|
| OMB APPROVAL | ||
|
| OMB Number: | 3235-0570 | |
|
| Expires: | August 31, 2010 | |
| UNITED STATES | Estimated average burden hours per response. . . . . . . . . . . . . . . . 18.9 | ||
| SECURITIES AND EXCHANGE COMMISSION |
| ||
| Washington, D.C. 20549 |
| ||
FORM N-CSR
CERTIFIED SHAREHOLDER REPORT OF REGISTERED
MANAGEMENT INVESTMENT COMPANIES
Investment Company Act file number | 811-7736 | |||||||
| ||||||||
Janus Aspen Series | ||||||||
(Exact name of registrant as specified in charter) | ||||||||
| ||||||||
151 Detroit Street, Denver, Colorado |
| 80206 | ||||||
(Address of principal executive offices) |
| (Zip code) | ||||||
| ||||||||
Stephanie Grauerholz-Lofton, 151 Detroit Street, Denver, Colorado 80206 | ||||||||
(Name and address of agent for service) | ||||||||
| ||||||||
Registrant’s telephone number, including area code: | 303-333-3863 |
| ||||||
| ||||||||
Date of fiscal year end: | 12/31 |
| ||||||
| ||||||||
Date of reporting period: | 12/31/07 |
| ||||||
Item 1 - - Reports to Shareholders
2007 Annual Report
Janus Aspen Series
Janus Aspen Balanced Portfolio
Look Inside. . .
• Portfolio management perspective
• Investment strategy behind your portfolio
• Portfolio performance, characteristics and holdings

Table of Contents
| Useful Information About Your Portfolio Report | 1 | ||||||
| Management Commentary and Schedule of Investments | 2 | ||||||
| Statement of Assets and Liabilities | 11 | ||||||
| Statement of Operations | 12 | ||||||
| Statements of Changes in Net Assets | 13 | ||||||
| Financial Highlights | 14 | ||||||
| Notes to Schedule of Investments | 15 | ||||||
| Notes to Financial Statements | 16 | ||||||
| Report of Independent Registered Public Accounting Firm | 24 | ||||||
| Additional Information | 25 | ||||||
| Explanations of Charts, Tables and Financial Statements | 28 | ||||||
| Designation Requirements | 31 | ||||||
| Trustees and Officers | 32 | ||||||
Please consider the charges, risks, expenses and investment objectives carefully before investing. For a prospectus containing this and other information, please call Janus at 1-800-525-0020 or download the file from www.janus.com/info. Read it carefully before you invest or send money.
Useful Information About Your Portfolio Report
Management Commentary
The Management Commentary in this report includes valuable insight from the Portfolio's managers as well as statistical information to help you understand how your Portfolio's performance and characteristics stack up against those of comparable indices.
Please keep in mind that the opinions expressed by the Portfolio's managers in the Management Commentary are just that: opinions. They are a reflection of the managers' best judgment at the time this report was compiled, which was December 31, 2007. As the investing environment changes, so could their opinions. The views are unique to the managers and aren't necessarily shared by their fellow employees or by Janus in general.
Portfolio Expenses
We believe it's important for our shareholders to have a clear understanding of Portfolio expenses and the impact they have on investment return.
The following is important information regarding the Portfolio's Expense Example, which appears in the Management Commentary within this Annual Report. Please refer to this information when reviewing the Expense Example for the Portfolio.
Example
As a shareholder of a Portfolio, you incur two types of costs: (1) transaction costs, including redemption fees (where applicable) (and any related exchange fees) and (2) ongoing costs, including management fees; distribution and shareholder servicing (12b-1) fees (applicable to Service Shares only); and other Portfolio expenses. The example is intended to help you understand your ongoing costs (in dollars) of investing in a Portfolio and to compare these costs with the ongoing costs of investing in other mutual funds. To do so, compare this 5% hypothetical example with the 5% hypothetical examples that appear in the shareholder reports of the other funds. The example is based upon an investment of $1,000 invested at the beginning of the period and held for the six-month period from July 1, 2007 to December 31, 2007.
Actual Expenses
The first line of the table in each example provides information about actual account values and actual expenses. You may use the information in this line, together with the amount you invested, to estimate the expenses that you paid over the period. Simply divide your account value by $1,000 (for example, an $8,600 account value divided by $1,000 = 8.6), then multiply the result by the number in the first line under the heading entitled "Expenses Paid During Period" to estimate the expenses you paid on your account during the period.
Hypothetical Example for Comparison Purposes
The second line of the table in each example provides information about hypothetical account values and hypothetical expenses based upon the Portfolio's actual expense ratio and an assumed rate of return of 5% per year before expenses, which is not the Portfolio's actual return. The hypothetical account values and expenses may not be used to estimate the actual ending account balance or expenses you paid for the period. You may use this information to compare the ongoing costs of investing in the Portfolio and other funds. To do so, compare this 5% hypothetical example with the 5% hypothetical examples that appear in the shareholder reports of the other funds.
Please note that the expenses shown in the tables are meant to highlight your ongoing costs only and do not reflect any transaction costs, such as redemption fees (where applicable) and any charges at the separate account level or contract level. Redemption fees are fully described in the prospectus. Therefore, the second line of each table is useful in comparing ongoing costs only, and will not help you determine the relative total costs of owning different funds. In addition, if these transaction costs and separate account or contract level charges were included, your costs would have been higher.
Janus Aspen Series December 31, 2007 1
Janus Aspen Balanced Portfolio (unaudited)
Portfolio Snapshot
The portfolio combines the growth potential of stocks with the balance of bonds.

Marc Pinto
co-portfolio
manager

Gibson Smith
co-portfolio
manager
Performance Overview
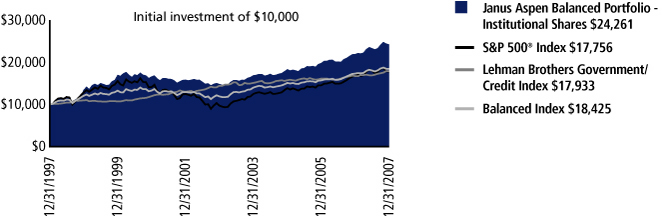
Janus Aspen Balanced Portfolio's Institutional Shares and Service Shares advanced 10.50% and 10.25%, respectively, for the 12-month period ended December 31, 2007, compared with a 6.43% return by the Balanced Index, an internally-calculated secondary benchmark. The Balanced Index is composed of a 55% weighting in the S&P 500® Index, the Portfolio's primary benchmark, and a 45% weighting in the Lehman Brothers Government/Credit Index, the Portfolio's other secondary benchmark, which returned 5.49% and 7.23%, respectively.
Economic Overview
Despite a volatile and weak second half of the year, equity markets worldwide managed to turn in modest gains over the 12-month period ended December 31, 2007. Much of the year's gains came during the first half amid continued expansion in the global economy and an active merger and acquisition (M&A) environment, but problems in the U.S. credit markets started to rattle investor confidence in July. Many indices retreated from recent peaks as investors digested a number of issues stemming from the subprime mortgage and structured debt markets. Credit market turmoil, subprime-related write-offs, continued weakness in the U.S. housing market, central bank intervention and the first year-over-year decline in domestic corporate earnings since 2002 were just some of the main themes dominating sentiment during the latter half of 2007. Through all of this, emerging country stocks tended to be the top performers while equities in developed countr ies struggled to keep pace. Domestic stocks were led by large, growth-oriented companies with small-cap value issues among the laggards.
As December came to a close, many themes supporting equity prices were fading. While domestic valuations were still considered to be reasonable, particularly with interest rates well off of their period highs, mixed signals on the financial health of the U.S. consumer and slowing earnings momentum were becoming a greater concern. One pillar of strength during the year, the labor market, showed signs that it may be starting to feel the impact of the housing slowdown and subsequent credit market turmoil. While job growth remained strong for much of the year, a weak December reading left some doubt about continued near-term strength. In the end, the questions remained surrounding the magnitude of slowing growth in the U.S. and whether the rest of the world will follow suit.
Stock Selection Benefited Portfolio Performance
The Portfolio's outperformance can be attributed primarily to strong, individual stock selection within the materials and consumer staples sectors. Potash Corporation of Saskatchewan was not only the top contributor within our materials holdings but also the top contributor overall. The company has the world's largest excess supply of potash, which is a key ingredient in fertilizer. We continue to believe in the company's long-term pricing power, as farmers have been less sensitive to increases in relatively small input costs such as potash. In addition, we are confident that customer diversification, as well as increasing demands on global agriculture land, will continue to benefit Potash Corporation. We therefore added to our position in this high-conviction holding.
Apple benefited from the successful launch of its iPhone mobile communications device during the middle of the year. While we believe the iPhone will be an important contributor to Apple's overall revenue generation, our long-term thesis continues to be centered on market share gains in Apple's core business of desktop and laptop computers.
Select Financials Stocks Detracted from Results
While most of the Portfolio's equity holdings provided solid returns for the period, a few individual detractors weighed on results. These included financial holding Merrill Lynch. The stock was under consistent pressure in the second half of the year as concerns arose regarding the company's exposure to the subprime mortgage market. These concerns were realized when the company announced that the write-offs they would take as a result of credit-related issues were double what management had originally estimated. Following the announcement of the greater-than-expected write down, CEO Stan O'Neal announced his departure from the firm. We viewed the change as fundamental to the company and, consequently, liquidated our position to rotate into traditionally less capital-market-sensitive opportunities in the financials sector.
Student loan provider SLM Corp., formerly "Sallie Mae," declined after the deal to take it private was called off. Investors became concerned that SLM's earnings outlook would be revised downward as its credit costs seem likely to increase. Given that potential earnings risk, we exited the position.
2 Janus Aspen Series December 31, 2007
(unaudited)
Fixed-Income Investments Provided Positive Results
Looking at the fixed-income side, the strongest contribution to returns in the fixed-income portion of the Portfolio came from our overweight position in U.S. Treasuries. Our higher quality bias protected us as credit and subprime mortgage concerns continued to drive risk premiums wider and Treasury yields lower in the second half of the year. At the end of the year, we held no mortgage-backed pass-through security exposure as we believe concerns about future volatility in the sector support an overweight position in the highest quality sectors among government securities. We are currently underweight in credit but will look to add to our highest conviction, strong free cash flow, potentially recession-resistant names as the risk/reward profiles become more compelling to us.
Outlook
With U.S. equity markets struggling late in the year, the investment team will continue to closely monitor several factors for directional cues. First, despite the weakness in the U.S. housing sector and related credit market turmoil, we believe U.S. employment had been a pillar of support for the economy. With signs of weakening at the end of the year, however, we will continue to watch the labor market closely for any sign of prolonged weakness and whether December's weaker-than-expected report was an aberration. We will also be monitoring conditions in the credit markets for signs of further deterioration. As the Federal Reserve (Fed) works to balance its dual mandate of sustainable growth and price stability, we will be watching for signs that suggest the Fed is behind the curve and whether it can be effective in navigating these uncertain economic times. Finally, as "bottom-up" fundamental investors, we will continue to watch the future path of corporate earnings, credit conditions, liquidity, and balance sheet health of our individual holdings in an effort to determine whether current valuations represent an attractive risk/reward profile.
Thank you for investing in Janus Aspen Balanced Portfolio.
Janus Aspen Balanced Portfolio At a Glance
5 Largest Contributors to Performance – Holdings
| Equity Contribution | |||||||
| Potash Corporation of Saskatchewan, Inc. (U.S. Shares) | 3.61 | % | |||||
| Apple, Inc. | 1.35 | % | |||||
| EnCana Corp. (U.S. Shares) | 1.20 | % | |||||
| Syngenta A.G. | 1.01 | % | |||||
| ConocoPhillips | 0.98 | % | |||||
5 Largest Detractors from Performance – Holdings
| Equity Contribution | |||||||
| SLM Corp. | (1.53 | )% | |||||
| Merrill Lynch & Company, Inc. | (1.06 | )% | |||||
| Fannie Mae | (0.94 | )% | |||||
| Starwood Hotels & Resorts Worldwide, Inc. | (0.66 | )% | |||||
| American Express Co. | (0.53 | )% | |||||
5 Largest Contributors to Performance – Sectors
| Equity Contribution | Portfolio Weighting (% of Net Assets) | S&P 500® Index Weighting | |||||||||||||
| Materials | 5.43 | % | 7.23 | % | 3.13 | % | |||||||||
| Consumer Staples | 3.93 | % | 17.21 | % | 9.52 | % | |||||||||
| Information Technology | 3.75 | % | 15.29 | % | 15.69 | % | |||||||||
| Energy | 2.70 | % | 8.06 | % | 10.82 | % | |||||||||
| Industrials | 1.56 | % | 11.63 | % | 11.22 | % | |||||||||
5 Lowest Contributors/Detractors to Performance – Sectors
| Equity Contribution | Portfolio Weighting (% of Net Assets) | S&P 500® Index Weighting | |||||||||||||
| Financials | (4.28 | )% | 16.00 | % | 20.57 | % | |||||||||
| Consumer Discretionary | (0.53 | )% | 11.75 | % | 9.92 | % | |||||||||
| Utilities | 0.00 | % | 0.00 | % | 3.54 | % | |||||||||
| Telecommunication Services | 0.00 | % | 0.00 | % | 3.64 | % | |||||||||
| Health Care | 0.72 | % | 12.83 | % | 11.95 | % | |||||||||
Janus Aspen Series December 31, 2007 3
Janus Aspen Balanced Portfolio (unaudited)
5 Largest Equity Holdings – (% of Net Assets)
| As of December 31, 2007 | |||
| ConocoPhillips Oil Companies - Integrated | 2.9 | % | |||||
| Roche Holding A.G. Medical - Drugs | 2.6 | % | |||||
| Potash Corporation of Saskatchewan, Inc. (U.S. Shares) Agricultural Chemicals | 2.4 | % | |||||
| Altria Group, Inc. Tobacco | 2.3 | % | |||||
| Reckitt Benckiser PLC Soap and Cleaning Preparations | 2.1 | % | |||||
| 12.3 | % | ||||||
Asset Allocation – (% of Net Assets)
| As of December 31, 2007 | |||

Emerging markets comprised 1.7% of total net assets.
Top Country Allocations – Long Positions (% of Investment Securities)
| As of December 31, 2007 | As of December 31, 2006 | ||||||
 | 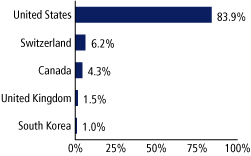 | ||||||
4 Janus Aspen Series December 31, 2007
(unaudited)
Performance
| Average Annual Total Return – for the periods ended December 31, 2007 | Expense Ratios – for the fiscal year ended December 31, 2006 | ||||||||||||||||||||||
| One Year | Five Year | Ten Year | Since Inception* | Total Annual Fund Operating Expenses | |||||||||||||||||||
| Janus Aspen Balanced Portfolio - Institutional Shares | 10.50 | % | 10.34 | % | 9.27 | % | 11.34 | % | 0.58 | % | |||||||||||||
| Janus Aspen Balanced Portfolio - Service Shares | 10.25 | % | 10.06 | % | 9.09 | % | 11.23 | % | 0.83 | % | |||||||||||||
| S&P 500® Index | 5.49 | % | 12.83 | % | 5.91 | % | 10.43 | % | |||||||||||||||
| Lehman Brothers Government/Credit Index | 7.23 | % | 4.44 | % | 6.01 | % | 6.02 | % | |||||||||||||||
| Balanced Index | 6.43 | % | 9.11 | % | 6.30 | % | 8.71 | % | |||||||||||||||
| Lipper Quartile - Institutional Shares | 1 | st | 1 | st | 1 | st | 1 | st | |||||||||||||||
| Lipper Ranking - Institutional Shares based on total returns for Variable Annuity Mixed-Asset Target Allocation Moderate Funds | 5/127 | 15/70 | 1/37 | 1/18 | |||||||||||||||||||
Visit janus.com/info to view up-to-date
performance and characteristic information
Data presented reflects past performance, which is no guarantee of future results. Investment results and principal value will fluctuate so that shares, when redeemed, may be worth more or less than their original cost. Due to market volatility, current performance may be higher or lower than the performance shown. Call 877.33JANUS or visit www.janus.com/info for performance current to the most recent month-end.
The Portfolio's expense ratio was determined based on average net assets as of the fiscal year ended December 31, 2006. Detailed information is available in the prospectus. All expenses are shown without the effect of expense offset arrangements. Pursuant to such arrangements, credits realized as a result of uninvested cash balances are used to reduce custodian and transfer agent expenses.
The Portfolio's performance may be affected by risks that include those associated with non-investment grade debt securities, and investments in specific industries or countries. Additional risks to the Portfolio may include those associated with investing in foreign securities, emerging markets, initial public offerings ("IPOs") and derivatives. Please see a Janus prospectus or www.janus.com/info for more information about risks, portfolio holdings and other details.
Portfolios that invest in bonds have the same interest rate, inflation and credit risks that are associated with the underlying bonds owned by the Portfolio. Unlike owning individual bonds, there are ongoing fees and expenses associated with owning shares of bond portfolios. The return of principal is not guaranteed due to net asset value fluctuation that is caused by changes in the price of specific bonds held in the Portfolio and selling of bonds within the Portfolio by the portfolio managers.
These returns do not reflect the charges and expenses of any particular insurance product or qualified plan. Returns shown would have been lower had they included insurance charges.
Returns include reinvestment of dividends from net investment income and distributions from capital gains. The returns shown do not reflect the deduction of taxes that a shareholder would pay on Portfolio distributions or the redemption of Portfolio shares.
Returns shown for Service Shares for periods prior to December 31, 1999 are derived from the historical performance of Institutional Shares, adjusted to reflect the higher operating expenses of Service Shares.
Janus Aspen Series December 31, 2007 5
Janus Aspen Balanced Portfolio (unaudited)
Portfolio Expenses
The example below shows you the ongoing costs (in dollars) of investing in your Portfolio and allows you to compare these costs with those of other mutual funds. Please refer to the section Useful Information About Your Portfolio Report for a detailed explanation of the information presented in these charts.
| Expense Example - Institutional Shares | Beginning Account Value (7/1/07) | Ending Account Value (12/31/07) | Expenses Paid During Period (7/1/07-12/31/07)(1) | ||||||||||||
| Actual | $ | 1,000.00 | $ | 1,039.30 | $ | 2.93 | |||||||||
| Hypothetical (5% return before expenses) | $ | 1,000.00 | $ | 1,022.33 | $ | 2.91 | |||||||||
| Expense Example - Service Shares | Beginning Account Value (7/1/07) | Ending Account Value (12/31/07) | Expenses Paid During Period (7/1/07-12/31/07)(1) | ||||||||||||
| Actual | $ | 1,000.00 | $ | 1,038.00 | $ | 4.21 | |||||||||
| Hypothetical (5% return before expenses) | $ | 1,000.00 | $ | 1,021.07 | $ | 4.18 | |||||||||
(1) Expenses are equal to the annualized expense ratio of 0.57% for Institutional Shares and 0.82% for Service Shares, multiplied by the average account value over the period, multiplied by 184/365 (to reflect the one-half year period).
Lipper, a wholly-owned subsidiary of Reuters, provides independent insight on global collective investments including mutual funds, retirement funds, hedge funds, fund fees and expenses to the asset management and media communities. Lipper ranks the performance of mutual funds within a classification of funds that have similar investment objectives. Rankings are historical with capital gains and dividends reinvested and do not include the effect of loads.
Lipper ranking is for the Institutional Share class only; other classes may have different performance characteristics.
September 30, 1993 is the date used to calculate the since-inception Lipper ranking, which is slightly different from when the Portfolio began operations since Lipper provides fund rankings as of the last day of the month.
There is no assurance that the investment process will consistently lead to successful investing.
See Notes to Schedule of Investments for index definitions.
The Portfolio may differ significantly from the securities held in the indices. The indices are unmanaged and not available for direct investment; therefore their performance does not reflect the expenses associated with the active management of an actual Portfolio.
See "Explanations of Charts, Tables and Financial Statements."
*The Portfolio's inception date – September 13, 1993
6 Janus Aspen Series December 31, 2007
Janus Aspen Balanced Portfolio
Schedule of Investments
As of December 31, 2007
| Shares or Principal Amount | Value | ||||||||||
| Common Stock - 57.7% | |||||||||||
| Advertising Sales - 0.7% | |||||||||||
| 270,310 | Lamar Advertising Co. - Class A* | $ | 12,993,802 | ||||||||
| Aerospace and Defense - 1.4% | |||||||||||
| 925,145 | BAE Systems PLC** | 9,170,244 | |||||||||
| 106,410 | Boeing Co. | 9,306,618 | |||||||||
| 180,580 | Embraer-Empresa Brasileira de Aeronautica S.A. (ADR)* | 8,232,642 | |||||||||
| 26,709,504 | |||||||||||
| Agricultural Chemicals - 5.3% | |||||||||||
| 313,855 | Potash Corporation of Saskatchewan, Inc. (U.S. Shares) | 45,182,565 | |||||||||
| 113,075 | Syngenta A.G. | 28,594,478 | |||||||||
| 542,154 | Syngenta A.G. (ADR) | 27,465,522 | |||||||||
| 101,242,565 | |||||||||||
| Apparel Manufacturers - 0.6% | |||||||||||
| 808,410 | Esprit Holdings, Ltd. | 12,027,288 | |||||||||
| Athletic Footwear - 0.6% | |||||||||||
| 179,230 | NIKE, Inc. - Class B | 11,513,735 | |||||||||
| Audio and Video Products - 0.5% | |||||||||||
| 185,845 | Sony Corp. (ADR)** | 10,091,384 | |||||||||
| Automotive - Cars and Light Trucks - 0.6% | |||||||||||
| 177,958 | BMW A.G.** | 11,106,583 | |||||||||
| Beverages - Non-Alcoholic - 1.5% | |||||||||||
| 248,290 | Coca-Cola Co. | 15,237,558 | |||||||||
| 168,296 | PepsiCo, Inc. | 12,773,666 | |||||||||
| 28,011,224 | |||||||||||
| Brewery - 0.7% | |||||||||||
| 169,200 | InBev N.V.** | 14,099,175 | |||||||||
| Building Products - Air and Heating - 0.6% | |||||||||||
| 205,605 | Daikin Industries, Ltd.*,** | 11,580,767 | |||||||||
| Casino Hotels - 0.5% | |||||||||||
| 846,332 | Crown, Ltd.* | 9,992,157 | |||||||||
| Commercial Services - Finance - 0.2% | |||||||||||
| 174,345 | Western Union Co. | 4,233,097 | |||||||||
| Computers - 1.4% | |||||||||||
| 40,785 | Apple, Inc.* | 8,078,693 | |||||||||
| 373,735 | Hewlett-Packard Co. | 18,866,143 | |||||||||
| 26,944,836 | |||||||||||
| Computers - Memory Devices - 1.5% | |||||||||||
| 1,535,723 | EMC Corp.* | 28,456,947 | |||||||||
| Cosmetics and Toiletries - 1.9% | |||||||||||
| 484,755 | Avon Products, Inc. | 19,162,365 | |||||||||
| 241,460 | Procter & Gamble Co. | 17,727,993 | |||||||||
| 36,890,358 | |||||||||||
| Diversified Operations - 2.3% | |||||||||||
| 1,047,865 | General Electric Co. | 38,844,356 | |||||||||
| 2,943,640 | Melco International Development, Ltd.* | 4,424,766 | |||||||||
| 43,269,122 | |||||||||||
| E-Commerce/Services - 0.7% | |||||||||||
| 174,380 | eBay, Inc.* | 5,787,672 | |||||||||
| 396,385 | Liberty Media Corp. - Interactive* | 7,563,026 | |||||||||
| 13,350,698 | |||||||||||
| Electric Products - Miscellaneous - 0.3% | |||||||||||
| 97,805 | Emerson Electric Co. | 5,541,631 | |||||||||
| Shares or Principal Amount | Value | ||||||||||
| Electronic Components - Semiconductors - 2.1% | |||||||||||
| 23,623 | Samsung Electronics Company, Ltd. | $ | 13,969,798 | ||||||||
| 807,669 | Texas Instruments, Inc. | 26,976,145 | |||||||||
| 40,945,943 | |||||||||||
| Enterprise Software/Services - 1.3% | |||||||||||
| 1,145,225 | Oracle Corp.* | 25,859,181 | |||||||||
| Finance - Credit Card - 1.8% | |||||||||||
| 655,848 | American Express Co. | 34,117,213 | |||||||||
| Finance - Investment Bankers/Brokers - 1.6% | |||||||||||
| 690,329 | JP Morgan Chase & Co. | 30,132,861 | |||||||||
| Finance - Mortgage Loan Banker - 1.0% | |||||||||||
| 486,415 | Fannie Mae | 19,446,872 | |||||||||
| Food - Diversified - 2.3% | |||||||||||
| 212,135 | Kraft Foods, Inc. - Class A | 6,921,965 | |||||||||
| 80,985 | Nestle S.A. | 37,184,414 | |||||||||
| 44,106,379 | |||||||||||
| Hotels and Motels - 0.9% | |||||||||||
| 379,447 | Starwood Hotels & Resorts Worldwide, Inc. | 16,707,051 | |||||||||
| Industrial Automation and Robotics - 0.5% | |||||||||||
| 147,420 | Rockwell Automation, Inc. | 10,166,083 | |||||||||
| Machinery - General Industrial - 0.5% | |||||||||||
| 11,101,755 | Shanghai Electric Group Company, Ltd. | 9,397,528 | |||||||||
| Medical - Biomedical and Genetic - 0.3% | |||||||||||
| 144,155 | Celgene Corp.* | 6,661,403 | |||||||||
| Medical - Drugs - 4.1% | |||||||||||
| 389,125 | Merck & Company, Inc. | 22,612,054 | |||||||||
| 289,206 | Roche Holding A.G. | 49,941,268 | |||||||||
| 122,620 | Wyeth | 5,418,578 | |||||||||
| 77,971,900 | |||||||||||
| Medical - HMO - 0.5% | |||||||||||
| 174,345 | Coventry Health Care, Inc.* | 10,329,941 | |||||||||
| Medical Instruments - 0.2% | |||||||||||
| 88,510 | Medtronic, Inc. | 4,449,398 | |||||||||
| Medical Products - 0.6% | |||||||||||
| 40,371 | Nobel Biocare Holding A.G. | 10,789,432 | |||||||||
| Multimedia - 0.7% | |||||||||||
| 846,332 | Consolidated Media Holdings, Ltd. | 3,120,228 | |||||||||
| 475,750 | News Corporation, Inc. - Class A | 9,748,118 | |||||||||
| 12,868,346 | |||||||||||
| Oil Companies - Exploration and Production - 2.1% | |||||||||||
| 580,575 | EnCana Corp. (U.S. Shares) | 39,455,877 | |||||||||
| Oil Companies - Integrated - 4.0% | |||||||||||
| 635,055 | ConocoPhillips | 56,075,357 | |||||||||
| 179,837 | Suncor Energy, Inc. | 19,667,792 | |||||||||
| 75,743,149 | |||||||||||
| Optical Supplies - 0.3% | |||||||||||
| 38,860 | Alcon, Inc. (U.S. Shares) | 5,558,534 | |||||||||
| Retail - Apparel and Shoe - 0.3% | |||||||||||
| 174,345 | Nordstrom, Inc. | 6,403,692 | |||||||||
| Retail - Consumer Electronics - 0.7% | |||||||||||
| 114,675 | Yamada Denki Company, Ltd.** | 13,183,557 | |||||||||
| Retail - Drug Store - 1.7% | |||||||||||
| 811,560 | CVS/Caremark Corp. | 32,259,510 | |||||||||
| Retail - Jewelry - 0.3% | |||||||||||
| 139,795 | Tiffany & Co. | 6,434,764 | |||||||||
See Notes to Schedule of Investments and Financial Statements.
Janus Aspen Series December 31, 2007 7
Janus Aspen Balanced Portfolio
Schedule of Investments
As of December 31, 2007
| Shares or Principal Amount | Value | ||||||||||
| Soap and Cleaning Preparations - 2.1% | |||||||||||
| 683,027 | Reckitt Benckiser PLC** | $ | 39,615,865 | ||||||||
| Telecommunication Equipment - Fiber Optics - 0.8% | |||||||||||
| 632,956 | Corning, Inc. | 15,184,614 | |||||||||
| Therapeutics - 0.9% | |||||||||||
| 393,112 | Gilead Sciences, Inc.* | 18,087,083 | |||||||||
| Tobacco - 2.3% | |||||||||||
| 583,290 | Altria Group, Inc. | 44,085,058 | |||||||||
| Transportation - Railroad - 1.5% | |||||||||||
| 374,661 | Canadian National Railway Co. (U.S. Shares) | 17,582,841 | |||||||||
| 82,742 | Union Pacific Corp. | 10,394,050 | |||||||||
| 27,976,891 | |||||||||||
| Web Portals/Internet Service Providers - 0.5% | |||||||||||
| 412,660 | Yahoo!, Inc.* | 9,598,472 | |||||||||
| Wireless Equipment - 0.5% | |||||||||||
| 229,510 | QUALCOMM, Inc. | 9,031,219 | |||||||||
| Total Common Stock (cost $809,264,397) | 1,104,622,689 | ||||||||||
| Corporate Debt - 8.6% | |||||||||||
| Agricultural Chemicals - 0% | |||||||||||
| $ | 720,000 | Mosaic Co., 7.625% senior notes, due 12/1/16 (144A)‡ | 777,600 | ||||||||
| Applications Software - 0.1% | |||||||||||
| 2,065,000 | Intuit, Inc., 5.75% senior unsecured notes, due 3/15/17 | 2,031,561 | |||||||||
| Automotive - Cars and Light Trucks - 0.1% | |||||||||||
| 2,070,000 | General Motors Nova Financial Corp., 6.85% company guaranteed notes, due 10/15/08 | 2,038,950 | |||||||||
| Beverages - Wine and Spirits - 0.1% | |||||||||||
| 1,050,000 | Diageo Capital PLC, 5.75% company guaranteed notes, due 10/23/17 | 1,055,963 | |||||||||
| Brewery - 0% | |||||||||||
| 605,000 | Anheuser Bush COS, Inc., 5.50% senior subordinated notes, due 1/15/18 | 617,632 | |||||||||
| Cable Television - 0.4% | |||||||||||
| 3,155,000 | Comcast Corp., 5.5425% company guaranteed notes, due 7/14/09‡ | 3,143,516 | |||||||||
| 4,867,855 | CSC Holdings, Inc., 6.89625% bank loan, due 3/29/13‡ | 4,593,503 | |||||||||
| 7,737,019 | |||||||||||
| Chemicals - Diversified - 0% | |||||||||||
| 880,000 | E.I. Du Pont De Nemours, 5.00% senior unsecured notes, 11/5/13 | 885,550 | |||||||||
| Commercial Banks - 0.2% | |||||||||||
| 4,265,000 | U.S. Bank, 5.70% subordinated notes, due 12/15/08 | 4,318,338 | |||||||||
| Computer Services - 0.1% | |||||||||||
| 2,090,000 | SunGard Data Systems, Inc., 9.125% company guaranteed notes, due 8/15/13 | 2,126,575 | |||||||||
| Consumer Products - Miscellaneous - 0.1% | |||||||||||
| 2,135,000 | Clorox Co., 5.95% senior unsecured notes, due 10/15/17 | 2,126,921 | |||||||||
| Shares or Principal Amount | Value | ||||||||||
| Containers - Metal and Glass - 0.7% | |||||||||||
| $ | 7,480,000 | Owens-Brockway Glass Container, Inc. 8.875%, company guaranteed notes due 2/15/09 | $ | 7,508,051 | |||||||
| 6,585,000 | Owens-Illinois, Inc., 7.35% senior notes, due 5/15/08 | 6,601,463 | |||||||||
| 14,109,514 | |||||||||||
| Data Processing and Management - 0.1% | |||||||||||
| 2,470,000 | First Data Corp., 9.875% company guaranteed notes due 9/24/15 (144A) | 2,297,100 | |||||||||
| Diversified Financial Services - 0.2% | |||||||||||
| 2,835,000 | General Electric Capital Corp., 6.75% notes, due 3/15/32 | 3,218,811 | |||||||||
| Diversified Operations - 0.6% | |||||||||||
| 8,065,000 | General Electric Co., 5.25% senior unsecured notes, due 12/6/17 | 8,047,789 | |||||||||
| 2,630,000 | Textron, Inc., 5.60% senior unsecured notes, due 12/1/17 | 2,620,637 | |||||||||
| 10,668,426 | |||||||||||
| Electric - Generation - 0.1% | |||||||||||
| 920,000 | Edison Mission Energy, 7.00% senior unsecured notes, due 5/15/17 | 903,900 | |||||||||
| Electric - Integrated - 1.3% | |||||||||||
| 2,475,000 | CMS Energy Corp., 6.30% senior unsubordinated notes, due 2/1/12 | 2,496,993 | |||||||||
| 1,255,000 | Energy Future Holdings, 10.875% company guaranteed notes due 11/1/17 (144A) | 1,261,275 | |||||||||
| 6,655,000 | MidAmerican Energy Holdings Co., 3.50% senior notes, due 5/15/08 | 6,611,277 | |||||||||
| Pacific Gas and Electric Co.: | |||||||||||
| 495,000 | 3.60%, unsecured notes, due 3/1/09 | 489,648 | |||||||||
| 1,740,000 | 4.20%, unsecured notes, due 3/1/11 | 1,712,195 | |||||||||
| 680,000 | Pacificorp, 6.25% first mortgage notes, due 10/15/37 | 702,229 | |||||||||
| Texas Competitive Electric Holdings Co., LLC: | |||||||||||
| 1,340,000 | 10.25%, company guaranteed notes due 11/1/15 (144A) | 1,326,600 | |||||||||
| 2,153,000 | 10.25% company guaranteed notes due 11/1/15 (144A) | 2,131,470 | |||||||||
| 4,030,000 | Virginia Electric & Power Co., 5.10% senior unsecured notes, due 11/30/12 | 4,047,321 | |||||||||
| 4,105,000 | West Penn Power Co., 5.95% first mortgage notes, due 12/15/17 (144A) | 4,125,016 | |||||||||
| 24,904,024 | |||||||||||
| Finance - Auto Loans - 0.5% | |||||||||||
| Ford Motor Credit Co.: | |||||||||||
| 892,000 | 7.9925%, senior unsecured notes due 1/13/12‡ | 749,246 | |||||||||
| 3,460,000 | 9.6925%, notes, due 4/15/12‡ | 3,402,467 | |||||||||
| 1,415,000 | 7.80%, notes, due 6/1/12 | 1,240,477 | |||||||||
| 5,700,000 | 8.00%, senior unsecured notes due 12/15/16 | 4,841,643 | |||||||||
| 10,233,833 | |||||||||||
| Finance - Investment Bankers/Brokers - 0.2% | |||||||||||
| 3,008,000 | JP Morgan Chase & Co, 6.00% senior notes, due 1/15/18 | 3,060,291 | |||||||||
See Notes to Schedule of Investments and Financial Statements.
8 Janus Aspen Series December 31, 2007
Schedule of Investments
As of December 31, 2007
| Shares or Principal Amount | Value | ||||||||||
| Food - Diversified - 0.3% | |||||||||||
| Kellogg Co.: | |||||||||||
| $ | 5,315,000 | 2.875%, senior notes, due 6/1/08 | $ | 5,264,470 | |||||||
| 1,010,000 | 5.125%, senior unsecured notes due 12/3/12 | 1,018,458 | |||||||||
| 6,282,928 | |||||||||||
| Food - Retail - 0.2% | |||||||||||
| 2,490,000 | Kroger Co., 6.40% company guaranteed notes, due 8/15/17 | 2,604,323 | |||||||||
| 765,000 | Stater Brothers Holdings, Inc., 7.75% company guaranteed notes, due 4/15/15 | 738,225 | |||||||||
| 3,342,548 | |||||||||||
| Food - Wholesale/Distribution - 0.2% | |||||||||||
| 3,950,000 | Supervalu, Inc., 7.50% senior unsecured notes, due 11/15/14 | 4,048,750 | |||||||||
| Independent Power Producer - 0.2% | |||||||||||
| 1,050,000 | NRG Energy, Inc., 7.375% company guaranteed notes, due 1/15/17 | 1,023,750 | |||||||||
| Reliant Energy, Inc.: | |||||||||||
| 2,550,000 | 7.625%, senior notes, due 6/15/14# | 2,524,500 | |||||||||
| 1,195,000 | 7.875%, senior notes, due 6/15/17 | 1,183,050 | |||||||||
| 4,731,300 | |||||||||||
| Machinery - Construction and Mining - 0.1% | |||||||||||
| 1,105,000 | Atlas Copco A.B., 5.60% bonds, due 5/22/17 (144A)§ | 1,105,403 | |||||||||
| Medical - Hospitals - 0.3% | |||||||||||
| HCA, Inc.: | |||||||||||
| 2,346,300 | 7.08%, bank loan, due 11/18/13‡ | 2,253,551 | |||||||||
| 3,215,000 | 9.25%, secured notes, due 11/15/16 | 3,375,750 | |||||||||
| 5,629,301 | |||||||||||
| Multimedia - 0.3% | |||||||||||
| 1,065,000 | Viacom, Inc., 6.125% senior unsecured notes, due 10/5/17 | 1,064,954 | |||||||||
| 4,435,000 | Walt Disney Company, 4.7% senior unsecured notes, due 12/1/12 | 4,434,854 | |||||||||
| 5,499,808 | |||||||||||
| Non-Hazardous Waste Disposal - 0.1% | |||||||||||
| Allied Waste Industries, Inc.: | |||||||||||
| 507,986 | 5.12063%, bank loan, due 3/28/14‡ | 484,599 | |||||||||
| 36,405 | 6.36%, bank loan, due 3/28/14‡ | 34,699 | |||||||||
| 34,478 | 6.42%, bank loan, due 3/28/14‡ | 32,862 | |||||||||
| 206,867 | 6.48%, bank loan, due 3/28/14‡ | 197,171 | |||||||||
| 407,987 | 6.50%, bank loan, due 3/28/14‡ | 388,865 | |||||||||
| 241,345 | 6.88%, bank loan, due 3/28/14‡ | 230,033 | |||||||||
| 1,368,229 | |||||||||||
| Oil Companies - Exploration and Production - 0.2% | |||||||||||
| 1,755,000 | Encana, Corp., 6.50% unsubordinated notes, due 2/1/38 | 1,813,573 | |||||||||
| Forest Oil Corp.: | |||||||||||
| 335,000 | 8.00%, company guaranteed notes due 12/15/11 | 348,400 | |||||||||
| 1,309,000 | 7.25%, senior notes, due 6/15/19 (144A) | 1,315,545 | |||||||||
| 1,100,000 | Sabine Pass L.P., 7.25% secured notes, due 11/30/13 | 1,050,500 | |||||||||
| 4,528,018 | |||||||||||
| Pipelines - 0.4% | |||||||||||
| Kinder Morgan Energy Partners L.P.: | |||||||||||
| 930,000 | 6.00%, senior unsecured notes, due 2/1/17 | 929,947 | |||||||||
| 564,000 | 6.50%, senior unsecured notes, due 2/1/37 | 557,429 | |||||||||
| Shares or Principal Amount | Value | ||||||||||
| Pipelines - (continued) | |||||||||||
| $ | 745,000 | Southern Natural Gas Co., 5.90% notes, due 4/1/17 (144A) | $ | 732,757 | |||||||
| 5,555,000 | Spectra Energy Corp., 6.75% senior unsubordinated, due 2/15/32# | 5,546,234 | |||||||||
| 7,766,367 | |||||||||||
| Publishing - Periodicals - 0.2% | |||||||||||
| 4,321,405 | Idearc, Inc., 6.83% bank loan, due 11/17/14‡ | 4,105,896 | |||||||||
| Rental Auto/Equipment - 0.1% | |||||||||||
| 2,879,483 | Avis Budget Car Rental LLC, 6.21% bank loan, due 4/19/12‡ | 2,770,783 | |||||||||
| Retail - Regional Department Stores - 0.2% | |||||||||||
| 3,530,000 | May Department Stores Co., 4.80% unsecured notes, due 7/15/09 | 3,509,971 | |||||||||
| Specified Purpose Acquisition Company - 0.1% | |||||||||||
| 1,950,076 | Solar Capital Corp., 6.8975% bank loan, due 2/11/13‡ | 1,878,839 | |||||||||
| Super-Regional Banks - 0.3% | |||||||||||
| 5,038,000 | Wells Fargo Co., 5.625% senior unsecured notes, due 12/11/17 | 5,041,078 | |||||||||
| Telecommunication Services - 0.4% | |||||||||||
| 7,710,000 | Verizon Communications, Inc., 4.00% senior unsecured notes, due 1/15/08 | 7,706,908 | |||||||||
| Transportation - Railroad - 0.1% | |||||||||||
| 1,445,000 | Canadian National Railway Co., 4.25% notes, due 8/1/09 | 1,438,113 | |||||||||
| Travel Services - 0.1% | |||||||||||
| 1,950,100 | TDS Investor Corp., 7.08% bank loan, due 8/23/13‡ | 1,851,776 | |||||||||
| Total Corporate Debt (cost $167,868,479) | 165,718,024 | ||||||||||
| Preferred Stock - 0.4% | |||||||||||
| U.S. Government Agency - 0.4% | |||||||||||
| 156,265 | Fannie Mae, 8.25% | 4,023,824 | |||||||||
| 151,475 | Freddie Mac, 8.375% | 3,961,071 | |||||||||
| Total Preferred Stock (cost $7,804,997) | 7,984,895 | ||||||||||
| U.S. Government Agencies - 1.0% | |||||||||||
| Fannie Mae: | |||||||||||
| $ | 1,885,000 | 2.50%, notes, due 6/15/08 | 1,868,252 | ||||||||
| 3,120,000 | 5.25%, notes, due 1/15/09 | 3,159,605 | |||||||||
| 655,000 | 6.375%, notes, due 6/15/09 | 679,972 | |||||||||
| 5,122,000 | 4.875%, notes, due 5/18/12 | 5,321,886 | |||||||||
| Freddie Mac: | |||||||||||
| 4,095,000 | 5.75%, notes, due 4/15/08 | 4,110,111 | |||||||||
| 1,665,000 | 5.75%, notes, due 3/15/09 | 1,701,603 | |||||||||
| 1,565,000 | 7.00%, notes, due 3/15/10 | 1,677,276 | |||||||||
| Total U.S. Government Agencies (cost $18,331,150) | 18,518,705 | ||||||||||
| U.S. Treasury Notes/Bonds - 29.7% | |||||||||||
| U.S. Treasury Notes/Bonds: | |||||||||||
| 8,813,090 | 3.625%, due 1/15/08#,ÇÇ | 8,824,370 | |||||||||
| 3,496,000 | 3.75%, due 5/15/08 | 3,500,097 | |||||||||
| 14,433,000 | 4.375%, due 11/15/08# | 14,546,891 | |||||||||
| 5,326,000 | 4.75%, due 12/31/08# | 5,400,894 | |||||||||
| 38,304,000 | 4.875%, due 1/31/09# | 38,983,284 | |||||||||
| 19,756,000 | 4.50%, due 2/15/09# | 20,053,881 | |||||||||
| 15,547,000 | 3.125%, due 4/15/09# | 15,554,292 | |||||||||
| 1,905,000 | 4.875%, due 5/15/09# | 1,949,947 | |||||||||
| 1,595,000 | 4.875%, due 5/31/09# | 1,634,377 | |||||||||
See Notes to Schedule of Investments and Financial Statements.
Janus Aspen Series December 31, 2007 9
Janus Aspen Balanced Portfolio
Schedule of Investments
As of December 31, 2007
| Shares or Principal Amount | Value | ||||||||||
| U.S. Treasury Notes/Bonds (continued): | |||||||||||
| $ | 16,419,000 | 6.00%, due 8/15/09# | $ | 17,169,398 | |||||||
| 1,495,000 | 3.625%, due 10/31/09 | 1,509,717 | |||||||||
| 10,771,000 | 4.625%, due 11/15/09# | 11,081,506 | |||||||||
| 20,318,000 | 4.00%, due 4/15/10# | 20,730,699 | |||||||||
| 5,460,000 | 4.50%, due 5/15/10# | 5,642,140 | |||||||||
| 8,521,000 | 3.625%, due 6/15/10# | 8,637,499 | |||||||||
| 4,076,000 | 5.75%, due 8/15/10 | 4,349,218 | |||||||||
| 740,000 | 4.25%, due 10/15/10 | 763,645 | |||||||||
| 21,914,000 | 4.50%, due 11/15/10# | 22,785,432 | |||||||||
| 4,592,000 | 4.375%, due 12/15/10# | 4,762,767 | |||||||||
| 14,841,000 | 4.50%, due 2/28/11# | 15,458,994 | |||||||||
| 14,649,000 | 4.875%, due 4/30/11 | 15,429,513 | |||||||||
| 7,972,000 | 4.875%, due 7/31/11# | 8,412,947 | |||||||||
| 14,043,000 | 5.00%, due 8/15/11# | 14,876,803 | |||||||||
| 3,701,000 | 4.625%, due 8/31/11# | 3,874,484 | |||||||||
| 1,850,000 | 4.50%, due 9/30/11 | 1,930,070 | |||||||||
| 1,120,000 | 4.50%, due 11/30/11# | 1,168,825 | |||||||||
| 1,356,000 | 4.625%, due 2/29/12# | 1,422,953 | |||||||||
| 1,170,000 | 4.75%, due 5/31/12 | 1,234,807 | |||||||||
| 26,000,000 | 4.875%, due 6/30/12 | 27,576,251 | |||||||||
| 2,510,000 | 4.625%, due 7/31/12 | 2,635,500 | |||||||||
| 19,274,000 | 4.125%, due 8/31/12# | 19,844,684 | |||||||||
| 2,235,000 | 4.25%, due 9/30/12# | 2,313,399 | |||||||||
| 4,655,000 | 3.875%, due 10/31/12# | 4,746,280 | |||||||||
| 220,000 | 3.375%, due 11/30/12# | 219,261 | |||||||||
| 10,800,000 | 4.25%, due 8/15/14# | 11,167,027 | |||||||||
| 20,601,047 | 1.875%, due 7/15/15#,ÇÇ | 20,998,585 | |||||||||
| 17,126,000 | 4.25%, due 8/15/15# | 17,578,229 | |||||||||
| 11,709,000 | 4.50%, due 2/15/16# | 12,187,418 | |||||||||
| 27,683,000 | 5.125%, due 5/15/16# | 29,962,530 | |||||||||
| 12,408,000 | 7.25%, due 5/15/16# | 15,257,969 | |||||||||
| 3,874,240 | 2.50%, due 7/15/16ÇÇ | 4,131,513 | |||||||||
| 20,788,000 | 4.875%, due 8/15/16# | 22,135,977 | |||||||||
| 15,723,000 | 4.625%, due 11/15/16# | 16,466,163 | |||||||||
| 9,933,000 | 4.50%, due 5/15/17# | 10,295,396 | |||||||||
| 9,655,000 | 4.25%, due 11/15/17# | 9,823,209 | |||||||||
| 4,334,000 | 7.875%, due 2/15/21# | 5,829,230 | |||||||||
| 9,880,000 | 7.25%, due 8/15/22# | 12,828,567 | |||||||||
| 11,696,000 | 6.00%, due 2/15/26# | 13,841,491 | |||||||||
| 4,419,710 | 3.375%, due 4/15/32ÇÇ | 5,660,681 | |||||||||
| 27,418,000 | 4.75%, due 2/15/37 | 28,694,638 | |||||||||
| 1,820,000 | 5.00%, due 5/15/37# | 1,983,658 | |||||||||
| Total U.S. Treasury Notes/Bonds (cost $546,190,001) | 567,867,106 | ||||||||||
| Money Markets - 1.7% | |||||||||||
| 15,838,500 | Janus Institutional Cash Management Fund - Institutional Shares, 4.98% | 15,838,500 | |||||||||
| 17,083,500 | Janus Institutional Money Market Fund - Institutional Shares, 4.91% | 17,083,500 | |||||||||
| Total Money Markets (cost $32,922,000) | 32,922,000 | ||||||||||
| Other Securities - 21.2% | |||||||||||
| 270,286,924 | Allianz Dresdner Daily Asset Fund† | 270,286,924 | |||||||||
| 76,805,838 | Repurchase Agreements† | 76,805,838 | |||||||||
| 15,730,326 | Time Deposit - Calyon N.A., 4.00%, 1/2/08† | 15,730,326 | |||||||||
| 15,730,326 | Time Deposit - Rabobank Ned Cayman Islands N.A., 2.50%, 1/2/08† | 15,730,326 | |||||||||
| 18,585 | Time Deposit - Suntrust Bank N.A., 1.00%, 1/2/08† | 18,585 | |||||||||
| 7,865,164 | Time Deposit - Svenska Handelsbanken N.A., 3.25%, 1/2/08† | 7,865,164 | |||||||||
| Shares or Principal Amount | Value | ||||||||||
| 19,662,908 | Time Deposit - Wells Fargo Bank N.A., 3.50%, 1/2/08† | 19,662,908 | |||||||||
| Total Other Securities (cost $406,100,071) | 406,100,071 | ||||||||||
| Total Investments (total cost $1,988,481,095) – 120.3% | 2,303,733,490 | ||||||||||
| Liabilities, net of Cash, Receivables and Other Assets – (20.3)% | (389,124,617 | ) | |||||||||
| Net Assets – 100% | $ | 1,914,608,873 | |||||||||
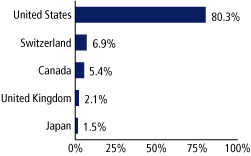
Summary of Investments by Country – (Long Positions)
| Country | Value | % of Investment Securities | |||||||||
| Australia | $ | 13,112,385 | 0.6 | % | |||||||
| Belgium | 14,099,175 | 0.6 | % | ||||||||
| Bermuda | 12,027,288 | 0.5 | % | ||||||||
| Brazil | 8,232,642 | 0.4 | % | ||||||||
| Canada | 125,366,138 | 5.4 | % | ||||||||
| China | 9,397,528 | 0.4 | % | ||||||||
| Germany | 11,106,583 | 0.5 | % | ||||||||
| Hong Kong | 4,424,766 | 0.2 | % | ||||||||
| Japan | 34,855,708 | 1.5 | % | ||||||||
| South Korea | 13,969,798 | 0.6 | % | ||||||||
| Switzerland | 159,533,648 | 6.9 | % | ||||||||
| United Kingdom | 48,786,109 | 2.1 | % | ||||||||
| United States†† | 1,848,821,722 | 80.3 | % | ||||||||
| Total | $ | 2,303,733,490 | 100.0 | % | |||||||
††Includes Short-Term Securities and Other Securities (61.2% excluding Short-Term Securities and Other Securities)
Forward Currency Contracts, Open
| Currency Sold and Settlement Date | Currency Units Sold | Currency Value in U.S.$ | Unrealized Gain/(Loss) | ||||||||||||
| British Pound 2/15/08 | 1,400,000 | $ | 2,782,899 | $ | 24,409 | ||||||||||
| British Pound 5/14/08 | 8,500,000 | 16,850,742 | 332,475 | ||||||||||||
| Euro 5/2/08 | 9,100,000 | 13,310,321 | 201,359 | ||||||||||||
| Japanese Yen 2/15/08 | 390,000,000 | 3,509,551 | (138,356 | ) | |||||||||||
| Total | $ | 36,453,513 | $ | 419,887 | |||||||||||
See Notes to Schedule of Investments and Financial Statements.
10 Janus Aspen Series December 31, 2007
Statement of Assets and Liabilities
| As of December 31, 2007 (all numbers in thousands except net asset value per share) | Janus Aspen Balanced Portfolio | ||||||
| Assets: | |||||||
| Investments at cost(1) | $ | 1,988,481 | |||||
| Investments at value(1) | $ | 2,270,811 | |||||
| Affiliated money market investments | 32,922 | ||||||
| Cash | 2,199 | ||||||
| Receivables: | |||||||
| Investments sold | 4,758 | ||||||
| Portfolio shares sold | 735 | ||||||
| Dividends | 1,893 | ||||||
| Interest | 9,039 | ||||||
| Non-interested Trustees' deferred compensation | 31 | ||||||
| Other assets | 62 | ||||||
| Forward currency contracts | 558 | ||||||
| Total Assets | 2,323,008 | ||||||
| Liabilities: | |||||||
| Payables: | |||||||
| Collateral for securities loaned (Note 1) | 406,100 | ||||||
| Portfolio shares repurchased | 1,021 | ||||||
| Advisory fees | 898 | ||||||
| Transfer agent fees and expenses | 1 | ||||||
| Distribution fees - Service Shares | 123 | ||||||
| Non-interested Trustees' fees and expenses | 14 | ||||||
| Non-interested Trustees' deferred compensation fees | 31 | ||||||
| Accrued expenses | 73 | ||||||
| Forward currency contracts | 138 | ||||||
| Total Liabilities | 408,399 | ||||||
| Net Assets | $ | 1,914,609 | |||||
| Net Assets Consist of: | |||||||
| Capital (par value and paid-in-surplus)* | $ | 1,476,353 | |||||
| Undistributed net investment income/(loss)* | 6,054 | ||||||
| Undistributed net realized gain/(loss) from investments and foreign currency transactions* | 116,521 | ||||||
| Unrealized appreciation/(depreciation) of investments, foreign currency translations and non-interested Trustees' deferred compensation | 315,681 | ||||||
| Total Net Assets | $ | 1,914,609 | |||||
| Net Assets - Institutional Shares | $ | 1,335,428 | |||||
| Shares Outstanding, $0.001 Par Value (unlimited shares authorized) | 44,451 | ||||||
| Net Asset Value Per Share | $ | 30.04 | |||||
| Net Assets - Service Shares | $ | 579,181 | |||||
| Shares Outstanding, $0.001 Par Value (unlimited shares authorized) | 18,641 | ||||||
| Net Asset Value Per Share | $ | 31.07 | |||||
*See Note 3 in Notes to Financial Statements.
(1) Investments at cost and value include $397,841,702 of securities loaned (Note 1).
See Notes to Financial Statements.
Janus Aspen Series December 31, 2007 11
Statement of Operations
| For the fiscal year ended December 31, 2007 (all numbers in thousands) | Janus Aspen Balanced Portfolio | ||||||
| Investment Income: | |||||||
| Interest | $ | 37,450 | |||||
| Securities lending income | 1,450 | ||||||
| Dividends | 21,906 | ||||||
| Dividends from affiliates | 840 | ||||||
| Foreign tax withheld | (599 | ) | |||||
| Total Investment Income | 61,047 | ||||||
| Expenses: | |||||||
| Advisory fees | 10,786 | ||||||
| Transfer agent fees and expenses | 6 | ||||||
| Registration fees | 20 | ||||||
| Custodian fees | 97 | ||||||
| Professional fees | 13 | ||||||
| Non-interested Trustees' fees and expenses | 54 | ||||||
| Distribution fees - Service Shares | 1,365 | ||||||
| Other expenses | 236 | ||||||
| Non-recurring costs (Note 2) | 1 | ||||||
| Costs assumed by Janus Capital Management LLC (Note 2) | (1 | ) | |||||
| Total Expenses | 12,577 | ||||||
| Expense and Fee Offset | (22 | ) | |||||
| Net Expenses | 12,555 | ||||||
| Net Investment Income/(Loss) | 48,492 | ||||||
| Net Realized and Unrealized Gain/(Loss) on Investments: | |||||||
| Net realized gain/(loss) from investments and foreign currency transactions | 124,759 | ||||||
| Change in net appreciation/(depreciation) of investments, foreign currency translations and non-interested Trustees' deferred compensation | 22,714 | ||||||
| Net Gain/(Loss) on Investments | 147,473 | ||||||
| Net Increase/(Decrease) in Net Assets Resulting from Operations | $ | 195,965 | |||||
See Notes to Financial Statements.
12 Janus Aspen Series December 31, 2007
Statements of Changes in Net Assets
| For the fiscal years ended December 31 | Janus Aspen Balanced Portfolio | ||||||||||
| (all numbers in thousands) | 2007 | 2006 | |||||||||
| Operations: | |||||||||||
| Net investment income/(loss) | $ | 48,492 | $ | 40,911 | |||||||
| Net realized gain/(loss) from investments and foreign currency transactions | 124,759 | 183,092 | |||||||||
| Change in net appreciation/(depreciation) of investments, foreign currency translations and non-interested Trustees' deferred compensation | 22,714 | (14,566 | ) | ||||||||
| Payment from affiliate (Note 2) | – | 1 | |||||||||
| Net Increase/(Decrease) in Net Assets Resulting from Operations | 195,965 | 209,438 | |||||||||
| Dividends and Distributions to Shareholders: | |||||||||||
| Net investment income* | |||||||||||
| Institutional Shares | (35,086 | ) | (32,008 | ) | |||||||
| Service Shares | (12,684 | ) | (9,453 | ) | |||||||
| Net realized gain/(loss) from investment transactions* | |||||||||||
| Institutional Shares | – | – | |||||||||
| Service Shares | – | – | |||||||||
| Net Decrease from Dividends and Distributions | (47,770 | ) | (41,461 | ) | |||||||
| Capital Share Transactions: | |||||||||||
| Shares sold | |||||||||||
| Institutional Shares | 23,903 | 31,534 | |||||||||
| Service Shares | 85,791 | 71,520 | |||||||||
| Reinvested dividends and distributions | |||||||||||
| Institutional Shares | 35,086 | 32,008 | |||||||||
| Service Shares | 12,684 | 9,453 | |||||||||
| Shares repurchased | |||||||||||
| Institutional Shares | (307,076 | ) | (395,655 | ) | |||||||
| Service Shares | (68,411 | ) | (173,852 | ) | |||||||
| Net Increase/(Decrease) from Capital Share Transactions | (218,023 | ) | (424,992 | ) | |||||||
| Net Increase/(Decrease) in Net Assets | (69,828 | ) | (257,015 | ) | |||||||
| Net Assets: | |||||||||||
| Beginning of period | 1,984,437 | 2,241,452 | |||||||||
| End of period | $ | 1,914,609 | $ | 1,984,437 | |||||||
| Undistributed net investment income/(loss)* | $ | 6,054 | $ | 5,348 | |||||||
*See Note 3 in Notes to Financial Statements.
See Notes to Financial Statements.
Janus Aspen Series December 31, 2007 13
Financial Highlights
Institutional Shares
| For a share outstanding during each | Janus Aspen Balanced Portfolio | ||||||||||||||||||||||
| fiscal year ended December 31 | 2007 | 2006 | 2005 | 2004 | 2003 | ||||||||||||||||||
| Net Asset Value, Beginning of Period | $ | 27.89 | $ | 25.74 | $ | 24.39 | $ | 22.98 | $ | 20.59 | |||||||||||||
| Income from Investment Operations: | |||||||||||||||||||||||
| Net investment income/(loss) | .82 | .61 | .61 | .60 | .47 | ||||||||||||||||||
| Net gain/(loss) on securities (both realized and unrealized) | 2.09 | 2.12 | 1.31 | 1.35 | 2.40 | ||||||||||||||||||
| Total from Investment Operations | 2.91 | 2.73 | 1.92 | 1.95 | 2.87 | ||||||||||||||||||
| Less Distributions and Other: | |||||||||||||||||||||||
| Dividends (from net investment income)* | (.76 | ) | (.58 | ) | (.57 | ) | (.54 | ) | (.48 | ) | |||||||||||||
| Distributions (from capital gains)* | – | – | – | – | – | ||||||||||||||||||
| Payment from affiliate | – | – | (1) | – | (1) | – | – | ||||||||||||||||
| Total Distributions and Other | (.76 | ) | (.58 | ) | (.57 | ) | (.54 | ) | (.48 | ) | |||||||||||||
| Net Asset Value, End of Period | $ | 30.04 | $ | 27.89 | $ | 25.74 | $ | 24.39 | $ | 22.98 | |||||||||||||
| Total Return | 10.50 | % | 10.72 | %(2) | 7.95 | %(2) | 8.53 | % | 14.05 | % | |||||||||||||
| Net Assets, End of Period (in thousands) | $ | 1,335,428 | $ | 1,475,350 | $ | 1,681,985 | $ | 2,395,562 | $ | 3,253,664 | |||||||||||||
| Average Net Assets for the Period (in thousands) | $ | 1,417,947 | $ | 1,554,032 | $ | 1,887,185 | $ | 3,012,164 | $ | 3,183,585 | |||||||||||||
| Ratio of Gross Expenses to Average Net Assets(3)(4) | 0.57 | % | 0.58 | % | 0.57 | % | 0.61 | % | 0.67 | % | |||||||||||||
| Ratio of Net Expenses to Average Net Assets(4) | 0.57 | % | 0.57 | % | 0.56 | % | 0.61 | % | 0.67 | % | |||||||||||||
| Ratio of Net Investment Income/(Loss) to Average Net Assets | 2.54 | % | 2.04 | % | 2.01 | % | 2.08 | % | 2.12 | % | |||||||||||||
| Portfolio Turnover Rate | 54 | % | 52 | % | 52 | % | 64 | % | 69 | % | |||||||||||||
Service Shares
| For a share outstanding during each fiscal year ended December 31 | Janus Aspen Balanced Portfolio | ||||||||||||||||||||||
| 2007 | 2006 | 2005 | 2004 | 2003 | |||||||||||||||||||
| Net Asset Value, Beginning of Period | $ | 28.83 | $ | 26.61 | $ | 25.24 | $ | 23.82 | $ | 21.32 | |||||||||||||
| Income from Investment Operations: | |||||||||||||||||||||||
| Net investment income/(loss) | .70 | .49 | .45 | .44 | .39 | ||||||||||||||||||
| Net gain/(loss) on securities (both realized and unrealized) | 2.24 | 2.27 | 1.46 | 1.52 | 2.52 | ||||||||||||||||||
| Total from Investment Operations | 2.94 | 2.76 | 1.91 | 1.96 | 2.91 | ||||||||||||||||||
| Less Distributions and Other: | |||||||||||||||||||||||
| Dividends (from net investment income)* | (.70 | ) | (.54 | ) | (.54 | ) | (.54 | ) | (.41 | ) | |||||||||||||
| Distributions (from capital gains)* | – | – | – | – | – | ||||||||||||||||||
| Payment from affiliate | – | – | (1) | – | (1) | – | – | ||||||||||||||||
| Total Distributions and Other | (.70 | ) | (.54 | ) | (.54 | ) | (.54 | ) | (.41 | ) | |||||||||||||
| Net Asset Value, End of Period | $ | 31.07 | $ | 28.83 | $ | 26.61 | $ | 25.24 | $ | 23.82 | |||||||||||||
| Total Return | 10.25 | % | 10.46 | %(2) | 7.62 | %(2) | 8.29 | % | 13.72 | % | |||||||||||||
| Net Assets, End of Period (in thousands) | $ | 579,181 | $ | 509,087 | $ | 559,467 | $ | 514,135 | $ | 431,044 | |||||||||||||
| Average Net Assets for the Period (in thousands) | $ | 545,997 | $ | 515,319 | $ | 526,693 | $ | 465,719 | $ | 349,871 | |||||||||||||
| Ratio of Gross Expenses to Average Net Assets(3)(4) | 0.82 | % | 0.83 | % | 0.82 | % | 0.86 | % | 0.92 | % | |||||||||||||
| Ratio of Net Expenses to Average Net Assets(4) | 0.82 | % | 0.82 | % | 0.82 | % | 0.86 | % | 0.92 | % | |||||||||||||
| Ratio of Net Investment Income/(Loss) to Average Net Assets | 2.27 | % | 1.79 | % | 1.77 | % | 1.85 | % | 1.86 | % | |||||||||||||
| Portfolio Turnover Rate | 54 | % | 52 | % | 52 | % | 64 | % | 69 | % | |||||||||||||
* See Note 3 in Notes to Financial Statements.
(1) Payment from affiliate aggregated less than $.01 on a per share basis for the fiscal year ended.
(2) During the fiscal year ended, Janus Capital and/or Janus Services LLC fully reimbursed the Portfolio for a loss on a transaction resulting from certain trading, pricing and/or shareholder activity errors, which otherwise would have reduced total return by less than 0.01%.
(3) The effect of non-recurring costs assumed by Janus Capital (Note 2) is included in the ratio of gross expenses to average net assets and was less than 0.01% for the fiscal years ended 2007, 2006, 2005 and 2004.
(4) See "Explanations of Charts, Tables and Financial Statements."
See Notes to Financial Statements.
14 Janus Aspen Series December 31, 2007
Notes to Schedule of Investments
| Balanced Index | An internally-calculated, hypothetical combination of unmanaged indices that combines total returns from the S&P 500® Index (55%) and the Lehman Brothers Government/Credit Index (45%). | ||||||
| Lehman Brothers Government/Credit Index | Is composed of all bonds that are investment grade with at least one year until maturity. | ||||||
| Lipper Variable Annuity Mixed-Asset Target Allocation Moderate Funds | Funds that, by portfolio practice, maintain a mix of between 40%-60% equity securities, with the remainder invested in bonds, cash, and cash equivalents. | ||||||
| S&P 500® Index | The Standard & Poor's ("S&P") 500® Index is a commonly recognized, market capitalization weighted index of 500 widely held equity securities, designed to measure broad U.S. equity performance. | ||||||
| 144A | Securities sold under Rule 144A of the Securities Act of 1933, as amended, are subject to legal and/or contractual restrictions on resale and may not be publicly sold without registration under the 1933 Act. | ||||||
| ADR | American Depositary Receipt | ||||||
| PLC | Public Limited Company | ||||||
| U.S. Shares | Securities of foreign companies trading on an American Stock Exchange. | ||||||
* Non-income-producing security.
** A portion of this security has been segregated by the custodian to cover margin or segregation requirements on open futures contracts, forward currency contracts, options contracts, short sales and/or securities with extended settlement dates.
‡ Rate is subject to change. Rate shown reflects rate as of December 31, 2007.
çç Security is a U.S. Treasury Inflation-Protected Security (TIPS).
# Loaned security; a portion or all of the security is on loan at December 31, 2007.
† The security is purchased with the cash collateral received from securities on loan (Note 1).
§Schedule of Restricted and Illiquid Securities (as of December 31, 2007)
| Acquisition Date | Acquisition Cost | Value | Value as a % of Net Assets | ||||||||||||||||
| Janus Aspen Balanced Portfolio | |||||||||||||||||||
| Atlas Copco A.B., 5.60% bonds, due 5/22/17 (144A) | 5/15/07 | $ | 1,104,503 | $ | 1,105,403 | 0.1 | % | ||||||||||||
The Portfolio has registration rights for certain restricted securities held as of December 31, 2007. The issuer incurs all registration costs.
Aggregate collateral segregated to cover margin or segregation requirements on open futures contracts, forward currency contracts, options contracts, short sales and/or securities with extended settlement dates as of December 31, 2007 is noted below.
| Portfolio | Aggregate Value | ||||||
| Janus Aspen Balanced Portfolio | $ | 108,847,575 | |||||
The interest rate on floating rate notes is based upon an index or market interest rates and is subject to change. Rates in the security description are as of December 31, 2007.
Janus Aspen Series December 31, 2007 15
Notes to Financial Statements
The following section describes the organization and significant accounting policies and provides more detailed information about the schedules and tables that appear throughout this report. In addition, the Notes to Financial Statements explain the methods used in preparing and presenting this report.
1. ORGANIZATION AND SIGNIFICANT ACCOUNTING POLICIES
Janus Aspen Balanced Portfolio (the "Portfolio") is a series fund. The Portfolio is part of Janus Aspen Series (the "Trust"), which is organized as a Delaware statutory trust and is registered under the Investment Company Act of 1940, as amended, (the "1940 Act") as an open-end management investment company. The Trust offers seventeen Portfolios, which include multiple series of shares, with differing investment objectives and policies. The Portfolio invests primarily in equity securities. The Portfolio is classified as diversified, as defined in the 1940 Act. The Portfolio is a no-load investment.
The Portfolio currently offers two classes of shares: Institutional Shares and Service Shares. Institutional Shares are offered only in connection with investment in and payments under variable insurance contracts and to qualified retirement plans. Service Shares are offered only in connection with investment in and payments under variable insurance contracts and to qualified retirement plans that require a fee from Portfolio assets to procure distribution and administrative services to contract owners and plan participants.
The following accounting policies have been consistently followed by the Portfolio and are in conformity with accounting principles generally accepted in the United States of America in the investment company industry.
Investment Valuation
Securities are valued at the last sales price or the official closing price for securities traded on a principal securities exchange (U.S. or foreign) and on the NASDAQ National Market. Securities traded on over-the-counter markets and listed securities for which no sales are reported are valued at the latest bid price (or yield equivalent thereof) obtained from one or more dealers transacting in a market for such securities or by a pricing service approved by the Portfolio's Trustees. Short-term securities with maturities of 60 days or less may be valued at amortized cost, which approximates market value. Debt securities with a remaining maturity of greater than 60 days are valued in accordance with the evaluated bid price supplied by the pricing service. The evaluated bid price supplied by the pricing service is an evaluation that reflects such factors as security prices, yields, maturities and ratings. Foreign securities and currencies ar e converted to U.S. dollars using the applicable exchange rate in effect as of the daily close of the New York Stock Exchange ("NYSE"). When market quotations are not readily available or deemed unreliable, or events or circumstances that may affect the value of portfolio securities held by the Portfolio are identified between the closing of their principal markets and the time the net asset value ("NAV") is determined, securities may be valued at fair value as determined in good faith under procedures established by and under the supervision of the Portfolio's Trustees. Circumstances in which fair value pricing may be utilized include, but are not limited to: (i) when significant events occur which may affect the securities of a single issuer, such as mergers, bankruptcies, or significant issuer specific developments; (ii) when significant events occur which may affect an entire market, such as natural disasters or significant governmen tal actions; and (iii) when non-significant events occur such as markets closing early or not opening, security trading halts, or pricing of non-valued securities and restricted or non-public securities. The Portfolio may use a systematic fair valuation model provided by an independent third party to value international equity securities in order to adjust for stale pricing, which may occur between the close of certain foreign exchanges and the NYSE.
Investment Transactions and Investment Income
Investment transactions are accounted for as of the date purchased or sold (trade date). Dividend income is recorded on the ex-dividend date. Certain dividends from foreign securities will be recorded as soon as the Trust is informed of the dividend if such information is obtained subsequent to the ex-dividend date. Dividends from foreign securities may be subject to withholding taxes in foreign jurisdictions. Interest income is recorded on the accrual basis and includes amortization of premiums and accretion of discounts. Gains and losses are determined on the identified cost basis, which is the same basis used for federal income tax purposes. Income, as well as gains and losses, both realized and unrealized, are allocated daily to each class of shares based upon the ratio of net assets represented by each class as a percentage of total net assets.
Expenses
The Portfolio bears expenses incurred specifically on its behalf as well as a portion of general expenses. Each class of shares bears expenses incurred specifically on its behalf and, in addition, each class bears a portion of general expenses, which may be based upon relative net assets of each class. Expenses are allocated daily to each class of shares based upon the ratio of net assets represented by each class as a percentage of total net assets. Expenses directly attributable to a specific class of shares are charged against the operations of such class.
Securities Lending
Under procedures adopted by the Trustees, the Portfolio may lend securities to qualified parties (typically brokers or other financial institutions) who need to borrow securities in order to complete certain transactions such as covering short sales, avoiding failures to deliver securities or completing arbitrage activities. The Portfolio may seek to earn additional income through securities lending. There is the risk of delay in recovering a loaned security or the risk of loss in collateral rights if the borrower fails financially. Janus Capital Management LLC ("Janus Capital") makes efforts to balance the benefits and risks from granting such loans.
State Street Bank and Trust Company served as the Portfolio's lending agent for the period January 1, 2007 through May 24, 2007. Effective May 25, 2007, Dresdner Bank AG became the lending agent for the Portfolio.
The Portfolio does not have the right to vote on securities while they are being lent; however, the Portfolio may attempt to call
16 Janus Aspen Series December 31, 2007
back the loan and vote the proxy if time permits. All loans will be continuously secured by collateral which may consist of cash, U.S. Government securities, domestic and foreign short-term debt instruments, letters of credit, time deposits, repurchase agreements, or such other collateral permitted by the Securities and Exchange Commission ("SEC"). Cash collateral may be invested in affiliated money market funds or other accounts advised by Janus Capital to the extent consistent with exemptive relief obtained from the SEC or as permitted by the 1940 Act and rules promulgated thereunder.
Dresdner Bank AG (the "Lending Agent") may also invest the cash collateral in the Allianz Dresdner Daily Asset Fund or investments in unaffiliated money market funds or accounts, mutually agreed to by the Portfolio and the Lending Agent, that comply with Rule 2a-7 of the 1940 Act relating to money market funds.
As of December 31, 2007, the Portfolio had on loan securities valued as indicated:
| Portfolio | Value at December 31, 2007 | ||||||
| Janus Aspen Balanced Portfolio | $ | 397,841,702 | |||||
As of December 31, 2007, the Portfolio received cash collateral for securities lending activity as indicated:
| Portfolio | Cash Collateral at December 31, 2007 | ||||||
| Janus Aspen Balanced Portfolio | $ | 406,100,071 | |||||
As of December 31, 2007, all cash collateral received by the Portfolio was invested in the Allianz Dresdner Daily Asset Fund, except for $76,805,838 and $59,007,309 which were invested in Repurchase Agreements and Time Deposits, respectively.
The value of the collateral must be at least 102% of the market value of the loaned securities that are denominated in U.S. dollars and 105% of the market value of the loaned securities that are not denominated in U.S. dollars. Loaned securities and related collateral are marked-to-market each business day based upon the market value of the loaned securities at the close of business, employing the most recent available pricing information. Collateral levels are then adjusted based on this mark-to-market evaluation.
The borrower pays fees at the Portfolio's direction to the Lending Agent. The Lending Agent may retain a portion of the interest earned on the cash collateral invested. The cash collateral invested by the Lending Agent is disclosed in the Schedule of Investments (if applicable). The lending fees and the Portfolio's portion of the interest income earned on cash collateral are included on the Statement of Operations (if applicable).
Interfund Lending
Pursuant to an exemptive order received from the SEC, the Portfolio may be party to an interfund lending agreement between the Portfolio and other Janus Capital sponsored mutual funds, which permits it to borrow or lend cash at a rate beneficial to both the borrowing and lending funds. Outstanding borrowings from all sources totaling 10% or more of the borrowing Portfolio's total assets must be collateralized at 102% of the outstanding principal value of the loan; loans of less than 10% may be unsecured. During the fiscal year ended December 31, 2007, there were no outstanding interfund borrowing or lending arrangements for the Portfolio.
Forward Currency Transactions
The Portfolio may enter into forward currency contracts in order to reduce its exposure to changes in foreign currency exchange rates on its foreign portfolio holdings and to lock in the U.S. dollar cost of firm purchase and sale commitments for securities denominated in or exposed to foreign currencies. A forward currency exchange contract is a commitment to purchase or sell a foreign currency at a future date at a negotiated rate. The gain or loss arising from the difference between the U.S. dollar cost of the original contract and the value of the foreign currency in U.S. dollars upon closing a contract is included in "Net realized gain/(loss) from investment and foreign currency transactions" on the Statement of Operations (if applicable).
Forward currency contracts held by the Portfolio are fully collateralized by other securities, which are denoted in the accompanying Schedule of Investments (if applicable). The collateral is evaluated daily to ensure its market value equals or exceeds the current market value of the corresponding forward currency contracts.
Futures Contracts
The Portfolio may enter into futures contracts to gain exposure to the stock market pending investment of cash balances or to meet liquidity needs. The Portfolio may also use such derivative instruments to hedge or protect from adverse movements in securities prices, currency rates or interest rates. The use of futures contracts may involve risks such as the possibility of illiquid markets or imperfect correlation between the value of the contracts and the underlying securities, or that the counterparty will fail to perform its obligations.
Futures contracts are marked-to-market daily, and the daily variation margin is recorded as a receivable or payable on the Statement of Assets and Liabilities (if applicable). When a contract is closed, a realized gain or loss is recorded as "Net realized gain/(loss) from futures contracts" on the Statement of Operations (if applicable) equal to the difference between the opening and closing value of the contract. Generally, futures contracts are marked-to-market (i.e., treated as realized and subject to distribution) for federal income tax purposes at fiscal year-end. Securities designated as collateral for market value on futures contracts are noted in the Schedule of Investments (if applicable). Such collateral is in the possession of the Portfolio's custodian. As of December 31, 2007, the Portfolio was not invested in futures contracts.
Bank Loans
The Portfolio may invest in bank loans, which include institutionally-traded floating rate securities generally acquired as an assignment or participation interest in loans originated by a bank or financial institution (the "Lender") that acts as agent for all holders. The agent administers the terms of the loan, as specified in the loan agreement. When investing in a loan participation, the Portfolio has the right to receive payments of
Janus Aspen Series December 31, 2007 17
Notes to Financial Statements (continued)
principal, interest and any fees to which it is entitled only from the Lender selling the loan agreement and only upon receipt by the Lender of payments from the borrower. The Portfolio generally has no right to enforce compliance with the terms of the loan agreement with the borrower. Assignments and participations involve credit, interest rate, and liquidity risk. Interest rates on floating rate securities adjust with general interest rate changes and/or issuer credit quality. The interest rates paid on a floating rate security in which the Portfolio invests generally are readjusted periodically to an increment over a designated benchmark rate, such as the one-month, three-month, six-month, or one-year London Interbank Offered Rate ("LIBOR'').
The Portfolio may have difficulty trading assignments and participations to third parties. There may be restrictions on transfer and only limited opportunities may exist to sell such securities in secondary markets. As a result, the Portfolio may be unable to sell assignments or participations at the desired time or may be able to sell only at a price less than fair market value. The Portfolio utilizes an independent third party to value individual bank loans on a daily basis.
The average monthly value of borrowings outstanding under bank loan arrangements and the related rate range during the fiscal year ended December 31, 2007 are noted in the table below.
| Portfolio | Average Monthly Value | Rates | |||||||||
| Janus Aspen Balanced Portfolio | $ | 17,354,210 | 1.75 | %-8.11380% | |||||||
Short Sales
The Portfolio may engage in "short sales against the box." Short sales against the box involve either selling short a security that the Portfolio owns, or selling short a security that the Portfolio has the right to obtain, for delivery at a specified date in the future. The Portfolio may enter into a short sale against the box to hedge against anticipated declines in the market price of portfolio securities by locking in gains. The Portfolio does not deliver from its portfolio the securities sold short and does not immediately receive the proceeds of the short sale. The Portfolio borrows the securities sold short and receives proceeds from the short sale only when it delivers the securities to the lender. If the value of the securities sold short increases prior to the scheduled delivery date, the Portfolio loses the opportunity to participate in the gain.
The Portfolio may engage in short sales when the portfolio manager anticipates that a security's market purchase price will be less than its borrowing price. To complete the transaction, the Portfolio must borrow the security to deliver it to the purchaser and buy that same security in the market to return it to the lender. The total market value of all of the Portfolio's short sale positions will not exceed 10% of its assets. Although the potential for gain is limited to the difference between the price at which the Portfolio sold the security short and the cost of borrowing the security, its potential for loss is theoretically unlimited because there is no limit to the cost of replacing the borrowed security. There is no assurance that the Portfolio will be able to close out a short position at a particular time or at an acceptable price. A gain or a loss will be recog nized upon termination of a short sale. There is no limit to the size of any loss that the Portfolio may recognize upon termination of a short sale. Short sales held by the Portfolio are fully collateralized by other securities, which are denoted in the accompanying Schedule of Investments (if applicable). As of December 31, 2007, the Portfolio was not engaged in short sales.
Floating Rate Loans
The Portfolio may invest in floating rate loans. Floating rate loans are debt securities that have floating interest rates tied to a benchmark lending rate such as the LIBOR. LIBOR is a short-term interest rate that banks charge one another and that is generally representative of the most competitive and current cash rates. In other cases, the lending rate could be tied to the prime rate offered by one or more major U.S. banks or the rate paid on large certificates of deposit traded in the secondary markets (the CD Rate). If the benchmark lending rate changes, the rate payable to lenders under the loan will change at the next scheduled adjustment date specified in the loan agreement. Floating rate loans are typically issued to companies (''borrowers'') in connection with recapitalizations, acquisitions, and refinancings. Floating rate loan investments are generally below investment grade. Senior floating rate loans are secured by specific co llateral of a borrower and are senior in the borrower's capital structure. The senior position in the borrower's capital structure generally gives holders of senior loans a claim on certain of the borrower's assets that is senior to subordinated debt and preferred and common stock in the case of a borrower's default. Floating rate loan investments may involve foreign borrowers, and investments may be denominated in foreign currencies. Floating rate loans often involve borrowers whose financial condition is troubled or uncertain and companies that are highly leveraged. The Portfolio may invest in obligations of borrowers who are in bankruptcy proceedings. Floating rate loans may include fully funded term loans or revolving lines of credit.
Foreign Currency Translations
The Portfolio does not isolate that portion of the results of operations resulting from changes in foreign exchange rates on investments from the fluctuations arising from changes in market prices of securities held at the date of the financial statements. Net unrealized appreciation or depreciation on investments and foreign currency translation arise from changes in the value of assets and liabilities, including investments in securities held at the date of the financial statements, resulting from changes in the exchange rates and changes in market prices of securities held.
Currency gains and losses are also calculated on payables and receivables that are denominated in foreign currencies. The payables and receivables are generally related to foreign security transactions and income.
Foreign currency-denominated assets and forward currency contracts may involve more risks than domestic transactions, including currency risk, political and economic risk, regulatory risk and market risk. Risks may arise from the potential inability of a counterparty to meet the terms of a contract and from unanticipated movements in the value of foreign currencies relative to the U.S. dollar.
18 Janus Aspen Series December 31, 2007
When-issued Securities
The Portfolio may purchase or sell securities on a when-issued or forward commitment basis. The price of the underlying securities and date when the securities will be delivered and paid for are fixed at the time the transaction is negotiated. Losses may arise due to changes in the market value of the securities or from the inability of counterparties to meet the terms of the contract. In connection with such purchases, the Portfolio may hold liquid assets as collateral with the Portfolio's custodian sufficient to cover the purchase price. As of December 31, 2007, the Portfolio was not invested in when-issued securities.
Equity-Linked Structured Notes
The Portfolio may invest in equity-linked structured notes. Equity-linked structured notes are derivative securities which are specially designed to combine the characteristics of one or more underlying securities and their equity derivatives in a single note form. The return and/or yield or income component may be based on the performance of the underlying equity securities, an equity index, and/or option positions. Equity-linked structured notes are typically offered in limited transactions by financial institutions in either registered or non-registered form. An investment in equity-linked structured notes creates exposure to the credit risk of the issuing financial institution, as well as to the market risk of the underlying securities. There is no guaranteed return of principal with these securities and the appreciation potential of these securities may be limited by a maximum payment or call right. In certain cases, equity-linked struc tured notes may be more volatile and less liquid than less complex securities or other types of fixed-income securities. Such securities may exhibit price behavior that does not correlate with other fixed-income securities. As of December 31, 2007, the Portfolio was not invested in equity-linked structured notes.
Initial Public Offerings
The Portfolio may invest in initial public offerings ("IPOs"). IPOs and other investment techniques may have a magnified performance impact on a fund with a small asset base. The Portfolio may not experience similar performance as its assets grow.
Additional Investment Risk
The Portfolio may be invested in lower-rated debt securities that have a higher risk of default or loss of value since these securities may be sensitive to economic changes, political changes or adverse developments specific to the issuer.
Restricted Security Transactions
Restricted securities held by the Portfolio may not be sold except in exempt transactions or in a public offering registered under the Securities Act of 1933. The risk of investing in such securities is generally greater than the risk of investing in the securities of widely held, publicly traded companies. Lack of a secondary market and resale restrictions may result in the inability of the Portfolio to sell a security at a fair price and may substantially delay the sale of the security. In addition, these securities may exhibit greater price volatility than securities for which secondary markets exist.
Dividend Distributions
The Portfolio may make semiannual distributions of substantially all of its investment income and an annual distribution of its net realized capital gains (if any). The majority of dividends and net realized capital gains distributions from the Portfolio may be automatically reinvested into additional shares of the Portfolio, based upon the discretion of the shareholder.
Estimates
The preparation of financial statements in conformity with accounting principles generally accepted in the United States of America requires management to make estimates and assumptions that affect the reported amount of assets and liabilities and disclosure of contingent assets and liabilities at the date of the financial statements, and the reported amounts of income and expenses during the reporting period. Actual results could differ from those estimates.
Federal Income Taxes
No provision for income taxes is included in the accompanying financial statements, as the Portfolio intends to distribute to shareholders all taxable investment income and realized gains and otherwise comply with Subchapter M of the Internal Revenue Code applicable to regulated investment companies.
New Accounting Pronouncements
In July 2006, the Financial Accounting Standards Board ("FASB") issued Interpretation No. 48, "Accounting for Uncertainty in Income Taxes – an Interpretation of FASB Statement No. 109" (the "Interpretation"). The Interpretation establishes for all entities, including pass-through entities such as the Portfolio, a minimum threshold for financial statement recognition of the benefit of positions taken in filing tax returns (including whether an entity is taxable in a particular jurisdiction), and requires certain expanded tax disclosures. A calendar year open-end or closed-end fund was required to implement the Interpretation no later than June 29, 2007 (the last business day of the semi-annual reporting period), and the Interpretation also applies to all open tax years as of the date of effectiveness. Management has evaluated the application of the Interpretation to the Portfolio and has determined there is no significant impact on the Portfolio's financial statements.
In September 2006, the FASB issued Statement of Financial Accounting Standards No. 157, "Fair Value Measurements" ("SFAS No. 157"), which defines fair value, establishes a framework for measuring fair value in generally accepted accounting principles, and expands disclosures about fair value measurements. SFAS No. 157 does not require new fair value measurements, but is applied to the extent that other accounting pronouncements require or permit fair value measurements. SFAS No. 157 emphasizes that fair value is a market-based measurement that should be determined based on the assumptions that market participants would use in pricing an asset or liability. SFAS No. 157 is effective for fiscal years beginning after November 15, 2007 and interim periods within those fiscal years. Management does not believe the adoption of SFAS No. 157 will impact the financial statement amounts, however, the Portfolio will be required to disclose the extent t o which fair value is used to measure assets and liabilities and the inputs used to develop the measurements.
Janus Aspen Series December 31, 2007 19
Notes to Financial Statements (continued)
2. INVESTMENT ADVISORY AGREEMENTS AND OTHER TRANSACTIONS WITH AFFILIATES
The Portfolio pays a monthly advisory fee to Janus Capital based upon average daily net assets and calculated at the annual rate of 0.55%.
Janus Services LLC ("Janus Services"), a wholly-owned subsidiary of Janus Capital, is the Portfolio's transfer agent. Janus Services receives certain out-of-pocket expenses for transfer agent services.
Certain officers of the Portfolio may also be officers and/or directors of Janus Capital. Such officers receive no compensation from the Portfolio, except for the Portfolio's Chief Compliance Officer. Effective January 1, 2006, the Portfolio began reimbursing the adviser for a portion of the compensation paid to the Chief Compliance Officer of the Trust. Total compensation of $3,078 was paid by the Portfolio during the fiscal year ended December 31, 2007. The Portfolio's portion is reported as part of "Other Expenses" on the Statement of Operations.
The Board of Trustees has adopted a deferred compensation plan (the "Deferred Plan") for independent Trustees to elect to defer receipt of all or a portion of the annual compensation they are entitled to receive from the Portfolio. All deferred fees are credited to an account established in the name of the Trustees. The amounts credited to the account then increase or decrease, as the case may be, in accordance with the performance of one or more of the Janus funds that are selected by the Trustees. The account balance continues to fluctuate in accordance with the performance of the selected fund or funds until final payment of all amounts credited to the account. The fluctuation of the account balance is recorded by the Portfolio as unrealized appreciation/(depreciation) and is shown as of December 31, 2007 on the Statement of Assets and Liabilities as an asset, "Noninterested Trustees' deferred compensation," and a liability, "Nonintereste d Trustees' deferred compensation fees." Additionally, the recorded unrealized appreciation/(depreciation) is included in "Unrealized net appreciation/(depreciation) of investments, foreign currency translations and non-interested Trustees' deferred compensation" on the Statement of Assets and Liabilities. Deferred compensation expenses for the fiscal year ended December 31, 2007 are included in "Non-interested Trustees' fees and expenses" on the Statement of Operations. Trustees are allowed to change their designation of mutual funds from time to time. Amounts will be deferred until distributed in accordance with the Deferred Plan. No deferred fees were paid to any Trustee under the Deferred Plan during the fiscal year ended December 31, 2007.
For the fiscal year ended December 31, 2007, Janus Capital assumed $24,421 of legal, consulting and Trustee costs and fees incurred by the funds in Janus Investment Fund, Janus Aspen Series and Janus Adviser Series (the "Funds") in connection with the regulatory and civil litigation matters discussed in Note 6. These non-recurring costs were allocated to all Funds based on the Funds' respective net assets as of July 31, 2004. Additionally, all future non-recurring costs will be allocated to the Funds based on the Funds' respective net assets on July 31, 2004. These "Non-recurring costs" and "Costs assumed by Janus Capital" are shown on the Statement of Operations.
During the fiscal year ended December 31, 2006, Janus Services reimbursed the Portfolio $623 for Service Shares, as a result of dilutions caused by incorrectly processed shareholder activity. Reimbursements are included in "Payment from affiliate" on the Statements of Changes in Net Assets.
During the fiscal year ended December 31, 2006, Janus Capital reimbursed the Portfolio $25 for Institutional Shares and $9 for Service Shares, as a result of dilutions caused by certain trading and/or pricing errors. Reimbursements are included in "Payment from affiliate" on the Statements of Changes in Net Assets.
Janus Distributors LLC, a wholly-owned subsidiary of Janus Capital, is a distributor of the Portfolio. Service Shares have adopted a Distribution and Shareholder Servicing Plan (the "Plan") pursuant to Rule 12b-1 under the 1940 Act. The Plan authorizes payments by the Portfolio in connection with the distribution of Service Shares at an annual rate of up to 0.25% of Service Share's average daily net assets.
The Portfolio's expenses may be reduced by expense offsets from an unaffiliated custodian and/or transfer agent. Such credits or offsets are included in "Expense and Fee Offset" on the Statement of Operations. The transfer agent fee offsets received during the period reduce Transfer Agent Fees and Expenses. Custodian offsets received reduce Custodian Fees. The Portfolio could have employed the assets used by the custodian and/or transfer agent to produce income if it had not entered into an expense offset arrangement.
The Portfolio may invest in money market funds, including funds managed by Janus Capital. During the fiscal year ended December 31, 2007, the Portfolio recorded distributions from affiliated investment companies as affiliated dividend income, and had the following affiliated purchases and sales:
| Purchases Shares/Cost | Sales Shares/Cost | Dividend Income | Value at 12/31/07 | ||||||||||||||||
| Janus Aspen Balanced Portfolio | |||||||||||||||||||
| Janus Institutional Cash Management Fund – Institutional Shares | $ | 160,711,724 | $ | 144,873,224 | $ | 472,331 | $ | 15,838,500 | |||||||||||
| Janus Institutional Cash Reserves Fund | 14,329,197 | 16,240,697 | 27,042 | – | |||||||||||||||
| Janus Institutional Money Market Fund – Institutional Shares | 296,873,421 | 279,789,921 | 265,582 | 17,083,500 | |||||||||||||||
| Janus Money Market Fund – Institutional Shares | 49,845,605 | 57,407,105 | 74,660 | – | |||||||||||||||
| $ | 521,759,947 | $ | 498,310,947 | $ | 839,615 | $ | 32,922,000 | ||||||||||||
20 Janus Aspen Series December 31, 2007
3. FEDERAL INCOME TAX
The tax components of capital shown in the table below represent: (1) distribution requirements the Portfolio must satisfy under the income tax regulations; (2) losses or deductions the Portfolio may be able to offset against income and gains realized in future years; and (3) unrealized appreciation or depreciation of investments for federal income tax purposes (reduced by foreign tax liability).
In 2007, the Portfolio incurred "Post-October" losses during the period from November 1, 2007 through December 31, 2007. These losses will be deferred for tax purposes and recognized in 2008.
Other book to tax differences in the current year may consist of deferred compensation, derivatives, and foreign currency contract adjustments. The Portfolio has elected to treat gains and losses on forward foreign currency contracts as capital gains and losses. Other foreign currency gains and losses on debt instruments are treated as ordinary income for federal income tax purposes pursuant to Section 988 of the Internal Revenue Code.
Accumulated capital losses noted below represent net capital loss carryovers, as of December 31, 2007, that may be available to offset future realized capital gains and thereby reduce future taxable gains distributions.
| Portfolio | Undistributed Ordinary Income | Undistributed Long-Term Gains | Accumulated Capital Losses | Post-October Deferral | Other Book to Tax Differences | Net Tax Appreciation/ (Depreciation) | |||||||||||||||||||||
| Janus Aspen Balanced Portfolio | $ | 6,674,885 | $ | 118,243,221 | $ | – | $ | (1,533 | ) | $ | (9,269 | ) | $ | 313,348,578 | |||||||||||||
During the year ended December 31, 2007, the following capital loss carryover was utilized by the Portfolio as indicated in the table below.
| Portfolio | Capital Loss Carryover Utilized | ||||||
| Janus Aspen Balanced Portfolio | $ | 7,667,345 | |||||
The aggregate cost of investments and the composition of unrealized appreciation and depreciation of investment securities for federal income tax purposes as of December 31, 2007 are noted below.
Unrealized appreciation and unrealized depreciation in the table below exclude appreciation/depreciation on foreign currency translations. The primary difference between book and tax appreciation or depreciation of investments is wash sale loss deferrals.
| Portfolio | Federal Tax Cost | Unrealized Appreciation | Unrealized (Depreciation) | ||||||||||||
| Janus Aspen Balanced Portfolio | $ | 1,990,384,912 | $ | 336,084,225 | $ | (22,735,647 | ) | ||||||||
Income and capital gains distributions are determined in accordance with income tax regulations that may differ from accounting principles generally accepted in the United States of America. These differences are due to differing treatments for items such as net short-term gains, deferral of wash sale losses, foreign currency transactions, net investment losses and capital loss carryovers. Certain permanent differences such as tax returns of capital and net investment losses noted below have been reclassified to paid-in capital.
| For the fiscal year ended December 31, 2007 | Distributions | ||||||||||||||||||
| Portfolio | From Ordinary Income | From Long-Term Capital Gains | Tax Return of Capital | Net Investment Loss | |||||||||||||||
| Janus Aspen Balanced Portfolio | $ | 47,769,415 | $ | – | $ | – | $ | – | |||||||||||
| For the fiscal year ended December 31, 2006 | Distributions | ||||||||||||||||||
| Portfolio | From Ordinary Income | From Long-Term Capital Gains | Tax Return of Capital | Net Investment Loss | |||||||||||||||
| Janus Aspen Balanced Portfolio | $ | 41,461,260 | $ | – | $ | – | $ | – | |||||||||||
Janus Aspen Series December 31, 2007 21
Notes to Financial Statements (continued)
4. CAPITAL SHARE TRANSACTIONS
| For each fiscal year ended December 31 | Janus Aspen Balanced Portfolio | ||||||||||
| (all numbers in thousands) | 2007 | 2006 | |||||||||
| Transactions in Portfolio Shares – Institutional Shares | |||||||||||
| Shares sold | 820 | 1,187 | |||||||||
| Reinvested dividends and distributions | 1,189 | 1,196 | |||||||||
| Shares repurchased | (10,463 | ) | (14,834 | ) | �� | ||||||
| Net Increase/(Decrease) in Portfolio Shares | (8,454 | ) | (12,451 | ) | |||||||
| Shares Outstanding, Beginning of Period | 52,905 | 65,356 | |||||||||
| Shares Outstanding, End of Period | 44,451 | 52,905 | |||||||||
| Transactions in Portfolio Shares – Service Shares | |||||||||||
| Shares sold | 2,824 | 2,603 | |||||||||
| Reinvested dividends and distributions | 415 | 340 | |||||||||
| Shares repurchased | (2,255 | ) | (6,307 | ) | |||||||
| Net Increase/(Decrease) in Portfolio Shares | 984 | (3,364 | ) | ||||||||
| Shares Outstanding, Beginning of Period | 17,657 | 21,021 | |||||||||
| Shares Outstanding, End of Period | 18,641 | 17,657 | |||||||||
5. PURCHASES AND SALES OF INVESTMENT SECURITIES
For the fiscal year ended December 31, 2007, the aggregate cost of purchases and proceeds from sales of investment securities (excluding short-term securities and mortgage dollar roll transactions) were as follows:
| Portfolio | Purchases of Securities | Proceeds from Sales of Securities | Purchases of Long-Term U.S. Government Obligations | Proceeds from Sales of Long-Term U.S. Government Obligations | |||||||||||||||
| Janus Aspen Balanced Portfolio | $ | 555,906,201 | $ | 751,792,947 | $ | 497,021,100 | $ | 551,572,667 | |||||||||||
6. PENDING LEGAL MATTERS
In the fall of 2003, the Securities and Exchange Commission ("SEC"), the Office of the New York State Attorney General ("NYAG"), the Colorado Attorney General ("COAG"), and the Colorado Division of Securities ("CDS") announced that they were investigating alleged frequent trading practices in the mutual fund industry. On August 18, 2004, Janus Capital announced that it had reached final settlements with the SEC, the NYAG, the COAG, and the CDS related to such regulators' investigations into Janus Capital's frequent trading arrangements.
A number of civil lawsuits were brought against Janus Capital and certain of its affiliates, the Janus funds, and related entities and individuals based on allegations similar to those announced by the above regulators and were filed in several state and federal jurisdictions. Such lawsuits alleged a variety of theories for recovery including, but not limited to, the federal securities laws, other federal statutes (including ERISA), and various common law doctrines. The Judicial Panel on Multidistrict Litigation transferred these actions to the U.S. District Court for the District of Maryland (the "Court") for coordinated proceedings. On September 29, 2004, five consolidated amended complaints were filed with the Court that generally include: (i) claims by a putative class of investors in certain Janus funds asserting claims on behalf of the investor class (Marini, et al. v. Janus Investment Fund, et al., U.S. District Court, District of Maryland, Case No. 04-CV-00497); (ii) derivative claims by investors in certain Janus funds ostensibly on behalf of such funds (Steinberg et al. v. Janus Capital Management, LLC et al., U.S. District Court, District of Maryland, Case No. 04-CV-00518); (iii) claims on behalf of participants in the Janus 401(k) plan (Wangberger v. Janus Capital Group Inc., 401(k) Advisory Committee, et al., U.S. District Court, District of Maryland, Case No. JFM-05-2711); (iv) claims brought on behalf of shareholders of Janus Capital Group Inc. ("JCGI") on a derivative basis against the Board of Directors of JCGI (Chasen v. Whiston, et al., U.S. District Court, District of Maryland,
22 Janus Aspen Series December 31, 2007
Case No. 04-MD-00855); and (v) claims by a putative class of shareholders of JCGI asserting claims on behalf of the shareholders (Wiggins, et al. v. Janus Capital Group, Inc., et al., U.S. District Court, District of Maryland, Case No. 04-CV-00818). Each of the five complaints initially named JCGI and/or Janus Capital as a defendant. In addition, the following were also named as defendants in one or more of the actions: Janus Investment Fund ("JIF"), Janus Aspen Series ("JAS"), Janus Adviser Series ("JAD"), Janus Distributors LLC, Enhanced Investment Technologies, LLC ("INTECH"), Bay Isle Financial LLC ("Bay Isle"), Perkins, Wolf, McDonnell and Company, LLC ("Perkins"), the Advisory Committee of the Janus 401(k) plan, and the current or former directors of JCGI.
On August 25, 2005, the Court entered orders dismissing most of the claims asserted against Janus Capital and its affiliates by fund investors in the Marini and Steinberg cases (actions (i) and (ii) above) except certain claims under Section 10(b) of the Securities Exchange Act of 1934 and under Section 36(b) of the Investment Company Act of 1940, as amended (the "1940 Act"). On August 15, 2006, the Wangberger complaint in the 401(k) plan class action (action (iii) above) was dismissed by the district court with prejudice. The plaintiff appealed that dismissal decision to the United States Court of Appeals for the Fourth Circuit. The appeal is still pending and argument in the matter was held in December 2007. The Court also dismissed the Chasen lawsuit (action (iv) above) against JCGI's Board of Directors without leave to amend. Finally, a Motion to Dismiss the Wiggins suit (action (v) above) was granted a nd the matter was dismissed in May 2007. However, in June 2007, Plaintiffs appealed that dismissal to the United States Court of Appeals for the Fourth Circuit. That appeal is currently pending.
In addition to the lawsuits described above, the Auditor of the State of West Virginia ("Auditor"), in his capacity as securities commissioner, has initiated administrative proceedings against many of the defendants in the market timing cases (including JCGI and Janus Capital) and, as a part of its relief, is seeking disgorgement and other monetary relief based on similar market timing allegations (In the Matter of Janus Capital Group Inc. et al., Before the Securities Commissioner, State of West Virginia, Summary Order No. 05-1320). The respondents in these proceedings collectively sought a Writ of Prohibition in state court, which was denied. Their subsequent Petition for Appeal was also denied. Consequently, in September 2006, JCGI and Janus Capital filed their answer to the Auditor's summary order instituting proceedings and requested a hearing. A status conference was held on June 28, 2007, during which the parties were ordered t o submit their proposed scheduling order. To date, no scheduling order has been entered in the case. In addition to the pending Motion to Discharge Order to Show Cause, JCGI and Janus Capital, as well as other similarly situated defendants, continue to challenge the statutory authority of the Auditor to bring such an action.
Additional lawsuits may be filed against certain of the Janus funds, Janus Capital, and related parties in the future. Janus Capital does not currently believe that these pending actions will materially affect its ability to continue providing services it has agreed to provide to the Janus funds.
Janus Aspen Series December 31, 2007 23
Report of Independent Registered Public Accounting Firm
To the Trustees and Shareholders
of Janus Aspen Balanced Portfolio
In our opinion, the accompanying statement of assets and liabilities, including the schedule of investments, and the related statements of operations and of changes in net assets and the financial highlights present fairly, in all material respects, the financial position of Janus Aspen Balanced Portfolio (one of the portfolios constituting Janus Aspen Series, hereafter referred to as the "Portfolio") at December 31, 2007, the results of its operations for the year then ended, the changes in its net assets for each of the two years in the period then ended, and the financial highlights for each of the five years in the period then ended, in conformity with accounting principles generally accepted in the United States of America. These financial statements and financial highlights (hereafter referred to as "financial statements") are the responsibility of the Portfolio's management; our responsibility is to express an opinion on these financi al statements based on our audits. We conducted our audits of these financial statements in accordance with the standards of the Public Company Accounting Oversight Board (United States). Those standards require that we plan and perform the audit to obtain reasonable assurance about whether the financial statements are free of material misstatement. An audit includes examining, on a test basis, evidence supporting the amounts and disclosures in the financial statements, assessing the accounting principles used and significant estimates made by management, and evaluating the overall financial statement presentation. We believe that our audits, which included confirmation of securities at December 31, 2007 by correspondence with the custodian, transfer agent and brokers, and the application of alternative auditing procedures where securities purchased had not been received, provide a reasonable basis for our opinion.

Denver, Colorado
February 15, 2008
24 Janus Aspen Series December 31, 2007
Additional Information (unaudited)
PROXY VOTING POLICIES AND VOTING RECORD
A description of the policies and procedures that the Portfolio uses to determine how to vote proxies relating to its portfolio securities is available: (i) without charge, upon request, by calling 1-800-525-0020 (toll free); (ii) on the Portfolio's website at www.janus.com/proxyvoting; and (iii) on the SEC's website at http://www.sec.gov. Additionally, information regarding the Portfolio's proxy voting record for the most recent twelve-month period ended June 30 is also available, free of charge, through www.janus.com/proxyvoting and from the SEC's website at http://www.sec.gov.
QUARTERLY PORTFOLIO HOLDINGS
The Portfolio files its complete portfolio holdings (schedule of investments) with the SEC for the first and third quarters of each fiscal year on Form N-Q within 60 days of the end of such fiscal quarter. The Portfolio's Form N-Q: (i) is available on the SEC's website at http://www.sec.gov; (ii) may be reviewed and copied at the SEC's Public Reference Room in Washington, D.C. (information on the Public Reference Room may be obtained by calling 1-800-SEC-0330); and (iii) is available without charge, upon request, by calling Janus at 1-800-525-0020 (toll free).
APPROVAL OF ADVISORY AGREEMENTS DURING THE PERIOD
The Trustees of Janus Aspen Series, none of whom has ever been affiliated with Janus Capital ("Independent Trustees"), oversee the management of each Portfolio and, as required by law, determine annually whether to continue the investment advisory agreement for each Portfolio and the subadvisory agreements for the three Portfolios that utilize subadvisers.
In connection with their most recent consideration of those agreements for each Portfolio, the Trustees received and reviewed a substantial amount of information provided by Janus Capital and the respective subadvisers in response to requests of the Independent Trustees and their independent legal counsel. They also received and reviewed a considerable amount of information and analysis provided by their independent fee consultant. Throughout their consideration of the agreements, the Independent Trustees were advised by their independent legal counsel. The Independent Trustees met with management to consider the agreements, and also met separately in executive session with their independent legal counsel and their independent fee consultant.
At a meeting held on December 14, 2007, based on their evaluation of the information provided by Janus Capital, the subadvisers and the independent fee consultant, as well as other information, the Trustees determined that the overall arrangements between each Portfolio and Janus Capital and each subadviser, as applicable, were fair and reasonable in light of the nature, extent and quality of the services provided by Janus Capital, its affiliates and the subadvisers, the fees charged for those services, and other matters that the Trustees considered relevant in the exercise of their business judgment. At that meeting the Trustees unanimously approved the continuation of the investment advisory agreement for each Portfolio, and the subadvisory agreement for each subadvised Portfolio, for the period from February 1, 2008 through February 1, 2009, subject to earlier termina tion as provided for in each agreement.
In considering the continuation of those agreements, the Trustees reviewed and analyzed various factors that they determined were relevant, including the factors described below, none of which by itself was considered dispositive. However, the material factors and conclusions that formed the basis for the Trustees' determination to approve the continuation of the agreements are discussed separately below.
Nature, Extent and Quality of Services
The Trustees reviewed the nature, extent and quality of the services provided by Janus Capital and the subadvisers to the Portfolios, taking into account the investment objective and strategy of each Portfolio, the knowledge of the Trustees gained from their regular meetings with management on at least a quarterly basis, and their ongoing review of information related to the Portfolios. In addition, the Trustees reviewed the resources and key personnel of Janus Capital and each subadviser, especially those who provide investment management services to the Portfolios. The Trustees also considered other services provided to the Portfolios by Janus Capital or the subadvisers, such as managing the execution of portfolio transactions and the selection of broker-dealers for those transactions, serving as the Portfolios' administrator, monitoring adherence to the Portfolios' investment restrictions, producing shareholder reports, providing support services for the Trustees and Trustee committees, communicating with shareholders, and overseeing the activities of other service providers, including monitoring compliance with various policies and procedures of the Portfolios and with applicable securities laws and regulations.
The Trustees concluded that the nature, extent and quality of the services provided by Janus Capital and/or the subadviser to each Portfolio were appropriate and consistent with the terms of the respective advisory and subadvisory agreements; that, taking into account steps taken to address those Portfolios whose performance lagged that of the median of their peers for certain periods, the quality of those services had been consistent with or superior to quality norms in the industry; and that the Portfolios were likely to benefit from the continued provision of those services. They also concluded that Janus Capital and each subadviser had sufficient personnel, with the appropriate education and experience, to serve the Portfolios effectively and had demonstrated its continuing ability to attract well-qualified personnel.
Janus Aspen Series December 31, 2007 25
Additional Information (unaudited) (continued)
Performance of the Portfolios
The Trustees considered the investment results of each Portfolio over various time periods. They reviewed information comparing each Portfolio's performance with the performance of comparable funds and peer groups identified by Lipper Inc., an independent provider of investment company data, and with the Portfolio's benchmark index. They concluded that the performance of many Portfolios was good to very good under current market conditions. Although the performance of some Portfolios lagged that of the median of their peers for certain periods, the Trustees also concluded that Janus Capital had taken appropriate steps to address those instances of under-performance and that the more recent performance of most of those Portfolios had been improving.
Costs of Services Provided
The Trustees examined information on the fees and expenses of each Portfolio in comparison to similar information for comparable funds as provided by Lipper. They also reviewed an analysis of that information provided by their independent fee consultant and noted that the rate of management (investment advisory and administrative) fees for most of the Portfolios, in some cases after contractual expense limitations, was below the mean management fee rate of the respective peer group of funds selected by Lipper.
The Trustees considered the methodology used by Janus Capital and each subadviser in determining compensation payable to portfolio managers, the competitive environment for investment management talent and the competitive market for mutual funds in different distribution channels. They concluded that the compensation methodology provided a good alignment of the interests of the portfolio managers with those of Portfolio shareholders.
The Trustees also reviewed management fees charged by Janus Capital to its separate account clients and to its subadvised funds (for which Janus Capital provides only services related to portfolio management). Although in most instances subadvisory and separate account fee rates for various investment strategies were lower than management fee rates for Portfolios having a similar strategy, the Trustees noted that, under the terms of the management agreements with the Portfolios, Janus Capital performs significant additional services for the Portfolios that it does not provide to those other clients, including administrative services, oversight of the Portfolios' other service providers, Trustee support, regulatory compliance and numerous other services, and that, in serving the Portfolios, Janus Capital assumes many legal risks that it does not assume in servicing its other clients. Moreover, the Trustees noted that the spread between the av erage fee rates charged to the Portfolios and the fee rates that Janus Capital charged to its separate account clients was significantly smaller than the average spread for such fee rates of other advisers, based on publicly available data and research conducted by their independent fee consultant.
The Trustees reviewed information on the profitability to Janus Capital and its affiliates of their relationships with each Portfolio, as well as an explanation of the methodology used in allocating various expenses of Janus Capital and its affiliates among the Portfolios and other clients. They also reviewed the financial statements of Janus Capital's parent company and its corporate structure. In their review, the Trustees considered whether Janus Capital and each subadviser receives adequate incentives to manage the Portfolios effectively. They recognized that profitability comparisons among investment advisers are difficult because very little comparative information is publicly available and profitability of any adviser is affected by numerous factors, including the organizational structure of the particular adviser, the types of funds and other accounts it manages, possible other lines of business, the methodology for allocating expens es, and the adviser's capital structure and cost of capital. However, based on the information available and taking those factors into account, the Trustees concluded that Janus Capital's profitability with respect to each Portfolio in relation to the services rendered was not unreasonable.
The Trustees concluded that the management fees and other compensation payable by each Portfolio to Janus Capital and its affiliates, as well as the fees payable by Janus Capital or the Portfolios to the subadvisers of subadvised Portfolios, were reasonable in relation to the nature, extent and quality of the services provided, taking into account the fees charged by other advisers for managing comparable mutual funds with similar strategies and the fees Janus Capital and the subadvisers charge to other clients. They also concluded that the overall expense ratio of each Portfolio was reasonable, taking into account the size of the Portfolio, the quality of services provided by Janus Capital and any subadviser, the investment performance of the Portfolio and any expense limitations agreed to by Janus Capital.
Economies of Scale
The Trustees considered information about the potential for Janus Capital to realize economies of scale as the assets of the Portfolios increase. They noted that, although most Portfolios pay advisory fees at a fixed rate as a percentage of net assets, without any breakpoints, the management fee rate paid by each Portfolio, after any contractual expense limitations, was below the mean management fee rate of the Portfolio's peer group selected by Lipper; and, for those Portfolios whose expenses are being reduced by the contractual expense limitations of Janus Capital, Janus Capital is subsidizing the Portfolios because they have not reached adequate scale. Moreover, as the assets of many of the Portfolios declined in the past few years, those Portfolios benefited from having advisory fee rates that remained constant rather than
26 Janus Aspen Series December 31, 2007
increasing as assets declined. In addition, performance fee structures have been implemented for several Portfolios that will cause the effective rate of advisory fees payable by such a Portfolio to vary depending on the investment performance of the Portfolio relative to its benchmark index over the measurement period; and a few Portfolios have fee schedules with breakpoints and reduced fee rates above certain asset levels. The Trustees also noted that the Portfolios share directly in economies of scale through lower charges of third-party service providers, based on the combined scale of all of the Portfolios. Based on all of the information they reviewed, the Trustees concluded that the current fee structure of each Portfolio was reasonable and that the current rates of fees do reflect a sharing between Janus Capital and the Portfolio of economies of scale at the current asset level of the Portfolio.
Other Benefits to Janus Capital
The Trustees also considered benefits that accrue to Janus Capital and its affiliates from their relationships with the Portfolios. They recognized that two affiliates of Janus Capital separately serve the Portfolios as transfer agent and distributor, respectively. They also considered Janus Capital's past and proposed use of commissions paid by Portfolios on their portfolio brokerage transactions to obtain proprietary and third-party research products and services benefiting those Portfolios and/or other clients of Janus Capital. The Trustees concluded that Janus Capital's use of "soft" commission dollars of a Portfolio to obtain proprietary and third-party research products and services was consistent with regulatory requirements and guidelines and was likely to benefit the Portfolios. The Trustees also concluded that, other than the services provided by Janus Capital and its affiliates pursuant to the agreements and the fees to be paid by each Portfolio therefor, the Portfolios and Janus Capital may potentially benefit from their relationship with each other in other ways. They concluded that Janus Capital benefits from the receipt of proprietary research products and services acquired through commissions paid on portfolio transactions of the Portfolios and that the Portfolios benefit from Janus Capital's receipt of those products and services, as well as research products and services acquired through commissions paid by other clients of Janus Capital. They further concluded that success of any Portfolio could attract other business to Janus Capital or other Janus funds and that the success of Janus Capital could enhance Janus Capital's ability to serve the Portfolios.
After full consideration of the above factors, as well as other factors, all of the Trustees, all of whom are Independent Trustees, concluded that the proposed continuation of the investment advisory agreement for each Portfolio, and the subadvisory agreement for each subadvised Portfolio, was in the best interest of the respective Portfolios and their shareholders.
Janus Aspen Series December 31, 2007 27
Explanations of Charts, Tables and
Financial Statements (unaudited)
1. PERFORMANCE OVERVIEWS
The performance overview graph compares the performance of a hypothetical $10,000 investment in the Portfolio with one or more widely used market indices. The hypothetical example does not represent the returns of any particular investment.
When comparing the performance of the Portfolio with an index, keep in mind that market indices do not include brokerage commissions that would be incurred if you purchased the individual securities in the index. They also do not include taxes payable on dividends and interest or operating expenses incurred if you maintained a Portfolio invested in the index.
Average annual total returns are quoted for each class of the Portfolio. Average annual total return is calculated by taking the growth or decline in value of an investment over a period of time, including reinvestment of any dividends, distributions and capital gains, then calculating the annual compounded percentage rate that would have produced the same result had the rate of growth been constant throughout the period. Average annual total return does not reflect the deduction of taxes that a shareholder would pay on Portfolio distributions or redemptions of Portfolio shares.
Pursuant to federal securities rules, expense ratios shown in the performance chart reflect subsidized and unsubsidized ratios for the past fiscal year. The total annual portfolio operating expenses ratio is gross of any fee waivers, reflecting a Portfolio's unsubsidized expense ratio. The net annual portfolio operating expenses ratio (if applicable) includes contractual waivers of Janus Capital and/or Janus Services, and reflects a Portfolio's subsidized expense ratio. Both the total annual portfolio operating expenses ratio and net annual portfolio operating expenses ratio are based on average net assets as of the fiscal year ended December 31, 2006. The ratios also include expenses indirectly incurred by the Portfolio as a result of investing in other investment companies or pooled investments, which are not reflected in the "Financial Highlights" of this report. As a result, these ratios may be higher or lower than those shown in the "F inancial Highlights" in this report. All expenses are shown without the effect of expense offset arrangements. Pursuant to such arrangements, credits realized as a result of uninvested cash balances are used to reduce custodian and transfer agent expenses.
2. SCHEDULE OF INVESTMENTS
Following the performance overview section is the Portfolio's Schedule of Investments. This schedule reports the industry concentrations and types of securities held in the Portfolio on the last day of the reporting period. Securities are usually listed by type (common stock, corporate debt, U.S. Government obligations, etc.) and by industry classification (banking, communications, insurance, etc.). Holdings are subject to change without notice.
The value of each security is quoted as of the last day of the reporting period. The value of securities denominated in foreign currencies is converted into U.S. dollars. Certain short-term investments maturing within 60 days are valued at amortized cost, which approximates market value.
A summary of investments by country is provided if the Portfolio invested in foreign securities. This summary reports the Portfolio's exposure to different countries by providing the percentage of securities invested in each country. The country of each security represents the country in which the company is incorporated.
2A. FORWARD CURRENCY CONTRACTS
A table listing forward currency contracts follows the Portfolio's Schedule of Investments (if applicable). Forward currency contracts are agreements to deliver or receive a preset amount of currency at a future date. Forward currency contracts are used to hedge against foreign currency risk in the Portfolio's long-term holdings.
The table provides the name of the foreign currency, the settlement date of the contract, the amount of the contract, the value of the currency in U.S. dollars and the amount of unrealized gain or loss. The amount of unrealized gain or loss reflects the change in currency exchange rates from the time the contract was opened to the last day of the reporting period.
2B. FUTURES
A table listing futures contracts follows the Portfolio's Schedule of Investments (if applicable). Futures contracts are contracts that obligate the buyer to receive and the seller to deliver an instrument or money at a specified price on a specified date. Futures are used to hedge against adverse movements in securities prices, currency risk or interest rates.
The table provides the name of the contract, number of contracts held, the expiration date, the principal amount, value and the amount of unrealized gain or loss. The amount of unrealized gain or loss reflects the marked-to-market amount for the last day of the reporting period.
3. STATEMENT OF ASSETS AND LIABILITIES
This statement is often referred to as the "balance sheet." It lists the assets and liabilities of the Portfolio on the last day of the reporting period.
28 Janus Aspen Series December 31, 2007
The Portfolio's assets are calculated by adding the value of the securities owned, the receivable for securities sold but not yet settled, the receivable for dividends declared but not yet received on stocks owned and the receivable for Portfolio shares sold to investors but not yet settled. The Portfolio's liabilities include payables for securities purchased but not yet settled, Portfolio shares redeemed but not yet paid and expenses owed but not yet paid. Additionally, there may be other assets and liabilities such as unrealized gain or loss on forward currency contracts.
The section entitled "Net Assets Consist of" breaks down the components of the Portfolio's net assets. Because the Portfolio must distribute substantially all earnings, you will notice that a significant portion of net assets is shareholder capital.
The last section of this statement reports the net asset value ("NAV") per share on the last day of the reporting period for each class of the Portfolio. The NAV is calculated by dividing the Portfolio's net assets (assets minus liabilities) by the number of shares outstanding.
4. STATEMENT OF OPERATIONS
This statement details the Portfolio's income, expenses, gains and losses on securities and currency transactions, and appreciation or depreciation of current Portfolio holdings.
The first section in this statement, entitled "Investment Income," reports the dividends earned from stocks and interest earned from interest-bearing securities in the Portfolio.
The next section reports the expenses and expense offsets incurred by the Portfolio, including the advisory fee paid to the investment adviser, transfer agent fees and expenses, printing and postage for mailing statements, financial reports and prospectuses, and other expenses. Expense offsets, if any, are also shown.
The last section lists the increase or decrease in the value of securities held in the Portfolio. The Portfolio realizes a gain (or loss) when it sells its position in a particular security. An unrealized gain (or loss) refers to the change in net appreciation or depreciation of the Portfolio during the reporting period. "Net Realized and Unrealized Gain/(Loss) on Investments" is affected both by changes in the market value of Portfolio holdings and by gains (or losses) realized during the reporting period.
5. STATEMENT OF CHANGES IN NET ASSETS
This statement reports the increase or decrease in the Portfolio's net assets during the reporting period. Changes in the Portfolio's net assets are attributable to investment operations, dividends, distributions and capital share transactions. This is important to investors because it shows exactly what caused the Portfolio's net asset size to change during the period.
The first section summarizes the information from the Statement of Operations regarding changes in net assets due to the Portfolio's investment performance. The Portfolio's net assets may also change as a result of dividend and capital gains distributions to investors. If investors receive their dividends in cash, money is taken out of the Portfolio to pay the distribution. If investors reinvest their dividends, the Portfolio's net assets will not be affected. If you compare the Portfolio's "Net Decrease from Dividends and Distributions" to the "Reinvested dividends and distributions," you will notice that dividend distributions had little effect on the Portfolio's net assets. This is because the majority of Janus investors reinvest their distributions.
The reinvestment of dividends is included under "Capital Share Transactions." "Capital Shares" refers to the money investors contribute to the Portfolio through purchases or withdraw via redemptions. The Portfolio's net assets will increase and decrease in value as investors purchase and redeem shares from the Portfolio.
6. FINANCIAL HIGHLIGHTS
This schedule provides a per-share breakdown of the components that affect the Portfolio's NAV for current and past reporting periods for each class of the Portfolio. Not only does this table provide you with total return, it also reports total distributions, asset size, expense ratios and portfolio turnover rate.
The first line in the table reflects the NAV per share at the beginning of the reporting period. The next line reports the net investment income per share, which comprises dividends and interest income earned on securities held by the Portfolio. Following is the total of gains/(losses), realized and unrealized. Dividends and distributions are then subtracted to arrive at the NAV per share at the end of the period. The next line reflects the average annual total return reported the last day of the period.
Also included are the expense ratios, or the percentage of average net assets that were used to cover operating expenses during the period. Expense ratios vary for a number of reasons, including the differences in management fees, the average shareholder account size and the extent of foreign investments, which entail greater transaction costs.
The Portfolio's expenses may be reduced through expense reduction arrangements. These arrangements may include the use of balance credits or transfer agent fee offsets. The Statement of Operations reflects total expenses before any such offset, the amount of the offset and the net expenses. The expense ratios listed in the Financial Highlights reflect total
Janus Aspen Series December 31, 2007 29
Explanations of Charts, Tables and
Financial Statements (unaudited) (continued)
expenses prior to any expense offsets (gross expense ratio) and after the expense offsets (net expense ratio). Both expense ratios reflect expenses after waivers (reimbursements), if applicable.
The ratio of net investment income/(loss) summarizes the income earned less expenses, divided by the average net assets of the Portfolio during the reporting period. Don't confuse this ratio with the Portfolio's yield. The net investment income ratio is not a true measure of the Portfolio's yield because it doesn't take into account the dividends distributed to the Portfolio's investors.
The next figure is the portfolio turnover rate, which measures the buying and selling activity in the Portfolio. Portfolio turnover is affected by market conditions, changes in the asset size of the Portfolio, the nature of the Portfolio's investments and the investment style of the portfolio manager. A 100% rate implies that an amount equal to the value of the entire portfolio is turned over in a year; a 50% rate means that an amount equal to the value of half the portfolio is traded in a year; and a 200% rate means that an amount equal to the value of the portfolio is traded every six months.
30 Janus Aspen Series December 31, 2007
Designation Requirements (unaudited)
For federal income tax purposes, the Portfolio designated the following for the year ended December 31, 2007:
Dividends Received Deduction Percentage
| Portfolio | |||||||
| Janus Aspen Balanced Portfolio | 29 | % | |||||
Janus Aspen Series December 31, 2007 31
Trustees and Officers (unaudited)
The Portfolio's Statement of Additional Information includes additional information about the Trustees and officers and is available, without charge, by calling 1-800-525-0020.
The following are the Trustees and officers of the Trust, together with a brief description of their principal occupations during the last five years (principal occupations for certain Trustees may include periods over five years).
Each Trustee has served in that capacity since he or she was originally elected or appointed. The Trustees do not serve a specified term of office. Each Trustee will hold office until the termination of the Trust or his or her earlier death, resignation, retirement, incapacity, or removal. The retirement age for Trustees is 72. The Portfolio's Nominating and Governance Committee will consider nominees for the position of Trustee recommended by shareholders. Shareholders may submit the name of a candidate for consideration by the Committee by submitting their recommendations to the Trust's Secretary. Each Trustee is currently a Trustee of two other registered investment companies advised by Janus Capital: Janus Investment Fund and Janus Adviser Series. As of the date of this report, collectively, these three registered investment companies consist of 75 series or funds.
The Trust's officers are elected annually by the Trustees for a one-year term. Certain officers also serve as officers of Janus Investment Fund and Janus Adviser Series. Certain officers of the Portfolio may also be officers and/or directors of Janus Capital. Portfolio officers receive no compensation from the Portfolio, except for the Portfolio's Chief Compliance Officer, as authorized by the Trustees.
Trustees
| Name, Address, and Age | Positions Held with Portfolio | Length of Time Served | Principal Occupations During the Past Five Years | Number of Portfolios/ Funds in Fund Complex Overseen by Trustee | Other Directorships Held by Trustee | ||||||||||||||||||
| Dennis B. Mullen* 151 Detroit Street Denver, CO 80206 DOB: 1943 | Chairman Trustee | 3/04-12/07 9/93-Present | Chief Executive Officer of Red Robin Gourmet Burgers, Inc. (since 2005). Formerly, private investor. | 75 | ** | Chairman of the Board (since 2005) and Director of Red Robin Gourmet Burgers, Inc., and Director of Janus Capital Funds Plc (Dublin-based, non-U.S. funds). | |||||||||||||||||
| Jerome S. Contro 151 Detroit Street Denver, CO 80206 DOB: 1956 | Trustee | 12/05-Present | Partner of Tango Group, a private investment firm (since 1999). | 75 | Trustee and Chairman of RS Investment Trust (since 2001), and Director of IZZE Beverages and MyFamily.com, Inc. (genealogical research website). | ||||||||||||||||||
| William F. McCalpin 151 Detroit Street Denver, CO 80206 DOB: 1957 | Trustee | 6/02-Present | Private investor. Formerly, Executive Vice President and Chief Operating Officer of The Rockefeller Brothers Fund (a private family foundation), and Vice President of Asian Cultural Council. | 75 | Director of F.B. Heron Foundation (a private grant making foundation). | ||||||||||||||||||
* Mr. McCalpin will succeed Mr. Mullen as Chairman as of January 1, 2008.
** Mr. Mullen also serves as director of Janus Capital Funds Plc, consisting of 16 funds. Including Janus Capital Funds Plc and the 75 funds comprising the Janus funds, Mr. Mullen oversees 91 funds.
32 Janus Aspen Series December 31, 2007
Trustees (cont.)
| Name, Address, and Age | Positions Held with Portfolio | Length of Time Served | Principal Occupations During the Past Five Years | Number of Portfolios/ Funds in Fund Complex Overseen by Trustee | Other Directorships Held by Trustee | ||||||||||||||||||
| John W. McCarter, Jr. 151 Detroit Street Denver, CO 80206 DOB: 1938 | Trustee | 6/02-Present | President and Chief Executive Officer of The Field Museum of Natural History (Chicago, IL) (since 1997). | 75 | Chairman of the Board and Director of Divergence Inc. (biotechnology firm); Director of W.W. Grainger, Inc. (industrial distributor); and Trustee of WTTW (Chicago public television station) and the University of Chicago. | ||||||||||||||||||
| James T. Rothe 151 Detroit Street Denver, CO 80206 DOB: 1943 | Trustee | 1/97-Present | Co-founder and Managing Director of Roaring Fork Capital Management, LLC (private investment in public equity firm), and Professor Emeritus of Business of the University of Colorado, Colorado Springs, CO (since 2004). Formerly, Professor of Business of the University of Colorado (2002-2004) and Distinguished Visiting Professor of Business (2001-2002) of Thunderbird (American Graduate School of International Management), Glendale, AZ. | 75 | Director of Red Robin Gourmet Burgers, Inc. | ||||||||||||||||||
| William D. Stewart 151 Detroit Street Denver, CO 80206 DOB: 1944 | Trustee | 9/93-Present | Corporate Vice President and General Manager of MKS Instruments – HPS Products, Boulder, CO (a manufacturer of vacuum fittings and valves). | 75 | N/A | ||||||||||||||||||
| Martin H. Waldinger 151 Detroit Street Denver, CO 80206 DOB: 1938 | Trustee | 9/93-Present | Private Investor and Consultant to California Planned Unit Developments (since 1994). Formerly, CEO and President of Marwal, Inc. (homeowner association management company). | 75 | N/A | ||||||||||||||||||
| Linda S. Wolf 151 Detroit Street Denver, CO 80206 DOB: 1947 | Trustee | 12/05-Present | Retired. Formerly, Chairman and Chief Executive Officer of Leo Burnett (Worldwide) (advertising agency) (2001-2005). | 75 | Director of Wal-Mart, The Field Museum of Natural History (Chicago, IL), Children's Memorial Hospital (Chicago, IL), Chicago Council on Foreign Relations, Economic Club of Chicago, and InnerWorkings (U.S. provider of print procurement solutions). | ||||||||||||||||||
Janus Aspen Series December 31, 2007 33
Trustees and Officers (unaudited) (continued)
Officers
| Name, Address, and Age | Positions Held with Portfolio | Term of Office* and Length of Time Served | Principal Occupations During the Past Five Years | ||||||||||||
| Marc Pinto 151 Detroit Street Denver, CO 80206 DOB: 1961 | Executive Vice President and Co-Portfolio Manager Janus Aspen Balanced Portfolio | 5/05-Present | Vice President of Janus Capital and Portfolio Manager for other Janus accounts. | ||||||||||||
| Gibson Smith 151 Detroit Street Denver, CO 80206 DOB: 1968 | Executive Vice President and Co-Portfolio Manager Janus Aspen Balanced Portfolio | 5/05-Present | Co-Chief Investment Officer and Executive Vice President of Janus Capital; Executive Vice President of Janus Distributors LLC and Janus Services LLC; and Portfolio Manager for other Janus accounts. Formerly, Vice President (2003-2006) of Janus Capital; and Analyst (2001-2003) for Janus Capital Corporation. | ||||||||||||
| Stephanie Grauerholz-Lofton 151 Detroit Street Denver, CO 80206 DOB: 1970 | Chief Legal Counsel and Secretary Vice President | 1/06-Present 3/06-Present | Vice President and Assistant General Counsel of Janus Capital, and Vice President and Assistant Secretary of Janus Distributors LLC. Formerly, Assistant Vice President of Janus Capital and Janus Distributors LLC (2006), and Associate of Vedder, Price, Kaufman & Kammholz, P.C. (1999-2003). | ||||||||||||
| Andrew J. Iseman 151 Detroit Street Denver, CO 80206 DOB: 1964 | President and Chief Executive Officer | 3/07-Present | Chief Operating Officer and Senior Vice President of Janus Capital Group, Inc. and Janus Capital; President of Janus Services LLC; and Director of Capital Group Partners, Inc. Formerly, Senior Vice President of Enhanced Investment Technologies, LLC (2005-2007); and Vice President of Janus Capital (2003-2005) and Janus Services LLC (2003-2004). | ||||||||||||
| David R. Kowalski 151 Detroit Street Denver, CO 80206 DOB: 1957 | Vice President, Chief Compliance Officer, and Anti-Money Laundering Officer | 6/02-Present | Senior Vice President and Chief Compliance Officer of Janus Capital, Janus Distributors LLC, and Janus Services LLC; Chief Compliance Officer of Bay Isle Financial LLC; and Vice President of Enhanced Investment Technologies, LLC. Formerly, Chief Compliance Officer of Enhanced Investment Technologies, LLC (2003-2005); Vice President of Janus Capital (2000-2005) and Janus Services LLC (2004-2005); and Assistant Vice President of Janus Services LLC (2000-2004). | ||||||||||||
| Jesper Nergaard 151 Detroit Street Denver, CO 80206 DOB: 1962 | Chief Financial Officer Vice President, Treasurer, and Principal Accounting Officer | 3/05-Present 2/05-Present | Vice President of Janus Capital. Formerly, Director of Financial Reporting for OppenheimerFunds, Inc. (2004-2005); Site Manager and First Vice President of Mellon Global Securities Services (2003); and Director of Fund Accounting, Project Development, and Training of INVESCO Funds Group (1994-2003). | ||||||||||||
*Officers are elected at least annually by the Trustees for a one-year term and may also be elected from time to time by the Trustees for an interim period.
34 Janus Aspen Series December 31, 2007
Notes
Janus Aspen Series December 31, 2007 35
Notes
36 Janus Aspen Series December 31, 2007
Notes
Janus Aspen Series December 31, 2007 37
Janus provides access to a wide range of investment disciplines.
Growth
Janus growth portfolios focus on companies believed to be the leaders in their respective industries, with solid management teams, expanding market share, margins and efficiencies.
Core
Janus core portfolios seek investments in more stable and predictable companies. These portfolios look for a strategic combination of steady growth and for certain portfolios, some degree of income.
Risk-Managed
Our risk-managed portfolios seek to outperform their respective indices while maintaining a risk profile equal to or lower than the index itself. Managed by INTECH (a Janus subsidiary), these portfolios use a mathematical process in an attempt to build a more "efficient" portfolio than the index.
Value
Janus value portfolios invest in companies they believe are poised for a turnaround or are trading at a significant discount to fair value. The goal is to gain unique insight into a company's true value and identify and evaluate potential catalysts that may unlock shareholder value.
International & Global
Janus international and global portfolios seek to leverage Janus' research capabilities by taking advantage of inefficiencies in foreign markets, where accurate information and analytical insight are often at a premium.
Bond
Janus bond portfolios attempt to provide less risk relative to equities while seeking to deliver a competitive total return through high current income and appreciation.
Money Market
Janus money market portfolios seek maximum current income consistent with stability of capital.
For more information about our funds, contact your investment professional or go to www.janus.com/info
Please consider the charges, risks, expenses and investment objectives carefully before investing. For a prospectus containing this and other information, please call Janus at 1-800-525-0020 or download the file from www.janus.com/info. Read it carefully before you invest or send money.
An investment in a money market portfolio is not insured or guaranteed by the Federal Deposit Insurance Corporation or any other government agency. Although the Portfolio seeks to preserve the value of your investment at $1.00 per share, it is possible to lose money by investing in the Portfolio.

151 Detroit Street
Denver, CO 80206
1-800-525-0020
Portfolio distributed by Janus Distributors LLC (2/08)
C-0108-357 109-02-704 02-08
2007 Annual Report
Janus Aspen Series
Janus Aspen Flexible Bond Portfolio
Look Inside. . .
• Portfolio management perspective
• Investment strategy behind your portfolio
• Portfolio performance, characteristics and holdings

Table of Contents
| Useful Information About Your Portfolio Report | 1 | ||||||
| Management Commentary and Schedule of Investments | 2 | ||||||
| Statement of Assets and Liabilities | 10 | ||||||
| Statement of Operations | 11 | ||||||
| Statements of Changes in Net Assets | 12 | ||||||
| Financial Highlights | 13 | ||||||
| Notes to Schedule of Investments | 14 | ||||||
| Notes to Financial Statements | 15 | ||||||
| Report of Independent Registered Public Accounting Firm | 24 | ||||||
| Additional Information | 25 | ||||||
| Explanations of Charts, Tables and Financial Statements | 28 | ||||||
| Trustees and Officers | 31 | ||||||
Please consider the charges, risks, expenses and investment objectives carefully before investing. For a prospectus containing this and other information, please call Janus at 1-800-525-0020 or download the file from www.janus.com/info. Read it carefully before you invest or send money.
Useful Information About Your Portfolio Report
Management Commentary
The Management Commentary in this report includes valuable insight from the Portfolio's managers as well as statistical information to help you understand how your Portfolio's performance and characteristics stack up against those of comparable indices.
Please keep in mind that the opinions expressed by the Portfolio's managers in the Management Commentary are just that: opinions. They are a reflection of the managers' best judgment at the time this report was compiled, which was December 31, 2007. As the investing environment changes, so could the managers' opinions. The views are unique to the managers and aren't necessarily shared by their fellow employees or by Janus in general.
Portfolio Expenses
We believe it's important for our shareholders to have a clear understanding of Portfolio expenses and the impact they have on investment return.
The following is important information regarding the Portfolio's Expense Example, which appears in the Management Commentary within this Annual Report. Please refer to this information when reviewing the Expense Example for the Portfolio.
Example
As a shareholder of a Portfolio, you incur two types of costs: (1) transaction costs, including redemption fees (where applicable) (and any related exchange fees) and (2) ongoing costs, including management fees; distribution and shareholder servicing (12b-1) fees (applicable to Service Shares only); and other Portfolio expenses. The example is intended to help you understand your ongoing costs (in dollars) of investing in a Portfolio and to compare these costs with the ongoing costs of investing in other mutual funds. To do so, compare this 5% hypothetical example with the 5% hypothetical examples that appear in the shareholder reports of the other funds. The example is based upon an investment of $1,000 invested at the beginning of the period and held for the six-month period from July 1, 2007 to December 31, 2007.
Actual Expenses
The first line of the table in each example provides information about actual account values and actual expenses. You may use the information in this line, together with the amount you invested, to estimate the expenses that you paid over the period. Simply divide your account value by $1,000 (for example, an $8,600 account value divided by $1,000 = 8.6), then multiply the result by the number in the first line under the heading entitled "Expenses Paid During Period" to estimate the expenses you paid on your account during the period.
Hypothetical Example for Comparison Purposes
The second line of the table in each example provides information about hypothetical account values and hypothetical expenses based upon the Portfolio's actual expense ratio and an assumed rate of return of 5% per year before expenses. This is not the Portfolio's actual return. The hypothetical account values and expenses may not be used to estimate the actual ending account balance or expenses you paid for the period. You may use this information to compare the ongoing costs of investing in the Portfolio and other funds. To do so, compare this 5% hypothetical example with the 5% hypothetical examples that appear in the shareholder reports of the other funds.
Janus Capital Management LLC ("Janus Capital") has contractually agreed to waive the Portfolio's total operating expenses, excluding the distribution and shareholder servicing (12b-1) fees applicable to Service Shares, brokerage commissions, interest, taxes and extraordinary expenses to certain limits until at least May 1, 2009. More information regarding the waivers is available in the Portfolio's prospectus.
Please note that the expenses shown in the tables are meant to highlight your ongoing costs only and do not reflect any transaction costs, such as redemption fees (where applicable) and any charges at the separate account level or contract level. Redemption fees are fully described in the prospectus. Therefore, the second line of each table is useful in comparing ongoing costs only, and will not help you determine the relative total costs of owning different funds. In addition, if these transaction costs and separate account or contract level charges were included, your costs would have been higher.
Janus Aspen Series December 31, 2007 1
Janus Aspen Flexible Bond Portfolio (unaudited)
Portfolio Snapshot
This bond portfolio continually adjusts its allocations among different types of bond investments in an attempt to take advantage of ever-changing market conditions.

Gibson Smith
co-portfolio manager

Darrell Watters
co-portfolio manager
Performance Overview
In the 12-month period ended December 31, 2007, Janus Aspen Flexible Bond Portfolio's Institutional Shares and Service Shares increased 7.04% and 6.80%, respectively, compared to a 6.97% increase for the Portfolio's benchmark, the Lehman Brothers Aggregate Bond Index.
Economic Update
Volatility in the bond market rose during the second half of the 12-month period ended December 31, 2007, amid credit concerns related to subprime mortgages and structured debt vehicles, central bank intervention and increasing uncertainty surrounding U.S. economic growth. After peaking mid-year near 5.30%, long-term interest rates, as measured by the 10-year U.S. Treasury bond, began trending lower, finishing the year more than a half percentage point lower for the entire period as subprime-related problems began to wreak havoc in other areas of the capital markets. Investors flocked to the relative safety of U.S. Treasuries amid rising speculation of a rate cut by the Federal Reserve (Fed) and uncertainty in risk-based assets. Through all of this, the yield curve began to normalize, with long-term rates higher than short-term rates.
Elsewhere, the spreads between U.S. Treasuries and high-yield bonds widened considerably from what had been historically low levels earlier in the year as bond investors' appetite for below-investment-grade securities waned. Further impacting the widening spreads was the degree of risk-aversion trading in the U.S., which emanated partially from subprime mortgage woes and the credit crunch. The question of whether the worst was over or further deterioration in liquidity conditions is to come remained unresolved as the period came to a close. In addition, uncertain future employment growth, continued weakness in housing and signs that the U.S. manufacturing sector may be weakening combined to keep the economic outlook somewhat hazy.
Overweight Exposure to Credit Hurt Results
While we scaled back exposure to finance-related holdings, the Portfolio's overweight position in corporate credits relative to the benchmark detracted from performance. This overweight exposure was supported by fundamental analysis of relative risks and opportunities across the fixed-income spectrum but proved detrimental during the market correction that occurred in the third quarter of 2007. Long term, we believe the risk/reward profile of the credit sector is compelling relative to other spread-based instruments. In particular, portfolio performance was held back by our exposure to highly liquid below-investment-grade credits with high free cash flow and asset-heavy balance sheets. As often happens in the rollover phase of a credit cycle, institutional investors faced with redemptions are forced to sell the most marketable credits first, which drives down prices of t hese more liquid, higher-quality fundamental issues. Later in a credit cycle, however, more liquid names tend to outperform, as investors once again focus on strong underlying fundamentals.
Additionally, despite the Portfolio's underweight exposure in the finance industry, a few remaining credits in this area worked against the Portfolio. These included bonds issued by commercial lender Capmark Financial Group. The recent sell-off in finance-related holdings did not discriminate between businesses with residential mortgage exposure and those, like Capmark, that focus on the commercial-lending market.
Overweight Position in the U.S. Treasury Sector Aided Performance
The largest positive contribution to performance for the year was relative overweight exposure in the U.S. Treasury sector. Last spring, as concerns mounted over spread volatility and credit problems in the mortgage sector, we began to substantially reduce the Portfolio's exposure to mortgage-backed securities, recycling most of the cash into what we felt were higher-quality Treasury positions. Additionally, we reduced the exposure to bank, finance and brokerage issuers prior to the mid-summer credit crunch. These steps helped to mitigate the Portfolio's sensitivity to the ensuing market sell-off, which took a heavy toll on mortgage- and finance-related holdings. We also increased our weighting in the electric utility sub-sector, which boosted performance as the cash flows in the underlying businesses are generally insulated from economic turmoil.
In addition to the performance benefits from reducing the Portfolio's overall risk profile, some individual credits boosted
2 Janus Aspen Series December 31, 2007
(unaudited)
performance. Among the top contributing credits over the 12-month period was General Electric Capital Corp. As a AAA-rated corporate issuer, GE Capital Corp.'s cost of financing is among the lowest in the market, and given their broadly diversified portfolio of financing, the company's debt held up well in the recent downturn.
Outlook
We are watching the outlook for the global economy and liquidity among financial institutions very closely as we believe this holds the key to the pricing and valuation of risk assets. The Portfolio's overweight U.S. Treasury position as of year-end, along with neutral duration and curve positioning are telling of our cautious view on the market. We view the Fed's 100 basis point easing and other actions as signaling that they will continue to add liquidity as necessary, while also helping to calm the markets. The housing market and the dislocations in the mortgage and funding markets have garnered more
attention recently and we believe there are potentially still problems to be resolved. Our underweight mortgage position signals our cautious approach to the mortgage market and the direction of swap spreads which measure the degree of stress in the banking system. All in all, we view credit as offering the greatest long-term total return opportunity for our shareholders. We will keep a keen eye out for further dislocations in the credit markets and for mis-priced securities, and will use volatility as an opportunity to add to our credit exposure where we feel the risk/reward profile is compelling. Additionally, we will continue watching the labor market closely for any sign of a prolonged slowdown that could weigh on consumer sentiment and economic growth. As always, we will continue to emphasize bottom-up company analysis as our primary tool in our quest to add value for shareholders.
Thank you for your investment in Janus Aspen Flexible Bond Portfolio.
Janus Aspen Flexible Bond Portfolio At a Glance
Portfolio Profile
| December 31, 2007 | |||||||
| Weighted Average Maturity | 6.4 Years | ||||||
| Average Modified Duration* | 4.3 Years | ||||||
| 30-Day Current Yield** | |||||||
| Institutional Shares | 4.15 | % | |||||
| Service Shares | 3.88 | % | |||||
| Weighted Average Fixed Income Credit Rating | AA+ | ||||||
| Number of Bonds/Notes | 179 | ||||||
*A theoretical measure of price volatility
**Yield will fluctuate
Ratings† Summary – (% of Net Assets)
| December 31, 2007 | |||||||
| AAA | 66.5 | % | |||||
| AA | 2.1 | % | |||||
| A | 3.8 | % | |||||
| BBB | 5.6 | % | |||||
| BB | 7.0 | % | |||||
| B | 4.9 | % | |||||
| Other | 10.1 | % | |||||
†Rated by Standard & Poor's
| Significant Areas of Investment – (% of Net Assets) | Asset Allocation – (% of Net Assets) | ||||||
| As of December 31, 2007 | As of December 31, 2007 | ||||||
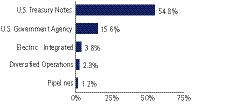 | 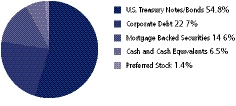 | ||||||
| Emerging markets comprised 0.1% of total net assets. | |||||||
Janus Aspen Series December 31, 2007 3
Janus Aspen Flexible Bond Portfolio
Performance
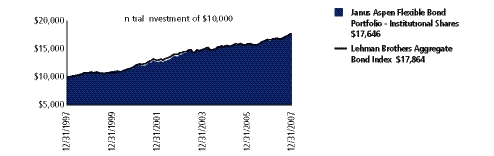
| Average Annual Total Return – for the periods ended December 31, 2007 | Expense Ratios – for the fiscal year ended December 31, 2006 | ||||||||||||||||||||||||||
| One Year | Five Year | Ten Year | Since Inception* | Total Annual Fund Operating Expenses | Net Annual Fund Operating Expenses | ||||||||||||||||||||||
| Janus Aspen Flexible Bond Portfolio - Institutional Shares | 7.04 | % | 4.71 | % | 5.84 | % | 7.09 | % | 0.65 | % | 0.65 | %(a) | |||||||||||||||
| Janus Aspen Flexible Bond Portfolio - Service Shares | 6.80 | % | 4.46 | % | 5.58 | % | 6.88 | % | 0.90 | % | 0.90 | %(b) | |||||||||||||||
| Lehman Brothers Aggregate Bond Index | 6.97 | % | 4.42 | % | 5.97 | % | 6.08 | % | |||||||||||||||||||
| Lipper Quartile - Institutional Shares | 2 | nd | 2 | nd | 2 | nd | 1 | st | |||||||||||||||||||
| Lipper Ranking - Institutional Shares based on total returns for Variable Annuity Intermediate Investment Grade Debt Funds | 22/63 | 18/48 | 5/17 | 1/11 | |||||||||||||||||||||||
Visit janus.com/info to view up-to-date
performance and characteristic information
Data presented reflects past performance, which is no guarantee of future results. Investment results and principal value will fluctuate so that shares, when redeemed, may be worth more or less than their original cost. Due to market volatility, current performance may be higher or lower than the performance shown. Call 877.33JANUS or visit www.janus.com/info for performance current to the most recent month-end.
(a)At December 31, 2006, Janus Capital has contractually agreed to waive the Portfolio's total operating expenses (excluding brokerage commissions, interest, taxes, and extraordinary expenses) to a certain limit until at least May 1, 2008. The net annual fund operating expense shown reflects the application of such limit and is detailed in the Statement of Additional Information. Returns shown include fee waivers, if any, and without such waivers returns would have been lower.
(b)At December 31, 2006, Janus Capital has contractually agreed to waive the Portfolio's total operating expenses (excluding the distribution and shareholder servicing fee, brokerage commissions, interest, taxes, and extraordinary expenses) to a certain limit until at least May 1, 2008. The net annual fund operating expense shown reflects the application of such limit and is detailed in the Statement of Additional Information. Returns shown include fee waivers, if any, and without such waivers returns would have been lower.
The Portfolio's expense ratios were determined based on average net assets as of the fiscal year ended December 31, 2006. Detailed information is available in the prospectus. Contractual waivers agreed to by Janus Capital are included under "Net Annual Fund Operating Expenses." All expenses are shown without the effect of expense offset arrangements. Pursuant to such arrangements, credits realized as a result of uninvested cash balances are used to reduce custodian and transfer agent expenses.
The Portfolio's total operating expenses did not exceed the expense limit so no waivers were in effect for the most fiscal year ended December 31, 2006.
The Portfolio's performance may be affected by risks that include those associated with non-investment grade debt securities and investments in specific industries or countries. Additional risks to the Portfolio may include those associated with investing in foreign securities, emerging markets, initial public offerings ("IPOs") and derivatives. Please see a Janus prospectus or www.janus.com/info for more information about risks, portfolio holdings and other details.
Portfolios that invest in bonds have the same interest rate, inflation and credit risks that are associated with the underlying bonds owned by the Portfolio. Unlike owning individual bonds, there are ongoing fees and expenses associated with owning shares of bond portfolios. The return of principal is not guaranteed due to net asset value fluctuation that is caused by changes in the price of specific bonds held in the Portfolio and selling of bonds within the Portfolio by the portfolio managers.
High-yield/high-risk bonds involve a greater risk of default and price volatility than U.S. Government and other high-quality bonds. High-yield/high-risk bonds can experience sudden and sharp price swings which will affect net asset value.
4 Janus Aspen Series December 31, 2007
(unaudited)
Portfolio Expenses
The example below shows you the ongoing costs (in dollars) of investing in your Portfolio and allows you to compare these costs with those of other mutual funds. Please refer to the section Useful Information About Your Portfolio Report for a detailed explanation of the information presented in these charts.
| Expense Example - Institutional Shares | Beginning Account Value (7/1/07) | Ending Account Value (12/31/07) | Expenses Paid During Period (7/1/07-12/31/07)(1) | ||||||||||||
| Actual | $ | 1,000.00 | $ | 1,059.80 | $ | 3.06 | |||||||||
| Hypothetical (5% return before expenses) | $ | 1,000.00 | $ | 1,022.23 | $ | 3.01 | |||||||||
| Expense Example - Service Shares | Beginning Account Value (7/1/07) | Ending Account Value (12/31/07) | Expenses Paid During Period (7/1/07-12/31/07)(1) | ||||||||||||
| Actual | $ | 1,000.00 | $ | 1,059.10 | $ | 4.36 | |||||||||
| Hypothetical (5% return before expenses) | $ | 1,000.00 | $ | 1,020.97 | $ | 4.28 | |||||||||
(1) Expenses are equal to the annualized expense ratio of 0.59% for Institutional Shares and 0.84% for Service Shares, multiplied by the average account value over the period, multiplied by 184/365 (to reflect the one-half year period).
These returns do not reflect the charges and expenses of any particular insurance product or qualified plan. Returns shown would have been lower had they included insurance charges.
Returns include reinvestment of dividends from net investment income and distributions from capital gains. The returns shown do not reflect the deduction of taxes that a shareholder would pay on Portfolio distributions or the redemption of Portfolio shares.
Returns shown for Service Shares for periods prior to December 31, 1999 are derived from the historical performance of Institutional Shares, adjusted to reflect the higher operating expenses of Service Shares.
Lipper, a wholly-owned subsidiary of Reuters, provides independent insight on global collective investments including mutual funds, retirement funds, hedge funds, fund fees and expenses to the asset management and media communities. Lipper ranks the performance of mutual funds within a classification of funds that have similar investment objectives. Rankings are historical with capital gains and dividends reinvested and do not include the effect of loads.
Lipper ranking is for the Institutional Share class only; other classes may have different performance characteristics.
September 30, 1993 is the date used to calculate the since-inception Lipper ranking, which is slightly different from when the Portfolio began operations since Lipper provides fund rankings as of the last day of the month.
If an expense waiver was in effect, it may have had a material effect on the total return or yield, and therefore the ranking for the period.
There is no assurance that the investment process will consistently lead to successful investing.
The Portfolio will invest at least 80% of its net assets in the type of securities described by its name.
Effective May 15, 2007, Gibson Smith and Darrell Watters became Co-Portfolio Managers of Janus Aspen Flexible Bond Portfolio.
See Notes to Schedule of Investments for index definitions.
The Portfolio may differ significantly from the securities held in the index. The index is unmanaged and not available for direct investment; therefore its performance does not reflect the expenses associated with the active management of an actual Portfolio.
See "Explanations of Charts, Tables and Financial Statements."
*The Portfolio's inception date – September 13, 1993
Janus Aspen Series December 31, 2007 5
Janus Aspen Flexible Bond Portfolio
Schedule of Investments
As of December 31, 2007
| Shares or Principal Amount | Value | ||||||||||
| Corporate Debt - 22.7% | |||||||||||
| Agricultural Operations - 0.2% | |||||||||||
| 537,000 | Bunge Limited Finance Corp., 4.375% company guaranteed notes, due 12/15/08 | $ | 533,454 | ||||||||
| Applications Software - 0.3% | |||||||||||
| 850,000 | Intuit, Inc., 5.75% senior unsecured notes due 3/15/17 | 836,236 | |||||||||
| Auction House - Art Dealer - 0.1% | |||||||||||
| 374,970 | Adesa, Inc., 7.08% bank loan due 10/20/13‡ | 351,845 | |||||||||
| Automotive - Cars and Light Trucks - 0.3% | |||||||||||
| 684,812 | Ford Motor Co., 8.00% bank loan due 12/16/13‡ | 632,595 | |||||||||
| 297,750 | General Motors Corp., 7.615% bank loan due 11/29/13‡ | 277,616 | |||||||||
| 910,211 | |||||||||||
| Automotive - Medium and Heavy Duty Trucks - 0.2% | |||||||||||
| Navistar International Corp.: | |||||||||||
| 78,200 | 4.7938%, bank loan, due 1/19/12‡ | 74,877 | |||||||||
| 105,800 | 8.23375%, bank loan, due 1/19/12‡ | 101,304 | |||||||||
| 506,000 | 8.23375%, bank loan, due 1/19/12‡ | 484,494 | |||||||||
| 660,675 | |||||||||||
| Beverages - Wine and Spirits - 0.1% | |||||||||||
| 410,000 | Diageo Capital PLC, 5.75% company guaranteed notes, due 10/23/17 | 412,328 | |||||||||
| Brewery - 0.1% | |||||||||||
| 250,000 | Anheuser Bush COS, Inc., 5.50% senior subordinated notes, due 1/15/18 | 255,220 | |||||||||
| Cable Television - 0.9% | |||||||||||
| 690,000 | Charter Communications Operating LLC 6.99%, bank loan, due 3/6/14‡ | 643,687 | |||||||||
| 1,270,000 | Cox Communications, Inc., 4.625% senior unsecured notes, due 1/15/10 | 1,260,147 | |||||||||
| CSC Holdings, Inc.: | |||||||||||
| 1,104,372 | 6.89625%, bank loan, due 3/29/13‡ | 1,042,130 | |||||||||
| 2,945,964 | |||||||||||
| Casino Hotels - 0.1% | |||||||||||
| Green Valley Ranch Gaming: | |||||||||||
| 10,725 | 6.8425%, bank loan, due 2/16/14‡ | 10,108 | |||||||||
| 106,800 | 6.8425%, bank loan, due 2/16/14‡ | 100,659 | |||||||||
| 132,000 | 7.08125%, bank loan, due 2/16/14‡ | 124,410 | |||||||||
| 170,000 | Seminole Hard Rock Entertainment 7.49%, secured notes, due 3/15/14‡ (144A) | 162,350 | |||||||||
| 397,527 | |||||||||||
| Cellular Telecommunications - 0.2% | |||||||||||
| 755,000 | Nextel Communications, Inc., 6.875% company guaranteed notes, due 10/31/13 | 743,767 | |||||||||
| Chemicals - Diversified - 0.2% | |||||||||||
| 490,000 | E.I. du Pont de Nemours and Co., 5.00% senior unsecured notes, 11/5/13 | 493,090 | |||||||||
| Commercial Services - 0.5% | |||||||||||
| 280,000 | Aramark Corp., 8.50% company guaranteed notes, due 2/1/15 | 283,500 | |||||||||
| 1,170,000 | Iron Mountain, Inc., 8.625% company guaranteed notes, due 4/1/13 | 1,184,625 | |||||||||
| 1,468,125 | |||||||||||
| Shares or Principal Amount | Value | ||||||||||
| Computer Services - 0.5% | |||||||||||
| $ | 1,465,000 | SunGard Data Systems, Inc., 9.125% company guaranteed notes, due 8/15/13 | $ | 1,490,638 | |||||||
| Consumer Products - Miscellaneous - 0.2% | |||||||||||
| 800,000 | Clorox Co., 5.95% senior unsecured notes due 10/15/17 | 796,973 | |||||||||
| Containers - Metal and Glass - 0.4% | |||||||||||
| 833,000 | Owens-Brockway Glass Container, Inc. 8.875%, company guaranteed notes due 2/15/09 | 836,124 | |||||||||
| 570,000 | Owens-Illinois, Inc., 7.35% senior notes due 5/15/08 | 571,425 | |||||||||
| 1,407,549 | |||||||||||
| Data Processing and Management - 0.2% | |||||||||||
| 560,000 | First Data Corp., 9.875% company guaranteed notes, due 9/24/15 (144A) | 520,800 | |||||||||
| Diversified Financial Services - 0.9% | |||||||||||
| General Electric Capital Corp.: | |||||||||||
| 1,965,000 | 4.875%, notes, due 10/21/10 | 1,994,210 | |||||||||
| 980,000 | 4.375%, unsecured notes, due 11/21/11 | 972,298 | |||||||||
| 2,966,508 | |||||||||||
| Diversified Operations - 2.3% | |||||||||||
| 3,310,000 | General Electric Co., 5.25% senior unsecured notes, due 12/6/17 | 3,302,936 | |||||||||
| 970,000 | Kansas City Southern, 7.50% company guaranteed notes, due 6/15/09 | 971,213 | |||||||||
| 600,000 | SPX Corp., 7.625% senior notes due 12/15/14 (144A) | 612,000 | |||||||||
| Textron, Inc.: | |||||||||||
| 1,025,000 | 6.375%, senior unsecured notes due 11/15/08 | 1,040,045 | |||||||||
| 1,460,000 | 5.60%, senior unsecured notes due 12/1/17 | 1,454,803 | |||||||||
| 7,380,997 | |||||||||||
| Diversified Operations - Commercial Services - 0.1% | |||||||||||
| Aramark Corp.: | |||||||||||
| 13,630 | 5.19813%, bank loan, due 1/27/14‡ | 12,914 | |||||||||
| 190,695 | 6.705%, bank loan, due 1/27/14‡ | 181,208 | |||||||||
| 194,122 | |||||||||||
| Electric - Generation - 0.6% | |||||||||||
| 1,900,000 | Edison Mission Energy, 7.00% senior unsecured notes, due 5/15/17 | 1,866,750 | |||||||||
| Electric - Integrated - 3.8% | |||||||||||
| 1,015,000 | CMS Energy Corp., 6.30% senior unsubordinated notes, due 2/1/12 | 1,024,019 | |||||||||
| 490,000 | Consolidated Edison, Inc., 5.50% debentures, due 9/15/16 | 492,175 | |||||||||
| 535,000 | Energy Future Holdings, 10.875% company guaranteed notes, due 11/1/17 (144A) | 537,675 | |||||||||
| 635,000 | MidAmerican Energy Holdings Co., 3.50% senior notes, due 5/15/08 | 630,828 | |||||||||
| 1,310,000 | Monongahela Power Co., 6.70% first mortgage notes, due 6/15/14 | 1,370,180 | |||||||||
| 690,000 | Pacific Gas and Electric Co., 4.80% unsecured notes, due 3/1/14 | 670,826 | |||||||||
| 620,000 | Pacificorp, 6.25% first mortgage notes due 10/15/37 | 640,268 | |||||||||
See Notes to Schedules of Investments and Financial Statements.
6 Janus Aspen Series December 31, 2007
Schedule of Investments
As of December 31, 2007
| Shares or Principal Amount | Value | ||||||||||
| Electric - Integrated - (continued) | |||||||||||
| $ | 1,680,000 | Southern California Edison Co., 7.625% unsecured notes, due 1/15/10 | $ | 1,783,171 | |||||||
| Texas Competitive Electric Holdings: | |||||||||||
| 740,000 | 10.25%, company guaranteed notes due 11/1/15 (144A) | 732,600 | |||||||||
| 920,000 | 10.25%, company guaranteed notes due 11/1/15 (144A) | 910,800 | |||||||||
| 1,643,400 | |||||||||||
| 1,660,000 | Virginia Electric & Power Co., 5.10% senior unsecured notes, due 11/30/12 | 1,667,135 | |||||||||
| 1,640,000 | West Penn Power Co., 5.95% first mortgage notes, due 12/15/17 (144A) | 1,647,997 | |||||||||
| 12,107,674 | |||||||||||
| Electronic Components - Semiconductors - 0.4% | |||||||||||
| 1,370,000 | National Semiconductor Corp., 5.24% senior unsecured notes, due 6/15/10‡ | 1,340,074 | |||||||||
| Energy - Alternate Sources - 0.1% | |||||||||||
| 328,350 | Huish Detergents, Inc., 6.83% bank loan due 4/26/14‡ | 282,929 | |||||||||
| Finance - Auto Loans - 0.4% | |||||||||||
| Ford Motor Credit Co.: | |||||||||||
| 321,000 | 9.75%, senior unsecured notes due 9/15/10‡ | 306,299 | |||||||||
| 940,000 | 9.6925%, notes, due 4/15/12‡ | 924,369 | |||||||||
| 220,000 | 7.80%, notes, due 6/1/12 | 192,866 | |||||||||
| 1,423,534 | |||||||||||
| Finance - Consumer Loans - 0.2% | |||||||||||
| 605,000 | John Deere Capital Corp., 4.875% senior notes, due 10/15/10 | 614,981 | |||||||||
| Finance - Investment Bankers/Brokers - 0.4% | |||||||||||
| 1,250,000 | JP Morgan Chase & Co, 6.00% senior notes, due 1/15/18 | 1,271,730 | |||||||||
| Finance - Other Services - 0.2% | |||||||||||
| Pinnacle Foods Finance LLC: | |||||||||||
| 25,875 | 7.5925%, bank loan, due 4/2/14‡ | 24,279 | |||||||||
| 660,675 | 7.94813%, bank loan, due 4/2/14‡ | 619,931 | |||||||||
| 644,210 | |||||||||||
| Food - Diversified - 0.1% | |||||||||||
| 410,000 | Kellogg, Co., 5.125% senior unsecured notes, due 12/3/12 | 413,433 | |||||||||
| Food - Retail - 0.3% | |||||||||||
| Stater Brothers Holdings, Inc.: | |||||||||||
| 385,000 | 8.125%, senior notes, due 6/15/12 | 380,188 | |||||||||
| 660,000 | 7.75%, company guaranteed notes due 4/15/15 | 636,900 | |||||||||
| 1,017,088 | |||||||||||
| Food - Wholesale/Distribution - 0.3% | |||||||||||
| 810,000 | Supervalu, Inc., 7.50% senior unsecured notes, due 11/15/14 | 830,250 | |||||||||
| Gas - Distribution - 0.1% | |||||||||||
| 400,000 | Southern Star Central Corp., 6.00% notes due 6/1/16 (144A) | 391,000 | |||||||||
| Independent Power Producer - 0.3% | |||||||||||
| Reliant Energy, Inc.: | |||||||||||
| 440,000 | 7.625%, senior notes, due 6/15/14 | 435,600 | |||||||||
| 440,000 | 7.875%, senior notes, due 6/15/17 | 435,600 | |||||||||
| 871,200 | |||||||||||
| Shares or Principal Amount | Value | ||||||||||
| Machinery - Electrical - 0.1% | |||||||||||
| Baldor Electric Co.: | |||||||||||
| $ | 114,459 | 7.125%, bank loan, due 1/31/14‡ | $ | 112,099 | |||||||
| 151,086 | 7.125%, bank loan, due 1/31/14‡ | 147,971 | |||||||||
| 260,070 | |||||||||||
| Medical - Hospitals - 0.4% | |||||||||||
| HCA, Inc.: | |||||||||||
| 312,632 | 7.61%, bank loan, due 11/18/13‡ | 300,273 | |||||||||
| 1,000,000 | 9.25%, secured notes, due 11/15/16 | 1,050,000 | |||||||||
| 1,350,273 | |||||||||||
| Metal - Diversified - 0.2% | |||||||||||
| 750,000 | Freeport-McMoran Copper & Gold, Inc. 8.375%, senior unsecured notes due 4/1/17 | 804,375 | |||||||||
| Multimedia - 1.0% | |||||||||||
| Viacom, Inc.: | |||||||||||
| 320,000 | 6.25%, senior notes, due 4/30/16 | 321,943 | |||||||||
| 400,000 | 6.125%, senior unsecured notes due 10/5/17 | 399,983 | |||||||||
| VNU, Inc.: | |||||||||||
| 257,027 | 7.4925%, bank loan, due 8/9/13‡ | 244,016 | |||||||||
| 427,774 | 7.14625%, bank loan, due 8/9/13‡ | 406,119 | |||||||||
| 1,820,000 | Walt Disney Company, 4.7% senior unsecured notes, due 12/1/12 | 1,819,940 | |||||||||
| 3,192,001 | |||||||||||
| Non-Hazardous Waste Disposal - 0.6% | |||||||||||
| 1,075,000 | Allied Waste Industries, Inc., 6.50% secured notes, due 11/15/10 | 1,075,000 | |||||||||
| 805,000 | Waste Management, Inc., 7.375% senior unsubordinated notes, due 8/1/10 | 850,320 | |||||||||
| 1,925,320 | |||||||||||
| Oil Companies - Exploration and Production - 1.2% | |||||||||||
| 970,000 | Encana, Corp., 6.50% unsubordinated notes, due 2/1/38 | 1,002,374 | |||||||||
| Forest Oil Corp.: | |||||||||||
| 130,000 | 8.00%, company guaranteed notes due 12/15/11 | 135,200 | |||||||||
| 470,000 | 7.25%, senior notes, due 6/15/19 (144A) | 472,350 | |||||||||
| 795,000 | Kerr-McGee Corp., 6.875% company guaranteed notes, due 9/15/11 | 846,116 | |||||||||
| 800,000 | Sabine Pass L.P., 7.50% secured notes due 11/30/16 | 764,000 | |||||||||
| 510,000 | XTO Energy, Inc., 6.10% senior unsecured notes, due 4/1/36 | 497,872 | |||||||||
| 3,717,912 | |||||||||||
| Paper and Related Products - 0.2% | |||||||||||
| Georgia-Pacific Corp.: | |||||||||||
| 34,941 | 6.89625%, bank loan, due 12/20/12‡ | 33,233 | |||||||||
| 69,882 | 6.83125%, bank loan, due 12/20/12‡ | 66,466 | |||||||||
| 55,207 | 6.58%, bank loan, due 12/20/12‡ | 52,508 | |||||||||
| 559,058 | 6.89625%, bank loan, due 12/20/12‡ | 531,725 | |||||||||
| 683,932 | |||||||||||
| Pipelines - 1.2% | |||||||||||
| 653 | Kern River Funding Corp., 4.893% company guaranteed notes, due 4/30/18 | 639 | |||||||||
| 3,525,000 | Kinder Morgan Finance Co., 5.70% company guaranteed notes, due 1/5/16 | 3,190,834 | |||||||||
See Notes to Schedules of Investments and Financial Statements.
Janus Aspen Series December 31, 2007 7
Janus Aspen Flexible Bond Portfolio
Schedule of Investments
As of December 31, 2007
| Shares or Principal Amount | Value | ||||||||||
| Pipelines - (continued) | |||||||||||
| $ | 690,000 | Spectra Energy Corp., 6.75% senior unsubordinated, due 2/15/32 | $ | 688,911 | |||||||
| 3,880,384 | |||||||||||
| Publishing - Periodicals - 0.1% | |||||||||||
| 396,000 | Idearc, Inc., 6.83% bank loan due 11/17/14‡ | 376,252 | |||||||||
| Reinsurance - 0.1% | |||||||||||
| 440,000 | Berkshire Hathaway, Inc., 4.625% company guaranteed notes, due 10/15/13 | 440,942 | |||||||||
| Satellite Telecommunications - 0.2% | |||||||||||
| 543,000 | INTELSAT Bermuda, Ltd., 7.725% bank loan, due 2/1/14‡ | 532,683 | |||||||||
| Savings/Loan/Thrifts - 0.1% | |||||||||||
| 200,000 | Sovereign Bancorp, Inc., 4.80% senior notes, due 9/1/10‡ | 199,253 | |||||||||
| Schools - 0.1% | |||||||||||
| 223,799 | Education Management LLC, 6.625% bank loan, due 6/1/13 ‡ | 212,609 | |||||||||
| Special Purpose Entity - 0.7% | |||||||||||
| 380,000 | Petroplus Finance, Ltd., 7.00% company guaranteed notes due 5/1/17 (144A) | 347,700 | |||||||||
| 1,420,000 | Resona Preferred Securities, Ltd. 7.191%, junior subordinated notes due 12/29/49 (144A)‡ | 1,408,978 | |||||||||
| 535,000 | Source Gas LLC, 5.90% senior notes due 4/1/17 (144A)§ | 509,814 | |||||||||
| 2,266,492 | |||||||||||
| Specified Purpose Acquisition Company - 0% | |||||||||||
| 89,100 | Solar Capital Corp., 6.8975% bank loan due 2/28/14‡ | 85,845 | |||||||||
| Super-Regional Banks - 0.6% | |||||||||||
| 2,070,000 | Wells Fargo Co., 5.625% senior unsecured notes, due 12/11/17 | 2,071,265 | |||||||||
| Telephone - Integrated - 0.5% | |||||||||||
| 1,000,000 | BellSouth Corp., 4.75% senior unsecured notes, due 11/15/12 | 989,308 | |||||||||
| 450,000 | Telefonica Emisiones S.A.U., 5.984% company guaranteed notes, due 6/20/11 | 462,910 | |||||||||
| 1,452,218 | |||||||||||
| Television - 0.2% | |||||||||||
| Univision Communications, Inc.: | |||||||||||
| 19,167 | 7.095%, bank loan, due 9/29/14‡ | 17,412 | |||||||||
| 670,833 | 7.21%, bank loan, due 9/29/14‡ | 609,432 | |||||||||
| 626,844 | |||||||||||
| Transportation - Railroad - 0.1% | |||||||||||
| 270,000 | Kansas City Southern de Mexico, 7.375% senior notes, due 6/1/14 (144A) | 262,575 | |||||||||
| Transportation - Services - 0.1% | |||||||||||
| 490,000 | Fedex Corp., 5.50% company guaranteed notes, due 8/15/09 | 495,409 | |||||||||
| Total Corporate Debt (cost $73,407,050) | 72,677,536 | ||||||||||
| Shares or Principal Amount | Value | ||||||||||
| Mortgage Backed Securities - 14.6% | |||||||||||
| Fannie Mae: | |||||||||||
| $ | 925,248 | 7.00%, due 9/1/14 | $ | 963,648 | |||||||
| 240,280 | 6.50%, due 11/1/17 | 248,562 | |||||||||
| 647,935 | 5.00%, due 11/1/18 | 649,555 | |||||||||
| 1,227,929 | 4.50%, due 5/1/19 | 1,207,708 | |||||||||
| 289,890 | 5.50%, due 8/1/19 | 293,948 | |||||||||
| 138,746 | 5.50%, due 9/1/19 | 140,795 | |||||||||
| 467,080 | 5.50%, due 9/1/19 | 473,618 | |||||||||
| 406,324 | 4.50%, due 4/1/20 | 399,524 | |||||||||
| 811,226 | 6.00%, due 10/1/21 | 830,680 | |||||||||
| 967,369 | 5.50%, due 9/1/24 | 972,682 | |||||||||
| 238,698 | 7.00%, due 11/1/28 | 251,712 | |||||||||
| 313,300 | 6.50%, due 2/1/31 | 325,123 | |||||||||
| 541,920 | 7.00%, due 2/1/32 | 571,466 | |||||||||
| 2,288,006 | 6.00%, due 10/1/32 | 2,330,995 | |||||||||
| 2,439,622 | 5.035%, due 1/1/33 | 2,454,195 | |||||||||
| 1,582,839 | 5.50%, due 2/1/33 | 1,585,657 | |||||||||
| 502,126 | 6.50%, due 3/1/33 | 519,102 | |||||||||
| 1,143,888 | 4.566%, due 4/1/33 | 1,145,442 | |||||||||
| 1,264,492 | 5.50%, due 11/1/33 | 1,265,429 | |||||||||
| 1,552,613 | 5.00%, due 4/1/34 | 1,516,616 | |||||||||
| 2,475,172 | 6.00%, due 7/1/34 | 2,521,687 | |||||||||
| 199,352 | 6.50%, due 9/1/34 | 206,966 | |||||||||
| 264,386 | 5.50%, due 11/1/34 | 264,401 | |||||||||
| 2,134,628 | 5.50%, due 11/1/34 | 2,134,746 | |||||||||
| 809,317 | 4.557%, due 12/1/34 | 803,612 | |||||||||
| 2,900,000 | 5.00%, due 1/25/35Ç | 2,829,313 | |||||||||
| 784,997 | 5.50%, due 1/1/36 | 784,518 | |||||||||
| 975,440 | 6.50%, due 1/1/36 | 1,002,794 | |||||||||
| 1,757,199 | 6.00%, due 3/1/36 | 1,784,775 | |||||||||
| 378,695 | 6.00%, due 8/1/36 | 384,639 | |||||||||
| 2,110,596 | 5.563%, due 11/1/36 | 2,137,194 | |||||||||
| 601,388 | 6.00%, due 1/1/37 | 610,826 | |||||||||
| 3,020,999 | 5.00%, due 2/1/37 | 2,946,519 | |||||||||
| Federal Home Loan Bank System: | |||||||||||
| 348,682 | 5.50%, due 12/1/34 | 348,371 | |||||||||
| 1,077,670 | 5.50%, due 12/1/34 | 1,076,710 | |||||||||
| 623,169 | 5.668%, due 3/1/37 | 630,281 | |||||||||
| Freddie Mac: | |||||||||||
| 356,696 | 5.50%, due 1/1/16 | 361,846 | |||||||||
| 677,145 | 5.50%, due 1/1/18 | 686,721 | |||||||||
| 426,796 | 5.50%, due 2/1/21 | 432,021 | |||||||||
| 670,028 | 6.00%, due 11/1/33 | 681,443 | |||||||||
| 929,002 | 6.00%, due 2/1/34 | 945,425 | |||||||||
| 225,284 | 3.924%, due 5/1/34 | 225,533 | |||||||||
| 1,418,581 | 3.744%, due 7/1/34 | 1,420,772 | |||||||||
| 307,799 | 6.50%, due 7/1/34 | 318,558 | |||||||||
| Ginnie Mae: | |||||||||||
| 719,459 | 6.00%, due 10/20/34 | 734,861 | |||||||||
| 443,065 | 6.50%, due 2/20/35 | 458,173 | |||||||||
| 1,841,597 | 5.50%, due 3/20/35 | 1,845,840 | |||||||||
| 38,133,506 | |||||||||||
| Total Mortgage Backed Securities (cost $46,440,340) | 46,725,002 | ||||||||||
See Notes to Schedules of Investments and Financial Statements.
8 Janus Aspen Series December 31, 2007
Schedule of Investments
As of December 31, 2007
| Shares or Principal Amount | Value | ||||||||||
| Preferred Stock - 1.4% | |||||||||||
| Finance - Other Services - 0.2% | |||||||||||
| 11,098 | Chevy Chase Preferred Capital Corp. Series A, convertible, 10.375% | $ | 562,114 | ||||||||
| Savings/Loan/Thrifts - 0.2% | |||||||||||
| 26,020 | Chevy Chase Bank FSB, 8.00% | 662,209 | |||||||||
| U.S. Government Agency - 1.0% | |||||||||||
| 63,805 | Fannie Mae, 8.25% | 1,642,978 | |||||||||
| 61,850 | Freddie Mac, 8.375% | 1,617,378 | |||||||||
| 3,260,356 | |||||||||||
| Total Preferred Stock (cost $4,470,489) | 4,484,679 | ||||||||||
| U.S. Treasury Notes/Bonds - 54.8% | |||||||||||
| U.S. Treasury Notes/Bonds: | |||||||||||
| $ | 7,585,000 | 4.875%, due 5/31/09 | 7,772,258 | ||||||||
| 7,240,000 | 4.625%, due 7/31/09# | 7,408,554 | |||||||||
| 390,000 | 4.75%, due 2/15/10 | 403,467 | |||||||||
| 38,953,000 | 4.50%, due 5/15/10# | 40,252,434 | |||||||||
| 3,615,000 | 5.125%, due 6/30/11 | 3,840,656 | |||||||||
| 6,175,000 | 4.50%, due 11/30/11# | 6,444,193 | |||||||||
| 540,000 | 4.75%, due 1/31/12 | 569,193 | |||||||||
| 10,585,000 | 4.625%, due 2/29/12# | 11,107,634 | |||||||||
| 885,000 | 4.50%, due 3/31/12 | 924,963 | |||||||||
| 1,265,000 | 4.50%, due 4/30/12# | 1,321,430 | |||||||||
| 26,328,000 | 4.75%, due 5/31/12**# | 27,786,334 | |||||||||
| 10,365,000 | 4.625%, due 7/31/12# | 10,883,250 | |||||||||
| 1,545,000 | 4.125%, due 8/31/12 | 1,590,746 | |||||||||
| 1,380,000 | 4.25%, due 9/30/12# | 1,428,408 | |||||||||
| 2,586,000 | 4.625%, due 11/15/16# | 2,708,230 | |||||||||
| 3,270,000 | 4.625%, due 2/15/17# | 3,418,684 | |||||||||
| 15,390,000 | 4.50%, due 5/15/17# | 15,951,489 | |||||||||
| 1,345,000 | 8.875%, due 8/15/17 | 1,850,637 | |||||||||
| 2,665,000 | 8.875%, due 2/15/19# | 3,747,864 | |||||||||
| 3,770,000 | 7.25%, due 8/15/22# | 4,895,111 | |||||||||
| 7,999,000 | 6.25%, due 8/15/23**# | 9,576,931 | |||||||||
| 4,520,000 | 4.75%, due 2/15/37 | 4,730,460 | |||||||||
| 6,291,000 | 5.00%, due 5/15/37# | 6,856,699 | |||||||||
| Total U.S. Treasury Notes/Bonds (cost $167,143,926) | 175,469,625 | ||||||||||
| Money Markets - 3.7% | |||||||||||
| 10,559,222 | Janus Institutional Cash Management Fund – Institutional Shares, 4.98% | 10,559,222 | |||||||||
| 1,305,000 | Janus Institutional Money Market Fund – Institutional Shares, 4.91% | 1,305,000 | |||||||||
| Total Money Markets (cost $11,864,222) | 11,864,222 | ||||||||||
| Shares or Principal Amount | Value | ||||||||||
| Other Securities - 24.5% | |||||||||||
| 54,883,278 | Allianz Dresdner Daily Asset Fund† | $ | 54,883,278 | ||||||||
| 13,433,811 | Repurchase Agreements† | 13,433,811 | |||||||||
| 2,753,504 | Time Deposit - Calyon N.A., 4.00% 1/2/08† | 2,753,504 | |||||||||
| 2,753,504 | Time Deposit - Rabobank Ned Cayman Isl. N.A., 2.50%, 1/2/08† | 2,753,504 | |||||||||
| 3,253 | Time Deposit - Suntrust Bank. N.A. 1.0%, 1/2/08† | 3,253 | |||||||||
| 1,376,752 | Time Deposit - Svenska Handelsbanken N.A., 3.25%, 1/2/08† | 1,376,752 | |||||||||
| 3,441,880 | Time Deposit - Wells Fargo N.A. 3.50%, 1/2/08† | 3,441,880 | |||||||||
| Total Other Securities (cost $78,645,982) | 78,645,982 | ||||||||||
| Total Investments (total cost $381,972,009) – 121.7% | 389,867,046 | ||||||||||
| Liabilities, net of Cash, Receivables and Other Assets – (21.7)% | (69,503,947 | ) | |||||||||
| Net Assets – 100% | $ | 320,363,099 | |||||||||
Summary of Investments by Country – (Long Positions)
| Country | Value | % of Investment Securities | |||||||||
| Canada | $ | 3,190,834 | 0.8 | % | |||||||
| Cayman Islands | 1,408,978 | 0.4 | % | ||||||||
| China | 347,700 | 0.1 | % | ||||||||
| Spain | 462,910 | 0.1 | % | ||||||||
| United States†† | 384,456,624 | 98.6 | % | ||||||||
| Total | $ | 389,867,046 | 100.0 | % | |||||||
††Includes Short-Term Securities and Other Securities (75.4% excluding Short-Term Securities and Other Securities)
See Notes to Schedules of Investments and Financial Statements.
Janus Aspen Series December 31, 2007 9
Statement of Assets and Liabilities
| As of December 31, 2007 (all numbers in thousands except net asset value per share) | Janus Aspen Flexible Bond Portfolio | ||||||
| Assets: | |||||||
| Investments at cost(1) | $ | 381,972 | |||||
| Investments at value(1) | $ | 378,003 | |||||
| Affiliated money market investments | 11,864 | ||||||
| Cash | 696 | ||||||
| Receivables: | |||||||
| Investments sold | 11,009 | ||||||
| Portfolio shares sold | 527 | ||||||
| Dividends | 14 | ||||||
| Interest | 2,929 | ||||||
| Non-interested Trustees' deferred compensation | 5 | ||||||
| Other assets | 64 | ||||||
| Total Assets | 405,111 | ||||||
| Liabilities: | |||||||
| Payables: | |||||||
| Collateral for securities loaned (Note 1) | 78,646 | ||||||
| Investments purchased | 5,842 | ||||||
| Portfolio shares repurchased | 57 | ||||||
| Advisory fees | 146 | ||||||
| Transfer agent fees and expenses | 1 | ||||||
| Distribution fees - Service Shares | 5 | ||||||
| Non-interested Trustees' fees and expenses | 3 | ||||||
| Non-interested Trustees' deferred compensation fees | 5 | ||||||
| Accrued expenses | 43 | ||||||
| Total Liabilities | 84,748 | ||||||
| Net Assets | $ | 320,363 | |||||
| Net Assets Consist of: | |||||||
| Capital (par value and paid-in-surplus)* | $ | 317,846 | |||||
| Undistributed net investment income/(loss)* | 699 | ||||||
| Undistributed net realized gain/(loss) from investments and foreign currency transactions* | (6,093 | ) | |||||
| Unrealized appreciation/(depreciation) of investments, foreign currency translations and non-interested Trustees' deferred compensation | 7,911 | ||||||
| Total Net Assets | $ | 320,363 | |||||
| Net Assets - Institutional Shares | $ | 297,919 | |||||
| Shares Outstanding, $0.001 Par Value (unlimited shares authorized) | 25,989 | ||||||
| Net Asset Value Per Share | $ | 11.46 | |||||
| Net Assets - Service Shares | $ | 22,444 | |||||
| Shares Outstanding, $0.001 Par Value (unlimited shares authorized) | 1,850 | ||||||
| Net Asset Value Per Share | $ | 12.13 | |||||
*See Note 3 in Notes to Financial Statements.
(1) Investments at cost and value include $77,069,838 of securities loaned (Note 1).
See Notes to Financial Statements.
10 Janus Aspen Series December 31, 2007
Statement of Operations
| For the fiscal year ended December 31, 2007 (all numbers in thousands) | Janus Aspen Flexible Bond Portfolio | ||||||
| Investment Income: | |||||||
| Interest | $ | 16,154 | |||||
| Securities lending income | 302 | ||||||
| Dividends | 140 | ||||||
| Dividends from affiliates | 484 | ||||||
| Total Investment Income | 17,080 | ||||||
| Expenses: | |||||||
| Advisory fees | 1,678 | ||||||
| Transfer agent fees and expenses | 5 | ||||||
| Registration fees | 19 | ||||||
| Custodian fees | 25 | ||||||
| Professional fees | 12 | ||||||
| Non-interested Trustees' fees and expenses | 12 | ||||||
| Distribution fees - Service Shares | 74 | ||||||
| System fees | 30 | ||||||
| Other expenses | 97 | ||||||
| Non-recurring costs (Note 2) | – | ||||||
| Costs assumed by Janus Capital Management LLC (Note 2) | – | ||||||
| Total Expenses | 1,952 | ||||||
| Expense and Fee Offset | (2 | ) | |||||
| Net Expenses | 1,950 | ||||||
| Net Investment Income/(Loss) | 15,130 | ||||||
| Net Realized and Unrealized Gain/(Loss) on Investments: | |||||||
| Net realized gain/(loss) from investments and foreign currency transactions | (1,163 | ) | |||||
| Net realized gain/(loss) from futures contracts | (43 | ) | |||||
| Net realized gain/(loss) from short sales | 6 | ||||||
| Change in net appreciation/(depreciation) of investments, foreign currency translations and non-interested Trustees' deferred compensation | 8,077 | ||||||
| Payment from affiliate (Note 2) | 15 | ||||||
| Net Gain/(Loss) on Investments | 6,892 | ||||||
| Net Increase/(Decrease) in Net Assets Resulting from Operations | $ | 22,022 | |||||
See Notes to Financial Statements.
Janus Aspen Series December 31, 2007 11
Statements of Changes in Net Assets
| For the fiscal years ended December 31 | Janus Aspen Flexible Bond Portfolio | ||||||||||
| (all numbers in thousands) | 2007 | 2006 | |||||||||
| Operations: | |||||||||||
| Net investment income/(loss) | $ | 15,130 | $ | 13,618 | |||||||
| Net realized gain/(loss) from investments and foreign currency transactions | (1,163 | ) | (3,577 | ) | |||||||
| Net realized gain/(loss) from futures contracts | (43 | ) | (19 | ) | |||||||
| Net realized gain/(loss) from short sales | 6 | (2 | ) | ||||||||
| Change in net appreciation/(depreciation) of investments, foreign currency translations and non-interested Trustees' deferred compensation | 8,077 | 2,168 | |||||||||
| Payment from affiliate (Note 2) | 15 | – | |||||||||
| Net Increase/(Decrease) in Net Assets Resulting from Operations | 22,022 | 12,188 | |||||||||
| Dividends and Distributions to Shareholders: | |||||||||||
| Net investment income* | |||||||||||
| Institutional Shares | (14,130 | ) | (12,918 | ) | |||||||
| Service Shares | (1,115 | ) | (1,216 | ) | |||||||
| Net realized gain/(loss) from investment transactions* | |||||||||||
| Institutional Shares | – | (554 | ) | ||||||||
| Service Shares | – | (64 | ) | ||||||||
| Net Decrease from Dividends and Distributions | (15,245 | ) | (14,752 | ) | |||||||
| Capital Share Transactions: | |||||||||||
| Shares sold | |||||||||||
| Institutional Shares | 78,346 | 36,889 | |||||||||
| Service Shares | 15,681 | 5,987 | |||||||||
| Reinvested dividends and distributions | |||||||||||
| Institutional Shares | 14,130 | 13,472 | |||||||||
| Service Shares | 1,115 | 1,280 | |||||||||
| Shares repurchased | |||||||||||
| Institutional Shares | (65,035 | ) | (61,602 | ) | |||||||
| Service Shares | (22,937 | ) | (12,409 | ) | |||||||
| Net Increase/(Decrease) from Capital Share Transactions | 21,300 | (16,383 | ) | ||||||||
| Net Increase/(Decrease) in Net Assets | 28,077 | (18,947 | ) | ||||||||
| Net Assets: | |||||||||||
| Beginning of period | 292,286 | 311,233 | |||||||||
| End of period | $ | 320,363 | $ | 292,286 | |||||||
| Undistributed net investment income/(loss)* | $ | 699 | $ | 757 | |||||||
*See Note 3 in Notes to Financial Statements.
See Notes to Financial Statements.
12 Janus Aspen Series December 31, 2007
Financial Highlights
Institutional Shares
| For a share outstanding during each fiscal year | Janus Aspen Flexible Bond Portfolio | ||||||||||||||||||||||
| ended December 31 | 2007 | 2006 | 2005 | 2004 | 2003 | ||||||||||||||||||
| Net Asset Value, Beginning of Period | $ | 11.24 | $ | 11.36 | $ | 12.14 | $ | 12.49 | $ | 12.30 | |||||||||||||
| Income from Investment Operations: | |||||||||||||||||||||||
| Net investment income/(loss) | .53 | .54 | .60 | .66 | .63 | ||||||||||||||||||
| Net gain/(loss) on securities (both realized and unrealized) | .24 | (.08 | ) | (.36 | ) | (.18 | ) | .15 | |||||||||||||||
| Total from Investment Operations | .77 | .46 | .24 | .48 | .78 | ||||||||||||||||||
| Less Distributions and Other: | |||||||||||||||||||||||
| Dividends (from net investment income)* | (.55 | ) | (.56 | ) | (.59 | ) | (.68 | ) | (.59 | ) | |||||||||||||
| Distributions (from capital gains)* | – | (.02 | ) | (.43 | ) | (.15 | ) | – | |||||||||||||||
| Payment from affiliate | – | (1) | – | – | (1) | – | (1) | – | |||||||||||||||
| Total Distributions and Other | (.55 | ) | (.58 | ) | (1.02 | ) | (.83 | ) | (.59 | ) | |||||||||||||
| Net Asset Value, End of Period | $ | 11.46 | $ | 11.24 | $ | 11.36 | $ | 12.14 | $ | 12.49 | |||||||||||||
| Total Return | 7.04 | %(2) | 4.22 | % | 2.00 | %(2) | 3.97 | %(2) | 6.39 | % | |||||||||||||
| Net Assets, End of Period (in thousands) | $ | 297,919 | $ | 264,656 | $ | 278,324 | $ | 404,522 | $ | 576,021 | |||||||||||||
| Average Net Assets for the Period (in thousands) | $ | 279,676 | $ | 264,990 | $ | 321,856 | $ | 525,932 | $ | 623,513 | |||||||||||||
| Ratio of Gross Expenses to Average Net Assets(3) | 0.61 | % | 0.64 | % | 0.57 | % | 0.59 | % | 0.64 | % | |||||||||||||
| Ratio of Net Expenses to Average Net Assets(3) | 0.61 | % | 0.64 | % | 0.57 | % | 0.59 | % | 0.64 | % | |||||||||||||
| Ratio of Net Investment Income/(Loss) to Average Net Assets | 4.91 | % | 4.63 | % | 4.18 | % | 4.28 | % | 4.51 | % | |||||||||||||
| Portfolio Turnover Rate | 138 | %(4) | 163 | %(4) | 171 | %(4) | 171 | % | 154 | % | |||||||||||||
Service Shares
| For a share outstanding during each fiscal year | Janus Aspen Flexible Bond Portfolio | ||||||||||||||||||||||
| ended December 31 | 2007 | 2006 | 2005 | 2004 | 2003 | ||||||||||||||||||
| Net Asset Value, Beginning of Period | $ | 11.86 | $ | 11.91 | $ | 12.70 | $ | 13.11 | $ | 12.82 | |||||||||||||
| Income from Investment Operations: | |||||||||||||||||||||||
| Net investment income/(loss) | .62 | .51 | .53 | .54 | .53 | ||||||||||||||||||
| Net gain/(loss) on securities (both realized and unrealized) | .17 | (.05 | ) | (.31 | ) | (.07 | ) | .26 | |||||||||||||||
| Total from Investment Operations | .79 | .46 | .22 | .47 | .79 | ||||||||||||||||||
| Less Distributions and Other: | |||||||||||||||||||||||
| Dividends (from net investment income)* | (.52 | ) | (.49 | ) | (.58 | ) | (.73 | ) | (.50 | ) | |||||||||||||
| Distributions (from capital gains)* | – | (.02 | ) | (.43 | ) | (.15 | ) | – | |||||||||||||||
| Payment from affiliate | – | (1) | – | – | (1) | – | (1) | – | |||||||||||||||
| Total Distributions and Other | (.52 | ) | (.51 | ) | (1.01 | ) | (.88 | ) | (.50 | ) | |||||||||||||
| Net Asset Value, End of Period | $ | 12.13 | $ | 11.86 | $ | 11.91 | $ | 12.70 | $ | 13.11 | |||||||||||||
| Total Return | 6.80 | %(2) | 3.98 | % | 1.76 | %(2) | 3.70 | %(2) | 6.17 | % | |||||||||||||
| Net Assets, End of Period (in thousands) | $ | 22,444 | $ | 27,630 | $ | 32,909 | $ | 34,867 | $ | 31,272 | |||||||||||||
| Average Net Assets for the Period (in thousands) | $ | 29,701 | $ | 30,780 | $ | 33,352 | $ | 33,840 | $ | 23,523 | |||||||||||||
| Ratio of Gross Expenses to Average Net Assets(3) | 0.86 | % | 0.89 | % | 0.83 | % | 0.84 | % | 0.89 | % | |||||||||||||
| Ratio of Net Expenses to Average Net Assets(3) | 0.85 | % | 0.89 | % | 0.82 | % | 0.84 | % | 0.89 | % | |||||||||||||
| Ratio of Net Investment Income/(Loss) to Average Net Assets | 4.66 | % | 4.36 | % | 3.94 | % | 4.03 | % | 4.26 | % | |||||||||||||
| Portfolio Turnover Rate | 138 | %(4) | 163 | %(4) | 171 | %(4) | 171 | % | 154 | % | |||||||||||||
*See Note 3 in Notes to Financial Statements.
(1) Payment from affiliate aggregated less than $.01 on a per share basis for fiscal year ended.
(2) During the fiscal year ended, Janus Capital and/or Janus Services LLC fully reimbursed the Portfolio for a loss on a transaction resulting from certain trading, pricing and/or shareholder activity errors, which otherwise would have reduced total return by less than 0.01%
(3) See Note 4 in Notes to Financial Statements.
(4) Excluding mortgage dollar roll transactions. If mortgage dollar roll transactions had been included, the portfolio turnover rate would have been 139% in 2007, 165% in 2006 and 177% in 2005.
See Notes to Financial Statements.
Janus Aspen Series December 31, 2007 13
Notes to Schedule of Investments
| Lehman Brothers Aggregate Bond Index | Is made up of the Lehman Brothers Government/Corporate Bond Index, Mortgage-Backed Securities Index and Asset-Based Securities Index, including securities that are of investment grade quality or better, have at least one year to maturity and have an outstanding par value of at least $100 million. | ||||||
| Lipper Variable Annuity Intermediate Investment Grade Debt Funds | Funds that invest at least 65% of their assets in investment grade debt issues (rated in top four grades) with dollar-weighted average maturities of five to ten years. | ||||||
| 144A | Securities sold under Rule 144A of the Securities Act of 1933, as amended, are subject to legal and/or contractual restrictions on resale and may not be publicly sold without registration under the 1933 Act. | ||||||
| PLC | Public Limited Company | ||||||
** A portion of this security has been segregated by the custodian to cover margin or segregation requirements on open futures contracts, forward currency contracts, options contracts, short sales and/or securities with extended settlement dates.
‡ Rate is subject to change. Rate shown reflects rate as of December 31, 2007.
# Loaned security; a portion or all of the security is on loan at December 31, 2007.
† The security is purchased with the cash collateral received from securities on loan (Note 1).
Ç Security is traded on a "to-be-announced" basis.
§Schedule of Restricted and Illiquid Securities (as of December 31, 2007)
| Acquisition Date | Acquisition Cost | Value | Value as % of Net Assets | ||||||||||||||||
| Janus Aspen Flexible Bond Portfolio | |||||||||||||||||||
| Source Gas LLC, 5.90% senior notes, due 4/1/17 (144A) | 4/11/07 - 9/20/07 | $ | 532,575 | $ | 509,814 | 0.2 | % | ||||||||||||
The Portfolio has registration rights for certain restricted securities held as of December 31, 2007. The issuer incurs all registration costs.
Aggregate collateral segregated to cover margin or segregation requirements on open futures contracts, forward currency contracts, options contracts, short sales and/or securities with extended settlement dates as of December 31, 2007 is noted below.
| Portfolio | Aggregate Value | ||||||
| Janus Aspen Flexible Bond Portfolio | $ | 10,371,893 | |||||
The interest rate for variable rate notes is based upon an index or market interest rates and is subject to change. Rates in the security description are as of December 31, 2007.
14 Janus Aspen Series December 31, 2007
Notes to Financial Statements
The following section describes the organization and significant accounting policies and provides more detailed information about the schedules and tables that appear throughout this report. In addition, the Notes to Financial Statements explain the methods used in preparing and presenting this report.
1. ORGANIZATION AND SIGNIFICANT ACCOUNTING POLICIES
Janus Aspen Flexible Bond Portfolio (the "Portfolio") is a series fund. The Portfolio is part of Janus Aspen Series (the "Trust"), which is organized as a Delaware statutory trust and is registered under the Investment Company Act of 1940, as amended, (the "1940 Act") as an open-end management investment company. The Trust offers seventeen Portfolios, which include multiple series of shares, with differing investment objectives and policies. The Portfolio invests primarily in income-producing securities. The Portfolio is classified as diversified, as defined in the 1940 Act. The Portfolio is a no-load investment.
The Portfolio currently offers two classes of shares: Institutional Shares and Service Shares. Institutional Shares are offered only in connection with investment in and payments under variable insurance contracts and to qualified retirement plans. Service Shares are offered only in connection with investment in and payments under variable insurance contracts and to qualified retirement plans that require a fee from Portfolio assets to procure distribution and administrative services to contract owners and plan participants.
The following accounting policies have been consistently followed by the Portfolio and are in conformity with accounting principles generally accepted in the United States of America in the investment company industry.
Investment Valuation
Securities are valued at the last sales price or the official closing price for securities traded on a principal securities exchange (U.S. or foreign) and on the NASDAQ National Market. Securities traded on over-the-counter markets and listed securities for which no sales are reported are valued at the latest bid price (or yield equivalent thereof) obtained from one or more dealers transacting in a market for such securities or by a pricing service approved by the Portfolio's Trustees. Short-term securities with maturities of 60 days or less may be valued at amortized cost, which approximates market value. Debt securities with a remaining maturity of greater than 60 days are valued in accordance with the evaluated bid price supplied by the pricing service. The evaluated bid price supplied by the pricing service is an evaluation that reflects such factors as security prices, yields, maturities and ratings. Foreign securities and currencies ar e converted to U.S. dollars using the applicable exchange rate in effect as of the daily close of the New York Stock Exchange ("NYSE"). When market quotations are not readily available or deemed unreliable, or events or circumstances that may affect the value of portfolio securities held by the Portfolio are identified between the closing of their principal markets and the time the net asset value ("NAV") is determined, securities may be valued at fair value as determined in good faith under procedures established by and under the supervision of the Portfolio's Trustees. Circumstances in which fair value pricing may be utilized include, but are not limited to: (i) when significant events occur which may affect the securities of a single issuer, such as mergers, bankruptcies, or significant issuer specific developments; (ii) when significant events occur which may affect an entire market, such as natural disasters or significant governmen tal actions; and (iii) when non-significant events occur such as markets closing early or not opening, security trading halts, or pricing of non-valued securities and restricted or non-public securities. The Portfolio may use a systematic fair valuation model provided by an independent third party to value international equity securities in order to adjust for stale pricing, which may occur between the close of certain foreign exchanges and the NYSE.
Investment Transactions and Investment Income
Investment transactions are accounted for as of the date purchased or sold (trade date). Dividend income is recorded on the ex-dividend date. Certain dividends from foreign securities will be recorded as soon as the Trust is informed of the dividend if such information is obtained subsequent to the ex-dividend date. Dividends from foreign securities may be subject to withholding taxes in foreign jurisdictions. Interest income is recorded on the accrual basis and includes amortization of premiums and accretion of discounts. Gains and losses are determined on the identified cost basis, which is the same basis used for federal income tax purposes. Income, as well as gains and losses, both realized and unrealized, are allocated daily to each class of shares based upon the ratio of net assets represented by each class as a percentage of total net assets.
Expenses
The Portfolio bears expenses incurred specifically on its behalf as well as a portion of general expenses. Each class of shares bears expenses incurred specifically on its behalf and, in addition, each class bears a portion of general expenses, which may be based upon relative net assets of each class. Expenses are allocated daily to each class of shares based upon the ratio of net assets represented by each class as a percentage of total net assets. Expenses directly attributable to a specific class of shares are charged against the operations of such class.
Securities Lending
Under procedures adopted by the Trustees, the Portfolio may lend securities to qualified parties (typically brokers or other financial institutions) who need to borrow securities in order to complete certain transactions such as covering short sales,
Janus Aspen Series December 31, 2007 15
Notes to Financial Statements (continued)
avoiding failures to deliver securities or completing arbitrage activities. The Portfolio may seek to earn additional income through securities lending. There is the risk of delay in recovering a loaned security or the risk of loss in collateral rights if the borrower fails financially. Janus Capital Management LLC ("Janus Capital") makes efforts to balance the benefits and risks from granting such loans.
State Street Bank and Trust Company served as the Portfolio's lending agent for the period January 1, 2007 through May 24, 2007. Effective May 25, 2007, Dresdner Bank AG became the lending agent for the Portfolio.
The Portfolio does not have the right to vote on securities while they are being lent; however, the Portfolio may attempt to call back the loan and vote the proxy if time permits. All loans will be continuously secured by collateral which may consist of cash, U.S. Government securities, domestic and foreign short-term debt instruments, letters of credit, time deposits, repurchase agreements, or such other collateral permitted by the Securities and Exchange Commission ("SEC"). Cash collateral may be invested in affiliated money market funds or other accounts advised by Janus Capital to the extent consistent with exemptive relief obtained from the SEC or as permitted by the 1940 Act and rules promulgated thereunder.
Dresdner Bank AG (the "Lending Agent") may also invest the cash collateral in the Allianz Dresdner Daily Asset Fund or investments in unaffiliated money market funds or accounts, mutually agreed to by the Portfolio and the Lending Agent, that comply with Rule 2a-7 of the 1940 Act relating to money market funds.
As of December 31, 2007, the Portfolio had on loan securities valued as indicated:
| Portfolio | Value at December 31, 2007 | ||||||
| Janus Aspen Flexible Bond Portfolio | $ | 77,069,838 | |||||
As of December 31, 2007, the Portfolio received cash collateral for securities lending activity as indicated:
| Portfolio | Cash Collateral at December 31, 2007 | ||||||
| Janus Aspen Flexible Bond Portfolio | $ | 78,645,982 | |||||
As of December 31, 2007, all cash collateral received by the Portfolio was invested in the Allianz Dresdner Daily Asset Fund, except for $13,433,811 and $10,328,893 which were invested in Repurchase Agreements and Time Deposits, respectively.
The value of the collateral must be at least 102% of the market value of the loaned securities that are denominated in U.S. dollars and 105% of the market value of the loaned securities that are not denominated in U.S. dollars. Loaned securities and related collateral are marked-to-market each business day based upon the market value of the loaned securities at the close of business, employing the most recent available pricing information. Collateral levels are then adjusted based on this mark-to-market evaluation.
The borrower pays fees at the Portfolio's direction to the Lending Agent. The Lending Agent may retain a portion of the interest earned on the cash collateral invested. The cash collateral invested by the Lending Agent is disclosed in the Schedule of Investments (if applicable). The lending fees and the Portfolio's portion of the interest income earned on cash collateral are included on the Statement of Operations (if applicable).
Interfund Lending
Pursuant to an exemptive order received from the SEC, the Portfolio may be party to an interfund lending agreement between the Portfolio and other Janus Capital sponsored mutual funds, which permits it to borrow or lend cash at a rate beneficial to both the borrowing and lending funds. Outstanding borrowings from all sources totaling 10% or more of the borrowing Portfolio's total assets must be collateralized at 102% of the outstanding principal value of the loan; loans of less than 10% may be unsecured. During the fiscal year ended December 31, 2007, there were no outstanding interfund borrowing or lending arrangements for the Portfolio.
Forward Currency Transactions
The Portfolio may enter into forward currency contracts in order to reduce its exposure to changes in foreign currency exchange rates on its foreign portfolio holdings and to lock in the U.S. dollar cost of firm purchase and sale commitments for securities denominated in or exposed to foreign currencies. A forward currency exchange contract is a commitment to purchase or sell a foreign currency at a future date at a negotiated rate. The gain or loss arising from the difference between the U.S. dollar cost of the original contract and the value of the foreign currency in U.S. dollars upon closing a contract is included in "Net realized gain/(loss) from investment and foreign currency transactions" on the Statement of Operations (if applicable).
Forward currency contracts held by the Portfolio are fully collateralized by other securities, which are denoted in the accompanying Schedule of Investments (if applicable). The collateral is evaluated daily to ensure its market value equals or exceeds the current market value of the corresponding forward currency contracts. As of December 31, 2007, the Portfolio was not invested in forward foreign currency contracts.
Futures Contracts
The Portfolio may enter into futures contracts to gain exposure to the stock market pending investment of cash balances or to meet liquidity needs. The Portfolio may also use such derivative instruments to hedge or protect from
16 Janus Aspen Series December 31, 2007
adverse movements in securities prices, currency rates or interest rates. The use of futures contracts may involve risks such as the possibility of illiquid markets or imperfect correlation between the value of the contracts and the underlying securities, or that the counterparty will fail to perform its obligations.
Futures contracts are marked-to-market daily, and the daily variation margin is recorded as a receivable or payable on the Statement of Assets and Liabilities (if applicable). When a contract is closed, a realized gain or loss is recorded as "Net realized gain/(loss) from futures contracts" on the Statement of Operations (if applicable) equal to the difference between the opening and closing value of the contract. Generally, futures contracts are marked-to-market (i.e., treated as realized and subject to distribution) for federal income tax purposes at fiscal year-end. Securities designated as collateral for market value on futures contracts are noted in the Schedule of Investments (if applicable). Such collateral is in the possession of the Portfolio's custodian. As of December 31, 2007, the Portfolio was not invested in futures contracts.
Mortgage Dollar Rolls
The Portfolio may enter into "mortgage dollar rolls." In a "mortgage dollar roll" transaction, the Portfolio sells a mortgage-related security (such as a Government National Mortgage Association ("Ginnie Mae") security) to a dealer and simultaneously agrees to repurchase a similar security (but not the same security) in the future at a pre-determined price. The Portfolio will not be entitled to receive interest and principal payments while the dealer holds the security. The difference between the sale price and the future purchase price is recorded as an adjustment to investment income.
The Portfolio's obligations under a dollar roll agreement must be covered by cash, U.S. Government securities or other liquid high grade debt obligations equal in value to the securities subject to repurchase by the Portfolio, maintained in a segregated account. To the extent that the Portfolio collateralizes its obligations under a dollar roll agreement, the asset coverage requirements of the 1940 Act will not apply to such transactions. Furthermore, under certain circumstances, an underlying mortgage-backed security that is part of a dollar roll transaction may be considered illiquid.
Successful use of mortgage dollar rolls depends on the Portfolio's ability to predict interest rates and mortgage payments. Dollar roll transactions involve the risk that the market value of the securities the Portfolio is required to purchase may decline below the agreed upon repurchase price.
The average monthly balance of dollar rolls outstanding for the Portfolio during the fiscal year ended December 31, 2007 was $290,428. As of December 31, 2007, the Portfolio was not invested in mortgage dollar rolls.
Securities Traded on a To-Be-Announced Basis
The Portfolio may trade securities on a to-be-announced ("TBA") basis. In a TBA transaction, the Portfolio commits to purchasing or selling securities for which specific information is not yet known at the time of the trade, particularly the face amount and maturity date in Ginnie Mae, Federal National Mortgage Association ("Fannie Mae") and/or Federal Home Loan Mortgage Corporation ("Freddie Mac") transactions. Securities purchased on a TBA basis are not settled until they are delivered to the Portfolio, normally 15 to 45 days later. Beginning on the date the Portfolio enters into a TBA transaction, cash, U.S. Government securities or other liquid high-grade debt obligations are segregated in an amount equal in value to the purchase price of the TBA security. These transactions are subject to market fluctuations and their current value is determined in the same manner as for other securities. As of December 31, 2007, the Portfolio held TBA securities with a total cost of $2,818,040.
Bank Loans
The Portfolio may invest in bank loans, which include institutionally-traded floating rate securities generally acquired as an assignment or participation interest in loans originated by a bank or financial institution (the "Lender") that acts as agent for all holders. The agent administers the terms of the loan, as specified in the loan agreement. When investing in a loan participation, the Portfolio has the right to receive payments of principal, interest and any fees to which it is entitled only from the Lender selling the loan agreement and only upon receipt by the Lender of payments from the borrower. The Portfolio generally has no right to enforce compliance with the terms of the loan agreement with the borrower. Assignments and participations involve credit, interest rate, and liquidity risk. Interest rates on floating rate securities adjust with general interest rate changes and/or issuer credit quality. The interest rates paid on a floating rate security in which the Portfolio invests generally are readjusted periodically to an increment over a designated benchmark rate, such as the one-month, three-month, six-month, or one-year London Interbank Offered Rate ("LIBOR'').
The Portfolio may have difficulty trading assignments and participations to third parties. There may be restrictions on transfer and only limited opportunities may exist to sell such securities in secondary markets. As a result, the Portfolio may be unable to sell assignments or participations at the desired time or may be able to sell only at a price less than fair market value. The Portfolio utilizes an independent third party to value individual bank loans on a daily basis.
The average monthly value of borrowings outstanding under bank loan arrangements and the related rate range during the
Janus Aspen Series December 31, 2007 17
Notes to Financial Statements (continued)
fiscal year ended December 31, 2007, are noted in the table below.
| Portfolio | Average Monthly Value | Rates | |||||||||
| Janus Aspen Flexible Bond Portfolio | $10,015,543 | 2.10%-9.00% | |||||||||
Short Sales
The Portfolio may engage in "short sales against the box." Short sales against the box involve either selling short a security that the Portfolio owns, or selling short a security that the Portfolio has the right to obtain, for delivery at a specified date in the future. The Portfolio may enter into a short sale against the box to hedge against anticipated declines in the market price of portfolio securities by locking in gains. The Portfolio does not deliver from its portfolio the securities sold short and does not immediately receive the proceeds of the short sale. The Portfolio borrows the securities sold short and receives proceeds from the short sale only when it delivers the securities to the lender. If the value of the securities sold short increases prior to the scheduled delivery date, the Portfolio loses the opportunity to participate in the gain. As of December 31, 2007, the Portfolio was not engaged in short sales.
Floating Rate Loans
The Portfolio may invest in floating rate loans. Floating rate loans are debt securities that have floating interest rates tied to a benchmark lending rate such as LIBOR. LIBOR is a short-term interest rate that banks charge one another and that is generally representative of the most competitive and current cash rates. In other cases, the lending rate could be tied to the prime rate offered by one or more major U.S. banks or the rate paid on large certificates of deposit traded in the secondary markets (the CD Rate). If the benchmark lending rate changes, the rate payable to lenders under the loan will change at the next scheduled adjustment date specified in the loan agreement. Floating rate loans are typically issued to companies (''borrowers'') in connection with recapitalizations, acquisitions, and refinancings. Floating rate loan investments are generally below investment grade. Senior floating rate loans are secured by specific collat eral of a borrower and are senior in the borrower's capital structure. The senior position in the borrower's capital structure generally gives holders of senior loans a claim on certain of the borrower's assets that is senior to subordinated debt and preferred and common stock in the case of a borrower's default. Floating rate loan investments may involve foreign borrowers, and investments may be denominated in foreign currencies. Floating rate loans often involve borrowers whose financial condition is troubled or uncertain and companies that are highly leveraged. The Portfolio may invest in obligations of borrowers who are in bankruptcy proceedings. Floating rate loans may include fully funded term loans or revolving lines of credit.
Foreign Currency Translations
The Portfolio does not isolate that portion of the results of operations resulting from changes in foreign exchange rates on investments from the fluctuations arising from changes in market prices of securities held at the date of the financial statements. Net unrealized appreciation or depreciation on investments and foreign currency translation arise from changes in the value of assets and liabilities, including investments in securities held at the date of the financial statements, resulting from changes in the exchange rates and changes in market prices of securities held.
Currency gains and losses are also calculated on payables and receivables that are denominated in foreign currencies. The payables and receivables are generally related to foreign security transactions and income.
Foreign currency-denominated assets and forward currency contracts may involve more risks than domestic transactions, including currency risk, political and economic risk, regulatory risk and market risk. Risks may arise from the potential inability of a counterparty to meet the terms of a contract and from unanticipated movements in the value of foreign currencies relative to the U.S. dollar.
When-issued Securities
The Portfolio may purchase or sell securities on a when-issued or forward commitment basis. The price of the underlying securities and date when the securities will be delivered and paid for are fixed at the time the transaction is negotiated. Losses may arise due to changes in the market value of the securities or from the inability of counterparties to meet the terms of the contract. In connection with such purchases, the Portfolio may hold liquid assets as collateral with the Portfolio's custodian sufficient to cover the purchase price. As of December 31, 2007, the Portfolio was not invested in when-issued securities.
Equity-Linked Structured Notes
The Portfolio may invest in equity-linked structured notes. Equity-linked structured notes are derivative securities which are specially designed to combine the characteristics of one or more underlying securities and their equity derivatives in a single note form. The return and/or yield or income component may be based on the performance of the underlying equity securities, an equity index, and/or option positions. Equity-linked structured notes are typically offered in limited transactions by financial institutions in either registered or non-registered form. An investment in equity-linked structured notes creates exposure to the credit risk of the issuing financial institution, as well as to the market risk of the underlying securities. There is no guaranteed return of principal with these securities and the appreciation potential of these securities may be limited by a maximum payment or call right. In certain cases, equity-linked struc tured notes may
18 Janus Aspen Series December 31, 2007
be more volatile and less liquid than less complex securities or other types of fixed-income securities. Such securities may exhibit price behavior that does not correlate with other fixed-income securities. As of December 31, 2007, the Portfolio was not invested in equity-linked structured notes.
Initial Public Offerings
The Portfolio may invest in initial public offerings ("IPOs"). IPOs and other investment techniques may have a magnified performance impact on a fund with a small asset base. The Portfolio may not experience similar performance as its assets grow.
Additional Investment Risk
The Portfolio may be invested in lower-rated debt securities that have a higher risk of default or loss of value since these securities may be sensitive to economic changes, political changes or adverse developments specific to the issuer.
Restricted Security Transactions
Restricted securities held by the Portfolio may not be sold except in exempt transactions or in a public offering registered under the Securities Act of 1933. The risk of investing in such securities is generally greater than the risk of investing in the securities of widely held, publicly traded companies. Lack of a secondary market and resale restrictions may result in the inability of the Portfolio to sell a security at a fair price and may substantially delay the sale of the security. In addition, these securities may exhibit greater price volatility than securities for which secondary markets exist.
Dividend Distributions
The Portfolio may make semiannual distributions of substantially all of its investment income and an annual distribution of its net realized capital gains (if any). The majority of dividends and net realized capital gains distributions from the Portfolio may be automatically reinvested into additional shares of the Portfolio, based upon the discretion of the shareholder.
Estimates
The preparation of financial statements in conformity with accounting principles generally accepted in the United States of America requires management to make estimates and assumptions that affect the reported amount of assets and liabilities and disclosure of contingent assets and liabilities at the date of the financial statements, and the reported amounts of income and expenses during the reporting period. Actual results could differ from those estimates.
Federal Income Taxes
No provision for income taxes is included in the accompanying financial statements, as the Portfolio intends to distribute to shareholders all taxable investment income and realized gains and otherwise comply with Subchapter M of the Internal Revenue Code applicable to regulated investment companies.
New Accounting Pronouncements
In July 2006, the Financial Accounting Standards Board ("FASB") issued Interpretation No. 48, "Accounting for Uncertainty in Income Taxes – an Interpretation of FASB Statement No. 109" (the "Interpretation"). The Interpretation establishes for all entities, including pass-through entities such as the Portfolio, a minimum threshold for financial statement recognition of the benefit of positions taken in filing tax returns (including whether an entity is taxable in a particular jurisdiction), and requires certain expanded tax disclosures. A calendar year open-end or closed-end fund was required to implement the Interpretation no later than June 29, 2007 (the last business day of the semi-annual reporting period), and the Interpretation also applies to all open tax years as of the date of effectiveness. Management has evaluated the application of the Interpretation to the Portfolio and has determined there is no significant impact on the P ortfolio's financial statements.
In September 2006, the FASB issued Statement of Financial Accounting Standards No. 157, "Fair Value Measurements" ("SFAS No. 157"), which defines fair value, establishes a framework for measuring fair value in generally accepted accounting principles, and expands disclosures about fair value measurements. SFAS No. 157 does not require new fair value measurements, but is applied to the extent that other accounting pronouncements require or permit fair value measurements. SFAS No. 157 emphasizes that fair value is a market-based measurement that should be determined based on the assumptions that market participants would use in pricing an asset or liability. SFAS No. 157 is effective for fiscal years beginning after November 15, 2007 and interim periods within those fiscal years. Management does not believe the adoption of SFAS No. 157 will impact the financial statement amounts, however, the Portfolio will be required to disclose the extent t o which fair value is used to measure assets and liabilities and the inputs used to develop the measurements.
2. INVESTMENT ADVISORY AGREEMENTS AND OTHER TRANSACTIONS WITH AFFILIATES
The Portfolio pays a monthly advisory fee to Janus Capital based upon average daily net assets and calculated at annual rates of 0.55% of the first $300 million of average daily net assets and 0.45% of average daily net assets in excess of $300 million.
Janus Capital has agreed until at least May 1, 2009 to reimburse the Portfolio by the amount, if any, that the normal operating expenses in any fiscal year, including the investment advisory fee but excluding the distribution and shareholder servicing (12b-1) fees applicable to Service Shares, brokerage commissions, interest, taxes and extraordinary expenses, exceed an annual rate of 0.90% of the average daily net assets of the Portfolio. The Portfolio is not required to repay any such waived fees in future years to Janus Capital.
Janus Aspen Series December 31, 2007 19
Notes to Financial Statements (continued)
Janus Services LLC ("Janus Services"), a wholly-owned subsidiary of Janus Capital, is the Portfolio's transfer agent. Janus Services receives certain out-of-pocket expenses for transfer agent services.
Certain officers of the Portfolio may also be officers and/or directors of Janus Capital. Such officers receive no compensation from the Portfolio, except for the Portfolio's Chief Compliance Officer. Effective January 1, 2006, the Portfolio began reimbursing the adviser for a portion of the compensation paid to the Chief Compliance Officer of the Trust. Total compensation of $3,078 was paid by the Portfolio during the fiscal year ended December 31, 2007. The Portfolio's portion is reported as part of "Other Expenses" on the Statement of Operations.
The Board of Trustees has adopted a deferred compensation plan (the "Deferred Plan") for independent Trustees to elect to defer receipt of all or a portion of the annual compensation they are entitled to receive from the Portfolio. All deferred fees are credited to an account established in the name of the Trustees. The amounts credited to the account then increase or decrease, as the case may be, in accordance with the performance of one or more of the Janus funds that are selected by the Trustees. The account balance continues to fluctuate in accordance with the performance of the selected fund or funds until final payment of all amounts credited to the account. The fluctuation of the account balance is recorded by the Portfolio as unrealized appreciation/(depreciation) and is shown as of December 31, 2007 on the Statement of Assets and Liabilities as an asset, "Noninterested Trustees' deferred compensation," and a liability, "Noninterest ed Trustees' deferred compensation fees." Additionally, the recorded unrealized appreciation/(depreciation) is included in "Unrealized net appreciation/(depreciation) of investments, foreign currency translations and non-interested Trustees' deferred compensation" on the Statement of Assets and Liabilities. Deferred compensation expenses for the fiscal year ended December 31, 2007 are included in "Non-interested Trustees' fees and expenses" on the Statement of Operations. Trustees are allowed to change their designation of mutual funds from time to time. Amounts will be deferred until distributed in accordance with the Deferred Plan. No deferred fees were paid to any Trustee under the Deferred Plan during the fiscal year ended December 31, 2007.
For the fiscal year ended December 31, 2007, Janus Capital assumed $24,421 of legal, consulting and Trustee costs and fees incurred by the funds in Janus Investment Fund, Janus Aspen Series and Janus Adviser Series (the "Funds") in connection with the regulatory and civil litigation matters discussed in Note 7. These non-recurring costs were allocated to all Funds based on the Funds' respective net assets as of July 31, 2004. Additionally, all future non-recurring costs will be allocated to the Funds based on the Funds' respective net assets on July 31, 2004. These "Non-recurring costs" and "Costs assumed by Janus Capital" are shown on the Statement of Operations.
During the fiscal year ended December 31, 2007, Janus Capital reimbursed the Portfolio $13,711 for Institutional Shares and $1,578 for Service Shares, as a result of dilutions caused by certain trading and/or pricing errors. Reimbursements are included in "Payment from affiliate" on the Statements of Changes in Net Assets.
Janus Distributors LLC, a wholly-owned subsidiary of Janus Capital, is a distributor of the Portfolio. Service Shares have adopted a Distribution and Shareholder Servicing Plan (the "Plan") pursuant to Rule 12b-1 under the 1940 Act. The Plan authorizes payments by the Portfolio in connection with the distribution of Service Shares at an annual rate of up to 0.25% of Service Share's average daily net assets.
The Portfolio's expenses may be reduced by expense offsets from an unaffiliated custodian and/or transfer agent. Such credits or offsets are included in "Expense and Fee Offset" on the Statement of Operations. The transfer agent fee offsets received during the period reduce Transfer Agent Fees and Expenses. Custodian offsets received reduce Custodian Fees. The Portfolio could have employed the assets used by the custodian and/or transfer agent to produce income if it had not entered into an expense offset arrangement.
The Portfolio may invest in money market funds, including funds managed by Janus Capital. During the fiscal year ended December 31, 2007, the Portfolio recorded distributions from affiliated investment companies as affiliated dividend income, and had the following affiliated purchases and sales:
| Purchases Shares/Cost | Sales Shares/Cost | Dividend Income | Value at 12/31/07 | ||||||||||||||||
| Janus Aspen Flexible Bond Portfolio | |||||||||||||||||||
| Janus Institutional Cash Management Fund – Institutional Shares | $ | 52,912,037 | $ | 42,352,815 | $ | 249,188 | $ | 10,559,222 | |||||||||||
| Janus Institutional Cash Reserves Fund | 9,389,098 | 11,022,125 | 16,367 | – | |||||||||||||||
| Janus Institutional Money Market Fund – Institutional Shares | 162,593,228 | 161,288,228 | 196,787 | 1,305,000 | |||||||||||||||
| Janus Money Market Fund – Institutional Shares | 16,617,996 | 23,282,996 | 21,258 | – | |||||||||||||||
| $ | 241,512,359 | $ | 237,946,164 | $ | 483,600 | $ | 11,864,222 | ||||||||||||
20 Janus Aspen Series December 31, 2007
3. FEDERAL INCOME TAX
The tax components of capital shown in the table below represent: (1) distribution requirements the Portfolio must satisfy under the income tax regulations; (2) losses or deductions the Portfolio may be able to offset against income and gains realized in future years; and (3) unrealized appreciation or depreciation of investments for federal income tax purposes (reduced by foreign tax liability).
Other book to tax differences in the current year may consist of deferred compensation, derivatives, and foreign currency contract adjustments. The Portfolio has elected to treat gains and losses on forward foreign currency contracts as capital gains and losses. Other foreign currency gains and losses on debt instruments are treated as ordinary income for federal income tax purposes pursuant to Section 988 of the Internal Revenue Code.
Accumulated capital losses noted below represent net capital loss carryovers, as of December 31, 2007, that may be available to offset future realized capital gains and thereby reduce future taxable gains distributions.
| Portfolio | Undistributed Ordinary Income | Undistributed Long-Term Gains | Accumulated Capital Losses | Post-October Deferral | Other Book to Tax Differences | Net Tax Appreciation/ (Depreciation) | |||||||||||||||||||||
| Janus Aspen Flexible Bond Portfolio | $ | 687,508 | $ | – | $ | (5,699,733 | ) | $ | – | $ | 27,915 | $ | 7,501,658 | ||||||||||||||
The table below shows the expiration date of the carryovers.
| Capital Loss Carryover Expiration Schedule For the year ended December 31, 2007 | |||||||||||||||
| Portfolio | December 31 2014 | December 31 2015 | Accumulated Capital Losses | ||||||||||||
| Janus Aspen Flexible Bond Portfolio | $ | (4,575,184 | ) | $ | (1,124,549 | ) | $ | (5,699,733 | ) | ||||||
The aggregate cost of investments and the composition of unrealized appreciation and depreciation of investment securities for federal income tax purposes as of December 31, 2007 are noted below.
Unrealized appreciation and unrealized depreciation in the table below exclude appreciation/depreciation on foreign currency translations. The primary difference between book and tax appreciation or depreciation of investments is wash sale loss deferrals.
| Portfolio | Federal Tax Cost | Unrealized Appreciation | Unrealized (Depreciation) | ||||||||||||
| Janus Aspen Flexible Bond Portfolio | $ | 382,365,388 | $ | 9,020,857 | $ | (1,519,199 | ) | ||||||||
Income and capital gains distributions are determined in accordance with income tax regulations that may differ from accounting principles generally accepted in the United States of America. These differences are due to differing treatments for items such as net short-term gains, deferral of wash sale losses, foreign currency transactions, net investment losses and capital loss carryovers. Certain permanent differences such as tax returns of capital and net investment losses noted below have been reclassified to paid-in capital.
| For the fiscal year ended December 31, 2007 | Distributions | ||||||||||||||||||
| Portfolio | From Ordinary Income | From Long-Term Capital Gains | Tax Return of Capital | Net Investment Loss | |||||||||||||||
| Janus Aspen Flexible Bond Portfolio | $ | 15,244,930 | $ | – | $ | – | $ | – | |||||||||||
| For the fiscal year ended December 31, 2006 | Distributions | ||||||||||||||||||
| Portfolio | From Ordinary Income | From Long-Term Capital Gains | Tax Return of Capital | Net Investment Loss | |||||||||||||||
| Janus Aspen Flexible Bond Portfolio | $ | 14,133,909 | $ | 617,929 | $ | – | $ | – | |||||||||||
Janus Aspen Series December 31, 2007 21
Notes to Financial Statements (continued)
4. EXPENSE RATIOS
The expense ratios listed in the Financial Highlights reflect expenses prior to any expense offsets (gross expense ratio) and after expense offsets (net expense ratio). Both expense ratios reflect expenses after waivers (reimbursement). Listed below are the gross expense ratios for the Portfolio that would have been in effect, absent the waiver of certain fees and offsets.
| For each fiscal year ended December 31 | Institutional Shares | Service Shares | |||||||||||||||||||||||||||||||||||||||||
| Portfolio | 2007(1) | 2006(1) | 2005(1) | 2004(1) | 2003 | 2007(1) | 2006(1) | 2005(1) | 2004(1) | 2003 | |||||||||||||||||||||||||||||||||
| Janus Aspen Flexible Bond Portfolio | 0.61 | % | 0.64 | % | 0.57 | % | 0.59 | % | 0.64 | % | 0.86 | % | 0.89 | % | 0.83 | % | 0.84 | % | 0.89 | % | |||||||||||||||||||||||
(1) The effect of non-recurring costs assumed by Janus Capital (Note 2) is included in the ratio of operating expenses to average net assets without waivers and/or expense reimbursements and was less than 0.01%.
5. CAPITAL SHARE TRANSACTIONS
| For each fiscal year ended December 31 | Janus Aspen Flexible Bond Portfolio | ||||||||||
| (all numbers in thousands) | 2007 | 2006 | |||||||||
| Transactions in Portfolio Shares – Institutional Shares | |||||||||||
| Shares sold | 6,910 | 3,266 | |||||||||
| Reinvested dividends and distributions | 1,260 | 1,216 | |||||||||
| Shares repurchased | (5,719 | ) | (5,450 | ) | |||||||
| Net Increase/(Decrease) in Portfolio Shares | 2,451 | (968 | ) | ||||||||
| Shares Outstanding, Beginning of Period | 23,538 | 24,506 | |||||||||
| Shares Outstanding, End of Period | 25,989 | 23,538 | |||||||||
| Transactions in Portfolio Shares – Service Shares | |||||||||||
| Shares sold | 1,311 | 504 | |||||||||
| Reinvested dividends and distributions | 94 | 110 | |||||||||
| Shares repurchased | (1,884 | ) | (1,048 | ) | |||||||
| Net Increase/(Decrease) in Portfolio Shares | (479 | ) | (434 | ) | |||||||
| Shares Outstanding, Beginning of Period | 2,329 | 2,763 | |||||||||
| Shares Outstanding, End of Period | 1,850 | 2,329 | |||||||||
6. PURCHASES AND SALES OF INVESTMENT SECURITIES
For the fiscal year ended December 31, 2007, the aggregate cost of purchases and proceeds from sales of investment securities (excluding short-term securities and mortgage dollar roll transactions) were as follows:
| Portfolio | Purchases of Securities | Proceeds from Sales of Securities | Purchases of Long- Term U.S. Government Obligations | Proceeds from Sales of Long-Term U.S. Government Obligations | |||||||||||||||
| Janus Aspen Flexible Bond Portfolio | $ | 112,524,282 | $ | 128,476,262 | $ | 318,101,672 | $ | 278,076,261 | |||||||||||
7. PENDING LEGAL MATTERS
In the fall of 2003, the Securities and Exchange Commission ("SEC"), the Office of the New York State Attorney General ("NYAG"), the Colorado Attorney General ("COAG"), and the Colorado Division of Securities ("CDS") announced that they were investigating alleged frequent trading practices in the mutual fund industry. On August 18, 2004, Janus Capital announced that it had reached final settlements with the SEC, the NYAG, the COAG, and the CDS related to such regulators' investigations into Janus Capital's frequent trading arrangements.
A number of civil lawsuits were brought against Janus Capital and certain of its affiliates, the Janus funds, and related entities and individuals based on allegations similar to those announced by the above regulators and were filed in several state and federal jurisdictions. Such lawsuits alleged a variety of theories for recovery including, but not limited to, the federal securities laws, other federal statutes (including ERISA), and various common law doctrines. The Judicial Panel on Multidistrict Litigation transferred these actions to the U.S. District Court for the District of Maryland (the "Court") for coordinated proceedings. On September 29, 2004, five consolidated amended complaints were filed with the Court that generally include: (i) claims by a putative class of investors in certain Janus funds asserting claims on behalf of the investor class (Marini, et al. v. Janus Investment Fund, et al., U.S. District Court, District of Maryland, Case No. 04-CV-00497); (ii) derivative claims by investors in certain Janus
22 Janus Aspen Series December 31, 2007
funds ostensibly on behalf of such funds (Steinberg et al. v. Janus Capital Management, LLC et al., U.S. District Court, District of Maryland, Case No. 04-CV-00518); (iii) claims on behalf of participants in the Janus 401(k) plan (Wangberger v. Janus Capital Group Inc., 401(k) Advisory Committee, et al., U.S. District Court, District of Maryland, Case No. JFM-05-2711); (iv) claims brought on behalf of shareholders of Janus Capital Group Inc. ("JCGI") on a derivative basis against the Board of Directors of JCGI (Chasen v. Whiston, et al., U.S. District Court, District of Maryland, Case No. 04-MD-00855); and (v) claims by a putative class of shareholders of JCGI asserting claims on behalf of the shareholders (Wiggins, et al. v. Janus Capital Group, Inc., et al., U.S. District Court, District of Maryland, Case No. 04-CV-00818). Each of the five complaints initially named JCGI and/or Janus Capital as a defendant. In a ddition, the following were also named as defendants in one or more of the actions: Janus Investment Fund ("JIF"), Janus Aspen Series ("JAS"), Janus Adviser Series ("JAD"), Janus Distributors LLC, Enhanced Investment Technologies, LLC ("INTECH"), Bay Isle Financial LLC ("Bay Isle"), Perkins, Wolf, McDonnell and Company, LLC ("Perkins"), the Advisory Committee of the Janus 401(k) plan, and the current or former directors of JCGI.
On August 25, 2005, the Court entered orders dismissing most of the claims asserted against Janus Capital and its affiliates by fund investors in the Marini and Steinberg cases (actions (i) and (ii) above) except certain claims under Section 10(b) of the Securities Exchange Act of 1934 and under Section 36(b) of the Investment Company Act of 1940, as amended (the "1940 Act"). On August 15, 2006, the Wangberger complaint in the 401(k) plan class action (action (iii) above) was dismissed by the district court with prejudice. The plaintiff appealed that dismissal decision to the United States Court of Appeals for the Fourth Circuit. The appeal is still pending and argument in the matter was held in December 2007. The Court also dismissed the Chasen lawsuit (action (iv) above) against JCGI's Board of Directors without leave to amend. Finally, a Mo tion to Dismiss the Wiggins suit (action (v) above) was granted and the matter was dismissed in May 2007. However, in June 2007, Plaintiffs appealed that dismissal to the United States Court of Appeals for the Fourth Circuit. That appeal is currently pending.
In addition to the lawsuits described above, the Auditor of the State of West Virginia ("Auditor"), in his capacity as securities commissioner, has initiated administrative proceedings against many of the defendants in the market timing cases (including JCGI and Janus Capital) and, as a part of its relief, is seeking disgorgement and other monetary relief based on similar market timing allegations (In the Matter of Janus Capital Group Inc. et al., Before the Securities Commissioner, State of West Virginia, Summary Order No. 05-1320). The respondents in these proceedings collectively sought a Writ of Prohibition in state court, which was denied. Their subsequent Petition for Appeal was also denied. Consequently, in September 2006, JCGI and Janus Capital filed their answer to the Auditor's summary order instituting proceedings and requested a hearing. A status conference was held on June 28, 2007, during which the parties were ordered t o submit their proposed scheduling order. To date, no scheduling order has been entered in the case. In addition to the pending Motion to Discharge Order to Show Cause, JCGI and Janus Capital, as well as other similarly situated defendants, continue to challenge the statutory authority of the Auditor to bring such an action.
Additional lawsuits may be filed against certain of the Janus funds, Janus Capital, and related parties in the future. Janus Capital does not currently believe that these pending actions will materially affect its ability to continue providing services it has agreed to provide to the Janus funds.
Janus Aspen Series December 31, 2007 23
Report of Independent Registered Public Accounting Firm
To the Trustees and Shareholders
of Janus Aspen Flexible Bond Portfolio
In our opinion, the accompanying statement of assets and liabilities, including the schedule of investments, and the related statements of operations and of changes in net assets and the financial highlights present fairly, in all material respects, the financial position of Janus Aspen Flexible Bond Portfolio (one of the portfolios constituting Janus Aspen Series, hereafter referred to as the "Portfolio") at December 31, 2007, the results of its operations for the year then ended, the changes in its net assets for each of the two years in the period then ended, and the financial highlights for each of the five years in the period then ended, in conformity with accounting principles generally accepted in the United States of America. These financial statements and financial highlights (hereafter referred to as "financial statements") are the responsibility of the Portfolio's management; our responsibility is to express an opinion on these fi nancial statements based on our audits. We conducted our audits of these financial statements in accordance with the standards of the Public Company Accounting Oversight Board (United States). Those standards require that we plan and perform the audit to obtain reasonable assurance about whether the financial statements are free of material misstatement. An audit includes examining, on a test basis, evidence supporting the amounts and disclosures in the financial statements, assessing the accounting principles used and significant estimates made by management, and evaluating the overall financial statement presentation. We believe that our audits, which included confirmation of securities at December 31, 2007 by correspondence with the custodian, transfer agent and brokers, and the application of alternative auditing procedures where securities purchased had not been received, provide a reasonable basis for our opinion.

Denver, Colorado
February 15, 2008
24 Janus Aspen Series December 31, 2007
Additional Information (unaudited)
PROXY VOTING POLICIES AND VOTING RECORD
A description of the policies and procedures that the Portfolio uses to determine how to vote proxies relating to its portfolio securities is available: (i) without charge, upon request, by calling 1-800-525-0020 (toll free); (ii) on the Portfolio's website at www.janus.com/proxyvoting; and (iii) on the SEC's website at http://www.sec.gov. Additionally, information regarding the Portfolio's proxy voting record for the most recent twelve- month period ended June 30 is also available, free of charge, through www.janus.com/proxyvoting and from the SEC's website at http://www.sec.gov.
QUARTERLY PORTFOLIO HOLDINGS
The Portfolio files its complete portfolio holdings (schedule of investments) with the SEC for the first and third quarters of each fiscal year on Form N-Q within 60 days of the end of such fiscal quarter. The Portfolio's Form N-Q (i) is available on the SEC's website at http://www.sec.gov; (ii) may be reviewed and copied at the SEC's Public Reference Room in Washington, D.C. (information on the Public Reference Room may be obtained by calling 1-800-SEC-0330); and (iii) is available without charge, upon request, by calling Janus at 1-800-525-0020 (toll free).
APPROVAL OF ADVISORY AGREEMENTS DURING THE PERIOD
The Trustees of Janus Aspen Series, none of whom has ever been affiliated with Janus Capital ("Independent Trustees"), oversee the management of each Portfolio and, as required by law, determine annually whether to continue the investment advisory agreement for each Portfolio and the subadvisory agreements for the three Portfolios that utilize subadvisers.
In connection with their most recent consideration of those agreements for each Portfolio, the Trustees received and reviewed a substantial amount of information provided by Janus Capital and the respective subadvisers in response to requests of the Independent Trustees and their independent legal counsel. They also received and reviewed a considerable amount of information and analysis provided by their independent fee consultant. Throughout their consideration of the agreements, the Independent Trustees were advised by their independent legal counsel. The Independent Trustees met with management to consider the agreements, and also met separately in executive session with their independent legal counsel and their independent fee consultant.
At a meeting held on December 14, 2007, based on their evaluation of the information provided by Janus Capital, the subadvisers and the independent fee consultant, as well as other information, the Trustees determined that the overall arrangements between each Portfolio and Janus Capital and each subadviser, as applicable, were fair and reasonable in light of the nature, extent and quality of the services provided by Janus Capital, its affiliates and the subadvisers, the fees charged for those services, and other matters that the Trustees considered relevant in the exercise of their business judgment. At that meeting the Trustees unanimously approved the continuation of the investment advisory agreement for each Portfolio, and the subadvisory agreement for each subadvised Portfolio, for the period from February 1, 2008 through February 1, 2009, subject to earlier termina tion as provided for in each agreement.
In considering the continuation of those agreements, the Trustees reviewed and analyzed various factors that they determined were relevant, including the factors described below, none of which by itself was considered dispositive. However, the material factors and conclusions that formed the basis for the Trustees' determination to approve the continuation of the agreements are discussed separately below.
Nature, Extent and Quality of Services
The Trustees reviewed the nature, extent and quality of the services provided by Janus Capital and the subadvisers to the Portfolios, taking into account the investment objective and strategy of each Portfolio, the knowledge of the Trustees gained from their regular meetings with management on at least a quarterly basis, and their ongoing review of information related to the Portfolios. In addition, the Trustees reviewed the resources and key personnel of Janus Capital and each subadviser, especially those who provide investment management services to the Portfolios. The Trustees also considered other services provided to the Portfolios by Janus Capital or the subadvisers, such as managing the execution of portfolio transactions and the selection of broker-dealers for those transactions, serving as the Portfolios' administrator, monitoring adherence to the Portfolios' investment restrictions, producing shareholder reports, providing support services for the Trustees and Trustee committees, communicating with shareholders, and overseeing the activities of other service providers, including monitoring compliance with various policies and procedures of the Portfolios and with applicable securities laws and regulations.
The Trustees concluded that the nature, extent and quality of the services provided by Janus Capital and/or the subadviser to each Portfolio were appropriate and consistent with the terms of the respective advisory and subadvisory agreements; that, taking into account steps taken to address those Portfolios whose performance lagged that of the median of their peers for certain periods, the quality of those services had been consistent with or superior to quality norms in the industry; and that the Portfolios were likely to benefit from the continued provision of those services. They also concluded that Janus Capital and each subadviser had sufficient personnel, with the appropriate education and experience, to
Janus Aspen Series December 31, 2007 25
Additional Information (unaudited) (continued)
serve the Portfolios effectively and had demonstrated its continuing ability to attract well-qualified personnel.
Performance of the Portfolios
The Trustees considered the investment results of each Portfolio over various time periods. They reviewed information comparing each Portfolio's performance with the performance of comparable funds and peer groups identified by Lipper Inc., an independent provider of investment company data, and with the Portfolio's benchmark index. They concluded that the performance of many Portfolios was good to very good under current market conditions. Although the performance of some Portfolios lagged that of the median of their peers for certain periods, the Trustees also concluded that Janus Capital had taken appropriate steps to address those instances of under-performance and that the more recent performance of most of those Portfolios had been improving.
Costs of Services Provided
The Trustees examined information on the fees and expenses of each Portfolio in comparison to similar information for comparable funds as provided by Lipper. They also reviewed an analysis of that information provided by their independent fee consultant and noted that the rate of management (investment advisory and administrative) fees for most of the Portfolios, in some cases after contractual expense limitations, was below the mean management fee rate of the respective peer group of funds selected by Lipper.
The Trustees considered the methodology used by Janus Capital and each subadviser in determining compensation payable to portfolio managers, the competitive environment for investment management talent and the competitive market for mutual funds in different distribution channels. They concluded that the compensation methodology provided a good alignment of the interests of the portfolio managers with those of Portfolio shareholders.
The Trustees also reviewed management fees charged by Janus Capital to its separate account clients and to its subadvised funds (for which Janus Capital provides only services related to portfolio management). Although in most instances subadvisory and separate account fee rates for various investment strategies were lower than management fee rates for Portfolios having a similar strategy, the Trustees noted that, under the terms of the management agreements with the Portfolios, Janus Capital performs significant additional services for the Portfolios that it does not provide to those other clients, including administrative services, oversight of the Portfolios' other service providers, Trustee support, regulatory compliance and numerous other services, and that, in serving the Portfolios, Janus Capital assumes many legal risks that it does not assume in servicing its ot her clients. Moreover, the Trustees noted that the spread between the average fee rates charged to the Portfolios and the fee rates that Janus Capital charged to its separate account clients was significantly smaller than the average spread for such fee rates of other advisers, based on publicly available data and research conducted by their independent fee consultant.
The Trustees reviewed information on the profitability to Janus Capital and its affiliates of their relationships with each Portfolio, as well as an explanation of the methodology used in allocating various expenses of Janus Capital and its affiliates among the Portfolios and other clients. They also reviewed the financial statements of Janus Capital's parent company and its corporate structure. In their review, the Trustees considered whether Janus Capital and each subadviser receives adequate incentives to manage the Portfolios effectively. They recognized that profitability comparisons among investment advisers are difficult because very little comparative information is publicly available and profitability of any adviser is affected by numerous factors, including the organizational structure of the particular adviser, the types of funds and other accounts it manages, possible other lines of business, the methodology for allocating expens es, and the adviser's capital structure and cost of capital. However, based on the information available and taking those factors into account, the Trustees concluded that Janus Capital's profitability with respect to each Portfolio in relation to the services rendered was not unreasonable.
The Trustees concluded that the management fees and other compensation payable by each Portfolio to Janus Capital and its affiliates, as well as the fees payable by Janus Capital or the Portfolios to the subadvisers of subadvised Portfolios, were reasonable in relation to the nature, extent and quality of the services provided, taking into account the fees charged by other advisers for managing comparable mutual funds with similar strategies and the fees Janus Capital and the subadvisers charge to other clients. They also concluded that the overall expense ratio of each Portfolio was reasonable, taking into account the size of the Portfolio, the quality of services provided by Janus Capital and any subadviser, the investment performance of the Portfolio and any expense limitations agreed to by Janus Capital.
Economies of Scale
The Trustees considered information about the potential for Janus Capital to realize economies of scale as the assets of the Portfolios increase. They noted that, although most Portfolios pay advisory fees at a fixed rate as a percentage of net assets, without any breakpoints, the management fee rate paid by each Portfolio, after any contractual expense limitations, was below the mean management fee rate of the Portfolio's peer
26 Janus Aspen Series December 31, 2007
group selected by Lipper; and, for those Portfolios whose expenses are being reduced by the contractual expense limitations of Janus Capital, Janus Capital is subsidizing the Portfolios because they have not reached adequate scale. Moreover, as the assets of many of the Portfolios declined in the past few years, those Portfolios benefited from having advisory fee rates that remained constant rather than increasing as assets declined. In addition, performance fee structures have been implemented for several Portfolios that will cause the effective rate of advisory fees payable by such a Portfolio to vary depending on the investment performance of the Portfolio relative to its benchmark index over the measurement period; and a few Portfolios have fee schedules with breakpoints and reduced fee rates above certain asset levels. The Trustees also noted that the Portfolios share directly in economies of scale through lower charges of third-party s ervice providers, based on the combined scale of all of the Portfolios. Based on all of the information they reviewed, the Trustees concluded that the current fee structure of each Portfolio was reasonable and that the current rates of fees do reflect a sharing between Janus Capital and the Portfolio of economies of scale at the current asset level of the Portfolio.
Other Benefits to Janus Capital
The Trustees also considered benefits that accrue to Janus Capital and its affiliates from their relationships with the Portfolios. They recognized that two affiliates of Janus Capital separately serve the Portfolios as transfer agent and distributor, respectively. They also considered Janus Capital's past and proposed use of commissions paid by Portfolios on their portfolio brokerage transactions to obtain proprietary and third-party research products and services benefiting those Portfolios and/or other clients of Janus Capital. The Trustees concluded that Janus Capital's use of "soft" commission dollars of a Portfolio to obtain proprietary and third-party research products and services was consistent with regulatory requirements and guidelines and was likely to benefit the Portfolios. The Trustees also concluded that, other than the services provided by Janus Capital and its affiliates pursuant to the agreements and the fees to be paid by each Portfolio therefor, the Portfolios and Janus Capital may potentially benefit from their relationship with each other in other ways. They concluded that Janus Capital benefits from the receipt of proprietary research products and services acquired through commissions paid on portfolio transactions of the Portfolios and that the Portfolios benefit from Janus Capital's receipt of those products and services, as well as research products and services acquired through commissions paid by other clients of Janus Capital. They further concluded that success of any Portfolio could attract other business to Janus Capital or other Janus funds and that the success of Janus Capital could enhance Janus Capital's ability to serve the Portfolios.
After full consideration of the above factors, as well as other factors, all of the Trustees, all of whom are Independent Trustees, concluded that the proposed continuation of the investment advisory agreement for each Portfolio, and the subadvisory agreement for each subadvised Portfolio, was in the best interest of the respective Portfolios and their shareholders.
Janus Aspen Series December 31, 2007 27
Explanations of Charts, Tables and Financial Statements (unaudited)
1. PERFORMANCE OVERVIEWS
The performance overview graph compares the performance of a hypothetical $10,000 investment in the Portfolio with one or more widely used market indices. The hypothetical example does not represent the returns of any particular investment.
When comparing the performance of the Portfolio with an index, keep in mind that market indices do not include brokerage commissions that would be incurred if you purchased the individual securities in the index. They also do not include taxes payable on dividends and interest or operating expenses incurred if you maintained a Portfolio invested in the index.
Average annual total returns are quoted for each class of the Portfolio. Average annual total return is calculated by taking the growth or decline in value of an investment over a period of time, including reinvestment of any dividends, distributions and capital gains, then calculating the annual compounded percentage rate that would have produced the same result had the rate of growth been constant throughout the period. Average annual total return does not reflect the deduction of taxes that a shareholder would pay on Portfolio distributions or redemptions of Portfolio shares.
Pursuant to federal securities rules, expense ratios shown in the performance chart reflect subsidized and unsubsidized ratios for the past fiscal year. The total annual portfolio operating expenses ratio is gross of any fee waivers, reflecting a Portfolio's unsubsidized expense ratio. The net annual portfolio operating expenses ratio (if applicable) includes contractual waivers of Janus Capital and/or Janus Services and reflects a Portfolio's subsidized expense ratio. Both the total annual portfolio operating expenses ratio and net annual portfolio operating expenses ratio are based on average net assets as of the fiscal year ended December 31, 2006. The ratios also include expenses indirectly incurred by the Portfolio as a result of investing in other investment companies or pooled investments, which are not reflected in the "Financial Highlights" of this report. As a result, these ratios may be higher or lower than those shown in the "Fin ancial Highlights" in this report. All expenses are shown without the effect of expense offset arrangements. Pursuant to such arrangements, credits realized as a result of uninvested cash balances are used to reduce custodian and transfer agent expenses.
2. SCHEDULE OF INVESTMENTS
Following the performance overview section is the Portfolio's Schedule of Investments. This schedule reports the industry concentrations and types of securities held in the Portfolio on the last day of the reporting period. Securities are usually listed by type (common stock, corporate debt, U.S. Government obligations, etc.) and by industry classification (banking, communications, insurance, etc.). Holdings are subject to change without notice.
The value of each security is quoted as of the last day of the reporting period. The value of securities denominated in foreign currencies is converted into U.S. dollars. Certain short-term investments maturing within 60 days are valued at amortized cost, which approximates market value.
A summary of investments by country is provided if the Portfolio invested in foreign securities. This summary reports the Portfolio's exposure to different countries by providing the percentage of securities invested in each country. The country of each security represents the country in which the company
is incorporated.
2A. FORWARD CURRENCY CONTRACTS
A table listing forward currency contracts follows the Portfolio's Schedule of Investments (if applicable). Forward currency contracts are agreements to deliver or receive a preset amount of currency at a future date. Forward currency contracts are used to hedge against foreign currency risk in the Portfolio's long-term holdings.
The table provides the name of the foreign currency, the settlement date of the contract, the amount of the contract, the value of the currency in U.S. dollars and the amount of unrealized gain or loss. The amount of unrealized gain or loss reflects the change in currency exchange rates from the time the contract was opened to the last day of the reporting period.
2B. FUTURES
A table listing futures contracts follows the Portfolio's Schedule of Investments (if applicable). Futures contracts are contracts that obligate the buyer to receive and the seller to deliver an instrument or money at a specified price on a specified date. Futures are used to hedge against adverse movements in securities prices, currency risk or interest rates.
The table provides the name of the contract, number of contracts held, the expiration date, the principal amount, value and the amount of unrealized gain or loss. The amount of unrealized gain or loss reflects the marked-to-market amount for the last day of the reporting period.
3. STATEMENT OF ASSETS AND LIABILITIES
This statement is often referred to as the "balance sheet." It lists the assets and liabilities of the Portfolio on the last day of the reporting period.
28 Janus Aspen Series December 31, 2007
The Portfolio's assets are calculated by adding the value of the securities owned, the receivable for securities sold but not yet settled, the receivable for dividends declared but not yet received on stocks owned and the receivable for Portfolio shares sold to investors but not yet settled. The Portfolio's liabilities include payables for securities purchased but not yet settled, Portfolio shares redeemed but not yet paid and expenses owed but not yet paid. Additionally, there may be other assets and liabilities such as unrealized gain or loss on forward currency contracts.
The section entitled "Net Assets Consist of" breaks down the components of the Portfolio's net assets. Because the Portfolio must distribute substantially all earnings, you will notice that a significant portion of net assets is shareholder capital.
The last section of this statement reports the net asset value ("NAV") per share on the last day of the reporting period for each class of the Portfolio. The NAV is calculated by dividing the Portfolio's net assets (assets minus liabilities) by the number of shares outstanding.
4. STATEMENT OF OPERATIONS
This statement details the Portfolio's income, expenses, gains and losses on securities and currency transactions, and appreciation or depreciation of current Portfolio holdings.
The first section in this statement, entitled "Investment Income," reports the dividends earned from stocks and interest earned from interest-bearing securities in the Portfolio.
The next section reports the expenses and expense offsets incurred by the Portfolio, including the advisory fee paid to the investment adviser, transfer agent fees and expenses, printing and postage for mailing statements, financial reports and prospectuses, and other expenses. Expense offsets, if any, are also shown.
The last section lists the increase or decrease in the value of securities held in the Portfolio. The Portfolio realizes a gain (or loss) when it sells its position in a particular security. An unrealized gain (or loss) refers to the change in net appreciation or depreciation of the Portfolio during the reporting period. "Net Realized and Unrealized Gain/(Loss) on Investments" is affected both by changes in the market value of Portfolio holdings and by gains (or losses) realized during the reporting period.
5. STATEMENT OF CHANGES IN NET ASSETS
This statement reports the increase or decrease in the Portfolio's net assets during the reporting period. Changes in the Portfolio's net assets are attributable to investment operations, dividends, distributions and capital share transactions. This is important to investors because it shows exactly what caused the Portfolio's net asset size to change during the period.
The first section summarizes the information from the Statement of Operations regarding changes in net assets due to the Portfolio's investment performance. The Portfolio's net assets may also change as a result of dividend and capital gains distributions to investors. If investors receive their dividends in cash, money is taken out of the Portfolio to pay the distribution. If investors reinvest their dividends, the Portfolio's net assets will not be affected. If you compare the Portfolio's "Net Decrease from Dividends and Distributions" to the "Reinvested dividends and distributions," you will notice that dividend distributions had little effect on the Portfolio's net assets. This is because the majority of Janus investors reinvest their distributions.
The reinvestment of dividends is included under "Capital Share Transactions." "Capital Shares" refers to the money investors contribute to the Portfolio through purchases or withdraw via redemptions. The Portfolio's net assets will increase and decrease in value as investors purchase and redeem shares from the Portfolio.
6. FINANCIAL HIGHLIGHTS
This schedule provides a per-share breakdown of the components that affect the Portfolio's NAV for current and past reporting periods for each class of the Portfolio. Not only does this table provide you with total return, it also reports total distributions, asset size, expense ratios and portfolio turnover rate.
The first line in the table reflects the NAV per share at the beginning of the reporting period. The next line reports the net investment income per share, which comprises dividends and interest income earned on securities held by the Portfolio. Following is the total of gains/(losses), realized and unrealized. Dividends and distributions are then subtracted to arrive at the NAV per share at the end of the period. The next line reflects the average annual total return reported the last day of the period.
Also included are the expense ratios, or the percentage of average net assets that were used to cover operating expenses during the period. Expense ratios vary for a number of reasons, including the differences in management fees, the average shareholder account size and the extent of foreign investments, which entail greater transaction costs.
The Portfolio's expenses may be reduced through expense reduction arrangements. These arrangements may include the use of brokerage commissions, balance credits or transfer agent
Janus Aspen Series December 31, 2007 29
Explanations of Charts, Tables and Financial Statements (unaudited) (continued)
fee offsets. The Statement of Operations reflects total expenses before any such offset, the amount of the offset and the net expenses. The expense ratios listed in the Financial Highlights reflect total expenses prior to any expense offsets (gross expense ratio) and after the expense offsets (net expense ratio). Both expense ratios reflect expenses after waivers (reimbursements), if applicable.
The ratio of net investment income/(loss) summarizes the income earned less expenses, divided by the average net assets of the Portfolio during the reporting period. Don't confuse this ratio with the Portfolio's yield. The net investment income ratio is not a true measure of the Portfolio's yield because it doesn't take into account the dividends distributed to the Portfolio's investors.
The next figure is the portfolio turnover rate, which measures the buying and selling activity in the Portfolio. Portfolio turnover is affected by market conditions, changes in the asset size of the Portfolio, the nature of the Portfolio's investments and the investment style of the portfolio manager. A 100% rate implies that an amount equal to the value of the entire portfolio is turned over in a year; a 50% rate means that an amount equal to the value of half the portfolio is traded in a year; and a 200% rate means that an amount equal to the value of the portfolio is traded every six months.
30 Janus Aspen Series December 31, 2007
Trustees and Officers (unaudited)
The Portfolio's Statement of Additional Information includes additional information about the Trustees and officers and is available, without charge, by calling 1-800-525-0020.
The following are the Trustees and officers of the Trust, together with a brief description of their principal occupations during the last five years (principal occupations for certain Trustees may include periods over five years).
Each Trustee has served in that capacity since he or she was originally elected or appointed. The Trustees do not serve a specified term of office. Each Trustee will hold office until the termination of the Trust or his or her earlier death, resignation, retirement, incapacity, or removal. The retirement age for Trustees is 72. The Portfolio's Nominating and Governance Committee will consider nominees for the position of Trusteerecommended by shareholders. Shareholders may submit the name of a candidate for consideration by the Committee by submitting their recommendations to the Trust's Secretary. Each Trustee is currently a Trustee of two other registered investment companies advised by Janus Capital: Janus Investment Fund and Janus Adviser Series. As of the date of this report, collectively, these three registered investment companies consist of 75 series or funds.
The Trust's officers are elected annually by the Trustees for a one-year term. Certain officers also serve as officers of Janus Investment Fund and Janus Adviser Series. Certain officers of the Portfolio may also be officers and/or directors of Janus Capital. Portfolio officers receive no compensation from the Portfolio, except for the Portfolio's Chief Compliance Officer, as authorized by the Trustees.
Trustees
| Name, Address, and Age | Positions Held with Portfolio | Length of Time Served | Principal Occupations During the Past Five Years | Number of Portfolios/Funds in Fund Complex Overseen by Trustee | Other Directorships Held by Trustee | ||||||||||||||||||
| Dennis B. Mullen* 151 Detroit Street Denver, CO 80206 DOB: 1943 | Chairman Trustee | 3/04-12/07 9/93-Present | Chief Executive Officer of Red Robin Gourmet Burgers, Inc. (since 2005). Formerly, private investor. | 75 | ** | Chairman of the Board (since 2005) and Director of Red Robin Gourmet Burgers, Inc., and Director of Janus Capital Funds Plc (Dublin-based, non-U.S. funds). | |||||||||||||||||
| Jerome S. Contro 151 Detroit Street Denver, CO 80206 DOB: 1956 | Trustee | 12/05-Present | Partner of Tango Group, a private investment firm (since 1999). | 75 | Trustee and Chairman of RS Investment Trust (since 2001), and Director of IZZE Beverages and MyFamily.com, Inc. (genealogical research website). | ||||||||||||||||||
| William F. McCalpin 151 Detroit Street Denver, CO 80206 DOB: 1957 | Trustee | 6/02-Present | Private investor. Formerly, Executive Vice President and Chief Operating Officer of The Rockefeller Brothers Fund (a private family foundation), and Vice President of Asian Cultural Council. | 75 | Director of F.B. Heron Foundation (a private grant making foundation). | ||||||||||||||||||
* Mr. McCalpin will succeed Mr. Mullen as Chairman as of January 1, 2008.
** Mr. Mullen also serves as director of Janus Capital Funds Plc, consisting of 16 funds. Including Janus Capital Funds Plc and the 75 funds comprising the Janus funds, Mr. Mullen oversees 91 funds.
Janus Aspen Series December 31, 2007 31
Trustees and Officers (unaudited) (continued)
Trustees (cont.)
| Name, Address, and Age | Positions Held with Portfolio | Length of Time Served | Principal Occupations During the Past Five Years | Number of Portfolios/Funds in Fund Complex Overseen by Trustee | Other Directorships Held by Trustee | ||||||||||||||||||
| John W. McCarter, Jr. 151 Detroit Street Denver, CO 80206 DOB: 1938 | Trustee | 6/02-Present | President and Chief Executive Officer of The Field Museum of Natural History (Chicago, IL) (since 1997). | 75 | Chairman of the Board and Director of Divergence Inc. (biotechnology firm); Director of W.W. Grainger, Inc. (industrial distributor); and Trustee of WTTW (Chicago public television station) and the University of Chicago. | ||||||||||||||||||
| James T. Rothe 151 Detroit Street Denver, CO 80206 DOB: 1943 | Trustee | 1/97-Present | Co-founder and Managing Director of Roaring Fork Capital Management, LLC (private investment in public equity firm), and Professor Emeritus of Business of the University of Colorado, Colorado Springs, CO (since 2004). Formerly, Professor of Business of the University of Colorado (2002-2004) and Distinguished Visiting Professor of Business (2001-2002) of Thunderbird (American Graduate School of International Management), Glendale, AZ. | 75 | Director of Red Robin Gourmet Burgers, Inc. | ||||||||||||||||||
| William D. Stewart 151 Detroit Street Denver, CO 80206 DOB: 1944 | Trustee | 9/93-Present | Corporate Vice President and General Manager of MKS Instruments – HPS Products, Boulder, CO (a manufacturer of vacuum fittings and valves). | 75 | N/A | ||||||||||||||||||
| Martin H. Waldinger 151 Detroit Street Denver, CO 80206 DOB: 1938 | Trustee | 9/93-Present | Private Investor and Consultant to California Planned Unit Developments (since 1994). Formerly, CEO and President of Marwal, Inc. (homeowner association management company). | 75 | N/A | ||||||||||||||||||
| Linda S. Wolf 151 Detroit Street Denver, CO 80206 DOB: 1947 | Trustee | 12/05-Present | Retired. Formerly, Chairman and Chief Executive Officer of Leo Burnett (Worldwide) (advertising agency) (2001-2005). | 75 | Director of Wal-Mart, The Field Museum of Natural History (Chicago, IL), Children's Memorial Hospital (Chicago, IL), Chicago Council on Foreign Relations, Economic Club of Chicago, and InnerWorkings (U.S. provider of print procurement solutions). | ||||||||||||||||||
32 Janus Aspen Series December 31, 2007
Officers
| Name, Address, and Age | Positions Held with Portfolio | Term of Office* and Length of Time Served | Principal Occupations During the Past Five Years | ||||||||||||
| Gibson Smith 151 Detroit Street Denver, CO 80206 DOB: 1968 | Executive Vice President and Co-Portfolio Manager Janus Aspen Flexible Bond Portfolio | 5/07-Present | Co-Chief Investment Officer and Executive Vice President of Janus Capital; Executive Vice President of Janus Distributors LLC and Janus Services LLC; and Portfolio Manager for other Janus accounts. Formerly, Vice President (2003-2006) of Janus Capital; and Analyst (2001-2003) for Janus Capital Corporation. | ||||||||||||
| Darrell Watters 151 Detroit Street Denver, CO 80206 DOB: 1963 | Executive Vice President and Co-Portfolio Manager Janus Aspen Flexible Bond Portfolio | 5/07-Present | Vice President and Research Analyst of Janus Capital, and Portfolio Manager for other Janus accounts. | ||||||||||||
| Stephanie Grauerholz-Lofton 151 Detroit Street Denver, CO 80206 DOB: 1970 | Chief Legal Counsel and Secretary Vice President | 1/06-Present 3/06-Present | Vice President and Assistant General Counsel of Janus Capital, and Vice President and Assistant Secretary of Janus Distributors LLC. Formerly, Assistant Vice President of Janus Capital and Janus Distributors LLC (2006), and Associate of Vedder, Price, Kaufman & Kammholz, P.C. (1999-2003). | ||||||||||||
| Andrew J. Iseman 151 Detroit Street Denver, CO 80206 DOB: 1964 | President and Chief Executive Officer | 3/07-Present | Chief Operating Officer and Senior Vice President of Janus Capital Group, Inc. and Janus Capital; President of Janus Services LLC; and Director of Capital Group Partners, Inc. Formerly, Senior Vice President of Enhanced Investment Technologies, LLC (2005-2007); and Vice President of Janus Capital (2003-2005) and Janus Services LLC (2003-2004). | ||||||||||||
| David R. Kowalski 151 Detroit Street Denver, CO 80206 DOB: 1957 | Vice President, Chief Compliance Officer, and Anti-Money Laundering Officer | 6/02-Present | Senior Vice President and Chief Compliance Officer of Janus Capital, Janus Distributors LLC, and Janus Services LLC; Chief Compliance Officer of Bay Isle Financial LLC; and Vice President of Enhanced Investment Technologies, LLC. Formerly, Chief Compliance Officer of Enhanced Investment Technologies, LLC (2003-2005); Vice President of Janus Capital (2000-2005) and Janus Services LLC (2004-2005); and Assistant Vice President of Janus Services LLC (2000-2004). | ||||||||||||
| Jesper Nergaard 151 Detroit Street Denver, CO 80206 DOB: 1962 | Chief Financial Officer Vice President, Treasurer, and Principal Accounting Officer | 3/05-Present 2/05-Present | Vice President of Janus Capital. Formerly, Director of Financial Reporting for OppenheimerFunds, Inc. (2004-2005); Site Manager and First Vice President of Mellon Global Securities Services (2003); and Director of Fund Accounting, Project Development, and Training of INVESCO Funds Group (1994-2003). | ||||||||||||
*Officers are elected at least annually by the Trustees for a one-year term and may also be elected from time to time by the Trustees for an interim period.
Janus Aspen Series December 31, 2007 33
Janus provides access to a wide range of investment disciplines.
Growth
Janus growth portfolios focus on companies believed to be the leaders in their respective industries, with solid management teams, expanding market share, margins and efficiencies.
Core
Janus core portfolios seek investments in more stable and predictable companies. These portfolios look for a strategic combination of steady growth and for certain portfolios, some degree of income.
Risk-Managed
Our risk-managed portfolios seek to outperform their respective indices while maintaining a risk profile equal to or lower than the index itself. Managed by INTECH (a Janus subsidiary), these portfolios use a mathematical process in an attempt to build a more "efficient" portfolio than the index.
Value
Janus value portfolios invest in companies they believe are poised for a turnaround or are trading at a significant discount to fair value. The goal is to gain unique insight into a company's true value and identify and evaluate potential catalysts that may unlock shareholder value.
International & Global
Janus international and global portfolios seek to leverage Janus' research capabilities by taking advantage of inefficiencies in foreign markets, where accurate information and analytical insight are often at a premium.
Bond
Janus bond portfolios attempt to provide less risk relative to equities while seeking to deliver a competitive total return through high current income and appreciation.
Money Market
Janus money market portfolios seek maximum current income consistent with stability of capital.
For more information about our funds, contact your investment professional or go to www.janus.com/info
Please consider the charges, risks, expenses and investment objectives carefully before investing. For a prospectus containing this and other information, please call Janus at 1-800-525-0020 or download the file from www.janus.com/info. Read it carefully before you invest or send money.
An investment in a money market portfolio is not insured or guaranteed by the Federal Deposit Insurance Corporation or any other government agency. Although the Portfolio seeks to preserve the value of your investment at $1.00 per share, it is possible to lose money by investing in the Portfolio.

151 Detroit Street
Denver, CO 80206
1-800-525-0020
Portfolio distributed by Janus Distributors LLC (2/08)
C-0108-357 109-02-705 02-08
2007 Annual Report
Janus Aspen Series
Janus Aspen Foreign Stock Portfolio
Look Inside. . .
• Portfolio management perspective
• Investment strategy behind your portfolio
• Portfolio performance, characteristics and holdings

Table of Contents
| Useful Information About Your Portfolio Report | 1 | ||||||
| Management Commentary and Schedule of Investments | 2 | ||||||
| Statement of Assets and Liabilities | 9 | ||||||
| Statement of Operations | 10 | ||||||
| Statements of Changes in Net Assets | 11 | ||||||
| Financial Highlights | 12 | ||||||
| Notes to Schedule of Investments | 13 | ||||||
| Notes to Financial Statements | 14 | ||||||
| Report of Independent Registered Public Accounting Firm | 22 | ||||||
| Additional Information | 23 | ||||||
| Explanations of Charts, Tables and Financial Statements | 26 | ||||||
| Designation Requirements | 29 | ||||||
| Trustees and Officers | 30 | ||||||
Please consider the charges, risks, expenses and investment objectives carefully before investing. For a prospectus containing this and other information, please call Janus at 1-800-525-0020 or download the file from www.janus.com/info. Read it carefully before you invest or send money.
Useful Information About Your Portfolio Report
Management Commentary
The Management Commentary in this report includes valuable insight from the Portfolio's manager as well as statistical information to help you understand how your Portfolio's performance and characteristics stack up against those of comparable indices.
Please keep in mind that the opinions expressed by the Portfolio's manager in the Management Commentary are just that: opinions. They are a reflection of the manager's best judgment at the time this report was compiled, which was December 31, 2007. As the investing environment changes, so could the manager's opinions. The views are unique to the manager and aren't necessarily shared by his fellow employees or by Janus in general.
Portfolio Expenses
We believe it's important for our shareholders to have a clear understanding of Portfolio expenses and the impact they have on investment return.
The following is important information regarding the Portfolio's Expense Example, which appears in the Management Commentary within this Annual Report. Please refer to this information when reviewing the Expense Example for the Portfolio.
Example
As a shareholder of a Portfolio, you incur two types of costs: (1) transaction costs, including redemption fees (where applicable) (and any related exchange fees) and (2) ongoing costs, including management fees; distribution and shareholder servicing (12b-1) fees (applicable to Service Shares only); and other Portfolio expenses. The example is intended to help you understand your ongoing costs (in dollars) of investing in a Portfolio and to compare these costs with the ongoing costs of investing in other mutual funds. To do so, compare this 5% hypothetical example with the 5% hypothetical examples that appear in the shareholder reports of the other funds. The example is based upon an investment of $1,000 invested at the beginning of the period and held for the six-month period from July 1, 2007 to D ecember 31, 2007.
Actual Expenses
The first line of the table in each example provides information about actual account values and actual expenses. You may use the information in this line, together with the amount you invested, to estimate the expenses that you paid over the period. Simply divide your account value by $1,000 (for example, an $8,600 account value divided by $1,000 = 8.6), then multiply the result by the number in the first line under the heading entitled "Expenses Paid During Period" to estimate the expenses you paid on your account during the period.
Hypothetical Example for Comparison Purposes
The second line of the table in each example provides information about hypothetical account values and hypothetical expenses based upon the Portfolio's actual expense ratio and an assumed rate of return of 5% per year before expenses, which is not the Portfolio's actual return. The hypothetical account values and expenses may not be used to estimate the actual ending account balance or expenses you paid for the period. You may use this information to compare the ongoing costs of investing in the Portfolio and other funds. To do so, compare this 5% hypothetical example with the 5% hypothetical examples that appear in the shareholder reports of the other funds.
Janus Capital Management LLC ("Janus Capital") has contractually agreed to waive the Portfolio's total operating expenses, excluding the distribution and shareholder servicing (12b-1) fees applicable to Service Shares, brokerage commissions, interest, taxes and extraordinary expenses to certain limits until at least May 1, 2009. More information regarding the waivers is available in the Portfolio's prospectus.
Please note that the expenses shown in the tables are meant to highlight your ongoing costs only and do not reflect any transaction costs, such as redemption fees (where applicable) and any charges at the separate account level or contract level. Redemption fees are fully described in the prospectus. Therefore, the second line of each table is useful in comparing ongoing costs only, and will not help you determine the relative total costs of owning different funds. In addition, if these transaction costs and separate account or contract level charges were included, your costs would have been higher.
Janus Aspen Series December 31, 2007 1
Janus Aspen Foreign Stock Portfolio (unaudited)
Portfolio Snapshot
This portfolio looks for companies anywhere in the world selling at a discount to what we believe is their true value.

Jason Yee
portfolio manager
Janus Aspen Foreign Stock Portfolio's Service Shares returned 18.25% over the 12 months ended December 31, 2007. The Portfolio outpaced the benchmark Morgan Stanley Capital International (MSCI) EAFE® Index, which returned 11.17% during the period. I was pleased with this strong absolute and relative performance.
The primary driver of relative performance was stock selection in the consumer discretionary and technology sectors. The Portfolio also benefited from healthy gains in a number of its financials holdings.
Among individual holdings, Nokia was the strongest contributor. The Finnish manufacturer of mobile handset and other telecommunication equipment reported strong results and showed signs of taking market share from its rival Motorola. I see the company as improving its product mix, focusing on more profitable niches and, in the process, creating the potential for margin expansion.
Shaw Communications, a leading cable and pay-TV provider in Canada, was a strong contributor during the period. Solid operating results provided the company ample cash flow, which it has been using to reduce debt as well as return capital to shareholders. The appreciation of the Canadian dollar versus the U.S. dollar was also a significant factor in the company's contribution to the Portfolio.
The Portfolio's industrials, materials and energy holdings failed to keep pace with Index category performance and a zero weight to utilities further detracted. Poor relative performance by a few of the Portfolio's health care holdings also weighed on relative returns. Individual detractors included Japan's Takeda Pharmaceuticals, which weakened in line with the overall Japanese market. The stock was also pressured by concerns over the market for one of its diabetes drugs, Actos, after an independent study of a competing drug found increased risk of cardiovascular issues. While the stock has suffered from the uncertainty surrounding this study, I believe Takeda should be able to demonstrate its drug does not have the same risk, which should allow the company to gain market share in the diabetes drug market.
Millea Holdings, a leading Japanese non-life insurance company, detracted from performance as Japanese equities continued to struggle during the period. With a relatively mature core insurance business, and an interesting but nascent opportunity in the life insurance arena, the company is executing reasonably from an operating perspective. However, its financial portfolio and holdings are often subject to movement in the overall Japanese financial markets. With the markets pricing in another round of deflation and slowing economic growth, Millea is not only over-capitalized but trading at a discount to net asset value, which I believe represents a compelling value.
"May you live in interesting times..." is a phrase I have often heard used in the popular press attributed to an ancient Chinese curse or proverb. This may perhaps be due to a Robert Kennedy speech in South Africa in 1966 where he references as such...and the rest is history, so to speak. Unfortunately, Chinese scholars are unable to find any reference to such a proverb. Perhaps this should at the very least suggest that many Americans have more to learn about China; despite the fact that ironically China is one of the biggest forces behind these interesting times today.
China's stardom on the global stage, particularly in the Western media, vacillates wildly between fame and notoriety. Each day, the newspaper reminds us of its miraculous economic growth, along with its gravity-defying stock markets and fountain of wealth creation. But turn the page, and we will subsequently read about tainted toys and pet food, unfair currency manipulation, and assorted other sordid tales about the costs of the Chinese economic miracle. China is a vast, populous and diverse country with thousands of years of history, culture and experience in its collective memory. So it is probably not surprising that China defies easy summation in a headline or short news article, much less a few paragraphs in this annual shareholder letter. I am going to focus on a single element of the China-U.S. economic relationship, and after a brief explanation of the major issues at hand, I hope to use this example to illustrate how I approach risk and uncertainty in a portfolio context.
Today's "interesting times" are largely supported by a financial conveyor belt many observers have dubbed "Bretton Woods II." This is in reference to a quaint time in history beginning in 1944 when the U.S. dollar and other currencies had a fixed exchange rate with an ounce of gold, which was subsequently renounced during the Nixon presidency. Financial commentators have written extensively on this subject under many names and guises, which might be cynically oversimplified as "the United States buys containers full of cheap goods from China/Asia that they don't need and can't afford, while China/Asia extends vendor financing to its most profligate customer to stash away over a trillion dollars in U.S. government bonds while building even more factories." Warren Buffett explained this phenomenon of trade and current account deficits in his 2004 Berkshire Hathaway Chairman's letter, so I will not try to improve upon it or other such descripti ons. Suffice it to say, as the U.S. continues to bequeath its assets and become increasingly indebted to foreign nations through overspending, the long-term consequences may continue to have significant implications
2 Janus Aspen Series December 31, 2007
(unaudited)
for investors, particularly for those of us here in America that denominate our wealth primarily in U.S. dollars.
I am describing all of this not because I simply wish to display my basic grasp of macroeconomics, nor because I know the resultant outcome, nor because I wish to moralize the fact that it is impossible for America to borrow itself into prosperity. All that history can assuredly say about the future is that it is certainly uncertain, often very surprising, and suffers no fools who make forecasts and predictions confidently. Much as I emphasized in last year's annual letter and mentioned earlier, this is all for the sake of communicating how I address risk in the Portfolio.
Given there are an infinite number of outcomes and possibilities in describing how this relationship evolves, what framework can I use to help us understand the Portfolio risks and exposures against the eventual "unwinding" of Bretton Woods II, or inversely, the risks involved in its unlikely continuation over the medium term? In explicitly quantifying this risk: at best, I can say the potential impacts are difficult to measure and that it is nearly impossible to predict its ultimate severity. Off-the-shelf risk management software, a common tool in the investment industry, will likely be very insufficient. Proprietary software may or may not be better, but may still lead to poor outcomes due to overconfidence in the models or poor inputs. But in qualitatively exploring this risk in particular, I can try to parse this risk into certain common sense groupings that help us estimate what sort of margin of error needs to exist:
(1) As a global investor, I am acutely aware of, and attempt to be quite diversified against, risks pertaining to changes to the currency regime. The Portfolio aims to perform reasonably in many different environments, the most obvious today being significant revaluations of the U.S. dollar. My point would be that I believe the Portfolio is positioned to withstand the consensus gradual decline in the U.S. dollar, while still offering sufficient protection against surprising shocks related to either a disorderly devaluation scenario or even a decidedly non-consensus appreciation scenario.
(2) It seems reasonable to presume from history that there will be significant "second order" downside effects from this unwinding, in terms of risk appetite, liquidity, and quality preferences in the financial markets...just as there has been on the upside. In my own narrow observation, these second order effects, while somewhat appreciated and discussed, are not easily captured within traditional risk models, particularly with respect to price, correlation, or volatility histories. I again reach to quote Warren Buffett from his most recent annual letter which more eloquently re-emphasizes this point, about which I also opined about a year ago: "Certain perils that lurk in investment strategies cannot be spotted by use of the models commonly employed today by financial institutions." Common sense is again perhaps the best, and only available, tactic for capital preservation in many instances.
(3) As in many cases in life, abstinence and avoidance are the "perfect" solutions but inevitably come burdened with some significant costs and consequences in their own right. So perhaps it is more realistic, at least in portfolio management, to be reasonable in my goals of risk prudence and chastity by limiting exposure to only the best and advantageous risk/reward situations. A potential cost of this strategy is always lagging short-term returns, as this discipline often means avoiding the momentum, hysteria, and irrational exuberance that characterizes the later stages of a financial bubble. Many investors believe that they will be able to recognize and exit the madness before the proverbial punchbowl is taken away. The technology boom and bust of the late 1990s is an example of many overstaying their welcome. I cannot firmly say whether Bretton Woods II and its resultant consequences are representative of any such madness (it may or may not be), but what I can say is that the Portfolio strives to endure outcomes outside the normal probability distributions in both the positive and negative direction.
In summary, there are always many intrinsic and extrinsic risks contained in every investment portfolio. I have explored just one of them in this letter, albeit one that is au courant in the headlines today, but which may be surprisingly underestimated in severity by the financial markets. With any luck, this example of Bretton Woods II has provided a small degree of insight on the process by which risks are evaluated and analyzed within the Portfolio. While I cannot ever promise that the Portfolio will emerge unscathed from this or any other risk, what I can do is try to remain thoughtful, balanced, rational and cognizant of each risk taken. Buffett has even mentioned as much by saying: "Temperament is also important. Independent thinking, emotional stability, and a keen sense of both human a nd institutional behavior are vital to long-term investment success." There are no simple, formulaic recipes for successful risk management. Many of the truly devastating and catastrophic risks are by nature impossible to see except after the fact, when they are suddenly obvious to everyone. So it is best to think deeply and broadly about the issues, search for any clues that might help improve the process, recognize limitations when confronted with complex and unknowable scenarios, and acknowledge that the future is inherently uncertain.
I think it is always prudent to keep a vigilant watch on overall risk levels in the Portfolio to mitigate potential capital loss. I have spoken at length in this letter to that point, but would remind you that the primary investment and risk management process involves thorough fundamental research, searching for high-quality businesses around the world available at attractive purchase prices. This has historically been a time-honored means for successful outcomes in the investment industry, and I hope to continue to execute better on this goal each and every day.
Thank you for your continued support of Janus Aspen Foreign Stock Portfolio.
Janus Aspen Series December 31, 2007 3
Janus Aspen Foreign Stock Portfolio (unaudited)
Janus Aspen Foreign Stock Portfolio At a Glance
5 Largest Contributors to Performance – Holdings
| Contribution | |||||||
| Nokia Oyj | 4.87 | % | |||||
| Shaw Communications, Inc. - Class B | 1.89 | % | |||||
| Sony Corp. | 1.70 | % | |||||
| Syngenta A.G. | 1.33 | % | |||||
| British Sky Broadcasting Group PLC | 1.23 | % | |||||
5 Largest Detractors from
Performance – Holdings
| Contribution | |||||||
| Takeda Pharmaceutical Company, Ltd. | (0.43 | )% | |||||
| Millea Holdings, Inc. | (0.19 | )% | |||||
| Grupo Televisa S.A. (ADR) | (0.18 | )% | |||||
| Pfeiffer Vacuum Technology A.G. | (0.18 | )% | |||||
| Independent News & Media PLC | (0.13 | )% | |||||
5 Largest Contributors to Performance – Sectors
| Portfolio Contribution | Portfolio Weighting (% of Net Assets) | Morgan Stanley Capital International EAFE® Index Weighting | |||||||||||||
| Consumer Discretionary | 8.76 | % | 39.11 | % | 11.62 | % | |||||||||
| Information Technology | 5.10 | % | 9.02 | % | 5.56 | % | |||||||||
| Consumer Staples | 2.72 | % | 10.64 | % | 8.12 | % | |||||||||
| Materials | 1.88 | % | 6.11 | % | 9.24 | % | |||||||||
| Telecommunication Services | 0.90 | % | 2.27 | % | 5.64 | % | |||||||||
5 Lowest Contributors/Detractors to Performance – Sectors
| Portfolio Contribution | Portfolio Weighting (% of Net Assets) | Morgan Stanley Capital International EAFE® Index Weighting | |||||||||||||
| Health Care | (0.40 | )% | 4.81 | % | 6.58 | % | |||||||||
| Utilities | 0.00 | % | 0.00 | % | 5.47 | % | |||||||||
| Financials | 0.42 | % | 15.01 | % | 28.74 | % | |||||||||
| Industrials | 0.52 | % | 8.89 | % | 11.79 | % | |||||||||
| Energy | 0.77 | % | 4.13 | % | 7.24 | % | |||||||||
4 Janus Aspen Series December 31, 2007
(unaudited)
5 Largest Equity Holdings – (% of Net Assets)
As of December 31, 2007
| Nokia Oyj | |||||||
| Wireless Equipment | 7.2 | % | |||||
| Sony Corp. Audio and Video Products | 5.4 | % | |||||
| British Sky Broadcasting Group PLC Television | 4.6 | % | |||||
| Nipponkoa Insurance Company, Ltd. Property and Casualty Insurance | 4.6 | % | |||||
| Koninklijke (Royal) Philips Electronics N.V. Electronic Components - Miscellaneous | 4.4 | % | |||||
| 26.2 | % | ||||||
Asset Allocation – (% of Net Assets)
As of December 31, 2007
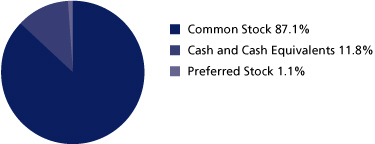
Emerging markets comprised 1.2% of total net assets.
Top Country Allocations – Long Positions (% of Investment Securities)
| As of December 31, 2007 | As of December 31, 2006 | ||||||
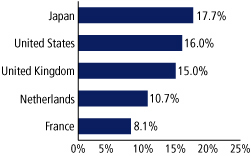 |  | ||||||
Janus Aspen Series December 31, 2007 5
Janus Aspen Foreign Stock Portfolio (unaudited)
Performance

| Average Annual Total Return – for the periods ended December 31, 2007 | Expense Ratios – for the fiscal year ended December 31, 2006 | ||||||||||||||||||||||
| One Year | Five Year | Since Inception* | Total Annual Fund Operating Expenses | Net Annual Fund Operating Expenses | |||||||||||||||||||
| Janus Aspen Foreign Stock Portfolio - Service Shares | 18.25 | % | 18.52 | % | 11.98 | % | 1.72 | % | 1.52 | %(a) | |||||||||||||
| Morgan Stanley Capital International EAFE® Index | 11.17 | % | 21.59 | % | 9.91 | % | |||||||||||||||||
| Lipper Quartile - Service Shares | 1 | st | 4 | th | 1 | st | |||||||||||||||||
| Lipper Ranking - Service Shares based on total returns for Variable Annuity International Funds | 36/242 | 153/186 | 34/135 | ||||||||||||||||||||
Visit janus.com/info to view up-to-date performance
and characteristic information
Data presented reflects past performance, which is no guarantee of future results. Investment results and principal value will fluctuate so that shares, when redeemed, may be worth more or less than their original cost. Due to market volatility, current performance may be higher or lower than the performance shown. Call 877.33JANUS or visit www.janus.com/info for performance current to the most recent month-end.
(a) At December 31, 2006, Janus Capital has contractually agreed to waive the Portfolio's total operating expenses (excluding the distribution and shareholder servicing fee, brokerage commissions, interest, taxes, and extraordinary expenses) to a certain limit until at least May 1, 2008. The net annual fund operating expense shown reflects the application of such limit and is detailed in the Statement of Additional Information. Returns shown include fee waivers, if any, and without such waivers returns would have been lower.
The Portfolio's expense ratios were determined based on average net assets as of the fiscal year ended December 31, 2006. Detailed information is available in the prospectus. Contractual waivers agreed to by Janus Capital are included under "Net Annual Fund Operating Expenses." All expenses are shown without the effect of expense offset arrangements. Pursuant to such arrangements, credits realized as a result of uninvested cash balances are used to reduce custodian and transfer agent expenses.
The Portfolio's performance may be affected by risks that include those associated with investments in specific industries or countries. Additional risks to the Portfolio may include those associated with investing in foreign securities, emerging markets, initial public offerings ("IPOs") and derivatives. Please see a Janus prospectus or www.janus.com/info for more information about risks, fund holdings and other details.
Foreign securities have additional risks including exchange rate changes, political and economic upheaval, the relative lack of information, relatively low market liquidity and the potential lack of strict financial and accounting controls and standards. These risks are magnified in emerging markets. The prices of foreign securities held by the Portfolio, and therefore the Portfolio's performance, may decline in response to such risks.
These returns do not reflect the charges and expenses of any particular insurance product or qualified plan. Returns shown would have been lower had they included insurance charges.
Due to certain investment strategies, the Portfolio may have an increased position in cash.
Returns include reinvestment of dividends from net investment income and distributions from capital gains. The returns shown do not reflect the deduction of taxes that a shareholder would pay on Portfolio distributions or the redemption of Portfolio shares.
Net dividends reinvested are the dividends that remain to be reinvested after foreign tax obligations have been met. Such obligations vary from country to country.
Lipper, a wholly-owned subsidiary of Reuters, provides independent insight on global collective investments including mutual funds, retirement funds, hedge funds, fund fees and expenses to the asset management and media communities. Lipper ranks the performance of mutual funds within a classification of funds that have similar investment objectives. Rankings are historical with capital gains and dividends reinvested and do not include the effect of loads.
6 Janus Aspen Series December 31, 2007
(unaudited)
Portfolio Expenses
The example below shows you the ongoing costs (in dollars) of investing in your Portfolio and allows you to compare these costs with those of other mutual funds. Please refer to the section Useful Information About Your Portfolio Report for a detailed explanation of the information presented in this chart.
| Expense Example - Service Shares | Beginning Account Value (7/1/07) | Ending Account Value (12/31/07) | Expenses Paid During Period (7/1/07-12/31/07)(1) | ||||||||||||
| Actual | $ | 1,000.00 | $ | 1,028.20 | $ | 6.59 | |||||||||
| Hypothetical (5% return before expenses) | $ | 1,000.00 | $ | 1,018.70 | $ | 6.56 | |||||||||
(1) Expenses are equal to the annualized expense ratio of 1.29%, multiplied by the average account value over the period, multiplied by 184/365 (to reflect the one-half year period). Expenses include effect of contractual waivers by Janus Capital.
May 31, 2001 is the date used to calculate the since-inception Lipper ranking, which is slightly different from when the Portfolio began operations since Lipper provides fund rankings as of the last day of the month.
If an expense waiver was in effect, it may have had a material effect on the total return and therefore the ranking for the period.
There is no assurance that the investment process will consistently lead to successful investing.
The Portfolio will invest at least 80% of its net assets in the type of securities described by its name.
See Notes to Schedule of Investments for index definitions.
The Portfolio may differ significantly from the securities held in the index. The index is unmanaged and not available for direct investment; therefore its performance does not reflect the expenses associated with the active management of an actual Portfolio.
See "Explanations of Charts, Tables and Financial Statements."
* The Portfolio's inception date – May 1, 2001
Janus Aspen Series December 31, 2007 7
Janus Aspen Foreign Stock Portfolio
Schedule of Investments
As of December 31, 2007
| Shares or Principal Amount | Value | ||||||||||
| Common Stock - 87.1% | |||||||||||
| Advertising Agencies - 0% | |||||||||||
| 124 | Interpublic Group of Companies, Inc.* | $ | 1,006 | ||||||||
| Advertising Services - 1.5% | |||||||||||
| 28,336 | WPP Group PLC | 364,909 | |||||||||
| Agricultural Chemicals - 3.4% | |||||||||||
| 3,325 | Syngenta A.G. | 840,828 | |||||||||
| Apparel Manufacturers - 3.1% | |||||||||||
| 52,000 | Esprit Holdings, Ltd. | 773,641 | |||||||||
| Audio and Video Products - 5.4% | |||||||||||
| 24,300 | Sony Corp. | 1,333,573 | |||||||||
| Beverages - Wine and Spirits - 2.5% | |||||||||||
| 29,156 | Diageo PLC | 626,749 | |||||||||
| Brewery - 1.8% | |||||||||||
| 7,021 | Heineken N.V. | 453,875 | |||||||||
| Broadcast Services and Programming - 1.2% | |||||||||||
| 12,720 | Grupo Televisa S.A. (ADR) | 302,354 | |||||||||
| Cable Television - 3.9% | |||||||||||
| 39,796 | Shaw Communications, Inc. - Class B | 953,458 | |||||||||
| Cellular Telecommunications - 2.2% | |||||||||||
| 146,586 | Vodafone Group PLC | 547,936 | |||||||||
| Chemicals - Diversified - 1.6% | |||||||||||
| 4,792 | Akzo Nobel N.V. | 383,828 | |||||||||
| 156 | Arkema* | 10,249 | |||||||||
| 394,077 | |||||||||||
| Diversified Operations - 6.3% | |||||||||||
| 42,000 | Hutchison Whampoa, Ltd. | 476,459 | |||||||||
| 5,541 | Louis Vuitton Moet Hennessy S.A. | 669,741 | |||||||||
| 12,590 | Smiths Group PLC | 253,850 | |||||||||
| 3,975 | Tyco International, Ltd. (U.S. Shares) | 157,609 | |||||||||
| 1,557,659 | |||||||||||
| Electronic Components - Miscellaneous - 5.0% | |||||||||||
| 25,360 | Koninklijke (Royal) Philips Electronics N.V. | 1,094,420 | |||||||||
| 3,975 | Tyco Electronics, Ltd. | 147,592 | |||||||||
| 1,242,012 | |||||||||||
| Electronic Components - Semiconductors - 0.8% | |||||||||||
| 78,058 | ARM Holdings PLC | 192,655 | |||||||||
| Food - Diversified - 2.0% | |||||||||||
| 1,097 | Nestle S.A. | 503,690 | |||||||||
| Food - Retail - 2.0% | |||||||||||
| 6,056 | Metro A.G. | 506,126 | |||||||||
| Hotels and Motels - 0.9% | |||||||||||
| 2,803 | Accor S.A. | 224,145 | |||||||||
| Insurance Brokers - 3.8% | |||||||||||
| 24,450 | Willis Group Holdings, Ltd. | 928,367 | |||||||||
| Machinery - Pumps - 2.3% | |||||||||||
| 6,941 | Pfeiffer Vacuum Technology A.G. | 565,062 | |||||||||
| Medical - Drugs - 3.4% | |||||||||||
| 11,433 | GlaxoSmithKline PLC | 291,053 | |||||||||
| 9,200 | Takeda Pharmaceutical Company, Ltd.* | 539,653 | |||||||||
| 830,706 | |||||||||||
| Medical Products - 0.7% | |||||||||||
| 3,975 | Covidien, Ltd. | 176,053 | |||||||||
| Multimedia - 2.6% | |||||||||||
| 13,856 | Vivendi Universal S.A. | 635,637 | |||||||||
| Shares or Principal Amount | Value | ||||||||||
| Oil Companies - Integrated - 3.8% | |||||||||||
| 33,354 | BP PLC | $ | 408,286 | ||||||||
| 6,272 | Total S.A. | 521,078 | |||||||||
| 929,364 | |||||||||||
| Property and Casualty Insurance - 8.1% | |||||||||||
| 26,400 | Millea Holdings, Inc.* | 892,950 | |||||||||
| 123,000 | Nipponkoa Insurance Company, Ltd.*,# | 1,125,836 | |||||||||
| 2,018,786 | |||||||||||
| Publishing - Books - 2.4% | |||||||||||
| 29,225 | Reed Elsevier N.V. | 583,184 | |||||||||
| Publishing - Newspapers - 1.0% | |||||||||||
| 67,969 | Independent News & Media PLC* | 235,393 | |||||||||
| Retail - Consumer Electronics - 1.6% | |||||||||||
| 3,400 | Yamada Denki Company, Ltd.* | 390,879 | |||||||||
| Rubber/Plastic Products - 1.1% | |||||||||||
| 15,000 | Tenma Corp. | 261,810 | |||||||||
| Semiconductor Equipment - 0.9% | |||||||||||
| 7,207 | ASML Holding N.V.* | 228,208 | |||||||||
| Television - 4.6% | |||||||||||
| 92,799 | British Sky Broadcasting Group PLC | 1,143,341 | |||||||||
| Wireless Equipment - 7.2% | |||||||||||
| 46,600 | Nokia Oyj | 1,795,269 | |||||||||
| Total Common Stock (cost $12,576,672) | 21,540,752 | ||||||||||
| Preferred Stock - 1.1% | |||||||||||
| Soap and Cleaning Preparations - 1.1% | |||||||||||
| 4,809 | Henkel KGaA (cost $101,008) | 269,475 | |||||||||
| Money Markets - 11.7% | |||||||||||
| 1,832,574 | Janus Institutional Cash Management Fund - Institutional Shares, 4.98% | 1,832,574 | |||||||||
| 1,072,310 | Janus Institutional Money Market Fund - Institutional Shares, 4.91% | 1,072,310 | |||||||||
| Total Money Markets (cost $2,904,884) | 2,904,884 | ||||||||||
| Other Securities - 3.5% | |||||||||||
| 602,924 | Allianz Dresdner Daily Asset Fund† | 602,924 | |||||||||
| 153,248 | Repurchase Agreements† | 153,248 | |||||||||
| 117,828 | Time Deposit† | 117,828 | |||||||||
| Total Other Securities (cost $874,000) | 874,000 | ||||||||||
| Total Investments (total cost $16,456,564) – 103.4% | 25,589,111 | ||||||||||
| Liabilities, net of Cash, Receivables and Other Assets – (3.4)% | (845,491 | ) | |||||||||
| Net Assets – 100% | $ | 24,743,620 | |||||||||
Summary of Investments by Country – (Long Positions)
| Country | Value | % of Investment Securities | |||||||||
| Bermuda | $ | 1,859,617 | 7.3 | % | |||||||
| Canada | 953,458 | 3.7 | % | ||||||||
| Finland | 1,795,269 | 7.0 | % | ||||||||
| France | 2,060,850 | 8.1 | % | ||||||||
| Germany | 1,340,663 | 5.2 | % | ||||||||
| Hong Kong | 476,459 | 1.9 | % | ||||||||
| Ireland | 235,393 | 0.9 | % | ||||||||
| Japan | 4,544,701 | 17.7 | % | ||||||||
| Mexico | 302,354 | 1.2 | % | ||||||||
| Netherlands | 2,743,515 | 10.7 | % | ||||||||
| Switzerland | 1,344,518 | 5.3 | % | ||||||||
| United Kingdom | 3,828,779 | 15.0 | % | ||||||||
| United States†† | 4,103,535 | 16.0 | % | ||||||||
| Total | $ | 25,589,111 | 100.0 | % | |||||||
††Includes Short-Term Securities and Other Securities (1.3% excluding Short-Term Securities and Other Securities).
See Notes to Schedule of Investments and Financial Statements.
8 Janus Aspen Series December 31, 2007
Statement of Assets and Liabilities
| As of December 31, 2007 (all numbers in thousands except net asset value per share) | Janus Aspen Foreign Stock Portfolio | ||||||
| Assets: | |||||||
| Investments at cost(1) | $ | 16,457 | |||||
| Investments at value(1) | $ | 22,684 | |||||
| Affiliated money market investments | 2,905 | ||||||
| Cash | 50 | ||||||
| Cash denominated in foreign currency (cost $4) | 4 | ||||||
| Receivables: | |||||||
| Portfolio shares sold | 3 | ||||||
| Dividends | 20 | ||||||
| Interest | 12 | ||||||
| Non-interested Trustees' deferred compensation | 1 | ||||||
| Other assets | – | ||||||
| Total Assets | 25,679 | ||||||
| Liabilities: | |||||||
| Payables: | |||||||
| Collateral for securities loaned (Note 1) | 874 | ||||||
| Portfolio shares repurchased | – | ||||||
| Advisory fees | 13 | ||||||
| Transfer agent fees and expenses | 1 | ||||||
| Distribution fees - Service Shares | 5 | ||||||
| Non-interested Trustees' fees and expenses | 1 | ||||||
| Non-interested Trustees' deferred compensation fees | 1 | ||||||
| Accrued expenses | 40 | ||||||
| Total Liabilities | 935 | ||||||
| Net Assets | $ | 24,744 | |||||
| Net Assets Consist of: | |||||||
| Capital (par value and paid-in-surplus)* | $ | 15,554 | |||||
| Undistributed net investment income/(loss)* | 54 | ||||||
| Undistributed net realized gain/(loss) from investments and foreign currency transactions* | 3 | ||||||
| Unrealized appreciation/(depreciation) of investments, foreign currency translations and non-interested Trustees' deferred compensation | 9,133 | ||||||
| Total Net Assets | $ | 24,744 | |||||
| Net Assets - Service Shares | $ | 24,744 | |||||
| Shares Outstanding, $0.001 Par Value (unlimited shares authorized) | 1,295 | ||||||
| Net Asset Value Per Share | $ | 19.11 | |||||
*See Note 3 in Notes to Financial Statements.
(1) Investments at cost and value include $828,330 of securities loaned (Note 1).
See Notes to Financial Statements.
Janus Aspen Series December 31, 2007 9
Statement of Operations
| For the fiscal year ended December 31, 2007 (all numbers in thousands) | Janus Aspen Foreign Stock Portfolio | ||||||
| Investment Income: | |||||||
| Interest | $ | – | |||||
| Securities lending income | 1 | ||||||
| Dividends | 611 | ||||||
| Dividends from affiliates | 107 | ||||||
| Foreign tax withheld | (35 | ) | |||||
| Total Investment Income | 684 | ||||||
| Expenses: | |||||||
| Advisory fees | 143 | ||||||
| Transfer agent expenses | 3 | ||||||
| Custodian fees | 13 | ||||||
| Professional fees | 13 | ||||||
| Non-interested Trustees' fees and expenses | 5 | ||||||
| Distribution fees - Service Shares | 57 | ||||||
| Printing expenses | 36 | ||||||
| System Fees | 19 | ||||||
| Other expenses | 13 | ||||||
| Non-recurring costs (Note 2) | – | ||||||
| Cost assumed by Janus Capital Management LLC (Note 2) | – | ||||||
| Total Expenses | 302 | ||||||
| Expense and Fee Offset | (1 | ) | |||||
| Net Expenses | 301 | ||||||
| Net Investment Income/(Loss) | 383 | ||||||
| Net Realized and Unrealized Gain/(Loss) on Investments: | |||||||
| Net realized gain/(loss) from investments and foreign currency transactions | 8 | ||||||
| Change in unrealized appreciation/(depreciation) of investments, foreign currency translations and non-interested Trustees' deferred compensation | 3,142 | ||||||
| Net Gain/(Loss) on Investments | 3,150 | ||||||
| Net Increase/(Decrease) in Net Assets Resulting from Operations | $ | 3,533 | |||||
See Notes to Financial Statements.
10 Janus Aspen Series December 31, 2007
Statements of Changes in Net Assets
| For the fiscal years ended December 31 | Janus Aspen Foreign Stock Portfolio | ||||||||||
| (all numbers in thousands) | 2007 | 2006 | |||||||||
| Operations: | |||||||||||
| Net investment income/(loss) | $ | 383 | $ | 194 | |||||||
| Net realized gain/(loss) from investment transactions and foreign currency transactions | 8 | 616 | |||||||||
| Change in unrealized appreciation/(depreciation) of investments, foreign currency translations and non-interested Trustees' deferred compensation | 3,142 | 2,102 | |||||||||
| Net Increase/(Decrease) in Net Assets Resulting from Operations | 3,533 | 2,912 | |||||||||
| Dividends and Distributions to Shareholders: | |||||||||||
| Net investment income* | |||||||||||
| Service Shares | (333 | ) | (278 | ) | |||||||
| Net realized gain/(loss) from investment transactions* | |||||||||||
| Service Shares | (533 | ) | (490 | ) | |||||||
| Net Decrease from Dividends and Distributions | (866 | ) | (768 | ) | |||||||
| Capital Share Transactions: | |||||||||||
| Shares sold | |||||||||||
| Service Shares | 7,612 | 3,273 | |||||||||
| Reinvested dividends and distributions | |||||||||||
| Service Shares | 866 | 768 | |||||||||
| Shares repurchased | |||||||||||
| Service Shares | (5,385 | ) | (2,873 | ) | |||||||
| Net Increase/(Decrease) from Capital Share Transactions | 3,093 | 1,168 | |||||||||
| Net Increase/(Decrease) in Net Assets | 5,760 | 3,312 | |||||||||
| Net Assets: | |||||||||||
| Beginning of period | 18,984 | 15,672 | |||||||||
| End of period | $ | 24,744 | $ | 18,984 | |||||||
| Undistributed net investment income/(loss)* | $ | 54 | $ | – | |||||||
*See Note 3 in Notes to Financial Statements.
See Notes to Financial Statements.
Janus Aspen Series December 31, 2007 11
Financial Highlights - Service Shares
| For a share outstanding during each | Janus Aspen Foreign Stock Portfolio | ||||||||||||||||||||||
| fiscal year ended December 31 | 2007 | 2006 | 2005 | 2004 | 2003 | ||||||||||||||||||
| Net Asset Value, Beginning of Period | $ | 16.75 | $ | 14.85 | $ | 14.09 | $ | 11.95 | $ | 9.00 | |||||||||||||
| Income from Investment Operations: | |||||||||||||||||||||||
| Net investment income/(loss) | .30 | .25 | .11 | .04 | .06 | ||||||||||||||||||
| Net gain/(loss) on securities (both realized and unrealized) | 2.74 | 2.37 | .76 | 2.14 | 2.95 | ||||||||||||||||||
| Total from Investment Operations | 3.04 | 2.62 | .87 | 2.18 | 3.01 | ||||||||||||||||||
| Less Distributions: | |||||||||||||||||||||||
| Dividends (from net investment income)* | (.26 | ) | (.25 | ) | (.11 | ) | (.04 | ) | (.04 | ) | |||||||||||||
| Distributions (from capital gains)* | (.42 | ) | (.47 | ) | – | – | – | ||||||||||||||||
| Tax return of capital* | – | – | – | – | (.02 | ) | |||||||||||||||||
| Total Distributions | (.68 | ) | (.72 | ) | (.11 | ) | (.04 | ) | (.06 | ) | |||||||||||||
| Net Asset Value, End of Period | $ | 19.11 | $ | 16.75 | $ | 14.85 | $ | 14.09 | $ | 11.95 | |||||||||||||
| Total Return | 18.25 | % | 18.06 | % | 6.24 | % | 18.22 | % | 33.39 | % | |||||||||||||
| Net Assets, End of Period (in thousands) | $ | 24,744 | $ | 18,984 | $ | 15,672 | $ | 16,889 | $ | 8,481 | |||||||||||||
| Average Net Assets for the Period (in thousands) | $ | 22,694 | $ | 17,224 | $ | 16,595 | $ | 13,297 | $ | 6,758 | |||||||||||||
| Ratio of Gross Expenses to Average Net Assets(1) | 1.33 | % | 1.49 | % | 1.45 | % | 1.46 | % | 1.50 | % | |||||||||||||
| Ratio of Net Expenses to Average Net Assets(1) | 1.33 | % | 1.49 | % | 1.44 | % | 1.45 | % | 1.50 | % | |||||||||||||
| Ratio of Net Investment Income/(Loss) to Average Net Assets | 1.69 | % | 1.13 | % | 0.82 | % | 0.34 | % | 0.40 | % | |||||||||||||
| Portfolio Turnover Rate | 0 | % | 16 | % | 20 | % | 14 | % | 31 | % | |||||||||||||
* See Note 3 in Notes to Financial Statements.
(1) See Note 4 in Notes to Financial Statements.
See Notes to Financial Statements.
12 Janus Aspen Series December 31, 2007
Notes to Schedule of Investments
| Lipper Variable Annuity International Funds | Funds that invest their assets in securities with primary trading markets outside of the United States. | ||||||
| Morgan Stanley Capital International EAFE® Index | Is a free float-adjusted market capitalization weighted index designed to measure developed market equity performance. The MSCI EAFE® Index is composed of companies representative of the market structure of developed market countries. The index includes reinvestment of dividends, net of foreign withholding taxes. | ||||||
| ADR | American Depositary Receipt | ||||||
| PLC | Public Limited Company | ||||||
| U.S. Shares | Securities of foreign companies trading on an American Stock Exchange. | ||||||
* Non-income-producing security.
# Loaned Security; a portion or all of the security is on loan as of December 31, 2007.
† The security is purchased with the cash collateral received from securities on loan (Note 1).
Janus Aspen Series December 31, 2007 13
Notes to Financial Statements
The following section describes the organization and significant accounting policies and provides more detailed information about the schedules and tables that appear throughout this report. In addition, the Notes to Financial Statements explain the methods used in preparing and presenting this report.
1. ORGANIZATION AND SIGNIFICANT ACCOUNTING POLICIES
Janus Aspen Foreign Stock Portfolio (the "Portfolio") is a series fund. The Portfolio is part of Janus Aspen Series (the "Trust"), which is organized as a Delaware statutory trust and is registered under the Investment Company Act of 1940, as amended, (the "1940 Act") as an open-end management investment company. The Trust offers seventeen Portfolios, which include multiple series of shares, with differing investment objectives and policies. The Portfolio invests primarily in equity securities. The Portfolio is classified as nondiversified, as defined in the 1940 Act. The Portfolio is a no-load investment.
The Portfolio currently offers one class of shares: Service Shares. Service Shares are offered only in connection with investment in and payments under variable insurance contracts and to qualified retirement plans that require a fee from Portfolio assets to procure distribution and administrative services to contract owners and plan participants.
The following accounting policies have been consistently followed by the Portfolio and are in conformity with accounting principles generally accepted in the United States of America in the investment company industry.
Investment Valuation
Securities are valued at the last sales price or the official closing price for securities traded on a principal securities exchange (U.S. or foreign) and on the NASDAQ National Market. Securities traded on over-the-counter markets and listed securities for which no sales are reported are valued at the latest bid price (or yield equivalent thereof) obtained from one or more dealers transacting in a market for such securities or by a pricing service approved by the Portfolio's Trustees. Short-term securities with maturities of 60 days or less may be valued at amortized cost, which approximates market value. Debt securities with a remaining maturity of greater than 60 days are valued in accordance with the evaluated bid price supplied by the pricing service. The evaluated bid price supplied by the pricing service is an evaluation that reflects such factors as security prices, yields, maturities and ratings. Foreign securities and currencies ar e converted to U.S. dollars using the applicable exchange rate in effect as of the daily close of the New York Stock Exchange ("NYSE"). When market quotations are not readily available or deemed unreliable, or events or circumstances that may affect the value of portfolio securities held by the Portfolio are identified between the closing of their principal markets and the time the net asset value ("NAV") is determined, securities may be valued at fair value as determined in good faith under procedures established by and under the supervision of the Portfolio's Trustees. Circumstances in which fair value pricing may be utilized include, but are not limited to: (i) when significant events occur which may affect the securities of a single issuer, such as mergers, bankruptcies, or significant issuer specific developments; (ii) when significant events occur which may affect an entire market, such as natural disasters or significant governmen tal actions; and (iii) when non-significant events occur such as markets closing early or not opening, security trading halts, or pricing of non-valued securities and restricted or non-public securities. The Portfolio may use a systematic fair valuation model provided by an independent third party to value international equity securities in order to adjust for stale pricing, which may occur between the close of certain foreign exchanges and the NYSE.
Investment Transactions and Investment Income
Investment transactions are accounted for as of the date purchased or sold (trade date). Dividend income is recorded on the ex-dividend date. Certain dividends from foreign securities will be recorded as soon as the Trust is informed of the dividend if such information is obtained subsequent to the ex-dividend date. Dividends from foreign securities may be subject to withholding taxes in foreign jurisdictions. Interest income is recorded on the accrual basis and includes amortization of premiums and accretion of discounts. Gains and losses are determined on the identified cost basis, which is the same basis used for federal income tax purposes.
Expenses
The Portfolio bears expenses incurred specifically on its behalf as well as a portion of general expenses, which may be allocated pro rata to the Portfolio.
Securities Lending
Under procedures adopted by the Trustees, the Portfolio may lend securities to qualified parties (typically brokers or other financial institutions) who need to borrow securities in order to complete certain transactions such as covering short sales, avoiding failures to deliver securities or completing arbitrage activities. The Portfolio may seek to earn additional income through securities lending. There is the risk of delay in recovering a loaned security or the risk of loss in collateral rights if the borrower fails financially. Janus Capital Management LLC ("Janus Capital") makes efforts to balance the benefits and risks from granting such loans.
State Street Bank and Trust Company served as the Portfolio's lending agent for the period January 1, 2007 through May 24, 2007. Effective May 25, 2007, Dresdner Bank AG became the lending agent for the Portfolio.
The Portfolio does not have the right to vote on securities while they are being lent; however, the Portfolio may attempt
14 Janus Aspen Series December 31, 2007
to call back the loan and vote the proxy if time permits. All loans will be continuously secured by collateral which may consist of cash, U.S. Government securities, domestic and foreign short-term debt instruments, letters of credit, time deposits, repurchase agreements, or such other collateral permitted by the Securities and Exchange Commission ("SEC"). Cash collateral may be invested in affiliated money market funds or other accounts advised by Janus Capital to the extent consistent with exemptive relief obtained from the SEC or as permitted by the 1940 Act and rules promulgated thereunder.
Dresdner Bank AG (the "Lending Agent") may also invest the cash collateral in the Allianz Dresdner Daily Asset Fund or investments in unaffiliated money market funds or accounts, mutually agreed to by the Portfolio and the Lending Agent, that comply with Rule 2a-7 of the 1940 Act relating to money market funds.
As of December 31, 2007, the Portfolio had on loan securities valued as indicated:
| Portfolio | Value at December 31, 2007 | ||||||
| Janus Aspen Foreign Stock Portfolio | $ | 828,330 | |||||
As of December 31, 2007, the Portfolio received cash collateral for securities lending activity as indicated:
| Portfolio | Cash Collateral at December 31, 2007 | ||||||
| Janus Aspen Foreign Stock Portfolio | $ | 874,000 | |||||
As of December 31, 2007, all cash collateral received by the Portfolio was invested in the Allianz Dresdner Daily Asset Fund, except for $153,248 and $117,828 which were invested in Repurchase Agreements and Time Deposits, respectively.
The value of the collateral must be at least 102% of the market value of the loaned securities that are denominated in U.S. dollars and 105% of the market value of the loaned securities that are not denominated in U.S. dollars. Loaned securities and related collateral are marked-to-market each business day based upon the market value of the loaned securities at the close of business, employing the most recent available pricing information. Collateral levels are then adjusted based on this mark-to-market evaluation.
The borrower pays fees at the Portfolio's direction to the Lending Agent. The Lending Agent may retain a portion of the interest earned on the cash collateral invested. The cash collateral invested by the Lending Agent is disclosed in the Schedule of Investments (if applicable). The lending fees and the Portfolio's portion of the interest income earned on cash collateral are included on the Statement of Operations (if applicable).
Interfund Lending
Pursuant to an exemptive order received from the SEC, the Portfolio may be party to an interfund lending agreement between the Portfolio and other Janus Capital sponsored mutual funds, which permits it to borrow or lend cash at a rate beneficial to both the borrowing and lending funds. Outstanding borrowings from all sources totaling 10% or more of the borrowing Portfolio's total assets must be collateralized at 102% of the outstanding principal value of the loan; loans of less than 10% may be unsecured. During the fiscal year ended December 31, 2007, there were no outstanding interfund borrowing or lending arrangements for the Portfolio.
Forward Currency Transactions
The Portfolio may enter into forward currency contracts in order to reduce its exposure to changes in foreign currency exchange rates on its foreign portfolio holdings and to lock in the U.S. dollar cost of firm purchase and sale commitments for securities denominated in or exposed to foreign currencies. A forward currency exchange contract is a commitment to purchase or sell a foreign currency at a future date at a negotiated rate. The gain or loss arising from the difference between the U.S. dollar cost of the original contract and the value of the foreign currency in U.S. dollars upon closing a contract is included in "Net realized gain/(loss) from investment and foreign currency transactions" on the Statement of Operations (if applicable).
Forward currency contracts held by the Portfolio are fully collateralized by other securities, which are denoted in the accompanying Schedule of Investments (if applicable). The collateral is evaluated daily to ensure its market value equals or exceeds the current market value of the corresponding forward currency contracts. As of December 31, 2007, the Portfolio was not invested in forward foreign currency contracts.
Futures Contracts
The Portfolio may enter into futures contracts to gain exposure to the stock market pending investment of cash balances or to meet liquidity needs. The Portfolio may also use such derivative instruments to hedge or protect from adverse movements in securities prices, currency rates or interest rates. The use of futures contracts may involve risks such as the possibility of illiquid markets or imperfect correlation between the value of the contracts and the underlying securities, or that the counterparty will fail to perform its obligations.
Futures contracts are marked-to-market daily, and the daily variation margin is recorded as a receivable or payable on the Statement of Assets and Liabilities (if applicable). When a contract is closed, a realized gain or loss is recorded as "Net realized gain/(loss) from futures contracts" on the Statement of Operations (if applicable) equal to the difference between the opening and closing value of the contract. Generally, futures
Janus Aspen Series December 31, 2007 15
Notes to Financial Statements (continued)
contracts are marked-to-market (i.e., treated as realized and subject to distribution) for federal income tax purposes at fiscal year-end. Securities designated as collateral for market value on futures contracts are noted in the Schedule of Investments (if applicable). Such collateral is in the possession of the Portfolio's custodian. As of December 31, 2007, the Portfolio was not invested in futures contracts.
Short Sales
The Portfolio may engage in "short sales against the box." Short sales against the box involve either selling short a security that the Portfolio owns, or selling short a security that the Portfolio has the right to obtain, for delivery at a specified date in the future. The Portfolio may enter into a short sale against the box to hedge against anticipated declines in the market price of portfolio securities by locking in gains. The Portfolio does not deliver from its portfolio the securities sold short and does not immediately receive the proceeds of the short sale. The Portfolio borrows the securities sold short and receives proceeds from the short sale only when it delivers the securities to the lender. If the value of the securities sold short increases prior to the scheduled delivery date, the Portfolio loses the opportunity to participate in the gain.
The Portfolio may engage in short sales when the portfolio manager anticipates that a security's market purchase price will be less than its borrowing price. To complete the transaction, the Portfolio must borrow the security to deliver it to the purchaser and buy that same security in the market to return it to the lender. The total market value of all of the Portfolio's short sale positions will not exceed 10% of its assets. Although the potential for gain is limited to the difference between the price at which the Portfolio sold the security short and the cost of borrowing the security, its potential for loss is theoretically unlimited because there is no limit to the cost of replacing the borrowed security. There is no assurance that the Portfolio will be able to close out a short position at a particular time or at an acceptable price. A gain or a loss will be recognized upon termination of a short sale. There is no limit to the size o f any loss that the Portfolio may recognize upon termination of a short sale. Short sales held by the Portfolio are fully collateralized by other securities, which are denoted in the accompanying Schedule of Investments (if applicable). As of December 31, 2007, the Portfolio was not engaged in short sales.
Foreign Currency Translations
The Portfolio does not isolate that portion of the results of operations resulting from changes in foreign exchange rates on investments from the fluctuations arising from changes in market prices of securities held at the date of the financial statements. Net unrealized appreciation or depreciation on investments and foreign currency translation arise from changes in the value of assets and liabilities, including investments in securities held at the date of the financial statements, resulting from changes in the exchange rates and changes in market prices of securities held.
Currency gains and losses are also calculated on payables and receivables that are denominated in foreign currencies. The payables and receivables are generally related to foreign security transactions and income.
Foreign currency-denominated assets and forward currency contracts may involve more risks than domestic transactions, including currency risk, political and economic risk, regulatory risk and market risk. Risks may arise from the potential inability of a counterparty to meet the terms of a contract and from unanticipated movements in the value of foreign currencies relative to the U.S. dollar.
When-issued Securities
The Portfolio may purchase or sell securities on a when-issued or forward commitment basis. The price of the underlying securities and date when the securities will be delivered and paid for are fixed at the time the transaction is negotiated. Losses may arise due to changes in the market value of the securities or from the inability of counterparties to meet the terms of the contract. In connection with such purchases, the Portfolio may hold liquid assets as collateral with the Portfolio's custodian sufficient to cover the purchase price. As of December 31, 2007, the Portfolio was not invested in when-issued securities.
Equity-Linked Structured Notes
The Portfolio may invest in equity-linked structured notes. Equity-linked structured notes are derivative securities which are specially designed to combine the characteristics of one or more underlying securities and their equity derivatives in a single note form. The return and/or yield or income component may be based on the performance of the underlying equity securities, an equity index, and/or option positions. Equity-linked structured notes are typically offered in limited transactions by financial institutions in either registered or non-registered form. An investment in equity-linked structured notes creates exposure to the credit risk of the issuing financial institution, as well as to the market risk of the underlying securities. There is no guaranteed return of principal with these securities and the appreciation potential of these securities may be limited by a maximum payment or call right. In certain cases, equity-linked struc tured notes may be more volatile and less liquid than less complex securities or other types of fixed-income securities. Such securities may exhibit price behavior that does not correlate with other fixed-income securities. As of December 31, 2007, the Portfolio was not invested in equity-linked structured notes.
Initial Public Offerings
The Portfolio may invest in initial public offerings ("IPOs"). IPOs and other investment techniques may have a magnified performance impact on a fund with a small asset base. The Portfolio may not experience similar performance as its assets grow.
16 Janus Aspen Series December 31, 2007
Restricted Security Transactions
Restricted securities held by the Portfolio may not be sold except in exempt transactions or in a public offering registered under the Securities Act of 1933. The risk of investing in such securities is generally greater than the risk of investing in the securities of widely held, publicly traded companies. Lack of a secondary market and resale restrictions may result in the inability of the Portfolio to sell a security at a fair price and may substantially delay the sale of the security. In addition, these securities may exhibit greater price volatility than securities for which secondary markets. As of December 31, 2007, the Portfolio was not invested in restricted securities.
Dividend Distributions
The Portfolio may make semiannual distributions of substantially all of its investment income and an annual distribution of its net realized capital gains (if any). The majority of dividends and net realized capital gains distributions from the Portfolio may be automatically reinvested into additional shares of the Portfolio, based upon the discretion of the shareholder.
Estimates
The preparation of financial statements in conformity with accounting principles generally accepted in the United States of America requires management to make estimates and assumptions that affect the reported amount of assets and liabilities and disclosure of contingent assets and liabilities at the date of the financial statements, and the reported amounts of income and expenses during the reporting period. Actual results could differ from those estimates.
Federal Income Taxes
No provision for income taxes is included in the accompanying financial statements, as the Portfolio intends to distribute to shareholders all taxable investment income and realized gains and otherwise comply with Subchapter M of the Internal Revenue Code applicable to regulated investment companies.
New Accounting Pronouncements
In July 2006, the Financial Accounting Standards Board ("FASB") issued Interpretation No. 48, "Accounting for Uncertainty in Income Taxes – an Interpretation of FASB Statement No. 109" (the "Interpretation"). The Interpretation establishes for all entities, including pass-through entities such as the Portfolio, a minimum threshold for financial statement recognition of the benefit of positions taken in filing tax returns (including whether an entity is taxable in a particular jurisdiction), and requires certain expanded tax disclosures. A calendar year open-end or closed-end fund was required to implement the Interpretation no later than June 29, 2007 (the last business day of the semi-annual reporting period), and the Interpretation also applies to all open tax years as of the date of effectiveness. Management has evaluated the application of the Interpretation to the Portfolio and has determined there is no significant impact on the Portfolio's financial statements.In September 2006, the FASB issued Statement of Financial Accounting Standards No. 157, "Fair Value Measurements" ("SFAS No. 157"), which defines fair value, establishes a framework for measuring fair value in generally accepted accounting principles, and expands disclosures about fair value measurements. SFAS No. 157 does not require new fair value measurements, but is applied to the extent that other accounting pronouncements require or permit fair value measurements. SFAS No. 157 emphasizes that fair value is a market-based measurement that should be determined based on the assumptions that market participants would use in pricing an asset or liability. SFAS No. 157 is effective for fiscal years beginning after November 15, 2007 and interim periods within those fiscal years. Management does not believe the adoption of SFAS No. 157 will impact the financial statement amounts, however, the Portfolio will be required to disclose the extent to which fair value is used to measure assets and liabilities and the inputs used to develop the measurements.
2. INVESTMENT ADVISORY AGREEMENTS AND OTHER TRANSACTIONS WITH AFFILIATES
The Portfolio pays a monthly advisory fee to Janus Capital based upon average daily net assets and calculated at the annual rate of 0.64%.
Janus Capital has agreed until at least May 1, 2009 to reimburse the Portfolio by the amount, if any, that the normal operating expenses in any fiscal year, including the investment advisory fee but excluding the distribution and shareholder servicing (12b-1) fees applicable to Service Shares, brokerage commissions, interest, taxes and extraordinary expenses, exceed an annual rate of 1.24% of the average daily net assets of the Portfolio. The Portfolio is not required to repay any such waived fees in future years to Janus Capital.
Janus Services LLC ("Janus Services"), a wholly-owned subsidiary of Janus Capital, is the Portfolio's transfer agent. Janus Services receives certain out-of-pocket expenses for transfer agent services.
Certain officers of the Portfolio may also be officers and/or directors of Janus Capital. Such officers receive no compensation from the Portfolio, except for the Portfolio's Chief Compliance Officer. Effective January 1, 2006, the Portfolio began reimbursing the adviser for a portion of the compensation paid to the Chief Compliance Officer of the Trust. Total compensation of $3,078 was paid by the Portfolio during the fiscal year ended December 31, 2007. The Portfolio's portion is reported as part of "Other Expenses" on the Statement of Operations.
The Board of Trustees has adopted a deferred compensation plan (the "Deferred Plan") for independent Trustees to elect to defer receipt of all or a portion of the annual compensation they are entitled to receive from the Portfolio. All deferred fees
Janus Aspen Series December 31, 2007 17
Notes to Financial Statements (continued)
are credited to an account established in the name of the Trustees. The amounts credited to the account then increase or decrease, as the case may be, in accordance with the performance of one or more of the Janus funds that are selected by the Trustees. The account balance continues to fluctuate in accordance with the performance of the selected fund or funds until final payment of all amounts credited to the account. The fluctuation of the account balance is recorded by the Portfolio as unrealized appreciation/(depreciation) and is shown as of December 31, 2007 on the Statement of Assets and Liabilities as an asset, "Noninterested Trustees' deferred compensation," and a liability, "Noninterested Trustees' deferred compensation fees." Additionally, the recorded unrealized appreciation/(depreciation ) is included in "Unrealized net appreciation/(depreciation) of investments, foreign currency translations and non-interested Trustees' deferred compensation" on the Statement of Assets and Liabilities. Deferred compensation expenses for the fiscal year ended December 31, 2007 are included in "Non-interested Trustees' fees and expenses" on the Statement of Operations. Trustees are allowed to change their designation of mutual funds from time to time. Amounts will be deferred until distributed in accordance with the Deferred Plan. No deferred fees were paid to any Trustee under the Deferred Plan during the fiscal year ended December 31, 2007.
For the fiscal year ended December 31, 2007, Janus Capital assumed $24,421 of legal, consulting and Trustee costs and fees incurred by the funds in Janus Investment Fund, Janus Aspen Series and Janus Adviser Series (the "Funds") in connection with the regulatory and civil litigation matters discussed in Note 7. These non-recurring costs were allocated to all Funds based on the Funds' respective net assets as of July 31, 2004. Additionally, all future non-recurring costs will be allocated to the Funds based on the Funds' respective net assets on July 31, 2004. These "Non-recurring costs" and "Costs assumed by Janus Capital" are shown on the Statement of Operations.
Janus Distributors LLC, a wholly-owned subsidiary of Janus Capital, is a distributor of the Portfolio. Service Shares have adopted a Distribution and Shareholder Servicing Plan (the "Plan") pursuant to Rule 12b-1 under the 1940 Act. The Plan authorizes payments by the Portfolio in connection with the distribution of Service Shares at an annual rate of up to 0.25% of Service Share's average daily net assets.
The Portfolio's expenses may be reduced by expense offsets from an unaffiliated custodian and/or transfer agent. Such credits or offsets are included in "Expense and Fee Offset" on the Statement of Operations. The transfer agent fee offsets received during the period reduce Transfer Agent Fees and Expenses. Custodian offsets received reduce Custodian Fees. The Portfolio could have employed the assets used by the custodian and/or transfer agent to produce income if it had not entered into an expense offset arrangement.
The Portfolio may invest in money market funds, including funds managed by Janus Capital. During the fiscal year ended December 31, 2007, the Portfolio recorded distributions from affiliated investment companies as affiliated dividend income, and had the following affiliated purchases and sales:
| Purchases Shares/Cost | Sales Shares/Cost | Dividend Income | Value at 12/31/07 | ||||||||||||||||
| Janus Aspen Foreign Stock Portfolio | |||||||||||||||||||
| Janus Institutional Cash Management Fund – Institutional Shares | $ | 2,364,416 | $ | 531,842 | $ | 38,020 | $ | 1,832,574 | |||||||||||
| Janus Institutional Cash Reserves Fund | 61,051 | 707,037 | 4,526 | – | |||||||||||||||
| Janus Institutional Money Market Fund – Institutional Shares | 5,885,467 | 4,813,157 | 64,056 | 1,072,310 | |||||||||||||||
| Janus Money Market Fund – Institutional Shares | 80,500 | 80,500 | 162 | – | |||||||||||||||
| $ | 8,391,434 | $ | 6,132,536 | $ | 106,764 | $ | 2,904,884 | ||||||||||||
3. FEDERAL INCOME TAX
The tax components of capital shown in the table below represent: (1) distribution requirements the Portfolio must satisfy under the income tax regulations; (2) losses or deductions the Portfolio may be able to offset against income and gains realized in future years; and (3) unrealized appreciation or depreciation of investments for federal income tax purposes (reduced by foreign tax liability).
Other book to tax differences in the current year may consist of deferred compensation, derivatives, and foreign currency contract adjustments. The Portfolio has elected to treat gains and losses on forward foreign currency contracts as capital gains and losses. Other foreign currency gains and losses on debt instruments are treated as ordinary income for federal income tax purposes pursuant to Section 988 of the Internal Revenue Code.
| Portfolio | Undistributed Ordinary Income | Undistributed Long-Term Gains | Accumulated Capital Losses | Post-October Deferral | Other Book to Tax Differences | Net Tax Appreciation/ (Depreciation) | |||||||||||||||||||||
| Janus Aspen Foreign Stock Portfolio | $ | 185,880 | $ | – | $ | – | $ | – | $ | (279 | ) | $ | 9,003,847 | ||||||||||||||
18 Janus Aspen Series December 31, 2007
The aggregate cost of investments and the composition of unrealized appreciation and depreciation of investment securities for federal income tax purposes as of December 31, 2007 are noted below.
Unrealized appreciation and unrealized depreciation in the table below exclude appreciation/depreciation on foreign currency translations. The primary difference between book and tax appreciation or depreciation of investments is wash sale loss deferrals and passive foreign investment companies.
| Portfolio | Federal Tax Cost | Unrealized Appreciation | Unrealized (Depreciation) | ||||||||||||
| Janus Aspen Foreign Stock Portfolio | $ | 16,585,264 | $ | 9,161,537 | $ | (157,690 | ) | ||||||||
Income and capital gains distributions are determined in accordance with income tax regulations that may differ from accounting principles generally accepted in the United States of America. These differences are due to differing treatments for items such as net short-term gains, deferral of wash sale losses, foreign currency transactions, net investment losses and capital loss carryovers. Certain permanent differences such as tax returns of capital and net investment losses noted below have been reclassified to paid-in capital.
For the fiscal year ended December 31, 2007
| Distributions | |||||||||||||||||||
| Portfolio | From Ordinary Income | From Long-Term Capital Gains | Tax Return of Capital | Net Investment Loss | |||||||||||||||
| Janus Aspen Foreign Stock Portfolio | $ | 333,343 | $ | 532,781 | $ | – | $ | – | |||||||||||
For the fiscal year ended December 31, 2006
| Distributions | |||||||||||||||||||
| Portfolio | From Ordinary Income | From Long-Term Capital Gains | Tax Return of Capital | Net Investment Loss | |||||||||||||||
| Janus Aspen Foreign Stock Portfolio | $ | 201,653 | $ | 566,799 | $ | – | $ | – | |||||||||||
4. EXPENSE RATIOS
The expense ratios listed in the Financial Highlights reflect expenses prior to any expense offsets (gross expense ratio) and after expense offsets (net expense ratio). Both expense ratios reflect expenses after waivers (reimbursement). Listed below are the gross expense ratios for the Portfolio that would have been in effect, absent the waiver of certain fees and offsets.
| For each fiscal year ended December 31 | |||||||||||||||||||||||
| Service Shares | |||||||||||||||||||||||
| Portfolio | 2007(1) | 2006(1) | 2005(1) | 2004(1) | 2003 | ||||||||||||||||||
| Janus Aspen Foreign Stock Portfolio | 1.33 | % | 1.69 | % | 1.45 | % | 1.46 | % | 1.89 | % | |||||||||||||
(1) The effect of non-recurring costs assumed by Janus Capital (Note 2) is included in the ratio of operating expenses to average net assets without waivers and/or expense reimbursements and was less than 0.01%.
5. CAPITAL SHARE TRANSACTIONS
| Janus Aspen Foreign Stock | |||||||||||
| For each fiscal year ended December 31 | Portfolio | ||||||||||
| (all numbers in thousands) | 2007 | 2006 | |||||||||
| Transactions in Portfolio Shares – Service Shares | |||||||||||
| Shares sold | 402 | 209 | |||||||||
| Reinvested dividends and distributions | 47 | 49 | |||||||||
| Shares repurchased | (287 | ) | (181 | ) | |||||||
| Net Increase/(Decrease) in Portfolio Shares | 162 | 77 | |||||||||
| Shares Outstanding, Beginning of Period | 1,133 | 1,056 | |||||||||
| Shares Outstanding, End of Period | 1,295 | 1,133 | |||||||||
Janus Aspen Series December 31, 2007 19
Notes to Financial Statements (continued)
6. PURCHASES AND SALES OF INVESTMENT SECURITIES
For the fiscal year ended December 31, 2007, the aggregate cost of purchases and proceeds from sales of investment securities (excluding short-term securities) were as follows:
| Portfolio | Purchases of Securities | Proceeds from Sales of Securities | Purchases of Long-Term U.S. Government Obligations | Proceeds from Sales of Long-Term U.S. Government Obligations | |||||||||||||||
| Janus Aspen Foreign Stock Portfolio | $ | 291,800 | $ | – | $ | – | $ | – | |||||||||||
7. PENDING LEGAL MATTERS
In the fall of 2003, the Securities and Exchange Commission ("SEC"), the Office of the New York State Attorney General ("NYAG"), the Colorado Attorney General ("COAG"), and the Colorado Division of Securities ("CDS") announced that they were investigating alleged frequent trading practices in the mutual fund industry. On August 18, 2004, Janus Capital announced that it had reached final settlements with the SEC, the NYAG, the COAG, and the CDS related to such regulators' investigations into Janus Capital's frequent trading arrangements.
A number of civil lawsuits were brought against Janus Capital and certain of its affiliates, the Janus funds, and related entities and individuals based on allegations similar to those announced by the above regulators and were filed in several state and federal jurisdictions. Such lawsuits alleged a variety of theories for recovery including, but not limited to, the federal securities laws, other federal statutes (including ERISA), and various common law doctrines. The Judicial Panel on Multidistrict Litigation transferred these actions to the U.S. District Court for the District of Maryland (the "Court") for coordinated proceedings. On September 29, 2004, five consolidated amended complaints were filed with the Court that generally include: (i) claims by a putative class of investors in certain Janus funds asserting claims on behalf of the investor class (Marini, et al. v. Janus Investment Fund, et al., U.S. District Court, District of Maryland, Case No. 04-CV-00497); (ii) derivative claims by investors in certain Janus funds ostensibly on behalf of such funds (Steinberg et al. v. Janus Capital Management, LLC et al., U.S. District Court, District of Maryland, Case No. 04-CV-00518); (iii) claims on behalf of participants in the Janus 401(k) plan (Wangberger v. Janus Capital Group Inc., 401(k) Advisory Committee, et al., U.S. District Court, District of Maryland, Case No. JFM-05-2711); (iv) claims brought on behalf of shareholders of Janus Capital Group Inc. ("JCGI") on a derivative basis against the Board of Directors of JCGI (Chasen v. Whiston, et al., U.S. District Court, District of Maryland, Case No. 04-MD-00855); and (v) claims by a putative class of shareholders of JCGI asserting claims on behalf of the shareholders (Wiggins, et al. v. Janus Capital Group, Inc., et al., U.S. District Court, District of Maryland, Case No. 04-CV-00818). Each of the five complaints initially named JCGI and/or Janus Capital as a defendant. In addition, the following were also named as defendants in one or more of the actions: Janus Investment Fund ("JIF"), Janus Aspen Series ("JAS"), Janus Adviser Series ("JAD"), Janus Distributors LLC, Enhanced Investment Technologies, LLC ("INTECH"), Bay Isle Financial LLC ("Bay Isle"), Perkins, Wolf, McDonnell and Company, LLC ("Perkins"), the Advisory Committee of the Janus 401(k) plan, and the current or former directors of JCGI.
On August 25, 2005, the Court entered orders dismissing most of the claims asserted against Janus Capital and its affiliates by fund investors in the Marini and Steinberg cases (actions (i) and (ii) above) except certain claims under Section 10(b) of the Securities Exchange Act of 1934 and under Section 36(b) of the Investment Company Act of 1940, as amended (the "1940 Act"). On August 15, 2006, the Wangberger complaint in the 401(k) plan class action (action (iii) above) was dismissed by the district court with prejudice. The plaintiff appealed that dismissal decision to the United States Court of Appeals for the Fourth Circuit. The appeal is still pending and argument in the matter was held in December 2007. The Court also dismissed the Chasen lawsuit (action (iv) above) against JCGI's Board of Directors without leave to amend. Finally, a Motion to Dismiss the Wiggins suit (action (v) above) was granted a nd the matter was dismissed in May 2007. However, in June 2007, Plaintiffs appealed that dismissal to the United States Court of Appeals for the Fourth Circuit. That appeal is currently pending.
In addition to the lawsuits described above, the Auditor of the State of West Virginia ("Auditor"), in his capacity as securities commissioner, has initiated administrative proceedings against many of the defendants in the market timing cases (including JCGI and Janus Capital) and, as a part of its relief, is seeking disgorgement and other monetary relief based on similar market timing allegations (In the Matter of Janus Capital Group Inc. et al., Before the Securities Commissioner, State of West Virginia, Summary Order No. 05-1320). The respondents in these proceedings collectively sought a Writ of Prohibition in state court, which was denied. Their subsequent Petition for Appeal was also denied. Consequently, in September 2006, JCGI and Janus Capital filed their answer to the Auditor's summary order instituting proceedings and
20 Janus Aspen Series December 31, 2007
requested a hearing. A status conference was held on June 28, 2007, during which the parties were ordered to submit their proposed scheduling order. To date, no scheduling order has been entered in the case. In addition to the pending Motion to Discharge Order to Show Cause, JCGI and Janus Capital, as well as other similarly situated defendants, continue to challenge the statutory authority of the Auditor to bring such an action.
Additional lawsuits may be filed against certain of the Janus funds, Janus Capital, and related parties in the future. Janus Capital does not currently believe that these pending actions will materially affect its ability to continue providing services it has agreed to provide to the Janus funds.
Janus Aspen Series December 31, 2007 21
Report of Independent Registered
Public Accounting Firm
To the Trustees and Shareholders
of Janus Aspen Foreign Stock Portfolio
In our opinion, the accompanying statement of assets and liabilities, including the schedule of investments, and the related statements of operations and of changes in net assets and the financial highlights present fairly, in all material respects, the financial position of Janus Aspen Foreign Stock Portfolio (one of the portfolios constituting Janus Aspen Series, hereafter referred to as the "Portfolio") at December 31, 2007, the results of its operations for the year then ended, the changes in its net assets for each of the two years in the period then ended, and the financial highlights for each of the five years in the period then ended, in conformity with accounting principles generally accepted in the United States of America. These financial statements and financial highlights (hereafter referred to as "financial statements") are the responsibility of the Portfolio's management; our responsibility is to express an opinion on these fi nancial statements based on our audits. We conducted our audits of these financial statements in accordance with the standards of the Public Company Accounting Oversight Board (United States). Those standards require that we plan and perform the audit to obtain reasonable assurance about whether the financial statements are free of material misstatement. An audit includes examining, on a test basis, evidence supporting the amounts and disclosures in the financial statements, assessing the accounting principles used and significant estimates made by management, and evaluating the overall financial statement presentation. We believe that our audits, which included confirmation of securities at December 31, 2007 by correspondence with the custodian, transfer agent and brokers, and the application of alternative auditing procedures where securities purchased had not been received, provide a reasonable basis for our opinion.

Denver, Colorado
February 15, 2008
22 Janus Aspen Series December 31, 2007
Additional Information (unaudited)
PROXY VOTING POLICIES AND VOTING RECORD
A description of the policies and procedures that the Portfolio uses to determine how to vote proxies relating to its portfolio securities is available: (i) without charge, upon request, by calling 1-800-525-0020 (toll free); (ii) on the Portfolio's website at www.janus.com/proxyvoting; and (iii) on the SEC's website at http://www.sec.gov. Additionally, information regarding the Portfolio's proxy voting record for the most recent twelve- month period ended June 30 is also available, free of charge, through www.janus.com/proxyvoting and from the SEC's website at http://www.sec.gov.
QUARTERLY PORTFOLIO HOLDINGS
The Portfolio files its complete portfolio holdings (schedule of investments) with the SEC for the first and third quarters of each fiscal year on Form N-Q within 60 days of the end of such fiscal quarter. The Portfolio's Form N-Q: (i) is available on the SEC's website at http://www.sec.gov; (ii) may be reviewed and copied at the SEC's Public Reference Room in Washington, D.C. (information on the Public Reference Room may be obtained by calling 1-800-SEC-0330); and (iii) is available without charge, upon request, by calling Janus at 1-800-525-0020 (toll free).
APPROVAL OF ADVISORY AGREEMENTS DURING THE PERIOD
The Trustees of Janus Aspen Series, none of whom has ever been affiliated with Janus Capital ("Independent Trustees"), oversee the management of each Portfolio and, as required by law, determine annually whether to continue the investment advisory agreement for each Portfolio and the subadvisory agreements for the three Portfolios that utilize subadvisers.
In connection with their most recent consideration of those agreements for each Portfolio, the Trustees received and reviewed a substantial amount of information provided by Janus Capital and the respective subadvisers in response to requests of the Independent Trustees and their independent legal counsel. They also received and reviewed a considerable amount of information and analysis provided by their independent fee consultant. Throughout their consideration of the agreements, the Independent Trustees were advised by their independent legal counsel. The Independent Trustees met with management to consider the agreements, and also met separately in executive session with their independent legal counsel and their independent fee consultant.
At a meeting held on December 14, 2007, based on their evaluation of the information provided by Janus Capital, the subadvisers and the independent fee consultant, as well as other information, the Trustees determined that the overall arrangements between each Portfolio and Janus Capital and each subadviser, as applicable, were fair and reasonable in light of the nature, extent and quality of the services provided by Janus Capital, its affiliates and the subadvisers, the fees charged for those services, and other matters that the Trustees considered relevant in the exercise of their business judgment. At that meeting the Trustees unanimously approved the continuation of the investment advisory agreement for each Portfolio, and the subadvisory agreement for each subadvised Portfolio, for the period from February 1, 2008 through February 1, 2009, subject to earlier termina tion as provided for in each agreement.
In considering the continuation of those agreements, the Trustees reviewed and analyzed various factors that they determined were relevant, including the factors described below, none of which by itself was considered dispositive. However, the material factors and conclusions that formed the basis for the Trustees' determination to approve the continuation of the agreements are discussed separately below.
Nature, Extent and Quality of Services
The Trustees reviewed the nature, extent and quality of the services provided by Janus Capital and the subadvisers to the Portfolios, taking into account the investment objective and strategy of each Portfolio, the knowledge of the Trustees gained from their regular meetings with management on at least a quarterly basis, and their ongoing review of information related to the Portfolios. In addition, the Trustees reviewed the resources and key personnel of Janus Capital and each subadviser, especially those who provide investment management services to the Portfolios. The Trustees also considered other services provided to the Portfolios by Janus Capital or the subadvisers, such as managing the execution of portfolio transactions and the selection of broker-dealers for those transactions, serving as the Portfolios' administrator, monitoring adherence to the Portfolios' investment restrictions, producing shareholder reports, providing support services for the Trustees and Trustee committees, communicating with shareholders, and overseeing the activities of other service providers, including monitoring compliance with various policies and procedures of the Portfolios and with applicable securities laws and regulations.
The Trustees concluded that the nature, extent and quality of the services provided by Janus Capital and/or the subadviser to each Portfolio were appropriate and consistent with the terms of the respective advisory and subadvisory agreements; that, taking into account steps taken to address those Portfolios whose performance lagged that of the median of their peers for certain periods, the quality of those services had been consistent with or superior to quality norms in the industry; and that the Portfolios were likely to benefit from the continued provision of those services. They also concluded that Janus Capital and each subadviser had sufficient
Janus Aspen Series December 31, 2007 23
Additional Information (continued)
personnel, with the appropriate education and experience, to serve the Portfolios effectively and had demonstrated its continuing ability to attract well-qualified personnel.
Performance of the Portfolios
The Trustees considered the investment results of each Portfolio over various time periods. They reviewed information comparing each Portfolio's performance with the performance of comparable funds and peer groups identified by Lipper Inc., an independent provider of investment company data, and with the Portfolio's benchmark index. They concluded that the performance of many Portfolios was good to very good under current market conditions. Although the performance of some Portfolios lagged that of the median of their peers for certain periods, the Trustees also concluded that Janus Capital had taken appropriate steps to address those instances of under-performance and that the more recent performance of most of those Portfolios had been improving.
Costs of Services Provided
The Trustees examined information on the fees and expenses of each Portfolio in comparison to similar information for comparable funds as provided by Lipper. They also reviewed an analysis of that information provided by their independent fee consultant and noted that the rate of management (investment advisory and administrative) fees for most of the Portfolios, in some cases after contractual expense limitations, was below the mean management fee rate of the respective peer group of funds selected by Lipper.
The Trustees considered the methodology used by Janus Capital and each subadviser in determining compensation payable to portfolio managers, the competitive environment for investment management talent and the competitive market for mutual funds in different distribution channels. They concluded that the compensation methodology provided a good alignment of the interests of the portfolio managers with those of Portfolio shareholders.
The Trustees also reviewed management fees charged by Janus Capital to its separate account clients and to its subadvised funds (for which Janus Capital provides only services related to portfolio management). Although in most instances subadvisory and separate account fee rates for various investment strategies were lower than management fee rates for Portfolios having a similar strategy, the Trustees noted that, under the terms of the management agreements with the Portfolios, Janus Capital performs significant additional services for the Portfolios that it does not provide to those other clients, including administrative services, oversight of the Portfolios' other service providers, Trustee support, regulatory compliance and numerous other services, and that, in serving the Portfolios, Janus Capital assumes many legal risks that it does not assume in servicing its ot her clients. Moreover, the Trustees noted that the spread between the average fee rates charged to the Portfolios and the fee rates that Janus Capital charged to its separate account clients was significantly smaller than the average spread for such fee rates of other advisers, based on publicly available data and research conducted by their independent fee consultant.
The Trustees reviewed information on the profitability to Janus Capital and its affiliates of their relationships with each Portfolio, as well as an explanation of the methodology used in allocating various expenses of Janus Capital and its affiliates among the Portfolios and other clients. They also reviewed the financial statements of Janus Capital's parent company and its corporate structure. In their review, the Trustees considered whether Janus Capital and each subadviser receives adequate incentives to manage the Portfolios effectively. They recognized that profitability comparisons among investment advisers are difficult because very little comparative information is publicly available and profitability of any adviser is affected by numerous factors, including the organizational structure of the particular adviser, the types of funds and other accounts it manages, possible other lines of business, the methodology for allocating expens es, and the adviser's capital structure and cost of capital. However, based on the information available and taking those factors into account, the Trustees concluded that Janus Capital's profitability with respect to each Portfolio in relation to the services rendered was not unreasonable.
The Trustees concluded that the management fees and other compensation payable by each Portfolio to Janus Capital and its affiliates, as well as the fees payable by Janus Capital or the Portfolios to the subadvisers of subadvised Portfolios, were reasonable in relation to the nature, extent and quality of the services provided, taking into account the fees charged by other advisers for managing comparable mutual funds with similar strategies and the fees Janus Capital and the subadvisers charge to other clients. They also concluded that the overall expense ratio of each Portfolio was reasonable, taking into account the size of the Portfolio, the quality of services provided by Janus Capital and any subadviser, the investment performance of the Portfolio and any expense limitations agreed to by Janus Capital.
Economies of Scale
The Trustees considered information about the potential for Janus Capital to realize economies of scale as the assets of the Portfolios increase. They noted that, although most Portfolios pay advisory fees at a fixed rate as a percentage of net assets, without any breakpoints, the management fee rate paid by each Portfolio, after any contractual expense limitations, was
24 Janus Aspen Series December 31, 2007
below the mean management fee rate of the Portfolio's peer group selected by Lipper; and, for those Portfolios whose expenses are being reduced by the contractual expense limitations of Janus Capital, Janus Capital is subsidizing the Portfolios because they have not reached adequate scale. Moreover, as the assets of many of the Portfolios declined in the past few years, those Portfolios benefited from having advisory fee rates that remained constant rather than increasing as assets declined. In addition, performance fee structures have been implemented for several Portfolios that will cause the effective rate of advisory fees payable by such a Portfolio to vary depending on the investment performance of the Portfolio relative to its benchmark index over the measurement period; and a few Portfolios have fee schedules with breakpoints and reduced fee rates above certain asset levels. The Trustees also noted that the Portfolios share directly i n economies of scale through lower charges of third-party service providers, based on the combined scale of all of the Portfolios. Based on all of the information they reviewed, the Trustees concluded that the current fee structure of each Portfolio was reasonable and that the current rates of fees do reflect a sharing between Janus Capital and the Portfolio of economies of scale at the current asset level of the Portfolio.
Other Benefits to Janus Capital
The Trustees also considered benefits that accrue to Janus Capital and its affiliates from their relationships with the Portfolios. They recognized that two affiliates of Janus Capital separately serve the Portfolios as transfer agent and distributor, respectively. They also considered Janus Capital's past and proposed use of commissions paid by Portfolios on their portfolio brokerage transactions to obtain proprietary and third-party research products and services benefiting those Portfolios and/or other clients of Janus Capital. The Trustees concluded that Janus Capital's use of "soft" commission dollars of a Portfolio to obtain proprietary and third-party research products and services was consistent with regulatory requirements and guidelines and was likely to benefit the Portfolios. The Trustees also concluded that, other than the services provided by Janus Capital and its affiliates pursuant to the agreements and the fees to be paid by each Portfolio therefor, the Portfolios and Janus Capital may potentially benefit from their relationship with each other in other ways. They concluded that Janus Capital benefits from the receipt of proprietary research products and services acquired through commissions paid on portfolio transactions of the Portfolios and that the Portfolios benefit from Janus Capital's receipt of those products and services, as well as research products and services acquired through commissions paid by other clients of Janus Capital. They further concluded that success of any Portfolio could attract other business to Janus Capital or other Janus funds and that the success of Janus Capital could enhance Janus Capital's ability to serve the Portfolios.
After full consideration of the above factors, as well as other factors, all of the Trustees, all of whom are Independent Trustees, concluded that the proposed continuation of the investment advisory agreement for each Portfolio, and the subadvisory agreement for each subadvised Portfolio, was in the best interest of the respective Portfolios and their shareholders.
Janus Aspen Series December 31, 2007 25
Explanations of Charts, Tables and
Financial Statements (unaudited)
1. PERFORMANCE OVERVIEWS
The performance overview graph compares the performance of a hypothetical $10,000 investment in the Portfolio with one or more widely used market indices. The hypothetical example does not represent the returns of any particular investment.
When comparing the performance of the Portfolio with an index, keep in mind that market indices do not include brokerage commissions that would be incurred if you purchased the individual securities in the index. They also do not include taxes payable on dividends and interest or operating expenses incurred if you maintained a Portfolio invested in the index.
Average annual total returns are quoted for the Portfolio. Average annual total return is calculated by taking the growth or decline in value of an investment over a period of time, including reinvestment of any dividends, distributions and capital gains, then calculating the annual compounded percentage rate that would have produced the same result had the rate of growth been constant throughout the period. Average annual total return does not reflect the deduction of taxes that a shareholder would pay on Portfolio distributions or redemptions of Portfolio shares.
Pursuant to federal securities rules, expense ratios shown in the performance chart reflect subsidized and unsubsidized ratios for the past fiscal year. The total annual portfolio operating expenses ratio is gross of any fee waivers, reflecting a Portfolio's unsubsidized expense ratio. The net annual portfolio operating expenses ratio (if applicable) includes contractual waivers of Janus Capital and/or Janus Services and reflects a Portfolio's subsidized expense ratio. Both the total annual portfolio operating expenses ratio and net annual portfolio operating expenses ratio are based on average net assets as of the fiscal year ended December 31, 2006. The ratios also include expenses indirectly incurred by the Portfolio as a result of investing in other investment companies or pooled investments, which are not reflected in the "Financial Highlights" of this report. As a result, these ratios may be higher or lower than those shown in the "Fin ancial Highlights" in this report. All expenses are shown without the effect of expense offset arrangements. Pursuant to such arrangements, credits realized as a result of uninvested cash balances are used to reduce custodian and transfer agent expenses.
2. SCHEDULE OF INVESTMENTS
Following the performance overview section is the Portfolio's Schedule of Investments. This schedule reports the industry concentrations and types of securities held in the Portfolio on the last day of the reporting period. Securities are usually listed by type (common stock, corporate bonds, U.S. Government obligations, etc.) and by industry classification (banking, communications, insurance, etc.). Holdings are subject to change without notice.
The value of each security is quoted as of the last day of the reporting period. The value of securities denominated in foreign currencies is converted into U.S. dollars. Certain short-term investments maturing within 60 days are valued at amortized cost, which approximates market value.
A summary of investments by country is provided if the Portfolio invested in foreign securities. This summary reports the Portfolio's exposure to different countries by providing the percentage of securities invested in each country. The country of each security represents the country in which the company is incorporated.
2A. FORWARD CURRENCY CONTRACTS
A table listing forward currency contracts follows the Portfolio's Schedule of Investments (if applicable). Forward currency contracts are agreements to deliver or receive a preset amount of currency at a future date. Forward currency contracts are used to hedge against foreign currency risk in the Portfolio's long-term holdings.
The table provides the name of the foreign currency, the settlement date of the contract, the amount of the contract, the value of the currency in U.S. dollars and the amount of unrealized gain or loss. The amount of unrealized gain or loss reflects the change in currency exchange rates from the time the contract was opened to the last day of the reporting period.
2B. FUTURES
A table listing futures contracts follows the Portfolio's Schedule of Investments (if applicable). Futures contracts are contracts that obligate the buyer to receive and the seller to deliver an instrument or money at a specified price on a specified date. Futures are used to hedge against adverse movements in securities prices, currency risk or interest rates.
The table provides the name of the contract, number of contracts held, the expiration date, the principal amount, value and the amount of unrealized gain or loss. The amount of unrealized gain or loss reflects the marked-to-market amount for the last day of the reporting period.
3. STATEMENT OF ASSETS AND LIABILITIES
This statement is often referred to as the "balance sheet." It lists the assets and liabilities of the Portfolio on the last day of the reporting period.
The Portfolio's assets are calculated by adding the value of the securities owned, the receivable for securities sold but not yet settled, the receivable for dividends declared but not yet
26 Janus Aspen Series December 31, 2007
received on stocks owned and the receivable for Portfolio shares sold to investors but not yet settled. The Portfolio's liabilities include payables for securities purchased but not yet settled, Portfolio shares redeemed but not yet paid and expenses owed but not yet paid. Additionally, there may be other assets and liabilities such as unrealized gain or loss on forward currency contracts.
The section entitled "Net Assets Consist of" breaks down the components of the Portfolio's net assets. Because the Portfolio must distribute substantially all earnings, you will notice that a significant portion of net assets is shareholder capital.
The last section of this statement reports the net asset value ("NAV") per share on the last day of the reporting period for each class of the Portfolio. The NAV is calculated by dividing the Portfolio's net assets (assets minus liabilities) by the number of shares outstanding.
4. STATEMENT OF OPERATIONS
This statement details the Portfolio's income, expenses, gains and losses on securities and currency transactions, and appreciation or depreciation of current Portfolio holdings.
The first section in this statement, entitled "Investment Income," reports the dividends earned from stocks and interest earned from interest-bearing securities in the Portfolio.
The next section reports the expenses and expense offsets incurred by the Portfolio, including the advisory fee paid to the investment adviser, transfer agent fees and expenses, printing and postage for mailing statements, financial reports and prospectuses and other expenses. Expense offsets, if any, are also shown.
The last section lists the increase or decrease in the value of securities held in the Portfolio. The Portfolio realizes a gain (or loss) when it sells its position in a particular security. An unrealized gain (or loss) refers to the change in net appreciation or depreciation of the Portfolio during the reporting period. "Net Realized and Unrealized Gain/(Loss) on Investments" is affected both by changes in the market value of Portfolio holdings and by gains (or losses) realized during the reporting period.
5. STATEMENT OF CHANGES IN NET ASSETS
This statement reports the increase or decrease in the Portfolio's net assets during the reporting period. Changes in the Portfolio's net assets are attributable to investment operations, dividends, distributions and capital share transactions. This is important to investors because it shows exactly what caused the Portfolio's net asset size to change during the period.
The first section summarizes the information from the Statement of Operations regarding changes in net assets due to the Portfolio's investment performance. The Portfolio's net assets may also change as a result of dividend and capital gains distributions to investors. If investors receive their dividends in cash, money is taken out of the Portfolio to pay the distribution. If investors reinvest their dividends, the Portfolio's net assets will not be affected. If you compare the Portfolio's "Net Decrease from Dividends and Distributions" to the "Reinvested dividends and distributions," you will notice that dividend distributions had little effect on the Portfolio's net assets. This is because the majority of Janus investors reinvest their distributions.
The reinvestment of dividends is included under "Capital Share Transactions." "Capital Shares" refers to the money investors contribute to the Portfolio through purchases or withdraw via redemptions. The Portfolio's net assets will increase and decrease in value as investors purchase and redeem shares from the Portfolio.
6. FINANCIAL HIGHLIGHTS
This schedule provides a per-share breakdown of the components that affect the Portfolio's NAV for current and past reporting periods for each class of the Portfolio. Not only does this table provide you with total return, it also reports total distributions, asset size, expense ratios and portfolio turnover rate.
The first line in the table reflects the NAV per share at the beginning of the reporting period. The next line reports the net investment income per share, which comprises dividends and interest income earned on securities held by the Portfolio. Following is the total of gains/(losses), realized and unrealized. Dividends and distributions are then subtracted to arrive at the NAV per share at the end of the period. The next line reflects the average annual total return reported the last day of the period.
Also included are the expense ratios, or the percentage of average net assets that were used to cover operating expenses during the period. Expense ratios vary for a number of reasons, including the differences in management fees, the average shareholder account size and the extent of foreign investments, which entail greater transaction costs.
The Portfolio's expenses may be reduced through expense reduction arrangements. These arrangements may include the use of balance credits or transfer agent fee offsets. The Statement of Operations reflects total expenses before any such offset, the amount of the offset and the net expenses. The expense ratios listed in the Financial Highlights reflect total expenses prior to any expense offsets (gross expense ratio) and after the expense offsets (net expense ratio). Both expense
Janus Aspen Series December 31, 2007 27
Explanations of Charts, Tables and
Financial Statements (unaudited) (continued)
ratios reflect expenses after waivers (reimbursements), if applicable.
The ratio of net investment income/(loss) summarizes the income earned less expenses, divided by the average net assets of the Portfolio during the reporting period. Don't confuse this ratio with the Portfolio's yield. The net investment income ratio is not a true measure of the Portfolio's yield because it doesn't take into account the dividends distributed to the Portfolio's investors.
The next figure is the portfolio turnover rate, which measures the buying and selling activity in the Portfolio. Portfolio turnover is affected by market conditions, changes in the asset size of the Portfolio, the nature of the Portfolio's investments and the investment style of the portfolio manager. A 100% rate implies that an amount equal to the value of the entire portfolio is turned over in a year; a 50% rate means that an amount equal to the value of half the portfolio is traded in a year; and a 200% rate means that an amount equal to the value of the portfolio is traded every six months.
28 Janus Aspen Series December 31, 2007
Designation Requirements (unaudited)
For federal income tax purposes, the Portfolio designated the following for the year ended December 31, 2007.
Capital Gain Distributions
| Portfolio | |||||||
| Janus Aspen Foreign Stock Portfolio | $ | 532,781 | |||||
Foreign Taxes Paid and Foreign Source Income
| Portfolio | Foreign Taxes Paid | Foreign Source Income | |||||||||
| Janus Aspen Foreign Stock Portfolio | $ | 34,580 | $ | 609,642 | |||||||
Janus Aspen Series December 31, 2007 29
Trustees and Officers (unaudited)
The Portfolio's Statement of Additional Information includes additional information about the Trustees and officers and is available, without charge, by calling 1-800-525-0020.
The following are the Trustees and officers of the Trust, together with a brief description of their principal occupations during the last five years (principal occupations for certain Trustees may include periods over five years).
Each Trustee has served in that capacity since he or she was originally elected or appointed. The Trustees do not serve a specified term of office. Each Trustee will hold office until the termination of the Trust or his or her earlier death, resignation, retirement, incapacity, or removal. The retirement age for Trustees is 72. The Portfolio's Nominating and Governance Committee will consider nominees for the position of Trustee recommended by shareholders. Shareholders may submit the name of a candidate for consideration by the Committee by submitting their recommendations to the Trust's Secretary. Each Trustee is currently a Trustee of two other registered investment companies advised by Janus Capital: Janus Investment Fund and Janus Adviser Series. As of the date of this report, collectively, these three registered investment companies consist of 75 series or funds.
The Trust's officers are elected annually by the Trustees for a one-year term. Certain officers also serve as officers of Janus Investment Fund and Janus Adviser Series. Certain officers of the Portfolio may also be officers and/or directors of Janus Capital. Portfolio officers receive no compensation from the Portfolio, except for the Portfolio's Chief Compliance Officer, as authorized by the Trustees.
Trustees
| Name, Address, and Age | Positions Held with Portfolio | Length of Time Served | Principal Occupations During the Past Five Years | Number of Portfolios/ Funds in Fund Complex Overseen by Trustee | Other Directorships Held by Trustee | ||||||||||||||||||
| Dennis B. Mullen* 151 Detroit Street Denver, CO 80206 DOB: 1943 | Chairman Trustee | 3/04-12/07 9/93-Present | Chief Executive Officer of Red Robin Gourmet Burgers, Inc. (since 2005). Formerly, private investor. | 75 | ** | Chairman of the Board (since 2005) and Director of Red Robin Gourmet Burgers, Inc., and Director of Janus Capital Funds Plc (Dublin-based, non-U.S. funds). | |||||||||||||||||
| Jerome S. Contro 151 Detroit Street Denver, CO 80206 DOB: 1956 | Trustee | 12/05-Present | Partner of Tango Group, a private investment firm (since 1999). | 75 | Trustee and Chairman of RS Investment Trust (since 2001), and Director of IZZE Beverages and MyFamily.com, Inc. (genealogical research website). | ||||||||||||||||||
| William F. McCalpin 151 Detroit Street Denver, CO 80206 DOB: 1957 | Trustee | 6/02-Present | Private investor. Formerly, Executive Vice President and Chief Operating Officer of The Rockefeller Brothers Fund (a private family foundation), and Vice President of Asian Cultural Council. | 75 | Director of F.B. Heron Foundation (a private grant making foundation). | ||||||||||||||||||
* Mr. McCalpin will succeed Mr. Mullen as Chairman as of January 1, 2008.
** Mr. Mullen also serves as director of Janus Capital Funds Plc, consisting of 16 funds. Including Janus Capital Funds Plc and the 75 funds comprising the Janus funds, Mr. Mullen oversees 91 funds.
30 Janus Aspen Series December 31, 2007
Trustees (cont.)
| Name, Address, and Age | Positions Held with Portfolio | Length of Time Served | Principal Occupations During the Past Five Years | Number of Portfolios/ Funds in Fund Complex Overseen by Trustee | Other Directorships Held by Trustee | ||||||||||||||||||
| John W. McCarter, Jr. 151 Detroit Street Denver, CO 80206 DOB: 1938 | Trustee | 6/02-Present | President and Chief Executive Officer of The Field Museum of Natural History (Chicago, IL) (since 1997). | 75 | Chairman of the Board and Director of Divergence Inc. (biotechnology firm); Director of W.W. Grainger, Inc. (industrial distributor); and Trustee of WTTW (Chicago public television station) and the University of Chicago. | ||||||||||||||||||
| James T. Rothe 151 Detroit Street Denver, CO 80206 DOB: 1943 | Trustee | 1/97-Present | Co-founder and Managing Director of Roaring Fork Capital Management, LLC (private investment in public equity firm), and Professor Emeritus of Business of the University of Colorado, Colorado Springs, CO (since 2004). Formerly, Professor of Business of the University of Colorado (2002-2004) and Distinguished Visiting Professor of Business (2001-2002) of Thunderbird (American Graduate School of International Management), Glendale, AZ. | 75 | Director of Red Robin Gourmet Burgers, Inc. | ||||||||||||||||||
| William D. Stewart 151 Detroit Street Denver, CO 80206 DOB: 1944 | Trustee | 9/93-Present | Corporate Vice President and General Manager of MKS Instruments – HPS Products, Boulder, CO (a manufacturer of vacuum fittings and valves). | 75 | N/A | ||||||||||||||||||
| Martin H. Waldinger 151 Detroit Street Denver, CO 80206 DOB: 1938 | Trustee | 9/93-Present | Private Investor and Consultant to California Planned Unit Developments (since 1994). Formerly, CEO and President of Marwal, Inc. (homeowner association management company). | 75 | N/A | ||||||||||||||||||
| Linda S. Wolf 151 Detroit Street Denver, CO 80206 DOB: 1947 | Trustee | 12/05-Present | Retired. Formerly, Chairman and Chief Executive Officer of Leo Burnett (Worldwide) (advertising agency) (2001-2005). | 75 | Director of Wal-Mart, The Field Museum of Natural History (Chicago, IL), Children's Memorial Hospital (Chicago, IL), Chicago Council on Foreign Relations, Economic Club of Chicago, and InnerWorkings (U.S. provider of print procurement solutions). | ||||||||||||||||||
Janus Aspen Series December 31, 2007 31
Trustees and Officers (unaudited) (continued)
Officers
| Name, Address, and Age | Positions Held with Portfolio | Term of Office* and Length of Time Served | Principal Occupations During the Past Five Years | ||||||||||||
| Jason P. Yee 151 Detroit Street Denver, CO 80206 DOB: 1969 | Executive Vice President and Portfolio Manager Janus Aspen Foreign Stock Portfolio | 3/01-Present | Vice President of Janus Capital and Portfolio Manager for other Janus accounts. | ||||||||||||
| Stephanie Grauerholz-Lofton 151 Detroit Street Denver, CO 80206 DOB: 1970 | Chief Legal Counsel and Secretary Vice President | 1/06-Present 3/06-Present | Vice President and Assistant General Counsel of Janus Capital, and Vice President and Assistant Secretary of Janus Distributors LLC. Formerly, Assistant Vice President of Janus Capital and Janus Distributors LLC (2006), and Associate of Vedder, Price, Kaufman & Kammholz, P.C. (1999-2003). | ||||||||||||
| Andrew J. Iseman 151 Detroit Street Denver, CO 80206 DOB: 1964 | President and Chief Executive Officer | 3/07-Present | Chief Operating Officer and Senior Vice President of Janus Capital Group, Inc. and Janus Capital; President of Janus Services LLC; and Director of Capital Group Partners, Inc. Formerly, Senior Vice President of Enhanced Investment Technologies, LLC (2005-2007); and Vice President of Janus Capital (2003-2005) and Janus Services LLC (2003-2004). | ||||||||||||
| David R. Kowalski 151 Detroit Street Denver, CO 80206 DOB: 1957 | Vice President, Chief Compliance Officer, and Anti-Money Laundering Officer | 6/02-Present | Senior Vice President and Chief Compliance Officer of Janus Capital, Janus Distributors LLC, and Janus Services LLC; Chief Compliance Officer of Bay Isle Financial LLC; and Vice President of Enhanced Investment Technologies, LLC. Formerly, Chief Compliance Officer of Enhanced Investment Technologies, LLC (2003-2005); Vice President of Janus Capital (2000-2005) and Janus Services LLC (2004-2005); and Assistant Vice President of Janus Services LLC (2000-2004). | ||||||||||||
| Jesper Nergaard 151 Detroit Street Denver, CO 80206 DOB: 1962 | Chief Financial Officer Vice President, Treasurer, and Principal Accounting Officer | 3/05-Present 2/05-Present | Vice President of Janus Capital. Formerly, Director of Financial Reporting for OppenheimerFunds, Inc. (2004-2005); Site Manager and First Vice President of Mellon Global Securities Services (2003); and Director of Fund Accounting, Project Development, and Training of INVESCO Funds Group (1994-2003). | ||||||||||||
*Officers are elected at least annually by the Trustees for a one-year term and may also be elected from time to time by the Trustees for an interim period.
32 Janus Aspen Series December 31, 2007
Notes
Janus Aspen Series December 31, 2007 33
Janus provides access to a wide range of investment disciplines.
Growth
Janus growth portfolios focus on companies believed to be the leaders in their respective industries, with solid management teams, expanding market share, margins and efficiencies.
Core
Janus core portfolios seek investments in more stable and predictable companies. These portfolios look for a strategic combination of steady growth and for certain portfolios, some degree of income.
Risk-Managed
Our risk-managed portfolios seek to outperform their respective indices while maintaining a risk profile equal to or lower than the index itself. Managed by INTECH (a Janus subsidiary), these portfolios use a mathematical process in an attempt to build a more "efficient" portfolio than the index.
Value
Janus value portfolios invest in companies they believe are poised for a turnaround or are trading at a significant discount to fair value. The goal is to gain unique insight into a company's true value and identify and evaluate potential catalysts that may unlock shareholder value.
International & Global
Janus international and global portfolios seek to leverage Janus' research capabilities by taking advantage of inefficiencies in foreign markets, where accurate information and analytical insight are often at a premium.
Bond
Janus bond portfolios attempt to provide less risk relative to equities while seeking to deliver a competitive total return through high current income and appreciation.
Money Market
Janus money market portfolios seek maximum current income consistent with stability of capital.
For more information about our funds, contact your investment professional or go to www.janus.com/info
Please consider the charges, risks, expenses and investment objectives carefully before investing. For a prospectus containing this and other information, please call Janus at 1-800-525-0020 or download the file from www.janus.com/info. Read it carefully before you invest or send money.
An investment in a money market portfolio is not insured or guaranteed by the Federal Deposit Insurance Corporation or any other government agency. Although the Portfolio seeks to preserve the value of your investment at $1.00 per share, it is possible to lose money by investing in the Portfolio.

151 Detroit Street
Denver, CO 80206
1-800-525-0020
Portfolio distributed by Janus Distributors LLC (2/08)
C-0108-357 109-02-716 02-08
2007 Annual Report
Janus Aspen Series
Janus Aspen Forty Portfolio
Look Inside. . .
• Portfolio management perspective
• Investment strategy behind your portfolio
• Portfolio performance, characteristics and holdings

Table of Contents
| Useful Information About Your Portfolio Report | 1 | ||||||
| Management Commentary and Schedule of Investments | 2 | ||||||
| Statement of Assets and Liabilities | 9 | ||||||
| Statement of Operations | 10 | ||||||
| Statements of Changes in Net Assets | 11 | ||||||
| Financial Highlights | 12 | ||||||
| Notes to Schedule of Investments | 13 | ||||||
| Notes to Financial Statements | 14 | ||||||
| Report of Independent Registered Public Accounting Firm | 22 | ||||||
| Additional Information | 23 | ||||||
| Explanations of Charts, Tables and Financial Statements | 26 | ||||||
| Designation Requirements | 29 | ||||||
| Trustees and Officers | 30 | ||||||
Please consider the charges, risks, expenses and investment objectives carefully before investing. For a prospectus containing this and other information, please call Janus at 1-800-525-0020 or download the file from www.janus.com/info. Read it carefully before you invest or send money.
Useful Information About Your Portfolio Report
Management Commentary
The Management Commentary in this report includes valuable insight from the Portfolio's manager as well as statistical information to help you understand how your Portfolio's performance and characteristics stack up against those of comparable indices.
Please keep in mind that the opinions expressed by the Portfolio's manager in the Management Commentary are just that: opinions. They are a reflection of the manager's best judgment at the time this report was compiled, which was December 31, 2007. As the investing environment changes, so could the manager's opinions. The views are unique to the manager and aren't necessarily shared by his fellow employees or by Janus in general.
Portfolio Expenses
We believe it's important for our shareholders to have a clear understanding of Portfolio expenses and the impact they have on investment return.
The following is important information regarding the Portfolio's Expense Example, which appears in the Management Commentary within this Annual Report. Please refer to this information when reviewing the Expense Example for the Portfolio.
Example
As a shareholder of a Portfolio, you incur two types of costs: (1) transaction costs, including redemption fees (where applicable) (and any related exchange fees) and (2) ongoing costs, including management fees; distribution and shareholder servicing (12b-1) fees (applicable to Service Shares only); and other Portfolio expenses. The example is intended to help you understand your ongoing costs (in dollars) of investing in a Portfolio and to compare these costs with the ongoing costs of investing in other mutual funds. To do so, compare this 5% hypothetical example with the 5% hypothetical examples that appear in the shareholder reports of the other funds. The example is based upon an investment of $1,000 invested at the beginning of the period and held for the six-month period from July 1, 2007 to December 31, 2007.
Actual Expenses
The first line of the table in each example provides information about actual account values and actual expenses. You may use the information in this line, together with the amount you invested, to estimate the expenses that you paid over the period. Simply divide your account value by $1,000 (for example, an $8,600 account value divided by $1,000 = 8.6), then multiply the result by the number in the first line under the heading entitled "Expenses Paid During Period" to estimate the expenses you paid on your account during the period.
Hypothetical Example for Comparison Purposes
The second line of the table in each example provides information about hypothetical account values and hypothetical expenses based upon the Portfolio's actual expense ratio and an assumed rate of return of 5% per year before expenses which is not the Portfolio's actual return. The hypothetical account values and expenses may not be used to estimate the actual ending account balance or expenses you paid for the period. You may use this information to compare the ongoing costs of investing in the Portfolio and other funds. To do so, compare this 5% hypothetical example with the 5% hypothetical examples that appear in the shareholder reports of the other funds.
Please note that the expenses shown in the tables are meant to highlight your ongoing costs only and do not reflect any transaction costs, such as redemption fees (where applicable) and any charges at the separate account level or contract level. Redemption fees are fully described in the prospectus. Therefore, the second line of each table is useful in comparing ongoing costs only, and will not help you determine the relative total costs of owning different funds. In addition, if these transaction costs and separate account or contract level charges were included, your costs would have been higher.
Janus Aspen Series December 31, 2007 1
Janus Aspen Forty Portfolio (unaudited)
Portfolio Snapshot
This high conviction portfolio invests primarily in companies we believe have sustainable businesses with large addressable markets that trade at attractive valuations.

Scott Schoelzel
portfolio manager
This will be my last letter to you as the portfolio manager of Janus Aspen Forty Portfolio. After more than 10 years as the Portfolio's manager I will be leaving Janus and turning the Portfolio over to its new manager, Ron Sachs, effective January 1, 2008. I am proud of the work we have done these past 10 years and the record we have built. From the highs of the late 1990s to the lows in the earlier part of this decade and then back on top again these past five years, what a journey. I want to thank each of you for your continued confidence and investment in the Portfolio along the way. It would have been easy to walk away when things were tough but I am proud to have persevered, like each of you, to celebrate the Portfolio's successes, as you will read about below.
Performance Overview
For the year ended December 31, 2007 Janus Aspen Forty Portfolio's Institutional Shares and Service Shares returned 36.99% and 36.63%, respectively. This compares to an 11.81% return for the Russell 1000® Growth Index, the Portfolio's primary benchmark, and a 5.49% return for its secondary benchmark, the S&P 500® Index. In addition to the Portfolio's performance, the operating metrics of the Portfolio remain stellar. Turnover moderated from an already low relative level to 23.56% (annualized), and the Portfolio's expenses remain amongst the most competitive in the industry at 0.70% for its Institutional Shares as of the current prospectus. When these returns are added to the results we have delivered in previous years, Janus Aspen Forty Portfolio's performance record places it in either the first or second percentile of all Lipper Variable Annuity (VA) Large-Cap Growth Portfolios for the past 1-, 3-, 5- and 10-year periods.
| Average Annual Returns | |||||||||||||||||||
| As of December 31, 2007 | One Year | Three Years | Five Years | Ten Years | |||||||||||||||
| Lipper Quartile | 1 | st | 1 | st | 1 | st | 1 | st | |||||||||||
| Rank | (1 out of 204) | (2 out of 194) | (1 out of 165) | (1 out of 54) | |||||||||||||||
| Percentile | 1 | st | 2 | nd | 1 | st | 2 | nd | |||||||||||
| Janus Aspen Forty Portfolio Institutional Shares | 36.99 | % | 19.12 | % | 19.22 | % | 13.14 | % | |||||||||||
| Russell 1000® Growth Index | 11.81 | % | 8.68 | % | 12.11 | % | 3.83 | % | |||||||||||
| S&P 500® Index | 5.49 | % | 8.62 | % | 12.83 | % | 5.91 | % | |||||||||||
Annual expense ratio of Janus Aspen Forty Portfolio's Institutional Shares as of the current prospectus: 0.70%
Lipper rankings based on total returns for Lipper VA Large-Cap Growth Portfolios as of 12/31/2007. Data presented reflects past performance, which is no guarantee of future results. Investment results and principal value will fluctuate so that shares, when redeemed, may be worth more or less than their original cost. Due to market volatility, current performance may be higher or lower than the performance shown. Call 877-33JANUS or visit janus.com/info for performance current to the most recent month-end.
What Went Right
One criticism often leveled at Janus is that we are "momentum" investors. I have heard this again recently as some of our larger, more successful holdings in Janus Aspen Forty Portfolio have become quite popular recently in the financial media. Over the past year the five biggest contributors to Janus Aspen Forty Portfolio's performance have been our investments in Potash Corporation of Saskatchewan, the world's largest miner of potash; Intuitive Surgical, the leading manufacturer of computer aided surgery systems; Research In Motion (RIMM), the maker of the increasingly popular BlackBerry mobile computing device; Apple; and Hess
Corp., an independent, vertically integrated oil company. While many of these companies are coming to the forefront of investors' minds today, investors in Janus Aspen Forty Portfolio and readers of this letter may remember that we have talked about many of these investments in years past. For example, the single biggest contributor to the Portfolio's performance this year was our investment in Potash Corporation, Our investment in Potash was initiated nearly two years ago in January of 2006. Our investment in Intuitive Surgical, the second largest contributor to the Portfolio's performance this year, was established in February of 2006. Our position in RIMM, the maker of the wildly successful
2 Janus Aspen Series December 31, 2007
(unaudited)
BlackBerry mobile communication devices, was established three years ago in January of 2005; and Apple nearly two years ago in February of 2006. Hess, the newcomer to the group, was initiated in May of 2006. So while many of these names are gaining popularity now, the picture was not nearly so clear a few years ago when we started to make these investments. And remember, it is not like we own 150 stocks and have "cherry picked" a few examples to make a point; we only have a handful of stocks in the entire Portfolio and the ones depicted here were limited solely to the top five performance contributors.
Over a longer period of time, some of the other biggest contributors to the Portfolio's long-term performance which are still owned in the Portfolio include Goldman Sachs Group, an investment initiated in January of 2001 and Roche Holdings A.G. initiated in July of 2006. I could go on and on, but the common thread among all of these early, timely investments is Janus' research. To that end, I would once again like to thank all of the Janus research analysts and my fellow portfolio managers, past and present, for all of their work and contributions to Janus Aspen Forty Portfolio's success over the years. It is clear to me that it is a myth that Janus is a group of "momentum" investors. Janus is a research-centric money management firm.
What Went Wrong
Although Janus Aspen Forty Portfolio had a strong year, not everything went our way. During 2007 we began to initiate some investments in a number of the leading brokerage firms as the "subprime" issue began to unfold. Thus far these "starter" positions have hurt the Portfolio's performance. To put this in a bit of context, three of the worst performing investments in Janus Aspen Forty Portfolio this past year were our positions in Merrill Lynch, Bear Stearns and Lehman Brothers Holdings. The detriment to performance has been (1.39)%, (1.26)% and (0.51)%, respectively, for a total of (3.16)%. Our single position in Potash Corporation, described above, contributed 8.10% during the same period. So while I never like to lose money, sometimes, as we wade into a tumultuous opportunity, the short term can go against us. We continue to monitor the evolving "subprime" landscape and its potential "ripple effect" and are confident that we will strike the right balance between prudence and opportunity.
Outlook
As for the market itself, I have never been very comfortable trying to guess which way the indices might zig or zag. The U.S. economy is certainly not short of challenges and it seems that the subprime issue looms larger every day. Despite this headwind, the rest of the world seems to be embracing the fruits of capitalism and continues to enjoy relatively stable growth, for now. I do worry about the increasing difficultly in finding and developing new supplies of energy and the associated adverse ripple effects that any shortages may have on the world's economy. I do believe the Portfolio is well positioned with its energy exposure, but severe disruptions could have profoundly adverse broader effects. More optimistically, I continue to marvel at the rate of innovation in everything from technology-centric entertainment, to global financial services, to genetics, to undersea oil exploration and everything in between. In the end, I am confiden t that there will always be companies who are providing innovative products and services that will prove to be good investments too. I continue to believe that the key to investment success is stock-specific research; broad generalizations can be both difficult and costly.
As I say goodbye, I would like to thank each of you for your continued confidence and investment in Janus Aspen Forty Portfolio. The past 10 years have been exhilarating and I cannot begin to express how humbled and how proud I am to have been entrusted with your investments. It would have been easy to walk away in the midst of the poor performance and Janus' regulatory troubles earlier this decade. But like each of you and so many of my colleagues at Janus, I am proud to have persevered. The investment performance of the Portfolio is once again indisputably among the best in the industry and the resultant sense of both "going out on top" and having "completed the bargain" is very gratifying. I will miss all of my colleagues and friends at Janus and wish all of you only success in your investing future.
Thank you for your continued investment in Janus Aspen Forty Portfolio.
Janus Aspen Series December 31, 2007 3
Janus Aspen Forty Portfolio (unaudited)
Janus Aspen Forty Portfolio At a Glance
5 Largest Contributors to Performance – Holdings
| Contribution | |||||||
| Potash Corporation of Saskatchewan, Inc. (U.S. Shares) | 8.10% | ||||||
| Intuitive Surgical, Inc. | 7.36 | % | |||||
| Research In Motion, Ltd. (U.S. Shares) | 6.68 | % | |||||
| Apple, Inc. | 3.53 | % | |||||
| Hess Corp. | 3.24 | % | |||||
5 Largest Detractors from Performance – Holdings
| Contribution | |||||||
| Merrill Lynch & Company, Inc. | (1.39 | )% | |||||
| Bear Stearns Companies, Inc. | (1.26 | )% | |||||
| Celgene Corp. | (1.05 | )% | |||||
| Lehman Brothers Holdings, Inc. | (0.51 | )% | |||||
| Wells Fargo & Co. | (0.40 | )% | |||||
5 Largest Contributors to Performance – Sectors
| Portfolio Contribution | Portfolio Weighting (% of Net Assets) | Russell 1000® Growth Index Weighting | |||||||||||||
| Information Technology | 13.25 | % | 16.58 | % | 27.10 | % | |||||||||
| Materials | 12.85 | % | 13.59 | % | 3.06 | % | |||||||||
| Health Care | 7.73 | % | 21.28 | % | 16.60 | % | |||||||||
| Energy | 6.79 | % | 11.77 | % | 6.25 | % | |||||||||
| Consumer Staples | 2.33 | % | 7.25 | % | 9.83 | % | |||||||||
5 Lowest Contributors/Detractors to Performance – Sectors
| Portfolio Contribution | Portfolio Weighting (% of Net Assets) | Russell 1000® Growth Index Weighting | |||||||||||||
| Financials | (3.28 | )% | 13.77 | % | 7.83 | % | |||||||||
| Utilities | 0.00 | % | 0.00 | % | 1.50 | % | |||||||||
| Telecommunication Services | 0.00 | % | 0.00 | % | 0.86 | % | |||||||||
| Industrials | 0.23 | % | 1.47 | % | 13.68 | % | |||||||||
| Consumer Discretionary | 1.37 | % | 14.29 | % | 13.30 | % | |||||||||
4 Janus Aspen Series December 31, 2007
(unaudited)
5 Largest Equity Holdings – (% of Net Assets)
| As of December 31, 2007 | |||
| Potash Corporation of Saskatchewan, Inc. (U.S. Shares) Agricultural Chemicals | 8.5% | ||||||
| Intuitive Surgical, Inc. Medical Instruments | 7.4 | % | |||||
| Research In Motion, Ltd. (U.S. Shares) Computers | 7.3 | % | |||||
| Google, Inc. - Class A Web Portals/Internet Service Providers | 6.3 | % | |||||
| Las Vegas Sands Corp. Casino Hotels | 5.8 | % | |||||
| 35.3 | % | ||||||
Asset Allocation – (% of Net Assets)
As of December 31, 2007

Emerging markets comprised 4.2% of total net assets.
Top Country Allocations – Long Positions (% of Investment Securities)
| As of December 31, 2007 | As of December 31, 2006 | ||||||
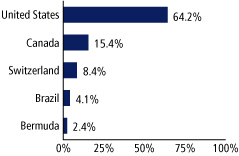 |  | ||||||
Janus Aspen Series December 31, 2007 5
Janus Aspen Forty Portfolio (unaudited)
Performance
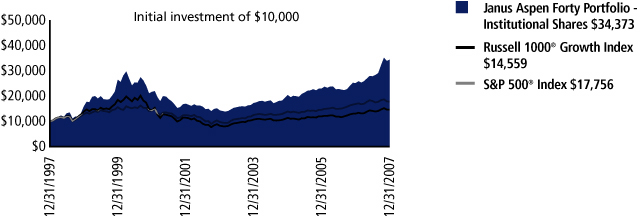
| Average Annual Total Return – for the periods ended December 31, 2007 | Expense Ratios – for the fiscal year ended December 31, 2006 | ||||||||||||||||||||||
| One Year | Five Year | Ten Year | Since Inception* | Total Annual Fund Operating Expenses | |||||||||||||||||||
| Janus Aspen Forty Portfolio - Institutional Shares | 36.99 | % | 19.22 | % | 13.14 | % | 14.78 | % | 0.70 | % | |||||||||||||
| Janus Aspen Forty Portfolio - Service Shares | 36.63 | % | 18.94 | % | 12.75 | % | 14.43 | % | 0.95 | % | |||||||||||||
| Russell 1000® Growth Index | 11.81 | % | 12.11 | % | 3.83 | % | 5.53 | % | |||||||||||||||
| S&P 500® Index | 5.49 | % | 12.83 | % | 5.91 | % | 7.60 | % | |||||||||||||||
| Lipper Quartile - Institutional Shares | 1 | st | 1 | st | 1 | st | 1 | st | |||||||||||||||
| Lipper Ranking - Institutional Shares based on total returns for Variable Annuity Large-Cap Growth Funds | 1/204 | 1/165 | 1/54 | 1/50 | |||||||||||||||||||
Visit janus.com/info to view up-to-date
performance and characteristic information
Data presented reflects past performance, which is no guarantee of future results. Investment results and principal value will fluctuate so that shares, when redeemed, may be worth more or less than their original cost. Due to market volatility, current performance may be higher or lower than the performance shown. Call 877.33JANUS or visit www.janus.com/info for performance current to the most recent month-end.
The Portfolio's expense ratio was determined based on average net assets as of the fiscal year ended December 31, 2006. Detailed information is available in the prospectus. All expenses are shown without the effect of expense offset arrangements. Pursuant to such arrangements, credits realized as a result of uninvested cash balances are used to reduce custodian and transfer agent expenses.
The Portfolio's performance may be affected by risks that include those associated with non-diversification and investments in specific industries or countries. Additional risks to the Portfolio may include those associated with investing in foreign securities, emerging markets, initial public offerings ("IPOs") and derivatives. Please see a Janus prospectus or www.janus.com/info for more information about risks, portfolio holdings and other details.
The use of short sales may cause the Portfolio to have higher expenses than those of other equity funds. Short sales are speculative transactions and involve special risks, including a greater reliance on the investment team's ability to accurately anticipate the future value of a security. The Portfolio's losses are potentially unlimited in a short sale transaction. The Portfolio's use of short sales in effect leverages the portfolio. The Portfolio's use of leverage may result in risks and can magnify the effect of any losses. There is no assurance that a leveraging strategy will be successful.
These returns do not reflect the charges and expenses of any particular insurance product or qualified plan. Returns shown would have been lower had they included insurance charges.
Returns include reinvestment of dividends from net investment income and distributions from capital gains. The returns shown do not reflect the deduction of taxes that a shareholder would pay on Portfolio distributions or the redemption of Portfolio shares.
Returns shown for Service Shares for periods prior to December 31, 1999 are derived from the historical performance of Institutional Shares, adjusted to reflect the higher operating expenses of Service Shares.
Total Annual Fund Operating Expenses include dividends or interest on short sales, which are paid to the lender of borrowed securities. Such expenses will vary depending on whether the securities the Portfolio sells short pay dividends or interest and the amount of such dividends or interest.
Lipper, a wholly-owned subsidiary of Reuters, provides independent insight on global collective investments including mutual funds, retirement funds, hedge funds, fund fees and expenses to the asset management and media communities. Lipper ranks the performance of mutual funds within a classification of funds that have similar investment objectives. Rankings are historical with capital gains and dividends reinvested and do not include the effect of loads.
Lipper ranking is for the Institutional Share class only; other classes may have different performance characteristics.
6 Janus Aspen Series December 31, 2007
(unaudited)
Portfolio Expenses
The example below shows you the ongoing costs (in dollars) of investing in your Portfolio and allows you to compare these costs with those of other mutual funds. Please refer to the section Useful Information About Your Portfolio Report for a detailed explanation of the information presented in these charts.
| Expense Example - Institutional Shares | Beginning Account Value (7/1/07) | Ending Account Value (12/31/07) | Expenses Paid During Period (7/1/07-12/31/07)(1) | ||||||||||||
| Actual | $ | 1,000.00 | $ | 1,237.30 | $ | 3.72 | |||||||||
| Hypothetical (5% return before expenses) | $ | 1,000.00 | $ | 1,021.88 | $ | 3.36 | |||||||||
| Expense Example - Service Shares | Beginning Account Value (7/1/07) | Ending Account Value (12/31/07) | Expenses Paid During Period (7/1/07-12/31/07)(1) | ||||||||||||
| Actual | $ | 1,000.00 | $ | 1,236.00 | $ | 5.13 | |||||||||
| Hypothetical (5% return before expenses) | $ | 1,000.00 | $ | 1,020.62 | $ | 4.63 | |||||||||
(1) Expenses are equal to the annualized expense ratio of 0.66% for Institutional Shares and 0.91% for Service Shares, multiplied by the average account value over the period, multiplied by 184/365 (to reflect the one-half year period).
May 31, 1997 is the date used to calculate the since-inception Lipper ranking, which is slightly different from when the Portfolio began operations since Lipper provides fund rankings as of the last day of the month.
There is no assurance that the investment process will consistently lead to successful investing.
See Notes to Schedule of Investments for index definitions.
The Portfolio may differ significantly from the securities held in the indices. The indices are unmanaged and not available for direct investment; therefore their performance does not reflect the expenses associated with the active management of an actual Portfolio.
See "Explanations of Charts, Tables and Financial Statements."
Effective January 1, 2008, Ron Sachs, CFA, is Portfolio Manager of Janus Aspen Forty Portfolio.
* The Portfolio's inception date – May 1, 1997
Janus Aspen Series December 31, 2007 7
Janus Aspen Forty Portfolio
Schedule of Investments
As of December 31, 2007
| Shares or Principal Amount | Value | ||||||||||
| Common Stock - 98.8% | |||||||||||
| Aerospace and Defense - 1.0% | |||||||||||
| 1,325,735 | BAE Systems PLC | $ | 13,140,981 | ||||||||
| Agricultural Chemicals - 15.2% | |||||||||||
| 262,445 | Monsanto Co. | 29,312,482 | |||||||||
| 765,955 | Potash Corporation of Saskatchewan, Inc. (U.S. Shares) | 110,266,881 | |||||||||
| 221,702 | Syngenta A.G. | 56,064,144 | |||||||||
| 195,643,507 | |||||||||||
| Agricultural Operations - 2.5% | |||||||||||
| 277,717 | Bunge, Ltd. | 32,329,036 | |||||||||
| Audio and Video Products - 2.4% | |||||||||||
| 576,587 | Sony Corp. (ADR) | 31,308,674 | |||||||||
| Casino Hotels - 5.8% | |||||||||||
| 729,810 | Las Vegas Sands Corp.*,# | 75,206,921 | |||||||||
| Computers - 11.7% | |||||||||||
| 287,730 | Apple, Inc.* | 56,993,558 | |||||||||
| 834,285 | Research In Motion, Ltd. (U.S. Shares)* | 94,607,918 | |||||||||
| 151,601,476 | |||||||||||
| Cosmetics and Toiletries - 3.3% | |||||||||||
| 576,085 | Procter & Gamble Co. | 42,296,161 | |||||||||
| Diversified Minerals - 4.2% | |||||||||||
| 1,667,225 | Companhia Vale do Rio Doce (ADR)# | 54,468,241 | |||||||||
| Entertainment Software - 0.9% | |||||||||||
| 191,397 | Electronic Arts, Inc.* | 11,179,499 | |||||||||
| Finance - Investment Bankers/Brokers - 6.5% | |||||||||||
| 154,945 | Bear Stearns Companies, Inc. | 13,673,896 | |||||||||
| 201,055 | Goldman Sachs Group, Inc. | 43,236,878 | |||||||||
| 202,397 | Lehman Brothers Holdings, Inc. | 13,244,860 | |||||||||
| 264,447 | Merrill Lynch & Company, Inc. | 14,195,515 | |||||||||
| 84,351,149 | |||||||||||
| Medical - Biomedical and Genetic - 4.1% | |||||||||||
| 838,427 | Celgene Corp.* | 38,743,712 | |||||||||
| 205,390 | Genentech, Inc.* | 13,775,507 | |||||||||
| 52,519,219 | |||||||||||
| Medical - Drugs - 2.0% | |||||||||||
| 148,595 | Roche Holding A.G. | 25,659,990 | |||||||||
| Medical Instruments - 7.4% | |||||||||||
| 294,645 | Intuitive Surgical, Inc.* | 95,612,302 | |||||||||
| Oil Companies - Exploration and Production - 5.3% | |||||||||||
| 149,997 | Apache Corp. | 16,130,677 | |||||||||
| 158,797 | EOG Resources, Inc. | 14,172,632 | |||||||||
| 493,010 | Occidental Petroleum Corp. | 37,956,841 | |||||||||
| 68,260,150 | |||||||||||
| Oil Companies - Integrated - 9.0% | |||||||||||
| 551,722 | ConocoPhillips | 48,717,053 | |||||||||
| 662,455 | Hess Corp. | 66,815,210 | |||||||||
| 115,532,263 | |||||||||||
| Oil Refining and Marketing - 1.1% | |||||||||||
| 201,415 | Valero Energy Corp. | 14,105,092 | |||||||||
| Optical Supplies - 2.3% | |||||||||||
| 209,666 | Alcon, Inc. (U.S. Shares) | 29,990,625 | |||||||||
| Retail - Apparel and Shoe - 0.9% | |||||||||||
| 190,904 | Industria de Diseno Textil S.A. | 11,687,833 | |||||||||
| Retail - Major Department Stores - 0.8% | |||||||||||
| 229,840 | J.C. Penney Company, Inc. | 10,110,662 | |||||||||
| Shares or Principal Amount | Value | ||||||||||
| Soap and Cleaning Preparations - 1.4% | |||||||||||
| 307,965 | Reckitt Benckiser PLC | $ | 17,862,105 | ||||||||
| Super-Regional Banks - 1.6% | |||||||||||
| 689,252 | Wells Fargo & Co. | 20,808,518 | |||||||||
| Therapeutics - 3.1% | |||||||||||
| 860,360 | Gilead Sciences, Inc.* | 39,585,164 | |||||||||
| Web Portals/Internet Service Providers - 6.3% | |||||||||||
| 117,414 | Google, Inc. - Class A* | 81,189,433 | |||||||||
| Total Common Stock (cost $702,429,736) | 1,274,449,001 | ||||||||||
| Money Market - 2.8% | |||||||||||
| 36,421,500 | Janus Institutional Cash Management Fund - Institutional Shares, 4.98% (cost $36,421,500) | 36,421,500 | |||||||||
| Other Securities - 1.7% | |||||||||||
| 14,978,623 | Allianz Dresdner Daily Asset Fund† | 14,978,623 | |||||||||
| 3,690,699 | Repurchase Agreements† | 3,690,699 | |||||||||
| 2,837,679 | Time Deposits† | 2,837,679 | |||||||||
| Total Other Securities (cost $21,507,001) | 21,507,001 | ||||||||||
| Total Investments (total cost $760,358,237) – 103.3% | 1,332,377,502 | ||||||||||
| Liabilities, net of Cash, Receivables and Other Assets – (3.3)% | (42,375,218 | ) | |||||||||
| Net Assets – 100% | $ | 1,290,002,284 | |||||||||
Summary of Investments by Country – (Long Positions)
| Country | Value | % of Investment Securities | |||||||||
| Bermuda | $ | 32,329,036 | 2.4 | % | |||||||
| Brazil | 54,468,241 | 4.1 | % | ||||||||
| Canada | 204,874,799 | 15.4 | % | ||||||||
| Japan | 31,308,674 | 2.3 | % | ||||||||
| Spain | 11,687,833 | 0.9 | % | ||||||||
| Switzerland | 111,714,759 | 8.4 | % | ||||||||
| United Kingdom | 31,003,086 | 2.3 | % | ||||||||
| United States†† | 854,991,074 | 64.2 | % | ||||||||
| Total | $ | 1,332,377,502 | 100.0 | % | |||||||
††Includes Short-Term Securities and Other Securities (59.8% excluding Short-Term Securities and Other Securities)
See Notes to Schedule of Investments and Financial Statements.
8 Janus Aspen Series December 31, 2007
Statement of Assets and Liabilities
| As of December 31, 2007 (all numbers in thousands except net asset value per share) | Janus Aspen Forty Portfolio | ||||||
| Assets: | |||||||
| Investments at cost(1) | $ | 760,358 | |||||
| Investments at value(1) | $ | 1,295,956 | |||||
| Affiliated money market investments | 36,422 | ||||||
| Cash | 236 | ||||||
| Receivables: | |||||||
| Portfolio shares sold | 1,082 | ||||||
| Dividends | 182 | ||||||
| Interest | 272 | ||||||
| Non-interested Trustees' deferred compensation | 21 | ||||||
| Other assets | 11 | ||||||
| Total Assets | 1,334,182 | ||||||
| Liabilities: | |||||||
| Payables: | |||||||
| Collateral for securities loaned (Note 1) | 21,507 | ||||||
| Investments purchased | 235 | ||||||
| Portfolio shares repurchased | 21,470 | ||||||
| Advisory fees | 701 | ||||||
| Transfer agent fees and expenses | 1 | ||||||
| Distribution fees - Service Shares | 155 | ||||||
| Non-interested Trustees' fees and expenses | 7 | ||||||
| Non-interested Trustees' deferred compensation fees | 21 | ||||||
| Accrued expenses | 83 | ||||||
| Total Liabilities | 44,180 | ||||||
| Net Assets | $ | 1,290,002 | |||||
| Net Assets Consist of: | |||||||
| Capital (par value and paid-in-surplus)* | $ | 1,193,340 | |||||
| Undistributed net investment income/(loss)* | 526 | ||||||
| Undistributed net realized gain/(loss) from investments and foreign currency transactions* | (475,885 | ) | |||||
| Unrealized appreciation/(depreciation) of investments, foreign currency translations and non-interested Trustees' deferred compensation | 572,021 | ||||||
| Total Net Assets | $ | 1,290,002 | |||||
| Net Assets - Institutional Shares | $ | 576,503 | |||||
| Shares Outstanding, $0.001 Par Value (unlimited shares authorized) | 13,999 | ||||||
| Net Asset Value Per Share | $ | 41.18 | |||||
| Net Assets - Service Shares | $ | 713,499 | |||||
| Shares Outstanding, $0.001 Par Value (unlimited shares authorized) | 17,489 | ||||||
| Net Asset Value Per Share | $ | 40.80 | |||||
* See Note 3 in Notes to Financial Statements.
(1) Investments at cost and value include $20,980,308 of securities loaned (Note 1).
See Notes to Financial Statements.
Janus Aspen Series December 31, 2007 9
Statement of Operations
| For the fiscal year ended December 31, 2007 (all numbers in thousands) | Janus Aspen Forty Portfolio | ||||||
| Investment Income: | |||||||
| Interest | $ | 2 | |||||
| Securities lending income | 72 | ||||||
| Dividends | 8,708 | ||||||
| Dividends from affiliates | 2,925 | ||||||
| Foreign tax withheld | (341 | ) | |||||
| Total Investment Income | 11,366 | ||||||
| Expenses: | |||||||
| Advisory fees | 6,616 | ||||||
| Transfer agent fees and expenses | 6 | ||||||
| Registration fees | 21 | ||||||
| Custodian fees | 65 | ||||||
| Professional fees | 12 | ||||||
| Printing expenses | 147 | ||||||
| Non-interested Trustees' fees and expenses | 30 | ||||||
| Distribution fees - Service Shares | 1,393 | ||||||
| Short sales dividend expense | 213 | ||||||
| Other expenses | 65 | ||||||
| Non-recurring costs (Note 2) | – | ||||||
| Costs assumed by Janus Capital Management LLC (Note 2) | – | ||||||
| Total Expenses | 8,568 | ||||||
| Expense and Fee Offset | (3 | ) | |||||
| Net Expenses | 8,565 | ||||||
| Net Investment Income/(Loss) | 2,801 | ||||||
| Net Realized and Unrealized Gain/(Loss) on Investments: | |||||||
| Net realized gain/(loss) from investments and foreign currency transactions | 15,570 | ||||||
| Net realized gain/(loss) from short sales | 322 | ||||||
| Change in net appreciation/(depreciation) of investments, foreign currency translations and non-interested Trustees' deferred compensation | 317,817 | ||||||
| Net Gain/(Loss) on Investments | 333,709 | ||||||
| Net Increase/(Decrease) in Net Assets Resulting from Operations | $ | 336,510 | |||||
See Notes to Financial Statements.
10 Janus Aspen Series December 31, 2007
Statements of Changes in Net Assets
| For the fiscal years ended December 31 | Janus Aspen Forty Portfolio | ||||||||||
| (all numbers in thousands) | 2007 | 2006 | |||||||||
| Operations: | |||||||||||
| Net investment income/(loss) | $ | 2,801 | $ | 2,318 | |||||||
| Net realized gain/(loss) from investment and foreign currency transactions | 15,570 | 163,641 | |||||||||
| Net realized gain/(loss) from short sales | 322 | 312 | |||||||||
| Change in net appreciation/(depreciation) of investments, foreign currency translations and non-interested Trustees' deferred compensation | 317,817 | (85,604 | ) | ||||||||
| Net Increase/(Decrease) in Net Assets Resulting from Operations | 336,510 | 80,667 | |||||||||
| Dividends and Distributions to Shareholders: | |||||||||||
| Net investment income* | |||||||||||
| Institutional Shares | (1,739 | ) | (1,551 | ) | |||||||
| Service Shares | (1,030 | ) | (616 | ) | |||||||
| Net realized gain/(loss) from investment transactions* | |||||||||||
| Institutional Shares | – | – | |||||||||
| Service Shares | – | – | |||||||||
| Net Decrease from Dividends and Distributions | (2,769 | ) | (2,167 | ) | |||||||
| Capital Share Transactions: | |||||||||||
| Shares sold | |||||||||||
| Institutional Shares | 96,218 | 46,364 | |||||||||
| Service Shares | 252,748 | 57,582 | |||||||||
| Reinvested dividends and distributions | |||||||||||
| Institutional Shares | 1,739 | 1,551 | |||||||||
| Service Shares | 935 | 616 | |||||||||
| Shares repurchased | |||||||||||
| Institutional Shares | (113,619 | ) | (210,298 | ) | |||||||
| Service Shares | (167,678 | ) | (114,240 | ) | |||||||
| Net Increase/(Decrease) from Capital Share Transactions | 70,343 | (218,425 | ) | ||||||||
| Net Increase/(Decrease) in Net Assets | 404,084 | (139,925 | ) | ||||||||
| Net Assets: | |||||||||||
| Beginning of period | 885,918 | 1,025,843 | |||||||||
| End of period | $ | 1,290,002 | $ | 885,918 | |||||||
| Undistributed net investment income/(loss)* | $ | 526 | $ | 286 | |||||||
* See Note 3 in Notes to Financial Statements.
See Notes to Financial Statements.
Janus Aspen Series December 31, 2007 11
Financial Highlights
Institutional Shares
| Janus Aspen Forty Portfolio | |||||||||||||||||||||||
| For a share outstanding during each fiscal year ended December 31 | 2007 | 2006 | 2005 | 2004 | 2003 | ||||||||||||||||||
| Net Asset Value, Beginning of Period | $ | 30.16 | $ | 27.68 | $ | 24.58 | $ | 20.84 | $ | 17.37 | |||||||||||||
| Income from Investment Operations: | |||||||||||||||||||||||
| Net investment income/(loss) | .15 | .13 | .06 | .06 | .08 | ||||||||||||||||||
| Net gain/(loss) on securities (both realized and unrealized) | 10.99 | 2.45 | 3.10 | 3.74 | 3.48 | ||||||||||||||||||
| Total from Investment Operations | 11.14 | 2.58 | 3.16 | 3.80 | 3.56 | ||||||||||||||||||
| Less Distributions and Other: | |||||||||||||||||||||||
| Dividends (from net investment income)* | (.12 | ) | (.10 | ) | (.06 | ) | (.06 | ) | (.09 | ) | |||||||||||||
| Distributions (from capital gains)* | – | – | – | – | – | ||||||||||||||||||
| Payment from affiliate | – | – | – | (1) | – | (1) | – | ||||||||||||||||
| Total Distributions and Other | (.12 | ) | (.10 | ) | (.06 | ) | (.06 | ) | (.09 | ) | |||||||||||||
| Net Asset Value, End of Period | $ | 41.18 | $ | 30.16 | $ | 27.68 | $ | 24.58 | $ | 20.84 | |||||||||||||
| Total Return | 36.99 | % | 9.35 | % | 12.85 | %(2) | 18.23 | %(2) | 20.54 | % | |||||||||||||
| Net Assets, End of Period (in thousands) | $ | 576,503 | $ | 439,009 | $ | 560,842 | $ | 502,681 | $ | 530,617 | |||||||||||||
| Average Net Assets for the Period (in thousands) | $ | 485,379 | $ | 474,784 | $ | 509,092 | $ | 495,684 | $ | 509,046 | |||||||||||||
| Ratio of Gross Expenses to Average Net Assets(3)(4) | 0.69 | %(5) | 0.70 | %(5) | 0.67 | % | 0.67 | % | 0.68 | % | |||||||||||||
| Ratio of Net Expenses to Average Net Assets(4) | 0.69 | %(5) | 0.70 | %(5) | 0.67 | % | 0.67 | % | 0.68 | % | |||||||||||||
| Ratio of Net Investment Income/(Loss) to Average Net Assets | 0.40 | % | 0.37 | % | 0.24 | % | 0.24 | % | 0.40 | % | |||||||||||||
| Portfolio Turnover Rate | 24 | % | 44 | % | 42 | % | 16 | % | 41 | % | |||||||||||||
Service Shares
| Janus Aspen Forty Portfolio | |||||||||||||||||||||||
| For a share outstanding during each fiscal year ended December 31 | 2007 | 2006 | 2005 | 2004 | 2003 | ||||||||||||||||||
| Net Asset Value, Beginning of Period | $ | 29.91 | $ | 27.45 | $ | 24.39 | $ | 20.68 | $ | 17.24 | |||||||||||||
| Income from Investment Operations: | |||||||||||||||||||||||
| Net investment income/(loss) | .06 | .03 | – | – | .03 | ||||||||||||||||||
| Net gain/(loss) on securities (both realized and unrealized) | 10.89 | 2.47 | 3.06 | 3.72 | 3.46 | ||||||||||||||||||
| Total from Investment Operations | 10.95 | 2.50 | 3.06 | 3.72 | 3.49 | ||||||||||||||||||
| Less Distributions: | |||||||||||||||||||||||
| Dividends (from net investment income)* | (.06 | ) | (.04 | ) | – | (.01 | ) | (.05 | ) | ||||||||||||||
| Distributions (from capital gains)* | – | – | – | – | – | ||||||||||||||||||
| Total Distributions | (.06 | ) | (.04 | ) | – | (.01 | ) | (.05 | ) | ||||||||||||||
| Net Asset Value, End of Period | $ | 40.80 | $ | 29.91 | $ | 27.45 | $ | 24.39 | $ | 20.68 | |||||||||||||
| Total Return | 36.63 | % | 9.12 | % | 12.56 | % | 17.97 | % | 20.23 | % | |||||||||||||
| Net Assets, End of Period (in thousands) | $ | 713,499 | $ | 446,909 | $ | 465,001 | $ | 437,777 | $ | 427,292 | |||||||||||||
| Average Net Assets for the Period (in thousands) | $ | 557,041 | $ | 439,970 | $ | 441,936 | $ | 423,061 | $ | 390,044 | |||||||||||||
| Ratio of Gross Expenses to Average Net Assets(3)(4) | 0.94 | %(5) | 0.95 | %(5) | 0.92 | % | 0.92 | % | 0.93 | % | |||||||||||||
| Ratio of Net Expenses to Average Net Assets(4) | 0.94 | %(5) | 0.95 | %(5) | 0.92 | % | 0.92 | % | 0.93 | % | |||||||||||||
| Ratio of Net Investment Income/(Loss) to Average Net Assets | 0.15 | % | 0.12 | % | (0.01 | )% | 0 | % | 0.15 | % | |||||||||||||
| Portfolio Turnover Rate | 24 | % | 44 | % | 42 | % | 16 | % | 41 | % | |||||||||||||
*See Note 3 in Notes to Financial Statements.
(1) Payment from affiliate aggregated less than $.01 on a per share basis for the fiscal year ended.
(2) During the fiscal year ended, Janus Capital and/or Janus Services LLC fully reimbursed the Portfolio for a loss on a transaction resulting from certain trading, pricing and/or shareholder activity errors, which otherwise would have reduced total return by less than 0.01%
(3) The effect of non-recurring costs assumed by Janus Capital (Note 2) is included in the ratio of gross expenses to average net assets and was less than 0.01% for the fiscal years ended 2007, 2006, 2005 and 2004.
(4) See "Explanations of Charts, Tables and Financial Statements."
(5) Ratio of Gross Expenses to Average Net Assets and Ratio of Net Expenses to Average Net Assets includes dividends on short positions. The ratio would be 0.67% for Institutional Shares and 0.92% for Service Shares in 2007 and 0.70% for Institutional Shares and 0.95% for Service Shares in 2006 without the inclusion of dividends on short positions.
See Notes to Financial Statements.
12 Janus Aspen Series December 31, 2007
Notes to Schedule of Investments
| Lipper Variable Annuity Large-Cap Growth Funds | Funds that, by portfolio practice, invest at least 75% of their equity assets in companies with market capitalizations (on a three-year weighted basis) greater than 300% of the dollar-weighted median market capitalization of the middle 1,000 securities of the S&P SuperComposite 1500 Index. Large-cap growth funds typically have an above-average price-to-earnings ratio, price-to-book ratio, and three-year sales-per-share growth value, compared to the S&P 500® Index. | ||||||
| Russell 1000® Growth Index | Measures the performance of those Russell 1000® companies with higher price-to-book ratios and higher forecasted growth values. | ||||||
| S&P 500® Index | The Standard & Poor's ("S&P") 500® Index is a commonly recognized, market capitalization weighted index of 500 widely held equity securities, designed to measure broad U.S. equity performance. | ||||||
| ADR | American Depositary Receipt | ||||||
| PLC | Public Limited Company | ||||||
| U.S. Shares | Securities of foreign companies trading on an American Stock Exchange. | ||||||
* Non-income-producing security.
# Loaned security; a portion or all of the security is on loan at December 31, 2007.
† The security is purchased with the cash collateral received from securities on loan (Note 1).
Janus Aspen Series December 31, 2007 13
Notes to Financial Statements
The following section describes the organization and significant accounting policies and provides more detailed information about the schedules and tables that appear throughout this report. In addition, the Notes to Financial Statements explain the methods used in preparing and presenting this report.
1. ORGANIZATION AND SIGNIFICANT ACCOUNTING POLICIES
Janus Aspen Forty Portfolio (the "Portfolio") is a series fund. The Portfolio is part of Janus Aspen Series (the "Trust"), which is organized as a Delaware statutory trust and is registered under the Investment Company Act of 1940, as amended (the "1940 Act") as an open-end management investment company. The Trust offers seventeen Portfolios, which include multiple series of shares, with differing investment objectives and policies. The Portfolio invests primarily in equity securities. The Portfolio is classified as nondiversified, as defined in the 1940 Act. The Portfolio is a no-load investment.
The Portfolio currently offers two classes of shares: Institutional Shares and Service Shares. Institutional Shares are offered only in connection with investment in and payments under variable insurance contracts and to qualified retirement plans. Service Shares are offered only in connection with investment in and payments under variable insurance contracts and to qualified retirement plans that require a fee from Portfolio assets to procure distribution and administrative services to contract owners and plan participants.
The following accounting policies have been consistently followed by the Portfolio and are in conformity with accounting principles generally accepted in the United States of America in the investment company industry.
Investment Valuation
Securities are valued at the last sales price or the official closing price for securities traded on a principal securities exchange (U.S. or foreign) and on the NASDAQ National Market. Securities traded on over-the-counter markets and listed securities for which no sales are reported are valued at the latest bid price (or yield equivalent thereof) obtained from one or more dealers transacting in a market for such securities or by a pricing service approved by the Portfolio's Trustees. Short-term securities with maturities of 60 days or less may be valued at amortized cost, which approximates market value. Debt securities with a remaining maturity of greater than 60 days are valued in accordance with the evaluated bid price supplied by the pricing service. The evaluated bid price supplied by the pricing service is an evaluation that reflects such factors as security prices, yields, maturities and ratings. Foreign securities and currencies ar e converted to U.S. dollars using the applicable exchange rate in effect as of the daily close of the New York Stock Exchange ("NYSE"). When market quotations are not readily available or deemed unreliable, or events or circumstances that may affect the value of portfolio securities held by the Portfolio are identified between the closing of their principal markets and the time the net asset value ("NAV") is determined, securities may be valued at fair value as determined in good faith under procedures established by and under the supervision of the Portfolio's Trustees. Circumstances in which fair value pricing may be utilized include, but are not limited to: (i) when significant events occur which may affect the securities of a single issuer, such as mergers, bankruptcies, or significant issuer specific developments; (ii) when significant events occur which may affect an entire market, such as natural disasters or significant governmen tal actions; and (iii) when non-significant events occur such as markets closing early or not opening, security trading halts, or pricing of non-valued securities and restricted or non-public securities. The Portfolio may use a systematic fair valuation model provided by an independent third party to value international equity securities in order to adjust for stale pricing, which may occur between the close of certain foreign exchanges and the NYSE.
Investment Transactions and Investment Income
Investment transactions are accounted for as of the date purchased or sold (trade date). Dividend income is recorded on the ex-dividend date. Certain dividends from foreign securities will be recorded as soon as the Trust is informed of the dividend if such information is obtained subsequent to the ex-dividend date. Dividends from foreign securities may be subject to withholding taxes in foreign jurisdictions. Interest income is recorded on the accrual basis and includes amortization of premiums and accretion of discounts. Gains and losses are determined on the identified cost basis, which is the same basis used for federal income tax purposes. Income, as well as gains and losses, both realized and unrealized, are allocated daily to each class of shares based upon the ratio of net assets represented by each class as a percentage of total net assets.
Expenses
The Portfolio bears expenses incurred specifically on its behalf as well as a portion of general expenses. Each class of shares bears expenses incurred specifically on its behalf and, in addition, each class bears a portion of general expenses, which may be based upon relative net assets of each class. Expenses are allocated daily to each class of shares based upon the ratio of net assets represented by each class as a percentage of total net assets. Expenses directly attributable to a specific class of shares are charged against the operations of such class.
Securities Lending
Under procedures adopted by the Trustees, the Portfolio may lend securities to qualified parties (typically brokers or other financial institutions) who need to borrow securities in order to complete certain transactions such as covering short sales, avoiding failures to deliver securities or completing arbitrage activities. The Portfolio may seek to earn additional income
14 Janus Aspen Series December 31, 2007
through securities lending. There is the risk of delay in recovering a loaned security or the risk of loss in collateral rights if the borrower fails financially. Janus Capital Management LLC ("Janus Capital") makes efforts to balance the benefits and risks from granting such loans.
State Street Bank and Trust Company served as the Portfolio's lending agent for the period January 1, 2007 through May 24, 2007. Effective May 25, 2007, Dresdner Bank AG became the lending agent for the Portfolio.
The Portfolio does not have the right to vote on securities while they are being lent; however, the Portfolio may attempt to call back the loan and vote the proxy if time permits. All loans will be continuously secured by collateral which may consist of cash, U.S. Government securities, domestic and foreign short-term debt instruments, letters of credit, time deposits, repurchase agreements, or such other collateral permitted by the Securities and Exchange Commission ("SEC"). Cash collateral may be invested in affiliated money market funds or other accounts advised by Janus Capital to the extent consistent with exemptive relief obtained from the SEC or as permitted by the 1940 Act and rules promulgated thereunder.
Dresdner Bank AG (the "Lending Agent") may also invest the cash collateral in the Allianz Dresdner Daily Asset Fund or investments in unaffiliated money market funds or accounts, mutually agreed to by the Portfolio and the Lending Agent, that comply with Rule 2a-7 of the 1940 Act relating to money market funds.
As of December 31, 2007, the Portfolio had on loan securities valued as indicated:
| Portfolio | Value at December 31, 2007 | ||||||
| Janus Aspen Forty Portfolio | $ | 20,980,308 | |||||
As of December 31, 2007, the Portfolio received cash collateral for securities lending activity as indicated:
| Portfolio | Cash Collateral at December 31, 2007 | ||||||
| Janus Aspen Forty Portfolio | $ | 21,507,001 | |||||
As of December 31, 2007, all cash collateral received by the Portfolio was invested in the Allianz Dresdner Daily Asset Fund, except for $3,690,699 and $2,837,679 which were invested in Repurchase Agreements and Time Deposits, respectively.
The value of the collateral must be at least 102% of the market value of the loaned securities that are denominated in U.S. dollars and 105% of the market value of the loaned securities that are not denominated in U.S. dollars. Loaned securities and related collateral are marked-to-market each business day based upon the market value of the loaned securities at the close of business, employing the most recent available pricing information. Collateral levels are then adjusted based on this mark-to-market evaluation.
The borrower pays fees at the Portfolio's direction to the Lending Agent. The Lending Agent may retain a portion of the interest earned on the cash collateral invested. The cash collateral invested by the Lending Agent is disclosed in the Schedule of Investments (if applicable). The lending fees and the Portfolio's portion of the interest income earned on cash collateral are included on the Statement of Operations (if applicable).
Interfund Lending
Pursuant to an exemptive order received from the SEC, the Portfolio may be party to an interfund lending agreement between the Portfolio and other Janus Capital sponsored mutual funds, which permits it to borrow or lend cash at a rate beneficial to both the borrowing and lending funds. Outstanding borrowings from all sources totaling 10% or more of the borrowing Portfolio's total assets must be collateralized at 102% of the outstanding principal value of the loan; loans of less than 10% may be unsecured. During the fiscal year ended December 31, 2007, there were no outstanding interfund borrowing or lending arrangements for the Portfolio.
Forward Currency Transactions
The Portfolio may enter into forward currency contracts in order to reduce its exposure to changes in foreign currency exchange rates on its foreign portfolio holdings and to lock in the U.S. dollar cost of firm purchase and sale commitments for securities denominated in or exposed to foreign currencies. A forward currency exchange contract is a commitment to purchase or sell a foreign currency at a future date at a negotiated rate. The gain or loss arising from the difference between the U.S. dollar cost of the original contract and the value of the foreign currency in U.S. dollars upon closing a contract is included in "Net realized gain/(loss) from investment and foreign currency transactions" on the Statement of Operations (if applicable).
Forward currency contracts held by the Portfolio are fully collateralized by other securities, which are denoted in the accompanying Schedule of Investments (if applicable). The collateral is evaluated daily to ensure its market value equals or exceeds the current market value of the corresponding forward currency contracts. As of December 31, 2007, the Portfolio was not invested in forward foreign currency contracts.
Futures Contracts
The Portfolio may enter into futures contracts to gain exposure to the stock market pending investment of cash balances or to meet liquidity needs. The Portfolio may also use such derivative instruments to hedge or protect from adverse movements in securities prices, currency rates or interest rates. The use of futures contracts may involve risks such as the possibility of illiquid markets or imperfect correlation between
Janus Aspen Series December 31, 2007 15
Notes to Financial Statements (continued)
the value of the contracts and the underlying securities, or that the counterparty will fail to perform its obligations.
Futures contracts are marked-to-market daily, and the daily variation margin is recorded as a receivable or payable on the Statement of Assets and Liabilities (if applicable). When a contract is closed, a realized gain or loss is recorded as "Net realized gain/(loss) from futures contracts" on the Statement of Operations (if applicable) equal to the difference between the opening and closing value of the contract. Generally, futures contracts are marked-to-market (i.e., treated as realized and subject to distribution) for federal income tax purposes at fiscal year-end. Securities designated as collateral for market value on futures contracts are noted in the Schedule of Investments (if applicable). Such collateral is in the possession of the Portfolio's custodian. As of December 31, 2007, the Portfolio was not invested in futures contracts.
Short Sales
The Portfolio may engage in "short sales against the box." Short sales against the box involve either selling short a security that the Portfolio owns, or selling short a security that the Portfolio has the right to obtain, for delivery at a specified date in the future. The Portfolio may enter into a short sale against the box to hedge against anticipated declines in the market price of portfolio securities by locking in gains. The Portfolio does not deliver from its portfolio the securities sold short and does not immediately receive the proceeds of the short sale. The Portfolio borrows the securities sold short and receives proceeds from the short sale only when it delivers the securities to the lender. If the value of the securities sold short increases prior to the scheduled delivery date, the Portfolio loses the opportunity to participate in the gain.
The Portfolio may engage in short sales when the portfolio manager anticipates that a security's market purchase price will be less than its borrowing price. To complete the transaction, the Portfolio must borrow the security to deliver it to the purchaser and buy that same security in the market to return it to the lender. The total market value of all of the Portfolio's short sale positions will not exceed 10% of its assets. Although the potential for gain is limited to the difference between the price at which the Portfolio sold the security short and the cost of borrowing the security, its potential for loss is theoretically unlimited because there is no limit to the cost of replacing the borrowed security. There is no assurance that the Portfolio will be able to close out a short position at a particular time or at an acceptable price. A gain or a loss will be recognized upon termination of a short sale. There is no limit to the size of any loss that the Portfolio may recognize upon termination of a short sale. Short sales held by the Portfolio are fully collateralized by other securities, which are denoted in the accompanying Schedule of Investments (if applicable). As of December 31, 2007, the Portfolio was not engaged in short sales.
Foreign Currency Translations
The Portfolio does not isolate that portion of the results of operations resulting from changes in foreign exchange rates on investments from the fluctuations arising from changes in market prices of securities held at the date of the financial statements. Net unrealized appreciation or depreciation on investments and foreign currency translation arise from changes in the value of assets and liabilities, including investments in securities held at the date of the financial statements, resulting from changes in the exchange rates and changes in market prices of securities held.
Currency gains and losses are also calculated on payables and receivables that are denominated in foreign currencies. The payables and receivables are generally related to foreign security transactions and income.
Foreign currency-denominated assets and forward currency contracts may involve more risks than domestic transactions, including currency risk, political and economic risk, regulatory risk and market risk. Risks may arise from the potential inability of a counterparty to meet the terms of a contract and from unanticipated movements in the value of foreign currencies relative to the U.S. dollar.
When-issued Securities
The Portfolio may purchase or sell securities on a when-issued or forward commitment basis. The price of the underlying securities and date when the securities will be delivered and paid for are fixed at the time the transaction is negotiated. Losses may arise due to changes in the market value of the securities or from the inability of counterparties to meet the terms of the contract. In connection with such purchases, the Portfolio may hold liquid assets as collateral with the Portfolio's custodian sufficient to cover the purchase price. As of December 31, 2007, the Portfolio was not invested in when-issued securities.
Equity-Linked Structured Notes
The Portfolio may invest in equity-linked structured notes. Equity-linked structured notes are derivative securities which are specially designed to combine the characteristics of one or more underlying securities and their equity derivatives in a single note form. The return and/or yield or income component may be based on the performance of the underlying equity securities, an equity index, and/or option positions. Equity-linked structured notes are typically offered in limited transactions by financial institutions in either registered or non-registered form. An investment in equity-linked structured notes creates exposure to the credit risk of the issuing financial institution, as well as to the market risk of the underlying securities. There is no guaranteed return of principal with these securities and the appreciation potential of these securities may be limited by a maximum payment or call right. In certain cases, equity-linked struc tured notes may be more volatile and less liquid than less complex securities or
16 Janus Aspen Series December 31, 2007
other types of fixed-income securities. Such securities may exhibit price behavior that does not correlate with other fixed-income securities. As of December 31, 2007, the Portfolio was not invested in equity-linked structured notes.
Initial Public Offerings
The Portfolio may invest in initial public offerings ("IPOs"). IPOs and other investment techniques may have a magnified performance impact on a fund with a small asset base. The Portfolio may not experience similar performance as its assets grow.
Restricted Security Transactions
Restricted securities held by the Portfolio may not be sold except in exempt transactions or in a public offering registered under the Securities Act of 1933. The risk of investing in such securities is generally greater than the risk of investing in the securities of widely held, publicly traded companies. Lack of a secondary market and resale restrictions may result in the inability of the Portfolio to sell a security at a fair price and may substantially delay the sale of the security. In addition, these securities may exhibit greater price volatility than securities for which secondary markets exist. As of December 31, 2007, the Portfolio was not invested in restricted securities.
Dividend Distributions
The Portfolio may make semiannual distributions of substantially all of its investment income and an annual distribution of its net realized capital gains (if any). The majority of dividends and net realized capital gains distributions from the Portfolio may be automatically reinvested into additional shares of the Portfolio, based upon the discretion of the shareholder.
Estimates
The preparation of financial statements in conformity with accounting principles generally accepted in the United States of America requires management to make estimates and assumptions that affect the reported amount of assets and liabilities and disclosure of contingent assets and liabilities at the date of the financial statements, and the reported amounts of income and expenses during the reporting period. Actual results could differ from those estimates.
Federal Income Taxes
No provision for income taxes is included in the accompanying financial statements, as the Portfolio intends to distribute to shareholders all taxable investment income and realized gains and otherwise comply with Subchapter M of the Internal Revenue Code applicable to regulated investment companies.
New Accounting Pronouncements
In July 2006, the Financial Accounting Standards Board ("FASB") issued Interpretation No. 48, "Accounting for Uncertainty in Income Taxes – an Interpretation of FASB Statement No. 109" (the "Interpretation"). The Interpretation establishes for all entities, including pass-through entities such as the Portfolio, a minimum threshold for financial statement recognition of the benefit of positions taken in filing tax returns (including whether an entity is taxable in a particular jurisdiction), and requires certain expanded tax disclosures. A calendar year open-end or closed-end fund was required to implement the Interpretation no later than June 29, 2007 (the last business day of the semi-annual reporting period), and the Interpretation also applies to all open tax years as of the date of effectiveness. Management has evaluated the application of the Interpretation to the Portfolio and has determined there is no significant impact on the Portfolio's financial statements.
In September 2006, the FASB issued Statement of Financial Accounting Standards No. 157, "Fair Value Measurements" ("SFAS No. 157"), which defines fair value, establishes a framework for measuring fair value in generally accepted accounting principles, and expands disclosures about fair value measurements. SFAS No. 157 does not require new fair value measurements, but is applied to the extent that other accounting pronouncements require or permit fair value measurements. SFAS No. 157 emphasizes that fair value is a market-based measurement that should be determined based on the assumptions that market participants would use in pricing an asset or liability. SFAS No. 157 is effective for fiscal years beginning after November 15, 2007 and interim periods within those fiscal years. Management does not believe the adoption of SFAS No. 157 will impact the financial statement amounts, however, the Portfolio will be required to disclose the extent t o which fair value is used to measure assets and liabilities and the inputs used to develop the measurements.
2. INVESTMENT ADVISORY AGREEMENTS AND OTHER TRANSACTIONS WITH AFFILIATES
The Portfolio pays a monthly advisory fee to Janus Capital based upon average daily net assets and calculated at the annual rate of 0.64%.
Janus Services LLC ("Janus Services"), a wholly-owned subsidiary of Janus Capital, is the Portfolio's transfer agent. Janus Services receives certain out-of-pocket expenses for transfer agent services.
Certain officers of the Portfolio may also be officers and/or directors of Janus Capital. Such officers receive no compensation from the Portfolio, except for the Portfolio's Chief Compliance Officer. Effective January 1, 2006, the Portfolio began reimbursing the adviser for a portion of the compensation paid to the Chief Compliance Officer of the Trust. Total compensation of $3,078 was paid by the Portfolio during the fiscal year ended December 31, 2007. The Portfolio's portion is reported as part of "Other Expenses" on the Statement of Operations.
Janus Aspen Series December 31, 2007 17
Notes to Financial Statements (continued)
The Board of Trustees has adopted a deferred compensation plan (the "Deferred Plan") for independent Trustees to elect to defer receipt of all or a portion of the annual compensation they are entitled to receive from the Portfolio. All deferred fees are credited to an account established in the name of the Trustees. The amounts credited to the account then increase or decrease, as the case may be, in accordance with the performance of one or more of the Janus funds that are selected by the Trustees. The account balance continues to fluctuate in accordance with the performance of the selected fund or funds until final payment of all amounts credited to the account. The fluctuation of the account balance is recorded by the Portfolio as unrealized appreciation/(depreciation) and is shown as of December 31, 2007 on the Statement of Assets and Liabilities as an asset, "Noninterested Trustees' deferred compensation," and a liability, "Nonintereste d Trustees' deferred compensation fees." Additionally, the recorded unrealized appreciation/(depreciation) is included in "Unrealized net appreciation/(depreciation) of investments, foreign currency translations and non-interested Trustees' deferred compensation" on the Statement of Assets and Liabilities. Deferred compensation expenses for the fiscal year ended December 31, 2007 are included in "Non-interested Trustees' fees and expenses" on the Statement of Operations. Trustees are allowed to change their designation of mutual funds from time to time. Amounts will be deferred until distributed in accordance with the Deferred Plan. No deferred fees were paid to any Trustee under the Deferred Plan during the fiscal year ended December 31, 2007.
For the fiscal year ended December 31, 2007, Janus Capital assumed $24,421 of legal, consulting and Trustee costs and fees incurred by the funds in Janus Investment Fund, Janus Aspen Series and Janus Adviser Series (the "Funds") in connection with the regulatory and civil litigation matters discussed in Note 6. These non-recurring costs were allocated to all Funds based on the Funds' respective net assets as of July 31, 2004. Additionally, all future non-recurring costs will be allocated to the Funds based on the Funds' respective net assets on July 31, 2004. These "Non-recurring costs" and "Costs assumed by Janus Capital" are shown on the Statement of Operations.
Janus Distributors LLC, a wholly-owned subsidiary of Janus Capital, is a distributor of the Portfolio. Service Shares have adopted a Distribution and Shareholder Servicing Plan (the "Plan") pursuant to Rule 12b-1 under the 1940 Act. The Plan authorizes payments by the Portfolio in connection with the distribution of Service Shares at an annual rate of up to 0.25% of Service Share's average daily net assets.
The Portfolio's expenses may be reduced by expense offsets from an unaffiliated custodian and/or transfer agent. Such credits or offsets are included in "Expense and Fee Offset" on the Statement of Operations. The transfer agent fee offsets received during the period reduce Transfer Agent Fees and Expenses. Custodian offsets received reduce Custodian Fees. The Portfolio could have employed the assets used by the custodian and/or transfer agent to produce income if it had not entered into an expense offset arrangement.
The Portfolio may invest in money market funds, including funds managed by Janus Capital. During the fiscal year ended December 31, 2007, the Portfolio recorded distributions from affiliated investment companies as affiliated dividend income, and had the following affiliated purchases and sales:
| Purchases Shares/Cost | Sales Shares/Cost | Dividend Income | Value at 12/31/07 | ||||||||||||||||
| Janus Aspen Forty Portfolio | |||||||||||||||||||
| Janus Institutional Cash Management Fund – Institutional Shares | $ | 174,295,060 | $ | 137,873,560 | $ | 2,251,669 | $ | 36,421,500 | |||||||||||
| Janus Institutional Cash Reserves Fund | 14,952,451 | 14,952,451 | 84,204 | – | |||||||||||||||
| Janus Institutional Money Market Fund – Institutional Shares | 133,044,072 | 133,044,072 | 408,390 | – | |||||||||||||||
| Janus Money Market Fund – Institutional Shares | 49,436,923 | 55,391,923 | 180,614 | – | |||||||||||||||
| $ | 371,728,506 | $ | 341,262,006 | $ | 2,924,877 | $ | 36,421,500 | ||||||||||||
3. FEDERAL INCOME TAX
The tax components of capital shown in the table below represent: (1) distribution requirements the Portfolio must satisfy under the income tax regulations; (2) losses or deductions the Portfolio may be able to offset against income and gains realized in future years; and (3) unrealized appreciation or depreciation of investments for federal income tax purposes (reduced by foreign tax liability).
In 2007, the Portfolio incurred "Post-October" losses during the period from November 1, 2007 through December 31, 2007. These losses will be deferred for tax purposes and recognized in 2008.
Other book to tax differences in the current year may consist of deferred compensation, derivatives, and foreign currency contract adjustments. The Portfolio has elected to treat gains and losses on forward foreign currency contracts as capital gains and losses. Other foreign currency gains and losses on debt instruments are treated as ordinary income for federal income tax purposes pursuant to Section 988 of the Internal Revenue Code.
Accumulated capital losses noted on the next page represent net capital loss carryovers, as of December 31, 2007, that may be available to offset future realized capital gains and thereby reduce future taxable gains distributions.
18 Janus Aspen Series December 31, 2007
| Portfolio | Undistributed Ordinary Income | Undistributed Long–Term Gains | Accumulated Capital Losses | Post-October Deferral | Other Book to Tax Differences | Net Tax Appreciation/ (Depreciation) | |||||||||||||||||||||
| Janus Aspen Forty Portfolio(1) | $ | 537,294 | $ | – | $ | (472,194,702 | ) | $ | (611,246 | ) | $ | (9,486 | ) | $ | 568,940,099 | ||||||||||||
(1) Capital loss carryover is subject to annual limitations.
The table below shows the expiration date of the carryovers.
Capital Loss Carryover Expiration Schedule
For the year ended December 31, 2007
| Portfolio | December 31, 2009 | December 31, 2010 | December 31, 2011 | ||||||||||||
| Janus Aspen Forty Portfolio(1) | $ | (176,789,231 | ) | $ | (149,006,480 | ) | $ | (146,398,991 | ) | ||||||
(1) Capital loss carryover is subject to annual limitations.
During the year ended December 31, 2007, the following capital loss carryover was utilized by the Portfolio as indicated in the table below.
| Portfolio | Capital Loss Carryover Utilized | ||||||
| Janus Aspen Forty Portfolio | $ | 15,937,035 | ) | ||||
The aggregate cost of investments and the composition of unrealized appreciation and depreciation of investment securities for federal income tax purposes as of December 31, 2007 are noted below.
Unrealized appreciation and unrealized depreciation in the table below exclude appreciation/depreciation on foreign currency translations. The primary difference between book and tax appreciation or depreciation of investments is wash sale loss deferrals.
| Portfolio | Federal Tax Cost | Unrealized Appreciation | Unrealized (Depreciation) | ||||||||||||
| Janus Aspen Forty Portfolio | $ | 763,437,403 | $ | 595,317,721 | $ | (26,377,622 | ) | ||||||||
Income and capital gains distributions are determined in accordance with income tax regulations that may differ from accounting principles generally accepted in the United States of America. These differences are due to differing treatments for items such as net short-term gains, deferral of wash sale losses, foreign currency transactions, net investment losses and capital loss carryovers. Certain permanent differences such as tax returns of capital and net investment losses noted below have been reclassified to paid-in capital.
| For the fiscal year ended December 31, 2007 | Distributions | ||||||||||||||||||
| Portfolio | From Ordinary Income | From Long-Term Capital Gains | Tax Return of Capital | Net Investment Loss | |||||||||||||||
| Janus Aspen Forty Portfolio | $ | 2,769,512 | $ | – | $ | – | $ | – | |||||||||||
| For the fiscal year ended December 31, 2006 | Distributions | ||||||||||||||||||
| Portfolio | From Ordinary Income | From Long-Term Capital Gains | Tax Return of Capital | Net Investment Loss | |||||||||||||||
| Janus Aspen Forty Portfolio | $ | 2,167,003 | $ | – | $ | – | $ | – | |||||||||||
Janus Aspen Series December 31, 2007 19
Notes to Financial Statements (continued)
4. CAPITAL SHARE TRANSACTIONS
| For each fiscal year ended December 31 | Janus Aspen Forty Portfolio | ||||||||||
| (all numbers in thousands) | 2007 | 2006 | |||||||||
| Transactions in Portfolio Shares – Institutional Shares | |||||||||||
| Shares sold | 2,668 | 1,660 | |||||||||
| Reinvested dividends and distributions | 46 | 54 | |||||||||
| Shares repurchased | (3,269 | ) | (7,423 | ) | |||||||
| Net Increase/(Decrease) in Portfolio Shares | (555 | ) | (5,709 | ) | |||||||
| Shares Outstanding, Beginning of Period | 14,554 | 20,263 | |||||||||
| Shares Outstanding, End of Period | 13,999 | 14,554 | |||||||||
| Transactions in Portfolio Shares – Service Shares | |||||||||||
| Shares sold | 7,192 | 2,070 | |||||||||
| Reinvested dividends and distributions | 25 | 22 | |||||||||
| Shares repurchased | (4,671 | ) | (4,087 | ) | |||||||
| Net Increase/(Decrease) in Portfolio Shares | 2,546 | (1,995 | ) | ||||||||
| Shares Outstanding, Beginning of Period | 14,943 | 16,938 | |||||||||
| Shares Outstanding, End of Period | 17,489 | 14,943 | |||||||||
5. PURCHASES AND SALES OF INVESTMENT SECURITIES
For the fiscal year ended December 31, 2007, the aggregate cost of purchases and proceeds from sales of investment securities (excluding short-term securities) were as follows:
| Portfolio | Purchases of Securities | Proceeds from Sales of Securities | Purchases of Long-Term U.S. Government Obligations | Proceeds from Sales of Long-Term U.S. Government Obligations | |||||||||||||||
| Janus Aspen Forty Portfolio | $ | 295,473,213 | $ | 234,551,912 | $ | – | $ | – | |||||||||||
6. PENDING LEGAL MATTERS
In the fall of 2003, the Securities and Exchange Commission ("SEC"), the Office of the New York State Attorney General ("NYAG"), the Colorado Attorney General ("COAG"), and the Colorado Division of Securities ("CDS") announced that they were investigating alleged frequent trading practices in the mutual fund industry. On August 18, 2004, Janus Capital announced that it had reached final settlements with the SEC, the NYAG, the COAG, and the CDS related to such regulators' investigations into Janus Capital's frequent trading arrangements.
A number of civil lawsuits were brought against Janus Capital and certain of its affiliates, the Janus funds, and related entities and individuals based on allegations similar to those announced by the above regulators and were filed in several state and federal jurisdictions. Such lawsuits alleged a variety of theories for recovery including, but not limited to, the federal securities laws, other federal statutes (including ERISA), and various common law doctrines. The Judicial Panel on Multidistrict Litigation transferred these actions to the U.S. District Court for the District of Maryland (the "Court") for coordinated proceedings. On September 29, 2004, five consolidated amended complaints were filed with the Court that generally include: (i) claims by a putative class of investors in certain Janus funds asserting claims on behalf of the investor class (Marini, et al. v. Janus Investment Fund, et al., U.S. District Court, District of Maryland, Case No. 04-CV-00497); (ii) derivative claims by investors in certain Janus funds ostensibly on behalf of such funds (Steinberg et al. v. Janus Capital Management, LLC et al., U.S. District Court, District of Maryland, Case No. 04-CV-00518); (iii) claims on behalf of participants in the Janus 401(k) plan (Wangberger v. Janus Capital Group Inc., 401(k) Advisory Committee, et al., U.S. District Court, District of Maryland, Case No. JFM-05-2711); (iv) claims brought on behalf of shareholders of Janus Capital Group Inc. ("JCGI") on a derivative basis against the Board of Directors of JCGI (Chasen v. Whiston, et al., U.S. District Court, District of Maryland, Case No. 04-MD-00855); and (v) claims by a putative class of shareholders of JCGI asserting claims on behalf of the shareholders (Wiggins, et al. v. Janus Capital Group, Inc., et al., U.S. District Court, District of Maryland, Case No. 04-CV-0081 8). Each of the five complaints initially named JCGI and/or Janus Capital as a defendant. In addition, the following were also named as defendants in one or more of the actions: Janus Investment Fund ("JIF"), Janus
20 Janus Aspen Series December 31, 2007
Aspen Series ("JAS"), Janus Adviser Series ("JAD"), Janus Distributors LLC, Enhanced Investment Technologies, LLC ("INTECH"), Bay Isle Financial LLC ("Bay Isle"), Perkins, Wolf, McDonnell and Company, LLC ("Perkins"), the Advisory Committee of the Janus 401(k) plan, and the current or former directors of JCGI.
On August 25, 2005, the Court entered orders dismissing most of the claims asserted against Janus Capital and its affiliates by fund investors in the Marini and Steinberg cases (actions (i) and (ii) above) except certain claims under Section 10(b) of the Securities Exchange Act of 1934 and under Section 36(b) of the Investment Company Act of 1940, as amended (the "1940 Act"). On August 15, 2006, the Wangberger complaint in the 401(k) plan class action (action (iii) above) was dismissed by the district court with prejudice. The plaintiff appealed that dismissal decision to the United States Court of Appeals for the Fourth Circuit. The appeal is still pending and argument in the matter was held in December 2007. The Court also dismissed the Chasen lawsuit (action (iv) above) against JCGI's Board of Directors without leave to amend. Finally, a Motion to Dismiss the Wiggins suit (action (v) above) was granted a nd the matter was dismissed in May 2007. However, in June 2007, Plaintiffs appealed that dismissal to the United States Court of Appeals for the Fourth Circuit. That appeal is currently pending.
In addition to the lawsuits described above, the Auditor of the State of West Virginia ("Auditor"), in his capacity as securities commissioner, has initiated administrative proceedings against many of the defendants in the market timing cases (including JCGI and Janus Capital) and, as a part of its relief, is seeking disgorgement and other monetary relief based on similar market timing allegations (In the Matter of Janus Capital Group Inc. et al., Before the Securities Commissioner, State of West Virginia, Summary Order No. 05-1320). The respondents in these proceedings collectively sought a Writ of Prohibition in state court, which was denied. Their subsequent Petition for Appeal was also denied. Consequently, in September 2006, JCGI and Janus Capital filed their answer to the Auditor's summary order instituting proceedings and requested a hearing. A status conference was held on June 28, 2007, during which the parties were ordered t o submit their proposed scheduling order. To date, no scheduling order has been entered in the case. In addition to the pending Motion to Discharge Order to Show Cause, JCGI and Janus Capital, as well as other similarly situated defendants, continue to challenge the statutory authority of the Auditor to bring such an action.
Additional lawsuits may be filed against certain of the Janus funds, Janus Capital, and related parties in the future. Janus Capital does not currently believe that these pending actions will materially affect its ability to continue providing services it has agreed to provide to the Janus funds.
Janus Aspen Series December 31, 2007 21
Report of Independent Registered Public
Accounting Firm
To the Trustees and Shareholders of
Janus Aspen Forty Portfolio
In our opinion, the accompanying statement of assets and liabilities, including the schedule of investments, and the related statements of operations and of changes in net assets and the financial highlights present fairly, in all material respects, the financial position of Janus Aspen Forty Portfolio (one of the portfolios constituting Janus Aspen Series, hereafter referred to as the "Portfolio") at December 31, 2007, the results of its operations for the year then ended, the changes in its net assets for each of the two years in the period then ended, and the financial highlights for each of the five years in the period then ended, in conformity with accounting principles generally accepted in the United States of America. These financial statements and financial highlights (hereafter referred to as "financial statements") are the responsibility of the Portfolio's management; our responsibility is to express an opinion on these financial statements based on our audits. We conducted our audits of these financial statements in accordance with the standards of the Public Company Accounting Oversight Board (United States). Those standards require that we plan and perform the audit to obtain reasonable assurance about whether the financial statements are free of material misstatement. An audit includes examining, on a test basis, evidence supporting the amounts and disclosures in the financial statements, assessing the accounting principles used and significant estimates made by management, and evaluating the overall financial statement presentation. We believe that our audits, which included confirmation of securities at December 31, 2007 by correspondence with the custodian, transfer agent and brokers, and the application of alternative auditing procedures where securities purchased had not been received, provide a reasonable basis for our opinion.

Denver, Colorado
February 15, 2008
22 Janus Aspen Series December 31, 2007
Additional Information (unaudited)
PROXY VOTING POLICIES AND VOTING RECORD
A description of the policies and procedures that the Portfolio uses to determine how to vote proxies relating to its portfolio securities is available: (i) without charge, upon request, by calling 1-800-525-0020 (toll free); (ii) on the Portfolio's website at www.janus.com/proxyvoting; and (iii) on the SEC's website at http://www.sec.gov. Additionally, information regarding the Portfolio's proxy voting record for the most recent twelve-month period ended June 30 is also available, free of charge, through www.janus.com/proxyvoting and from the SEC's website at http://www.sec.gov.
QUARTERLY PORTFOLIO HOLDINGS
The Portfolio files its complete portfolio holdings (schedule of investments) with the SEC for the first and third quarters of each fiscal year on Form N-Q within 60 days of the end of such fiscal quarter. The Portfolio's Form N-Q: (i) is available on the SEC's website at http://www.sec.gov; (ii) may be reviewed and copied at the SEC's Public Reference Room in Washington, D.C. (information on the Public Reference Room may be obtained by calling 1-800-SEC-0330); and (iii) is available without charge, upon request, by calling Janus at 1-800-525-0020 (toll free).
APPROVAL OF ADVISORY AGREEMENTS DURING THE PERIOD
The Trustees of Janus Aspen Series, none of whom has ever been affiliated with Janus Capital ("Independent Trustees"), oversee the management of each Portfolio and, as required by law, determine annually whether to continue the investment advisory agreement for each Portfolio and the subadvisory agreements for the three Portfolios that utilize subadvisers.
In connection with their most recent consideration of those agreements for each Portfolio, the Trustees received and reviewed a substantial amount of information provided by Janus Capital and the respective subadvisers in response to requests of the Independent Trustees and their independent legal counsel. They also received and reviewed a considerable amount of information and analysis provided by their independent fee consultant. Throughout their consideration of the agreements, the Independent Trustees were advised by their independent legal counsel. The Independent Trustees met with management to consider the agreements, and also met separately in executive session with their independent legal counsel and their independent fee consultant.
At a meeting held on December 14, 2007, based on their evaluation of the information provided by Janus Capital, the subadvisers and the independent fee consultant, as well as other information, the Trustees determined that the overall arrangements between each Portfolio and Janus Capital and each subadviser, as applicable, were fair and reasonable in light of the nature, extent and quality of the services provided by Janus Capital, its affiliates and the subadvisers, the fees charged for those services, and other matters that the Trustees considered relevant in the exercise of their business judgment. At that meeting the Trustees unanimously approved the continuation of the investment advisory agreement for each Portfolio, and the subadvisory agreement for each subadvised Portfolio, for the period from February 1, 2008 through February 1, 2009, subject to earlier termina tion as provided for in each agreement.
In considering the continuation of those agreements, the Trustees reviewed and analyzed various factors that they determined were relevant, including the factors described below, none of which by itself was considered dispositive. However, the material factors and conclusions that formed the basis for the Trustees' determination to approve the continuation of the agreements are discussed separately below.
Nature, Extent and Quality of Services
The Trustees reviewed the nature, extent and quality of the services provided by Janus Capital and the subadvisers to the Portfolios, taking into account the investment objective and strategy of each Portfolio, the knowledge of the Trustees gained from their regular meetings with management on at least a quarterly basis, and their ongoing review of information related to the Portfolios. In addition, the Trustees reviewed the resources and key personnel of Janus Capital and each subadviser, especially those who provide investment management services to the Portfolios. The Trustees also considered other services provided to the Portfolios by Janus Capital or the subadvisers, such as managing the execution of portfolio transactions and the selection of broker-dealers for those transactions, serving as the Portfolios' administrator, monitoring adherence to the Portfolios' investment restrictions, producing shareholder reports, providing support services for the Trustees and Trustee committees, communicating with shareholders, and overseeing the activities of other service providers, including monitoring compliance with various policies and procedures of the Portfolios and with applicable securities laws and regulations.
The Trustees concluded that the nature, extent and quality of the services provided by Janus Capital and/or the subadviser to each Portfolio were appropriate and consistent with the terms of the respective advisory and subadvisory agreements; that, taking into account steps taken to address those Portfolios whose performance lagged that of the median of their peers for certain periods, the quality of those services had been consistent with or superior to quality norms in the industry; and that the Portfolios were likely to benefit from the continued provision of those services. They also concluded that Janus Capital and each subadviser had sufficient personnel, with the appropriate education and experience, to serve the Portfolios effectively and had demonstrated its continuing ability to attract well-qualified personnel.
Janus Aspen Series December 31, 2007 23
Additional Information (unaudited) (continued)
Performance of the Portfolios
The Trustees considered the investment results of each Portfolio over various time periods. They reviewed information comparing each Portfolio's performance with the performance of comparable funds and peer groups identified by Lipper Inc., an independent provider of investment company data, and with the Portfolio's benchmark index. They concluded that the performance of many Portfolios was good to very good under current market conditions. Although the performance of some Portfolios lagged that of the median of their peers for certain periods, the Trustees also concluded that Janus Capital had taken appropriate steps to address those instances of under-performance and that the more recent performance of most of those Portfolios had been improving.
Costs of Services Provided
The Trustees examined information on the fees and expenses of each Portfolio in comparison to similar information for comparable funds as provided by Lipper. They also reviewed an analysis of that information provided by their independent fee consultant and noted that the rate of management (investment advisory and administrative) fees for most of the Portfolios, in some cases after contractual expense limitations, was below the mean management fee rate of the respective peer group of funds selected by Lipper.
The Trustees considered the methodology used by Janus Capital and each subadviser in determining compensation payable to portfolio managers, the competitive environment for investment management talent and the competitive market for mutual funds in different distribution channels. They concluded that the compensation methodology provided a good alignment of the interests of the portfolio managers with those of Portfolio shareholders.
The Trustees also reviewed management fees charged by Janus Capital to its separate account clients and to its subadvised funds (for which Janus Capital provides only services related to portfolio management). Although in most instances subadvisory and separate account fee rates for various investment strategies were lower than management fee rates for Portfolios having a similar strategy, the Trustees noted that, under the terms of the management agreements with the Portfolios, Janus Capital performs significant additional services for the Portfolios that it does not provide to those other clients, including administrative services, oversight of the Portfolios' other service providers, Trustee support, regulatory compliance and numerous other services, and that, in serving the Portfolios, Janus Capital assumes many legal risks that it does not assume in servicing its other clients. Moreover, the Trustees noted that the spread between the av erage fee rates charged to the Portfolios and the fee rates that Janus Capital charged to its separate account clients was significantly smaller than the average spread for such fee rates of other advisers, based on publicly available data and research conducted by their independent fee consultant.
The Trustees reviewed information on the profitability to Janus Capital and its affiliates of their relationships with each Portfolio, as well as an explanation of the methodology used in allocating various expenses of Janus Capital and its affiliates among the Portfolios and other clients. They also reviewed the financial statements of Janus Capital's parent company and its corporate structure. In their review, the Trustees considered whether Janus Capital and each subadviser receives adequate incentives to manage the Portfolios effectively. They recognized that profitability comparisons among investment advisers are difficult because very little comparative information is publicly available and profitability of any adviser is affected by numerous factors, including the organizational structure of the particular adviser, the types of funds and other accounts it manages, possible other lines of business, the methodology for allocating expens es, and the adviser's capital structure and cost of capital. However, based on the information available and taking those factors into account, the Trustees concluded that Janus Capital's profitability with respect to each Portfolio in relation to the services rendered was not unreasonable.
The Trustees concluded that the management fees and other compensation payable by each Portfolio to Janus Capital and its affiliates, as well as the fees payable by Janus Capital or the Portfolios to the subadvisers of subadvised Portfolios, were reasonable in relation to the nature, extent and quality of the services provided, taking into account the fees charged by other advisers for managing comparable mutual funds with similar strategies and the fees Janus Capital and the subadvisers charge to other clients. They also concluded that the overall expense ratio of each Portfolio was reasonable, taking into account the size of the Portfolio, the quality of services provided by Janus Capital and any subadviser, the investment performance of the Portfolio and any expense limitations agreed to by Janus Capital.
Economies of Scale
The Trustees considered information about the potential for Janus Capital to realize economies of scale as the assets of the Portfolios increase. They noted that, although most Portfolios pay advisory fees at a fixed rate as a percentage of net assets, without any breakpoints, the management fee rate paid by each Portfolio, after any contractual expense limitations, was below the mean management fee rate of the Portfolio's peer group selected by Lipper; and, for those Portfolios whose expenses are being reduced by the contractual expense limitations of Janus Capital, Janus Capital is subsidizing the Portfolios because they have not reached adequate scale. Moreover, as the assets of many of the Portfolios declined in the past few years, those Portfolios benefited from having
24 Janus Aspen Series December 31, 2007
advisory fee rates that remained constant rather than increasing as assets declined. In addition, performance fee structures have been implemented for several Portfolios that will cause the effective rate of advisory fees payable by such a Portfolio to vary depending on the investment performance of the Portfolio relative to its benchmark index over the measurement period; and a few Portfolios have fee schedules with breakpoints and reduced fee rates above certain asset levels. The Trustees also noted that the Portfolios share directly in economies of scale through lower charges of third-party service providers, based on the combined scale of all of the Portfolios. Based on all of the information they reviewed, the Trustees concluded that the current fee structure of each Portfolio was reasonable and that the current rates of fees do reflect a sharing between Janus Capital and the Portfolio of economies of scale at the current asset level of the Portfolio.
Other Benefits to Janus Capital
The Trustees also considered benefits that accrue to Janus Capital and its affiliates from their relationships with the Portfolios. They recognized that two affiliates of Janus Capital separately serve the Portfolios as transfer agent and distributor, respectively. They also considered Janus Capital's past and proposed use of commissions paid by Portfolios on their portfolio brokerage transactions to obtain proprietary and third-party research products and services benefiting those Portfolios and/or other clients of Janus Capital. The Trustees concluded that Janus Capital's use of "soft" commission dollars of a Portfolio to obtain proprietary and third-party research products and services was consistent with regulatory requirements and guidelines and was likely to benefit the Portfolios. The Trustees also concluded that, other than the services provided by Janus Capital and its affiliates pursuant to the agreements and the fees to be paid by each Portfolio therefor, the Portfolios and Janus Capital may potentially benefit from their relationship with each other in other ways. They concluded that Janus Capital benefits from the receipt of proprietary research products and services acquired through commissions paid on portfolio transactions of the Portfolios and that the Portfolios benefit from Janus Capital's receipt of those products and services, as well as research products and services acquired through commissions paid by other clients of Janus Capital. They further concluded that success of any Portfolio could attract other business to Janus Capital or other Janus funds and that the success of Janus Capital could enhance Janus Capital's ability to serve the Portfolios.
After full consideration of the above factors, as well as other factors, all of the Trustees, all of whom are Independent Trustees, concluded that the proposed continuation of the investment advisory agreement for each Portfolio, and the subadvisory agreement for each subadvised Portfolio, was in the best interest of the respective Portfolios and their shareholders.
Janus Aspen Series December 31, 2007 25
Explanations of Charts, Tables and
Financial Statements (unaudited)
1. PERFORMANCE OVERVIEWS
The performance overview graph compares the performance of a hypothetical $10,000 investment in the Portfolio with one or more widely used market indices. The hypothetical example does not represent the returns of any particular investment.
When comparing the performance of the Portfolio with an index, keep in mind that market indices do not include brokerage commissions that would be incurred if you purchased the individual securities in the index. They also do not include taxes payable on dividends and interest or operating expenses incurred if you maintained a Portfolio invested in the index.
Average annual total returns are quoted for each class of the Portfolio. Average annual total return is calculated by taking the growth or decline in value of an investment over a period of time, including reinvestment of any dividends, distributions and capital gains, then calculating the annual compounded percentage rate that would have produced the same result had the rate of growth been constant throughout the period. Average annual total return does not reflect the deduction of taxes that a shareholder would pay on Portfolio distributions or redemptions of Portfolio shares.
Pursuant to federal securities rules, expense ratios shown in the performance chart reflect subsidized and unsubsidized ratios for the past fiscal year. The total annual portfolio operating expenses ratio is gross of any fee waivers, reflecting a Portfolio's unsubsidized expense ratio. The net annual portfolio operating expenses ratio (if applicable) includes contractual waivers of Janus Capital and/or Janus Services and reflects a Portfolio's subsidized expense ratio. Both the total annual portfolio operating expenses ratio and net annual portfolio operating expenses ratio are based on average net assets as of the fiscal year ended December 31, 2006. The ratios also include expenses indirectly incurred by the Portfolio as a result of investing in other investment companies or pooled investments, which are not reflected in the "Financial Highlights" of this report. As a result, these ratios may be higher or lower than those shown in the "Fin ancial Highlights" in this report. All expenses are shown without the effect of expense offset arrangements. Pursuant to such arrangements, credits realized as a result of uninvested cash balances are used to reduce custodian and transfer agent expenses.
2. SCHEDULE OF INVESTMENTS
Following the performance overview section is the Portfolio's Schedule of Investments. This schedule reports the industry concentrations and types of securities held in the Portfolio on the last day of the reporting period. Securities are usually listed by type (common stock, corporate bonds, U.S. Government obligations, etc.) and by industry classification (banking, communications, insurance, etc.). Holdings are subject to change without notice.
The value of each security is quoted as of the last day of the reporting period. The value of securities denominated in foreign currencies is converted into U.S. dollars. Certain short-term investments maturing within 60 days are valued at amortized cost, which approximates market value.
A summary of investments by country is provided if the Portfolio invested in foreign securities. This summary reports the Portfolio's exposure to different countries by providing the percentage of securities invested in each country. The country of each security represents the country in which the company is incorporated.
2A. FORWARD CURRENCY CONTRACTS
A table listing forward currency contracts follows the Portfolio's Schedule of Investments (if applicable). Forward currency contracts are agreements to deliver or receive a preset amount of currency at a future date. Forward currency contracts are used to hedge against foreign currency risk in the Portfolio's long-term holdings.
The table provides the name of the foreign currency, the settlement date of the contract, the amount of the contract, the value of the currency in U.S. dollars and the amount of unrealized gain or loss. The amount of unrealized gain or loss reflects the change in currency exchange rates from the time the contract was opened to the last day of the reporting period.
2B. FUTURES
A table listing futures contracts follows the Portfolio's Schedule of Investments (if applicable). Futures contracts are contracts that obligate the buyer to receive and the seller to deliver an instrument or money at a specified price on a specified date. Futures are used to hedge against adverse movements in securities prices, currency risk or interest rates.
The table provides the name of the contract, number of contracts held, the expiration date, the principal amount, value and the amount of unrealized gain or loss. The amount of unrealized gain or loss reflects the marked-to-market amount for the last day of the reporting period.
3. STATEMENT OF ASSETS AND LIABILITIES
This statement is often referred to as the "balance sheet." It lists the assets and liabilities of the Portfolio on the last day of the reporting period.
26 Janus Aspen Series December 31, 2007
The Portfolio's assets are calculated by adding the value of the securities owned, the receivable for securities sold but not yet settled, the receivable for dividends declared but not yet received on stocks owned and the receivable for Portfolio shares sold to investors but not yet settled. The Portfolio's liabilities include payables for securities purchased but not yet settled, Portfolio shares redeemed but not yet paid and expenses owed but not yet paid. Additionally, there may be other assets and liabilities such as unrealized gain or loss on forward currency contracts.
The section entitled "Net Assets Consist of" breaks down the components of the Portfolio's net assets. Because the Portfolio must distribute substantially all earnings, you will notice that a significant portion of net assets is shareholder capital.
The last section of this statement reports the net asset value ("NAV") per share on the last day of the reporting period for each class of the Portfolio. The NAV is calculated by dividing the Portfolio's net assets (assets minus liabilities) by the number of shares outstanding.
4. STATEMENT OF OPERATIONS
This statement details the Portfolio's income, expenses, gains and losses on securities and currency transactions, and appreciation or depreciation of current Portfolio holdings.
The first section in this statement, entitled "Investment Income," reports the dividends earned from stocks and interest earned from interest-bearing securities in the Portfolio.
The next section reports the expenses and expense offsets incurred by the Portfolio, including the advisory fee paid to the investment adviser, transfer agent fees and expenses, printing and postage for mailing statements, financial reports and prospectuses, and other expenses. Expense offsets, if any, are also shown.
The last section lists the increase or decrease in the value of securities held in the Portfolio. The Portfolio realizes a gain (or loss) when it sells its position in a particular security. An unrealized gain (or loss) refers to the change in net appreciation or depreciation of the Portfolio during the reporting period. "Net Realized and Unrealized Gain/(Loss) on Investments" is affected both by changes in the market value of Portfolio holdings and by gains (or losses) realized during the reporting period.
5. STATEMENT OF CHANGES IN NET ASSETS
This statement reports the increase or decrease in the Portfolio's net assets during the reporting period. Changes in the Portfolio's net assets are attributable to investment operations, dividends, distributions and capital share transactions. This is important to investors because it shows exactly what caused the Portfolio's net asset size to change during the period.
The first section summarizes the information from the Statement of Operations regarding changes in net assets due to the Portfolio's investment performance. The Portfolio's net assets may also change as a result of dividend and capital gains distributions to investors. If investors receive their dividends in cash, money is taken out of the Portfolio to pay the distribution. If investors reinvest their dividends, the Portfolio's net assets will not be affected. If you compare the Portfolio's "Net Decrease from Dividends and Distributions" to the "Reinvested dividends and distributions," you will notice that dividend distributions had little effect on the Portfolio's net assets. This is because the majority of Janus investors reinvest their distributions.
The reinvestment of dividends is included under "Capital Share Transactions." "Capital Shares" refers to the money investors contribute to the Portfolio through purchases or withdraw via redemptions. The Portfolio's net assets will increase and decrease in value as investors purchase and redeem shares from the Portfolio.
6. FINANCIAL HIGHLIGHTS
This schedule provides a per-share breakdown of the components that affect the Portfolio's NAV for current and past reporting periods for each class of the Portfolio. Not only does this table provide you with total return, it also reports total distributions, asset size, expense ratios and portfolio turnover rate.
The first line in the table reflects the NAV per share at the beginning of the reporting period. The next line reports the net investment income per share, which comprises dividends and interest income earned on securities held by the Portfolio. Following is the total of gains/(losses), realized and unrealized. Dividends and distributions are then subtracted to arrive at the NAV per share at the end of the period. The next line reflects the average annual total return reported the last day of the period.
Also included are the expense ratios, or the percentage of average net assets that were used to cover operating expenses during the period. Expense ratios vary for a number of reasons, including the differences in management fees, the average shareholder account size and the extent of foreign investments, which entail greater transaction costs.
The Portfolio's expenses may be reduced through expense reduction arrangements. These arrangements may include the use of balance credits or transfer agent fee offsets. The Statement of Operations reflects total expenses before any such offset, the amount of the offset and the net expenses. The
Janus Aspen Series December 31, 2007 27
Explanations of Charts, Tables and
Financial Statements (unaudited) (continued)
expense ratios listed in the Financial Highlights reflect total expenses prior to any expense offsets (gross expense ratio) and after the expense offsets (net expense ratio). Both expense ratios reflect expenses after waivers (reimbursements), if applicable.
The ratio of net investment income/(loss) summarizes the income earned less expenses, divided by the average net assets of the Portfolio during the reporting period. Don't confuse this ratio with the Portfolio's yield. The net investment income ratio is not a true measure of the Portfolio's yield because it doesn't take into account the dividends distributed to the Portfolio's investors.
The next figure is the portfolio turnover rate, which measures the buying and selling activity in the Portfolio. Portfolio turnover is affected by market conditions, changes in the asset size of the Portfolio, the nature of the Portfolio's investments and the investment style of the portfolio manager. A 100% rate implies that an amount equal to the value of the entire portfolio is turned over in a year; a 50% rate means that an amount equal to the value of half the portfolio is traded in a year; and a 200% rate means that an amount equal to the value of the portfolio is traded every six months.
28 Janus Aspen Series December 31, 2007
Designation Requirements (unaudited)
For federal income tax purposes, the Portfolio designated the following for the year ended December 31, 2007:
Dividends Received Deduction Percentage
| Portfolio | |||||||
| Janus Aspen Forty Portfolio | 100 | % | |||||
Janus Aspen Series December 31, 2007 29
Trustees and Officers (unaudited)
The Portfolio's Statement of Additional Information includes additional information about the Trustees and officers and is available, without charge, by calling 1-800-525-0020.
The following are the Trustees and officers of the Trust, together with a brief description of their principal occupations during the last five years (principal occupations for certain Trustees may include periods over five years).
Each Trustee has served in that capacity since he or she was originally elected or appointed. The Trustees do not serve a specified term of office. Each Trustee will hold office until the termination of the Trust or his or her earlier death, resignation, retirement, incapacity, or removal. The retirement age for Trustees is 72. The Portfolio's Nominating and Governance Committee will consider nominees for the position of Trustee recommended by shareholders. Shareholders may submit the name of a candidate for consideration by the Committee by submitting their recommendations to the Trust's Secretary. Each Trustee is currently a Trustee of two other registered investment companies advised by Janus Capital: Janus Investment Fund and Janus Adviser Series. As of the date of this report, collectively, these three registered investment companies consist of 75 series or funds.
The Trust's officers are elected annually by the Trustees for a one-year term. Certain officers also serve as officers of Janus Investment Fund and Janus Adviser Series. Certain officers of the Portfolio may also be officers and/or directors of Janus Capital. Portfolio officers receive no compensation from the Portfolio, except for the Portfolio's Chief Compliance Officer, as authorized by the Trustees.
Trustees
| Name, Address, and Age | Positions Held with Portfolio | Length of Time Served | Principal Occupations During the Past Five Years | Number of Portfolios/ Funds in Fund Complex Overseen by Trustee | Other Directorships Held by Trustee | ||||||||||||||||||
| Dennis B. Mullen* 151 Detroit Street Denver, CO 80206 DOB: 1943 | Chairman Trustee | 3/04-12/07 9/93-Present | Chief Executive Officer of Red Robin Gourmet Burgers, Inc. (since 2005). Formerly, private investor. | 75 | ** | Chairman of the Board (since 2005) and Director of Red Robin Gourmet Burgers, Inc., and Director of Janus Capital Funds Plc (Dublin-based, non-U.S. funds). | |||||||||||||||||
| Jerome S. Contro 151 Detroit Street Denver, CO 80206 DOB: 1956 | Trustee | 12/05-Present | Partner of Tango Group, a private investment firm (since 1999). | 75 | Trustee and Chairman of RS Investment Trust (since 2001), and Director of IZZE Beverages and MyFamily.com, Inc. (genealogical research website). | ||||||||||||||||||
| William F. McCalpin 151 Detroit Street Denver, CO 80206 DOB: 1957 | Trustee | 6/02-Present | Private investor. Formerly, Executive Vice President and Chief Operating Officer of The Rockefeller Brothers Fund (a private family foundation), and Vice President of Asian Cultural Council. | 75 | Director of F.B. Heron Foundation (a private grant making foundation). | ||||||||||||||||||
* Mr. McCalpin will succeed Mr. Mullen as Chairman as of January 1, 2008.
** Mr. Mullen also serves as director of Janus Capital Funds Plc, consisting of 16 funds. Including Janus Capital Funds Plc and the 75 funds comprising the Janus funds, Mr. Mullen oversees 91 funds.
30 Janus Aspen Series December 31, 2007
Trustees (cont.)
| Name, Address, and Age | Positions Held with Portfolio | Length of Time Served | Principal Occupations During the Past Five Years | Number of Portfolios/ Funds in Fund Complex Overseen by Trustee | Other Directorships Held by Trustee | ||||||||||||||||||
| John W. McCarter, Jr. 151 Detroit Street Denver, CO 80206 DOB: 1938 | Trustee | 6/02-Present | President and Chief Executive Officer of The Field Museum of Natural History (Chicago, IL) (since 1997). | 75 | Chairman of the Board and Director of Divergence Inc. (biotechnology firm); Director of W.W. Grainger, Inc. (industrial distributor); and Trustee of WTTW (Chicago public television station) and the University of Chicago. | ||||||||||||||||||
| James T. Rothe 151 Detroit Street Denver, CO 80206 DOB: 1943 | Trustee | 1/97-Present | Co-founder and Managing Director of Roaring Fork Capital Management, LLC (private investment in public equity firm), and Professor Emeritus of Business of the University of Colorado, Colorado Springs, CO (since 2004). Formerly, Professor of Business of the University of Colorado (2002-2004) and Distinguished Visiting Professor of Business (2001-2002) of Thunderbird (American Graduate School of International Management), Glendale, AZ. | 75 | Director of Red Robin Gourmet Burgers, Inc. | ||||||||||||||||||
| William D. Stewart 151 Detroit Street Denver, CO 80206 DOB: 1944 | Trustee | 9/93-Present | Corporate Vice President and General Manager of MKS Instruments – HPS Products, Boulder, CO (a manufacturer of vacuum fittings and valves). | 75 | N/A | ||||||||||||||||||
| Martin H. Waldinger 151 Detroit Street Denver, CO 80206 DOB: 1938 | Trustee | 9/93-Present | Private Investor and Consultant to California Planned Unit Developments (since 1994). Formerly, CEO and President of Marwal, Inc. (homeowner association management company). | 75 | N/A | ||||||||||||||||||
| Linda S. Wolf 151 Detroit Street Denver, CO 80206 DOB: 1947 | Trustee | 12/05-Present | Retired. Formerly, Chairman and Chief Executive Officer of Leo Burnett (Worldwide) (advertising agency) (2001-2005). | 75 | Director of Wal-Mart, The Field Museum of Natural History (Chicago, IL), Children's Memorial Hospital (Chicago, IL), Chicago Council on Foreign Relations, Economic Club of Chicago, and InnerWorkings (U.S. provider of print procurement solutions). | ||||||||||||||||||
Janus Aspen Series December 31, 2007 31
Trustees and Officers (unaudited) (continued)
Officers
| Name, Address, and Age | Positions Held with Portfolio | Term of Office* and Length of Time Served | Principal Occupations During the Past Five Years | ||||||||||||
| Scott W. Schoelzel** 151 Detroit Street Denver, CO 80206 DOB: 1958 | Executive Vice President and Portfolio Manager Janus Aspen Forty Portfolio | 5/97-12/07 | Vice President of Janus Capital and Portfolio Manager for other Janus accounts. | ||||||||||||
| Stephanie Grauerholz-Lofton 151 Detroit Street Denver, CO 80206 DOB: 1970 | Chief Legal Counsel and Secretary Vice President | 1/06-Present 3/06-Present | Vice President and Assistant General Counsel of Janus Capital, and Vice President and Assistant Secretary of Janus Distributors LLC. Formerly, Assistant Vice President of Janus Capital and Janus Distributors LLC (2006), and Associate of Vedder, Price, Kaufman & Kammholz, P.C. (1999-2003). | ||||||||||||
| Andrew J. Iseman 151 Detroit Street Denver, CO 80206 DOB: 1964 | President and Chief Executive Officer | 3/07-Present | Chief Operating Officer and Senior Vice President of Janus Capital Group, Inc. and Janus Capital; President of Janus Services LLC; and Director of Capital Group Partners, Inc. Formerly, Senior Vice President of Enhanced Investment Technologies, LLC (2005-2007); and Vice President of Janus Capital (2003-2005) and Janus Services LLC (2003-2004). | ||||||||||||
| David R. Kowalski 151 Detroit Street Denver, CO 80206 DOB: 1957 | Vice President, Chief Compliance Officer, and Anti-Money Laundering Officer | 6/02-Present | Senior Vice President and Chief Compliance Officer of Janus Capital, Janus Distributors LLC, and Janus Services LLC; Chief Compliance Officer of Bay Isle Financial LLC; and Vice President of Enhanced Investment Technologies, LLC. Formerly, Chief Compliance Officer of Enhanced Investment Technologies, LLC (2003-2005); Vice President of Janus Capital (2000-2005) and Janus Services LLC (2004-2005); and Assistant Vice President of Janus Services LLC (2000-2004). | ||||||||||||
| Jesper Nergaard 151 Detroit Street Denver, CO 80206 DOB: 1962 | Chief Financial Officer Vice President, Treasurer, and Principal Accounting Officer | 3/05-Present 2/05-Present | Vice President of Janus Capital. Formerly, Director of Financial Reporting for OppenheimerFunds, Inc. (2004-2005); Site Manager and First Vice President of Mellon Global Securities Services (2003); and Director of Fund Accounting, Project Development, and Training of INVESCO Funds Group (1994-2003). | ||||||||||||
* Officers are elected at least annually by the Trustees for a one-year term and may also be elected from time to time by the Trustees for an interim period.
** Scott Schoelzel intends to resign his position with the Portfolio effective January 1, 2008.
32 Janus Aspen Series December 31, 2007
Notes
Janus Aspen Series December 31, 2007 33
Janus provides access to a wide range of investment disciplines.
Growth
Janus growth portfolios focus on companies believed to be the leaders in their respective industries, with solid management teams, expanding market share, margins and efficiencies.
Core
Janus core portfolios seek investments in more stable and predictable companies. These portfolios look for a strategic combination of steady growth and for certain portfolios, some degree of income.
Risk-Managed
Our risk-managed portfolios seek to outperform their respective indices while maintaining a risk profile equal to or lower than the index itself. Managed by INTECH (a Janus subsidiary), these portfolios use a mathematical process in an attempt to build a more "efficient" portfolio than the index.
Value
Janus value portfolios invest in companies they believe are poised for a turnaround or are trading at a significant discount to fair value. The goal is to gain unique insight into a company's true value and identify and evaluate potential catalysts that may unlock shareholder value.
International & Global
Janus international and global portfolios seek to leverage Janus' research capabilities by taking advantage of inefficiencies in foreign markets, where accurate information and analytical insight are often at a premium.
Bond
Janus bond portfolios attempt to provide less risk relative to equities while seeking to deliver a competitive total return through high current income and appreciation.
Money Market
Janus money market portfolios seek maximum current income consistent with stability of capital.
For more information about our funds, contact your investment professional or go to www.janus.com/info
Please consider the charges, risks, expenses and investment objectives carefully before investing. For a prospectus containing this and other information, please call Janus at 1-800-525-0020 or download the file from www.janus.com/info. Read it carefully before you invest or send money.
An investment in a money market portfolio is not insured or guaranteed by the Federal Deposit Insurance Corporation or any other government agency. Although the Portfolio seeks to preserve the value of your investment at $1.00 per share, it is possible to lose money by investing in the Portfolio.

151 Detroit Street
Denver, CO 80206
1-800-525-0020
Portfolio distributed by Janus Distributors LLC (2/08)
C-0108-357 109-02-710 02-08
2007 Annual Report
Janus Aspen Series
Janus Aspen Fundamental Equity Portfolio
Look Inside. . .
• Portfolio management perspective
• Investment strategy behind your portfolio
• Portfolio performance, characteristics and holdings

Table of Contents
| Useful Information About Your Portfolio Report | 1 | ||||||
| Management Commentary and Schedule of Investments | 2 | ||||||
| Statement of Assets and Liabilities | 11 | ||||||
| Statement of Operations | 12 | ||||||
| Statements of Changes in Net Assets | 13 | ||||||
| Financial Highlights | 14 | ||||||
| Notes to Schedule of Investments | 15 | ||||||
| Notes to Financial Statements | 16 | ||||||
| Report of Independent Registered Public Accounting Firm | 25 | ||||||
| Additional Information | 26 | ||||||
| Explanations of Charts, Tables and Financial Statements | 29 | ||||||
| Designation Requirements | 32 | ||||||
| Trustees and Officers | 33 | ||||||
Please consider the charges, risks, expenses and investment objectives carefully before investing. For a prospectus containing this and other information, please call Janus at 1-800-525-0020 or download the file from www.janus.com/info. Read it carefully before you invest or send money.
Useful Information About Your Portfolio Report
Management Commentary
The Management Commentary in this report includes valuable insight from the Portfolio's manager as well as statistical information to help you understand how your Portfolio's performance and characteristics stack up against those of comparable indices.
Please keep in mind that the opinions expressed by the Portfolio's manager in the Management Commentary are just that: opinions. They are a reflection of the manager's best judgment at the time this report was compiled, which was December 31, 2007. As the investing environment changes, so could the manager's opinions. The views are unique to the manager and aren't necessarily shared by his fellow employees or by Janus in general.
Portfolio Expenses
We believe it's important for our shareholders to have a clear understanding of Portfolio expenses and the impact they have on investment return.
The following is important information regarding the Portfolio's Expense Example, which appears in the Management Commentary within this Annual Report. Please refer to this information when reviewing the Expense Example for the Portfolio.
Example
As a shareholder of a Portfolio, you incur two types of costs: (1) transaction costs, including redemption fees (where applicable) (and any related exchange fees) and (2) ongoing costs, including management fees; distribution and shareholder servicing (12b-1) fees (applicable to Service Shares only); and other Portfolio expenses. The example is intended to help you understand your ongoing costs (in dollars) of investing in a Portfolio and to compare these costs with the ongoing costs of investing in other mutual funds. To do so, compare this 5% hypothetical example with the 5% hypothetical examples that appear in the shareholder reports of the other funds. The example is based upon an investment of $1,000 invested at the beginning of the period and held for the six-month period from July 1, 2007 to December 31, 2007.
Actual Expenses
The first line of the table in each example provides information about actual account values and actual expenses. You may use the information in this line, together with the amount you invested, to estimate the expenses that you paid over the period. Simply divide your account value by $1,000 (for example, an $8,600 account value divided by $1,000 = 8.6), then multiply the result by the number in the first line under the heading entitled "Expenses Paid During Period" to estimate the expenses you paid on your account during the period.
Hypothetical Example for Comparison Purposes
The second line of the table in each example provides information about hypothetical account values and hypothetical expenses based upon the Portfolio's actual expense ratio and an assumed rate of return of 5% per year before expenses, which is not the Portfolio's actual return. The hypothetical account values and expenses may not be used to estimate the actual ending account balance or expenses you paid for the period. You may use this information to compare the ongoing costs of investing in the Portfolio and other funds. To do so, compare this 5% hypothetical example with the 5% hypothetical examples that appear in the shareholder reports of the other funds.
Janus Capital Management LLC ("Janus Capital") has contractually agreed to waive the Portfolio's total operating expenses, excluding the distribution and shareholder servicing (12b-1) fees applicable to Service Shares, brokerage commissions, interest, taxes and extraordinary expenses to certain limits until at least May 1, 2009. Expenses in the examples reflect application of these waivers. Had the waivers not been in effect, your expenses would have been higher. More information regarding the waivers is available in the Portfolio's prospectus.
Please note that the expenses shown in the tables are meant to highlight your ongoing costs only and do not reflect any transaction costs, such as redemption fees (where applicable) and any charges at the separate account level or contract level. Redemption fees are fully described in the prospectus. Therefore, the second line of each table is useful in comparing ongoing costs only, and will not help you determine the relative total costs of owning different funds. In addition, if these transaction costs and separate account or contract level charges were included, your costs would have been higher.
Janus Aspen Series December 31, 2007 1
Janus Aspen Fundamental Equity Portfolio (unaudited)
Portfolio Snapshot
The conservative growth portfolio relies on the Janus Research Team to drive its fundamental approach to investing in core holdings and opportunistic companies.
Team Based Approach Led by Jim Goff
Director of Research
Performance Overview
For the 12-month period ended December 31, 2007, Janus Aspen Fundamental Equity Portfolio's Institutional Shares and Service Shares returned 11.02% and 10.79%, respectively. The performance outpaced the Portfolio's primary benchmark, the S&P 500® Index, which returned 5.49%. However, the Portfolio's performance lagged its secondary benchmark, the Russell 1000® Growth Index, which returned 11.81%.
Economic Overview
Despite a volatile and weak second half of the year, equity markets worldwide managed to turn in modest gains over the 12-month period ended December 31, 2007. Much of the year's gains came during the first half amid continued expansion in the global economy and an active merger and acquisition (M&A) environment, but problems in the U.S. credit markets started to rattle investor confidence in July. Many indices retreated from recent peaks as investors digested a number of issues stemming from the subprime mortgage and structured debt markets. Credit market turmoil, subprime-related write-offs, continued weakness in the U.S. housing market, central bank intervention and the first year-over-year decline in domestic corporate earnings since 2002 were just some of the main themes dominating sentiment during the latter-half of 2007. Through all of this, emerging country stocks were the top performers while equities in developed countries stru ggled to keep pace. Domestic stocks were led by large, growth-oriented companies with small-cap value issues among the laggards.
As December came to a close, many themes supporting equity prices were fading. While domestic valuations were still considered to be reasonable, particularly with interest rates well off of their period highs, mixed signals on the financial health of the U.S. consumer and slowing earnings momentum were becoming a greater concern. While job growth remained strong for much of the year, a weak December reading left some doubt about continued near-term strength. In the end, the questions remained surrounding the magnitude of slowing growth in the U.S. and whether the rest of the world will follow suit.
Since November 7, 2007, Janus Aspen Fundamental Equity Portfolio has been team-managed, representing the best ideas from Janus' more than 35 equity analysts. Individual analysts primarily drive stock selection, with debate and oversight provided by the global sector research team with which that analyst is aligned. We believe there is great power in individual analysts making direct investment decisions, as they are most familiar with the stocks they cover. We keep the Portfolio sector neutral compared to its primary benchmark, although the Portfolio has nearly 5.5% non-U.S. exposure. The focus of the Portfolio is on capturing the best ideas of Janus' research platform and generating strong and consistent investment returns.
Investments That Contributed to Performance
The Portfolio's outperformance can be attributed primarily to its holdings in the energy and technology sectors.
Integrated oil company Hess Corp. was the top contributor to performance for the period. The company benefited from the rising price of oil during 2007 and increased appreciation for the future production potential from Hess' new projects, including deep water projects in the Gulf of Mexico and off the coast of Brazil. Given the price appreciation during the year, we trimmed the position in order to harvest profits.
Tata Steel was another strong individual contributor. The investment thesis was based on the fact that the company is an integrated steel producer, meaning it controls its own iron ore, and it had high operating margins with a strong balance sheet. Tata Steel successfully completed the acquisition of U.K.-based steelmaker Corus Steel and has benefited from rising steel prices, which has aided revenue growth. However, I felt that Tata Steel overpaid to acquire Corus (the largest U.K. steel maker) and that this acquisition would destroy value for Tata Steel Shareholders. It also showed lack of capital spending discipline on the part of Tata Steel. I believe that the Corus acquisition is going to increase the financial risks faced by Tata Steel (its balance sheet is highly levered following this deal) and its operational risks (this deal significantly increased its sensitivity to steel prices because Corus was a very high cost producer). Overal l, I felt that it became too risky to remain a shareholder in Tata Steel because of these increased risks and therefore I harvested gains in the name and exited the position. The Portfolio also used listed options and total return swaps to fully utilize our research process. Please see the "Notes to Financial Statements" for a discussion of derivatives used by the Portfolio.
2 Janus Aspen Series December 31, 2007
(unaudited)
Stocks That Hurt Performance
Areas of weakness included the financial and communications sectors, where select holdings fell short of our expectations.
The subprime loan issues that have dominated the financial markets for months weighed on the stock price of global investment bank Merrill Lynch. The stock initially had suffered from uncertainty and later from the announcement of large write-downs in its mortgage assets. While the valuation is low, we remain concerned about further charge-offs in Merrill Lynch's mortgage portfolio. Therefore, we exited the position.
Citigroup was also negatively impacted by the subprime credit issues in the market, which caused a larger than expected charge-off and resulted in the dismissal of the CEO. We exited the position due to concerns about the health of Citigroup's balance sheet and the stability of its dividend.
Outlook
With U.S. equity markets struggling late in the year, the investment team will continue to closely monitor several factors for directional cues. First, despite the weakness in the U.S. housing sector and related credit market turmoil, we believe U.S. employment has remained a pillar of support for the economy. With signs of weakening at the end of the year, we will continue to watch the labor market closely for any sign of prolonged weakness and whether December's weaker-than-expected report was an aberration. We will also be monitoring conditions in the credit markets for signs of further deterioration. As the Federal Reserve (Fed) works to balance its dual mandate of sustainable growth and price stability, we will be watching for signs that suggest the Fed is behind the curve and whether it can be effective in navigating these uncertain economic times. Finally, as "bot tom-up" fundamental investors, we will continue to watch the future path of corporate earnings, credit conditions, liquidity, and balance sheet health of our individual holdings in an effort to determine whether current valuations represent an attractive risk/reward profile.
We have a seasoned team of research analysts, an intensive research platform and a disciplined investment process that seeks to produce a diversified portfolio of best ideas. By seeking to add value through our research and attempting to manage risk through diversification, we hope to continue to produce strong risk-adjusted returns for our investors. We are excited about the prospects for Janus Aspen Fundamental Equity Portfolio.
Thank you for your investment in Janus Aspen Fundamental Equity Portfolio.
Janus Aspen Series December 31, 2007 3
Janus Aspen Fundamental Equity Portfolio (unaudited)
Janus Aspen Fundamental Equity Portfolio At a Glance
5 Largest Contributors to Performance – Holdings
| Contribution | |||||||
| Hess Corp. | 2.67 | % | |||||
| Tata Steel, Ltd. | 1.63 | % | |||||
| EMC Corp. | 1.28 | % | |||||
| First Solar, Inc. | 1.07 | % | |||||
| Apple, Inc. | 1.04 | % | |||||
5 Largest Detractors from Performance – Holdings
| Contribution | |||||||
| Merrill Lynch & Company, Inc. | (1.54 | )% | |||||
| Citigroup, Inc. | (1.30 | )% | |||||
| E*TRADE Financial Corp. | (1.29 | )% | |||||
| Advanced Micro Devices, Inc. | (0.82 | )% | |||||
| Spansion, Inc. - Class A | (0.75 | )% | |||||
4 Largest Contributors to Performance – Sectors
| Portfolio Contribution | Portfolio Weighting (% of Net Assets) | S&P 500® Index Weighting | |||||||||||||
| Energy | 7.62 | % | 18.22 | % | 14.36 | % | |||||||||
| Technology | 4.81 | % | 18.97 | % | 14.06 | % | |||||||||
| Industrials | 2.75 | % | 13.69 | % | 15.65 | % | |||||||||
| Health Care | 2.68 | % | 14.59 | % | 12.66 | % | |||||||||
4 Largest Detractors to Performance – Sectors
| Portfolio Contribution | Portfolio Weighting (% of Net Assets) | S&P 500® Index Weighting | |||||||||||||
| Financials | (5.67 | )% | 17.61 | % | 20.57 | % | |||||||||
| Communications | (0.75 | )% | 6.39 | % | 9.56 | % | |||||||||
| Consumer | 0.16 | % | 9.70 | % | 13.13 | % | |||||||||
| Other* | 0.49 | % | 0.83 | % | 0.00 | % | |||||||||
* Industry not classified by Global Industry Classification Standard
4 Janus Aspen Series December 31, 2007
(unaudited)
5 Largest Equity Holdings – (% of Net Assets)
As of December 31, 2007
| Hess Corp. Oil Companies - Integrated | 4.1 | % | |||||
| Owens-Illinois, Inc. Containers - Metal and Glass | 3.2 | % | |||||
| NRG Energy, Inc. Independent Power Producer | 2.8 | % | |||||
| AES Corp. Electric - Generation | 2.8 | % | |||||
| General Electric Co. Diversified Operations | 2.5 | % | |||||
| 15.4 | % | ||||||
Asset Allocation – (% of Net Assets)
As of December 31, 2007

Emerging markets comprised 0.3% of total net assets.
Top Country Allocations – Long Positions (% of Investment Securities)
| As of December 31, 2007 | As of December 31, 2006 | ||||||
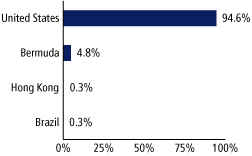 | 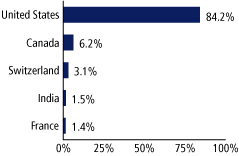 | ||||||
Janus Aspen Series December 31, 2007 5
Janus Aspen Fundamental Equity Portfolio (unaudited)
Performance

| Average Annual Total Return – for the periods ended December 31, 2007 | Expense Ratios – for the fiscal year ended December 31, 2006 | ||||||||||||||||||||||||||
| One Year | Five Year | Ten Year | Since Inception* | Total Annual Fund Operating Expenses | Net Annual Fund Operating Expenses | ||||||||||||||||||||||
| Janus Aspen Fundamental Equity Portfolio - Institutional Shares | 11.02 | % | 14.55 | % | 10.48 | % | 12.90 | % | 1.73 | % | 1.20 | %(a) | |||||||||||||||
| Janus Aspen Fundamental Equity Portfolio - Service Shares | 10.79 | % | 14.70 | % | 10.35 | % | 12.76 | % | 2.00 | % | 1.45 | %(b) | |||||||||||||||
| S&P 500® Index | 5.49 | % | 12.83 | % | 5.91 | % | 7.60 | % | |||||||||||||||||||
| Russell 1000® Growth Index | 11.81 | % | 12.11 | % | 3.83 | % | 5.53 | % | |||||||||||||||||||
| Lipper Quartile - Institutional Shares | 1 | st | 1 | st | 1 | st | 1 | st | |||||||||||||||||||
| Lipper Rankings - Institutional Shares based on total returns for Variable Annuity Large-Cap Core Funds | 16/203 | 12/163 | 1/69 | 1/62 | |||||||||||||||||||||||
Visit janus.com/info to view up-to-date performance
and characteristic information
Data presented reflects past performance, which is no guarantee of future results. Investment results and principal value will fluctuate so that shares, when redeemed, may be worth more or less than their original cost. Due to market volatility, current performance may be higher or lower than the performance shown. Call 877.33JANUS or visit www.janus.com/info for performance current to the most recent month-end.
(a)At December 31, 2006, Janus Capital has contractually agreed to waive the Portfolio's total operating expenses (excluding brokerage commissions, interest, taxes, and extraordinary expenses) to a certain limit until at least May 1, 2008. The net annual fund operating expense shown reflects the application of such limit and is detailed in the Statement of Additional Information. Returns shown include fee waivers, if any, and without such waivers returns would have been lower.
(b)At December 31, 2006, Janus Capital has contractually agreed to waive the Portfolio's total operating expenses (excluding the distribution and shareholder servicing fee, brokerage commissions, interest, taxes, and extraordinary expenses) to a certain limit until at least May 1, 2008. The net annual fund operating expense shown reflects the application of such limit and is detailed in the Statement of Additional Information. Returns shown include fee waivers, if any, and without such waivers returns would have been lower.
The Portfolio's expense ratios were determined based on average net assets as of the fiscal year ended December 31, 2006. Detailed information is available in the prospectus. Contractual waivers agreed to by Janus Capital are included under "Net Annual Fund Operating Expenses." All expenses are shown without the effect of expense offset arrangements. Pursuant to such arrangements, credits realized as a result of uninvested cash balances are used to reduce custodian and transfer agent expenses.
The Portfolio's performance may be affected by risks that include those associated with investments in specific industries or countries. Additional risks to the Portfolio may include those associated with investing in foreign securities, emerging markets, initial public offerings ("IPOs") and derivatives. Please see a Janus prospectus or www.janus.com/info for more information about risks, portfolio holdings and other details.
Portfolios that invest in REITs may be subject to a higher degree of market risk because of the REITs concentration in a specific industry, sector or geographic region, REITs may be subject to risks including, but not limited to, decline in the value of real estate, risks related to general and economic conditions, changes in the value of the underlying property owned by the trust and defaults by borrowers.
These returns do not reflect the charges and expenses of any particular insurance product or qualified plan. Returns shown would have been lower had they included insurance charges.
6 Janus Aspen Series December 31, 2007
(unaudited)
Portfolio Expenses
The example below shows you the ongoing costs (in dollars) of investing in your Portfolio and allows you to compare these costs with those of other mutual funds. Please refer to the section Useful Information About Your Portfolio Report for a detailed explanation of the information presented in these charts.
| Expense Example - Institutional Shares | Beginning Account Value (7/1/07) | Ending Account Value (12/31/07) | Expenses Paid During Period (7/1/07-12/31/07)(1) | ||||||||||||
| Actual | $ | 1,000.00 | $ | 1,017.70 | $ | 6.10 | |||||||||
| Hypothetical (5% return before expenses) | $ | 1,000.00 | $ | 1,019.16 | $ | 6.11 | |||||||||
| Expense Example - Service Shares | Beginning Account Value (7/1/07) | Ending Account Value (12/31/07) | Expenses Paid During Period (7/1/07-12/31/07)((1) | ||||||||||||
| Actual | $ | 1,000.00 | $ | 1,016.70 | $ | 7.37 | |||||||||
| Hypothetical (5% return before expenses) | $ | 1,000.00 | $ | 1,017.90 | $ | 7.37 | |||||||||
(1) Expenses are equal to the annualized expense ratio of 1.20% for Institutional Shares and 1.45% for Service Shares, multiplied by the average account value over the period, multiplied by 184/365 (to reflect the one-half year period). Expenses include effect of contractual waivers by Janus Capital.
Returns include reinvestment of dividends from net investment income and distributions from capital gains. The returns shown do not reflect the deduction of taxes that a shareholder would pay on Portfolio distributions or the redemption of Portfolio shares.
Returns shown for Service Shares for periods prior to December 31, 1999 are derived from the historical performance of Institutional Shares, adjusted to reflect the higher operating expenses of Service Shares.
Lipper, a wholly-owned subsidiary of Reuters, provides independent insight on global collective investments including mutual funds, retirement funds, hedge funds, fund fees and expenses to the asset management and media communities. Lipper ranks the performance of mutual funds within a classification of funds that have similar investment objectives. Rankings are historical with capital gains and dividends reinvested and do not include the effect of loads.
Lipper ranking is for the Institutional Share class only; other classes may have different performance characteristics.
May 31, 1997 is the date used to calculate the since-inception Lipper ranking, which is slightly different from when the Portfolio began operations since Lipper provides fund rankings as of the last day of the month.
If an expense waiver was in effect, it may have had a material effect on the total return or yield, and therefore the ranking for the period.
There is no assurance that the investment process will consistently lead to successful investing.
The Portfolio will invest at least 80% of its net assets in the type of securities described by its name.
See Notes to Schedule of Investments for index definitions.
The Portfolio may differ significantly from the securities held in the indices. The indices are unmanaged and not available for direct investment; therefore their performance does not reflect the expenses associated with the active management of an actual Portfolio.
See "Explanations of Charts, Tables and Financial Statements."
Effective November 7, 2007, the Janus Research Team led by Director of Research, Jim Goff, is managing Janus Aspen Fundamental Equity Portfolio.
*The Portfolio's inception date – May 1, 1997
Janus Aspen Series December 31, 2007 7
Janus Aspen Fundamental Equity Portfolio
Schedule of Investments
As of December 31, 2007
| Shares or Principal Amount | Value | ||||||||||
| Common Stock - 98.9% | |||||||||||
| Advertising Sales - 1.1% | |||||||||||
| 3,340 | Lamar Advertising Co. - Class A* | $ | 160,554 | ||||||||
| Aerospace and Defense - 0.3% | |||||||||||
| 925 | Embraer-Empresa Brasileira de Aeronautica S.A. (ADR)* | 42,171 | |||||||||
| Agricultural Operations - 1.1% | |||||||||||
| 1,340 | Bunge, Ltd. | 155,989 | |||||||||
| Applications Software - 0.5% | |||||||||||
| 3,625 | Red Hat, Inc.* | 75,545 | |||||||||
| Athletic Footwear - 0.6% | |||||||||||
| 1,330 | NIKE, Inc. - Class B | 85,439 | |||||||||
| Brewery - 1.4% | |||||||||||
| 3,930 | Anheuser-Busch Companies, Inc. | 205,696 | |||||||||
| Building - Residential and Commercial - 1.4% | |||||||||||
| 395 | NVR, Inc.* | 206,980 | |||||||||
| Building and Construction Products - Miscellaneous - 1.3% | |||||||||||
| 5,375 | USG Corp.* | 192,371 | |||||||||
| Casino Hotels - 0.4% | |||||||||||
| 4,515 | Melco PBL Entertainment (Macau), Ltd. (ADR)* | 52,193 | |||||||||
| Casino Services - 0.6% | |||||||||||
| 2,045 | International Game Technology | 89,837 | |||||||||
| Commercial Banks - 1.3% | |||||||||||
| 3,860 | SVB Financial Group* | 194,544 | |||||||||
| Computers - 1.8% | |||||||||||
| 860 | Apple, Inc.* | 170,349 | |||||||||
| 1,735 | Hewlett-Packard Co. | 87,583 | |||||||||
| 257,932 | |||||||||||
| Computers - Integrated Systems - 0.2% | |||||||||||
| 5,850 | Bank Tec (144A)*,§,ºº | 35,100 | |||||||||
| Computers - Memory Devices - 0.4% | |||||||||||
| 3,060 | EMC Corp.* | 56,702 | |||||||||
| Containers - Metal and Glass - 5.0% | |||||||||||
| 10,525 | Crown Holdings, Inc.* | 269,966 | |||||||||
| 9,410 | Owens-Illinois, Inc.* | 465,794 | |||||||||
| 735,760 | |||||||||||
| Cosmetics and Toiletries - 1.6% | |||||||||||
| 6,015 | Avon Products, Inc. | 237,773 | |||||||||
| Data Processing and Management - 0.6% | |||||||||||
| 2,430 | Paychex, Inc. | 88,015 | |||||||||
| Diversified Operations - 2.5% | |||||||||||
| 9,696 | General Electric Co.** | 359,431 | |||||||||
| Drug Delivery Systems - 1.1% | |||||||||||
| 3,860 | Hospira, Inc.* | 164,590 | |||||||||
| Electric - Generation - 2.8% | |||||||||||
| 18,905 | AES Corp.* | 404,378 | |||||||||
| Electronic Components - Semiconductors - 1.3% | |||||||||||
| 4,285 | Microsemi Corp.* | 94,870 | |||||||||
| 3,725 | SiRF Technology Holdings, Inc.* | 93,609 | |||||||||
| 188,479 | |||||||||||
| Enterprise Software/Services - 1.0% | |||||||||||
| 6,485 | Oracle Corp.*,** | 146,431 | |||||||||
| Shares or Principal Amount | Value | ||||||||||
| Entertainment Software - 0.7% | |||||||||||
| 1,820 | Electronic Arts, Inc.* | $ | 106,306 | ||||||||
| Finance - Consumer Loans - 0.5% | |||||||||||
| 5,500 | Nelnet, Inc. - Class A | 69,905 | |||||||||
| Finance - Credit Card - 1.4% | |||||||||||
| 3,985 | American Express Co. | 207,300 | |||||||||
| Finance - Investment Bankers/Brokers - 2.6% | |||||||||||
| 6,430 | JP Morgan Chase & Co. | 280,670 | |||||||||
| 2,783 | optionsXpress Holdings, Inc. | 94,121 | |||||||||
| 374,791 | |||||||||||
| Finance - Mortgage Loan Banker - 2.1% | |||||||||||
| 5,190 | Fannie Mae | 207,496 | |||||||||
| 3,155 | Freddie Mac | 107,491 | |||||||||
| 314,987 | |||||||||||
| Finance - Other Services - 0.8% | |||||||||||
| 165 | CME Group, Inc. | 113,190 | |||||||||
| Financial Guarantee Insurance - 0.2% | |||||||||||
| 1,660 | MBIA, Inc.# | 30,926 | |||||||||
| Food - Diversified - 1.0% | |||||||||||
| 4,650 | Kraft Foods, Inc. - Class A | 151,730 | |||||||||
| Independent Power Producer - 2.8% | |||||||||||
| 9,445 | NRG Energy, Inc.* | 409,346 | |||||||||
| Industrial Automation and Robotics - 1.4% | |||||||||||
| 2,985 | Rockwell Automation, Inc. | 205,846 | |||||||||
| Insurance Brokers - 1.6% | |||||||||||
| 6,080 | Willis Group Holdings, Ltd. | 230,858 | |||||||||
| Investment Management and Advisory Services - 3.1% | |||||||||||
| 5,325 | National Financial Partners Corp. | 242,874 | |||||||||
| 3,430 | T. Rowe Price Group, Inc. | 208,818 | |||||||||
| 451,692 | |||||||||||
| Medical - Biomedical and Genetic - 1.3% | |||||||||||
| 4,190 | Celgene Corp.* | 193,620 | |||||||||
| Medical - Drugs - 1.1% | |||||||||||
| 2,820 | Merck & Company, Inc. | 163,870 | |||||||||
| Medical - HMO - 2.9% | |||||||||||
| 4,290 | Coventry Health Care, Inc.* | 254,183 | |||||||||
| 3,015 | UnitedHealth Group, Inc. | 175,473 | |||||||||
| 429,656 | |||||||||||
| Medical Instruments - 1.1% | |||||||||||
| 4,115 | St. Jude Medical, Inc.* | 167,234 | |||||||||
| Multimedia - 2.2% | |||||||||||
| 3,670 | McGraw-Hill Companies, Inc. | 160,783 | |||||||||
| 8,130 | News Corporation, Inc. - Class A | 166,583 | |||||||||
| 327,366 | |||||||||||
| Oil - Field Services - 1.6% | |||||||||||
| 9,795 | BJ Services Co. | 237,627 | |||||||||
| Oil and Gas Drilling - 1.3% | |||||||||||
| 6,695 | Nabors Industries, Ltd.* | 183,376 | |||||||||
| Oil Companies - Exploration and Production - 2.4% | |||||||||||
| 3,995 | EOG Resources, Inc. | 356,554 | |||||||||
| Oil Companies - Integrated - 4.1% | |||||||||||
| 5,900 | Hess Corp. | 595,073 | |||||||||
| Oil Refining and Marketing - 1.9% | |||||||||||
| 3,915 | Valero Energy Corp. | 274,167 | |||||||||
See Notes to Schedule of Investments and Financial Statements.
8 Janus Aspen Series December 31, 2007
Schedule of Investments
As of December 31, 2007
| Shares or Principal Amount | Value | ||||||||||
| Power Converters and Power Supply Equipment - 1.3% | |||||||||||
| 3,560 | Hubbell, Inc. - Class B | $ | 183,696 | ||||||||
| Reinsurance - 2.1% | |||||||||||
| 66 | Berkshire Hathaway, Inc. - Class B* | 312,576 | |||||||||
| REIT - Diversified - 1.5% | |||||||||||
| 12,587 | CapitalSource, Inc. | 221,405 | |||||||||
| Respiratory Products - 1.5% | |||||||||||
| 3,335 | Respironics, Inc.* | 218,376 | |||||||||
| Retail - Apparel and Shoe - 2.2% | |||||||||||
| 2,870 | Abercrombie & Fitch Co. - Class A | 229,514 | |||||||||
| 2,415 | Nordstrom, Inc. | 88,703 | |||||||||
| 318,217 | |||||||||||
| Retail - Consumer Electronics - 0.6% | |||||||||||
| 1,722 | Best Buy Company, Inc. | 90,663 | |||||||||
| Retail - Drug Store - 1.4% | |||||||||||
| 5,045 | CVS/Caremark Corp. | 200,539 | |||||||||
| Retail - Jewelry - 1.1% | |||||||||||
| 3,375 | Tiffany & Co. | 155,351 | |||||||||
| Semiconductor Components/Integrated Circuits - 3.2% | |||||||||||
| 18,190 | Atmel Corp.* | 78,581 | |||||||||
| 7,105 | Cypress Semiconductor Corp.* | 255,992 | |||||||||
| 10,015 | Marvell Technology Group, Ltd.* | 140,010 | |||||||||
| 474,583 | |||||||||||
| Semiconductor Equipment - 1.2% | |||||||||||
| 3,735 | KLA-Tencor Corp. | 179,878 | |||||||||
| Telecommunication Equipment - 1.5% | |||||||||||
| 11,075 | Arris Group, Inc.* | 110,529 | |||||||||
| 2,275 | CommScope, Inc.* | 111,952 | |||||||||
| 222,481 | |||||||||||
| Telecommunication Equipment - Fiber Optics - 1.3% | |||||||||||
| 7,700 | Corning, Inc. | 184,723 | |||||||||
| Telecommunication Services - 2.3% | |||||||||||
| 6,930 | SAVVIS, Inc.* | 193,416 | |||||||||
| 7,310 | Time Warner Telecom, Inc. - Class A*,# | 148,320 | |||||||||
| 341,736 | |||||||||||
| Therapeutics - 2.2% | |||||||||||
| 4,375 | Amylin Pharmaceuticals, Inc.*,# | 161,875 | |||||||||
| 3,590 | Gilead Sciences, Inc.* | 165,176 | |||||||||
| 327,051 | |||||||||||
| Tobacco - 1.4% | |||||||||||
| 2,770 | Altria Group, Inc. | 209,357 | |||||||||
| Toys - 1.1% | |||||||||||
| 8,110 | Mattel, Inc. | 154,414 | |||||||||
| Transportation - Services - 3.0% | |||||||||||
| 3,640 | C.H. Robinson Worldwide, Inc. | 196,997 | |||||||||
| 3,455 | United Parcel Service, Inc. - Class B | 244,337 | |||||||||
| 441,334 | |||||||||||
| Web Portals/Internet Service Providers - 1.1% | |||||||||||
| 6,675 | Yahoo!, Inc.* | 155,261 | |||||||||
| Wireless Equipment - 2.5% | |||||||||||
| 6,475 | Crown Castle International Corp.* | 269,360 | |||||||||
| 2,445 | QUALCOMM, Inc. | 96,211 | |||||||||
| 365,571 | |||||||||||
| Total Common Stock (cost $14,003,061) | 14,488,542 | ||||||||||
| Shares or Principal Amount | Value | ||||||||||
| Money Markets - 0.7% | |||||||||||
| 108,970 | Janus Institutional Cash Management Fund – Institutional Shares, 4.98% (cost $108,970) | $ | 108,970 | ||||||||
| Other Securities - 1.7% | |||||||||||
| 175,411 | Allianz Dresdner Daily Asset Fund† | 175,411 | |||||||||
| 41,037 | Repurchase Agreements† | 41,037 | |||||||||
| 31,552 | Time Deposits† | 31,552 | |||||||||
| Total Other Securities (cost $248,000) | 248,000 | ||||||||||
| Total Investments (total cost $14,360,031) – 101.3% | 14,845,512 | ||||||||||
| Liabilities, net of Cash, Receivables and Other Assets – (1.3)% | (186,964 | ) | |||||||||
| Net Assets – 100% | $ | 14,658,548 | |||||||||
Summary of Investments by Country – (Long Positions)
| Country | Value | % of Investment Securities | |||||||||
| Bermuda | $ | 710,233 | 4.8 | % | |||||||
| Brazil | 42,171 | 0.3 | % | ||||||||
| Hong Kong | 52,193 | 0.3 | % | ||||||||
| United States†† | 14,040,915 | 94.6 | % | ||||||||
| Total | $ | 14,845,512 | 100.0 | % | |||||||
††Includes Short-Term Securities and Other Securities (92.2% excluding Short-Term Securities and Other Securities)
See Notes to Schedule of Investments and Financial Statements.
Janus Aspen Series December 31, 2007 9
Janus Aspen Fundamental Equity Portfolio
Total Return Swaps outstanding at December 31, 2007
| Counterparty | Notional Amount | Return Paid by the Portfolio | Return Received by the Portfolio | Termination Date | Unrealized Appreciation/ Depreciation | ||||||||||||||||||
| Lehman Brothers | $ | (34,046 | ) | 1- month S&P 500® | 1-month Fannie Mae | ||||||||||||||||||
| Index plus LIBOR | plus LIBOR | ||||||||||||||||||||||
| minus 5 basis points | plus 20 basis points | 7/24/2008 | $ | (29,427 | ) | ||||||||||||||||||
| Total | $ | (29,427 | ) | ||||||||||||||||||||
10 Janus Aspen Series December 31, 2007
Statement of Assets and Liabilities
| As of December 31, 2007 (all numbers in thousands except net asset value per share) | Janus Aspen Fundamental Equity Portfolio | ||||||
| Assets: | |||||||
| Investments at cost(1) | $ | 14,360 | |||||
| Investments at value(1) | $ | 14,737 | |||||
| Affiliated money market investments | 109 | ||||||
| Cash | 49 | ||||||
| Cash denominated in foreign currency (cost $34) | 34 | ||||||
| Receivables: | |||||||
| Investments sold | 7 | ||||||
| Portfolio shares sold | – | ||||||
| Dividends | 18 | ||||||
| Interest | 1 | ||||||
| Swap contract | 5 | ||||||
| Due from adviser | 12 | ||||||
| Other assets | – | ||||||
| Non-interested Trustees' deferred compensation | – | ||||||
| Total Assets | 14,972 | ||||||
| Liabilities: | |||||||
| Payables: | |||||||
| Collateral for securities loaned (Note 1) | 248 | ||||||
| Swap contract | 1 | ||||||
| Portfolio shares repurchased | 6 | ||||||
| System fees | 5 | ||||||
| Advisory fees | 7 | ||||||
| Transfer agent fees and expenses | 1 | ||||||
| Distribution fees - Service Shares | 1 | ||||||
| Printing expenses | 14 | ||||||
| Non-interested Trustees' fees and expenses | 1 | ||||||
| Foreign tax liability | 4 | ||||||
| Professional fees | 16 | ||||||
| Non-interested Trustees' deferred compensation fees | – | ||||||
| Accrued expenses | 9 | ||||||
| Total Liabilities | 313 | ||||||
| Net Assets | $ | 14,659 | |||||
| Net Assets Consist of: | |||||||
| Capital (par value and paid-in-surplus)* | $ | 10,512 | |||||
| Undistributed net investment income/(loss)* | 6 | ||||||
| Undistributed net realized gain/(loss) from investments and foreign currency transactions* | 3,689 | ||||||
| Unrealized appreciation/(depreciation) of investments, foreign currency translations and non-interested Trustees' deferred compensation(2) | 452 | ||||||
| Total Net Assets | $ | 14,659 | |||||
| Net Assets - Institutional Shares | $ | 12,198 | |||||
| Shares Outstanding, $0.001 Par Value (unlimited shares authorized) | 473 | ||||||
| Net Asset Value Per Share | $ | 25.77 | |||||
| Net Assets - Service Shares | $ | 2,461 | |||||
| Shares Outstanding, $0.001 Par Value (unlimited shares authorized) | 95 | ||||||
| Net Asset Value Per Share | $ | 25.86 | |||||
*See Note 3 in Notes to Financial Statements.
(1) Investments at cost and value include $236,568 of securities loaned (Note 1).
(2) Net of foreign taxes on investments of $3,744.
See Notes to Financial Statements.
Janus Aspen Series December 31, 2007 11
Statement of Operations
| For the fiscal year ended December 31, 2007 (all numbers in thousands) | Janus Aspen Fundamental Equity Portfolio | ||||||
| Investment Income: | |||||||
| Interest | $ | 1 | |||||
| Securities lending income | 1 | ||||||
| Dividends | 207 | ||||||
| Dividends from affiliates | 16 | ||||||
| Foreign tax withheld | (4 | ) | |||||
| Total Investment Income | 221 | ||||||
| Expenses: | |||||||
| Advisory fees | 90 | ||||||
| Transfer agent fees and expenses | 4 | ||||||
| Registration fees | 14 | ||||||
| Custodian fees | 23 | ||||||
| Professional fees | 12 | ||||||
| Non-interested Trustees' fees and expenses | 4 | ||||||
| Printing expenses | 42 | ||||||
| Distribution fees - Service Shares | 6 | ||||||
| System fees | 19 | ||||||
| Legal fees | 7 | ||||||
| Other expenses | 6 | ||||||
| Non-recurring costs (Note 2) | – | ||||||
| Costs assumed by Janus Capital Management LLC (Note 2) | – | ||||||
| Total Expenses | 227 | ||||||
| Expense and Fee Offset | (1 | ) | |||||
| Net Expenses | 226 | ||||||
| Less: Excess Expense Reimbursement | (41 | ) | |||||
| Net Expenses after Expense Reimbursement | 185 | ||||||
| Net Investment Income/(Loss) | 36 | ||||||
| Net Realized and Unrealized Gain/(Loss) on Investments: | |||||||
| Net realized gain/(loss) from investments and foreign currency transactions | 3,674 | ||||||
| Net realized gain/(loss) from options contracts | 28 | ||||||
| Net realized gain/(loss) from swap contracts | 24 | ||||||
| Change in net appreciation/(depreciation) of investments, foreign currency translations and non-interested Trustees' deferred compensation(1) | (2,139 | ) | |||||
| Payment from affiliate (Note 2) | – | ||||||
| Net Gain/(Loss) on Investments | 1,587 | ||||||
| Net Increase/(Decrease) in Net Assets Resulting from Operations | $ | 1,623 | |||||
(1) Net of foreign taxes on investments of $3,744.
See Notes to Financial Statements.
12 Janus Aspen Series December 31, 2007
Statements of Changes in Net Assets
| For the fiscal years ended December 31 | Janus Aspen Fundamental Equity Portfolio | ||||||||||
| (all numbers in thousands) | 2007 | 2006 | |||||||||
| Operations: | |||||||||||
| Net investment income/(loss) | $ | 36 | $ | 18 | |||||||
| Net realized gain/(loss) from investments and foreign currency transactions | 3,674 | 1,516 | |||||||||
| Net realized gain/(loss) from option contracts | 28 | – | |||||||||
| Net realized gain/(loss) from swap contracts | 24 | – | |||||||||
| Change in net appreciation/(depreciation) of investments, foreign currency translations and non-interested Trustees' deferred compensation | (2,139 | ) | (161 | ) | |||||||
| Payment from affiliate (Note 2) | – | – | |||||||||
| Net Increase/(Decrease) in Net Assets Resulting from Operations | 1,623 | 1,373 | |||||||||
| Dividends and Distributions to Shareholders: | |||||||||||
| Net investment income* | |||||||||||
| Institutional Shares | (28 | ) | (23 | ) | |||||||
| Service Shares | (2 | ) | (1 | ) | |||||||
| Net realized gain/(loss) from investment transactions* | |||||||||||
| Institutional Shares | (77 | ) | – | ||||||||
| Service Shares | (13 | ) | – | ||||||||
| Net Decrease from Dividends and Distributions | (120 | ) | (24 | ) | |||||||
| Capital Share Transactions: | |||||||||||
| Shares sold | |||||||||||
| Institutional Shares | 2,947 | 2,714 | |||||||||
| Service Shares | 792 | 1,497 | |||||||||
| Reinvested dividends and distributions | |||||||||||
| Institutional Shares | 105 | 23 | |||||||||
| Service Shares | 15 | 1 | |||||||||
| Shares repurchased | |||||||||||
| Institutional Shares | (5,480 | ) | (3,407 | ) | |||||||
| Service Shares | (388 | ) | (859 | ) | |||||||
| Net Increase/(Decrease) from Capital Share Transactions | (2,009 | ) | (31 | ) | |||||||
| Net Increase/(Decrease) in Net Assets | (506 | ) | 1,318 | ||||||||
| Net Assets: | |||||||||||
| Beginning of period | 15,165 | 13,847 | |||||||||
| End of period | $ | 14,659 | $ | 15,165 | |||||||
| Undistributed net investment income/(loss)* | $ | 6 | $ | – | |||||||
*See Note 3 in Notes to Financial Statements.
See Notes to Financial Statements.
Janus Aspen Series December 31, 2007 13
Financial Highlights
Institutional Shares
| For a share outstanding during | Janus Aspen Fundamental Equity Portfolio | ||||||||||||||||||||||
| each fiscal year ended December 31 | 2007 | 2006 | 2005 | 2004 | 2003 | ||||||||||||||||||
| Net Asset Value, Beginning of Period | $ | 23.40 | $ | 21.31 | $ | 18.44 | $ | 16.27 | $ | 13.24 | |||||||||||||
| Income from Investment Operations: | |||||||||||||||||||||||
| Net investment income/(loss) | .08 | .04 | .02 | .03 | .02 | ||||||||||||||||||
| Net gain/(loss) on securities (both realized and unrealized) | 2.50 | 2.09 | 2.87 | 2.16 | 3.04 | ||||||||||||||||||
| Total from Investment Operations | 2.58 | 2.13 | 2.89 | 2.19 | 3.06 | ||||||||||||||||||
| Less Distributions and Other: | |||||||||||||||||||||||
| Dividends (from net investment income)* | (.06 | ) | (.04 | ) | (.02 | ) | (.02 | ) | (.02 | ) | |||||||||||||
| Distributions (from capital gains)* | (.15 | ) | – | – | – | – | |||||||||||||||||
| Tax return of capital* | – | – | – | – | (.01 | ) | |||||||||||||||||
| Payment from affiliate | – | (1) | – | – | (1) | – | – | ||||||||||||||||
| Total Distributions and Other | (.21 | ) | (.04 | ) | (.02 | ) | (.02 | ) | (.03 | ) | |||||||||||||
| Net Asset Value, End of Period | $ | 25.77 | $ | 23.40 | $ | 21.31 | $ | 18.44 | $ | 16.27 | |||||||||||||
| Total Return | 11.02 | %(2) | 9.99 | % | 15.68 | %(2) | 13.44 | % | 23.10 | % | |||||||||||||
| Net Assets, End of Period (in thousands) | $ | 12,198 | $ | 13,331 | $ | 12,798 | $ | 10,414 | $ | 10,593 | |||||||||||||
| Average Net Assets for the Period (in thousands) | $ | 12,754 | $ | 13,447 | $ | 11,057 | $ | 10,039 | $ | 9,905 | |||||||||||||
| Ratio of Gross Expenses to Average Net Assets(3) | 1.20 | % | 1.20 | % | 1.21 | % | 1.23 | % | 1.25 | % | |||||||||||||
| Ratio of Net Expenses to Average Net Assets(3) | 1.20 | % | 1.20 | % | 1.20 | % | 1.23 | % | 1.25 | % | |||||||||||||
| Ratio of Net Investment Income/(Loss) to Average Net Assets | 0.27 | % | 0.15 | % | 0.06 | % | 0.14 | % | 0.03 | % | |||||||||||||
| Portfolio Turnover Rate | 124 | % | 51 | % | 62 | % | 65 | % | 82 | % | |||||||||||||
Service Shares
| For a share outstanding during | Janus Aspen Fundamental Equity Portfolio | ||||||||||||||||||||||
| each fiscal year ended December 31 | 2007 | 2006 | 2005 | 2004 | 2003 | ||||||||||||||||||
| Net Asset Value, Beginning of Period | $ | 23.50 | $ | 21.44 | $ | 18.59 | $ | 16.42 | $ | 13.16 | |||||||||||||
| Income from Investment Operations: | |||||||||||||||||||||||
| Net investment income/(loss) | .02 | (.01 | ) | – | (.01 | ) | – | ||||||||||||||||
| Net gain/(loss) on securities (both realized and unrealized) | 2.51 | 2.09 | 2.85 | 2.18 | 3.30 | ||||||||||||||||||
| Total from Investment Operations | 2.53 | 2.08 | 2.85 | 2.17 | 3.30 | ||||||||||||||||||
| Less Distributions and Other: | |||||||||||||||||||||||
| Dividends (from net investment income)* | (.02 | ) | (.02 | ) | – | – | (.04 | ) | |||||||||||||||
| Distributions (from capital gains)* | (.15 | ) | – | – | – | – | |||||||||||||||||
| Tax return of capital* | – | – | – | – | – | (4) | |||||||||||||||||
| Payment from affiliate | – | – | – | (1) | – | – | |||||||||||||||||
| Total Distributions and Other | (.17 | ) | (.02 | ) | – | – | (.04 | ) | |||||||||||||||
| Net Asset Value, End of Period | $ | 25.86 | $ | 23.50 | $ | 21.44 | $ | 18.59 | $ | 16.42 | |||||||||||||
| Total Return | 10.79 | % | 9.69 | % | 15.35 | %(2) | 13.22 | % | 25.08 | % | |||||||||||||
| Net Assets, End of Period (in thousands) | $ | 2,461 | $ | 1,834 | $ | 1,049 | $ | 379 | $ | 289 | |||||||||||||
| Average Net Assets for the Period (in thousands) | $ | 2,209 | $ | 1,825 | $ | 667 | $ | 290 | $ | 219 | |||||||||||||
| Ratio of Gross Expenses to Average Net Assets(3) | 1.45 | % | 1.45 | % | 1.46 | % | 1.48 | % | 1.50 | % | |||||||||||||
| Ratio of Net Expenses to Average Net Assets(3) | 1.45 | % | 1.45 | % | 1.45 | % | 1.48 | % | 1.50 | % | |||||||||||||
| Ratio of Net Investment Income/(Loss) to Average Net Assets | 0.04 | % | (0.12 | )% | (0.21 | )% | (0.09 | )% | (0.39 | )% | |||||||||||||
| Portfolio Turnover Rate | 124 | % | 51 | % | 62 | % | 65 | % | 82 | % | |||||||||||||
* See Note 3 in Notes to Financial Statements.
(1) Payment from affiliate aggregated less than $.01 on a per share basis for the fiscal year ended.
(2) During the fiscal year ended, Janus Capital and/or Janus Services LLC fully reimbursed the Portfolio for a loss on a transaction resulting from certain trading, pricing and/or shareholder activity errors, which otherwise would have reduced total return by less than 0.01%.
(3) See Note 4 in Notes to Financial Statements.
(4) Tax return of capital aggregated less than $.01 on a per share basis for the fiscal year ended.
See Notes to Financial Statements.
14 Janus Aspen Series December 31, 2007
Notes to Schedule of Investments
| Lipper Variable Annuity Large-Cap Core Funds | Funds that, by portfolio practice, invest at least 75% of their equity assets in companies with market capitalizations (on a three-year weighted basis) greater than 300% of the dollar-weighted median market capitalization of the middle 1,000 securities of the S&P SuperComposite 1500 Index. Large-cap core funds have more latitude in the companies in which they invest. These funds typically have an average price-to-earnings ratio, price-to-book ratio, and three-year sales-per-share growth value, compared to the S&P 500® Index. | ||||||
| Russell 1000® Growth Index | Measures the performance of those Russell 1000 Index® companies with higher price-to-book ratios and higher forecasted growth values. | ||||||
| S&P 500® Index | The Standard & Poor's ("S&P") 500® Index is a commonly recognized, market capitalization weighted index of 500 widely held equity securities, designed to measure broad U.S. equity performance. | ||||||
| 144A | Securities sold under Rule 144A of the Securities Act of 1933, as amended, are subject to legal and/or contractual restrictions on resale and may not be publicly sold without registration under the 1933 Act. | ||||||
| ADR | American Depositary Receipt | ||||||
| REIT | Real Estate Investment Trust | ||||||
* Non-income-producing security.
** A portion of this security has been segregated by the custodian to cover margin or segregation requirements on open futures contracts, forward currency contracts, options contracts, short sales and/or securities with extended settlement dates.
† The security is purchased with the cash collateral received from securities on loan (Note 1).
# Loaned security; a portion or all of the security is on loan at December 31, 2007.
ºº Schedule of Fair Valued Securities (as of December 31, 2007)
| Value | Value as a % of Net Assets | ||||||||||
| Janus Aspen Fundamental Equity Portfolio | |||||||||||
| Bank Tec (144A) | $ | 35,100 | 0.2 | % | |||||||
Securities are valued at "fair value" pursuant to procedures adopted by the Portfolio's Trustees. The Schedule of Fair Valued Securities does not include international activities fair valued pursuant to a systematic fair valuation model.
§Schedule of Restricted and Illiquid Securities (as of December 31, 2007)
| Acquisition Date | Acquisition Cost | Value | Value as % of Net Assets | ||||||||||||||||
| Janus Aspen Fundamental Equity Portfolio | |||||||||||||||||||
| Bank Tec (144A)ºº | 6/20/07 | $ | 46,800 | $ | 35,100 | 0.2 | % | ||||||||||||
The Portfolio has registration rights for certain restricted securities held as of December 31, 2007. The issuer incurs all registration costs.
Aggregate collateral segregated to cover margin or segregation requirements on open futures contracts, forward currency contracts, options contracts, short sales and/or securities with extended settlement dates as of December 31, 2007 is noted below.
| Portfolio | Aggregate Value | ||||||
| Janus Aspen Fundamental Equity Portfolio | $ | 14,601 | |||||
Janus Aspen Series December 31, 2007 15
Notes to Financial Statements
The following section describes the organization and significant accounting policies and provides more detailed information about the schedules and tables that appear throughout this report. In addition, the Notes to Financial Statements explain the methods used in preparing and presenting this report.
1. ORGANIZATION AND SIGNIFICANT ACCOUNTING POLICIES
Janus Aspen Fundamental Equity Portfolio (the "Portfolio") is a series fund. The Portfolio is part of Janus Aspen Series (the "Trust"), which is organized as a Delaware statutory trust and is registered under the Investment Company Act of 1940, as amended, (the "1940 Act") as an open-end management investment company. The Trust offers seventeen Portfolios, which include multiple series of shares, with differing investment objectives and policies. The Portfolio invests primarily in equity securities. The Portfolio is classified as diversified, as defined in the 1940 Act. The Portfolio is a no-load investment.
The Portfolio currently offers two classes of shares: Institutional Shares and Service Shares. Institutional Shares are offered only in connection with investment in and payments under variable insurance contracts and to qualified retirement plans. Service Shares are offered only in connection with investment in and payments under variable insurance contracts and to qualified retirement plans that require a fee from Portfolio assets to procure distribution and administrative services to contract owners and plan participants.
The following accounting policies have been consistently followed by the Portfolio and are in conformity with accounting principles generally accepted in the United States of America in the investment company industry.
Investment Valuation
Securities are valued at the last sales price or the official closing price for securities traded on a principal securities exchange (U.S. or foreign) and on the NASDAQ National Market. Securities traded on over-the-counter markets and listed securities for which no sales are reported are valued at the latest bid price (or yield equivalent thereof) obtained from one or more dealers transacting in a market for such securities or by a pricing service approved by the Portfolio's Trustees. Short-term securities with maturities of 60 days or less may be valued at amortized cost, which approximates market value. Debt securities with a remaining maturity of greater than 60 days are valued in accordance with the evaluated bid price supplied by the pricing service. The evaluated bid price supplied by the pricing service is an evaluation that reflects such factors as security prices, yields, maturities and ratings. Foreign securities and currencies ar e converted to U.S. dollars using the applicable exchange rate in effect as of the daily close of the New York Stock Exchange ("NYSE"). When market quotations are not readily available or deemed unreliable, or events or circumstances that may affect the value of portfolio securities held by the Portfolio are identified between the closing of their principal markets and the time the net asset value ("NAV") is determined, securities may be valued at fair value as determined in good faith under procedures established by and under the supervision of the Portfolio's Trustees. Circumstances in which fair value pricing may be utilized include, but are not limited to: (i) when significant events occur which may affect the securities of a single issuer, such as mergers, bankruptcies, or significant issuer specific developments; (ii) when significant events occur which may affect an entire market, such as natural disasters or significant governmen tal actions; and (iii) when non-significant events occur such as markets closing early or not opening, security trading halts, or pricing of non-valued securities and restricted or non-public securities. The Portfolio may use a systematic fair valuation model provided by an independent third party to value international equity securities in order to adjust for stale pricing, which may occur between the close of certain foreign exchanges and the NYSE.
Investment Transactions and Investment Income
Investment transactions are accounted for as of the date purchased or sold (trade date). Dividend income is recorded on the ex-dividend date. Certain dividends from foreign securities will be recorded as soon as the Trust is informed of the dividend if such information is obtained subsequent to the ex-dividend date. Dividends from foreign securities may be subject to withholding taxes in foreign jurisdictions. Interest income is recorded on the accrual basis and includes amortization of premiums and accretion of discounts. Gains and losses are determined on the identified cost basis, which is the same basis used for federal income tax purposes. Income, as well as gains and losses, both realized and unrealized, are allocated daily to each class of shares based upon the ratio of net assets represented by each class as a percentage of total net assets.
Expenses
The Portfolio bears expenses incurred specifically on its behalf as well as a portion of general expenses. Each class of shares bears expenses incurred specifically on its behalf and, in addition, each class bears a portion of general expenses, which may be based upon relative net assets of each class. Expenses are allocated daily to each class of shares based upon the ratio of net assets represented by each class as a percentage of total net assets. Expenses directly attributable to a specific class of shares are charged against the operations of such class.
Securities Lending
Under procedures adopted by the Trustees, the Portfolio may lend securities to qualified parties (typically brokers or other financial institutions) who need to borrow securities in order to complete certain transactions such as covering short sales, avoiding failures to deliver securities or completing arbitrage activities. The Portfolio may seek to earn additional income through securities lending. There is the risk of delay in recovering a loaned security or the risk of loss in collateral rights if the borrower fails financially. Janus Capital Management LLC ("Janus Capital") makes efforts to balance the benefits and risks from granting such loans.
State Street Bank and Trust Company served as the Portfolio's lending agent for the period January 1, 2007 through May 24, 2007. Effective May 25, 2007, Dresdner Bank AG became the lending agent for the Portfolio.
The Portfolio does not have the right to vote on securities while they are being lent; however, the Portfolio may attempt to call back the loan and vote the proxy if time permits. All loans will be continuously secured by collateral which may consist of cash, U.S. Government securities, domestic and foreign
16 Janus Aspen Series December 31, 2007
short-term debt instruments, letters of credit, time deposits, repurchase agreements, or such other collateral permitted by the Securities and Exchange Commission ("SEC"). Cash collateral may be invested in affiliated money market funds or other accounts advised by Janus Capital to the extent consistent with exemptive relief obtained from the SEC or as permitted by the 1940 Act and rules promulgated thereunder.
Dresdner Bank AG (the "Lending Agent") may also invest the cash collateral in the Allianz Dresdner Daily Asset Fund or investments in unaffiliated money market funds or accounts, mutually agreed to by the Portfolio and the Lending Agent, that comply with Rule 2a-7 of the 1940 Act relating to money market funds.
As of December 31, 2007, the Portfolio had on loan securities valued as indicated:
| Portfolio | Value at December 31, 2007 | ||||||
| Janus Aspen Fundamental Equity Portfolio | $ | 236,568 | |||||
As of December 31, 2007, the Portfolio received cash collateral for securities lending activity as indicated:
| Portfolio | Cash Collateral at December 31, 2007 | ||||||
| Janus Aspen Fundamental Equity Portfolio | $ | 248,000 | |||||
As of December 31, 2007, all cash collateral received by the Portfolio was invested in the Allianz Dresdner Daily Asset Fund, except for $41,037 and $31,552 which were invested in Repurchase Agreements and Time Deposits, respectively.
The value of the collateral must be at least 102% of the market value of the loaned securities that are denominated in U.S. dollars and 105% of the market value of the loaned securities that are not denominated in U.S. dollars. Loaned securities and related collateral are marked-to-market each business day based upon the market value of the loaned securities at the close of business, employing the most recent available pricing information. Collateral levels are then adjusted based on this mark-to-market evaluation.
The borrower pays fees at the Portfolio's direction to the Lending Agent. The Lending Agent may retain a portion of the interest earned on the cash collateral invested. The cash collateral invested by the Lending Agent is disclosed in the Schedule of Investments (if applicable). The lending fees and the Portfolio's portion of the interest income earned on cash collateral are included on the Statement of Operations (if applicable).
Interfund Lending
Pursuant to an exemptive order received from the SEC, the Portfolio may be party to an interfund lending agreement between the Portfolio and other Janus Capital sponsored mutual funds, which permits it to borrow or lend cash at a rate beneficial to both the borrowing and lending funds. Outstanding borrowings from all sources totaling 10% or more of the borrowing Portfolio's total assets must be collateralized at 102% of the outstanding principal value of the loan; loans of less than 10% may be unsecured. During the fiscal year ended December 31, 2007, there were no outstanding interfund borrowing or lending arrangements for the Portfolio.
Forward Currency Transactions
The Portfolio may enter into forward currency contracts in order to reduce its exposure to changes in foreign currency exchange rates on its foreign portfolio holdings and to lock in the U.S. dollar cost of firm purchase and sale commitments for securities denominated in or exposed to foreign currencies. A forward currency exchange contract is a commitment to purchase or sell a foreign currency at a future date at a negotiated rate. The gain or loss arising from the difference between the U.S. dollar cost of the original contract and the value of the foreign currency in U.S. dollars upon closing a contract is included in "Net realized gain/(loss) from investment and foreign currency transactions" on the Statement of Operations (if applicable).
Forward currency contracts held by the Portfolio are fully collateralized by other securities, which are denoted in the accompanying Schedule of Investments (if applicable). The collateral is evaluated daily to ensure its market value equals or exceeds the current market value of the corresponding forward currency contracts. As of December 31, 2007, the Portfolio was not invested in forward foreign currency contracts.
Futures Contracts
The Portfolio may enter into futures contracts to gain exposure to the stock market pending investment of cash balances or to meet liquidity needs. The Portfolio may also use such derivative instruments to hedge or protect from adverse movements in securities prices, currency rates or interest rates. The use of futures contracts may involve risks such as the possibility of illiquid markets or imperfect correlation between the value of the contracts and the underlying securities, or that the counterparty will fail to perform its obligations.
Futures contracts are marked-to-market daily, and the daily variation margin is recorded as a receivable or payable on the Statement of Assets and Liabilities (if applicable). When a contract is closed, a realized gain or loss is recorded as "Net realized gain/(loss) from futures contracts" on the Statement of Operations (if applicable) equal to the difference between the opening and closing value of the contract. Generally, futures contracts are marked-to-market (i.e., treated as realized and subject to distribution) for federal income tax purposes at fiscal year-end. Securities designated as collateral for market value on futures contracts are noted in the Schedule of Investments (if applicable). Such collateral is in the possession of the Portfolio's custodian. As of December 31, 2007, the Portfolio was not invested in futures contracts.
Swaps
The Portfolio may enter into swap agreements to hedge its exposure to interest rates and credit risk or for investment purposes. A swap is an agreement that obligates two parties to exchange a series of cash flows at specified intervals based upon or calculated by reference to changes in specified prices or rates for a specified amount of an underlying asset. The payment flows are usually netted against each other, with the difference being paid by one party to the other. Swap contracts are reported as an asset and liability on the Statement of Assets and Liabilities. Realized gains and losses are reported in "Net realized gain/(loss) from swap contracts" on the Statement of Operations (if applicable).
Janus Aspen Series December 31, 2007 17
Notes to Financial Statements (continued)
Risks may arise as a result of the failure of the counterparty to the swap contract to comply with the terms of the swap contract. The loss incurred by the failure of a counterparty is generally limited to the net interim payment to be received by the Portfolio, and/or the termination value. Therefore, the Portfolio considers the creditworthiness of each counterparty to a swap contract in evaluating potential credit risk. Additionally, risks may arise from unanticipated movements in interest rates or in the value of the underlying securities.
Options Contracts
The Portfolio may purchase or write put and call options on futures contracts and on portfolio securities for hedging purposes or as a substitute for an investment. The Portfolio may also purchase or write put and call options on foreign currencies in a manner similar to that in which futures or forward contracts on foreign currencies will be utilized. The Portfolio generally invests in options to hedge against adverse movements in the value of portfolio holdings.
When an option is written, the Portfolio receives a premium and becomes obligated to sell or purchase the underlying security at a fixed price, upon exercise of the option. In writing an option, the Portfolio bears the market risk of an unfavorable change in the price of the security underlying the written option. Exercise of an option written by the Portfolio could result in the Portfolio buying or selling a security at a price different from the current market value.
When an option is exercised, the proceeds on sales for a written call option, the purchase cost for a written put option, or the cost of the security for a purchased put or call option is adjusted by the amount of premium received or paid.
The Portfolio may also purchase and write exchange-listed and over-the-counter put and call options on domestic securities indices, and on foreign securities indices listed on domestic and foreign securities exchanges. Options on securities indices are similar to options on securities except that (1) the expiration cycles of securities index options are monthly, while those of securities options are currently quarterly, and (2) the delivery requirements are different. Instead of giving the right to take or make delivery of securities at a specified price, an option on a securities index gives the holder the right to receive a cash ''exercise settlement amount'' equal to (a) the amount, if any, by which the fixed exercise price of the option exceeds (in the case of a put) or is less than (in the case of a call) the closing value of the underlying index on the date of exercise, multiplied by (b) a fixed ''index multiplier.'' Receipt of this ca sh amount will depend upon the closing level of the securities index upon which the option is based being greater than, in the case of a call, or less than, in the case of a put, the exercise price of the index and the exercise price of the option times a specified multiple. The writer of the option is obligated, in return for the premium received, to make delivery of this amount.
Holdings designated to cover outstanding written options are noted in the Schedule of Investments (if applicable). Options written are reported as a liability on the Statement of Assets and Liabilities as "Options written at value" (if applicable). Realized gains and losses are reported as "Net realized gain/(loss) from options contracts" on the Statement of Operations (if applicable). The Portfolio recognized realized gains of $27,717 from written options during the fiscal year ended December 31, 2007.
The risk in writing a call option is that the Portfolio gives up the opportunity for profit if the market price of the security increases and the option is exercised. The risk in writing a put option is that the Portfolio may incur a loss if the market price of the security decreases and the option is exercised. The risk in buying an option is that the Portfolio pays a premium whether or not the option is exercised. The use of such instruments may involve certain additional risks as a result of unanticipated movement in the market. A lack of correlation between the value of an instrument underlying an option and the asset being hedged, or unexpected adverse price movements, could render the Portfolio's hedging strategy unsuccessful. In addition, there can be no assurance that a liquid secondary market will exist for any option purchased or sold. There is no limit to the loss that the Portfolio may recognize due to written call options.
Written option activity for the fiscal year ended December 31, 2007 was as follows:
| Call Options | Number of Contracts | Premiums Received | |||||||||
| Janus Aspen Fundamental Equity Portfolio | |||||||||||
| Options outstanding at December 31, 2006 | – | $ | – | ||||||||
| Options written | 494 | (1) | 129,725 | ||||||||
| Options closed | (297 | ) | (117,480 | ) | |||||||
| Options expired | (182 | ) | (10,699 | ) | |||||||
| Options exercised | (15 | ) | (1,546 | ) | |||||||
| Options outstanding at December 31, 2007 | – | $ | – | ||||||||
(1) Adjusted for Marathon Oil Corp. 2 for 1 stock split 6/19/07
| Put Options | Number of Contracts | Premiums Received | |||||||||
| Janus Aspen Fundamental Equity Portfolio | |||||||||||
| Options outstanding at December 31, 2006 | 14 | $ | 2,030 | ||||||||
| Options written | – | – | |||||||||
| Options closed | (14 | ) | (2,030 | ) | |||||||
| Options expired | – | – | |||||||||
| Options exercised | – | – | |||||||||
| Options outstanding at December 31, 2007 | – | $ | – | ||||||||
Short Sales
The Portfolio may engage in "short sales against the box." Short sales against the box involve either selling short a security that the Portfolio owns, or selling short a security that the Portfolio has the right to obtain, for delivery at a specified date in the future. The Portfolio may enter into a short sale against the box to hedge against anticipated declines in the market price of portfolio securities by locking in gains. The Portfolio does not deliver from its portfolio the securities sold short and does not immediately receive the proceeds of the short sale. The Portfolio borrows the securities sold short and receives proceeds from the short sale only when it delivers the securities to the lender. If the value of the securities sold short increases prior to the scheduled delivery date, the Portfolio loses the opportunity to participate in the gain.
18 Janus Aspen Series December 31, 2007
The Portfolio may engage in short sales when the investment personnel anticipate that a security's market purchase price will be less than its borrowing price. To complete the transaction, the Portfolio must borrow the security to deliver it to the purchaser and buy that same security in the market to return it to the lender. The total market value of all of the Portfolio's short sale positions will not exceed 10% of its assets. Although the potential for gain is limited to the difference between the price at which the Portfolio sold the security short and the cost of borrowing the security, its potential for loss is theoretically unlimited because there is no limit to the cost of replacing the borrowed security. There is no assurance that the Portfolio will be able to close out a short position at a particular time or at an acceptable price. A gain or a loss will be recognized upon termination of a short sale. There is no limit to the size of any loss that the Portfolio may recognize upon termination of a short sale. Short sales held by the Portfolio are fully collateralized by other securities, which are denoted in the accompanying Schedule of Investments (if applicable). As of December 31, 2007, the Portfolio was not engaged in short sales.
Foreign Currency Translations
The Portfolio does not isolate that portion of the results of operations resulting from changes in foreign exchange rates on investments from the fluctuations arising from changes in market prices of securities held at the date of the financial statements. Net unrealized appreciation or depreciation on investments and foreign currency translation arise from changes in the value of assets and liabilities, including investments in securities held at the date of the financial statements, resulting from changes in the exchange rates and changes in market prices of securities held.
Currency gains and losses are also calculated on payables and receivables that are denominated in foreign currencies. The payables and receivables are generally related to foreign security transactions and income.
Foreign currency-denominated assets and forward currency contracts may involve more risks than domestic transactions, including currency risk, political and economic risk, regulatory risk and market risk. Risks may arise from the potential inability of a counterparty to meet the terms of a contract and from unanticipated movements in the value of foreign currencies relative to the U.S. dollar.
When-issued Securities
The Portfolio may purchase or sell securities on a when-issued or forward commitment basis. The price of the underlying securities and date when the securities will be delivered and paid for are fixed at the time the transaction is negotiated. Losses may arise due to changes in the market value of the securities or from the inability of counterparties to meet the terms of the contract. In connection with such purchases, the Portfolio may hold liquid assets as collateral with the Portfolio's custodian sufficient to cover the purchase price. As of December 31, 2007, the Portfolio was not invested in when-issued securities.
Equity-Linked Structured Notes
The Portfolio may invest in equity-linked structured notes. Equity-linked structured notes are derivative securities which are specially designed to combine the characteristics of one or more underlying securities and their equity derivatives in a single note form. The return and/or yield or income component may be based on the performance of the underlying equity securities, an equity index, and/or option positions. Equity-linked structured notes are typically offered in limited transactions by financial institutions in either registered or non-registered form. An investment in equity-linked structured notes creates exposure to the credit risk of the issuing financial institution, as well as to the market risk of the underlying securities. There is no guaranteed return of principal with these securities and the appreciation potential of these securities may be limited b y a maximum payment or call right. In certain cases, equity-linked structured notes may be more volatile and less liquid than less complex securities or other types of fixed-income securities. Such securities may exhibit price behavior that does not correlate with other fixed-income securities. As of December 31, 2007, the Portfolio was not invested in equity-linked structured notes.
Initial Public Offerings
The Portfolio may invest in initial public offerings ("IPOs"). IPOs and other investment techniques may have a magnified performance impact on a fund with a small asset base. The Portfolio may not experience similar performance as its assets grow.
Restricted Security Transactions
Restricted securities held by the Portfolio may not be sold except in exempt transactions or in a public offering registered under the Securities Act of 1933. The risk of investing in such securities is generally greater than the risk of investing in the securities of widely held, publicly traded companies. Lack of a secondary market and resale restrictions may result in the inability of the Portfolio to sell a security at a fair price and may substantially delay the sale of the security. In addition, these securities may exhibit greater price volatility than securities for which secondary markets exist. As of December 31, 2007, the Portfolio was invested in restricted securities.
Dividend Distributions
The Portfolio may make semiannual distributions of substantially all of its investment income and an annual distribution of its net realized capital gains (if any). The majority of dividends and net realized capital gains distributions from the Portfolio may be automatically reinvested into additional shares of the Portfolio, based upon the discretion of the shareholder.
The Portfolio has made certain investments in real estate investment trusts ("REITs") which pay dividends to their shareholders based upon funds available from operations. It is quite common for these dividends to exceed the REIT's taxable earnings and profits resulting in the excess portion of such dividends being designated as a return of capital. If the Portfolio distributes such amounts, such distribution could constitute a return of capital to shareholders for federal income tax purposes.
Estimates
The preparation of financial statements in conformity with accounting principles generally accepted in the United States of America requires management to make estimates and
Janus Aspen Series December 31, 2007 19
Notes to Financial Statements (continued)
assumptions that affect the reported amount of assets and liabilities and disclosure of contingent assets and liabilities at the date of the financial statements, and the reported amounts of income and expenses during the reporting period. Actual results could differ from those estimates.
Federal Income Taxes
No provision for income taxes is included in the accompanying financial statements, as the Portfolio intends to distribute to shareholders all taxable investment income and realized gains and otherwise comply with Subchapter M of the Internal Revenue Code applicable to regulated investment companies.
New Accounting Pronouncements
In July 2006, the Financial Accounting Standards Board ("FASB") issued Interpretation No. 48, "Accounting for Uncertainty in Income Taxes – an Interpretation of FASB Statement No. 109" (the "Interpretation"). The Interpretation establishes for all entities, including pass-through entities such as the Portfolio, a minimum threshold for financial statement recognition of the benefit of positions taken in filing tax returns (including whether an entity is taxable in a particular jurisdiction), and requires certain expanded tax disclosures. A calendar year open-end or closed-end fund was required to implement the Interpretation no later than June 29, 2007 (the last business day of the semi-annual reporting period), and the Interpretation also applies to all open tax years as of the date of effectiveness. Management has evaluated the application of the Interpretation to the Portfolio and has determined there is no significant impact on the Portfolio's financial statements.
In September 2006, the FASB issued Statement of Financial Accounting Standards No. 157, "Fair Value Measurements" ("SFAS No. 157"), which defines fair value, establishes a framework for measuring fair value in generally accepted accounting principles, and expands disclosures about fair value measurements. SFAS No. 157 does not require new fair value measurements, but is applied to the extent that other accounting pronouncements require or permit fair value measurements. SFAS No. 157 emphasizes that fair value is a market-based measurement that should be determined based on the assumptions that market participants would use in pricing an asset or liability. SFAS No. 157 is effective for fiscal years beginning after November 15, 2007 and interim periods within those fiscal years. Management does not believe the adoption of SFAS No. 157 will impact the financial statement amounts, however, the Portfolio will be required to disclose the extent t o which fair value is used to measure assets and liabilities and the inputs used to develop the measurements.
2. INVESTMENT ADVISORY AGREEMENTS AND OTHER TRANSACTIONS WITH AFFILIATES
The Portfolio pays a monthly advisory fee to Janus Capital based upon average daily net assets and calculated at the annual rate of 0.60%.
Janus Capital has agreed until at least May 1, 2009 to reimburse the Portfolio by the amount, if any, that the normal operating expenses in any fiscal year, including the investment advisory fee but excluding the distribution and shareholder servicing (12b-1) fees applicable to Service Shares, brokerage commissions, interest, taxes and extraordinary expenses, exceed an annual rate of 1.20% of the average daily net assets of the Portfolio.
Janus Services LLC ("Janus Services"), a wholly-owned subsidiary of Janus Capital, is the Portfolio's transfer agent. Janus Services receives certain out-of-pocket expenses for transfer agent services.
Certain officers of the Portfolio may also be officers and/or directors of Janus Capital. Such officers receive no compensation from the Portfolio, except for the Portfolio's Chief Compliance Officer. Effective January 1, 2006, the Portfolio began reimbursing the adviser for a portion of the compensation paid to the Chief Compliance Officer of the Trust. Total compensation of $3,078 was paid by the Portfolio during the fiscal year ended December 31, 2007. The Portfolio's portion is reported as part of "Other Expenses" on the Statement of Operations.
The Board of Trustees has adopted a deferred compensation plan (the "Deferred Plan") for independent Trustees to elect to defer receipt of all or a portion of the annual compensation they are entitled to receive from the Portfolio. All deferred fees are credited to an account established in the name of the Trustees. The amounts credited to the account then increase or decrease, as the case may be, in accordance with the performance of one or more of the Janus funds that are selected by the Trustees. The account balance continues to fluctuate in accordance with the performance of the selected fund or funds until final payment of all amounts credited to the account. The fluctuation of the account balance is recorded by the Portfolio as unrealized appreciation/(depreciation) and is shown as of December 31, 2007 on the Statement of Assets and Liabilities as an asset, "Noninterested Trustees' deferred compensation," and a liability, "Nonintereste d Trustees' deferred compensation fees." Additionally, the recorded unrealized appreciation/(depreciation) is included in "Unrealized net appreciation/(depreciation) of investments, foreign currency translations and non-interested Trustees' deferred compensation" on the Statement of Assets and Liabilities. Deferred compensation expenses for the fiscal year ended December 31, 2007 are included in "Non-interested Trustees' fees and expenses" on the Statement of Operations. Trustees are allowed to change their designation of mutual funds from time to time. Amounts will be deferred until distributed in accordance with the Deferred Plan. No deferred fees were paid to any Trustee under the Deferred Plan during the fiscal year ended December 31, 2007.
For the fiscal year ended December 31, 2007, Janus Capital assumed $24,421 of legal, consulting and Trustee costs and fees incurred by the funds in Janus Investment Fund, Janus Aspen Series and Janus Adviser Series (the "Funds") in connection with the regulatory and civil litigation matters discussed in Note 7. These non-recurring costs were allocated to all Funds based on the Funds' respective net assets as of July 31, 2004. Additionally, all future non-recurring costs will be allocated to the Funds based on the Funds' respective net assets on July 31, 2004. These "Non-recurring costs" and "Costs assumed by Janus Capital" are shown on the Statement of Operations.
20 Janus Aspen Series December 31, 2007
During the fiscal year ended December 31, 2007, Janus Capital reimbursed the Portfolio $33 for Institutional Shares, as a result of dilutions caused by certain trading and/or pricing errors. Reimbursements are included in "Payment from affiliate" on the Statements of Changes in Net Assets.
Janus Distributors LLC, a wholly-owned subsidiary of Janus Capital, is a distributor of the Portfolio. Service Shares have adopted a Distribution and Shareholder Servicing Plan (the "Plan") pursuant to Rule 12b-1 under the 1940 Act. The Plan authorizes payments by the Portfolio in connection with the distribution of Service Shares at an annual rate of up to 0.25% of Service Share's average daily net assets.
The Portfolio's expenses may be reduced by expense offsets from an unaffiliated custodian and/or transfer agent. Such credits or offsets are included in Expense and Fee Offset on the Statement of Operations. The transfer agent fee offsets received during the period reduce Transfer Agent Fees and Expenses. Custodian offsets received reduce Custodian Fees. The Portfolio could have employed the assets used by the custodian and/or transfer agent to produce income if they had not entered into an expense offset arrangement.
The Portfolio may invest in money market funds, including funds managed by Janus Capital. During the fiscal year ended December 31, 2007, the Portfolio recorded distributions from affiliated investment companies as affiliated dividend income, and had the following affiliated purchases and sales:
| Janus Aspen Fundamental Equity Portfolio | Purchases Shares/Cost | Sales Shares/Cost | Dividend Income | Value at 12/31/07 | |||||||||||||||
| Janus Institutional Cash Management Fund – Institutional Shares | $ | 2,252,116 | $ | 2,143,146 | $ | 7,700 | $ | 108,970 | |||||||||||
| Janus Institutional Cash Reserves Fund | 116,033 | 253,633 | 337 | – | |||||||||||||||
| Janus Institutional Money Market Fund – Institutional Shares | 5,167,697 | 5,167,697 | 7,469 | – | |||||||||||||||
| Janus Money Market Fund – Institutional Shares | 647,215 | 762,615 | 586 | – | |||||||||||||||
| $ | 8,183,061 | $ | 8,327,091 | $ | 16,092 | $ | 108,970 | ||||||||||||
3. FEDERAL INCOME TAX
The tax components of capital shown in the table below represent: (1) distribution requirements the Portfolio must satisfy under the income tax regulations; (2) losses or deductions the Portfolio may be able to offset against income and gains realized in future years; and (3) unrealized appreciation or depreciation of investments for federal income tax purposes (reduced by foreign tax liability).
In 2007, the Portfolio incurred "Post October" losses during the period from November 1, 2007 through December 31, 2007. These losses will be deferred for tax purposes and recognized in 2008.
Other book to tax differences in the current year may consist of deferred compensation, derivatives, and foreign currency contract adjustments. The Portfolio has elected to treat gains and losses on forward foreign currency contracts as capital gains and losses. Other foreign currency gains and losses on debt instruments are treated as ordinary income for federal income tax purposes pursuant to Section 988 of the Internal Revenue Code.
Accumulated capital losses noted below represent net capital loss carryovers, as of December 31, 2007, that may be available to offset future realized capital gains and thereby reduce future taxable gains distributions.
| Portfolio | Undistributed Ordinary Income | Undistributed Long-Term Gains | Accumulated Capital Losses | Post-October Deferral | Other Book to Tax Differences | Net Tax Appreciation/ (Depreciation) | |||||||||||||||||||||
| Janus Aspen Fundamental Equity Portfolio | $ | 576,103 | $ | 3,156,485 | $ | – | $ | (558 | ) | $ | (29,546 | ) | $ | 444,629 | |||||||||||||
The aggregate cost of investments and the composition of unrealized appreciation and depreciation of investment securities for federal income tax purposes as of December 31, 2007 are noted below.Unrealized appreciation and unrealized depreciation in the table below exclude appreciation/depreciation on foreign currency translations. The primary difference between book and tax appreciation or depreciation of investments is wash sale loss deferrals.
| Portfolio | Federal Tax Cost | Unrealized Appreciation | Unrealized (Depreciation) | ||||||||||||
| Janus Aspen Fundamental Equity Portfolio | $ | 14,397,139 | $ | 1,104,561 | $ | (656,188 | ) | ||||||||
Janus Aspen Series December 31, 2007 21
Notes to Financial Statements (continued)
Income and capital gains distributions are determined in accordance with income tax regulations that may differ from accounting principles generally accepted in the United States of America. These differences are due to differing treatments for items such as net short-term gains, deferral of wash sale losses, foreign currency transactions, net investment losses and capital loss carryovers. Certain permanent differences such as tax returns of capital and net investment losses noted below have been reclassified to paid-in capital.
| For the fiscal year ended December 31, 2007 | Distributions | ||||||||||||||||||
| Portfolio | From Ordinary Income | From Long-Term Capital Gains | Tax Return of Capital | Net Investment Loss | |||||||||||||||
| Janus Aspen Fundamental Equity Portfolio | $ | 30,026 | $ | 90,140 | $ | – | $ | – | |||||||||||
| For the fiscal year ended December 31, 2006 | Distributions | ||||||||||||||||||
| Portfolio | From Ordinary Income | From Long-Term Capital Gains | Tax Return of Capital | Net Investment Loss | |||||||||||||||
| Janus Aspen Fundamental Equity Portfolio | $ | 18,945 | $ | 4,917 | $ | – | $ | – | |||||||||||
4. EXPENSE RATIOS
The expense ratios listed in the Financial Highlights reflect expenses prior to any expense offsets (gross expense ratio) and after expense offsets (net expense ratio). Both expense ratios reflect expenses after waivers (reimbursement). Listed below are the gross expense ratios for the Portfolio that would have been in effect, absent the waiver of certain fees and offsets.
For each fiscal year ended December 31
| Institutional Shares | Service Shares | ||||||||||||||||||||||||||||||||||||||||||
| Portfolio | 2007(1) | 2006(1) | 2005(1) | 2004(1) | 2003 | 2007(1) | 2006(1) | 2005(1) | 2004(1) | 2003 | |||||||||||||||||||||||||||||||||
| Janus Aspen Fundamental Equity Portfolio | 1.48 | % | 1.73 | % | 1.44 | % | 1.52 | % | 2.08 | % | 1.73 | % | 2.00 | % | 1.73 | % | 1.76 | % | 2.35 | % | |||||||||||||||||||||||
(1) The effect of non-recurring costs assumed by Janus Capital (Note 2) is included in the ratio of operating expenses to average net assets without waivers and/or expense reimbursements and was less than 0.01%.
5. CAPITAL SHARE TRANSACTIONS
| For each fiscal year ended December 31 | Janus Aspen Fundamental Equity Portfolio | ||||||||||
| (all numbers in thousands) | 2007 | 2006 | |||||||||
| Transactions in Portfolio Shares – Institutional Shares | |||||||||||
| Shares sold | 120 | 121 | |||||||||
| Reinvested dividends and distributions | 4 | 1 | |||||||||
| Shares repurchased | (221 | ) | (153 | ) | |||||||
| Net Increase/(Decrease) in Portfolio Shares | (97 | ) | (31 | ) | |||||||
| Shares Outstanding, Beginning of Period | 570 | 601 | |||||||||
| Shares Outstanding, End of Period | 473 | 570 | |||||||||
| Transactions in Portfolio Shares – Service Shares | |||||||||||
| Shares sold | 32 | 66 | |||||||||
| Reinvested dividends and distributions | 1 | – | |||||||||
| Shares repurchased | (16 | ) | (37 | ) | |||||||
| Net Increase/(Decrease) in Portfolio Shares | 17 | 29 | |||||||||
| Shares Outstanding, Beginning of Period | 78 | 49 | |||||||||
| Shares Outstanding, End of Period | 95 | 78 | |||||||||
22 Janus Aspen Series December 31, 2007
6. PURCHASES AND SALES OF INVESTMENT SECURITIES
For the fiscal year ended December 31, 2007, the aggregate cost of purchases and proceeds from sales of investment securities (excluding short-term securities and options) were as follows:
| Portfolio | Purchases of Securities | Proceeds from sales of Securities | Purchases of Long-Term U.S. Government Obligations | Proceeds from Sales of Long-Term U.S. Government Obligations | |||||||||||||||
| Janus Aspen Fundamental Equity Portfolio | $ | 18,097,658 | $ | 19,822,667 | $ | – | $ | – | |||||||||||
7. PENDING LEGAL MATTERS
In the fall of 2003, the Securities and Exchange Commission ("SEC"), the Office of the New York State Attorney General ("NYAG"), the Colorado Attorney General ("COAG"), and the Colorado Division of Securities ("CDS") announced that they were investigating alleged frequent trading practices in the mutual fund industry. On August 18, 2004, Janus Capital announced that it had reached final settlements with the SEC, the NYAG, the COAG, and the CDS related to such regulators' investigations into Janus Capital's frequent trading arrangements.
A number of civil lawsuits were brought against Janus Capital and certain of its affiliates, the Janus funds, and related entities and individuals based on allegations similar to those announced by the above regulators and were filed in several state and federal jurisdictions. Such lawsuits alleged a variety of theories for recovery including, but not limited to, the federal securities laws, other federal statutes (including ERISA), and various common law doctrines. The Judicial Panel on Multidistrict Litigation transferred these actions to the U.S. District Court for the District of Maryland (the "Court") for coordinated proceedings. On September 29, 2004, five consolidated amended complaints were filed with the Court that generally include: (i) claims by a putative class of investors in certain Janus funds asserting claims on behalf of the investor class (Marini, et al. v. Janus Investment Fund, et al., U.S. District Court, District of Maryland, Case No. 04-CV-00497); (ii) derivative claims by investors in certain Janus funds ostensibly on behalf of such funds (Steinberg et al. v. Janus Capital Management, LLC et al., U.S. District Court, District of Maryland, Case No. 04-CV-00518); (iii) claims on behalf of participants in the Janus 401(k) plan (Wangberger v. Janus Capital Group Inc., 401(k) Advisory Committee, et al., U.S. District Court, District of Maryland, Case No. JFM-05-2711); (iv) claims brought on behalf of shareholders of Janus Capital Group Inc. ("JCGI") on a derivative basis against the Board of Directors of JCGI (Chasen v. Whiston, et al., U.S. District Court, District of Maryland, Case No. 04-MD-00855); and (v) claims by a putative class of shareholders of JCGI asserting claims on behalf of the shareholders (Wiggins, et al. v. Janus Capital Group, Inc., et al., U.S. District Court, District of Maryland, Case No. 04-CV-0081 8). Each of the five complaints initially named JCGI and/or Janus Capital as a defendant. In addition, the following were also named as defendants in one or more of the actions: Janus Investment Fund ("JIF"), Janus Aspen Series ("JAS"), Janus Adviser Series ("JAD"), Janus Distributors LLC, Enhanced Investment Technologies, LLC ("INTECH"), Bay Isle Financial LLC ("Bay Isle"), Perkins, Wolf, McDonnell and Company, LLC ("Perkins"), the Advisory Committee of the Janus 401(k) plan, and the current or former directors of JCGI.
On August 25, 2005, the Court entered orders dismissing most of the claims asserted against Janus Capital and its affiliates by fund investors in the Marini and Steinberg cases (actions (i) and (ii) above) except certain claims under Section 10(b) of the Securities Exchange Act of 1934 and under Section 36(b) of the Investment Company Act of 1940, as amended (the "1940 Act"). On August 15, 2006, the Wangberger complaint in the 401(k) plan class action (action (iii) above) was dismissed by the district court with prejudice. The plaintiff appealed that dismissal decision to the United States Court of Appeals for the Fourth Circuit. The appeal is still pending and argument in the matter was held in December 2007. The Court also dismissed the Chasen lawsuit (action (iv) above) against JCGI's Board of Directors without leave to amend. Finally, a Motion to Dismiss the Wiggins suit (action (v) above) was granted a nd the matter was dismissed in May 2007. However, in June 2007, Plaintiffs appealed that dismissal to the United States Court of Appeals for the Fourth Circuit. That appeal is currently pending.
In addition to the lawsuits described above, the Auditor of the State of West Virginia ("Auditor"), in his capacity as securities commissioner, has initiated administrative proceedings against many of the defendants in the market timing cases (including JCGI and Janus Capital) and, as a part of its relief, is seeking disgorgement and other monetary relief based on similar market timing allegations (In the Matter of Janus Capital Group Inc. et al., Before the Securities Commissioner, State of West Virginia, Summary Order No. 05-1320). The respondents in these proceedings collectively sought a Writ of
Janus Aspen Series December 31, 2007 23
Notes to Financial Statements (continued)
Prohibition in state court, which was denied. Their subsequent Petition for Appeal was also denied. Consequently, in September 2006, JCGI and Janus Capital filed their answer to the Auditor's summary order instituting proceedings and requested a hearing. A status conference was held on June 28, 2007, during which the parties were ordered to submit their proposed scheduling order. To date, no scheduling order has been entered in the case. In addition to the pending Motion to Discharge Order to Show Cause, JCGI and Janus Capital, as well as other similarly situated defendants, continue to challenge the statutory authority of the Auditor to bring such an action.
Additional lawsuits may be filed against certain of the Janus funds, Janus Capital, and related parties in the future. Janus Capital does not currently believe that these pending actions will materially affect its ability to continue providing services it has agreed to provide to the Janus funds.
24 Janus Aspen Series December 31, 2007
Report of Independent Registered Public Accounting Firm
To the Trustees and Shareholders
of Janus Aspen Fundamental Equity Portfolio
In our opinion, the accompanying statement of assets and liabilities, including the schedule of investments, and the related statements of operations and of changes in net assets and the financial highlights present fairly, in all material respects, the financial position of Janus Aspen Fundamental Equity Portfolio (formerly Janus Aspen Core Equity Portfolio) (one of the portfolios constituting Janus Aspen Series, hereafter referred to as the "Portfolio") at December 31, 2007, the results of its operations for the year then ended, the changes in its net assets for each of the two years in the period then ended, and the financial highlights for each of the five years in the period then ended, in conformity with accounting principles generally accepted in the United States of America. These financial statements and financial highlights (hereafter referred to as "financial statements") are the responsibility of the Portfolio's management; our r esponsibility is to express an opinion on these financial statements based on our audits. We conducted our audits of these financial statements in accordance with the standards of the Public Company Accounting Oversight Board (United States). Those standards require that we plan and perform the audit to obtain reasonable assurance about whether the financial statements are free of material misstatement. An audit includes examining, on a test basis, evidence supporting the amounts and disclosures in the financial statements, assessing the accounting principles used and significant estimates made by management, and evaluating the overall financial statement presentation. We believe that our audits, which included confirmation of securities at December 31, 2007 by correspondence with the custodian, transfer agent and brokers, and the application of alternative auditing procedures where securities purchased had not been received, provide a reasonable basis for our opinion.

Denver, Colorado
February 15, 2008
Janus Aspen Series December 31, 2007 25
Additional Information (unaudited)
PROXY VOTING POLICIES AND VOTING RECORD
A description of the policies and procedures that the Portfolio uses to determine how to vote proxies relating to its portfolio securities is available: (i) without charge, upon request, by calling 1-800-525-0020 (toll free); (ii) on the Portfolio's website at www.janus.com/proxyvoting; and (iii) on the SEC's website at http://www.sec.gov. Additionally, information regarding the Portfolio's proxy voting record for the most recent twelve-month period ended June 30 is also available, free of charge, through www.janus.com/proxyvoting and from the SEC's website at http://www.sec.gov.
QUARTERLY PORTFOLIO HOLDINGS
The Portfolio files its complete portfolio holdings (schedule of investments) with the SEC for the first and third quarters of each fiscal year on Form N-Q within 60 days of the end of such fiscal quarter. The Portfolio's Form N-Q: (i) is available on the SEC's website at http://www.sec.gov; (ii) may be reviewed and copied at the SEC's Public Reference Room in Washington, D.C. (information on the Public Reference Room may be obtained by calling 1-800-SEC-0330); and (iii) is available without charge, upon request, by calling Janus at 1-800-525-0020 (toll free).
APPROVAL OF ADVISORY AGREEMENTS DURING THE PERIOD
The Trustees of Janus Aspen Series, none of whom has ever been affiliated with Janus Capital ("Independent Trustees"), oversee the management of each Portfolio and, as required by law, determine annually whether to continue the investment advisory agreement for each Portfolio and the subadvisory agreements for the three Portfolios that utilize subadvisers.
In connection with their most recent consideration of those agreements for each Portfolio, the Trustees received and reviewed a substantial amount of information provided by Janus Capital and the respective subadvisers in response to requests of the Independent Trustees and their independent legal counsel. They also received and reviewed a considerable amount of information and analysis provided by their independent fee consultant. Throughout their consideration of the agreements, the Independent Trustees were advised by their independent legal counsel. The Independent Trustees met with management to consider the agreements, and also met separately in executive session with their independent legal counsel and their independent fee consultant.
At a meeting held on December 14, 2007, based on their evaluation of the information provided by Janus Capital, the subadvisers and the independent fee consultant, as well as other information, the Trustees determined that the overall arrangements between each Portfolio and Janus Capital and each subadviser, as applicable, were fair and reasonable in light of the nature, extent and quality of the services provided by Janus Capital, its affiliates and the subadvisers, the fees charged for those services, and other matters that the Trustees considered relevant in the exercise of their business judgment. At that meeting the Trustees unanimously approved the continuation of the investment advisory agreement for each Portfolio, and the subadvisory agreement for each subadvised Portfolio, for the period from February 1, 2008 through February 1, 2009, subject to earlier termina tion as provided for in each agreement.
In considering the continuation of those agreements, the Trustees reviewed and analyzed various factors that they determined were relevant, including the factors described below, none of which by itself was considered dispositive. However, the material factors and conclusions that formed the basis for the Trustees' determination to approve the continuation of the agreements are discussed separately below.
Nature, Extent and Quality of Services
The Trustees reviewed the nature, extent and quality of the services provided by Janus Capital and the subadvisers to the Portfolios, taking into account the investment objective and strategy of each Portfolio, the knowledge of the Trustees gained from their regular meetings with management on at least a quarterly basis, and their ongoing review of information related to the Portfolios. In addition, the Trustees reviewed the resources and key personnel of Janus Capital and each subadviser, especially those who provide investment management services to the Portfolios. The Trustees also considered other services provided to the Portfolios by Janus Capital or the subadvisers, such as managing the execution of portfolio transactions and the selection of broker-dealers for those transactions, serving as the Portfolios' administrator, monitoring adherence to the Portfolios' investment restrictions, producing shareholder reports, providing support services for the Trustees and Trustee committees, communicating with shareholders, and overseeing the activities of other service providers, including monitoring compliance with various policies and procedures of the Portfolios and with applicable securities laws and regulations.
The Trustees concluded that the nature, extent and quality of the services provided by Janus Capital and/or the subadviser to each Portfolio were appropriate and consistent with the terms of the respective advisory and subadvisory agreements; that, taking into account steps taken to address those Portfolios whose performance lagged that of the median of their peers for certain periods, the quality of those services had been consistent with or superior to quality norms in the industry; and that the Portfolios were likely to benefit from the continued provision of those services. They also concluded that Janus Capital and each subadviser had sufficient personnel, with the appropriate education and experience, to
26 Janus Aspen Series December 31, 2007
serve the Portfolios effectively and had demonstrated its continuing ability to attract well-qualified personnel.
Performance of the Portfolios
The Trustees considered the investment results of each Portfolio over various time periods. They reviewed information comparing each Portfolio's performance with the performance of comparable funds and peer groups identified by Lipper Inc., an independent provider of investment company data, and with the Portfolio's benchmark index. They concluded that the performance of many Portfolios was good to very good under current market conditions. Although the performance of some Portfolios lagged that of the median of their peers for certain periods, the Trustees also concluded that Janus Capital had taken appropriate steps to address those instances of under-performance and that the more recent performance of most of those Portfolios had been improving.
Costs of Services Provided
The Trustees examined information on the fees and expenses of each Portfolio in comparison to similar information for comparable funds as provided by Lipper. They also reviewed an analysis of that information provided by their independent fee consultant and noted that the rate of management (investment advisory and administrative) fees for most of the Portfolios, in some cases after contractual expense limitations, was below the mean management fee rate of the respective peer group of funds selected by Lipper.
The Trustees considered the methodology used by Janus Capital and each subadviser in determining compensation payable to portfolio managers, the competitive environment for investment management talent and the competitive market for mutual funds in different distribution channels. They concluded that the compensation methodology provided a good alignment of the interests of the portfolio managers with those of Portfolio shareholders.
The Trustees also reviewed management fees charged by Janus Capital to its separate account clients and to its subadvised funds (for which Janus Capital provides only services related to portfolio management). Although in most instances subadvisory and separate account fee rates for various investment strategies were lower than management fee rates for Portfolios having a similar strategy, the Trustees noted that, under the terms of the management agreements with the Portfolios, Janus Capital performs significant additional services for the Portfolios that it does not provide to those other clients, including administrative services, oversight of the Portfolios' other service providers, Trustee support, regulatory compliance and numerous other services, and that, in serving the Portfolios, Janus Capital assumes many legal risks that it does not assume in servicing its ot her clients. Moreover, the Trustees noted that the spread between the average fee rates charged to the Portfolios and the fee rates that Janus Capital charged to its separate account clients was significantly smaller than the average spread for such fee rates of other advisers, based on publicly available data and research conducted by their independent fee consultant.
The Trustees reviewed information on the profitability to Janus Capital and its affiliates of their relationships with each Portfolio, as well as an explanation of the methodology used in allocating various expenses of Janus Capital and its affiliates among the Portfolios and other clients. They also reviewed the financial statements of Janus Capital's parent company and its corporate structure. In their review, the Trustees considered whether Janus Capital and each subadviser receives adequate incentives to manage the Portfolios effectively. They recognized that profitability comparisons among investment advisers are difficult because very little comparative information is publicly available and profitability of any adviser is affected by numerous factors, including the organizational structure of the particular adviser, the types of funds and other accounts it manages, possible other lines of business, the methodology for allocating expens es, and the adviser's capital structure and cost of capital. However, based on the information available and taking those factors into account, the Trustees concluded that Janus Capital's profitability with respect to each Portfolio in relation to the services rendered was not unreasonable.
The Trustees concluded that the management fees and other compensation payable by each Portfolio to Janus Capital and its affiliates, as well as the fees payable by Janus Capital or the Portfolios to the subadvisers of subadvised Portfolios, were reasonable in relation to the nature, extent and quality of the services provided, taking into account the fees charged by other advisers for managing comparable mutual funds with similar strategies and the fees Janus Capital and the subadvisers charge to other clients. They also concluded that the overall expense ratio of each Portfolio was reasonable, taking into account the size of the Portfolio, the quality of services provided by Janus Capital and any subadviser, the investment performance of the Portfolio and any expense limitations agreed to by Janus Capital.
Economies of Scale
The Trustees considered information about the potential for Janus Capital to realize economies of scale as the assets of the Portfolios increase. They noted that, although most Portfolios pay advisory fees at a fixed rate as a percentage of net assets, without any breakpoints, the management fee rate paid by each Portfolio, after any contractual expense limitations, was below the mean management fee rate of the Portfolio's peer
Janus Aspen Series December 31, 2007 27
Additional Information (unaudited) (continued)
group selected by Lipper; and, for those Portfolios whose expenses are being reduced by the contractual expense limitations of Janus Capital, Janus Capital is subsidizing the Portfolios because they have not reached adequate scale. Moreover, as the assets of many of the Portfolios declined in the past few years, those Portfolios benefited from having advisory fee rates that remained constant rather than increasing as assets declined. In addition, performance fee structures have been implemented for several Portfolios that will cause the effective rate of advisory fees payable by such a Portfolio to vary depending on the investment performance of the Portfolio relative to its benchmark index over the measurement period; and a few Portfolios have fee schedules with breakpoints and reduced fee rates above certain asset levels. The Trustees also noted that the Portfolios share directly in economies of scale through lower charges of third-party s ervice providers, based on the combined scale of all of the Portfolios. Based on all of the information they reviewed, the Trustees concluded that the current fee structure of each Portfolio was reasonable and that the current rates of fees do reflect a sharing between Janus Capital and the Portfolio of economies of scale at the current asset level of the Portfolio.
Other Benefits to Janus Capital
The Trustees also considered benefits that accrue to Janus Capital and its affiliates from their relationships with the Portfolios. They recognized that two affiliates of Janus Capital separately serve the Portfolios as transfer agent and distributor, respectively. They also considered Janus Capital's past and proposed use of commissions paid by Portfolios on their portfolio brokerage transactions to obtain proprietary and third-party research products and services benefiting those Portfolios and/or other clients of Janus Capital. The Trustees concluded that Janus Capital's use of "soft" commission dollars of a Portfolio to obtain proprietary and third-party research products and services was consistent with regulatory requirements and guidelines and was likely to benefit the Portfolios. The Trustees also concluded that, other than the services provided by Janus Capital and its affiliates pursuant to the agreements and the fees to be paid by each Portfolio therefor, the Portfolios and Janus Capital may potentially benefit from their relationship with each other in other ways. They concluded that Janus Capital benefits from the receipt of proprietary research products and services acquired through commissions paid on portfolio transactions of the Portfolios and that the Portfolios benefit from Janus Capital's receipt of those products and services, as well as research products and services acquired through commissions paid by other clients of Janus Capital. They further concluded that success of any Portfolio could attract other business to Janus Capital or other Janus funds and that the success of Janus Capital could enhance Janus Capital's ability to serve the Portfolios.
After full consideration of the above factors, as well as other factors, all of the Trustees, all of whom are Independent Trustees, concluded that the proposed continuation of the investment advisory agreement for each Portfolio, and the subadvisory agreement for each subadvised Portfolio, was in the best interest of the respective Portfolios and their shareholders.
28 Janus Aspen Series December 31, 2007
Explanations of Charts, Tables and
Financial Statements (unaudited)
1. PERFORMANCE OVERVIEWS
The performance overview graph compares the performance of a hypothetical $10,000 investment in the Portfolio with one or more widely used market indices. The hypothetical example does not represent the returns of any particular investment.
When comparing the performance of the Portfolio with an index, keep in mind that market indices do not include brokerage commissions that would be incurred if you purchased the individual securities in the index. They also do not include taxes payable on dividends and interest or operating expenses incurred if you maintained a Portfolio invested in the index.
Average annual total returns are quoted for each class of the Portfolio. Average annual total return is calculated by taking the growth or decline in value of an investment over a period of time, including reinvestment of any dividends, distributions and capital gains, then calculating the annual compounded percentage rate that would have produced the same result had the rate of growth been constant throughout the period. Average annual total return does not reflect the deduction of taxes that a shareholder would pay on Portfolio distributions or redemptions of Portfolio shares.
Pursuant to federal securities rules, expense ratios shown in the performance chart reflect subsidized and unsubsidized ratios for the past fiscal year. The total annual portfolio operating expenses ratio is gross of any fee waivers, reflecting a Portfolio's unsubsidized expense ratio. The net annual portfolio operating expenses ratio (if applicable) includes contractual waivers of Janus Capital and/or Janus Services, and reflects a Portfolio's subsidized expense ratio. Both the total annual portfolio operating expenses ratio and net annual portfolio operating expenses ratio are based on average net assets as of the fiscal year ended December 31, 2006. The ratios also include expenses indirectly incurred by the Portfolio as a result of investing in other investment companies or pooled investments, which are not reflected in the "Financial Highlights" of this report. As a result, these ratios may be higher or lower than those shown in the "Fi nancial Highlights" in this report. All expenses are shown without the effect of expense offset arrangements. Pursuant to such arrangements, credits realized as a result of uninvested cash balances are used to reduce custodian and transfer agent expenses.
2. SCHEDULE OF INVESTMENTS
Following the performance overview section is the Portfolio's Schedule of Investments. This schedule reports the industry concentrations and types of securities held in the Portfolio on the last day of the reporting period. Securities are usually listed by type (common stock, corporate bonds, U.S. Government obligations, etc.) and by industry classification (banking, communications, insurance, etc.). Holdings are subject to change without notice.
The value of each security is quoted as of the last day of the reporting period. The value of securities denominated in foreign currencies is converted into U.S. dollars. Certain short-term investments maturing within 60 days are valued at amortized cost, which approximates market value.
A summary of investments by country is provided if the Portfolio invested in foreign securities. This summary reports the Portfolio's exposure to different countries by providing the percentage of securities invested in each country. The country of each security represents the country in which the company is incorporated.
2A. FORWARD CURRENCY CONTRACTS
A table listing forward currency contracts follows the Portfolio's Schedule of Investments (if applicable). Forward currency contracts are agreements to deliver or receive a preset amount of currency at a future date. Forward currency contracts are used to hedge against foreign currency risk in the Portfolio's long-term holdings.
The table provides the name of the foreign currency, the settlement date of the contract, the amount of the contract, the value of the currency in U.S. dollars and the amount of unrealized gain or loss. The amount of unrealized gain or loss reflects the change in currency exchange rates from the time the contract was opened to the last day of the reporting period.
2B. FUTURES
A table listing futures contracts follows the Portfolio's Schedule of Investments (if applicable). Futures contracts are contracts that obligate the buyer to receive and the seller to deliver an instrument or money at a specified price on a specified date. Futures are used to hedge against adverse movements in securities prices, currency risk or interest rates.
The table provides the name of the contract, number of contracts held, the expiration date, the principal amount, value and the amount of unrealized gain or loss. The amount of unrealized gain or loss reflects the marked-to-market amount for the last day of the reporting period.
2C. OPTIONS
A table listing written option contracts follows the Portfolio's Schedule of Investments (if applicable). Written option contracts are contracts that obligate the Portfolio to sell or purchase an underlying security at a fixed price, upon exercise of the option. Options are used to hedge against adverse
Janus Aspen Series December 31, 2007 29
Explanations of Charts, Tables and
Financial Statements (unaudited) (continued)
movements in securities prices, currency risk or interest rates. The table provides the name of the contract, number of contracts held, the expiration date, exercise price, value and premiums received.
3. STATEMENT OF ASSETS AND LIABILITIES
This statement is often referred to as the "balance sheet." It lists the assets and liabilities of the Portfolio on the last day of the reporting period.
The Portfolio's assets are calculated by adding the value of the securities owned, the receivable for securities sold but not yet settled, the receivable for dividends declared but not yet received on stocks owned and the receivable for Portfolio shares sold to investors but not yet settled. The Portfolio's liabilities include payables for securities purchased but not yet settled, Portfolio shares redeemed but not yet paid and expenses owed but not yet paid. Additionally, there may be other assets and liabilities such as unrealized gain or loss on forward currency contracts.
The section entitled "Net Assets Consist of" breaks down the components of the Portfolio's net assets. Because the Portfolio must distribute substantially all earnings, you will notice that a significant portion of net assets is shareholder capital.
The last section of this statement reports the net asset value ("NAV") per share on the last day of the reporting period for each class of the Portfolio. The NAV is calculated by dividing the Portfolio's net assets (assets minus liabilities) by the number of shares outstanding.
4. STATEMENT OF OPERATIONS
This statement details the Portfolio's income, expenses, gains and losses on securities and currency transactions, and appreciation or depreciation of current Portfolio holdings.
The first section in this statement, entitled "Investment Income," reports the dividends earned from stocks and interest earned from interest-bearing securities in the Portfolio.
The next section reports the expenses and expense offsets incurred by the Portfolio, including the advisory fee paid to the investment adviser, transfer agent fees and expenses, printing and postage for mailing statements, financial reports and prospectuses, and other expenses. Expense offsets, if any, are also shown.
The last section lists the increase or decrease in the value of securities held in the Portfolio. The Portfolio realizes a gain (or loss) when it sells its position in a particular security. An unrealized gain (or loss) refers to the change in net appreciation or depreciation of the Portfolio during the reporting period. "Net Realized and Unrealized Gain/(Loss) on Investments" is affected both by changes in the market value of Portfolio holdings and by gains (or losses) realized during the reporting period.
5. STATEMENT OF CHANGES IN NET ASSETS
This statement reports the increase or decrease in the Portfolio's net assets during the reporting period. Changes in the Portfolio's net assets are attributable to investment operations, dividends, distributions and capital share transactions. This is important to investors because it shows exactly what caused the Portfolio's net asset size to change during the period.
The first section summarizes the information from the Statement of Operations regarding changes in net assets due to the Portfolio's investment performance. The Portfolio's net assets may also change as a result of dividend and capital gains distributions to investors. If investors receive their dividends in cash, money is taken out of the Portfolio to pay the distribution. If investors reinvest their dividends, the Portfolio's net assets will not be affected. If you compare the Portfolio's "Net Decrease from Dividends and Distributions" to the "Reinvested dividends and distributions," you will notice that dividend distributions had little effect on the Portfolio's net assets. This is because the majority of Janus investors reinvest their distributions.
The reinvestment of dividends is included under "Capital Share Transactions." "Capital Shares" refers to the money investors contribute to the Portfolio through purchases or withdraw via redemptions. The Portfolio's net assets will increase and decrease in value as investors purchase and redeem shares from the Portfolio.
6. FINANCIAL HIGHLIGHTS
This schedule provides a per-share breakdown of the components that affect the Portfolio's NAV for current and past reporting periods for each class of the Portfolio. Not only does this table provide you with total return, it also reports total distributions, asset size, expense ratios and portfolio turnover rate.
The first line in the table reflects the NAV per share at the beginning of the reporting period. The next line reports the net investment income per share, which comprises dividends and interest income earned on securities held by the Portfolio. Following is the total of gains/(losses), realized and unrealized. Dividends and distributions are then subtracted to arrive at the NAV per share at the end of the period. The next line reflects the average annual total return reported the last day of the period.
30 Janus Aspen Series December 31, 2007
Also included are the expense ratios, or the percentage of average net assets that were used to cover operating expenses during the period. Expense ratios vary for a number of reasons, including the differences in management fees, the average shareholder account size and the extent of foreign investments, which entail greater transaction costs.
The Portfolio's expenses may be reduced through expense reduction arrangements. These arrangements may include the use of balance credits or transfer agent fee offsets. The Statement of Operations reflects total expenses before any such offset, the amount of the offset and the net expenses. The expense ratios listed in the Financial Highlights reflect total expenses prior to any expense offsets (gross expense ratio) and after the expense offsets (net expense ratio). Both expense ratios reflect expenses after waivers (reimbursements), if applicable.
The ratio of net investment income/(loss) summarizes the income earned less expenses, divided by the average net assets of the Portfolio during the reporting period. Don't confuse this ratio with the Portfolio's yield. The net investment income ratio is not a true measure of the Portfolio's yield because it doesn't take into account the dividends distributed to the Portfolio's investors.
The next figure is the portfolio turnover rate, which measures the buying and selling activity in the Portfolio. Portfolio turnover is affected by market conditions, changes in the asset size of the Portfolio, the nature of the Portfolio's investments and the investment style of the portfolio manager. A 100% rate implies that an amount equal to the value of the entire portfolio is turned over in a year; a 50% rate means that an amount equal to the value of half the portfolio is traded in a year; and a 200% rate means that an amount equal to the value of the portfolio is traded every six months.
Janus Aspen Series December 31, 2007 31
Designation Requirements (unaudited)
For federal income tax purposes, the Portfolio designated the following for the year ended December 31, 2007:
Capital Gains Distributions
| Portfolio | |||||||
| Janus Aspen Fundamental Equity Portfolio | $ | 90,140 | |||||
Dividends Received Deduction Percentage
| Portfolio | |||||||
| Janus Aspen Fundamental Equity Portfolio | 26 | % | |||||
32 Janus Aspen Series December 31, 2007
Trustees and Officers (unaudited)
The Portfolio's Statement of Additional Information includes additional information about the Trustees and officers and is available, without charge, by calling 1-800-525-0020.
The following are the Trustees and officers of the Trust, together with a brief description of their principal occupations during the last five years (principal occupations for certain Trustees may include periods over five years).
Each Trustee has served in that capacity since he or she was originally elected or appointed. The Trustees do not serve a specified term of office. Each Trustee will hold office until the termination of the Trust or his or her earlier death, resignation, retirement, incapacity, or removal. The retirement age for Trustees is 72. The Portfolio's Nominating and Governance Committee will consider nominees for the position of Trustee recommended by shareholders. Shareholders may submit the name of a candidate for consideration by the Committee by submitting their recommendations to the Trust's Secretary. Each Trustee is currently a Trustee of two other registered investment companies advised by Janus Capital: Janus Investment Fund and Janus Adviser Series. As of the date of this report, collectively, these three registered investment companies consist of 75 series or funds.
The Trust's officers are elected annually by the Trustees for a one-year term. Certain officers also serve as officers of Janus Investment Fund and Janus Adviser Series. Certain officers of the Portfolio may also be officers and/or directors of Janus Capital. Portfolio officers receive no compensation from the Portfolio, except for the Portfolio's Chief Compliance Officer, as authorized by the Trustees.
Trustees
| Name, Address, and Age | Positions Held with Portfolio | Length of Time Served | Principal Occupations During the Past Five Years | Number of Portfolios/ Funds in Fund Complex Overseen by Trustee | Other Directorships Held by Trustee | ||||||||||||||||||
| Dennis B. Mullen* 151 Detroit Street Denver, CO 80206 DOB: 1943 | Chairman Trustee | 3/04-12/07 9/93-Present | Chief Executive Officer of Red Robin Gourmet Burgers, Inc. (since 2005). Formerly, private investor. | 75 | ** | Chairman of the Board (since 2005) and Director of Red Robin Gourmet Burgers, Inc., and Director of Janus Capital Funds Plc (Dublin-based, non-U.S. funds). | |||||||||||||||||
| Jerome S. Contro 151 Detroit Street Denver, CO 80206 DOB: 1956 | Trustee | 12/05-Present | Partner of Tango Group, a private investment firm (since 1999). | 75 | Trustee and Chairman of RS Investment Trust (since 2001), and Director of IZZE Beverages and MyFamily.com, Inc. (genealogical research website). | ||||||||||||||||||
| William F. McCalpin 151 Detroit Street Denver, CO 80206 DOB: 1957 | Trustee | 6/02-Present | Private investor. Formerly, Executive Vice President and Chief Operating Officer of The Rockefeller Brothers Fund (a private family foundation), and Vice President of Asian Cultural Council. | 75 | Director of F.B. Heron Foundation (a private grant making foundation). | ||||||||||||||||||
* Mr. McCalpin will succeed Mr. Mullen as Chairman as of January 1, 2008.
** Mr. Mullen also serves as director of Janus Capital Funds Plc, consisting of 16 funds. Including Janus Capital Funds Plc and the 75 funds comprising the Janus funds, Mr. Mullen oversees 91 funds.
Janus Aspen Series December 31, 2007 33
Trustees and Officers (unaudited) (continued)
Trustees (cont.)
| Name, Address, and Age | Positions Held with Portfolio | Length of Time Served | Principal Occupations During the Past Five Years | Number of Portfolios/ Funds in Fund Complex Overseen by Trustee | Other Directorships Held by Trustee | ||||||||||||||||||
| John W. McCarter, Jr. 151 Detroit Street Denver, CO 80206 DOB: 1938 | Trustee | 6/02-Present | President and Chief Executive Officer of The Field Museum of Natural History (Chicago, IL) (since 1997). | 75 | Chairman of the Board and Director of Divergence Inc. (biotechnology firm); Director of W.W. Grainger, Inc. (industrial distributor); and Trustee of WTTW (Chicago public television station) and the University of Chicago. | ||||||||||||||||||
| James T. Rothe 151 Detroit Street Denver, CO 80206 DOB: 1943 | Trustee | 1/97-Present | Co-founder and Managing Director of Roaring Fork Capital Management, LLC (private investment in public equity firm), and Professor Emeritus of Business of the University of Colorado, Colorado Springs, CO (since 2004). Formerly, Professor of Business of the University of Colorado (2002-2004) and Distinguished Visiting Professor of Business (2001-2002) of Thunderbird (American Graduate School of International Management), Glendale, AZ. | 75 | Director of Red Robin Gourmet Burgers, Inc. | ||||||||||||||||||
| William D. Stewart 151 Detroit Street Denver, CO 80206 DOB: 1944 | Trustee | 9/93-Present | Corporate Vice President and General Manager of MKS Instruments – HPS Products, Boulder, CO (a manufacturer of vacuum fittings and valves). | 75 | N/A | ||||||||||||||||||
| Martin H. Waldinger 151 Detroit Street Denver, CO 80206 DOB: 1938 | Trustee | 9/93-Present | Private Investor and Consultant to California Planned Unit Developments (since 1994). Formerly, CEO and President of Marwal, Inc. (homeowner association management company). | 75 | N/A | ||||||||||||||||||
| Linda S. Wolf 151 Detroit Street Denver, CO 80206 DOB: 1947 | Trustee | 12/05-Present | Retired. Formerly, Chairman and Chief Executive Officer of Leo Burnett (Worldwide) (advertising agency) (2001-2005). | 75 | Director of Wal-Mart, The Field Museum of Natural History (Chicago, IL), Children's Memorial Hospital (Chicago, IL), Chicago Council on Foreign Relations, Economic Club of Chicago, and InnerWorkings (U.S. provider of print procurement solutions). | ||||||||||||||||||
34 Janus Aspen Series December 31, 2007
Officers
| Name, Address, and Age | Positions Held with Portfolio | Term of Office* and Length of Time Served | Principal Occupations During the Past Five Years | ||||||||||||
| James P. Goff 151 Detroit Street Denver, CO 80206 DOB: 1964 | Executive Vice President Janus Aspen Fundamental Equity Portfolio | 11/07-Present | Vice President and Director of Research of Janus Capital. | ||||||||||||
| Stephanie Grauerholz-Lofton 151 Detroit Street Denver, CO 80206 DOB: 1970 | Chief Legal Counsel and Secretary Vice President | 1/06-Present 3/06-Present | Vice President and Assistant General Counsel of Janus Capital, and Vice President and Assistant Secretary of Janus Distributors LLC. Formerly, Assistant Vice President of Janus Capital and Janus Distributors LLC (2006), and Associate of Vedder, Price, Kaufman & Kammholz, P.C. (1999-2003). | ||||||||||||
| Andrew J. Iseman 151 Detroit Street Denver, CO 80206 DOB: 1964 | President and Chief Executive Officer | 3/07-Present | Chief Operating Officer and Senior Vice President of Janus Capital Group, Inc. and Janus Capital; President of Janus Services LLC; and Director of Capital Group Partners, Inc. Formerly, Senior Vice President of Enhanced Investment Technologies, LLC (2005-2007); and Vice President of Janus Capital (2003-2005) and Janus Services LLC (2003-2004). | ||||||||||||
| David R. Kowalski 151 Detroit Street Denver, CO 80206 DOB: 1957 | Vice President, Chief Compliance Officer, and Anti-Money Laundering Officer | 6/02-Present | Senior Vice President and Chief Compliance Officer of Janus Capital, Janus Distributors LLC, and Janus Services LLC; Chief Compliance Officer of Bay Isle Financial LLC; and Vice President of Enhanced Investment Technologies, LLC. Formerly, Chief Compliance Officer of Enhanced Investment Technologies, LLC (2003-2005); Vice President of Janus Capital (2000-2005) and Janus Services LLC (2004-2005); and Assistant Vice President of Janus Services LLC (2000-2004). | ||||||||||||
| Jesper Nergaard 151 Detroit Street Denver, CO 80206 DOB: 1962 | Chief Financial Officer Vice President, Treasurer, and Principal Accounting Officer | 3/05-Present 2/05-Present | Vice President of Janus Capital. Formerly, Director of Financial Reporting for OppenheimerFunds, Inc. (2004-2005); Site Manager and First Vice President of Mellon Global Securities Services (2003); and Director of Fund Accounting, Project Development, and Training of INVESCO Funds Group (1994-2003). | ||||||||||||
*Officers are elected at least annually by the Trustees for a one-year term and may also be elected from time to time by the Trustees for an interim period.
Janus Aspen Series December 31, 2007 35
Notes
36 Janus Aspen Series December 31, 2007
Notes
Janus Aspen Series December 31, 2007 37
Janus provides access to a wide range of investment disciplines.
Growth
Janus growth portfolios focus on companies believed to be the leaders in their respective industries, with solid management teams, expanding market share, margins and efficiencies.
Core
Janus core portfolios seek investments in more stable and predictable companies. These portfolios look for a strategic combination of steady growth and for certain portfolios, some degree of income.
Risk-Managed
Our risk-managed portfolios seek to outperform their respective indices while maintaining a risk profile equal to or lower than the index itself. Managed by INTECH (a Janus subsidiary), these portfolios use a mathematical process in an attempt to build a more "efficient" portfolio than the index.
Value
Janus value portfolios invest in companies they believe are poised for a turnaround or are trading at a significant discount to fair value. The goal is to gain unique insight into a company's true value and identify and evaluate potential catalysts that may unlock shareholder value.
International & Global
Janus international and global portfolios seek to leverage Janus' research capabilities by taking advantage of inefficiencies in foreign markets, where accurate information and analytical insight are often at a premium.
Bond
Janus bond portfolios attempt to provide less risk relative to equities while seeking to deliver a competitive total return through high current income and appreciation.
Money Market
Janus money market portfolios seek maximum current income consistent with stability of capital.
For more information about our funds, contact your investment professional or go to www.janus.com/info
Please consider the charges, risks, expenses and investment objectives carefully before investing. For a prospectus containing this and other information, please call Janus at 1-800-525-0020 or download the file from www.janus.com/info. Read it carefully before you invest or send money.
An investment in a money market portfolio is not insured or guaranteed by the Federal Deposit Insurance Corporation or any other government agency. Although the Portfolio seeks to preserve the value of your investment at $1.00 per share, it is possible to lose money by investing in the Portfolio.

151 Detroit Street
Denver, CO 80206
1-800-525-0020
Portfolio distributed by Janus Distributors LLC (2/08)
C-0108-357 109-02-711 02-08
2007 Annual Report
Janus Aspen Series
Janus Aspen Global Life Sciences Portfolio
Look Inside. . .
• Portfolio management perspective
• Investment strategy behind your portfolio
• Portfolio performance, characteristics and holdings

Table of Contents
| Useful Information About Your Portfolio Report | 1 | ||||||
| Management Commentary and Schedule of Investments | 2 | ||||||
| Statement of Assets and Liabilities | 9 | ||||||
| Statement of Operations | 10 | ||||||
| Statements of Changes in Net Assets | 11 | ||||||
| Financial Highlights | 12 | ||||||
| Notes to Schedule of Investments | 13 | ||||||
| Notes to Financial Statements | 14 | ||||||
| Report of Independent Registered Public Accounting Firm | 22 | ||||||
| Additional Information | 23 | ||||||
| Explanations of Charts, Tables and Financial Statements | 26 | ||||||
| Designation Requirements | |||||||
| Trustees and Officers | 29 | ||||||
Please consider the charges, risks, expenses and investment objectives carefully before investing. For a prospectus containing this and other information, please call Janus at 1-800-525-0020 or download the file from www.janus.com/info. Read it carefully before you invest or send money.
Useful Information About Your Portfolio Report
Management Commentary
The Management Commentary in this report includes valuable insight from the Portfolio's manager as well as statistical information to help you understand how your Portfolio's performance and characteristics stack up against those of comparable indices.
Please keep in mind that the opinions expressed by the Portfolio's manager in the Management Commentary are just that: opinions. They are a reflection of the manager's best judgment at the time this report was compiled, which was December 31, 2007. As the investing environment changes, so could the manager's opinions. The views are unique to the manager and aren't necessarily shared by his fellow employees or by Janus in general.
Portfolio Expenses
We believe it's important for our shareholders to have a clear understanding of Portfolio expenses and the impact they have on investment return.
The following is important information regarding the Portfolio's Expense Example, which appears in the Management Commentary within this Annual Report. Please refer to this information when reviewing the Expense Example for the Portfolio.
Example
As a shareholder of a Portfolio, you incur two types of costs: (1) transaction costs, including redemption fees (where applicable) (and any related exchange fees) and (2) ongoing costs, including management fees; distribution and shareholder servicing (12b-1) fees (applicable to Service Shares only); and other Portfolio expenses. The example is intended to help you understand your ongoing costs (in dollars) of investing in a Portfolio and to compare these costs with the ongoing costs of investing in other mutual funds. To do so, compare this 5% hypothetical example with the 5% hypothetical examples that appear in the shareholder reports of the other funds. The example is based upon an investment of $1,000 invested at the beginning of the period and held for the six-month period from July 1, 2007 to D ecember 31, 2007.
Actual Expenses
The first line of the table in each example provides information about actual account values and actual expenses. You may use the information in this line, together with the amount you invested, to estimate the expenses that you paid over the period. Simply divide your account value by $1,000 (for example, an $8,600 account value divided by $1,000 = 8.6), then multiply the result by the number in the first line under the heading entitled "Expenses Paid During Period" to estimate the expenses you paid on your account during the period.
Hypothetical Example for Comparison Purposes
The second line of the table in each example provides information about hypothetical account values and hypothetical expenses based upon the Portfolio's actual expense ratio and an assumed rate of return of 5% per year before expenses, which is not the Portfolio's actual return. The hypothetical account values and expenses may not be used to estimate the actual ending account balance or expenses you paid for the period. You may use this information to compare the ongoing costs of investing in the Portfolio and other funds. To do so, compare this 5% hypothetical example with the 5% hypothetical examples that appear in the shareholder reports of the other funds.
Janus Capital Management LLC ("Janus Capital") has contractually agreed to waive the Portfolio's total operating expenses, excluding the distribution and shareholder servicing (12b-1) fees applicable to Service Shares, brokerage commissions, interest, taxes and extraordinary expenses to certain limits until at least May 1, 2009. More information regarding the waivers is available in the Portfolio's prospectus.
Please note that the expenses shown in the tables are meant to highlight your ongoing costs only and do not reflect any transaction costs, such as redemption fees (where applicable) and any charges at the separate account level or contract level. Redemption fees are fully described in the prospectus. Therefore, the second line of each table is useful in comparing ongoing costs only, and will not help you determine the relative total costs of owning different funds. In addition, if these transaction costs and separate account or contract level charges were included, your costs would have been higher.
Janus Aspen Series December 31, 2007 1
Janus Aspen Global Life Sciences Portfolio (unaudited)
Portfolio Snapshot
This portfolio seeks companies around the world that are dedicated to improving the quality of life for a growing and aging world.

Andy Acker
portfolio manager
Introduction
December 31, 2007 marked the completion of my first eight months as sole portfolio manager of Janus Aspen Global Life Sciences Portfolio. I had worked closely with Tom Malley on the Portfolio over the previous eight years. While Tom's leadership will be missed, I am fortunate to be working with an outstanding team of dedicated health care analysts with a combined 50 years of professional investment experience. Their considerable efforts and strong stock picking helped make the transition a smooth one for me.
Performance Overview
Janus Aspen Global Life Sciences Portfolio's Institutional Shares and Service Shares returned 22.04% and 21.70%, respectively, during the year ended December 31, 2007. This compared favorably to the 5.49% return of the S&P 500® Index (the Portfolio's primary benchmark), and was noteworthy given the fifth year of health care underperformance versus the broader markets. The Portfolio substantially outperformed the 3.94% return of the Morgan Stanley Capital International (MSCI)1 World Health Care Index, its secondary benchmark.
Investment Strategy
The Portfolio seeks to uncover opportunities that span the health care spectrum, including stocks in the biotechnology, pharmaceuticals, health care services and medical technology arenas. Our bottom-up fundamental approach utilizes extensive proprietary research in an effort to discover the best investment ideas across the globe.
The Portfolio includes companies that can be grouped into three conceptual buckets: core growth, emerging growth and opportunistic investments. In general, we seek to invest about half of the Portfolio in core growth holdings (companies with dominant franchises that have generated strong, consistent free cash flow). Emerging growth companies (those with new product cycles that we believe can drive earnings acceleration), should make up 20-30% of the Portfolio. The remaining positions will generally be reserved for opportunistic investments, exemplified by companies that we feel are suffering from short-term issues that should resolve over time.
A Broad Group of Stocks Contributed to Returns
The Portfolio's performance was broad based, with 10 individual names up over 50% in the period. Health care equipment maker Dade Behring was the largest contributor. Our clinical and laboratory customer checks had identified Dade's new Vista platform as a potential best-in-class product that would substantially expand the company's addressable markets. This was subsequently recognized by German industrial giant Siemens A.G., which announced a takeover offer for Dade at nearly a 40% premium to the closing price at the time.
Biotechnology firm Alexion Pharmaceuticals was another key contributor, as its stock more than doubled over the past year. Alexion was driven by the better-than-expected launch of its new drug Soliris, which addresses a rare but life threatening blood disorder called PNH. Alexion fits into our theme of investing in companies addressing high unmet medical needs. We took some profits after the significant run-up, but remain optimistic about Alexion and the commercial opportunity for Soliris.
In the health care services sector, Medco Health Solutions, one of the country's largest prescription drug benefit managers (PBMs), was also a top performer. While increased utilization of generic drugs has been challenging for pharmaceutical companies, PBMs like Medco have been a key beneficiary of this trend as they derive higher margins from generic drugs. We believe Medco should continue to benefit from cost pressures in the pharmaceutical sector.
Select Biotechnology Stocks Weighed on Returns
Despite the overall positive performance, a few names weighed on returns. Biotech company Celgene was the largest detractor from performance. The stock was negatively impacted by a shortfall in third quarter revenues and competitive concerns. We believe the problems should be temporary and key drug Revlimid continues to have a compelling profile for the treatment of several forms of cancer. We added to our position during the weakness.
While we held a relatively small position in Amgen (a bellwether of the biotechnology industry), it still detracted from the Portfolio's performance. Amgen was impacted by new clinical trial data which raised safety concerns about two of Amgen's best-selling products, Epogen and Aranesp, for the treatment of anemia. These concerns prompted reimbursement changes which have reduced sales of the drugs. We continued to hold onto the stock due to offsetting cost cuts and upside from the pipeline.
Finally, MannKind, a biotechnology firm developing a novel formulation of inhaled insulin for the treatment of diabetes, suffered from the poor commercial reception of a competitive
2 Janus Aspen Series December 31, 2007
(unaudited)
product called Exubera. While Exubera's failure called into question the commercial value of an inhaled insulin formulation, we continue to believe MannKind's product may have distinct clinical and convenience advantages that could lead to a more favorable outcome. Thus, we maintained a position in the stock.
Risk Management
The setbacks the Portfolio experienced late in 2006 prompted us to re-evaluate the process. In consultation with Janus' head of risk management, Dan Scherman, we decided to incorporate a value-at-risk (VAR) approach in an attempt to further strengthen the Portfolio's risk control framework. This approach focuses attention on downside risk, especially from binary events (such as clinical trial announcements or regulatory decisions) that could lead to significant share price volatility. In practice, this means the position size of any one holding is limited so that, in a worst-case scenario, the potential negative impact from a particular holding should not exceed 1% of the overall portfolio. We incorporated the VAR approach at the beginning of 2007 and we are encouraged by the early results.
Looking Ahead
We believe demographic trends and technological advances continue to support health care spending growth above gross domestic product (GDP) growth in most of the world's economies. The underperformance of health care stocks versus the broader indices over the last five years has created what we feel are compelling valuations within the sector. In addition, we think concerns about slowing economic growth should highlight health care companies' defensive qualities.
While the upcoming presidential cycle has created an overhang for the sector, we believe the impact of any changes at the companies in which we invest should be manageable. We are confident in the names we own and have been pleased with the Portfolio's recent performance. We will continue to seek investments within the health care arena that we feel represent the sector's best opportunities.
I also want to welcome the newest addition to the health care analyst team, Ethan Lovell, who comes to us with 13 years of experience, most recently from ClearBridge Advisors.
Thank you for your continued investment in Janus Aspen Global Life Sciences Portfolio.
Janus Aspen Global Life Sciences Portfolio At a Glance
5 Largest Contributors to Performance – Holdings
| Contribution | |||||||
| Dade Behring Holdings, Inc. | 1.91 | % | |||||
| MGI Pharma, Inc. | 1.89 | % | |||||
| Onyx Pharmaceuticals, Inc. | 1.86 | % | |||||
| Medco Health Solutions, Inc. | 1.71 | % | |||||
| Alexion Pharmaceuticals, Inc. | 1.67 | % | |||||
5 Largest Detractors from Performance – Holdings
| Contribution | |||||||
| Celgene Corp. | (0.76 | )% | |||||
| Amgen, Inc. | (0.65 | )% | |||||
| MannKind Corp. | (0.61 | )% | |||||
| Achillion Pharmaceuticals, Inc. | (0.49 | )% | |||||
| Adolor Corp. | (0.45 | )% | |||||
5 Largest Contributors to Performance – Sectors
| Portfolio Contribution | Portfolio Weighting (% of Net Assets) | S&P 500® Index Weighting | |||||||||||||
| Health Care | 19.50 | % | 88.13 | % | 11.95 | % | |||||||||
| Materials | 2.10 | % | 4.19 | % | 3.13 | % | |||||||||
| Consumer Staples | 1.40 | % | 5.64 | % | 9.52 | % | |||||||||
| Financials | 0.17 | % | 1.58 | % | 20.57 | % | |||||||||
| Industrials | 0.06 | % | 0.28 | % | 11.22 | % | |||||||||
5 Largest Detractors/Contributors to Performance – Sectors
| Portfolio Contribution | Portfolio Weighting (% of Net Assets) | S&P 500® Index Weighting | |||||||||||||
| Others* | (0.06 | )% | 0.05 | % | 0.00 | % | |||||||||
| Utilities | (0.02 | )% | 0.09 | % | 3.54 | % | |||||||||
| Telecommunication Services | 0.00 | % | 0.00 | % | 3.64 | % | |||||||||
| Information Technology | 0.00 | % | 0.00 | % | 15.69 | % | |||||||||
| Energy | 0.00 | % | 0.00 | % | 10.82 | % | |||||||||
*Industry not classified by Global Industry Classification Standard
Janus Aspen Series December 31, 2007 3
Janus Aspen Global Life Sciences Portfolio (unaudited)
5 Largest Equity Holdings – (% of Net Assets)
As of December 31, 2007
| Roche Holding A.G. Medical - Drugs | 4.1 | % | |||||
| CVS/Caremark Corp. Retail - Drug Store | 4.0 | % | |||||
| Merck & Company, Inc. Medical - Drugs | 3.8 | % | |||||
| Bayer A.G. Chemicals - Diversified | 3.0 | % | |||||
| Celgene Corp. Medical - Biomedical and Genetic | 3.0 | % | |||||
| 17.9 | % | ||||||
Asset Allocation – (% of Net Assets)
As of December 31, 2007
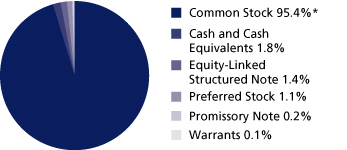
Emerging markets comprised 1.7% of total net assets.
*Includes Securities Sold Short of (0.7)%
Top Country Allocations – Long Positions (% of Investment Securities)
| As of December 31, 2007 | As of December 31, 2006 | ||||||
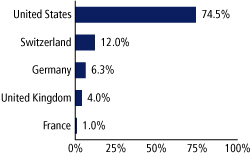 | 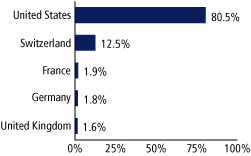 | ||||||
4 Janus Aspen Series December 31, 2007
(unaudited)
Performance
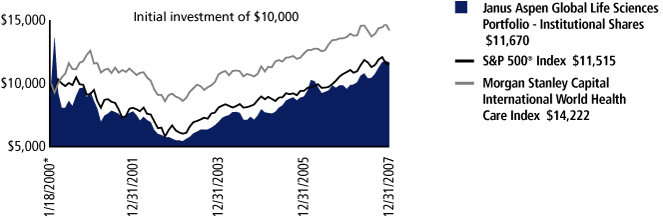
| Average Annual Total Return – for the periods ended December 31, 2007 | Expense Ratios – for the fiscal year ended December 31, 2006 | ||||||||||||||||||||||
| One Year | Five Year | Since Inception* | Total Annual Fund Operating Expenses | Net Annual Fund Operating Expenses | |||||||||||||||||||
| Janus Aspen Global Life Sciences Portfolio - Institutional Shares | 22.04 | % | 16.20 | % | 1.96 | % | 1.10 | % | 1.10 | %(a) | |||||||||||||
| Janus Aspen Global Life Sciences Portfolio - Service Shares | 21.70 | % | 15.94 | % | 1.71 | % | 1.35 | % | 1.35 | %(b) | |||||||||||||
| S&P 500® Index | 5.49 | % | 12.83 | % | 1.79 | % | |||||||||||||||||
| Morgan Stanley Capital International World Health Care Index | 3.94 | % | 9.66 | % | 4.55 | %** | |||||||||||||||||
| Lipper Ranking - Institutional Shares | 1 | st | 1 | st | 3 | rd | |||||||||||||||||
| Lipper Ranking - Institutional Shares based on total returns for Variable Annuity Health/Biotechnology Funds | 1/35 | 7/27 | 5/6 | ||||||||||||||||||||
Visit janus.com/info to view up-to-date
performance and characteristic information
Data presented reflects past performance, which is no guarantee of future results. Investment results and principal value will fluctuate so that shares, when redeemed, may be worth more or less than their original cost. Due to market volatility, current performance may be higher or lower than the performance shown. Call 877.33JANUS or visit www.janus.com/info for performance current to the most recent month-end.
(a)At December 31, 2006, Janus Capital has contractually agreed to waive the Portfolio's total operating expenses (excluding brokerage commissions, interest, taxes, and extraordinary expenses) to a certain limit until at least May 1, 2008. The net annual fund operating expense shown reflects the application of such limit and is detailed in the Statement of Additional Information. Returns shown include fee waivers, if any, and without such waivers returns would have been lower.
(b)At December 31, 2006, Janus Capital has contractually agreed to waive the Portfolio's total operating expenses (excluding the distribution and shareholder servicing fee, brokerage commissions, interest, taxes, and extraordinary expenses) to a certain limit until at least May 1, 2008. The net annual fund operating expense shown reflects the application of such limit and is detailed in the Statement of Additional Information. Returns shown include fee waivers, if any, and without such waivers returns would have been lower.
The Portfolio's expense ratios were determined based on average net assets as of the fiscal year ended December 31, 2006. Detailed information is available in the prospectus. Contractual waivers agreed to by Janus Capital are included under "Net Annual Fund Operating Expenses." All expenses are shown without the effect of expense offset arrangements. Pursuant to such arrangements, credits realized as a result of uninvested cash balances are used to reduce custodian and transfer agent expenses.
The Portfolio's total operating expenses did not exceed the expense limit so no waivers were in effect for the fiscal year ended December 31, 2006.
The Portfolio's performance may be affected by risks that include those associated with investments in specific industries or countries. Additional risks to the Portfolio may include those associated with investing in foreign securities, emerging markets, initial public offerings ("IPOs") and derivatives. Please see a Janus prospectus or www.janus.com/info for more information about risks, portfolio holdings and other details.
The use of short sales may cause the Portfolio to have higher expenses than those of other equity funds. Short sales are speculative transactions and involve special risks, including a greater reliance on the investment team's ability to accurately anticipate the future value of a security. The Portfolio's losses are potentially unlimited in a short sale transaction. The Portfolio's use of short sales in effect leverages the Portfolio's portfolio. The Portfolio's use of leverage may result in risks and can magnify the effect of any losses. There is no assurance that a leveraging strategy will be successful
Portfolios that invest in REITs may be subject to a higher degree of market risk because of the REITs concentration in a specific industry, sector or geographic region, REITs may be subject to risks including, but not limited to, decline in the value of real estate, risks related to general and economic conditions, changes in the value of the underlying property owned by the trust and defaults by borrowers.
The Portfolio invests in certain industry groups, which may react similarly to market developments (resulting in greater price volatility), and may have significant exposure to foreign markets (which include risks such as currency fluctuation and political uncertainty).
Janus Aspen Series December 31, 2007 5
Janus Aspen Global Life Sciences Portfolio (unaudited)
Portfolio Expenses
The example below shows you the ongoing costs (in dollars) of investing in your Portfolio and allows you to compare these costs with those of other mutual funds. Please refer to the section Useful Information About Your Portfolio Report for a detailed explanation of the information presented in these charts.
| Expense Example - Institutional Shares | Beginning Account Value (7/1/07) | Ending Account Value (12/31/07) | Expenses Paid During Period (7/1/07-12/31/07)(1) | ||||||||||||
| Actual | $ | 1,000.00 | $ | 1,121.50 | $ | 6.10 | |||||||||
| Hypothetical (5% return before expenses) | $ | 1,000.00 | $ | 1,019.46 | $ | 5.80 | |||||||||
| Expense Example - Service Shares | Beginning Account Value (7/1/07) | Ending Account Value (12/31/07) | Expenses Paid During Period (7/1/07-12/31/07)(1) | ||||||||||||
| Actual | $ | 1,000.00 | $ | 1,120.50 | $ | 7.43 | |||||||||
| Hypothetical (5% return before expenses) | $ | 1,000.00 | $ | 1,018.20 | $ | 7.07 | |||||||||
(1) Expenses are equal to the annualized expense ratio of 1.14% for Institutional Shares and 1.39% for Service Shares, multiplied by the average account value over the period, multiplied by 184/365 (to reflect the one-half year period).
These returns do not reflect the charges and expenses of any particular insurance product or qualified plan. Returns shown would have been lower had they included insurance charges.
Returns include reinvestment of dividends from net investment income and distributions from capital gains. The returns shown do not reflect the deduction of taxes that a shareholder would pay on Portfolio distributions or the redemption of Portfolio shares.
Net dividends reinvested are the dividends that remain to be reinvested after foreign tax obligations have been met. Such obligations vary from country to country.
Lipper, a wholly-owned subsidiary of Reuters, provides independent insight on global collective investments including mutual funds, retirement funds, hedge funds, fund fees and expenses to the asset management and media communities. Lipper ranks the performance of mutual funds within a classification of funds that have similar investment objectives. Rankings are historical with capital gains and dividends reinvested and do not include the effect of loads.
Lipper ranking is for the Institutional Share class only; other classes may have different performance characteristics.
January 31, 2000 is the date used to calculate the since-inception Lipper ranking, which is slightly different from when the Portfolio began operations since Lipper provides fund rankings as of the last day of the month.
If an expense waiver was in effect, it may have had a material effect on the total return or yield, and therefore the ranking for the period.
There is no assurance that the investment process will consistently lead to successful investing.
The Portfolio will invest at least 80% of its net assets in the type of securities described by its name.
Effective May 1, 2007, Andrew Acker became Portfolio Manager of Janus Aspen Global Life Sciences Portfolio.
See Notes to Schedule of Investments for index definitions.
The Portfolio may differ significantly from the securities held in the indices. The indices are unmanaged and not available for direct investment; therefore their performance does not reflect the expenses associated with the active management of an actual Portfolio.
See "Explanations of Charts, Tables and Financial Statements."
* The Portfolio's inception date – January 18, 2000
** The Morgan Stanley Capital International World Health Care Index since inception returns are calculated from January 31, 2000.
6 Janus Aspen Series December 31, 2007
Janus Aspen Global Life Sciences Portfolio
Schedule of Investments
As of December 31, 2007
| Shares or Principal Amount | Value | ||||||||||
| Common Stock - 96.1% | |||||||||||
| Agricultural Chemicals - 2.5% | |||||||||||
| 2,898 | Syngenta A.G.** | $ | 732,848 | ||||||||
| Chemicals - Diversified - 4.4% | |||||||||||
| 9,535 | Bayer A.G.** | 868,915 | |||||||||
| 1,673 | K+S A.G.** | 400,159 | |||||||||
| 1,269,074 | |||||||||||
| Dental Supplies and Equipment - 0.1% | |||||||||||
| 510 | Osstem Implant Company, Ltd.* | 17,529 | |||||||||
| Diagnostic Kits - 0.6% | |||||||||||
| 2,920 | IDEXX Laboratories, Inc.* | 171,200 | |||||||||
| Dialysis Centers - 0.9% | |||||||||||
| 5,151 | Fresenius Medical Care A.G. & Co.** | 273,492 | |||||||||
| Diversified Operations - 0.6% | |||||||||||
| 26,667 | Max India, Ltd.* | 177,487 | |||||||||
| Drug Delivery Systems - 1.2% | |||||||||||
| 8,080 | Hospira, Inc.* | 344,531 | |||||||||
| Medical - Biomedical and Genetic - 20.9% | |||||||||||
| 5,427 | Abraxis BioScience* | 373,215 | |||||||||
| 26,515 | Acorda Therapeutics, Inc.* | 582,269 | |||||||||
| 7,370 | Alexion Pharmaceuticals, Inc.* | 552,971 | |||||||||
| 5,991 | AMAG Pharmaceuticals, Inc.*,# | 360,239 | |||||||||
| 9,620 | Amgen, Inc.* | 446,753 | |||||||||
| 15,630 | Arena Pharmaceuticals, Inc.* | 122,383 | |||||||||
| 4,005 | Biogen Idec, Inc.* | 227,965 | |||||||||
| 18,570 | Celgene Corp.* | 858,119 | |||||||||
| 9,039 | Cougar Biotechnology, Inc.* | 295,575 | |||||||||
| 16,390 | Exelixis, Inc.* | 141,446 | |||||||||
| 37,480 | Fibrogen, Inc.*,ºº,§ | 219,258 | |||||||||
| 7,715 | Genentech, Inc.* | 517,445 | |||||||||
| 9,385 | Genzyme Corp.* | 698,619 | |||||||||
| 5,245 | Millipore Corp.*,# | 383,829 | |||||||||
| 5,900 | Savient Pharmaceuticals, Inc.* | 135,523 | |||||||||
| 6,350 | Vertex Pharmaceuticals, Inc.* | 147,511 | |||||||||
| 6,063,120 | |||||||||||
| Medical - Drugs - 30.0% | |||||||||||
| 28,090 | Achillion Pharmaceuticals, Inc.* | 140,169 | |||||||||
| 13,015 | APP Pharmaceuticals, Inc.* | 133,664 | |||||||||
| 14,415 | Array BioPharma, Inc.* | 121,374 | |||||||||
| 4,490 | Auxilium Pharmaceuticals, Inc.* | 134,655 | |||||||||
| 15,105 | BioForm Medical, Inc.* | 103,167 | |||||||||
| 8,135 | Eli Lilly and Co. | 434,328 | |||||||||
| 20,355 | Forest Laboratories, Inc.* | 741,940 | |||||||||
| 13,900 | K-V Pharmaceutical Co. - Class A*,# | 396,706 | |||||||||
| 18,865 | Merck & Company, Inc. | 1,096,245 | |||||||||
| 3,190 | Merck KGaA** | 415,146 | |||||||||
| 14,650 | Novartis A.G.** | 801,395 | |||||||||
| 9,985 | OSI Pharmaceuticals, Inc.*,# | 484,372 | |||||||||
| 6,881 | Roche Holding A.G.** | 1,188,239 | |||||||||
| 3,249 | Sanofi-Aventis** | 299,138 | |||||||||
| 19,740 | Schering-Plough Corp. | 525,874 | |||||||||
| 11,040 | Shire PLC (ADR)** | 761,208 | |||||||||
| 3,185 | Takeda Pharmaceutical Company, Ltd.* | 186,825 | |||||||||
| 16,300 | Wyeth | 720,297 | |||||||||
| 8,684,742 | |||||||||||
| Medical - Generic Drugs - 0.8% | |||||||||||
| 8,660 | Pharmstandard (GDR) (144A)* | 238,150 | |||||||||
| Shares or Principal Amount | Value | ||||||||||
| Medical - HMO - 6.1% | |||||||||||
| 13,757 | Coventry Health Care, Inc.* | $ | 815,102 | ||||||||
| 6,515 | Health Net, Inc.* | 314,675 | |||||||||
| 10,990 | UnitedHealth Group, Inc. | 639,618 | |||||||||
| 1,769,395 | |||||||||||
| Medical Instruments - 2.8% | |||||||||||
| 9,580 | Medtronic, Inc. | 481,586 | |||||||||
| 8,340 | St. Jude Medical, Inc.* | 338,938 | |||||||||
| 820,524 | |||||||||||
| Medical Labs and Testing Services - 0.7% | |||||||||||
| 10,350 | Diagnosticos da America | 214,680 | |||||||||
| Medical Products - 3.0% | |||||||||||
| 1,695 | Nobel Biocare Holding A.G.** | 453,001 | |||||||||
| 10,305 | Xtent, Inc.*, | 101,607 | |||||||||
| 4,805 | Zimmer Holdings, Inc.* | 317,851 | |||||||||
| 872,459 | |||||||||||
| Optical Supplies - 1.8% | |||||||||||
| 3,730 | Alcon, Inc. (U.S. Shares)** | 533,539 | |||||||||
| Pharmacy Services - 1.9% | |||||||||||
| 5,590 | Medco Health Solutions, Inc.* | 566,826 | |||||||||
| Physician Practice Management - 2.1% | |||||||||||
| 8,785 | Pediatrix Medical Group, Inc.* | 598,698 | |||||||||
| REIT - Diversified - 1.0% | |||||||||||
| 16,240 | CapitalSource, Inc. | 285,662 | |||||||||
| REIT - Health Care - 0.8% | |||||||||||
| 5,450 | Ventas, Inc. | 246,613 | |||||||||
| REIT - Office Property - 1.2% | |||||||||||
| 3,490 | Alexandria Real Estate Equities, Inc. | 354,828 | |||||||||
| Respiratory Products - 1.5% | |||||||||||
| 6,725 | Respironics, Inc.* | 440,353 | |||||||||
| Retail - Drug Store - 4.3% | |||||||||||
| 29,620 | CVS/Caremark Corp.** | 1,177,395 | |||||||||
| 9,111 | Drogasil S.A. | 73,492 | |||||||||
| 1,250,887 | |||||||||||
| Soap and Cleaning Preparations - 1.6% | |||||||||||
| 8,167 | Reckitt Benckiser PLC** | 473,690 | |||||||||
| Therapeutics - 5.3% | |||||||||||
| 6,305 | Amylin Pharmaceuticals, Inc.*,# | 233,285 | |||||||||
| 7,596 | Gilead Sciences, Inc.* | 349,492 | |||||||||
| 16,755 | MannKind Corp.*,# | 133,370 | |||||||||
| 8,640 | Onyx Pharmaceuticals, Inc.*,# | 480,556 | |||||||||
| 5,985 | Theravance, Inc.* | 116,708 | |||||||||
| 2,460 | United Therapeutics Corp.*,# | 240,219 | |||||||||
| 1,553,630 | |||||||||||
| Total Common Stock (cost $22,304,463) | 27,953,957 | ||||||||||
| Preferred Stock - 1.1% | |||||||||||
| Medical - Biomedical and Genetic - 0.1% | |||||||||||
| 876 | Cougar Biotechnology, Inc. | 28,645 | |||||||||
| Medical - Generic Drugs - 0.6% | |||||||||||
| 267,733 | Mediquest Therapeuticsºº,§ | 160,639 | |||||||||
See Notes to Schedules of Investments and Financial Statements.
Janus Aspen Series December 31, 2007 7
Janus Aspen Global Life Sciences Portfolio
Schedule of Investments
As of December 31, 2007
| Shares or Principal Amount | Value | ||||||||||
| Medical Instruments - 0.4% | |||||||||||
| 14,375 | GMP Companies, Inc.ºº,§ | $ | 126,788 | ||||||||
| Total Preferred Stock (cost $287,681) | 316,072 | ||||||||||
| Equity-Linked Structured Note - 1.4% | |||||||||||
| 9,294 | Morgan Stanley Co., convertible, (Gilead Sciences, Inc.), 0% (144A)§ (cost $390,999) | 416,185 | |||||||||
| Warrants - 0.1% | |||||||||||
| Medical - Generic Drugs - 0% | |||||||||||
| 15,163 | Mediquest Therapeutics - expires 6/15/12ºº,§ | 1,539 | |||||||||
| 64,229 | Mediquest Therapeutics - expires 6/15/11ºº,§ | 5,254 | |||||||||
| 6,793 | |||||||||||
| Medical Instruments - 0.1% | |||||||||||
| 6,978 | GMP Companies, Inc. - expires 6/1/11ºº,§ | 10,816 | |||||||||
| 1,195 | GMP Companies, Inc. - expires 6/1/11ºº,§ | 5,342 | |||||||||
| 16,158 | |||||||||||
| Total Warrants (cost $1,774) | 22,951 | ||||||||||
| Promissory Notes - 0.2% | |||||||||||
| Medical - Generic Drugs - 0.2% | |||||||||||
| 50,544 | Mediquest Therapeutics, Promissory Note 14.00%, due 3/31/08ºº,§ (cost $48,770) | 48,770 | |||||||||
| Money Market - 1.4% | |||||||||||
| 420,000 | Janus Institutional Cash Management Fund - Institutional Shares 4.98% (cost $420,000) | 420,000 | |||||||||
| Other Securities - 6.0% | |||||||||||
| 1,217,969 | Allianz Dresdner Daily Asset Fund† | 1,217,969 | |||||||||
| 294,930 | Repurchase Agreements† | 294,930 | |||||||||
| 226,763 | Time Deposit† | 226,763 | |||||||||
| Total Other Securities (cost $1,739,662) | 1,739,662 | ||||||||||
| Total Investments (total cost $25,193,349) – 106.3% | 30,917,597 | ||||||||||
| Securities Sold Short - (0.7)% | |||||||||||
| Physical Therapy and Rehabilitation Centers - (0.7)% | |||||||||||
| 10,015 | HEALTHSOUTH Corp.* (proceeds $175,487) | (210,315 | ) | ||||||||
| Liabilities, net of Cash, Receivables and Other Assets – (5.6)% | (1,634,699 | ) | |||||||||
| Net Assets – 100% | $ | 29,072,583 | |||||||||
Summary of Investments by Country – (Long Positions)
| Country | Value | % of Investment Securities | |||||||||
| Brazil | $ | 288,172 | 0.9 | % | |||||||
| France | 299,138 | 1.0 | % | ||||||||
| Germany | 1,957,712 | 6.3 | % | ||||||||
| India | 177,487 | 0.6 | % | ||||||||
| Japan | 186,825 | 0.6 | % | ||||||||
| South Korea | 17,529 | 0.1 | % | ||||||||
| Switzerland | 3,709,022 | 12.0 | % | ||||||||
| United Kingdom | 1,234,898 | 4.0 | % | ||||||||
| United States†† | 23,046,814 | 74.5 | % | ||||||||
| Total | $ | 30,917,597 | 100.0 | % | |||||||
††Includes Short-Term Securities and Other Securities (67.6% excluding Short-Term Securities and Other Securities)
Summary of Investments by Country – (Short Positions)
| Country | Value | % of Securities Sold Short | |||||||||
| United States | $ | (210,315 | ) | 100.0 | % | ||||||
| Total | $ | (210,315 | ) | 100.0 | % | ||||||
Forward Currency Contracts, Open
| Currency Sold and Settlement Date | Currency Units Sold | Currency Value in U.S.$ | Unrealized Gain/(Loss) | ||||||||||||
| British Pound 2/15/08 | 57,100 | $ | 113,503 | $ | 996 | ||||||||||
| British Pound 5/14/08 | 55,000 | 109,034 | 2,151 | ||||||||||||
| Euro 5/14/08 | 195,000 | 285,204 | (8,114 | ) | |||||||||||
| Swiss Franc 2/15/08 | 370,000 | 327,842 | (16,835 | ) | |||||||||||
| Swiss Franc 5/2/08 | 345,000 | 306,817 | 8,424 | ||||||||||||
| Total | $ | 1,142,400 | $ | (13,378 | ) | ||||||||||
See Notes to Schedules of Investments and Financial Statements.
8 Janus Aspen Series December 31, 2007
Statement of Assets and Liabilities
| As of December 31, 2007 (all numbers in thousands except net asset value per share) | Janus Aspen Global Life Sciences Portfolio | ||||||
| Assets: | |||||||
| Investments at cost(1) | $ | 25,193 | |||||
| Investments at value(1) | $ | 30,498 | |||||
| Affiliated money market investments | 420 | ||||||
| Deposits with broker for short sales | 175 | ||||||
| Receivables: | |||||||
| Investments sold | 379 | ||||||
| Portfolio shares sold | 11 | ||||||
| Dividends | 10 | ||||||
| Interest | 2 | ||||||
| Non-interested Trustees' deferred compensation | – | ||||||
| Other assets | 1 | ||||||
| Forward currency contracts | 12 | ||||||
| Total Assets | 31,508 | ||||||
| Liabilities: | |||||||
| Payables: | |||||||
| Short sales, at value (proceeds $175) | 210 | ||||||
| Collateral for securities loaned (Note 1) | 1,740 | ||||||
| Due to custodian | 263 | ||||||
| Investments purchased | 105 | ||||||
| Portfolio shares repurchased | 23 | ||||||
| Advisory fees | 16 | ||||||
| Transfer agent fees and expenses | 1 | ||||||
| Distribution fees - Service Shares | 5 | ||||||
| Non-interested Trustees' fees and expenses | 1 | ||||||
| Foreign tax liability | 3 | ||||||
| Non-interested Trustees' deferred compensation fees | – | ||||||
| Accrued expenses | 43 | ||||||
| Forward currency contracts | 25 | ||||||
| Total Liabilities | 2,435 | ||||||
| Net Assets | $ | 29,073 | |||||
| Net Assets Consist of: | |||||||
| Capital (par value and paid-in-surplus)* | $ | 25,105 | |||||
| Undistributed net investment income/(loss)* | (2 | ) | |||||
| Undistributed net realized gain/(loss) from investments and foreign currency transactions* | (1,703 | ) | |||||
| Unrealized appreciation/(depreciation) of investments, foreign currency translations and non-interested Trustees' deferred compensation(2) | 5,673 | ||||||
| Total Net Assets | $ | 29,073 | |||||
| Net Assets - Institutional Shares | $ | 3,505 | |||||
| Shares Outstanding, $0.001 Par Value (unlimited shares authorized) | 301 | ||||||
| Net Asset Value Per Share | $ | 11.63 | |||||
| Net Assets - Service Shares | $ | 25,568 | |||||
| Shares Outstanding, $0.001 Par Value (unlimited shares authorized) | 2,234 | ||||||
| Net Asset Value Per Share | $ | 11.44 | |||||
* See Note 3 in Notes to Financial Statements.
(1) Investments at cost and value include $1,691,962 of securities loaned (Note 1).
(2) Net of foreign taxes on investments of $2,592.
See Notes to Financial Statements.
Janus Aspen Series December 31, 2007 9
Statement of Operations
| For the fiscal year ended December 31, 2007 (all numbers in thousands) | Janus Aspen Global Life Sciences Portfolio | ||||||
| Investment Income: | |||||||
| Interest | $ | – | |||||
| Securities lending income | 4 | ||||||
| Dividends | 209 | ||||||
| Dividends from affiliates | 8 | ||||||
| Foreign tax withheld | (13 | ) | |||||
| Total Investment Income | 208 | ||||||
| Expenses: | |||||||
| Advisory fees | 189 | ||||||
| Transfer agent fees and expenses | 4 | ||||||
| Registration fees | 2 | ||||||
| Custodian fees | 37 | ||||||
| Professional fees | 12 | ||||||
| Non-interested Trustees' fees and expenses | 5 | ||||||
| Distribution fees - Service Shares | 65 | ||||||
| Printing Expenses | 40 | ||||||
| System Fees | 19 | ||||||
| Other expenses | 14 | ||||||
| Non-recurring costs (Note 2) | – | ||||||
| Costs assumed by Janus Capital Management LLC (Note 2) | – | ||||||
| Total Expenses | 387 | ||||||
| Expense and Fee Offset | (1 | ) | |||||
| Net Expenses | 386 | ||||||
| Net Investment Income/(Loss) | (178 | ) | |||||
| Net Realized and Unrealized Gain/(Loss) on Investments: | |||||||
| Net realized gain/(loss) from investments and foreign currency transactions | 4,599 | ||||||
| Net realized gain/(loss) from short sales | 13 | ||||||
| Change in unrealized appreciation/(depreciation) of investments, foreign currency translations and non-interested Trustees' deferred compensation(1) | 1,379 | ||||||
| Payment from affiliate (Note 2) | 1 | ||||||
| Net Gain/(Loss) on Investments | 5,992 | ||||||
| Net Increase/(Decrease) in Net Assets Resulting from Operations | $ | 5,814 | |||||
(1) Net of foreign taxes on investments of $2,592.
See Notes to Financial Statements.
10 Janus Aspen Series December 31, 2007
Statements of Changes in Net Assets
| For the fiscal years ended December 31 | Janus Aspen Global Life Sciences Portfolio | ||||||||||
| (all numbers in thousands) | 2007 | 2006 | |||||||||
| Operations: | |||||||||||
| Net investment income/(loss) | $ | (178 | ) | $ | (241 | ) | |||||
| Net realized gain/(loss) from investment and foreign currency transactions | 4,599 | 7,772 | |||||||||
| Net realized gain/(loss) from short sales | 13 | (21 | ) | ||||||||
| Net realized gain/(loss) from option contracts | – | (35 | ) | ||||||||
| Change unrealized appreciation/(depreciation) of investments, foreign currency translations and non-interested Trustees' deferred compensation | 1,379 | (5,322 | ) | ||||||||
| Payment from affiliate (Note 2) | 1 | – | |||||||||
| Net Increase/(Decrease) in Net Assets Resulting from Operations | 5,814 | 2,153 | |||||||||
| Dividends and Distributions to Shareholders: | |||||||||||
| Net Investment income* | |||||||||||
| Institutional Shares | – | – | |||||||||
| Service Shares | – | – | |||||||||
| Net realized gain/(loss) from investment transactions* | |||||||||||
| Institutional Shares | – | – | |||||||||
| Service Shares | – | – | |||||||||
| Net Decrease from Dividends and Distributions | – | – | |||||||||
| Capital Share Transactions: | |||||||||||
| Shares sold | |||||||||||
| Institutional Shares | 748 | 985 | |||||||||
| Service Shares | 2,443 | 4,698 | |||||||||
| Reinvested dividends and distributions | |||||||||||
| Institutional Shares | – | – | |||||||||
| Service Shares | – | – | |||||||||
| Shares repurchased | |||||||||||
| Institutional Shares | (1,347 | ) | (1,682 | ) | |||||||
| Service Shares | (8,301 | ) | (10,839 | ) | |||||||
| Net Increase/(Decrease) from Capital Share Transactions | (6,457 | ) | (6,838 | ) | |||||||
| Net Increase/(Decrease) in Net Assets | (643 | ) | (4,685 | ) | |||||||
| Net Assets: | |||||||||||
| Beginning of period | 29,716 | 34,401 | |||||||||
| End of period | $ | 29,073 | $ | 29,716 | |||||||
| Undistributed net investment income/(loss)* | $ | (2 | ) | $ | – | ||||||
*See Note 3 in Notes to Financial Statements.
See Notes to Financial Statements.
Janus Aspen Series December 31, 2007 11
Financial Highlights
Institutional Shares
| For a share outstanding during each fiscal year ended December 31 | Janus Aspen Global Life Sciences Portfolio | ||||||||||||||||||||||
| 2007 | 2006 | 2005 | 2004 | 2003 | |||||||||||||||||||
| Net Asset Value, Beginning of Period | $ | 9.53 | $ | 8.94 | $ | 7.94 | $ | 6.93 | $ | 5.49 | |||||||||||||
| Income from Investment Operations: | |||||||||||||||||||||||
| Net investment income/(loss) | .05 | .05 | .03 | .02 | .02 | ||||||||||||||||||
| Net gain/(loss) on securities (both realized and unrealized) | 2.05 | .54 | .97 | .99 | 1.42 | ||||||||||||||||||
| Total from Investment Operations | 2.10 | .59 | 1.00 | 1.01 | 1.44 | ||||||||||||||||||
| Less Distributions and Other: | |||||||||||||||||||||||
| Dividends (from net investment income)* | – | – | – | – | – | ||||||||||||||||||
| Distributions (from capital gains)* | – | – | – | – | – | ||||||||||||||||||
| Payment from affiliate | – | (1) | – | – | – | – | |||||||||||||||||
| Total Distributions and Other | – | – | – | – | – | ||||||||||||||||||
| Net Asset Value, End of Period | $ | 11.63 | $ | 9.53 | $ | 8.94 | $ | 7.94 | $ | 6.93 | |||||||||||||
| Total Return | 22.04 | %(2) | 6.60 | % | 12.59 | % | 14.57 | % | 26.23 | % | |||||||||||||
| Net Assets, End of Period (in thousands) | $ | 3,505 | $ | 3,428 | $ | 3,879 | $ | 4,088 | $ | 3,822 | |||||||||||||
| Average Net Assets for the Period (in thousands) | $ | 3,391 | $ | 3,913 | $ | 3,733 | $ | 3,998 | $ | 3,601 | |||||||||||||
| Ratio of Gross Expenses to Average Net Assets(3) | 1.09 | % | 1.10 | % | 0.95 | % | 0.90 | % | 0.97 | % | |||||||||||||
| Ratio of Net Expenses to Average Net Assets(3) | 1.09 | % | 1.10 | % | 0.95 | % | 0.90 | % | 0.97 | % | |||||||||||||
| Ratio of Net Investment Income/(Loss) to Average Net Assets | (0.38 | )% | (0.48 | )% | (0.53 | )% | (0.42 | )% | (0.34 | )% | |||||||||||||
| Portfolio Turnover Rate | 81 | % | 80 | % | 89 | % | 108 | % | 110 | % | |||||||||||||
Service Shares
| For a share outstanding during each fiscal year ended December 31 | Janus Aspen Global Life Sciences Portfolio | ||||||||||||||||||||||
| 2007 | 2006 | 2005 | 2004 | 2003 | |||||||||||||||||||
| Net Asset Value, Beginning of Period | $ | 9.40 | $ | 8.84 | $ | 7.87 | $ | 6.89 | $ | 5.46 | |||||||||||||
| Income from Investment Operations: | |||||||||||||||||||||||
| Net investment income/(loss) | (.01 | ) | (.01 | ) | – | – | – | ||||||||||||||||
| Net gain/(loss) on securities (both realized and unrealized) | 2.05 | .57 | .97 | .98 | 1.43 | ||||||||||||||||||
| Total from Investment Operations | 2.04 | .56 | .97 | .98 | 1.43 | ||||||||||||||||||
| Less Distributions and Other: | |||||||||||||||||||||||
| Dividends (from net investment income)* | – | – | – | – | – | ||||||||||||||||||
| Distributions (from capital gains)* | – | – | – | – | – | ||||||||||||||||||
| Payment from affiliate | – | (1) | – | – | – | – | |||||||||||||||||
| Total Distributions and Other | – | – | – | – | – | ||||||||||||||||||
| Net Asset Value, End of Period | $ | 11.44 | $ | 9.40 | $ | 8.84 | $ | 7.87 | $ | 6.89 | |||||||||||||
| Total Return | 21.70 | %(2) | 6.33 | % | 12.33 | % | 14.22 | % | 26.19 | % | |||||||||||||
| Net Assets, End of Period (in thousands) | $ | 25,568 | $ | 26,288 | $ | 30,522 | $ | 30,082 | $ | 31,282 | |||||||||||||
| Average Net Assets for the Period (in thousands) | $ | 26,165 | $ | 30,308 | $ | 30,905 | $ | 31,902 | $ | 28,604 | |||||||||||||
| Ratio of Gross Expenses to Average Net Assets(3) | 1.34 | % | 1.35 | % | 1.20 | % | 1.15 | % | 1.22 | % | |||||||||||||
| Ratio of Net Expenses to Average Net Assets(3) | 1.34 | % | 1.35 | % | 1.20 | % | 1.15 | % | 1.22 | % | |||||||||||||
| Ratio of Net Investment Income/(Loss) to Average Net Assets | (0.63 | )% | (0.73 | )% | (0.77 | )% | (0.66 | )% | (0.59 | )% | |||||||||||||
| Portfolio Turnover Rate | 81 | % | 80 | % | 89 | % | 108 | % | 110 | % | |||||||||||||
*See Note 3 in Notes to Financial Statements.
(1) Payment from affiliate aggregated less than $.01 on a per share basis for the fiscal year ended.
(2) During the fiscal year ended, Janus Capital and/or Janus Services LLC fully reimbursed the Portfolio for a loss on a transaction resulting from certain trading, pricing and/or shareholder activity errors, which otherwise would have reduced total return by 0.01%.
(3) See Note 4 in Notes to Financial Statements.
See Notes to Financial Statements.
12 Janus Aspen Series December 31, 2007
Notes to Schedule of Investments
| Lipper Variable Annuity Health/Biotechnology Funds | Funds that invest at least 65% of their equity portfolio in shares of companies engaged in health care, medicine, and biotechnology. | ||||||
| Morgan Stanley Capital International World Health Care Index | Is a capitalization weighted index that monitors the performance of health care stocks from developed market countries in North America, Europe and the Asia/Pacific Region. The index includes reinvestment of dividends, net of foreign withholding taxes. | ||||||
| S&P 500® Index | The Standard & Poor's ("S&P") 500® Index is a commonly recognized, market capitalization weighted index of 500 widely held equity securities, designed to measure broad U.S. equity performance. | ||||||
| 144A | Securities sold under Rule 144A of the Securities Act of 1933, as amended, are subject to legal and/or contractual restrictions on resale and may not be publicly sold without registration under the 1933 Act. | ||||||
| ADR | American Depositary Receipt | ||||||
| GDR | Global Depositary Receipt | ||||||
| PLC | Public Limited Company | ||||||
| REIT | Real Estate Investment Trust | ||||||
| U.S. Shares | Securities of foreign companies trading on an American Stock Exchange. | ||||||
* Non-income-producing security.
** A portion of this security has been segregated by the custodian to cover margin or segregation requirements on open futures contracts, forward currency contracts, options contracts, short sales and/or securities with extended settlement dates.
# Loaned Security; a portion or all of the security is on loan as of December 31, 2007.
† The security is purchased with the cash collateral received from securities on loan (Note 1).
ºº Schedule of Fair Valued Securities (as of December 31, 2007)
| Value | Value as a % of Net Assets | ||||||||||
| Janus Aspen Global Life Sciences Portfolio | |||||||||||
| Fibrogen, Inc. | $ | 219,258 | 0.8 | % | |||||||
| GMP Companies, Inc. | 126,788 | 0.4 | % | ||||||||
| GMP Companies, Inc. - expires 6/1/11 | 10,816 | 0.0 | % | ||||||||
| GMP Companies, Inc. - expires 6/1/11 | 5,342 | 0.0 | % | ||||||||
| Mediquest Therapeutics | 160,639 | 0.6 | % | ||||||||
| Mediquest Therapeutics - expires 6/15/11 | 5,254 | 0.0 | % | ||||||||
| Mediquest Therapeutics - expires 6/15/12 | 1,539 | 0.0 | % | ||||||||
| Mediquest Therapeutics - Promissory Note | 48,770 | 0.2 | % | ||||||||
| $ | 578,406 | 2.0 | % | ||||||||
Securities are valued at "fair value" pursuant to procedures adopted by the Portfolio's Trustees. The Schedule of Fair Valued Securities does not include international activities fair valued pursuant to a systematic fair valuation model.
§ Schedule of Restricted and Illiquid Securities (as of December 31, 2007)
| Acquisition Date | Acquisition Cost | Value | Value as % of Net Assets | ||||||||||||||||
| Janus Aspen Global Life Sciences Portfolio | |||||||||||||||||||
| Fibrogen, Inc.ºº | 12/28/04 - 11/8/05 | $ | 170,534 | $ | 219,258 | 0.8 | % | ||||||||||||
| GMP Companies, Inc.ºº | 5/31/06 - 7/23/07 | 125,133 | 126,788 | 0.4 | % | ||||||||||||||
| GMP Companies, Inc. - expires 6/1/11ºº | 5/31/06 | – | 10,816 | 0.0 | % | ||||||||||||||
| GMP Companies, Inc. - expires 6/1/11ºº | 5/31/06 - 10/4/06 | – | 5,342 | 0.0 | % | ||||||||||||||
| Mediquest Therapeutics - Promissory Noteºº | 10/12/07 | 48,770 | 48,770 | 0.2 | % | ||||||||||||||
| Mediquest Therapeuticsºº | 5/11/06 - 6/15/06 | 160,640 | 160,639 | 0.6 | % | ||||||||||||||
| Mediquest Therapeutics - expires 6/15/11ºº | 5/11/06 - 6/15/06 | – | 5,254 | 0.0 | % | ||||||||||||||
| Mediquest Therapeutics - expires 6/15/12ºº | 10/12/07 | 1,774 | 1,539 | 0.0 | % | ||||||||||||||
| Morgan Stanley Co. convertible, (Gilead Sciences, Inc.), 0% (144A) | 10/17/07 | 390,999 | 416,185 | 1.4 | % | ||||||||||||||
| $ | 897,850 | $ | 994,591 | 3.4 | % | ||||||||||||||
The Portfolio has registration rights for certain restricted securities held as of December 31, 2007. The issuer incurs all registration costs.
Aggregate collateral segregated to cover margin or segregation requirements on open futures contracts, forward currency contracts, options contracts, short sales and/or securities with extended settlement dates as of December 31, 2007 is noted below.
| Portfolio | Aggregate Value | ||||||
| Janus Aspen Global Life Sciences Portfolio | $ | 7,538,644 | |||||
Janus Aspen Series December 31, 2007 13
Notes to Financial Statements
The following section describes the organization and significant accounting policies and provides more detailed information about the schedules and tables that appear throughout this report. In addition, the Notes to Financial Statements explain the methods used in preparing and presenting this report.
1. ORGANIZATION AND SIGNIFICANT ACCOUNTING POLICIES
Janus Aspen Global Life Sciences Portfolio (the "Portfolio") is a series fund. The Portfolio is part of Janus Aspen Series (the "Trust"), which is organized as a Delaware statutory trust and is registered under the Investment Company Act of 1940, as amended, (the "1940 Act") as an open-end management investment company. The Trust offers seventeen Portfolios, which include multiple series of shares, with differing investment objectives and policies. The Portfolio invests primarily in equity securities. The Portfolio is classified as diversified, as defined in the 1940 Act. The Portfolio is a no-load investment.
The Portfolio currently offers two classes of shares: Institutional Shares and Service Shares. Institutional Shares are offered only in connection with investment in and payments under variable insurance contracts and to qualified retirement plans. Service Shares are offered only in connection with investment in and payments under variable insurance contracts and to qualified retirement plans that require a fee from Portfolio assets to procure distribution and administrative services to contract owners and plan participants.
The following accounting policies have been consistently followed by the Portfolio and are in conformity with accounting principles generally accepted in the United States of America in the investment company industry.
Investment Valuation
Securities are valued at the last sales price or the official closing price for securities traded on a principal securities exchange (U.S. or foreign) and on the NASDAQ National Market. Securities traded on over-the-counter markets and listed securities for which no sales are reported are valued at the latest bid price (or yield equivalent thereof) obtained from one or more dealers transacting in a market for such securities or by a pricing service approved by the Portfolio's Trustees. Short-term securities with maturities of 60 days or less may be valued at amortized cost, which approximates market value. Debt securities with a remaining maturity of greater than 60 days are valued in accordance with the evaluated bid price supplied by the pricing service. The evaluated bid price supplied by the pricing service is an evaluation that reflects such factors as security prices, yields, maturities and ratings. Foreign securities and currencies ar e converted to U.S. dollars using the applicable exchange rate in effect as of the daily close of the New York Stock Exchange ("NYSE"). When market quotations are not readily available or deemed unreliable, or events or circumstances that may affect the value of portfolio securities held by the Portfolio are identified between the closing of their principal markets and the time the net asset value ("NAV") is determined, securities may be valued at fair value as determined in good faith under procedures established by and under the supervision of the Portfolio's Trustees. Circumstances in which fair value pricing may be utilized include, but are not limited to: (i) when significant events occur which may affect the securities of a single issuer, such as mergers, bankruptcies, or significant issuer specific developments; (ii) when significant events occur which may affect an entire market, such as natural disasters or significant governmen tal actions; and (iii) when non-significant events occur such as markets closing early or not opening, security trading halts, or pricing of non-valued securities and restricted or non-public securities. The Portfolio may use a systematic fair valuation model provided by an independent third party to value international equity securities in order to adjust for stale pricing, which may occur between the close of certain foreign exchanges and the NYSE.
Investment Transactions and Investment Income
Investment transactions are accounted for as of the date purchased or sold (trade date). Dividend income is recorded on the ex-dividend date. Certain dividends from foreign securities will be recorded as soon as the Trust is informed of the dividend if such information is obtained subsequent to the ex-dividend date. Dividends from foreign securities may be subject to withholding taxes in foreign jurisdictions. Interest income is recorded on the accrual basis and includes amortization of premiums and accretion of discounts. Gains and losses are determined on the identified cost basis, which is the same basis used for federal income tax purposes. Income, as well as gains and losses, both realized and unrealized, are allocated daily to each class of shares based upon the ratio of net assets represented by each class as a percentage of total net assets.
Expenses
The Portfolio bears expenses incurred specifically on its behalf as well as a portion of general expenses. Each class of shares bears expenses incurred specifically on its behalf and, in addition, each class bears a portion of general expenses, which may be based upon relative net assets of each class. Expenses are allocated daily to each class of shares based upon the ratio of net assets represented by each class as a percentage of total net assets. Expenses directly attributable to a specific class of shares are charged against the operations of such class.
Securities Lending
Under procedures adopted by the Trustees, the Portfolio may lend securities to qualified parties (typically brokers or other financial institutions) who need to borrow securities in order to complete certain transactions such as covering short sales, avoiding failures to deliver securities or completing arbitrage activities. The Portfolio may seek to earn additional income
14 Janus Aspen Series December 31, 2007
through securities lending. There is the risk of delay in recovering a loaned security or the risk of loss in collateral rights if the borrower fails financially. Janus Capital Management LLC ("Janus Capital") makes efforts to balance the benefits and risks from granting such loans.
State Street Bank and Trust Company served as the Portfolio's lending agent for the period January 1, 2007 through May 24, 2007. Effective May 25, 2007, Dresdner Bank AG became the lending agent for the Portfolio.
The Portfolio does not have the right to vote on securities while they are being lent; however, the Portfolio may attempt to call back the loan and vote the proxy if time permits. All loans will be continuously secured by collateral which may consist of cash, U.S. Government securities, domestic and foreign short-term debt instruments, letters of credit, time deposits, repurchase agreements, or such other collateral permitted by the Securities and Exchange Commission ("SEC"). Cash collateral may be invested in affiliated money market funds or other accounts advised by Janus Capital to the extent consistent with exemptive relief obtained from the SEC or as permitted by the 1940 Act and rules promulgated thereunder.
Dresdner Bank AG (the "Lending Agent") may also invest the cash collateral in the Allianz Dresdner Daily Asset Fund or investments in unaffiliated money market funds or accounts, mutually agreed to by the Portfolio and the Lending Agent, that comply with Rule 2a-7 of the 1940 Act relating to money market funds.
As of December 31, 2007, the Portfolio had on loan securities valued as indicated:
| Portfolio | Value at December 31, 2007 | ||||||
| Janus Aspen Global Life Sciences Portfolio | $ | 1,691,962 | |||||
As of December 31, 2007, the Portfolio received cash collateral for securities lending activity as indicated:
| Portfolio | Cash Collateral at December 31, 2007 | ||||||
| Janus Aspen Global Life Sciences Portfolio | $ | 1,739,662 | |||||
As of December 31, 2007, all cash collateral received by the Portfolio was invested in the Allianz Dresdner Daily Asset Fund, except for $294,930 and $226,763 which were invested in Repurchase Agreements and Time Deposits, respectively.
The value of the collateral must be at least 102% of the market value of the loaned securities that are denominated in U.S. dollars and 105% of the market value of the loaned securities that are not denominated in U.S. dollars. Loaned securities and related collateral are marked-to-market each business day based upon the market value of the loaned securities at the close of business, employing the most recent available pricing information. Collateral levels are then adjusted based on this mark-to-market evaluation.
The borrower pays fees at the Portfolio's direction to the Lending Agent. The Lending Agent may retain a portion of the interest earned on the cash collateral invested. The cash collateral invested by the Lending Agent is disclosed in the Schedule of Investments (if applicable). The lending fees and the Portfolio's portion of the interest income earned on cash collateral are included on the Statement of Operations (if applicable).
Interfund Lending
Pursuant to an exemptive order received from the SEC, the Portfolio may be party to an interfund lending agreement between the Portfolio and other Janus Capital sponsored mutual funds, which permits it to borrow or lend cash at a rate beneficial to both the borrowing and lending funds. Outstanding borrowings from all sources totaling 10% or more of the borrowing Portfolio's total assets must be collateralized at 102% of the outstanding principal value of the loan; loans of less than 10% may be unsecured. During the fiscal year ended December 31, 2007, there were no outstanding interfund borrowing or lending arrangements for the Portfolio.
Forward Currency Transactions
The Portfolio may enter into forward currency contracts in order to reduce its exposure to changes in foreign currency exchange rates on its foreign portfolio holdings and to lock in the U.S. dollar cost of firm purchase and sale commitments for securities denominated in or exposed to foreign currencies. A forward currency exchange contract is a commitment to purchase or sell a foreign currency at a future date at a negotiated rate. The gain or loss arising from the difference between the U.S. dollar cost of the original contract and the value of the foreign currency in U.S. dollars upon closing a contract is included in "Net realized gain/(loss) from investments and foreign currency transactions" on the Statement of Operations (if applicable).
Forward currency contracts held by the Portfolio are fully collateralized by other securities, which are denoted in the accompanying Schedule of Investments (if applicable). The collateral is evaluated daily to ensure its market value equals or exceeds the current market value of the corresponding forward currency contracts.
Futures Contracts
The Portfolio may enter into futures contracts to gain exposure to the stock market pending investment of cash balances or to meet liquidity needs. The Portfolio may also use such derivative instruments to hedge or protect from adverse movements in securities prices, currency rates or interest rates. The use of futures contracts may involve risks such as the possibility of illiquid markets or imperfect correlation between the value of the contracts and the underlying securities, or that the counterparty will fail to perform its obligations.
Futures contracts are marked-to-market daily, and the daily variation margin is recorded as a receivable or payable on the
Janus Aspen Series December 31, 2007 15
Notes to Financial Statements (continued)
Statement of Assets and Liabilities (if applicable). When a contract is closed, a realized gain or loss is recorded as "Net realized gain/(loss) from futures contracts" on the Statement of Operations (if applicable) equal to the difference between the opening and closing value of the contract. Generally, futures contracts are marked-to-market (i.e., treated as realized and subject to distribution) for federal income tax purposes at fiscal year-end. Securities designated as collateral for market value on futures contracts are noted in the Schedule of Investments (if applicable). Such collateral is in the possession of the Portfolio's custodian. As of December 31, 2007, the Portfolio was not invested in futures contracts.
Short Sales
The Portfolio may engage in "short sales against the box." Short sales against the box involve either selling short a security that the Portfolio owns, or selling short a security that the Portfolio has the right to obtain, for delivery at a specified date in the future. The Portfolio may enter into a short sale against the box to hedge against anticipated declines in the market price of portfolio securities by locking in gains. The Portfolio does not deliver from its portfolio the securities sold short and does not immediately receive the proceeds of the short sale. The Portfolio borrows the securities sold short and receives proceeds from the short sale only when it delivers the securities to the lender. If the value of the securities sold short increases prior to the scheduled delivery date, the Portfolio loses the opportunity to participate in the gain.
The Portfolio may engage in short sales when the portfolio manager anticipates that a security's market purchase price will be less than its borrowing price. To complete the transaction, the Portfolio must borrow the security to deliver it to the purchaser and buy that same security in the market to return it to the lender. The total market value of all of the Portfolio's short sale positions will not exceed 10% of its assets. Although the potential for gain is limited to the difference between the price at which the Portfolio sold the security short and the cost of borrowing the security, its potential for loss is theoretically unlimited because there is no limit to the cost of replacing the borrowed security. There is no assurance that the Portfolio will be able to close out a short position at a particular time or at an acceptable price. A gain or a loss will be recognized upon termination of a short sale. There is no limit to the size of any loss that the Portfolio may recognize upon termination of a short sale. Short sales held by the Portfolio are fully collateralized by other securities, which are denoted in the accompanying Schedule of Investments (if applicable).
Foreign Currency Translations
The Portfolio does not isolate that portion of the results of operations resulting from changes in foreign exchange rates on investments from the fluctuations arising from changes in market prices of securities held at the date of the financial statements. Net unrealized appreciation or depreciation on investments and foreign currency translation arise from changes in the value of assets and liabilities, including investments in securities held at the date of the financial statements, resulting from changes in the exchange rates and changes in market prices of securities held.
Currency gains and losses are also calculated on payables and receivables that are denominated in foreign currencies. The payables and receivables are generally related to foreign security transactions and income.
Foreign currency-denominated assets and forward currency contracts may involve more risks than domestic transactions, including currency risk, political and economic risk, regulatory risk and market risk. Risks may arise from the potential inability of a counterparty to meet the terms of a contract and from unanticipated movements in the value of foreign currencies relative to the U.S. dollar.
When-issued Securities
The Portfolio may purchase or sell securities on a when-issued or forward commitment basis. The price of the underlying securities and date when the securities will be delivered and paid for are fixed at the time the transaction is negotiated. Losses may arise due to changes in the market value of the securities or from the inability of counterparties to meet the terms of the contract. In connection with such purchases, the Portfolio may hold liquid assets as collateral with the Portfolio's custodian sufficient to cover the purchase price. As of December 31, 2007, the Portfolio was not invested in when-issued securities.
Equity-Linked Structured Notes
The Portfolio may invest in equity-linked structured notes. Equity-linked structured notes are derivative securities which are specially designed to combine the characteristics of one or more underlying securities and their equity derivatives in a single note form. The return and/or yield or income component may be based on the performance of the underlying equity securities, an equity index, and/or option positions. Equity-linked structured notes are typically offered in limited transactions by financial institutions in either registered or non-registered form. An investment in equity-linked structured notes creates exposure to the credit risk of the issuing financial institution, as well as to the market risk of the underlying securities. There is no guaranteed return of principal with these securities and the appreciation potential of these securities may be limited by a maximum payment or call right. In certain cases, equity-linked struc tured notes may be more volatile and less liquid than less complex securities or other types of fixed-income securities. Such securities may exhibit price behavior that does not correlate with other fixed-income securities.
Initial Public Offerings
The Portfolio may invest in initial public offerings ("IPOs"). IPOs and other investment techniques may have a magnified performance impact on a fund with a small asset base. The Portfolio may not experience similar performance as its assets grow.
16 Janus Aspen Series December 31, 2007
Restricted Security Transactions
Restricted securities held by the Portfolio may not be sold except in exempt transactions or in a public offering registered under the Securities Act of 1933. The risk of investing in such securities is generally greater than the risk of investing in the securities of widely held, publicly traded companies. Lack of a secondary market and resale restrictions may result in the inability of the Portfolio to sell a security at a fair price and may substantially delay the sale of the security. In addition, these securities may exhibit greater price volatility than securities for which secondary markets exist. As of December 31, 2007, the Portfolio was invested in restricted securities.
Dividend Distributions
The Portfolio may make semiannual distributions of substantially all of its investment income and an annual distribution of its net realized capital gains (if any). The majority of dividends and net realized capital gains distributions from the Portfolio may be automatically reinvested into additional shares of the Portfolio, based upon the discretion of the shareholder.
The Portfolio has made certain investments in real estate investment trusts ("REITs") which pay dividends to their shareholders based upon funds available from operations. It is quite common for these dividends to exceed the REIT's taxable earnings and profits resulting in the excess portion of such dividends being designated as a return of capital. If the Portfolio distributes such amounts, such distribution could constitute a return of capital to shareholders for federal income tax purposes.
Estimates
The preparation of financial statements in conformity with accounting principles generally accepted in the United States of America requires management to make estimates and assumptions that affect the reported amount of assets and liabilities and disclosure of contingent assets and liabilities at the date of the financial statements, and the reported amounts of income and expenses during the reporting period. Actual results could differ from those estimates.
Federal Income Taxes
No provision for income taxes is included in the accompanying financial statements, as the Portfolio intends to distribute to shareholders all taxable investment income and realized gains and otherwise comply with Subchapter M of the Internal Revenue Code applicable to regulated investment companies.
New Accounting Pronouncements
In July 2006, the Financial Accounting Standards Board ("FASB") issued Interpretation No. 48, "Accounting for Uncertainty in Income Taxes – an Interpretation of FASB Statement No. 109" (the "Interpretation"). The Interpretation establishes for all entities, including pass-through entities such as the Portfolio, a minimum threshold for financial statement recognition of the benefit of positions taken in filing tax returns (including whether an entity is taxable in a particular jurisdiction), and requires certain expanded tax disclosures. A calendar year open-end or closed-end fund was required to implement the Interpretation no later than June 29, 2007 (the last business day of the semi-annual reporting period), and the Interpretation also applies to all open tax years as of the date of effectiveness. Management has evaluated the application of the Interpretation to the Portfolio and has determined there is no significant impact on the Portfolio's financial statements.
In September 2006, the FASB issued Statement of Financial Accounting Standards No. 157, "Fair Value Measurements" ("SFAS No. 157"), which defines fair value, establishes a framework for measuring fair value in generally accepted accounting principles, and expands disclosures about fair value measurements. SFAS No. 157 does not require new fair value measurements, but is applied to the extent that other accounting pronouncements require or permit fair value measurements. SFAS No. 157 emphasizes that fair value is a market-based measurement that should be determined based on the assumptions that market participants would use in pricing an asset or liability. SFAS No. 157 is effective for fiscal years beginning after November 15, 2007 and interim periods within those fiscal years. Management does not believe the adoption of SFAS No. 157 will impact the financial statement amounts, however, the Portfolio will be required to disclose the extent t o which fair value is used to measure assets and liabilities and the inputs used to develop the measurements.
2. INVESTMENT ADVISORY AGREEMENTS AND OTHER TRANSACTIONS WITH AFFILIATES
The Portfolio pays a monthly advisory fee to Janus Capital based upon average daily net assets and calculated at the annual rate of 0.64%.
Janus Capital has agreed until at least May 1, 2009 to reimburse the Portfolio by the amount, if any, that the normal operating expenses in any fiscal year, including the investment advisory fee but excluding the distribution and shareholder servicing (12b-1) fees applicable to Service Shares, brokerage commissions, interest, taxes and extraordinary expenses, exceed an annual rate of 1.24% of the average daily net assets of the Portfolio. The Portfolio is not required to repay any such waived fees in future years to Janus Capital.
Janus Services LLC ("Janus Services"), a wholly-owned subsidiary of Janus Capital, is the Portfolio's transfer agent. Janus Services receives certain out-of-pocket expenses for transfer agent services.
Certain officers of the Portfolio may also be officers and/or directors of Janus Capital. Such officers receive no compensation from the Portfolio, except for the Portfolio's Chief Compliance Officer. Effective January 1, 2006, the Portfolio began reimbursing the adviser for a portion of the compensation paid to the Chief Compliance Officer of the Trust. Total compensation of $3,078 was paid by the Portfolio during the fiscal year ended December 31, 2007. The Portfolio's portion is reported as part of "Other Expenses" on the Statement of Operations.
The Board of Trustees has adopted a deferred compensation plan (the "Deferred Plan") for independent Trustees to elect to
Janus Aspen Series December 31, 2007 17
Notes to Financial Statements (continued)
defer receipt of all or a portion of the annual compensation they are entitled to receive from the Portfolio. All deferred fees are credited to an account established in the name of the Trustees. The amounts credited to the account then increase or decrease, as the case may be, in accordance with the performance of one or more of the Janus funds that are selected by the Trustees. The account balance continues to fluctuate in accordance with the performance of the selected fund or funds until final payment of all amounts credited to the account. The fluctuation of the account balance is recorded by the Portfolio as unrealized appreciation/(depreciation) and is shown as of December 31, 2007 on the Statement of Assets and Liabilities as an asset, "Noninterested Trustees' deferred compensation," and a liability, "Noninterested Trustees' deferred compensation fees." Additionally, the recorded unrealized appreciation/(depreciation) is included in "Unrealized net appreciation/(depreciation) of investments, foreign currency translations and non-interested Trustees' deferred compensation" on the Statement of Assets and Liabilities. Deferred compensation expenses for the fiscal year ended December 31, 2007 are included in "Non-interested Trustees' fees and expenses" on the Statement of Operations. Trustees are allowed to change their designation of mutual funds from time to time. Amounts will be deferred until distributed in accordance with the Deferred Plan. No deferred fees were paid to any Trustee under the Deferred Plan during the fiscal year ended December 31, 2007.
For the fiscal year ended December 31, 2007, Janus Capital assumed $24,421 of legal, consulting and Trustee costs and fees incurred by the funds in Janus Investment Fund, Janus Aspen Series and Janus Adviser Series (the "Funds") in connection with the regulatory and civil litigation matters discussed in Note 7. These non-recurring costs were allocated to all Funds based on the Funds' respective net assets as of July 31, 2004. Additionally, all future non-recurring costs will be allocated to the Funds based on the Funds' respective net assets on July 31, 2004. These "Non-recurring costs" and "Costs assumed by Janus Capital" are shown on the Statement of Operations.
During the fiscal year ended December 31, 2007, Janus Capital reimbursed the Portfolio $69 for Institutional Shares and $540 for Service Shares, as a result of dilutions caused by certain trading and/or pricing errors. Reimbursements are included in "Payment from affiliate" on the Statements of Changes in Net Assets.
Janus Distributors LLC, a wholly-owned subsidiary of Janus Capital, is a distributor of the Portfolio. Service Shares have adopted a Distribution and Shareholder Servicing Plan (the "Plan") pursuant to Rule 12b-1 under the 1940 Act. The Plan authorizes payments by the Portfolio in connection with the distribution of Service Shares at an annual rate of up to 0.25% of Service Share's average daily net assets.
The Portfolio's expenses may be reduced by expense offsets from an unaffiliated custodian and/or transfer agent. Such credits or offsets are included in "Expense and Fee Offset" on the Statement of Operations. The transfer agent fee offsets received during the period reduce Transfer Agent Fees and Expenses. Custodian offsets received reduce Custodian Fees. The Portfolio could have employed the assets used by the custodian and/or transfer agent to produce income if it had not entered into an expense offset arrangement.
The Portfolio may invest in money market funds, including funds managed by Janus Capital. During the fiscal year ended December 31, 2007, the Portfolio recorded distributions from affiliated investment companies as affiliated dividend income, and had the following affiliated purchases and sales:
| Purchases Shares/Cost | Sales Shares/Cost | Dividend Income | Value at 12/31/07 | ||||||||||||||||
| Janus Aspen Global Life Sciences Portfolio | |||||||||||||||||||
| Janus Institutional Cash Management Fund – Institutional Shares | $ | 2,805,838 | $ | 2,385,838 | $ | 4,421 | $ | 420,000 | |||||||||||
| Janus Institutional Cash Reserves Fund | 567,081 | 592,540 | 410 | – | |||||||||||||||
| Janus Institutional Money Market Fund – Institutional Shares | 5,592,387 | 5,592,387 | 3,303 | – | |||||||||||||||
| Janus Money Market Fund – Institutional Shares | 748,000 | 748,000 | 268 | – | |||||||||||||||
| $ | 9,713,306 | $ | 9,318,765 | $ | 8,402 | $ | 420,000 | ||||||||||||
3. FEDERAL INCOME TAX
The tax components of capital shown in the table below represent: (1) distribution requirements the Portfolio must satisfy under the income tax regulations; (2) losses or deductions the Portfolio may be able to offset against income and gains realized in future years; and (3) unrealized appreciation or depreciation of investments for federal income tax purposes (reduced by foreign tax liability).
In 2007, the Portfolio incurred "Post-October" losses during the period from November 1, 2007 through December 31, 2007. These losses will be deferred for tax purposes and recognized in 2008.
Other book to tax differences in the current year may consist of deferred compensation, derivatives, and foreign currency contract adjustments. The Portfolio has elected to treat gains and losses on forward foreign currency contracts as capital gains and losses. Other foreign currency gains and losses on debt instruments are treated as ordinary income for federal income tax purposes pursuant to Section 988 of the Internal Revenue Code.
18 Janus Aspen Series December 31, 2007
Accumulated capital losses noted below represent net capital loss carryovers, as of December 31, 2007, that may be available to offset future realized capital gains and thereby reduce future taxable gains distributions.
| Portfolio | Undistributed Ordinary Income | Undistributed Long-Term Gains | Accumulated Capital Losses | Post-October Deferral | Other Book to Tax Differences | Net Tax Appreciation/ (Depreciation) | |||||||||||||||||||||
| Janus Aspen Global Life Sciences Portfolio | $ | – | $ | – | $ | (1,344,560 | ) | $ | (992 | ) | $ | (1,307 | ) | $ | 5,314,833 | ||||||||||||
The table below shows the expiration dates of the carryovers.
Capital Loss Carryover Expiration Schedule
For the year ended December 31, 2007
| Portfolio | December 31, 2011 | ||||||
| Janus Aspen Global Life Sciences Portfolio | $ | (1,344,560 | ) | ||||
During the year ended December 31, 2007, the following capital loss carryover was utilized by the Portfolio as indicated in the table below.
| Portfolio | Capital Loss Carryover Utilized | ||||||
| Janus Aspen Global Life Sciences Portfolio | $ | 4,726,756 | |||||
The aggregate cost of investments and the composition of unrealized appreciation and depreciation of investment securities for federal income tax purposes as of December 31, 2007 are noted below.
Unrealized appreciation and unrealized depreciation in the table below exclude appreciation/depreciation on foreign currency translations. The primary difference between book and tax appreciation or depreciation of investments is wash sale loss deferrals.
| Portfolio | Federal Tax Cost | Unrealized Appreciation | Unrealized (Depreciation) | ||||||||||||
| Janus Aspen Global Life Sciences Portfolio | $ | 25,565,344 | $ | 6,473,725 | $ | (1,121,472 | ) | ||||||||
Income and capital gains distributions are determined in accordance with income tax regulations that may differ from accounting principles generally accepted in the United States of America. These differences are due to differing treatments for items such as net short-term gains, deferral of wash sale losses, foreign currency transactions, net investment losses and capital loss carryovers. Certain permanent differences such as tax returns of capital and net investment losses noted below have been reclassified to paid-in capital.
| For the fiscal year ended December 31, 2007 | Distributions | ||||||||||||||||||
| Portfolio | From Ordinary Income | From Long-Term Capital Gains | Tax Return of Capital | Net Investment Loss | |||||||||||||||
| Janus Aspen Global Life Sciences Portfolio | $ | – | $ | – | $ | – | $ | (180,519 | ) | ||||||||||
| For the fiscal year ended December 31, 2006 | Distributions | ||||||||||||||||||
| Portfolio | From Ordinary Income | From Long-Term Capital Gains | Tax Return of Capital | Net Investment Loss | |||||||||||||||
| Janus Aspen Global Life Sciences Portfolio | $ | – | $ | – | $ | – | $ | (240,433 | ) | ||||||||||
Janus Aspen Series December 31, 2007 19
Notes to Financial Statements (continued)
4. EXPENSE RATIOS
The expense ratios listed in the Financial Highlights reflect expenses prior to any expense offsets (gross expense ratio) and after expense offsets (net expense ratio). Both expense ratios reflect expenses after waivers (reimbursement). Listed below are the gross expense ratios for the Portfolio that would have been in effect, absent the waiver of certain fees and offsets.
For each fiscal year ended December 31
| Institutional Shares | Service Shares | ||||||||||||||||||||||||||||||||||||||||||
| Portfolio | 2007(1) | 2006(1) | 2005(1) | 2004(1) | 2003 | 2007(1) | 2006(1) | 2005(1) | 2004(1) | 2003 | |||||||||||||||||||||||||||||||||
| Janus Aspen Global Life Sciences Portfolio | 1.09 | % | 1.10 | % | 0.95 | % | 0.90 | % | 0.97 | % | 1.34 | % | 1.35 | % | 1.20 | % | 1.15 | % | 1.22 | % | |||||||||||||||||||||||
(1) The effect of non-recurring costs assumed by Janus Capital (Note 2) is included in the ratio of operating expenses to average net assets without waivers and/or expense reimbursements and was less than 0.01%.
5. CAPITAL SHARE TRANSACTIONS
| For each fiscal year ended December 31 | Janus Aspen Global Life Sciences Portfolio | ||||||||||
| (all numbers in thousands) | 2007 | 2006 | |||||||||
| Transactions in Portfolio Shares – Institutional Shares | |||||||||||
| Shares sold | 70 | 101 | |||||||||
| Reinvested dividends and distributions | – | – | |||||||||
| Shares repurchased | (129 | ) | (175 | ) | |||||||
| Net Increase/(Decrease) in Portfolio Shares | (59 | ) | (74 | ) | |||||||
| Shares Outstanding, Beginning of Period | 360 | 434 | |||||||||
| Shares Outstanding, End of Period | 301 | 360 | |||||||||
| Transactions in Portfolio Shares – Service Shares | |||||||||||
| Shares sold | 232 | 484 | |||||||||
| Reinvested dividends and distributions | – | – | |||||||||
| Shares repurchased | (795 | ) | (1,141 | ) | |||||||
| Net Increase/(Decrease) in Portfolio Shares | (563 | ) | (657 | ) | |||||||
| Shares Outstanding, Beginning of Period | 2,797 | 3,454 | |||||||||
| Shares Outstanding, End of Period | 2,234 | 2,797 | |||||||||
6. PURCHASES AND SALES OF INVESTMENT SECURITIES
For the fiscal year ended December 31, 2007, the aggregate cost of purchases and proceeds from sales of investment securities (excluding short-term securities and short sales) were as follows:
| Portfolio | Purchases of Securities | Proceeds from Sales of Securities | Purchases of Long-Term U.S. Government Obligations | Proceeds from Sales of Long-Term U.S. Government Obligations | |||||||||||||||
| Janus Aspen Global Life Sciences Portfolio | $ | 23,700,728 | $ | 30,390,514 | $ | – | $ | – | |||||||||||
7. PENDING LEGAL MATTERS
In the fall of 2003, the Securities and Exchange Commission ("SEC"), the Office of the New York State Attorney General ("NYAG"), the Colorado Attorney General ("COAG"), and the Colorado Division of Securities ("CDS") announced that they were investigating alleged frequent trading practices in the mutual fund industry. On August 18, 2004, Janus Capital announced that it had reached final settlements with the SEC, the NYAG, the COAG, and the CDS related to such regulators' investigations into Janus Capital's frequent trading arrangements.
A number of civil lawsuits were brought against Janus Capital and certain of its affiliates, the Janus funds, and related entities and individuals based on allegations similar to those announced by the above regulators and were filed in several state and federal jurisdictions. Such lawsuits alleged a variety of theories for recovery including, but not limited to, the federal securities laws, other federal statutes (including ERISA), and various common law doctrines. The Judicial Panel on Multidistrict Litigation transferred these actions to the U.S. District Court for the District of Maryland (the
20 Janus Aspen Series December 31, 2007
"Court") for coordinated proceedings. On September 29, 2004, five consolidated amended complaints were filed with the Court that generally include: (i) claims by a putative class of investors in certain Janus funds asserting claims on behalf of the investor class (Marini, et al. v. Janus Investment Fund, et al., U.S. District Court, District of Maryland, Case No. 04-CV-00497); (ii) derivative claims by investors in certain Janus funds ostensibly on behalf of such funds (Steinberg et al. v. Janus Capital Management, LLC et al., U.S. District Court, District of Maryland, Case No. 04-CV-00518); (iii) claims on behalf of participants in the Janus 401(k) plan (Wangberger v. Janus Capital Group Inc., 401(k) Advisory Committee, et al., U.S. District Court, District of Maryland, Case No. JFM-05-2711); (iv) claims brought on behalf of shareholders of Janus Capital Group Inc. ("JCGI") on a derivative basis against the Board of Dir ectors of JCGI (Chasen v. Whiston, et al., U.S. District Court, District of Maryland, Case No. 04-MD-00855); and (v) claims by a putative class of shareholders of JCGI asserting claims on behalf of the shareholders (Wiggins, et al. v. Janus Capital Group, Inc., et al., U.S. District Court, District of Maryland, Case No. 04-CV-00818). Each of the five complaints initially named JCGI and/or Janus Capital as a defendant. In addition, the following were also named as defendants in one or more of the actions: Janus Investment Fund ("JIF"), Janus Aspen Series ("JAS"), Janus Adviser Series ("JAD"), Janus Distributors LLC, Enhanced Investment Technologies, LLC ("INTECH"), Bay Isle Financial LLC ("Bay Isle"), Perkins, Wolf, McDonnell and Company, LLC ("Perkins"), the Advisory Committee of the Janus 401(k) plan, and the current or former directors of JCGI.
On August 25, 2005, the Court entered orders dismissing most of the claims asserted against Janus Capital and its affiliates by fund investors in the Marini and Steinberg cases (actions (i) and (ii) above) except certain claims under Section 10(b) of the Securities Exchange Act of 1934 and under Section 36(b) of the Investment Company Act of 1940, as amended (the "1940 Act"). On August 15, 2006, the Wangberger complaint in the 401(k) plan class action (action (iii) above) was dismissed by the district court with prejudice. The plaintiff appealed that dismissal decision to the United States Court of Appeals for the Fourth Circuit. The appeal is still pending and argument in the matter was held in December 2007. The Court also dismissed the Chasen lawsuit (action (iv) above) against JCGI's Board of Directors without leave to amend. Finally, a Motion to Dismiss the Wiggins suit (action (v) above) was granted and the matter was dismissed in May 2007. However, in June 2007, Plaintiffs appealed that dismissal to the United States Court of Appeals for the Fourth Circuit. That appeal is currently pending.
In addition to the lawsuits described above, the Auditor of the State of West Virginia ("Auditor"), in his capacity as securities commissioner, has initiated administrative proceedings against many of the defendants in the market timing cases (including JCGI and Janus Capital) and, as a part of its relief, is seeking disgorgement and other monetary relief based on similar market timing allegations (In the Matter of Janus Capital Group Inc. et al., Before the Securities Commissioner, State of West Virginia, Summary Order No. 05-1320). The respondents in these proceedings collectively sought a Writ of Prohibition in state court, which was denied. Their subsequent Petition for Appeal was also denied. Consequently, in September 2006, JCGI and Janus Capital filed their answer to the Auditor's summary order instituting proceedings and requested a hearing. A status conference was held on June 28, 2007, during which the parties were ordered t o submit their proposed scheduling order. To date, no scheduling order has been entered in the case. In addition to the pending Motion to Discharge Order to Show Cause, JCGI and Janus Capital, as well as other similarly situated defendants, continue to challenge the statutory authority of the Auditor to bring such an action.
Additional lawsuits may be filed against certain of the Janus funds, Janus Capital, and related parties in the future. Janus Capital does not currently believe that these pending actions will materially affect its ability to continue providing services it has agreed to provide to the Janus funds.
Janus Aspen Series December 31, 2007 21
Report of Independent Registered Public Accounting Firm
To the Trustees and Shareholders
of Janus Aspen Global Life Sciences Portfolio
In our opinion, the accompanying statement of assets and liabilities, including the schedule of investments, and the related statements of operations and of changes in net assets and the financial highlights present fairly, in all material respects, the financial position of Janus Aspen Global Life Sciences Portfolio (one of the portfolios constituting Janus Aspen Series, hereafter referred to as the "Portfolio") at December 31, 2007, the results of its operations for the year then ended, the changes in its net assets for each of the two years in the period then ended, and the financial highlights for each of the five years in the period then ended, in conformity with accounting principles generally accepted in the United States of America. These financial statements and financial highlights (hereafter referred to as "financial statements") are the responsibility of the Portfolio's management; our responsibility is to express an opinion on t hese financial statements based on our audits. We conducted our audits of these financial statements in accordance with the standards of the Public Company Accounting Oversight Board (United States). Those standards require that we plan and perform the audit to obtain reasonable assurance about whether the financial statements are free of material misstatement. An audit includes examining, on a test basis, evidence supporting the amounts and disclosures in the financial statements, assessing the accounting principles used and significant estimates made by management, and evaluating the overall financial statement presentation. We believe that our audits, which included confirmation of securities at December 31, 2007 by correspondence with the custodian, transfer agent and brokers, and the application of alternative auditing procedures where securities purchased had not been received, provide a reasonable basis for our opinion.

Denver, Colorado
February 15, 2008
22 Janus Aspen Series December 31, 2007
Additional Information (unaudited)
PROXY VOTING POLICIES AND VOTING RECORD
A description of the policies and procedures that the Portfolio uses to determine how to vote proxies relating to its portfolio securities is available: (i) without charge, upon request, by calling 1-800-525-0020 (toll free); (ii) on the Portfolio's website at www.janus.com/proxyvoting; and (iii) on the SEC's website at http://www.sec.gov. Additionally, information regarding the Portfolio's proxy voting record for the most recent twelve-month period ended June 30 is also available, free of charge, through www.janus.com/proxyvoting and from the SEC's website at http://www.sec.gov.
QUARTERLY PORTFOLIO HOLDINGS
The Portfolio files its complete portfolio holdings (schedule of investments) with the SEC for the first and third quarters of each fiscal year on Form N-Q within 60 days of the end of such fiscal quarter. The Portfolio's Form N-Q: (i) is available on the SEC's website at http://www.sec.gov; (ii) may be reviewed and copied at the SEC's Public Reference Room in Washington, D.C. (information on the Public Reference Room may be obtained by calling 1-800-SEC-0330); and (iii) is available without charge, upon request, by calling Janus at 1-800-525-0020 (toll free).
APPROVAL OF ADVISORY AGREEMENTS DURING THE PERIOD
The Trustees of Janus Aspen Series, none of whom has ever been affiliated with Janus Capital ("Independent Trustees"), oversee the management of each Portfolio and, as required by law, determine annually whether to continue the investment advisory agreement for each Portfolio and the subadvisory agreements for the three Portfolios that utilize subadvisers.
In connection with their most recent consideration of those agreements for each Portfolio, the Trustees received and reviewed a substantial amount of information provided by Janus Capital and the respective subadvisers in response to requests of the Independent Trustees and their independent legal counsel. They also received and reviewed a considerable amount of information and analysis provided by their independent fee consultant. Throughout their consideration of the agreements, the Independent Trustees were advised by their independent legal counsel. The Independent Trustees met with management to consider the agreements, and also met separately in executive session with their independent legal counsel and their independent fee consultant.
At a meeting held on December 14, 2007, based on their evaluation of the information provided by Janus Capital, the subadvisers and the independent fee consultant, as well as other information, the Trustees determined that the overall arrangements between each Portfolio and Janus Capital and each subadviser, as applicable, were fair and reasonable in light of the nature, extent and quality of the services provided by Janus Capital, its affiliates and the subadvisers, the fees charged for those services, and other matters that the Trustees considered relevant in the exercise of their business judgment. At that meeting the Trustees unanimously approved the continuation of the investment advisory agreement for each Portfolio, and the subadvisory agreement for each subadvised Portfolio, for the period from February 1, 2008 through February 1, 2009, subject to earlier termina tion as provided for in each agreement.
In considering the continuation of those agreements, the Trustees reviewed and analyzed various factors that they determined were relevant, including the factors described below, none of which by itself was considered dispositive. However, the material factors and conclusions that formed the basis for the Trustees' determination to approve the continuation of the agreements are discussed separately below.
Nature, Extent and Quality of Services
The Trustees reviewed the nature, extent and quality of the services provided by Janus Capital and the subadvisers to the Portfolios, taking into account the investment objective and strategy of each Portfolio, the knowledge of the Trustees gained from their regular meetings with management on at least a quarterly basis, and their ongoing review of information related to the Portfolios. In addition, the Trustees reviewed the resources and key personnel of Janus Capital and each subadviser, especially those who provide investment management services to the Portfolios. The Trustees also considered other services provided to the Portfolios by Janus Capital or the subadvisers, such as managing the execution of portfolio transactions and the selection of broker-dealers for those transactions, serving as the Portfolios' administrator, monitoring adherence to the Portfolios' investment restrictions, producing shareholder reports, providing support services for the Trustees and Trustee committees, communicating with shareholders, and overseeing the activities of other service providers, including monitoring compliance with various policies and procedures of the Portfolios and with applicable securities laws and regulations.
The Trustees concluded that the nature, extent and quality of the services provided by Janus Capital and/or the subadviser to each Portfolio were appropriate and consistent with the terms of the respective advisory and subadvisory agreements; that, taking into account steps taken to address those Portfolios whose performance lagged that of the median of their peers for certain periods, the quality of those services had been consistent with or superior to quality norms in the industry; and that the Portfolios were likely to benefit from the continued provision of those services. They also concluded that Janus Capital and each subadviser had sufficient personnel, with the appropriate education and experience, to
Janus Aspen Series December 31, 2007 23
Additional Information (unaudited) (continued)
serve the Portfolios effectively and had demonstrated its continuing ability to attract well-qualified personnel.
Performance of the Portfolios
The Trustees considered the investment results of each Portfolio over various time periods. They reviewed information comparing each Portfolio's performance with the performance of comparable funds and peer groups identified by Lipper Inc., an independent provider of investment company data, and with the Portfolio's benchmark index. They concluded that the performance of many Portfolios was good to very good under current market conditions. Although the performance of some Portfolios lagged that of the median of their peers for certain periods, the Trustees also concluded that Janus Capital had taken appropriate steps to address those instances of under-performance and that the more recent performance of most of those Portfolios had been improving.
Costs of Services Provided
The Trustees examined information on the fees and expenses of each Portfolio in comparison to similar information for comparable funds as provided by Lipper. They also reviewed an analysis of that information provided by their independent fee consultant and noted that the rate of management (investment advisory and administrative) fees for most of the Portfolios, in some cases after contractual expense limitations, was below the mean management fee rate of the respective peer group of funds selected by Lipper.
The Trustees considered the methodology used by Janus Capital and each subadviser in determining compensation payable to portfolio managers, the competitive environment for investment management talent and the competitive market for mutual funds in different distribution channels. They concluded that the compensation methodology provided a good alignment of the interests of the portfolio managers with those of Portfolio shareholders.
The Trustees also reviewed management fees charged by Janus Capital to its separate account clients and to its subadvised funds (for which Janus Capital provides only services related to portfolio management). Although in most instances subadvisory and separate account fee rates for various investment strategies were lower than management fee rates for Portfolios having a similar strategy, the Trustees noted that, under the terms of the management agreements with the Portfolios, Janus Capital performs significant additional services for the Portfolios that it does not provide to those other clients, including administrative services, oversight of the Portfolios' other service providers, Trustee support, regulatory compliance and numerous other services, and that, in serving the Portfolios, Janus Capital assumes many legal risks that it does not assume in servicing its ot her clients. Moreover, the Trustees noted that the spread between the average fee rates charged to the Portfolios and the fee rates that Janus Capital charged to its separate account clients was significantly smaller than the average spread for such fee rates of other advisers, based on publicly available data and research conducted by their independent fee consultant.
The Trustees reviewed information on the profitability to Janus Capital and its affiliates of their relationships with each Portfolio, as well as an explanation of the methodology used in allocating various expenses of Janus Capital and its affiliates among the Portfolios and other clients. They also reviewed the financial statements of Janus Capital's parent company and its corporate structure. In their review, the Trustees considered whether Janus Capital and each subadviser receives adequate incentives to manage the Portfolios effectively. They recognized that profitability comparisons among investment advisers are difficult because very little comparative information is publicly available and profitability of any adviser is affected by numerous factors, including the organizational structure of the particular adviser, the types of funds and other accounts it manages, possible other lines of business, the methodology for allocating expens es, and the adviser's capital structure and cost of capital. However, based on the information available and taking those factors into account, the Trustees concluded that Janus Capital's profitability with respect to each Portfolio in relation to the services rendered was not unreasonable.
The Trustees concluded that the management fees and other compensation payable by each Portfolio to Janus Capital and its affiliates, as well as the fees payable by Janus Capital or the Portfolios to the subadvisers of subadvised Portfolios, were reasonable in relation to the nature, extent and quality of the services provided, taking into account the fees charged by other advisers for managing comparable mutual funds with similar strategies and the fees Janus Capital and the subadvisers charge to other clients. They also concluded that the overall expense ratio of each Portfolio was reasonable, taking into account the size of the Portfolio, the quality of services provided by Janus Capital and any subadviser, the investment performance of the Portfolio and any expense limitations agreed to by Janus Capital.
Economies of Scale
The Trustees considered information about the potential for Janus Capital to realize economies of scale as the assets of the Portfolios increase. They noted that, although most Portfolios pay advisory fees at a fixed rate as a percentage of net assets, without any breakpoints, the management fee rate paid by each Portfolio, after any contractual expense limitations, was below the mean management fee rate of the Portfolio's peer
24 Janus Aspen Series December 31, 2007
group selected by Lipper; and, for those Portfolios whose expenses are being reduced by the contractual expense limitations of Janus Capital, Janus Capital is subsidizing the Portfolios because they have not reached adequate scale. Moreover, as the assets of many of the Portfolios declined in the past few years, those Portfolios benefited from having advisory fee rates that remained constant rather than increasing as assets declined. In addition, performance fee structures have been implemented for several Portfolios that will cause the effective rate of advisory fees payable by such a Portfolio to vary depending on the investment performance of the Portfolio relative to its benchmark index over the measurement period; and a few Portfolios have fee schedules with breakpoints and reduced fee rates above certain asset levels. The Trustees also noted that the Portfolios share directly in economies of scale through lower charges of third-party s ervice providers, based on the combined scale of all of the Portfolios. Based on all of the information they reviewed, the Trustees concluded that the current fee structure of each Portfolio was reasonable and that the current rates of fees do reflect a sharing between Janus Capital and the Portfolio of economies of scale at the current asset level of the Portfolio.
Other Benefits to Janus Capital
The Trustees also considered benefits that accrue to Janus Capital and its affiliates from their relationships with the Portfolios. They recognized that two affiliates of Janus Capital separately serve the Portfolios as transfer agent and distributor, respectively. They also considered Janus Capital's past and proposed use of commissions paid by Portfolios on their portfolio brokerage transactions to obtain proprietary and third-party research products and services benefiting those Portfolios and/or other clients of Janus Capital. The Trustees concluded that Janus Capital's use of "soft" commission dollars of a Portfolio to obtain proprietary and third-party research products and services was consistent with regulatory requirements and guidelines and was likely to benefit the Portfolios. The Trustees also concluded that, other than the services provided by Janus Capital and its affiliates pursuant to the agreements and the fees to be paid by each Portfolio therefor, the Portfolios and Janus Capital may potentially benefit from their relationship with each other in other ways. They concluded that Janus Capital benefits from the receipt of proprietary research products and services acquired through commissions paid on portfolio transactions of the Portfolios and that the Portfolios benefit from Janus Capital's receipt of those products and services, as well as research products and services acquired through commissions paid by other clients of Janus Capital. They further concluded that success of any Portfolio could attract other business to Janus Capital or other Janus funds and that the success of Janus Capital could enhance Janus Capital's ability to serve the Portfolios.After full consideration of the above factors, as well as other factors, all of the Trustees, all of whom are Independent Trustees, concluded that the proposed continuation of the investment advisory agree ment for each Portfolio, and the subadvisory agreement for each subadvised Portfolio, was in the best interest of the respective Portfolios and their shareholders.
Janus Aspen Series December 31, 2007 25
Explanations of Charts, Tables and Financial Statements (unaudited)
1. PERFORMANCE OVERVIEWS
The performance overview graph compares the performance of a hypothetical $10,000 investment in the Portfolio with one or more widely used market indices. The hypothetical example does not represent the returns of any particular investment.
When comparing the performance of the Portfolio with an index, keep in mind that market indices do not include brokerage commissions that would be incurred if you purchased the individual securities in the index. They also do not include taxes payable on dividends and interest or operating expenses incurred if you maintained a Portfolio invested in the index.
Average annual total returns are quoted for each class of the Portfolio. Average annual total return is calculated by taking the growth or decline in value of an investment over a period of time, including reinvestment of any dividends, distributions and capital gains, then calculating the annual compounded percentage rate that would have produced the same result had the rate of growth been constant throughout the period. Average annual total return does not reflect the deduction of taxes that a shareholder would pay on Portfolio distributions or redemptions of Portfolio shares.
Pursuant to federal securities rules, expense ratios shown in the performance chart reflect subsidized and unsubsidized ratios for the past fiscal year. The total annual portfolio operating expenses ratio is gross of any fee waivers, reflecting a Portfolio's unsubsidized expense ratio. The net annual portfolio operating expenses ratio (if applicable) includes contractual waivers of Janus Capital and/or Janus Services and reflects a Portfolio's subsidized expense ratio. Both the total annual portfolio operating expenses ratio and net annual portfolio operating expenses ratio are based on average net assets as of the fiscal year ended December 31, 2006. The ratios also include expenses indirectly incurred by the Portfolio as a result of investing in other investment companies or pooled investments, which are not reflected in the "Financial Highlights" of this report. As a result, these ratios may be higher or lower than those shown in the "Fin ancial Highlights" in this report. All expenses are shown without the effect of expense offset arrangements. Pursuant to such arrangements, credits realized as a result of uninvested cash balances are used to reduce custodian and transfer agent expenses.
2. SCHEDULE OF INVESTMENTS
Following the performance overview section is the Portfolio's Schedule of Investments. This schedule reports the industry concentrations and types of securities held in the Portfolio on the last day of the reporting period. Securities are usually listed by type (common stock, corporate bonds, U.S. Government obligations, etc.) and by industry classification (banking, communications, insurance, etc.). Holdings are subject to change without notice.
The value of each security is quoted as of the last day of the reporting period. The value of securities denominated in foreign currencies is converted into U.S. dollars. Certain short-term investments maturing within 60 days are valued at amortized cost, which approximates market value.
A summary of investments by country is provided if the Portfolio invested in foreign securities. This summary reports the Portfolio's exposure to different countries by providing the percentage of securities invested in each country. The country of each security represents the country in which the company is incorporated.
2A. FORWARD CURRENCY CONTRACTS
A table listing forward currency contracts follows the Portfolio's Schedule of Investments (if applicable). Forward currency contracts are agreements to deliver or receive a preset amount of currency at a future date. Forward currency contracts are used to hedge against foreign currency risk in the Portfolio's long-term holdings.
The table provides the name of the foreign currency, the settlement date of the contract, the amount of the contract, the value of the currency in U.S. dollars and the amount of unrealized gain or loss. The amount of unrealized gain or loss reflects the change in currency exchange rates from the time the contract was opened to the last day of the reporting period.
2B. FUTURES
A table listing futures contracts follows the Portfolio's Schedule of Investments (if applicable). Futures contracts are contracts that obligate the buyer to receive and the seller to deliver an instrument or money at a specified price on a specified date. Futures are used to hedge against adverse movements in securities prices, currency risk or interest rates.
The table provides the name of the contract, number of contracts held, the expiration date, the principal amount, value and the amount of unrealized gain or loss. The amount of unrealized gain or loss reflects the marked-to-market amount for the last day of the reporting period.
3. STATEMENT OF ASSETS AND LIABILITIES
This statement is often referred to as the "balance sheet." It lists the assets and liabilities of the Portfolio on the last day of the reporting period.
The Portfolio's assets are calculated by adding the value of the securities owned, the receivable for securities sold but not yet settled, the receivable for dividends declared but not yet received on stocks owned and the receivable for Portfolio shares sold to investors but not yet settled. The Portfolio's liabilities include payables for securities purchased but not yet settled, Portfolio shares redeemed but not yet paid and expenses owed but not yet paid. Additionally, there may be
26 Janus Aspen Series December 31, 2007
other assets and liabilities such as unrealized gain or loss on forward currency contracts.
The section entitled "Net Assets Consist of" breaks down the components of the Portfolio's net assets. Because the Portfolio must distribute substantially all earnings, you will notice that a significant portion of net assets is shareholder capital.
The last section of this statement reports the net asset value ("NAV") per share on the last day of the reporting period for each class of the Portfolio. The NAV is calculated by dividing the Portfolio's net assets (assets minus liabilities) by the number of shares outstanding.
4. STATEMENT OF OPERATIONS
This statement details the Portfolio's income, expenses, gains and losses on securities and currency transactions, and appreciation or depreciation of current Portfolio holdings.
The first section in this statement, entitled "Investment Income," reports the dividends earned from stocks and interest earned from interest-bearing securities in the Portfolio.
The next section reports the expenses and expense offsets incurred by the Portfolio, including the advisory fee paid to the investment adviser, transfer agent fees and expenses, printing and postage for mailing statements, financial reports and prospectuses, and other expenses. Expense offsets, if any, are also shown.
The last section lists the increase or decrease in the value of securities held in the Portfolio. The Portfolio realizes a gain (or loss) when it sells its position in a particular security. An unrealized gain (or loss) refers to the change in net appreciation or depreciation of the Portfolio during the reporting period. "Net Realized and Unrealized Gain/(Loss) on Investments" is affected both by changes in the market value of Portfolio holdings and by gains (or losses) realized during the reporting period.
5. STATEMENT OF CHANGES IN NET ASSETS
This statement reports the increase or decrease in the Portfolio's net assets during the reporting period. Changes in the Portfolio's net assets are attributable to investment operations, dividends, distributions and capital share transactions. This is important to investors because it shows exactly what caused the Portfolio's net asset size to change during the period.
The first section summarizes the information from the Statement of Operations regarding changes in net assets due to the Portfolio's investment performance. The Portfolio's net assets may also change as a result of dividend and capital gains distributions to investors. If investors receive their dividends in cash, money is taken out of the Portfolio to pay the distribution. If investors reinvest their dividends, the Portfolio's net assets will not be affected. If you compare the Portfolio's "Net Decrease from Dividends and Distributions" to the "Reinvested dividends and distributions," you will notice that dividend distributions had little effect on the Portfolio's net assets. This is because the majority of Janus investors reinvest their distributions.
The reinvestment of dividends is included under "Capital Share Transactions." "Capital Shares" refers to the money investors contribute to the Portfolio through purchases or withdraw via redemptions. The Portfolio's net assets will increase and decrease in value as investors purchase and redeem shares from the Portfolio.
6. FINANCIAL HIGHLIGHTS
This schedule provides a per-share breakdown of the components that affect the Portfolio's NAV for current and past reporting periods for each class of the Portfolio. Not only does this table provide you with total return, it also reports total distributions, asset size, expense ratios and portfolio turnover rate.
The first line in the table reflects the NAV per share at the beginning of the reporting period. The next line reports the net investment income per share, which comprises dividends and interest income earned on securities held by the Portfolio. Following is the total of gains/(losses), realized and unrealized. Dividends and distributions are then subtracted to arrive at the NAV per share at the end of the period. The next line reflects the average annual total return reported the last day of the period.
Also included are the expense ratios, or the percentage of average net assets that were used to cover operating expenses during the period. Expense ratios vary for a number of reasons, including the differences in management fees, the average shareholder account size and the extent of foreign investments, which entail greater transaction costs.
The Portfolio's expenses may be reduced through expense reduction arrangements. These arrangements may include the use of balance credits or transfer agent fee offsets. The Statement of Operations reflects total expenses before any such offset, the amount of the offset and the net expenses. The expense ratios listed in the Financial Highlights reflect total expenses prior to any expense offsets (gross expense ratio) and after the expense offsets (net expense ratio). Both expense ratios reflect expenses after waivers (reimbursements), if applicable.
The ratio of net investment income/(loss) summarizes the income earned less expenses, divided by the average net assets of the Portfolio during the reporting period. Don't confuse this ratio with the Portfolio's yield. The net investment income ratio is not a true measure of the Portfolio's yield because it doesn't take into account the dividends distributed to the Portfolio's investors.
Janus Aspen Series December 31, 2007 27
Explanations of Charts, Tables and Financial Statements (unaudited) (continued)
The next figure is the portfolio turnover rate, which measures the buying and selling activity in the Portfolio. Portfolio turnover is affected by market conditions, changes in the asset size of the Portfolio, the nature of the Portfolio's investments and the investment style of the portfolio manager. A 100% rate implies that an amount equal to the value of the entire portfolio is turned over in a year; a 50% rate means that an amount equal to the value of half the portfolio is traded in a year; and a 200% rate means that an amount equal to the value of the portfolio is traded every six months.
28 Janus Aspen Series December 31, 2007
Trustees and Officers (unaudited)
The Portfolio's Statement of Additional Information includes additional information about the Trustees and officers and is available, without charge, by calling 1-800-525-0020.
The following are the Trustees and officers of the Trust, together with a brief description of their principal occupations during the last five years (principal occupations for certain Trustees may include periods over five years).
Each Trustee has served in that capacity since he or she was originally elected or appointed. The Trustees do not serve a specified term of office. Each Trustee will hold office until the termination of the Trust or his or her earlier death, resignation, retirement, incapacity, or removal. The retirement age for Trustees is 72. The Portfolio's Nominating and Governance Committee will consider nominees for the position of Trustee recommended by shareholders. Shareholders may submit the name of a candidate for consideration by the Committee by submitting their recommendations to the Trust's Secretary. Each Trustee is currently a Trustee of two other registered investment companies advised by Janus Capital: Janus Investment Fund and Janus Adviser Series. As of the date of this report, collectively, these three registered investment companies consist of 75 series or funds.
The Trust's officers are elected annually by the Trustees for a one-year term. Certain officers also serve as officers of Janus Investment Fund and Janus Adviser Series. Certain officers of the Portfolio may also be officers and/or directors of Janus Capital. Portfolio officers receive no compensation from the Portfolio, except for the Portfolio's Chief Compliance Officer, as authorized by the Trustees.
Trustees
| Name, Address and Age | Positions Held with Portfolio | Length of Time Served | Principal Occupations During the Past Five Years | Number of Portfolios/Funds in Fund Complex Overseen by Trustee | Other Directorships Held by Trustee | ||||||||||||||||||
| Dennis B. Mullen* 151 Detroit Street Denver, CO 80206 DOB: 1943 | Chairman Trustee | 3/04-12/07 9/93-Present | Chief Executive Officer of Red Robin Gourmet Burgers, Inc. (since 2005). Formerly, private investor. | 75 | ** | Chairman of the Board (since 2005) and Director of Red Robin Gourmet Burgers, Inc., and Director of Janus Capital Funds Plc (Dublin-based, non-U.S. funds). | |||||||||||||||||
| Jerome S. Contro 151 Detroit Street Denver, CO 80206 DOB: 1956 | Trustee | 12/05-Present | Partner of Tango Group, a private investment firm (since 1999). | 75 | Trustee and Chairman of RS Investment Trust (since 2001), and Director of IZZE Beverages and MyFamily.com, Inc. (genealogical research website). | ||||||||||||||||||
| William F. McCalpin 151 Detroit Street Denver, CO 80206 DOB: 1957 | Trustee | 6/02-Present | Private investor. Formerly, Executive Vice President and Chief Operating Officer of The Rockefeller Brothers Fund (a private family foundation), and Vice President of Asian Cultural Council. | 75 | Director of F.B. Heron Foundation (a private grant making foundation). | ||||||||||||||||||
* Mr. McCalpin will succeed Mr. Mullen as Chairman as of January 1, 2008.
** Mr. Mullen also serves as director of Janus Capital Funds Plc, consisting of 16 funds. Including Janus Capital Funds Plc and the 75 funds comprising the Janus funds, Mr. Mullen oversees 91 funds.
Janus Aspen Series December 31, 2007 29
Trustees and Officers (unaudited) (continued)
Trustees (cont.)
| Name, Address and Age | Positions Held with Portfolio | Length of Time Served | Principal Occupations During the Past Five Years | Number of Portfolios/Funds in Fund Complex Overseen by Trustee | Other Directorships Held by Trustee | ||||||||||||||||||
| John W. McCarter, Jr. 151 Detroit Street Denver, CO 80206 DOB: 1938 | Trustee | 6/02-Present | President and Chief Executive Officer of The Field Museum of Natural History (Chicago, IL) (since 1997). | 75 | Chairman of the Board and Director of Divergence Inc. (biotechnology firm); Director of W.W. Grainger, Inc. (industrial distributor); and Trustee of WTTW (Chicago public television station) and the University of Chicago. | ||||||||||||||||||
| James T. Rothe 151 Detroit Street Denver, CO 80206 DOB: 1943 | Trustee | 1/97-Present | Co-founder and Managing Director of Roaring Fork Capital Management, LLC (private investment in public equity firm), and Professor Emeritus of Business of the University of Colorado, Colorado Springs, CO (since 2004). Formerly, Professor of Business of the University of Colorado (2002-2004) and Distinguished Visiting Professor of Business (2001-2002) of Thunderbird (American Graduate School of International Management), Glendale, AZ. | 75 | Director of Red Robin Gourmet Burgers, Inc. | ||||||||||||||||||
| William D. Stewart 151 Detroit Street Denver, CO 80206 DOB: 1944 | Trustee | 9/93-Present | Corporate Vice President and General Manager of MKS Instruments – HPS Products, Boulder, CO (a manufacturer of vacuum fittings and valves). | 75 | N/A | ||||||||||||||||||
| Martin H. Waldinger 151 Detroit Street Denver, CO 80206 DOB: 1938 | Trustee | 9/93-Present | Private Investor and Consultant to California Planned Unit Developments (since 1994). Formerly, CEO and President of Marwal, Inc. (homeowner association management company). | 75 | N/A | ||||||||||||||||||
| Linda S. Wolf 151 Detroit Street Denver, CO 80206 DOB: 1947 | Trustee | 12/05-Present | Retired. Formerly, Chairman and Chief Executive Officer of Leo Burnett (Worldwide) (advertising agency) (2001-2005). | 75 | Director of Wal-Mart, The Field Museum of Natural History (Chicago, IL), Children's Memorial Hospital (Chicago, IL), Chicago Council on Foreign Relations, Economic Club of Chicago, and InnerWorkings (U.S. provider of print procurement solutions). | ||||||||||||||||||
30 Janus Aspen Series December 31, 2007
Officers
| Name, Address and Age | Positions Held with Portfolio | Term of Office* and Length of Time Served | Principal Occupations During the Past Five Years | ||||||||||||
| Andrew Acker 151 Detroit Street Denver, CO 80206 DOB: 1970 | Executive Vice President and Portfolio Manager Janus Aspen Global Life Sciences Portfolio | 5/07-Present | Vice President and Research Analyst for Janus Capital, and Portfolio Manager for other Janus accounts. | ||||||||||||
| Stephanie Grauerholz-Lofton 151 Detroit Street Denver, CO 80206 DOB: 1970 | Chief Legal Counsel and Secretary Vice President | 1/06-Present 3/06-Present | Vice President and Assistant General Counsel of Janus Capital, and Vice President and Assistant Secretary of Janus Distributors LLC. Formerly, Assistant Vice President of Janus Capital and Janus Distributors LLC (2006), and Associate of Vedder, Price, Kaufman & Kammholz, P.C. (1999-2003). | ||||||||||||
| Andrew J. Iseman 151 Detroit Street Denver, CO 80206 DOB: 1964 | President and Chief Executive Officer | 3/07-Present | Chief Operating Officer and Senior Vice President of Janus Capital Group, Inc. and Janus Capital; President of Janus Services LLC; and Director of Capital Group Partners, Inc. Formerly, Senior Vice President of Enhanced Investment Technologies, LLC (2005-2007); and Vice President of Janus Capital (2003-2005) and Janus Services LLC (2003-2004). | ||||||||||||
| David R. Kowalski 151 Detroit Street Denver, CO 80206 DOB: 1957 | Vice President, Chief Compliance Officer, and Anti-Money Laundering Officer | 6/02-Present | Senior Vice President and Chief Compliance Officer of Janus Capital, Janus Distributors LLC, and Janus Services LLC; Chief Compliance Officer of Bay Isle Financial LLC; and Vice President of Enhanced Investment Technologies, LLC. Formerly, Chief Compliance Officer of Enhanced Investment Technologies, LLC (2003-2005); Vice President of Janus Capital (2000-2005) and Janus Services LLC (2004-2005); and Assistant Vice President of Janus Services LLC (2000-2004). | ||||||||||||
| Jesper Nergaard 151 Detroit Street Denver, CO 80206 DOB: 1962 | Chief Financial Officer Vice President, Treasurer, and Principal Accounting Officer | 3/05-Present 2/05-Present | Vice President of Janus Capital. Formerly, Director of Financial Reporting for OppenheimerFunds, Inc. (2004-2005); Site Manager and First Vice President of Mellon Global Securities Services (2003); and Director of Fund Accounting, Project Development, and Training of INVESCO Funds Group (1994-2003). | ||||||||||||
*Officers are elected at least annually by the Trustees for a one-year term and may also be elected from time to time by the Trustees for an interim period.
Janus Aspen Series December 31, 2007 31
Notes
32 Janus Aspen Series December 31, 2007
Notes
Janus Aspen Series December 31, 2007 33
Janus provides access to a wide range of investment disciplines.
Growth
Janus growth portfolios focus on companies believed to be the leaders in their respective industries, with solid management teams, expanding market share, margins and efficiencies.
Core
Janus core portfolios seek investments in more stable and predictable companies. These portfolios look for a strategic combination of steady growth and for certain portfolios, some degree of income.
Risk-Managed
Our risk-managed portfolios seek to outperform their respective indices while maintaining a risk profile equal to or lower than the index itself. Managed by INTECH (a Janus subsidiary), these portfolios use a mathematical process in an attempt to build a more "efficient" portfolio than the index.
Value
Janus value portfolios invest in companies they believe are poised for a turnaround or are trading at a significant discount to fair value. The goal is to gain unique insight into a company's true value and identify and evaluate potential catalysts that may unlock shareholder value.
International & Global
Janus international and global portfolios seek to leverage Janus' research capabilities by taking advantage of inefficiencies in foreign markets, where accurate information and analytical insight are often at a premium.
Bond
Janus bond portfolios attempt to provide less risk relative to equities while seeking to deliver a competitive total return through high current income and appreciation.
Money Market
Janus money market portfolios seek maximum current income consistent with stability of capital.
For more information about our funds, contact your investment professional or go to www.janus.com/info
Please consider the charges, risks, expenses and investment objectives carefully before investing. For a prospectus containing this and other information, please call Janus at 1-800-525-0020 or download the file from www.janus.com/info. Read it carefully before you invest or send money.
An investment in a money market portfolio is not insured or guaranteed by the Federal Deposit Insurance Corporation or any other government agency. Although the Portfolio seeks to preserve the value of your investment at $1.00 per share, it is possible to lose money by investing in the Portfolio.

151 Detroit Street
Denver, CO 80206
1-800-525-0020
Portfolio distributed by Janus Distributors LLC (2/08)
C-0108-357 109-02-713 02-08
2007 Annual Report
Janus Aspen Series
Janus Aspen Global Technology Portfolio
Look Inside. . .
• Portfolio management perspective
• Investment strategy behind your portfolio
• Portfolio performance, characteristics and holdings

Table of Contents
| Useful Information About Your Portfolio Report | 1 | ||||||
| Management Commentary and Schedule of Investments | 2 | ||||||
| Statement of Assets and Liabilities | 11 | ||||||
| Statement of Operations | 12 | ||||||
| Statements of Changes in Net Assets | 13 | ||||||
| Financial Highlights | 14 | ||||||
| Notes to Schedule of Investments | 16 | ||||||
| Notes to Financial Statements | 17 | ||||||
| Report of Independent Registered Public Accounting Firm | 26 | ||||||
| Additional Information | 27 | ||||||
| Explanations of Charts, Tables and Financial Statements | 30 | ||||||
| Designation Requirements | 33 | ||||||
| Trustees and Officers | 34 | ||||||
Please consider the charges, risks, expenses and investment objectives carefully before investing. For a prospectus containing this and other information, please call Janus at 1-800-525-0020 or download the file from www.janus.com/info. Read it carefully before you invest or send money.
Useful Information About Your Portfolio Report
Management Commentary
The Management Commentary in this report includes valuable insight from the Portfolio's manager as well as statistical information to help you understand how your Portfolio's performance and characteristics stack up against those of comparable indices.
Please keep in mind that the opinions expressed by the Portfolio's manager in the Management Commentary are just that: opinions. They are a reflection of the manager's best judgment at the time this report was compiled, which was December 31, 2007. As the investing environment changes, so could the manager's opinions. The views are unique to the manager and aren't necessarily shared by his fellow employees or by Janus in general.
Portfolio Expenses
We believe it's important for our shareholders to have a clear understanding of Portfolio expenses and the impact they have on investment return.
The following is important information regarding the Portfolio's Expense Example, which appears in the Management Commentary within this Annual Report. Please refer to this information when reviewing the Expense Example for the Portfolio.
Example
As a shareholder of a Portfolio, you incur two types of costs: (1) transaction costs, including redemption fees (where applicable) (and any related exchange fees) and (2) ongoing costs, including management fees; distribution and shareholder servicing (12b-1) fees (applicable to Service Shares and Service II Shares only); and other Portfolio expenses. The example is intended to help you understand your ongoing costs (in dollars) of investing in a Portfolio and to compare these costs with the ongoing costs of investing in other mutual funds. To do so, compare this 5% hypothetical example with the 5% hypothetical examples that appear in the shareholder reports of the other funds. The example is based upon an investment of $1,000 invested at the beginning of the period and held for the six-month period from July 1, 2007 to December 31, 2007.
Actual Expenses
The first line of the table in each example provides information about actual account values and actual expenses. You may use the information in this line, together with the amount you invested, to estimate the expenses that you paid over the period. Simply divide your account value by $1,000 (for example, an $8,600 account value divided by $1,000 = 8.6), then multiply the result by the number in the first line under the heading entitled "Expenses Paid During Period" to estimate the expenses you paid on your account during the period.
Hypothetical Example for Comparison Purposes
The second line of the table in each example provides information about hypothetical account values and hypothetical expenses based upon the Portfolio's actual expense ratio and an assumed rate of return of 5% per year before expenses, which is not the Portfolio's actual return. The hypothetical account values and expenses may not be used to estimate the actual ending account balance or expenses you paid for the period. You may use this information to compare the ongoing costs of investing in the Portfolio and other funds. To do so, compare this 5% hypothetical example with the 5% hypothetical examples that appear in the shareholder reports of the other funds.
Janus Capital Management LLC ("Janus Capital") has contractually agreed to waive the Portfolio's total operating expenses, excluding the distribution and shareholder servicing (12b-1) fees applicable to Service Shares and Service II Shares, brokerage commissions, interest, taxes and extraordinary expenses to certain limits until at least May 1, 2009. More information regarding the waivers is available in the Portfolio's prospectus.
Please note that the expenses shown in the tables are meant to highlight your ongoing costs only and do not reflect any transaction costs, such as redemption fees (where applicable) and any charges at the separate account level or contract level. Redemption fees are fully described in the prospectus. Therefore, the second line of each table is useful in comparing ongoing costs only, and will not help you determine the relative total costs of owning different funds. In addition, if these transaction costs and separate account or contract level charges were included, your costs would have been higher.
Janus Aspen Series December 31, 2007 1
Janus Aspen Global Technology Portfolio (unaudited)
Portfolio Snapshot
This portfolio pursues forward-thinking companies around the globe that are advancing the frontiers of technology in profitable ways.

Barney Wilson
portfolio manager
Performance Overview
During the 12 months ended December 31, 2007, Janus Aspen Global Technology Portfolio's Institutional Shares, Service Shares and Service II Shares advanced 22.07%, 21.70% and 21.75% respectively. By comparison, the Portfolio's benchmarks, the Morgan Stanley Capital International (MSCI) World Information Technology IndexSM, and the S&P 500® Index returned 15.10% and 5.49%, respectively.
Investment Strategy
Janus Aspen Global Technology Portfolio's objective is to seek long-term growth of capital. I work closely with the Janus analysts covering technology and technology-related companies to identify high quality and innovative technology companies that are growing earnings and cash flow in excess of market expectations. While investing in the information technology sector can be more volatile than a broader market index, I believe the sector can provide an excellent opportunity for attractive investment returns if one can tolerate the volatility.
Three things are at the core of the Portfolio's investment and portfolio construction philosophy: fundamental research, valuation analysis and diversification. First, in the intensive research that is a hallmark of Janus, we seek out the customers, competitors and suppliers of a company to develop our view of the future fundamental performance of that company. We try to anticipate material changes in industries and to understand which companies are going to win on a multi-year basis in the product marketplace and why. Second, in conducting our valuation analysis, we focus foremost on the value of the future cash flows of the company. When we invest in a company, we believe the value of the company is more than the value of the stock. Third, when constructing the Portfolio, I deliberately seek to control risk by diversifying across multiple dimensions, such as subsectors, geographies, market capitalizations and valuation ranges.
To anticipate changes in foreign currency, I may hedge a portion of the Portfolio's foreign currency exposure. Forward foreign currency exchange contracts may be used to buy and sell currencies in order to fix a price for foreign securities. Please see the "Notes to Financial Statements" for a discussion of derivatives used by the Portfolio.
Contributors to Portfolio Performance
The strongest contributor to the Portfolio's performance was China-based solar technology company JA Solar Holdings, an initial public offering in the first calendar quarter of 2007. Although the company benefited from the market run-up in many solar stocks, I believe JA Solar has a competitive advantage due to its low manufacturing costs compared with U.S. and European solar-cell producers. In the long term, as the use of solar technology increases, I believe cost-competitive and innovative companies like JA Solar will benefit.
Another notable performer was Apple. Apple's performance was boosted by strong earnings and hype surrounding its iPhone, a new product that combines a mobile phone, a wide-screen iPod and the Internet in a small handheld device. In our opinion, the iPhone has certainly helped drive the stock, but the key reasons we own the company are the innovation and ease-of-use in its products. I believe Apple will continue to gain consumer market share.
Research In Motion, the Canadian company that makes the popular BlackBerry handheld device, performed well during the period. We own this company because I believe mobile phones are going to become more complex with more data, music and e-mail capabilities. I think Apple's iPhone will actually increase interest in the BlackBerry and thus the overall market. Although the BlackBerry is especially prevalent in corporate settings, I believe there is still a tremendous amount of market share to gain.
The robust solar market also benefited U.S.-based SunPower Corp, a solar cell manufacturer, which posted strong results during the year. Higher oil prices and the quest for environmentally friendlier forms of energy have been boosting interest in all types of alternative energy, including solar power. Solar power is another prominent theme within the Portfolio.
Detractors from Performance
Wireless provider LM Ericsson, in Sweden, was the largest detractor. It was down 40% in the fourth quarter. The company lowered its earnings and revenue forecasts, due to weaker than expected demand for wireless telecom
2 Janus Aspen Series December 31, 2007
(unaudited)
infrastructure products. I still believe that the company, over the longer term, will benefit from the expected increase in wireless traffic and the corresponding need to spend on infrastructure.
Silicon-On-Insulator Technologies (SOITEC), a French company that manufactures silicon for semiconductor chips for high-end computers, was another detractor. SOITEC's heavy reliance on Advanced Micro Devices and its unsuccessful efforts to get contracts with other companies hurt results. Also, the strong euro relative to the dollar squeezed the company's margins, with euro-cost base and dollar-based revenues. I exited the position during the year.
Akamai Technologies, a content distribution network company that delivers large amounts of content over a broad area for other companies, suffered from increased competition. I believe that the area of content distribution service will continue to grow, as will the outsourcing of Internet services. I feel this industry will eventually consolidate with a handful of players as part of this process, and Akamai and others have been aggressive in pricing to pursue business.
Another detractor was China-based Actions Semiconductor. The company has unsuccessfully attempted to produce more sophisticated, high-end products. As a result, Actions Semiconductor suffered from weakness in semiconductor pricing. Similarly, computer memory chip producer Samsung Electronics was hurt by overall weakness in pricing for DRAM and NAND memory technology. I believe Samsung is the lowest-cost producer and the clear leader in this field. Once prices recover, I feel Samsung is well positioned in memory products, as well as other businesses such as flat panel displays and mobile phones.
Looking Ahead
As mentioned, I am very focused on anticipating change, figuring out which companies are going to win on a multi-year basis in the product marketplace and on finding companies where the price of the stock is below the value of the cash flows of the company. My goal will continue to be to leverage the strong, grassroots research foundation of Janus to uncover what I believe are the best investment opportunities for our shareholders.
Thank you for your investment in Janus Aspen Global Technology Portfolio.
Janus Aspen Series December 31, 2007 3
Janus Aspen Global Technology Portfolio (unaudited)
Janus Aspen Global Technology Portfolio At a Glance
5 Largest Contributors to Performance – Holdings
| Contribution | |||||||
| JA Solar Holdings Company, Ltd. (ADR) | 2.94 | % | |||||
| Apple, Inc. | 2.49 | % | |||||
| Cypress Semiconductor Corp. | 2.10 | % | |||||
| First Solar, Inc. | 2.02 | % | |||||
| SunPower Corp. - Class A | 1.90 | % | |||||
5 Largest Detractors from Performance – Holdings
| Contribution | |||||||
| Telefonaktiebolaget LM Ericsson (ADR) | (0.92 | )% | |||||
| Silicon-On-Insulator Technologies (SOITEC) | (0.84 | )% | |||||
| Akamai Technologies, Inc. | (0.60 | )% | |||||
| SAVVIS, Inc. | (0.58 | )% | |||||
| KLA-Tencor Corp. | (0.54 | )% | |||||
5 Largest Contributors to Performance – Sectors
| Portfolio Weighting | S&P 500® | ||||||||||||||
| Portfolio Contribution | (% of Net Assets) | Index Weighting | |||||||||||||
| Information Technology | 11.71 | % | 74.85 | % | 15.69 | % | |||||||||
| Industrials | 10.01 | % | 8.10 | % | 11.22 | % | |||||||||
| Consumer Discretionary | 1.84 | % | 10.82 | % | 9.92 | % | |||||||||
| Materials | 0.48 | % | 1.47 | % | 3.13 | % | |||||||||
| Telecommunication Services | 0.41 | % | 2.82 | % | 3.64 | % | |||||||||
5 Lowest Contributors/Detractors to Performance – Sectors
| Portfolio Weighting | S&P 500® | ||||||||||||||
| Portfolio Contribution | (% of Net Assets) | Index Weighting | |||||||||||||
| Other* | (0.26 | )% | 0.06 | % | 0.00 | % | |||||||||
| Utilities | 0.00 | % | 0.00 | % | 3.54 | % | |||||||||
| Financials | 0.00 | % | 0.00 | % | 20.57 | % | |||||||||
| Energy | 0.00 | % | 0.00 | % | 10.82 | % | |||||||||
| Consumer Staples | 0.00 | % | 0.00 | % | 9.52 | % | |||||||||
*Industry not classified by Global Classification Standard
4 Janus Aspen Series December 31, 2007
(unaudited)
5 Largest Equity Holdings – (% of Net Assets)
As of December 31, 2007
| KLA-Tencor Corp. Semiconductor Equipment | 3.8 | % | |||||
| Corning, Inc. Telecommunication Equipment - Fiber Optics | 3.6 | % | |||||
| JA Solar Holdings Company, Ltd. (ADR) Energy - Alternate Sources | 3.1 | % | |||||
| Sony Corp. Audio and Video Products | 2.7 | % | |||||
| ARM Holdings PLC Electronic Components - Semiconductors | 2.4 | % | |||||
| 15.6 | % | ||||||
Asset Allocation – (% of Net Assets)
As of December 31, 2007
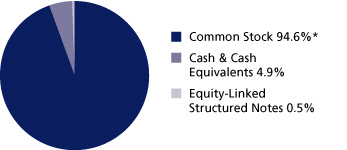
Emerging markets comprised 16.9% of total net assets.
* Includes Securities Sold Short of (0.4)%
Top Country Allocations – Long Positions (% of Investment Securities)
| As of December 31, 2007 | As of December 31, 2006 | ||||||
 | 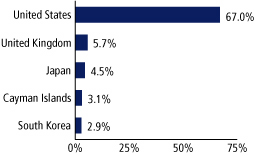 | ||||||
Janus Aspen Series December 31, 2007 5
Janus Aspen Global Technology Portfolio (unaudited)
Performance
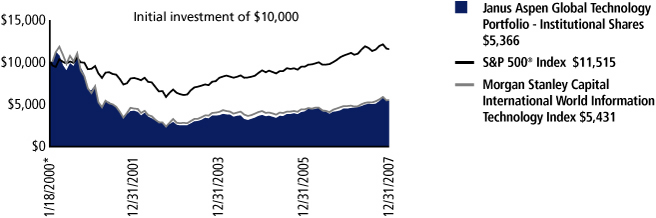
| Average Annual Total Return – for the periods ended December 31, 2007 | Expense Ratios – for the fiscal year ended December 31, 2006 | ||||||||||||||||||||||
| One Year | Five Year | Since Inception* | Total Annual Fund Operating Expenses | Net Annual Fund Operating Expenses | |||||||||||||||||||
| Janus Aspen Global Technology Portfolio - Institutional Shares | 22.07 | % | 16.89 | % | (7.53 | )% | 0.85 | % | 0.85 | %(a) | |||||||||||||
| Janus Aspen Global Technology Portfolio - Service Shares | 21.70 | % | 16.61 | % | (7.76 | )% | 1.10 | % | 1.10 | %(b) | |||||||||||||
| Janus Aspen Global Technology Portfolio - Service II Shares | 21.75 | % | 16.77 | % | (7.76 | )% | 1.10 | % | 1.10 | %(c) | |||||||||||||
| S&P 500® Index | 5.49 | % | 12.83 | % | 1.79 | % | |||||||||||||||||
| Morgan Stanley Capital International World Information Technology Index | 15.10 | % | 14.91 | % | (7.42 | )%** | |||||||||||||||||
| Lipper Quartile - Institutional Shares | 1 | st | 2 | nd | 3 | rd | |||||||||||||||||
| Lipper Ranking - Institutional Shares based on total returns for Variable Annuity Science and Technology Funds | 12/57 | 23/52 | 10/15 | ||||||||||||||||||||
Visit janus.com/info to view up-to-date
performance and characteristic information
Data presented reflects past performance, which is no guarantee of future results. Investment results and principal value will fluctuate so that shares, when redeemed, may be worth more or less than their original cost. Due to market volatility, current performance may be higher or lower than the performance shown. Call 877.33JANUS or visit www.janus.com/info for performance current to the most recent month-end.
For Service II Shares, a 1% redemption fee may be imposed on shares held for 60 days or less. Performance shown does not reflect this redemption fee and, if reflected, performance would have been lower.
(a)At December 31, 2006, Janus Capital has contractually agreed to waive the Portfolio's total operating expenses (excluding brokerage commissions, interest, taxes, and extraordinary expenses) to a certain limit until at least May 1, 2008. The net annual fund operating expense shown reflects the application of such limit and is detailed in the Statement of Additional Information. Returns shown include fee waivers, if any, and without such waivers returns would have been lower.
(b)At December 31, 2006, Janus Capital has contractually agreed to waive the Portfolio's total operating expenses (excluding the distribution and shareholder servicing fee, brokerage commissions, interest, taxes, and extraordinary expenses) to a certain limit until at least May 1, 2008. The net annual fund operating expense shown reflects the application of such limit and is detailed in the Statement of Additional Information. Returns shown include fee waivers, if any, and without such waivers returns would have been lower.
(c)At December 31, 2006, Janus Capital has contractually agreed to waive the Portfolio's total operating expenses (excluding the distribution and shareholder servicing fee, brokerage commissions, interest, taxes, and extraordinary expenses) to a certain limit until at least May 1, 2008. The net annual fund operating expense shown reflects the application of such limit and is detailed in the Statement of Additional Information. Returns shown include fee waivers, if any, and without such waivers returns would have been lower.
The Portfolio's expense ratios were determined based on average net assets as of the fiscal year ended December 31, 2006. Detailed information is available in the prospectus. Contractual waivers agreed to by Janus Capital are included under "Net Annual Fund Operating Expenses." All expenses are shown without the effect of expense offset arrangements. Pursuant to such arrangements, credits realized as a result of uninvested cash balances are used to reduce custodian and transfer agent expenses.
The Portfolio's total operating expenses did not exceed the expense limit so no waivers were in effect for the fiscal year ended December 31, 2006.
6 Janus Aspen Series December 31, 2007
(unaudited)
Portfolio Expenses
The example below shows you the ongoing costs (in dollars) of investing in your Portfolio and allows you to compare these costs with those of other mutual funds. Please refer to the section Useful Information About Your Portfolio Report for a detailed explanation of the information presented in these charts.
| Expense Example - Institutional Shares | Beginning Account Value (7/1/07) | Ending Account Value (12/31/07) | Expenses Paid During Period (7/1/07-12/31/07)(1) | ||||||||||||
| Actual | $ | 1,000.00 | $ | 1077.30 | $ | 4.29 | |||||||||
| Hypothetical (5% return before expenses) | $ | 1,000.00 | $ | 1,021.07 | $ | 4.18 | |||||||||
| Expense Example - Service Shares | Beginning Account Value (7/1/07) | Ending Account Value (12/31/07) | Expenses Paid During Period (7/1/07-12/31/07)(1) | ||||||||||||
| Actual | $ | 1,000.00 | $ | 1,075.90 | $ | 5.60 | |||||||||
| Hypothetical (5% return before expenses) | $ | 1,000.00 | $ | 1,019.81 | $ | 5.45 | |||||||||
| Expense Example - Service II Shares | Beginning Account Value (7/1/07) | Ending Account Value (12/31/07) | Expenses Paid During Period (7/1/07-12/31/07)(1) | ||||||||||||
| Actual | $ | 1,000.00 | $ | 1,076.50 | $ | 5.60 | |||||||||
| Hypothetical (5% return before expenses) | $ | 1,000.00 | $ | 1,019.81 | $ | 5.45 | |||||||||
(1) Expenses are equal to the annualized expense ratio of 0.82% for Institutional Shares, 1.07% for Service Shares and 1.07% for Service II Shares multiplied by the average account value over the period, multiplied by 184/365 (to reflect the one-half year period). Expenses include the effect of contractual waivers by Janus Capital.
The Portfolio's performance may be affected by risks that include those associated with investments in specific industries or countries. Additional risks to the Portfolio may include those associated with investing in foreign securities, emerging markets, initial public offerings ("IPOs") and derivatives. Please see a Janus prospectus or www.janus.com/info for more information about risks, portfolio holdings and other details.
The use of short sales may cause the Portfolio to have higher expenses than those of other equity funds. Short sales are speculative transactions and involve special risks, including a greater reliance on the investment team's ability to accurately anticipate the future value of a security. The Portfolio's losses are potentially unlimited in a short sale transaction. The Portfolio's use of short sales in effect leverages the Portfolio's portfolio. The Portfolio's use of leverage may result in risks and can magnify the effect of any losses. There is no assurance that a leveraging strategy will be successful.
The Portfolio may at times have significant exposure to certain industry groups, which may react similarly to market developments (resulting in greater price volatility). The Portfolio also may have significant exposure to foreign markets (which include risks such as currency fluctuation and political uncertainty).
These returns do not reflect the charges and expenses of any particular insurance product or qualified plan. Returns shown would have been lower had they included insurance charges.
Returns include reinvestment of dividends from net investment income and distributions from capital gains. The returns shown do not reflect the deduction of taxes that a shareholder would pay on Portfolio distributions or the redemption of Portfolio shares.
Returns shown for Service II Shares for periods prior to December 31, 2001 are derived from the historical performance of Institutional Shares, adjusted to reflect the higher operating expenses of Service II Shares.
Net dividends reinvested are the dividends that remain to be reinvested after foreign tax obligations have been met. Such obligations vary from country to country.
Lipper, a wholly-owned subsidiary of Reuters, provides independent insight on global collective investments including mutual funds, retirement funds, hedge funds, fund fees and expenses to the asset management and media communities. Lipper ranks the performance of mutual funds within a classification of funds that have similar investment objectives. Rankings are historical with capital gains and dividends reinvested and do not include the effect of sales loads.
Lipper ranking is for the Institutional Share class only; other classes may have different performance characteristics.
January 31, 2000 is the date used to calculate the since-inception Lipper ranking, which is slightly different from when the Portfolio began operations since Lipper provides fund rankings as of the last day of the month.
If an expense waiver was in effect, it may have had a material effect on the total return or yield, and therefore the ranking for the period.
There is no assurance that the investment process will consistently lead to successful investing.
The Portfolio will invest at least 80% of its net assets in the type of securities described by its name.
Effective May 1, 2007, Barney H. Wilson is the sole Portfolio Manager of Janus Aspen Global Technology Portfolio.
See Notes to Schedule of Investments for index definitions.
The Portfolio may differ significantly from the securities held in the indices. The indices are unmanaged and not available for direct investment; therefore their performance does not reflect the expenses associated with the active management of an actual Portfolio.
See "Explanations of Charts, Tables and Financial Statements."
* The Portfolio's inception date – January 18, 2000
** The Morgan Stanley Capital International World Information Technology Index since inception returns are calculated from January 31, 2000.
Janus Aspen Series December 31, 2007 7
Janus Aspen Global Technology Portfolio
Schedule of Investments
As of December 31, 2007
| Shares/Principal/Contract Amounts | Value | ||||||||||
| Common Stock - 95.0% | |||||||||||
| Advertising Sales - 0.7% | |||||||||||
| 23,110 | Lamar Advertising Co. - Class A* | $ | 1,110,898 | ||||||||
| Aerospace and Defense - 0.6% | |||||||||||
| 101,598 | BAE Systems PLC** | 1,007,062 | |||||||||
| Aerospace and Defense - Equipment - 1.2% | |||||||||||
| 17,310 | Alliant Techsystems, Inc.* | 1,969,186 | |||||||||
| Applications Software - 5.5% | |||||||||||
| 46,045 | Infosys Technologies, Ltd. | 2,067,877 | |||||||||
| 48,765 | Microsoft Corp. | 1,736,034 | |||||||||
| 114,680 | Red Hat, Inc.* | 2,389,931 | |||||||||
| 258,100 | Satyam Computer Services, Ltd. | 2,960,193 | |||||||||
| 9,154,035 | |||||||||||
| Audio and Video Products - 2.7% | |||||||||||
| 83,200 | Sony Corp.** | 4,565,978 | |||||||||
| Batteries and Battery Systems - 2.1% | |||||||||||
| 307,465 | BYD Company, Ltd. | 2,034,808 | |||||||||
| 776,000 | BYD Electronic Company, Ltd.* | 1,502,854 | |||||||||
| 3,537,662 | |||||||||||
| Casino Services - 0.5% | |||||||||||
| 20,685 | International Game Technology | 908,692 | |||||||||
| Chemicals - Diversified - 1.7% | |||||||||||
| 18,800 | Shin-Etsu Chemical Company, Ltd.** | 1,190,220 | |||||||||
| 5,764 | Wacker Chemie A.G.** | 1,647,920 | |||||||||
| 2,838,140 | |||||||||||
| Computer Software - 0.3% | |||||||||||
| 15,000 | Omniture, Inc.*,# | 499,350 | |||||||||
| Computers - 6.5% | |||||||||||
| 15,785 | Apple, Inc.*,** | 3,126,693 | |||||||||
| 65,860 | Dell, Inc.* | 1,614,229 | |||||||||
| 67,040 | Hewlett-Packard Co.** | 3,384,179 | |||||||||
| 23,890 | Research In Motion, Ltd. (U.S. Shares)** | 2,709,126 | |||||||||
| 10,834,227 | |||||||||||
| Computers - Peripheral Equipment - 1.4% | |||||||||||
| 62,128 | Logitech International S.A.* | 2,271,446 | |||||||||
| Consulting Services - 0.7% | |||||||||||
| 73,210 | Genpact, Ltd.*,# | 1,114,988 | |||||||||
| Data Processing and Management - 0.5% | |||||||||||
| 21,295 | Paychex, Inc. | 771,305 | |||||||||
| Decision Support Software - 0.5% | |||||||||||
| 45,190 | DemandTec, Inc.* | 871,715 | |||||||||
| E-Commerce/Services - 0.4% | |||||||||||
| 206,500 | Alibaba.com Corp.*,# | 732,307 | |||||||||
| Electric Products - Miscellaneous - 2.1% | |||||||||||
| 191,000 | Sharp Corp.*,** | 3,458,008 | |||||||||
| Electronic Components - Miscellaneous - 2.8% | |||||||||||
| 384,336 | Hon Hai Precision Industry Company, Ltd.** | 2,394,248 | |||||||||
| 54,258 | Koninklijke (Royal) Philips Electronics N.V.** | 2,341,524 | |||||||||
| 4,735,772 | |||||||||||
| Electronic Components - Semiconductors - 8.9% | |||||||||||
| 1,614,057 | ARM Holdings PLC** | 3,983,659 | |||||||||
| 49,930 | IPG Photonics Corp.* | 998,101 | |||||||||
| 27,300 | MediaTek, Inc.** | 354,447 | |||||||||
| 47,795 | Microchip Technology, Inc. | 1,501,719 | |||||||||
| 91,455 | Microsemi Corp.*,# | 2,024,814 | |||||||||
| Shares/Principal/Contract Amounts | Value | ||||||||||
| Electronic Components - Semiconductors - (continued) | |||||||||||
| 142,424 | MIPS Technologies, Inc.*,# | $ | 706,423 | ||||||||
| 5,388 | Samsung Electronics Company, Ltd.** | 3,186,271 | |||||||||
| 80,730 | SiRF Technology Holdings, Inc.*,**,# | 2,028,745 | |||||||||
| 24,100 | Spreadtrum Communications, Inc. (ADR)*,# | 295,466 | |||||||||
| 15,079,645 | |||||||||||
| Electronic Connectors - 0.9% | |||||||||||
| 32,550 | Amphenol Corp. - Class A | 1,509,344 | |||||||||
| Electronic Measuring Instruments - 1.8% | |||||||||||
| 48,540 | Memsic, Inc.* | 491,710 | |||||||||
| 83,980 | Trimble Navigation, Ltd.* | 2,539,555 | |||||||||
| 3,031,265 | |||||||||||
| Energy - Alternate Sources - 6.2% | |||||||||||
| 22,660 | Comverge, Inc.*,# | 713,563 | |||||||||
| 3,905 | First Solar, Inc.* | 1,043,182 | |||||||||
| 124,000 | Gintech Energy Corp.** | 1,219,885 | |||||||||
| 73,505 | JA Solar Holdings Company, Ltd. (ADR)* | 5,131,384 | |||||||||
| 10,190 | SunPower Corp. - Class A*,**,# | 1,328,674 | |||||||||
| 11,305 | Suntech Power Holdings Company, Ltd. (ADR)* | 930,628 | |||||||||
| 10,367,316 | |||||||||||
| Engineering - Research and Development Services - 0.8% | |||||||||||
| 45,012 | ABB, Ltd. | 1,306,541 | |||||||||
| Enterprise Software/Services - 2.6% | |||||||||||
| 19,830 | Concur Technologies, Inc. | 718,044 | |||||||||
| 139,705 | Oracle Corp.* | 3,154,539 | |||||||||
| 16,100 | Taleo Corp.* | 479,458 | |||||||||
| 4,352,041 | |||||||||||
| Entertainment Software - 1.8% | |||||||||||
| 51,100 | Electronic Arts, Inc.* | �� | 2,984,751 | ||||||||
| E-Services/Consulting - 1.0% | |||||||||||
| 110,340 | RightNow Technologies, Inc.*,# | 1,748,889 | |||||||||
| Human Resources - 0.5% | |||||||||||
| 22,305 | Kenexa Corp.* | 433,163 | |||||||||
| 32,245 | SuccessFactors, Inc.*,# | 381,136 | |||||||||
| 814,299 | |||||||||||
| Internet Applications Software - 1.3% | |||||||||||
| 38,835 | DealerTrack Holdings, Inc.* | 1,299,807 | |||||||||
| 23,900 | Vocus, Inc.* | 825,267 | |||||||||
| 2,125,074 | |||||||||||
| Internet Connectivity Services - 1.7% | |||||||||||
| 46,730 | NDS Group PLC (ADR)** | 2,768,285 | |||||||||
| Internet Security - 0.4% | |||||||||||
| 41,985 | Symantec Corp.* | 677,638 | |||||||||
| Machinery - General Industrial - 0.8% | |||||||||||
| 1,552,000 | Shanghai Electric Group Company, Ltd. | 1,313,753 | |||||||||
| Medical - Biomedical and Genetic - 0.8% | |||||||||||
| 30,225 | Celgene Corp.* | 1,396,697 | |||||||||
| Medical - Drugs - 1.9% | |||||||||||
| 14,325 | Merck & Company, Inc. | 832,426 | |||||||||
| 4,835 | Roche Holding A.G. | 834,927 | |||||||||
| 22,630 | Shire PLC (ADR)** | 1,560,339 | |||||||||
| 3,227,692 | |||||||||||
| Networking Products - 1.6% | |||||||||||
| 99,420 | Cisco Systems, Inc.* | 2,691,299 | |||||||||
See Notes to Schedule of Investments and Financial Statements.
8 Janus Aspen Series December 31, 2007
Schedule of Investments
As of December 31, 2007
| Shares/Principal/Contract Amounts | Value | ||||||||||
| Power Converters and Power Supply Equipment - 2.0% | |||||||||||
| 63,390 | Advanced Energy Industries, Inc.* | $ | 829,141 | ||||||||
| 36,000 | China High Speed Transmission Equipment Group Company, Ltd.* | 96,038 | |||||||||
| 22,012 | Suzlon Energy, Ltd. | 1,081,777 | |||||||||
| 11,843 | Vestas Wind Systems A.S.* | 1,278,346 | |||||||||
| 3,285,302 | |||||||||||
| Retail - Consumer Electronics - 1.9% | |||||||||||
| 29,375 | Best Buy Company, Inc.# | 1,546,594 | |||||||||
| 14,850 | Yamada Denki Company, Ltd.** | 1,707,223 | |||||||||
| 3,253,817 | |||||||||||
| Semiconductor Components/Integrated Circuits - 6.3% | |||||||||||
| 152,635 | Actions Semiconductor Company, Ltd. (ADR)* | 622,751 | |||||||||
| 363,190 | Atmel Corp.* | 1,568,981 | |||||||||
| 68,460 | Cypress Semiconductor Corp.* | 2,466,614 | |||||||||
| 136,980 | Marvell Technology Group, Ltd.* | 1,914,980 | |||||||||
| 595,522 | Siliconware Precision Industries Co.** | 1,070,713 | |||||||||
| 1,560,562 | Taiwan Semiconductor Manufacturing Company, Ltd.** | 2,983,866 | |||||||||
| 10,627,905 | |||||||||||
| Semiconductor Equipment - 5.7% | |||||||||||
| 102,010 | ASML Holdings N.V. (U.S. Shares)*,** | 3,191,893 | |||||||||
| 133,275 | KLA-Tencor Corp. | 6,418,524 | |||||||||
| 9,610,417 | |||||||||||
| Telecommunication Equipment - 1.4% | |||||||||||
| 167,170 | Arris Group, Inc.* | 1,668,357 | |||||||||
| 13,490 | CommScope, Inc.* | 663,843 | |||||||||
| 2,332,200 | |||||||||||
| Telecommunication Equipment - Fiber Optics - 3.6% | |||||||||||
| 251,495 | Corning, Inc.** | 6,033,365 | |||||||||
| Telecommunication Services - 4.7% | |||||||||||
| 91,445 | Amdocs, Ltd. (U.S. Shares)*,** | 3,152,109 | |||||||||
| 75,135 | NeuStar, Inc. - Class A* | 2,154,872 | |||||||||
| 94,040 | SAVVIS, Inc.* | 2,624,656 | |||||||||
| 7,931,637 | |||||||||||
| Television - 0.6% | |||||||||||
| 87,469 | British Sky Broadcasting Group PLC** | 1,077,672 | |||||||||
| Web Hosting/Design - 1.0% | |||||||||||
| 8,095 | Equinix, Inc.*,# | 818,162 | |||||||||
| 130,265 | Terremark Worldwide, Inc.*,# | 846,722 | |||||||||
| 1,664,884 | |||||||||||
| Web Portals/Internet Service Providers - 1.2% | |||||||||||
| 1,905 | Google, Inc. - Class A* | 1,317,269 | |||||||||
| 28,400 | Yahoo!, Inc.* | 660,584 | |||||||||
| 1,977,853 | |||||||||||
| Wireless Equipment - 3.4% | |||||||||||
| 77,015 | Crown Castle International Corp.* | 3,203,824 | |||||||||
| 20,745 | QUALCOMM, Inc. | 816,316 | |||||||||
| 73,155 | Telefonaktiebolaget LM Ericsson (ADR) | 1,708,169 | |||||||||
| 5,728,309 | |||||||||||
| Total Common Stock (cost $125,098,318) | 159,298,661 | ||||||||||
| Equity-Linked Structured Notes - 0.5% | |||||||||||
| Finance - Investment Bankers/Brokers - 0.5% | |||||||||||
| 25,960 | Goldman Sachs, Inc., convertible (Omniture, Inc.), 0% (144A)§ (cost $742,456) | 794,039 | |||||||||
| Shares/Principal/Contract Amounts | Value | ||||||||||
| Money Markets - 5.4% | |||||||||||
| $ | 9,047,008 | Janus Institutional Cash Management Fund - Institutional Shares, 4.98% (cost $9,047,008) | $ | 9,047,008 | |||||||
| Purchased Options - Puts - 0% | |||||||||||
| 136 | NASDAQ-100 Shares Trust expires January 2008 exercise price $49.00 (premiums paid $15,368) | 5,440 | |||||||||
| Other Securities - 4.7% | |||||||||||
| 5,565,280 | Allianz Dresdner Daily Asset Fund† | 5,565,280 | |||||||||
| 1,311,519 | Repurchase Agreements† | 1,311,519 | |||||||||
| 1,008,393 | Time Deposits† | 1,008,393 | |||||||||
| Total Other Securities (cost $7,885,192) | 7,885,192 | ||||||||||
| Total Investments (total cost $142,788,342) – 105.6% | 177,030,340 | ||||||||||
| Securities Sold Short - (0.4)% | |||||||||||
| Electronic Components - Semiconductors - (0.1)% | |||||||||||
| 10,080 | OmniVision Technologies, Inc.* | (157,752 | ) | ||||||||
| Investment Companies - (0.3)% | |||||||||||
| 11,425 | PowerShares QQQ | (585,188 | ) | ||||||||
| Total Securities Sold Short (proceeds $719,441) | (742,940 | ) | |||||||||
| Liabilities, net of Cash, Receivables and Other Assets – (5.2)% | (8,639,753 | ) | |||||||||
| Net Assets – 100% | $ | 167,647,647 | |||||||||
Summary of Investments by Country – (Long Positions)
| Country | Value | % of Investment Securities | |||||||||
| Bermuda | $ | 3,029,968 | 1.7 | % | |||||||
| Canada | 2,709,126 | 1.5 | % | ||||||||
| Cayman Islands | 1,553,379 | 0.9 | % | ||||||||
| China | 11,010,572 | 6.2 | % | ||||||||
| Denmark | 1,278,346 | 0.7 | % | ||||||||
| Germany | 1,647,920 | 0.9 | % | ||||||||
| Hong Kong | 96,038 | 0.1 | % | ||||||||
| India | 6,109,847 | 3.5 | % | ||||||||
| Japan | 10,921,429 | 6.2 | % | ||||||||
| Netherlands | 5,533,417 | 3.1 | % | ||||||||
| South Korea | 3,186,271 | 1.8 | % | ||||||||
| Sweden | 1,708,169 | 1.0 | % | ||||||||
| Switzerland | 4,412,914 | 2.5 | % | ||||||||
| Taiwan | 8,023,159 | 4.5 | % | ||||||||
| United Kingdom | 13,549,126 | 7.6 | % | ||||||||
| United States†† | 102,260,659 | 57.8 | % | ||||||||
| Total | $ | 177,030,340 | 100.0 | % | |||||||
††Includes Short-Term Securities and Other Securities (48.2% excluding Short-Term Securities and Other Securities)
Summary of Investments by Country – (Short Positions)
| Country | Value | % of Securities Sold Short | |||||||||
| United States | $ | (742,940 | ) | 100.0 | % | ||||||
| Total | $ | (742,940 | ) | 100.0 | % | ||||||
See Notes to Schedule of Investments and Financial Statements.
Janus Aspen Series December 31, 2007 9
Janus Aspen Global Technology Portfolio
Schedule of Investments
As of December 31, 2007
Forward Currency Contracts, Open
| Currency Sold and Settlement Date | Currency Units Sold | Currency Value in U.S.$ | Unrealized Gain/(Loss) | ||||||||||||
| British Pound 5/14/08 | 1,498,000 | $ | 2,969,696 | $ | 58,594 | ||||||||||
| Euro 5/2/08 | 1,650,000 | 2,413,410 | 36,510 | ||||||||||||
| Japanese Yen 5/2/08 | 137,000,000 | 1,242,455 | 39,596 | ||||||||||||
| South Korean Won 5/14/08 | 1,270,000,000 | 1,371,120 | 21,195 | ||||||||||||
| Taiwan Dollar 5/14/08 | 35,000,000 | 1,097,402 | (7,060 | ) | |||||||||||
| Total | $ | 9,094,083 | $ | 148,835 | |||||||||||
| Value | |||||||
| Schedule of Written Options - Calls | |||||||
| Apple, Inc. expires April 2008 32 contracts exercise price $175.00 | $ | (114,400 | ) | ||||
| Research In Motion, Ltd. expires March 2008 51 contracts exercise price $115.00 | (57,630 | ) | |||||
| Sunpower Corp. expires March 2008 59 contracts exercise price $95.00 | (237,180 | ) | |||||
| Total Written Options - Calls (Premiums received $136,364) | $ | (409,210 | ) | ||||
See Notes to Schedule of Investments and Financial Statements.
10 Janus Aspen Series December 31, 2007
Statement of Assets and Liabilities
| As of December 31, 2007 (all numbers in thousands except net asset value per share) | Janus Aspen Global Technology Portfolio | ||||||
| Assets: | |||||||
| Investments at cost(1) | $ | 142,788 | |||||
| Investments at value(1) | $ | 167,983 | |||||
| Affiliated money market investments | 9,047 | ||||||
| Cash denominated in foreign currency (cost $354) | 354 | ||||||
| Deposits with broker for short sales | 719 | ||||||
| Receivables: | |||||||
| Portfolio shares sold | 65 | ||||||
| Dividends | 12 | ||||||
| Interest | 37 | ||||||
| Non-interested Trustees' deferred compensation | 3 | ||||||
| Other assets | 2 | ||||||
| Forward currency contracts | 156 | ||||||
| Total Assets | 178,378 | ||||||
| Liabilities: | |||||||
| Payables: | |||||||
| Short sales, at value (proceeds $719) | 743 | ||||||
| Options written, at value (premiums received of $136) | 409 | ||||||
| Collateral for securities loaned (Note 1) | 7,885 | ||||||
| Due to custodian | 267 | ||||||
| Investments purchased | 739 | ||||||
| Portfolio shares repurchased | 256 | ||||||
| Advisory fees | 91 | ||||||
| Transfer agent fees and expenses | 1 | ||||||
| Distribution fees - Service Shares | 29 | ||||||
| Distribution fees - Service II Shares | 6 | ||||||
| Legal fees | 5 | ||||||
| Non-interested Trustees' fees and expenses | 2 | ||||||
| Short sales dividend | 1 | ||||||
| Non-interested Trustees' deferred compensation fees | 3 | ||||||
| Accrued expenses | 286 | ||||||
| Forward currency contracts | 7 | ||||||
| Total Liabilities | 10,730 | ||||||
| Net Assets | $ | 167,648 | |||||
| Net Assets Consist of: | |||||||
| Capital (par value and paid-in-surplus)* | $ | 523,444 | |||||
| Undistributed net investment income/(loss)* | 112 | ||||||
| Undistributed net realized gain/(loss) from investments and foreign currency transactions* | (390,003 | ) | |||||
| Unrealized appreciation/(depreciation) of investments, foreign currency translations and non-interested Trustees' deferred compensation | 34,095 | ||||||
| Total Net Assets | $ | 167,648 | |||||
| Net Assets - Institutional Shares | $ | 4,093 | |||||
| Shares Outstanding, $0.001 Par Value (unlimited shares authorized) | 815 | ||||||
| Net Asset Value Per Share | $ | 5.02 | |||||
| Net Assets - Service Shares | $ | 137,367 | |||||
| Shares Outstanding, $0.001 Par Value (unlimited shares authorized) | 26,534 | ||||||
| Net Asset Value Per Share | $ | 5.18 | |||||
| Net Assets - Service II Shares | $ | 26,188 | |||||
| Shares Outstanding, $0.001 Par Value (unlimited shares authorized) | 4,962 | ||||||
| Net Asset Value Per Share | $ | 5.28 | |||||
* See Note 3 in Notes to Financial Statements.
(1) Investments at cost and value include $7,612,450 of securities loaned (Note 1).
See Notes to Financial Statements.
Janus Aspen Series December 31, 2007 11
Statement of Operations
| For the fiscal year ended December 31, 2007 (all numbers in thousands) | Janus Aspen Global Technology Portfolio | ||||||
| Investment Income: | |||||||
| Interest | $ | 9 | |||||
| Securities lending income | 89 | ||||||
| Dividends | 2,149 | ||||||
| Dividends from affiliates | 250 | ||||||
| Foreign tax withheld | (130 | ) | |||||
| Total Investment Income | 2,367 | ||||||
| Expenses: | |||||||
| Advisory fees | 1,032 | ||||||
| Transfer agent fees and expenses | 6 | ||||||
| Registration fees | 2 | ||||||
| Custodian fees | 45 | ||||||
| Professional fees | 12 | ||||||
| Non-interested Trustees' fees and expenses | 8 | ||||||
| Distribution fees - Service Shares | 333 | ||||||
| Distribution fees - Service II Shares | 64 | ||||||
| Printing expenses | 164 | ||||||
| Short sales dividend expense | 1 | ||||||
| Other expenses | 58 | ||||||
| Non-recurring costs (Note 2) | – | ||||||
| Costs assumed by Janus Capital Management LLC (Note 2) | – | ||||||
| Total Expenses | 1,725 | ||||||
| Expense and Fee Offset | (1 | ) | |||||
| Net Expenses | 1,724 | ||||||
| Net Investment Income/(Loss) | 643 | ||||||
| Net Realized and Unrealized Gain/(Loss) on Investments: | |||||||
| Net realized gain/(loss) from investments and foreign currency transactions | 29,604 | ||||||
| Net realized gain/(loss) from short sales | (315 | ) | |||||
| Net realized gain/(loss) from options contracts | (1,439 | ) | |||||
| Change in net appreciation/(depreciation) of investments, foreign currency translations and non-interested Trustees' deferred compensation | 2,995 | ||||||
| Payment from affiliate (Note 2) | – | ||||||
| Net Gain/(Loss) on Investments | 30,845 | ||||||
| Net Increase/(Decrease) in Net Assets Resulting from Operations | $ | 31,488 | |||||
See Notes to Financial Statements.
12 Janus Aspen Series December 31, 2007
Statements of Changes in Net Assets
| For the fiscal years ended December 31, 2007 | Janus Aspen Global Technology Portfolio | ||||||||||
| (all numbers in thousands) | 2007 | 2006 | |||||||||
| Operations: | |||||||||||
| Net investment income/(loss) | $ | 643 | $ | (194 | ) | ||||||
| Net realized gain/(loss) from investments and foreign currency transactions | 29,604 | 25,814 | |||||||||
| Net realized gain/(loss) from short sales | (315 | ) | – | ||||||||
| Net realized gain/(loss) from option contracts | (1,439 | ) | 40 | ||||||||
| Change in net appreciation/(depreciation) of investments, foreign currency translations and non-interested Trustees' deferred compensation | 2,995 | (13,627 | ) | ||||||||
| Payment from affiliate (Note 2) | – | – | |||||||||
| Net Increase/(Decrease) in Net Assets Resulting from Operations | 31,488 | 12,033 | |||||||||
| Dividends and Distributions to Shareholders: | |||||||||||
| Net investment income* | |||||||||||
| Institutional Shares | (17 | ) | – | ||||||||
| Service Shares | (438 | ) | – | ||||||||
| Service II Shares | (81 | ) | – | ||||||||
| Net realized gain/(loss) from investment transactions* | |||||||||||
| Institutional Shares | – | – | |||||||||
| Service Shares | – | – | |||||||||
| Service II Shares | – | – | |||||||||
| Net Decrease from Dividends and Distributions | (536 | ) | – | ||||||||
| Capital Share Transactions: | |||||||||||
| Shares sold | |||||||||||
| Institutional Shares | 2,095 | 555 | |||||||||
| Service Shares | 16,722 | 15,099 | |||||||||
| Service II Shares | 4,273 | 4,128 | |||||||||
| Redemption fees | |||||||||||
| Service II Shares | 8 | 15 | |||||||||
| Reinvested dividends and distributions | |||||||||||
| Institutional Shares | 17 | – | |||||||||
| Service Shares | 438 | – | |||||||||
| Service II Shares | 81 | – | |||||||||
| Shares repurchased | |||||||||||
| Institutional Shares | (1,279 | ) | (1,075 | ) | |||||||
| Service Shares | (37,603 | ) | (30,917 | ) | |||||||
| Service II Shares | (7,878 | ) | (7,059 | ) | |||||||
| Net Increase/(Decrease) from Capital Share Transactions | (23,126 | ) | (19,254 | ) | |||||||
| Net Increase/(Decrease) in Net Assets | 7,826 | (7,221 | ) | ||||||||
| Net Assets: | |||||||||||
| Beginning of period | 159,822 | 167,043 | |||||||||
| End of period | $ | 167,648 | $ | 159,822 | |||||||
| Undistributed net investment income/(loss)* | $ | 112 | $ | (1 | ) | ||||||
* See Note 3 in Notes to Financial Statements.
See Notes to Financial Statements.
Janus Aspen Series December 31, 2007 13
Financial Highlights
Institutional Shares
| For a share outstanding during | Janus Aspen Global Technology Portfolio | ||||||||||||||||||||||
| each fiscal year ended December 31 | 2007 | 2006 | 2005 | 2004 | 2003 | ||||||||||||||||||
| Net Asset Value, Beginning of Period | $ | 4.13 | $ | 3.82 | $ | 3.42 | $ | 3.39 | $ | 2.31 | |||||||||||||
| Income from Investment Operations: | |||||||||||||||||||||||
| Net investment income/(loss) | – | .03 | .05 | .02 | (.01 | ) | |||||||||||||||||
| Net gain/(loss) on securities (both realized and unrealized) | .91 | .28 | .35 | .01 | 1.09 | ||||||||||||||||||
| Total from Investment Operations | .91 | .31 | .40 | .03 | 1.08 | ||||||||||||||||||
| Less Distributions: | |||||||||||||||||||||||
| Dividends (from net investment income)* | (.02 | ) | – | – | – | – | |||||||||||||||||
| Distributions (from capital gains)* | – | – | – | – | – | ||||||||||||||||||
| Total Distributions | (.02 | ) | – | – | – | – | |||||||||||||||||
| Net Asset Value, End of Period | $ | 5.02 | $ | 4.13 | $ | 3.82 | $ | 3.42 | $ | 3.39 | |||||||||||||
| Total Return | 22.07 | % | 8.12 | % | 11.70 | % | 0.88 | % | 46.75 | % | |||||||||||||
| Net Assets, End of Period (in thousands) | $ | 4,093 | $ | 2,673 | $ | 2,989 | $ | 4,423 | $ | 5,580 | |||||||||||||
| Average Net Assets for the Period (in thousands) | $ | 3,293 | $ | 2,823 | $ | 3,100 | $ | 4,887 | $ | 3,871 | |||||||||||||
| Ratio of Gross Expenses to Average Net Assets(1) | 0.82 | %(2) | 0.83 | % | 0.73 | % | 0.72 | % | 0.85 | % | |||||||||||||
| Ratio of Net Expenses to Average Net Assets(1) | 0.82 | %(2) | 0.83 | % | 0.73 | % | 0.72 | % | 0.85 | % | |||||||||||||
| Ratio of Net Investment Income/(Loss) to Average Net Assets | 0.70 | % | 0.13 | % | 0.01 | % | 0.19 | % | (0.22 | )% | |||||||||||||
| Portfolio Turnover Rates | 67 | % | 89 | % | 42 | % | 30 | % | 46 | % | |||||||||||||
Service Shares
| For a share outstanding during | Janus Aspen Global Technology Portfolio | ||||||||||||||||||||||
| each fiscal year ended December 31 | 2007 | 2006 | 2005 | 2004 | 2003 | ||||||||||||||||||
| Net Asset Value, Beginning of Period | $ | 4.27 | $ | 3.96 | $ | 3.55 | $ | 3.53 | $ | 2.41 | |||||||||||||
| Income from Investment Operations: | |||||||||||||||||||||||
| Net investment income/(loss) | .02 | – | – | – | – | ||||||||||||||||||
| Net gain/(loss) on securities (both realized and unrealized) | .91 | .31 | .41 | .02 | 1.12 | ||||||||||||||||||
| Total from Investment Operations | .93 | .31 | .41 | .02 | 1.12 | ||||||||||||||||||
| Less Distributions: | |||||||||||||||||||||||
| Dividends (from net investment income)* | (.02 | ) | – | – | – | – | |||||||||||||||||
| Distributions (from capital gains)* | – | – | – | – | – | ||||||||||||||||||
| Total Distributions | (.02 | ) | – | – | – | – | |||||||||||||||||
| Net Asset Value, End of Period | $ | 5.18 | $ | 4.27 | $ | 3.96 | $ | 3.55 | $ | 3.53 | |||||||||||||
| Total Return | 21.70 | % | 7.83 | % | 11.55 | % | 0.57 | % | 46.47 | % | |||||||||||||
| Net Assets, End of Period (in thousands) | $ | 137,367 | $ | 132,281 | $ | 138,172 | $ | 151,354 | $ | 180,513 | |||||||||||||
| Average Net Assets for the Period (in thousands) | $ | 133,221 | $ | 134,175 | $ | 134,959 | $ | 161,072 | $ | 147,151 | |||||||||||||
| Ratio of Gross Expenses to Average Net Assets(1) | 1.07 | %(2) | 1.08 | % | 0.98 | % | 0.97 | % | 1.10 | % | |||||||||||||
| Ratio of Net Expenses to Average Net Assets(1) | 1.07 | %(2) | 1.08 | % | 0.98 | % | 0.97 | % | 1.10 | % | |||||||||||||
| Ratio of Net Investment Income/(Loss) to Average Net Assets | 0.39 | % | (0.12 | )% | (0.24 | )% | (0.06 | )% | (0.44 | )% | |||||||||||||
| Portfolio Turnover Rates | 67 | % | 89 | % | 42 | % | 30 | % | 46 | % | |||||||||||||
* See Note 3 in Notes to Financial Statements.
(1) See Note 4 in Notes to Financial Statements.
(2) Ratio of Gross Expenses to Average Net Assets and Ratio of Net Expenses to Average Net Assets includes dividends on short positions. The ratio would have been 0.82% for Institutional Shares and 1.07% for Service Shares in 2007 without the inclusion of dividends on short positions.
See Notes to Financial Statements.
14 Janus Aspen Series December 31, 2007
Service II Shares
| For a share outstanding during | Janus Aspen Global Technology Portfolio | ||||||||||||||||||||||
| each fiscal year ended December 31 | 2007 | 2006 | 2005 | 2004 | 2003 | ||||||||||||||||||
| Net Asset Value, Beginning of Period | $ | 4.35 | $ | 4.03 | $ | 3.62 | $ | 3.59 | $ | 2.44 | |||||||||||||
| Income from Investment Operations: | |||||||||||||||||||||||
| Net investment income/(loss) | .02 | – | – | – | – | ||||||||||||||||||
| Net gain/(loss) on securities (both realized and unrealized) | .93 | .32 | .41 | .03 | 1.14 | ||||||||||||||||||
| Total from Investment Operations | .95 | .32 | .41 | .03 | 1.14 | ||||||||||||||||||
| Less Distributions and Other: | |||||||||||||||||||||||
| Dividends (from net investment income)* | (.02 | ) | – | – | – | – | |||||||||||||||||
| Distributions (from capital gains)* | – | – | – | – | – | ||||||||||||||||||
| Redemption fees | – | (1) | – | (1) | – | (1) | – | (1) | .01 | ||||||||||||||
| Payment from affiliate | – | (2) | – | – | – | – | |||||||||||||||||
| Total Distributions and Other | (.02 | ) | – | – | – | .01 | |||||||||||||||||
| Net Asset Value, End of Period | $ | 5.28 | $ | 4.35 | $ | 4.03 | $ | 3.62 | $ | 3.59 | |||||||||||||
| Total Return | 21.75 | %(3) | 7.94 | % | 11.33 | % | 0.84 | % | 47.13 | % | |||||||||||||
| Net Assets, End of Period (in thousands) | $ | 26,188 | $ | 24,868 | $ | 25,882 | $ | 27,404 | $ | 28,634 | |||||||||||||
| Average Net Assets for the Period (in thousands) | $ | 25,482 | $ | 25,605 | $ | 24,247 | $ | 25,926 | $ | 21,419 | |||||||||||||
| Ratio of Gross Expenses to Average Net Assets(4) | 1.07 | %(5) | 1.08 | % | 0.99 | % | 0.97 | % | 1.10 | % | |||||||||||||
| Ratio of Net Expenses to Average Net Assets(4) | 1.07 | %(5) | 1.08 | % | 0.98 | % | 0.97 | % | 1.10 | % | |||||||||||||
| Ratio of Net Investment Income/(Loss) to Average Net Assets | 0.39 | % | (0.13 | )% | (0.25 | )% | (0.06 | )% | (0.44 | )% | |||||||||||||
| Portfolio Turnover Rates | 67 | % | 89 | % | 42 | % | 30 | % | 46 | % | |||||||||||||
* See Note 3 in Notes to Financial Statements.
(1) Redemption fees aggregated less than $.01 on a per share basis for the fiscal year ended.
(2) Payment from affiliate aggregated less than $.01 on a per share basis for the fiscal year ended.
(3) During the fiscal year ended, Janus Capital and/or Janus Services LLC fully reimbursed the Portfolio for a loss on a transaction resulting from certain trading, pricing and/or shareholder activity errors, which otherwise would have reduced total return by less than 0.01%.
(4) See Note 4 in Notes to Financial Statements.
(5) Ratio of Gross Expenses to Average Net Assets and Ratio of Net Expenses to Average Net Assets includes dividends on short positions. The ratio would have been 1.07% for Service II Shares in 2007 without the inclusion of dividends on short positions.
See Notes to Financial Statements.
Janus Aspen Series December 31, 2007 15
Notes to Schedule of Investments
| Lipper Variable Annuity Science and Technology Funds | Funds that invest at least 65% of their equity portfolio in science and technology stocks. | ||||||
| Morgan Stanley Capital International World Information Technology Index | Is a capitalization weighted index that monitors the performance of information technology stocks from developed market countries in North America, Europe, and the Asia/Pacific Region. The index includes reinvestment of dividends, net of foreign withholding taxes. | ||||||
| S&P 500® Index | The Standard & Poor's ("S&P") 500® Index is a commonly recognized, market capitalization weighted index of 500 widely held equity securities, designed to measure broad U.S. equity performance. | ||||||
| 144A | Securities sold under Rule 144A of the Securities Act of 1933, as amended, are subject to legal and/or contractual restrictions on resale and may not be publicly sold without registration under the 1933 Act. | ||||||
| ADR | American Depositary Receipt | ||||||
| PLC | Public Limited Company | ||||||
| U.S. Shares | Securities of foreign companies trading on an American Stock Exchange. | ||||||
* Non-income-producing security.
** A portion of this security has been segregated by the custodian to cover margin or segregation requirements on open futures contracts, forward currency contracts, options contracts, short sales and/or securities with extended settlement dates.
# Loaned security; a portion or all of the security is on loan at December 31, 2007.
† The security is purchased with the cash collateral received from securities on loan (Note 1).
§ Schedule of Restricted and Illiquid Securities (as of December 31, 2007)
| Acquisition Date | Acquisition Cost | Value | Value as % of Net Assets | ||||||||||||||||
| Janus Aspen Global Technology Portfolio | |||||||||||||||||||
| Goldman Sachs, Inc. convertible, (Omniture, Inc.), 0% (144A) | 11/20/07 | $ | 742,456 | $ | 794,039 | 0.5 | % | ||||||||||||
The Portfolio has registration rights for certain restricted securities held as of December 31, 2007. The issuer incurs all registration costs.
Aggregate collateral segregated to cover margin or segregation requirements on open futures contracts, forward currency contracts, options contracts, short sales and/or securities with extended settlement dates as of December 31, 2007 is noted below.
| Portfolio | Aggregate Value | ||||||
| Janus Aspen Global Technology Portfolio | $ | 47,845,990 | |||||
16 Janus Aspen Series December 31, 2007
Notes to Financial Statements
The following section describes the organization and significant accounting policies and provides more detailed information about the schedules and tables that appear throughout this report. In addition, the Notes to Financial Statements explain the methods used in preparing and presenting this report.
1. ORGANIZATION AND SIGNIFICANT ACCOUNTING POLICIES
Janus Aspen Global Technology Portfolio (the "Portfolio") is a series fund. The Portfolio is part of Janus Aspen Series (the "Trust"), which is organized as a Delaware statutory trust and is registered under the Investment Company Act of 1940, as amended, (the "1940 Act") as an open-end management investment company. The Trust offers seventeen Portfolios, which include multiple series of shares, with differing investment objectives and policies. The Portfolio invests primarily in equity securities. The Portfolio is classified as diversified, as defined in the 1940 Act. The Portfolio is a no-load investment.
The Portfolio currently offers three classes of shares: Institutional Shares, Service Shares and Service II Shares. Institutional Shares are offered only in connection with investment in and payments under variable insurance contracts and to qualified retirement plans. Service Shares and Service II Shares are offered only in connection with investment in and payments under variable insurance contracts and to qualified retirement plans that require a fee from Portfolio assets to procure distribution and administrative services to contract owners and plan participants. For Service II Shares, a redemption fee may be imposed on interests in separate accounts or plans held 60 days or less.
The following accounting policies have been consistently followed by the Portfolio and are in conformity with accounting principles generally accepted in the United States of America in the investment company industry.
Investment Valuation
Securities are valued at the last sales price or the official closing price for securities traded on a principal securities exchange (U.S. or foreign) and on the NASDAQ National Market. Securities traded on over-the-counter markets and listed securities for which no sales are reported are valued at the latest bid price (or yield equivalent thereof) obtained from one or more dealers transacting in a market for such securities or by a pricing service approved by the Portfolio's Trustees. Short-term securities with maturities of 60 days or less may be valued at amortized cost, which approximates market value. Debt securities with a remaining maturity of greater than 60 days are valued in accordance with the evaluated bid price supplied by the pricing service. The evaluated bid price supplied by the pricing service is an evaluation that reflects such factors as security prices, yields, maturities and ratings. Foreign securities and currencies are converted to U.S. dollars using the applicable exchange rate in effect as of the daily close of the New York Stock Exchange ("NYSE"). When market quotations are not readily available or deemed unreliable, or events or circumstances that may affect the value of portfolio securities held by the Portfolio are identified between the closing of their principal markets and the time the net asset value ("NAV") is determined, securities may be valued at fair value as determined in good faith under procedures established by and under the supervision of the Portfolio's Trustees. Circumstances in which fair value pricing may be utilized include, but are not limited to: (i) when significant events occur which may affect the securities of a single issuer, such as mergers, bankruptcies, or significant issuer specific developments; (ii) when significant events occur which may affect an entire market, such as natural disasters or significant governmen tal actions; and (iii) when non-significant events occur such as markets closing early or not opening, security trading halts, or pricing of non-valued securities and restricted or non-public securities. The Portfolio may use a systematic fair valuation model provided by an independent third party to value international equity securities in order to adjust for stale pricing, which may occur between the close of certain foreign exchanges and the NYSE.
Investment Transactions and Investment Income
Investment transactions are accounted for as of the date purchased or sold (trade date). Dividend income is recorded on the ex-dividend date. Certain dividends from foreign securities will be recorded as soon as the Trust is informed of the dividend if such information is obtained subsequent to the ex-dividend date. Dividends from foreign securities may be subject to withholding taxes in foreign jurisdictions. Interest income is recorded on the accrual basis and includes amortization of premiums and accretion of discounts. Gains and losses are determined on the identified cost basis, which is the same basis used for federal income tax purposes. Income, as well as gains and losses, both realized and unrealized, are allocated daily to each class of shares based upon the ratio of net assets represented by each class as a percentage of total net assets.
Expenses
The Portfolio bears expenses incurred specifically on its behalf as well as a portion of general expenses. Each class of shares bears expenses incurred specifically on its behalf and, in addition, each class bears a portion of general expenses, which may be based upon relative net assets of each class. Expenses are allocated daily to each class of shares based upon the ratio of net assets represented by each class as a percentage of total net assets. Expenses directly attributable to a specific class of shares are charged against the operations of such class.
Securities Lending
Under procedures adopted by the Trustees, the Portfolio may lend securities to qualified parties (typically brokers or other
Janus Aspen Series December 31, 2007 17
Notes to Financial Statements (continued)
financial institutions) who need to borrow securities in order to complete certain transactions such as covering short sales, avoiding failures to deliver securities or completing arbitrage activities. The Portfolio may seek to earn additional income through securities lending. There is the risk of delay in recovering a loaned security or the risk of loss in collateral rights if the borrower fails financially. Janus Capital Management LLC ("Janus Capital") makes efforts to balance the benefits and risks from granting such loans.
State Street Bank and Trust Company served as the Portfolio's lending agent for the period January 1, 2007 through May 24, 2007. Effective May 25, 2007, Dresdner Bank AG became the lending agent for the Portfolio.
The Portfolio does not have the right to vote on securities while they are being lent; however, the Portfolio may attempt to call back the loan and vote the proxy if time permits. All loans will be continuously secured by collateral which may consist of cash, U.S. Government securities, domestic and foreign short-term debt instruments, letters of credit, time deposits, repurchase agreements, money market mutual funds or other money market accounts, or such other collateral permitted by the Securities and Exchange Commission ("SEC"). Cash collateral may be invested in affiliated money market funds or other accounts advised by Janus Capital to the extent consistent with exemptive relief obtained from the SEC or as permitted by the 1940 Act and rules promulgated thereunder.
Dresdner Bank AG (the "Lending Agent") may also invest the cash collateral in the Allianz Dresdner Daily Asset Fund or investments in unaffiliated money market funds or accounts, mutually agreed to by the Portfolio and the Lending Agent, that comply with Rule 2a-7 of the 1940 Act relating to money market funds.
As of December 31, 2007, the Portfolio had on loan securities valued as indicated:
| Portfolio | Value at December 31, 2007 | ||||||
| Janus Aspen Global Technology Portfolio | $ | 7,612,450 | |||||
As of December 31, 2007, the Portfolio received cash collateral for securities lending activity as indicated:
| Portfolio | Cash Collateral at December 31, 2007 | ||||||
| Janus Aspen Global Technology Portfolio | $ | 7,885,192 | |||||
As of December 31, 2007, all cash collateral received by the Portfolio was invested in the Allianz Dresdner Daily Asset Fund, except for $1,311,519 and $1,008,393 which were invested in Repurchase Agreements and Time Deposits, respectively.
The value of the collateral must be at least 102% of the market value of the loaned securities that are denominated in U.S. dollars and 105% of the market value of the loaned securities that are not denominated in U.S. dollars. Loaned securities and related collateral are marked-to-market each business day based upon the market value of the loaned securities at the close of business, employing the most recent available pricing information. Collateral levels are then adjusted based on this mark-to-market evaluation.
The borrower pays fees at the Portfolio's direction to the Lending Agent. The Lending Agent may retain a portion of the interest earned on the cash collateral invested. The cash collateral invested by the Lending Agent is disclosed in the Schedule of Investments (if applicable). The lending fees and the Portfolio's portion of the interest income earned on cash collateral are included on the Statement of Operations (if applicable).
Interfund Lending
Pursuant to an exemptive order received from the SEC, the Portfolio may be party to an interfund lending agreement between the Portfolio and other Janus Capital sponsored mutual funds, which permits it to borrow or lend cash at a rate beneficial to both the borrowing and lending funds. Outstanding borrowings from all sources totaling 10% or more of the borrowing Portfolio's total assets must be collateralized at 102% of the outstanding principal value of the loan; loans of less than 10% may be unsecured. During the fiscal year ended December 31, 2007, there were no outstanding interfund borrowing or lending arrangements for the Portfolio.
Forward Currency Transactions
The Portfolio may enter into forward currency contracts in order to reduce its exposure to changes in foreign currency exchange rates on its foreign portfolio holdings and to lock in the U.S. dollar cost of firm purchase and sale commitments for securities denominated in or exposed to foreign currencies. A forward currency exchange contract is a commitment to purchase or sell a foreign currency at a future date at a negotiated rate. The gain or loss arising from the difference between the U.S. dollar cost of the original contract and the value of the foreign currency in U.S. dollars upon closing a contract is included in "Net realized gain/(loss) from investment and foreign currency transactions" on the Statement of Operations (if applicable).
Forward currency contracts held by the Portfolio are fully collateralized by other securities, which are denoted in the accompanying Schedule of Investments (if applicable). The collateral is evaluated daily to ensure its market value equals or exceeds the current market value of the corresponding forward currency contracts.
Futures Contracts
The Portfolio may enter into futures contracts to gain exposure to the stock market pending investment of cash balances or to meet liquidity needs. The Portfolio may also use such derivative instruments to hedge or protect from adverse movements in securities prices, currency rates or interest rates. The use of futures contracts may involve risks such as the possibility of illiquid markets or imperfect correlation between
18 Janus Aspen Series December 31, 2007
the value of the contracts and the underlying securities, or that the counterparty will fail to perform its obligations.
Futures contracts are marked-to-market daily, and the daily variation margin is recorded as a receivable or payable on the Statement of Assets and Liabilities (if applicable). When a contract is closed, a realized gain or loss is recorded as "Net realized gain/(loss) from futures contracts" on the Statement of Operations (if applicable) equal to the difference between the opening and closing value of the contract. Generally, futures contracts are marked-to-market (i.e., treated as realized and subject to distribution) for federal income tax purposes at fiscal year-end. Securities designated as collateral for market value on futures contracts are noted in the Schedule of Investments (if applicable). Such collateral is in the possession of the Portfolio's custodian. As of December 31, 2007, the Portfolio was not invested in futures contracts.
Options Contracts
The Portfolio may purchase or write put and call options on futures contracts and on portfolio securities for hedging purposes or as a substitute for an investment. The Portfolio may also purchase or write put and call options on foreign currencies in a manner similar to that in which futures or forward contracts on foreign currencies will be utilized. The Portfolio generally invests in options to hedge against adverse movements in the value of portfolio holdings.
When an option is written, the Portfolio receives a premium and becomes obligated to sell or purchase the underlying security at a fixed price, upon exercise of the option. In writing an option, the Portfolio bears the market risk of an unfavorable change in the price of the security underlying the written option. Exercise of an option written by the Portfolio could result in the Portfolio buying or selling a security at a price different from the current market value.
When an option is exercised, the proceeds on sales for a written call option, the purchase cost for a written put option, or the cost of the security for a purchased put or call option is adjusted by the amount of premium received or paid.
The Portfolio may also purchase and write exchange-listed and over-the-counter put and call options on domestic securities indices, and on foreign securities indices listed on domestic and foreign securities exchanges. Options on securities indices are similar to options on securities except that (1) the expiration cycles of securities index options are monthly, while those of securities options are currently quarterly, and (2) the delivery requirements are different. Instead of giving the right to take or make delivery of securities at a specified price, an option on a securities index gives the holder the right to receive a cash "exercise settlement amount" equal to (a) the amount, if any, by which the fixed exercise price of the option exceeds (in the case of a put) or is less than (in the case of a call) the closing value of the underlying index on the date of exercise, multiplied by (b) a fixed "index multiplier." Receipt of this cash a mount will depend upon the closing level of the securities index upon which the option is based being greater than, in the case of a call, or less than, in the case of a put, the exercise price of the index and the exercise price of the option times a specified multiple. The writer of the option is obligated, in return for the premium received, to make delivery of this amount.
Holdings designated to cover outstanding written options are noted in the Schedule of Investments (if applicable). Options written are reported as a liability on the Statement of Assets and Liabilities as "Options written at value" (if applicable). Realized gains and losses are reported as "Net realized gain/(loss) from options contracts" on the Statement of Operations (if applicable). The Portfolio recognized realized losses of $1,556,046 for written options during the fiscal year ended December 31, 2007.
The risk in writing a call option is that the Portfolio gives up the opportunity for profit if the market price of the security increases and the option is exercised. The risk in writing a put option is that the Portfolio may incur a loss if the market price of the security decreases and the option is exercised. The risk in buying an option is that the Portfolio pays a premium whether or not the option is exercised. The use of such instruments may involve certain additional risks as a result of unanticipated movement in the market. A lack of correlation between the value of an instrument underlying an option and the asset being hedged, or unexpected adverse price movements, could render the Portfolio's hedging strategy unsuccessful. In addition, there can be no assurance that a liquid secondary market will exist for any option purchased or sold. There is no limit to the loss that the Portfolio may recognize due to written call options.
Written option activity for the fiscal year ended December 31, 2007 was as follows:
| Call Options | Number of Contracts | Premiums Received | |||||||||
| Janus Aspen Global Technology Portfolio | |||||||||||
| Options Outstanding at December 31, 2006 | 785 | $ | 112,297 | ||||||||
| Options written | 4,140 | (1) | 1,280,600 | ||||||||
| Options expired | – | – | |||||||||
| Options closed | (4,783 | ) | (1,256,533 | ) | |||||||
| Options exercised | – | – | |||||||||
| Options outstanding at December 31, 2007 | 142 | $ | 136,364 | ||||||||
(1) Adjusted for Game Stop Corp. - Class A 2 for 1 Stock Split 3/19/07
| Put Options | Number of Contracts | Premiums Received | |||||||||
| Janus Aspen Global Technology Portfolio | |||||||||||
| Options outstanding at December 31, 2006 | 50 | $ | 14,200 | ||||||||
| Options written | – | – | |||||||||
| Options expired | – | – | |||||||||
| Options closed | (50 | ) | (14,200 | ) | |||||||
| Options exercised | – | – | |||||||||
| Options outstanding at December 31, 2007 | – | $ | – | ||||||||
Short Sales
The Portfolio may engage in "short sales against the box." Short sales against the box involve either selling short a
Janus Aspen Series December 31, 2007 19
Notes to Financial Statements (continued)
security that the Portfolio owns, or selling short a security that the Portfolio has the right to obtain, for delivery at a specified date in the future. The Portfolio may enter into a short sale against the box to hedge against anticipated declines in the market price of portfolio securities by locking in gains. The Portfolio does not deliver from its portfolio the securities sold short and does not immediately receive the proceeds of the short sale. The Portfolio borrows the securities sold short and receives proceeds from the short sale only when it delivers the securities to the lender. If the value of the securities sold short increases prior to the scheduled delivery date, the Portfolio loses the opportunity to participate in the gain.
The Portfolio may engage in short sales when the portfolio manager anticipates that a security's market purchase price will be less than its borrowing price. To complete the transaction, the Portfolio must borrow the security to deliver it to the purchaser and buy that same security in the market to return it to the lender. The total market value of all of the Portfolio's short sale positions will not exceed 10% of its assets. Although the potential for gain is limited to the difference between the price at which the Portfolio sold the security short and the cost of borrowing the security, its potential for loss is theoretically unlimited because there is no limit to the cost of replacing the borrowed security. There is no assurance that the Portfolio will be able to close out a short position at a particular time or at an acceptable price. A gain or a loss will be recognized upon termination of a short sale. There is no limit to the size o f any loss that the Portfolio may recognize upon termination of a short sale. Short sales held by the Portfolio are fully collateralized by other securities, which are denoted in the accompanying Schedule of Investments (if applicable).
Foreign Currency Translations
The Portfolio does not isolate that portion of the results of operations resulting from changes in foreign exchange rates on investments from the fluctuations arising from changes in market prices of securities held at the date of the financial statements. Net unrealized appreciation or depreciation on investments and foreign currency translation arise from changes in the value of assets and liabilities, including investments in securities held at the date of the financial statements, resulting from changes in the exchange rates and changes in market prices of securities held.
Currency gains and losses are also calculated on payables and receivables that are denominated in foreign currencies. The payables and receivables are generally related to foreign security transactions and income.
Foreign currency-denominated assets and forward currency contracts may involve more risks than domestic transactions, including currency risk, political and economic risk, regulatory risk and market risk. Risks may arise from the potential inability of a counterparty to meet the terms of a contract and from unanticipated movements in the value of foreign currencies relative to the U.S. dollar.
When-issued Securities
The Portfolio may purchase or sell securities on a when-issued or forward commitment basis. The price of the underlying securities and date when the securities will be delivered and paid for are fixed at the time the transaction is negotiated. Losses may arise due to changes in the market value of the securities or from the inability of counterparties to meet the terms of the contract. In connection with such purchases, the Portfolio may hold liquid assets as collateral with the Portfolio's custodian sufficient to cover the purchase price. As of December 31, 2007, the Portfolio was not invested in when-issued securities.
Equity-Linked Structured Notes
The Portfolio may invest in equity-linked structured notes. Equity-linked structured notes are derivative securities which are specially designed to combine the characteristics of one or more underlying securities and their equity derivatives in a single note form. The return and/or yield or income component may be based on the performance of the underlying equity securities, an equity index, and/or option positions. Equity-linked structured notes are typically offered in limited transactions by financial institutions in either registered or non-registered form. An investment in equity-linked structured notes creates exposure to the credit risk of the issuing financial institution, as well as to the market risk of the underlying securities. There is no guaranteed return of principal with these securities and the appreciation potential of these securities may be limited by a maximum payment or call right. In certain cases, equity-linked struc tured notes may be more volatile and less liquid than less complex securities or other types of fixed-income securities. Such securities may exhibit price behavior that does not correlate with other fixed-income securities.
Initial Public Offerings
The Portfolio may invest in initial public offerings ("IPOs"). IPOs and other investment techniques may have a magnified performance impact on a fund with a small asset base. The Portfolio may not experience similar performance as its assets grow.
Restricted Security Transactions
Restricted securities held by the Portfolio may not be sold except in exempt transactions or in a public offering registered under the Securities Act of 1933. The risk of investing in such securities is generally greater than the risk of investing in the securities of widely held, publicly traded companies. Lack of a secondary market and resale restrictions may result in the inability of the Portfolio to sell a security at a fair price and may substantially delay the sale of the security. In addition, these securities may exhibit greater price volatility than securities for which secondary markets exist.
Dividend Distributions
The Portfolio may make semiannual distributions of substantially all of its investment income and an annual distribution of its net realized capital gains (if any). The majority of dividends and net realized capital gains distributions from the
20 Janus Aspen Series December 31, 2007
Portfolio may be automatically reinvested into additional shares of the Portfolio, based upon the discretion of the shareholder.
Estimates
The preparation of financial statements in conformity with accounting principles generally accepted in the United States of America requires management to make estimates and assumptions that affect the reported amount of assets and liabilities and disclosure of contingent assets and liabilities at the date of the financial statements, and the reported amounts of income and expenses during the reporting period. Actual results could differ from those estimates.
Federal Income Taxes
No provision for income taxes is included in the accompanying financial statements, as the Portfolio intends to distribute to shareholders all taxable investment income and realized gains and otherwise comply with Subchapter M of the Internal Revenue Code applicable to regulated investment companies.
New Accounting Pronouncements
In July 2006, the Financial Accounting Standards Board ("FASB") issued Interpretation No. 48, "Accounting for Uncertainty in Income Taxes – an Interpretation of FASB Statement No. 109" (the "Interpretation"). The Interpretation establishes for all entities, including pass-through entities such as the Portfolio, a minimum threshold for financial statement recognition of the benefit of positions taken in filing tax returns (including whether an entity is taxable in a particular jurisdiction), and requires certain expanded tax disclosures. A calendar year open-end or closed-end fund was required to implement the Interpretation no later than June 29, 2007 (the last business day of the semi-annual reporting period), and the Interpretation also applies to all open tax years as of the date of effectiveness. Management has evaluated the application of the Interpretation to the Portfolio and has determined there is no significant impact on the P ortfolio's financial statements.
In September 2006, the FASB issued Statement of Financial Accounting Standards No. 157, "Fair Value Measurements" ("SFAS No. 157"), which defines fair value, establishes a framework for measuring fair value in generally accepted accounting principles, and expands disclosures about fair value measurements. SFAS No. 157 does not require new fair value measurements, but is applied to the extent that other accounting pronouncements require or permit fair value measurements. SFAS No. 157 emphasizes that fair value is a market-based measurement that should be determined based on the assumptions that market participants would use in pricing an asset or liability. SFAS No. 157 is effective for fiscal years beginning after November 15, 2007 and interim periods within those fiscal years. Management does not believe the adoption of SFAS No. 157 will impact the financial statement amounts, however, the Portfolio will be required to disclose the extent t o which fair value is used to measure assets and liabilities and the inputs used to develop the measurements.
2. INVESTMENT ADVISORY AGREEMENTS AND OTHER TRANSACTIONS WITH AFFILIATES
The Portfolio pays a monthly advisory fee to Janus Capital based upon average daily net assets and calculated at the annual rate of 0.64%.
Janus Capital has agreed until at least May 1, 2009 to reimburse the Portfolio by the amount, if any, that the normal operating expenses in any fiscal year, including the investment advisory fee but excluding the distribution and shareholder servicing (12b-1) fees applicable to Service Shares and Service II Shares, brokerage commissions, interest, taxes and extraordinary expenses, exceed an annual rate of 1.24% of the average daily net assets of the Portfolio. The Portfolio is not required to repay any such waived fees in future years to Janus Capital.
Janus Services LLC ("Janus Services"), a wholly-owned subsidiary of Janus Capital, is the Portfolio's transfer agent. Janus Services receives certain out-of-pocket expenses for transfer agent services.
Certain officers of the Portfolio may also be officers and/or directors of Janus Capital. Such officers receive no compensation from the Portfolio, except for the Portfolio's Chief Compliance Officer. Effective January 1, 2006, the Portfolio began reimbursing the adviser for a portion of the compensation paid to the Chief Compliance Officer of the Trust. Total compensation of $3,078 was paid by the Portfolio during the fiscal year ended December 31, 2007. The Portfolio's portion is reported as part of "Other Expenses" on the Statement of Operations.
The Board of Trustees has adopted a deferred compensation plan (the "Deferred Plan") for independent Trustees to elect to defer receipt of all or a portion of the annual compensation they are entitled to receive from the Portfolio. All deferred fees are credited to an account established in the name of the Trustees. The amounts credited to the account then increase or decrease, as the case may be, in accordance with the performance of one or more of the Janus funds that are selected by the Trustees. The account balance continues to fluctuate in accordance with the performance of the selected fund or funds until final payment of all amounts credited to the account. The fluctuation of the account balance is recorded by the Portfolio as unrealized appreciation/(depreciation) and is shown as of December 31, 2007 on the Statement of Assets and Liabilities as an asset, "Noninterested Trustees' deferred compensation," and a liability, "Nonintereste d Trustees' deferred compensation fees." Additionally, the recorded unrealized appreciation/(depreciation) is included in "Unrealized net appreciation/(depreciation) of investments, foreign currency translations and non-interested Trustees' deferred compensation" on the Statement of Assets and Liabilities. Deferred compensation expenses for the fiscal year ended December 31, 2007 are included in "Non-interested Trustees' fees and expenses" on the Statement of Operations. Trustees are allowed to change their designation of mutual funds from time to time. Amounts will be deferred until distributed in
Janus Aspen Series December 31, 2007 21
Notes to Financial Statements (continued)
accordance with the Deferred Plan. No deferred fees were paid to any Trustee under the Deferred Plan during the fiscal year ended December 31, 2007.
A 1.00% redemption fee may be imposed on Service II Shares of the Portfolio held for 60 days or less. This fee is paid to the Portfolio rather than Janus Capital, and is designed to deter excessive short-term trading and to offset the brokerage commissions, market impact, and other costs associated with changes in the Portfolio's asset level and cash flow due to short-term money movements in and out of the Portfolio. The redemption fee is accounted for as an addition to Paid-in Capital. Total redemption fees received by the Portfolio were $7,947 for the fiscal year ended December 31, 2007.
For the fiscal year ended December 31, 2007, Janus Capital assumed $24,421 of legal, consulting and Trustee costs and fees incurred by the funds in Janus Investment Fund, Janus Aspen Series and Janus Adviser Series (the "Funds") in connection with the regulatory and civil litigation matters discussed in Note 7. These non-recurring costs were allocated to all Funds based upon the Funds' respective net assets as of July 31, 2004. Additionally, all future non-recurring costs will be allocated to the Funds based on the Funds' respective net assets on July 31, 2004. These "Non-recurring costs" and "Costs assumed by Janus Capital" are shown on the Statement of Operations.
During the fiscal year ended December 31, 2007, Janus Capital reimbursed the Portfolio $41 for Service II Shares, as a result of dilutions caused by certain trading and/or pricing errors. Reimbursements are included in "Payment from affiliate" on the Statements of Changes in Net Assets.
Janus Distributors LLC, a wholly-owned subsidiary of Janus Capital, is a distributor of the Portfolio. Service Shares and Service II Shares have adopted a Distribution and Shareholder Servicing Plan (the "Plan") pursuant to Rule 12b-1 under the 1940 Act. The Plan authorizes payments by the Portfolio in connection with the distribution of Service Shares and Service II Shares at an annual rate of up to 0.25% of Service Share's and of Service II Share's respective average daily net assets.
The Portfolio's expenses may be reduced by expense offsets from an unaffiliated custodian and/or transfer agent. Such credits or offsets are included in "Expense and Fee Offset" on the Statement of Operations. The transfer agent fee offsets received during the period reduce Transfer Agent Fees and Expenses. Custodian offsets received reduce Custodian Fees. The Portfolio could have employed the assets used by the custodian and/or transfer agent to produce income if it had not entered into an expense offset arrangement.
The Portfolio may invest in money market funds, including funds managed by Janus Capital. During the fiscal year ended December 31, 2007, the Portfolio recorded distributions from affiliated investment companies as affiliated dividend income, and had the following affiliated purchases and sales:
| Purchases Shares/Cost | Sales Shares/Cost | Dividend Income | Value at 12/31/07 | ||||||||||||||||
| Janus Aspen Global Technology Portfolio | |||||||||||||||||||
| Janus Institutional Cash Management Fund - Institutional Shares | $ | 16,612,699 | $ | 7,565,691 | $ | 111,050 | $ | 9,047,008 | |||||||||||
| Janus Institutional Cash Reserves Fund | 2,324,111 | 5,573,468 | 15,995 | – | |||||||||||||||
| Janus Institutional Money Market Fund - Institutional Shares | 42,113,163 | 42,113,163 | 96,856 | – | |||||||||||||||
| Janus Money Market Fund - Institutional Shares | 8,356,344 | 16,887,024 | 26,490 | – | |||||||||||||||
| $ | 69,406,317 | $ | 72,139,346 | $ | 250,391 | $ | 9,047,008 | ||||||||||||
3. FEDERAL INCOME TAX
The tax components of capital shown in the table below represent: (1) distribution requirements the Portfolio must satisfy under the income tax regulations; (2) losses or deductions the Portfolio may be able to offset against income and gains realized in future years; and (3) unrealized appreciation or depreciation of investments for federal income tax purposes (reduced by foreign tax liability).
Other book to tax differences in the current year may consist of deferred compensation, derivatives, and foreign currency contract adjustments. The Portfolio has elected to treat gains and losses on forward foreign currency contracts as capital gains and losses. Other foreign currency gains and losses on debt instruments are treated as ordinary income for federal income tax purposes pursuant to Section 988 of the Internal Revenue Code.
Accumulated capital losses noted below represent net capital loss carryovers, as of December 31, 2007, that may be available to offset future realized capital gains and thereby reduce future taxable gains distributions.
| Portfolio | Undistributed Ordinary Income | Undistributed Long–Term Gains | Accumulated Capital Losses | Post October Deferral | Other Book to Tax Differences | Net Tax Appreciation/ (Depreciation) | |||||||||||||||||||||
| Janus Aspen Global Technology Portfolio | $ | 113,614 | $ | – | $ | (389,627,541 | ) | $ | – | $ | (8,245 | ) | $ | 33,726,148 | |||||||||||||
22 Janus Aspen Series December 31, 2007
The table below shows the expiration dates of the carryovers.
Capital Loss Carryover Expiration Schedule
For the year ended December 31, 2007
| Portfolio | December 31, 2009 | December 31, 2010 | December 31, 2011 | December 31, 2012 | |||||||||||||||
| Janus Aspen Global Technology Portfolio | $ | (231,201,630 | ) | $ | (148,365,762 | ) | $ | (8,794,052 | ) | $ | (1,266,097 | ) | |||||||
During the year ended December 31, 2007, the following capital loss carryover was utilized by the Portfolio as indicated in the table below.
| Portfolio | Capital Loss Carryover Utilized | ||||||
| Janus Aspen Global Technology Portfolio | $ | 28,222,196 | |||||
The aggregate cost of investments and the composition of unrealized appreciation and depreciation of investment securities for federal income tax purposes as of December 31, 2007 are noted below.Unrealized appreciation and unrealized depreciation in the table below exclude appreciation/depreciation on foreign currency translations. The primary difference between book and tax appreciation or depreciation of investments is wash sale loss deferrals.
| Portfolio | Federal Tax Cost | Unrealized Appreciation | Unrealized (Depreciation) | ||||||||||||
| Janus Aspen Global Technology Portfolio | $ | 143,007,848 | $ | 42,331,925 | $ | (8,309,433 | ) | ||||||||
Income and capital gains distributions are determined in accordance with income tax regulations that may differ from accounting principles generally accepted in the United States of America. These differences are due to differing treatments for items such as net short-term gains, deferral of wash sale losses, foreign currency transactions, net investment losses and capital loss carryovers. Certain permanent differences such as tax returns of capital and net investment losses noted below have been reclassified to paid-in capital.
| Distributions | |||||||||||||||||||
| For the fiscal year ended December 31, 2007 Portfolio | From Ordinary Income | From Long-Term Capital Gains | Tax Return of Capital | Net Investment Loss | |||||||||||||||
| Janus Aspen Global Technology Portfolio | $ | 535,673 | $ | – | $ | – | $ | – | |||||||||||
| Distributions | |||||||||||||||||||
| For the fiscal year ended December 31, 2006 Portfolio | From Ordinary Income | From Long-Term Capital Gains | Tax Return of Capital | Net Investment Loss | |||||||||||||||
| Janus Aspen Global Technology Portfolio | $ | – | $ | – | $ | – | $ | (249,285 | ) | ||||||||||
Janus Aspen Series December 31, 2007 23
Notes to Financial Statements (continued)
4. EXPENSE RATIOS
The expense ratios listed in the Financial Highlights reflect expenses prior to any expense offsets (gross expense ratio) and after expense offsets (net expense ratio). Both expense ratios reflect expenses after waivers (reimbursement). Listed below are the gross expense ratios for the Portfolio that would have been in effect, absent the waiver of certain fees and offsets.
For each fiscal year ended December 31
| Institutional Shares | Service Shares | Service II Shares | |||||||||||||||||||||||||||||||||||||||||||||||||||||||||||||
| Portfolio | 2007(1) | 2006(1) | 2005(1) | 2004(1) | 2003 | 2007(1) | 2006(1) | 2005(1) | 2004(1) | 2003 | 2007(1) | 2006(1) | 2005(1) | 2004(1) | 2003 | ||||||||||||||||||||||||||||||||||||||||||||||||
| Janus Aspen Global Technology Portfolio | 0.82 | % | 0.83 | % | 0.73 | % | 0.72 | % | 0.85 | % | 1.07 | % | 1.08 | % | 0.98 | % | 0.97 | % | 1.10 | % | 1.07 | % | 1.08 | % | 0.99 | % | 0.97 | % | 1.10 | % | |||||||||||||||||||||||||||||||||
(1) The effect of non-recurring costs assumed by Janus Capital (Note 2) is included in the ratio of operating expenses to average net assets without waivers and/or expense reimbursements and was less than 0.01%.
5. CAPITAL SHARE TRANSACTIONS
| For each fiscal year ended December 31 | Janus Aspen Global Technology Portfolio | ||||||||||
| (all numbers in thousands) | 2007 | 2006 | |||||||||
| Transactions in Portfolio Shares – Institutional Shares | |||||||||||
| Shares sold | 442 | 137 | |||||||||
| Reinvested dividends and distributions | 3 | – | |||||||||
| Shares repurchased | (277 | ) | (272 | ) | |||||||
| Net Increase/(Decrease) in Portfolio Shares | 168 | (135 | ) | ||||||||
| Shares Outstanding, Beginning of Period | 647 | 782 | |||||||||
| Shares Outstanding, End of Period | 815 | 647 | |||||||||
| Transactions in Portfolio Shares – Service Shares | |||||||||||
| Shares sold | 3,409 | 3,723 | |||||||||
| Reinvested dividends and distributions | 85 | – | |||||||||
| Shares repurchased | (7,963 | ) | (7,632 | ) | |||||||
| Net Increase/(Decrease) in Portfolio Shares | (4,469 | ) | (3,909 | ) | |||||||
| Shares Outstanding, Beginning of Period | 31,003 | 34,912 | |||||||||
| Shares Outstanding, End of Period | 26,534 | 31,003 | |||||||||
| Transactions in Portfolio Shares – Service II Shares | |||||||||||
| Shares sold | 875 | 1,007 | |||||||||
| Reinvested dividends and distributions | 15 | – | |||||||||
| Shares repurchased | (1,648 | ) | (1,708 | ) | |||||||
| Net Increase/(Decrease) in Portfolio Shares | (758 | ) | (701 | ) | |||||||
| Shares Outstanding, Beginning of Period | 5,720 | 6,421 | |||||||||
| Shares Outstanding, End of Period | 4,962 | 5,720 | |||||||||
6. PURCHASES AND SALES OF INVESTMENT SECURITIES
For the fiscal year ended December 31, 2007, the aggregate cost of purchases and proceeds from sales of investment securities (excluding short-term securities and options contracts) were as follows:
| Portfolio | Purchases of Securities | Proceeds from Sales of Securities | Purchases of Long-Term U.S. Government Obligations | Proceeds from Sales of Long-Term U.S. Government Obligations | |||||||||||||||
| Janus Aspen Global Technology Portfolio | $ | 105,724,426 | $ | 127,496,718 | $ | – | $ | 381,328 | |||||||||||
24 Janus Aspen Series December 31, 2007
7. PENDING LEGAL MATTERS
In the fall of 2003, the Securities and Exchange Commission ("SEC"), the Office of the New York State Attorney General ("NYAG"), the Colorado Attorney General ("COAG"), and the Colorado Division of Securities ("CDS") announced that they were investigating alleged frequent trading practices in the mutual fund industry. On August 18, 2004, Janus Capital announced that it had reached final settlements with the SEC, the NYAG, the COAG, and the CDS related to such regulators' investigations into Janus Capital's frequent trading arrangements.
A number of civil lawsuits were brought against Janus Capital and certain of its affiliates, the Janus funds, and related entities and individuals based on allegations similar to those announced by the above regulators and were filed in several state and federal jurisdictions. Such lawsuits alleged a variety of theories for recovery including, but not limited to, the federal securities laws, other federal statutes (including ERISA), and various common law doctrines. The Judicial Panel on Multidistrict Litigation transferred these actions to the U.S. District Court for the District of Maryland (the "Court") for coordinated proceedings. On September 29, 2004, five consolidated amended complaints were filed with the Court that generally include: (i) claims by a putative class of investors in certain Janus funds asserting claims on behalf of the investor class (Marini, et al. v. Janus Investment Fund, et al., U.S. District Court, District of Maryland, Case No. 04-CV-00497); (ii) derivative claims by investors in certain Janus funds ostensibly on behalf of such funds (Steinberg et al. v. Janus Capital Management, LLC et al., U.S. District Court, District of Maryland, Case No. 04-CV-00518); (iii) claims on behalf of participants in the Janus 401(k) plan (Wangberger v. Janus Capital Group Inc., 401(k) Advisory Committee, et al., U.S. District Court, District of Maryland, Case No. JFM-05-2711); (iv) claims brought on behalf of shareholders of Janus Capital Group Inc. ("JCGI") on a derivative basis against the Board of Directors of JCGI (Chasen v. Whiston, et al., U.S. District Court, District of Maryland, Case No. 04-MD-00855); and (v) claims by a putative class of shareholders of JCGI asserting claims on behalf of the shareholders (Wiggins, et al. v. Janus Capital Group, Inc., et al., U.S. District Court, District of Maryland, Case No. 04-CV-00818). Each of the five complaints initially named JCGI and/or Janus Capital as a defendant. In addition, the following were also named as defendants in one or more of the actions: Janus Investment Fund ("JIF"), Janus Aspen Series ("JAS"), Janus Adviser Series ("JAD"), Janus Distributors LLC, Enhanced Investment Technologies, LLC ("INTECH"), Bay Isle Financial LLC ("Bay Isle"), Perkins, Wolf, McDonnell and Company, LLC ("Perkins"), the Advisory Committee of the Janus 401(k) plan, and the current or former directors of JCGI.
On August 25, 2005, the Court entered orders dismissing most of the claims asserted against Janus Capital and its affiliates by fund investors in the Marini and Steinberg cases (actions (i) and (ii) above) except certain claims under Section 10(b) of the Securities Exchange Act of 1934 and under Section 36(b) of the Investment Company Act of 1940, as amended (the "1940 Act"). On August 15, 2006, the Wangberger complaint in the 401(k) plan class action (action (iii) above) was dismissed by the district court with prejudice. The plaintiff appealed that dismissal decision to the United States Court of Appeals for the Fourth Circuit. The appeal is still pending and argument in the matter was held in December 2007. The Court also dismissed the Chasen lawsuit (action (iv) above) against JCGI's Board of Directors without leave to amend. Finally, a Motion to Dismiss the Wiggins suit (action (v) above) was granted and the matter was dismissed in May 2007. However, in June 2007, Plaintiffs appealed that dismissal to the United States Court of Appeals for the Fourth Circuit. That appeal is currently pending.
In addition to the lawsuits described above, the Auditor of the State of West Virginia ("Auditor"), in his capacity as securities commissioner, has initiated administrative proceedings against many of the defendants in the market timing cases (including JCGI and Janus Capital) and, as a part of its relief, is seeking disgorgement and other monetary relief based on similar market timing allegations (In the Matter of Janus Capital Group Inc. et al., Before the Securities Commissioner, State of West Virginia, Summary Order No. 05-1320). The respondents in these proceedings collectively sought a Writ of Prohibition in state court, which was denied. Their subsequent Petition for Appeal was also denied. Consequently, in September 2006, JCGI and Janus Capital filed their answer to the Auditor's summary order instituting proceedings and requested a hearing. A status conference was held on June 28, 2007, during which the parties were ordered t o submit their proposed scheduling order. To date, no scheduling order has been entered in the case. In addition to the pending Motion to Discharge Order to Show Cause, JCGI and Janus Capital, as well as other similarly situated defendants, continue to challenge the statutory authority of the Auditor to bring such an action.
Additional lawsuits may be filed against certain of the Janus funds, Janus Capital, and related parties in the future. Janus Capital does not currently believe that these pending actions will materially affect its ability to continue providing services it has agreed to provide to the Janus funds.
Janus Aspen Series December 31, 2007 25
Report of Independent Registered Public Accounting Firm
To the Trustees and Shareholders
of Janus Aspen Global Technology Portfolio
In our opinion, the accompanying statement of assets and liabilities, including the schedule of investments, and the related statements of operations and of changes in net assets and the financial highlights present fairly, in all material respects, the financial position of Janus Aspen Global Technology Portfolio (one of the portfolios constituting Janus Aspen Series, hereafter referred to as the "Portfolio") at December 31, 2007, the results of its operations for the year then ended, the changes in its net assets for each of the two years in the period then ended, and the financial highlights for each of the five years in the period then ended, in conformity with accounting principles generally accepted in the United States of America. These financial statements and financial highlights (hereafter referred to as "financial statements") are the responsibility of the Portfolio's management; our responsibility is to express an opinion on thes e financial statements based on our audits. We conducted our audits of these financial statements in accordance with the standards of the Public Company Accounting Oversight Board (United States). Those standards require that we plan and perform the audit to obtain reasonable assurance about whether the financial statements are free of material misstatement. An audit includes examining, on a test basis, evidence supporting the amounts and disclosures in the financial statements, assessing the accounting principles used and significant estimates made by management, and evaluating the overall financial statement presentation. We believe that our audits, which included confirmation of securities at December 31, 2007 by correspondence with the custodian, transfer agent and brokers, and the application of alternative auditing procedures where securities purchased had not been received, provide a reasonable basis for our opinion.

Denver, Colorado
February 15, 2008
26 Janus Aspen Series December 31, 2007
Additional Information (unaudited)
PROXY VOTING POLICIES AND VOTING RECORD
A description of the policies and procedures that the Portfolio uses to determine how to vote proxies relating to its portfolio securities is available: (i) without charge, upon request, by calling 1-800-525-0020 (toll free); (ii) on the Portfolio's website at www.janus.com/proxyvoting; and (iii) on the SEC's website at http://www.sec.gov. Additionally, information regarding the Portfolio's proxy voting record for the most recent twelve-month period ended June 30 is also available, free of charge, through www.janus.com/proxyvoting and from the SEC's website at http://www.sec.gov.
QUARTERLY PORTFOLIO HOLDINGS
The Portfolio files its complete portfolio holdings (schedule of investments) with the SEC for the first and third quarters of each fiscal year on Form N-Q within 60 days of the end of such fiscal quarter. The Portfolio's Form N-Q: (i) is available on the SEC's website at http://www.sec.gov; (ii) may be reviewed and copied at the SEC's Public Reference Room in Washington, D.C. (information on the Public Reference Room may be obtained by calling 1-800-SEC-0330); and (iii) is available without charge, upon request, by calling Janus at 1-800-525-0020 (toll free).
APPROVAL OF ADVISORY AGREEMENTS DURING THE PERIOD
The Trustees of Janus Aspen Series, none of whom has ever been affiliated with Janus Capital ("Independent Trustees"), oversee the management of each Portfolio and, as required by law, determine annually whether to continue the investment advisory agreement for each Portfolio and the subadvisory agreements for the three Portfolios that utilize subadvisers.
In connection with their most recent consideration of those agreements for each Portfolio, the Trustees received and reviewed a substantial amount of information provided by Janus Capital and the respective subadvisers in response to requests of the Independent Trustees and their independent legal counsel. They also received and reviewed a considerable amount of information and analysis provided by their independent fee consultant. Throughout their consideration of the agreements, the Independent Trustees were advised by their independent legal counsel. The Independent Trustees met with management to consider the agreements, and also met separately in executive session with their independent legal counsel and their independent fee consultant.
At a meeting held on December 14, 2007, based on their evaluation of the information provided by Janus Capital, the subadvisers and the independent fee consultant, as well as other information, the Trustees determined that the overall arrangements between each Portfolio and Janus Capital and each subadviser, as applicable, were fair and reasonable in light of the nature, extent and quality of the services provided by Janus Capital, its affiliates and the subadvisers, the fees charged for those services, and other matters that the Trustees considered relevant in the exercise of their business judgment. At that meeting the Trustees unanimously approved the continuation of the investment advisory agreement for each Portfolio, and the subadvisory agreement for each subadvised Portfolio, for the period from February 1, 2008 through February 1, 2009, subject to earlier termina tion as provided for in each agreement.
In considering the continuation of those agreements, the Trustees reviewed and analyzed various factors that they determined were relevant, including the factors described below, none of which by itself was considered dispositive. However, the material factors and conclusions that formed the basis for the Trustees' determination to approve the continuation of the agreements are discussed separately below.
Nature, Extent and Quality of Services
The Trustees reviewed the nature, extent and quality of the services provided by Janus Capital and the subadvisers to the Portfolios, taking into account the investment objective and strategy of each Portfolio, the knowledge of the Trustees gained from their regular meetings with management on at least a quarterly basis, and their ongoing review of information related to the Portfolios. In addition, the Trustees reviewed the resources and key personnel of Janus Capital and each subadviser, especially those who provide investment management services to the Portfolios. The Trustees also considered other services provided to the Portfolios by Janus Capital or the subadvisers, such as managing the execution of portfolio transactions and the selection of broker-dealers for those transactions, serving as the Portfolios' administrator, monitoring adherence to the Portfolios' investment restrictions, producing shareholder reports, providing support services for the Trustees and Trustee committees, communicating with shareholders, and overseeing the activities of other service providers, including monitoring compliance with various policies and procedures of the Portfolios and with applicable securities laws and regulations.
The Trustees concluded that the nature, extent and quality of the services provided by Janus Capital and/or the subadviser to each Portfolio were appropriate and consistent with the terms of the respective advisory and subadvisory agreements; that, taking into account steps taken to address those Portfolios whose performance lagged that of the median of their peers for certain periods, the quality of those services had been consistent with or superior to quality norms in the industry; and that the Portfolios were likely to benefit from the continued provision of those services. They also concluded that Janus Capital and each subadviser had sufficient personnel, with the appropriate education and experience, to serve the Portfolios effectively and had demonstrated its continuing ability to attract well-qualified personnel.
Janus Aspen Series December 31, 2007 27
Additional Information (unaudited) (continued)
Performance of the Portfolios
The Trustees considered the investment results of each Portfolio over various time periods. They reviewed information comparing each Portfolio's performance with the performance of comparable funds and peer groups identified by Lipper Inc., an independent provider of investment company data, and with the Portfolio's benchmark index. They concluded that the performance of many Portfolios was good to very good under current market conditions. Although the performance of some Portfolios lagged that of the median of their peers for certain periods, the Trustees also concluded that Janus Capital had taken appropriate steps to address those instances of under-performance and that the more recent performance of most of those Portfolios had been improving.
Costs of Services Provided
The Trustees examined information on the fees and expenses of each Portfolio in comparison to similar information for comparable funds as provided by Lipper. They also reviewed an analysis of that information provided by their independent fee consultant and noted that the rate of management (investment advisory and administrative) fees for most of the Portfolios, in some cases after contractual expense limitations, was below the mean management fee rate of the respective peer group of funds selected by Lipper.
The Trustees considered the methodology used by Janus Capital and each subadviser in determining compensation payable to portfolio managers, the competitive environment for investment management talent and the competitive market for mutual funds in different distribution channels. They concluded that the compensation methodology provided a good alignment of the interests of the portfolio managers with those of Portfolio shareholders.
The Trustees also reviewed management fees charged by Janus Capital to its separate account clients and to its subadvised funds (for which Janus Capital provides only services related to portfolio management). Although in most instances subadvisory and separate account fee rates for various investment strategies were lower than management fee rates for Portfolios having a similar strategy, the Trustees noted that, under the terms of the management agreements with the Portfolios, Janus Capital performs significant additional services for the Portfolios that it does not provide to those other clients, including administrative services, oversight of the Portfolios' other service providers, Trustee support, regulatory compliance and numerous other services, and that, in serving the Portfolios, Janus Capital assumes many legal risks that it does not assume in servicing its other clients. Moreover, the Trustees noted that the spread between the av erage fee rates charged to the Portfolios and the fee rates that Janus Capital charged to its separate account clients was significantly smaller than the average spread for such fee rates of other advisers, based on publicly available data and research conducted by their independent fee consultant.
The Trustees reviewed information on the profitability to Janus Capital and its affiliates of their relationships with each Portfolio, as well as an explanation of the methodology used in allocating various expenses of Janus Capital and its affiliates among the Portfolios and other clients. They also reviewed the financial statements of Janus Capital's parent company and its corporate structure. In their review, the Trustees considered whether Janus Capital and each subadviser receives adequate incentives to manage the Portfolios effectively. They recognized that profitability comparisons among investment advisers are difficult because very little comparative information is publicly available and profitability of any adviser is affected by numerous factors, including the organizational structure of the particular adviser, the types of funds and other accounts it manages, possible other lines of business, the methodology for allocating expens es, and the adviser's capital structure and cost of capital. However, based on the information available and taking those factors into account, the Trustees concluded that Janus Capital's profitability with respect to each Portfolio in relation to the services rendered was not unreasonable.
The Trustees concluded that the management fees and other compensation payable by each Portfolio to Janus Capital and its affiliates, as well as the fees payable by Janus Capital or the Portfolios to the subadvisers of subadvised Portfolios, were reasonable in relation to the nature, extent and quality of the services provided, taking into account the fees charged by other advisers for managing comparable mutual funds with similar strategies and the fees Janus Capital and the subadvisers charge to other clients. They also concluded that the overall expense ratio of each Portfolio was reasonable, taking into account the size of the Portfolio, the quality of services provided by Janus Capital and any subadviser, the investment performance of the Portfolio and any expense limitations agreed to by Janus Capital.
Economies of Scale
The Trustees considered information about the potential for Janus Capital to realize economies of scale as the assets of the Portfolios increase. They noted that, although most Portfolios pay advisory fees at a fixed rate as a percentage of net assets, without any breakpoints, the management fee rate paid by each Portfolio, after any contractual expense limitations, was below the mean management fee rate of the Portfolio's peer group selected by Lipper; and, for those Portfolios whose expenses are being reduced by the contractual expense limitations of Janus Capital, Janus Capital is subsidizing the Portfolios because they have not reached adequate scale. Moreover, as the assets of many of the Portfolios declined in the past few years, those Portfolios benefited from having advisory fee rates that remained constant rather than
28 Janus Aspen Series December 31, 2007
increasing as assets declined. In addition, performance fee structures have been implemented for several Portfolios that will cause the effective rate of advisory fees payable by such a Portfolio to vary depending on the investment performance of the Portfolio relative to its benchmark index over the measurement period; and a few Portfolios have fee schedules with breakpoints and reduced fee rates above certain asset levels. The Trustees also noted that the Portfolios share directly in economies of scale through lower charges of third-party service providers, based on the combined scale of all of the Portfolios. Based on all of the information they reviewed, the Trustees concluded that the current fee structure of each Portfolio was reasonable and that the current rates of fees do reflect a sharing between Janus Capital and the Portfolio of economies of scale at the current asset level of the Portfolio.
Other Benefits to Janus Capital
The Trustees also considered benefits that accrue to Janus Capital and its affiliates from their relationships with the Portfolios. They recognized that two affiliates of Janus Capital separately serve the Portfolios as transfer agent and distributor, respectively. They also considered Janus Capital's past and proposed use of commissions paid by Portfolios on their portfolio brokerage transactions to obtain proprietary and third-party research products and services benefiting those Portfolios and/or other clients of Janus Capital. The Trustees concluded that Janus Capital's use of "soft" commission dollars of a Portfolio to obtain proprietary and third-party research products and services was consistent with regulatory requirements and guidelines and was likely to benefit the Portfolios. The Trustees also concluded that, other than the services provided by Janus Capital and its affiliates pursuant to the agreements and the fees to be paid by each Portfolio therefor, the Portfolios and Janus Capital may potentially benefit from their relationship with each other in other ways. They concluded that Janus Capital benefits from the receipt of proprietary research products and services acquired through commissions paid on portfolio transactions of the Portfolios and that the Portfolios benefit from Janus Capital's receipt of those products and services, as well as research products and services acquired through commissions paid by other clients of Janus Capital. They further concluded that success of any Portfolio could attract other business to Janus Capital or other Janus funds and that the success of Janus Capital could enhance Janus Capital's ability to serve the Portfolios.
After full consideration of the above factors, as well as other factors, all of the Trustees, all of whom are Independent Trustees, concluded that the proposed continuation of the investment advisory agreement for each Portfolio, and the subadvisory agreement for each subadvised Portfolio, was in the best interest of the respective Portfolios and their shareholders.
Janus Aspen Series December 31, 2007 29
Explanations of Charts, Tables and
Financial Statements (unaudited)
1. PERFORMANCE OVERVIEWS
The performance overview graph compares the performance of a hypothetical $10,000 investment in the Portfolio with one or more widely used market indices. The hypothetical example does not represent the returns of any particular investment.
When comparing the performance of the Portfolio with an index, keep in mind that market indices do not include brokerage commissions that would be incurred if you purchased the individual securities in the index. They also do not include taxes payable on dividends and interest or operating expenses incurred if you maintained a Portfolio invested in the index.
Average annual total returns are quoted for each class of the Portfolio. Average annual total return is calculated by taking the growth or decline in value of an investment over a period of time, including reinvestment of any dividends, distributions and capital gains, then calculating the annual compounded percentage rate that would have produced the same result had the rate of growth been constant throughout the period. Average annual total return does not reflect the deduction of taxes that a shareholder would pay on Portfolio distributions or redemptions of Portfolio shares.
Pursuant to federal securities rules, expense ratios shown in the performance chart reflect subsidized and unsubsidized ratios for the past fiscal year. The total annual portfolio operating expenses ratio is gross of any fee waivers, reflecting a Portfolio's unsubsidized expense ratio. The net annual portfolio operating expenses ratio (if applicable) includes contractual waivers of Janus Capital and/or Janus Services and reflects a Portfolio's subsidized expense ratio. Both the total annual portfolio operating expenses ratio and net annual portfolio operating expenses ratio are based on average net assets as of the fiscal year ended December 31, 2006. The ratios also include expenses indirectly incurred by the Portfolio as a result of investing in other investment companies or pooled investments, which are not reflected in the "Financial Highlights" of this report. As a result, these ratios may be higher or lower than those shown in the "Fin ancial Highlights" in this report. All expenses are shown without the effect of expense offset arrangements. Pursuant to such arrangements, credits realized as a result of uninvested cash balances are used to reduce custodian and transfer agent expenses.
2. SCHEDULE OF INVESTMENTS
Following the performance overview section is the Portfolio's Schedule of Investments. This schedule reports the industry concentrations and types of securities held in the Portfolio on the last day of the reporting period. Securities are usually listed by type (common stock, corporate bonds, U.S. Government obligations, etc.) and by industry classification (banking, communications, insurance, etc.). Holdings are subject to change without notice.
The value of each security is quoted as of the last day of the reporting period. The value of securities denominated in foreign currencies is converted into U.S. dollars. Certain short-term investments maturing within 60 days are valued at amortized cost, which approximates market value.
A summary of investments by country is provided if the Portfolio invested in foreign securities. This summary reports the Portfolio's exposure to different countries by providing the percentage of securities invested in each country. The country of each security represents the country in which the company is incorporated.
2A. FORWARD CURRENCY CONTRACTS
A table listing forward currency contracts follows the Portfolio's Schedule of Investments (if applicable). Forward currency contracts are agreements to deliver or receive a preset amount of currency at a future date. Forward currency contracts are used to hedge against foreign currency risk in the Portfolio's long-term holdings.
The table provides the name of the foreign currency, the settlement date of the contract, the amount of the contract, the value of the currency in U.S. dollars and the amount of unrealized gain or loss. The amount of unrealized gain or loss reflects the change in currency exchange rates from the time the contract was opened to the last day of the reporting period.
2B. FUTURES
A table listing futures contracts follows the Portfolio's Schedule of Investments (if applicable). Futures contracts are contracts that obligate the buyer to receive and the seller to deliver an instrument or money at a specified price on a specified date. Futures are used to hedge against adverse movements in securities prices, currency risk or interest rates.
The table provides the name of the contract, number of contracts held, the expiration date, the principal amount, value and the amount of unrealized gain or loss. The amount of unrealized gain or loss reflects the marked-to-market amount for the last day of the reporting period.
2C. Options
A table listing written option contracts follows the Portfolio's Schedule of Investments (if applicable). Written option contracts are contracts that obligate the Portfolio to sell or purchase an underlying security at a fixed price, upon exercise of the option. Options are used to hedge against adverse movements in securities prices, currency risk or interest rates. The table provides the name of the contract, number of contracts held, the expiration date, exercise price, value and premiums received.
30 Janus Aspen Series December 31, 2007
3. STATEMENT OF ASSETS AND LIABILITIES
This statement is often referred to as the "balance sheet." It lists the assets and liabilities of the Portfolio on the last day of the reporting period.
The Portfolio's assets are calculated by adding the value of the securities owned, the receivable for securities sold but not yet settled, the receivable for dividends declared but not yet received on stocks owned and the receivable for Portfolio shares sold to investors but not yet settled. The Portfolio's liabilities include payables for securities purchased but not yet settled, Portfolio shares redeemed but not yet paid and expenses owed but not yet paid. Additionally, there may be other assets and liabilities such as unrealized gain or loss on forward currency contracts.
The section entitled "Net Assets Consist of" breaks down the components of the Portfolio's net assets. Because the Portfolio must distribute substantially all earnings, you will notice that a significant portion of net assets is shareholder capital.
The last section of this statement reports the net asset value ("NAV") per share on the last day of the reporting period for each class of the Portfolio. The NAV is calculated by dividing the Portfolio's net assets (assets minus liabilities) by the number of shares outstanding.
4. STATEMENT OF OPERATIONS
This statement details the Portfolio's income, expenses, gains and losses on securities and currency transactions, and appreciation or depreciation of current Portfolio holdings.
The first section in this statement, entitled "Investment Income," reports the dividends earned from stocks and interest earned from interest-bearing securities in the Portfolio.
The next section reports the expenses and expense offsets incurred by the Portfolio, including the advisory fee paid to the investment adviser, transfer agent fees and expenses, printing and postage for mailing statements, financial reports and prospectuses, and other expenses. Expense offsets, if any, are also shown.
The last section lists the increase or decrease in the value of securities held in the Portfolio. The Portfolio realizes a gain (or loss) when it sells its position in a particular security. An unrealized gain (or loss) refers to the change in net appreciation or depreciation of the Portfolio during the reporting period. "Net Realized and Unrealized Gain/(Loss) on Investments" is affected both by changes in the market value of Portfolio holdings and by gains (or losses) realized during the reporting period.
5. STATEMENT OF CHANGES IN NET ASSETS
This statement reports the increase or decrease in the Portfolio's net assets during the reporting period. Changes in the Portfolio's net assets are attributable to investment operations, dividends, distributions and capital share transactions. This is important to investors because it shows exactly what caused the Portfolio's net asset size to change during the period.
The first section summarizes the information from the Statement of Operations regarding changes in net assets due to the Portfolio's investment performance. The Portfolio's net assets may also change as a result of dividend and capital gains distributions to investors. If investors receive their dividends in cash, money is taken out of the Portfolio to pay the distribution. If investors reinvest their dividends, the Portfolio's net assets will not be affected. If you compare the Portfolio's "Net Decrease from Dividends and Distributions" to the "Reinvested dividends and distributions," you will notice that dividend distributions had little effect on the Portfolio's net assets. This is because the majority of Janus investors reinvest their distributions.
The reinvestment of dividends is included under "Capital Share Transactions." "Capital Shares" refers to the money investors contribute to the Portfolio through purchases or withdraw via redemptions. The "Redemption Fees" refers to the fee paid to the Portfolio for shares held for 60 days or less by a shareholder. The Portfolio's net assets will increase and decrease in value as investors purchase and redeem shares from the Portfolio.
6. FINANCIAL HIGHLIGHTS
This schedule provides a per-share breakdown of the components that affect the Portfolio's NAV for current and past reporting periods for each class of the Portfolio. Not only does this table provide you with total return, it also reports total distributions, asset size, expense ratios and portfolio turnover rate.
The first line in the table reflects the NAV per share at the beginning of the reporting period. The next line reports the net investment income per share, which comprises dividends and interest income earned on securities held by the Portfolio. Following is the total of gains/(losses), realized and unrealized. Dividends and distributions are then subtracted to arrive at the NAV per share at the end of the period. The next line reflects the average annual total return reported the last day of the period.
Also included are the expense ratios, or the percentage of average net assets that were used to cover operating expenses during the period. Expense ratios vary for a number of reasons, including the differences in management fees, the average shareholder account size and the extent of foreign investments, which entail greater transaction costs.
The Portfolio's expenses may be reduced through expense reduction arrangements. These arrangements may include the use of balance credits or transfer agent fee offsets. The Statement of Operations reflects total expenses before any such offset, the amount of the offset and the net expenses. The
Janus Aspen Series December 31, 2007 31
Explanations of Charts, Tables and
Financial Statements (unaudited) (continued)
expense ratios listed in the Financial Highlights reflect total expenses prior to any expense offsets (gross expense ratio) and after the expense offsets (net expense ratio). Both expense ratios reflect expenses after waivers (reimbursements), if applicable.
The ratio of net investment income/(loss) summarizes the income earned less expenses, divided by the average net assets of the Portfolio during the reporting period. Don't confuse this ratio with the Portfolio's yield. The net investment income ratio is not a true measure of the Portfolio's yield because it doesn't take into account the dividends distributed to the Portfolio's investors.
The next figure is the portfolio turnover rate, which measures the buying and selling activity in the Portfolio. Portfolio turnover is affected by market conditions, changes in the asset size of the Portfolio, the nature of the Portfolio's investments and the investment style of the portfolio manager. A 100% rate implies that an amount equal to the value of the entire portfolio is turned over in a year; a 50% rate means that an amount equal to the value of half the portfolio is traded in a year; and a 200% rate means that an amount equal to the value of the portfolio is traded every six months.
32 Janus Aspen Series December 31, 2007
Designation Requirements (unaudited)
For federal income tax purposes, the Portfolio designated the following for the year ended December 31, 2007:
Dividends Received Deduction Percentage
| Portfolio | |||||||
| Janus Aspen Global Technology Portfolio | 48 | % | |||||
Janus Aspen Series December 31, 2007 33
Trustees and Officers (unaudited)
The Portfolio's Statement of Additional Information includes additional information about the Trustees and officers and is available, without charge, by calling 1-800-525-0020.
The following are the Trustees and officers of the Trust, together with a brief description of their principal occupations during the last five years (principal occupations for certain Trustees may include periods over five years).
Each Trustee has served in that capacity since he or she was originally elected or appointed. The Trustees do not serve a specified term of office. Each Trustee will hold office until the termination of the Trust or his or her earlier death, resignation, retirement, incapacity, or removal. The retirement age for Trustees is 72. The Portfolio's Nominating and Governance Committee will consider nominees for the position of Trustee recommended by shareholders. Shareholders may submit the name of a candidate for consideration by the Committee by submitting their recommendations to the Trust's Secretary. Each Trustee is currently a Trustee of two other registered investment companies advised by Janus Capital: Janus Investment Fund and Janus Adviser Series. As of the date of this report, collectively, these three registered investment companies consist of 75 series or funds.
The Trust's officers are elected annually by the Trustees for a one-year term. Certain officers also serve as officers of Janus Investment Fund and Janus Adviser Series. Certain officers of the Portfolio may also be officers and/or directors of Janus Capital. Portfolio officers receive no compensation from the Portfolio, except for the Portfolio's Chief Compliance Officer, as authorized by the Trustees.
Trustees
| Name, Address, and Age | Positions Held with Portfolio | Length of Time Served | Principal Occupations During the Past Five Years | Number of Portfolios/Funds in Fund Complex Overseen by Trustee | Other Directorships Held by Trustee | ||||||||||||||||||
| Dennis B. Mullen* 151 Detroit Street Denver, CO 80206 DOB: 1943 Chairman | Trustee | 3/04-12/07 9/93-Present | Chief Executive Officer of Red Robin Gourmet Burgers, Inc. (since 2005). Formerly, private investor. | 75 | ** | Chairman of the Board (since 2005) and Director of Red Robin Gourmet Burgers, Inc., and Director of Janus Capital Funds Plc (Dublin-based, non-U.S. funds). | |||||||||||||||||
| Jerome S. Contro 151 Detroit Street Denver, CO 80206 DOB: 1956 | Trustee | 12/05-Present | Partner of Tango Group, a private investment firm (since 1999). | 75 | Trustee and Chairman of RS Investment Trust (since 2001), and Director of IZZE Beverages and MyFamily.com, Inc. (genealogical research website). | ||||||||||||||||||
| William F. McCalpin 151 Detroit Street Denver, CO 80206 DOB: 1957 | Trustee | 6/02-Present | Private investor. Formerly, Executive Vice President and Chief Operating Officer of The Rockefeller Brothers Fund (a private family foundation), and Vice President of Asian Cultural Council. | 75 | Director of F.B. Heron Foundation (a private grant making foundation). | ||||||||||||||||||
* Mr. McCalpin will succeed Mr. Mullen as Chairman as of January 1, 2008.
** Mr. Mullen also serves as director of Janus Capital Funds Plc, consisting of 16 funds. Including Janus Capital Funds Plc and the 75 funds comprising the Janus funds, Mr. Mullen oversees 91 funds.
34 Janus Aspen Series December 31, 2007
Trustees (cont.)
| Name, Address, and Age | Positions Held with Portfolio | Length of Time Served | Principal Occupations During the Past Five Years | Number of Portfolios/Funds in Fund Complex Overseen by Trustee | Other Directorships Held by Trustee | ||||||||||||||||||
| John W. McCarter, Jr. 151 Detroit Street Denver, CO 80206 DOB: 1938 | Trustee | 6/02-Present | President and Chief Executive Officer of The Field Museum of Natural History (Chicago, IL) (since 1997). | 75 | Chairman of the Board and Director of Divergence Inc. (biotechnology firm); Director of W.W. Grainger, Inc. (industrial distributor); and Trustee of WTTW (Chicago public television station) and the University of Chicago. | ||||||||||||||||||
| James T. Rothe 151 Detroit Street Denver, CO 80206 DOB: 1943 | Trustee | 1/97-Present | Co-founder and Managing Director of Roaring Fork Capital Management, LLC (private investment in public equity firm), and Professor Emeritus of Business of the University of Colorado, Colorado Springs, CO (since 2004). Formerly, Professor of Business of the University of Colorado (2002-2004) and Distinguished Visiting Professor of Business (2001-2002) of Thunderbird (American Graduate School of International Management), Glendale, AZ. | 75 | Director of Red Robin Gourmet Burgers, Inc. | ||||||||||||||||||
| William D. Stewart 151 Detroit Street Denver, CO 80206 DOB: 1944 | Trustee | 9/93-Present | Corporate Vice President and General Manager of MKS Instruments – HPS Products, Boulder, CO (a manufacturer of vacuum fittings and valves). | 75 | N/A | ||||||||||||||||||
| Martin H. Waldinger 151 Detroit Street Denver, CO 80206 DOB: 1938 | Trustee | 9/93-Present | Private Investor and Consultant to California Planned Unit Developments (since 1994). Formerly, CEO and President of Marwal, Inc. (homeowner association management company). | 75 | N/A | ||||||||||||||||||
| Linda S. Wolf 151 Detroit Street Denver, CO 80206 DOB: 1947 | Trustee | 12/05-Present | Retired. Formerly, Chairman and Chief Executive Officer of Leo Burnett (Worldwide) (advertising agency) (2001-2005). | 75 | Director of Wal-Mart, The Field Museum of Natural History (Chicago, IL), Children's Memorial Hospital (Chicago, IL), Chicago Council on Foreign Relations, Economic Club of Chicago, and InnerWorkings (U.S. provider of print procurement solutions). | ||||||||||||||||||
Janus Aspen Series December 31, 2007 35
Trustees and Officers (unaudited) (continued)
Officers
| Name, Address and Age | Positions Held with Portfolio | Term of Office* and Length of Time Served | Principal Occupations During the Past Five Years | ||||||||||||
| Burton H. Wilson 151 Detroit Street Denver, CO 80206 DOB: 1963 | Executive Vice President and Portfolio Manager Janus Aspen Global Technology Portfolio | 2/06-Present | Vice President and Research Analyst for Janus Capital, and Portfolio Manager for other Janus accounts. Formerly, Research Analyst (2000-2004) for Lincoln Equity Management. | ||||||||||||
| Stephanie Grauerholz-Lofton 151 Detroit Street Denver, CO 80206 DOB: 1970 | Chief Legal Counsel and Secretary Vice President | 1/06-Present 3/06-Present | Vice President and Assistant General Counsel of Janus Capital, and Vice President and Assistant Secretary of Janus Distributors LLC. Formerly, Assistant Vice President of Janus Capital and Janus Distributors LLC (2006), and Associate of Vedder, Price, Kaufman & Kammholz, P.C. (1999-2003). | ||||||||||||
| Andrew J. Iseman 151 Detroit Street Denver, CO 80206 DOB: 1964 | President and Chief Executive Officer | 3/07-Present | Chief Operating Officer and Senior Vice President of Janus Capital Group, Inc. and Janus Capital; President of Janus Services LLC; and Director of Capital Group Partners, Inc. Formerly, Senior Vice President of Enhanced Investment Technologies, LLC (2005-2007); and Vice President of Janus Capital (2003-2005) and Janus Services LLC (2003-2004). | ||||||||||||
| David R. Kowalski 151 Detroit Street Denver, CO 80206 DOB: 1957 | Vice President, Chief Compliance Officer, and Anti-Money Laundering Officer | 6/02-Present | Senior Vice President and Chief Compliance Officer of Janus Capital, Janus Distributors LLC, and Janus Services LLC; Chief Compliance Officer of Bay Isle Financial LLC; and Vice President of Enhanced Investment Technologies, LLC. Formerly, Chief Compliance Officer of Enhanced Investment Technologies, LLC (2003-2005); Vice President of Janus Capital (2000-2005) and Janus Services LLC (2004-2005); and Assistant Vice President of Janus Services LLC (2000-2004). | ||||||||||||
| Jesper Nergaard 151 Detroit Street Denver, CO 80206 DOB: 1962 | Chief Financial Officer Vice President, Treasurer, and Principal Accounting Officer | 3/05-Present 2/05-Present | Vice President of Janus Capital. Formerly, Director of Financial Reporting for OppenheimerFunds, Inc. (2004-2005); Site Manager and First Vice President of Mellon Global Securities Services (2003); and Director of Fund Accounting, Project Development, and Training of INVESCO Funds Group (1994-2003). | ||||||||||||
* Officers are elected at least annually by the Trustees for a one-year term and may also be elected from time to time by the Trustees for an interim period.
36 Janus Aspen Series December 31, 2007
Notes
Janus Aspen Series December 31, 2007 37
Janus provides access to a wide range of investment disciplines.
Growth
Janus growth portfolios focus on companies believed to be the leaders in their respective industries, with solid management teams, expanding market share, margins and efficiencies.
Core
Janus core portfolios seek investments in more stable and predictable companies. These portfolios look for a strategic combination of steady growth and for certain portfolios, some degree of income.
Risk-Managed
Our risk-managed portfolios seek to outperform their respective indices while maintaining a risk profile equal to or lower than the index itself. Managed by INTECH (a Janus subsidiary), these portfolios use a mathematical process in an attempt to build a more "efficient" portfolio than the index.
Value
Janus value portfolios invest in companies they believe are poised for a turnaround or are trading at a significant discount to fair value. The goal is to gain unique insight into a company's true value and identify and evaluate potential catalysts that may unlock shareholder value.
International & Global
Janus international and global portfolios seek to leverage Janus' research capabilities by taking advantage of inefficiencies in foreign markets, where accurate information and analytical insight are often at a premium.
Bond
Janus bond portfolios attempt to provide less risk relative to equities while seeking to deliver a competitive total return through high current income and appreciation.
Money Market
Janus money market portfolios seek maximum current income consistent with stability of capital.
For more information about our funds, contact your investment professional or go to www.janus.com/info
Please consider the charges, risks, expenses and investment objectives carefully before investing. For a prospectus containing this and other information, please call Janus at 1-800-525-0020 or download the file from www.janus.com/info. Read it carefully before you invest or send money.
An investment in a money market portfolio is not insured or guaranteed by the Federal Deposit Insurance Corporation or any other government agency. Although the Portfolio seeks to preserve the value of your investment at $1.00 per share, it is possible to lose money by investing in the Portfolio.

151 Detroit Street
Denver, CO 80206
1-800-525-0020
Portfolio distributed by Janus Distributors LLC (2/08)
C-0108-357 109-02-714 02-08
2007 Annual Report
Janus Aspen Series
Janus Aspen Growth and Income Portfolio
Look Inside. . .
• Portfolio management perspective
• Investment strategy behind your portfolio
• Portfolio performance, characteristics and holdings

Table of Contents
| Useful Information About Your Portfolio Report | 1 | ||||||
| Management Commentary and Schedule of Investments | 2 | ||||||
| Statement of Assets and Liabilities | 11 | ||||||
| Statement of Operations | 12 | ||||||
| Statements of Changes in Net Assets | 13 | ||||||
| Financial Highlights | 14 | ||||||
| Notes to Schedule of Investments | 15 | ||||||
| Notes to Financial Statements | 16 | ||||||
| Report of Independent Registered Public Accounting Firm | 25 | ||||||
| Additional Information | 26 | ||||||
| Explanations of Charts, Tables and Financial Statements | 29 | ||||||
| Designation Requirements | 32 | ||||||
| Trustees and Officers | 33 | ||||||
Please consider the charges, risks, expenses and investment objectives carefully before investing. For a prospectus containing this and other information, please call Janus at 1-800-525-0020 or download the file from www.janus.com/info. Read it carefully before you invest or send money.
Useful Information About Your Portfolio Report
Management Commentary
The Management Commentary in this report includes valuable insight from the Portfolio's manager as well as statistical information to help you understand how your Portfolio's performance and characteristics stack up against those of comparable indices.
Please keep in mind that the opinions expressed by the Portfolio's manager in the Management Commentary are just that: opinions. They are a reflection of the manager's best judgment at the time this report was compiled, which was December 31, 2007. As the investing environment changes, so could the manager's opinions. The views are unique to the manager and aren't necessarily shared by his fellow employees or by Janus in general.
Portfolio Expenses
We believe it's important for our shareholders to have a clear understanding of Portfolio expenses and the impact they have on investment return.
The following is important information regarding the Portfolio's Expense Example, which appears in the Management Commentary within this Annual Report. Please refer to this information when reviewing the Expense Example for the Portfolio.
Example
As a shareholder of a Portfolio, you incur two types of costs: (1) transaction costs, including redemption fees (where applicable) (and any related exchange fees) and (2) ongoing costs, including management fees; distribution and shareholder servicing (12b-1) fees (applicable to Service Shares only); and other Portfolio expenses. The example is intended to help you understand your ongoing costs (in dollars) of investing in a Portfolio and to compare these costs with the ongoing costs of investing in other mutual funds. To do so, compare this 5% hypothetical example with the 5% hypothetical examples that appear in the shareholder reports of the other funds. The example is based upon an investment of $1,000 invested at the beginning of the period and held for the six-month period from July 1, 2007 to December 31, 2007.
Actual Expenses
The first line of the table in each example provides information about actual account values and actual expenses. You may use the information in this line, together with the amount you invested, to estimate the expenses that you paid over the period. Simply divide your account value by $1,000 (for example, an $8,600 account value divided by $1,000 = 8.6), then multiply the result by the number in the first line under the heading entitled "Expenses Paid During Period" to estimate the expenses you paid on your account during the period.
Hypothetical Example for Comparison Purposes
The second line of the table in each example provides information about hypothetical account values and hypothetical expenses based upon the Portfolio's actual expense ratio and an assumed rate of return of 5% per year before expenses, which is not the Portfolio's actual return. The hypothetical account values and expenses may not be used to estimate the actual ending account balance or expenses you paid for the period. You may use this information to compare the ongoing costs of investing in the Portfolio and other funds. To do so, compare this 5% hypothetical example with the 5% hypothetical examples that appear in the shareholder reports of the other funds.
Please note that the expenses shown in the tables are meant to highlight your ongoing costs only and do not reflect any transaction costs, such as redemption fees (where applicable) and any charges at the separate account level or contract level. Redemption fees are fully described in the prospectus. Therefore, the second line of each table is useful in comparing ongoing costs only, and will not help you determine the relative total costs of owning different funds. In addition, if these transaction costs and separate account or contract level charges were included, your costs would have been higher.
Janus Aspen Series December 31, 2007 1
Janus Aspen Growth and Income Portfolio
(unaudited)
Portfolio Snapshot
This growth portfolio seeks to create capital appreciation and income through all types of market conditions by leveraging the best ideas of the Janus Research Team.

Marc Pinto
portfolio manager
Performance Overview
For the 12-month period ended December 31, 2007, the Portfolio outpaced its primary benchmark with its Institutional Shares and Service Shares returning 8.70% and 8.44%, respectively. The Portfolio's primary benchmark, the S&P 500® Index and its secondary benchmark, the Russell 1000® Growth Index, returned 5.49% and 11.81%, respectively.
Economic Overview
Despite a volatile and weak second half of the year, equity markets worldwide managed to turn in modest gains over the 12-month period ended December 31, 2007. Much of the year's gains came during the first half amid continued expansion in the global economy and an active merger and acquisition (M&A) environment, but problems in the U.S. credit markets started to rattle investor confidence in July. Many indices retreated from recent peaks as investors digested a number of issues stemming from the subprime mortgage and structured debt markets. Credit market turmoil, subprime-related write-offs, continued weakness in the U.S. housing market, central bank intervention and the first year-over-year decline in domestic corporate earnings since 2002 were just some of the main themes dominating sentiment during the latter half of 2007. Through all of this, emerging country stocks tended to be the top performers while equities in developed countr ies struggled to keep pace. Domestic stocks were led by large, growth-oriented companies with small-cap value issues among the laggards.
As December came to a close, many themes supporting equity prices were fading. While domestic valuations were still considered to be reasonable, particularly with interest rates well off of their period highs, mixed signals on the financial health of the U.S. consumer and slowing earnings momentum were becoming a greater concern. One pillar of strength during the year, the labor market, showed signs that it may be starting to feel the impact of the housing slowdown and subsequent credit market turmoil. While job growth remained strong for much of the year, a weak December reading left some doubt about continued near-term strength. In the end, the questions remained surrounding the magnitude of slowing growth in the U.S. and whether the rest of the world will follow suit.
Stocks That Contributed to Performance
The Portfolio's outperformance can be attributed primarily to its overweight position relative to the Index in energy stocks and to strong stock selection in the materials sector.
Oil Company Hess Corp was the top contributor to performance for the year. The company benefited from the rising price of oil during 2007 and increased appreciation for the future production potential from Hess' new projects, including deep-water projects in the Gulf of Mexico and off the coast of Brazil. I believe that Hess remains undervalued given the potential reserves in these projects.
Tata Steel was another strong individual contributor. The stock was first purchased in March 2006. The investment thesis was based on the fact that the company is an integrated steel producer, meaning it controls its own iron ore, and it had high operating margins with a strong balance sheet. It seemed to be an obvious way to participate in the growth of the Indian economy. Unfortunately, the emerging market sector immediately sold off in the summer of 2006. Tata shares went even lower after the company won a three-month bidding war for U.K.-based steelmaker Corus Steel. The market appeared as if Tata destroyed shareholder value by overpaying for Corus (Tata paid 34% more than its initial bid) and diluting its own high-return business. In addition, investors feared that the company employed significant financial leverage while simultaneously raising its operating leverage to the steel pricing cycle. While this may have been a rational respon se, I held on to the stock based on my belief that the company would benefit from an increased marketing presence in Europe. Perseverance paid off. Not only did Tata Steel successfully complete the financing, but steel prices also rose steadily. I harvested gains in the name and exited the position. The Portfolio also used listed options and total return swaps to fully utilize the research process. Please see the "Notes to Financial Statements" for a discussion of derivatives used by the Portfolio.
Weak Performers Included E-TRADE and Advanced Micro Devices
E-TRADE Financial Corp. was the largest detractor from performance. I initiated a position in E-TRADE due to its growth prospects in the online brokerage industry. However, the company recently disclosed greater-than-expected losses in
2 Janus Aspen Series December 31, 2007
(unaudited)
its mortgage portfolio, stemming from the recent subprime credit meltdown. I exited the position.
The Portfolio's holding in Advanced Micro Devices was a detractor in the microprocessor industry. The company was forced to pare back its ambitious plan to gain market share when it became evident that rival Intel would successfully defend its market position through its balance sheet and manufacturing capacity. Intel proved better prepared to weather margin pressure from the ensuing price war, resulting in a setback for AMD. As such I chose to exit the position.
Outlook
With U.S. equity markets struggling late in the year, the investment team will continue to closely monitor several factors for directional cues. First, despite the weakness in the U.S. housing sector and related credit market turmoil, U.S. employment had been a pillar of support for the economy. With signs of weakening at the end of the year, however, we will continue to watch the labor market closely for any sign of prolonged weakness and whether December's weaker-than-expected report was an aberration. We will also monitor conditions in the credit markets for signs of further deterioration. As the Federal Reserve (Fed) works to balance its dual mandate of sustainable growth and price stability, we will be watching for signs that suggest the Fed is behind the curve and whether it can be effective in navigating these uncertain economic times. Finally, as a "bottom-up" fu ndamental investor, I will continue to watch the future path of corporate earnings, credit conditions, liquidity, and balance sheet health of our individual holdings in an effort to determine whether current valuations represent an attractive risk/reward profile.
Manager Change
In closing, effective November 7, 2007, I became manager of Janus Aspen Growth and Income Portfolio. A 13-year Janus veteran, I served as Assistant Portfolio Manager of Janus Growth and Income Fund (the Portfolio's retail counterpart) from 1995 to 1997. I am a classic growth investor, looking for strong fundamental businesses with top-notch management teams that are working to maximize shareholder value. Under my leadership, the Portfolio will continue to employ the same investment processes and leverage the same in-depth, fundamental analysis and company-by-company approach to portfolio construction that are hallmarks of Janus' research process.
Thank you for your investment in Janus Aspen Growth and Income Portfolio.
Janus Aspen Series December 31, 2007 3
Janus Aspen Growth and Income Portfolio (unaudited)
Janus Aspen Growth and Income Portfolio At a Glance
5 Largest Contributors to Performance – Holdings
| Contribution | |||||||
| Hess Corp. | 2.52 | % | |||||
| Tata Steel, Ltd. | 1.85 | % | |||||
| Suntech Power Holdings Company, Ltd. (ADR) | 1.24 | % | |||||
| EnCana Corp. (U.S. Shares) | 1.21 | % | |||||
| Bharti Tele-Ventures, Ltd. | 1.11 | % | |||||
5 Largest Detractors from Performance – Holdings
| Contribution | |||||||
| E*TRADE Financial Corp. | (2.25 | )% | |||||
| Advanced Micro Devices, Inc. | (1.49 | )% | |||||
| Spansion, Inc. - Class A | (1.14 | )% | |||||
| Citigroup, Inc. | (0.95 | )% | |||||
| Fannie Mae | (0.70 | )% | |||||
5 Largest Contributors to Performance – Sectors
| Portfolio Contribution | Portfolio Weighting (% of Net Assets) | S&P 500® Index Weighting | |||||||||||||
| Energy | 7.28 | % | 17.36 | % | 10.82 | % | |||||||||
| Industrials | 2.43 | % | 12.43 | % | 11.22 | % | |||||||||
| Materials | 2.32 | % | 3.40 | % | 3.13 | % | |||||||||
| Consumer Staples | 1.43 | % | 7.84 | % | 9.52 | % | |||||||||
| Health Care | 1.18 | % | 9.30 | % | 11.95 | % | |||||||||
5 Lowest Contributors/Detractors to Performance – Sectors
| Portfolio Contribution | Portfolio Weighting (% of Net Assets) | S&P 500® Index Weighting | |||||||||||||
| Financials | (5.81 | )% | 11.61 | % | 20.57 | % | |||||||||
| Consumer Discretionary | (1.03 | )% | 12.37 | % | 9.92 | % | |||||||||
| Utilities | (0.05 | )% | 0.58 | % | 3.54 | % | |||||||||
| Other* | 0.01 | % | 0.03 | % | 0.00 | % | |||||||||
| Information Technology | 0.64 | % | 23.03 | % | 15.69 | % | |||||||||
*Industry not classified by Global Classification Standard.
4 Janus Aspen Series December 31, 2007
(unaudited)
5 Largest Equity Holdings – (% of Net Assets)
As of December 31, 2007
| Hess Corp. Oil Companies - Integrated | 3.9 | % | |||||
| General Electric Co. Diversified Operations | 3.4 | % | |||||
| EnCana Corp. (U.S. Shares) Oil Companies - Exploration and Production | 2.9 | % | |||||
| CVS/Caremark Corp. Retail - Drug Store | 2.8 | % | |||||
| Exxon Mobil Corp. Oil Companies - Integrated | 2.5 | % | |||||
| 15.5 | % | ||||||
Asset Allocation – (% of Net Assets)
As of December 31, 2007
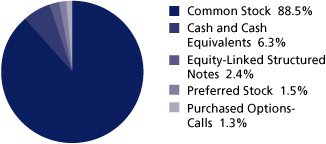
Emerging markets comprised 6.2% of total net assets.
Top Country Allocations – Long Positions (% of Investment Securities)
| As of December 31, 2007 | As of December 31, 2006 | ||||||
 |  | ||||||
Janus Aspen Series December 31, 2007 5
Janus Aspen Growth and Income Portfolio (unaudited)
Performance
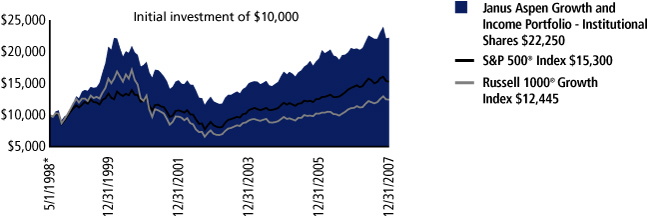
| Average Annual Total Return – for the periods ended December 31, 2007 | Expense Ratios – for the fiscal year ended December 31, 2006 | ||||||||||||||||||
| One Year | Five Year | Since Inception* | Total Annual Fund Operating Expenses | ||||||||||||||||
| Janus Aspen Growth and Income Portfolio - Institutional Shares | 8.70 | % | 12.82 | % | 8.62 | % | 0.87 | % | |||||||||||
| Janus Aspen Growth and Income Portfolio - Service Shares | 8.44 | % | 12.57 | % | 8.36 | % | 1.10 | % | |||||||||||
| S&P 500® Index | 5.49 | % | 12.83 | % | 4.50 | % | |||||||||||||
| Russell 1000® Growth Index | 11.81 | % | 12.11 | % | 2.29 | % | |||||||||||||
| Lipper Quartile - Institutional Shares | 1 | st | 2 | nd | 1 | st | |||||||||||||
| Lipper Ranking - Institutional Shares based on total returns for Variable Annuity Large-Cap Core Funds | 46/203 | 52/163 | 3/79 | ||||||||||||||||
Visit janus.com/info to view up-to-date
performance and characteristic information
Data presented reflects past performance, which is no guarantee of future results. Investment results and principal value will fluctuate so that shares, when redeemed, may be worth more or less than their original cost. Due to market volatility, current performance may be higher or lower than the performance shown. Call 877.33JANUS or visit www.janus.com/info for performance current to the most recent month-end.
The Portfolio's expense ratio was determined based on average net assets as of the fiscal year ended December 31, 2006. Detailed information is available in the prospectus. All expenses are shown without the effect of expense offset arrangements. Pursuant to such arrangements, credits realized as a result of uninvested cash balances are used to reduce custodian and transfer agent expenses.
The Portfolio's performance may be affected by risks that include those associated with undervalued or overlooked companies and investments in specific industries or countries. Additional risks to the Portfolio may include those associated with investing in foreign securities, emerging markets, initial public offerings ("IPOs") and derivatives. Please see a Janus prospectus or www.janus.com/info for more information about risks, portfolio holdings and other details.
These returns do not reflect the charges and expenses of any particular insurance product or qualified plan. Returns shown would have been lower had they included insurance charges.
Returns include reinvestment of dividends from net investment income and distributions from capital gains. The returns shown do not reflect the deduction of taxes that a shareholder would pay on Portfolio distributions or the redemption of Portfolio shares.
Returns shown for Service Shares for periods prior to December 31, 1999 are derived from the historical performance of Institutional Shares, adjusted to reflect the higher operating expenses of Service Shares.
Lipper, a wholly-owned subsidiary of Reuters, provides independent insight on global collective investments including mutual funds, retirement funds, hedge funds, fund fees and expenses to the asset management and media communities. Lipper ranks the performance of mutual funds within a classification of funds that have similar investment objectives. Rankings are historical with capital gains and dividends reinvested and do not include the effect of loads.
Lipper ranking is for the Institutional Share class only; other classes may have different performance characteristics.
May 31, 1998 is the date used to calculate the since-inception Lipper ranking, which is slightly different from when the Portfolio began operations since Lipper provides fund rankings as of the last day of the month.
There is no assurance that the investment process will consistently lead to successful investing.
6 Janus Aspen Series December 31, 2007
(unaudited)
Portfolio Expenses
The example below shows you the ongoing costs (in dollars) of investing in your Portfolio and allows you to compare these costs with those of other mutual funds. Please refer to the section Useful Information About Your Portfolio Report for a detailed explanation of the information presented in these charts.
| Expense Example – Institutional Shares | Beginning Account Value (7/1/07) | Ending Account Value (12/31/07) | Expenses Paid During Period (7/1/07-12/31/07)(1) | ||||||||||||
| Actual | $ | 1,000.00 | $ | 995.30 | $ | 4.17 | |||||||||
| Hypothetical (5% return before expenses) | $ | 1,000.00 | $ | 1,021.02 | $ | 4.23 | |||||||||
| Expense Example – Service Shares | Beginning Account Value (7/1/07) | Ending Account Value (12/31/07) | Expenses Paid During Period (7/1/07-12/31/07)(1) | ||||||||||||
| Actual | $ | 1,000.00 | $ | 994.30 | $ | 5.43 | |||||||||
| Hypothetical (5% return before expenses) | $ | 1,000.00 | $ | 1,019.76 | $ | 5.50 | |||||||||
(1) Expenses are equal to the annualized expense ratio of 0.83% for Institutional Shares and 1.08% for Service Shares, multiplied by the average account value over the period, multiplied by 184/365 (to reflect the one-half year period).
See Notes to Schedule of Investments for index definitions.
The Portfolio may differ significantly from the securities held in the indices. The indices are unmanaged and not available for direct investment; therefore their performance does not reflect the expenses associated with the active management of an actual Portfolio.
See "Explanations of Charts, Tables and Financial Statements."
Effective November 7, 2007, Marc Pinto is Portfolio Manager of Janus Aspen Growth and Income Portfolio.
*The Portfolio's inception date – May 1, 1998
Janus Aspen Series December 31, 2007 7
Janus Aspen Growth and Income Portfolio
Schedule of Investments
As of December 31, 2007
| Shares/Principal/Contract Amounts | Value | ||||||||||
| Common Stock - 88.5% | |||||||||||
| Advertising Sales - 0.7% | |||||||||||
| 12,190 | Lamar Advertising Co. - Class A* | $ | 585,973 | ||||||||
| Aerospace and Defense - 2.3% | |||||||||||
| 11,885 | BAE Systems PLC | 117,807 | |||||||||
| 10,920 | Boeing Co. | 955,063 | |||||||||
| 16,695 | Embraer-Empresa Brasileira de Aeronautica S.A. (ADR)* | 761,125 | |||||||||
| 1,833,995 | |||||||||||
| Agricultural Chemicals - 1.0% | |||||||||||
| 15,720 | Syngenta A.G. (ADR)** | 796,375 | |||||||||
| Agricultural Operations - 0.4% | |||||||||||
| 6,769 | Archer-Daniels-Midland Co. | 314,285 | |||||||||
| Apparel Manufacturers - 0.8% | |||||||||||
| 40,650 | Esprit Holdings, Ltd. | 604,779 | |||||||||
| Applications Software - 1.0% | |||||||||||
| 11,631 | Infosys Technologies, Ltd. | 522,347 | |||||||||
| 27,126 | Satyam Computer Services, Ltd. | 311,113 | |||||||||
| 833,460 | |||||||||||
| Athletic Footwear - 0.5% | |||||||||||
| 5,795 | NIKE, Inc. - Class B | 372,271 | |||||||||
| Audio and Video Products - 0.4% | |||||||||||
| 5,790 | Sony Corp. (ADR) | 314,397 | |||||||||
| Automotive - Cars and Light Trucks - 0.5% | |||||||||||
| 19,915 | Tata Motors, Ltd. | 374,903 | |||||||||
| Beverages - Non-Alcoholic - 0.4% | |||||||||||
| 5,790 | Coca-Cola Co. | 355,332 | |||||||||
| Brewery - 1.2% | |||||||||||
| 11,610 | InBev N.V.** | 967,443 | |||||||||
| Cable Television - 0.3% | |||||||||||
| 11,330 | Comcast Corp. - Class A* | 206,886 | |||||||||
| Casino Hotels - 0.2% | |||||||||||
| 13,912 | Crown, Ltd.* | 164,251 | |||||||||
| Coal - 0.8% | |||||||||||
| 10,120 | Peabody Energy Corp. | 623,797 | |||||||||
| Commercial Services - Finance - 0.9% | |||||||||||
| 28,935 | Western Union Co. | 702,542 | |||||||||
| Computers - 1.1% | |||||||||||
| 34,770 | Dell, Inc.* | 852,213 | |||||||||
| Computers - Integrated Systems - 0.2% | |||||||||||
| 31,575 | Bank Tec (144A)*,ºº,§ | 189,450 | |||||||||
| Computers - Memory Devices - 2.3% | |||||||||||
| 99,960 | EMC Corp.* | 1,852,259 | |||||||||
| Cosmetics and Toiletries - 3.1% | |||||||||||
| 17,465 | Avon Products, Inc. | 690,391 | |||||||||
| 24,652 | Procter & Gamble Co. | 1,809,950 | |||||||||
| 2,500,341 | |||||||||||
| Dental Supplies and Equipment - 0.4% | |||||||||||
| 19,515 | Align Technology, Inc.*,# | 325,510 | |||||||||
| Diversified Operations - 3.8% | |||||||||||
| 72,578 | General Electric Co.** | 2,690,467 | |||||||||
| 237,000 | Melco International Development, Ltd.* | 356,249 | |||||||||
| 3,046,716 | |||||||||||
| Shares/Principal/Contract Amounts | Value | ||||||||||
| E-Commerce/Services - 0.5% | |||||||||||
| 5,975 | eBay, Inc.* | $ | 198,310 | ||||||||
| 11,605 | Liberty Media Corp. - Interactive* | 221,424 | |||||||||
| 419,734 | |||||||||||
| Electronic Components - Semiconductors - 4.3% | |||||||||||
| 1,025 | Samsung Electronics Company, Ltd. | 606,148 | |||||||||
| 3,684 | Samsung Electronics Company, Ltd. (GDR)* | 1,078,491 | |||||||||
| 8,710 | SiRF Technology Holdings, Inc.*,# | 218,882 | |||||||||
| 94,141 | Spansion, Inc. - Class A* | 369,974 | |||||||||
| 36,111 | Texas Instruments, Inc. | 1,206,108 | |||||||||
| 3,479,603 | |||||||||||
| Energy - Alternate Sources - 1.3% | |||||||||||
| 2,190 | JA Solar Holdings Company, Ltd. (ADR)* | 152,884 | |||||||||
| 10,365 | Suntech Power Holdings Company, Ltd. (ADR)* | 853,247 | |||||||||
| 1,006,131 | |||||||||||
| Enterprise Software/Services - 1.1% | |||||||||||
| 40,650 | Oracle Corp.*,** | 917,877 | |||||||||
| Entertainment Software - 1.1% | |||||||||||
| 15,685 | Electronic Arts, Inc.* | 916,161 | |||||||||
| Finance - Credit Card - 2.3% | |||||||||||
| 34,930 | American Express Co. | 1,817,059 | |||||||||
| Finance - Investment Bankers/Brokers - 2.8% | |||||||||||
| 1,820 | Goldman Sachs Group, Inc. | 391,391 | |||||||||
| 31,120 | JP Morgan Chase & Co. | 1,358,388 | |||||||||
| 10,810 | UBS A.G. (U.S. Shares)** | 497,260 | |||||||||
| 2,247,039 | |||||||||||
| Finance - Mortgage Loan Banker - 2.1% | |||||||||||
| 41,655 | Fannie Mae | 1,665,367 | |||||||||
| Food - Canned - 0.4% | |||||||||||
| 15,396 | TreeHouse Foods, Inc.* | 353,954 | |||||||||
| Food - Diversified - 1.3% | |||||||||||
| 2,312 | Nestle S.A.** | 1,061,559 | |||||||||
| Forestry - 0.5% | |||||||||||
| 5,505 | Weyerhaeuser Co. | 405,939 | |||||||||
| Hotels and Motels - 0.8% | |||||||||||
| 13,935 | Starwood Hotels & Resorts Worldwide, Inc. | 613,558 | |||||||||
| Instruments - Controls - 0.3% | |||||||||||
| 8,755 | Watts Water Technologies, Inc. - Class A# | 260,899 | |||||||||
| Machinery - Construction and Mining - 0.6% | |||||||||||
| 6,150 | Caterpillar, Inc. | 446,244 | |||||||||
| Medical - Biomedical and Genetic - 0.3% | |||||||||||
| 5,830 | Celgene Corp.* | 269,404 | |||||||||
| Medical - Drugs - 4.2% | |||||||||||
| 23,305 | Merck & Company, Inc. | 1,354,254 | |||||||||
| 9,505 | Roche Holding A.G.** | 1,641,361 | |||||||||
| 8,725 | Wyeth | 385,558 | |||||||||
| 3,381,173 | |||||||||||
| Medical - HMO - 1.3% | |||||||||||
| 17,895 | Coventry Health Care, Inc.* | 1,060,279 | |||||||||
| Medical Instruments - 0.7% | |||||||||||
| 11,035 | Medtronic, Inc. | 554,729 | |||||||||
| Medical Products - 0.6% | |||||||||||
| 1,740 | Nobel Biocare Holding A.G.** | 465,027 | |||||||||
See Notes to Schedule of Investments and Financial Statements.
8 Janus Aspen Series December 31, 2007
Schedule of Investments
As of December 31, 2007
| Shares/Principal/Contract Amounts | Value | ||||||||||
| Multimedia - 0.8% | |||||||||||
| 13,912 | Consolidated Media Holdings, Ltd. | $ | 51,290 | ||||||||
| 26,760 | News Corporation, Inc. - Class B | 568,650 | |||||||||
| 619,940 | |||||||||||
| Oil - Field Services - 1.1% | |||||||||||
| 22,875 | Halliburton Co. | 867,191 | |||||||||
| Oil Companies - Exploration and Production - 3.7% | |||||||||||
| 34,468 | EnCana Corp. (U.S. Shares) | 2,342,445 | |||||||||
| 7,200 | EOG Resources, Inc. | 642,600 | |||||||||
| 2,985,045 | |||||||||||
| Oil Companies - Integrated - 8.9% | |||||||||||
| 21,795 | Exxon Mobil Corp. | 2,041,974 | |||||||||
| 31,194 | Hess Corp. | 3,146,227 | |||||||||
| 17,671 | Suncor Energy, Inc. | 1,932,581 | |||||||||
| 7,120,782 | |||||||||||
| Oil Refining and Marketing - 1.4% | |||||||||||
| 16,035 | Valero Energy Corp. | 1,122,931 | |||||||||
| Optical Supplies - 1.0% | |||||||||||
| 5,825 | Alcon, Inc. (U.S. Shares)** | 833,208 | |||||||||
| Real Estate Operating/Development - 0.5% | |||||||||||
| 90,765 | Hang Lung Properties, Ltd. | 410,933 | |||||||||
| Retail - Apparel and Shoe - 1.4% | |||||||||||
| 31,311 | Nordstrom, Inc. | 1,150,053 | |||||||||
| Retail - Consumer Electronics - 0.7% | |||||||||||
| 10,402 | Best Buy Company, Inc.# | 547,665 | |||||||||
| Retail - Drug Store - 2.8% | |||||||||||
| 56,495 | CVS/Caremark Corp. | 2,245,676 | |||||||||
| Retail - Jewelry - 1.3% | |||||||||||
| 22,005 | Tiffany & Co. | 1,012,890 | |||||||||
| Retail - Pet Food and Supplies - 0.7% | |||||||||||
| 23,700 | PETsMART, Inc. | 557,661 | |||||||||
| Semiconductor Equipment - 0.9% | |||||||||||
| 14,920 | KLA-Tencor Corp. | 718,547 | |||||||||
| Soap and Cleaning Preparations - 0.8% | |||||||||||
| 11,605 | Reckitt Benckiser PLC | 673,095 | |||||||||
| Telecommunication Equipment - Fiber Optics - 0.9% | |||||||||||
| 30,026 | Corning, Inc. | 720,324 | |||||||||
| Telecommunication Services - 1.5% | |||||||||||
| 46,209 | Bharti Tele-Ventures, Ltd.* | 1,168,299 | |||||||||
| Television - 1.6% | |||||||||||
| 103,441 | British Sky Broadcasting Group PLC | 1,274,457 | |||||||||
| Tobacco - 2.0% | |||||||||||
| 21,485 | Altria Group, Inc. | 1,623,836 | |||||||||
| Toys - 0.9% | |||||||||||
| 27,165 | Marvel Entertainment, Inc.* | 725,577 | |||||||||
| Transportation - Services - 0.5% | |||||||||||
| 5,450 | United Parcel Service, Inc. - Class B | 385,424 | |||||||||
| Water - 0.8% | |||||||||||
| 6,400 | American States Water Co. | 241,152 | |||||||||
| 11,785 | Aqua America, Inc.# | 249,842 | |||||||||
| 4,700 | California Water Service Group# | 173,994 | |||||||||
| 664,988 | |||||||||||
| Shares/Principal/Contract Amounts | Value | ||||||||||
| Web Portals/Internet Service Providers - 2.9% | |||||||||||
| 1,336 | Google, Inc. - Class A* | $ | 923,817 | ||||||||
| 59,990 | Yahoo!, Inc.* | 1,395,368 | |||||||||
| 2,319,185 | |||||||||||
| Wireless Equipment - 2.6% | |||||||||||
| 6,420 | American Tower Corp. - Class A* | 273,492 | |||||||||
| 35,390 | Nokia Oyj (ADR)** | 1,358,622 | |||||||||
| 11,750 | QUALCOMM, Inc. | 462,363 | |||||||||
| 2,094,477 | |||||||||||
| Total Common Stock (cost $57,875,766) | 71,001,098 | ||||||||||
| Equity-Linked Structured Notes - 2.4% | |||||||||||
| Finance - Investment Bankers/Brokers - 2.4% | |||||||||||
| 28,244 | Lehman Brothers Holdings, Inc. convertible, (Corning, Inc.) 10.55% (144A)§ | 672,207 | |||||||||
| 7,355 | Merrill Lynch & Company, Inc. convertible, (Apple, Inc.) 11.30% (144A)§ | 1,222,916 | |||||||||
| Total Equity-Linked Structured Notes (cost $1,754,954) | 1,895,123 | ||||||||||
| Preferred Stock - 1.5% | |||||||||||
| Metal - Diversified - 0.6% | |||||||||||
| 3,685 | Freeport-McMoRan Copper & Gold, Inc. convertible, 6.75% | 556,140 | |||||||||
| Money Center Banks - 0.2% | |||||||||||
| 760 | UBS A.G. Jersey Branch, 37% (U.S. Shares) (144A)§ | 137,697 | |||||||||
| U.S. Government Agency - 0.7% | |||||||||||
| 11,630 | Fannie Mae, 8.25% | 299,473 | |||||||||
| 9,100 | Freddie Mac, 8.375% | 237,965 | |||||||||
| 537,438 | |||||||||||
| Total Preferred Stock (cost $1,655,438) | 1,231,275 | ||||||||||
| Purchased Options - Calls - 1.3% | |||||||||||
| 158 | ConocoPhillips (LEAPS) expires January 2009 exercise price $70.00 | 354,710 | |||||||||
| 253 | CVS/Caremark Corp. (LEAPS) expires January 2010 exercise price $35.00 | 253,000 | |||||||||
| 102 | J.C. Penney Company, Inc. (LEAPS) expires January 2010 exercise price $70.00 | 34,680 | |||||||||
| 154 | Nordstrom, Inc. (LEAPS) expires January 2010 exercise price $40.00 | 120,120 | |||||||||
| 116 | Procter & Gamble Co. expires January 2008 exercise price $70.00 | 41,760 | |||||||||
| 122 | Procter & Gamble Co. (LEAPS) expires January 2009 exercise price $65.00 | 148,840 | |||||||||
| 150 | Texas Instruments, Inc. (LEAPS) expires January 2010 exercise price $35.00 | 80,584 | |||||||||
| Total Purchased Options - Calls (premiums paid $1,045,432) | 1,033,694 | ||||||||||
See Notes to Schedule of Investments and Financial Statements.
Janus Aspen Series December 31, 2007 9
Janus Aspen Growth and Income Portfolio
Schedule of Investments
As of December 31, 2007
| Shares/Principal/Contract Amounts | Value | ||||||||||
| Money Markets - 4.5% | |||||||||||
| 2,930,430 | Janus Institutional Cash Management Fund - Institutional Shares, 4.98% | $ | 2,930,430 | ||||||||
| 665,973 | Janus Institutional Money Market Fund - Institutional Shares, 4.91% | 665,973 | |||||||||
| Total Money Markets (cost $3,596,403) | 3,596,403 | ||||||||||
| Other Securities - 1.4% | |||||||||||
| 787,966 | Allianz Dresdner Daily Asset Fund† | 787,966 | |||||||||
| 202,426 | Repurchase Agreements† | 202,426 | |||||||||
| 155,640 | Time Deposits† | 155,640 | |||||||||
| Total Other Securities (cost $1,146,032) | 1,146,032 | ||||||||||
| Total Investments (total cost $67,074,025) – 99.6% | 79,903,625 | ||||||||||
| Cash, Receivables and Other Assets, net of Liabilities – 0.4% | 317,547 | ||||||||||
| Net Assets – 100% | $ | 80,221,172 | |||||||||
Summary of Investments by Country – (Long Positions)
| Country | Value | % of Investment Securities | |||||||||
| Australia | $ | 215,541 | 0.3 | % | |||||||
| Belgium | 967,443 | 1.2 | % | ||||||||
| Bermuda | 604,779 | 0.8 | % | ||||||||
| Brazil | 761,125 | 1.0 | % | ||||||||
| Canada | 4,275,026 | 5.4 | % | ||||||||
| Cayman Islands | 853,247 | 1.1 | % | ||||||||
| China | 152,884 | 0.2 | % | ||||||||
| Finland | 1,358,622 | 1.7 | % | ||||||||
| Hong Kong | 767,182 | 1.0 | % | ||||||||
| India | 2,376,662 | 3.0 | % | ||||||||
| Japan | 314,397 | 0.4 | % | ||||||||
| South Korea | 1,684,639 | 2.1 | % | ||||||||
| Switzerland | 5,294,790 | 6.6 | % | ||||||||
| United Kingdom | 2,203,056 | 2.8 | % | ||||||||
| United States†† | 58,074,232 | 72.7 | % | ||||||||
| Total | $ | 79,903,625 | 100.0 | % | |||||||
††Includes Short-Term Securities and Other Securities (66.7% excluding Short-Term Securities and Other Securities)
Forward Currency Contracts, Open
| Currency Sold and Settlement Date | Currency Units Sold | Currency Value in U.S.$ | Unrealized Gain/(Loss) | ||||||||||||
| Euro 5/2/08 | 335,000 | $ | 489,995 | $ | 7,413 | ||||||||||
| Euro 5/14/08 | 85,000 | 124,320 | (3,537 | ) | |||||||||||
| Swiss Franc 2/15/08 | 390,000 | 345,564 | (17,744 | ) | |||||||||||
| Swiss Franc 5/2/08 | 505,000 | 449,109 | 12,331 | ||||||||||||
| Total | $ | 1,408,988 | $ | (1,537 | ) | ||||||||||
Total Return Swaps outstanding at December 31, 2007
| Counterparty | Notional Amount | Return Paid by the Portfolio | Return Received by the Portfolio | Termination Date | Unrealized Appreciation/ Depreciation | ||||||||||||||||||
| Lehman Brothers | $ | (194,296 | ) | 1-month S&P 500® Index plus LIBOR minus 5 basis points | 1-month Fannie Mae plus LIBOR plus 20 basis points | 7/24/2008 | $ | (171,077 | ) | ||||||||||||||
| Total | $ | (171,077 | ) | ||||||||||||||||||||
See Notes to Schedule of Investments and Financial Statements.
10 Janus Aspen Series December 31, 2007
Statement of Assets and Liabilities
| As of December 31, 2007 (all numbers in thousands except net asset value per share) | Janus Aspen Growth and Income Portfolio | ||||||
| Assets: | |||||||
| Investments at cost(1) | $ | 67,074 | |||||
| Investments at value(1) | $ | 76,308 | |||||
| Affiliated money market investments | 3,596 | ||||||
| Cash | 1,239 | ||||||
| Receivables: | |||||||
| Investments sold | 300 | ||||||
| Portfolio shares sold | 25 | ||||||
| Dividends | 96 | ||||||
| Interest | 15 | ||||||
| Swap contract | 28 | ||||||
| Non-interested Trustees' deferred compensation | 1 | ||||||
| Other assets | 1 | ||||||
| Forward currency contracts | 20 | ||||||
| Total Assets | 81,629 | ||||||
| Liabilities: | |||||||
| Payables: | |||||||
| Collateral for securities loaned (Note 1) | 1,146 | ||||||
| Swap contract | 6 | ||||||
| Portfolio shares repurchased | 134 | ||||||
| Advisory fees | 42 | ||||||
| Transfer agent fees and expenses | 1 | ||||||
| Distribution fees - Service Shares | 8 | ||||||
| Non-interested Trustees' fees and expenses | 1 | ||||||
| Foreign tax liability | 6 | ||||||
| Non-interested Trustees' deferred compensation fees | 1 | ||||||
| Accrued expenses | 41 | ||||||
| Forward currency contracts | 22 | ||||||
| Total Liabilities | 1,408 | ||||||
| Net Assets | $ | 80,221 | |||||
| Net Assets Consist of: | |||||||
| Capital (par value and paid-in-surplus)* | $ | 113,444 | |||||
| Undistributed net investment income/(loss)* | (24 | ) | |||||
| Undistributed net realized gain/(loss) from investments and foreign currency transactions* | (45,850 | ) | |||||
| Unrealized appreciation/(depreciation) of investments, foreign currency translations and non-interested Trustees' deferred compensation(2) | 12,651 | ||||||
| Total Net Assets | $ | 80,221 | |||||
| Net Assets - Institutional Shares | $ | 42,718 | |||||
| Shares Outstanding, $0.001 Par Value (unlimited shares authorized) | 2,147 | ||||||
| Net Asset Value Per Share | $ | 19.89 | |||||
| Net Assets - Service Shares | $ | 37,503 | |||||
| Shares Outstanding, $0.001 Par Value (unlimited shares authorized) | 1,875 | ||||||
| Net Asset Value Per Share | $ | 20.01 | |||||
* See Note 3 in Notes to Financial Statements.
(1) Investments at cost and value include $1,107,475 of securities loaned (Note 1).
(2) Net of foreign taxes on investments of $5,633.
See Notes to Financial Statements.
Janus Aspen Series December 31, 2007 11
Statement of Operations
| For the fiscal year ended December 31, 2007 (all numbers in thousands) | Janus Aspen Growth and Income Portfolio | ||||||
| Investment Income: | |||||||
| Interest | $ | 1 | |||||
| Securities lending income | 15 | ||||||
| Dividends | 2,273 | ||||||
| Dividends from affiliates | 95 | ||||||
| Foreign tax withheld | (31 | ) | |||||
| Total Investment Income | 2,353 | ||||||
| Expenses: | |||||||
| Advisory fees | 513 | ||||||
| Transfer agent fees and expenses | 5 | ||||||
| Registration fees | 17 | ||||||
| Custodian fees | 44 | ||||||
| Professional fees | 12 | ||||||
| Non-interested Trustees' fees and expenses | 6 | ||||||
| Distribution fees - Service Shares | 92 | ||||||
| Printing expenses | 48 | ||||||
| System fees | 19 | ||||||
| Other expenses | 16 | ||||||
| Non-recurring costs (Note 2) | – | ||||||
| Costs assumed by Janus Capital Management LLC (Note 2) | – | ||||||
| Total Expenses | 772 | ||||||
| Expense and Fee Offset | (2 | ) | |||||
| Net Expenses | 770 | ||||||
| Net Investment Income/(Loss) | 1,583 | ||||||
| Net Realized and Unrealized Gain/(Loss) on Investments: | |||||||
| Net realized gain/(loss) from investments and foreign currency transactions | 7,089 | ||||||
| Net realized gain/(loss) from options contracts | 9 | ||||||
| Net realized gain/(loss) from swap contracts | 140 | ||||||
| Change in net appreciation/(depreciation) of investments, foreign currency translations and non-interested Trustees' deferred compensation(1) | (1,996 | ) | |||||
| Net Gain/(Loss) on Investments | 5,242 | ||||||
| Net Increase/(Decrease) in Net Assets Resulting from Operations | $ | 6,825 | |||||
(1) Net of foreign taxes on investments of $5,633.
See Notes to Financial Statements.
12 Janus Aspen Series December 31, 2007
Statements of Changes in Net Assets
| For the fiscal years ended December 31 | Janus Aspen Growth and Income Portfolio | ||||||||||
| (all numbers in thousands) | 2007 | 2006 | |||||||||
| Operations: | |||||||||||
| Net investment income/(loss) | $ | 1,583 | $ | 1,616 | |||||||
| Net realized gain/(loss) from investment and foreign currency transactions | 7,089 | 11,449 | |||||||||
| Net realized gain/(loss) from options contracts | 9 | – | |||||||||
| Net realized gain/(loss) from swap contracts | 140 | – | |||||||||
| Change in net appreciation/(depreciation) of investments, foreign currency translations and non-interested Trustees' deferred compensation | (1,996 | ) | (5,690 | ) | |||||||
| Payment from affiliate (Note 2) | – | – | |||||||||
| Net Increase/(Decrease) in Net Assets Resulting from Operations | 6,825 | 7,375 | |||||||||
| Dividends and Distributions to Shareholders: | |||||||||||
| Net investment income* | |||||||||||
| Institutional Shares | (914 | ) | (757 | ) | |||||||
| Service Shares | (663 | ) | (513 | ) | |||||||
| Net realized gain/(loss) from investment transactions* | |||||||||||
| Institutional Shares | – | – | |||||||||
| Service Shares | – | – | |||||||||
| Net Decrease from Dividends and Distributions | (1,577 | ) | (1,270 | ) | |||||||
| Capital Share Transactions: | |||||||||||
| Shares sold | |||||||||||
| Institutional Shares | 9,073 | 18,074 | |||||||||
| Service Shares | 9,601 | 4,815 | |||||||||
| Reinvested dividends and distributions | |||||||||||
| Institutional Shares | 914 | 757 | |||||||||
| Service Shares | 663 | 513 | |||||||||
| Shares repurchased | |||||||||||
| Institutional Shares | (17,005 | ) | (12,946 | ) | |||||||
| Service Shares | (12,035 | ) | (27,253 | ) | |||||||
| Net Increase/(Decrease) from Capital Share Transactions | (8,789 | ) | (16,040 | ) | |||||||
| Net Increase/(Decrease) in Net Assets | (3,541 | ) | (9,935 | ) | |||||||
| Net Assets: | |||||||||||
| Beginning of period | 83,762 | 93,697 | |||||||||
| End of period | $ | 80,221 | $ | 83,762 | |||||||
| Undistributed net investment income/(loss)* | $ | (24 | ) | $ | 163 | ||||||
* See Note 3 in Notes to Financial Statements.
See Notes to Financial Statements.
Janus Aspen Series December 31, 2007 13
Financial Highlights
Institutional Shares
| For a share outstanding during each fiscal year ended December 31, 2007 | Janus Aspen Growth and Income Portfolio | ||||||||||||||||||||||
| 2007 | 2006 | 2005 | 2004 | 2003 | |||||||||||||||||||
| Net Asset Value, Beginning of Period | $ | 18.67 | $ | 17.57 | $ | 15.70 | $ | 14.11 | $ | 11.56 | |||||||||||||
| Income from Investment Operations: | |||||||||||||||||||||||
| Net investment income/(loss) | .37 | .29 | .10 | .09 | .15 | ||||||||||||||||||
| Net gain/(loss) on securities (both realized and unrealized) | 1.26 | 1.13 | 1.88 | 1.60 | 2.53 | ||||||||||||||||||
| Total from Investment Operations | 1.63 | 1.42 | 1.98 | 1.69 | 2.68 | ||||||||||||||||||
| Less Distributions and Other: | |||||||||||||||||||||||
| Dividends (from net investment income)* | (.41 | ) | (.32 | ) | (.11 | ) | (.10 | ) | (.13 | ) | |||||||||||||
| Distributions (from capital gains)* | – | – | – | – | – | ||||||||||||||||||
| Payment from affiliate | – | – | (1) | – | – | – | |||||||||||||||||
| Total Distributions and Other | (.41 | ) | (.32 | ) | (.11 | ) | (.10 | ) | (.13 | ) | |||||||||||||
| Net Asset Value, End of Period | $ | 19.89 | $ | 18.67 | $ | 17.57 | $ | 15.70 | $ | 14.11 | |||||||||||||
| Total Return | 8.70 | % | 8.12 | %(2) | 12.62 | % | 11.97 | % | 23.34 | % | |||||||||||||
| Net Assets, End of Period (in thousands) | $ | 42,718 | $ | 46,586 | $ | 38,146 | $ | 27,784 | $ | 26,816 | |||||||||||||
| Average Net Assets for the Period (in thousands) | $ | 46,374 | $ | 43,210 | $ | 31,257 | $ | 25,658 | $ | 29,902 | |||||||||||||
| Ratio of Gross Expenses to Average Net Assets(3)(4) | 0.82 | % | 0.86 | % | 0.74 | % | 0.77 | % | 0.83 | % | |||||||||||||
| Ratio of Net Expenses to Average Net Assets(4) | 0.82 | % | 0.86 | % | 0.74 | % | 0.77 | % | 0.83 | % | |||||||||||||
| Ratio of Net Investment Income/(Loss) to Average Net Assets | 2.02 | % | 1.97 | % | 0.62 | % | 0.63 | % | 0.85 | % | |||||||||||||
| Portfolio Turnover Rate | 74 | % | 58 | % | 37 | % | 48 | % | 43 | % | |||||||||||||
Service Shares
| For a share outstanding during each fiscal year ended December 31, 2007 | Janus Aspen Growth and Income Portfolio | ||||||||||||||||||||||
| 2007 | 2006 | 2005 | 2004 | 2003 | |||||||||||||||||||
| Net Asset Value, Beginning of Period | $ | 18.79 | $ | 17.66 | $ | 15.77 | $ | 14.22 | $ | 11.56 | |||||||||||||
| Income from Investment Operations: | |||||||||||||||||||||||
| Net investment income/(loss) | .32 | .31 | .07 | .06 | .06 | ||||||||||||||||||
| Net gain/(loss) on securities (both realized and unrealized) | 1.27 | 1.06 | 1.87 | 1.55 | 2.66 | ||||||||||||||||||
| Total from Investment Operations | 1.59 | 1.37 | 1.94 | 1.61 | 2.72 | ||||||||||||||||||
| Less Distributions and Other: | |||||||||||||||||||||||
| Dividends (from net investment income)* | (.37 | ) | (.24 | ) | (.06 | ) | (.06 | ) | (.06 | ) | |||||||||||||
| Distributions (from capital gains)* | – | – | – | – | – | ||||||||||||||||||
| Payment from affiliate | – | – | .01 | – | – | ||||||||||||||||||
| Total Distributions and Other | (.37 | ) | (.24 | ) | (.05 | ) | (.06 | ) | (.06 | ) | |||||||||||||
| Net Asset Value, End of Period | $ | 20.01 | $ | 18.79 | $ | 17.66 | $ | 15.77 | $ | 14.22 | |||||||||||||
| Total Return | 8.44 | % | 7.83 | % | 12.40 | %(5) | 11.32 | % | 23.60 | % | |||||||||||||
| Net Assets, End of Period (in thousands) | $ | 37,503 | $ | 37,176 | $ | 55,551 | $ | 55,596 | $ | 62,223 | |||||||||||||
| Average Net Assets for the Period (in thousands) | $ | 36,644 | $ | 44,953 | $ | 53,705 | $ | 56,017 | $ | 61,252 | |||||||||||||
| Ratio of Gross Expenses to Average Net Assets(3)(4) | 1.07 | % | 1.09 | % | 0.99 | % | 1.02 | % | 1.10 | % | |||||||||||||
| Ratio of Net Expenses to Average Net Assets(4) | 1.07 | % | 1.09 | % | 0.99 | % | 1.02 | % | 1.10 | % | |||||||||||||
| Ratio of Net Investment Income/(Loss) to Average Net Assets | 1.76 | % | 1.70 | % | 0.37 | % | 0.36 | % | 0.44 | % | |||||||||||||
| Portfolio Turnover Rate | 74 | % | 58 | % | 37 | % | 48 | % | 43 | % | |||||||||||||
* See Note 3 in Notes to Financial Statements.
(1) Payment from affiliate aggregated less than $.01 on a per share basis for the fiscal year ended.
(2) During the fiscal year ended, Janus Capital and/or Janus Services LLC fully reimbursed the Portfolio for a loss on a transaction resulting from certain trading, pricing and/or shareholder activity errors, which otherwise would have reduced total return by less than 0.01%.
(3) The effect of non-recurring costs assumed by Janus Capital (Note 2) is included in the ratio of gross expenses to average net assets and was less than 0.01% for the fiscal years ended 2007, 2006, 2005 and 2004.
(4) See "Explanations of Charts, Tables and Financial Statements."
(5) During the fiscal year ended, Janus Capital and/or Janus Services LLC fully reimbursed the Portfolio for a loss on a transaction resulting from certain trading, pricing and/or shareholder activity errors, which otherwise would have reduced total return by 0.05%.
See Notes to Financial Statements.
14 Janus Aspen Series December 31, 2007
Notes to Schedule of Investments
| Lipper Variable Annuity Large-Cap Core Funds | Funds that, by portfolio practice, invest at least 75% of their equity assets in companies with market capitalizations (on a three-year weighted basis) greater than 300% of the dollar-weighted median market capitalization of the middle 1,000 securities of the S&P SuperComposite 1500 Index. Large-cap core funds have more latitude in the companies in which they invest. These funds typically have an average price-to-earnings ratio, price-to-book ratio, and three-year sales-per-share growth value, compared to the S&P 500® Index. | ||||||
| Russell 1000® Growth Index | Measures the performance of those Russell 1000® Index companies with higher price-to-book ratios and higher forecasted growth values. | ||||||
| S&P 500® Index | The Standard & Poor's ("S&P") 500® Index is a commonly recognized, market capitalization weighted index of 500 widely held equity securities, designed to measure broad U.S. equity performance. | ||||||
| 144A | Securities sold under Rule 144A of the Securities Act of 1933, as amended, are subject to legal and/or contractual restrictions on resale and may not be publicly sold without registration under the 1933 Act. | ||||||
| ADR | American Depositary Receipt | ||||||
| GDR | Global Depositary Receipt | ||||||
| LEAPS | Long-Term Equity Anticipation Securities | ||||||
| PLC | Public Limited Company | ||||||
| U.S. Shares | Securities of foreign companies trading on an American Stock Exchange. | ||||||
* Non-income-producing security.
** A portion of this security has been segregated by the custodian to cover margin or segregation requirements on open futures contracts, forward currency contracts, options contracts, short sales and/or securities with extended settlement dates.
# Loaned security; a portion or all of the security is on loan at December 31, 2007.
† The security is purchased with the cash collateral received from securities on loan (Note 1).
ºº Schedule of Fair Valued Securities (as of December 31, 2007)
| Janus Aspen Growth and Income Portfolio | Value | Value as a % of Net Assets | |||||||||
| Bank Tec (144A) | $ | 189,450 | 0.2 | % | |||||||
Securities are valued at "fair value" pursuant to procedures adopted by the Portfolio's Trustees. The Schedule of Fair Valued Securities does not include international activities fair valued pursuant to a systematic fair valuation model.
§ Schedule of Restricted and Illiquid Securities (as of December 31, 2007)
| Acquisition Date | Acquisition Cost | Value | Value as % of Net Assets | ||||||||||||||||
| Janus Aspen Growth and Income Portfolio | |||||||||||||||||||
| Bank Tec (144A)ºº | 6/20/07 | $ | 252,600 | $ | 189,450 | 0.2 | % | ||||||||||||
| Lehman Brothers Holdings, Inc. convertible, (Corning, Inc.), 10.55% (144A) | 9/6/07 | 697,627 | 672,207 | 0.9 | % | ||||||||||||||
| Merrill Lynch & Company, Inc. convertible, (Apple, Inc.), 11.30% (144A) | 9/21/07 | 1,057,328 | 1,222,916 | 1.5 | % | ||||||||||||||
| UBS A.G. Jersey Branch (U.S. Shares) (144A) | 7/17/07 | 760,000 | 137,697 | 0.2 | % | ||||||||||||||
| $ | 2,767,555 | $ | 2,222,270 | 2.8 | % | ||||||||||||||
The Portfolio has registration rights for certain restricted securities held as of December 31, 2007. The issuer incurs all registration costs.
Aggregate collateral segregated to cover margin or segregation requirements on open futures contracts, forward currency contracts, options contracts, short sales and/or securities with extended settlement dates as of December 31, 2007 is noted below.
| Portfolio | Aggregate Value | ||||||
| Janus Aspen Growth and Income Portfolio | $ | 7,703,778 | |||||
Janus Aspen Series December 31, 2007 15
Notes to Financial Statements
The following section describes the organization and significant accounting policies and provides more detailed information about the schedules and tables that appear throughout this report. In addition, the Notes to Financial Statements explain the methods used in preparing and presenting this report.
1. ORGANIZATION AND SIGNIFICANT ACCOUNTING POLICIES
Janus Aspen Growth and Income Portfolio (the "Portfolio") is a series fund. The Portfolio is part of Janus Aspen Series (the "Trust"), which is organized as a Delaware statutory trust and is registered under the Investment Company Act of 1940, as amended, (the "1940 Act") as an open-end management investment company. The Trust offers seventeen Portfolios, which include multiple series of shares, with differing investment objectives and policies. The Portfolio invests primarily in equity securities. The Portfolio is classified as diversified, as defined in the 1940 Act. The Portfolio is a no-load investment.
The Portfolio currently offers two classes of shares: Institutional Shares and Service Shares. Institutional Shares are offered only in connection with investment in and payments under variable insurance contracts and to qualified retirement plans. Service Shares are offered only in connection with investment in and payments under variable insurance contracts and to qualified retirement plans that require a fee from Portfolio assets to procure distribution and administrative services to contract owners and plan participants.
The following accounting policies have been consistently followed by the Portfolio and are in conformity with accounting principles generally accepted in the United States of America in the investment company industry.
Investment Valuation
Securities are valued at the last sales price or the official closing price for securities traded on a principal securities exchange (U.S. or foreign) and on the NASDAQ National Market. Securities traded on over-the-counter markets and listed securities for which no sales are reported are valued at the latest bid price (or yield equivalent thereof) obtained from one or more dealers transacting in a market for such securities or by a pricing service approved by the Portfolio's Trustees. Short-term securities with maturities of 60 days or less may be valued at amortized cost, which approximates market value. Debt securities with a remaining maturity of greater than 60 days are valued in accordance with the evaluated bid price supplied by the pricing service. The evaluated bid price supplied by the pricing service is an evaluation that reflects such factors as security prices, yields, maturities and ratings. Foreign securities and currencies ar e converted to U.S. dollars using the applicable exchange rate in effect as of the daily close of the New York Stock Exchange ("NYSE"). When market quotations are not readily available or deemed unreliable, or events or circumstances that may affect the value of portfolio securities held by the Portfolio are identified between the closing of their principal markets and the time the net asset value ("NAV") is determined, securities may be valued at fair value as determined in good faith under procedures established by and under the supervision of the Portfolio's Trustees. Circumstances in which fair value pricing may be utilized include, but are not limited to: (i) when significant events occur which may affect the securities of a single issuer, such as mergers, bankruptcies, or significant issuer specific developments; (ii) when significant events occur which may affect an entire market, such as natural disasters or significant governmen tal actions; and (iii) when non-significant events occur such as markets closing early or not opening, security trading halts, or pricing of non-valued securities and restricted or non-public securities. The Portfolio may use a systematic fair valuation model provided by an independent third party to value international equity securities in order to adjust for stale pricing, which may occur between the close of certain foreign exchanges and the NYSE.
Investment Transactions and Investment Income
Investment transactions are accounted for as of the date purchased or sold (trade date). Dividend income is recorded on the ex-dividend date. Certain dividends from foreign securities will be recorded as soon as the Trust is informed of the dividend if such information is obtained subsequent to the ex-dividend date. Dividends from foreign securities may be subject to withholding taxes in foreign jurisdictions. Interest income is recorded on the accrual basis and includes amortization of premiums and accretion of discounts. Gains and losses are determined on the identified cost basis, which is the same basis used for federal income tax purposes. Income, as well as gains and losses, both realized and unrealized, are allocated daily to each class of shares based upon the ratio of net assets represented by each class as a percentage of total net assets.
Expenses
The Portfolio bears expenses incurred specifically on its behalf as well as a portion of general expenses. Each class of shares bears expenses incurred specifically on its behalf and, in addition, each class bears a portion of general expenses, which may be based upon relative net assets of each class. Expenses are allocated daily to each class of shares based upon the ratio of net assets represented by each class as a percentage of total net assets. Expenses directly attributable to a specific class of shares are charged against the operations of such class.
Securities Lending
Under procedures adopted by the Trustees, the Portfolio may lend securities to qualified parties (typically brokers or other financial institutions) who need to borrow securities in order to complete certain transactions such as covering short sales, avoiding failures to deliver securities or completing arbitrage activities. The Portfolio may seek to earn additional income through securities lending. There is the risk of delay in recovering a loaned security or the risk of loss in collateral rights if the borrower fails financially. Janus Capital Management LLC ("Janus Capital") makes efforts to balance the benefits and risks from granting such loans.
State Street Bank and Trust Company served as the Portfolio's lending agent for the period January 1, 2007 through May 24, 2007. Effective May 25, 2007, Dresdner Bank AG became the lending agent for the Portfolio.
16 Janus Aspen Series December 31, 2007
The Portfolio does not have the right to vote on securities while they are being lent; however, the Portfolio may attempt to call back the loan and vote the proxy if time permits. All loans will be continuously secured by collateral which may consist of cash, U.S. Government securities, domestic and foreign short-term debt instruments, letters of credit, time deposits, repurchase agreements, or such other collateral permitted by the Securities and Exchange Commission ("SEC"). Cash collateral may be invested in affiliated money market funds or other accounts advised by Janus Capital to the extent consistent with exemptive relief obtained from the SEC or as permitted by the 1940 Act and rules promulgated thereunder.
Dresdner Bank AG (the "Lending Agent") may also invest the cash collateral in the Allianz Dresdner Daily Asset Fund or investments in unaffiliated money market funds or accounts, mutually agreed to by the Portfolio and the Lending Agent, that comply with Rule 2a-7 of the 1940 Act relating to money market funds.
As of December 31, 2007, the Portfolio had on loan securities valued as indicated:
| Portfolio | Value at December 31, 2007 | ||||||
| Janus Aspen Growth and Income Portfolio | $ | 1,107,475 | |||||
As of December 31, 2007, the Portfolio received cash collateral for securities lending activity as indicated:
| Portfolio | Cash Collateral at December 31, 2007 | ||||||
| Janus Aspen Growth and Income Portfolio | $ | 1,146,032 | |||||
As of December 31, 2007, all cash collateral received by the Portfolio was invested in the Allianz Dresdner Daily Asset Fund, except for $202,426 and $155,640 which were invested in Repurchase Agreements and Time Deposits, respectively.
The value of the collateral must be at least 102% of the market value of the loaned securities that are denominated in U.S. dollars and 105% of the market value of the loaned securities that are not denominated in U.S. dollars. Loaned securities and related collateral are marked-to-market each business day based upon the market value of the loaned securities at the close of business, employing the most recent available pricing information. Collateral levels are then adjusted based on this mark-to-market evaluation.
The borrower pays fees at the Portfolio's direction to the Lending Agent. The Lending Agent may retain a portion of the interest earned on the cash collateral invested. The cash collateral invested by the Lending Agent is disclosed in the Schedule of Investments (if applicable). The lending fees and the Portfolio's portion of the interest income earned on cash collateral are included on the Statement of Operations (if applicable).
Interfund Lending
Pursuant to an exemptive order received from the SEC, the Portfolio may be party to an interfund lending agreement between the Portfolio and other Janus Capital sponsored mutual funds, which permits it to borrow or lend cash at a rate beneficial to both the borrowing and lending funds. Outstanding borrowings from all sources totaling 10% or more of the borrowing Portfolio's total assets must be collateralized at 102% of the outstanding principal value of the loan; loans of less than 10% may be unsecured. During the fiscal year ended December 31, 2007, there were no outstanding interfund borrowing or lending arrangements for the Portfolio.
Forward Currency Transactions
The Portfolio may enter into forward currency contracts in order to reduce its exposure to changes in foreign currency exchange rates on its foreign portfolio holdings and to lock in the U.S. dollar cost of firm purchase and sale commitments for securities denominated in or exposed to foreign currencies. A forward currency exchange contract is a commitment to purchase or sell a foreign currency at a future date at a negotiated rate. The gain or loss arising from the difference between the U.S. dollar cost of the original contract and the value of the foreign currency in U.S. dollars upon closing a contract is included in "Net realized gain/(loss) from investment and foreign currency transactions" on the Statement of Operations (if applicable).
Forward currency contracts held by the Portfolio are fully collateralized by other securities, which are denoted in the accompanying Schedule of Investments (if applicable). The collateral is evaluated daily to ensure its market value equals or exceeds the current market value of the corresponding forward currency contracts.
Futures Contracts
The Portfolio may enter into futures contracts to gain exposure to the stock market pending investment of cash balances or to meet liquidity needs. The Portfolio may also use such derivative instruments to hedge or protect from adverse movements in securities prices, currency rates or interest rates. The use of futures contracts may involve risks such as the possibility of illiquid markets or imperfect correlation between the value of the contracts and the underlying securities, or that the counterparty will fail to perform its obligations.
Futures contracts are marked-to-market daily, and the daily variation margin is recorded as a receivable or payable on the Statement of Assets and Liabilities (if applicable). When a contract is closed, a realized gain or loss is recorded as "Net realized gain/(loss) from futures contracts" on the Statement of
Janus Aspen Series December 31, 2007 17
Notes to Financial Statements (continued)
Operations (if applicable) equal to the difference between the opening and closing value of the contract. Generally, futures contracts are marked-to-market (i.e., treated as realized and subject to distribution) for federal income tax purposes at fiscal year-end. Securities designated as collateral for market value on futures contracts are noted in the Schedule of Investments (if applicable). Such collateral is in the possession of the Portfolio's custodian. As of December 31, 2007, the Portfolio was not invested in futures contracts.
Swaps
The Portfolio may enter into swap agreements to hedge its exposure to interest rates and credit risk or for investment purposes. A swap is an agreement that obligates two parties to exchange a series of cash flows at specified intervals based upon or calculated by reference to changes in specified prices or rates for a specified amount of an underlying asset. The payment flows are usually netted against each other, with the difference being paid by one party to the other. Swap contracts are reported as an asset and liability on the Statement of Assets and Liabilities. Realized gains and losses are reported in "Net realized gain/(loss) from swap contracts" on the Statement of Operations (if applicable).
Risks may arise as a result of the failure of the counterparty to the swap contract to comply with the terms of the swap contract. The loss incurred by the failure of a counterparty is generally limited to the net interim payment to be received by the Portfolio, and/or the termination value. Therefore, the Portfolio considers the creditworthiness of each counterparty to a swap contract in evaluating potential credit risk. Additionally, risks may arise from unanticipated movements in interest rates or in the value of the underlying securities.
Options Contracts
The Portfolio may purchase or write put and call options on futures contracts and on portfolio securities for hedging purposes or as a substitute for an investment. The Portfolio may also purchase or write put and call options on foreign currencies in a manner similar to that in which futures or forward contracts on foreign currencies will be utilized. The Portfolio generally invests in options to hedge against adverse movements in the value of portfolio holdings.
When an option is written, the Portfolio receives a premium and becomes obligated to sell or purchase the underlying security at a fixed price, upon exercise of the option. In writing an option, the Portfolio bears the market risk of an unfavorable change in the price of the security underlying the written option. Exercise of an option written by the Portfolio could result in the Portfolio buying or selling a security at a price different from the current market value.
When an option is exercised, the proceeds on sales for a written call option, the purchase cost for a written put option, or the cost of the security for a purchased put or call option is adjusted by the amount of premium received or paid.
The Portfolio may also purchase and write exchange-listed and over-the-counter put and call options on domestic securities indices, and on foreign securities indices listed on domestic and foreign securities exchanges. Options on securities indices are similar to options on securities except that (1) the expiration cycles of securities index options are monthly, while those of securities options are currently quarterly, and (2) the delivery requirements are different. Instead of giving the right to take or make delivery of securities at a specified price, an option on a securities index gives the holder the right to receive a cash ''exercise settlement amount'' equal to (a) the amount, if any, by which the fixed exercise price of the option exceeds (in the case of a put) or is less than (in the case of a call) the closing value of the underlying index on the date of exercise, multiplied by (b) a fixed ''index multiplier.'' Receipt of this ca sh amount will depend upon the closing level of the securities index upon which the option is based being greater than, in the case of a call, or less than, in the case of a put, the exercise price of the index and the exercise price of the option times a specified multiple. The writer of the option is obligated, in return for the premium received, to make delivery of this amount.
Holdings designated to cover outstanding written options are noted in the Schedule of Investments (if applicable). Options written are reported as a liability on the Statement of Assets and Liabilities as "Options written at value" (if applicable). Realized gains and losses are reported as "Net realized gain/(loss) from options contracts" on the Statement of Operations (if applicable). The Portfolio recognized realized gains of $4,427 from written options during the fiscal year ended December 31, 2007.
The risk in writing a call option is that the Portfolio gives up the opportunity for profit if the market price of the security increases and the option is exercised. The risk in writing a put option is that the Portfolio may incur a loss if the market price of the security decreases and the option is exercised. The risk in buying an option is that the Portfolio pays a premium whether or not the option is exercised. The use of such instruments may involve certain additional risks as a result of unanticipated movement in the market. A lack of correlation between the value of an instrument underlying an option and the asset being hedged, or unexpected adverse price movements, could render the Portfolio's hedging strategy unsuccessful. In addition, there can be no assurance that a liquid secondary market will exist for any option purchased or sold. There is no limit to the loss that the Portfolio may recognize due to written call options.
18 Janus Aspen Series December 31, 2007
Written option activity for the fiscal year ended December 31, 2007, was as follows:
| Call Options | Number of Contracts | Premiums Received | |||||||||
| Janus Aspen Growth and Income Portfolio | |||||||||||
| Options Outstanding at December 31, 2006 | – | $ | – | ||||||||
| Options written | 160 | 14,370 | |||||||||
| Options expired | (110 | ) | (4,101 | ) | |||||||
| Options closed | (48 | ) | (10,063 | ) | |||||||
| Options exercised | (2 | ) | (206 | ) | |||||||
| Options outstanding at December 31, 2007 | – | $ | – | ||||||||
| Put Options | Number of Contracts | Premiums Received | |||||||||
| Janus Aspen Growth and Income Portfolio | |||||||||||
| Options outstanding at December 31, 2006 | 116 | $ | 16,824 | ||||||||
| Options written | |||||||||||
| Options expired | |||||||||||
| Options closed | (116 | ) | (16,824 | ) | |||||||
| Options exercised | |||||||||||
| Options outstanding at December 31, 2007 | – | $ | – | ||||||||
Short Sales
The Portfolio may engage in "short sales against the box." Short sales against the box involve either selling short a security that the Portfolio owns, or selling short a security that the Portfolio has the right to obtain, for delivery at a specified date in the future. The Portfolio may enter into a short sale against the box to hedge against anticipated declines in the market price of portfolio securities by locking in gains. The Portfolio does not deliver from its portfolio the securities sold short and does not immediately receive the proceeds of the short sale. The Portfolio borrows the securities sold short and receives proceeds from the short sale only when it delivers the securities to the lender. If the value of the securities sold short increases prior to the scheduled delivery date, the Portfolio loses the opportunity to participate in the gain.
The Portfolio may engage in short sales when the portfolio manager anticipates that a security's market purchase price will be less than its borrowing price. To complete the transaction, the Portfolio must borrow the security to deliver it to the purchaser and buy that same security in the market to return it to the lender. The total market value of all of the Portfolio's short sale positions will not exceed 10% of its assets. Although the potential for gain is limited to the difference between the price at which the Portfolio sold the security short and the cost of borrowing the security, its potential for loss is theoretically unlimited because there is no limit to the cost of replacing the borrowed security. There is no assurance that the Portfolio will be able to close out a short position at a particular time or at an acceptable price. A gain or a loss will be recognized upon termination of a short sale. There is no limit to the size of any loss that the Portfolio may recognize upon termination of a short sale. Short sales held by the Portfolio are fully collateralized by other securities, which are denoted in the accompanying Schedule of Investments (if applicable). As of December 31, 2007, the Portfolio was not engaged in short sales.
Foreign Currency Translations
The Portfolio does not isolate that portion of the results of operations resulting from changes in foreign exchange rates on investments from the fluctuations arising from changes in market prices of securities held at the date of the financial statements. Net unrealized appreciation or depreciation on investments and foreign currency translation arise from changes in the value of assets and liabilities, including investments in securities held at the date of the financial statements, resulting from changes in the exchange rates and changes in market prices of securities held.
Currency gains and losses are also calculated on payables and receivables that are denominated in foreign currencies. The payables and receivables are generally related to foreign security transactions and income.
Foreign currency-denominated assets and forward currency contracts may involve more risks than domestic transactions, including currency risk, political and economic risk, regulatory risk and market risk. Risks may arise from the potential inability of a counterparty to meet the terms of a contract and from unanticipated movements in the value of foreign currencies relative to the U.S. dollar.
When-issued Securities
The Portfolio may purchase or sell securities on a when-issued or forward commitment basis. The price of the underlying securities and date when the securities will be delivered and paid for are fixed at the time the transaction is negotiated. Losses may arise due to changes in the market value of the securities or from the inability of counterparties to meet the terms of the contract. In connection with such purchases, the Portfolio may hold liquid assets as collateral with the Portfolio's custodian sufficient to cover the purchase price. As of December 31, 2007, the Portfolio was not invested in when-issued securities.
Equity-Linked Structured Notes
The Portfolio may invest in equity-linked structured notes. Equity-linked structured notes are derivative securities which are specially designed to combine the characteristics of one or more underlying securities and their equity derivatives in a single note form. The return and/or yield or income component may be based on the performance of the underlying equity securities, an equity index, and/or option positions. Equity-linked structured notes are typically offered in limited transactions by financial institutions in either registered or non-registered form. An investment in equity-linked structured notes creates exposure to the credit risk of the issuing financial institution, as well as to the market risk of the underlying securities. There is no guaranteed return of principal with these securities and the appreciation potential of these securities may be limited by a maximum payment or call right. In certain cases, equity-linked struc tured notes may be more volatile and less liquid than less complex securities or other types of fixed-income securities. Such securities may exhibit price behavior that does not correlate with other fixed-income securities.
Janus Aspen Series December 31, 2007 19
Notes to Financial Statements (continued)
Initial Public Offerings
The Portfolio may invest in initial public offerings ("IPOs"). IPOs and other investment techniques may have a magnified performance impact on a fund with a small asset base. The Portfolio may not experience similar performance as its assets grow.
Restricted Security Transactions
Restricted securities held by the Portfolio may not be sold except in exempt transactions or in a public offering registered under the Securities Act of 1933. The risk of investing in such securities is generally greater than the risk of investing in the securities of widely held, publicly traded companies. Lack of a secondary market and resale restrictions may result in the inability of the Portfolio to sell a security at a fair price and may substantially delay the sale of the security. In addition, these securities may exhibit greater price volatility than securities for which secondary markets exist. As of December 31, 2007, the Portfolio was invested in restricted securities.
Dividend Distributions
The Portfolio may make semiannual distributions of substantially all of its investment income and an annual distribution of its net realized capital gains (if any). The majority of dividends and net realized capital gains distributions from the Portfolio may be automatically reinvested into additional shares of the Portfolio, based upon the discretion of the shareholder.
Estimates
The preparation of financial statements in conformity with accounting principles generally accepted in the United States of America requires management to make estimates and assumptions that affect the reported amount of assets and liabilities and disclosure of contingent assets and liabilities at the date of the financial statements, and the reported amounts of income and expenses during the reporting period. Actual results could differ from those estimates.
Federal Income Taxes
No provision for income taxes is included in the accompanying financial statements, as the Portfolio intends to distribute to shareholders all taxable investment income and realized gains and otherwise comply with Subchapter M of the Internal Revenue Code applicable to regulated investment companies.
New Accounting Pronouncements
In July 2006, the Financial Accounting Standards Board ("FASB") issued Interpretation No. 48, "Accounting for Uncertainty in Income Taxes – an Interpretation of FASB Statement No. 109" (the "Interpretation"). The Interpretation establishes for all entities, including pass-through entities such as the Portfolio, a minimum threshold for financial statement recognition of the benefit of positions taken in filing tax returns (including whether an entity is taxable in a particular jurisdiction), and requires certain expanded tax disclosures. A calendar year open-end or closed-end fund was required to implement the Interpretation no later than June 29, 2007 (the last business day of the semi-annual reporting period), and the Interpretation also applies to all open tax years as of the date of effectiveness. Management has evaluated the application of the Interpretation to the Portfolio and has determined there is no significant impact on the Portfolio's financial statements.
In September 2006, the FASB issued Statement of Financial Accounting Standards No. 157, "Fair Value Measurements" ("SFAS No. 157"), which defines fair value, establishes a framework for measuring fair value in generally accepted accounting principles, and expands disclosures about fair value measurements. SFAS No. 157 does not require new fair value measurements, but is applied to the extent that other accounting pronouncements require or permit fair value measurements. SFAS No. 157 emphasizes that fair value is a market-based measurement that should be determined based on the assumptions that market participants would use in pricing an asset or liability. SFAS No. 157 is effective for fiscal years beginning after November 15, 2007 and interim periods within those fiscal years. Management does not believe the adoption of SFAS No. 157 will impact the financial statement amounts, however, the Portfolio will be required to disclose the extent t o which fair value is used to measure assets and liabilities and the inputs used to develop the measurements.
2. INVESTMENT ADVISORY AGREEMENTS AND OTHER TRANSACTIONS WITH AFFILIATES
The Portfolio pays a monthly advisory fee to Janus Capital based upon average daily net assets and calculated at the annual rate of 0.62%.
Janus Services LLC ("Janus Services"), a wholly-owned subsidiary of Janus Capital, is the Portfolio's transfer agent. Janus Services receives certain out-of-pocket expenses for transfer agent services.
Certain officers of the Portfolio may also be officers and/or directors of Janus Capital. Such officers receive no compensation from the Portfolio, except for the Portfolio's Chief Compliance Officer. Effective January 1, 2006, the Portfolio began reimbursing the adviser for a portion of the compensation paid to the Chief Compliance Officer of the Trust. Total compensation of $3,078 was paid by the Portfolio during the fiscal year ended December 31, 2007. The Portfolio's portion is reported as part of "Other Expenses" on the Statement of Operations.
The Board of Trustees has adopted a deferred compensation plan (the "Deferred Plan") for independent Trustees to elect to defer receipt of all or a portion of the annual compensation they are entitled to receive from the Portfolio. All deferred fees are credited to an account established in the name of the Trustees. The amounts credited to the account then increase or decrease, as the case may be, in accordance with the performance of one or more of the Janus funds that are selected by the Trustees. The account balance continues to fluctuate in accordance with the performance of the
20 Janus Aspen Series December 31, 2007
selected fund or funds until final payment of all amounts credited to the account. The fluctuation of the account balance is recorded by the Portfolio as unrealized appreciation/(depreciation) and is shown as of December 31, 2007 on the Statement of Assets and Liabilities as an asset, "Noninterested Trustees' deferred compensation," and a liability, "Noninterested Trustees' deferred compensation fees." Additionally, the recorded unrealized appreciation/(depreciation) is included in "Unrealized net appreciation/(depreciation) of investments, foreign currency translations and non-interested Trustees' deferred compensation" on the Statement of Assets and Liabilities. Deferred compensation expenses for the fiscal year ended December 31, 2007 are included in "Non-interested Trustees' fees and expenses" on the Statement of Operations. Trustees are allowed to change their designation of mutual funds from time to time. Amounts will be deferred until distributed in accordance with the Deferred Plan. No deferred fees were paid to any Trustee under the Deferred Plan during the fiscal year ended December 31, 2007.
For the fiscal year ended December 31, 2007, Janus Capital assumed $24,421 of legal, consulting and Trustee costs and fees incurred by the funds in Janus Investment Fund, Janus Aspen Series and Janus Adviser Series (the "Funds") in connection with the regulatory and civil litigation matters discussed in Note 6. These non-recurring costs were allocated to all Funds based on the Funds' respective net assets as of July 31, 2004. Additionally, all future non-recurring costs will be allocated to the Funds based on the Funds' respective net assets on July 31, 2004. These "Non-recurring costs" and "Costs assumed by Janus Capital" are shown on the Statement of Operations.
During the fiscal year ended December 31, 2006, Janus Capital reimbursed the Portfolio $1 for Institutional Shares as a result of dilutions caused by certain trading and/or pricing errors. Reimbursements are included in "Payment from affiliate" on the Statements of Changes in Net Assets.
Janus Distributors LLC, a wholly-owned subsidiary of Janus Capital, is a distributor of the Portfolio. Service Shares have adopted a Distribution and Shareholder Servicing Plan (the "Plan") pursuant to Rule 12b-1 under the 1940 Act. The Plan authorizes payments by the Portfolio in connection with the distribution of Service Shares at an annual rate of up to 0.25% of Service Share's average daily net assets.
The Portfolio's expenses may be reduced by expense offsets from an unaffiliated custodian and/or transfer agent. Such credits or offsets are included in "Expense and Fee Offset" on the Statement of Operations. The transfer agent fee offsets received during the period reduce Transfer Agent Fees and Expenses. Custodian offsets received reduce Custodian Fees. The Portfolio could have employed the assets used by the custodian and/or transfer agent to produce income if it had not entered into an expense offset arrangement.
The Portfolio may invest in money market funds, including funds managed by Janus Capital. During the fiscal year ended December 31, 2007, the Portfolio recorded distributions from affiliated investment companies as affiliated dividend income, and had the following affiliated purchases and sales:
| Purchases Shares/Cost | Sales Shares/Cost | Dividend Income | Value at 12/31/07 | ||||||||||||||||
| Janus Aspen Growth and Income Portfolio | |||||||||||||||||||
| Janus Institutional Cash Management Fund – Institutional Shares | $ | 7,224,331 | $ | 4,293,901 | $ | 47,878 | $ | 2,930,430 | |||||||||||
| Janus Institutional Cash Reserves Fund | 662,684 | 722,684 | 1,458 | – | |||||||||||||||
| Janus Institutional Money Market Fund – Institutional Shares | 20,847,861 | 20,181,888 | 31,984 | 665,973 | |||||||||||||||
| Janus Money Market Fund – Institutional Shares | 6,598,068 | 8,616,752 | 13,959 | – | |||||||||||||||
| $ | 35,332,944 | $ | 33,815,225 | $ | 95,279 | $ | 3,596,403 | ||||||||||||
3. FEDERAL INCOME TAX
The tax components of capital shown in the table below represent: (1) distribution requirements the Portfolio must satisfy under the income tax regulations; (2) losses or deductions the Portfolio may be able to offset against income and gains realized in future years; and (3) unrealized appreciation or depreciation of investments for federal income tax purposes (reduced by foreign tax liability).
Other book to tax differences in the current year may consist of deferred compensation, derivatives, and foreign currency contract adjustments. The Portfolio has elected to treat gains and losses on forward foreign currency contracts as capital gains and losses. Other foreign currency gains and losses on debt instruments are treated as ordinary income for federal income tax purposes pursuant to Section 988 of the Internal Revenue Code.
In 2007, the Portfolio incurred "Post-October" losses during the period from November 1, 2007 through December 31, 2007. These losses will be deferred for tax purposes and recognized in 2008.
| Portfolio | Undistributed Ordinary Income | Undistributed Long–Term Gains | Accumulated Capital Losses | Post-October Deferral | Other Book to Tax Differences | Net Tax Appreciation/ (Depreciation) | |||||||||||||||||||||
| Janus Aspen Growth and Income Portfolio(1) | $ | 28 | $ | – | $ | (45,457,498 | ) | $ | (8,139 | ) | $ | (171,548 | ) | $ | 12,414,144 | ||||||||||||
(1) Capital loss carryover is subject to annual limitations.
Janus Aspen Series December 31, 2007 21
Notes to Financial Statements (continued)
Accumulated capital losses noted below represent net capital loss carryovers, as of December 31, 2007, that may be available to offset future realized capital gains and thereby reduce future taxable gains distributions. The table below shows the expiration dates of the carryovers.
Capital Loss Carryover Expiration Schedule
For the year ended December 31, 2007
| Portfolio | December 31, 2008 | December 31, 2009 | December 31, 2010 | December 31, 2011 | |||||||||||||||
| Janus Aspen Growth and Income Portfolio(1) | $ | (516,392 | ) | $ | (516,392 | ) | $ | (28,683,410 | ) | $ | (15,741,304 | ) | |||||||
(1) Capital loss carryover is subject to annual limitations.
During the year ended December 31, 2007, the following capital loss carryover was utilized by the Portfolio as indicated in the table below.
| Portfolio | Capital Loss Carryover Utilized | ||||||
| Janus Aspen Growth and Income Portfolio | $ | 7,635,860 | |||||
The aggregate cost of investments and the composition of unrealized appreciation and depreciation of investment securities for federal income tax purposes as of December 31, 2007 are noted below.
Unrealized appreciation and unrealized depreciation in the table below exclude appreciation/depreciation on foreign currency translations. The primary difference between book and tax appreciation or depreciation of investments is wash sale loss deferrals.
| Portfolio | Federal Tax Cost | Unrealized Appreciation | Unrealized (Depreciation) | ||||||||||||
| Janus Aspen Growth and Income Portfolio | $ | 67,483,848 | $ | 16,069,589 | $ | (3,649,812 | ) | ||||||||
Income and capital gains distributions are determined in accordance with income tax regulations that may differ from accounting principles generally accepted in the United States of America. These differences are due to differing treatments for items such as net short-term gains, deferral of wash sale losses, foreign currency transactions, net investment losses and capital loss carryovers. Certain permanent differences such as tax returns of capital and net investment losses noted below have been reclassified to paid-in capital.
| For the fiscal year ended December 31, 2007 | Distributions | ||||||||||||||||||
| Portfolio | From Ordinary Income | From Long-Term Capital Gains | Tax Return of Capital | Net Investment Loss | |||||||||||||||
| Janus Aspen Growth and Income Portfolio | $ | 1,577,256 | $ | – | $ | – | $ | – | |||||||||||
| For the fiscal year ended December 31, 2006 | Distributions | ||||||||||||||||||
| Portfolio | From Ordinary Income | From Long-Term Capital Gains | Tax Return of Capital | Net Investment Loss | |||||||||||||||
| Janus Aspen Growth and Income Portfolio | $ | 1,269,497 | $ | – | $ | – | $ | – | |||||||||||
22 Janus Aspen Series December 31, 2007
4. CAPITAL SHARE TRANSACTIONS
| For each fiscal year ended December 31 | Janus Aspen Growth and Income Portfolio | ||||||||||
| (all numbers in thousands) | 2007 | 2006 | |||||||||
| Transactions in Portfolio Shares – Institutional Shares | |||||||||||
| Shares sold | 464 | 994 | |||||||||
| Reinvested dividends and distributions | 45 | 42 | |||||||||
| Shares repurchased | �� | (857 | ) | (712 | ) | ||||||
| Net Increase/(Decrease) in Portfolio Shares | (348 | ) | 324 | ||||||||
| Shares Outstanding, Beginning of Period | 2,495 | 2,171 | |||||||||
| Shares Outstanding, End of Period | 2,147 | 2,495 | |||||||||
| Transactions in Portfolio Shares – Service Shares | |||||||||||
| Shares sold | 471 | 261 | |||||||||
| Reinvested dividends and distributions | 33 | 28 | |||||||||
| Shares repurchased | (608 | ) | (1,456 | ) | |||||||
| Net Increase/(Decrease) in Portfolio Shares | (104 | ) | (1,167 | ) | |||||||
| Shares Outstanding, Beginning of Period | 1,979 | 3,146 | |||||||||
| Shares Outstanding, End of Period | 1,875 | 1,979 | |||||||||
5. PURCHASES AND SALES OF INVESTMENT SECURITIES
For the fiscal year ended December 31, 2007, the aggregate cost of purchases and proceeds from sales of investment securities (excluding short-term securities and options) were as follows:
| Portfolio | Purchases of Securities | Proceeds from Sales of Securities | Purchases of Long-Term U.S. Government Obligations | Proceeds from Sales of Long-Term U.S. Government Obligations | |||||||||||||||
| Janus Aspen Growth and Income Portfolio | $ | 59,245,624 | $ | 70,255,119 | $ | – | $ | – | |||||||||||
6. PENDING LEGAL MATTERS
In the fall of 2003, the Securities and Exchange Commission ("SEC"), the Office of the New York State Attorney General ("NYAG"), the Colorado Attorney General ("COAG"), and the Colorado Division of Securities ("CDS") announced that they were investigating alleged frequent trading practices in the mutual fund industry. On August 18, 2004, Janus Capital announced that it had reached final settlements with the SEC, the NYAG, the COAG, and the CDS related to such regulators' investigations into Janus Capital's frequent trading arrangements.
A number of civil lawsuits were brought against Janus Capital and certain of its affiliates, the Janus funds, and related entities and individuals based on allegations similar to those announced by the above regulators and were filed in several state and federal jurisdictions. Such lawsuits alleged a variety of theories for recovery including, but not limited to, the federal securities laws, other federal statutes (including ERISA), and various common law doctrines. The Judicial Panel on Multidistrict Litigation transferred these actions to the U.S. District Court for the District of Maryland (the "Court") for coordinated proceedings. On September 29, 2004, five consolidated amended complaints were filed with the Court that generally include: (i) claims by a putative class of investors in certain Janus funds asserting claims on behalf of the investor class (Marini, et al. v. Janus Investment Fund, et al., U.S. District Court, District of Maryland, Case No. 04-CV-00497); (ii) derivative claims by investors in certain Janus funds ostensibly on behalf of such funds (Steinberg et al. v. Janus Capital Management, LLC et al., U.S. District Court, District of Maryland, Case No. 04-CV-00518); (iii) claims on behalf of participants in the Janus 401(k) plan (Wangberger v. Janus Capital Group Inc., 401(k) Advisory Committee, et al., U.S. District Court, District of Maryland, Case No. JFM-05-2711); (iv) claims brought on behalf of shareholders of Janus Capital Group Inc. ("JCGI") on a derivative basis against the Board of Directors of JCGI (Chasen v. Whiston, et al., U.S. Dis trict Court, District of Maryland, Case No. 04-MD-00855); and (v) claims by a putative class of shareholders of JCGI asserting claims on behalf of the shareholders (Wiggins, et al. v. Janus
Janus Aspen Series December 31, 2007 23
Notes to Financial Statements (continued)
Capital Group, Inc., et al., U.S. District Court, District of Maryland, Case No. 04-CV-00818). Each of the five complaints initially named JCGI and/or Janus Capital as a defendant. In addition, the following were also named as defendants in one or more of the actions: Janus Investment Fund ("JIF"), Janus Aspen Series ("JAS"), Janus Adviser Series ("JAD"), Janus Distributors LLC, Enhanced Investment Technologies, LLC ("INTECH"), Bay Isle Financial LLC ("Bay Isle"), Perkins, Wolf, McDonnell and Company, LLC ("Perkins"), the Advisory Committee of the Janus 401(k) plan, and the current or former directors of JCGI.
On August 25, 2005, the Court entered orders dismissing most of the claims asserted against Janus Capital and its affiliates by fund investors in the Marini and Steinberg cases (actions (i) and (ii) above) except certain claims under Section 10(b) of the Securities Exchange Act of 1934 and under Section 36(b) of the Investment Company Act of 1940, as amended (the "1940 Act"). On August 15, 2006, the Wangberger complaint in the 401(k) plan class action (action (iii) above) was dismissed by the district court with prejudice. The plaintiff appealed that dismissal decision to the United States Court of Appeals for the Fourth Circuit. The appeal is still pending and argument in the matter was held in December 2007. The Court also dismissed the Chasen lawsuit (action (iv) above) against JCGI's Board of Directors without leave to amend. Finally, a Motion to Dismiss the Wiggins suit (action (v) above) was granted and the matter was dismissed in May 2007. However, in June 2007, Plaintiffs appealed that dismissal to the United States Court of Appeals for the Fourth Circuit. That appeal is currently pending.
In addition to the lawsuits described above, the Auditor of the State of West Virginia ("Auditor"), in his capacity as securities commissioner, has initiated administrative proceedings against many of the defendants in the market timing cases (including JCGI and Janus Capital) and, as a part of its relief, is seeking disgorgement and other monetary relief based on similar market timing allegations (In the Matter of Janus Capital Group Inc. et al., Before the Securities Commissioner, State of West Virginia, Summary Order No. 05-1320). The respondents in these proceedings collectively sought a Writ of Prohibition in state court, which was denied. Their subsequent Petition for Appeal was also denied. Consequently, in September 2006, JCGI and Janus Capital filed their answer to the Auditor's summary order instituting proceedings and requested a hearing. A status conference was held on June 28, 2007, during which the parties were ordered t o submit their proposed scheduling order. To date, no scheduling order has been entered in the case. In addition to the pending Motion to Discharge Order to Show Cause, JCGI and Janus Capital, as well as other similarly situated defendants, continue to challenge the statutory authority of the Auditor to bring such an action.
Additional lawsuits may be filed against certain of the Janus funds, Janus Capital, and related parties in the future. Janus Capital does not currently believe that these pending actions will materially affect its ability to continue providing services it has agreed to provide to the Janus funds.
24 Janus Aspen Series December 31, 2007
Report of Independent Registered Public Accounting Firm
To the Trustees and Shareholders
of Janus Aspen Growth and Income Portfolio
In our opinion, the accompanying statement of assets and liabilities, including the schedule of investments, and the related statements of operations and of changes in net assets and the financial highlights present fairly, in all material respects, the financial position of Janus Aspen Growth and Income Portfolio (one of the portfolios constituting Janus Aspen Series, hereafter referred to as the "Portfolio") at December 31, 2007, the results of its operations for the year then ended, the changes in its net assets for each of the two years in the period then ended, and the financial highlights for each of the five years in the period then ended, in conformity with accounting principles generally accepted in the United States of America. These financial statements and financial highlights (hereafter referred to as "financial statements") are the responsibility of the Portfolio's management; our responsibility is to express an opinion on thes e financial statements based on our audits. We conducted our audits of these financial statements in accordance with the standards of the Public Company Accounting Oversight Board (United States). Those standards require that we plan and perform the audit to obtain reasonable assurance about whether the financial statements are free of material misstatement. An audit includes examining, on a test basis, evidence supporting the amounts and disclosures in the financial statements, assessing the accounting principles used and significant estimates made by management, and evaluating the overall financial statement presentation. We believe that our audits, which included confirmation of securities at December 31, 2007 by correspondence with the custodian, transfer agent and brokers, and the application of alternative auditing procedures where securities purchased had not been received, provide a reasonable basis for our opinion.

Denver, Colorado
February 15, 2008
Janus Aspen Series December 31, 2007 25
Additional Information (unaudited)
PROXY VOTING POLICIES AND VOTING RECORD
A description of the policies and procedures that the Portfolio uses to determine how to vote proxies relating to its portfolio securities is available: (i) without charge, upon request, by calling 1-800-525-0020 (toll free); (ii) on the Portfolio's website at www.janus.com/proxyvoting; and (iii) on the SEC's website at http://www.sec.gov. Additionally, information regarding the Portfolio's proxy voting record for the most recent twelve-month period ended June 30 is also available, free of charge, through www.janus.com/proxyvoting and from the SEC's website at http://www.sec.gov.
QUARTERLY PORTFOLIO HOLDINGS
The Portfolio files its complete portfolio holdings (schedule of investments) with the SEC for the first and third quarters of each fiscal year on Form N-Q within 60 days of the end of such fiscal quarter. The Portfolio's Form N-Q: (i) is available on the SEC's website at http://www.sec.gov; (ii) may be reviewed and copied at the SEC's Public Reference Room in Washington, D.C. (information on the Public Reference Room may be obtained by calling 1-800-SEC-0330); and (iii) is available without charge, upon request, by calling Janus at 1-800-525-0020 (toll free).
APPROVAL OF ADVISORY AGREEMENTS DURING THE PERIOD
The Trustees of Janus Aspen Series, none of whom has ever been affiliated with Janus Capital ("Independent Trustees"), oversee the management of each Portfolio and, as required by law, determine annually whether to continue the investment advisory agreement for each Portfolio and the subadvisory agreements for the three Portfolios that utilize subadvisers.
In connection with their most recent consideration of those agreements for each Portfolio, the Trustees received and reviewed a substantial amount of information provided by Janus Capital and the respective subadvisers in response to requests of the Independent Trustees and their independent legal counsel. They also received and reviewed a considerable amount of information and analysis provided by their independent fee consultant. Throughout their consideration of the agreements, the Independent Trustees were advised by their independent legal counsel. The Independent Trustees met with management to consider the agreements, and also met separately in executive session with their independent legal counsel and their independent fee consultant.
At a meeting held on December 14, 2007, based on their evaluation of the information provided by Janus Capital, the subadvisers and the independent fee consultant, as well as other information, the Trustees determined that the overall arrangements between each Portfolio and Janus Capital and each subadviser, as applicable, were fair and reasonable in light of the nature, extent and quality of the services provided by Janus Capital, its affiliates and the subadvisers, the fees charged for those services, and other matters that the Trustees considered relevant in the exercise of their business judgment. At that meeting the Trustees unanimously approved the continuation of the investment advisory agreement for each Portfolio, and the subadvisory agreement for each subadvised Portfolio, for the period from February 1, 2008 through February 1, 2009, subject to earlier termina tion as provided for in each agreement.
In considering the continuation of those agreements, the Trustees reviewed and analyzed various factors that they determined were relevant, including the factors described below, none of which by itself was considered dispositive. However, the material factors and conclusions that formed the basis for the Trustees' determination to approve the continuation of the agreements are discussed separately below.
Nature, Extent and Quality of Services
The Trustees reviewed the nature, extent and quality of the services provided by Janus Capital and the subadvisers to the Portfolios, taking into account the investment objective and strategy of each Portfolio, the knowledge of the Trustees gained from their regular meetings with management on at least a quarterly basis, and their ongoing review of information related to the Portfolios. In addition, the Trustees reviewed the resources and key personnel of Janus Capital and each subadviser, especially those who provide investment management services to the Portfolios. The Trustees also considered other services provided to the Portfolios by Janus Capital or the subadvisers, such as managing the execution of portfolio transactions and the selection of broker-dealers for those transactions, serving as the Portfolios' administrator, monitoring adherence to the Portfolios' investment restrictions, producing shareholder reports, providing support services for the Trustees and Trustee committees, communicating with shareholders, and overseeing the activities of other service providers, including monitoring compliance with various policies and procedures of the Portfolios and with applicable securities laws and regulations.
The Trustees concluded that the nature, extent and quality of the services provided by Janus Capital and/or the subadviser to each Portfolio were appropriate and consistent with the terms of the respective advisory and subadvisory agreements; that, taking into account steps taken to address those Portfolios whose performance lagged that of the median of their peers for certain periods, the quality of those services had been consistent with or superior to quality norms in the industry; and that the Portfolios were likely to benefit from the continued provision of those services. They also concluded that Janus Capital and each subadviser had sufficient personnel, with the appropriate education and experience, to
26 Janus Aspen Series December 31, 2007
serve the Portfolios effectively and had demonstrated its continuing ability to attract well-qualified personnel.
Performance of the Portfolios
The Trustees considered the investment results of each Portfolio over various time periods. They reviewed information comparing each Portfolio's performance with the performance of comparable funds and peer groups identified by Lipper Inc., an independent provider of investment company data, and with the Portfolio's benchmark index. They concluded that the performance of many Portfolios was good to very good under current market conditions. Although the performance of some Portfolios lagged that of the median of their peers for certain periods, the Trustees also concluded that Janus Capital had taken appropriate steps to address those instances of under-performance and that the more recent performance of most of those Portfolios had been improving.
Costs of Services Provided
The Trustees examined information on the fees and expenses of each Portfolio in comparison to similar information for comparable funds as provided by Lipper. They also reviewed an analysis of that information provided by their independent fee consultant and noted that the rate of management (investment advisory and administrative) fees for most of the Portfolios, in some cases after contractual expense limitations, was below the mean management fee rate of the respective peer group of funds selected by Lipper.
The Trustees considered the methodology used by Janus Capital and each subadviser in determining compensation payable to portfolio managers, the competitive environment for investment management talent and the competitive market for mutual funds in different distribution channels. They concluded that the compensation methodology provided a good alignment of the interests of the portfolio managers with those of Portfolio shareholders.
The Trustees also reviewed management fees charged by Janus Capital to its separate account clients and to its subadvised funds (for which Janus Capital provides only services related to portfolio management). Although in most instances subadvisory and separate account fee rates for various investment strategies were lower than management fee rates for Portfolios having a similar strategy, the Trustees noted that, under the terms of the management agreements with the Portfolios, Janus Capital performs significant additional services for the Portfolios that it does not provide to those other clients, including administrative services, oversight of the Portfolios' other service providers, Trustee support, regulatory compliance and numerous other services, and that, in serving the Portfolios, Janus Capital assumes many legal risks that it does not assume in servicing its other clients. Moreover, the Trustees noted that the spread between the av erage fee rates charged to the Portfolios and the fee rates that Janus Capital charged to its separate account clients was significantly smaller than the average spread for such fee rates of other advisers, based on publicly available data and research conducted by their independent fee consultant.
The Trustees reviewed information on the profitability to Janus Capital and its affiliates of their relationships with each Portfolio, as well as an explanation of the methodology used in allocating various expenses of Janus Capital and its affiliates among the Portfolios and other clients. They also reviewed the financial statements of Janus Capital's parent company and its corporate structure. In their review, the Trustees considered whether Janus Capital and each subadviser receives adequate incentives to manage the Portfolios effectively. They recognized that profitability comparisons among investment advisers are difficult because very little comparative information is publicly available and profitability of any adviser is affected by numerous factors, including the organizational structure of the particular adviser, the types of funds and other accounts it manages, possible other lines of business, the methodology for allocating expens es, and the adviser's capital structure and cost of capital. However, based on the information available and taking those factors into account, the Trustees concluded that Janus Capital's profitability with respect to each Portfolio in relation to the services rendered was not unreasonable.
The Trustees concluded that the management fees and other compensation payable by each Portfolio to Janus Capital and its affiliates, as well as the fees payable by Janus Capital or the Portfolios to the subadvisers of subadvised Portfolios, were reasonable in relation to the nature, extent and quality of the services provided, taking into account the fees charged by other advisers for managing comparable mutual funds with similar strategies and the fees Janus Capital and the subadvisers charge to other clients. They also concluded that the overall expense ratio of each Portfolio was reasonable, taking into account the size of the Portfolio, the quality of services provided by Janus Capital and any subadviser, the investment performance of the Portfolio and any expense limitations agreed to by Janus Capital.
Economies of Scale
The Trustees considered information about the potential for Janus Capital to realize economies of scale as the assets of the Portfolios increase. They noted that, although most Portfolios pay advisory fees at a fixed rate as a percentage of net assets, without any breakpoints, the management fee rate paid by each Portfolio, after any contractual expense limitations, was below the mean management fee rate of the Portfolio's peer group selected by Lipper; and, for those Portfolios whose expenses are being reduced by the contractual expense limitations of Janus Capital, Janus Capital is subsidizing the Portfolios because they have not reached adequate scale. Moreover, as the assets of many of the Portfolios declined in the past few years, those Portfolios benefited from having
Janus Aspen Series December 31, 2007 27
Additional Information (unaudited) (continued)
advisory fee rates that remained constant rather than increasing as assets declined. In addition, performance fee structures have been implemented for several Portfolios that will cause the effective rate of advisory fees payable by such a Portfolio to vary depending on the investment performance of the Portfolio relative to its benchmark index over the measurement period; and a few Portfolios have fee schedules with breakpoints and reduced fee rates above certain asset levels. The Trustees also noted that the Portfolios share directly in economies of scale through lower charges of third-party service providers, based on the combined scale of all of the Portfolios. Based on all of the information they reviewed, the Trustees concluded that the current fee structure of each Portfolio was reasonable and that the current rates of fees do reflect a sharing between Janus Capital and the Portfolio of economies of scale at the current asset level of the Portfolio.
Other Benefits to Janus Capital
The Trustees also considered benefits that accrue to Janus Capital and its affiliates from their relationships with the Portfolios. They recognized that two affiliates of Janus Capital separately serve the Portfolios as transfer agent and distributor, respectively. They also considered Janus Capital's past and proposed use of commissions paid by Portfolios on their portfolio brokerage transactions to obtain proprietary and third-party research products and services benefiting those Portfolios and/or other clients of Janus Capital. The Trustees concluded that Janus Capital's use of "soft" commission dollars of a Portfolio to obtain proprietary and third-party research products and services was consistent with regulatory requirements and guidelines and was likely to benefit the Portfolios. The Trustees also concluded that, other than the services provided by Janus Capital and its affiliates pursuant to the agreements and the fees to be paid by each Portfolio therefor, the Portfolios and Janus Capital may potentially benefit from their relationship with each other in other ways. They concluded that Janus Capital benefits from the receipt of proprietary research products and services acquired through commissions paid on portfolio transactions of the Portfolios and that the Portfolios benefit from Janus Capital's receipt of those products and services, as well as research products and services acquired through commissions paid by other clients of Janus Capital. They further concluded that success of any Portfolio could attract other business to Janus Capital or other Janus funds and that the success of Janus Capital could enhance Janus Capital's ability to serve the Portfolios.
After full consideration of the above factors, as well as other factors, all of the Trustees, all of whom are Independent Trustees, concluded that the proposed continuation of the investment advisory agreement for each Portfolio, and the subadvisory agreement for each subadvised Portfolio, was in the best interest of the respective Portfolios and their shareholders.
28 Janus Aspen Series December 31, 2007
Explanations of Charts, Tables and
Financial Statements (unaudited)
1. PERFORMANCE OVERVIEWS
The performance overview graph compares the performance of a hypothetical $10,000 investment in the Portfolio with one or more widely used market indices. The hypothetical example does not represent the returns of any particular investment.
When comparing the performance of the Portfolio with an index, keep in mind that market indices do not include brokerage commissions that would be incurred if you purchased the individual securities in the index. They also do not include taxes payable on dividends and interest or operating expenses incurred if you maintained a Portfolio invested in the index.
Average annual total returns are quoted for each class of the Portfolio. Average annual total return is calculated by taking the growth or decline in value of an investment over a period of time, including reinvestment of any dividends, distributions and capital gains, then calculating the annual compounded percentage rate that would have produced the same result had the rate of growth been constant throughout the period. Average annual total return does not reflect the deduction of taxes that a shareholder would pay on Portfolio distributions or redemptions of Portfolio shares.
Pursuant to federal securities rules, expense ratios shown in the performance chart reflect subsidized and unsubsidized ratios for the past fiscal year. The total annual portfolio operating expenses ratio is gross of any fee waivers, reflecting a Portfolio's unsubsidized expense ratio. The net annual portfolio operating expenses ratio (if applicable) includes contractual waivers of Janus Capital and/or Janus Services and reflects a Portfolio's subsidized expense ratio. Both the total annual portfolio operating expenses ratio and net annual portfolio operating expenses ratio are based on average net assets as of the fiscal year ended December 31, 2006. The ratios also include expenses indirectly incurred by the Portfolio as a result of investing in other investment companies or pooled investments, which are not reflected in the "Financial Highlights" of this report. As a result, these ratios may be higher or lower than those shown in the "Fin ancial Highlights" in this report. All expenses are shown without the effect of expense offset arrangements. Pursuant to such arrangements, credits realized as a result of uninvested cash balances are used to reduce custodian and transfer agent expenses.
2. SCHEDULE OF INVESTMENTS
Following the performance overview section is the Portfolio's Schedule of Investments. This schedule reports the industry concentrations and types of securities held in the Portfolio on the last day of the reporting period. Securities are usually listed by type (common stock, corporate bonds, U.S. Government obligations, etc.) and by industry classification (banking, communications, insurance, etc.). Holdings are subject to change without notice.
The value of each security is quoted as of the last day of the reporting period. The value of securities denominated in foreign currencies is converted into U.S. dollars. Certain short-term investments maturing within 60 days are valued at amortized cost, which approximates market value.
A summary of investments by country is provided if the Portfolio invested in foreign securities. This summary reports the Portfolio's exposure to different countries by providing the percentage of securities invested in each country. The country of each security represents the country in which the company is incorporated.
2A. FORWARD CURRENCY CONTRACTS
A table listing forward currency contracts follows the Portfolio's Schedule of Investments (if applicable). Forward currency contracts are agreements to deliver or receive a preset amount of currency at a future date. Forward currency contracts are used to hedge against foreign currency risk in the Portfolio's long-term holdings.
The table provides the name of the foreign currency, the settlement date of the contract, the amount of the contract, the value of the currency in U.S. dollars and the amount of unrealized gain or loss. The amount of unrealized gain or loss reflects the change in currency exchange rates from the time the contract was opened to the last day of the reporting period.
2B. FUTURES
A table listing futures contracts follows the Portfolio's Schedule of Investments (if applicable). Futures contracts are contracts that obligate the buyer to receive and the seller to deliver an instrument or money at a specified price on a specified date. Futures are used to hedge against adverse movements in securities prices, currency risk or interest rates.
The table provides the name of the contract, number of contracts held, the expiration date, the principal amount, value and the amount of unrealized gain or loss. The amount of unrealized gain or loss reflects the marked-to-market amount for the last day of the reporting period.
2C. OPTIONS
A table listing written option contracts follows the Portfolio's Schedule of Investments (if applicable). Written option contracts are contracts that obligate the Portfolio to sell or purchase an underlying security at a fixed price, upon exercise of the option. Options are used to hedge against adverse movements in securities prices, currency risk or interest rates. The table provides the name of the contract, number of contracts held, the expiration date, exercise price, value and premiums received.
Janus Aspen Series December 31, 2007 29
Explanations of Charts, Tables and
Financial Statements (unaudited) (continued)
3. STATEMENT OF ASSETS AND LIABILITIES
This statement is often referred to as the "balance sheet." It lists the assets and liabilities of the Portfolio on the last day of the reporting period.
The Portfolio's assets are calculated by adding the value of the securities owned, the receivable for securities sold but not yet settled, the receivable for dividends declared but not yet received on stocks owned and the receivable for Portfolio shares sold to investors but not yet settled. The Portfolio's liabilities include payables for securities purchased but not yet settled, Portfolio shares redeemed but not yet paid and expenses owed but not yet paid. Additionally, there may be other assets and liabilities such as unrealized gain or loss on forward currency contracts.
The section entitled "Net Assets Consist of" breaks down the components of the Portfolio's net assets. Because the Portfolio must distribute substantially all earnings, you will notice that a significant portion of net assets is shareholder capital.
The last section of this statement reports the net asset value ("NAV") per share on the last day of the reporting period for each class of the Portfolio. The NAV is calculated by dividing the Portfolio's net assets (assets minus liabilities) by the number of shares outstanding.
4. STATEMENT OF OPERATIONS
This statement details the Portfolio's income, expenses, gains and losses on securities and currency transactions, and appreciation or depreciation of current Portfolio holdings.
The first section in this statement, entitled "Investment Income," reports the dividends earned from stocks and interest earned from interest-bearing securities in the Portfolio.
The next section reports the expenses and expense offsets incurred by the Portfolio, including the advisory fee paid to the investment adviser, transfer agent fees and expenses, printing and postage for mailing statements, financial reports and prospectuses, and other expenses. Expense offsets, if any, are also shown.
The last section lists the increase or decrease in the value of securities held in the Portfolio. The Portfolio realizes a gain (or loss) when it sells its position in a particular security. An unrealized gain (or loss) refers to the change in net appreciation or depreciation of the Portfolio during the reporting period. "Net Realized and Unrealized Gain/(Loss) on Investments" is affected both by changes in the market value of Portfolio holdings and by gains (or losses) realized during the reporting period.
5. STATEMENT OF CHANGES IN NET ASSETS
This statement reports the increase or decrease in the Portfolio's net assets during the reporting period. Changes in the Portfolio's net assets are attributable to investment operations, dividends, distributions and capital share transactions. This is important to investors because it shows exactly what caused the Portfolio's net asset size to change during the period.
The first section summarizes the information from the Statement of Operations regarding changes in net assets due to the Portfolio's investment performance. The Portfolio's net assets may also change as a result of dividend and capital gains distributions to investors. If investors receive their dividends in cash, money is taken out of the Portfolio to pay the distribution. If investors reinvest their dividends, the Portfolio's net assets will not be affected. If you compare the Portfolio's "Net Decrease from Dividends and Distributions" to the "Reinvested dividends and distributions," you will notice that dividend distributions had little effect on the Portfolio's net assets. This is because the majority of Janus investors reinvest their distributions.
The reinvestment of dividends is included under "Capital Share Transactions." "Capital Shares" refers to the money investors contribute to the Portfolio through purchases or withdraw via redemptions. The Portfolio's net assets will increase and decrease in value as investors purchase and redeem shares from the Portfolio.
6. FINANCIAL HIGHLIGHTS
This schedule provides a per-share breakdown of the components that affect the Portfolio's NAV for current and past reporting periods for each class of the Portfolio. Not only does this table provide you with total return, it also reports total distributions, asset size, expense ratios and portfolio turnover rate.
The first line in the table reflects the NAV per share at the beginning of the reporting period. The next line reports the net investment income per share, which comprises dividends and interest income earned on securities held by the Portfolio. Following is the total of gains/(losses), realized and unrealized. Dividends and distributions are then subtracted to arrive at the NAV per share at the end of the period. The next line reflects the average annual total return reported the last day of the period.
Also included are the expense ratios, or the percentage of average net assets that were used to cover operating expenses during the period. Expense ratios vary for a number of reasons, including the differences in management fees, the average shareholder account size and the extent of foreign investments, which entail greater transaction costs.
The Portfolio's expenses may be reduced through expense reduction arrangements. These arrangements may include the use of balance credits or transfer agent fee offsets. The Statement of Operations reflects total expenses before any such offset, the amount of the offset and the net expenses. The
30 Janus Aspen Series December 31, 2007
expense ratios listed in the Financial Highlights reflect total expenses prior to any expense offsets (gross expense ratio) and after the expense offsets (net expense ratio). Both expense ratios reflect expenses after waivers (reimbursements), if applicable.
The ratio of net investment income/(loss) summarizes the income earned less expenses, divided by the average net assets of the Portfolio during the reporting period. Don't confuse this ratio with the Portfolio's yield. The net investment income ratio is not a true measure of the Portfolio's yield because it doesn't take into account the dividends distributed to the Portfolio's investors.
The next figure is the portfolio turnover rate, which measures the buying and selling activity in the Portfolio. Portfolio turnover is affected by market conditions, changes in the asset size of the Portfolio, the nature of the Portfolio's investments and the investment style of the portfolio manager. A 100% rate implies that an amount equal to the value of the entire portfolio is turned over in a year; a 50% rate means that an amount equal to the value of half the portfolio is traded in a year; and a 200% rate means that an amount equal to the value of the portfolio is traded every six months.
Janus Aspen Series December 31, 2007 31
Designation Requirements (unaudited)
For federal income tax purposes, the Portfolio designated the following for the year ended December 31, 2007:
Dividends Received Deduction Percentage
| Portfolio | |||||||
| Janus Aspen Growth and Income Portfolio | 29 | % | |||||
32 Janus Aspen Series December 31, 2007
Trustees and Officers (unaudited)
The Portfolio's Statement of Additional Information includes additional information about the Trustees and officers and is available, without charge, by calling 1-800-525-0020.
The following are the Trustees and officers of the Trust, together with a brief description of their principal occupations during the last five years (principal occupations for certain Trustees may include periods over five years).
Each Trustee has served in that capacity since he or she was originally elected or appointed. The Trustees do not serve a specified term of office. Each Trustee will hold office until the termination of the Trust or his or her earlier death, resignation, retirement, incapacity, or removal. The retirement age for Trustees is 72. The Portfolio's Nominating and Governance Committee will consider nominees for the position of Trustee recommended by shareholders. Shareholders may submit the name of a candidate for consideration by the Committee by submitting their recommendations to the Trust's Secretary. Each Trustee is currently a Trustee of two other registered investment companies advised by Janus Capital: Janus Investment Fund and Janus Adviser Series. As of the date of this report, collectively, these three registered investment companies consist of 75 series or funds.
The Trust's officers are elected annually by the Trustees for a one-year term. Certain officers also serve as officers of Janus Investment Fund and Janus Adviser Series. Certain officers of the Portfolio may also be officers and/or directors of Janus Capital. Portfolio officers receive no compensation from the Portfolio, except for the Portfolio's Chief Compliance Officer, as authorized by the Trustees.
Trustees
| Name, Address, and Age | Positions Held with Portfolio | Length of Time Served | Principal Occupations During the Past Five Years | Number of Portfolios/ Funds in Fund Complex Overseen by Trustee | Other Directorships Held by Trustee | ||||||||||||||||||
| Dennis B. Mullen* 151 Detroit Street Denver, CO 80206 DOB: 1943 | Chairman Trustee | 3/04-12/07 9/93-Present | Chief Executive Officer of Red Robin Gourmet Burgers, Inc. (since 2005). Formerly, private investor. | 75 | ** | Chairman of the Board (since 2005) and Director of Red Robin Gourmet Burgers, Inc., and Director of Janus Capital Funds Plc (Dublin-based, non-U.S. funds). | |||||||||||||||||
| Jerome S. Contro 151 Detroit Street Denver, CO 80206 DOB: 1956 | Trustee | 12/05-Present | Partner of Tango Group, a private investment firm (since 1999). | 75 | Trustee and Chairman of RS Investment Trust (since 2001), and Director of IZZE Beverages and MyFamily.com, Inc. (genealogical research website). | ||||||||||||||||||
| William F. McCalpin 151 Detroit Street Denver, CO 80206 DOB: 1957 | Trustee | 6/02-Present | Private investor. Formerly, Executive Vice President and Chief Operating Officer of The Rockefeller Brothers Fund (a private family foundation), and Vice President of Asian Cultural Council. | 75 | Director of F.B. Heron Foundation (a private grant making foundation). | ||||||||||||||||||
* Mr. McCalpin will succeed Mr. Mullen as Chairman as of January 1, 2008.
** Mr. Mullen also serves as director of Janus Capital Funds Plc, consisting of 16 funds. Including Janus Capital Funds Plc and the 75 funds comprising the Janus funds, Mr. Mullen oversees 91 funds.
Janus Aspen Series December 31, 2007 33
Trustees and Officers (unaudited) (continued)
Trustees (cont.)
| Name, Address, and Age | Positions Held with Portfolio | Length of Time Served | Principal Occupations During the Past Five Years | Number of Portfolios/ Funds in Fund Complex Overseen by Trustee | Other Directorships Held by Trustee | ||||||||||||||||||
| John W. McCarter, Jr. 151 Detroit Street Denver, CO 80206 DOB: 1938 | Trustee | 6/02-Present | President and Chief Executive Officer of The Field Museum of Natural History (Chicago, IL) (since 1997). | 75 | Chairman of the Board and Director of Divergence Inc. (biotechnology firm); Director of W.W. Grainger, Inc. (industrial distributor); and Trustee of WTTW (Chicago public television station) and the University of Chicago. | ||||||||||||||||||
| James T. Rothe 151 Detroit Street Denver, CO 80206 DOB: 1943 | Trustee | 1/97-Present | Co-founder and Managing Director of Roaring Fork Capital Management, LLC (private investment in public equity firm), and Professor Emeritus of Business of the University of Colorado, Colorado Springs, CO (since 2004). Formerly, Professor of Business of the University of Colorado (2002-2004) and Distinguished Visiting Professor of Business (2001-2002) of Thunderbird (American Graduate School of International Management), Glendale, AZ. | 75 | Director of Red Robin Gourmet Burgers, Inc. | ||||||||||||||||||
| William D. Stewart 151 Detroit Street Denver, CO 80206 DOB: 1944 | Trustee | 9/93-Present | Corporate Vice President and General Manager of MKS Instruments – HPS Products, Boulder, CO (a manufacturer of vacuum fittings and valves). | 75 | N/A | ||||||||||||||||||
| Martin H. Waldinger 151 Detroit Street Denver, CO 80206 DOB: 1938 | Trustee | 9/93-Present | Private Investor and Consultant to California Planned Unit Developments (since 1994). Formerly, CEO and President of Marwal, Inc. (homeowner association management company). | 75 | N/A | ||||||||||||||||||
| Linda S. Wolf 151 Detroit Street Denver, CO 80206 DOB: 1947 | Trustee | 12/05-Present | Retired. Formerly, Chairman and Chief Executive Officer of Leo Burnett (Worldwide) (advertising agency) (2001-2005). | 75 | Director of Wal-Mart, The Field Museum of Natural History (Chicago, IL), Children's Memorial Hospital (Chicago, IL), Chicago Council on Foreign Relations, Economic Club of Chicago, and InnerWorkings (U.S. provider of print procurement solutions). | ||||||||||||||||||
34 Janus Aspen Series December 31, 2007
Officers
| Name, Address, and Age | Positions Held with Portfolio | Term of Office* and Length of Time Served | Principal Occupations During the Past Five Years | ||||||||||||
| Marc Pinto 151 Detroit Street Denver, CO 80206 DOB: 1961 | Executive Vice President and Portfolio Manager Janus Aspen Growth and Income Portfolio | 11/07-Present | Vice President of Janus Capital and Portfolio Manager for other Janus accounts. | ||||||||||||
| Stephanie Grauerholz-Lofton 151 Detroit Street Denver, CO 80206 DOB: 1970 | Chief Legal Counsel and Secretary Vice President | 1/06-Present 3/06-Present | Vice President and Assistant General Counsel of Janus Capital, and Vice President and Assistant Secretary of Janus Distributors LLC. Formerly, Assistant Vice President of Janus Capital and Janus Distributors LLC (2006), and Associate of Vedder, Price, Kaufman & Kammholz, P.C. (1999-2003). | ||||||||||||
| Andrew J. Iseman 151 Detroit Street Denver, CO 80206 DOB: 1964 | President and Chief Executive Officer | 3/07-Present | Chief Operating Officer and Senior Vice President of Janus Capital Group, Inc. and Janus Capital; President of Janus Services LLC; and Director of Capital Group Partners, Inc. Formerly, Senior Vice President of Enhanced Investment Technologies, LLC (2005-2007); and Vice President of Janus Capital (2003-2005) and Janus Services LLC (2003-2004). | ||||||||||||
| David R. Kowalski 151 Detroit Street Denver, CO 80206 DOB: 1957 | Vice President, Chief Compliance Officer, and Anti-Money Laundering Officer | 6/02-Present | Senior Vice President and Chief Compliance Officer of Janus Capital, Janus Distributors LLC, and Janus Services LLC; Chief Compliance Officer of Bay Isle Financial LLC; and Vice President of Enhanced Investment Technologies, LLC. Formerly, Chief Compliance Officer of Enhanced Investment Technologies, LLC (2003-2005); Vice President of Janus Capital (2000-2005) and Janus Services LLC (2004-2005); and Assistant Vice President of Janus Services LLC (2000-2004). | ||||||||||||
| Jesper Nergaard 151 Detroit Street Denver, CO 80206 DOB: 1962 | Chief Financial Officer Vice President, Treasurer, and Principal Accounting Officer | 3/05-Present 2/05-Present | Vice President of Janus Capital. Formerly, Director of Financial Reporting for OppenheimerFunds, Inc. (2004-2005); Site Manager and First Vice President of Mellon Global Securities Services (2003); and Director of Fund Accounting, Project Development, and Training of INVESCO Funds Group (1994-2003). | ||||||||||||
*Officers are elected at least annually by the Trustees for a one-year term and may also be elected from time to time by the Trustees for an interim period.
Janus Aspen Series December 31, 2007 35
Notes
36 Janus Aspen Series December 31, 2007
Notes
Janus Aspen Series December 31, 2007 37
Janus provides access to a wide range of investment disciplines.
Growth
Janus growth portfolios focus on companies believed to be the leaders in their respective industries, with solid management teams, expanding market share, margins and efficiencies.
Core
Janus core portfolios seek investments in more stable and predictable companies. These portfolios look for a strategic combination of steady growth and for certain portfolios, some degree of income.
Risk-Managed
Our risk-managed portfolios seek to outperform their respective indices while maintaining a risk profile equal to or lower than the index itself. Managed by INTECH (a Janus subsidiary), these portfolios use a mathematical process in an attempt to build a more "efficient" portfolio than the index.
Value
Janus value portfolios invest in companies they believe are poised for a turnaround or are trading at a significant discount to fair value. The goal is to gain unique insight into a company's true value and identify and evaluate potential catalysts that may unlock shareholder value.
International & Global
Janus international and global portfolios seek to leverage Janus' research capabilities by taking advantage of inefficiencies in foreign markets, where accurate information and analytical insight are often at a premium.
Bond
Janus bond portfolios attempt to provide less risk relative to equities while seeking to deliver a competitive total return through high current income and appreciation.
Money Market
Janus money market portfolios seek maximum current income consistent with stability of capital.
For more information about our funds, contact your investment professional or go to www.janus.com/info
Please consider the charges, risks, expenses and investment objectives carefully before investing. For a prospectus containing this and other information, please call Janus at 1-800-525-0020 or download the file from www.janus.com/info. Read it carefully before you invest or send money.
An investment in a money market portfolio is not insured or guaranteed by the Federal Deposit Insurance Corporation or any other government agency. Although the Portfolio seeks to preserve the value of your investment at $1.00 per share, it is possible to lose money by investing in the Portfolio.

151 Detroit Street
Denver, CO 80206
1-800-525-0020
Portfolio distributed by Janus Distributors LLC (2/08)
C-0108-357 109-02-712 02-08
2007 Annual Report
Janus Aspen Series
Janus Aspen INTECH Risk-Managed Core Portfolio
Look Inside. . .
• Portfolio management perspective
• Investment strategy behind your portfolio
• Portfolio performance, characteristics and holdings

Table of Contents
| Useful Information About Your Portfolio Report | 1 | ||||||
| Management Commentary and Schedule of Investments | 2 | ||||||
| Statement of Assets and Liabilities | 11 | ||||||
| Statement of Operations | 12 | ||||||
| Statements of Changes in Net Assets | 13 | ||||||
| Financial Highlights | 14 | ||||||
| Notes to Schedule of Investments | 15 | ||||||
| Notes to Financial Statements | 16 | ||||||
| Report of Independent Registered Public Accounting Firm | 23 | ||||||
| Additional Information | 24 | ||||||
| Explanations of Charts, Tables and Financial Statements | 27 | ||||||
| Designation Requirements | 29 | ||||||
| Trustees and Officers | 30 | ||||||
Please consider the charges, risks, expenses and investment objectives carefully before investing. For a prospectus containing this and other information, please call Janus at 1-800-525-0020 or download the file from www.janus.com/info. Read it carefully before you invest or send money.
Useful Information About Your Portfolio Report
Management Commentary
The Management Commentary in this report includes valuable insight from the Portfolio's managers as well as statistical information to help you understand how your Portfolio's performance and characteristics stack up against those of comparable indices.
Please keep in mind that the opinions expressed by the Portfolio's managers in the Management Commentary are just that: opinions. They are a reflection of the managers' best judgment at the time this report was compiled, which was December 31, 2007. As the investing environment changes, so could the managers' opinions. The views are unique to the managers and aren't necessarily shared by their fellow employees or by Janus in general.
Portfolio Expenses
We believe it's important for our shareholders to have a clear understanding of Portfolio expenses and the impact they have on investment return.
The following is important information regarding the Portfolio's Expense Example, which appears in the Portfolio Management Commentary within this Annual Report. Please refer to this information when reviewing the Expense Example for the Portfolio.
Example
As a shareholder of a Portfolio, you incur two types of costs: (1) transaction costs, including redemption fees (where applicable) (and any related exchange fees) and (2) ongoing costs, including management fees; distribution and shareholder servicing (12b-1) fees (applicable to Service Shares only); administrative services fees (applicable to Service Shares only); and other Portfolio expenses. The example is intended to help you understand your ongoing costs (in dollars) of investing in a Portfolio and to compare these costs with the ongoing costs of investing in other mutual funds. To do so, compare this 5% hypothetical example with the 5% hypothetical examples that appear in the shareholder reports of the other funds. The example is based upon an investment of $1,000 invested at the beginning of the period and held for the six-month period from July 1, 2007 to December 31, 2007.
Actual Expenses
The first line of the table in each example provides information about actual account values and actual expenses. You may use the information in this line, together with the amount you invested, to estimate the expenses that you paid over the period. Simply divide your account value by $1,000 (for example, an $8,600 account value divided by $1,000 = 8.6), then multiply the result by the number in the first line under the heading entitled "Expenses Paid During Period" to estimate the expenses you paid on your account during the period.
Hypothetical Example for Comparison Purposes
The second line of the table in each example provides information about hypothetical account values and hypothetical expenses based upon the Portfolio's actual expense ratio and an assumed rate of return of 5% per year before expenses, which is not the Portfolio's actual return. The hypothetical account values and expenses may not be used to estimate the actual ending account balance or expenses you paid for the period. You may use this information to compare the ongoing costs of investing in the Portfolio and other funds. To do so, compare this 5% hypothetical example with the 5% hypothetical examples that appear in the shareholder reports of the other funds.
Janus Capital Management LLC ("Janus Capital") has contractually agreed to waive the Portfolio's total operating expenses, excluding the distribution and shareholder servicing (12b-1) fees applicable to Service Shares, the administrative services fees applicable to Service Shares, brokerage commissions, interest, taxes and extraordinary expenses to certain limits until at least May 1, 2009. More information regarding the waivers is available in the Portfolio's prospectus.
Please note that the expenses shown in the tables are meant to highlight your ongoing costs only and do not reflect any transaction costs, such as redemption fees (where applicable) and any charges at the separate account level or contract level. Redemption fees are fully described in the prospectus. Therefore, the second line of each table is useful in comparing ongoing costs only, and will not help you determine the relative total costs of owning different funds. In addition, if these transaction costs and separate account or contract level charges were included, your costs would have been higher.
Janus Aspen Series December 31, 2007 1
Janus Aspen INTECH Risk-Managed Core Portfolio
(unaudited)
Portfolio Snapshot
This portfolio uses a mathematically-based investment process that seeks to capitalize on the natural volatility of stock prices. The primary aim of this strategy is to outperform the benchmark index without increasing risk.
Managed by INTECH
Performance Overview
For the 12 months ended December 31, 2007, Janus Aspen INTECH Risk-Managed Core Portfolio returned 6.05% for its Service Shares. This compares to the 5.49% return posted by the S&P 500® Index, the Portfolio's benchmark.
Investment Strategy in This Environment
While INTECH does not employ fundamental analysis in the management of the Portfolio, fundamentals can have a significant impact on the general direction of the market in which we participate. The Portfolio's goal is to produce long-term returns in excess of its benchmark with an equal or lesser amount of risk.
The Portfolio's mathematical investment process seeks to build a more efficient portfolio than its benchmark, the S&P 500® Index. With a focus on risk management, investment decisions are governed by a mathematical investment process. The process does not attempt to predict the direction of the market, nor does it have a particular view of any company in the Portfolio.
Performance Review
As stock prices moved naturally throughout the period, we continued to implement our mathematical process in a disciplined manner in an effort to maintain a more efficient portfolio than the Index, without increasing relative risk. While other factors may influence performance over the short term, we believe that the consistent application of our process will help the Portfolio perform well over the long term.
In INTECH's 20-year history, we have experienced 12-month periods of similar magnitude in terms of both underperformance and outperformance. From our perspective, the key is to keep periods of underperformance both short in duration and mild in scope. INTECH aims to achieve its targeted returns over the long term and we believe the Portfolio remains well positioned for long-term capital growth.
Investment Strategy and Outlook
INTECH's mathematical, risk-managed investment process seeks to outperform the S&P 500® Index over the long term, while attempting to control risk. We will continue implementing the process in a disciplined and deliberate manner in an effort to achieve our long-term performance goals. The Portfolio may underperform during shorter time periods, but has the goal of outperformance over a three- to five-year period. Managing risk remains essential to the investment process. We will continue to make marginal improvements to the mathematical process, seeking an efficient portfolio that offers better long-term results than the benchmark, regardless of the market's direction.
Thank you for your investment in Janus Aspen INTECH Risk-Managed Core Portfolio.
2 Janus Aspen Series December 31, 2007
(unaudited)
Janus Aspen INTECH Risk-Managed Core Portfolio At a Glance
5 Largest Equity Holdings – (% of Net Assets)
As of December 31, 2007
| Exxon Mobil Corp. Oil Companies - Integrated | 4.7 | % | |||||
| AT&T, Inc. Telephone - Integrated | 4.5 | % | |||||
| General Electric Co. Diversified Operations | 3.1 | % | |||||
| Merck & Company, Inc. Medical - Drugs | 2.9 | % | |||||
| Procter & Gamble Co. Cosmetics and Toiletries | 2.0 | % | |||||
| 17.2 | % | ||||||
Asset Allocation – (% of Net Assets)
As of December 31, 2007

Top Country Allocations – Long Positions (% of Investment Securities)
| As of December 31, 2007 | As of December 31, 2006 | ||||||
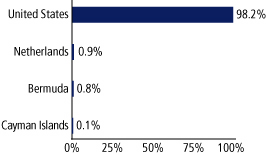 | 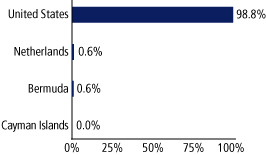 | ||||||
Janus Aspen Series December 31, 2007 3
Janus Aspen INTECH Risk-Managed Core Portfolio
(unaudited)
Performance

| Average Annual Total Return – for the periods ended December 31, 2007 | Expense Ratios – for the fiscal year ended December 31, 2006 | ||||||||||||||||||
| One Year | Since Inception* | Total Annual Fund Operating Expenses | Net Annual Fund Operating Expenses | ||||||||||||||||
| Janus Aspen INTECH Risk-Managed Core Portfolio - Service Shares | 6.05 | % | 13.89 | % | 1.86 | % | 1.45 | %(a) | |||||||||||
| S&P 500® Index | 5.49 | % | 12.11 | % | |||||||||||||||
| Lipper Quartile - Service Shares | 2 | nd | 2 | nd | |||||||||||||||
| Lipper Ranking - Service Shares based on total returns for Variable Annuity Multi-Cap Core Funds | 93/214 | 47/131 | |||||||||||||||||
Visit janus.com/info to view up-to-date
performance and characteristic information
Data presented reflects past performance, which is no guarantee of future results. Investment results and principal value will fluctuate so that shares, when redeemed, may be worth more or less than their original cost. Due to market volatility, current performance may be higher or lower than the performance shown. Call 877.33JANUS or visit www.janus.com/info for performance current to the most recent month-end.
(a)At December 31, 2006, Janus Capital has contractually agreed to waive the Portfolio's total operating expenses (excluding the distribution and shareholder servicing fee, administrative services fee, brokerage commissions, interest, taxes, and extraordinary expenses) to a certain limit until at least May 1, 2008. The net annual fund operating expense shown reflects the application of such limit and is detailed in the Statement of Additional Information. Returns shown include fee waivers, if any, and without such waivers returns would have been lower.
The Portfolio's expense ratio was determined based on average net assets as of the fiscal year ended December 31, 2006. Detailed information is available in the prospectus. Contractual waivers agreed to by Janus Capital are included under "Net Annual Fund Operating Expenses." All expenses are shown without the effect of expense offset arrangements. Pursuant to such arrangements, credits realized as a result of uninvested cash balances are used to reduce custodian and transfer agent expenses.
The Portfolio has a performance-based management fee that adjusts upward or downward based on the Portfolio's performance relative to an approved benchmark index over a performance measurement period.
The proprietary mathematical process used by Enhanced Investment Technologies, LLC ("INTECH") may not achieve the desired results. Since the Portfolio is regularly rebalanced, this may result in a higher portfolio turnover rate, higher expenses and potentially higher net taxable gains or losses for investors compared to a "buy and hold" or index portfolio strategy.
Portfolios that invest in Real Estate Investment Trusts (REITs) may be subject to a higher degree of market risk because of concentration in a specific industry, sector or geographic region. REITs may be subject to risks including, but not limited to: liquidity, decline in the value of real estate, risks related to general and economic conditions, changes in the value of the underlying property owned by the trust and defaults by borrowers. To the extent the Portfolio invests in foreign REITs, it may be subject to fluctuations in currency rates or political or economic conditions in a particular country.
These returns do not reflect the charges and expenses of any particular insurance product or qualified plan. Returns shown would have been lower had they included insurance charges.
Returns include reinvestment of dividends from net investment income and distributions from capital gains. The returns shown do not reflect the deduction of taxes that a shareholder would pay on Portfolio distributions or the redemption of Portfolio shares.
Lipper, a wholly-owned subsidiary of Reuters, provides independent insight on global collective investments including mutual funds, retirement funds, hedge funds, fund fees and expenses to the asset management and media communities. Lipper ranks the performance of mutual funds within a classification of funds that have similar investment objectives. Rankings are historical with capital gains and dividends reinvested and do not include the effect of loads.
4 Janus Aspen Series December 31, 2007
(unaudited)
Portfolio Expenses
| Expense Example – Service Shares | Beginning Account Value (7/1/07) | Ending Account Value (12/31/07) | Expenses Paid During Period (7/1/07-12/31/07)(1) | ||||||||||||
| Actual | $ | 1,000.00 | $ | 1,014.70 | $ | 7.36 | |||||||||
| Hypothetical (5% return before expenses) | $ | 1,000.00 | $ | 1,017.90 | $ | 7.37 | |||||||||
(1) Expenses are equal to the annualized expense ratio of 1.45%, multiplied by the average account value over the period, multiplied by 184/365 (to reflect the one-half year period). Expenses include the effect of contractual waivers by Janus Capital.
January 31, 2003, is the date used to calculate the since-inception Lipper ranking, which is slightly different from when the Portfolio began operations since Lipper provides fund rankings as of the last day of the month.
If an expense waiver was in effect, it may have had a material effect on the total return or yield, and therefore the ranking for the period.
There is no assurance the stated objective(s) will be met.
See Notes to Schedule of Investments for index definitions.
The weighting of securities within the Portfolio may differ significantly from the weightings within the index. The index is unmanaged and not available for direct investment; therefore its performance does not reflect the expenses associated with the active management of an actual Portfolio.
See "Explanations of Charts, Tables and Financial Statements."
* The Portfolio's inception date – January 2, 2003
Janus Aspen Series December 31, 2007 5
Janus Aspen INTECH Risk-Managed Core Portfolio
Schedule of Investments
As of December 31, 2007
| Shares or Principal Amount | Value | ||||||||||
| Common Stock - 99.3% | |||||||||||
| Advertising Agencies - 0.1% | |||||||||||
| 1,700 | Interpublic Group of Companies, Inc.* | $ | 13,787 | ||||||||
| 700 | Omnicom Group, Inc. | 33,271 | |||||||||
| 47,058 | |||||||||||
| Aerospace and Defense - 2.8% | |||||||||||
| 2,400 | Boeing Co. | 209,904 | |||||||||
| 1,600 | General Dynamics Corp. | 142,384 | |||||||||
| 3,800 | Lockheed Martin Corp. | 399,988 | |||||||||
| 800 | Northrop Grumman Corp. | 62,912 | |||||||||
| 1,400 | Raytheon Co. | 84,980 | |||||||||
| 100 | Rockwell Collins, Inc. | 7,197 | |||||||||
| 907,365 | |||||||||||
| Aerospace and Defense - Equipment - 0.6% | |||||||||||
| 2,100 | B.F. Goodrich Co. | 148,281 | |||||||||
| 500 | United Technologies Corp. | 38,270 | |||||||||
| 186,551 | |||||||||||
| Agricultural Chemicals - 0.3% | |||||||||||
| 1,000 | Monsanto Co. | 111,690 | |||||||||
| Agricultural Operations - 0% | |||||||||||
| 200 | Archer-Daniels-Midland Co. | 9,286 | |||||||||
| Apparel Manufacturers - 1.1% | |||||||||||
| 5,300 | Coach, Inc.* | 162,074 | |||||||||
| 1,000 | Polo Ralph Lauren Corp. | 61,790 | |||||||||
| 1,800 | VF Corp. | 123,588 | |||||||||
| 347,452 | |||||||||||
| Appliances - 0.1% | |||||||||||
| 200 | Whirlpool Corp. | 16,326 | |||||||||
| Applications Software - 1.4% | |||||||||||
| 500 | Citrix Systems, Inc.* | 19,005 | |||||||||
| 1,900 | Compuware Corp.* | 16,872 | |||||||||
| 11,800 | Microsoft Corp. | 420,080 | |||||||||
| 455,957 | |||||||||||
| Athletic Footwear - 0.5% | |||||||||||
| 2,400 | NIKE, Inc. - Class B | 154,176 | |||||||||
| Audio and Video Products - 0.2% | |||||||||||
| 1,000 | Harman International Industries, Inc. | 73,710 | |||||||||
| Automotive - Medium and Heavy Duty Trucks - 0.6% | |||||||||||
| 3,800 | PACCAR, Inc. | 207,024 | |||||||||
| Automotive - Truck Parts and Equipment - Original - 0.7% | |||||||||||
| 6,600 | Johnson Controls, Inc. | 237,864 | |||||||||
| Beverages - Non-Alcoholic - 1.9% | |||||||||||
| 4,000 | Coca-Cola Co. | 245,480 | |||||||||
| 2,600 | Coca-Cola Enterprises, Inc. | 67,678 | |||||||||
| 900 | Pepsi Bottling Group, Inc. | 35,514 | |||||||||
| 3,300 | PepsiCo, Inc. | 250,470 | |||||||||
| 599,142 | |||||||||||
| Beverages - Wine and Spirits - 0.2% | |||||||||||
| 900 | Brown-Forman Corp. - Class B | 66,699 | |||||||||
| Brewery - 0.4% | |||||||||||
| 2,200 | Molson Coors Brewing Co. - Class B | 113,564 | |||||||||
| Broadcast Services and Programming - 0.5% | |||||||||||
| 4,600 | Clear Channel Communications, Inc. | 158,792 | |||||||||
| Building Products - Air and Heating - 0% | |||||||||||
| 300 | Trane, Inc. | 14,013 | |||||||||
| Shares or Principal Amount | Value | ||||||||||
| Cable Television - 1.1% | |||||||||||
| 12,100 | Comcast Corp. - Class A* | $ | 220,946 | ||||||||
| 6,100 | DIRECTV Group, Inc.* | 141,032 | |||||||||
| 361,978 | |||||||||||
| Casino Hotels - 0.8% | |||||||||||
| 3,000 | Harrah's Entertainment, Inc. | 266,250 | |||||||||
| Chemicals - Diversified - 0.5% | |||||||||||
| 1,300 | Dow Chemical Co. | 51,246 | |||||||||
| 200 | E.I. du Pont de Nemours and Co. | 8,818 | |||||||||
| 1,500 | PPG Industries, Inc. | 105,345 | |||||||||
| 165,409 | |||||||||||
| Chemicals - Specialty - 0% | |||||||||||
| 300 | International Flavors & Fragrances, Inc. | 14,439 | |||||||||
| Coatings and Paint Products - 0% | |||||||||||
| 200 | Sherwin-Williams Co. | 11,608 | |||||||||
| Computers - 4.3% | |||||||||||
| 2,500 | Apple, Inc.* | 495,200 | |||||||||
| 700 | Dell, Inc.* | 17,157 | |||||||||
| 9,700 | Hewlett-Packard Co. | 489,656 | |||||||||
| 3,400 | IBM Corp. | 367,540 | |||||||||
| 1,369,553 | |||||||||||
| Computers - Integrated Systems - 0.3% | |||||||||||
| 3,400 | Terdata Corp.* | 93,194 | |||||||||
| Computers - Memory Devices - 0.5% | |||||||||||
| 8,500 | EMC Corp.* | 157,505 | |||||||||
| 200 | SanDisk Corp.* | 6,634 | |||||||||
| 164,139 | |||||||||||
| Consumer Products - Miscellaneous - 0.1% | |||||||||||
| 400 | Kimberly-Clark Corp. | 27,736 | |||||||||
| Containers - Metal and Glass - 0.3% | |||||||||||
| 2,000 | Ball Corp. | 90,000 | |||||||||
| Containers - Paper and Plastic - 0% | |||||||||||
| 200 | Pactiv Corp.* | 5,326 | |||||||||
| Cosmetics and Toiletries - 3.4% | |||||||||||
| 1,800 | Avon Products, Inc. | 71,154 | |||||||||
| 4,300 | Colgate-Palmolive Co. | 335,228 | |||||||||
| 1,000 | Estee Lauder Companies, Inc. - Class A | 43,610 | |||||||||
| 8,727 | Procter & Gamble Co. | 640,736 | |||||||||
| 1,090,728 | |||||||||||
| Data Processing and Management - 0.4% | |||||||||||
| 2,700 | Fidelity National Information Services, Inc. | 112,293 | |||||||||
| Dental Supplies and Equipment - 0% | |||||||||||
| 300 | Patterson Companies, Inc.* | 10,185 | |||||||||
| Distribution/Wholesale - 0.1% | |||||||||||
| 200 | W.W. Grainger, Inc. | 17,504 | |||||||||
| Diversified Operations - 5.8% | |||||||||||
| 700 | 3M Co. | 59,024 | |||||||||
| 1,400 | Cooper Industries, Ltd. - Class A | 74,032 | |||||||||
| 600 | Eaton Corp. | 58,170 | |||||||||
| 26,500 | General Electric Co. | 982,355 | |||||||||
| 4,400 | Honeywell International, Inc. | 270,908 | |||||||||
| 600 | Illinois Tool Works, Inc. | 32,124 | |||||||||
| 3,200 | Ingersoll-Rand Co. - Class A | 148,704 | |||||||||
| 3,300 | Leucadia National Corp. | 155,430 | |||||||||
| 100 | Parker Hannifin Corp. | 7,531 | |||||||||
| 800 | Textron, Inc. | 57,040 | |||||||||
| 1,845,318 | |||||||||||
See Notes to Schedule of Investments and Financial Statements.
6 Janus Aspen Series December 31, 2007
Schedule of Investments
As of December 31, 2007
| Shares or Principal Amount | Value | ||||||||||
| Drug Delivery Systems - 0.1% | |||||||||||
| 600 | Hospira, Inc.* | $ | 25,584 | ||||||||
| E-Commerce/Products - 1.4% | |||||||||||
| 4,900 | Amazon.com, Inc.* | 453,936 | |||||||||
| E-Commerce/Services - 0.3% | |||||||||||
| 2,400 | Expedia, Inc.* | 75,888 | |||||||||
| 800 | IAC/InterActiveCorp* | 21,536 | |||||||||
| 97,424 | |||||||||||
| Electric - Integrated - 8.0% | |||||||||||
| 1,000 | Allegheny Energy, Inc. | 63,610 | |||||||||
| 5,500 | American Electric Power Company, Inc. | 256,080 | |||||||||
| 500 | CenterPoint Energy, Inc.# | 8,565 | |||||||||
| 100 | CMS Energy Corp. | 1,738 | |||||||||
| 3,700 | Constellation Energy Group, Inc. | 379,361 | |||||||||
| 100 | Dominion Resources, Inc. | 4,745 | |||||||||
| 1,400 | Edison International | 74,718 | |||||||||
| 3,500 | Entergy Corp. | 418,320 | |||||||||
| 800 | Exelon Corp. | 65,312 | |||||||||
| 2,700 | FirstEnergy Corp. | 195,318 | |||||||||
| 7,000 | FPL Group, Inc. | 474,459 | |||||||||
| 400 | Pepco Holdings, Inc. | 11,732 | |||||||||
| 1,200 | PG&E Corp. | 51,708 | |||||||||
| 6,100 | PPL Corp. | 317,749 | |||||||||
| 2,600 | Public Service Enterprise Group, Inc. | 255,424 | |||||||||
| 2,578,839 | |||||||||||
| Electronic Components - Semiconductors - 0.9% | |||||||||||
| 300 | Altera Corp. | 5,796 | |||||||||
| 1,600 | Intel Corp.* | 42,656 | |||||||||
| 1,600 | MEMC Electronic Materials, Inc.* | 141,584 | |||||||||
| 1,100 | Microchip Technology, Inc. | 34,562 | |||||||||
| 300 | National Semiconductor Corp. | 6,792 | |||||||||
| 1,400 | Texas Instruments, Inc. | 46,760 | |||||||||
| 278,150 | |||||||||||
| Electronics - Military - 0.1% | |||||||||||
| 300 | L-3 Communications Holdings, Inc. | 31,782 | |||||||||
| Engineering - Research and Development Services - 0.5% | |||||||||||
| 600 | Fluor Corp. | 87,432 | |||||||||
| 900 | Jacobs Engineering Group, Inc.* | 86,049 | |||||||||
| 173,481 | |||||||||||
| Engines - Internal Combustion - 0.5% | |||||||||||
| 1,200 | Cummins, Inc. | 152,844 | |||||||||
| Enterprise Software/Services - 0.5% | |||||||||||
| 7,576 | Oracle Corp.* | 171,066 | |||||||||
| Fiduciary Banks - 0% | |||||||||||
| 88 | Bank of New York Mellon Corp. | 4,291 | |||||||||
| Filtration and Separations Products - 0.4% | |||||||||||
| 2,800 | Pall Corp. | 112,896 | |||||||||
| Finance - Consumer Loans - 0.1% | |||||||||||
| 1,400 | SLM Corp.* | 28,196 | |||||||||
| Finance - Investment Bankers/Brokers - 2.2% | |||||||||||
| 11,800 | Citigroup, Inc. | 347,392 | |||||||||
| 1,000 | Goldman Sachs Group, Inc. | 215,050 | |||||||||
| 3,500 | JP Morgan Chase & Co. | 152,775 | |||||||||
| 100 | Morgan Stanley Co. | 5,311 | |||||||||
| 720,528 | |||||||||||
| Shares or Principal Amount | Value | ||||||||||
| Finance - Mortgage Loan Banker - 0.1% | |||||||||||
| 500 | Fannie Mae | $ | 19,990 | ||||||||
| Finance - Other Services - 0.6% | |||||||||||
| 100 | CME Group, Inc. | 68,600 | |||||||||
| 500 | IntercontinentalExchange, Inc.* | 96,250 | |||||||||
| 200 | NYSE Euronext | 17,554 | |||||||||
| 182,404 | |||||||||||
| Food - Confectionary - 0.2% | |||||||||||
| 100 | Hershey Foods Corp. | 3,940 | |||||||||
| 1,100 | Wm. Wrigley Jr. Co. | 64,405 | |||||||||
| 68,345 | |||||||||||
| Food - Dairy Products - 0.1% | |||||||||||
| 700 | Dean Foods Co.* | 18,102 | |||||||||
| Food - Diversified - 0.5% | |||||||||||
| 200 | ConAgra Foods, Inc. | 4,758 | |||||||||
| 900 | General Mills, Inc. | 51,300 | |||||||||
| 2,100 | H.J. Heinz Co. | 98,028 | |||||||||
| 100 | Kellogg Co. | 5,243 | |||||||||
| 159,329 | |||||||||||
| Food - Meat Products - 0.3% | |||||||||||
| 7,000 | Tyson Foods, Inc. - Class A | 107,310 | |||||||||
| Food - Retail - 1.3% | |||||||||||
| 10,000 | Kroger Co. | 267,100 | |||||||||
| 4,100 | Safeway, Inc. | 140,261 | |||||||||
| 407,361 | |||||||||||
| Food - Wholesale/Distribution - 0.6% | |||||||||||
| 5,100 | Supervalu, Inc. | 191,352 | |||||||||
| Forestry - 0.4% | |||||||||||
| 1,700 | Weyerhaeuser Co. | 125,358 | |||||||||
| Gas - Distribution - 0.1% | |||||||||||
| 700 | Sempra Energy Co. | 43,316 | |||||||||
| Health Care Cost Containment - 0% | |||||||||||
| 100 | McKesson Corp. | 6,551 | |||||||||
| Hotels and Motels - 0% | |||||||||||
| 200 | Wyndham Worldwide Corp. | 4,712 | |||||||||
| Independent Power Producer - 0.1% | |||||||||||
| 4,900 | Dynegy, Inc.* | 34,986 | |||||||||
| Industrial Automation and Robotics - 0.2% | |||||||||||
| 700 | Rockwell Automation, Inc. | 48,272 | |||||||||
| Industrial Gases - 0.2% | |||||||||||
| 600 | Air Products and Chemicals, Inc. | 59,178 | |||||||||
| 100 | Praxair, Inc. | 8,871 | |||||||||
| 68,049 | |||||||||||
| Instruments - Scientific - 1.4% | |||||||||||
| 2,900 | PerkinElmer, Inc. | 75,458 | |||||||||
| 4,500 | Thermo Fisher Scientific, Inc.* | 259,560 | |||||||||
| 1,600 | Waters Corp.* | 126,512 | |||||||||
| 461,530 | |||||||||||
| Insurance Brokers - 0% | |||||||||||
| 100 | Aon Corp. | 4,769 | |||||||||
| Internet Security - 0.1% | |||||||||||
| 1,100 | VeriSign, Inc.* | 41,371 | |||||||||
See Notes to Schedule of Investments and Financial Statements.
Janus Aspen Series December 31, 2007 7
Janus Aspen INTECH Risk-Managed Core Portfolio
Schedule of Investments
As of December 31, 2007
| Shares or Principal Amount | Value | ||||||||||
| Investment Management and Advisory Services - 0.1% | |||||||||||
| 200 | Ameriprise Financial, Inc. | $ | 11,022 | ||||||||
| 300 | Franklin Resources, Inc. | 34,329 | |||||||||
| 45,351 | |||||||||||
| Life and Health Insurance - 1.6% | |||||||||||
| 5,600 | CIGNA Corp. | 300,888 | |||||||||
| 58 | Lincoln National Corp. | 3,377 | |||||||||
| 1,200 | Prudential Financial, Inc. | 111,648 | |||||||||
| 3,800 | UnumProvident Corp. | 90,402 | |||||||||
| 506,315 | |||||||||||
| Machinery - Construction and Mining - 0.8% | |||||||||||
| 2,000 | Caterpillar, Inc. | 145,120 | |||||||||
| 1,900 | Terex Corp.* | 124,583 | |||||||||
| 269,703 | |||||||||||
| Machinery - Farm - 0.4% | |||||||||||
| 1,300 | Deere & Co. | 121,056 | |||||||||
| Machinery - General Industrial - 0% | |||||||||||
| 300 | Manitowoc Company, Inc. | 14,649 | |||||||||
| Medical - Biomedical and Genetic - 0.4% | |||||||||||
| 100 | Biogen Idec, Inc.* | 5,692 | |||||||||
| 2,300 | Celgene Corp.* | 106,283 | |||||||||
| 111,975 | |||||||||||
| Medical - Drugs - 5.8% | |||||||||||
| 5,400 | Abbott Laboratories | 303,210 | |||||||||
| 6,500 | Bristol-Myers Squibb Co. | 172,380 | |||||||||
| 800 | Eli Lilly and Co. | 42,712 | |||||||||
| 2,800 | King Pharmaceuticals, Inc.* | 28,672 | |||||||||
| 15,800 | Merck & Company, Inc. | 918,138 | |||||||||
| 4,200 | Pfizer, Inc. | 95,466 | |||||||||
| 10,500 | Schering-Plough Corp. | 279,720 | |||||||||
| 100 | Wyeth | 4,419 | |||||||||
| 1,844,717 | |||||||||||
| Medical - Generic Drugs - 0.1% | |||||||||||
| 800 | Watson Pharmaceuticals, Inc.* | 21,712 | |||||||||
| Medical - HMO - 0.4% | |||||||||||
| 1,200 | Aetna, Inc. | 69,276 | |||||||||
| 500 | Coventry Health Care, Inc.* | 29,625 | |||||||||
| 300 | UnitedHealth Group, Inc. | 17,460 | |||||||||
| 116,361 | |||||||||||
| Medical - Wholesale Drug Distributors - 0.1% | |||||||||||
| 400 | Cardinal Health, Inc. | 23,100 | |||||||||
| Medical Information Systems - 0% | |||||||||||
| 600 | IMS Health, Inc. | 13,824 | |||||||||
| Medical Instruments - 0% | |||||||||||
| 200 | Medtronic, Inc. | 10,054 | |||||||||
| Medical Labs and Testing Services - 0.2% | |||||||||||
| 1,000 | Quest Diagnostics, Inc. | 52,900 | |||||||||
| Medical Products - 3.0% | |||||||||||
| 5,200 | Baxter International, Inc. | 301,860 | |||||||||
| 200 | Becton, Dickinson and Co. | 16,716 | |||||||||
| 2,300 | Johnson & Johnson | 153,410 | |||||||||
| 4,300 | Stryker Corp. | 321,296 | |||||||||
| 2,300 | Zimmer Holdings, Inc.* | 152,145 | |||||||||
| 945,427 | |||||||||||
| Shares or Principal Amount | Value | ||||||||||
| Metal - Aluminum - 0.2% | |||||||||||
| 2,000 | Alcoa, Inc. | $ | 73,100 | ||||||||
| Metal - Diversified - 0.2% | |||||||||||
| 472 | Freeport-McMoRan Copper & Gold, Inc. - Class B | 48,352 | |||||||||
| Metal Processors and Fabricators - 1.4% | |||||||||||
| 3,200 | Precision Castparts Corp. | 443,840 | |||||||||
| Multi-Line Insurance - 2.2% | |||||||||||
| 2,800 | American International Group, Inc. | 163,240 | |||||||||
| 10,100 | Loews Corp. | 508,434 | |||||||||
| 600 | MetLife, Inc. | 36,972 | |||||||||
| 708,646 | |||||||||||
| Multimedia - 1.1% | |||||||||||
| 300 | Meredith Corp. | 16,494 | |||||||||
| 8,500 | News Corporation, Inc. - Class A | 174,165 | |||||||||
| 2,300 | Time Warner, Inc. | 37,973 | |||||||||
| 4,300 | Walt Disney Co. | 138,804 | |||||||||
| 367,436 | |||||||||||
| Networking Products - 1.9% | |||||||||||
| 17,000 | Cisco Systems, Inc.* | 460,190 | |||||||||
| 4,400 | Juniper Networks, Inc.* | 146,080 | |||||||||
| 606,270 | |||||||||||
| Non-Ferrous Metals - 0% | |||||||||||
| 200 | Titanium Metals Corp. | 5,290 | |||||||||
| Oil - Field Services - 1.5% | |||||||||||
| 300 | Baker Hughes, Inc. | 24,330 | |||||||||
| 2,900 | Schlumberger, Ltd. (U.S. Shares) | 285,273 | |||||||||
| 1,600 | Smith International, Inc. | 118,160 | |||||||||
| 600 | Weatherford International, Ltd.* | 41,160 | |||||||||
| 468,923 | |||||||||||
| Oil and Gas Drilling - 0.5% | |||||||||||
| 900 | Noble Corp. (U.S. Shares) | 50,859 | |||||||||
| 200 | Rowan Companies, Inc. | 7,892 | |||||||||
| 629 | Transocean, Inc.* | 90,041 | |||||||||
| 148,792 | |||||||||||
| Oil Companies - Exploration and Production - 0.5% | |||||||||||
| 100 | Anadarko Petroleum Corp. | 6,569 | |||||||||
| 200 | Apache Corp. | 21,508 | |||||||||
| 200 | Noble Energy, Inc. | 15,904 | |||||||||
| 600 | Occidental Petroleum Corp. | 46,194 | |||||||||
| 300 | Range Resources Corp. | 15,408 | |||||||||
| 800 | XTO Energy, Inc. | 41,088 | |||||||||
| 146,671 | |||||||||||
| Oil Companies - Integrated - 7.5% | |||||||||||
| 5,065 | Chevron Corp. | 472,716 | |||||||||
| 2,200 | ConocoPhillips | 194,260 | |||||||||
| 16,100 | Exxon Mobil Corp. | 1,508,410 | |||||||||
| 100 | Hess Corp. | 10,086 | |||||||||
| 3,240 | Marathon Oil Corp. | 197,186 | |||||||||
| 400 | Murphy Oil Corp. | 33,936 | |||||||||
| 2,416,594 | |||||||||||
| Oil Field Machinery and Equipment - 0.9% | |||||||||||
| 3,800 | National-Oilwell Varco, Inc.* | 279,148 | |||||||||
| Oil Refining and Marketing - 0.6% | |||||||||||
| 1,200 | Tesoro Corp. | 57,240 | |||||||||
| 1,800 | Valero Energy Corp. | 126,054 | |||||||||
| 183,294 | |||||||||||
See Notes to Schedule of Investments and Financial Statements.
8 Janus Aspen Series December 31, 2007
Schedule of Investments
As of December 31, 2007
| Shares or Principal Amount | Value | ||||||||||
| Paper and Related Products - 0.3% | |||||||||||
| 500 | International Paper Co. | $ | 16,190 | ||||||||
| 500 | MeadWestvaco Corp. | 15,650 | |||||||||
| 3,000 | Temple-Inland, Inc. | 62,550 | |||||||||
| 94,390 | |||||||||||
| Pharmacy Services - 1.5% | |||||||||||
| 1,200 | Express Scripts, Inc. - Class A* | 87,600 | |||||||||
| 3,817 | Medco Health Solutions, Inc.* | 387,044 | |||||||||
| 474,644 | |||||||||||
| Pipelines - 0.1% | |||||||||||
| 200 | Questar Corp. | 10,820 | |||||||||
| 200 | Williams Companies, Inc. | 7,156 | |||||||||
| 17,976 | |||||||||||
| Printing - Commercial - 0% | |||||||||||
| 300 | R.R. Donnelley & Sons Co. | 11,322 | |||||||||
| Property and Casualty Insurance - 0.1% | |||||||||||
| 400 | Travelers Companies, Inc. | 21,520 | |||||||||
| Quarrying - 0.5% | |||||||||||
| 2,000 | Vulcan Materials Co. | 158,180 | |||||||||
| Real Estate Operating/Development - 0.1% | |||||||||||
| 999 | Forestar Real Estate Group, Inc.* | 23,566 | |||||||||
| REIT - Office Property - 0% | |||||||||||
| 100 | Boston Properties, Inc. | 9,181 | |||||||||
| Retail - Apparel and Shoe - 0% | |||||||||||
| 200 | Nordstrom, Inc. | 7,346 | |||||||||
| Retail - Auto Parts - 0.2% | |||||||||||
| 600 | AutoZone, Inc.* | 71,946 | |||||||||
| Retail - Automobile - 0% | |||||||||||
| 400 | Auto Nation, Inc.* | 6,264 | |||||||||
| Retail - Computer Equipment - 0.1% | |||||||||||
| 400 | GameStop Corp. - Class A* | 24,844 | |||||||||
| Retail - Consumer Electronics - 0.2% | |||||||||||
| 3,800 | RadioShack Corp. | 64,068 | |||||||||
| Retail - Discount - 0.1% | |||||||||||
| 800 | Big Lots, Inc.* | 12,792 | |||||||||
| 100 | Wal-Mart Stores, Inc. | 4,753 | |||||||||
| 17,545 | |||||||||||
| Retail - Drug Store - 0.4% | |||||||||||
| 3,102 | CVS/Caremark Corp. | 123,305 | |||||||||
| Retail - Jewelry - 0.4% | |||||||||||
| 2,600 | Tiffany & Co. | 119,678 | |||||||||
| Retail - Major Department Stores - 0% | |||||||||||
| 100 | Sears Holdings Corp.* | 10,205 | |||||||||
| Retail - Regional Department Stores - 0.2% | |||||||||||
| 1,300 | Kohl's Corp.* | 59,540 | |||||||||
| Retail - Restaurants - 1.3% | |||||||||||
| 7,000 | McDonald's Corp. | 412,370 | |||||||||
| Rubber - Tires - 0.4% | |||||||||||
| 4,000 | Goodyear Tire & Rubber Co.* | 112,880 | |||||||||
| Savings/Loan/Thrifts - 0.1% | |||||||||||
| 999 | Guaranty Financial Group, Inc.* | 15,984 | |||||||||
| 900 | Washington Mutual, Inc. | 12,249 | |||||||||
| 28,233 | |||||||||||
| Shares or Principal Amount | Value | ||||||||||
| Schools - 0.3% | |||||||||||
| 1,500 | Apollo Group, Inc. - Class A* | $ | 105,225 | ||||||||
| Semiconductor Components/Integrated Circuits - 0.3% | |||||||||||
| 1,900 | Analog Devices, Inc. | 60,230 | |||||||||
| 1,500 | Linear Technology Corp. | 47,745 | |||||||||
| 107,975 | |||||||||||
| Semiconductor Equipment - 0% | |||||||||||
| 300 | Applied Materials, Inc. | 5,328 | |||||||||
| 200 | KLA-Tencor Corp. | 9,632 | |||||||||
| 14,960 | |||||||||||
| Steel - Producers - 0.6% | |||||||||||
| 1,600 | United States Steel Corp. | 193,456 | |||||||||
| Steel - Specialty - 0.4% | |||||||||||
| 1,300 | Allegheny Technologies, Inc. | 112,320 | |||||||||
| Super-Regional Banks - 1.3% | |||||||||||
| 9,176 | Bank of America Corp. | 378,602 | |||||||||
| 100 | SunTrust Banks, Inc. | 6,249 | |||||||||
| 400 | U.S. Bancorp | 12,696 | |||||||||
| 1,000 | Wells Fargo & Co. | 30,190 | |||||||||
| 427,737 | |||||||||||
| Telecommunication Equipment - Fiber Optics - 0.2% | |||||||||||
| 1,300 | Ciena Corp.* | 44,343 | |||||||||
| 700 | Corning, Inc. | 16,793 | |||||||||
| 61,136 | |||||||||||
| Telecommunication Services - 0.5% | |||||||||||
| 3,300 | Embarq Corp. | 163,449 | |||||||||
| Telephone - Integrated - 5.9% | |||||||||||
| 34,972 | AT&T, Inc.# | 1,453,437 | |||||||||
| 700 | CenturyTel, Inc. | 29,022 | |||||||||
| 8,500 | Sprint Nextel Corp. | 111,605 | |||||||||
| 6,500 | Verizon Communications, Inc. | 283,985 | |||||||||
| 1,013 | Windstream Corp. | 13,189 | |||||||||
| 1,891,238 | |||||||||||
| Television - 0% | |||||||||||
| 300 | CBS Corp. - Class B | 8,175 | |||||||||
| Therapeutics - 0.1% | |||||||||||
| 500 | Gilead Sciences, Inc.* | 23,005 | |||||||||
| Tobacco - 0.4% | |||||||||||
| 1,300 | Altria Group, Inc. | 98,254 | |||||||||
| 300 | UST, Inc. | 16,440 | |||||||||
| 114,694 | |||||||||||
| Tools - Hand Held - 0% | |||||||||||
| 100 | Snap-On, Inc. | 4,824 | |||||||||
| Toys - 0.7% | |||||||||||
| 2,400 | Hasbro, Inc. | 61,392 | |||||||||
| 7,800 | Mattel, Inc. | 148,512 | |||||||||
| 209,904 | |||||||||||
| Transportation - Railroad - 0.3% | |||||||||||
| 600 | CSX Corp. | 26,388 | |||||||||
| 600 | Union Pacific Corp. | 75,372 | |||||||||
| 101,760 | |||||||||||
| Transportation - Services - 0% | |||||||||||
| 200 | Expeditors International of Washington, Inc. | 8,936 | |||||||||
See Notes to Schedule of Investments and Financial Statements.
Janus Aspen Series December 31, 2007 9
Janus Aspen INTECH Risk-Managed Core Portfolio
Schedule of Investments
As of December 31, 2007
| Shares or Principal Amount | Value | ||||||||||
| Web Portals/Internet Service Providers - 0.6% | |||||||||||
| 300 | Google, Inc. - Class A* | $ | 207,444 | ||||||||
| Wireless Equipment - 0.1% | |||||||||||
| 600 | American Tower Corp. - Class A* | 25,560 | |||||||||
| 100 | QUALCOMM, Inc. | 3,935 | |||||||||
| 29,495 | |||||||||||
| Total Common Stock (cost $29,879,020) | 31,822,689 | ||||||||||
| Money Markets - 1.4% | |||||||||||
| 440,378 | Janus Institutional Cash Management Fund - Institutional Shares, 4.98% (cost $440,378) | 440,378 | |||||||||
| Other Securities - 3.6% | |||||||||||
| 4,392 | Allianz Dresdner Daily Asset Fund† | 4,392 | |||||||||
| 653,514 | Repurchase Agreements† | 653,514 | |||||||||
| 502,470 | Time Deposits† | 502,470 | |||||||||
| Total Other Securities (cost $1,160,376) | 1,160,376 | ||||||||||
| Total Investments (total cost $31,479,774) – 104.3% | 33,423,443 | ||||||||||
| Liabilities, net of Cash, Receivables and Other Assets – (4.3)% | (1,383,797 | ) | |||||||||
| Net Assets – 100% | $ | 32,039,646 | |||||||||
Summary of Investments by Country – (Long Positions)
| Country | Value | % of Investment Securities | |||||||||
| Bermuda | $ | 263,896 | 0.8 | % | |||||||
| Cayman Islands | 50,859 | 0.1 | % | ||||||||
| Netherlands | 285,273 | 0.9 | % | ||||||||
| United States†† | 32,823,415 | 98.2 | % | ||||||||
| Total | $ | 33,423,443 | 100.0 | % | |||||||
††Includes Short-Term Securities and Other Securities (93.4% excluding Short-Term Securities and Other Securities)
See Notes to Schedule of Investments and Financial Statements.
10 Janus Aspen Series December 31, 2007
Statement of Assets and Liabilities
| As of December 31, 2007 (all numbers in thousands except net asset value per share) | Janus Aspen INTECH Risk-Managed Core Portfolio | ||||||
| Assets: | |||||||
| Investments at cost(1) | $ | 31,480 | |||||
| Investments at value(1) | $ | 32,983 | |||||
| Affiliated money market investments | 440 | ||||||
| Cash | 50 | ||||||
| Receivables: | |||||||
| Investments sold | 614 | ||||||
| Portfolio shares sold | 132 | ||||||
| Dividends | 39 | ||||||
| Interest | 1 | ||||||
| Non-interested Trustees' deferred compensation | – | ||||||
| Other assets | 9 | ||||||
| Total Assets | 34,268 | ||||||
| Liabilities: | |||||||
| Payables: | |||||||
| Collateral for securities loaned (Note 1) | 1,160 | ||||||
| Investments purchased | 956 | ||||||
| Portfolio shares repurchased | 34 | ||||||
| Advisory fees | 11 | ||||||
| Transfer agent fees and expenses | 1 | ||||||
| Distribution fees - Service Shares | 7 | ||||||
| Administrative service fees - Service Shares | 3 | ||||||
| Non-interested Trustees' fees and expenses | 1 | ||||||
| Non-interested Trustees' deferred compensation fees | – | ||||||
| Accrued expenses | 55 | ||||||
| Total Liabilities | 2,228 | ||||||
| Net Assets | $ | 32,040 | |||||
| Net Assets Consist of: | |||||||
| Capital (par value and paid-in-surplus)* | $ | 28,571 | |||||
| Undistributed net investment income/(loss)* | 19 | ||||||
| Undistributed net realized gain/(loss) from investments and foreign currency transactions* | 1,506 | ||||||
| Unrealized net appreciation/(depreciation) of investments, foreign currency translations and non-interested Trustees' deferred compensation | 1,944 | ||||||
| Total Net Assets | $ | 32,040 | |||||
| Net Assets - Service Shares | $ | 32,040 | |||||
| Shares Outstanding, $0.001 Par Value (unlimited shares authorized) | 2,411 | ||||||
| Net Asset Value Per Share | $ | 13.29 | |||||
*See Note 3 in Notes to Financial Statements.
(1) Investments at cost and value include $1,119,273 of securities loaned (Note 1).
See Notes to Financial Statements.
Janus Aspen Series December 31, 2007 11
Statement of Operations
| For the fiscal year ended December 31, 2007 (all numbers in thousands) | Janus Aspen INTECH Risk-Managed Core Portfolio | ||||||
| Investment Income: | |||||||
| Interest | $ | – | |||||
| Dividends | 442 | ||||||
| Dividends from affiliates | 19 | ||||||
| Total Investment Income | 461 | ||||||
| Expenses: | |||||||
| Advisory fees | 86 | ||||||
| Transfer agent fees and expenses | 3 | ||||||
| Registration fees | 3 | ||||||
| Custodian fees | 27 | ||||||
| Professional fees | 25 | ||||||
| Non-interested Trustees' fees and expenses | 4 | ||||||
| Distribution fees - Service Shares | 56 | ||||||
| Administrative services fees - Service Shares | 22 | ||||||
| Printing expenses | 136 | ||||||
| Legal fees | 7 | ||||||
| System fees | 19 | ||||||
| Other expenses | 6 | ||||||
| Non-recurring costs (Note 2) | – | ||||||
| Costs assumed by Janus Capital Management LLC (Note 2) | – | ||||||
| Total Expenses | 394 | ||||||
| Expense and Fee Offset | – | ||||||
| Net Expenses | 394 | ||||||
| Less: Excess Expense Reimbursement | (70 | ) | |||||
| Net Expenses after Expense Reimbursement | 324 | ||||||
| Net Investment Income/(Loss) | 137 | ||||||
| Net Realized and Unrealized Gain/(Loss) on Investments: | |||||||
| Net realized gain/(loss) from investment and foreign currency transactions | 1,571 | ||||||
| Change in unrealized net appreciation/(depreciation) of investments, foreign currency translations and non-interested Trustees' deferred compensation | (232 | ) | |||||
| Net Gain/(Loss) on Investments | 1,339 | ||||||
| Net Increase/(Decrease) in Net Assets Resulting from Operations | $ | 1,476 | |||||
See Notes to Financial Statements.
12 Janus Aspen Series December 31, 2007
Statements of Changes in Net Assets
| For the fiscal years ended December 31 | Janus Aspen INTECH Risk-Managed Core Portfolio | ||||||||||
| (all numbers in thousands) | 2007 | 2006 | |||||||||
| Operations: | |||||||||||
| Net investment income/(loss) | $ | 137 | $ | 32 | |||||||
| Net realized gain/(loss) from investment and foreign currency transactions | 1,571 | 1,429 | |||||||||
| Change in unrealized net appreciation/(depreciation) of investments, foreign currency translations and non-interested Trustees' deferred compensation | (232 | ) | 148 | ||||||||
| Net Increase/(Decrease) in Net Assets Resulting from Operations | 1,476 | 1,609 | |||||||||
| Dividends and Distributions to Shareholders: | |||||||||||
| Net investment income* | |||||||||||
| Service Shares | (129 | ) | (20 | ) | |||||||
| Net realized gain/(loss) from investment transactions* | |||||||||||
| Service Shares | (152 | ) | (1,319 | ) | |||||||
| Tax return of capital* | |||||||||||
| Service Shares | – | – | |||||||||
| Net Decrease from Dividends and Distributions | (281 | ) | (1,339 | ) | |||||||
| Capital Share Transactions: | |||||||||||
| Shares sold | |||||||||||
| Service Shares | 19,414 | 12,671 | |||||||||
| Reinvested dividends and distributions | |||||||||||
| Service Shares | 281 | 1,339 | |||||||||
| Shares repurchased | |||||||||||
| Service Shares | (5,571 | ) | (17,313 | ) | |||||||
| Net Increase/(Decrease) from Capital Share Transactions | 14,124 | (3,303 | ) | ||||||||
| Net Increase/(Decrease) in Net Assets | 15,319 | (3,033 | ) | ||||||||
| Net Assets: | |||||||||||
| Beginning of period | 16,721 | 19,754 | |||||||||
| End of period | $ | 32,040 | $ | 16,721 | |||||||
| Undistributed Net investment Income/(Loss)* | $ | 19 | $ | 12 | |||||||
*See Note 3 in Notes to Financial Statements.
See Notes to Financial Statements.
Janus Aspen Series December 31, 2007 13
Financial Highlights – Service Shares
| For a share outstanding during each | Janus Aspen INTECH Risk-Managed Core Portfolio | ||||||||||||||||||||||
| fiscal year or period ended December 31 | 2007 | 2006 | 2005 | 2004 | 2003(1) | ||||||||||||||||||
| Net Asset Value, Beginning of Period | $ | 12.71 | $ | 12.47 | $ | 13.60 | $12.49 | $ | 10.00 | ||||||||||||||
| Income from Investment Operations: | |||||||||||||||||||||||
| Net investment income/(loss) | .06 | .02 | .04 | .02 | – | ||||||||||||||||||
| Net gain/(loss) on securities (both realized and unrealized) | .71 | 1.33 | 1.43 | 2.16 | 2.50 | ||||||||||||||||||
| Total from Investment Operations | .77 | 1.35 | 1.47 | 2.18 | 2.50 | ||||||||||||||||||
| Less Distributions: | |||||||||||||||||||||||
| Dividends (from net investment income)* | (.06 | ) | (.02 | ) | (.04 | ) | (.01 | ) | – | ||||||||||||||
| Distributions (from capital gains)* | (.13 | ) | (1.09 | ) | (2.35 | ) | (1.06 | ) | (.01 | ) | |||||||||||||
| Tax return of capital* | – | – | (.21 | ) | – | – | |||||||||||||||||
| Total Distributions | (.19 | ) | (1.11 | ) | (2.60 | ) | (1.07 | ) | (.01 | ) | |||||||||||||
| Net Asset Value, End of Period | $ | 13.29 | $ | 12.71 | $ | 12.47 | $ | 13.60 | $ | 12.49 | |||||||||||||
| Total Return** | 6.05 | % | 10.77 | % | 10.92 | % | 17.55 | % | 24.99 | % | |||||||||||||
| Net Assets, End of Period (in thousands) | $ | 32,040 | $ | 16,721 | $ | 19,754 | $ | 20,680 | $ | 11,337 | |||||||||||||
| Average Net Assets for the Period (in thousands) | $ | 22,388 | $ | 18,260 | $ | 19,174 | $ | 15,270 | $ | 8,414 | |||||||||||||
| Ratio of Gross Expenses to Average Net Assets***(2) | 1.45 | % | 1.45 | % | 1.35 | % | 1.43 | % | 1.50 | % | |||||||||||||
| Ratio of Net Expenses to Average Net Assets***(2) | 1.45 | % | 1.45 | % | 1.34 | % | 1.43 | % | 1.50 | % | |||||||||||||
| Ratio of Net Investment Income/(Loss) to Average Net Assets*** | 0.61 | % | 0.17 | % | 0.42 | % | 0.14 | % | 0 | % | |||||||||||||
| Portfolio Turnover Rate*** | 101 | % | 141 | % | 109 | % | 84 | % | 61 | % | |||||||||||||
* See Note 3 in Notes to Financial Statements.
** Total return not annualized for periods of less than one full year.
*** Annualized for periods of less than one full year.
(1) Fiscal period from January 2, 2003 (inception date) through December 31, 2003.
(2) See Note 4 in Notes to Financial Statements.
See Notes to Financial Statements.
14 Janus Aspen Series December 31, 2007
Notes to Schedule of Investments
| Lipper Variable Annuity Multi-Cap Core Funds | Funds that, by portfolio practice, invest in a variety of market capitalization ranges without concentrating 75% of their equity assets in any one market capitalization range over an extended period of time. Multi-cap funds typically have between 25% to 75% of their assets invested in companies with market capitalizations (on a three-year weighted basis) above 300% of the dollar-weighted median market capitalization of the middle 1,000 securities of the S&P SuperComposite 1500 Index. Multi-cap core funds have more latitude in the companies in which they invest. These funds typically have an average price-to-earnings ratio, price-to-book ratio, and three-year sales-per-share growth value, compared to the S&P SuperComposite 1500 Index. | ||||||
| S&P 500® Index | The Standard & Poor's ("S&P") 500® Index is a commonly recognized, market capitalization weighted index of 500 widely held equity securities, designed to measure broad U.S. equity performance. | ||||||
| REIT | Real Estate Investment Trust | ||||||
| U.S. Shares | Securities of foreign companies trading on an American Stock Exchange. | ||||||
*Non-income-producing security.
#Loaned security; a portion or all of the security is on loan as of December 31, 2007.
†The security is purchased with the cash collateral received from securities on loan (Note 1).
Janus Aspen Series December 31, 2007 15
Notes to Financial Statements
The following section describes the organization and significant accounting policies and provides more detailed information about the schedules and tables that appear throughout this report. In addition, the Notes to Financial Statements explain the methods used in preparing and presenting this report.
1. ORGANIZATION AND SIGNIFICANT ACCOUNTING POLICIES
Janus Aspen INTECH Risk-Managed Core Portfolio (the "Portfolio") is a series fund. The Portfolio is part of Janus Aspen Series (the "Trust"), which is organized as a Delaware statutory trust and is registered under the Investment Company Act of 1940, as amended, (the "1940 Act") as an open-end management investment company. The Trust offers seventeen Portfolios, which include multiple series of shares, with differing investment objectives and policies. The Portfolio invests primarily in equity securities. The Portfolio is classified as diversified, as defined in the 1940 Act. The Portfolio is a no-load investment.
The Portfolio currently offers one class of shares: Service Shares. Service Shares are offered only in connection with investment in and payments under variable insurance contracts and to qualified retirement plans that require a fee from Portfolio assets to procure distribution and administrative services to contract owners and plan participants.
Janus Capital Management LLC ("Janus Capital") invested initial seed capital in the amount of $10,000 for the Portfolio on December 31, 2002. Janus Capital invested additional seed capital in the amount of $7,490,000 for the Portfolio on January 2, 2003. Janus Capital redeemed all seed capital in the Portfolio on February 27, 2006.
The following accounting policies have been consistently followed by the Portfolio and are in conformity with accounting principles generally accepted in the United States of America in the investment company industry.
Investment Valuation
Securities are valued at the last sales price or the official closing price for securities traded on a principal securities exchange (U.S. or foreign) and on the NASDAQ National Market. Securities traded on over-the-counter markets and listed securities for which no sales are reported are valued at the latest bid price (or yield equivalent thereof) obtained from one or more dealers transacting in a market for such securities or by a pricing service approved by the Portfolio's Trustees. Short-term securities with maturities of 60 days or less may be valued at amortized cost, which approximates market value. Debt securities with a remaining maturity of greater than 60 days are valued in accordance with the evaluated bid price supplied by the pricing service. The evaluated bid price supplied by the pricing service is an evaluation that reflects such factors as security prices, yields, maturities and ratings. Foreign securities and currencies ar e converted to U.S. dollars using the applicable exchange rate in effect as of the daily close of the New York Stock Exchange ("NYSE"). When market quotations are not readily available or deemed unreliable, or events or circumstances that may affect the value of portfolio securities held by the Portfolio are identified between the closing of their principal markets and the time the net asset value ("NAV") is determined, securities may be valued at fair value as determined in good faith under procedures established by and under the supervision of the Portfolio's Trustees. Circumstances in which fair value pricing may be utilized include, but are not limited to: (i) when significant events occur which may affect the securities of a single issuer, such as mergers, bankruptcies, or significant issuer specific developments; (ii) when significant events occur which may affect an entire market, such as natural disasters or significant governmen tal actions; and (iii) when non-significant events occur such as markets closing early or not opening, security trading halts, or pricing of non-valued securities and restricted or non-public securities. The Portfolio may use a systematic fair valuation model provided by an independent third party to value international equity securities in order to adjust for stale pricing, which may occur between the close of certain foreign exchanges and the NYSE.
Investment Transactions and Investment Income
Investment transactions are accounted for as of the date purchased or sold (trade date). Dividend income is recorded on the ex-dividend date. Certain dividends from foreign securities will be recorded as soon as the Trust is informed of the dividend if such information is obtained subsequent to the ex-dividend date. Dividends from foreign securities may be subject to withholding taxes in foreign jurisdictions. Interest income is recorded on the accrual basis and includes amortization of premiums and accretion of discounts. Gains and losses are determined on the identified cost basis, which is the same basis used for federal income tax purposes.
Expenses
The Portfolio bears expenses incurred specifically on its behalf as well as a portion of general expenses, which may be allocated pro rata to the Portfolio.
Securities Lending
Under procedures adopted by the Trustees, the Portfolio may lend securities to qualified parties (typically brokers or other financial institutions) who need to borrow securities in order to complete certain transactions such as covering short sales, avoiding failures to deliver securities or completing arbitrage activities. The Portfolio may seek to earn additional income through securities lending. There is the risk of delay in recovering a loaned security or the risk of loss in collateral rights if the borrower fails financially. Janus Capital Management LLC ("Janus Capital") makes efforts to balance the benefits and risks from granting such loans.
State Street Bank and Trust Company served as the Portfolio's lending agent for the period January 1, 2007 through May 24, 2007. Effective May 25, 2007, Dresdner Bank AG became the lending agent for the Portfolio.
16 Janus Aspen Series December 31, 2007
The Portfolio does not have the right to vote on securities while they are being lent; however, the Portfolio may attempt to call back the loan and vote the proxy if time permits. All loans will be continuously secured by collateral which may consist of cash, U.S. Government securities, domestic and foreign short-term debt instruments, letters of credit, time deposits, repurchase agreements, money market mutual funds or other money market accounts, or such other collateral permitted by the Securities and Exchange Commission ("SEC"). Cash collateral may be invested in affiliated money market funds or other accounts advised by Janus Capital to the extent consistent with exemptive relief obtained from the SEC or as permitted by the 1940 Act and rules promulgated thereunder.
Dresdner Bank AG (the "Lending Agent") may also invest the cash collateral in the Allianz Dresdner Daily Asset Fund or investments in unaffiliated money market funds or accounts, mutually agreed to by the Portfolio and the Lending Agent, that comply with Rule 2a-7 of the 1940 Act relating to money market funds.
As of December 31, 2007, the Portfolio had on loan securities valued as indicated:
| Portfolio | Value at December 31, 2007 | ||||||
| Janus Aspen INTECH Risk-Managed Core Portfolio | $ | 1,119,273 | |||||
As of December 31, 2007, the Portfolio received cash collateral for securities lending activity as indicated:
| Portfolio | Cash Collateral at December 31, 2007 | ||||||
| Janus Aspen INTECH Risk-Managed Core Portfolio | $ | 1,160,376 | |||||
As of December 31, 2007, all cash collateral received by the Portfolio was invested in the Allianz Dresdner Daily Asset Fund, except for $653,514 and $502,470 which were invested in Repurchase Agreements and Time Deposits, respectively.
The value of the collateral must be at least 102% of the market value of the loaned securities that are denominated in U.S. dollars and 105% of the market value of the loaned securities that are not denominated in U.S. dollars. Loaned securities and related collateral are marked-to-market each business day based upon the market value of the loaned securities at the close of business, employing the most recent available pricing information. Collateral levels are then adjusted based on this mark-to-market evaluation.
The borrower pays fees at the Portfolio's direction to the Lending Agent. The Lending Agent may retain a portion of the interest earned on the cash collateral invested. The cash collateral invested by the Lending Agent is disclosed in the Schedule of Investments (if applicable). The lending fees and the Portfolio's portion of the interest income earned on cash collateral are included on the Statement of Operations (if applicable).
Interfund Lending
Pursuant to an exemptive order received from the SEC, the Portfolio may be party to an interfund lending agreement between the Portfolio and other Janus Capital sponsored mutual funds, which permits it to borrow or lend cash at a rate beneficial to both the borrowing and lending funds. Outstanding borrowings from all sources totaling 10% or more of the borrowing Portfolio's total assets must be collateralized at 102% of the outstanding principal value of the loan; loans of less than 10% may be unsecured. During the fiscal year ended December 31, 2007, there were no outstanding interfund borrowing or lending arrangements for the Portfolio.
Futures Contracts
The Portfolio may enter into futures contracts to gain exposure to the stock market pending investment of cash balances or to meet liquidity needs. The Portfolio may also use such derivative instruments to hedge or protect from adverse movements in securities prices, currency rates or interest rates. The use of futures contracts may involve risks such as the possibility of illiquid markets or imperfect correlation between the value of the contracts and the underlying securities, or that the counterparty will fail to perform its obligations.
Futures contracts are marked-to-market daily, and the daily variation margin is recorded as a receivable or payable on the Statement of Assets and Liabilities (if applicable). When a contract is closed, a realized gain or loss is recorded as "Net realized gain/(loss) from futures contracts" on the Statement of Operations (if applicable) equal to the difference between the opening and closing value of the contract. Generally, futures contracts are marked-to-market (i.e., treated as realized and subject to distribution) for federal income tax purposes at fiscal year-end. Securities designated as collateral for market value on futures contracts are noted in the Schedule of Investments (if applicable). Such collateral is in the possession of the Portfolio's custodian. As of December 31, 2007, the Portfol io was not invested in futures contracts.
Initial Public Offerings
The Portfolio may invest in initial public offerings ("IPOs"). IPOs and other investment techniques may have a magnified performance impact on a fund with a small asset base. The Portfolio may not experience similar performance as its assets grow.
Restricted Security Transactions
Restricted securities held by the Portfolio may not be sold except in exempt transactions or in a public offering registered under the Securities Act of 1933. The risk of investing in such securities is generally greater than the risk of investing in the securities of widely held, publicly traded companies. Lack of a secondary market and resale restrictions may result in the inability of the Portfolio to sell a security at a fair price and may substantially delay the sale of the security. In addition, these securities may exhibit greater price volatility than securities for which secondary markets exist. As of December 31, 2007, the Portfolio was not invested in restricted securities.
Janus Aspen Series December 31, 2007 17
Notes to Financial Statements (continued)
Dividend Distributions
The Portfolio may make semiannual distributions of substantially all of its investment income and an annual distribution of its net realized capital gains (if any). The majority of dividends and net realized capital gains distributions from the Portfolio may be automatically reinvested into additional shares of the Portfolio, based upon the discretion of the shareholder.
The Portfolio has made certain investments in real estate investment trusts ("REITs") which pay dividends to their shareholders based upon funds available from operations. It is quite common for these dividends to exceed the REIT's taxable earnings and profits resulting in the excess portion of such dividends being designated as a return of capital. If the Portfolio distributes such amounts, such distribution could constitute a return of capital to shareholders for federal income tax purposes.
Estimates
The preparation of financial statements in conformity with accounting principles generally accepted in the United States of America requires management to make estimates and assumptions that affect the reported amount of assets and liabilities and disclosure of contingent assets and liabilities at the date of the financial statements, and the reported amounts of income and expenses during the reporting period. Actual results could differ from those estimates.
Federal Income Taxes
No provision for income taxes is included in the accompanying financial statements, as the Portfolio intends to distribute to shareholders all taxable investment income and realized gains and otherwise comply with Subchapter M of the Internal Revenue Code applicable to regulated investment companies.
New Accounting Pronouncements
In July 2006, the Financial Accounting Standards Board ("FASB") issued Interpretation No. 48, "Accounting for Uncertainty in Income Taxes – an Interpretation of FASB Statement No. 109" (the "Interpretation"). The Interpretation establishes for all entities, including pass-through entities such as the Portfolio, a minimum threshold for financial statement recognition of the benefit of positions taken in filing tax returns (including whether an entity is taxable in a particular jurisdiction), and requires certain expanded tax disclosures. A calendar year open-end or closed-end fund was required to implement the Interpretation no later than June 29, 2007 (the last business day of the semi-annual reporting period), and the Interpretation also applies to all open tax years as of the date of effectiveness. Management has evaluated the application of the Interpretation to the Portfolio and has determined there is no significant impact on the P ortfolio's financial statements.
In September 2006, the FASB issued Statement of Financial Accounting Standards No. 157, "Fair Value Measurements" ("SFAS No. 157"), which defines fair value, establishes a framework for measuring fair value in generally accepted accounting principles, and expands disclosures about fair value measurements. SFAS No. 157 does not require new fair value measurements, but is applied to the extent that other accounting pronouncements require or permit fair value measurements. SFAS No. 157 emphasizes that fair value is a market-based measurement that should be determined based on the assumptions that market participants would use in pricing an asset or liability. SFAS No. 157 is effective for fiscal years beginning after November 15, 2007 and interim periods within those fiscal years. Management does not believe the adoption of SFAS No. 157 will impact the financial statement a mounts, however, the Portfolio will be required to disclose the extent to which fair value is used to measure assets and liabilities and the inputs used to develop the measurements.
2. INVESTMENT ADVISORY AGREEMENTS AND OTHER TRANSACTIONS WITH AFFILIATES
The Portfolio pays a monthly advisory fee to Janus Capital based upon average daily net assets and calculated at the annual rate of 0.50%.
For the Portfolio, the investment advisory fee is determined by calculating a base fee and applying a performance adjustment. The base fee rate is the same as the investment advisory fee rate shown in the previous paragraph. The performance adjustment either increases or decreases the base fee depending on how well the Portfolio has performed relative to its benchmark, as shown below:
| Portfolio | Benchmark Index | ||||||
| Janus Aspen INTECH Risk-Managed Core Portfolio | S&P 500® Index | ||||||
Only the base fee rate applied until January 2007 for the Portfolio, at which time the calculation of the performance adjustment is applied as follows:
(Investment Advisory Fee = Base Fee +/- Performance Adjustment).
The investment advisory fee paid to Janus Capital by the Portfolio consists of two components: (i) a base fee calculated by applying the contractual fixed-rate of the advisory fee to the Portfolio's average daily net assets during the previous month ("Base Fee"), plus or minus (ii) a performance-fee adjustment ("Performance Adjustment") calculated by applying a variable rate of up to 0.15% (positive or negative) to the Portfolio's average daily net assets during the applicable performance measurement period.
The performance measurement period generally is the previous 36 months. When the Portfolio's performance-based fee structure has been in effect for at least 12 months, but less than 36 months, the performance measurement period will be equal to the time that has elapsed since the performance-based fee structure took effect. As noted above, any Performance Adjustment began January 2007 for the Portfolio. No Performance Adjustment will be applied unless the difference between the Portfolio's investment performance and the
18 Janus Aspen Series December 31, 2007
investment record of the Portfolio's benchmark index is 0.50% or greater (positive or negative) during the applicable performance measurement period. Because the Performance Adjustment is tied to the Portfolio's performance relative to its benchmark index (and not its absolute performance), the Performance Adjustment could increase Janus Capital's fee even if the Portfolio's shares lose value during the performance measurement period and could decrease Janus Capital's fee even if the Portfolio's shares increase in value during the performance measurement period. For purposes of computing the Base Fee and the Performance Adjustment, net assets will be averaged over different periods (average daily net assets during the previous month for the Base Fee, versus average daily net assets during the performance measurement period for the Performance Adjustment). Performance of the Portfolio is calculated net of expenses, whereas the Portfolio's ben chmark index does not have any expenses. Reinvestment of dividends and distributions are included in calculating both the performance of the Portfolio and the Portfolio's benchmark index. The Base Fee is calculated and accrued daily. The Performance Adjustment is calculated monthly in arrears and is accrued evenly each day throughout the month. The investment fee is paid monthly in arrears.
It is not possible to predict the effect of the Performance Adjustment on future overall compensation to Janus Capital since it will depend on the performance of the Portfolio relative to the record of the Portfolio's benchmark index and future changes to the size of the Portfolio.
The Portfolio's prospectus and statement of additional information contain additional information about performance-based fees. The amount shown as Advisory fees on the Statement of Operations reflects the Base Fee plus/minus any Performance Adjustment. During the fiscal year ended December 31, 2007, the Portfolio recorded a negative Performance Adjustment of $25,718.
Enhanced Investment Technologies, LLC ("INTECH") serves as subadviser to the Portfolio. Janus Capital indirectly owns approximately 86.5% of the outstanding voting shares of INTECH. Janus Capital pays INTECH a subadvisory fee at the annual rate of 0.26% of average daily net assets from its management fee for managing the Portfolio.
Effective January 1, 2008, the subadvisory fee rate paid by Janus Capital changed from a fixed rate based on the Portfolio's annual average daily net assets (plus or minus half of any performance fee adjustment) to a fee equal to 50% of the investment advisory fee rate paid by the Portfolio to Janus Capital (net of any performance fee adjustment).
Janus Services LLC ("Janus Services"), a wholly-owned subsidiary of Janus Capital, receives from the Portfolio a fee at an annual rate of up to 0.10% of the average daily net assets of Service Shares of the Portfolio, to compensate Janus Services for providing, or arranging for the provision of record keeping, subaccounting, and administrative services.
Janus Services receives certain out-of-pocket expenses for transfer agent services.
Janus Capital has agreed until at least May 1, 2009 to reimburse the Portfolio by the amount, if any, that the normal operating expenses in any fiscal year, including the investment advisory fee but excluding the distribution and shareholder servicing (12b-1) fees applicable to Service Shares, the administrative services fees applicable to Service Shares, brokerage commissions, interest, taxes and extraordinary expenses, exceed an annual rate of 1.10% of the average daily net assets of the Portfolio. The Portfolio is not required to repay any such waived fees in future years to Janus Capital.
Certain officers of the Portfolio may also be officers and/or directors of Janus Capital. Such officers receive no compensation from the Portfolio, except for the Portfolio's Chief Compliance Officer. Effective January 1, 2006, the Portfolio began reimbursing the adviser for a portion of the compensation paid to the Chief Compliance Officer of the Trust. Total compensation of $3,078 was paid by the Portfolio during the fiscal year ended December 31, 2007. The Portfolio's portion is reported as part of "Other Expenses" on the Statement of Operations.
The Board of Trustees has adopted a deferred compensation plan (the "Deferred Plan") for independent Trustees to elect to defer receipt of all or a portion of the annual compensation they are entitled to receive from the Portfolio. All deferred fees are credited to an account established in the name of the Trustees. The amounts credited to the account then increase or decrease, as the case may be, in accordance with the performance of one or more of the Janus funds that are selected by the Trustees. The account balance continues to fluctuate in accordance with the performance of the selected fund or funds until final payment of all amounts credited to the account. The fluctuation of the account balance is recorded by the Portfolio as unrealized appreciation/(depreciation) and is shown as of December 31, 2007 on the Statement of Assets and Liabilities as an asset, "Noninterested Trustees' deferred compensation," and a liability, "Noninterest ed Trustees' deferred compensation fees." Additionally, the recorded unrealized appreciation/(depreciation) is included in "Unrealized net appreciation/(depreciation) of investments, foreign currency translations and non-interested Trustees' deferred compensation" on the Statement of Assets and Liabilities. Deferred compensation expenses for the fiscal year ended December 31, 2007 are included in "Non-interested Trustees' fees and expenses" on the Statement of Operations. Trustees are allowed to change their designation of mutual funds from time to time. Amounts will be deferred until distributed in accordance with the Deferred Plan. No deferred fees were paid to any Trustee under the Deferred Plan during the fiscal year ended December 31, 2007.
Janus Aspen Series December 31, 2007 19
Notes to Financial Statements (continued)
For the fiscal year ended December 31, 2007, Janus Capital assumed $24,421 of legal, consulting and Trustee costs and fees incurred by the funds in Janus Investment Fund, Janus Aspen Series and Janus Adviser Series (the "Funds") in connection with the regulatory and civil litigation matters discussed in Note 7. These non-recurring costs were allocated to all Funds based on the Funds' respective net assets as of July 31, 2004. Additionally, all future non-recurring costs will be allocated to the Funds based on the Funds' respective net assets on July 31, 2004. These "Non-recurring costs" and "Costs assumed by Janus Capital" are shown on the Statement of Operations.
Janus Distributors LLC, a wholly-owned subsidiary of Janus Capital, is a distributor of the Portfolio. Service Shares have adopted a Distribution and Shareholder Servicing Plan (the "Plan") pursuant to Rule 12b-1 under the 1940 Act. The Plan authorizes payments by the Portfolio in connection with the distribution of Service Shares at an annual rate of up to 0.25% of Service Share's average daily net assets.
The Portfolio's expenses may be reduced by expense offsets from an unaffiliated custodian and/or transfer agent. Such credits or offsets are included in "Expense and Fee Offset" on the Statement of Operations. The transfer agent fee offsets received during the period reduce Transfer Agent Fees and Expenses. Custodian offsets received reduce Custodian Fees. The Portfolio could have employed the assets used by the custodian and/or transfer agent to produce income if it had not entered into an expense offset arrangement.
The Portfolio may invest in money market funds, including funds managed by Janus Capital. During the fiscal year ended December 31, 2007, the Portfolio recorded distributions from affiliated investment companies as affiliated dividend income, and had the following affiliated purchases and sales:
| Purchases Shares/Cost | Sales Shares/Cost | Dividend Income | Value at 12/31/07 | ||||||||||||||||
| Janus Aspen INTECH Risk-Managed Core Portfolio | |||||||||||||||||||
| Janus Institutional Cash Management Fund – Institutional Shares | $ | 2,064,915 | $ | 1,624,537 | $ | 4,116 | $ | 440,378 | |||||||||||
| Janus Institutional Cash Reserves Fund | 160,600 | 160,600 | 93 | – | |||||||||||||||
| Janus Institutional Money Market Fund – Institutional Shares | 17,499,266 | 17,499,266 | 14,231 | – | |||||||||||||||
| Janus Money Market Fund – Institutional Shares | 503,400 | 503,400 | 464 | – | |||||||||||||||
| $ | 20,228,181 | $ | 19,787,803 | $ | 18,904 | $ | 440,378 | ||||||||||||
3. FEDERAL INCOME TAX
The tax components of capital shown in the table below represent: (1) distribution requirements the Portfolio must satisfy under the income tax regulations; (2) losses or deductions the Portfolio may be able to offset against income and gains realized in future years; and (3) unrealized appreciation or depreciation of investments for federal income tax purposes (reduced by foreign tax liability).
Other book to tax differences in the current year may consist of deferred compensation, derivatives, and foreign currency contract adjustments. The Portfolio has elected to treat gains and losses on forward foreign currency contracts as capital gains and losses. Other foreign currency gains and losses on debt instruments are treated as ordinary income for federal income tax purposes pursuant to Section 988 of the Internal Revenue Code.
| Portfolio | Undistributed Ordinary Income | Undistributed Long-Term Gains | Accumulated Capital Losses | Post October Deferral | Other Book to Tax Differences | Net Tax Appreciation/ (Depreciation) | |||||||||||||||||||||
| Janus Aspen INTECH Risk-Managed Core Portfolio | $ | 22,445 | $ | 1,598,789 | $ | – | $ | – | $ | (167 | ) | $ | 1,847,648 | ||||||||||||||
The aggregate cost of investments and the composition of unrealized appreciation and depreciation of investment securities for federal income tax purposes as of December 31, 2007 are noted below.
Unrealized appreciation and unrealized depreciation in the table below exclude appreciation/depreciation on foreign currency translations. The primary difference between book and tax appreciation or depreciation of investments is wash sale loss deferrals.
| Portfolio | Federal Tax Cost | Unrealized Appreciation | Unrealized (Depreciation) | ||||||||||||
| Janus Aspen INTECH Risk-Managed Core Portfolio | $31,575,795 | $ | 3,181,392 | $ | (1,333,744 | ) | |||||||||
20 Janus Aspen Series December 31, 2007
Income and capital gains distributions are determined in accordance with income tax regulations that may differ from accounting principles generally accepted in the United States of America. These differences are due to differing treatments for items such as net short-term gains, deferral of wash sale losses, foreign currency transactions, net investment losses and capital loss carryovers. Certain permanent differences such as tax returns of capital and net investment losses noted below have been reclassified to paid-in capital.
| For the fiscal year ended December 31, 2007 | Distributions | ||||||||||||||||||
| Portfolio | From Ordinary Income | From Long-Term Capital Gains | Tax Return of Capital | Net Investment Loss | |||||||||||||||
| Janus Aspen INTECH Risk-Managed Core Portfolio | $ | 129,291 | $ | 151,778 | $ | – | $ | – | |||||||||||
| For the fiscal period ended December 31, 2006 | Distributions | ||||||||||||||||||
| Portfolio | From Ordinary Income | From Long-Term Capital Gains | Tax Return of Capital | Net Investment Loss | |||||||||||||||
| Janus Aspen INTECH Risk-Managed Core Portfolio | $ | 19,977 | $ | 1,319,180 | $ | – | $ | – | |||||||||||
4. EXPENSE RATIOS
The expense ratios listed in the Financial Highlights reflect expenses prior to any expense offsets (gross expense ratio) and after expense offsets (net expense ratio). Both expense ratios reflect expenses after waivers (reimbursement). Listed below are the gross expense ratios for the Portfolio that would have been in effect, absent the waiver of certain fees and offsets.
For each fiscal year or period ended December 31
| Service Shares | |||||||||||||||||||||||
| Portfolio | 2007(1) | 2006(1) | 2005(1) | 2004(1) | 2003(2) | ||||||||||||||||||
| Janus Aspen INTECH Risk-Managed Core Portfolio | 1.76 | % | 1.86 | % | 1.35 | % | 1.43 | % | 2.62 | % | |||||||||||||
(1) The effect of non-recurring costs assumed by Janus Capital (Note 2) is included in the ratio of operating expenses to average net assets without waivers and/or expense reimbursements and was less than 0.01%.
(2) Fiscal period from January 2, 2003 (inception date) through December 31, 2003.
5. CAPITAL SHARE TRANSACTIONS
| For each fiscal year ended December 31 | Janus Aspen INTECH Risk-Managed Core Portfolio | ||||||||||
| (all numbers in thousands) | 2007 | 2006 | |||||||||
| Transactions in Portfolio Shares – Service Shares | |||||||||||
| Shares sold | 1,496 | 974 | |||||||||
| Reinvested dividends and distributions | 21 | 105 | |||||||||
| Shares repurchased | (422 | ) | (1,348 | ) | |||||||
| Net Increase/(Decrease) in Portfolio Shares | 1,095 | (269 | ) | ||||||||
| Shares Outstanding, Beginning of Period | 1,316 | 1,585 | |||||||||
| Shares Outstanding, End of Period | 2,411 | 1,316 | |||||||||
6. PURCHASES AND SALES OF INVESTMENT SECURITIES
For the fiscal year ended December 31, 2007, the aggregate cost of purchases and proceeds from sales of investment securities (excluding short-term securities) were as follows:
| Portfolio | Purchases of Securities | Proceeds from Sales of Securities | Purchases of Long- Term U.S. Government Obligations | Proceeds from Sales of Long-Term U.S. Government Obligations | |||||||||||||||
| Janus Aspen INTECH Risk-Managed Core Portfolio | $ | 36,407,414 | $ | 22,565,628 | $ | – | $ | – | |||||||||||
Janus Aspen Series December 31, 2007 21
Notes to Financial Statements (continued)
7. PENDING LEGAL MATTERS
In the fall of 2003, the Securities and Exchange Commission ("SEC"), the Office of the New York State Attorney General ("NYAG"), the Colorado Attorney General ("COAG"), and the Colorado Division of Securities ("CDS") announced that they were investigating alleged frequent trading practices in the mutual fund industry. On August 18, 2004, Janus Capital announced that it had reached final settlements with the SEC, the NYAG, the COAG, and the CDS related to such regulators' investigations into Janus Capital's frequent trading arrangements.
A number of civil lawsuits were brought against Janus Capital and certain of its affiliates, the Janus funds, and related entities and individuals based on allegations similar to those announced by the above regulators and were filed in several state and federal jurisdictions. Such lawsuits alleged a variety of theories for recovery including, but not limited to, the federal securities laws, other federal statutes (including ERISA), and various common law doctrines. The Judicial Panel on Multidistrict Litigation transferred these actions to the U.S. District Court for the District of Maryland (the "Court") for coordinated proceedings. On September 29, 2004, five consolidated amended complaints were filed with the Court that generally include: (i) claims by a putative class of investors in certain Janus funds asserting claims on behalf of the investor class (Marini, et al. v. Janus Investment Fund, et al., U.S. District Court, District of Maryland, Case No. 04-CV-00497); (ii) derivative claims by investors in certain Janus funds ostensibly on behalf of such funds (Steinberg et al. v. Janus Capital Management, LLC et al., U.S. District Court, District of Maryland, Case No. 04-CV-00518); (iii) claims on behalf of participants in the Janus 401(k) plan (Wangberger v. Janus Capital Group Inc., 401(k) Advisory Committee, et al., U.S. District Court, District of Maryland, Case No. JFM-05-2711); (iv) claims brought on behalf of shareholders of Janus Capital Group Inc. ("JCGI") on a derivative basis against the Board of Directors of JCGI (Chasen v. Whiston, et al., U.S. District Court, District of Maryland, Case No. 04-MD-00855); and (v) claims by a putative class of shareholders of JCGI asserting claims on behalf of the shareholders (Wiggins, et al. v. Janus Capital Group, Inc., et al., U.S. District Court, District of Maryland, Case No. 04-CV-00818). Each of the five complaints initially named JCGI and/or Janus Capital as a defendant. In addition, the following were also named as defendants in one or more of the actions: Janus Investment Fund ("JIF"), Janus Aspen Series ("JAS"), Janus Adviser Series ("JAD"), Janus Distributors LLC, Enhanced Investment Technologies, LLC ("INTECH"), Bay Isle Financial LLC ("Bay Isle"), Perkins, Wolf, McDonnell and Company, LLC ("Perkins"), the Advisory Committee of the Janus 401(k) plan, and the current or former directors of JCGI.
On August 25, 2005, the Court entered orders dismissing most of the claims asserted against Janus Capital and its affiliates by fund investors in the Marini and Steinberg cases (actions (i) and (ii) above) except certain claims under Section 10(b) of the Securities Exchange Act of 1934 and under Section 36(b) of the Investment Company Act of 1940, as amended (the "1940 Act"). On August 15, 2006, the Wangberger complaint in the 401(k) plan class action (action (iii) above) was dismissed by the district court with prejudice. The plaintiff appealed that dismissal decision to the United States Court of Appeals for the Fourth Circuit. The appeal is still pending and argument in the matter was held in December 2007. The Court also dismissed the Chasen lawsuit (action (iv) above) against JCGI's Board of Directors without leave to amend. Finally, a Motion to Dismiss the Wiggins suit (action (v) above) was granted a nd the matter was dismissed in May 2007. However, in June 2007, Plaintiffs appealed that dismissal to the United States Court of Appeals for the Fourth Circuit. That appeal is currently pending.
In addition to the lawsuits described above, the Auditor of the State of West Virginia ("Auditor"), in his capacity as securities commissioner, has initiated administrative proceedings against many of the defendants in the market timing cases (including JCGI and Janus Capital) and, as a part of its relief, is seeking disgorgement and other monetary relief based on similar market timing allegations (In the Matter of Janus Capital Group Inc. et al., Before the Securities Commissioner, State of West Virginia, Summary Order No. 05-1320). The respondents in these proceedings collectively sought a Writ of Prohibition in state court, which was denied. Their subsequent Petition for Appeal was also denied. Consequently, in September 2006, JCGI and Janus Capital filed their answer to the Auditor's summary order instituting proceedings and requested a hearing. A status conference was held on June 28, 2007, during which the parties were ordered t o submit their proposed scheduling order. To date, no scheduling order has been entered in the case. In addition to the pending Motion to Discharge Order to Show Cause, JCGI and Janus Capital, as well as other similarly situated defendants, continue to challenge the statutory authority of the Auditor to bring such an action.
Additional lawsuits may be filed against certain of the Janus funds, Janus Capital, and related parties in the future. Janus Capital does not currently believe that these pending actions will materially affect its ability to continue providing services it has agreed to provide to the Janus funds.
22 Janus Aspen Series December 31, 2007
Report of Independent Registered Public
Accounting Firm
To the Trustees and Shareholders
of Janus Aspen INTECH Risk-Managed Core Portfolio
In our opinion, the accompanying statement of assets and liabilities, including the schedule of investments, and the related statements of operations and of changes in net assets and the financial highlights present fairly, in all material respects, the financial position of Janus Aspen INTECH Risk-Managed Core Portfolio (formerly Janus Aspen Risk-Managed Core Portfolio) (one of the portfolios constituting Janus Aspen Series, hereafter referred to as the "Portfolio") at December 31, 2007, the results of its operations for the year then ended, the changes in its net assets for each of the two years in the period then ended, and the financial highlights for each of the periods indicated, in conformity with accounting principles generally accepted in the United States of America. These financial statements and financial highlights (hereafter referred to as "financial statements") are the responsibility of the Portfolio's management; our respons ibility is to express an opinion on these financial statements based on our audits. We conducted our audits of these financial statements in accordance with the standards of the Public Company Accounting Oversight Board (United States). Those standards require that we plan and perform the audit to obtain reasonable assurance about whether the financial statements are free of material misstatement. An audit includes examining, on a test basis, evidence supporting the amounts and disclosures in the financial statements, assessing the accounting principles used and significant estimates made by management, and evaluating the overall financial statement presentation. We believe that our audits, which included confirmation of securities at December 31, 2007 by correspondence with the custodian, transfer agent and brokers, and the application of alternative auditing procedures where securities purchased had not been received, provide a reasonable basis for our opinion.

Denver, Colorado
February 15, 2008
Janus Aspen Series December 31, 2007 23
Additional Information (unaudited)
PROXY VOTING POLICIES AND VOTING RECORD
A description of the policies and procedures that the Portfolio uses to determine how to vote proxies relating to its portfolio securities is available: (i) without charge, upon request, by calling 1-800-525-0020 (toll free); (ii) on the Portfolio's website at www.janus.com/proxyvoting; and (iii) on the SEC's website at http://www.sec.gov. Additionally, information regarding the Portfolio's proxy voting record for the most recent twelve-month period ended June 30 is also available, free of charge, through www.janus.com/proxyvoting and from the SEC's website at http://www.sec.gov.
QUARTERLY PORTFOLIO HOLDINGS
The Portfolio files its complete portfolio holdings (schedule of investments) with the SEC for the first and third quarters of each fiscal year on Form N-Q within 60 days of the end of such fiscal quarter. The Portfolio's Form N-Q: (i) is available on the SEC's website at http://www.sec.gov; (ii) may be reviewed and copied at the SEC's Public Reference Room in Washington, D.C. (information on the Public Reference Room may be obtained by calling 1-800-SEC-0330); and (iii) is available without charge, upon request, by calling Janus at 1-800-525-0020 (toll free).
APPROVAL OF ADVISORY AGREEMENTS DURING THE PERIOD
The Trustees of Janus Aspen Series, none of whom has ever been affiliated with Janus Capital ("Independent Trustees"), oversee the management of each Portfolio and, as required by law, determine annually whether to continue the investment advisory agreement for each Portfolio and the subadvisory agreements for the three Portfolios that utilize subadvisers.
In connection with their most recent consideration of those agreements for each Portfolio, the Trustees received and reviewed a substantial amount of information provided by Janus Capital and the respective subadvisers in response to requests of the Independent Trustees and their independent legal counsel. They also received and reviewed a considerable amount of information and analysis provided by their independent fee consultant. Throughout their consideration of the agreements, the Independent Trustees were advised by their independent legal counsel. The Independent Trustees met with management to consider the agreements, and also met separately in executive session with their independent legal counsel and their independent fee consultant.
At a meeting held on December 14, 2007, based on their evaluation of the information provided by Janus Capital, the subadvisers and the independent fee consultant, as well as other information, the Trustees determined that the overall arrangements between each Portfolio and Janus Capital and each subadviser, as applicable, were fair and reasonable in light of the nature, extent and quality of the services provided by Janus Capital, its affiliates and the subadvisers, the fees charged for those services, and other matters that the Trustees considered relevant in the exercise of their business judgment. At that meeting the Trustees unanimously approved the continuation of the investment advisory agreement for each Portfolio, and the subadvisory agreement for each subadvised Portfolio, for the period from February 1, 2008 through February 1, 2009, subject to earlier termina tion as provided for in each agreement.
In considering the continuation of those agreements, the Trustees reviewed and analyzed various factors that they determined were relevant, including the factors described below, none of which by itself was considered dispositive. However, the material factors and conclusions that formed the basis for the Trustees' determination to approve the continuation of the agreements are discussed separately below.
Nature, Extent and Quality of Services
The Trustees reviewed the nature, extent and quality of the services provided by Janus Capital and the subadvisers to the Portfolios, taking into account the investment objective and strategy of each Portfolio, the knowledge of the Trustees gained from their regular meetings with management on at least a quarterly basis, and their ongoing review of information related to the Portfolios. In addition, the Trustees reviewed the resources and key personnel of Janus Capital and each subadviser, especially those who provide investment management services to the Portfolios. The Trustees also considered other services provided to the Portfolios by Janus Capital or the subadvisers, such as managing the execution of portfolio transactions and the selection of broker-dealers for those transactions, serving as the Portfolios' administrator, monitoring adherence to the Portfolios' investment restrictions, producing shareholder reports, providing support services for the Trustees and Trustee committees, communicating with shareholders, and overseeing the activities of other service providers, including monitoring compliance with various policies and procedures of the Portfolios and with applicable securities laws and regulations.
The Trustees concluded that the nature, extent and quality of the services provided by Janus Capital and/or the subadviser to each Portfolio were appropriate and consistent with the terms of the respective advisory and subadvisory agreements; that, taking into account steps taken to address those Portfolios whose performance lagged that of the median of their peers for certain periods, the quality of those services had been consistent with or superior to quality norms in the industry;
24 Janus Aspen Series December 31, 2007
and that the Portfolios were likely to benefit from the continued provision of those services. They also concluded that Janus Capital and each subadviser had sufficient personnel, with the appropriate education and experience, to serve the Portfolios effectively and had demonstrated its continuing ability to attract well-qualified personnel.
Performance of the Portfolios
The Trustees considered the investment results of each Portfolio over various time periods. They reviewed information comparing each Portfolio's performance with the performance of comparable funds and peer groups identified by Lipper Inc., an independent provider of investment company data, and with the Portfolio's benchmark index. They concluded that the performance of many Portfolios was good to very good under current market conditions. Although the performance of some Portfolios lagged that of the median of their peers for certain periods, the Trustees also concluded that Janus Capital had taken appropriate steps to address those instances of under-performance and that the more recent performance of most of those Portfolios had been improving.
Costs of Services Provided
The Trustees examined information on the fees and expenses of each Portfolio in comparison to similar information for comparable funds as provided by Lipper. They also reviewed an analysis of that information provided by their independent fee consultant and noted that the rate of management (investment advisory and administrative) fees for most of the Portfolios, in some cases after contractual expense limitations, was below the mean management fee rate of the respective peer group of funds selected by Lipper.
The Trustees considered the methodology used by Janus Capital and each subadviser in determining compensation payable to portfolio managers, the competitive environment for investment management talent and the competitive market for mutual funds in different distribution channels. They concluded that the compensation methodology provided a good alignment of the interests of the portfolio managers with those of Portfolio shareholders.
The Trustees also reviewed management fees charged by Janus Capital to its separate account clients and to its subadvised funds (for which Janus Capital provides only services related to portfolio management). Although in most instances subadvisory and separate account fee rates for various investment strategies were lower than management fee rates for Portfolios having a similar strategy, the Trustees noted that, under the terms of the management agreements with the Portfolios, Janus Capital performs significant additional services for the Portfolios that it does not provide to those other clients, including administrative services, oversight of the Portfolios' other service providers, Trustee support, regulatory compliance and numerous other services, and that, in serving the Portfolios, Janus Capital assumes many legal risks that it does not assume in servicing its ot her clients. Moreover, the Trustees noted that the spread between the average fee rates charged to the Portfolios and the fee rates that Janus Capital charged to its separate account clients was significantly smaller than the average spread for such fee rates of other advisers, based on publicly available data and research conducted by their independent fee consultant.
The Trustees reviewed information on the profitability to Janus Capital and its affiliates of their relationships with each Portfolio, as well as an explanation of the methodology used in allocating various expenses of Janus Capital and its affiliates among the Portfolios and other clients. They also reviewed the financial statements of Janus Capital's parent company and its corporate structure. In their review, the Trustees considered whether Janus Capital and each subadviser receives adequate incentives to manage the Portfolios effectively. They recognized that profitability comparisons among investment advisers are difficult because very little comparative information is publicly available and profitability of any adviser is affected by numerous factors, including the organizational structure of the particular adviser, the types of funds and other accounts it manages, possible other lines of business, the methodology for allocating expens es, and the adviser's capital structure and cost of capital. However, based on the information available and taking those factors into account, the Trustees concluded that Janus Capital's profitability with respect to each Portfolio in relation to the services rendered was not unreasonable.
The Trustees concluded that the management fees and other compensation payable by each Portfolio to Janus Capital and its affiliates, as well as the fees payable by Janus Capital or the Portfolios to the subadvisers of subadvised Portfolios, were reasonable in relation to the nature, extent and quality of the services provided, taking into account the fees charged by other advisers for managing comparable mutual funds with similar strategies and the fees Janus Capital and the subadvisers charge to other clients. They also concluded that the overall expense ratio of each Portfolio was reasonable, taking into account the size of the Portfolio, the quality of services provided by Janus Capital and any subadviser, the investment performance of the Portfolio and any expense limitations agreed to by Janus Capital.
Janus Aspen Series December 31, 2007 25
Additional Information (unaudited) (continued)
Economies of Scale
The Trustees considered information about the potential for Janus Capital to realize economies of scale as the assets of the Portfolios increase. They noted that, although most Portfolios pay advisory fees at a fixed rate as a percentage of net assets, without any breakpoints, the management fee rate paid by each Portfolio, after any contractual expense limitations, was below the mean management fee rate of the Portfolio's peer group selected by Lipper; and, for those Portfolios whose expenses are being reduced by the contractual expense limitations of Janus Capital, Janus Capital is subsidizing the Portfolios because they have not reached adequate scale. Moreover, as the assets of many of the Portfolios declined in the past few years, those Portfolios benefited from having advisory fee rates that remained constant rather than increasing as assets declined. In addition, performance fee structures have been implemented for several Portfolios that will cause the effective rate of advisory fees payable by such a Portfolio to vary depending on the investment performance of the Portfolio relative to its benchmark index over the measurement period; and a few Portfolios have fee schedules with breakpoints and reduced fee rates above certain asset levels. The Trustees also noted that the Portfolios share directly in economies of scale through lower charges of third-party service providers, based on the combined scale of all of the Portfolios. Based on all of the information they reviewed, the Trustees concluded that the current fee structure of each Portfolio was reasonable and that the current rates of fees do reflect a sharing between Janus Capital and the Portfolio of economies of scale at the current asset level of the Portfolio.
Other Benefits to Janus Capital
The Trustees also considered benefits that accrue to Janus Capital and its affiliates from their relationships with the Portfolios. They recognized that two affiliates of Janus Capital separately serve the Portfolios as transfer agent and distributor, respectively. They also considered Janus Capital's past and proposed use of commissions paid by Portfolios on their portfolio brokerage transactions to obtain proprietary and third-party research products and services benefiting those Portfolios and/or other clients of Janus Capital. The Trustees concluded that Janus Capital's use of "soft" commission dollars of a Portfolio to obtain proprietary and third-party research products and services was consistent with regulatory requirements and guidelines and was likely to benefit the Portfolios. The Trustees also concluded that, other than the services provided by Janus Capital and its affiliates pursuant to the agreements and the fees to be paid by each Portfolio therefor, the Portfolios and Janus Capital may potentially benefit from their relationship with each other in other ways. They concluded that Janus Capital benefits from the receipt of proprietary research products and services acquired through commissions paid on portfolio transactions of the Portfolios and that the Portfolios benefit from Janus Capital's receipt of those products and services, as well as research products and services acquired through commissions paid by other clients of Janus Capital. They further concluded that success of any Portfolio could attract other business to Janus Capital or other Janus funds and that the success of Janus Capital could enhance Janus Capital's ability to serve the Portfolios.
After full consideration of the above factors, as well as other factors, all of the Trustees, all of whom are Independent Trustees, concluded that the proposed continuation of the investment advisory agreement for each Portfolio, and the subadvisory agreement for each subadvised Portfolio, was in the best interest of the respective Portfolios and their shareholders.
26 Janus Aspen Series December 31, 2007
Explanations of Charts, Tables and
Financial Statements (unaudited)
1. PERFORMANCE OVERVIEWS
The performance overview graph compares the performance of a hypothetical $10,000 investment in the Portfolio with one or more widely used market indices. The hypothetical example does not represent the returns of any particular investment.
When comparing the performance of the Portfolio with an index, keep in mind that market indices do not include brokerage commissions that would be incurred if you purchased the individual securities in the index. They also do not include taxes payable on dividends and interest or operating expenses incurred if you maintained a Portfolio invested in the index.
Average annual total return is calculated by taking the growth or decline in value of an investment over a period of time, including reinvestment of any dividends, distributions and capital gains, then calculating the annual compounded percentage rate that would have produced the same result had the rate of growth been constant throughout the period. Average annual total return does not reflect the deduction of taxes that a shareholder would pay on Portfolio distributions or redemptions of Portfolio shares.
Pursuant to federal securities rules, expense ratios shown in the performance chart reflect subsidized and unsubsidized ratios for the past fiscal year. The total annual portfolio operating expenses ratio is gross of any fee waivers, reflecting a Portfolio's unsubsidized expense ratio. The net annual portfolio operating expenses ratio (if applicable) includes contractual waivers of Janus Capital and/or Janus Services and reflects a Portfolio's subsidized expense ratio. Both the total annual portfolio operating expenses ratio and net annual portfolio operating expenses ratio are based on average net assets as of the fiscal year ended December 31, 2006. The ratios also include expenses indirectly incurred by the Portfolio as a result of investing in other investment companies or pooled investments, which are not reflected in the "Financial Highlights" of this report. As a result, these ratios may be higher or lower than those shown in the "Fin ancial Highlights" in this report. All expenses are shown without the effect of expense offset arrangements. Pursuant to such arrangements, credits realized as a result of uninvested cash balances are used to reduce custodian and transfer agent expenses.
2. SCHEDULE OF INVESTMENTS
Following the performance overview section is the Portfolio's Schedule of Investments. This schedule reports the industry concentrations and types of securities held in the Portfolio on the last day of the reporting period. Securities are usually listed by type (common stock, corporate bonds, U.S. Government obligations, etc.) and by industry classification (banking, communications, insurance, etc.). Holdings are subject to change without notice.
The value of each security is quoted as of the last day of the reporting period. The value of securities denominated in foreign currencies is converted into U.S. dollars. Certain short-term investments maturing within 60 days are valued at amortized cost, which approximates market value.
A summary of investments by country is provided if the Portfolio invested in foreign securities. This summary reports the Portfolio's exposure to different countries by providing the percentage of securities invested in each country. The country of each security represents the country in which the company is incorporated.
FUTURES
A table listing futures contracts follows the Portfolio's Schedule of Investments (if applicable). Futures contracts are contracts that obligate the buyer to receive and the seller to deliver an instrument or money at a specified price on a specified date. Futures are used to hedge against adverse movements in securities prices, currency risk or interest rates.
The table provides the name of the contract, number of contracts held, the expiration date, the principal amount, value and the amount of unrealized gain or loss. The amount of unrealized gain or loss reflects the marked-to-market amount for the last day of the reporting period.
3. STATEMENT OF ASSETS AND LIABILITIES
This statement is often referred to as the "balance sheet." It lists the assets and liabilities of the Portfolio on the last day of the reporting period.
The Portfolio's assets are calculated by adding the value of the securities owned, the receivable for securities sold but not yet settled, the receivable for dividends declared but not yet received on stocks owned and the receivable for Portfolio shares sold to investors but not yet settled. The Portfolio's liabilities include payables for securities purchased but not yet settled, Portfolio shares redeemed but not yet paid and expenses owed but not yet paid. Additionally, there may be other assets and liabilities such as unrealized gain or loss on forward currency contracts.
The section entitled "Net Assets Consist of" breaks down the components of the Portfolio's net assets. Because the Portfolio must distribute substantially all earnings, you will notice that a significant portion of net assets is shareholder capital.
The last section of this statement reports the net asset value ("NAV") per share on the last day of the reporting period for the Portfolio. The NAV is calculated by dividing the Portfolio's net assets (assets minus liabilities) by the number of shares outstanding.
Janus Aspen Series December 31, 2007 27
Explanations of Charts, Tables and
Financial Statements (unaudited) (continued)
4. STATEMENT OF OPERATIONS
This statement details the Portfolio's income, expenses, gains and losses on securities and currency transactions, and appreciation or depreciation of current Portfolio holdings.
The first section in this statement, entitled "Investment Income," reports the dividends earned from stocks and interest earned from interest-bearing securities in the Portfolio.
The next section reports the expenses and expense offsets incurred by the Portfolio, including the advisory fee paid to the investment adviser, transfer agent fees and expenses, printing and postage for mailing statements, financial reports and prospectuses, and other expenses. Expense offsets, if any, are also shown.
The last section lists the increase or decrease in the value of securities held in the Portfolio. The Portfolio realizes a gain (or loss) when it sells its position in a particular security. An unrealized gain (or loss) refers to the change in net appreciation or depreciation of the Portfolio during the reporting period. "Net Realized and Unrealized Gain/(Loss) on Investments" is affected both by changes in the market value of Portfolio holdings and by gains (or losses) realized during the reporting period.
5. STATEMENT OF CHANGES IN NET ASSETS
This statement reports the increase or decrease in the Portfolio's net assets during the reporting period. Changes in the Portfolio's net assets are attributable to investment operations, dividends, distributions and capital share transactions. This is important to investors because it shows exactly what caused the Portfolio's net asset size to change during the period.
The first section summarizes the information from the Statement of Operations regarding changes in net assets due to the Portfolio's investment performance. The Portfolio's net assets may also change as a result of dividend and capital gains distributions to investors. If investors receive their dividends in cash, money is taken out of the Portfolio to pay the distribution. If investors reinvest their dividends, the Portfolio's net assets will not be affected. If you compare the Portfolio's "Net Decrease from Dividends and Distributions" to the "Reinvested dividends and distributions," you will notice that dividend distributions had little effect on the Portfolio's net assets. This is because the majority of Janus investors reinvest their distributions.
The reinvestment of dividends is included under "Capital Share Transactions." "Capital Shares" refers to the money investors contribute to the Portfolio through purchases or withdraw via redemptions. The Portfolio's net assets will increase and decrease in value as investors purchase and redeem shares from the Portfolio.
6. FINANCIAL HIGHLIGHTS
This schedule provides a per-share breakdown of the components that affect the Portfolio's NAV for current and past reporting periods. Not only does this table provide you with total return, it also reports total distributions, asset size, expense ratios and portfolio turnover rate.
The first line in the table reflects the NAV per share at the beginning of the reporting period. The next line reports the net investment income per share, which comprises dividends and interest income earned on securities held by the Portfolio. Following is the total of gains/(losses), realized and unrealized. Dividends and distributions are then subtracted to arrive at the NAV per share at the end of the period. The next line reflects the average annual total return reported the last day of the period.
Also included are the expense ratios, or the percentage of average net assets that were used to cover operating expenses during the period. Expense ratios vary for a number of reasons, including the differences in management fees, the average shareholder account size and the extent of foreign investments, which entail greater transaction costs.
The Portfolio's expenses may be reduced through expense reduction arrangements. These arrangements may include the use of balance credits or transfer agent fee offsets. The Statement of Operations reflects total expenses before any such offset, the amount of the offset and the net expenses. The expense ratios listed in the Financial Highlights reflect total expenses prior to any expense offsets (gross expense ratio) and after the expense offsets (net expense ratio). Both expense ratios reflect expenses after waivers (reimbursements), if applicable.
The ratio of net investment income/(loss) summarizes the income earned less expenses, divided by the average net assets of the Portfolio during the reporting period. Don't confuse this ratio with the Portfolio's yield. The net investment income ratio is not a true measure of the Portfolio's yield because it doesn't take into account the dividends distributed to the Portfolio's investors.
The next figure is the portfolio turnover rate, which measures the buying and selling activity in the Portfolio. Portfolio turnover is affected by market conditions, changes in the asset size of the Portfolio, the nature of the Portfolio's investments and the investment style of the portfolio manager. A 100% rate implies that an amount equal to the value of the entire portfolio is turned over in a year; a 50% rate means that an amount equal to the value of half the portfolio is traded in a year; and a 200% rate means that an amount equal to the value of the portfolio is traded every six months.
28 Janus Aspen Series December 31, 2007
Designation Requirements (unaudited)
For federal income tax purposes, the Portfolio designated the following for the year ended December 31, 2007:
Capital Gain Distributions
| Portfolio | |||||||
| Janus Aspen INTECH Risk-Managed Core Portfolio | $ | 151,778 | |||||
Dividends Received Deduction Percentage
| Portfolio | |||||||
| Janus Aspen INTECH Risk-Managed Core Portfolio | 100 | % | |||||
Janus Aspen Series December 31, 2007 29
Trustees and Officers (unaudited)
The Portfolio's Statement of Additional Information includes additional information about the Trustees and officers and is available, without charge, by calling 1-800-525-0020.
The following are the Trustees and officers of the Trust, together with a brief description of their principal occupations during the last five years (principal occupations for certain Trustees may include periods over five years).
Each Trustee has served in that capacity since he or she was originally elected or appointed. The Trustees do not serve a specified term of office. Each Trustee will hold office until the termination of the Trust or his or her earlier death, resignation, retirement, incapacity, or removal. The retirement age for Trustees is 72. The Portfolio's Nominating and Governance Committee will consider nominees for the position of Trustee recommended by shareholders. Shareholders may submit the name of a candidate for consideration by the Committee by submitting their recommendations to the Trust's Secretary. Each Trustee is currently a Trustee of two other registered investment companies advised by Janus Capital: Janus Investment Fund and Janus Adviser Series. As of the date of this report, collectively, these three registered investment companies consist of 75 series or funds.
The Trust's officers are elected annually by the Trustees for a one-year term. Certain officers also serve as officers of Janus Investment Fund and Janus Adviser Series. Certain officers of the Portfolio may also be officers and/or directors of Janus Capital. Portfolio officers receive no compensation from the Portfolio, except for the Portfolio's Chief Compliance Officer, as authorized by the Trustees.
Trustees
| Name, Address, and Age | Positions Held with Portfolio | Length of Time Served | Principal Occupations During the Past Five Years | Number of Portfolios/Funds in Fund Complex Overseen by Trustee | Other Directorships Held by Trustee | ||||||||||||||||||
| Dennis B. Mullen* 151 Detroit Street Denver, CO 80206 DOB: 1943 | Chairman Trustee | 3/04-12/07 9/93-Present | Chief Executive Officer of Red Robin Gourmet Burgers, Inc. (since 2005). Formerly, private investor. | 75 | ** | Chairman of the Board (since 2005) and Director of Red Robin Gourmet Burgers, Inc., and Director of Janus Capital Funds Plc (Dublin-based, non-U.S. funds). | |||||||||||||||||
| Jerome S. Contro 151 Detroit Street Denver, CO 80206 DOB: 1956 | Trustee | 12/05-Present | Partner of Tango Group, a private investment firm (since 1999). | 75 | Trustee and Chairman of RS Investment Trust (since 2001), and Director of IZZE Beverages and MyFamily.com, Inc. (genealogical research website). | ||||||||||||||||||
| William F. McCalpin 151 Detroit Street Denver, CO 80206 DOB: 1957 | Trustee | 6/02-Present | Private investor. Formerly, Executive Vice President and Chief Operating Officer of The Rockefeller Brothers Fund (a private family foundation), and Vice President of Asian Cultural Council. | 75 | Director of F.B. Heron Foundation (a private grant making foundation). | ||||||||||||||||||
| John W. McCarter, Jr. 151 Detroit Street Denver, CO 80206 DOB: 1938 | Trustee | 6/02-Present | President and Chief Executive Officer of The Field Museum of Natural History (Chicago, IL) (since 1997). | 75 | Chairman of the Board and Director of Divergence Inc. (biotechnology firm); Director of W.W. Grainger, Inc. (industrial distributor); and Trustee of WTTW (Chicago public television station) and the University of Chicago. | ||||||||||||||||||
* Mr. McCalpin will succeed Mr. Mullen as Chairman as of January 1, 2008.
** Mr. Mullen also serves as director of Janus Capital Funds Plc, consisting of 16 funds. Including Janus Capital Funds Plc and the 75 funds comprising the Janus funds, Mr. Mullen oversees 91 funds.
30 Janus Aspen Series December 31, 2007
Trustees (cont.)
| Name, Address, and Age | Positions Held with Portfolio | Length of Time Served | Principal Occupations During the Past Five Years | Number of Portfolios/Funds in Fund Complex Overseen by Trustee | Other Directorships Held by Trustee | ||||||||||||||||||
| James T. Rothe 151 Detroit Street Denver, CO 80206 DOB: 1943 | Trustee | 1/97-Present | Co-founder and Managing Director of Roaring Fork Capital Management, LLC (private investment in public equity firm), and Professor Emeritus of Business of the University of Colorado, Colorado Springs, CO (since 2004). Formerly, Professor of Business of the University of Colorado (2002-2004) and Distinguished Visiting Professor of Business (2001-2002) of Thunderbird (American Graduate School of International Management), Glendale, AZ. | 75 | Director of Red Robin Gourmet Burgers, Inc. | ||||||||||||||||||
| William D. Stewart 151 Detroit Street Denver, CO 80206 DOB: 1944 | Trustee | 9/93-Present | Corporate Vice President and General Manager of MKS Instruments - HPS Products, Boulder, CO (a manufacturer of vacuum fittings and valves). | 75 | N/A | ||||||||||||||||||
| Martin H. Waldinger 151 Detroit Street Denver, CO 80206 DOB: 1938 | Trustee | 9/93-Present | Private Investor and Consultant to California Planned Unit Developments (since 1994). Formerly, CEO and President of Marwal, Inc. (homeowner association management company). | 75 | N/A | ||||||||||||||||||
| Linda S. Wolf 151 Detroit Street Denver, CO 80206 DOB: 1947 | Trustee | 12/05-Present | Retired. Formerly, Chairman and Chief Executive Officer of Leo Burnett (Worldwide) (advertising agency) (2001-2005). | 75 | Director of Wal-Mart, The Field Museum of Natural History (Chicago, IL), Children's Memorial Hospital (Chicago, IL), Chicago Council on Foreign Relations, Economic Club of Chicago, and InnerWorkings (U.S. provider of print procurement solutions). | ||||||||||||||||||
Janus Aspen Series December 31, 2007 31
Trustees and Officers (unaudited) (continued)
Officers
| Name, Address, and Age | Positions Held with Portfolio | Term of Office* and Length of Time Served | Principal Occupations During the Past Five Years | ||||||||||||
| Stephanie Grauerholz-Lofton 151 Detroit Street Denver, CO 80206 DOB: 1970 | Chief Legal Counsel and Secretary Vice President | 1/06-Present 3/06-Present | Vice President and Assistant General Counsel of Janus Capital, and Vice President and Assistant Secretary of Janus Distributors LLC. Formerly, Assistant Vice President of Janus Capital and Janus Distributors LLC (2006), and Associate of Vedder, Price, Kaufman & Kammholz, P.C. (1999-2003). | ||||||||||||
| Andrew J. Iseman 151 Detroit Street Denver, CO 80206 DOB: 1964 | President and Chief Executive Officer | 3/07-Present | Chief Operating Officer and Senior Vice President of Janus Capital Group, Inc. and Janus Capital; President of Janus Services LLC; and Director of Capital Group Partners, Inc. Formerly, Senior Vice President of Enhanced Investment Technologies, LLC (2005-2007); and Vice President of Janus Capital (2003-2005) and Janus Services LLC (2003-2004). | ||||||||||||
| David R. Kowalski 151 Detroit Street Denver, CO 80206 DOB: 1957 | Vice President, Chief Compliance Officer, and Anti-Money Laundering Officer | 6/02-Present | Senior Vice President and Chief Compliance Officer of Janus Capital, Janus Distributors LLC, and Janus Services LLC; Chief Compliance Officer of Bay Isle Financial LLC; and Vice President of Enhanced Investment Technologies, LLC. Formerly, Chief Compliance Officer of Enhanced Investment Technologies, LLC (2003-2005); Vice President of Janus Capital (2000-2005) and Janus Services LLC (2004-2005); and Assistant Vice President of Janus Services LLC (2000-2004). | ||||||||||||
| Jesper Nergaard 151 Detroit Street Denver, CO 80206 DOB: 1962 | Chief Financial Officer Vice President, Treasurer, and Principal Accounting Officer | 3/05-Present 2/05-Present | Vice President of Janus Capital. Formerly, Director of Financial Reporting for OppenheimerFunds, Inc. (2004-2005); Site Manager and First Vice President of Mellon Global Securities Services (2003); and Director of Fund Accounting, Project Development, and Training of INVESCO Funds Group (1994-2003). | ||||||||||||
*Officers are elected at least annually by the Trustees for a one-year term and may also be elected from time to time by the Trustees for an interim period.
32 Janus Aspen Series December 31, 2007
Notes
Janus Aspen Series December 31, 2007 33
Janus provides access to a wide range of investment disciplines.
Growth
Janus growth portfolios focus on companies believed to be the leaders in their respective industries, with solid management teams, expanding market share, margins and efficiencies.
Core
Janus core portfolios seek investments in more stable and predictable companies. These portfolios look for a strategic combination of steady growth and for certain portfolios, some degree of income.
Risk-Managed
Our risk-managed portfolios seek to outperform their respective indices while maintaining a risk profile equal to or lower than the index itself. Managed by INTECH (a Janus subsidiary), these portfolios use a mathematical process in an attempt to build a more "efficient" portfolio than the index.
Value
Janus value portfolios invest in companies they believe are poised for a turnaround or are trading at a significant discount to fair value. The goal is to gain unique insight into a company's true value and identify and evaluate potential catalysts that may unlock
shareholder value.
International & Global
Janus international and global portfolios seek to leverage Janus' research capabilities by taking advantage of inefficiencies in foreign markets, where accurate information and analytical insight are often at a premium.
Bond
Janus bond portfolios attempt to provide less risk relative to equities while seeking to deliver a competitive total return through high current income and appreciation.
Money Market
Janus money market portfolios seek maximum current income consistent with stability of capital.
For more information about our funds, contact your investment professional or go to www.janus.com/info
Please consider the charges, risks, expenses and investment objectives carefully before investing. For a prospectus containing this and other information, please call Janus at 1-800-525-0020 or download the file from www.janus.com/info. Read it carefully before you invest or send money.
An investment in a money market portfolio is not insured or guaranteed by the Federal Deposit Insurance Corporation or any other government agency. Although the Portfolio seeks to preserve the value of your investment at $1.00 per share, it is possible to lose money by investing in the Portfolio.

151 Detroit Street
Denver, CO 80206
1-800-525-0020
Portfolio distributed by Janus Distributors LLC (2/08)
C-0807-899 109-02-718 02-08
2007 Annual Report
Janus Aspen Series
Janus Aspen INTECH Risk-Managed Growth Portfolio
Look Inside. . .
• Portfolio management perspective
• Investment strategy behind your portfolio
• Portfolio performance, characteristics and holdings

Table of Contents
| Useful Information About Your Portfolio Report | 1 | ||||||
| Management Commentary and Schedule of Investments | 2 | ||||||
| Statement of Assets and Liabilities | 11 | ||||||
| Statement of Operations | 12 | ||||||
| Statements of Changes in Net Assets | 13 | ||||||
| Financial Highlights | 14 | ||||||
| Notes to Schedule of Investments | 15 | ||||||
| Notes to Financial Statements | 16 | ||||||
| Report of Independent Registered Public Accounting Firm | 23 | ||||||
| Additional Information | 24 | ||||||
| Explanations of Charts, Tables and Financial Statements | 27 | ||||||
| Designation Requirements | 29 | ||||||
| Trustees and Officers | 30 | ||||||
Please consider the charges, risks, expenses and investment objectives carefully before investing. For a prospectus containing this and other information, please call Janus at 1-800-525-0020 or download the file from www.janus.com/info. Read it carefully before you invest or send money.
Useful Information About Your Portfolio Report
Management Commentary
The portfolio Management Commentary in this report includes valuable insight from the Portfolio's managers as well as statistical information to help you understand how your Portfolio's performance and characteristics stack up against those of comparable indices.
Please keep in mind that the opinions expressed by the Portfolio's managers in the Management Commentary are just that: opinions. They are a reflection of the managers' best judgment at the time this report was compiled, which was December 31, 2007. As the investing environment changes, so could the managers' opinions. The views are unique to the managers and aren't necessarily shared by their fellow employees or by Janus in general.
Portfolio Expenses
We believe it's important for our shareholders to have a clear understanding of Portfolio expenses and the impact they have on investment return.
The following is important information regarding the Portfolio's Expense Example, which appears in the Management Commentary within this Annual Report. Please refer to this information when reviewing the Expense Example for the Portfolio.
Example
As a shareholder of a Portfolio, you incur two types of costs: (1) transaction costs, including redemption fees (where applicable) (and any related exchange fees) and (2) ongoing costs, including management fees; distribution and shareholder servicing (12b-1) fees (applicable to Service Shares only); administrative services fees (applicable to Service Shares only); and other Portfolio expenses. The example is intended to help you understand your ongoing costs (in dollars) of investing in a Portfolio and to compare these costs with the ongoing costs of investing in other mutual funds. To do so, compare this 5% hypothetical example with the 5% hypothetical examples that appear in the shareholder reports of the other funds. The example is based upon an investment of $1,000 invested at the beginning of the period and held for the six-month period from July 1, 2007 to December 31, 2007.
Actual Expenses
The first line of the table in each example provides information about actual account values and actual expenses. You may use the information in this line, together with the amount you invested, to estimate the expenses that you paid over the period. Simply divide your account value by $1,000 (for example, an $8,600 account value divided by $1,000 = 8.6), then multiply the result by the number in the first line under the heading entitled "Expenses Paid During Period" to estimate the expenses you paid on your account during the period.
Hypothetical Example for Comparison Purposes
The second line of the table in each example provides information about hypothetical account values and hypothetical expenses based upon the Portfolio's actual expense ratio and an assumed rate of return of 5% per year before expenses, which is not the Portfolio's actual return. The hypothetical account values and expenses may not be used to estimate the actual ending account balance or expenses you paid for the period. You may use this information to compare the ongoing costs of investing in the Portfolio and other funds. To do so, compare this 5% hypothetical example with the 5% hypothetical examples that appear in the shareholder reports of the other funds.
Janus Capital Management LLC ("Janus Capital") has contractually agreed to waive the Portfolio's total operating expenses, excluding the distribution and shareholder servicing (12b-1) fees applicable to Service Shares, the administrative services fees applicable to Service Shares, brokerage commissions, interest, taxes and extraordinary expenses to certain limits until at least May 1, 2008. Expenses in the examples reflect application of these waivers. Had the waivers not been in effect, your expenses would have been higher. More information regarding the waivers is available in the Portfolio's prospectus.
Please note that the expenses shown in the tables are meant to highlight your ongoing costs only and do not reflect any transaction costs, such as redemption fees (where applicable) and any charges at the separate account level or contract level. Redemption fees are fully described in the prospectus. Therefore, the second line of each table is useful in comparing ongoing costs only, and will not help you determine the relative total costs of owning different funds. In addition, if these transaction costs and separate account or contract level charges were included, your costs would have been higher.
Janus Aspen Series December 31, 2007 1
Janus Aspen INTECH Risk-Managed Growth Portfolio (unaudited)
Managed by INTECH
Portfolio Snapshot
This portfolio uses a mathematically-based investment process that seeks to capitalize on the natural volatility of stock prices. The primary aim of this strategy is to outperform the benchmark index without increasing risk.
Performance Overview
For the 12 months ended December 31, 2007, Janus Aspen INTECH Risk-Managed Growth Portfolio returned 9.88% for its Service Shares. This compares to the 11.81% return posted by the Russell 1000® Growth Index, the Portfolio's benchmark.
Investment Strategy in This Environment
While INTECH does not employ fundamental analysis in the management of the Portfolio, fundamentals can have a significant impact on the general direction of the market in which we participate. The Portfolio's goal is to produce long-term returns in excess of its benchmark with an equal or lesser amount of risk.
The Portfolio's mathematical investment process seeks to build a more efficient portfolio than its benchmark, the Russell 1000® Growth Index. With a focus on risk management, investment decisions are governed by a mathematical investment process. The process does not attempt to predict the direction of the market, nor does it have a particular view of any company in the Portfolio.
Performance Review
As stock prices moved naturally throughout the period, we continued to implement our mathematical process in a disciplined manner in an effort to maintain a more efficient portfolio than the Index, without increasing relative risk. While other factors may influence performance over the short term, we believe that the consistent application of our process will help the Portfolio perform well over the long term.
In INTECH's 20-year history, we have experienced 12-month periods of similar magnitude in terms of both underperformance and outperformance. From our perspective, the key is to keep periods of underperformance both short in duration and mild in scope. INTECH aims to achieve its targeted returns over the long term and we believe the Portfolio remains well positioned for long-term capital growth.
Investment Strategy and Outlook
INTECH's mathematical, risk-managed investment process seeks to outperform the Russell 1000® Growth Index over the long term, while attempting to control risk. We will continue implementing the process in a disciplined and deliberate manner in an effort to achieve our long-term performance goals. The Portfolio may underperform during shorter time periods, but has the goal of outperformance over a three- to five-year period. Managing risk remains essential to the investment process. We will continue to make marginal improvements to the mathematical process, seeking an efficient portfolio that offers better long-term results than the benchmark, regardless of the market's direction.
Thank you for your investment in Janus Aspen INTECH Risk-Managed Growth Portfolio.
2 Janus Aspen Series December 31, 2007
(unaudited)
Janus Aspen INTECH Risk-Managed Growth Portfolio At a Glance
5 Largest Equity Holdings – (% of Net Assets)
As of December 31, 2007
| Microsoft Corp. Applications Software | 4.5 | % | |||||
| Schlumberger, Ltd. (U.S. Shares) Oil - Field Services | 3.0 | % | |||||
| Merck & Company, Inc. Medical - Drugs | 3.0 | % | |||||
| IBM Corp. Computers | 2.4 | % | |||||
| Apple, Inc. Computers | 2.1 | % | |||||
| 15.0 | % | ||||||
Asset Allocation – (% of Net Assets)
| As of December 31, 2007 | |||
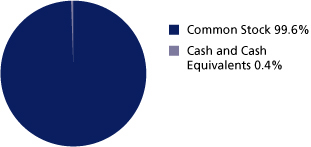
Top Country Allocations – Long Positions (% of Investment Securities)
| As of December 31, 2007 | As of December 31, 2006 | ||||||
 |  | ||||||
Janus Aspen Series December 31, 2007 3
Janus Aspen INTECH Risk-Managed Growth Portfolio
(unaudited)
Performance
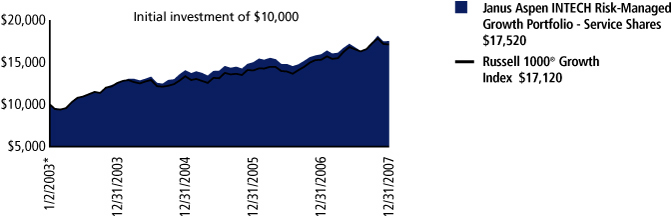
| Average Annual Total Return – for the periods ended December 31, 2007 | Expense Ratios – for the fiscal year ended December 31, 2006 | ||||||||||||||||||
| One Year | Since Inception* | Total Annual Fund Operating Expenses | Net Annual Fund Operating Expenses | ||||||||||||||||
| Janus Aspen INTECH Risk-Managed Growth Portfolio - Service Shares | 9.88 | % | 11.88 | % | 2.23 | % | 1.45 | %(a) | |||||||||||
| Russell 1000® Growth Index | 11.81 | % | 11.37 | % | |||||||||||||||
| Lipper Quartile | 3 | rd | 4 | th | |||||||||||||||
| Lipper Rankings based on total returns for Variable Annuity Mid-Cap Growth Funds | 113/167 | 84/103 | |||||||||||||||||
Visit janus.com/info to view up-to-date
performance and characteristic information
Data presented reflects past performance, which is no guarantee of future results. Investment results and principal value will fluctuate so that shares, when redeemed, may be worth more or less than their original cost. Due to market volatility, current performance may be higher or lower than the performance shown. Call 877.33JANUS or visit www.janus.com/info for performance current to the most recent month-end.
(a) At December 31, 2006, Janus Capital has contractually agreed to waive the Portfolio's total operating expenses (excluding the distribution and shareholder servicing fee, administrative services fee, brokerage commissions, interest, taxes, and extraordinary expenses) to a certain limit until at least May 1, 2008. The net annual fund operating expense shown reflects the application of such limit and is detailed in the Statement of Additional Information. Returns shown include fee waivers, if any, and without such waivers returns would have been lower.
The Portfolio's expense ratios were determined based on average net assets as of the fiscal year ended December 31, 2006. Detailed information is available in the prospectus. Contractual waivers agreed to by Janus Capital are included under "Net Annual Fund Operating Expenses." All expenses are shown without the effect of expense offset arrangements. Pursuant to such arrangements, credits realized as a result of uninvested cash balances are used to reduce custodian and transfer agent expenses.
The Portfolio's fee waiver exceeded the investment advisory fee for the most recent period presented so the Portfolio did not pay Janus Capital any investment advisory fees (net of fee waivers).
The proprietary mathematical process used by Enhanced Investment Technologies, LLC ("INTECH") may not achieve the desired results. Since the Portfolio is regularly rebalanced, this may result in a higher portfolio turnover rate, higher expenses and potentially higher net taxable gains or losses for investors compared to a "buy and hold" or index portfolio strategy.
These returns do not reflect the charges and expenses of any particular insurance product or qualified plan. Returns shown would have been lower had they included insurance charges.
Returns include reinvestment of dividends from net investment income and distributions from capital gains. The returns shown do not reflect the deduction of taxes that a shareholder would pay on Portfolio distributions or the redemption of Portfolio shares.
Lipper, a wholly-owned subsidiary of Reuters, provides independent insight on global collective investments including mutual funds, retirement funds, hedge funds, fund fees and expenses to the asset management and media communities. Lipper ranks the performance of mutual funds within a classification of funds that have similar investment objectives. Rankings are historical with capital gains and dividends reinvested and do not include the effect of loads.
If an expense waiver was in effect, it may have had a material effect on the total return or yield, and therefore the ranking for the period.
There is no assurance the stated objective(s) will be met.
See Notes to Schedule of Investments for index definitions.
4 Janus Aspen Series December 31, 2007
(unaudited)
Portfolio Expenses
The example below shows you the ongoing costs (in dollars) of investing in your Portfolio and allows you to compare these costs with those of other mutual funds. Please refer to the section Useful Information About Your Portfolio Report for a detailed explanation of the information presented in this chart.
| Expense Example - Service Shares | Beginning Account Value (7/1/07) | Ending Account Value (12/31/07) | Expenses Paid During Period (7/1/07-12/31/07)(1) | ||||||||||||
| Actual | $ | 1,000.00 | $ | 953.70 | $ | 7.14 | |||||||||
| Hypothetical (5% return before expenses) | $ | 1,000.00 | $ | 1,017.90 | $ | 7.37 | |||||||||
(1)Expenses are equal to the annualized expense ratio of 1.45%, multiplied by the average account value over the period, multiplied by 184/365 (to reflect the one-half year period). Expenses include the effect of contractual waivers by Janus Capital.
January 31, 2003 is the date used to calculate the since-inception Lipper ranking, which is slightly different from when the Portfolio began operations since Lipper provides fund rankings as of the last day of the month.
The weighting of securities within the Portfolio may differ significantly from the weightings within the index. The index is unmanaged and not available for direct investment; therefore its performance does not reflect the expenses associated with the active management of an actual Portfolio.
See "Explanations of Charts, Tables and Financial Statements."
* The Portfolio's inception date – January 2, 2003
Janus Aspen Series December 31, 2007 5
Janus Aspen INTECH Risk-Managed Growth Portfolio
Schedule of Investments
As of December 31, 2007
| Shares or Principal Amount | Value | ||||||||||
| Common Stock - 99.6% | |||||||||||
| Aerospace and Defense - 1.6% | |||||||||||
| 1,000 | Boeing Co. | $ | 87,460 | ||||||||
| 800 | Lockheed Martin Corp. | 84,208 | |||||||||
| 200 | Northrop Grumman Corp. | 15,728 | |||||||||
| 187,396 | |||||||||||
| Aerospace and Defense - Equipment - 0.9% | |||||||||||
| 300 | Alliant Techsystems, Inc.* | 34,128 | |||||||||
| 700 | B.F. Goodrich Co. | 49,427 | |||||||||
| 200 | United Technologies Corp. | 15,308 | |||||||||
| 98,863 | |||||||||||
| Agricultural Chemicals - 0.5% | |||||||||||
| 200 | Monsanto Co. | 22,338 | |||||||||
| 400 | Mosaic Co.* | 37,736 | |||||||||
| 60,074 | |||||||||||
| Airlines - 0.1% | |||||||||||
| 300 | Delta Air Lines, Inc.* | 4,467 | |||||||||
| 200 | Northwest Airlines Corp.* | 2,902 | |||||||||
| 7,369 | |||||||||||
| Apparel Manufacturers - 0.9% | |||||||||||
| 1,400 | Coach, Inc.* | 42,812 | |||||||||
| 1,100 | Hanesbrands, Inc.* | 29,887 | |||||||||
| 400 | Polo Ralph Lauren Corp. | 24,716 | |||||||||
| 97,415 | |||||||||||
| Applications Software - 4.6% | |||||||||||
| 200 | Compuware Corp.* | 1,776 | |||||||||
| 14,600 | Microsoft Corp. | 519,760 | |||||||||
| 400 | Red Hat, Inc.* | 8,336 | |||||||||
| 529,872 | |||||||||||
| Athletic Footwear - 0.6% | |||||||||||
| 1,000 | NIKE, Inc. - Class B | 64,240 | |||||||||
| Audio and Video Products - 0.2% | |||||||||||
| 300 | Harman International Industries, Inc. | 22,113 | |||||||||
| Automotive - Medium and Heavy Duty Trucks - 0.5% | |||||||||||
| 400 | Oshkosh Truck Corp. | 18,904 | |||||||||
| 600 | PACCAR, Inc. | 32,688 | |||||||||
| 51,592 | |||||||||||
| Automotive - Truck Parts and Equipment - Original - 0.5% | |||||||||||
| 300 | Borg-Warner Automotive, Inc. | 14,523 | |||||||||
| 1,200 | Johnson Controls, Inc. | 43,248 | |||||||||
| 57,771 | |||||||||||
| Batteries and Battery Systems - 0.6% | |||||||||||
| 600 | Energizer Holdings, Inc.* | 67,278 | |||||||||
| Beverages - Non-Alcoholic - 2.8% | |||||||||||
| 2,200 | Coca-Cola Co. | 135,014 | |||||||||
| 100 | Pepsi Bottling Group, Inc. | 3,946 | |||||||||
| 2,400 | PepsiCo, Inc. | 182,160 | |||||||||
| 321,120 | |||||||||||
| Beverages - Wine and Spirits - 0.2% | |||||||||||
| 300 | Brown-Forman Corp. - Class B | 22,233 | |||||||||
| Brewery - 0.1% | |||||||||||
| 200 | Anheuser-Busch Companies, Inc. | 10,468 | |||||||||
| Shares or Principal Amount | Value | ||||||||||
| Broadcast Services and Programming - 1.6% | |||||||||||
| 100 | Clear Channel Communications, Inc. | $ | 3,452 | ||||||||
| 2,400 | Discovery Holding Co. - Class A* | 60,336 | |||||||||
| 2,900 | Liberty Global, Inc. - Class A* | 113,651 | |||||||||
| 177,439 | |||||||||||
| Building Products - Cement and Aggregate - 0.7% | |||||||||||
| 600 | Martin Marietta Materials, Inc. | 79,560 | |||||||||
| Cable Television - 1.2% | |||||||||||
| 1,300 | Cablevision Systems New York Group - Class A* | 31,850 | |||||||||
| 450 | Comcast Corp. - Class A* | 8,217 | |||||||||
| 1,300 | DIRECTV Group, Inc.* | 30,056 | |||||||||
| 1,600 | EchoStar Communications Corp. - Class A* | 60,352 | |||||||||
| 200 | Time Warner Cable, Inc.* | 5,520 | |||||||||
| 135,995 | |||||||||||
| Casino Hotels - 1.8% | |||||||||||
| 1,100 | Harrah's Entertainment, Inc. | 97,625 | |||||||||
| 1,300 | MGM Mirage* | 109,226 | |||||||||
| 206,851 | |||||||||||
| Casino Services - 0% | |||||||||||
| 100 | Scientific Games Corp. - Class A* | 3,325 | |||||||||
| Cellular Telecommunications - 0.1% | |||||||||||
| 300 | Leap Wireless International, Inc.* | 13,992 | |||||||||
| 100 | MetroPCS Communications, Inc.* | 1,945 | |||||||||
| 15,937 | |||||||||||
| Chemicals - Diversified - 0.4% | |||||||||||
| 1,200 | Celanese Corp. - Class A | 50,784 | |||||||||
| Chemicals - Specialty - 0.4% | |||||||||||
| 1,700 | Nalco Holding Co. | 41,106 | |||||||||
| Commercial Services - 0.1% | |||||||||||
| 100 | Alliance Data Systems Corp.* | 7,499 | |||||||||
| 200 | Quanta Services, Inc.* | 5,248 | |||||||||
| 12,747 | |||||||||||
| Computer Services - 0% | |||||||||||
| 100 | FactSet Research Systems, Inc. | 5,570 | |||||||||
| Computers - 6.6% | |||||||||||
| 1,200 | Apple, Inc.* | 237,696 | |||||||||
| 300 | Dell, Inc.* | 7,353 | |||||||||
| 4,700 | Hewlett-Packard Co. | 237,256 | |||||||||
| 2,500 | IBM Corp. | 270,250 | |||||||||
| 752,555 | |||||||||||
| Computers - Integrated Systems - 0.2% | |||||||||||
| 500 | Diebold, Inc. | 14,490 | |||||||||
| 200 | NCR Corp.* | 5,020 | |||||||||
| 200 | Terdata Corp.* | 5,482 | |||||||||
| 24,992 | |||||||||||
| Computers - Memory Devices - 0.5% | |||||||||||
| 3,000 | EMC Corp.* | 55,590 | |||||||||
| Consulting Services - 0.3% | |||||||||||
| 900 | Accenture, Ltd. - Class A (U.S. Shares) | 32,427 | |||||||||
| Consumer Products - Miscellaneous - 0.2% | |||||||||||
| 300 | Kimberly-Clark Corp. | 20,802 | |||||||||
See Notes to Schedule of Investments and Financial Statements.
6 Janus Aspen Series December 31, 2007
Schedule of Investments
As of December 31, 2007
| Shares or Principal Amount | Value | ||||||||||
| Containers - Metal and Glass - 1.3% | |||||||||||
| 600 | Ball Corp. | $ | 27,000 | ||||||||
| 800 | Crown Holdings, Inc.* | 20,520 | |||||||||
| 2,000 | Owens-Illinois, Inc.* | 99,000 | |||||||||
| 146,520 | |||||||||||
| Cosmetics and Toiletries - 3.0% | |||||||||||
| 100 | Alberto-Culver Co. | 2,454 | |||||||||
| 200 | Avon Products, Inc. | 7,906 | |||||||||
| 1,200 | Colgate-Palmolive Co. | 93,552 | |||||||||
| 300 | Estee Lauder Companies, Inc. - Class A | 13,083 | |||||||||
| 3,142 | Procter & Gamble Co. | 230,686 | |||||||||
| 347,681 | |||||||||||
| Data Processing and Management - 1.9% | |||||||||||
| 200 | Dun & Bradstreet Corp. | 17,726 | |||||||||
| 300 | Fidelity National Information Services, Inc. | 12,477 | |||||||||
| 700 | MasterCard, Inc. - Class A | 150,640 | |||||||||
| 500 | NAVTEQ Corp.* | 37,800 | |||||||||
| 218,643 | |||||||||||
| Dental Supplies and Equipment - 0.2% | |||||||||||
| 400 | Dentsply International, Inc. | 18,008 | |||||||||
| Diagnostic Equipment - 0.2% | |||||||||||
| 300 | Gen-Probe, Inc.* | 18,879 | |||||||||
| Diagnostic Kits - 0.3% | |||||||||||
| 500 | IDEXX Laboratories, Inc.* | 29,315 | |||||||||
| Diversified Operations - 4.0% | |||||||||||
| 400 | 3M Co. | 33,728 | |||||||||
| 200 | Carlisle Companies, Inc. | 7,406 | |||||||||
| 300 | Cooper Industries, Ltd. - Class A | 15,864 | |||||||||
| 100 | Eaton Corp. | 9,695 | |||||||||
| 4,800 | General Electric Co. | 177,936 | |||||||||
| 600 | Harsco Corp. | 38,442 | |||||||||
| 2,000 | Honeywell International, Inc. | 123,140 | |||||||||
| 100 | Illinois Tool Works, Inc. | 5,354 | |||||||||
| 300 | Ingersoll-Rand Co. - Class A | 13,941 | |||||||||
| 100 | Roper Industries, Inc. | 6,254 | |||||||||
| 300 | Textron, Inc. | 21,390 | |||||||||
| 453,150 | |||||||||||
| Drug Delivery Systems - 0.1% | |||||||||||
| 300 | Hospira, Inc.* | 12,792 | |||||||||
| E-Commerce/Products - 1.5% | |||||||||||
| 1,800 | Amazon.com, Inc.* | 166,752 | |||||||||
| E-Commerce/Services - 0.1% | |||||||||||
| 900 | Hlth Corp.* | 12,060 | |||||||||
| Electric - Integrated - 2.2% | |||||||||||
| 300 | Allegheny Energy, Inc. | 19,083 | |||||||||
| 1,100 | Constellation Energy Group, Inc. | 112,783 | |||||||||
| 300 | Exelon Corp. | 24,492 | |||||||||
| 1,800 | PPL Corp. | 93,762 | |||||||||
| 250,120 | |||||||||||
| Electronic Components - Miscellaneous - 0.2% | |||||||||||
| 200 | Garmin, Ltd. (U.S. Shares) | 19,400 | |||||||||
| Electronic Components - Semiconductors - 1.2% | |||||||||||
| 2,900 | Intel Corp.* | 77,314 | |||||||||
| 1,000 | Intersil Corp. - Class A | 24,480 | |||||||||
| 200 | MEMC Electronic Materials, Inc.* | 17,698 | |||||||||
| 700 | Texas Instruments, Inc. | 23,380 | |||||||||
| 142,872 | |||||||||||
| Shares or Principal Amount | Value | ||||||||||
| Electronic Design Automation - 0.1% | |||||||||||
| 500 | Cadence Design Systems, Inc.* | $ | 8,505 | ||||||||
| Electronic Measuring Instruments - 0.2% | |||||||||||
| 800 | Trimble Navigation, Ltd.* | 24,192 | |||||||||
| Electronic Parts Distributors - 0.7% | |||||||||||
| 800 | Arrow Electronics, Inc.* | 31,424 | |||||||||
| 1,500 | Avnet, Inc.* | 52,455 | |||||||||
| 83,879 | |||||||||||
| Energy - Alternate Sources - 0.6% | |||||||||||
| 200 | First Solar, Inc.* | 53,428 | |||||||||
| 100 | SunPower Corp. - Class A* | 13,039 | |||||||||
| 66,467 | |||||||||||
| Engineering - Research and Development Services - 1.2% | |||||||||||
| 300 | Fluor Corp. | 43,716 | |||||||||
| 400 | Foster Wheeler, Ltd.* | 62,008 | |||||||||
| 300 | Jacobs Engineering Group, Inc.* | 28,683 | |||||||||
| 100 | McDermott International, Inc.* | 5,903 | |||||||||
| 140,310 | |||||||||||
| Engines - Internal Combustion - 0.3% | |||||||||||
| 300 | Cummins, Inc. | 38,211 | |||||||||
| Enterprise Software/Services - 0.3% | |||||||||||
| 1,757 | Oracle Corp.* | 39,673 | |||||||||
| Filtration and Separations Products - 0.3% | |||||||||||
| 800 | Pall Corp. | 32,256 | |||||||||
| Finance - Consumer Loans - 0.1% | |||||||||||
| 300 | SLM Corp.* | 6,042 | |||||||||
| Finance - Other Services - 1.9% | |||||||||||
| 112 | CME Group, Inc. | 76,832 | |||||||||
| 700 | IntercontinentalExchange, Inc.* | 134,750 | |||||||||
| 100 | MF Global, Ltd.* | 3,147 | |||||||||
| 214,729 | |||||||||||
| Food - Confectionary - 0.5% | |||||||||||
| 1,000 | Wm. Wrigley Jr. Co. | 58,550 | |||||||||
| Food - Diversified - 0.1% | |||||||||||
| 200 | H.J. Heinz Co. | 9,336 | |||||||||
| 100 | Kellogg Co. | 5,243 | |||||||||
| 14,579 | |||||||||||
| Food - Retail - 0.1% | |||||||||||
| 400 | Kroger Co. | 10,684 | |||||||||
| Footwear and Related Apparel - 0.4% | |||||||||||
| 1,100 | Crocs, Inc.*,# | 40,491 | |||||||||
| Garden Products - 0.2% | |||||||||||
| 400 | Toro Co. | 21,776 | |||||||||
| Hazardous Waste Disposal - 0.3% | |||||||||||
| 500 | Stericycle, Inc.* | 29,700 | |||||||||
| Health Care Cost Containment - 0.1% | |||||||||||
| 100 | McKesson Corp. | 6,551 | |||||||||
| Hospital Beds and Equipment - 0.3% | |||||||||||
| 700 | Kinetic Concepts, Inc.* | 37,492 | |||||||||
| Hotels and Motels - 0.1% | |||||||||||
| 100 | Orient-Express Hotel, Ltd. - Class A | 5,752 | |||||||||
| Human Resources - 0.3% | |||||||||||
| 700 | Hewitt Associates, Inc. - Class A* | 26,803 | |||||||||
| 200 | Manpower, Inc. | 11,380 | |||||||||
| 38,183 | |||||||||||
See Notes to Schedule of Investments and Financial Statements.
Janus Aspen Series December 31, 2007 7
Janus Aspen INTECH Risk-Managed Growth Portfolio
Schedule of Investments
As of December 31, 2007
| Shares or Principal Amount | Value | ||||||||||
| Independent Power Producer - 1.7% | |||||||||||
| 200 | Dynegy, Inc.* | $ | 1,428 | ||||||||
| 1,900 | Mirant Corp.* | 74,062 | |||||||||
| 2,700 | NRG Energy, Inc.* | 117,018 | |||||||||
| 192,508 | |||||||||||
| Industrial Automation and Robotics - 0.2% | |||||||||||
| 300 | Rockwell Automation, Inc. | 20,688 | |||||||||
| Industrial Gases - 0.2% | |||||||||||
| 200 | Air Products and Chemicals, Inc. | 19,726 | |||||||||
| Instruments - Controls - 0.4% | |||||||||||
| 400 | Mettler-Toledo International, Inc.* | 45,520 | |||||||||
| Instruments - Scientific - 0.4% | |||||||||||
| 500 | PerkinElmer, Inc. | 13,010 | |||||||||
| 200 | Thermo Fisher Scientific, Inc.* | 11,536 | |||||||||
| 300 | Waters Corp.* | 23,721 | |||||||||
| 48,267 | |||||||||||
| Internet Security - 0.3% | |||||||||||
| 500 | McAfee, Inc.* | 18,750 | |||||||||
| 300 | VeriSign, Inc.* | 11,283 | |||||||||
| 30,033 | |||||||||||
| Investment Management and Advisory Services - 0.3% | |||||||||||
| 500 | Eaton Vance Corp. | 22,705 | |||||||||
| 100 | Franklin Resources, Inc. | 11,443 | |||||||||
| 34,148 | |||||||||||
| Life and Health Insurance - 0.6% | |||||||||||
| 100 | AFLAC, Inc. | 6,263 | |||||||||
| 1,000 | CIGNA Corp. | 53,730 | |||||||||
| 100 | Prudential Financial, Inc. | 9,304 | |||||||||
| 69,297 | |||||||||||
| Machine Tools and Related Products - 0.1% | |||||||||||
| 200 | Kennametal, Inc. | 7,572 | |||||||||
| Machinery - Construction and Mining - 0.8% | |||||||||||
| 1,100 | Caterpillar, Inc. | 79,816 | |||||||||
| 200 | Terex Corp.* | 13,114 | |||||||||
| 92,930 | |||||||||||
| Machinery - Pumps - 0.3% | |||||||||||
| 300 | Flowserve Corp. | 28,860 | |||||||||
| Medical - Biomedical and Genetic - 0.6% | |||||||||||
| 900 | Celgene Corp.* | 41,589 | |||||||||
| 100 | Charles River Laboratories International, Inc.* | 6,580 | |||||||||
| 200 | Invitrogen Corp.* | 18,682 | |||||||||
| 66,851 | |||||||||||
| Medical - Drugs - 6.8% | |||||||||||
| 3,100 | Abbott Laboratories | 174,065 | |||||||||
| 3,400 | Bristol-Myers Squibb Co. | 90,168 | |||||||||
| 200 | Eli Lilly and Co. | 10,678 | |||||||||
| 300 | Endo Pharmaceuticals Holdings, Inc.* | 8,001 | |||||||||
| 5,900 | Merck & Company, Inc. | 342,849 | |||||||||
| 6,100 | Schering-Plough Corp. | 162,504 | |||||||||
| 788,265 | |||||||||||
| Shares or Principal Amount | Value | ||||||||||
| Medical - HMO - 1.5% | |||||||||||
| 400 | Aetna, Inc. | $ | 23,092 | ||||||||
| 300 | Coventry Health Care, Inc.* | 17,775 | |||||||||
| 900 | Health Net, Inc.* | 43,470 | |||||||||
| 800 | Sierra Health Services, Inc.* | 33,568 | |||||||||
| 860 | UnitedHealth Group, Inc. | 50,052 | |||||||||
| 200 | WellCare Health Plans, Inc.* | 8,482 | |||||||||
| 176,439 | |||||||||||
| Medical - Wholesale Drug Distributors - 0.1% | |||||||||||
| 200 | Cardinal Health, Inc. | 11,550 | |||||||||
| Medical Instruments - 0.6% | |||||||||||
| 200 | Beckman Coulter, Inc. | 14,560 | |||||||||
| 100 | Intuitive Surgical, Inc.* | 32,450 | |||||||||
| 400 | Medtronic, Inc. | 20,108 | |||||||||
| 67,118 | |||||||||||
| Medical Labs and Testing Services - 0.4% | |||||||||||
| 200 | Covance, Inc.* | 17,324 | |||||||||
| 600 | Quest Diagnostics, Inc. | 31,740 | |||||||||
| 49,064 | |||||||||||
| Medical Products - 3.2% | |||||||||||
| 2,500 | Baxter International, Inc. | 145,125 | |||||||||
| 100 | Becton, Dickinson and Co. | 8,358 | |||||||||
| 100 | Henry Schein, Inc.* | 6,140 | |||||||||
| 400 | Johnson & Johnson | 26,680 | |||||||||
| 1,700 | Stryker Corp. | 127,024 | |||||||||
| 800 | Zimmer Holdings, Inc.* | 52,920 | |||||||||
| 366,247 | |||||||||||
| Metal - Copper - 0.7% | |||||||||||
| 800 | Southern Copper Corp. | 84,104 | |||||||||
| Metal - Iron - 0.1% | |||||||||||
| 100 | Cleveland-Cliffs, Inc. | 10,080 | |||||||||
| Metal Processors and Fabricators - 2.1% | |||||||||||
| 1,700 | Precision Castparts Corp. | 235,790 | |||||||||
| Multimedia - 0% | |||||||||||
| 200 | News Corporation, Inc. - Class A | 4,098 | |||||||||
| 30 | Walt Disney Co. | 968 | |||||||||
| 5,066 | |||||||||||
| Networking Products - 2.2% | |||||||||||
| 8,700 | Cisco Systems, Inc.* | 235,509 | |||||||||
| 600 | Juniper Networks, Inc.* | 19,920 | |||||||||
| 255,429 | |||||||||||
| Non-Hazardous Waste Disposal - 0.1% | |||||||||||
| 200 | Republic Services, Inc. | 6,270 | |||||||||
| Oil - Field Services - 4.3% | |||||||||||
| 100 | Baker Hughes, Inc. | 8,110 | |||||||||
| 1,500 | Global Industries, Ltd.* | 32,130 | |||||||||
| 100 | Oceaneering International, Inc.* | 6,735 | |||||||||
| 3,500 | Schlumberger, Ltd. (U.S. Shares)# | 344,295 | |||||||||
| 700 | Smith International, Inc. | 51,695 | |||||||||
| 800 | Superior Energy Services, Inc.* | 27,536 | |||||||||
| 300 | Weatherford International, Ltd.* | 20,580 | |||||||||
| 491,081 | |||||||||||
| Oil and Gas Drilling - 1.3% | |||||||||||
| 200 | Diamond Offshore Drilling, Inc. | 28,400 | |||||||||
| 500 | Noble Corp. (U.S. Shares) | 28,255 | |||||||||
| 100 | Pride International, Inc.* | 3,390 | |||||||||
| 656 | Transocean, Inc.* | 93,906 | |||||||||
| 153,951 | |||||||||||
See Notes to Schedule of Investments and Financial Statements.
8 Janus Aspen Series December 31, 2007
Schedule of Investments
As of December 31, 2007
| Shares or Principal Amount | Value | ||||||||||
| Oil Companies - Exploration and Production - 0.3% | |||||||||||
| 400 | Denbury Resources, Inc.* | $ | 11,900 | ||||||||
| 100 | Unit Corp.* | 4,625 | |||||||||
| 275 | XTO Energy, Inc. | 14,124 | |||||||||
| 30,649 | |||||||||||
| Oil Companies - Integrated - 1.2% | |||||||||||
| 1,500 | Exxon Mobil Corp. | 140,535 | |||||||||
| Oil Field Machinery and Equipment - 1.8% | |||||||||||
| 400 | Cameron International Corp.* | 19,252 | |||||||||
| 1,400 | Dresser-Rand Group, Inc.* | 54,670 | |||||||||
| 300 | FMC Technologies, Inc.* | 17,010 | |||||||||
| 100 | Grant Prideco, Inc.* | 5,551 | |||||||||
| 1,500 | National-Oilwell Varco, Inc.* | 110,190 | |||||||||
| 206,673 | |||||||||||
| Oil Refining and Marketing - 1.6% | |||||||||||
| 300 | Cheniere Energy, Inc.* | 9,792 | |||||||||
| 100 | Frontier Oil Corp. | 4,058 | |||||||||
| 100 | Holly Corp. | 5,089 | |||||||||
| 1,900 | Tesoro Corp. | 90,630 | |||||||||
| 1,100 | Valero Energy Corp. | 77,033 | |||||||||
| 186,602 | |||||||||||
| Paper and Related Products - 0.1% | |||||||||||
| 1,700 | Domtar Corp. (U.S. Shares)* | 13,073 | |||||||||
| Pharmacy Services - 1.9% | |||||||||||
| 600 | Express Scripts, Inc. - Class A* | 43,800 | |||||||||
| 1,725 | Medco Health Solutions, Inc.* | 174,915 | |||||||||
| 218,715 | |||||||||||
| Pipelines - 0.1% | |||||||||||
| 200 | Equitable Resources, Inc. | 10,656 | |||||||||
| 100 | Questar Corp. | 5,410 | |||||||||
| 16,066 | |||||||||||
| Private Corrections - 0.1% | |||||||||||
| 400 | Corrections Corporation of America* | 11,804 | |||||||||
| Quarrying - 0.4% | |||||||||||
| 641 | Vulcan Materials Co. | 50,697 | |||||||||
| Racetracks - 0.5% | |||||||||||
| 900 | Penn National Gaming, Inc.* | 53,595 | |||||||||
| Real Estate Operating/Development - 0% | |||||||||||
| 100 | Forest City Enterprises, Inc. - Class A | 4,444 | |||||||||
| Rental Auto/Equipment - 0.1% | |||||||||||
| 500 | Avis Budget Group, Inc.* | 6,500 | |||||||||
| 400 | Hertz Global Holdings, Inc.* | 6,356 | |||||||||
| 12,856 | |||||||||||
| Research and Development - 0% | |||||||||||
| 100 | Pharmaceutical Product Development, Inc. | 4,037 | |||||||||
| Respiratory Products - 0.1% | |||||||||||
| 100 | Respironics, Inc.* | 6,548 | |||||||||
| Retail - Auto Parts - 0.2% | |||||||||||
| 200 | AutoZone, Inc.* | 23,982 | |||||||||
| Retail - Catalog Shopping - 0.2% | |||||||||||
| 500 | MSC Industrial Direct Company, Inc. - Class A | 20,235 | |||||||||
| Retail - Computer Equipment - 0.5% | |||||||||||
| 900 | GameStop Corp. - Class A* | 55,899 | |||||||||
| Retail - Consumer Electronics - 0.2% | |||||||||||
| 1,500 | RadioShack Corp. | 25,290 | |||||||||
| Shares or Principal Amount | Value | ||||||||||
| Retail - Discount - 0.3% | |||||||||||
| 100 | Big Lots, Inc.* | $ | 1,599 | ||||||||
| 1,200 | Dollar Tree Stores, Inc.* | 31,104 | |||||||||
| 32,703 | |||||||||||
| Retail - Drug Store - 0.5% | |||||||||||
| 1,436 | CVS/Caremark Corp. | 57,081 | |||||||||
| 100 | Walgreen Co. | 3,808 | |||||||||
| 60,889 | |||||||||||
| Retail - Jewelry - 0.1% | |||||||||||
| 300 | Tiffany & Co. | 13,809 | |||||||||
| Retail - Restaurants - 0.1% | |||||||||||
| 100 | McDonald's Corp. | 5,891 | |||||||||
| Rubber - Tires - 0.5% | |||||||||||
| 2,100 | Goodyear Tire & Rubber Co.* | 59,262 | |||||||||
| Schools - 1.1% | |||||||||||
| 700 | Apollo Group, Inc. - Class A* | 49,105 | |||||||||
| 300 | Career Education Corp.* | 7,542 | |||||||||
| 800 | ITT Educational Services, Inc.* | 68,216 | |||||||||
| 124,863 | |||||||||||
| Semiconductor Components/Integrated Circuits - 0.5% | |||||||||||
| 700 | Analog Devices, Inc. | 22,190 | |||||||||
| 300 | Cypress Semiconductor Corp.* | 10,809 | |||||||||
| 700 | Linear Technology Corp. | 22,281 | |||||||||
| 55,280 | |||||||||||
| Semiconductor Equipment - 0.2% | |||||||||||
| 500 | Varian Semiconductor Equipment Associates, Inc.* | 18,500 | |||||||||
| Soap and Cleaning Preparations - 0.3% | |||||||||||
| 700 | Church & Dwight Company, Inc. | 37,849 | |||||||||
| Steel - Producers - 0.6% | |||||||||||
| 1,600 | AK Steel Holding Corp.* | 73,984 | |||||||||
| Steel - Specialty - 0.1% | |||||||||||
| 100 | Allegheny Technologies, Inc. | 8,640 | |||||||||
| Telecommunication Equipment - 0.4% | |||||||||||
| 900 | CommScope, Inc.* | 44,289 | |||||||||
| 100 | Harris Corp. | 6,268 | |||||||||
| 50,557 | |||||||||||
| Telecommunication Equipment - Fiber Optics - 0% | |||||||||||
| 100 | Corning, Inc. | 2,399 | |||||||||
| Telephone - Integrated - 0.2% | |||||||||||
| 300 | Telephone and Data Systems, Inc. | 18,780 | |||||||||
| Textile - Apparel - 0.2% | |||||||||||
| 700 | Guess?, Inc. | 26,523 | |||||||||
| Theaters - 0% | |||||||||||
| 200 | Regal Entertainment Group - Class A | 3,614 | |||||||||
| Therapeutics - 0.2% | |||||||||||
| 100 | Amylin Pharmaceuticals, Inc.* | 3,700 | |||||||||
| 300 | Gilead Sciences, Inc.* | 13,803 | |||||||||
| 500 | Warner Chilcott, Ltd.* | 8,865 | |||||||||
| 26,368 | |||||||||||
| Tobacco - 0.5% | |||||||||||
| 200 | Altria Group, Inc. | 15,116 | |||||||||
| 500 | Loews Corp. - Carolina Group | 42,650 | |||||||||
| 57,766 | |||||||||||
See Notes to Schedule of Investments and Financial Statements.
Janus Aspen Series December 31, 2007 9
Janus Aspen INTECH Risk-Managed Growth Portfolio
Schedule of Investments
As of December 31, 2007
| Shares or Principal Amount | Value | ||||||||||
| Toys - 0.2% | |||||||||||
| 100 | Hasbro, Inc. | $ | 2,558 | ||||||||
| 1,000 | Mattel, Inc. | 19,040 | |||||||||
| 21,598 | |||||||||||
| Transportation - Marine - 0.1% | |||||||||||
| 200 | Tidewater, Inc. | 10,972 | |||||||||
| Transportation - Railroad - 0.3% | |||||||||||
| 100 | CSX Corp. | 4,398 | |||||||||
| 200 | Union Pacific Corp. | 25,124 | |||||||||
| 29,522 | |||||||||||
| Transportation - Truck - 0.2% | |||||||||||
| 1,000 | J.B. Hunt Transport Services, Inc. | 27,550 | |||||||||
| Vitamins and Nutrition Products - 0.1% | |||||||||||
| 300 | NBTY, Inc.* | 8,220 | |||||||||
| Web Portals/Internet Service Providers - 1.8% | |||||||||||
| 300 | Google, Inc. - Class A* | 207,444 | |||||||||
| Wireless Equipment - 0% | |||||||||||
| 100 | QUALCOMM, Inc. | 3,935 | |||||||||
| Total Common Stock (cost $10,231,547) | 11,393,170 | ||||||||||
| Money Markets - 1.2% | |||||||||||
| 139,000 | Janus Institutional Cash Management Fund - Institutional Shares, 4.98% (cost $139,000) | 139,000 | |||||||||
| Other Securities - 2.6% | |||||||||||
| 27,016 | Allianz Dresdner Daily Asset Fund† | 27,016 | |||||||||
| 152,249 | Repurchase Agreements† | 152,249 | |||||||||
| 117,060 | Time Deposits† | 117,060 | |||||||||
| Total Other Securities (cost $296,325) | 296,325 | ||||||||||
| Total Investments (total cost $10,666,872) – 103.4% | 11,828,495 | ||||||||||
| Liabilities, net of Cash, Receivables and Other Assets – (3.4)% | (389,826 | ) | |||||||||
| Net Assets – 100% | $ | 11,438,669 | |||||||||
Summary of Investments by Country – (Long Positions)
| Country | Value | % of Investment Securities | |||||||||
| Bermuda | $ | 91,711 | 0.8 | % | |||||||
| Canada | 13,073 | 0.1 | % | ||||||||
| Cayman Islands | 47,655 | 0.4 | % | ||||||||
| Netherlands | 344,295 | 2.9 | % | ||||||||
| United States†† | 11,331,761 | 95.8 | % | ||||||||
| Total | $ | 11,828,495 | 100.0 | % | |||||||
††Includes Short-Term Securities and Other Securities (94.6% excluding Short-Term Securities and Other Securities)
See Notes to Schedule of Investments and Financial Statements.
10 Janus Aspen Series December 31, 2007
Statement of Assets and Liabilities
| As of December 31, 2007 (all numbers in thousands except net asset value per share) | Janus Aspen INTECH Risk-Managed Growth Portfolio | ||||||
| Assets: | |||||||
| Investments at cost(1) | $ | 10,667 | |||||
| Investments at value(1) | $ | 11,689 | |||||
| Affiliated money market investments | 139 | ||||||
| Cash | 1 | ||||||
| Receivables: | |||||||
| Investments sold | 384 | ||||||
| Dividends | 10 | ||||||
| Interest | – | ||||||
| Due from adviser | 19 | ||||||
| Non-interested Trustees' deferred compensation | 1 | ||||||
| Other assets | – | ||||||
| Total Assets | 12,243 | ||||||
| Liabilities: | |||||||
| Payables: | |||||||
| Collateral for securities loaned (Note 1) | 296 | ||||||
| Investments purchased | 446 | ||||||
| Portfolio shares repurchased | – | ||||||
| Advisory fees | 5 | ||||||
| Professional fees | 25 | ||||||
| Transfer agent fees and expenses | 1 | ||||||
| Distribution fees - Service Shares | 2 | ||||||
| Administrative services fees - Service Shares | 1 | ||||||
| Non-interested Trustees' fees and expenses | 1 | ||||||
| Non-interested Trustees' deferred compensation fees | 1 | ||||||
| Accrued expenses | 26 | ||||||
| Total Liabilities | 804 | ||||||
| Net Assets | $ | 11,439 | |||||
| Net Assets Consist of: | |||||||
| Capital (par value and paid-in-surplus)* | $ | 10,077 | |||||
| Undistributed net investment income/(loss)* | – | ||||||
| Undistributed net realized gain/(loss) from investments and foreign currency transactions* | 200 | ||||||
| Unrealized appreciation/(depreciation) of investments, foreign currency translations and non-interested Trustees' deferred compensation | 1,162 | ||||||
| Total Net Assets | $ | 11,439 | |||||
| Net Assets - Service Shares | $ | 11,439 | |||||
| Shares Outstanding, $0.001 Par Value (unlimited shares authorized) | 974 | ||||||
| Net Asset Value Per Share | $ | 11.74 | |||||
* See Note 3 in Notes to Financial Statements.
(1) Investments at cost and value include $289,710 of securities loaned (Note 1).
See Notes to Financial Statements.
Janus Aspen Series December 31, 2007 11
Statement of Operations
| For the fiscal year ended December 31, 2007 (all numbers in thousands) | Janus Aspen INTECH Risk-Managed Growth Portfolio | ||||||
| Investment Income: | |||||||
| Interest | $ | – | |||||
| Securities lending income | – | ||||||
| Dividends | 135 | ||||||
| Dividends from affiliates | 4 | ||||||
| Total Investment Income | 139 | ||||||
| Expenses: | |||||||
| Advisory fees | 55 | ||||||
| Transfer agent fees and expenses | 3 | ||||||
| Registration fees | 3 | ||||||
| Custodian fees | 26 | ||||||
| Professional fees | 25 | ||||||
| Non-interested Trustees' fees and expenses | 4 | ||||||
| Distribution fees - Service Shares | 27 | ||||||
| Administrative service fees - Service Shares | 11 | ||||||
| System fees | 19 | ||||||
| Legal fees | 7 | ||||||
| Printing expenses | 45 | ||||||
| Other expenses | 5 | ||||||
| Non-recurring costs (Note 2) | – | ||||||
| Costs assumed by Janus Capital Management LLC (Note 2) | – | ||||||
| Total Expenses | 230 | ||||||
| Expense and Fee Offset | – | ||||||
| Net Expenses | 230 | ||||||
| Less: Excess Expense Reimbursement | (71 | ) | |||||
| Net Expenses after Expense Reimbursement | 159 | ||||||
| Net Investment Income/(Loss) | (20 | ) | |||||
| Net Realized and Unrealized Gain/(Loss) on Investments: | |||||||
| Net realized gain/(loss) from investments and foreign currency transactions | 1,237 | ||||||
| Change in net appreciation/(depreciation) of investments, foreign currency translations and non-interested Trustees' deferred compensation | (185 | ) | |||||
| Net Gain/(Loss) on Investments | 1,052 | ||||||
| Net Increase/(Decrease) in Net Assets Resulting from Operations | $ | 1,032 | |||||
See Notes to Financial Statements.
12 Janus Aspen Series December 31, 2007
Statements of Changes in Net Assets
| For the fiscal years ended December 31 | Janus Aspen INTECH Risk-Managed Growth Portfolio | ||||||||||
| (all numbers in thousands) | 2007 | 2006 | |||||||||
| Operations: | |||||||||||
| Net investment income/(loss) | $ | (20 | ) | $ | (22 | ) | |||||
| Net realized gain/(loss) from investment and foreign currency transactions | 1,237 | 485 | |||||||||
| Change in net appreciation/(depreciation) of investments, foreign currency translations and non-interested Trustees' deferred compensation | (185 | ) | 169 | ||||||||
| Net Increase/(Decrease) in Net Assets Resulting from Operations | 1,032 | 632 | |||||||||
| Dividends and Distributions to Shareholders: | |||||||||||
| Net investment income* | |||||||||||
| Service Shares | – | – | |||||||||
| Net realized gain/(loss) from investment transactions* | |||||||||||
| Service Shares | (1,046 | ) | (442 | ) | |||||||
| Net Decrease from Dividends and Distributions | (1,046 | ) | (442 | ) | |||||||
| Capital Share Transactions: | |||||||||||
| Shares sold | |||||||||||
| Service Shares | 22 | 24 | |||||||||
| Reinvested dividends and distributions | |||||||||||
| Service Shares | 1,046 | 442 | |||||||||
| Shares repurchased | |||||||||||
| Service Shares | (24 | ) | (1,500 | ) | |||||||
| Net Increase/(Decrease) from Capital Share Transactions | 1,044 | (1,034 | ) | ||||||||
| Net Increase/(Decrease) in Net Assets | 1,030 | (844 | ) | ||||||||
| Net Assets: | |||||||||||
| Beginning of period | 10,409 | 11,253 | |||||||||
| End of period | $ | 11,439 | $ | 10,409 | |||||||
| Undistributed net investment income/(loss)* | $ | – | $ | – | |||||||
*See Note 3 in Notes to Financial Statements.
See Notes to Financial Statements.
Janus Aspen Series December 31, 2007 13
Financial Highlights - Service Shares
| For a share outstanding during each fiscal year | Janus Aspen INTECH Risk-Managed Growth Portfolio | ||||||||||||||||||||||
| or period ended December 31 | 2007 | 2006 | 2005 | 2004 | 2003(1) | ||||||||||||||||||
| Net Asset Value, Beginning of Period | $ | 11.75 | $ | 11.55 | $ | 12.14 | $ | 12.44 | $ | 10.00 | |||||||||||||
| Income from Investment Operations: | |||||||||||||||||||||||
| Net investment income/(loss) | – | – | – | – | – | ||||||||||||||||||
| Net gain/(loss) on securities (both realized and unrealized) | 1.17 | .72 | .83 | 1.48 | 2.54 | ||||||||||||||||||
| Total from Investment Operations | 1.17 | .72 | .83 | 1.48 | 2.54 | ||||||||||||||||||
| Less Distributions: | |||||||||||||||||||||||
| Distributions (from net investment income)* | – | – | – | – | – | ||||||||||||||||||
| Distributions (from capital gains)* | (1.18 | ) | (.52 | ) | (1.32 | ) | (1.78 | ) | (.10 | ) | |||||||||||||
| Tax return of capital* | – | – | (.10 | ) | – | – | |||||||||||||||||
| Total Distributions | (1.18 | ) | (.52 | ) | (1.42 | ) | (1.78 | ) | (.10 | ) | |||||||||||||
| Net Asset Value, End of Period | $ | 11.74 | $ | 11.75 | $ | 11.55 | $ | 12.14 | $ | 12.44 | |||||||||||||
| Total Return** | 9.88 | % | 6.22 | % | 6.89 | % | 12.00 | % | 25.38 | % | |||||||||||||
| Net Assets, End of Period (in thousands) | $ | 11,439 | $ | 10,409 | $ | 11,253 | $ | 10,532 | $ | 9,401 | |||||||||||||
| Average Net Assets for the Period (in thousands) | $ | 10,970 | $ | 10,314 | $ | 10,600 | $ | 9,724 | $ | 8,135 | �� | ||||||||||||
| Ratio of Gross Expenses to Average Net Assets***(2) | 1.45 | % | 1.45 | % | 1.45 | % | 1.43 | % | 1.50 | % | |||||||||||||
| Ratio of Net Expenses to Average Net Assets***(2) | 1.45 | % | 1.45 | % | 1.45 | % | 1.42 | % | 1.50 | % | |||||||||||||
| Ratio of Net Investment Income/(Loss) to Average Net Assets*** | (0.19 | )% | (0.21 | )% | (0.54 | )% | (0.34 | )% | (0.67 | )% | |||||||||||||
| Portfolio Turnover Rate*** | 134 | % | 120 | % | 126 | % | 110 | % | 65 | % | |||||||||||||
* See Note 3 in Notes to Financial Statements.
** Total return not annualized for periods of less than one full year.
*** Annualized for periods of less than one full year.
(1) Fiscal period from January 2, 2003 (inception date) through December 31, 2003.
(2) See Note 4 in Notes to Financial Statements.
See Notes to Financial Statements.
14 Janus Aspen Series December 31, 2007
Notes to Schedule of Investments
| Lipper Variable Annuity Mid-Cap Growth Funds | Funds that, by portfolio practice, invest at least 75% of their equity assets in companies with market capitalizations (on a three-year weighted basis) less than 300% of the dollar-weighted median market capitalization of the middle 1,000 securities of the S&P SuperComposite 1500 Index. Mid-cap growth funds typically have an above-average price-to-earnings ratio, price-to-book ratio, and three-year sales-per-share growth value, compared to the S&P MidCap 400 Index. | ||||||
| Russell 1000® Growth Index | Measures the performance of those Russell 1000® companies with higher price-to-book ratios and higher forecasted growth values. | ||||||
| U.S. Shares | Securities of foreign companies trading on an American Stock Exchange. | ||||||
* Non-income-producing security.
# Loaned security; a portion or all of the security is on loan at December 31, 2007.
† The security is purchased with the cash collateral received from securities on loan (Note 1).
Janus Aspen Series December 31, 2007 15
Notes to Financial Statements
The following section describes the organization and significant accounting policies and provides more detailed information about the schedules and tables that appear throughout this report. In addition, the Notes to Financial Statements explain the methods used in preparing and presenting this report.
1. ORGANIZATION AND SIGNIFICANT ACCOUNTING POLICIES
Janus Aspen INTECH Risk-Managed Growth Portfolio (the "Portfolio") is a series fund. The Portfolio is part of Janus Aspen Series (the "Trust"), which is organized as a Delaware statutory trust and is registered under the Investment Company Act of 1940, as amended, (the "1940 Act") as an open-end management investment company. The Trust offers seventeen Portfolios, which include multiple series of shares, with differing investment objectives and policies. The Portfolio invests primarily in equity securities. The Portfolio is classified as diversified, as defined in the 1940 Act. The Portfolio is a no-load investment.
The Portfolio currently offers one class of shares: Service Shares. Service Shares are offered only in connection with investment in and payments under variable insurance contracts and to qualified retirement plans that require a fee from Portfolio assets to procure distribution and administrative services to contract owners and plan participants.
Janus Capital Management LLC ("Janus Capital") invested initial seed capital in the amount of $10,000 for the Portfolio on December 31, 2002. Janus Capital invested additional seed capital in the amount of $7,490,000 for the Portfolio on January 2, 2003. Janus Capital redeemed $1,500,000 of seed capital on April 11, 2006.
The following accounting policies have been consistently followed by the Portfolio and are in conformity with accounting principles generally accepted in the United States of America in the investment company industry.
Investment Valuation
Securities are valued at the last sales price or the official closing price for securities traded on a principal securities exchange (U.S. or foreign) and on the NASDAQ National Market. Securities traded on over-the-counter markets and listed securities for which no sales are reported are valued at the latest bid price (or yield equivalent thereof) obtained from one or more dealers transacting in a market for such securities or by a pricing service approved by the Portfolio's Trustees. Short-term securities with maturities of 60 days or less may be valued at amortized cost, which approximates market value. Debt securities with a remaining maturity of greater than 60 days are valued in accordance with the evaluated bid price supplied by the pricing service. The evaluated bid price supplied by the pricing service is an evaluation that reflects such factors as security prices, yields, maturities and ratings. Foreign securities and currencies ar e converted to U.S. dollars using the applicable exchange rate in effect as of the daily close of the New York Stock Exchange ("NYSE"). When market quotations are not readily available or deemed unreliable, or events or circumstances that may affect the value of portfolio securities held by the Portfolio are identified between the closing of their principal markets and the time the net asset value ("NAV") is determined, securities may be valued at fair value as determined in good faith under procedures established by and under the supervision of the Portfolio's Trustees. Circumstances in which fair value pricing may be utilized include, but are not limited to: (i) when significant events occur which may affect the securities of a single issuer, such as mergers, bankruptcies, or significant issuer specific developments; (ii) when significant events occur which may affect an entire market, such as natural disasters or significant governmen tal actions; and (iii) when non-significant events occur such as markets closing early or not opening, security trading halts, or pricing of non-valued securities and restricted or non-public securities. The Portfolio may use a systematic fair valuation model provided by an independent third party to value international equity securities in order to adjust for stale pricing, which may occur between the close of certain foreign exchanges and the NYSE.
Investment Transactions and Investment Income
Investment transactions are accounted for as of the date purchased or sold (trade date). Dividend income is recorded on the ex-dividend date. Certain dividends from foreign securities will be recorded as soon as the Trust is informed of the dividend if such information is obtained subsequent to the ex-dividend date. Dividends from foreign securities may be subject to withholding taxes in foreign jurisdictions. Interest income is recorded on the accrual basis and includes amortization of premiums and accretion of discounts. Gains and losses are determined on the identified cost basis, which is the same basis used for federal income tax purposes.
Expenses
The Portfolio bears expenses incurred specifically on its behalf as well as a portion of general expenses, which may be allocated pro rata to the Portfolio.
Securities Lending
Under procedures adopted by the Trustees, the Portfolio may lend securities to qualified parties (typically brokers or other financial institutions) who need to borrow securities in order to complete certain transactions such as covering short sales, avoiding failures to deliver securities or completing arbitrage activities. The Portfolio may seek to earn additional income through securities lending. There is the risk of delay in recovering a loaned security or the risk of loss in collateral rights if the borrower fails financially. Janus Capital Management LLC ("Janus Capital") makes efforts to balance the benefits and risks from granting such loans.
State Street Bank and Trust Company served as the Portfolio's lending agent for the period January 1, 2007 through May 24, 2007. Effective May 25, 2007, Dresdner Bank AG became the lending agent for the Portfolio.
16 Janus Aspen Series December 31, 2007
The Portfolio does not have the right to vote on securities while they are being lent; however, the Portfolio may attempt to call back the loan and vote the proxy if time permits. All loans will be continuously secured by collateral which may consist of cash, U.S. Government securities, domestic and foreign short-term debt instruments, letters of credit, time deposits, repurchase agreements or such other collateral permitted by the Securities and Exchange Commission ("SEC"). Cash collateral may be invested in affiliated money market funds or other accounts advised by Janus Capital to the extent consistent with exemptive relief obtained from the SEC or as permitted by the 1940 Act and rules promulgated thereunder.
Dresdner Bank AG (the "Lending Agent") may also invest the cash collateral in the Allianz Dresdner Daily Asset Fund or investments in unaffiliated money market funds or accounts, mutually agreed to by the Portfolio and the Lending Agent, that comply with Rule 2a-7 of the 1940 Act relating to money market funds.
As of December 31, 2007, the Portfolio had on loan securities valued as indicated:
| Portfolio | Value at December 31, 2007 | ||||||
| Janus Aspen INTECH Risk-Managed Growth Portfolio | $ | 289,710 | |||||
As of December 31, 2007, the Portfolio received cash collateral for securities lending activity as indicated:
| Portfolio | Cash Collateral at December 31, 2007 | ||||||
| Janus Aspen INTECH Risk-Managed Growth Portfolio | $ | 296,325 | |||||
As of December 31, 2007, all cash collateral received by the Portfolio was invested in the Allianz Dresdner Daily Asset Fund, except for $152,249 and $117,060 which were invested in Repurchase Agreements and Time Deposits, respectively.
The value of the collateral must be at least 102% of the market value of the loaned securities that are denominated in U.S. dollars and 105% of the market value of the loaned securities that are not denominated in U.S. dollars. Loaned securities and related collateral are marked-to-market each business day based upon the market value of the loaned securities at the close of business, employing the most recent available pricing information. Collateral levels are then adjusted based on this mark-to-market evaluation.
The borrower pays fees at the Portfolio's direction to the Lending Agent. The Lending Agent may retain a portion of the interest earned on the cash collateral invested. The cash collateral invested by the Lending Agent is disclosed in the Schedule of Investments (if applicable). The lending fees and the Portfolio's portion of the interest income earned on cash collateral are included on the Statement of Operations (if applicable).
Interfund Lending
Pursuant to an exemptive order received from the SEC, the Portfolio may be party to an interfund lending agreement between the Portfolio and other Janus Capital sponsored mutual funds, which permits it to borrow or lend cash at a rate beneficial to both the borrowing and lending funds. Outstanding borrowings from all sources totaling 10% or more of the borrowing Portfolio's total assets must be collateralized at 102% of the outstanding principal value of the loan; loans of less than 10% may be unsecured. During the fiscal year ended December 31, 2007, there were no outstanding interfund borrowing or lending arrangements for the Portfolio.
Futures Contracts
The Portfolio may enter into futures contracts to gain exposure to the stock market pending investment of cash balances or to meet liquidity needs. The Portfolio may also use such derivative instruments to hedge or protect from adverse movements in securities prices, currency rates or interest rates. The use of futures contracts may involve risks such as the possibility of illiquid markets or imperfect correlation between the value of the contracts and the underlying securities, or that the counterparty will fail to perform its obligations.
Futures contracts are marked-to-market daily, and the daily variation margin is recorded as a receivable or payable on the Statement of Assets and Liabilities (if applicable). When a contract is closed, a realized gain or loss is recorded as "Net realized gain/(loss) from futures contracts" on the Statement of Operations (if applicable) equal to the difference between the opening and closing value of the contract. Generally, futures contracts are marked-to-market (i.e., treated as realized and subject to distribution) for federal income tax purposes at fiscal year-end. Securities designated as collateral for market value on futures contracts are noted in the Schedule of Investments (if applicable). Such collateral is in the possession of the Portfolio's custodian. As of December 31, 2007, the Portfol io was not invested in futures contracts.
Initial Public Offerings
The Portfolio may invest in initial public offerings ("IPOs"). IPOs and other investment techniques may have a magnified performance impact on a fund with a small asset base. The Portfolio may not experience similar performance as its assets grow.
Restricted Security Transactions
Restricted securities held by the Portfolio may not be sold except in exempt transactions or in a public offering registered under the Securities Act of 1933. The risk of investing in such securities is generally greater than the risk of investing in the securities of widely held, publicly traded companies. Lack of a secondary market and resale restrictions may result in the inability of the Portfolio to sell a security at a fair price and may
Janus Aspen Series December 31, 2007 17
Notes to Financial Statements (continued)
substantially delay the sale of the security. In addition, these securities may exhibit greater price volatility than securities for which secondary markets exist. As of December 31, 2007, the Portfolio was not invested in restricted securities.
Dividend Distributions
The Portfolio may make semiannual distributions of substantially all of its investment income and an annual distribution of its net realized capital gains (if any). The majority of dividends and net realized capital gains distributions from the Portfolio may be automatically reinvested into additional shares of the Portfolio, based upon the discretion of the shareholder.
The Portfolio may make certain investments in real estate investment trusts ("REITs") which pay dividends to their shareholders based upon funds available from operations. It is quite common for these dividends to exceed the REIT's taxable earnings and profits resulting in the excess portion of such dividends being designated as a return of capital. If the Portfolio distributes such amounts, such distribution could constitute a return of capital to shareholders for federal income tax purposes.
Estimates
The preparation of financial statements in conformity with accounting principles generally accepted in the United States of America requires management to make estimates and assumptions that affect the reported amount of assets and liabilities and disclosure of contingent assets and liabilities at the date of the financial statements, and the reported amounts of income and expenses during the reporting period. Actual results could differ from those estimates.
Federal Income Taxes
No provision for income taxes is included in the accompanying financial statements, as the Portfolio intends to distribute to shareholders all taxable investment income and realized gains and otherwise comply with Subchapter M of the Internal Revenue Code applicable to regulated investment companies.
New Accounting Pronouncements
In July 2006, the Financial Accounting Standards Board ("FASB") issued Interpretation No. 48, "Accounting for Uncertainty in Income Taxes – an Interpretation of FASB Statement No. 109" (the "Interpretation"). The Interpretation establishes for all entities, including pass-through entities such as the Portfolio, a minimum threshold for financial statement recognition of the benefit of positions taken in filing tax returns (including whether an entity is taxable in a particular jurisdiction), and requires certain expanded tax disclosures. A calendar year open-end or closed-end fund was required to implement the Interpretation no later than June 29, 2007 (the last business day of the semi-annual reporting period), and the Interpretation also applies to all open tax years as of the date of effectiveness. Management has evaluated the application of the Interpretation t o the Portfolio and has determined there is no significant impact on the Portfolio's financial statements.
In September 2006, the FASB issued Statement of Financial Accounting Standards No. 157, "Fair Value Measurements" ("SFAS No. 157"), which defines fair value, establishes a framework for measuring fair value in generally accepted accounting principles, and expands disclosures about fair value measurements. SFAS No. 157 does not require new fair value measurements, but is applied to the extent that other accounting pronouncements require or permit fair value measurements. SFAS No. 157 emphasizes that fair value is a market-based measurement that should be determined based on the assumptions that market participants would use in pricing an asset or liability. SFAS No. 157 is effective for fiscal years beginning after November 15, 2007 and interim periods within those fiscal years. Management does not believe the adoption of SFAS No. 157 will impact the financial statement amounts, however, the Portfolio will be required to disclose the extent t o which fair value is used to measure assets and liabilities and the inputs used to develop the measurements.
2. INVESTMENT ADVISORY AGREEMENTS AND OTHER TRANSACTIONS WITH AFFILIATES
The Portfolio pays a monthly advisory fee to Janus Capital based upon average daily net assets and calculated at the annual rate of 0.50%.
Enhanced Investment Technologies, LLC ("INTECH") serves as subadviser to the Portfolio. Janus Capital indirectly owns approximately 86.5% of the outstanding voting shares of INTECH. Janus Capital pays INTECH a subadvisory fee at the annual rate of 0.26% of average daily net assets from its management fee for managing the Portfolio.
Effective January 1, 2008, the subadvisory fee rate paid by Janus Capital changed from a fixed rate based on the Portfolio's annual average daily net assets to a fee equal to 50% of the investment advisory fee rate paid by the Portfolio to Janus Capital.
Janus Services LLC ("Janus Services"), a wholly-owned subsidiary of Janus Capital, receives from the Portfolio a fee at an annual rate of up to 0.10% of the average daily net assets of Service Shares of the Portfolio, to compensate Janus Services for providing, or arranging for the provision of record keeping, subaccounting, and administrative services.
Janus Services receives certain out-of-pocket expenses for transfer agent services.
18 Janus Aspen Series December 31, 2007
Janus Capital has agreed until at least May 1, 2009 to reimburse the Portfolio by the amount, if any, that the normal operating expenses in any fiscal year, including the investment advisory fee but excluding the distribution and shareholder servicing (12b-1) fees applicable to Service Shares, the administrative services fees applicable to Service Shares, brokerage commissions, interest, taxes and extraordinary expenses, exceed an annual rate of 1.10% of the average daily net assets of the Portfolio. The Portfolio is not required to repay any such waived fees in future years to Janus Capital.
Certain officers of the Portfolio may also be officers and/or directors of Janus Capital. Such officers receive no compensation from the Portfolio, except for the Portfolio's Chief Compliance Officer. Effective January 1, 2006, the Portfolio began reimbursing the adviser for a portion of the compensation paid to the Chief Compliance Officer of the Trust. Total compensation of $3,078 was paid by the Portfolio during the fiscal year ended December 31, 2007. The Portfolio's portion is reported as part of "Other Expenses" on the Statement of Operations.
The Board of Trustees has adopted a deferred compensation plan (the "Deferred Plan") for independent Trustees to elect to defer receipt of all or a portion of the annual compensation they are entitled to receive from the Portfolio. All deferred fees are credited to an account established in the name of the Trustees. The amounts credited to the account then increase or decrease, as the case may be, in accordance with the performance of one or more of the Janus funds that are selected by the Trustees. The account balance continues to fluctuate in accordance with the performance of the selected fund or funds until final payment of all amounts credited to the account. The fluctuation of the account balance is recorded by the Portfolio as unrealized appreciation/(depreciation) and is shown as of December 31, 2007 on the Statement of Assets and Liabilities as an asset, "Noninterested Trustees' deferred compensation," and a liability, "Noninterested Trustees' deferred compensation fees." Additionally, the recorded unrealized appreciation/(depreciation) is included in "Unrealized net appreciation/(depreciation) of investments, foreign currency translations and non-interested Trustees' deferred compensation" on the Statement of Assets and Liabilities. Deferred compensation expenses for the fiscal year ended December 31, 2007 are included in "Non-interested Trustees' fees and expenses" on the Statement of Operations. Trustees are allowed to change their designation of mutual funds from time to time. Amounts will be deferred until distributed in accordance with the Deferred Plan. No deferred fees were paid to any Trustee under the Deferred Plan during the fiscal year ended December 31, 2007.
For the fiscal year ended December 31, 2007, Janus Capital assumed $24,421 of legal, consulting and Trustee costs and fees incurred by the funds in Janus Investment Fund, Janus Aspen Series and Janus Adviser Series (the "Funds") in connection with the regulatory and civil litigation matters discussed in Note 7. These non-recurring costs were allocated to all Funds based on the Funds' respective net assets as of July 31, 2004. Additionally, all future non-recurring costs will be allocated to the Funds based on the Funds' respective net assets on July 31, 2004. These "Non-recurring costs" and "Costs assumed by Janus Capital" are shown on the Statement of Operations.
Janus Distributors LLC, a wholly-owned subsidiary of Janus Capital, is a distributor of the Portfolio. Service Shares have adopted a Distribution and Shareholder Servicing Plan (the "Plan") pursuant to Rule 12b-1 under the 1940 Act. The Plan authorizes payments by the Portfolio in connection with the distribution of Service Shares at an annual rate of up to 0.25% of Service Share's average daily net assets.
The Portfolio's expenses may be reduced by expense offsets from an unaffiliated custodian and/or transfer agent. Such credits or offsets are included in "Expense and Fee Offset" on the Statement of Operations. The transfer agent fee offsets received during the period reduce Transfer Agent Fees and Expenses. Custodian offsets received reduce Custodian Fees. The Portfolio could have employed the assets used by the custodian and/or transfer agent to produce income if it had not entered into an expense offset arrangement.
The Portfolio may invest in money market funds, including funds managed by Janus Capital. During the fiscal year ended December 31, 2007, the Portfolio recorded distributions from affiliated investment companies as affiliated dividend income, and had the following affiliated purchases and sales:
| Purchases Shares/Cost | Sales Shares/Cost | Dividend Income | Value at 12/31/07 | ||||||||||||||||
| Janus Aspen INTECH Risk-Managed Growth Portfolio | |||||||||||||||||||
| Janus Institutional Cash Management Fund – Institutional Shares | $ | 542,128 | $ | 403,128 | $ | 2,085 | $ | 139,000 | |||||||||||
| Janus Institutional Cash Reserves Fund | 59,936 | 68,436 | 264 | – | |||||||||||||||
| Janus Institutional Money Market Fund – Institutional Shares | 789,178 | 789,178 | 1,067 | – | |||||||||||||||
| Janus Money Market Fund – Institutional Shares | 72,626 | 119,251 | 301 | – | |||||||||||||||
| $ | 1,463,868 | $ | 1,379,993 | $ | 3,717 | $ | 139,000 | ||||||||||||
Janus Aspen Series December 31, 2007 19
Notes to Financial Statements (continued)
3. FEDERAL INCOME TAX
The tax components of capital shown in the table below represent: (1) distribution requirements the Portfolio must satisfy under the income tax regulations; (2) losses or deductions the Portfolio may be able to offset against income and gains realized in future years; and (3) unrealized appreciation or depreciation of investments for federal income tax purposes (reduced by foreign tax liability).
Other book to tax differences in the current year may consist of deferred compensation, derivatives, and foreign currency contract adjustments. The Portfolio has elected to treat gains and losses on forward foreign currency contracts as capital gains and losses. Other foreign currency gains and losses on debt instruments are treated as ordinary income for federal income tax purposes pursuant to Section 988 of the Internal Revenue Code.
| Portfolio | Undistributed Ordinary Income | Undistributed Long-Term Gains | Accumulated Capital Losses | Post October Deferral | Other Book to Tax Differences | Net Tax Appreciation/ (Depreciation) | |||||||||||||||||||||
| Janus Aspen INTECH Risk-Managed Growth Portfolio | $ | 38,966 | $ | 175,532 | $ | – | $ | – | $ | (80 | ) | $ | 1,147,085 | ||||||||||||||
The aggregate cost of investments and the composition of unrealized appreciation and depreciation of investment securities for federal income tax purposes as of December 31, 2007 are noted below.
Unrealized appreciation and unrealized depreciation in the table below exclude appreciation/depreciation on foreign currency translations. The primary difference between book and tax appreciation or depreciation of investments is wash sale loss deferrals.
| Portfolio | Federal Tax Cost | Unrealized Appreciation | Unrealized (Depreciation) | ||||||||||||
| Janus Aspen INTECH Risk-Managed Growth Portfolio | $ | 10,681,410 | $ | 1,519,542 | $ | (372,457 | ) | ||||||||
Income and capital gains distributions are determined in accordance with income tax regulations that may differ from accounting principles generally accepted in the United States of America. These differences are due to differing treatments for items such as net short-term gains, deferral of wash sale losses, foreign currency transactions, net investment losses and capital loss carryovers. Certain permanent differences such as tax returns of capital and net investment losses noted below have been reclassified to paid-in capital.
| For the fiscal year ended December 31, 2007 | Distributions | ||||||||||||||||||
| Portfolio | From Ordinary Income | From Long-Term Capital Gains | Tax Return of Capital | Net Investment Loss | |||||||||||||||
| Janus Aspen INTECH Risk-Managed Growth Portfolio | $ | 69,928 | $ | 976,390 | $ | – | $ | – | |||||||||||
| For the fiscal period ended December 31, 2006 | Distributions | ||||||||||||||||||
| Portfolio | From Ordinary Income | From Long-Term Capital Gains | Tax Return of Capital | Net Investment Loss | |||||||||||||||
| Janus Aspen INTECH Risk-Managed Growth Portfolio | $ | – | $ | 442,094 | $ | – | $ | (21,511 | ) | ||||||||||
4. EXPENSE RATIOS
The expense ratios listed in the Financial Highlights reflect expenses prior to any expense offsets (gross expense ratio) and after expense offsets (net expense ratio). Both expense ratios reflect expenses after waivers (reimbursement). Listed below are the gross expense ratios for the Portfolio that would have been in effect, absent the waiver of certain fees and offsets.
| For each fiscal year ended December 31 | Service Shares | ||||||||||||||||||||||
| Portfolio | 2007(1) | 2006(1) | 2005(1) | 2004(1) | 2003(2) | ||||||||||||||||||
| Janus Aspen INTECH Risk-Managed Growth Portfolio | 2.10 | % | 2.23 | % | 1.68 | % | 1.73 | % | 2.58 | % | |||||||||||||
(1) The effect of non-recurring costs assumed by Janus Capital (Note 2) is included in the ratio of operating expenses to average net assets without waivers
and/or expense reimbursements and was less than 0.01%.
(2) Fiscal period from January 2, 2003 (inception date) through December 31, 2003.
20 Janus Aspen Series December 31, 2007
5. CAPITAL SHARE TRANSACTIONS
| For each fiscal year ended December 31 | Janus Aspen INTECH Risk-Managed Growth Portfolio | ||||||||||
| (all numbers in thousands) | 2007 | 2006 | |||||||||
| Transactions in Portfolio Shares – Service Shares | |||||||||||
| Shares sold | 2 | 2 | |||||||||
| Reinvested dividends and distributions | 88 | 37 | |||||||||
| Shares repurchased | (2 | ) | (128 | ) | |||||||
| Net Increase/(Decrease) in Portfolio Shares | 88 | (89 | ) | ||||||||
| Shares Outstanding, Beginning of Period | 886 | 975 | |||||||||
| Shares Outstanding, End of Period | 974 | 886 | |||||||||
6. PURCHASES AND SALES OF INVESTMENT SECURITIES
For the fiscal year ended December 31, 2007, the aggregate cost of purchases and proceeds from sales of investment securities (excluding short-term securities) were as follows:
| Portfolio | Purchases of Securities | Proceeds from Sales of Securities | Purchases of Long- Term U.S. Government Obligations | Proceeds from Sales of Long-Term U.S. Government Obligations | |||||||||||||||
| Janus Aspen INTECH Risk-Managed Growth Portfolio | $ | 14,704,270 | $ | 14,738,123 | $ | – | $ | – | |||||||||||
7. PENDING LEGAL MATTERS
In the fall of 2003, the Securities and Exchange Commission ("SEC"), the Office of the New York State Attorney General ("NYAG"), the Colorado Attorney General ("COAG"), and the Colorado Division of Securities ("CDS") announced that they were investigating alleged frequent trading practices in the mutual fund industry. On August 18, 2004, Janus Capital announced that it had reached final settlements with the SEC, the NYAG, the COAG, and the CDS related to such regulators' investigations into Janus Capital's frequent trading arrangements.
A number of civil lawsuits were brought against Janus Capital and certain of its affiliates, the Janus funds, and related entities and individuals based on allegations similar to those announced by the above regulators and were filed in several state and federal jurisdictions. Such lawsuits alleged a variety of theories for recovery including, but not limited to, the federal securities laws, other federal statutes (including ERISA), and various common law doctrines. The Judicial Panel on Multidistrict Litigation transferred these actions to the U.S. District Court for the District of Maryland (the "Court") for coordinated proceedings. On September 29, 2004, five consolidated amended complaints were filed with the Court that generally include: (i) claims by a putative class of investors in certain Janus funds asserting claims on behalf of the investor class (Marini, et al. v. Janus Investment Fund, et al., U.S. District Court, District of Maryland, Case No. 04-CV-00497); (ii) derivative claims by investors in certain Janus funds ostensibly on behalf of such funds (Steinberg et al. v. Janus Capital Management, LLC et al., U.S. District Court, District of Maryland, Case No. 04-CV-00518); (iii) claims on behalf of participants in the Janus 401(k) plan (Wangberger v. Janus Capital Group Inc., 401(k) Advisory Committee, et al., U.S. District Court, District of Maryland, Case No. JFM-05-2711); (iv) claims brought on behalf of shareholders of Janus Capital Group Inc. ("JCGI") on a derivative basis against the Board of Directors of JCGI (Chasen v. Whiston, et al., U.S. District Court, District of Maryland, Case No. 04-MD-00855); and (v) claims by a putative class of shareholders of JCGI asserting claims on behalf of the shareholders (Wiggins, et al. v. Janus Capital Group, Inc., et al., U.S. District Court, District of Maryland, Case No. 04- CV-00818). Each of the five complaints initially named JCGI and/or Janus Capital as a defendant. In addition, the following were also named as defendants in one or more of the actions: Janus Investment Fund ("JIF"), Janus Aspen Series ("JAS"), Janus Adviser Series ("JAD"), Janus Distributors LLC, Enhanced Investment Technologies, LLC ("INTECH"), Bay Isle Financial LLC ("Bay Isle"), Perkins, Wolf, McDonnell and Company, LLC ("Perkins"), the Advisory Committee of the Janus 401(k) plan, and the current or former directors of JCGI.
On August 25, 2005, the Court entered orders dismissing most of the claims asserted against Janus Capital and its affiliates by fund investors in the Marini and Steinberg cases (actions (i) and (ii) above) except certain claims under Section 10(b) of the Securities Exchange Act of 1934 and under Section 36(b) of the Investment Company Act of 1940,
Janus Aspen Series December 31, 2007 21
Notes to Financial Statements (continued)
as amended (the "1940 Act"). On August 15, 2006, the Wangberger complaint in the 401(k) plan class action (action (iii) above) was dismissed by the district court with prejudice. The plaintiff appealed that dismissal decision to the United States Court of Appeals for the Fourth Circuit. The appeal is still pending and argument in the matter was held in December 2007. The Court also dismissed the Chasen lawsuit (action (iv) above) against JCGI's Board of Directors without leave to amend. Finally, a Motion to Dismiss the Wiggins suit (action (v) above) was granted and the matter was dismissed in May 2007. However, in June 2007, Plaintiffs appealed that dismissal to the United States Court of Appeals for the Fourth Circuit. That appeal is currently pending.
In addition to the lawsuits described above, the Auditor of the State of West Virginia ("Auditor"), in his capacity as securities commissioner, has initiated administrative proceedings against many of the defendants in the market timing cases (including JCGI and Janus Capital) and, as a part of its relief, is seeking disgorgement and other monetary relief based on similar market timing allegations (In the Matter of Janus Capital Group Inc. et al., Before the Securities Commissioner, State of West Virginia, Summary Order No. 05-1320). The respondents in these proceedings collectively sought a Writ of Prohibition in state court, which was denied. Their subsequent Petition for Appeal was also denied. Consequently, in September 2006, JCGI and Janus Capital filed their answer to the Auditor's summary order instituting proceedings and requested a hearing. A statu s conference was held on June 28, 2007, during which the parties were ordered to submit their proposed scheduling order. To date, no scheduling order has been entered in the case. In addition to the pending Motion to Discharge Order to Show Cause, JCGI and Janus Capital, as well as other similarly situated defendants, continue to challenge the statutory authority of the Auditor to bring such an action.
Additional lawsuits may be filed against certain of the Janus funds, Janus Capital, and related parties in the future. Janus Capital does not currently believe that these pending actions will materially affect its ability to continue providing services it has agreed to provide to the Janus funds.
22 Janus Aspen Series December 31, 2007
Report of Independent Registered Public
Accounting Firm
To the Trustees and Shareholders
of Janus Aspen INTECH Risk-Managed Growth Portfolio
In our opinion, the accompanying statement of assets and liabilities, including the schedule of investments, and the related statements of operations and of changes in net assets and the financial highlights present fairly, in all material respects, the financial position of Janus Aspen INTECH Risk-Managed Growth Portfolio (formerly Janus Aspen Risk-Managed Growth Portfolio) (one of the portfolios constituting Janus Aspen Series, hereafter referred to as the "Portfolio") at December 31, 2007, the results of its operations for the year then ended, the changes in its net assets for each of the two years in the period then ended, and the financial highlights for each of the periods indicated, in conformity with accounting principles generally accepted in the United States of America. These financial statements and financial highlights (hereafter referred to as "financial statements") are the responsibility of the Portfolio's management; our res ponsibility is to express an opinion on these financial statements based on our audits. We conducted our audits of these financial statements in accordance with the standards of the Public Company Accounting Oversight Board (United States). Those standards require that we plan and perform the audit to obtain reasonable assurance about whether the financial statements are free of material misstatement. An audit includes examining, on a test basis, evidence supporting the amounts and disclosures in the financial statements, assessing the accounting principles used and significant estimates made by management, and evaluating the overall financial statement presentation. We believe that our audits, which included confirmation of securities at December 31, 2007 by correspondence with the custodian, transfer agent and brokers, and the application of alternative auditing procedures where securities purchased had not been received, provide a reasonable basis for our opinion.

Denver, Colorado
February 15, 2008
Janus Aspen Series December 31, 2007 23
Additional Information (unaudited)
PROXY VOTING POLICIES AND VOTING RECORD
A description of the policies and procedures that the Portfolio uses to determine how to vote proxies relating to its portfolio securities is available: (i) without charge, upon request, by calling 1-800-525-0020 (toll free); (ii) on the Portfolio's website at www.janus.com/proxyvoting; and (iii) on the SEC's website at http://www.sec.gov. Additionally, information regarding the Portfolio's proxy voting record for the most recent twelve-month period ended June 30 is also available, free of charge, through www.janus.com/proxyvoting and from the SEC's website at http://www.sec.gov.
QUARTERLY PORTFOLIO HOLDINGS
The Portfolio files its complete portfolio holdings (schedule of investments) with the SEC for the first and third quarters of each fiscal year on Form N-Q within 60 days of the end of such fiscal quarter. The Portfolio's Form N-Q: (i) is available on the SEC's website at http://www.sec.gov; (ii) may be reviewed and copied at the SEC's Public Reference Room in Washington, D.C. (information on the Public Reference Room may be obtained by calling 1-800-SEC-0330); and (iii) is available without charge, upon request, by calling Janus at 1-800-525-0020 (toll free).
APPROVAL OF ADVISORY AGREEMENTS DURING THE PERIOD
The Trustees of Janus Aspen Series, none of whom has ever been affiliated with Janus Capital ("Independent Trustees"), oversee the management of each Portfolio and, as required by law, determine annually whether to continue the investment advisory agreement for each Portfolio and the subadvisory agreements for the three Portfolios that utilize subadvisers.
In connection with their most recent consideration of those agreements for each Portfolio, the Trustees received and reviewed a substantial amount of information provided by Janus Capital and the respective subadvisers in response to requests of the Independent Trustees and their independent legal counsel. They also received and reviewed a considerable amount of information and analysis provided by their independent fee consultant. Throughout their consideration of the agreements, the Independent Trustees were advised by their independent legal counsel. The Independent Trustees met with management to consider the agreements, and also met separately in executive session with their independent legal counsel and their independent fee consultant.
At a meeting held on December 14, 2007, based on their evaluation of the information provided by Janus Capital, the subadvisers and the independent fee consultant, as well as other information, the Trustees determined that the overall arrangements between each Portfolio and Janus Capital and each subadviser, as applicable, were fair and reasonable in light of the nature, extent and quality of the services provided by Janus Capital, its affiliates and the subadvisers, the fees charged for those services, and other matters that the Trustees considered relevant in the exercise of their business judgment. At that meeting the Trustees unanimously approved the continuation of the investment advisory agreement for each Portfolio, and the subadvisory agreement for each subadvised Portfolio, for the period from February 1, 2008 through February 1, 2009, subject to earlier termina tion as provided for in each agreement.
In considering the continuation of those agreements, the Trustees reviewed and analyzed various factors that they determined were relevant, including the factors described below, none of which by itself was considered dispositive. However, the material factors and conclusions that formed the basis for the Trustees' determination to approve the continuation of the agreements are discussed separately below.
Nature, Extent and Quality of Services
The Trustees reviewed the nature, extent and quality of the services provided by Janus Capital and the subadvisers to the Portfolios, taking into account the investment objective and strategy of each Portfolio, the knowledge of the Trustees gained from their regular meetings with management on at least a quarterly basis, and their ongoing review of information related to the Portfolios. In addition, the Trustees reviewed the resources and key personnel of Janus Capital and each subadviser, especially those who provide investment management services to the Portfolios. The Trustees also considered other services provided to the Portfolios by Janus Capital or the subadvisers, such as managing the execution of portfolio transactions and the selection of broker-dealers for those transactions, serving as the Portfolios' administrator, monitoring adherence to the Portfolios' investment restrictions, producing shareholder reports, providing support services for the Trustees and Trustee committees, communicating with shareholders, and overseeing the activities of other service providers, including monitoring compliance with various policies and procedures of the Portfolios and with applicable securities laws and regulations.
The Trustees concluded that the nature, extent and quality of the services provided by Janus Capital and/or the subadviser to each Portfolio were appropriate and consistent with the terms of the respective advisory and subadvisory agreements; that, taking into account steps taken to address those Portfolios whose performance lagged that of the median of their peers for certain periods, the quality of those services had been consistent with or superior to quality norms in the industry; and that the Portfolios were likely to benefit from the continued provision of those services. They also concluded that Janus Capital and each subadviser had sufficient personnel, with the appropriate education and experience, to
24 Janus Aspen Series December 31, 2007
serve the Portfolios effectively and had demonstrated its continuing ability to attract well-qualified personnel.
Performance of the Portfolios
The Trustees considered the investment results of each Portfolio over various time periods. They reviewed information comparing each Portfolio's performance with the performance of comparable funds and peer groups identified by Lipper Inc., an independent provider of investment company data, and with the Portfolio's benchmark index. They concluded that the performance of many Portfolios was good to very good under current market conditions. Although the performance of some Portfolios lagged that of the median of their peers for certain periods, the Trustees also concluded that Janus Capital had taken appropriate steps to address those instances of under-performance and that the more recent performance of most of those Portfolios had been improving.
Costs of Services Provided
The Trustees examined information on the fees and expenses of each Portfolio in comparison to similar information for comparable funds as provided by Lipper. They also reviewed an analysis of that information provided by their independent fee consultant and noted that the rate of management (investment advisory and administrative) fees for most of the Portfolios, in some cases after contractual expense limitations, was below the mean management fee rate of the respective peer group of funds selected by Lipper.
The Trustees considered the methodology used by Janus Capital and each subadviser in determining compensation payable to portfolio managers, the competitive environment for investment management talent and the competitive market for mutual funds in different distribution channels. They concluded that the compensation methodology provided a good alignment of the interests of the portfolio managers with those of Portfolio shareholders.
The Trustees also reviewed management fees charged by Janus Capital to its separate account clients and to its subadvised funds (for which Janus Capital provides only services related to portfolio management). Although in most instances subadvisory and separate account fee rates for various investment strategies were lower than management fee rates for Portfolios having a similar strategy, the Trustees noted that, under the terms of the management agreements with the Portfolios, Janus Capital performs significant additional services for the Portfolios that it does not provide to those other clients, including administrative services, oversight of the Portfolios' other service providers, Trustee support, regulatory compliance and numerous other services, and that, in serving the Portfolios, Janus Capital assumes many legal risks that it does not assume in servicing its ot her clients. Moreover, the Trustees noted that the spread between the average fee rates charged to the Portfolios and the fee rates that Janus Capital charged to its separate account clients was significantly smaller than the average spread for such fee rates of other advisers, based on publicly available data and research conducted by their independent fee consultant.
The Trustees reviewed information on the profitability to Janus Capital and its affiliates of their relationships with each Portfolio, as well as an explanation of the methodology used in allocating various expenses of Janus Capital and its affiliates among the Portfolios and other clients. They also reviewed the financial statements of Janus Capital's parent company and its corporate structure. In their review, the Trustees considered whether Janus Capital and each subadviser receives adequate incentives to manage the Portfolios effectively. They recognized that profitability comparisons among investment advisers are difficult because very little comparative information is publicly available and profitability of any adviser is affected by numerous factors, including the organizational structure of the particular adviser, the types of funds and other accounts it manages, possible other lines of business, the methodology for allocating expens es, and the adviser's capital structure and cost of capital. However, based on the information available and taking those factors into account, the Trustees concluded that Janus Capital's profitability with respect to each Portfolio in relation to the services rendered was not unreasonable.
The Trustees concluded that the management fees and other compensation payable by each Portfolio to Janus Capital and its affiliates, as well as the fees payable by Janus Capital or the Portfolios to the subadvisers of subadvised Portfolios, were reasonable in relation to the nature, extent and quality of the services provided, taking into account the fees charged by other advisers for managing comparable mutual funds with similar strategies and the fees Janus Capital and the subadvisers charge to other clients. They also concluded that the overall expense ratio of each Portfolio was reasonable, taking into account the size of the Portfolio, the quality of services provided by Janus Capital and any subadviser, the investment performance of the Portfolio and any expense limitations agreed to by Janus Capital.
Economies of Scale
The Trustees considered information about the potential for Janus Capital to realize economies of scale as the assets of the Portfolios increase. They noted that, although most Portfolios pay advisory fees at a fixed rate as a percentage of net assets, without any breakpoints, the management fee rate paid by each Portfolio, after any contractual expense limitations, was below the mean management fee rate of the Portfolio's peer
Janus Aspen Series December 31, 2007 25
Additional Information (unaudited) (continued)
group selected by Lipper; and, for those Portfolios whose expenses are being reduced by the contractual expense limitations of Janus Capital, Janus Capital is subsidizing the Portfolios because they have not reached adequate scale. Moreover, as the assets of many of the Portfolios declined in the past few years, those Portfolios benefited from having advisory fee rates that remained constant rather than increasing as assets declined. In addition, performance fee structures have been implemented for several Portfolios that will cause the effective rate of advisory fees payable by such a Portfolio to vary depending on the investment performance of the Portfolio relative to its benchmark index over the measurement period; and a few Portfolios have fee schedules with breakpoints and reduced fee rates above certain asset levels. The Trustees also noted that the Portfolios share directly in economies of scale through lower charges of third-party s ervice providers, based on the combined scale of all of the Portfolios. Based on all of the information they reviewed, the Trustees concluded that the current fee structure of each Portfolio was reasonable and that the current rates of fees do reflect a sharing between Janus Capital and the Portfolio of economies of scale at the current asset level of the Portfolio.
Other Benefits to Janus Capital
The Trustees also considered benefits that accrue to Janus Capital and its affiliates from their relationships with the Portfolios. They recognized that two affiliates of Janus Capital separately serve the Portfolios as transfer agent and distributor, respectively. They also considered Janus Capital's past and proposed use of commissions paid by Portfolios on their portfolio brokerage transactions to obtain proprietary and third-party research products and services benefiting those Portfolios and/or other clients of Janus Capital. The Trustees concluded that Janus Capital's use of "soft" commission dollars of a Portfolio to obtain proprietary and third-party research products and services was consistent with regulatory requirements and guidelines and was likely to benefit the Portfolios. The Trustees also concluded that, other than the services provided by Janus Capital and its affiliates pursuant to the agreements and the fees to be paid by each Portfolio therefor, the Portfolios and Janus Capital may potentially benefit from their relationship with each other in other ways. They concluded that Janus Capital benefits from the receipt of proprietary research products and services acquired through commissions paid on portfolio transactions of the Portfolios and that the Portfolios benefit from Janus Capital's receipt of those products and services, as well as research products and services acquired through commissions paid by other clients of Janus Capital. They further concluded that success of any Portfolio could attract other business to Janus Capital or other Janus funds and that the success of Janus Capital could enhance Janus Capital's ability to serve the Portfolios.
After full consideration of the above factors, as well as other factors, all of the Trustees, all of whom are Independent Trustees, concluded that the proposed continuation of the investment advisory agreement for each Portfolio, and the subadvisory agreement for each subadvised Portfolio, was in the best interest of the respective Portfolios and their shareholders.
26 Janus Aspen Series December 31, 2007
Explanations of Charts, Tables and
Financial Statements (unaudited)
1. PERFORMANCE OVERVIEWS
The performance overview graph compares the performance of a hypothetical $10,000 investment in the Portfolio with one or more widely used market indices. The hypothetical example does not represent the returns of any particular investment.
When comparing the performance of the Portfolio with an index, keep in mind that market indices do not include brokerage commissions that would be incurred if you purchased the individual securities in the index. They also do not include taxes payable on dividends and interest or operating expenses incurred if you maintained a Portfolio invested in the index.
Average annual total return is calculated by taking the growth or decline in value of an investment over a period of time, including reinvestment of any dividends, distributions and capital gains, then calculating the annual compounded percentage rate that would have produced the same result had the rate of growth been constant throughout the period. Average annual total return does not reflect the deduction of taxes that a shareholder would pay on Portfolio distributions or redemptions of Portfolio shares.
Pursuant to federal securities rules, expense ratios shown in the performance chart reflect subsidized and unsubsidized ratios for the past fiscal year. The total annual portfolio operating expenses ratio is gross of any fee waivers, reflecting a Portfolio's unsubsidized expense ratio. The net annual portfolio operating expenses ratio (if applicable) includes contractual waivers of Janus Capital and/or Janus Services and reflects a Portfolio's subsidized expense ratio. Both the total annual portfolio operating expenses ratio and net annual portfolio operating expenses ratio are based on average net assets as of the fiscal year ended December 31, 2006. The ratios also include expenses indirectly incurred by the Portfolio as a result of investing in other investment companies or pooled investments, which are not reflected in the "Financial Highlights" of this report. As a result, these ratios may be higher or lower than those shown in the "Fin ancial Highlights" in this report. All expenses are shown without the effect of expense offset arrangements. Pursuant to such arrangements, credits realized as a result of uninvested cash balances are used to reduce custodian and transfer agent expenses.
2. SCHEDULE OF INVESTMENTS
Following the performance overview section is the Portfolio's Schedule of Investments. This schedule reports the industry concentrations and types of securities held in the Portfolio on the last day of the reporting period. Securities are usually listed by type (common stock, corporate bonds, U.S. Government obligations, etc.) and by industry classification (banking, communications, insurance, etc.). Holdings are subject to change without notice.
The value of each security is quoted as of the last day of the reporting period. The value of securities denominated in foreign currencies is converted into U.S. dollars. Certain short-term investments maturing within 60 days are valued at amortized cost, which approximates market value.
A summary of investments by country is provided if the Portfolio invested in foreign securities. This summary reports the Portfolio's exposure to different countries by providing the percentage of securities invested in each country. The country of each security represents the country in which the company is incorporated.
FUTURES
A table listing futures contracts follows the Portfolio's Schedule of Investments (if applicable). Futures contracts are contracts that obligate the buyer to receive and the seller to deliver an instrument or money at a specified price on a specified date. Futures are used to hedge against adverse movements in securities prices, currency risk or interest rates.
The table provides the name of the contract, number of contracts held, the expiration date, the principal amount, value and the amount of unrealized gain or loss. The amount of unrealized gain or loss reflects the marked-to- market amount for the last day of the reporting period.
3. STATEMENT OF ASSETS AND LIABILITIES
This statement is often referred to as the "balance sheet." It lists the assets and liabilities of the Portfolio on the last day of the reporting period.
The Portfolio's assets are calculated by adding the value of the securities owned, the receivable for securities sold but not yet settled, the receivable for dividends declared but not yet received on stocks owned and the receivable for Portfolio shares sold to investors but not yet settled. The Portfolio's liabilities include payables for securities purchased but not yet settled, Portfolio shares redeemed but not yet paid and expenses owed but not yet paid. Additionally, there may be other assets and liabilities such as unrealized gain or loss on forward currency contracts.
The section entitled "Net Assets Consist of" breaks down the components of the Portfolio's net assets. Because the Portfolio must distribute substantially all earnings, you will notice that a significant portion of net assets is shareholder capital.
The last section of this statement reports the net asset value ("NAV") per share on the last day of the reporting period for the Portfolio. The NAV is calculated by dividing the Portfolio's net assets (assets minus liabilities) by the number of shares outstanding.
4. STATEMENT OF OPERATIONS
This statement details the Portfolio's income, expenses, gains and losses on securities and currency transactions, and appreciation or depreciation of current Portfolio holdings.
Janus Aspen Series December 31, 2007 27
Explanations of Charts, Tables and
Financial Statements (unaudited) (continued)
The first section in this statement, entitled "Investment Income," reports the dividends earned from stocks and interest earned from interest-bearing securities in the Portfolio.
The next section reports the expenses and expense offsets incurred by the Portfolio, including the advisory fee paid to the investment adviser, transfer agent fees and expenses, printing and postage for mailing statements, financial reports and prospectuses, and other expenses. Expense offsets, if any, are also shown.
The last section lists the increase or decrease in the value of securities held in the Portfolio. The Portfolio realizes a gain (or loss) when it sells its position in a particular security. An unrealized gain (or loss) refers to the change in net appreciation or depreciation of the Portfolio during the reporting period. "Net Realized and Unrealized Gain/(Loss) on Investments" is affected both by changes in the market value of Portfolio holdings and by gains (or losses) realized during the reporting period.
5. STATEMENT OF CHANGES IN NET ASSETS
This statement reports the increase or decrease in the Portfolio's net assets during the reporting period. Changes in the Portfolio's net assets are attributable to investment operations, dividends, distributions and capital share transactions. This is important to investors because it shows exactly what caused the Portfolio's net asset size to change during the period.
The first section summarizes the information from the Statement of Operations regarding changes in net assets due to the Portfolio's investment performance. The Portfolio's net assets may also change as a result of dividend and capital gains distributions to investors. If investors receive their dividends in cash, money is taken out of the Portfolio to pay the distribution. If investors reinvest their dividends, the Portfolio's net assets will not be affected. If you compare the Portfolio's "Net Decrease from Dividends and Distributions" to the "Reinvested dividends and distributions," you will notice that dividend distributions had little effect on the Portfolio's net assets. This is because the majority of Janus investors reinvest their distributions.
The reinvestment of dividends is included under "Capital Share Transactions." "Capital Shares" refers to the money investors contribute to the Portfolio through purchases or withdraw via redemptions. The Portfolio's net assets will increase and decrease in value as investors purchase and redeem shares from the Portfolio.
6. FINANCIAL HIGHLIGHTS
This schedule provides a per-share breakdown of the components that affect the Portfolio's NAV for current and past reporting periods. Not only does this table provide you with total return, it also reports total distributions, asset size, expense ratios and portfolio turnover rate.
The first line in the table reflects the NAV per share at the beginning of the reporting period. The next line reports the net investment income per share, which comprises dividends and interest income earned on securities held by the Portfolio. Following is the total of gains/(losses), realized and unrealized. Dividends and distributions are then subtracted to arrive at the NAV per share at the end of the period. The next line reflects the average annual total return reported the last day of the period.
Also included are the expense ratios, or the percentage of average net assets that were used to cover operating expenses during the period. Expense ratios vary for a number of reasons, including the differences in management fees, the average shareholder account size and the extent of foreign investments, which entail greater transaction costs.
The Portfolio's expenses may be reduced through expense reduction arrangements. These arrangements may include the use of balance credits or transfer agent fee offsets. The Statement of Operations reflects total expenses before any such offset, the amount of the offset and the net expenses. The expense ratios listed in the Financial Highlights reflect total expenses prior to any expense offsets (gross expense ratio) and after the expense offsets (net expense ratio). Both expense ratios reflect expenses after waivers (reimbursements), if applicable.
The ratio of net investment income/(loss) summarizes the income earned less expenses, divided by the average net assets of the Portfolio during the reporting period. Don't confuse this ratio with the Portfolio's yield. The net investment income ratio is not a true measure of the Portfolio's yield because it doesn't take into account the dividends distributed to the Portfolio's investors.
The next figure is the portfolio turnover rate, which measures the buying and selling activity in the Portfolio. Portfolio turnover is affected by market conditions, changes in the asset size of the Portfolio, the nature of the Portfolio's investments and the investment style of the portfolio manager. A 100% rate implies that an amount equal to the value of the entire portfolio is turned over in a year; a 50% rate means that an amount equal to the value of half the portfolio is traded in a year; and a 200% rate means that an amount equal to the value of the portfolio is traded every six months.
28 Janus Aspen Series December 31, 2007
Designation Requirements (unaudited)
For federal income tax purposes, the Portfolio designated the following for the year ended December 31, 2007:
Capital Gain Distributions
| Portfolio | |||||||
| Janus Aspen INTECH Risk-Managed Growth Portfolio | $ | 976,390 | |||||
Janus Aspen Series December 31, 2007 29
Trustees and Officers (unaudited)
The Portfolio's Statement of Additional Information includes additional information about the Trustees and officers and is available, without charge, by calling 1-800-525-0020.
The following are the Trustees and officers of the Trust, together with a brief description of their principal occupations during the last five years (principal occupations for certain Trustees may include periods over five years).
Each Trustee has served in that capacity since he or she was originally elected or appointed. The Trustees do not serve a specified term of office. Each Trustee will hold office until the termination of the Trust or his or her earlier death, resignation, retirement, incapacity, or removal. The retirement age for Trustees is 72. The Portfolio's Nominating and Governance Committee will consider nominees for the position of Trustee recommended by shareholders. Shareholders may submit the name of a candidate for consideration by the Committee by submitting their recommendations to the Trust's Secretary. Each Trustee is currently a Trustee of two other registered investment companies advised by Janus Capital: Janus Investment Fund and Janus Adviser Series. As of the date of this report, collectively, these three registered investment companies consist of 75 series or funds.
The Trust's officers are elected annually by the Trustees for a one-year term. Certain officers also serve as officers of Janus Investment Fund and Janus Adviser Series. Certain officers of the Portfolio may also be officers and/or directors of Janus Capital. Portfolio officers receive no compensation from the Portfolio, except for the Portfolio's Chief Compliance Officer, as authorized by the Trustees.
Trustees
| Name, Address, and Age | Positions Held with Portfolio | Length of Time Served | Principal Occupations During the Past Five Years | Number of Portfolios/ Funds in Fund Complex Overseen by Trustee | Other Directorships Held by Trustee | ||||||||||||||||||
| Dennis B. Mullen* 151 Detroit Street Denver, CO 80206 DOB: 1943 | Chairman Trustee | 3/04-12/07 9/93-Present | Chief Executive Officer of Red Robin Gourmet Burgers, Inc. (since 2005). Formerly, private investor. | 75 | ** | Chairman of the Board (since 2005) and Director of Red Robin Gourmet Burgers, Inc., and Director of Janus Capital Funds Plc (Dublin-based, non-U.S. funds). | |||||||||||||||||
| Jerome S. Contro 151 Detroit Street Denver, CO 80206 DOB: 1956 | Trustee | 12/05-Present | Partner of Tango Group, a private investment firm (since 1999). | 75 | Trustee and Chairman of RS Investment Trust (since 2001), and Director of IZZE Beverages and MyFamily.com, Inc. (genealogical research website). | ||||||||||||||||||
| William F. McCalpin 151 Detroit Street Denver, CO 80206 DOB: 1957 | Trustee | 6/02-Present | Private investor. Formerly, Executive Vice President and Chief Operating Officer of The Rockefeller Brothers Fund (a private family foundation), and Vice President of Asian Cultural Council. | 75 | Director of F.B. Heron Foundation (a private grant making foundation). | ||||||||||||||||||
| John W. McCarter, Jr. 151 Detroit Street Denver, CO 80206 DOB: 1938 | Trustee | 6/02-Present | President and Chief Executive Officer of The Field Museum of Natural History (Chicago, IL) (since 1997). | 75 | Chairman of the Board and Director of Divergence Inc. (biotechnology firm); Director of W.W. Grainger, Inc. (industrial distributor); and Trustee of WTTW (Chicago public television station) and the University of Chicago. | ||||||||||||||||||
*Mr. McCalpin will succeed Mr. Mullen as Chairman as of January 1, 2008.
**Mr. Mullen also serves as director of Janus Capital Funds Plc, consisting of 16 funds. Including Janus Capital Funds Plc and the 75 funds comprising the Janus funds, Mr. Mullen oversees 91 funds.
30 Janus Aspen Series December 31, 2007
Trustees (cont.)
| Name, Address, and Age | Positions Held with Portfolio | Length of Time Served | Principal Occupations During the Past Five Years | Number of Portfolios/ Funds in Fund Complex Overseen by Trustee | Other Directorships Held by Trustee | ||||||||||||||||||
| James T. Rothe 151 Detroit Street Denver, CO 80206 DOB: 1943 | Trustee | 1/97-Present | Co-founder and Managing Director of Roaring Fork Capital Management, LLC (private investment in public equity firm), and Professor Emeritus of Business of the University of Colorado, Colorado Springs, CO (since 2004). Formerly, Professor of Business of the University of Colorado (2002-2004) and Distinguished Visiting Professor of Business (2001-2002) of Thunderbird (American Graduate School of International Management), Glendale, AZ. | 75 | Director of Red Robin Gourmet Burgers, Inc. | ||||||||||||||||||
| William D. Stewart 151 Detroit Street Denver, CO 80206 DOB: 1944 | Trustee | 9/93-Present | Corporate Vice President and General Manager of MKS Instruments - HPS Products, Boulder, CO (a manufacturer of vacuum fittings and valves). | 75 | N/A | ||||||||||||||||||
| Martin H. Waldinger 151 Detroit Street Denver, CO 80206 DOB: 1938 | Trustee | 9/93-Present | Private Investor and Consultant to California Planned Unit Developments (since 1994). Formerly, CEO and President of Marwal, Inc. (homeowner association management company). | 75 | N/A | ||||||||||||||||||
| Linda S. Wolf 151 Detroit Street Denver, CO 80206 DOB: 1947 | Trustee | 12/05-Present | Retired. Formerly, Chairman and Chief Executive Officer of Leo Burnett (Worldwide) (advertising agency) (2001-2005). | 75 | Director of Wal-Mart, The Field Museum of Natural History (Chicago, IL), Children's Memorial Hospital (Chicago, IL), Chicago Council on Foreign Relations, Economic Club of Chicago, and InnerWorkings (U.S. provider of print procurement solutions). | ||||||||||||||||||
Janus Aspen Series December 31, 2007 31
Trustees and Officers (unaudited) (continued)
Officers
| Name, Address, and Age | Positions Held with Portfolio | Term of Office* and Length of Time Served | Principal Occupations During the Past Five Years | ||||||||||||
| Stephanie Grauerholz-Lofton 151 Detroit Street Denver, CO 80206 DOB: 1970 | Chief Legal Counsel and Secretary Vice President | 1/06-Present 3/06-Present | Vice President and Assistant General Counsel of Janus Capital, and Vice President and Assistant Secretary of Janus Distributors LLC. Formerly, Assistant Vice President of Janus Capital and Janus Distributors LLC (2006), and Associate of Vedder, Price, Kaufman & Kammholz, P.C. (1999-2003). | ||||||||||||
| Andrew J. Iseman 151 Detroit Street Denver, CO 80206 DOB: 1964 | President and Chief Executive Officer | 3/07-Present | Chief Operating Officer and Senior Vice President of Janus Capital Group, Inc. and Janus Capital; President of Janus Services LLC; and Director of Capital Group Partners, Inc. Formerly, Senior Vice President of Enhanced Investment Technologies, LLC (2005-2007); and Vice President of Janus Capital (2003-2005) and Janus Services LLC (2003-2004). | ||||||||||||
| David R. Kowalski 151 Detroit Street Denver, CO 80206 DOB: 1957 | Vice President, Chief Compliance Officer, and Anti-Money Laundering Officer | 6/02-Present | Senior Vice President and Chief Compliance Officer of Janus Capital, Janus Distributors LLC, and Janus Services LLC; Chief Compliance Officer of Bay Isle Financial LLC; and Vice President of Enhanced Investment Technologies, LLC. Formerly, Chief Compliance Officer of Enhanced Investment Technologies, LLC (2003-2005); Vice President of Janus Capital (2000-2005) and Janus Services LLC (2004-2005); and Assistant Vice President of Janus Services LLC (2000-2004). | ||||||||||||
| Jesper Nergaard 151 Detroit Street Denver, CO 80206 DOB: 1962 | Chief Financial Officer Vice President, Treasurer, and Principal Accounting Officer | 3/05-Present 2/05-Present | Vice President of Janus Capital. Formerly, Director of Financial Reporting for OppenheimerFunds, Inc. (2004-2005); Site Manager and First Vice President of Mellon Global Securities Services (2003); and Director of Fund Accounting, Project Development, and Training of INVESCO Funds Group (1994-2003). | ||||||||||||
*Officers are elected at least annually by the Trustees for a one-year term and may also be elected from time to time by the Trustees for an interim period.
32 Janus Aspen Series December 31, 2007
Notes
Janus Aspen Series December 31, 2007 33
Janus provides access to a wide range of investment disciplines.
Growth
Janus growth portfolios focus on companies believed to be the leaders in their respective industries, with solid management teams, expanding market share, margins and efficiencies.
Core
Janus core portfolios seek investments in more stable and predictable companies. These portfolios look for a strategic combination of steady growth and for certain portfolios, some degree of income.
Risk-Managed
Our risk-managed portfolios seek to outperform their respective indices while maintaining a risk profile equal to or lower than the index itself. Managed by INTECH (a Janus subsidiary), these portfolios use a mathematical process in an attempt to build a more "efficient" portfolio than the index.
Value
Janus value portfolios invest in companies they believe are poised for a turnaround or are trading at a significant discount to fair value. The goal is to gain unique insight into a company's true value and identify and evaluate potential catalysts that may unlock shareholder value.
International & Global
Janus international and global portfolios seek to leverage Janus' research capabilities by taking advantage of inefficiencies in foreign markets, where accurate information and analytical insight are often at a premium.
Bond
Janus bond portfolios attempt to provide less risk relative to equities while seeking to deliver a competitive total return through high current income and appreciation.
Money Market
Janus money market portfolios seek maximum current income consistent with stability of capital.
For more information about our funds, contact your investment professional or go to www.janus.com/info
Please consider the charges, risks, expenses and investment objectives carefully before investing. For a prospectus containing this and other information, please call Janus at 1-800-525-0020 or download the file from www.janus.com/info. Read it carefully before you invest or send money.
An investment in a money market portfolio is not insured or guaranteed by the Federal Deposit Insurance Corporation or any other government agency. Although the Portfolio seeks to preserve the value of your investment at $1.00 per share, it is possible to lose money by investing in the Portfolio.

151 Detroit Street
Denver, CO 80206
1-800-525-0020
Portfolios distributed by Janus Distributors LLC (2/08)
C-0108-357 109-02-717 02-08
2007 Annual Report
Janus Aspen Series
Janus Aspen International Growth Portfolio
Look Inside. . .
• Portfolio management perspective
• Investment strategy behind your portfolio
• Portfolio performance, characteristics and holdings

Table of Contents
| Useful Information About Your Portfolio Report | 1 | ||||||
| Management Commentary and Schedule of Investments | 2 | ||||||
| Statement of Assets and Liabilities | 11 | ||||||
| Statement of Operations | 12 | ||||||
| Statements of Changes in Net Assets | 13 | ||||||
| Financial Highlights | 14 | ||||||
| Notes to Schedule of Investments | 16 | ||||||
| Notes to Financial Statements | 18 | ||||||
| Report of Independent Registered Public Accounting Firm | 26 | ||||||
| Additional Information | 27 | ||||||
| Explanations of Charts, Tables and Financial Statements | 30 | ||||||
| Designation Requirements | 33 | ||||||
| Trustees and Officers | 34 | ||||||
Please consider the charges, risks, expenses and investment objectives carefully before investing. For a prospectus containing this and other information, please call Janus at 1-800-525-0020 or download the file from www.janus.com/info. Read it carefully before you invest or send money.
Useful Information About Your Portfolio Report
Management Commentary
The Management Commentary in this report includes valuable insight from the Portfolio's manager as well as statistical information to help you understand how your Portfolio's performance and characteristics stack up against those of comparable indices.
Please keep in mind that the opinions expressed by the Portfolio's manager in the Management Commentary are just that: opinions. They are a reflection of the manager's best judgment at the time this report was compiled, which was December 31, 2007. As the investing environment changes, so could the manager's opinions. The views are unique to the manager and aren't necessarily shared by his fellow employees or by Janus in general.
Portfolio Expenses
We believe it's important for our shareholders to have a clear understanding of Portfolio expenses and the impact they have on investment return.
The following is important information regarding the Portfolio's Expense Example, which appears in the Management Commentary within this Annual Report. Please refer to this information when reviewing the Expense Example for the Portfolio.
Example
As a shareholder of a Portfolio, you incur two types of costs: (1) transaction costs, including redemption fees (where applicable) (and any related exchange fees) and (2) ongoing costs, including management fees; distribution and shareholder servicing (12b-1) fees (applicable to Service Shares and Service II Shares only); and other Portfolio expenses. The example is intended to help you understand your ongoing costs (in dollars) of investing in a Portfolio and to compare these costs with the ongoing costs of investing in other mutual funds. To do so, compare this 5% hypothetical example with the 5% hypothetical examples that appear in the shareholder reports of the other funds. The example is based upon an investment of $1,000 invested at the beginning of the period and held for the six-month period from July 1, 2007 to December 31, 2007.
Actual Expenses
The first line of the table in each example provides information about actual account values and actual expenses. You may use the information in this line, together with the amount you invested, to estimate the expenses that you paid over the period. Simply divide your account value by $1,000 (for example, an $8,600 account value divided by $1,000 = 8.6), then multiply the result by the number in the first line under the heading entitled "Expenses Paid During Period" to estimate the expenses you paid on your account during the period.
Hypothetical Example for Comparison Purposes
The second line of the table in each example provides information about hypothetical account values and hypothetical expenses based upon the Portfolio's actual expense ratio and an assumed rate of return of 5% per year before expenses, which is not the Portfolio's actual return. The hypothetical account values and expenses may not be used to estimate the actual ending account balance or expenses you paid for the period. You may use this information to compare the ongoing costs of investing in the Portfolio and other funds. To do so, compare this 5% hypothetical example with the 5% hypothetical examples that appear in the shareholder reports of the other funds.
Please note that the expenses shown in the tables are meant to highlight your ongoing costs only and do not reflect any transaction costs, such as redemption fees (where applicable) and any charges at the separate account level or contract level. Redemption fees are fully described in the prospectus. Therefore, the second line of each table is useful in comparing ongoing costs only, and will not help you determine the relative total costs of owning different funds. In addition, if these transaction costs and separate account or contract level charges were included, your costs would have been higher.
Janus Aspen Series December 31, 2007 1
Janus Aspen International Growth Portfolio
(unaudited)
Portfolio Snapshot
This growth portfolio invests primarily in companies located outside the U.S. Stocks are selected on their fundamental merits, rather than by geography, economic climate or industry sector.

Brent Lynn
portfolio manager
Performance Overview
During the 12-month period ended December 31, 2007, Janus Aspen International Growth Portfolio's Institutional Shares, Service Shares and Service II Shares returned 28.41%, 28.09% and 28.17%, respectively. Its primary benchmark, the Morgan Stanley Capital International (MSCI) EAFE® Index, returned 11.17%, and its secondary benchmark the MSCI All Country World ex-U.S. IndexSM, returned 16.65%, for the same period. While I am very pleased with the short-term performance of the Portfolio, I continue to focus on long-term investing and performance. With that in mind, I remain confident in our research process and optimistic about the longer-term prospects for the companies in the Portfolio.
Investment Strategy
In general, global stock markets had a very positive year, driven by an environment of reasonable economic growth combined with still moderate interest rates and inflation. Prior to the summer onset of the subprime-led credit crisis, the U.S. economy had shown a remarkable resilience in the face of high oil prices, rising interest rates and a slowing housing market. The economies of Continental Europe generally showed strength during the period, but Japan's economy disappointed expectations of acceleration. China and India continued to be among the fastest-growing large economies in the world, driven by globalization, urbanization, and infrastructure development. The Chinese economy has become the key growth engine for the Asian region and one of the key pillars of growth for the world.
Holdings in Brazil, India, China, Hong Kong, and Canada significantly contributed to the Portfolio's performance during the period. On a sector basis, our investments in consumer discretionary, energy, real estate and materials companies were significant positive contributors to performance.
Another factor affecting the Portfolio's absolute performance was currency. During the 12-month period, currency had a positive impact of 5.79% as the Portfolio was unhedged and the dollar depreciated in value versus most key global currencies. However, currency negatively affected the Portfolio relative to the MSCI EAFE® Index. The Portfolio was overweight in countries such as Canada, Brazil and India whose currencies strengthened versus the dollar during the period. However, this positive effect was more than offset by the Portfolio's significant underweight position in Continental Europe, the U.K. and Australia. The European currencies, U.K. pound and Aussie dollar all strengthened versus the U.S. dollar.
During the period, our emerging market exposure remained at the high end of historical trends. However, as a result of sharp increases in global emerging markets, the valuations of some of our emerging market holdings began to look less attractive. Although the long-term growth outlook for these companies remains strong, I cut or sold some of our emerging market holdings as their share prices reached our valuation targets. At the same time, I increased our positions in some underperforming emerging market stocks which I believed had very strong business franchises and attractive valuations, such as Korean technology company Samsung Electronics, Taiwanese semiconductor foundry Taiwan Semiconductor Manufacturing Company (TSMC) and Brazilian sugar producer Cosan.
Global financial markets corrected sharply in July and August due to fears about contagion from the U.S. housing downturn and problems in the U.S. subprime mortgage market. The potential for problems in the U.S. housing market, where prices had appreciated sharply and mortgage lending standards had been relaxed, had been anticipated by many observers for a long time. However, I was surprised by the rapid and powerful contagion effect from the U.S. housing market to the global commercial paper and inter-bank lending markets and to the global financial system in general. During the broad-based market sell-off, the Portfolio declined sharply. Moves by the Federal Reserve (Fed) to lower interest rates and provide liquidity at least temporarily alleviated the crisis. Many of our holdings recovered over the last few months as stocks generally bounced back. Despite the Fed's recent reductions in U.S. interest rates, I remain concerned about the nea r-term outlook for the U.S. economy as the financial system struggles with fallout from the subprime crisis and housing prices continue to fall across the country.
Although the near-term outlook is murky and recent volatility unsettling, I believe that sometimes volatility can give us the opportunity to buy great growth companies at attractive prices. As the market sold off during July and August, we reviewed the Portfolio stock by stock. In cases where our highest conviction stocks had fallen sharply and valuations looked particularly compelling, I added to some of our existing positions. To help fund these purchases, I sold some positions that had performed relatively well during the period. While I still believed in the management and long-term
2 Janus Aspen Series December 31, 2007
(unaudited)
growth opportunities of many of these companies I sold, other high-conviction stocks appeared to offer more attractive valuations.
During the period, the Portfolio significantly increased its weighting in the technology sector. I increased our weighting based on bottom-up stock picking, not on a macro view of the technology sector. Based on in-depth research by our analyst team, I believed that some very strong technology franchises, with exciting medium- and long-term growth opportunities, were trading at undeservedly low valuations. In my opinion, many of the largest technology holdings in the Portfolio are global leaders in their respective industries. For example, during the period, the Portfolio increased positions or bought new positions in Samsung Electronics, the global leader in memory semiconductors; Ericsson, the global leader in wireless telecom infrastructure; TSMC, the global leader in semiconductor foundry; ARM Holdings, the global leader in intellectual property for mobile microprocessors; Amdocs, the global leader in telecom billing software and Sharp, the global leader in solar cells and one of the global leaders in flat panel displays.
Stocks That Aided Performance
The leading contributor during the 12-month period was Indian conglomerate Reliance Industries. Detailed industry analysis and numerous company checks by analysts Laurent Saltiel and Geoff Jay gave us confidence in the sustainability of the global petrochemicals cycle and especially the global refining cycle. With world-class assets and a strong position in the fast-growing Indian market, I believe Reliance should be able to maintain higher-than-industry margins in its petrochemicals and refining businesses and also generate high returns on investment from its large capacity expansions. In addition, Geoff's analysis of Reliance's exploration properties offshore of India's east coast indicated the potential for significant increases in the company's oil and gas reserves. I am also excited about the company's entrance into the undeveloped retail industry in India. I have been impressed with management's vision and ability to execute huge proje cts. Laurent's and Geoff's checks and analysis gave me the confidence to own a large position in Reliance during the period.
The second largest contributor to performance was Canadian fertilizer company Potash Corporation. In analyzing the company, Laurent conducted thorough checks with global fertilizer competitors and leading agriculture logistics providers, as well as key buyers of fertilizer and agricultural commodities. Laurent has forecasted an environment of very tight supply and demand and strong price increases in potash fertilizer. I have been very impressed by management and their focus on profitability. Laurent's work on Potash gave me the confidence to own a large position in the stock during the period.
China Overseas Land & Investment, one of the leading residential housing developers in China, was the third largest contributor to performance. Analyst Stephen Lew visited development projects and met with real estate companies in a number of key Chinese cities. Stephen's understanding of Chinese real estate markets and China Overseas Land & Investment's specific projects gave me a better appreciation for the company's competitive advantages in land acquisition and for the potential long-term growth of the housing market. I have been impressed by management's track record of successfully implementing its growth plans. Stephen's work gave me the conviction to own a large position in China Overseas Land & Investment during the period.
Li & Fung, a Hong Kong-based logistics provider for the apparel and consumer product sectors, was another contributor to performance. Analyst Dan Kozlowski's meetings with logistics companies and retailers helped me further appreciate Li & Fung's competitive advantages and open-ended long-term growth prospects as more and more U.S. and European retailers outsource non-core areas such as manufacturing logistics for their products. I have been impressed by the company's competitive advantages in its core business and by management's ability to find new avenues for growth. Dan's analysis gave me the conviction to further increase our position in Li & Fung during the period.
Stocks That Hindered Performance
Silicon-On-Insulator Technologies (SOITEC), the French manufacturer of silicon-on-insulator (SOI) semiconductor wafers, was the largest detractor from Portfolio performance during the period. I was disappointed by the pace of adoption of SOI technology by new semiconductor customers. Also, one of SOITEC's key end markets, high-end video game consoles, experienced weaker-than-expected sales. In hindsight, I had been overly optimistic about the growth in SOI wafers. I significantly cut the position during the period.
Arcandor A.G., a German conglomerate, was another detractor from Portfolio performance during the period. Concerns that European consumer weakness would hurt Arcandor's retail and travel businesses hurt the stock. Also, tighter global credit markets and weaker real estate markets may hinder the company's plans to divest non-core assets. I felt that management's strategy of strengthening the core businesses and focusing the portfolio was correct, and I increased the position during the period.
Melco International Development, a Hong Kong-based gaming company, also detracted from Portfolio performance during the period. Melco was hurt by startup problems for its key new casino in Macau. The company was also hurt by tighter
Janus Aspen Series December 31, 2007 3
Janus Aspen International Growth Portfolio
(unaudited)
credit markets and investor concerns about near-term overcapacity of casinos in Macau. I believe that Melco is well positioned to take advantage of the long-term growth in Macau gaming, and I held onto a meaningful position in Melco during the period.
Outlook
By nature, global stock markets often experience significant volatility. During volatile markets, such as July and August of this year, the conviction to hold onto existing positions or buy new positions is critical. My conviction comes from the tremendous, in-depth fundamental research our analyst team does on a daily basis. In this letter, I've tried to provide a few examples of the value-added research performed by our team. Laurent, Geoff, Stephen, Dan and the rest of Janus' investment team travel thousands and thousands of miles every year meeting competitors, suppliers and customers of the companies in the Portfolio. These meetings help us understand our companies better and lay the foundation for high-conviction investments in the Portfolio.
During the past 12 months, I feel that the markets and the Portfolio performed well. I consider 12 months to be a short length of time, and in future 12-month periods, the performance of the Portfolio may be considerably worse and perhaps negative. Throughout turbulent markets, I have not changed my investment approach. I believe the best way to generate solid long-term returns is to make high-conviction, long-term investments in world-class companies with exciting growth prospects trading at undeservedly low valuations. As manager of the Portfolio, my sole focus is to deliver strong, long-term performance for you. I will perform this job to the best of my ability.
Thank you for your continued investment in Janus Aspen International Growth Portfolio.
Janus Aspen International Growth Portfolio At a Glance
5 Largest Contributors to Performance – Holdings
| Contribution | |||||||
| Reliance Industries, Ltd. | 5.59 | % | |||||
| Potash Corporation of Saskatchewan, Inc. | 3.50 | % | |||||
| China Overseas Land & Investment, Ltd. | 2.08 | % | |||||
| Bunge, Ltd. | 1.84 | % | |||||
| Companhia Vale do Rio Doce (ADR) | 1.68 | % | |||||
5 Largest Detractors from Performance – Holdings
| Contribution | |||||||
| Silicon-On-Insulator Technologies (SOITEC) | (1.04 | )% | |||||
| Arcandor A.G. | (0.85 | )% | |||||
| Melco International Development, Ltd. | (0.82 | )% | |||||
| Telefonaktiebolaget L.M. Ericsson - Class B | (0.76 | )% | |||||
| Cosan S.A. Industria e Comerico | (0.63 | )% | |||||
5 Largest Contributors to Performance – Sectors
| Portfolio Contribution | Portfolio Weighting (% of Net Assets) | Morgan Stanley Capital International EAFE® Index Weighting | |||||||||||||
| Energy | 7.38 | % | 11.56 | % | 7.24 | % | |||||||||
| Financials | 6.94 | % | 16.38 | % | 28.74 | % | |||||||||
| Consumer Discretionary | 6.22 | % | 24.30 | % | 11.62 | % | |||||||||
| Materials | 5.81 | % | 4.81 | % | 9.24 | % | |||||||||
| Consumer Staples | 3.09 | % | 9.91 | % | 8.12 | % | |||||||||
5 Lowest Contributors/Detractors to Performance – Sectors
| Portfolio Contribution | Portfolio Weighting (% of Net Assets) | Morgan Stanley Capital International EAFE® Index Weighting | |||||||||||||
| Information Technology | (2.42 | )% | 18.87 | % | 5.56 | % | |||||||||
| Utilities | 0.11 | % | 0.34 | % | 5.47 | % | |||||||||
| Health Care | 0.11 | % | 3.14 | % | 6.58 | % | |||||||||
| Other* | 0.13 | % | 0.16 | % | 0.00 | % | |||||||||
| Telecommunication Services | 0.92 | % | 1.27 | % | 5.64 | % | |||||||||
* Industry not classified by Global Industry Classification Standard
4 Janus Aspen Series December 31, 2007
(unaudited)
5 Largest Equity Holdings – (% of Net Assets)
As of December 31, 2007
| Li & Fung, Ltd. Distribution/Wholesale | 5.3 | % | |||||
| Reliance Industries, Ltd. Oil Refining and Marketing | 4.8 | % | |||||
| Samsung Electronics Company, Ltd. Electronic Components - Semiconductors | 4.5 | % | |||||
| Bunge, Ltd. Agricultural Operations | 3.4 | % | |||||
| Potash Corporation of Saskatchewan, Inc. Agricultural Chemicals | 3.2 | % | |||||
| 21.2 | % | ||||||
Asset Allocation – (% of Net Assets)
As of December 31, 2007
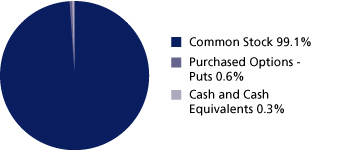
Emerging markets comprised 36.9% of total net assets.
Top Country Allocations – Long Positions (% of Investment Securities)
| As of December 31, 2007 | As of December 31, 2006 | ||||||
 |  | ||||||
Janus Aspen Series December 31, 2007 5
Janus Aspen International Growth Portfolio
(unaudited)
Performance
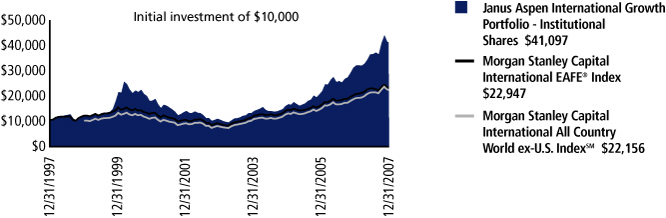
| Average Annual Total Return – for the periods ended December 31, 2007 | Expense Ratios – for the fiscal year ended December 31, 2006 | ||||||||||||||||||||||
| One Year | Five Year | Ten Year | Since Inception* | Total Annual Fund Operating Expenses | |||||||||||||||||||
| Janus Aspen International Growth Portfolio - Institutional Shares | 28.41 | % | 31.98 | % | 15.18 | % | 16.28 | % | 0.71 | % | |||||||||||||
| Janus Aspen International Growth Portfolio - Service Shares | 28.09 | % | 31.65 | % | 14.74 | % | 16.21 | % | 0.96 | % | |||||||||||||
| Janus Aspen International Growth Portfolio - Service II Shares | 28.17 | % | 31.70 | % | 14.80 | % | 16.25 | % | 0.96 | % | |||||||||||||
| Morgan Stanley Capital International EAFE® Index | 11.17 | % | 21.59 | % | 8.66 | % | 7.69 | % | |||||||||||||||
| Morgan Stanley Capital International All Country World ex-U.S. IndexSM | 16.65 | % | 24.02 | % | N/A | 9.24 | %** | ||||||||||||||||
| Lipper Quartile - Institutional Shares | 1 | st | 1 | st | 1 | st | 1 | st | |||||||||||||||
| Lipper Ranking - Institutional Shares based on total returns for Variable Annuity International Funds | 2/242 | 2/186 | 3/81 | 1/36 | |||||||||||||||||||
Visit janus.com/info to view up-to-date
performance and characteristic information
Data presented reflects past performance, which is no guarantee of future results. Investment results and principal value will fluctuate so that shares, when redeemed, may be worth more or less than their original cost. Due to market volatility, current performance may be higher or lower than the performance shown. Call 877.33JANUS or visit www.janus.com/info for performance current to the most recent month-end.
For Service II Shares, a 1% redemption fee may be imposed on shares held for 60 days or less. Performance shown does not reflect this redemption fee and, if reflected, performance would have been lower.
The Portfolio's expense ratio was determined based on average net assets as of the fiscal year ended December 31, 2006. Detailed information is available in the prospectus. All expenses are shown without the effect of expense offset arrangements. Pursuant to such arrangements, credits realized as a result of uninvested cash balances are used to reduce custodian and transfer agent expenses.
The Portfolio's performance may be affected by risks that include those associated with investments in specific industries or countries. Additional risks to the Portfolio may include those associated with investing in foreign securities, emerging markets, initial public offerings ("IPOs") and derivatives. Please see a Janus prospectus or www.janus.com/info for more information about risks, portfolio holdings and other details.
Foreign securities have additional risks including exchange rate changes, political and economic upheaval, the relative lack of information, relatively low market liquidity and the potential lack of strict financial and accounting controls and standards. These risks are magnified in emerging markets. The prices of foreign securities held by the Portfolio, and therefore the Portfolio's performance, may decline in response to such risks.
These returns do not reflect the charges and expenses of any particular insurance product or qualified plan. Returns shown would have been lower had they included insurance charges.
Janus Aspen International Growth Portfolio held approximately 13.7% and 10.0% of its net assets in Brazil and Indian securities, respectively, as of December 31, 2007 and the Portfolio has experienced significant gains due, in part, to its investments in Brazil and India. While holdings are subject to change without notice, the Portfolio's returns and NAV may be affected to a large degree by fluctuations in currency exchange rates or political or economic conditions in Brazil and India.
Returns include reinvestment of dividends from net investment income and distributions from capital gains. The returns shown do not reflect the deduction of taxes that a shareholder would pay on Portfolio distributions or the redemption of Portfolio shares.
6 Janus Aspen Series December 31, 2007
(unaudited)
Portfolio Expenses
| Expense Example - Institutional Shares | Beginning Account Value (7/1/07) | Ending Account Value (12/31/07) | Expenses Paid During Period (7/1/07-12/31/07)(1) | ||||||||||||
| Actual | $ | 1,000.00 | $ | 1,124.90 | $ | 3.75 | |||||||||
| Hypothetical (5% return before expenses) | $ | 1,000.00 | $ | 1,021.68 | $ | 3.57 | |||||||||
| Expense Example - Service Shares | Beginning Account Value (7/1/07) | Ending Account Value (12/31/07) | Expenses Paid During Period (7/1/07-12/31/07)(1) | ||||||||||||
| Actual | $ | 1,000.00 | $ | 1,123.60 | $ | 5.09 | |||||||||
| Hypothetical (5% return before expenses) | $ | 1,000.00 | $ | 1,020.42 | $ | 4.84 | |||||||||
| Expense Example - Service II Shares | Beginning Account Value (7/1/07) | Ending Account Value (12/31/07) | Expenses Paid During Period (7/1/07-12/31/07)(1) | ||||||||||||
| Actual | $ | 1,000.00 | $ | 1,124.00 | $ | 5.09 | |||||||||
| Hypothetical (5% return before expenses) | $ | 1,000.00 | $ | 1,020.42 | $ | 4.84 | |||||||||
(1) Expenses are equal to the annualized expense ratio of 0.70% for Institutional Shares, 0.95% for Service Shares and 0.95% for Service II Shares multiplied by the average account value over the period, multiplied by 184/365 (to reflect the one-half year period).
Returns shown for Service Shares and Service II Shares for periods prior to December 31, 1999 and December 31, 2001, respectively, are derived from the historical performance of Institutional Shares, adjusted to reflect the higher operating expense of Service Shares and Service II Shares.
Net dividends reinvested are the dividends that remain to be reinvested after foreign tax obligations have been met. Such obligations vary from country to country.
Lipper, a wholly-owned subsidiary of Reuters, provides independent insight on global collective investments including mutual funds, retirement funds, hedge funds, fund fees and expenses to the asset management and media communities. Lipper ranks the performance of mutual funds within a classification of funds that have similar investment objectives. Rankings are historical with capital gains and dividends reinvested and do not include the effect of loads.
Lipper ranking is for the Institutional Share class only; other classes may have different performance characteristics.
May 31, 1994 is the date used to calculate the since-inception Lipper ranking, which is slightly different from when the Portfolio began operations since Lipper provides fund rankings as of the last day of the month.
There is no assurance that the investment process will consistently lead to successful investing.
The Portfolio will invest at least 80% of its net assets in the type of securities described by its name.
See Notes to Schedule of Investments for index definitions.
The Portfolio may differ significantly from the securities held in the indices. The indices are unmanaged and not available for direct investment; therefore their performance does not reflect the expenses associated with the active management of an actual Portfolio.
See "Explanations of Charts, Tables and Financial Statements."
Effective December 21, 2007, Janus Aspen International Growth Portfolio no longer accepts investments in the Portfolio by new shareholders.
* The Portfolio's inception date – May 2, 1994
** The Morgan Stanley Capital International All Country World ex-U.S. IndexSM since inception returns are calculated from December 31, 1998.
Janus Aspen Series December 31, 2007 7
Janus Aspen International Growth Portfolio
Schedule of Investments
As of December 31, 2007
| Shares/Principal/Contract Amounts | Value | ||||||||||
| Common Stock - 99.1% | |||||||||||
| Aerospace and Defense - 1.6% | |||||||||||
| 1,055,255 | Embraer-Empresa Brasileira de Aeronautica S.A. (ADR)* | $ | 48,109,075 | ||||||||
| Agricultural Chemicals - 3.3% | |||||||||||
| 662,791 | Potash Corporation of Saskatchewan, Inc. | 96,385,812 | |||||||||
| 2,480,000 | Sinofert Holdings, Ltd. | 2,315,587 | |||||||||
| 98,701,399 | |||||||||||
| Agricultural Operations - 5.5% | |||||||||||
| 1,300,000 | BrasilAgro - Companhia Brasileira de Propriedades Agricolas*,ß | 7,307,476 | |||||||||
| 879,535 | Bunge, Ltd.** | 102,386,669 | |||||||||
| 47,318,584 | Chaoda Modern Agriculture Holdings, Ltd. | 42,846,414 | |||||||||
| 10,512,375 | China Green Holdings, Ltd. | 11,285,072 | |||||||||
| 163,825,631 | |||||||||||
| Apparel Manufacturers - 2.6% | |||||||||||
| 5,182,400 | Esprit Holdings, Ltd. | 77,102,233 | |||||||||
| Applications Software - 0.4% | |||||||||||
| 274,724 | Infosys Technologies, Ltd. | 12,337,833 | |||||||||
| Audio and Video Products - 2.9% | |||||||||||
| 1,571,500 | Sony Corp. | 86,243,208 | |||||||||
| Batteries and Battery Systems - 0.5% | |||||||||||
| 2,329,000 | BYD Company, Ltd. | 15,413,357 | |||||||||
| Beverages - Wine and Spirits - 0.9% | |||||||||||
| 4,687,108 | C&C Group PLC | 28,093,595 | |||||||||
| Broadcast Services and Programming - 0.4% | |||||||||||
| 484,669 | Grupo Televisa S.A. (ADR) | 11,520,582 | |||||||||
| Building - Residential and Commercial - 2.0% | |||||||||||
| 854,945 | Gafisa S.A. | 15,950,323 | |||||||||
| 1,210,300 | MRV Engenharia e Participacoes S.A.* | 25,886,405 | |||||||||
| 666,300 | Rossi Residencial S.A. | 17,041,400 | |||||||||
| 58,878,128 | |||||||||||
| Casino Hotels - 2.0% | |||||||||||
| 4,065,334 | Crown, Ltd.* | 47,997,070 | |||||||||
| 1,041,020 | Melco PBL Entertainment (Macau), Ltd. (ADR)* | 12,034,191 | |||||||||
| 60,031,261 | |||||||||||
| Chemicals - Diversified - 1.7% | |||||||||||
| 206,700 | K+S A.G. | 49,439,870 | |||||||||
| Commercial Banks - 3.4% | |||||||||||
| 2,160,874 | Anglo Irish Bank Corporation PLC | 34,559,326 | |||||||||
| 716,965 | Banca Generali S.P.A. | 7,204,343 | |||||||||
| 89,225 | Banco Compartamos S.A.* | 387,089 | |||||||||
| 8,536,300 | Banco de Oro | 12,489,155 | |||||||||
| 166,780 | Banco de Oro-EPCI, Inc. (GDR) (144A) | 4,889,256 | |||||||||
| 238,222 | Julius Baer Holding, Ltd. | 19,653,010 | |||||||||
| 1,228,014 | Punjab National Bank, Ltd. | 20,705,793 | |||||||||
| 99,887,972 | |||||||||||
| Commercial Services - 0.6% | |||||||||||
| 2,262,000 | Park24 Company, Ltd.*,# | 17,545,257 | |||||||||
| Computers - 0.3% | |||||||||||
| 1,216,700 | Foxconn Technology Company, Ltd. | 9,905,903 | |||||||||
| Computers - Other - 0.3% | |||||||||||
| 717,309,535 | A-Max Holdings, Ltd.*,£ | 9,659,929 | |||||||||
| Shares/Principal/Contract Amounts | Value | ||||||||||
| Computers - Peripheral Equipment - 0.8% | |||||||||||
| 678,301 | Logitech International S.A.* | $ | 24,799,186 | ||||||||
| Cosmetics and Toiletries - 1.0% | |||||||||||
| 150,209 | LG Household & Health Care, Ltd.* | 31,263,941 | |||||||||
| Dental Supplies and Equipment - 0.3% | |||||||||||
| 263,828 | Osstem Implant Company, Ltd.* | 9,067,995 | |||||||||
| Distribution/Wholesale - 5.3% | |||||||||||
| 38,744,970 | Li & Fung, Ltd. | 156,532,283 | |||||||||
| Diversified Financial Services - 0.5% | |||||||||||
| 211,212 | Reliance Capital, Ltd. | 13,865,175 | |||||||||
| Diversified Operations - 1.8% | |||||||||||
| 1,324,985 | Max India, Ltd.* | 8,818,664 | |||||||||
| 22,306,465 | Melco International Development, Ltd.* | 33,530,220 | |||||||||
| 33,571,753 | Polytec Asset Holdings, Ltd. | 9,989,415 | |||||||||
| 52,338,299 | |||||||||||
| Electric - Distribution - 0.3% | |||||||||||
| 865,055 | Equatorial Energia S.A. | 9,117,359 | |||||||||
| Electric Products - Miscellaneous - 3.0% | |||||||||||
| 4,910,000 | Sharp Corp. | 88,894,350 | |||||||||
| Electronic Components - Semiconductors - 6.7% | |||||||||||
| 25,196,171 | ARM Holdings PLC | 62,186,764 | |||||||||
| 228,324 | Samsung Electronics Company, Ltd. | 135,022,654 | |||||||||
| 179,743 | Silicon-On-Insulator Technologies (SOITEC)* | 2,194,103 | |||||||||
| 199,403,521 | |||||||||||
| Energy - Alternate Sources - 0.6% | |||||||||||
| 216,460 | Suntech Power Holdings Company, Ltd. (ADR)* | 17,818,987 | |||||||||
| Finance - Investment Bankers/Brokers - 0.8% | |||||||||||
| 1,416,600 | Nomura Holdings, Inc. | 23,856,051 | |||||||||
| Finance - Mortgage Loan Banker - 1.0% | |||||||||||
| 412,955 | Housing Development Finance Corporation, Ltd. | 30,154,307 | |||||||||
| Finance - Other Services - 2.0% | |||||||||||
| 7,223,868 | IG Group Holdings PLC | 58,232,649 | |||||||||
| Gambling - Non-Hotel - 0.2% | |||||||||||
| 360,800 | Great Canadian Gaming Corp.* | 5,667,781 | |||||||||
| General - 0.2% | |||||||||||
| 15,198,335 | Trinity, Ltd.*,ºº,§ | 6,919,941 | |||||||||
| Hotels and Motels - 0.4% | |||||||||||
| 1,291,500 | Kingdom Hotel Investments (GDR)* | 10,525,725 | |||||||||
| Insurance Brokers - 0.2% | |||||||||||
| 429,254 | Eurodekania, Ltd.*,ºº,§ | 6,275,276 | |||||||||
| Internet Connectivity Services - 0.6% | |||||||||||
| 310,100 | NDS Group PLC (ADR)* | 18,370,324 | |||||||||
| Investment Companies - 1.7% | |||||||||||
| 1,099,450 | Bradespar S.A. | 29,417,549 | |||||||||
| 2,460,276 | SM Investments Corp. | 20,210,544 | |||||||||
| 49,628,093 | |||||||||||
| Investment Management and Advisory Services - 0.3% | |||||||||||
| 1,486,480 | Bluebay Asset Management | 10,503,382 | |||||||||
| Multimedia - 0.5% | |||||||||||
| 4,065,334 | Consolidated Media Holdings, Ltd. | 14,987,933 | |||||||||
| Oil Companies - Exploration and Production - 1.9% | |||||||||||
| 629,051 | Niko Resources, Ltd. | 56,899,566 | |||||||||
See Notes to Schedule of Investments and Financial Statements.
8 Janus Aspen Series December 31, 2007
Schedule of Investments
As of December 31, 2007
| Shares/Principal/Contract Amounts | Value | ||||||||||
| Oil Companies - Integrated - 1.6% | |||||||||||
| 184,985 | Lukoil (ADR) | $ | 16,001,203 | ||||||||
| 263,760 | Petroleo Brasileiro S.A. (ADR) | 30,395,702 | |||||||||
| 46,396,905 | |||||||||||
| Oil Field Machinery and Equipment - 1.0% | |||||||||||
| 1,354,596 | Wellstream Holdings PLC* | 29,199,806 | |||||||||
| Oil Refining and Marketing - 5.1% | |||||||||||
| 105,700 | Petroplus Holdings A.G.* | 8,183,509 | |||||||||
| 1,953,139 | Reliance Industries, Ltd. | 142,865,105 | |||||||||
| 151,048,614 | |||||||||||
| Public Thoroughfares - 1.0% | |||||||||||
| 1,194,953 | Companhia de Concessoes Rodoviarias | 18,471,730 | |||||||||
| 903,160 | Obrascon Huarte Lain Brasil S.A. | 11,417,689 | |||||||||
| 29,889,419 | |||||||||||
| Real Estate Management/Services - 3.6% | |||||||||||
| 365,100 | Daito Trust Construction Company, Ltd.* | 20,269,676 | |||||||||
| 700,846 | IVG Immobilien A.G. | 23,255,251 | |||||||||
| 137,295 | Jones Lang LaSalle, Inc. | 9,769,912 | |||||||||
| 1,511,000 | Mitsubishi Estate Company, Ltd.* | 36,775,444 | |||||||||
| 79,112 | Orco Property Group | 9,429,275 | |||||||||
| 934,400 | Sao Carlos Empreendimentos e Participacoes S.A.* | 8,666,442 | |||||||||
| 108,166,000 | |||||||||||
| Real Estate Operating/Development - 10.3% | |||||||||||
| 1,052,435 | Ablon Group* | 5,435,936 | |||||||||
| 42,731,286 | Ayala Land, Inc. | 14,735,716 | |||||||||
| 1,573,740 | Brascan Residential Properties S.A. | 9,730,826 | |||||||||
| 2,856,000 | CapitaLand, Ltd. | 12,444,142 | |||||||||
| 44,672,000 | China Overseas Land & Investment, Ltd. | 92,358,840 | |||||||||
| 4,851,800 | Cyrela Brazil Realty S.A. | 65,999,753 | |||||||||
| 970,360 | Cyrela Commercial Properties S.A. Empreendimentos e Participacoes* | 6,550,885 | |||||||||
| 16,365,000 | Hang Lung Properties, Ltd. | 74,091,562 | |||||||||
| 313,935 | Iguatemi Empresa de Shopping Centers S.A. | 5,117,546 | |||||||||
| 941,105 | PDG Realty S.A. Empreendimentos e Participacoes | 13,225,197 | |||||||||
| 518,950 | Rodobens Negocios Imobiliarios S.A. | 6,169,642 | |||||||||
| 305,860,045 | |||||||||||
| Recreational Centers - 1.1% | |||||||||||
| 2,260,664 | Orascom Hotels & Development* | 33,751,857 | |||||||||
| Retail - Major Department Stores - 2.1% | |||||||||||
| 2,688,999 | Arcandor A.G.* | 63,378,044 | |||||||||
| Semiconductor Components/Integrated Circuits - 3.2% | |||||||||||
| 2,141,735 | Actions Semiconductor Company, Ltd. (ADR)* | 8,738,279 | |||||||||
| 850,670 | Marvell Technology Group, Ltd.* | 11,892,367 | |||||||||
| 37,925,437 | Taiwan Semiconductor Manufacturing Company, Ltd. | 72,515,175 | |||||||||
| 687,260 | Vimicro International Corp. (ADR)* | 2,584,098 | |||||||||
| 95,729,919 | |||||||||||
| Semiconductor Equipment - 2.2% | |||||||||||
| 1,146,105 | ASML Holding N.V.* | 36,291,203 | |||||||||
| 610,190 | KLA-Tencor Corp. | 29,386,750 | |||||||||
| 65,677,953 | |||||||||||
| Shares/Principal/Contract Amounts | Value | ||||||||||
| Sugar - 3.6% | |||||||||||
| 2,202,743 | Bajaj Hindusthan, Ltd. | $ | 16,016,138 | ||||||||
| 426,300 | Bajaj Hindusthan, Ltd. (GDR) (144A) | 3,099,244 | |||||||||
| 4,484,380 | Balrampur Chini Mills, Ltd.* | 12,858,029 | |||||||||
| 4,218,816 | Cosan, Ltd. - Class A Shares*,£ | 53,157,082 | |||||||||
| 1,570,503 | Cosan S.A. Industria e Comercio | 18,362,261 | |||||||||
| 188,869 | Shree Renuka Sugars, Ltd. | 4,844,890 | |||||||||
| 108,337,644 | |||||||||||
| Telecommunication Services - 3.7% | |||||||||||
| 2,278,505 | Amdocs, Ltd. (U.S. Shares)* | 78,540,067 | |||||||||
| 1,667,092 | Reliance Communications, Ltd. | 31,573,648 | |||||||||
| 110,113,715 | |||||||||||
| Telephone - Integrated - 0.3% | |||||||||||
| 380,915 | GVT Holdings S.A.* | 7,654,700 | |||||||||
| Transportation - Marine - 0.2% | |||||||||||
| 3,332,466 | DP World, Ltd.* | 3,965,635 | |||||||||
| 231,390 | Star Asia Financial, Ltd. (144A)ºº,§ | 2,545,290 | |||||||||
| 6,510,925 | |||||||||||
| Wireless Equipment - 1.6% | |||||||||||
| 20,221,849 | Telefonaktiebolaget L.M. Ericsson - Class B | 47,219,992 | |||||||||
| Total Common Stock (cost $2,077,694,522) | 2,950,752,895 | ||||||||||
| Purchased Options - Puts - 0.6% | |||||||||||
| 604,673 | iShares MSCI Emerging Markets Index expires April 2008 exercise price $149.20 | 6,924,782 | |||||||||
| 5,668 | iShares MSCI Emerging Markets Index expires April 2008 exercise price $157.69 | 9,799,972 | |||||||||
| Total Purchased Options - Puts (premiums paid $16,753,915) | 16,724,754 | ||||||||||
| Rights - 0% | |||||||||||
| Sugar - 0% | |||||||||||
| 684,268 | Cosan S.A. Industria e Comercio expires - 1/5/08 (cost $0) | 34,617 | |||||||||
| Money Markets - 0.4% | |||||||||||
| 10,032,986 | Janus Institutional Cash Management Fund - Institutional Shares, 4.98% | 10,032,986 | |||||||||
| 640,000 | Janus Institutional Money Market Fund - Institutional Shares, 4.91% | 640,000 | |||||||||
| Total Money Markets (cost $10,672,986) | 10,672,986 | ||||||||||
| Other Securities - 0.4% | |||||||||||
| 8,543,975 | Allianz Dresdner Daily Asset Fund† | 8,543,975 | |||||||||
| 2,081,000 | Repurchase Agreements† | 2,081,000 | |||||||||
| 1,600,025 | Time Deposits† | 1,600,025 | |||||||||
| Total Other Securities (cost $12,225,000) | 12,225,000 | ||||||||||
| Total Investments (total cost $2,117,346,423) – 100.5% | 2,990,410,252 | ||||||||||
| Liabilities, net of Cash, Receivables and Other Assets – (0.5)% | (14,287,481 | ) | |||||||||
| Net Assets – 100% | $ | 2,976,122,771 | |||||||||
See Notes to Schedules of Investments and Financial Statements.
Janus Aspen Series December 31, 2007 9
Janus Aspen International Growth Portfolio
Schedule of Investments
As of December 31, 2007
Summary of Investments by Country – (Long Positions)
| Country | Value | % of Investment Securities | |||||||||
| Australia | $ | 62,985,003 | 2.1 | % | |||||||
| Bermuda | 371,174,140 | 12.4 | % | ||||||||
| Brazil | 407,783,658 | 13.6 | % | ||||||||
| Canada | 158,953,159 | 5.3 | % | ||||||||
| Cayman Islands | 92,502,917 | 3.1 | % | ||||||||
| China | 15,413,357 | 0.5 | % | ||||||||
| Egypt | 33,751,857 | 1.1 | % | ||||||||
| France | 2,194,103 | 0.1 | % | ||||||||
| Germany | 136,073,165 | 4.6 | % | ||||||||
| Hong Kong | 218,934,754 | 7.3 | % | ||||||||
| Hungary | 5,435,936 | 0.2 | % | ||||||||
| India | 297,138,828 | 9.9 | % | ||||||||
| Ireland | 62,652,921 | 2.1 | % | ||||||||
| Italy | 7,204,343 | 0.2 | % | ||||||||
| Japan | 273,583,986 | 9.2 | % | ||||||||
| Luxembourg | 9,429,275 | 0.3 | % | ||||||||
| Mexico | 11,907,671 | 0.4 | % | ||||||||
| Netherlands | 36,291,203 | 1.2 | % | ||||||||
| Philippines | 52,324,671 | 1.8 | % | ||||||||
| Russia | 16,001,202 | 0.5 | % | ||||||||
| Singapore | 12,444,142 | 0.4 | % | ||||||||
| South Korea | 175,354,590 | 5.9 | % | ||||||||
| Sweden | 47,219,992 | 1.6 | % | ||||||||
| Switzerland | 52,635,704 | 1.8 | % | ||||||||
| Taiwan | 82,421,079 | 2.8 | % | ||||||||
| United Arab Emirates | 3,965,635 | 0.1 | % | ||||||||
| United Kingdom | 263,308,269 | 8.8 | % | ||||||||
| United States†† | 81,324,692 | 2.7 | % | ||||||||
| Total | $ | 2,990,410,252 | 100.0 | % | |||||||
††Includes Short-Term Securities and Other Securities (2.0% excluding Short-Term Securities and Other Securities)
See Notes to Schedules of Investments and Financial Statements.
10 Janus Aspen Series December 31, 2007
Statement of Assets and Liabilities
| As of December 31, 2007 (all numbers in thousands except net asset value per share) | Janus Aspen International Growth Portfolio | ||||||
| Assets: | |||||||
| Investments at cost(1) | $ | 2,117,346 | |||||
| Investments at value(1) | $ | 2,979,737 | |||||
| Affiliated money market investments | 10,673 | ||||||
| Cash denominated in foreign currency (cost $373) | 375 | ||||||
| Receivables: | |||||||
| Investments sold | 1,338 | ||||||
| Portfolio shares sold | 1,366 | ||||||
| Dividends | 1,547 | ||||||
| Interest | 66 | ||||||
| Non-interested Trustees' deferred compensation | 48 | ||||||
| Other assets | 32 | ||||||
| Total Assets | 2,995,182 | ||||||
| Liabilities: | |||||||
| Payables: | |||||||
| Collateral for securities loaned (Note 1) | 12,225 | ||||||
| Due to custodian | 425 | ||||||
| Investments purchased | 347 | ||||||
| Portfolio shares repurchased | 2,676 | ||||||
| Advisory fees | 1,614 | ||||||
| Transfer agent fees and expenses | 1 | ||||||
| Distribution fees - Service Shares | 329 | ||||||
| Distribution fees - Service II Shares | 93 | ||||||
| Non-interested Trustees' fees and expenses | 17 | ||||||
| Non-interested Trustees' deferred compensation fees | 48 | ||||||
| Foreign tax liability | 1,049 | ||||||
| Accrued expenses | 235 | ||||||
| Total Liabilities | 19,059 | ||||||
| Net Assets | $ | 2,976,123 | |||||
| Net Assets Consist of: | |||||||
| Capital (par value and paid-in-surplus)* | $ | 1,740,415 | |||||
| Undistributed net investment income/(loss)* | (8,870 | ) | |||||
| Undistributed net realized gain/(loss) from investments and foreign currency transactions* | 372,544 | ||||||
| Unrealized net appreciation/(depreciation) of investments, foreign currency translations and non-interested Trustees' deferred compensation(2) | 872,034 | ||||||
| Total Net Assets | $ | 2,976,123 | |||||
| Net Assets - Institutional Shares | $ | 987,570 | |||||
| Shares Outstanding, $0.001 Par Value (unlimited shares authorized) | 15,109 | ||||||
| Net Asset Value Per Share | $ | 65.36 | |||||
| Net Assets - Service Shares | $ | 1,549,980 | |||||
| Shares Outstanding, $0.001 Par Value (unlimited shares authorized) | 24,007 | ||||||
| Net Asset Value Per Share | $ | 64.56 | |||||
| Net Assets - Service II Shares | $ | 438,573 | |||||
| Shares Outstanding, $0.001 Par Value (unlimited shares authorized) | 6,765 | ||||||
| Net Asset Value Per Share | $ | 64.83 | |||||
*See Note 3 in Notes to Financial Statements.
(1) Investments at cost and value include $11,566,549 of securities loaned (Note 1).
(2) Net of foreign taxes on investments of $1,049,131.
See Notes to Financial Statements.
Janus Aspen Series December 31, 2007 11
Statement of Operations
| For the fiscal year ended December 31, 2007 (all numbers in thousands) | Janus Aspen International Growth Portfolio | ||||||
| Investment Income: | |||||||
| Interest | $ | 29 | |||||
| Securities lending income | 513 | ||||||
| Dividends | 36,816 | ||||||
| Dividends from affiliates | 1,031 | ||||||
| Foreign tax withheld | (2,130 | ) | |||||
| Total Investment Income | 36,259 | ||||||
| Expenses: | |||||||
| Advisory fees | 16,657 | ||||||
| Transfer agent fees and expenses | 8 | ||||||
| Registration fees | 23 | ||||||
| Custodian fees | 1,004 | ||||||
| Professional fees | 16 | ||||||
| Non-interested Trustees' fees and expenses | 76 | ||||||
| Printing expenses | 321 | ||||||
| Legal fees | 7 | ||||||
| System fees | 19 | ||||||
| Distribution fees - Service Shares | 3,316 | ||||||
| Distribution fees - Service II Shares | 909 | ||||||
| Other expenses | 129 | ||||||
| Non-recurring costs (Note 2) | – | ||||||
| Costs assumed by Janus Capital Management LLC (Note 2) | – | ||||||
| Total Expenses | 22,485 | ||||||
| Expense and Fee Offset | (1 | ) | |||||
| Net Expenses | 22,484 | ||||||
| Net Investment Income/(Loss) | 13,775 | ||||||
| Net Realized and Unrealized Gain/(Loss) on Investments: | |||||||
| Net realized gain/(loss) from investment and foreign currency transactions | 501,878 | ||||||
| Net realized gain/(loss) from options contracts | (3,924 | ) | |||||
| Change in unrealized net appreciation/(depreciation) of investments, foreign currency translations and non-interested Trustees' deferred compensation(1) | 129,753 | ||||||
| Payment from affiliate (Note 2) | 1 | ||||||
| Net Gain/(Loss) on Investments | 627,708 | ||||||
| Net Increase/(Decrease) in Net Assets Resulting from Operations | $ | 641,483 | |||||
(1) Net of foreign taxes on investments of $1,049,131.
See Notes to Financial Statements.
12 Janus Aspen Series December 31, 2007
Statements of Changes in Net Assets
| For the fiscal years ended December 31 | Janus Aspen International Growth Portfolio | ||||||||||
| (all numbers in thousands) | 2007 | 2006 | |||||||||
| Operations: | |||||||||||
| Net investment income/(loss) | $ | 13,775 | $ | 27,038 | |||||||
| Net realized gain/(loss) from investment and foreign currency transactions | 501,878 | 304,159 | |||||||||
| Net realized gain/(loss) from options contracts | (3,924 | ) | – | ||||||||
| Change in unrealized net appreciation/(depreciation) of investments, foreign currency translations and non-interested Trustees' deferred compensation | 129,753 | 324,983 | |||||||||
| Payment from affiliate (Note 2) | 1 | 9 | |||||||||
| Net Increase/(Decrease) in Net Assets Resulting from Operations | 641,483 | 656,189 | |||||||||
| Dividends and Distributions to Shareholders: | |||||||||||
| Net investment income* | |||||||||||
| Institutional Shares | (5,732 | ) | (13,793 | ) | |||||||
| Service Shares | (6,080 | ) | (15,757 | ) | |||||||
| Service II Shares | (1,670 | ) | (4,335 | ) | |||||||
| Net realized gain from investment transactions* | |||||||||||
| Institutional Shares | – | – | |||||||||
| Service Shares | – | – | |||||||||
| Service II Shares | – | – | |||||||||
| Net Decrease from Dividends and Distributions | (13,482 | ) | (33,885 | ) | |||||||
| Capital Share Transactions: | |||||||||||
| Shares sold | |||||||||||
| Institutional Shares | 142,916 | 233,326 | |||||||||
| Service Shares | 342,951 | 236,692 | |||||||||
| Service II Shares | 136,029 | 151,658 | |||||||||
| Redemption fees | |||||||||||
| Service II Shares | 151 | 69 | |||||||||
| Reinvested dividends and distributions | |||||||||||
| Institutional Shares | 5,732 | 13,793 | |||||||||
| Service Shares | 6,080 | 15,757 | |||||||||
| Service II Shares | 1,670 | 4,335 | |||||||||
| Shares repurchased | |||||||||||
| Institutional Shares | (226,668 | ) | (204,513 | ) | |||||||
| Service Shares | (193,009 | ) | (116,835 | ) | |||||||
| Service II Shares | (89,116 | ) | (33,625 | ) | |||||||
| Net Increase/(Decrease) from Capital Share Transactions | 126,736 | 300,657 | |||||||||
| Net Increase/(Decrease) in Net Assets | 754,737 | 922,961 | |||||||||
| Net Assets: | |||||||||||
| Beginning of period | 2,221,386 | 1,298,425 | |||||||||
| End of period | $ | 2,976,123 | $ | 2,221,386 | |||||||
| Undistributed net investment income/(loss)* | $ | (8,870 | ) | $ | (13,232 | ) | |||||
* See Note 3 in Notes to Financial Statements.
See Notes to Financial Statements.
Janus Aspen Series December 31, 2007 13
Financial Highlights
Institutional Shares
| For a share outstanding during each | Janus Aspen International Growth Portfolio | ||||||||||||||||||||||
| fiscal year ended December 31 | 2007 | 2006 | 2005 | 2004 | 2003 | ||||||||||||||||||
| Net Asset Value, Beginning of Period | $ | 51.21 | $ | 35.54 | $ | 27.19 | $ | 23.06 | $ | 17.30 | |||||||||||||
| Income from Investment Operations: | |||||||||||||||||||||||
| Net investment income/(loss) | .50 | .56 | .41 | .30 | .24 | ||||||||||||||||||
| Net gain/(loss) on securities (both realized and unrealized) | 14.02 | 15.97 | 8.30 | 4.05 | 5.75 | ||||||||||||||||||
| Total from Investment Operations | 14.52 | 16.53 | 8.71 | 4.35 | 5.99 | ||||||||||||||||||
| Less Distributions and Other: | |||||||||||||||||||||||
| Dividends (from net investment income)* | (.37 | ) | (.86 | ) | (.36 | ) | (.22 | ) | (.23 | ) | |||||||||||||
| Distributions (from capital gains)* | – | – | – | – | – | ||||||||||||||||||
| Payment from affiliate | – | (1) | – | (1) | – | – | (1) | – | |||||||||||||||
| Total Distributions and Other | (.37 | ) | (.86 | ) | (.36 | ) | (.22 | ) | (.23 | ) | |||||||||||||
| Net Asset Value, End of Period | $ | 65.36 | $ | 51.21 | $ | 35.54 | $ | 27.19 | $ | 23.06 | |||||||||||||
| Total Return | 28.41 | %(2) | 46.98 | %(2) | 32.28 | % | 18.99 | %(2) | 34.91 | % | |||||||||||||
| Net Assets, End of Period (in thousands) | $ | 987,570 | $ | 844,734 | $ | 549,948 | $ | 465,055 | $ | 637,918 | |||||||||||||
| Average Net Assets for the Period (in thousands) | $ | 915,608 | $ | 691,150 | $ | 473,781 | $ | 556,677 | $ | 595,791 | |||||||||||||
| Ratio of Gross Expenses to Average Net Assets(3)(4) | 0.70 | % | 0.71 | % | 0.70 | % | 0.69 | % | 0.76 | % | |||||||||||||
| Ratio of Net Expenses to Average Net Assets(4) | 0.70 | % | 0.71 | % | 0.70 | % | 0.68 | % | 0.76 | % | |||||||||||||
| Ratio of Net Investment Income/(Loss) to Average Net Assets | 0.70 | % | 1.79 | % | 1.05 | % | 1.02 | % | 1.26 | % | |||||||||||||
| Portfolio Turnover Rate | 59 | % | 60 | % | 57 | % | 65 | % | 123 | % | |||||||||||||
Service Shares
| For a share outstanding during each | Janus Aspen International Growth Portfolio | ||||||||||||||||||||||
| fiscal year ended December 31 | 2007 | 2006 | 2005 | 2004 | 2003 | ||||||||||||||||||
| Net Asset Value, Beginning of Period | $ | 50.62 | $ | 35.17 | $ | 26.94 | $ | 22.89 | $ | 17.18 | |||||||||||||
| Income from Investment Operations: | |||||||||||||||||||||||
| Net investment income/(loss) | .38 | .46 | .31 | .20 | .18 | ||||||||||||||||||
| Net gain/(loss) on securities (both realized and unrealized) | 13.82 | 15.79 | 8.24 | 4.05 | 5.71 | ||||||||||||||||||
| Total from Investment Operations | 14.20 | 16.25 | 8.55 | 4.25 | 5.89 | ||||||||||||||||||
| Less Distributions and Other: | |||||||||||||||||||||||
| Dividends (from net investment income)* | (.26 | ) | (.80 | ) | (.32 | ) | (.20 | ) | (.18 | ) | |||||||||||||
| Distributions (from capital gains)* | – | – | – | – | – | ||||||||||||||||||
| Payment from affiliate | – | – | (1) | – | (1) | – | (1) | – | |||||||||||||||
| Total Distributions and Other | (.26 | ) | (.80 | ) | (.32 | ) | (.20 | ) | (.18 | ) | |||||||||||||
| Net Asset Value, End of Period | $ | 64.56 | $ | 50.62 | $ | 35.17 | $ | 26.94 | $ | 22.89 | |||||||||||||
| Total Return | 28.09 | % | 46.66 | %(2) | 31.94 | %(2) | 18.69 | %(2) | 34.53 | % | |||||||||||||
| Net Assets, End of Period (in thousands) | $ | 1,549,980 | $ | 1,072,922 | $ | 635,357 | $ | 498,735 | $ | 457,965 | |||||||||||||
| Average Net Assets for the Period (in thousands) | $ | 1,326,458 | $ | 826,815 | $ | 523,662 | $ | 457,088 | $ | 391,922 | |||||||||||||
| Ratio of Gross Expenses to Average Net Assets(3)(4) | 0.95 | % | 0.96 | % | 0.95 | % | 0.94 | % | 1.01 | % | |||||||||||||
| Ratio of Net Expenses to Average Net Assets(4) | 0.95 | % | 0.96 | % | 0.95 | % | 0.93 | % | 1.01 | % | |||||||||||||
| Ratio of Net Investment Income/(Loss) to Average Net Assets | 0.44 | % | 1.49 | % | 0.78 | % | 0.77 | % | 0.99 | % | |||||||||||||
| Portfolio Turnover Rate | 59 | % | 60 | % | 57 | % | 65 | % | 123 | % | |||||||||||||
* See Note 3 in Notes to Financial Statements.
(1) Payment from affiliate aggregated less than $.01 on a per share basis for the fiscal year ended.
(2) During the fiscal year ended, Janus Capital and/or Janus Services LLC fully reimbursed the Portfolio for a loss on a transaction resulting from certain trading, pricing and/or shareholder activity errors, which otherwise would have reduced total return by less than 0.01%.
(3) The effect of non-recurring costs assumed by Janus Capital (Note 2) is included in the ratio of gross expenses to average net assets and was less than 0.01% for the fiscal years ended 2007, 2006, 2005 and 2004.
(4) See "Explanation of Charts, Tables, and Financial Statements."
See Notes to Financial Statements.
14 Janus Aspen Series December 31, 2007
Service II Shares
| For a share outstanding during each | Janus Aspen International Growth Portfolio | ||||||||||||||||||||||
| fiscal year ended December 31 | 2007 | 2006 | 2005 | 2004 | 2003 | ||||||||||||||||||
| Net Asset Value, Beginning of Period | $ | 50.80 | $ | 35.38 | $ | 27.11 | $ | 23.02 | $ | 17.27 | |||||||||||||
| Income from Investment Operations: | |||||||||||||||||||||||
| Net investment income/(loss) | .38 | .49 | .30 | .20 | .17 | ||||||||||||||||||
| Net gain/(loss) on securities (both realized and unrealized) | 13.89 | 15.85 | 8.31 | 4.08 | 5.75 | ||||||||||||||||||
| Total from Investment Operations | 14.27 | 16.34 | 8.61 | 4.28 | 5.92 | ||||||||||||||||||
| Less Distributions and Other: | |||||||||||||||||||||||
| Dividends (from net investment income)* | (.26 | ) | (.94 | ) | (.34 | ) | (.20 | ) | (.18 | ) | |||||||||||||
| Distributions (from capital gains)* | – | – | – | – | – | ||||||||||||||||||
| Redemption fees | .02 | .02 | – | (1) | .01 | .01 | |||||||||||||||||
| Payment from affiliate | – | (2) | – | (2) | – | (2) | – | (2) | – | ||||||||||||||
| Total Distributions and Other | (.24 | ) | (.92 | ) | (.34 | ) | (.19 | ) | (.17 | ) | |||||||||||||
| Net Asset Value, End of Period | $ | 64.83 | $ | 50.80 | $ | 35.38 | $ | 27.11 | $ | 23.02 | |||||||||||||
| Total Return | 28.17 | %(3) | 46.70 | %(3) | 31.97 | %(3) | 18.75 | %(3) | 34.55 | % | |||||||||||||
| Net Assets, End of Period (in thousands) | $ | 438,573 | $ | 303,730 | $ | 113,120 | $ | 72,194 | $ | 60,206 | |||||||||||||
| Average Net Assets for the Period (in thousands) | $ | 363,622 | $ | 186,734 | $ | 82,746 | $ | 63,943 | $ | 47,299 | |||||||||||||
| Ratio of Gross Expenses to Average Net Assets(4)(5) | 0.95 | % | 0.96 | % | 0.95 | % | 0.94 | % | 1.01 | % | |||||||||||||
| Ratio of Net Expenses to Average Net Assets(5) | 0.95 | % | 0.95 | % | 0.95 | % | 0.93 | % | 1.01 | % | |||||||||||||
| Ratio of Net Investment Income/(Loss) to Average Net Assets | 0.42 | % | 1.26 | % | 0.78 | % | 0.79 | % | 0.98 | % | |||||||||||||
| Portfolio Turnover Rate | 59 | % | 60 | % | 57 | % | 65 | % | 123 | % | |||||||||||||
* See Note 3 in Notes to Financial Statements.
(1) Redemption fees aggregated less than $.01 on a per share basis for the fiscal year ended.
(2) Payment from affiliate aggregated less than $.01 on a per share basis for the fiscal year ended.
(3) During the fiscal year ended, Janus Capital and/or Janus Services LLC fully reimbursed the Portfolio for a loss on a transaction resulting from certain trading, pricing and/or shareholder activity errors, which otherwise would have reduced total return by less than 0.01%.
(4) The effect of non-recurring costs assumed by Janus Capital (Note 2) is included in the ratio of gross expenses to average net assets and was less than 0.01% for the fiscal years ended 2007, 2006, 2005 and 2004.
(5) See "Explanation of Charts, Tables, and Financial Statements."
See Notes to Financial Statements.
Janus Aspen Series December 31, 2007 15
Notes to Schedule of Investments
| Lipper Variable Annuity International Funds | Funds that invest their assets in securities with primary trading markets outside of the United States. | ||||||
| Morgan Stanley Capital International All Country World ex-U.S. IndexSM | Is an unmanaged, free float-adjusted, market capitalization weighted index composed of stocks of companies located in countries throughout the world, excluding the United States. It is designed to measure equity market performance in global developed and emerging markets outside the United States. The index includes reinvestment of dividends, net of foreign withholding taxes. | ||||||
| Morgan Stanley Capital International EAFE® Index | Is a free float-adjusted market capitalization weighted index designed to measure developed market equity performance. The MSCI EAFE® Index is composed of companies representative of the market structure of developed market countries. The index includes reinvestment of dividends, net of foreign withholding taxes. | ||||||
| 144A | Securities sold under Rule 144A of the Securities Act of 1933, as amended, are subject to legal and/or contractual restrictions on resale and may not be publicly sold without registration under the 1933 Act. | ||||||
| ADR | American Depositary Receipt | ||||||
| GDR | Global Depositary Receipt | ||||||
| PLC | Public Limited Company | ||||||
| U.S. Shares | Securities of foreign companies trading on an American Stock Exchange. | ||||||
* Non-income-producing security.
** A portion of this security has been segregated by the custodian to cover margin or segregation requirements on open futures contracts, forward currency contracts, options contracts, short sales and/or securities with extended settlement dates.
ß Security is illiquid.
# Loaned security; a portion or all of the security is on loan at December 31, 2007.
† The security is purchased with the cash collateral received from securities on loan (Note 1).
ºº Schedule of Fair Valued Securities (as of December 31, 2007)
| Value | Value as a % of Net Assets | ||||||||||
| Janus Aspen International Growth Portfolio | |||||||||||
| Eurodekania, Ltd. | $ | 6,275,276 | 0.2 | % | |||||||
| Star Asia Financial, Ltd. (144A) | 2,545,290 | 0.1 | % | ||||||||
| Trinity, Ltd. | 6,919,941 | 0.2 | % | ||||||||
| $ | 15,740,507 | 0.5 | % | ||||||||
Securities are valued at "fair value" pursuant to procedures adopted by the Portfolio's Trustees. The Schedule of Fair Valued Securities does not include international activities fair valued pursuant to a systematic fair valuation model.
§ Schedule of Restricted and Illiquid Securities (as of December 31, 2007)
| Acquisition Date | Acquisition Cost | Value | Value as % of Net Assets | ||||||||||||||||
| Janus Aspen International Growth Portfolio | |||||||||||||||||||
| Eurodekania, Ltd.ºº | 3/8/07 | $ | 5,628,245 | $ | 6,275,276 | 0.2 | % | ||||||||||||
| Star Asia Financial, Ltd. (144A)ºº | 2/22/07 - 6/22/07 | 2,399,730 | 2,545,290 | 0.1 | % | ||||||||||||||
| Trinity, Ltd.ºº | 11/14/07 | 6,995,780 | 6,919,941 | 0.2 | % | ||||||||||||||
| $ | 15,023,755 | $ | 15,740,507 | 0.5 | % | ||||||||||||||
The Portfolio has registration rights for certain restricted securities held as of December 31, 2007. The issuer incurs all registration costs.
16 Janus Aspen Series December 31, 2007
£ The Investment Company Act of 1940, as amended, defines affiliates as those companies in which a fund holds 5% or more of the outstanding voting securities at any time during the fiscal year ended December 31, 2007.
| Purchases | Sales | Realized | Dividend | Value | |||||||||||||||||||||||||||
| Shares | Cost | Shares | Cost | Gain/(Loss) | Income | at 12/31/07 | |||||||||||||||||||||||||
| Janus Aspen International Growth Portfolio | |||||||||||||||||||||||||||||||
| A-Max Holdings, Ltd.* | 717,309,535 | $ | 12,089,271 | – | $ | – | $ | – | $ | – | $ | 9,659,929 | |||||||||||||||||||
| Cosan, Ltd. - Class A Shares | 5,222,501 | 54,836,261 | 1,003,685 | 10,538,693 | 749,093 | – | 53,157,082 | ||||||||||||||||||||||||
| $ | 66,925,532 | $ | 10,538,693 | $ | 749,093 | $ | – | $ | 62,817,011 | ||||||||||||||||||||||
Aggregate collateral segregated to cover margin or segregation requirements on open futures contracts, forward currency contracts, options contracts, short sales and/or securities with extended settlement dates as of December 31, 2007 is noted below.
| Portfolio | Aggregate Value | ||||||
| Janus Aspen International Growth Portfolio | $ | 7,566,650 | |||||
Janus Aspen Series December 31, 2007 17
Notes to Financial Statements
The following section describes the organization and significant accounting policies and provides more detailed information about the schedules and tables that appear throughout this report. In addition, the Notes to Financial Statements explain the methods used in preparing and presenting this report.
1. ORGANIZATION AND SIGNIFICANT ACCOUNTING POLICIES
Janus Aspen International Growth Portfolio (the "Portfolio") is a series fund. The Portfolio is part of Janus Aspen Series (the "Trust"), which is organized as a Delaware statutory trust and is registered under the Investment Company Act of 1940, as amended, (the "1940 Act") as an open-end management investment company. The Trust offers seventeen Portfolios, which include multiple series of shares, with differing investment objectives and policies. The Portfolio invests primarily in equity securities. The Portfolio is classified as diversified, as defined in the 1940 Act. The Portfolio is a no-load investment.
The Portfolio currently offers three classes of shares: Institutional Shares, Service Shares and Service II Shares. Institutional Shares are offered only in connection with investment in and payments under variable insurance contracts and to qualified retirement plans. Service Shares and Service II Shares are offered only in connection with investment in and payments under variable insurance contracts and to qualified retirement plans that require a fee from Portfolio assets to procure distribution and administrative services to contract owners and plan participants. For Service II Shares, a redemption fee may be imposed on interests in separate accounts or plans held 60 days or less.
The following accounting policies have been consistently followed by the Portfolio and are in conformity with accounting principles generally accepted in the United States of America in the investment company industry.
Investment Valuation
Securities are valued at the last sales price or the official closing price for securities traded on a principal securities exchange (U.S. or foreign) and on the NASDAQ National Market. Securities traded on over-the-counter markets and listed securities for which no sales are reported are valued at the latest bid price (or yield equivalent thereof) obtained from one or more dealers transacting in a market for such securities or by a pricing service approved by the Portfolio's Trustees. Short-term securities with maturities of 60 days or less may be valued at amortized cost, which approximates market value. Debt securities with a remaining maturity of greater than 60 days are valued in accordance with the evaluated bid price supplied by the pricing service. The evaluated bid price supplied by the pricing service is an evaluation that reflects such factors as security prices, yields, maturities and ratings. Foreign securities and currencies ar e converted to U.S. dollars using the applicable exchange rate in effect as of the daily close of the New York Stock Exchange ("NYSE"). When market quotations are not readily available or deemed unreliable, or events or circumstances that may affect the value of portfolio securities held by the Portfolio are identified between the closing of their principal markets and the time the net asset value ("NAV") is determined, securities may be valued at fair value as determined in good faith under procedures established by and under the supervision of the Portfolio's Trustees. Circumstances in which fair value pricing may be utilized include, but are not limited to: (i) when significant events occur which may affect the securities of a single issuer, such as mergers, bankruptcies, or significant issuer specific developments; (ii) when significant events occur which may affect an entire market, such as natural disasters or significant governmen tal actions; and (iii) when non-significant events occur such as markets closing early or not opening, security trading halts, or pricing of non-valued securities and restricted or non-public securities. The Portfolio may use a systematic fair valuation model provided by an independent third party to value international equity securities in order to adjust for stale pricing, which may occur between the close of certain foreign exchanges and the NYSE.
Investment Transactions and Investment Income
Investment transactions are accounted for as of the date purchased or sold (trade date). Dividend income is recorded on the ex-dividend date. Certain dividends from foreign securities will be recorded as soon as the Trust is informed of the dividend if such information is obtained subsequent to the ex-dividend date. Dividends from foreign securities may be subject to withholding taxes in foreign jurisdictions. Interest income is recorded on the accrual basis and includes amortization of premiums and accretion of discounts. Gains and losses are determined on the identified cost basis, which is the same basis used for federal income tax purposes. Income, as well as gains and losses, both realized and unrealized, are allocated daily to each class of shares based upon the ratio of net assets represented by each class as a percentage of total net assets.
Expenses
The Portfolio bears expenses incurred specifically on its behalf as well as a portion of general expenses. Each class of shares bears expenses incurred specifically on its behalf and, in addition, each class bears a portion of general expenses, which may be based upon relative net assets of each class. Expenses are allocated daily to each class of shares based upon the ratio of net assets represented by each class as a percentage of total net assets. Expenses directly attributable to a specific class of shares are charged against the operations of such class.
Securities Lending
Under procedures adopted by the Trustees, the Portfolio may lend securities to qualified parties (typically brokers or other financial institutions) who need to borrow securities in order to complete certain transactions such as covering short sales, avoiding failures to deliver securities or completing arbitrage activities. The Portfolio may seek to earn additional income through securities lending. There is the risk of delay in recovering a loaned security or the risk of loss in collateral rights if the borrower fails financially. Janus Capital
18 Janus Aspen Series December 31, 2007
Management LLC ("Janus Capital") makes efforts to balance the benefits and risks from granting such loans.
State Street Bank and Trust Company served as the Portfolio's lending agent for the period January 1, 2007 through May 24, 2007. Effective May 25, 2007, Dresdner Bank AG became the lending agent for the Portfolio.
The Portfolio does not have the right to vote on securities while they are being lent; however, the Portfolio may attempt to call back the loan and vote the proxy if time permits. All loans will be continuously secured by collateral which may consist of cash, U.S. Government securities, domestic and foreign short-term debt instruments, letters of credit, time deposits, repurchase agreements, or such other collateral permitted by the Securities and Exchange Commission ("SEC"). Cash collateral may be invested in affiliated money market funds or other accounts advised by Janus Capital to the extent consistent with exemptive relief obtained from the SEC or as permitted by the 1940 Act and rules promulgated thereunder.
Dresdner Bank AG (the "Lending Agent") may also invest the cash collateral in the Allianz Dresdner Daily Asset Fund or investments in unaffiliated money market funds or accounts, mutually agreed to by the Portfolio and the Lending Agent, that comply with Rule 2a-7 of the 1940 Act relating to money market funds.
As of December 31, 2007, the Portfolio had on loan securities valued as indicated:
| Portfolio | Value at December 31, 2007 | ||||||
| Janus Aspen International Growth Portfolio | $ | 11,566,549 | |||||
As of December 31, 2007, the Portfolio received cash collateral for securities lending activity as indicated:
| Portfolio | Cash Collateral at December 31, 2007 | ||||||
| Janus Aspen International Growth Portfolio | $ | 12,225,000 | |||||
As of December 31, 2007, all cash collateral received by the Portfolio was invested in the Allianz Dresdner Daily Asset Fund, except for $2,081,000 and $1,600,025 which were invested in Repurchase Agreements and Time Deposits, respectively.
The value of the collateral must be at least 102% of the market value of the loaned securities that are denominated in U.S. dollars and 105% of the market value of the loaned securities that are not denominated in U.S. dollars. Loaned securities and related collateral are marked-to-market each business day based upon the market value of the loaned securities at the close of business, employing the most recent available pricing information. Collateral levels are then adjusted based on this mark-to-market evaluation.
The borrower pays fees at the Portfolio's direction to the Lending Agent. The Lending Agent may retain a portion of the interest earned on the cash collateral invested. The cash collateral invested by the Lending Agent is disclosed in the Schedule of Investments (if applicable). The lending fees and the Portfolio's portion of the interest income earned on cash collateral are included on the Statement of Operations (if applicable).
Interfund Lending
Pursuant to an exemptive order received from the SEC, the Portfolio may be party to an interfund lending agreement between the Portfolio and other Janus Capital sponsored mutual funds, which permits it to borrow or lend cash at a rate beneficial to both the borrowing and lending funds. Outstanding borrowings from all sources totaling 10% or more of the borrowing Portfolio's total assets must be collateralized at 102% of the outstanding principal value of the loan; loans of less than 10% may be unsecured. During the fiscal year ended December 31, 2007, there were no outstanding interfund borrowing or lending arrangements for the Portfolio.
Forward Currency Transactions
The Portfolio may enter into forward currency contracts in order to reduce its exposure to changes in foreign currency exchange rates on its foreign portfolio holdings and to lock in the U.S. dollar cost of firm purchase and sale commitments for securities denominated in or exposed to foreign currencies. A forward currency exchange contract is a commitment to purchase or sell a foreign currency at a future date at a negotiated rate. The gain or loss arising from the difference between the U.S. dollar cost of the original contract and the value of the foreign currency in U.S. dollars upon closing a contract is included in "Net realized gain/(loss) from investment and foreign currency transactions" on the Statement of Operations (if applicable).
Forward currency contracts held by the Portfolio are fully collateralized by other securities, which are denoted in the accompanying Schedule of Investments (if applicable). The collateral is evaluated daily to ensure its market value equals or exceeds the current market value of the corresponding forward currency contracts. As of December 31, 2007, the Portfolio was not invested in forward foreign currency contracts.
Futures Contracts
The Portfolio may enter into futures contracts to gain exposure to the stock market pending investment of cash balances or to meet liquidity needs. The Portfolio may also use such derivative instruments to hedge or protect from adverse movements in securities prices, currency rates or interest rates. The use of futures contracts may involve risks such as the possibility of illiquid markets or imperfect correlation between the value of the contracts and the underlying securities, or that the counterparty will fail to perform its obligations.
Futures contracts are marked-to-market daily, and the daily variation margin is recorded as a receivable or payable on the Statement of Assets and Liabilities (if applicable). When a contract is closed, a realized gain or loss is recorded as "Net realized gain/(loss) from futures contracts" on the Statement of Operations (if applicable) equal to the difference between the opening and closing value of the contract. Generally, futures contracts are marked-to-market (i.e., treated as realized and subject to distribution) for federal income tax purposes at
Janus Aspen Series December 31, 2007 19
Notes to Financial Statements (continued)
fiscal year-end. Securities designated as collateral for market value on futures contracts are noted in the Schedule of Investments (if applicable). Such collateral is in the possession of the Portfolio's custodian. As of December 31, 2007, the Portfolio was not invested in futures contracts.
Options Contracts
The Portfolio may purchase or write put and call options on futures contracts and on portfolio securities for hedging purposes or as a substitute for an investment. The Portfolio may also purchase or write put and call options on foreign currencies in a manner similar to that in which futures or forward contracts on foreign currencies will be utilized. The Portfolio generally invests in options to hedge against adverse movements in the value of portfolio holdings.
When an option is written, the Portfolio receives a premium and becomes obligated to sell or purchase the underlying security at a fixed price, upon exercise of the option. In writing an option, the Portfolio bears the market risk of an unfavorable change in the price of the security underlying the written option. Exercise of an option written by the Portfolio could result in the Portfolio buying or selling a security at a price different from the current market value.
When an option is exercised, the proceeds on sales for a written call option, the purchase cost for a written put option, or the cost of the security for a purchased put or call option is adjusted by the amount of premium received or paid.
The Portfolio may also purchase and write exchange-listed and over-the-counter put and call options on domestic securities indices, and on foreign securities indices listed on domestic and foreign securities exchanges. Options on securities indices are similar to options on securities except that (1) the expiration cycles of securities index options are monthly, while those of securities options are currently quarterly, and (2) the delivery requirements are different. Instead of giving the right to take or make delivery of securities at a specified price, an option on a securities index gives the holder the right to receive a cash ''exercise settlement amount'' equal to (a) the amount, if any, by which the fixed exercise price of the option exceeds (in the case of a put) or is less than (in the case of a call) the closing value of the underlying index on the date of exercise, multiplied by (b) a fixed ''index multiplier.'' Receipt of this ca sh amount will depend upon the closing level of the securities index upon which the option is based being greater than, in the case of a call, or less than, in the case of a put, the exercise price of the index and the exercise price of the option times a specified multiple. The writer of the option is obligated, in return for the premium received, to make delivery of this amount.
Holdings designated to cover outstanding written options are noted in the Schedule of Investments (if applicable). Options written are reported as a liability on the Statement of Assets and Liabilities as "Options written at value" (if applicable). Realized gains and losses are reported on the Statement of Operations as "Net realized gain/(loss) from options contracts" on the Statement of Operations (if applicable). The Portfolio did not recognize any realized gains and/or losses from written option transactions during the fiscal year ended December 31, 2007.
The risk in writing a call option is that the Portfolio gives up the opportunity for profit if the market price of the security increases and the option is exercised. The risk in writing a put option is that the Portfolio may incur a loss if the market price of the security decreases and the option is exercised. The risk in buying an option is that the Portfolio pays a premium whether or not the option is exercised. The use of such instruments may involve certain additional risks as a result of unanticipated movement in the market. A lack of correlation between the value of an instrument underlying an option and the asset being hedged, or unexpected adverse price movements, could render the Portfolio's hedging strategy unsuccessful. In addition, there can be no assurance that a liquid secondary market will exist for any option purchased or sold. There is no limit to the loss that the Portfolio may recognize due to written call options. As of December 31, 2007, the Portfolio was not invested in written option contracts.
Short Sales
The Portfolio may engage in "short sales against the box." Short sales against the box involve either selling short a security that the Portfolio owns, or selling short a security that the Portfolio has the right to obtain, for delivery at a specified date in the future. The Portfolio may enter into a short sale against the box to hedge against anticipated declines in the market price of portfolio securities by locking in gains. The Portfolio does not deliver from its portfolio the securities sold short and does not immediately receive the proceeds of the short sale. The Portfolio borrows the securities sold short and receives proceeds from the short sale only when it delivers the securities to the lender. If the value of the securities sold short increases prior to the scheduled delivery date, the Portfolio loses the opportunity to participate in the gain.
The Portfolio may engage in short sales when the portfolio manager anticipates that a security's market purchase price will be less than its borrowing price. To complete the transaction, the Portfolio must borrow the security to deliver it to the purchaser and buy that same security in the market to return it to the lender. The total market value of all of the Portfolio's short sale positions will not exceed 10% of its assets. Although the potential for gain is limited to the difference between the price at which the Portfolio sold the security short and the cost of borrowing the security, its potential for loss is theoretically unlimited because there is no limit to the cost of replacing the borrowed security. There is no assurance that the Portfolio will be able to close out a short position at a particular time or at an acceptable price. A gain or a loss will be recognized upon termination of a short sale. There is no limit to the size of any loss that the Portfolio may recognize upon termination of a short sale. Short sales held by the Portfolio are fully collateralized by other securities, which are denoted in the accompanying Schedule of Investments (if applicable). As of December 31, 2007, the Portfolio was not engaged in short sales.
20 Janus Aspen Series December 31, 2007
Foreign Currency Translations
The Portfolio does not isolate that portion of the results of operations resulting from changes in foreign exchange rates on investments from the fluctuations arising from changes in market prices of securities held at the date of the financial statements. Net unrealized appreciation or depreciation on investments and foreign currency translation arise from changes in the value of assets and liabilities, including investments in securities held at the date of the financial statements, resulting from changes in the exchange rates and changes in market prices of securities held.
Currency gains and losses are also calculated on payables and receivables that are denominated in foreign currencies. The payables and receivables are generally related to foreign security transactions and income.
Foreign currency-denominated assets and forward currency contracts may involve more risks than domestic transactions, including currency risk, political and economic risk, regulatory risk and market risk. Risks may arise from the potential inability of a counterparty to meet the terms of a contract and from unanticipated movements in the value of foreign currencies relative to the U.S. dollar.
When-issued Securities
The Portfolio may purchase or sell securities on a when-issued or forward commitment basis. The price of the underlying securities and date when the securities will be delivered and paid for are fixed at the time the transaction is negotiated. Losses may arise due to changes in the market value of the securities or from the inability of counterparties to meet the terms of the contract. In connection with such purchases, the Portfolio may hold liquid assets as collateral with the Portfolio's custodian sufficient to cover the purchase price. As of December 31, 2007, the Portfolio was not invested in when-issued securities.
Equity-Linked Structured Notes
The Portfolio may invest in equity-linked structured notes. Equity-linked structured notes are derivative securities which are specially designed to combine the characteristics of one or more underlying securities and their equity derivatives in a single note form. The return and/or yield or income component may be based on the performance of the underlying equity securities, an equity index, and/or option positions. Equity-linked structured notes are typically offered in limited transactions by financial institutions in either registered or non-registered form. An investment in equity-linked structured notes creates exposure to the credit risk of the issuing financial institution, as well as to the market risk of the underlying securities. There is no guaranteed return of principal with these securities and the appreciation potential of these securities may be limited by a maximum payment or call right. In certain cases, equity-linked struc tured notes may be more volatile and less liquid than less complex securities or other types of fixed-income securities. Such securities may exhibit price behavior that does not correlate with other fixed-income securities. As of December 31, 2007, the Portfolio was not invested in equity-linked structured notes.
Initial Public Offerings
The Portfolio may invest in initial public offerings ("IPOs"). IPOs and other investment techniques may have a magnified performance impact on a fund with a small asset base. The Portfolio may not experience similar performance as its assets grow.
Restricted Security Transactions
Restricted securities held by the Portfolio may not be sold except in exempt transactions or in a public offering registered under the Securities Act of 1933. The risk of investing in such securities is generally greater than the risk of investing in the securities of widely held, publicly traded companies. Lack of a secondary market and resale restrictions may result in the inability of the Portfolio to sell a security at a fair price and may substantially delay the sale of the security. In addition, these securities may exhibit greater price volatility than securities for which secondary markets exist. As of December 31, 2007, the Portfolio was invested in restricted securities.
Dividend Distributions
The Portfolio may make semiannual distributions of substantially all of its investment income and an annual distribution of its net realized capital gains (if any). The majority of dividends and net realized capital gains distributions from the Portfolio may be automatically reinvested into additional shares of the Portfolio, based upon the discretion of the shareholder.
Estimates
The preparation of financial statements in conformity with accounting principles generally accepted in the United States of America requires management to make estimates and assumptions that affect the reported amount of assets and liabilities and disclosure of contingent assets and liabilities at the date of the financial statements, and the reported amounts of income and expenses during the reporting period. Actual results could differ from those estimates.
Federal Income Taxes
No provision for income taxes is included in the accompanying financial statements, as the Portfolio intends to distribute to shareholders all taxable investment income and realized gains and otherwise comply with Subchapter M of the Internal Revenue Code applicable to regulated investment companies.
New Accounting Pronouncements
In July 2006, the Financial Accounting Standards Board ("FASB") issued Interpretation No. 48, "Accounting for Uncertainty in Income Taxes – an Interpretation of FASB Statement No. 109" (the "Interpretation"). The Interpretation establishes for all entities, including pass-through entities such as the Portfolio, a minimum threshold for financial statement recognition of the benefit of positions taken in filing tax returns (including whether an entity is taxable in a particular jurisdiction), and requires certain expanded tax disclosures. A calendar year open-end or closed-end fund was required to implement the Interpretation no later than June 29, 2007 (the last business day of the semi-annual reporting period), and the Interpretation also applies to all open tax years as of the date
Janus Aspen Series December 31, 2007 21
Notes to Financial Statements (continued)
of effectiveness. Management has evaluated the application of the Interpretation to the Portfolio and has determined there is no significant impact on the Portfolio's financial statements.
In September 2006, the FASB issued Statement of Financial Accounting Standards No. 157, "Fair Value Measurements" ("SFAS No. 157"), which defines fair value, establishes a framework for measuring fair value in generally accepted accounting principles, and expands disclosures about fair value measurements. SFAS No. 157 does not require new fair value measurements, but is applied to the extent that other accounting pronouncements require or permit fair value measurements. SFAS No. 157 emphasizes that fair value is a market-based measurement that should be determined based on the assumptions that market participants would use in pricing an asset or liability. SFAS No. 157 is effective for fiscal years beginning after November 15, 2007 and interim periods within those fiscal years. Management does not believe the adoption of SFAS No. 157 will impact the financial statement amounts, however, the Portfolio will be required to disclose the extent t o which fair value is used to measure assets and liabilities and the inputs used to develop the measurements.
2. INVESTMENT ADVISORY AGREEMENTS AND OTHER TRANSACTIONS WITH AFFILIATES
The Portfolio pays a monthly advisory fee to Janus Capital based upon average daily net assets and calculated at the annual rate of 0.64%.
Janus Services LLC ("Janus Services"), a wholly-owned subsidiary of Janus Capital, is the Portfolio's transfer agent. Janus Services receives certain out-of-pocket expenses for transfer agent services.
Certain officers of the Portfolio may also be officers and/or directors of Janus Capital. Such officers receive no compensation from the Portfolio, except for the Portfolio's Chief Compliance Officer. Effective January 1, 2006, the Portfolio began reimbursing the adviser for a portion of the compensation paid to the Chief Compliance Officer of the Trust. Total compensation of $3,078 was paid by the Portfolio during the fiscal year ended December 31, 2007. The Portfolio's portion is reported as part of "Other Expenses" on the Statement of Operations.
The Board of Trustees has adopted a deferred compensation plan (the "Deferred Plan") for independent Trustees to elect to defer receipt of all or a portion of the annual compensation they are entitled to receive from the Portfolio. All deferred fees are credited to an account established in the name of the Trustees. The amounts credited to the account then increase or decrease, as the case may be, in accordance with the performance of one or more of the Janus funds that are selected by the Trustees. The account balance continues to fluctuate in accordance with the performance of the selected fund or funds until final payment of all amounts credited to the account. The fluctuation of the account balance is recorded by the Portfolio as unrealized appreciation/(depreciation) and is shown as of December 31, 2007 on the Statement of Assets and Liabilities as an asset, "Noninterested Trustees' deferred compensation," and a liability, "Noninterested Trustees' deferred compensation fees." Additionally, the recorded unrealized appreciation/(depreciation) is included in "Unrealized net appreciation/(depreciation) of investments, foreign currency translations and non-interested Trustees' deferred compensation" on the Statement of Assets and Liabilities. Deferred compensation expenses for the fiscal year ended December 31, 2007 are included in "Non-interested Trustees' fees and expenses" on the Statement of Operations. Trustees are allowed to change their designation of mutual funds from time to time. Amounts will be deferred until distributed in accordance with the Deferred Plan. No deferred fees were paid to any Trustee under the Deferred Plan during the fiscal year ended December 31, 2007.
A 1.00% redemption fee may be imposed on Service II Shares of the Portfolio held for 60 days or less. This fee is paid to the Portfolio rather than Janus Capital, and is designed to deter excessive short-term trading and to offset the brokerage commissions, market impact, and other costs associated with changes in the Portfolio's asset level and cash flow due to short-term money movements in and out of the Portfolio. The redemption fee is accounted for as an addition to Paid-in Capital. Total redemption fees received by the Portfolio were $150,657 for the fiscal year ended December 31, 2007.
For the fiscal year ended December 31, 2007, Janus Capital assumed $24,421 of legal, consulting and Trustee costs and fees incurred by the funds in Janus Investment Fund, Janus Aspen Series and Janus Adviser Series (the "Funds") in connection with the regulatory and civil litigation matters discussed in Note 6. These non-recurring costs were allocated to all Funds based on the Funds' respective net assets as of July 31, 2004. Additionally, all future non-recurring costs will be allocated to the Funds based on the Funds' respective net assets on July 31, 2004. These "Non-recurring costs" and "Costs assumed by Janus Capital" are shown on the Statement of Operations.
During the fiscal year ended December 31, 2007, Janus Services reimbursed the Portfolio $931 for Service II Shares as a result of dilutions caused by incorrectly processed shareholder activity. Reimbursements are included in "Payment from affiliate" on the Statements of Changes in Net Assets.
During the fiscal year ended December 31, 2007, Janus Capital reimbursed the Portfolio $99 for Institutional Shares, as a result of dilutions caused by certain trading and/or pricing errors. Reimbursements are included in "Payment from affiliate" on the Statements of Changes in Net Assets.
During the fiscal year ended December 31, 2006, Janus Services reimbursed the Portfolio $605 for Institutional Shares, $5,520 for Service Shares and $887 for Service II Shares, as a result of dilutions caused by incorrectly processed shareholder activity. Reimbursements are included in "Payment from affiliate" on the Statements of Changes in Net Assets.
During the fiscal year ended December 31, 2006, Janus Capital reimbursed the Portfolio $847 for Institutional Shares, $988 for Service Shares and $196 for Service II
22 Janus Aspen Series December 31, 2007
Shares, as a result of dilutions caused by certain trading and/or pricing errors. Reimbursements are included in "Payment from affiliate" on the Statements of Changes in Net Assets.
Janus Distributors LLC, a wholly-owned subsidiary of Janus Capital, is a distributor of the Portfolio. Service Shares and Service II Shares have adopted a Distribution and Shareholder Servicing Plan (the "Plan") pursuant to Rule 12b-1 under the 1940 Act. The Plan authorizes payments by the Portfolio in connection with the distribution of Service Shares and Service II Shares at an annual rate of up to 0.25% of Service Share's and Service II Share's respective average daily net assets.
The Portfolio's expenses may be reduced by expense offsets from an unaffiliated custodian and/or transfer agent. Such credits or offsets are included in "Expense and Fee Offset" on the Statement of Operations. The transfer agent fee offsets received during the period reduce Transfer Agent Fees and Expenses. Custodian offsets received reduce Custodian Fees. The Portfolio could have employed the assets used by the custodian and/or transfer agent to produce income if it had not entered into an expense offset arrangement.
The Portfolio may invest in money market funds, including funds managed by Janus Capital. During the fiscal year ended December 31, 2007, the Portfolio recorded distributions from affiliated investment companies as affiliated dividend income, and had the following affiliated purchases and sales:
| Janus Aspen International Growth Portfolio | Purchases Shares/Cost | Sales Shares/Cost | Dividend Income | Value at 12/31/07 | |||||||||||||||
| Janus Institutional Cash Management Fund - Institutional Shares | $ | 200,059,526 | $ | 190,026,540 | $ | 619,746 | $ | 10,032,986 | |||||||||||
| Janus Institutional Cash Reserves Fund | 9,051,852 | 11,124,852 | 10,577 | – | |||||||||||||||
| Janus Institutional Money Market Fund - Institutional Shares | 357,249,059 | 356,609,059 | 314,045 | 640,000 | |||||||||||||||
| Janus Money Market Fund - Institutional Shares | 112,507,260 | 121,396,260 | 87,024 | – | |||||||||||||||
| $ | 678,867,697 | $ | 679,156,711 | $ | 1,031,392 | $ | 10,672,986 | ||||||||||||
3. FEDERAL INCOME TAX
The tax components of capital shown in the table below represent: (1) distribution requirements the Portfolio must satisfy under the income tax regulations; (2) losses or deductions the Portfolio may be able to offset against income and gains realized in future years; and (3) unrealized appreciation or depreciation of investments for federal income tax purposes (reduced by foreign tax liability).
In 2007, the Portfolio incurred "Post-October" losses during the period from November 1, 2007 through December 31, 2007. These losses will be deferred for tax purposes and recognized in 2008.
Other book to tax differences in the current year may consist of deferred compensation, derivatives, and foreign currency contract adjustments. The Portfolio has elected to treat gains and losses on forward foreign currency contracts as capital gains and losses. Other foreign currency gains and losses on debt instruments are treated as ordinary income for federal income tax purposes pursuant to Section 988 of the Internal Revenue Code.
| Portfolio | Undistributed Ordinary Income | Undistributed Long–Term Gains | Accumulated Capital Losses | Post-October Deferral | Other Book to Tax Differences | Net Tax Appreciation/ (Depreciation) | |||||||||||||||||||||
| Janus Aspen International Growth Portfolio(1) | $ | 58,347,638 | $ | 342,412,305 | $ | (399,261 | ) | $ | (72,881 | ) | $ | (6,059 | ) | $ | 835,425,529 | ||||||||||||
(1) Capital loss carryover is subject to annual limitations.
Accumulated capital losses noted below represent net capital loss carryovers, as of December 31, 2007, that may be available to offset future realized capital gains and thereby reduce future taxable gains distributions. The table below shows the expiration dates of the carryovers.
Capital Loss Carryover Expiration Schedule
For the year ended December 31, 2007
| Portfolio | December 31, 2009 | December 31, 2010 | |||||||||
| Janus Aspen International Growth Portfolio(1) | $ | (266,174 | ) | $ | (133,087 | ) | |||||
(1) Capital loss carryover is subject to annual limitations.
During the year ended December 31, 2007, the following capital loss carryover was utilized by the Portfolio as indicated in the table below.
| Portfolio | Capital Loss Carryover Utilized | ||||||
| Janus Aspen International Growth Portfolio | $ | 113,875,007 | |||||
Janus Aspen Series December 31, 2007 23
Notes to Financial Statements (continued)
The aggregate cost of investments and the composition of unrealized appreciation and depreciation of investment securities for federal income tax purposes as of December 31, 2007, are noted below.
Unrealized appreciation and unrealized depreciation in the table below exclude appreciation/depreciation on foreign currency translations. The primary difference between book and tax appreciation or depreciation of investments is wash sale loss deferrals and passive foreign investment companies.
| Portfolio | Federal Tax Cost | Unrealized Appreciation | Unrealized (Depreciation) | ||||||||||||
| Janus Aspen International Growth Portfolio | $ | 2,153,935,592 | $ | 981,405,967 | $ | (144,931,307 | ) | ||||||||
Income and capital gains distributions are determined in accordance with income tax regulations that may differ from accounting principles generally accepted in the United States of America. These differences are due to differing treatments for items such as net short-term gains, deferral of wash sale losses, foreign currency transactions, net investment losses and capital loss carryovers. Certain permanent differences such as tax returns of capital and net investment losses noted below have been reclassified to paid-in capital.
| For the fiscal year ended December 31, 2007 | Distributions | ||||||||||||||||||
| Portfolio | From Ordinary Income | From Long-Term Capital Gains | Tax Return of Capital | Net Investment Loss | |||||||||||||||
| Janus Aspen International Growth Portfolio | $ | 13,482,656 | $ | – | $ | – | $ | – | |||||||||||
| For the fiscal year ended December 31, 2006 | Distributions | ||||||||||||||||||
| Portfolio | From Ordinary Income | From Long-Term Capital Gains | Tax Return of Capital | Net Investment Loss | |||||||||||||||
| Janus Aspen International Growth Portfolio | $ | 33,885,214 | $ | – | $ | – | $ | – | |||||||||||
4. CAPITAL SHARE TRANSACTIONS
| For each fiscal year ended December 31 | Janus Aspen International Growth Portfolio | ||||||||||
| (all numbers in thousands) | 2007 | 2006 | |||||||||
| Transactions in Portfolio Shares – Institutional Shares | |||||||||||
| Shares sold | 2,511 | 5,510 | |||||||||
| Reinvested dividends and distributions | 95 | 321 | |||||||||
| Shares repurchased | (3,993 | ) | (4,811 | ) | |||||||
| Net Increase/(Decrease) in Portfolio Shares | (1,387 | ) | 1,020 | ||||||||
| Shares Outstanding, Beginning of Period | 16,496 | 15,476 | |||||||||
| Shares Outstanding, End of Period | 15,109 | 16,496 | |||||||||
| Transactions in Portfolio Shares – Service Shares | |||||||||||
| Shares sold | 6,033 | 5,523 | |||||||||
| Reinvested dividends and distributions | 102 | 370 | |||||||||
| Shares repurchased | (3,325 | ) | (2,759 | ) | |||||||
| Net Increase/(Decrease) in Portfolio Shares | 2,810 | 3,134 | |||||||||
| Shares Outstanding, Beginning of Period | 21,197 | 18,063 | |||||||||
| Shares Outstanding, End of Period | 24,007 | 21,197 | |||||||||
| Transactions in Portfolio Shares – Service II Shares | |||||||||||
| Shares sold | 2,377 | 3,502 | |||||||||
| Reinvested dividends and distributions | 28 | 97 | |||||||||
| Shares repurchased | (1,619 | ) | (817 | ) | |||||||
| Net Increase/(Decrease) in Portfolio Shares | 786 | 2,782 | |||||||||
| Shares Outstanding, Beginning of Period | 5,979 | 3,197 | |||||||||
| Shares Outstanding, End of Period | 6,765 | 5,979 | |||||||||
24 Janus Aspen Series December 31, 2007
5. PURCHASES AND SALES OF INVESTMENT SECURITIES
For the fiscal year ended December 31, 2007, the aggregate cost of purchases and proceeds from sales of investment securities (excluding short-term securities) were as follows:
| Portfolio | Purchases of Securities | Proceeds from Sales of Securities | Purchases of Long-Term U.S. Government Obligations | Proceeds from Sales of Long-Term U.S. Government Obligations | |||||||||||||||
| Janus Aspen International Growth Portfolio | $ | 1,664,266,592 | $ | 1,545,085,698 | $ | – | $ | – | |||||||||||
6. PENDING LEGAL MATTERS
In the fall of 2003, the Securities and Exchange Commission ("SEC"), the Office of the New York State Attorney General ("NYAG"), the Colorado Attorney General ("COAG"), and the Colorado Division of Securities ("CDS") announced that they were investigating alleged frequent trading practices in the mutual fund industry. On August 18, 2004, Janus Capital announced that it had reached final settlements with the SEC, the NYAG, the COAG, and the CDS related to such regulators' investigations into Janus Capital's frequent trading arrangements.
A number of civil lawsuits were brought against Janus Capital and certain of its affiliates, the Janus funds, and related entities and individuals based on allegations similar to those announced by the above regulators and were filed in several state and federal jurisdictions. Such lawsuits alleged a variety of theories for recovery including, but not limited to, the federal securities laws, other federal statutes (including ERISA), and various common law doctrines. The Judicial Panel on Multidistrict Litigation transferred these actions to the U.S. District Court for the District of Maryland (the "Court") for coordinated proceedings. On September 29, 2004, five consolidated amended complaints were filed with the Court that generally include: (i) claims by a putative class of investors in certain Janus funds asserting claims on behalf of the investor class (Marini, et al. v. Janus Investment Fund, et al., U.S. District Court, District of Maryland, Case No. 04-CV-00497); (ii) derivative claims by investors in certain Janus funds ostensibly on behalf of such funds (Steinberg et al. v. Janus Capital Management, LLC et al., U.S. District Court, District of Maryland, Case No. 04-CV-00518); (iii) claims on behalf of participants in the Janus 401(k) plan (Wangberger v. Janus Capital Group Inc., 401(k) Advisory Committee, et al., U.S. District Court, District of Maryland, Case No. JFM-05-2711); (iv) claims brought on behalf of shareholders of Janus Capital Group Inc. ("JCGI") on a derivative basis against the Board of Directors of JCGI (Chasen v. Whiston, et al., U.S. District Court, District of Maryland, Case No. 04-MD-00855); and (v) claims by a putative class of shareholders of JCGI asserting claims on behalf of the shareholders (Wiggins, et al. v. Janus Capital Group, Inc., et al., U.S. District Court, District of Maryland, Case No. 04-CV-00818). Each of the five complaints initially named JCGI and/or Janus Capita l as a defendant. In addition, the following were also named as defendants in one or more of the actions: Janus Investment Fund ("JIF"), Janus Aspen Series ("JAS"), Janus Adviser Series ("JAD"), Janus Distributors LLC, Enhanced Investment Technologies, LLC ("INTECH"), Bay Isle Financial LLC ("Bay Isle"), Perkins, Wolf, McDonnell and Company, LLC ("Perkins"), the Advisory Committee of the Janus 401(k) plan, and the current or former directors of JCGI.
On August 25, 2005, the Court entered orders dismissing most of the claims asserted against Janus Capital and its affiliates by fund investors in the Marini and Steinberg cases (actions (i) and (ii) above) except certain claims under Section 10(b) of the Securities Exchange Act of 1934 and under Section 36(b) of the Investment Company Act of 1940, as amended (the "1940 Act"). On August 15, 2006, the Wangberger complaint in the 401(k) plan class action (action (iii) above) was dismissed by the district court with prejudice. The plaintiff appealed that dismissal decision to the United States Court of Appeals for the Fourth Circuit. The appeal is still pending and argument in the matter was held in December 2007. The Court also dismissed the Chasen lawsuit (action (iv) above) against JCGI's Board of Directors without leave to amend. Finally, a Motion to Dismiss the Wiggins suit (action (v) above) was granted and the matter was dismissed in May 2007. However, in June 2007, Plaintiffs appealed that dismissal to the United States Court of Appeals for the Fourth Circuit. That appeal is currently pending.
In addition to the lawsuits described above, the Auditor of the State of West Virginia ("Auditor"), in his capacity as securities commissioner, has initiated administrative proceedings against many of the defendants in the market timing cases (including JCGI and Janus Capital) and, as a part of its relief, is seeking disgorgement and other monetary relief based on similar market timing allegations (In the Matter of Janus Capital Group Inc. et al., Before the Securities Commissioner, State of West Virginia, Summary Order No. 05-1320). The respondents in these proceedings collectively sought a Writ of Prohibition in state court, which was denied. Their subsequent Petition for Appeal was also denied. Consequently, in September 2006, JCGI and Janus Capital filed their answer to the Auditor's summary order instituting proceedings and requested a hearing. A status conference was held on June 28, 2007, during which the parties were ordered t o submit their proposed scheduling order. To date, no scheduling order has been entered in the case. In addition to the pending Motion to Discharge Order to Show Cause, JCGI and Janus Capital, as well as other similarly situated defendants, continue to challenge the statutory authority of the Auditor to bring such an action.
Additional lawsuits may be filed against certain of the Janus funds, Janus Capital, and related parties in the future. Janus Capital does not currently believe that these pending actions will materially affect its ability to continue providing services it has agreed to provide to the Janus funds.
Janus Aspen Series December 31, 2007 25
Report of Independent Registered Public
Accounting Firm
To the Trustees and Shareholders
of Janus Aspen International Growth Portfolio
In our opinion, the accompanying statement of assets and liabilities, including the schedule of investments, and the related statements of operations and of changes in net assets and the financial highlights present fairly, in all material respects, the financial position of Janus Aspen International Growth Portfolio (one of the portfolios constituting Janus Aspen Series, hereafter referred to as the "Portfolio") at December 31, 2007, the results of its operations for the year then ended, the changes in its net assets for each of the two years in the period then ended, and the financial highlights for each of the five years in the period then ended, in conformity with accounting principles generally accepted in the United States of America. These financial statements and financial highlights (hereafter referred to as "financial statements") are the responsibility of the Portfolio's management; our responsibility is to express an opinion on t hese financial statements based on our audits. We conducted our audits of these financial statements in accordance with the standards of the Public Company Accounting Oversight Board (United States). Those standards require that we plan and perform the audit to obtain reasonable assurance about whether the financial statements are free of material misstatement. An audit includes examining, on a test basis, evidence supporting the amounts and disclosures in the financial statements, assessing the accounting principles used and significant estimates made by management, and evaluating the overall financial statement presentation. We believe that our audits, which included confirmation of securities at December 31, 2007 by correspondence with the custodian, transfer agent and brokers, and the application of alternative auditing procedures where securities purchased had not been received, provide a reasonable basis for our opinion.

Denver, Colorado
February 15, 2008
26 Janus Aspen Series December 31, 2007
Additional Information (unaudited)
PROXY VOTING POLICIES AND VOTING RECORD
A description of the policies and procedures that the Portfolio uses to determine how to vote proxies relating to its portfolio securities is available: (i) without charge, upon request, by calling 1-800-525-0020 (toll free); (ii) on the Portfolio's website at www.janus.com/proxyvoting; and (iii) on the SEC's website at http://www.sec.gov. Additionally, information regarding the Portfolio's proxy voting record for the most recent twelve-month period ended June 30 is also available, free of charge, through www.janus.com/proxyvoting and from the SEC's website at http://www.sec.gov.
QUARTERLY PORTFOLIO HOLDINGS
The Portfolio files its complete portfolio holdings (schedule of investments) with the SEC for the first and third quarters of each fiscal year on Form N-Q within 60 days of the end of such fiscal quarter. The Portfolio's Form N-Q: (i) is available on the SEC's website at http://www.sec.gov; (ii) may be reviewed and copied at the SEC's Public Reference Room in Washington, D.C. (information on the Public Reference Room may be obtained by calling 1-800-SEC-0330); and (iii) is available without charge, upon request, by calling Janus at 1-800-525-0020 (toll free).
APPROVAL OF ADVISORY AGREEMENTS DURING THE PERIOD
The Trustees of Janus Aspen Series, none of whom has ever been affiliated with Janus Capital ("Independent Trustees"), oversee the management of each Portfolio and, as required by law, determine annually whether to continue the investment advisory agreement for each Portfolio and the subadvisory agreements for the three Portfolios that utilize subadvisers.
In connection with their most recent consideration of those agreements for each Portfolio, the Trustees received and reviewed a substantial amount of information provided by Janus Capital and the respective subadvisers in response to requests of the Independent Trustees and their independent legal counsel. They also received and reviewed a considerable amount of information and analysis provided by their independent fee consultant. Throughout their consideration of the agreements, the Independent Trustees were advised by their independent legal counsel. The Independent Trustees met with management to consider the agreements, and also met separately in executive session with their independent legal counsel and their independent fee consultant.
At a meeting held on December 14, 2007, based on their evaluation of the information provided by Janus Capital, the subadvisers and the independent fee consultant, as well as other information, the Trustees determined that the overall arrangements between each Portfolio and Janus Capital and each subadviser, as applicable, were fair and reasonable in light of the nature, extent and quality of the services provided by Janus Capital, its affiliates and the subadvisers, the fees charged for those services, and other matters that the Trustees considered relevant in the exercise of their business judgment. At that meeting the Trustees unanimously approved the continuation of the investment advisory agreement for each Portfolio, and the subadvisory agreement for each subadvised Portfolio, for the period from February 1, 2008 through February 1, 2009, subject to earlier termina tion as provided for in each agreement.
In considering the continuation of those agreements, the Trustees reviewed and analyzed various factors that they determined were relevant, including the factors described below, none of which by itself was considered dispositive. However, the material factors and conclusions that formed the basis for the Trustees' determination to approve the continuation of the agreements are discussed separately below.
Nature, Extent and Quality of Services
The Trustees reviewed the nature, extent and quality of the services provided by Janus Capital and the subadvisers to the Portfolios, taking into account the investment objective and strategy of each Portfolio, the knowledge of the Trustees gained from their regular meetings with management on at least a quarterly basis, and their ongoing review of information related to the Portfolios. In addition, the Trustees reviewed the resources and key personnel of Janus Capital and each subadviser, especially those who provide investment management services to the Portfolios. The Trustees also considered other services provided to the Portfolios by Janus Capital or the subadvisers, such as managing the execution of portfolio transactions and the selection of broker-dealers for those transactions, serving as the Portfolios' administrator, monitoring adherence to the Portfolios' investment restrictions, producing shareholder reports, providing support services for the Trustees and Trustee committees, communicating with shareholders, and overseeing the activities of other service providers, including monitoring compliance with various policies and procedures of the Portfolios and with applicable securities laws and regulations.
The Trustees concluded that the nature, extent and quality of the services provided by Janus Capital and/or the subadviser to each Portfolio were appropriate and consistent with the terms of the respective advisory and subadvisory agreements; that, taking into account steps taken to address those Portfolios whose performance lagged that of the median of their peers for certain periods, the quality of those services had been consistent with or superior to quality norms in the industry; and that the Portfolios were likely to benefit from the continued provision of those services. They also concluded that Janus Capital and each subadviser had
Janus Aspen Series December 31, 2007 27
Additional Information (unaudited) (continued)
sufficient personnel, with the appropriate education and experience, to serve the Portfolios effectively and had demonstrated its continuing ability to attract well-qualified personnel.
Performance of the Portfolios
The Trustees considered the investment results of each Portfolio over various time periods. They reviewed information comparing each Portfolio's performance with the performance of comparable funds and peer groups identified by Lipper Inc., an independent provider of investment company data, and with the Portfolio's benchmark index. They concluded that the performance of many Portfolios was good to very good under current market conditions. Although the performance of some Portfolios lagged that of the median of their peers for certain periods, the Trustees also concluded that Janus Capital had taken appropriate steps to address those instances of under-performance and that the more recent performance of most of those Portfolios had been improving.
Costs of Services Provided
The Trustees examined information on the fees and expenses of each Portfolio in comparison to similar information for comparable funds as provided by Lipper. They also reviewed an analysis of that information provided by their independent fee consultant and noted that the rate of management (investment advisory and administrative) fees for most of the Portfolios, in some cases after contractual expense limitations, was below the mean management fee rate of the respective peer group of funds selected by Lipper.
The Trustees considered the methodology used by Janus Capital and each subadviser in determining compensation payable to portfolio managers, the competitive environment for investment management talent and the competitive market for mutual funds in different distribution channels. They concluded that the compensation methodology provided a good alignment of the interests of the portfolio managers with those of Portfolio shareholders.
The Trustees also reviewed management fees charged by Janus Capital to its separate account clients and to its subadvised funds (for which Janus Capital provides only services related to portfolio management). Although in most instances subadvisory and separate account fee rates for various investment strategies were lower than management fee rates for Portfolios having a similar strategy, the Trustees noted that, under the terms of the management agreements with the Portfolios, Janus Capital performs significant additional services for the Portfolios that it does not provide to those other clients, including administrative services, oversight of the Portfolios' other service providers, Trustee support, regulatory compliance and numerous other services, and that, in serving the Portfolios, Janus Capital assumes many legal risks that it does not assume in servicing its other clients. Moreover, the Trustees noted that the spread between the av erage fee rates charged to the Portfolios and the fee rates that Janus Capital charged to its separate account clients was significantly smaller than the average spread for such fee rates of other advisers, based on publicly available data and research conducted by their independent fee consultant.
The Trustees reviewed information on the profitability to Janus Capital and its affiliates of their relationships with each Portfolio, as well as an explanation of the methodology used in allocating various expenses of Janus Capital and its affiliates among the Portfolios and other clients. They also reviewed the financial statements of Janus Capital's parent company and its corporate structure. In their review, the Trustees considered whether Janus Capital and each subadviser receives adequate incentives to manage the Portfolios effectively. They recognized that profitability comparisons among investment advisers are difficult because very little comparative information is publicly available and profitability of any adviser is affected by numerous factors, including the organizational structure of the particular adviser, the types of funds and other accounts it manages, possible other lines of business, the methodology for allocating expens es, and the adviser's capital structure and cost of capital. However, based on the information available and taking those factors into account, the Trustees concluded that Janus Capital's profitability with respect to each Portfolio in relation to the services rendered was not unreasonable.
The Trustees concluded that the management fees and other compensation payable by each Portfolio to Janus Capital and its affiliates, as well as the fees payable by Janus Capital or the Portfolios to the subadvisers of subadvised Portfolios, were reasonable in relation to the nature, extent and quality of the services provided, taking into account the fees charged by other advisers for managing comparable mutual funds with similar strategies and the fees Janus Capital and the subadvisers charge to other clients. They also concluded that the overall expense ratio of each Portfolio was reasonable, taking into account the size of the Portfolio, the quality of services provided by Janus Capital and any subadviser, the investment performance of the Portfolio and any expense limitations agreed to by Janus Capital.
Economies of Scale
The Trustees considered information about the potential for Janus Capital to realize economies of scale as the assets of the Portfolios increase. They noted that, although most Portfolios pay advisory fees at a fixed rate as a percentage of net assets, without any breakpoints, the management fee rate paid by each Portfolio, after any contractual expense limitations, was below the mean management fee rate of the Portfolio's peer group selected by Lipper; and, for those Portfolios whose expenses are being reduced by the contractual expense limitations of Janus Capital, Janus Capital is subsidizing the Portfolios because they have not reached adequate scale. Moreover, as the assets of many of the Portfolios declined in the past few years, those Portfolios benefited from having
28 Janus Aspen Series December 31, 2007
Additional Information (unaudited) (continued)
advisory fee rates that remained constant rather than increasing as assets declined. In addition, performance fee structures have been implemented for several Portfolios that will cause the effective rate of advisory fees payable by such a Portfolio to vary depending on the investment performance of the Portfolio relative to its benchmark index over the measurement period; and a few Portfolios have fee schedules with breakpoints and reduced fee rates above certain asset levels. The Trustees also noted that the Portfolios share directly in economies of scale through lower charges of third-party service providers, based on the combined scale of all of the Portfolios. Based on all of the information they reviewed, the Trustees concluded that the current fee structure of each Portfolio was reasonable and that the current rates of fees do reflect a sharing between Janus Capital and the Portfolio of economies of scale at the current asset level of the Portfolio.
Other Benefits to Janus Capital
The Trustees also considered benefits that accrue to Janus Capital and its affiliates from their relationships with the Portfolios. They recognized that two affiliates of Janus Capital separately serve the Portfolios as transfer agent and distributor, respectively. They also considered Janus Capital's past and proposed use of commissions paid by Portfolios on their portfolio brokerage transactions to obtain proprietary and third-party research products and services benefiting those Portfolios and/or other clients of Janus Capital. The Trustees concluded that Janus Capital's use of "soft" commission dollars of a Portfolio to obtain proprietary and third-party research products and services was consistent with regulatory requirements and guidelines and was likely to benefit the Portfolios. The Trustees also concluded that, other than the services provided by Janus Capital and its affiliates pursuant to the agreements and the fees to be paid by each Portfolio therefor, the Portfolios and Janus Capital may potentially benefit from their relationship with each other in other ways. They concluded that Janus Capital benefits from the receipt of proprietary research products and services acquired through commissions paid on portfolio transactions of the Portfolios and that the Portfolios benefit from Janus Capital's receipt of those products and services, as well as research products and services acquired through commissions paid by other clients of Janus Capital. They further concluded that success of any Portfolio could attract other business to Janus Capital or other Janus funds and that the success of Janus Capital could enhance Janus Capital's ability to serve the Portfolios.
After full consideration of the above factors, as well as other factors, all of the Trustees, all of whom are Independent Trustees, concluded that the proposed continuation of the investment advisory agreement for each Portfolio, and the subadvisory agreement for each subadvised Portfolio, was in the best interest of the respective Portfolios and their shareholders.
Janus Aspen Series December 31, 2007 29
Explanations of Charts, Tables and
Financial Statements (unaudited)
1. PERFORMANCE OVERVIEWS
The performance overview graph compares the performance of a hypothetical $10,000 investment in the Portfolio with one or more widely used market indices. The hypothetical example does not represent the returns of any particular investment.
When comparing the performance of the Portfolio with an index, keep in mind that market indices do not include brokerage commissions that would be incurred if you purchased the individual securities in the index. They also do not include taxes payable on dividends and interest or operating expenses incurred if you maintained a Portfolio invested in the index.
Average annual total returns are quoted for each class of the Portfolio. Average annual total return is calculated by taking the growth or decline in value of an investment over a period of time, including reinvestment of any dividends, distributions and capital gains, then calculating the annual compounded percentage rate that would have produced the same result had the rate of growth been constant throughout the period. Average annual total return does not reflect the deduction of taxes that a shareholder would pay on Portfolio distributions or redemptions of Portfolio shares.
Pursuant to federal securities rules, expense ratios shown in the performance chart reflect subsidized and unsubsidized ratios for the past fiscal year. The total annual portfolio operating expenses ratio is gross of any fee waivers, reflecting a Portfolio's unsubsidized expense ratio. The net annual portfolio operating expenses ratio (if applicable) includes contractual waivers of Janus Capital and/or Janus Services and reflects a Portfolio's subsidized expense ratio. Both the total annual portfolio operating expenses ratio and net annual portfolio operating expenses ratio are based on average net assets as of the fiscal year ended December 31, 2006. The ratios also include expenses indirectly incurred by the Portfolio as a result of investing in other investment companies or pooled investments, which are not reflected in the "Financial Highlights" of this report. As a result, these ratios may be higher or lower than those shown in the "Fin ancial Highlights" in this report. All expenses are shown without the effect of expense offset arrangements. Pursuant to such arrangements, credits realized as a result of uninvested cash balances are used to reduce custodian and transfer agent expenses.
2. SCHEDULE OF INVESTMENTS
Following the performance overview section is the Portfolio's Schedule of Investments. This schedule reports the industry concentrations and types of securities held in the Portfolio on the last day of the reporting period. Securities are usually listed by type (common stock, corporate bonds, U.S. Government obligations, etc.) and by industry classification (banking, communications, insurance, etc.). Holdings are subject to change without notice.
The value of each security is quoted as of the last day of the reporting period. The value of securities denominated in foreign currencies is converted into U.S. dollars. Certain short-term investments maturing within 60 days are valued at amortized cost, which approximates market value.
A summary of investments by country is provided if the Portfolio invested in foreign securities. This summary reports the Portfolio's exposure to different countries by providing the percentage of securities invested in each country. The country of each security represents the country in which the company is incorporated.
2A. FORWARD CURRENCY CONTRACTS
A table listing forward currency contracts follows the Portfolio's Schedule of Investments (if applicable). Forward currency contracts are agreements to deliver or receive a preset amount of currency at a future date. Forward currency contracts are used to hedge against foreign currency risk in the Portfolio's long-term holdings.
The table provides the name of the foreign currency, the settlement date of the contract, the amount of the contract, the value of the currency in U.S. dollars and the amount of unrealized gain or loss. The amount of unrealized gain or loss reflects the change in currency exchange rates from the time the contract was opened to the last day of the reporting period.
2B. FUTURES
A table listing futures contracts follows the Portfolio's Schedule of Investments (if applicable). Futures contracts are contracts that obligate the buyer to receive and the seller to deliver an instrument or money at a specified price on a specified date. Futures are used to hedge against adverse movements in securities prices, currency risk or interest rates.
The table provides the name of the contract, number of contracts held, the expiration date, the principal amount, value and the amount of unrealized gain or loss. The amount of unrealized gain or loss reflects the marked-to- market amount for the last day of the reporting period.
2C. OPTIONS
A table listing written option contracts follows the Portfolio's Schedule of Investments (if applicable). Written option contracts are contracts that obligate the Portfolio to sell or purchase an underlying security at a fixed price, upon exercise of the option. Options are used to hedge against adverse movements in securities prices, currency risk or interest rates.
30 Janus Aspen Series December 31, 2007
The table provides the name of the contract, number of contracts held, the expiration date, exercise price, value and premiums received.
3. STATEMENT OF ASSETS AND LIABILITIES
This statement is often referred to as the "balance sheet." It lists the assets and liabilities of the Portfolio on the last day of the reporting period.
The Portfolio's assets are calculated by adding the value of the securities owned, the receivable for securities sold but not yet settled, the receivable for dividends declared but not yet received on stocks owned and the receivable for Portfolio shares sold to investors but not yet settled. The Portfolio's liabilities include payables for securities purchased but not yet settled, Portfolio shares redeemed but not yet paid and expenses owed but not yet paid. Additionally, there may be other assets and liabilities such as unrealized gain or loss on forward currency contracts.
The section entitled "Net Assets Consist of" breaks down the components of the Portfolio's net assets. Because the Portfolio must distribute substantially all earnings, you will notice that a significant portion of net assets is shareholder capital.
The last section of this statement reports the net asset value ("NAV") per share on the last day of the reporting period for each class of the Portfolio. The NAV is calculated by dividing the Portfolio's net assets (assets minus liabilities) by the number of shares outstanding.
4. STATEMENT OF OPERATIONS
This statement details the Portfolio's income, expenses, gains and losses on securities and currency transactions, and appreciation or depreciation of current Portfolio holdings.
The first section in this statement, entitled "Investment Income," reports the dividends earned from stocks and interest earned from interest-bearing securities in the Portfolio.
The next section reports the expenses and expense offsets incurred by the Portfolio, including the advisory fee paid to the investment adviser, transfer agent fees and expenses, printing and postage for mailing statements, financial reports and prospectuses, and other expenses. Expense offsets, if any, are also shown.
The last section lists the increase or decrease in the value of securities held in the Portfolio. The Portfolio realizes a gain (or loss) when it sells its position in a particular security. An unrealized gain (or loss) refers to the change in net appreciation or depreciation of the Portfolio during the reporting period. "Net Realized and Unrealized Gain/(Loss) on Investments" is affected both by changes in the market value of Portfolio holdings and by gains (or losses) realized during the reporting period.
5. STATEMENT OF CHANGES IN NET ASSETS
This statement reports the increase or decrease in the Portfolio's net assets during the reporting period. Changes in the Portfolio's net assets are attributable to investment operations, dividends, distributions and capital share transactions. This is important to investors because it shows exactly what caused the Portfolio's net asset size to change during the period.
The first section summarizes the information from the Statement of Operations regarding changes in net assets due to the Portfolio's investment performance. The Portfolio's net assets may also change as a result of dividend and capital gains distributions to investors. If investors receive their dividends in cash, money is taken out of the Portfolio to pay the distribution. If investors reinvest their dividends, the Portfolio's net assets will not be affected. If you compare the Portfolio's "Net Decrease from Dividends and Distributions" to the "Reinvested dividends and distributions," you will notice that dividend distributions had little effect on the Portfolio's net assets. This is because the majority of Janus investors reinvest their distributions.
The reinvestment of dividends is included under "Capital Share Transactions." "Capital Shares" refers to the money investors contribute to the Portfolio through purchases or withdraw via redemptions. The "Redemption Fees" refers to the fee paid to the Portfolio for shares held for 60 days or less by a shareholder. The Portfolio's net assets will increase and decrease in value as investors purchase and redeem shares from the Portfolio.
6. FINANCIAL HIGHLIGHTS
This schedule provides a per-share breakdown of the components that affect the Portfolio's NAV for current and past reporting periods for each class of the Portfolio. Not only does this table provide you with total return, it also reports total distributions, asset size, expense ratios and portfolio turnover rate.
The first line in the table reflects the NAV per share at the beginning of the reporting period. The next line reports the net investment income per share, which comprises dividends and interest income earned on securities held by the Portfolio. Following is the total of gains/(losses), realized and unrealized. Dividends and distributions are then subtracted to arrive at the NAV per share at the end of the period. The next line reflects the average annual total return reported the last day of the period.
Janus Aspen Series December 31, 2007 31
Explanations of Charts, Tables and
Financial Statements (unaudited) (continued)
Also included are the expense ratios, or the percentage of average net assets that were used to cover operating expenses during the period. Expense ratios vary for a number of reasons, including the differences in management fees, the average shareholder account size and the extent of foreign investments, which entail greater transaction costs.
The Portfolio's expenses may be reduced through expense reduction arrangements. These arrangements may include the use of balance credits or transfer agent fee offsets. The Statement of Operations reflects total expenses before any such offset, the amount of the offset and the net expenses. The expense ratios listed in the Financial Highlights reflect total expenses prior to any expense offsets (gross expense ratio) and after the expense offsets (net expense ratio). Both expense ratios reflect expenses after waivers (reimbursements), if applicable.
The ratio of net investment income/(loss) summarizes the income earned less expenses, divided by the average net assets of the Portfolio during the reporting period. Don't confuse this ratio with the Portfolio's yield. The net investment income ratio is not a true measure of the Portfolio's yield because it doesn't take into account the dividends distributed to the Portfolio's investors.
The next figure is the portfolio turnover rate, which measures the buying and selling activity in the Portfolio. Portfolio turnover is affected by market conditions, changes in the asset size of the Portfolio, the nature of the Portfolio's investments and the investment style of the portfolio manager. A 100% rate implies that an amount equal to the value of the entire portfolio is turned over in a year; a 50% rate means that an amount equal to the value of half the portfolio is traded in a year; and a 200% rate means that an amount equal to the value of the portfolio is traded every six months.
32 Janus Aspen Series December 31, 2007
Designation Requirements (unaudited)
For federal income tax purposes, the Portfolio designated the following for the year ended December 31, 2007:
Foreign Taxes Paid and Foreign Source Income
| Portfolio | Foreign Taxes Paid | Foreign Source Income | |||||||||
| Janus Aspen International Growth Portfolio | $ | 1,917,598 | $ | 35,407,248 | |||||||
Janus Aspen Series December 31, 2007 33
Trustees and Officers (unaudited)
The Portfolio's Statement of Additional Information includes additional information about the Trustees and officers and is available, without charge, by calling 1-800-525-0020.
The following are the Trustees and officers of the Trust, together with a brief description of their principal occupations during the last five years (principal occupations for certain Trustees may include periods over five years).
Each Trustee has served in that capacity since he or she was originally elected or appointed. The Trustees do not serve a specified term of office. Each Trustee will hold office until the termination of the Trust or his or her earlier death, resignation, retirement, incapacity, or removal. The retirement age for Trustees is 72. The Portfolio's Nominating and Governance Committee will consider nominees for the position of Trustee recommended by shareholders. Shareholders may submit the name of a candidate for consideration by the Committee by submitting their recommendations to the Trust's Secretary. Each Trustee is currently a Trustee of two other registered investment companies advised by Janus Capital: Janus Investment Fund and Janus Adviser Series. As of the date of this report, collectively, these three registered investment companies consist of 75 series or funds.
The Trust's officers are elected annually by the Trustees for a one-year term. Certain officers also serve as officers of Janus Investment Fund and Janus Adviser Series. Certain officers of the Portfolio may also be officers and/or directors of Janus Capital. Portfolio officers receive no compensation from the Portfolio, except for the Portfolio's Chief Compliance Officer, as authorized by the Trustees.
Trustees
| Name, Address, and Age | Positions Held with Portfolio | Length of Time Served | Principal Occupations During the Past Five Years | Number of Portfolios/ Funds in Fund Complex Overseen by Trustee | Other Directorships Held by Trustee | ||||||||||||||||||
| Dennis B. Mullen* 151 Detroit Street Denver, CO 80206 DOB: 1943 | Chairman Trustee | 3/04-12/07 9/93-Present | Chief Executive Officer of Red Robin Gourmet Burgers, Inc. (since 2005). Formerly, private investor. | 75 | ** | Chairman of the Board (since 2005) and Director of Red Robin Gourmet Burgers, Inc., and Director of Janus Capital Funds Plc (Dublin-based, non-U.S. funds). | |||||||||||||||||
| Jerome S. Contro 151 Detroit Street Denver, CO 80206 DOB: 1956 | Trustee | 12/05-Present | Partner of Tango Group, a private investment firm (since 1999). | 75 | Trustee and Chairman of RS Investment Trust (since 2001), and Director of IZZE Beverages and MyFamily.com, Inc. (genealogical research website). | ||||||||||||||||||
| William F. McCalpin 151 Detroit Street Denver, CO 80206 DOB: 1957 | Trustee | 6/02-Present | Private investor. Formerly, Executive Vice President and Chief Operating Officer of The Rockefeller Brothers Fund (a private family foundation), and Vice President of Asian Cultural Council. | 75 | Director of F.B. Heron Foundation (a private grant making foundation). | ||||||||||||||||||
| John W. McCarter, Jr. 151 Detroit Street Denver, CO 80206 DOB: 1938 | Trustee | 6/02-Present | President and Chief Executive Officer of The Field Museum of Natural History (Chicago, IL) (since 1997). | 75 | Chairman of the Board and Director of Divergence Inc. (biotechnology firm); Director of W.W. Grainger, Inc. (industrial distributor); and Trustee of WTTW (Chicago public television station) and the University of Chicago. | ||||||||||||||||||
* Mr. McCalpin will succeed Mr. Mullen as Chairman as of January 1, 2008.
** Mr. Mullen also serves as director of Janus Capital Funds Plc, consisting of 16 funds. Including Janus Capital Funds Plc and the 75 funds comprising the Janus funds, Mr. Mullen oversees 91 funds.
34 Janus Aspen Series December 31, 2007
Trustees (cont.)
| Name, Address, and Age | Positions Held with Portfolio | Length of Time Served | Principal Occupations During the Past Five Years | Number of Portfolios/ Funds in Fund Complex Overseen by Trustee | Other Directorships Held by Trustee | ||||||||||||||||||
| James T. Rothe 151 Detroit Street Denver, CO 80206 DOB: 1943 | Trustee | 1/97-Present | Co-founder and Managing Director of Roaring Fork Capital Management, LLC (private investment in public equity firm), and Professor Emeritus of Business of the University of Colorado, Colorado Springs, CO (since 2004). Formerly, Professor of Business of the University of Colorado (2002-2004) and Distinguished Visiting Professor of Business (2001-2002) of Thunderbird (American Graduate School of International Management), Glendale, AZ. | 75 | Director of Red Robin Gourmet Burgers, Inc. | ||||||||||||||||||
| William D. Stewart 151 Detroit Street Denver, CO 80206 DOB: 1944 | Trustee | 9/93-Present | Corporate Vice President and General Manager of MKS Instruments – HPS Products, Boulder, CO (a manufacturer of vacuum fittings and valves). | 75 | N/A | ||||||||||||||||||
| Martin H. Waldinger 151 Detroit Street Denver, CO 80206 DOB: 1938 | Trustee | 9/93-Present | Private Investor and Consultant to California Planned Unit Developments (since 1994). Formerly, CEO and President of Marwal, Inc. (homeowner association management company). | 75 | N/A | ||||||||||||||||||
| Linda S. Wolf 151 Detroit Street Denver, CO 80206 DOB: 1947 | Trustee | 12/05-Present | Retired. Formerly, Chairman and Chief Executive Officer of Leo Burnett (Worldwide) (advertising agency) (2001-2005). | 75 | Director of Wal-Mart, The Field Museum of Natural History (Chicago, IL), Children's Memorial Hospital (Chicago, IL), Chicago Council on Foreign Relations, Economic Club of Chicago, and InnerWorkings (U.S. provider of print procurement solutions). | ||||||||||||||||||
Janus Aspen Series December 31, 2007 35
Trustees and Officers (unaudited) (continued)
Officers
| Name, Address, and Age | Positions Held with Portfolio | Term of Office* and Length of Time Served | Principal Occupations During the Past Five Years | ||||||||||||
| Brent A. Lynn 151 Detroit Street Denver, CO 80206 DOB: 1964 | Executive Vice President and Portfolio Manager Janus Aspen International Growth Portfolio | 1/01-Present | Vice President of Janus Capital. | ||||||||||||
| Stephanie Grauerholz-Lofton 151 Detroit Street Denver, CO 80206 DOB: 1970 | Chief Legal Counsel and Secretary Vice President | 1/06-Present 3/06-Present | Vice President and Assistant General Counsel of Janus Capital, and Vice President and Assistant Secretary of Janus Distributors LLC. Formerly, Assistant Vice President of Janus Capital and Janus Distributors LLC (2006), and Associate of Vedder, Price, Kaufman & Kammholz, P.C. (1999-2003). | ||||||||||||
| Andrew J. Iseman 151 Detroit Street Denver, CO 80206 DOB: 1964 | President and Chief Executive Officer | 3/07-Present | Chief Operating Officer and Senior Vice President of Janus Capital Group, Inc. and Janus Capital; President of Janus Services LLC; and Director of Capital Group Partners, Inc. Formerly, Senior Vice President of Enhanced Investment Technologies, LLC (2005-2007); and Vice President of Janus Capital (2003-2005) and Janus Services LLC (2003-2004). | ||||||||||||
| David R. Kowalski 151 Detroit Street Denver, CO 80206 DOB: 1957 | Vice President, Chief Compliance Officer, and Anti-Money Laundering Officer | 6/02-Present | Senior Vice President and Chief Compliance Officer of Janus Capital, Janus Distributors LLC, and Janus Services LLC; Chief Compliance Officer of Bay Isle Financial LLC; and Vice President of Enhanced Investment Technologies, LLC. Formerly, Chief Compliance Officer of Enhanced Investment Technologies, LLC (2003-2005); Vice President of Janus Capital (2000-2005) and Janus Services LLC (2004-2005); and Assistant Vice President of Janus Services LLC (2000-2004). | ||||||||||||
| Jesper Nergaard 151 Detroit Street Denver, CO 80206 DOB: 1962 | Chief Financial Officer Vice President, Treasurer, and Principal Accounting Officer | 3/05-Present 2/05-Present | Vice President of Janus Capital. Formerly, Director of Financial Reporting for OppenheimerFunds, Inc. (2004-2005); Site Manager and First Vice President of Mellon Global Securities Services (2003); and Director of Fund Accounting, Project Development, and Training of INVESCO Funds Group (1994-2003). | ||||||||||||
*Officers are elected at least annually by the Trustees for a one-year term and may also be elected from time to time by the Trustees for an interim period.
36 Janus Aspen Series December 31, 2007
Notes
Janus Aspen Series December 31, 2007 37
Janus provides access to a wide range of investment disciplines.
Growth
Janus growth portfolios focus on companies believed to be the leaders in their respective industries, with solid management teams, expanding market share, margins and efficiencies.
Core
Janus core portfolios seek investments in more stable and predictable companies. These portfolios look for a strategic combination of steady growth and for certain portfolios, some degree of income.
Risk-Managed
Our risk-managed portfolios seek to outperform their respective indices while maintaining a risk profile equal to or lower than the index itself. Managed by INTECH (a Janus subsidiary), these portfolios use a mathematical process in an attempt to build a more "efficient" portfolio than the index.
Value
Janus value portfolios invest in companies they believe are poised for a turnaround or are trading at a significant discount to fair value. The goal is to gain unique insight into a company's true value and identify and evaluate potential catalysts that may unlock shareholder value.
International & Global
Janus international and global portfolios seek to leverage Janus' research capabilities by taking advantage of inefficiencies in foreign markets, where accurate information and analytical insight are often at a premium.
Bond
Janus bond portfolios attempt to provide less risk relative to equities while seeking to deliver a
competitive total return through high current income and appreciation.
Money Market
Janus money market portfolios seek maximum current income consistent with stability of capital.
For more information about our funds, contact your investment professional or go to www.janus.com/info
Please consider the charges, risks, expenses and investment objectives carefully before investing. For a prospectus containing this and other information, please call Janus at 1-800-525-0020 or download the file from www.janus.com/info. Read it carefully before you invest or send money.
An investment in a money market portfolio is not insured or guaranteed by the Federal Deposit Insurance Corporation or any other government agency. Although the Portfolio seeks to preserve the value of your investment at $1.00 per share, it is possible to lose money by investing in the Portfolio.

151 Detroit Street
Denver, CO 80206
1-800-525-0020
Portfolio distributed by Janus Distributors LLC (2/08)
C-0108-357 109-02-707 02-08
2007 Annual Report
Janus Aspen Series
Janus Aspen Large Cap Growth Portfolio
Look Inside. . .
• Portfolio management perspective
• Investment strategy behind your portfolio
• Portfolio performance, characteristics and holdings

Table of Contents
| Useful Information About Your Portfolio Report | 1 | ||||||
| Management Commentary and Schedule of Investments | 2 | ||||||
| Statement of Assets and Liabilities | 11 | ||||||
| Statement of Operations | 12 | ||||||
| Statements of Changes in Net Assets | 13 | ||||||
| Financial Highlights | 14 | ||||||
| Notes to Schedule of Investments | 15 | ||||||
| Notes to Financial Statements | 16 | ||||||
| Report of Independent Registered Public Accounting Firm | 24 | ||||||
| Additional Information | 25 | ||||||
| Explanations of Charts, Tables and Financial Statements | 28 | ||||||
| Designation Requirements | 31 | ||||||
| Trustees and Officers | 32 | ||||||
Please consider the charges, risks, expenses and investment objectives carefully before investing. For a prospectus containing this and other information, please call Janus at 1-800-525-0020 or download the file from www.janus.com/info. Read it carefully before you invest or send money.
Useful Information About Your Portfolio Report
Management Commentary
The Management Commentary in this report includes valuable insight from the Portfolio's manager as well as statistical information to help you understand how your Portfolio's performance and characteristics stack up against those of comparable indices.
Please keep in mind that the opinions expressed by the Portfolio's manager in the Management Commentary are just that: opinions. They are a reflection of the manager's best judgment at the time this report was compiled, which was December 31, 2007. As the investing environment changes, so could the manager's opinions. The views are unique to the manager and aren't necessarily shared by his fellow employees or by Janus in general.
Portfolio Expenses
We believe it's important for our shareholders to have a clear understanding of Portfolio expenses and the impact they have on investment return.
The following is important information regarding the Portfolio's Expense Example, which appears in the Management Commentary within this Annual Report. Please refer to this information when reviewing the Expense Example for the Portfolio.
Example
As a shareholder of a Portfolio, you incur two types of costs: (1) transaction costs, including redemption fees (where applicable) (and any related exchange fees) and (2) ongoing costs, including management fees; distribution and shareholder servicing (12b-1) fees (applicable to Service Shares only); and other Portfolio expenses. The example is intended to help you understand your ongoing costs (in dollars) of investing in a Portfolio and to compare these costs with the ongoing costs of investing in other mutual funds. To do so, compare this 5% hypothetical example with the 5% hypothetical examples that appear in the shareholder reports of the other funds. The example is based upon an investment of $1,000 invested at the beginning of the period and held for the six-month period from July 1, 2007 to December 31, 2007.
Actual Expenses
The first line of the table in each example provides information about actual account values and actual expenses. You may use the information in this line, together with the amount you invested, to estimate the expenses that you paid over the period. Simply divide your account value by $1,000 (for example, an $8,600 account value divided by $1,000 = 8.6), then multiply the result by the number in the first line under the heading entitled "Expenses Paid During Period" to estimate the expenses you paid on your account during the period.
Hypothetical Example for Comparison Purposes
The second line of the table in each example provides information about hypothetical account values and hypothetical expenses based upon the Portfolio's actual expense ratio and an assumed rate of return of 5% per year before expenses, which is not the Portfolio's actual return. The hypothetical account values and expenses may not be used to estimate the actual ending account balance or expenses you paid for the period. You may use this information to compare the ongoing costs of investing in the Portfolio and other funds. To do so, compare this 5% hypothetical example with the 5% hypothetical examples that appear in the shareholder reports of the other funds.
Please note that the expenses shown in the tables are meant to highlight your ongoing costs only and do not reflect any transaction costs, such as redemption fees (where applicable) and any charges at the separate account level or contract level. Redemption fees are fully described in the prospectus. Therefore, the second line of each table is useful in comparing ongoing costs only, and will not help you determine the relative total costs of owning different funds. In addition, if these transaction costs and separate account or contract level charges were included, your costs would have been higher.
Janus Aspen Series December 31, 2007 1
Janus Aspen Large Cap Growth Portfolio (unaudited)
Portfolio Snapshot
This portfolio invests primarily in common stocks of larger, more established companies singled out for their growth potential. In addition, we focus on companies that exhibit "smart growth" meaning we place greater emphasis on sustainable and repeatable growth than the pace at which the company grows.

Jonathan Coleman
lead co-portfolio manager

Daniel Riff
co-portfolio manager
Performance Review
For the 12-month period ended December 31, 2007, Janus Aspen Large Cap Growth Portfolio's Institutional Shares and Service Shares advanced 15.14% and 14.84%, respectively, outperforming the Portfolio's primary benchmark, the Russell 1000® Growth Index, which gained 11.81%. The Portfolio also outperformed its secondary benchmark, the S&P 500® Index, which returned 5.49%.
Economic Summary
Despite a volatile and weak second half of the year, equity markets worldwide managed to turn in modest gains over the 12-month period ended December 31, 2007. Much of the year's gains came during the first half amid continued expansion in the global economy and an active merger and acquisition (M&A) environment, but problems in the U.S. credit markets started to rattle investor confidence in July. Many indices retreated from recent peaks as investors digested a number of issues stemming from the subprime mortgage and structured debt markets. Credit market turmoil, subprime-related write-offs, continued weakness in the U.S. housing market, central bank intervention and the first year-over-year decline in domestic corporate earnings since 2002 were just some of the main themes dominating sentiment during the latter half of 2007. Through all of this, emerging country stocks were the top performers while equities in developed countries stru ggled to keep pace. Domestic stocks were led by large, growth-oriented companies with small-cap value issues among the laggards.
As December came to a close, many themes supporting equity prices were fading. While domestic valuations were still considered to be reasonable, particularly with interest rates well off of their period highs, mixed signals on the financial health of the U.S. consumer and slowing earnings momentum were becoming a greater concern. While job growth remained strong for much of the year, a weak December reading left some doubt about continued near-term strength. In the end, the questions remained surrounding the magnitude of slowing growth in the U.S. and whether the rest of the world will follow suit.
Outperformance Was Broad Across Many Sectors
Looking more closely at the Portfolio, sectors that contributed most to outperformance included information technology, industrials, energy and materials.
Within information technology, Apple made the single largest contribution to performance for the period. Apple has enjoyed success with the launching of its iPhone mobile device. We view the iPod and iPhone as the "Trojan Horses" that introduce consumers to the Apple lifestyle, which in turn draws consumers into Apple stores to purchase Apple computers, thereby benefiting the Apple ecosystem.
Within materials, our agricultural holdings have continued to do well. Specifically, Monsanto posted decent gains aided by healthy sales of its genetically modified seeds. Another strong agricultural holding was Syngenta, a Swiss-based leader in crop protection, which has been supported by higher commodity prices for corn and soybeans. Syngenta's business is experiencing improving fundamentals in the Brazilian market as more acreage is planted.
Integrated oil company Hess Corp. was also a top performer in the energy sector. We added to the position during the quarter based on an impressive number of exploitable opportunities around the globe that the company has in its pipeline. We believe the price of the stock does not fully reflect the upside potential of these projects.
Detractors from Performance
Holdings within the financials sector detracted from performance during the period. As mentioned, concerns about subprime exposure and the subsequent credit crunch that occurred this past summer weighed on the market in the second half of the year. Investment banks like Merrill Lynch, UBS, and JPMorgan Chase all came under pressure as investors avoided areas of the market with potential exposure to subprime mortgages. Indeed, recent write-downs, such as those at Merrill Lynch among others, have been larger than expected as banks have been forced to mark-to-market or
2 Janus Aspen Series December 31, 2007
(unaudited)
determine the current market value for their deteriorating mortgage portfolios.
Home mortgage provider Fannie Mae lost ground after it announced non-cash mark-to-market charges on its retained portfolio due to Generally Accepted Accounting Principals (GAAP) accounting regulations. Given the ongoing risk of mortgage defaults and Fannie Mae's accounting restrictions, we chose to trim the position.
Other stocks that declined in the quarter included Celgene in the health care sector. Its most recent quarter was slightly short of expectations for myeloma treatment Revlimid sales due to timing issues. Later in the quarter, confusing data was presented at a cancer conference regarding Revlimid's efficacy in patients with multiple myeloma, which weighed on the stock. Our research indicates fundamentals remain intact; therefore we added to the position.
Our largest detractor for the period was Nordstrom. The department store leader lowered guidance due to slower store traffic. We remain constructive on the name, given the high free cash flow generation of the business model, its under-penetrated store base and flexible product offering. As such, we added to the position.
At the end of the period the Portfolio was overweight in the financials and materials sectors as compared to the primary benchmark, while underweight in the information technology, health care and consumer discretionary sectors.
Other Changes to the Portfolio
We added compelling new stocks to the Portfolio during the period. For example, we purchased InBev, the world's leading brewer by volume. We view InBev as a stable and predictable business model with global exposure, run by a seasoned management team with a track record of creating value for shareholders. We were attracted to the company's growth potential, financial discipline and free cash flow generation.
We exited consumer stocks like Best Buy and BMW A.G. to reduce our exposure to consumer spending. We also sold our stake in Lowe's and Marsh & McLennan. With Lowe's we had concerns about Home Depot's strengthening competitive positioning and the continued weakness in housing. We sold media conglomerate IAC/InterActiveCorp after it reached our price target and used the proceeds to add to our News Corp position, which we believe has a more attractive risk/reward profile. We trimmed names like Boeing and Precision Castparts, and sold names like EMC, in order to harvest gains.
Conclusion
With U.S. equity markets struggling late in the year, the investment team will continue to closely monitor several factors for directional cues. First, despite the weakness in the U.S. housing sector and related credit market turmoil, we believe U.S. employment has remained a pillar of support for the economy. With signs of weakening at the end of the year, we will continue to watch the labor market closely for any sign of prolonged weakness and whether December's weaker-than-expected report was an aberration. We will also be monitoring conditions in the credit markets for signs of further deterioration. As the Federal Reserve (Fed) works to balance its dual mandate of sustainable growth and price stability, we will be watching for signs that suggest the Fed is behind the curve and whether it can be effective in navigating these uncertain economic times. Covered calls and puts were used during the period in an effort to enhance shareholder r eturns. Typically, this involves selling a covered call at or above the target price of an underlying equity position to earn extra income. Please see the "Notes to Financial Statements" for a discussion of derivatives used by the Portfolio. Finally, as "bottom-up" fundamental investors, we will continue to watch the future path of corporate earnings, credit conditions, liquidity, and balance sheet health of our individual holdings in an effort to determine whether current valuations represent an attractive risk/reward profile.
There is rising concern about an economic slowdown in the U.S. economy. We aim to construct an all-weather Portfolio that seeks to perform well in up markets and preserve capital in down markets. Given the macro economic concern, we have added what we believe are more predictable business models to the Portfolio in areas like health care and consumer staples.
Manager Change
The Portfolio's previous manager, David Corkins, retired from Janus as of November 1, 2007. Jonathan Coleman, Co-Chief Investment Officer and a 13-year Janus veteran, assumed lead Portfolio Management responsibilities. He is joined by Dan Riff, Co-Portfolio Manager.
Thank you for your investment in Janus Aspen Large Cap Growth Portfolio.
Janus Aspen Series December 31, 2007 3
Janus Aspen Large Cap Growth Portfolio (unaudited)
Janus Aspen Large Cap Growth Portfolio At a Glance
5 Largest Contributors to Performance – Holdings
| Contribution | |||||||
| Apple, Inc. | 1.93 | % | |||||
| Monsanto Co. | 1.38 | % | |||||
| Hess Corp. | 1.37 | % | |||||
| Precision Castparts Corp. | 1.29 | % | |||||
| NRG Energy, Inc. | 1.14 | % | |||||
5 Largest Detractors from Performance – Holdings
| Contribution | |||||||
| Nordstrom, Inc. | (0.57 | )% | |||||
| Fannie Mae | (0.52 | )% | |||||
| Merrill Lynch & Company, Inc. | (0.44 | )% | |||||
| Akamai Technologies, Inc. | (0.43 | )% | |||||
| Advanced Micro Devices, Inc. | (0.42 | )% | |||||
5 Largest Contributors to Performance – Sectors
| Portfolio Contribution | Portfolio Weighting (% of Net Assets) | Russell 1000® Growth Index Weighting | |||||||||||||
| Information Technology | 4.80 | % | 22.00 | % | 27.10 | % | |||||||||
| Industrials | 2.88 | % | 13.02 | % | 13.68 | % | |||||||||
| Energy | 2.87 | % | 6.00 | % | 6.25 | % | |||||||||
| Materials | 2.47 | % | 4.97 | % | 3.06 | % | |||||||||
| Consumer Staples | 1.58 | % | 10.33 | % | 9.83 | % | |||||||||
5 Lowest Contributors/Detractors to Performance – Sectors
| Portfolio Contribution | Portfolio Weighting (% of Net Assets) | Russell 1000® Growth Index Weighting | |||||||||||||
| Financials | (1.94 | )% | 14.16 | % | 7.83 | % | |||||||||
| Consumer Discretionary | (0.04 | )% | 10.62 | % | 13.30 | % | |||||||||
| Telecommunication Services | 0.70 | % | 3.02 | % | 0.86 | % | |||||||||
| Utilities | 1.42 | % | 3.57 | % | 1.50 | % | |||||||||
| Health Care | 1.44 | % | 12.30 | % | 16.60 | % | |||||||||
4 Janus Aspen Series December 31, 2007
(unaudited)
5 Largest Equity Holdings – (% of Net Assets)
As of December 31, 2007
| Microsoft Corp. Applications Software | 3.7 | % | |||||
| Hess Corp. Oil Companies - Integrated | 3.2 | % | |||||
| CVS/Caremark Corp. Retail - Drug Store | 2.9 | % | |||||
| InBev N.V. Brewery | 2.9 | % | |||||
| Exxon Mobil Corp. Oil Companies - Integrated | 2.9 | % | |||||
| 15.6 | % | ||||||
Asset Allocation – (% of Net Assets)
As of December 31, 2007
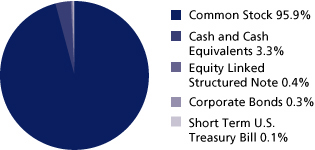
Emerging markets comprised 3.3% of total net assets.
Top Country Allocations – Long Positions (% of Investment Securities)
| As of December 31, 2007 | As of December 31, 2006 | ||||||
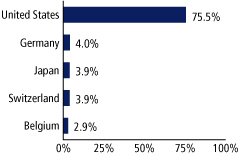 | 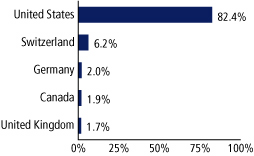 | ||||||
Janus Aspen Series December 31, 2007 5
Janus Aspen Large Cap Growth Portfolio (unaudited)
Performance
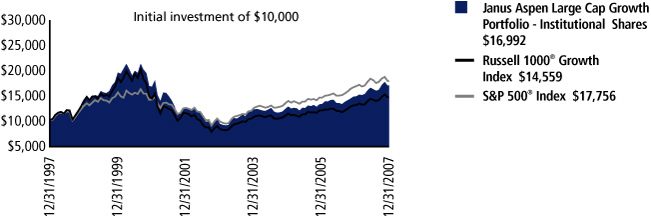
| Average Annual Total Return – for the periods ended December 31, 2007 | Expense Ratios – for the fiscal year ended December 31, 2006 | ||||||||||||||||||||||
| One Year | Five Year | Ten Year | Since Inception* | Total Annual Fund Operating Expenses | |||||||||||||||||||
| Janus Aspen Large Cap Growth Portfolio - Institutional Shares | 15.14 | % | 12.98 | % | 5.44 | % | 8.98 | % | 0.69 | % | |||||||||||||
| Janus Aspen Large Cap Growth Portfolio - Service Shares | 14.84 | % | 12.70 | % | 5.16 | % | 8.67 | % | 0.94 | % | |||||||||||||
| Russell 1000® Growth Index | 11.81 | % | 12.11 | % | 3.83 | % | 9.01 | % | |||||||||||||||
| S&P 500® Index | 5.49 | % | 12.83 | % | 5.91 | % | 10.43 | % | |||||||||||||||
| Lipper Quartile - Institutional Shares | 2 | nd | 2 | nd | 2 | nd | 2 | nd | |||||||||||||||
| Lipper Ranking - Institutional Shares based on total returns for Variable Annuity Large-Cap Growth Funds | 63/204 | 61/165 | 26/54 | 12/26 | |||||||||||||||||||
Visit janus.com/info to view up-to-date
performance and characteristic information
Data presented reflects past performance, which is no guarantee of future results. Investment results and principal value will fluctuate so that shares, when redeemed, may be worth more or less than their original cost. Due to market volatility, current performance may be higher or lower than the performance shown. Call 877.33JANUS or visit www.janus.com/info for performance current to the most recent month-end.
The Portfolio's expense ratios were determined based on average net assets as of the fiscal year ended December 31, 2006. Detailed information is available in the prospectus. All expenses are shown without the effect of expense offset arrangements. Pursuant to such arrangements, credits realized as a result of uninvested cash balances are used to reduce custodian and transfer agent expenses.
The Portfolio's performance may be affected by risks that include those associated with investments in specific industries or countries. Additional risks to the Portfolio may include those associated with investing in foreign securities, emerging markets, initial public offerings ("IPOs") and derivatives. Please see a Janus prospectus or www.janus.com/info for more information about risks, portfolio holdings and other details.
These returns do not reflect the charges and expenses of any particular insurance product or qualified plan. Returns shown would have been lower had they included insurance charges.
Returns include reinvestment of dividends from net investment income and distributions from capital gains. The returns shown do not reflect the deduction of taxes that a shareholder would pay on Portfolio distributions or the redemption of Portfolio shares.
Returns shown for Service Shares for periods prior to December 31, 1999 are derived from the historical performance of Institutional Shares, adjusted to reflect the higher operating expenses of Service Shares.
Lipper, a wholly-owned subsidiary of Reuters, provides independent insight on global collective investments including mutual funds, retirement funds, hedge funds, fund fees and expenses to the asset management and media communities. Lipper ranks the performance of mutual funds within a classification of funds that have similar investment objectives. Rankings are historical with capital gains and dividends reinvested and do not include the effect of loads.
Lipper ranking is for the Institutional Share class only; other classes may have different performance characteristics.
September 30, 1993 is the date used to calculate the since-inception Lipper ranking, which is slightly different from when the Portfolio began operations since Lipper provides fund rankings as of the last day of the month or the first Thursday after fund inception.
There is no assurance that the investment process will consistently lead to successful investing.
6 Janus Aspen Series December 31, 2007
(unaudited)
Portfolio Expenses
The example below shows you the ongoing costs (in dollars) of investing in your Portfolio and allows you to compare these costs with those of other mutual funds. Please refer to the section Useful Information About Your Portfolio Report for a detailed explanation of the information presented in these charts.
| Expense Example – Institutional Shares | Beginning Account Value (7/1/07) | Ending Account Value (12/31/07) | Expenses Paid During Period (7/1/07-12/31/07)(1) | ||||||||||||
| Actual | $ | 1,000.00 | $ | 1,050.50 | $ | 3.36 | |||||||||
| Hypothetical (5% return before expenses) | $ | 1,000.00 | $ | 1,021.93 | $ | 3.31 | |||||||||
| Expense Example – Service Shares | Beginning Account Value (7/1/07) | Ending Account Value (12/31/07) | Expenses Paid During Period (7/1/07-12/31/07)(1) | ||||||||||||
| Actual | $ | 1,000.00 | $ | 1,049.10 | $ | 4.65 | |||||||||
| Hypothetical (5% return before expenses) | $ | 1,000.00 | $ | 1,020.67 | $ | 4.58 | |||||||||
(1) Expenses are equal to the annualized expense ratio of 0.65% for Institutional Shares and 0.90% for Service Shares, multiplied by the average account value over the period, multiplied by 184/365 (to reflect the one-half year period).
The Portfolio will invest at least 80% of its net assets in the type of securities described by its name.
See Notes to Schedule of Investments for index definitions.
The Portfolio may differ significantly from the securities held in the indices. The indices are unmanaged and not available for direct investment; therefore their performance does not reflect the expenses associated with the active management of an actual Portfolio.
Effective November 1, 2007, Jonathan Coleman, CFA, is lead Co-Portfolio Manager and Daniel Riff is Co-Portfolio Manager of Janus Aspen Large Cap Growth Portfolio.
See "Explanations of Charts, Tables and Financial Statements."
*The Portfolio's inception date – September 13, 1993
Janus Aspen Series December 31, 2007 7
Janus Aspen Large Cap Growth Portfolio
Schedule of Investments
As of December 31, 2007
| Shares or Principal Amount | Value | ||||||||||
| Common Stock - 95.9% | |||||||||||
| Aerospace and Defense - 2.3% | |||||||||||
| 134,109 | Boeing Co. | $ | 11,729,173 | ||||||||
| 451,080 | Embraer-Empresa Brasileira de Aeronautica S.A. (ADR)* | 20,564,737 | |||||||||
| 107,295 | Lockheed Martin Corp. | 11,293,872 | |||||||||
| 43,587,782 | |||||||||||
| Agricultural Chemicals - 3.6% | |||||||||||
| 266,440 | Monsanto Co. | 29,758,684 | |||||||||
| 148,089 | Syngenta A.G. | 37,448,841 | |||||||||
| 67,207,525 | |||||||||||
| Apparel Manufacturers - 0.9% | |||||||||||
| 1,163,102 | Esprit Holdings, Ltd. | 17,304,292 | |||||||||
| Applications Software - 3.7% | |||||||||||
| 1,939,990 | Microsoft Corp. | 69,063,644 | |||||||||
| Audio and Video Products - 1.8% | |||||||||||
| 598,955 | Sony Corp.** | 32,870,379 | |||||||||
| Beverages - Non-Alcoholic - 0.5% | |||||||||||
| 137,035 | Coca-Cola Co. | 8,409,838 | |||||||||
| Brewery - 2.9% | |||||||||||
| 664,480 | InBev N.V.** | 55,370,095 | |||||||||
| Casino Hotels - 0.7% | |||||||||||
| 1,183,332 | Crown, Ltd.* | 13,970,923 | |||||||||
| Cellular Telecommunications - 1.1% | |||||||||||
| 343,865 | America Movil S.A. de C.V. - Series L (ADR) | 21,109,872 | |||||||||
| Chemicals - Diversified - 2.4% | |||||||||||
| 259,695 | Bayer A.G.** | 23,665,753 | |||||||||
| 87,050 | K+S A.G.** | 20,821,193 | |||||||||
| 44,486,946 | |||||||||||
| Commercial Services - Finance - 1.0% | |||||||||||
| 736,300 | Western Union Co. | 17,877,364 | |||||||||
| Computers - 6.1% | |||||||||||
| 213,795 | Apple, Inc.* | 42,348,515 | |||||||||
| 791,840 | Dell, Inc.* | 19,407,998 | |||||||||
| 582,300 | Hewlett-Packard Co. | 29,394,504 | |||||||||
| 218,441 | Research In Motion, Ltd. (U.S. Shares)* | 24,771,209 | |||||||||
| 115,922,226 | |||||||||||
| Cosmetics and Toiletries - 2.7% | |||||||||||
| 383,220 | Avon Products, Inc. | 15,148,687 | |||||||||
| 488,576 | Procter & Gamble Co. | 35,871,250 | |||||||||
| 51,019,937 | |||||||||||
| Data Processing and Management - 0.6% | |||||||||||
| 318,591 | Paychex, Inc. | 11,539,366 | |||||||||
| Diversified Operations - 3.3% | |||||||||||
| 416,000 | China Merchants Holdings International Company, Ltd. | 2,587,695 | |||||||||
| 97,385 | Danaher Corp. | 8,544,560 | |||||||||
| 536,915 | General Electric Co. | 19,903,439 | |||||||||
| 202,165 | Siemens A.G.** | 32,008,266 | |||||||||
| 63,043,960 | |||||||||||
| Electric - Generation - 1.3% | |||||||||||
| 1,180,685 | AES Corp.* | 25,254,852 | |||||||||
| Shares or Principal Amount | Value | ||||||||||
| Electric Products - Miscellaneous - 2.1% | |||||||||||
| 386,880 | Emerson Electric Co. | $ | 21,920,621 | ||||||||
| 1,017,000 | Sharp Corp.*,** | 18,412,536 | |||||||||
| 40,333,157 | |||||||||||
| Electronic Components - Semiconductors - 0.8% | |||||||||||
| 444,625 | Texas Instruments, Inc. | 14,850,475 | |||||||||
| Electronic Measuring Instruments - 0.5% | |||||||||||
| 40,800 | Keyence Corp.*,** | 10,038,086 | |||||||||
| Enterprise Software/Services - 1.7% | |||||||||||
| 1,377,250 | Oracle Corp.* | 31,098,305 | |||||||||
| Entertainment Software - 0.9% | |||||||||||
| 284,950 | Electronic Arts, Inc.* | 16,643,930 | |||||||||
| Finance - Credit Card - 1.1% | |||||||||||
| 400,040 | American Express Co.** | 20,810,081 | |||||||||
| Finance - Investment Bankers/Brokers - 2.5% | |||||||||||
| 794,720 | JP Morgan Chase & Co. | 34,689,528 | |||||||||
| 784,400 | Nomura Holdings, Inc.*,** | 13,209,577 | |||||||||
| 47,899,105 | |||||||||||
| Finance - Mortgage Loan Banker - 0.4% | |||||||||||
| 177,390 | Fannie Mae | 7,092,052 | |||||||||
| Finance - Other Services - 1.1% | |||||||||||
| 30,005 | CME Group, Inc. | 20,583,430 | |||||||||
| Food - Retail - 1.0% | |||||||||||
| 2,062,534 | Tesco PLC** | 19,592,451 | |||||||||
| Forestry - 1.2% | |||||||||||
| 296,660 | Weyerhaeuser Co. | 21,875,708 | |||||||||
| Independent Power Producer - 2.2% | |||||||||||
| 951,010 | NRG Energy, Inc.*,# | 41,216,773 | |||||||||
| Investment Management and Advisory Services - 0.7% | |||||||||||
| 227,725 | T. Rowe Price Group, Inc. | 13,863,898 | |||||||||
| Life and Health Insurance - 0.4% | |||||||||||
| 2,301,822 | Sanlam, Ltd. | 7,669,032 | |||||||||
| Medical - Biomedical and Genetic - 4.0% | |||||||||||
| 313,660 | Amgen, Inc.* | 14,566,370 | |||||||||
| 525,496 | Celgene Corp.* | 24,283,170 | |||||||||
| 275,780 | Genentech, Inc.* | 18,496,565 | |||||||||
| 250,315 | Genzyme Corp.*,** | 18,633,449 | |||||||||
| 75,979,554 | |||||||||||
| Medical - Drugs - 3.7% | |||||||||||
| 586,790 | Merck & Company, Inc. | 34,098,367 | |||||||||
| 209,700 | Roche Holding A.G. | 36,211,850 | |||||||||
| 70,310,217 | |||||||||||
| Medical - HMO - 4.1% | |||||||||||
| 665,610 | Coventry Health Care, Inc.* | 39,437,393 | |||||||||
| 651,115 | UnitedHealth Group, Inc. | 37,894,893 | |||||||||
| 77,332,286 | |||||||||||
| Medical Instruments - 0.5% | |||||||||||
| 191,720 | Medtronic, Inc. | 9,637,764 | |||||||||
| Metal Processors and Fabricators - 0.9% | |||||||||||
| 118,325 | Precision Castparts Corp. | 16,411,678 | |||||||||
| Multi-Line Insurance - 0.7% | |||||||||||
| 228,115 | American International Group, Inc. | 13,299,105 | |||||||||
See Notes to Schedules of Investments and Financial Statements.
8 Janus Aspen Series December 31, 2007
Schedule of Investments
As of December 31, 2007
| Shares or Principal Amount | Value | ||||||||||
| Multimedia - 1.7% | |||||||||||
| 937,671 | Consolidated Media Holdings, Ltd. | $ | 3,456,973 | ||||||||
| 1,350,210 | News Corporation, Inc. - Class A | 27,665,803 | |||||||||
| 31,122,776 | |||||||||||
| Networking Products - 1.2% | |||||||||||
| 812,617 | Cisco Systems, Inc.* | 21,997,542 | |||||||||
| Oil Companies - Exploration and Production - 0.8% | |||||||||||
| 191,500 | Occidental Petroleum Corp. | 14,743,585 | |||||||||
| Oil Companies - Integrated - 6.1% | |||||||||||
| 587,434 | Exxon Mobil Corp.** | 55,036,691 | |||||||||
| 605,045 | Hess Corp. | 61,024,840 | |||||||||
| 116,061,531 | |||||||||||
| Real Estate Operating/Development - 0.7% | |||||||||||
| 2,729,000 | Hang Lung Properties, Ltd. | 12,355,385 | |||||||||
| Reinsurance - 1.4% | |||||||||||
| 5,521 | Berkshire Hathaway, Inc. - Class B* | 26,147,456 | |||||||||
| Retail - Apparel and Shoe - 1.2% | |||||||||||
| 619,460 | Nordstrom, Inc. | 22,752,766 | |||||||||
| Retail - Drug Store - 2.9% | |||||||||||
| 1,394,459 | CVS/Caremark Corp. | 55,429,745 | |||||||||
| Retail - Office Supplies - 1.0% | |||||||||||
| 846,813 | Staples, Inc. | 19,535,976 | |||||||||
| Seismic Data Collection - 0% | |||||||||||
| 35,415 | Electromagnetic GeoServices A.S.*,# | 332,149 | |||||||||
| Semiconductor Components/Integrated Circuits - 1.3% | |||||||||||
| 911,095 | Marvell Technology Group, Ltd.* | 12,737,108 | |||||||||
| 6,523,000 | Taiwan Semiconductor Manufacturing Company, Ltd. | 12,472,275 | |||||||||
| 25,209,383 | |||||||||||
| Semiconductor Equipment - 1.4% | |||||||||||
| 557,290 | KLA-Tencor Corp.# | 26,839,086 | |||||||||
| Soap and Cleaning Preparations - 0.5% | |||||||||||
| 172,840 | Reckitt Benckiser PLC** | 10,024,796 | |||||||||
| Telecommunication Equipment - Fiber Optics - 1.8% | |||||||||||
| 1,426,920 | Corning, Inc. | 34,231,811 | |||||||||
| Telecommunication Services - 0.6% | |||||||||||
| 399,005 | NeuStar, Inc. - Class A* | 11,443,463 | |||||||||
| Tobacco - 1.1% | |||||||||||
| 275,261 | Altria Group, Inc. | 20,804,226 | |||||||||
| Toys - 0.8% | |||||||||||
| 817,575 | Mattel, Inc. | 15,566,628 | |||||||||
| Transportation - Railroad - 0.3% | |||||||||||
| 100,000 | Canadian National Railway Co. (U.S. Shares) | 4,693,000 | |||||||||
| Transportation - Services - 2.4% | |||||||||||
| 429,330 | C.H. Robinson Worldwide, Inc. | 23,235,339 | |||||||||
| 315,630 | United Parcel Service, Inc. - Class B | 22,321,354 | |||||||||
| 45,556,693 | |||||||||||
| Web Portals/Internet Service Providers - 2.1% | |||||||||||
| 48,710 | Google, Inc. - Class A* | 33,681,991 | |||||||||
| 291,059 | Yahoo!, Inc.* | 6,770,032 | |||||||||
| 40,452,023 | |||||||||||
| Wireless Equipment - 1.2% | |||||||||||
| 529,610 | Crown Castle International Corp.* | 22,031,776 | |||||||||
| Total Common Stock (cost $1,603,508,969) | 1,811,907,884 | ||||||||||
| Shares or Principal Amount | Value | ||||||||||
| Corporate Bonds - 0.3% | |||||||||||
| Electric - Integrated - 0.3% | |||||||||||
| $ | 1,940,000 | Energy Future Holdings, 10.875% company guaranteed notes due 11/1/17 (144A) | $ | 1,949,700 | |||||||
| 3,330,000 | TXU Energy Co. LLC, 10.25% company guaranteed notes due 11/1/15 (144A) | 3,296,700 | |||||||||
| Total Corporate Bonds (cost $5,270,000) | 5,246,400 | ||||||||||
| Equity-Linked Structured Note - 0.4% | |||||||||||
| Finance - Investment Bankers/Brokers - 0.4% | |||||||||||
| 173,823 | Morgan Stanley Co., convertible (Gilead Sciences, Inc.), 0% (144A)§ (cost $7,312,734) | 7,783,794 | |||||||||
| Money Market - 3.4% | |||||||||||
| 64,604,421 | Janus Institutional Cash Management Fund - Institutional Shares, 4.98% (cost $64,604,421) | 64,604,421 | |||||||||
| Other Securities - 0.3% | |||||||||||
| 3,794,766 | Allianz Dresdner Daily Asset Fund† | 3,794,766 | |||||||||
| 951,020 | Repurchase Agreements† | 951,020 | |||||||||
| 731,213 | Time Deposits† | 731,213 | |||||||||
| Total Other Securities (cost $5,476,999) | 5,476,999 | ||||||||||
| Short-Term U.S. Treasury Bill - 0.1% | |||||||||||
| $ | 901,000 | U.S. Treasury Bill, 4.04% due 1/24/08 (amortized cost $898,601)** | 898,601 | ||||||||
| Total Investments (total cost $1,687,071,724) – 100.4% | 1,895,918,099 | ||||||||||
| Liabilities, net of Cash, Receivables and Other Assets – (0.4)% | (6,944,380 | ) | |||||||||
| Net Assets – 100% | $ | 1,888,973,719 | |||||||||
Summary of Investments by Country – (Long Positions)
| Country | Value | % of Investment Securities | |||||||||
| Australia | $ | 17,427,896 | 0.9 | % | |||||||
| Belgium | 55,370,095 | 2.9 | % | ||||||||
| Bermuda | 30,041,400 | 1.6 | % | ||||||||
| Brazil | �� | 20,564,737 | 1.1 | % | |||||||
| Canada | 29,464,209 | 1.6 | % | ||||||||
| Germany | 76,495,212 | 4.0 | % | ||||||||
| Hong Kong | 14,943,080 | 0.8 | % | ||||||||
| Japan | 74,530,578 | 3.9 | % | ||||||||
| Mexico | 21,109,872 | 1.1 | % | ||||||||
| Norway | 332,149 | 0.0 | % | ||||||||
| South Africa | 7,669,032 | 0.4 | % | ||||||||
| Switzerland | 73,660,691 | 3.9 | % | ||||||||
| Taiwan | 12,472,275 | 0.7 | % | ||||||||
| United Kingdom | 29,617,247 | 1.6 | % | ||||||||
| United States†† | 1,432,219,626 | 75.5 | % | ||||||||
| Total | $ | 1,895,918,099 | 100.0 | % | |||||||
††Includes Short-Term Securities and Other Securities (71.8% excluding Short-Term Securities and Other Securities)
See Notes to Schedules of Investments and Financial Statements.
Janus Aspen Series December 31, 2007 9
Janus Aspen Large Cap Growth Portfolio
Schedule of Investments
As of December 31, 2007
Forward Currency Contracts, Open
| Currency Sold and Settlement Date | Currency Units Sold | Currency Value in U.S.$ | Unrealized Gain/(Loss) | ||||||||||||
| British Pound 5/14/08 | 3,415,000 | $ | 6,770,033 | $ | 133,577 | ||||||||||
| Euro 4/16/08 | 900,000 | 1,316,508 | (38,076 | ) | |||||||||||
| Euro 5/2/08 | 5,050,000 | 7,386,497 | 111,743 | ||||||||||||
| Japanese Yen 4/16/08 | 230,000,000 | 2,082,738 | (88,962 | ) | |||||||||||
| Total | $ | 17,555,776 | $ | 118,282 | |||||||||||
| Value | |||||||
| Schedule of Written Options - Calls | |||||||
| Genzyme Corp. expires January 2008 217 contracts exercise price $85.00 | $ | (3,255 | ) | ||||
| Genzyme Corp. expires January 2008 163 contracts exercise price $90.00 | (1,630 | ) | |||||
| Total Written Options - Calls | |||||||
| (Premiums received $30,390) | $ | (4,885 | ) | ||||
| Value | |||||||
| Schedule of Written Options - Puts | |||||||
| Nordstrom, Inc. expires January 2008 211 contracts exercise price $40.00 | $ | (77,648 | ) | ||||
| Total Written Options - Puts | |||||||
| (Premiums received $23,606) | $ | (77,648 | ) | ||||
See Notes to Schedules of Investments and Financial Statements.
10 Janus Aspen Series December 31, 2007
Statement of Assets and Liabilities
| As of December 31, 2007 (all numbers in thousands except net asset value per share) | Janus Aspen Large Cap Growth Portfolio | ||||||
| Assets: | |||||||
| Investments at cost(1) | $ | 1,687,072 | |||||
| Investments at value(1) | $ | 1,831,314 | |||||
| Affiliated money market investments | 64,604 | ||||||
| Cash | 404 | ||||||
| Receivables: | |||||||
| Investments sold | 11,860 | ||||||
| Portfolio shares sold | 1,287 | ||||||
| Dividends | 1,183 | ||||||
| Interest | 378 | ||||||
| Non-interested Trustees' deferred compensation | 31 | ||||||
| Other assets | 11 | ||||||
| Forward currency contracts | 245 | ||||||
| Total Assets | 1,911,317 | ||||||
| Liabilities: | |||||||
| Payables: | |||||||
| Options written, at value (premiums received of $54) | 83 | ||||||
| Collateral for securities loaned (Note 1) | 5,477 | ||||||
| Investments purchased | 14,422 | ||||||
| Portfolio shares repurchased | 891 | ||||||
| Advisory fees | 1,004 | ||||||
| Transfer agent fees and expenses | 1 | ||||||
| Distribution fees - Service Shares | 251 | ||||||
| Non-interested Trustees' fees and expenses | 7 | ||||||
| Non-interested Trustees' deferred compensation fees | 31 | ||||||
| Accrued expenses | 49 | ||||||
| Forward currency contracts | 127 | ||||||
| Total Liabilities | 22,343 | ||||||
| Net Assets | $ | 1,888,974 | |||||
| Net Assets Consist of: | |||||||
| Capital (par value and paid-in-surplus)* | $ | 2,232,768 | |||||
| Undistributed net investment income/(loss)* | 1,131 | ||||||
| Undistributed net realized gain/(loss) from investments and foreign currency transactions* | (553,858 | ) | |||||
| Unrealized appreciation/(depreciation) of investments, foreign currency translations and non-interested Trustees' deferred compensation | 208,933 | ||||||
| Total Net Assets | $ | 1,888,974 | |||||
| Net Assets - Institutional Shares | $ | 677,593 | |||||
| Shares Outstanding, $0.001 Par Value (unlimited shares authorized) | 25,640 | ||||||
| Net Asset Value Per Share | $ | 26.43 | |||||
| Net Assets - Service Shares | $ | 1,211,381 | |||||
| Shares Outstanding, $0.001 Par Value (unlimited shares authorized) | 46,454 | ||||||
| Net Asset Value Per Share | $ | 26.08 | |||||
* See Note 3 in Notes to Financial Statements.
(1) Investments at cost and value include $5,323,633 of securities loaned (Note 1).
See Notes to Financial Statements.
Janus Aspen Series December 31, 2007 11
Statement of Operations
| For the fiscal year ended December 31, 2007 (all numbers in thousands) | Janus Aspen Large Cap Growth Portfolio | ||||||
| Investment Income: | |||||||
| Interest | $ | 277 | |||||
| Securities lending income | 99 | ||||||
| Dividends | 15,712 | ||||||
| Dividends from affiliates | 3,330 | ||||||
| Foreign tax withheld | (317 | ) | |||||
| Total Investment Income | 19,101 | ||||||
| Expenses: | |||||||
| Advisory fees | 7,976 | ||||||
| Transfer agent fees and expenses | 6 | ||||||
| Registration fees | 23 | ||||||
| Custodian fees | 80 | ||||||
| Professional fees | 21 | ||||||
| Non-interested Trustees' fees and expenses | 33 | ||||||
| Distribution fees - Service Shares | 1,424 | ||||||
| Other expenses | 168 | ||||||
| Non-recurring costs (Note 2) | – | ||||||
| Costs assumed by Janus Capital Management LLC (Note 2) | – | ||||||
| Total Expenses | 9,731 | ||||||
| Expense and Fee Offset | (5 | ) | |||||
| Net Expenses | 9,726 | ||||||
| Net Investment Income/(Loss) | 9,375 | ||||||
| Net Realized and Unrealized Gain/(Loss) on Investments: | |||||||
| Net realized gain/(loss) from investments and foreign currency transactions | 92,127 | ||||||
| Net realized gain/(loss) from options contracts | 442 | ||||||
| Change in net appreciation/(depreciation) of investments, foreign currency translations and non-interested Trustees' deferred compensation | 40,769 | ||||||
| Payment from affiliate (Note 2) | 11 | ||||||
| Net Gain/(Loss) on Investments | 133,349 | ||||||
| Net Increase/(Decrease) in Net Assets Resulting from Operations | $ | 142,724 | |||||
See Notes to Financial Statements.
12 Janus Aspen Series December 31, 2007
Statements of Changes in Net Assets
| For the fiscal years ended December 31 | Janus Aspen Large Cap Growth Portfolio | ||||||||||
| (all numbers in thousands) | 2007 | 2006 | |||||||||
| Operations: | |||||||||||
| Net investment income/(loss) | $ | 9,375 | $ | 3,776 | |||||||
| Net realized gain/(loss) from investment and foreign currency transactions | 92,127 | 86,521 | |||||||||
| Net realized gain/loss from options contracts | 442 | 118 | |||||||||
| Change in net appreciation/(depreciation) of investments, foreign currency translations and non-interested Trustees' deferred compensation | 40,769 | (471 | ) | ||||||||
| Payment from affiliate (Note 2) | 11 | – | |||||||||
| Net Increase/(Decrease) in Net Assets Resulting from Operations | 142,724 | 89,944 | |||||||||
| Dividends and Distributions to Shareholders: | |||||||||||
| Net investment income* | |||||||||||
| Institutional Shares | (4,879 | ) | (3,301 | ) | |||||||
| Service Shares | (3,727 | ) | (412 | ) | |||||||
| Net realized gain/(loss) from investment transactions* | |||||||||||
| Institutional Shares | – | – | |||||||||
| Service Shares | – | – | |||||||||
| Net Decrease from Dividends and Distributions | (8,606 | ) | (3,713 | ) | |||||||
| Capital Share Transactions: | |||||||||||
| Shares sold | |||||||||||
| Institutional Shares | 42,939 | 24,118 | |||||||||
| Service Shares | 1,061,496 | 10,859 | |||||||||
| Reinvested dividends and distributions | |||||||||||
| Institutional Shares | 4,879 | 3,301 | |||||||||
| Service Shares | 3,727 | 412 | |||||||||
| Shares repurchased | |||||||||||
| Institutional Shares | (138,831 | ) | (151,386 | ) | |||||||
| Service Shares | (46,361 | ) | (33,943 | ) | |||||||
| Net Increase/(Decrease) from Capital Share Transactions | 927,849 | (146,639 | ) | ||||||||
| Net Increase/(Decrease) in Net Assets | 1,061,967 | (60,408 | ) | ||||||||
| Net Assets: | |||||||||||
| Beginning of period | 827,007 | 887,415 | |||||||||
| End of period | $ | 1,888,974 | $ | 827,007 | |||||||
| Undistributed net investment income/(loss)* | $ | 1,131 | $ | 377 | |||||||
* See Note 3 in Notes to Financial Statements.
See Notes to Financial Statements.
Janus Aspen Series December 31, 2007 13
Financial Highlights
Institutional Shares
| For a share outstanding during each | Janus Aspen Large Cap Growth Portfolio | ||||||||||||||||||||||
| fiscal year ended December 31 | 2007 | 2006 | 2005 | 2004 | 2003 | ||||||||||||||||||
| Net Asset Value, Beginning of Period | $ | 23.12 | $ | 20.86 | $ | 20.08 | $ | 19.23 | $ | 14.61 | |||||||||||||
| Income from Investment Operations: | |||||||||||||||||||||||
| Net investment income/(loss) | .24 | .12 | .09 | .04 | .02 | ||||||||||||||||||
| Net gain/(loss) on securities (both realized and unrealized) | 3.25 | 2.25 | .76 | .84 | 4.62 | ||||||||||||||||||
| Total from Investment Operations | 3.49 | 2.37 | .85 | .88 | 4.64 | ||||||||||||||||||
| Less Distributions and Other: | |||||||||||||||||||||||
| Dividends (from net investment income)* | (.18 | ) | (.11 | ) | (.07 | ) | (.03 | ) | (.02 | ) | |||||||||||||
| Distributions (from capital gains)* | – | – | – | – | – | ||||||||||||||||||
| Payment from affiliate | – | (1) | – | – | – | – | |||||||||||||||||
| Total Distributions and Other | (.18 | ) | (.11 | ) | (.07 | ) | (.03 | ) | (.02 | ) | |||||||||||||
| Net Asset Value, End of Period | $ | 26.43 | $ | 23.12 | $ | 20.86 | $ | 20.08 | $ | 19.23 | |||||||||||||
| Total Return | 15.14 | %(2) | 11.38 | % | 4.23 | % | 4.57 | % | 31.73 | % | |||||||||||||
| Net Assets, End of Period (in thousands) | $ | 677,593 | $ | 677,289 | $ | 730,374 | $ | 1,177,145 | $ | 1,666,317 | |||||||||||||
| Average Net Assets for the Period (in thousands) | $ | 686,441 | $ | 693,731 | $ | 857,660 | $ | 1,462,102 | $ | 1,533,995 | |||||||||||||
| Ratio of Gross Expenses to Average Net Assets(3)(4) | 0.66 | % | 0.69 | % | 0.66 | % | 0.67 | % | 0.67 | % | |||||||||||||
| Ratio of Net Expenses to Average Net Assets(4) | 0.66 | % | 0.69 | % | 0.66 | % | 0.66 | % | 0.67 | % | |||||||||||||
| Ratio of Net Investment Income/(Loss) to Average Net Assets | 0.89 | % | 0.49 | % | 0.31 | % | 0.14 | % | 0.12 | % | |||||||||||||
| Portfolio Turnover Rate | 78 | % | 54 | % | 87 | % | 33 | % | 24 | % | |||||||||||||
Service Shares
| For a share outstanding during each | Janus Aspen Large Cap Growth Portfolio | ||||||||||||||||||||||
| fiscal year ended December 31 | 2007 | 2006 | 2005 | 2004 | 2003 | ||||||||||||||||||
| Net Asset Value, Beginning of Period | $ | 22.84 | $ | 20.62 | $ | 19.85 | $ | 19.04 | $ | 14.48 | |||||||||||||
| Income from Investment Operations: | |||||||||||||||||||||||
| Net investment income/(loss) | .32 | .02 | (.02 | ) | (.04 | ) | (.03 | ) | |||||||||||||||
| Net gain/(loss) on securities (both realized and unrealized) | 3.07 | 2.26 | .82 | .85 | 4.59 | ||||||||||||||||||
| Total from Investment Operations | 3.39 | 2.28 | .80 | .81 | 4.56 | ||||||||||||||||||
| Less Distributions and Other: | |||||||||||||||||||||||
| Dividends (from net investment income)* | (.15 | ) | (.06 | ) | (.03 | ) | – | – | |||||||||||||||
| Distributions (from capital gains)* | – | – | – | – | – | ||||||||||||||||||
| Payment from affiliate | – | (1) | – | – | – | – | |||||||||||||||||
| Total Distributions and Other | (.15 | ) | (.06 | ) | (.03 | ) | – | – | |||||||||||||||
| Net Asset Value, End of Period | $ | 26.08 | $ | 22.84 | $ | 20.62 | $ | 19.85 | $ | 19.04 | |||||||||||||
| Total Return | 14.84 | %(2) | 11.08 | % | 4.01 | % | 4.25 | % | 31.49 | % | |||||||||||||
| Net Assets, End of Period (in thousands) | $ | 1,211,381 | $ | 149,718 | $ | 157,041 | $ | 183,028 | $ | 211,100 | |||||||||||||
| Average Net Assets for the Period (in thousands) | $ | 569,659 | $ | 148,875 | $ | 163,753 | $ | 191,544 | $ | 188,994 | |||||||||||||
| Ratio of Gross Expenses to Average Net Assets(3)(4) | 0.91 | % | 0.94 | % | 0.91 | % | 0.92 | % | 0.92 | % | |||||||||||||
| Ratio of Net Expenses to Average Net Assets(4) | 0.91 | % | 0.94 | % | 0.91 | % | 0.91 | % | 0.92 | % | |||||||||||||
| Ratio of Net Investment Income/(Loss) to Average Net Assets | 0.58 | % | 0.24 | % | 0.06 | % | (0.11 | )% | (0.13 | )% | |||||||||||||
| Portfolio Turnover Rate | 78 | % | 54 | % | 87 | % | 33 | % | 24 | % | |||||||||||||
* See Note 3 in Notes to Financial Statements.
(1) Payment from affiliate aggregated less than $.01 on a per share basis for the fiscal year ended.
(2) During the fiscal year ended, Janus Capital and/or Janus Services LLC fully reimbursed the Portfolio for a loss on a transaction resulting from certain trading, pricing and/or shareholder activity errors, which otherwise would have reduced total return by less than 0.01%.
(3) The effect of non-recurring costs assumed by Janus Capital (Note 2) is included in the ratio of gross expenses to average net assets and was less than 0.01% for the fiscal years ended 2007, 2006, 2005 and 2004.
(4) See "Explanation of Charts, Tables, and Financial Statements."
See Notes to Financial Statements.
14 Janus Aspen Series December 31, 2007
Notes to Schedule of Investments
| Lipper Variable Annuity Large-Cap Growth Funds | Funds that, by portfolio practice, invest at least 75% of their equity assets in companies with market capitalizations (on a three-year weighted basis) greater than 300% of the dollar-weighted median market capitalization of the middle 1,000 securities of the S&P SuperComposite 1500 Index. Large-cap growth funds typically have an above-average price-to-earnings ratio, price-to-book ratio, and three-year sales-per-share growth value, compared to the S&P 500® Index. | ||||||
| Russell 1000® Growth Index | Measures the performance of those Russell 1000® companies with higher price-to-book ratios and higher forecasted growth values. | ||||||
| S&P 500® Index | The Standard & Poor's ("S&P") 500® Index is a commonly recognized, market capitalization weighted index of 500 widely held equity securities, designed to measure broad U.S. equity performance. | ||||||
| 144A | Securities sold under Rule 144A of the Securities Act of 1933, as amended, are subject to legal and/or contractual restrictions on resale and may not be publicly sold without registration under the 1933 Act. | ||||||
| ADR | American Depositary Receipt | ||||||
| PLC | Public Limited Company | ||||||
| U.S. Shares | Securities of foreign companies trading on an American Stock Exchange. | ||||||
* Non-income-producing security.
** A portion of this security has been segregated by the custodian to cover margin or segregation requirements on open futures contracts, forward currency contracts, options contracts, short sales and/or securities with extended settlement dates.
# Loaned security; a portion or all of the security is on loan at December 31, 2007.
† The security is purchased with the cash collateral received from securities on loan (Note 1).
§ Schedule of Restricted and Illiquid Securities (as of December 31, 2007)
| Acquisition Date | Acquisition Cost | Value | Value as a % of Net Assets | ||||||||||||||||
| Janus Aspen Large Cap Growth Portfolio | |||||||||||||||||||
| Morgan Stanley Co., convertible, (Gilead Sciences, Inc.), 0% (144A) | 10/17/07 | $ | 7,312,734 | $ | 7,783,794 | 0.4 | % | ||||||||||||
The Portfolio has registration rights for certain restricted securities held as of December 31, 2007. The issuer incurs all registration costs.
Aggregate collateral segregated to cover margin or segregation requirements on open futures contracts, forward currency contracts, options contracts, short sales and/or securities with extended settlement dates as of December 31, 2007 is noted below.
| Portfolio | Aggregate Value | ||||||
| Janus Aspen Large Cap Growth Portfolio | $ | 245,898,824 | |||||
Janus Aspen Series December 31, 2007 15
Notes to Financial Statements
The following section describes the organization and significant accounting policies and provides more detailed information about the schedules and tables that appear throughout this report. In addition, the Notes to Financial Statements explain the methods used in preparing and presenting this report.
1. ORGANIZATION AND SIGNIFICANT ACCOUNTING POLICIES
Janus Aspen Large Cap Growth Portfolio (the "Portfolio") is a series fund. The Portfolio is part of Janus Aspen Series (the "Trust"), which is organized as a Delaware statutory trust and is registered under the Investment Company Act of 1940, as amended, (the "1940 Act") as an open-end management investment company. The Trust offers seventeen Portfolios, which include multiple series of shares, with differing investment objectives and policies. The Portfolio invests primarily in equity securities. The Portfolio is classified as diversified, as defined in the 1940 Act. The Portfolio is a no-load investment.
The Portfolio currently offers two classes of shares: Institutional Shares and Service Shares. Institutional Shares are offered only in connection with investment in and payments under variable insurance contracts and to qualified retirement plans. Service Shares are offered only in connection with investment in and payments under variable insurance contracts and to qualified retirement plans that require a fee from Portfolio assets to procure distribution and administrative services to contract owners and plan participants.
The following accounting policies have been consistently followed by the Portfolio and are in conformity with accounting principles generally accepted in the United States of America in the investment company industry.
Investment Valuation
Securities are valued at the last sales price or the official closing price for securities traded on a principal securities exchange (U.S. or foreign) and on the NASDAQ National Market. Securities traded on over-the-counter markets and listed securities for which no sales are reported are valued at the latest bid price (or yield equivalent thereof) obtained from one or more dealers transacting in a market for such securities or by a pricing service approved by the Portfolio's Trustees. Short-term securities with maturities of 60 days or less may be valued at amortized cost, which approximates market value. Debt securities with a remaining maturity of greater than 60 days are valued in accordance with the evaluated bid price supplied by the pricing service. The evaluated bid price supplied by the pricing service is an evaluation that reflects such factors as security prices, yields, maturities and ratings. Foreign securities and currencies ar e converted to U.S. dollars using the applicable exchange rate in effect as of the daily close of the New York Stock Exchange ("NYSE"). When market quotations are not readily available or deemed unreliable, or events or circumstances that may affect the value of portfolio securities held by the Portfolio are identified between the closing of their principal markets and the time the net asset value ("NAV") is determined, securities may be valued at fair value as determined in good faith under procedures established by and under the supervision of the Portfolio's Trustees. Circumstances in which fair value pricing may be utilized include, but are not limited to: (i) when significant events occur which may affect the securities of a single issuer, such as mergers, bankruptcies, or significant issuer specific developments; (ii) when significant events occur which may affect an entire market, such as natural disasters or significant governmental actions; and (iii) when non-significant events occur such as markets closing early or not opening, security trading halts, or pricing of non-valued securities and restricted or non-public securities. The Portfolio may use a systematic fair valuation model provided by an independent third party to value international equity securities in order to adjust for stale pricing, which may occur between the close of certain foreign exchanges and the NYSE.
Investment Transactions and Investment Income
Investment transactions are accounted for as of the date purchased or sold (trade date). Dividend income is recorded on the ex-dividend date. Certain dividends from foreign securities will be recorded as soon as the Trust is informed of the dividend if such information is obtained subsequent to the ex-dividend date. Dividends from foreign securities may be subject to withholding taxes in foreign jurisdictions. Interest income is recorded on the accrual basis and includes amortization of premiums and accretion of discounts. Gains and losses are determined on the identified cost basis, which is the same basis used for federal income tax purposes. Income, as well as gains and losses, both realized and unrealized, are allocated daily to each class of shares based upon the ratio of net assets represented by each class as a percentage of total net assets.
Expenses
The Portfolio bears expenses incurred specifically on its behalf as well as a portion of general expenses. Each class of shares bears expenses incurred specifically on its behalf and, in addition, each class bears a portion of general expenses, which may be based upon relative net assets of each class. Expenses are allocated daily to each class of shares based upon the ratio of net assets represented by each class as a percentage of total net assets. Expenses directly attributable to a specific class of shares are charged against the operations of such class.
Securities Lending
Under procedures adopted by the Trustees, the Portfolio may lend securities to qualified parties (typically brokers or other financial institutions) who need to borrow securities in order to complete certain transactions such as covering short sales, avoiding failures to deliver securities or completing arbitrage activities. The Portfolio may seek to earn additional income through securities lending. There is the risk of delay in recovering a loaned security or the risk of loss in collateral rights if the borrower fails financially. Janus Capital Management LLC ("Janus Capital") makes efforts to balance the benefits and risks from granting such loans.
16 Janus Aspen Series December 31, 2007
State Street Bank and Trust Company served as the Portfolio's lending agent for the period January 1, 2007 through May 24, 2007. Effective May 25, 2007, Dresdner Bank AG became the lending agent for the Portfolio.
The Portfolio does not have the right to vote on securities while they are being lent; however, the Portfolio may attempt to call back the loan and vote the proxy if time permits. All loans will be continuously secured by collateral which may consist of cash, U.S. Government securities, domestic and foreign short-term debt instruments, letters of credit, time deposits, repurchase agreements, or such other collateral permitted by the Securities and Exchange Commission ("SEC"). Cash collateral may be invested in affiliated money market funds or other accounts advised by Janus Capital to the extent consistent with exemptive relief obtained from the SEC or as permitted by the 1940 Act and rules promulgated thereunder.
Dresdner Bank AG (the "Lending Agent") may also invest the cash collateral in the Allianz Dresdner Daily Asset Fund or investments in unaffiliated money market funds or accounts, mutually agreed to by the Portfolio and the Lending Agent, that comply with Rule 2a-7 of the 1940 Act relating to money market funds.
As of December 31, 2007, the Portfolio had on loan securities valued as indicated:
| Portfolio | Value at December 31, 2007 | ||||||
| Janus Aspen Large Cap Growth Portfolio | $ | 5,323,633 | |||||
As of December 31, 2007, the Portfolio received cash collateral for securities lending activity as indicated:
| Portfolio | Cash Collateral at December 31, 2007 | ||||||
| Janus Aspen Large Cap Growth Portfolio | $ | 5,476,999 | |||||
As of December 31, 2007, all cash collateral received by the Portfolio was invested in the Allianz Dresdner Daily Asset Fund, except for $951,020 and $731,213 which were invested in Repurchase Agreements and Time Deposits, respectively.
The value of the collateral must be at least 102% of the market value of the loaned securities that are denominated in U.S. dollars and 105% of the market value of the loaned securities that are not denominated in U.S. dollars. Loaned securities and related collateral are marked-to-market each business day based upon the market value of the respective securities at the close of business, employing the most recent available pricing information. Collateral levels are then adjusted based on this mark-to-market evaluation.
The borrower pays fees at the Portfolio's direction to the Lending Agent. The Lending Agent may retain a portion of the interest earned on the cash collateral invested. The cash collateral invested by the Lending Agent is disclosed in the Schedule of Investments (if applicable). The lending fees and the Portfolio's portion of the interest income earned on cash collateral are included on the Statement of Operations (if applicable).
Interfund Lending
Pursuant to an exemptive order received from the SEC, the Portfolio may be party to an interfund lending agreement between the Portfolio and other Janus Capital sponsored mutual funds, which permits it to borrow or lend cash at a rate beneficial to both the borrowing and lending funds. Outstanding borrowings from all sources totaling 10% or more of the borrowing Portfolio's total assets must be collateralized at 102% of the outstanding principal value of the loan; loans of less than 10% may be unsecured. During the fiscal year ended December 31, 2007, there were no outstanding interfund borrowing or lending arrangements for the Portfolio.
Forward Currency Transactions
The Portfolio may enter into forward currency contracts in order to reduce its exposure to changes in foreign currency exchange rates on its foreign portfolio holdings and to lock in the U.S. dollar cost of firm purchase and sale commitments for securities denominated in or exposed to foreign currencies. A forward currency exchange contract is a commitment to purchase or sell a foreign currency at a future date at a negotiated rate. The gain or loss arising from the difference between the U.S. dollar cost of the original contract and the value of the foreign currency in U.S. dollars upon closing a contract is included in "Net realized gain/(loss) from investment and foreign currency transactions" on the Statement of Operations (if applicable).
Forward currency contracts held by the Portfolio are fully collateralized by other securities, which are denoted in the accompanying Schedule of Investments (if applicable). The collateral is evaluated daily to ensure its market value equals or exceeds the current market value of the corresponding forward currency contracts.
Futures Contracts
The Portfolio may enter into futures contracts to gain exposure to the stock market pending investment of cash balances or to meet liquidity needs. The Portfolio may also use such derivative instruments to hedge or protect from adverse movements in securities prices, currency rates or interest rates. The use of futures contracts may involve risks such as the possibility of illiquid markets or imperfect correlation between the value of the contracts and the underlying securities, or that the counterparty will fail to perform its obligations.
Futures contracts are marked-to-market daily, and the daily variation margin is recorded as a receivable or payable on the Statement of Assets and Liabilities (if applicable). When a contract is closed, a realized gain or loss is recorded as "Net realized gain/(loss) from futures contracts" on the Statement of Operations (if applicable) equal to the difference between the opening and closing value of the contract. Generally, futures contracts are marked-to-market (i.e., treated as realized and subject to distribution) for federal income tax purposes at fiscal year-end. Securities designated as collateral for market value on futures contracts are noted in the Schedule of
Janus Aspen Series December 31, 2007 17
Notes to Financial Statements (continued)
Investments (if applicable). Such collateral is in the possession of the Portfolio's custodian. As of December 31, 2007, the Portfolio was not invested in futures contracts.
Options Contracts
The Portfolio may purchase or write put and call options on futures contracts and on portfolio securities for hedging purposes or as a substitute for an investment. The Portfolio may also purchase or write put and call options on foreign currencies in a manner similar to that in which futures or forward contracts on foreign currencies will be utilized. The Portfolio generally invests in options to hedge against adverse movements in the value of portfolio holdings.
When an option is written, the Portfolio receives a premium and becomes obligated to sell or purchase the underlying security at a fixed price, upon exercise of the option. In writing an option, the Portfolio bears the market risk of an unfavorable change in the price of the security underlying the written option. Exercise of an option written by the Portfolio could result in the Portfolio buying or selling a security at a price different from the current market value.
When an option is exercised, the proceeds on sales for a written call option, the purchase cost for a written put option, or the cost of the security for a purchased put or call option is adjusted by the amount of premium received or paid.
The Portfolio may also purchase and write exchange-listed and over-the-counter put and call options on domestic securities indices, and on foreign securities indices listed on domestic and foreign securities exchanges. Options on securities indices are similar to options on securities except that (1) the expiration cycles of securities index options are monthly, while those of securities options are currently quarterly, and (2) the delivery requirements are different. Instead of giving the right to take or make delivery of securities at a specified price, an option on a securities index gives the holder the right to receive a cash ''exercise settlement amount'' equal to (a) the amount, if any, by which the fixed exercise price of the option exceeds (in the case of a put) or is less than (in the case of a call) the closing value of the underlying index on the date of exercise, multiplied by (b) a fixed ''index multiplier.'' Receipt of this ca sh amount will depend upon the closing level of the securities index upon which the option is based being greater than, in the case of a call, or less than, in the case of a put, the exercise price of the index and the exercise price of the option times a specified multiple. The writer of the option is obligated, in return for the premium received, to make delivery of this amount.
Holdings designated to cover outstanding written options are noted in the Schedule of Investments (if applicable). Options written are reported as a liability on the Statement of Assets and Liabilities as "Options written at value" (if applicable). Realized gains and losses are reported as "Net realized gain/(loss) from options contracts" on the Statement of Operations (if applicable). The Portfolio recognized realized gains of $442,043 for written options during the fiscal year ended December 31, 2007.
The risk in writing a call option is that the Portfolio gives up the opportunity for profit if the market price of the security increases and the option is exercised. The risk in writing a put option is that the Portfolio may incur a loss if the market price of the security decreases and the option is exercised. The risk in buying an option is that the Portfolio pays a premium whether or not the option is exercised. The use of such instruments may involve certain additional risks as a result of unanticipated movement in the market. A lack of correlation between the value of an instrument underlying an option and the asset being hedged, or unexpected adverse price movements, could render the Portfolio's hedging strategy unsuccessful. In addition, there can be no assurance that a liquid secondary market will exist for any option purchased or sold. There is no limit to the loss that the Portfolio may recognize due to written call options.
Written option activity for the fiscal year ended December 31, 2007 was as follows:
| Call Options | Number of Contracts | Premiums Received | |||||||||
| Janus Aspen Large Cap Growth Portfolio | |||||||||||
| Options Outstanding at December 31, 2006 | 2,339 | $ | 134,199 | ||||||||
| Options written | 6,763 | (1) | 370,836 | ||||||||
| Options closed | (953 | ) | (150,951 | ) | |||||||
| Options expired | (7,557 | ) | (306,263 | ) | |||||||
| Options exercised | (212 | ) | (17,431 | ) | |||||||
| Options outstanding at December 31, 2007 | 380 | $ | 30,390 | ||||||||
(1) Adjusted for NRG Energy Inc. 2 for 1 Stock Split 6/1/07
| Put Options | Number of Contracts | Premiums Received | |||||||||
| Janus Aspen Large Cap Growth Portfolio | |||||||||||
| Options outstanding at December 31, 2006 | 1,391 | $ | 57,032 | ||||||||
| Options written | 4,153 | 228,660 | |||||||||
| Options closed | (286 | ) | (57,771 | ) | |||||||
| Options expired | (4,678 | ) | (184,189 | ) | |||||||
| Options exercised | (369 | ) | (20,126 | ) | |||||||
| Options outstanding at December 31, 2007 | 211 | $ | 23,606 | ||||||||
Short Sales
The Portfolio may engage in "short sales against the box." Short sales against the box involve either selling short a security that the Portfolio owns, or selling short a security that the Portfolio has the right to obtain, for delivery at a specified date in the future. The Portfolio may enter into a short sale against the box to hedge against anticipated declines in the market price of portfolio securities by locking in gains. The Portfolio does not deliver from its portfolio the securities sold short and does not immediately receive the proceeds of the short sale. The Portfolio borrows the securities sold short and receives proceeds from the short sale only when it delivers the securities to the lender. If the value of the securities sold short increases prior to the scheduled delivery date, the Portfolio loses the opportunity to participate in the gain.
18 Janus Aspen Series December 31, 2007
The Portfolio may engage in short sales when the portfolio managers anticipate that a security's market purchase price will be less than its borrowing price. To complete the transaction, the Portfolio must borrow the security to deliver it to the purchaser and buy that same security in the market to return it to the lender. The total market value of all of the Portfolio's short sale positions will not exceed 10% of its assets. Although the potential for gain is limited to the difference between the price at which the Portfolio sold the security short and the cost of borrowing the security, its potential for loss is theoretically unlimited because there is no limit to the cost of replacing the borrowed security. There is no assurance that the Portfolio will be able to close out a short position at a particular time or at an acceptable price. A gain or a loss will be recognized upon termination of a short sale. There is no limit to the size o f any loss that the Portfolio may recognize upon termination of a short sale. Short sales held by the Portfolio are fully collateralized by other securities, which are denoted in the accompanying Schedule of Investments (if applicable). As of December 31, 2007, the Portfolio was not engaged in short sales.
Foreign Currency Translations
The Portfolio does not isolate that portion of the results of operations resulting from changes in foreign exchange rates on investments from the fluctuations arising from changes in market prices of securities held at the date of the financial statements. Net unrealized appreciation or depreciation on investments and foreign currency translation arise from changes in the value of assets and liabilities, including investments in securities held at the date of the financial statements, resulting from changes in the exchange rates and changes in market prices of securities held.
Currency gains and losses are also calculated on payables and receivables that are denominated in foreign currencies. The payables and receivables are generally related to foreign security transactions and income.
Foreign currency-denominated assets and forward currency contracts may involve more risks than domestic transactions, including currency risk, political and economic risk, regulatory risk and market risk. Risks may arise from the potential inability of a counterparty to meet the terms of a contract and from unanticipated movements in the value of foreign currencies relative to the U.S. dollar.
When-issued Securities
The Portfolio may purchase or sell securities on a when-issued or forward commitment basis. The price of the underlying securities and date when the securities will be delivered and paid for are fixed at the time the transaction is negotiated. Losses may arise due to changes in the market value of the securities or from the inability of counterparties to meet the terms of the contract. In connection with such purchases, the Portfolio may hold liquid assets as collateral with the Portfolio's custodian sufficient to cover the purchase price. As of December 31, 2007, the Portfolio was not invested in when-issued securities.
Equity-Linked Structured Notes
The Portfolio may invest in equity-linked structured notes. Equity-linked structured notes are derivative securities which are specially designed to combine the characteristics of one or more underlying securities and their equity derivatives in a single note form. The return and/or yield or income component may be based on the performance of the underlying equity securities, an equity index, and/or option positions. Equity-linked structured notes are typically offered in limited transactions by financial institutions in either registered or non-registered form. An investment in equity-linked structured notes creates exposure to the credit risk of the issuing financial institution, as well as to the market risk of the underlying securities. There is no guaranteed return of principal with these securities and the appreciation potential of these securities may be limited b y a maximum payment or call right. In certain cases, equity-linked structured notes may be more volatile and less liquid than less complex securities or other types of fixed-income securities. Such securities may exhibit price behavior that does not correlate with other fixed-income securities.
Initial Public Offerings
The Portfolio may invest in initial public offerings ("IPOs"). IPOs and other investment techniques may have a magnified performance impact on a fund with a small asset base. The Portfolio may not experience similar performance as its assets grow.
Restricted Security Transactions
Restricted securities held by the Portfolio may not be sold except in exempt transactions or in a public offering registered under the Securities Act of 1933. The risk of investing in such securities is generally greater than the risk of investing in the securities of widely held, publicly traded companies. Lack of a secondary market and resale restrictions may result in the inability of the Portfolio to sell a security at a fair price and may substantially delay the sale of the security. In addition, these securities may exhibit greater price volatility than securities for which secondary markets exist.
Dividend Distributions
The Portfolio may make semiannual distributions of substantially all of its investment income and an annual distribution of its net realized capital gains (if any). The majority of dividends and net realized capital gains distributions from the Portfolio may be automatically reinvested into additional shares of the Portfolio, based upon the discretion of the shareholder.
Estimates
The preparation of financial statements in conformity with accounting principles generally accepted in the United States of America requires management to make estimates and assumptions that affect the reported amount of assets and liabilities and disclosure of contingent assets and liabilities at the date of the financial statements, and the reported amounts of income and expenses during the reporting period. Actual results could differ from those estimates.
Federal Income Taxes
No provision for income taxes is included in the accompanying financial statements, as the Portfolio intends to distribute to shareholders all taxable investment income and realized gains
Janus Aspen Series December 31, 2007 19
Notes to Financial Statements (continued)
and otherwise comply with Subchapter M of the Internal Revenue Code applicable to regulated investment companies.
New Accounting Pronouncements
In July 2006, the Financial Accounting Standards Board ("FASB") issued Interpretation No. 48, "Accounting for Uncertainty in Income Taxes – an Interpretation of FASB Statement No. 109" (the "Interpretation"). The Interpretation establishes for all entities, including pass-through entities such as the Portfolio, a minimum threshold for financial statement recognition of the benefit of positions taken in filing tax returns (including whether an entity is taxable in a particular jurisdiction), and requires certain expanded tax disclosures. A calendar year open-end or closed-end fund was required to implement the Interpretation no later than June 29, 2007 (the last business day of the semi-annual reporting period), and the Interpretation also applies to all open tax years as of the date of effectiveness. Management has evaluated the application of the Interpretation to the Portfolio and has determined there is no significant impact on the P ortfolio's financial statements.
In September 2006, the FASB issued Statement of Financial Accounting Standards No. 157, "Fair Value Measurements" ("SFAS No. 157"), which defines fair value, establishes a framework for measuring fair value in generally accepted accounting principles, and expands disclosures about fair value measurements. SFAS No. 157 does not require new fair value measurements, but is applied to the extent that other accounting pronouncements require or permit fair value measurements. SFAS No. 157 emphasizes that fair value is a market-based measurement that should be determined based on the assumptions that market participants would use in pricing an asset or liability. SFAS No. 157 is effective for fiscal years beginning after November 15, 2007 and interim periods within those fiscal years. Management does not believe the adoption of SFAS No. 157 will impact the financial statement amounts, however, the Portfolio will be required to disclose the extent t o which fair value is used to measure assets and liabilities and the inputs used to develop the measurements.
2. INVESTMENT ADVISORY AGREEMENTS AND OTHER TRANSACTIONS WITH AFFILIATES
The Portfolio pays a monthly advisory fee to Janus Capital based upon average daily net assets and calculated at the annual rate of 0.64%.
Janus Services LLC ("Janus Services"), a wholly-owned subsidiary of Janus Capital, is the Portfolio's transfer agent. Janus Services receives certain out-of-pocket expenses for transfer agent services.
Certain officers of the Portfolio may also be officers and/or directors of Janus Capital. Such officers receive no compensation from the Portfolio, except for the Portfolio's Chief Compliance Officer. Effective January 1, 2006, the Portfolio began reimbursing the adviser for a portion of the compensation paid to the Chief Compliance Officer of the Trust. Total compensation of $3,078 was paid by the Portfolio during the fiscal year ended December 31, 2007. The Portfolio's portion is reported as part of "Other Expenses" on the Statement of Operations.
The Board of Trustees has adopted a deferred compensation plan (the "Deferred Plan") for independent Trustees to elect to defer receipt of all or a portion of the annual compensation they are entitled to receive from the Portfolio. All deferred fees are credited to an account established in the name of the Trustees. The amounts credited to the account then increase or decrease, as the case may be, in accordance with the performance of one or more of the Janus funds that are selected by the Trustees. The account balance continues to fluctuate in accordance with the performance of the selected fund or funds until final payment of all amounts credited to the account. The fluctuation of the account balance is recorded by the Portfolio as unrealized appreciation/(depreciation) and is shown as of December 31, 2007 on the Statement of Assets and Liabilities as an asset, "Noninterested Trustees' deferred compensation," and a liability, "Noninterest ed Trustees' deferred compensation fees." Additionally, the recorded unrealized appreciation/(depreciation) is included in "Unrealized net appreciation/(depreciation) of investments, foreign currency translations and non-interested Trustees' deferred compensation" on the Statement of Assets and Liabilities. Deferred compensation expenses for the fiscal year ended December 31, 2007 are included in "Non-interested Trustees' fees and expenses" on the Statement of Operations. Trustees are allowed to change their designation of mutual funds from time to time. Amounts will be deferred until distributed in accordance with the Deferred Plan. No deferred fees were paid to any Trustee under the Deferred Plan during the fiscal year ended December 31, 2007.
For the fiscal year ended December 31, 2007, Janus Capital assumed $24,421 of legal, consulting and Trustee costs and fees incurred by the funds in Janus Investment Fund, Janus Aspen Series and Janus Adviser Series (the "Funds") in connection with the regulatory and civil litigation matters discussed in Note 6. These non-recurring costs were allocated to all Funds based on the Funds' respective net assets as of July 31, 2004. Additionally, all future non-recurring costs will be allocated to the Funds based on the Funds' respective net assets on July 31, 2004. These "Non-recurring costs" and "Costs assumed by Janus Capital" are shown on the Statement of Operations.
During the fiscal year ended December 31, 2007, Janus Capital reimbursed the Portfolio $6,340 for Institutional Shares and $4,494 for Service Shares, as a result of dilutions caused by certain trading and/or pricing errors. Reimbursements are included in "Payment from affiliate" on the Statements of Changes in Net Assets.
Janus Distributors LLC, a wholly-owned subsidiary of Janus Capital, is a distributor of the Portfolio. Service Shares have adopted a Distribution and Shareholder Servicing Plan (the "Plan") pursuant to Rule 12b-1 under the 1940 Act. The Plan authorizes payments by the Portfolio in connection with the
20 Janus Aspen Series December 31, 2007
distribution of Service Shares at an annual rate of up to 0.25% of Service Share's average daily net assets.
The Portfolio's expenses may be reduced by expense offsets from an unaffiliated custodian and/or transfer agent. Such credits or offsets are included in "Expense and Fee Offset" on the Statement of Operations. The transfer agent fee offsets received during the period reduce Transfer Agent Fees and Expenses. Custodian offsets received reduce Custodian Fees. The Portfolio could have employed the assets used by the custodian and/or transfer agent to produce income if it had not entered into an expense offset arrangement.
The Portfolio may invest in money market funds, including funds managed by Janus Capital. During the fiscal year ended December 31, 2007, the Portfolio recorded distributions from affiliated investment companies as affiliated dividend income, and had the following affiliated purchases and sales:
| Purchases Shares/Cost | Sales Shares/Cost | Dividend Income | Value at 12/31/07 | ||||||||||||||||
| Janus Aspen Large Cap Growth Portfolio | |||||||||||||||||||
| Janus Institutional Cash Management Fund – Institutional Shares | $ | 233,827,073 | $ | 169,222,652 | $ | 2,386,004 | $ | 64,604,421 | |||||||||||
| Janus Institutional Cash Reserves Fund | 1,322,400 | 1,322,400 | 191 | – | |||||||||||||||
| Janus Institutional Money Market Fund – Institutional Shares | 767,141,154 | 767,141,154 | 940,311 | – | |||||||||||||||
| Janus Money Market Fund – Institutional Shares | 5,420,633 | 6,860,633 | 3,696 | – | |||||||||||||||
| $ | 1,007,711,260 | $ | 944,546,839 | $ | 3,330,202 | $ | 64,604,421 | ||||||||||||
3. FEDERAL INCOME TAX
The tax components of capital shown in the table below represent: (1) distribution requirements the Portfolio must satisfy under the income tax regulations; (2) losses or deductions the Portfolio may be able to offset against income and gains realized in future years; and (3) unrealized appreciation or depreciation of investments for federal income tax purposes (reduced by foreign tax liability).
In 2007, the Portfolio incurred "Post-October" losses during the period from November 1, 2007 through December 31, 2007. These losses will be deferred for tax purposes and recognized in 2008.
Other book to tax differences in the current year may consist of deferred compensation, derivatives, and foreign currency contract adjustments. The Portfolio has elected to treat gains and losses on forward foreign currency contracts as capital gains and losses. Other foreign currency gains and losses on debt instruments are treated as ordinary income for federal income tax purposes pursuant to Section 988 of the Internal Revenue Code.
The capital loss carryforward in Janus Aspen Large Cap Growth Portfolio is subject to annual limitations under applicable tax laws and may expire unused as a result of a significant change in share ownership during the current year. Due to these limitations, $518,757,204 of the carryforward will not be available for use. As a result, this amount has been reclassified to paid-in-capital.
| Portfolio | Undistributed Ordinary Income | Undistributed Long–Term Gains | Accumulated Capital Losses | Post-October Deferral | Other Book to Tax Differences | Net Tax Appreciation/ (Depreciation) | |||||||||||||||||||||
| Janus Aspen Large Cap Growth Portfolio(1) | $ | 1,153,368 | $ | – | $ | (547,883,392 | ) | $ | (2,894 | ) | $ | (51,153 | ) | $ | 202,990,367 | ||||||||||||
(1) Capital loss carryover is subject to annual limitations.
Accumulated capital losses noted below represent net capital loss carryovers, as of December 31, 2007, that may be available to offset future realized capital gains and thereby reduce future taxable gains distributions. The table below shows the expiration dates of the carryovers.
Capital Loss Carryover Expiration Schedule
For the year ended December 31, 2007
| Portfolio | December 31, 2008 | December 31, 2009 | December 31, 2010 | December 31, 2011 | |||||||||||||||
| Janus Aspen Large Cap Growth Portfolio(1) | $ | (171,977 | ) | $ | (378,164,191 | ) | $ | (84,773,612 | ) | $ | (84,773,612 | ) | |||||||
(1) Capital loss carryover is subject to annual limitations.
During the year ended December 31, 2007, the following capital loss carryover was utilized by the Portfolio as indicated in the table below.
| Portfolio | Capital Loss Carryover Utilized | ||||||
| Janus Aspen Large Cap Growth Portfolio | $ | 97,680,102 | |||||
Janus Aspen Series December 31, 2007 21
Notes to Financial Statements (continued)
The aggregate cost of investments and the composition of unrealized appreciation and depreciation of investment securities for federal income tax purposes as of December 31, 2007 are noted below.
Unrealized appreciation and unrealized depreciation in the table below exclude appreciation/depreciation on foreign currency translations. The primary difference between book and tax appreciation or depreciation of investments is wash sale loss deferrals.
| Portfolio | Federal Tax Cost | Unrealized Appreciation | Unrealized (Depreciation) | ||||||||||||
| Janus Aspen Large Cap Growth Portfolio | $ | 1,692,927,732 | $ | 252,481,707 | $ | (49,491,340 | ) | ||||||||
Income and capital gains distributions are determined in accordance with income tax regulations that may differ from accounting principles generally accepted in the United States of America. These differences are due to differing treatments for items such as net short-term gains, deferral of wash sale losses, foreign currency transactions, net investment losses and capital loss carryovers. Certain permanent differences such as tax returns of capital and net investment losses noted below have been reclassified to paid-in capital.
| For the fiscal year ended December 31, 2007 | Distributions | ||||||||||||||||||
| Portfolio | From Ordinary Income | From Long-Term Capital Gains | Tax Return of Capital | Net Investment Loss | |||||||||||||||
| Janus Aspen Large Cap Growth Portfolio | $ | 8,606,100 | $ | – | $ | – | $ | – | |||||||||||
| For the fiscal year ended December 31, 2006 | Distributions | ||||||||||||||||||
| Portfolio | From Ordinary Income | From Long-Term Capital Gains | Tax Return of Capital | Net Investment Loss | |||||||||||||||
| Janus Aspen Large Cap Growth Portfolio | $ | 3,712,528 | $ | – | $ | – | $ | – | |||||||||||
| 4. CAPITAL SHARE TRANSACTIONS | |||
| For each fiscal year ended December 31 | Janus Aspen Large Cap Growth Portfolio | ||||||||||
| (all numbers in thousands) | 2007 | 2006 | |||||||||
| Transactions in Portfolio Shares – Institutional Shares | |||||||||||
| Shares sold | 1,696 | 1,106 | |||||||||
| Reinvested dividends and distributions | 190 | 150 | |||||||||
| Shares repurchased | (5,537 | ) | (6,979 | ) | |||||||
| Net Increase/(Decrease) in Portfolio Shares | (3,651 | ) | (5,723 | ) | |||||||
| Shares Outstanding, Beginning of Period | 29,291 | 35,014 | |||||||||
| Shares Outstanding, End of Period | 25,640 | 29,291 | |||||||||
| Transactions in Portfolio Shares – Service Shares | |||||||||||
| Shares sold | 41,616 | 502 | |||||||||
| Reinvested dividends and distributions | 144 | 19 | |||||||||
| Shares repurchased | (1,861 | ) | (1,584 | ) | |||||||
| Net Increase/(Decrease) in Portfolio Shares | 39,899 | (1,063 | ) | ||||||||
| Shares Outstanding, Beginning of Period | 6,555 | 7,618 | |||||||||
| Shares Outstanding, End of Period | 46,454 | 6,555 | |||||||||
5. PURCHASES AND SALES OF INVESTMENT SECURITIES
For the fiscal year ended December 31, 2007, the aggregate cost of purchases and proceeds from sales of investment securities (excluding short-term securities) were as follows:
| Portfolio | Purchases of Securities | Proceeds from Sales of Securities | Purchases of Long-Term U.S. Government Obligations | Proceeds from Sales of Long-Term U.S. Government Obligations | |||||||||||||||
| Janus Aspen Large Cap Growth Portfolio | $ | 1,812,680,810 | $ | 939,040,091 | $ | 6,036,623 | $ | 12,168,656 | |||||||||||
22 Janus Aspen Series December 31, 2007
6. PENDING LEGAL MATTERS
In the fall of 2003, the Securities and Exchange Commission ("SEC"), the Office of the New York State Attorney General ("NYAG"), the Colorado Attorney General ("COAG"), and the Colorado Division of Securities ("CDS") announced that they were investigating alleged frequent trading practices in the mutual fund industry. On August 18, 2004, Janus Capital announced that it had reached final settlements with the SEC, the NYAG, the COAG, and the CDS related to such regulators' investigations into Janus Capital's frequent trading arrangements.
A number of civil lawsuits were brought against Janus Capital and certain of its affiliates, the Janus funds, and related entities and individuals based on allegations similar to those announced by the above regulators and were filed in several state and federal jurisdictions. Such lawsuits alleged a variety of theories for recovery including, but not limited to, the federal securities laws, other federal statutes (including ERISA), and various common law doctrines. The Judicial Panel on Multidistrict Litigation transferred these actions to the U.S. District Court for the District of Maryland (the "Court") for coordinated proceedings. On September 29, 2004, five consolidated amended complaints were filed with the Court that generally include: (i) claims by a putative class of investors in certain Janus funds asserting claims on behalf of the investor class (Marini, et al. v. Janus Investment Fund, et al., U.S. District Court, District of Maryland, Case No. 04-CV-00497); (ii) derivative claims by investors in certain Janus funds ostensibly on behalf of such funds (Steinberg et al. v. Janus Capital Management, LLC et al., U.S. District Court, District of Maryland, Case No. 04-CV-00518); (iii) claims on behalf of participants in the Janus 401(k) plan (Wangberger v. Janus Capital Group Inc., 401(k) Advisory Committee, et al., U.S. District Court, District of Maryland, Case No. JFM-05-2711); (iv) claims brought on behalf of shareholders of Janus Capital Group Inc. ("JCGI") on a derivative basis against the Board of Directors of JCGI (Chasen v. Whiston, et al., U.S. District Court, District of Maryland, Case No. 04-MD-00855); and (v) claims by a putative class of shareholders of JCGI asserting claims on behalf of the shareholders (Wiggins, et al. v. Janus Capital Group, Inc., et al., U.S. District Court, District of Maryland, Case No. 04-CV-00818). Each of the five complaints initially named JCGI and/or Janus Capita l as a defendant. In addition, the following were also named as defendants in one or more of the actions: Janus Investment Fund ("JIF"), Janus Aspen Series ("JAS"), Janus Adviser Series ("JAD"), Janus Distributors LLC, Enhanced Investment Technologies, LLC ("INTECH"), Bay Isle Financial LLC ("Bay Isle"), Perkins, Wolf, McDonnell and Company, LLC ("Perkins"), the Advisory Committee of the Janus 401(k) plan, and the current or former directors of JCGI.
On August 25, 2005, the Court entered orders dismissing most of the claims asserted against Janus Capital and its affiliates by fund investors in the Marini and Steinberg cases (actions (i) and (ii) above) except certain claims under Section 10(b) of the Securities Exchange Act of 1934 and under Section 36(b) of the Investment Company Act of 1940, as amended (the "1940 Act"). On August 15, 2006, the Wangberger complaint in the 401(k) plan class action (action (iii) above) was dismissed by the district court with prejudice. The plaintiff appealed that dismissal decision to the United States Court of Appeals for the Fourth Circuit. The appeal is still pending and argument in the matter was held in December 2007. The Court also dismissed the Chasen lawsuit (action (iv) above) against JCGI's Board of Directors without leave to amend. Finally, a Motion to Dismiss the Wiggins suit (action (v) above) was granted a nd the matter was dismissed in May 2007. However, in June 2007, Plaintiffs appealed that dismissal to the United States Court of Appeals for the Fourth Circuit. That appeal is currently pending.
In addition to the lawsuits described above, the Auditor of the State of West Virginia ("Auditor"), in his capacity as securities commissioner, has initiated administrative proceedings against many of the defendants in the market timing cases (including JCGI and Janus Capital) and, as a part of its relief, is seeking disgorgement and other monetary relief based on similar market timing allegations (In the Matter of Janus Capital Group Inc. et al., Before the Securities Commissioner, State of West Virginia, Summary Order No. 05-1320). The respondents in these proceedings collectively sought a Writ of Prohibition in state court, which was denied. Their subsequent Petition for Appeal was also denied. Consequently, in September 2006, JCGI and Janus Capital filed their answer to the Auditor's summary order instituting proceedings and requested a hearing. A status conference was held on June 28, 2007, during which the parties were ordered t o submit their proposed scheduling order. To date, no scheduling order has been entered in the case. In addition to the pending Motion to Discharge Order to Show Cause, JCGI and Janus Capital, as well as other similarly situated defendants, continue to challenge the statutory authority of the Auditor to bring such an action.
Additional lawsuits may be filed against certain of the Janus funds, Janus Capital, and related parties in the future. Janus Capital does not currently believe that these pending actions will materially affect its ability to continue providing services it has agreed to provide to the Janus funds.
Janus Aspen Series December 31, 2007 23
Report of Independent Registered Public Accounting Firm
To the Trustees and Shareholders
of Janus Aspen Large Cap Growth Portfolio
In our opinion, the accompanying statement of assets and liabilities, including the schedule of investments, and the related statements of operations and of changes in net assets and the financial highlights present fairly, in all material respects, the financial position of Janus Aspen Large Cap Growth Portfolio (one of the portfolios constituting Janus Aspen Series, hereafter referred to as the "Portfolio") at December 31, 2007, the results of its operations for the year then ended, the changes in its net assets for each of the two years in the period then ended, and the financial highlights for each of the five years in the period then ended, in conformity with accounting principles generally accepted in the United States of America. These financial statements and financial highlights (hereafter referred to as "financial statements") are the responsibility of the Portfolio's management; our responsibility is to express an opinion on these financial statements based on our audits. We conducted our audits of these financial statements in accordance with the standards of the Public Company Accounting Oversight Board (United States). Those standards require that we plan and perform the audit to obtain reasonable assurance about whether the financial statements are free of material misstatement. An audit includes examining, on a test basis, evidence supporting the amounts and disclosures in the financial statements, assessing the accounting principles used and significant estimates made by management, and evaluating the overall financial statement presentation. We believe that our audits, which included confirmation of securities at December 31, 2007 by correspondence with the custodian, transfer agent and brokers, and the application of alternative auditing procedures where securities purchased had not been received, provide a reasonable basis for our opinion.

Denver, Colorado
February 15, 2008
24 Janus Aspen Series December 31, 2007
Additional Information (unaudited)
PROXY VOTING POLICIES AND VOTING RECORD
A description of the policies and procedures that the Portfolio uses to determine how to vote proxies relating to its portfolio securities is available: (i) without charge, upon request, by calling 1-800-525-0020 (toll free); (ii) on the Portfolio's website at www.janus.com/proxyvoting; and (iii) on the SEC's website at http://www.sec.gov. Additionally, information regarding the Portfolio's proxy voting record for the most recent twelve- month period ended June 30 is also available, free of charge, through www.janus.com/proxyvoting and from the SEC's website at http://www.sec.gov.
QUARTERLY PORTFOLIO HOLDINGS
The Portfolio files its complete portfolio holdings (schedule of investments) with the SEC for the first and third quarters of each fiscal year on Form N-Q within 60 days of the end of such fiscal quarter. The Portfolio's Form N-Q: (i) is available on the SEC's website at http://www.sec.gov; (ii) may be reviewed and copied at the SEC's Public Reference Room in Washington, D.C. (information on the Public Reference Room may be obtained by calling 1-800-SEC-0330); and (iii) is available without charge, upon request, by calling Janus at 1-800-525-0020 (toll free).
APPROVAL OF ADVISORY AGREEMENTS DURING THE PERIOD
The Trustees of Janus Aspen Series, none of whom has ever been affiliated with Janus Capital ("Independent Trustees"), oversee the management of each Portfolio and, as required by law, determine annually whether to continue the investment advisory agreement for each Portfolio and the subadvisory agreements for the three Portfolios that utilize subadvisers.
In connection with their most recent consideration of those agreements for each Portfolio, the Trustees received and reviewed a substantial amount of information provided by Janus Capital and the respective subadvisers in response to requests of the Independent Trustees and their independent legal counsel. They also received and reviewed a considerable amount of information and analysis provided by their independent fee consultant. Throughout their consideration of the agreements, the Independent Trustees were advised by their independent legal counsel. The Independent Trustees met with management to consider the agreements, and also met separately in executive session with their independent legal counsel and their independent fee consultant.
At a meeting held on December 14, 2007, based on their evaluation of the information provided by Janus Capital, the subadvisers and the independent fee consultant, as well as other information, the Trustees determined that the overall arrangements between each Portfolio and Janus Capital and each subadviser, as applicable, were fair and reasonable in light of the nature, extent and quality of the services provided by Janus Capital, its affiliates and the subadvisers, the fees charged for those services, and other matters that the Trustees considered relevant in the exercise of their business judgment. At that meeting the Trustees unanimously approved the continuation of the investment advisory agreement for each Portfolio, and the subadvisory agreement for each subadvised Portfolio, for the period from February 1, 2008 through February 1, 2009, subject to earlier termina tion as provided for in each agreement.
In considering the continuation of those agreements, the Trustees reviewed and analyzed various factors that they determined were relevant, including the factors described below, none of which by itself was considered dispositive. However, the material factors and conclusions that formed the basis for the Trustees' determination to approve the continuation of the agreements are discussed separately below.
Nature, Extent and Quality of Services
The Trustees reviewed the nature, extent and quality of the services provided by Janus Capital and the subadvisers to the Portfolios, taking into account the investment objective and strategy of each Portfolio, the knowledge of the Trustees gained from their regular meetings with management on at least a quarterly basis, and their ongoing review of information related to the Portfolios. In addition, the Trustees reviewed the resources and key personnel of Janus Capital and each subadviser, especially those who provide investment management services to the Portfolios. The Trustees also considered other services provided to the Portfolios by Janus Capital or the subadvisers, such as managing the execution of portfolio transactions and the selection of broker-dealers for those transactions, serving as the Portfolios' administrator, monitoring adherence to the Portfolios' investment restrictions, producing shareholder reports, providing support services for the Trustees and Trustee committees, communicating with shareholders, and overseeing the activities of other service providers, including monitoring compliance with various policies and procedures of the Portfolios and with applicable securities laws and regulations.
The Trustees concluded that the nature, extent and quality of the services provided by Janus Capital and/or the subadviser to each Portfolio were appropriate and consistent with the terms of the respective advisory and subadvisory agreements; that, taking into account steps taken to address those Portfolios whose performance lagged that of the median of their peers for certain periods, the quality of those services had been consistent with or superior to quality norms in the industry; and that the Portfolios were likely to benefit from the continued provision of those services. They also concluded that Janus Capital and each subadviser had sufficient personnel, with the appropriate education and experience, to
Janus Aspen Series December 31, 2007 25
Additional Information (unaudited) (continued)
serve the Portfolios effectively and had demonstrated its continuing ability to attract well-qualified personnel.
Performance of the Portfolios
The Trustees considered the investment results of each Portfolio over various time periods. They reviewed information comparing each Portfolio's performance with the performance of comparable funds and peer groups identified by Lipper Inc., an independent provider of investment company data, and with the Portfolio's benchmark index. They concluded that the performance of many Portfolios was good to very good under current market conditions. Although the performance of some Portfolios lagged that of the median of their peers for certain periods, the Trustees also concluded that Janus Capital had taken appropriate steps to address those instances of under-performance and that the more recent performance of most of those Portfolios had been improving.
Costs of Services Provided
The Trustees examined information on the fees and expenses of each Portfolio in comparison to similar information for comparable funds as provided by Lipper. They also reviewed an analysis of that information provided by their independent fee consultant and noted that the rate of management (investment advisory and administrative) fees for most of the Portfolios, in some cases after contractual expense limitations, was below the mean management fee rate of the respective peer group of funds selected by Lipper.
The Trustees considered the methodology used by Janus Capital and each subadviser in determining compensation payable to portfolio managers, the competitive environment for investment management talent and the competitive market for mutual funds in different distribution channels. They concluded that the compensation methodology provided a good alignment of the interests of the portfolio managers with those of Portfolio shareholders.
The Trustees also reviewed management fees charged by Janus Capital to its separate account clients and to its subadvised funds (for which Janus Capital provides only services related to portfolio management). Although in most instances subadvisory and separate account fee rates for various investment strategies were lower than management fee rates for Portfolios having a similar strategy, the Trustees noted that, under the terms of the management agreements with the Portfolios, Janus Capital performs significant additional services for the Portfolios that it does not provide to those other clients, including administrative services, oversight of the Portfolios' other service providers, Trustee support, regulatory compliance and numerous other services, and that, in serving the Portfolios, Janus Capital assumes many legal risks that it does not assume in servicing its other clients. Moreover, the Trustees noted that the spread between the av erage fee rates charged to the Portfolios and the fee rates that Janus Capital charged to its separate account clients was significantly smaller than the average spread for such fee rates of other advisers, based on publicly available data and research conducted by their independent fee consultant.
The Trustees reviewed information on the profitability to Janus Capital and its affiliates of their relationships with each Portfolio, as well as an explanation of the methodology used in allocating various expenses of Janus Capital and its affiliates among the Portfolios and other clients. They also reviewed the financial statements of Janus Capital's parent company and its corporate structure. In their review, the Trustees considered whether Janus Capital and each subadviser receives adequate incentives to manage the Portfolios effectively. They recognized that profitability comparisons among investment advisers are difficult because very little comparative information is publicly available and profitability of any adviser is affected by numerous factors, including the organizational structure of the particular adviser, the types of funds and other accounts it manages, possible other lines of business, the methodology for allocating expens es, and the adviser's capital structure and cost of capital. However, based on the information available and taking those factors into account, the Trustees concluded that Janus Capital's profitability with respect to each Portfolio in relation to the services rendered was not unreasonable.
The Trustees concluded that the management fees and other compensation payable by each Portfolio to Janus Capital and its affiliates, as well as the fees payable by Janus Capital or the Portfolios to the subadvisers of subadvised Portfolios, were reasonable in relation to the nature, extent and quality of the services provided, taking into account the fees charged by other advisers for managing comparable mutual funds with similar strategies and the fees Janus Capital and the subadvisers charge to other clients. They also concluded that the overall expense ratio of each Portfolio was reasonable, taking into account the size of the Portfolio, the quality of services provided by Janus Capital and any subadviser, the investment performance of the Portfolio and any expense limitations agreed to by Janus Capital.
Economies of Scale
The Trustees considered information about the potential for Janus Capital to realize economies of scale as the assets of the Portfolios increase. They noted that, although most Portfolios pay advisory fees at a fixed rate as a percentage of net assets, without any breakpoints, the management fee rate paid by each Portfolio, after any contractual expense limitations, was below the mean management fee rate of the Portfolio's peer group selected by Lipper; and, for those Portfolios whose expenses are being reduced by the contractual expense limitations of Janus Capital, Janus Capital is subsidizing the Portfolios because they have not reached adequate scale. Moreover, as the assets of many of the Portfolios declined in the past few years, those Portfolios benefited from having
26 Janus Aspen Series December 31, 2007
advisory fee rates that remained constant rather than increasing as assets declined. In addition, performance fee structures have been implemented for several Portfolios that will cause the effective rate of advisory fees payable by such a Portfolio to vary depending on the investment performance of the Portfolio relative to its benchmark index over the measurement period; and a few Portfolios have fee schedules with breakpoints and reduced fee rates above certain asset levels. The Trustees also noted that the Portfolios share directly in economies of scale through lower charges of third-party service providers, based on the combined scale of all of the Portfolios. Based on all of the information they reviewed, the Trustees concluded that the current fee structure of each Portfolio was reasonable and that the current rates of fees do reflect a sharing between Janus Capital and the Portfolio of economies of scale at the current asset level of the Portfolio.
Other Benefits to Janus Capital
The Trustees also considered benefits that accrue to Janus Capital and its affiliates from their relationships with the Portfolios. They recognized that two affiliates of Janus Capital separately serve the Portfolios as transfer agent and distributor, respectively. They also considered Janus Capital's past and proposed use of commissions paid by Portfolios on their portfolio brokerage transactions to obtain proprietary and third-party research products and services benefiting those Portfolios and/or other clients of Janus Capital. The Trustees concluded that Janus Capital's use of "soft" commission dollars of a Portfolio to obtain proprietary and third-party research products and services was consistent with regulatory requirements and guidelines and was likely to benefit the Portfolios. The Trustees also concluded that, other than the services provided by Janus Capital and its affiliates pursuant to the agreements and the fees to be paid by each Portfolio therefor, the Portfolios and Janus Capital may potentially benefit from their relationship with each other in other ways. They concluded that Janus Capital benefits from the receipt of proprietary research products and services acquired through commissions paid on portfolio transactions of the Portfolios and that the Portfolios benefit from Janus Capital's receipt of those products and services, as well as research products and services acquired through commissions paid by other clients of Janus Capital. They further concluded that success of any Portfolio could attract other business to Janus Capital or other Janus funds and that the success of Janus Capital could enhance Janus Capital's ability to serve the Portfolios.
After full consideration of the above factors, as well as other factors, all of the Trustees, all of whom are Independent Trustees, concluded that the proposed continuation of the investment advisory agreement for each Portfolio, and the subadvisory agreement for each subadvised Portfolio, was in the best interest of the respective Portfolios and their shareholders.
Janus Aspen Series December 31, 2007 27
Explanations of Charts, Tables and
Financial Statements (unaudited)
1. PERFORMANCE OVERVIEWS
The performance overview graph compares the performance of a hypothetical $10,000 investment in the Portfolio with one or more widely used market indices. The hypothetical example does not represent the returns of any particular investment.
When comparing the performance of the Portfolio with an index, keep in mind that market indices do not include brokerage commissions that would be incurred if you purchased the individual securities in the index. They also do not include taxes payable on dividends and interest or operating expenses incurred if you maintained a Portfolio invested in the index.
Average annual total returns are quoted for each class of the Portfolio. Average annual total return is calculated by taking the growth or decline in value of an investment over a period of time, including reinvestment of any dividends, distributions and capital gains, then calculating the annual compounded percentage rate that would have produced the same result had the rate of growth been constant throughout the period. Average annual total return does not reflect the deduction of taxes that a shareholder would pay on Portfolio distributions or redemptions of Portfolio shares.
Pursuant to federal securities rules, expense ratios shown in the performance chart reflect subsidized and unsubsidized ratios for the past fiscal year. The total annual portfolio operating expenses ratio is gross of any fee waivers, reflecting a Portfolio's unsubsidized expense ratio. The net annual portfolio operating expenses ratio (if applicable) includes contractual waivers of Janus Capital and/or Janus Services and reflects a Portfolio's subsidized expense ratio. Both the total annual portfolio operating expenses ratio and net annual portfolio operating expenses ratio are based on average net assets as of the fiscal year ended December 31, 2006. The ratios also include expenses indirectly incurred by the Portfolio as a result of investing in other investment companies or pooled investments, which are not reflected in the "Financial Highlights" of this report. As a result, these ratios may be higher or lower than those shown in the "Fin ancial Highlights" in this report. All expenses are shown without the effect of expense offset arrangements. Pursuant to such arrangements, credits realized as a result of uninvested cash balances are used to reduce custodian and transfer agent expenses.
2. SCHEDULE OF INVESTMENTS
Following the performance overview section is the Portfolio's Schedule of Investments. This schedule reports the industry concentrations and types of securities held in the Portfolio on the last day of the reporting period. Securities are usually listed by type (common stock, corporate bonds, U.S. Government obligations, etc.) and by industry classification (banking, communications, insurance, etc.). Holdings are subject to change without notice.
The value of each security is quoted as of the last day of the reporting period. The value of securities denominated in foreign currencies is converted into U.S. dollars. Certain short-term investments maturing within 60 days are valued at amortized cost, which approximates market value.
A summary of investments by country is provided if the Portfolio invested in foreign securities. This summary reports the Portfolio's exposure to different countries by providing the percentage of securities invested in each country. The country of each security represents the country in which the company is incorporated.
2A. FORWARD CURRENCY CONTRACTS
A table listing forward currency contracts follows the Portfolio's Schedule of Investments (if applicable). Forward currency contracts are agreements to deliver or receive a preset amount of currency at a future date. Forward currency contracts are used to hedge against foreign currency risk in the Portfolio's long-term holdings.
The table provides the name of the foreign currency, the settlement date of the contract, the amount of the contract, the value of the currency in U.S. dollars and the amount of unrealized gain or loss. The amount of unrealized gain or loss reflects the change in currency exchange rates from the time the contract was opened to the last day of the reporting period.
2B. FUTURES
A table listing futures contracts follows the Portfolio's Schedule of Investments (if applicable). Futures contracts are contracts that obligate the buyer to receive and the seller to deliver an instrument or money at a specified price on a specified date. Futures are used to hedge against adverse movements in securities prices, currency risk or interest rates.
The table provides the name of the contract, number of contracts held, the expiration date, the principal amount, value and the amount of unrealized gain or loss. The amount of unrealized gain or loss reflects the marked-to-market amount for the last day of the reporting period.
2C. OPTIONS
A table listing written option contracts follows the Portfolio's Schedule of Investments (if applicable). Written option contracts are contracts that obligate the Portfolio to sell or purchase an underlying security at a fixed price, upon exercise of the option. Options are used to hedge against adverse movements in securities prices, currency risk or interest rates.
28 Janus Aspen Series December 31, 2007
The table provides the name of the contract, number of contracts held, the expiration date, exercise price, value and premiums received.
3. STATEMENT OF ASSETS AND LIABILITIES
This statement is often referred to as the "balance sheet." It lists the assets and liabilities of the Portfolio on the last day of the reporting period.
The Portfolio's assets are calculated by adding the value of the securities owned, the receivable for securities sold but not yet settled, the receivable for dividends declared but not yet received on stocks owned and the receivable for Portfolio shares sold to investors but not yet settled. The Portfolio's liabilities include payables for securities purchased but not yet settled, Portfolio shares redeemed but not yet paid and expenses owed but not yet paid. Additionally, there may be other assets and liabilities such as unrealized gain or loss on forward currency contracts.
The section entitled "Net Assets Consist of" breaks down the components of the Portfolio's net assets. Because the Portfolio must distribute substantially all earnings, you will notice that a significant portion of net assets is shareholder capital.
The last section of this statement reports the net asset value ("NAV") per share on the last day of the reporting period for each class of the Portfolio. The NAV is calculated by dividing the Portfolio's net assets (assets minus liabilities) by the number of shares outstanding.
4. STATEMENT OF OPERATIONS
This statement details the Portfolio's income, expenses, gains and losses on securities and currency transactions, and appreciation or depreciation of current Portfolio holdings.
The first section in this statement, entitled "Investment Income," reports the dividends earned from stocks and interest earned from interest-bearing securities in the Portfolio.
The next section reports the expenses and expense offsets incurred by the Portfolio, including the advisory fee paid to the investment adviser, transfer agent fees and expenses, printing and postage for mailing statements, financial reports and prospectuses, and other expenses. Expense offsets, if any, are also shown.
The last section lists the increase or decrease in the value of securities held in the Portfolio. The Portfolio realizes a gain (or loss) when it sells its position in a particular security. An unrealized gain (or loss) refers to the change in net appreciation or depreciation of the Portfolio during the reporting period. "Net Realized and Unrealized Gain/(Loss) on Investments" is affected both by changes in the market value of Portfolio holdings and by gains (or losses) realized during the reporting period.
5. STATEMENT OF CHANGES IN NET ASSETS
This statement reports the increase or decrease in the Portfolio's net assets during the reporting period. Changes in the Portfolio's net assets are attributable to investment operations, dividends, distributions and capital share transactions. This is important to investors because it shows exactly what caused the Portfolio's net asset size to change during the period.
The first section summarizes the information from the Statement of Operations regarding changes in net assets due to the Portfolio's investment performance. The Portfolio's net assets may also change as a result of dividend and capital gains distributions to investors. If investors receive their dividends in cash, money is taken out of the Portfolio to pay the distribution. If investors reinvest their dividends, the Portfolio's net assets will not be affected. If you compare the Portfolio's "Net Decrease from Dividends and Distributions" to the "Reinvested dividends and distributions," you will notice that dividend distributions had little effect on the Portfolio's net assets. This is because the majority of Janus investors reinvest their distributions.
The reinvestment of dividends is included under "Capital Share Transactions." "Capital Shares" refers to the money investors contribute to the Portfolio through purchases or withdraw via redemptions. The Portfolio's net assets will increase and decrease in value as investors purchase and redeem shares from the Portfolio.
6. FINANCIAL HIGHLIGHTS
This schedule provides a per-share breakdown of the components that affect the Portfolio's NAV for current and past reporting periods for each class of the Portfolio. Not only does this table provide you with total return, it also reports total distributions, asset size, expense ratios and portfolio turnover rate.
The first line in the table reflects the NAV per share at the beginning of the reporting period. The next line reports the net investment income per share, which comprises dividends and interest income earned on securities held by the Portfolio. Following is the total of gains/(losses), realized and unrealized. Dividends and distributions are then subtracted to arrive at the NAV per share at the end of the period. The next line reflects the average annual total return reported the last day of the period.
Janus Aspen Series December 31, 2007 29
Explanations of Charts, Tables and
Financial Statements (unaudited) (continued)
Also included are the expense ratios, or the percentage of average net assets that were used to cover operating expenses during the period. Expense ratios vary for a number of reasons, including the differences in management fees, the average shareholder account size and the extent of foreign investments, which entail greater transaction costs.
The Portfolio's expenses may be reduced through expense reduction arrangements. These arrangements may include the use of balance credits or transfer agent fee offsets. The Statement of Operations reflects total expenses before any such offset, the amount of the offset and the net expenses. The expense ratios listed in the Financial Highlights reflect total expenses prior to any expense offsets (gross expense ratio) and after the expense offsets (net expense ratio). Both expense ratios reflect expenses after waivers (reimbursements), if applicable.
The ratio of net investment income/(loss) summarizes the income earned less expenses, divided by the average net assets of the Portfolio during the reporting period. Don't confuse this ratio with the Portfolio's yield. The net investment income ratio is not a true measure of the Portfolio's yield because it doesn't take into account the dividends distributed to the Portfolio's investors.
The next figure is the portfolio turnover rate, which measures the buying and selling activity in the Portfolio. Portfolio turnover is affected by market conditions, changes in the asset size of the Portfolio, the nature of the Portfolio's investments and the investment style of the portfolio manager. A 100% rate implies that an amount equal to the value of the entire portfolio is turned over in a year; a 50% rate means that an amount equal to the value of half the portfolio is traded in a year; and a 200% rate means that an amount equal to the value of the portfolio is traded every six months.
30 Janus Aspen Series December 31, 2007
Designation Requirements (unaudited)
For federal income tax purposes, the Portfolio designated the following for the year ended December 31, 2007:
Dividends Received Deduction Percentage
| Portfolio | |||||||
| Janus Aspen Large Cap Growth Portfolio | 100 | % | |||||
Janus Aspen Series December 31, 2007 31
Trustees and Officers (unaudited)
The Portfolio's Statement of Additional Information includes additional information about the Trustees and officers and is available, without charge, by calling 1-800-525-0020.
The following are the Trustees and officers of the Trust, together with a brief description of their principal occupations during the last five years (principal occupations for certain Trustees may include periods over five years).
Each Trustee has served in that capacity since he or she was originally elected or appointed. The Trustees do not serve a specified term of office. Each Trustee will hold office until the termination of the Trust or his or her earlier death, resignation, retirement, incapacity, or removal. The retirement age for Trustees is 72. The Portfolio's Nominating and Governance Committee will consider nominees for the position of Trustee recommended by shareholders. Shareholders may submit the name of a candidate for consideration by the Committee by submitting their recommendations to the Trust's Secretary. Each Trustee is currently a Trustee of two other registered investment companies advised by Janus Capital: Janus Investment Fund and Janus Adviser Series. As of the date of this report, collectively, these three registered investment companies consist of 75 series or funds.
The Trust's officers are elected annually by the Trustees for a one-year term. Certain officers also serve as officers of Janus Investment Fund and Janus Adviser Series. Certain officers of the Portfolio may also be officers and/or directors of Janus Capital. Portfolio officers receive no compensation from the Portfolio, except for the Portfolio's Chief Compliance Officer, as authorized by the Trustees.
Trustees
| Name, Address, and Age | Positions Held with Portfolio | Length of Time Served | Principal Occupations During the Past Five Years | Number of Portfolios/ Funds in Fund Complex Overseen by Trustee | Other Directorships Held by Trustee | ||||||||||||||||||
| Dennis B. Mullen* 151 Detroit Street Denver, CO 80206 DOB: 1943 | Chairman Trustee | 3/04-12/07 9/93-Present | Chief Executive Officer of Red Robin Gourmet Burgers, Inc. (since 2005). Formerly, private investor. | 75 | ** | Chairman of the Board (since 2005) and Director of Red Robin Gourmet Burgers, Inc., and Director of Janus Capital Funds Plc (Dublin-based, non-U.S. funds). | |||||||||||||||||
| Jerome S. Contro 151 Detroit Street Denver, CO 80206 DOB: 1956 | Trustee | 12/05-Present | Partner of Tango Group, a private investment firm (since 1999). | 75 | Trustee and Chairman of RS Investment Trust (since 2001), and Director of IZZE Beverages and MyFamily.com, Inc. (genealogical research website). | ||||||||||||||||||
| William F. McCalpin 151 Detroit Street Denver, CO 80206 DOB: 1957 | Trustee | 6/02-Present | Private investor. Formerly, Executive Vice President and Chief Operating Officer of The Rockefeller Brothers Fund (a private family foundation), and Vice President of Asian Cultural Council. | 75 | Director of F.B. Heron Foundation (a private grant making foundation). | ||||||||||||||||||
| John W. McCarter, Jr. 151 Detroit Street Denver, CO 80206 DOB: 1938 | Trustee | 6/02-Present | President and Chief Executive Officer of The Field Museum of Natural History (Chicago, IL) (since 1997). | 75 | Chairman of the Board and Director of Divergence Inc. (biotechnology firm); Director of W.W. Grainger, Inc. (industrial distributor); and Trustee of WTTW (Chicago public television station) and the University of Chicago. | ||||||||||||||||||
*Mr. McCalpin will succeed Mr. Mullen as Chairman as of January 1, 2008.
**Mr. Mullen also serves as director of Janus Capital Funds Plc, consisting of 16 funds. Including Janus Capital Funds Plc and the 75 funds comprising the Janus funds, Mr. Mullen oversees 91 funds.
32 Janus Aspen Series December 31, 2007
Trustees (cont.)
| Name, Address, and Age | Positions Held with Portfolio | Length of Time Served | Principal Occupations During the Past Five Years | Number of Portfolios/ Funds in Fund Complex Overseen by Trustee | Other Directorships Held by Trustee | ||||||||||||||||||
| James T. Rothe 151 Detroit Street Denver, CO 80206 DOB: 1943 | Trustee | 1/97-Present | Co-founder and Managing Director of Roaring Fork Capital Management, LLC (private investment in public equity firm), and Professor Emeritus of Business of the University of Colorado, Colorado Springs, CO (since 2004). Formerly, Professor of Business of the University of Colorado (2002-2004) and Distinguished Visiting Professor of Business (2001-2002) of Thunderbird (American Graduate School of International Management), Glendale, AZ. | 75 | Director of Red Robin Gourmet Burgers, Inc. | ||||||||||||||||||
| William D. Stewart 151 Detroit Street Denver, CO 80206 DOB: 1944 | Trustee | 9/93-Present | Corporate Vice President and General Manager of MKS Instruments – HPS Products, Boulder, CO (a manufacturer of vacuum fittings and valves). | 75 | N/A | ||||||||||||||||||
| Martin H. Waldinger 151 Detroit Street Denver, CO 80206 DOB: 1938 | Trustee | 9/93-Present | Private Investor and Consultant to California Planned Unit Developments (since 1994). Formerly, CEO and President of Marwal, Inc. (homeowner association management company). | 75 | N/A | ||||||||||||||||||
| Linda S. Wolf 151 Detroit Street Denver, CO 80206 DOB: 1947 | Trustee | 12/05-Present | Retired. Formerly, Chairman and Chief Executive Officer of Leo Burnett (Worldwide) (advertising agency) (2001-2005). | 75 | Director of Wal-Mart, The Field Museum of Natural History (Chicago, IL), Children's Memorial Hospital (Chicago, IL), Chicago Council on Foreign Relations, Economic Club of Chicago, and InnerWorkings (U.S. provider of print procurement solutions). | ||||||||||||||||||
Janus Aspen Series December 31, 2007 33
Trustees and Officers (unaudited) (continued)
Officers
| Name, Address, and Age | Positions Held with Portfolio | Term of Office* and Length of Time Served | Principal Occupations During the Past Five Years | ||||||||||||
| Jonathan D. Coleman 151 Detroit Street Denver, CO 80206 DOB: 1971 | Executive Vice President and Co-Portfolio Manager Janus Aspen Large Cap Growth Portfolio | 11/07-Present | Co-Chief Investment Officer and Executive Vice President of Janus Capital, and Portfolio Manager for other Janus accounts. Formerly, Portfolio Manager (2002-2007) for Mid Cap Growth Portfolio and Vice President (1998-2006) of Janus Capital. | ||||||||||||
| Daniel Riff 151 Detroit Street Denver, CO 80206 DOB: 1972 | Executive Vice President and Co-Portfolio Manager Janus Aspen Large Cap Growth Portfolio | 11/07-Present | Portfolio Manager for other Janus accounts. Formerly, Analyst (2003-2007) for Janus Capital. | ||||||||||||
| Stephanie Grauerholz-Lofton 151 Detroit Street Denver, CO 80206 DOB: 1970 | Chief Legal Counsel and Secretary Vice President | 1/06-Present 3/06-Present | Vice President and Assistant General Counsel of Janus Capital, and Vice President and Assistant Secretary of Janus Distributors LLC. Formerly, Assistant Vice President of Janus Capital and Janus Distributors LLC (2006), and Associate of Vedder, Price, Kaufman & Kammholz, P.C. (1999-2003). | ||||||||||||
| Andrew J. Iseman 151 Detroit Street Denver, CO 80206 DOB: 1964 | President and Chief Executive Officer | 3/07-Present | Chief Operating Officer and Senior Vice President of Janus Capital Group, Inc. and Janus Capital; President of Janus Services LLC; and Director of Capital Group Partners, Inc. Formerly, Senior Vice President of Enhanced Investment Technologies, LLC (2005-2007); and Vice President of Janus Capital (2003-2005) and Janus Services LLC (2003-2004). | ||||||||||||
| David R. Kowalski 151 Detroit Street Denver, CO 80206 DOB: 1957 | Vice President, Chief Compliance Officer, and Anti-Money Laundering Officer | 6/02-Present | �� | Senior Vice President and Chief Compliance Officer of Janus Capital, Janus Distributors LLC, and Janus Services LLC; Chief Compliance Officer of Bay Isle Financial LLC; and Vice President of Enhanced Investment Technologies, LLC. Formerly, Chief Compliance Officer of Enhanced Investment Technologies, LLC (2003-2005); Vice President of Janus Capital (2000-2005) and Janus Services LLC (2004-2005); and Assistant Vice President of Janus Services LLC (2000-2004). | |||||||||||
| Jesper Nergaard 151 Detroit Street Denver, CO 80206 DOB: 1962 | Chief Financial Officer Vice President, Treasurer, and Principal Accounting Officer | 3/05-Present 2/05-Present | Vice President of Janus Capital. Formerly, Director of Financial Reporting for OppenheimerFunds, Inc. (2004-2005); Site Manager and First Vice President of Mellon Global Securities Services (2003); and Director of Fund Accounting, Project Development, and Training of INVESCO Funds Group (1994-2003). | ||||||||||||
*Officers are elected at least annually by the Trustees for a one-year term and may also be elected from time to time by the Trustees for an interim period.
34 Janus Aspen Series December 31, 2007
Notes
Janus Aspen Series December 31, 2007 35
Notes
36 Janus Aspen Series December 31, 2007
Notes
Janus Aspen Series December 31, 2007 37
Janus provides access to a wide range of investment disciplines.
Growth
Janus growth portfolios focus on companies believed to be the leaders in their respective industries, with solid management teams, expanding market share, margins and efficiencies.
Core
Janus core portfolios seek investments in more stable and predictable companies. These portfolios look for a strategic combination of steady growth and for certain portfolios, some degree of income.
Risk-Managed
Our risk-managed portfolios seek to outperform their respective indices while maintaining a risk profile equal to or lower than the index itself. Managed by INTECH (a Janus subsidiary), these portfolios use a mathematical process in an attempt to build a more "efficient" portfolio than the index.
Value
Janus value portfolios invest in companies they believe are poised for a turnaround or are trading at a significant discount to fair value. The goal is to gain unique insight into a company's true value and identify and evaluate potential catalysts that may unlock shareholder value.
International & Global
Janus international and global portfolios seek to leverage Janus' research capabilities by taking advantage of inefficiencies in foreign markets, where accurate information and analytical insight are often at a premium.
Bond
Janus bond portfolios attempt to provide less risk relative to equities while seeking to deliver a competitive total return through high current income and appreciation.
Money Market
Janus money market portfolios seek maximum current income consistent with stability of capital.
For more information about our funds, contact your investment professional or go to www.janus.com/info
Please consider the charges, risks, expenses and investment objectives carefully before investing. For a prospectus containing this and other information, please call Janus at 1-800-525-0020 or download the file from www.janus.com/info. Read it carefully before you invest or send money.
An investment in a money market portfolio is not insured or guaranteed by the Federal Deposit Insurance Corporation or any other government agency. Although the Portfolio seeks to preserve the value of your investment at $1.00 per share, it is possible to lose money by investing in the Portfolio.

151 Detroit Street
Denver, CO 80206
1-800-525-0020
Portfolio distributed by Janus Distributors LLC (2/08)
C-0108-357 109-02-701 02-08
2007 Annual Report
Janus Aspen Series
Janus Aspen Mid Cap Growth Portfolio
Look Inside. . .
• Portfolio management perspective
• Investment strategy behind your portfolio
• Portfolio performance, characteristics and holdings

Table of Contents
| Useful Information About Your Portfolio Report | 1 | ||||||
| Management Commentary and Schedule of Investments | 2 | ||||||
| Statement of Assets and Liabilities | 11 | ||||||
| Statement of Operations | 12 | ||||||
| Statements of Changes in Net Assets | 13 | ||||||
| Financial Highlights | 14 | ||||||
| Notes to Schedule of Investments | 15 | ||||||
| Notes to Financial Statements | 16 | ||||||
| Report of Independent Registered Public Accounting Firm | 23 | ||||||
| Additional Information | 24 | ||||||
| Explanation of Charts, Tables and Financial Statements | 27 | ||||||
| Designation Requirements | 29 | ||||||
| Trustees and Officers | 30 | ||||||
Please consider the charges, risks, expenses and investment objectives carefully before investing. For a prospectus containing this and other information, please call Janus at 1-800-525-0020 or download the file from www.janus.com/info. Read it carefully before you invest or send money.
Useful Information About Your Portfolio Report
Management Commentary
The Management Commentary in this report includes valuable insight from the Portfolio's manager as well as statistical information to help you understand how your Portfolio's performance and characteristics stack up against those of comparable indices.
Please keep in mind that the opinions expressed by the Portfolio's manager in the Management Commentary are just that: opinions. They are a reflection of the manager's best judgment at the time this report was compiled, which was December 31, 2007. As the investing environment changes, so could the manager's opinions. The views are unique to the manager and aren't necessarily shared by his fellow employees or by Janus in general.
Portfolio Expenses
We believe it's important for our shareholders to have a clear understanding of Portfolio expenses and the impact they have on investment return.
The following is important information regarding the Portfolio's Expense Example, which appears in the Management Commentary within this Annual Report. Please refer to this information when reviewing the Expense Example for the Portfolio.
Example
As a shareholder of a Portfolio, you incur two types of costs: (1) transaction costs, including redemption fees (where applicable) (and any related exchange fees) and (2) ongoing costs, including management fees; distribution and shareholder servicing (12b-1) fees (applicable to Service Shares only); and other Portfolio expenses. The example is intended to help you understand your ongoing costs (in dollars) of investing in a Portfolio and to compare these costs with the ongoing costs of investing in other mutual funds. To do so, compare this 5% hypothetical example with the 5% hypothetical examples that appear in the shareholder reports of the other funds. The example is based upon an investment of $1,000 invested at the beginning of the period and held for the six-month period from July 1, 2007 to December 31, 2007.
Actual Expenses
The first line of the table in each example provides information about actual account values and actual expenses. You may use the information in this line, together with the amount you invested, to estimate the expenses that you paid over the period. Simply divide your account value by $1,000 (for example, an $8,600 account value divided by $1,000 = 8.6), then multiply the result by the number in the first line under the heading entitled "Expenses Paid During Period" to estimate the expenses you paid on your account during the period.
Hypothetical Example for Comparison Purposes
The second line of the table in each example provides information about hypothetical account values and hypothetical expenses based upon the Portfolio's actual expense ratio and an assumed rate of return of 5% per year before expenses, which is not the Portfolio's actual return. The hypothetical account values and expenses may not be used to estimate the actual ending account balance or expenses you paid for the period. You may use this information to compare the ongoing costs of investing in the Portfolio and other funds. To do so, compare this 5% hypothetical example with the 5% hypothetical examples that appear in the shareholder reports of the other funds.
Please note that the expenses shown in the tables are meant to highlight your ongoing costs only and do not reflect any transaction costs, such as redemption fees (where applicable) and any charges at the separate account level or contract level. Redemption fees are fully described in the prospectus. Therefore, the second line of each table is useful in comparing ongoing costs only, and will not help you determine the relative total costs of owning different funds. In addition, if these transaction costs and separate account or contract level charges were included, your costs would have been higher.
Janus Aspen Series December 31, 2007 1
Janus Aspen Mid Cap Growth Portfolio (unaudited)
Portfolio Snapshot
This portfolio invests in medium-sized companies believed to have moved beyond their emerging growth phase but that still may have room to expand their businesses and grow.

Brian Demain
portfolio manager
Performance Overview
During the 12 months ended December 31, 2007, Janus Aspen Mid Cap Growth Portfolio's Institutional Shares and Service Shares advanced 22.10% and 21.80%, respectively. Meanwhile, the Portfolio's primary benchmark, the Russell Midcap® Growth Index, returned 11.43%. The Portfolio's secondary benchmark, the S&P MidCap 400 Index, returned 7.98% for the same time period.
Overview
Despite a volatile and weak second half of the year, equity markets worldwide managed to turn in modest gains over the 12-month period ended December 31, 2007. Much of the year's gains came during the first half amid continued expansion in the global economy and an active merger and acquisition (M&A) environment, but problems in the U.S. credit markets started to rattle investor confidence in July. Many indices retreated from recent peaks as investors digested a number of issues stemming from the subprime mortgage and structured debt markets. Credit market turmoil, subprime-related write-offs, continued weakness in the U.S. housing market, central bank intervention and the first year-over-year decline in domestic corporate earnings since 2002 were just some of the main themes dominating sentiment during the latter half of 2007. Through all of th is, emerging country stocks tended to be the top performers while equities in developed countries struggled to keep pace. Domestic stocks were led by large, growth-oriented companies with small-cap value issues among the laggards.
As December came to a close, many items supporting equity prices were fading. While domestic valuations were still considered to be reasonable, particularly with interest rates well off of their period highs, mixed signals on the financial health of the U.S. consumer and slowing earnings momentum were becoming a greater concern. One pillar of strength during the year, the labor market, showed signs that it may be starting to feel the impact of the housing slowdown and subsequent credit market turmoil. While job growth remained strong for much of the year, a weak December reading left some doubt about continued near-term strength. In the end, questions remained surrounding the magnitude of slowing growth in the U.S. and whether the rest of the world will follow suit.
Materials Stocks Boosted Performance
Strong individual stock selection, with noteworthy outperformance from picks in the materials and information technology sectors, helped the Portfolio outpace the benchmark during the period.
The largest positive contributors to the Portfolio were Potash Corporation and Owens-Illinois – two materials holdings. Potash has the world's largest excess capacity of potash, an important ingredient in agriculture fertilizer. Potash-based fertilizer has proven to improve agriculture efficiency and has seen higher demand in the agricultural sector along with increasing demands on the world's arable land. Additionally, the cost of using potash is small relative to current prices for the end product, harvested grains. As a result, the company has benefited from pricing power as the end user is generally insensitive to increases in potash prices. With the market for potash tight and the company's sales fully booked for the first half of 2008, I remain optimistic about the growth prospects at this company but harvested gains in the position late in the period reflecting the less attractive risk/reward profile.
Container manufacturer Owens-Illinois gained on the market's positive reaction to CEO Al Stroucken's focus on cost control. Additionally, the company began to see a benefit from price increases and, as a result, reported strong quarterly financial results. I believe pricing power and an emphasis on controlling costs generally make a company's profit margins and cash flows more predictable, resulting in a higher valuation from the public markets. I was pleased to see these developments at Owens during the period.
Financials Stocks Weighed on Results
Areas of weakness included the energy and financial sectors, where select Portfolio holdings declined during the period. An underweight position in energy stocks versus the benchmark also hurt the Portfolio's results.
Long-time holding Lamar Advertising suffered on market reaction to the company's reduced guidance in the third quarter as management noted seeing some weakness in the economy. I believe the market overreacted to management's candor and that growth prospects from digital billboards are not adequately reflected in the stock's valuation. The company
2 Janus Aspen Series December 31, 2007
(unaudited)
continued to generate free cash flow and return capital to shareholders. Given what I believe to be strong underlying fundamentals, predictability and potential for future growth, I added to the position on the weakness.
Financials sector company and ratings agency Moody's Corporation was unable to avoid recent issues surrounding the U.S. credit markets, as a significant decrease in new debt issuance and concerns about the quality of the company's ratings created a challenging environment. I trimmed the position to reflect the uncertainty surrounding the company's and the debt market's future operating environment.
Outlook
With U.S. equity markets struggling late in the year, the investment team will continue to closely monitor several factors for directional cues. First, despite the weakness in the U.S. housing sector and related credit market turmoil, I believe that U.S. employment had been a pillar of support for the economy. With signs of weakening at the end of the year, however, I will continue to watch the labor market closely for any sign of prolonged weakness and whether December's weaker-than-expected report was an aberration. I will also be monitoring conditions in the credit markets for signs of further deterioration. As the Federal Reserve (Fed) works to balance its dual mandate of sustainable growth and price stability, I will be watching for signs that suggest the Fed is behind the curve and whether it can be effective in navigating these uncertain economic times. Finally, as "bottom-up" fundamental investors, the investment team and I will cont inue to watch the future path of corporate earnings, credit conditions, liquidity and balance sheet health of our individual holdings in an effort to determine whether current valuations represent an attractive risk/reward profile.
I am excited to assume management responsibilities for Janus Aspen Mid Cap Growth Portfolio. I have nine years of investing experience and three years of working with prior manager Jonathan Coleman as an Assistant Portfolio Manager on the Portfolio, so I come into this role with experience and knowledge of the Portfolio.
As shareholders, you should expect a very similar management style to Jonathan's. I will concentrate on finding businesses with strong competitive advantages, high and improving returns on invested capital, sustainable growth and strong management. I will focus on buying these stocks at attractive valuations. Finally, I will attempt to limit the volatility of the Portfolio's returns by emphasizing names that I believe have repeatable and sustainable growth at the top of the Portfolio. The most important element to be aware of in this transition is that I will be backed by the same team of Janus analysts who have supported the Portfolio over the past five years of solid performance. This talented, hard-working, diverse group provides a constant flow of new investment ideas, as well as detailed analysis on existing positions.
I greatly appreciate the trust you are placing in both me and the analyst team at Janus, and I look forward to communicating with you in the coming years.
Thank you for your investment in Janus Aspen Mid Cap Growth Portfolio.
Janus Aspen Series December 31, 2007 3
Janus Aspen Mid Cap Growth Portfolio (unaudited)
Janus Aspen Mid Cap Growth Portfolio At a Glance
5 Largest Contributors to Performance – Holdings
| Contribution | |||||||
| Potash Corporation of Saskatchewan, Inc. (U.S. Shares) | 3.49 | % | |||||
| Owens-Illinois, Inc. | 2.74 | % | |||||
| Cypress Semiconductor Corp. | 1.70 | % | |||||
| Dade Behring Holdings, Inc. | 1.53 | % | |||||
| Apple, Inc. | 1.36 | % | |||||
5 Largest Detractors from Performance – Holdings
| Contribution | |||||||
| Lamar Advertising Co. | (0.79 | )% | |||||
| Moody's Corp. | (0.62 | )% | |||||
| Celgene Corp. | (0.53 | )% | |||||
| Nelnet, Inc. - Class A | (0.45 | )% | |||||
| SAVVIS, Inc | (0.45 | )% | |||||
5 Largest Contributors to Performance – Sectors
| Portfolio Contribution | Portfolio Weighting (% of Net Assets) | Russell Midcap® Growth Index Weighting | |||||||||||||
| Materials | 6.57 | % | 7.97 | % | 4.51 | % | |||||||||
| Health Care | 4.90 | % | 15.84 | % | 13.65 | % | |||||||||
| Information Technology | 4.89 | % | 18.37 | % | 19.01 | % | |||||||||
| Industrials | 2.41 | % | 13.17 | % | 15.26 | % | |||||||||
| Energy | 1.97 | % | 5.08 | % | 9.55 | % | |||||||||
5 Lowest Contributors/Detractors to Performance – Sectors
| Portfolio Contribution | Portfolio Weighting (% of Net Assets) | Russell Midcap® Growth Index Weighting | |||||||||||||
| Consumer Staples | (0.36 | )% | 1.88 | % | 4.29 | % | |||||||||
| Consumer Discretionary | (0.13 | )% | 17.02 | % | 20.11 | % | |||||||||
| Other* | 0.00 | % | 0.03 | % | 0.00 | % | |||||||||
| Utilities | 0.40 | % | 0.92 | % | 2.55 | % | |||||||||
| Telecommunication Services | 0.40 | % | 4.70 | % | 2.41 | % | |||||||||
*Industry not classified by Global Industry Classification Standard
4 Janus Aspen Series December 31, 2007
(unaudited)
5 Largest Equity Holdings – (% of Net Assets)
| As of December 31, 2007 | |||
| Owens-Illinois, Inc. Containers - Metal and Glass | 3.1 | % | |||||
| Crown Castle International Corp. Wireless Equipment | 2.9 | % | |||||
| T. Rowe Price Group, Inc. Investment Management and Advisory Services | 2.9 | % | |||||
| Lamar Advertising Co. Advertising Sales | 2.6 | % | |||||
| Potash Corporation of Saskatchewan, Inc. (U.S. Shares) Agricultural Chemicals | 2.5 | % | |||||
| 14.0 | % | ||||||
Asset Allocation – (% of Net Assets)
| As of December 31, 2007 | |||

Emerging markets comprised 2.8% of total net assets.
Top Country Allocations – Long Positions (% of Investment Securities)
| As of December 31, 2007 | As of December 31, 2006 | ||||||
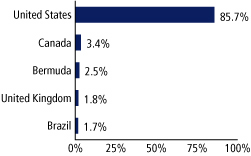 |  | ||||||
Janus Aspen Series December 31, 2007 5
Janus Aspen Mid Cap Growth Portfolio (unaudited)
Performance
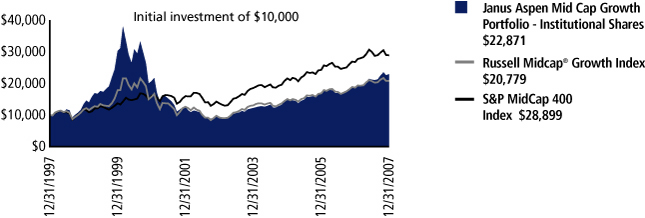
| Average Annual Total Return – for the periods ended December 31, 2007 | Expense Ratios – for the fiscal year ended December 31, 2006 | ||||||||||||||||||||||
| One Year | Five Year | Ten Year | Since Inception* | Total Annual Fund Operating Expenses | |||||||||||||||||||
| Janus Aspen Mid Cap Growth Portfolio - Institutional Shares | 22.10 | % | 20.50 | % | 8.62 | % | 11.71 | % | 0.70 | % | |||||||||||||
| Janus Aspen Mid Cap Growth Portfolio - Service Shares | 21.80 | % | 20.20 | % | 8.33 | % | 11.42 | % | 0.95 | % | |||||||||||||
| Russell Midcap® Growth Index | 11.43 | % | 17.90 | % | 7.59 | % | 10.36 | % | |||||||||||||||
| S&P MidCap 400 Index | 7.98 | % | 16.20 | % | 11.20 | % | 13.38 | % | |||||||||||||||
| Lipper Quartile - Institutional Shares | 2 | nd | 1 | st | 2 | nd | 1 | st | |||||||||||||||
| Lipper Ranking - Institutional Shares based on total returns for Variable Annuity Mid-Cap Growth Funds | 43/154 | 19/119 | 15/30 | 3/13 | |||||||||||||||||||
Visit janus.com/info to view up-to-date
performance and characteristic information
Data presented reflects past performance, which is no guarantee of future results. Investment results and principal value will fluctuate so that shares, when redeemed, may be worth more or less than their original cost. Due to market volatility, current performance may be higher or lower than the performance shown. Call 877.33JANUS or visit www.janus.com/info for performance current to the most recent month-end.
The Portfolio's expense ratio was determined based on average net assets as of the fiscal year ended December 31, 2006. Detailed information is available in the prospectus. All expenses are shown without the effect of expense offset arrangements. Pursuant to such arrangements, credits realized as a result of uninvested cash balances are used to reduce custodian and transfer agent expenses.
The Portfolio's performance may be affected by risks that include those associated with investments in specific industries or countries. Additional risks to the Portfolio may include those associated with investing in foreign securities, emerging markets, initial public offerings ("IPOs"), derivatives and companies with relatively small market capitalizations. Please see a Janus prospectus or www.janus.com/info for more information about risks, portfolio holdings and other details.
Portfolios that invest in REITs may be subject to a higher degree of market risk because of the REITs concentration in a specific industry, sector or geographic region, REITs may be subject to risks including, but not limited to, decline in the value of real estate, risks related to general and economic conditions, changes in the value of the underlying property owned by the trust and defaults by borrowers.
These returns do not reflect the charges and expenses of any particular insurance product or qualified plan. Returns shown would have been lower had they included insurance charges.
Returns include reinvestment of dividends from net investment income and distributions from capital gains. The returns shown do not reflect the deduction of taxes that a shareholder would pay on Portfolio distributions or the redemption of Portfolio shares.
Returns shown for Service Shares for periods prior to December 31, 1999 are derived from the historical performance of Institutional Shares, adjusted to reflect the higher operating expenses of Service Shares.
Lipper, a wholly-owned subsidiary of Reuters, provides independent insight on global collective investments including mutual funds, retirement funds, hedge funds, fund fees and expenses to the asset management and media communities. Lipper ranks the performance of mutual funds within a classification of funds that have similar investment objectives. Rankings are historical with capital gains and dividends reinvested and do not include the effect of loads.
Lipper ranking is for the Institutional Share class only; other classes may have different performance characteristics.
September 30, 1993 is the date used to calculate the since-inception Lipper ranking, which is slightly different from when the Portfolio began operations since Lipper provides fund rankings as of the last day of the month.
There is no assurance that the investment process will consistently lead to successful investing.
The Portfolio will invest at least 80% of its net assets in the type of securities described by its name.
6 Janus Aspen Series December 31, 2007
(unaudited)
Portfolio Expenses
The example below shows you the ongoing costs (in dollars) of investing in your Portfolio and allows you to compare these costs with those of other mutual funds. Please refer to the section Useful Information About Your Portfolio Report for a detailed explanation of the information presented in these charts.
| Expense Example - Institutional Shares | Beginning Account Value (7/1/07) | Ending Account Value (12/31/07) | Expenses Paid During Period (7/1/07-12/31/07)(1) | ||||||||||||
| Actual | $ | 1,000.00 | $ | 1,080.60 | $ | 3.51 | |||||||||
| Hypothetical (5% return before expenses) | $ | 1,000.00 | $ | 1,021.83 | $ | 3.41 | |||||||||
| Expense Example - Service Shares | Beginning Account Value (7/1/07) | Ending Account Value (12/31/07) | Expenses Paid During Period (7/1/07-12/31/07)(1) | ||||||||||||
| Actual | $ | 1,000.00 | $ | 1,080.40 | $ | 4.82 | |||||||||
| Hypothetical (5% return before expenses) | $ | 1,000.00 | $ | 1,020.57 | $ | 4.69 | |||||||||
(1) Expenses are equal to the annualized expense ratio of 0.67% for Institutional Shares and 0.92% for Service Shares, multiplied by the average account value over the period, multiplied by 184/365 (to reflect the one-half year period).
See Notes to Schedule of Investments for index definitions.
The Portfolio may differ significantly from the securities held in the indices. The indices are unmanaged and not available for direct investment; therefore their performance does not reflect the expenses associated with the active management of an actual Portfolio.
See "Explanations of Charts, Tables and Financial Statements."
Effective November 1, 2007, Brian Demain is Portfolio Manager of Janus Aspen Mid Cap Growth Portfolio. Jonathan Coleman, previous Portfolio Manager of Janus Aspen Mid Cap Growth Portfolio, will work with Brian Demain to ensure a smooth transition of the Portfolio.
*The Portfolio's inception date – September 13, 1993
Janus Aspen Series December 31, 2007 7
Janus Aspen Mid Cap Growth Portfolio
Schedule of Investments
As of December 31, 2007
| Shares or Principal Amount | Value | ||||||||||
| Common Stock - 96.2% | |||||||||||
| Advertising Sales - 2.6% | |||||||||||
| 497,616 | Lamar Advertising Co.* | $ | 23,920,401 | ||||||||
| Aerospace and Defense - 1.8% | |||||||||||
| 361,240 | Embraer-Empresa Brasileira de Aeronautica S.A. (ADR)* | 16,468,932 | |||||||||
| Aerospace and Defense - Equipment - 0.3% | |||||||||||
| 28,400 | Alliant Techsystems, Inc.* | 3,230,784 | |||||||||
| Agricultural Chemicals - 2.5% | |||||||||||
| 165,145 | Potash Corporation of Saskatchewan, Inc. (U.S. Shares) | 23,774,274 | |||||||||
| Airlines - 1.2% | |||||||||||
| 283,808 | Ryanair Holdings PLC (ADR)*,# | 11,193,388 | |||||||||
| Apparel Manufacturers - 0.9% | |||||||||||
| 538,000 | Esprit Holdings, Ltd. | 8,004,207 | |||||||||
| Automotive - Truck Parts and Equipment - Original - 0.4% | |||||||||||
| 152,960 | Tenneco, Inc.* | 3,987,667 | |||||||||
| Batteries and Battery Systems - 0.7% | |||||||||||
| 61,860 | Energizer Holdings, Inc.* | 6,936,362 | |||||||||
| Building - Mobile Home and Manufactured Homes - 0.5% | |||||||||||
| 113,965 | Thor Industries, Inc.# | 4,331,810 | |||||||||
| Building - Residential and Commercial - 0.7% | |||||||||||
| 12,340 | NVR, Inc.* | 6,466,160 | |||||||||
| Building and Construction Products - Miscellaneous - 0.5% | |||||||||||
| 131,185 | USG Corp.*,# | 4,695,111 | |||||||||
| Casino Hotels - 0.8% | |||||||||||
| 634,677 | Crown, Ltd.* | 7,493,268 | |||||||||
| Casino Services - 1.7% | |||||||||||
| 137,015 | International Game Technology | 6,019,069 | |||||||||
| 299,343 | Scientific Games Corp. - Class A*,# | 9,953,155 | |||||||||
| 15,972,224 | |||||||||||
| Cellular Telecommunications - 1.8% | |||||||||||
| 169,490 | Leap Wireless International, Inc.*,# | 7,905,014 | |||||||||
| 184,820 | N.I.I. Holdings, Inc.* | 8,930,502 | |||||||||
| 16,835,516 | |||||||||||
| Chemicals - Diversified - 0.7% | |||||||||||
| 28,622 | K+S A.G. | 6,845,999 | |||||||||
| Commercial Services - 1.8% | |||||||||||
| 451,493 | Iron Mountain, Inc.* | 16,714,271 | |||||||||
| Commercial Services - Finance - 2.7% | |||||||||||
| 329,270 | Equifax, Inc. | 11,972,258 | |||||||||
| 217,339 | Jackson Hewitt Tax Service, Inc. | 6,900,513 | |||||||||
| 134,726 | Moody's Corp. | 4,809,718 | |||||||||
| 42,100 | Wright Express Corp.* | 1,494,129 | |||||||||
| 25,176,618 | |||||||||||
| Computer Services - 1.1% | |||||||||||
| 162,390 | IHS, Inc. - Class A* | 9,834,338 | |||||||||
| Computers - 1.4% | |||||||||||
| 67,859 | Apple, Inc.* | 13,441,511 | |||||||||
| Consulting Services - 1.5% | |||||||||||
| 796,460 | Gartner Group, Inc.* | 13,985,838 | |||||||||
| Shares or Principal Amount | Value | ||||||||||
| Containers - Metal and Glass - 4.5% | |||||||||||
| 280,726 | Ball Corp. | $ | 12,632,670 | ||||||||
| 586,007 | Owens-Illinois, Inc.* | 29,007,346 | |||||||||
| 41,640,016 | |||||||||||
| Data Processing and Management - 1.6% | |||||||||||
| 139,550 | Global Payments, Inc. | 6,491,866 | |||||||||
| 226,360 | Paychex, Inc. | 8,198,759 | |||||||||
| 14,690,625 | |||||||||||
| Decision Support Software - 0.7% | |||||||||||
| 158,340 | MSCI, Inc.* | 6,080,256 | |||||||||
| Distribution/Wholesale - 0.8% | |||||||||||
| 1,967,000 | Li & Fung, Ltd. | 7,946,812 | |||||||||
| Diversified Operations - 1.1% | |||||||||||
| 83,065 | Harsco Corp. | 5,321,974 | |||||||||
| 15,530,207 | Polytec Asset Holdings, Ltd. | 4,621,078 | |||||||||
| 9,943,052 | |||||||||||
| E-Commerce/Services - 0.5% | |||||||||||
| 254,810 | Liberty Media Corp. - Interactive* | 4,861,775 | |||||||||
| Electric Products - Miscellaneous - 1.1% | |||||||||||
| 218,170 | AMETEK, Inc. | 10,219,083 | |||||||||
| Electronic Components - Semiconductors - 0.4% | |||||||||||
| 110,995 | Microchip Technology, Inc. | 3,487,463 | |||||||||
| Electronic Connectors - 0.4% | |||||||||||
| 90,240 | Amphenol Corp. - Class A | 4,184,429 | |||||||||
| Electronic Measuring Instruments - 1.3% | |||||||||||
| 390,020 | Trimble Navigation, Ltd.* | 11,794,205 | |||||||||
| Entertainment Software - 0.6% | |||||||||||
| 101,400 | Electronic Arts, Inc.* | 5,922,774 | |||||||||
| Fiduciary Banks - 1.1% | |||||||||||
| 128,953 | Northern Trust Corp. | 9,875,221 | |||||||||
| Finance - Consumer Loans - 0.4% | |||||||||||
| 309,015 | Nelnet, Inc. - Class A# | 3,927,581 | |||||||||
| Finance - Other Services - 1.5% | |||||||||||
| 20,013 | CME Group, Inc. | 13,728,918 | |||||||||
| Food - Canned - 0.6% | |||||||||||
| 241,155 | TreeHouse Foods, Inc.* | 5,544,153 | |||||||||
| Gambling - Non-Hotel - 0.2% | |||||||||||
| 137,200 | Great Canadian Gaming Corp.* | 2,155,265 | |||||||||
| Independent Power Producer - 0.9% | |||||||||||
| 200,800 | NRG Energy, Inc.* | 8,702,672 | |||||||||
| Instruments - Controls - 0.6% | |||||||||||
| 51,005 | Mettler-Toledo International, Inc.* | 5,804,369 | |||||||||
| Instruments - Scientific - 1.3% | |||||||||||
| 206,836 | Thermo Fisher Scientific, Inc.* | 11,930,300 | |||||||||
| Investment Management and Advisory Services - 3.7% | |||||||||||
| 168,125 | National Financial Partners Corp. | 7,668,181 | |||||||||
| 449,791 | T. Rowe Price Group, Inc. | 27,383,276 | |||||||||
| 35,051,457 | |||||||||||
| Life and Health Insurance - 0.5% | |||||||||||
| 1,408,314 | Sanlam, Ltd. | 4,692,111 | |||||||||
| Machinery - General Industrial - 0.5% | |||||||||||
| 5,508,000 | Shanghai Electric Group Company, Ltd. | 4,662,468 | |||||||||
See Notes to Schedule of Investments and Financial Statements.
8 Janus Aspen Series December 31, 2007
Schedule of Investments
As of December 31, 2007
| Shares or Principal Amount | Value | ||||||||||
| Machinery - Pumps - 0.4% | |||||||||||
| 112,135 | Graco, Inc. | $ | 4,178,150 | ||||||||
| Medical - Biomedical and Genetic - 1.8% | |||||||||||
| 367,001 | Celgene Corp.* | 16,959,116 | |||||||||
| Medical - Drugs - 0.6% | |||||||||||
| 76,715 | Shire PLC (ADR) | 5,289,499 | |||||||||
| Medical - HMO - 2.0% | |||||||||||
| 313,356 | Coventry Health Care, Inc.* | 18,566,343 | |||||||||
| Medical Labs and Testing Services - 0.4% | |||||||||||
| 44,070 | Covance, Inc.* | 3,817,343 | |||||||||
| Metal Processors and Fabricators - 0.7% | |||||||||||
| 46,075 | Precision Castparts Corp. | 6,390,603 | |||||||||
| Multi-Line Insurance - 1.2% | |||||||||||
| 160,951 | Assurant, Inc. | 10,767,622 | |||||||||
| Multimedia - 0.3% | |||||||||||
| 634,677 | Consolidated Media Holdings, Ltd. | 2,339,905 | |||||||||
| Oil - Field Services - 0.6% | |||||||||||
| 221,105 | BJ Services Co. | 5,364,007 | |||||||||
| Oil and Gas Drilling - 0.6% | |||||||||||
| 140,010 | Helmerich & Payne, Inc. | 5,610,201 | |||||||||
| Oil Companies - Exploration and Production - 4.4% | |||||||||||
| 111,795 | Chesapeake Energy Corp. | 4,382,364 | |||||||||
| 264,514 | EOG Resources, Inc. | 23,607,874 | |||||||||
| 92,390 | Forest Oil Corp.* | 4,697,107 | |||||||||
| 268,680 | Petrohawk Energy Corp.* | 4,650,851 | |||||||||
| 109,609 | Sandridge Energy, Inc.* | 3,930,579 | |||||||||
| 41,268,775 | |||||||||||
| Oil Companies - Integrated - 1.1% | |||||||||||
| 99,770 | Hess Corp. | 10,062,802 | |||||||||
| Physician Practice Management - 1.2% | |||||||||||
| 165,510 | Pediatrix Medical Group, Inc.* | 11,279,507 | |||||||||
| Property and Casualty Insurance - 0.4% | |||||||||||
| 129,898 | W. R. Berkley Corp. | 3,872,259 | |||||||||
| Real Estate Management/Services - 0.6% | |||||||||||
| 265,750 | CB Richard Ellis Group, Inc.* | 5,726,913 | |||||||||
| Real Estate Operating/Development - 1.1% | |||||||||||
| 1,051,000 | Hang Lung Properties, Ltd. | 4,758,340 | |||||||||
| 167,575 | St. Joe Co.*,# | 5,950,588 | |||||||||
| 10,708,928 | |||||||||||
| Reinsurance - 1.9% | |||||||||||
| 3,794 | Berkshire Hathaway, Inc. - Class B* | 17,968,384 | |||||||||
| REIT - Diversified - 1.2% | |||||||||||
| 627,241 | CapitalSource, Inc.# | 11,033,169 | |||||||||
| Respiratory Products - 1.9% | |||||||||||
| 277,904 | Respironics, Inc.* | 18,197,154 | |||||||||
| Retail - Apparel and Shoe - 2.7% | |||||||||||
| 142,945 | Abercrombie & Fitch Co. - Class A | 11,431,312 | |||||||||
| 364,490 | Nordstrom, Inc. | 13,387,717 | |||||||||
| 24,819,029 | |||||||||||
| Retail - Office Supplies - 1.2% | |||||||||||
| 500,760 | Staples, Inc. | 11,552,533 | |||||||||
| Shares or Principal Amount | Value | ||||||||||
| Schools - 0.4% | |||||||||||
| 50,884 | Apollo Group, Inc. - Class A* | $ | 3,569,513 | ||||||||
| Semiconductor Components/Integrated Circuits - 2.9% | |||||||||||
| 1,466,110 | Atmel Corp.* | 6,333,595 | |||||||||
| 353,255 | Cypress Semiconductor Corp.* | 12,727,778 | |||||||||
| 578,108 | Marvell Technology Group, Ltd.* | 8,081,950 | |||||||||
| 27,143,323 | |||||||||||
| Semiconductor Equipment - 1.6% | |||||||||||
| 315,285 | KLA-Tencor Corp. | 15,184,126 | |||||||||
| Telecommunication Equipment - 1.6% | |||||||||||
| 302,565 | CommScope, Inc.* | 14,889,224 | |||||||||
| Telecommunication Services - 3.8% | |||||||||||
| 352,172 | Amdocs, Ltd. (U.S. Shares)* | 12,139,369 | |||||||||
| 460,015 | SAVVIS, Inc.* | 12,839,019 | |||||||||
| 523,680 | Time Warner Telecom, Inc. - Class A* | 10,625,467 | |||||||||
| 35,603,855 | |||||||||||
| Therapeutics - 1.3% | |||||||||||
| 228,042 | Gilead Sciences, Inc.* | 10,492,212 | |||||||||
| 263,680 | MannKind Corp.*,# | 2,098,893 | |||||||||
| 12,591,105 | |||||||||||
| Toys - 1.5% | |||||||||||
| 186,835 | Marvel Entertainment, Inc.* | 4,990,363 | |||||||||
| 453,335 | Mattel, Inc. | 8,631,498 | |||||||||
| 13,621,861 | |||||||||||
| Transportation - Equipment and Leasing - 0.5% | |||||||||||
| 123,285 | GATX Corp. | 4,522,094 | |||||||||
| Transportation - Railroad - 0.7% | |||||||||||
| 146,500 | Canadian National Railway Co. (U.S. Shares) | 6,875,245 | |||||||||
| Transportation - Services - 1.4% | |||||||||||
| 128,920 | C.H. Robinson Worldwide, Inc. | 6,977,150 | |||||||||
| 133,042 | Expeditors International of Washington, Inc. | 5,944,317 | |||||||||
| 12,921,467 | |||||||||||
| Transportation - Truck - 0.6% | |||||||||||
| 143,280 | Landstar System, Inc. | 6,039,252 | |||||||||
| Web Hosting/Design - 0.8% | |||||||||||
| 71,163 | Equinix, Inc.*,# | 7,192,444 | |||||||||
| Wireless Equipment - 2.9% | |||||||||||
| 659,170 | Crown Castle International Corp.* | 27,421,472 | |||||||||
| Total Common Stock (cost $597,418,464) | 899,500,907 | ||||||||||
| Money Markets - 1.7% | |||||||||||
| 15,597,846 | Janus Institutional Cash Management Fund - Institutional Shares, 4.98% (cost $15,597,846) | 15,597,846 | |||||||||
| Other Securities - 4.4% | |||||||||||
| 28,899,103 | Allianz Dresdner Daily Asset Fund† | 28,899,103 | |||||||||
| 7,214,923 | Repurchase Agreements† | 7,214,923 | |||||||||
| 5,547,359 | Time Deposits† | 5,547,359 | |||||||||
| Total Other Securities (cost $41,661,385) | 41,661,385 | ||||||||||
| Total Investments (total cost $654,677,695) – 102.3% | 956,760,138 | ||||||||||
| Liabilities, net of Cash, Receivables and Other Assets – (2.3)% | (21,773,864 | ) | |||||||||
| Net Assets – 100% | $ | 934,986,274 | |||||||||
See Notes to Schedule of Investments and Financial Statements.
Janus Aspen Series December 31, 2007 9
Janus Aspen Mid Cap Growth Portfolio
Schedule of Investments
As of December 31, 2007
Summary of Investments by Country – (Long Positions)
| Country | Value | % of Investment Securities | |||||||||
| Australia | $ | 9,833,173 | 1.0 | % | |||||||
| Bermuda | 24,032,969 | 2.5 | % | ||||||||
| Brazil | 16,468,932 | 1.7 | % | ||||||||
| Canada | 32,804,784 | 3.4 | % | ||||||||
| Cayman Islands | 4,621,078 | 0.5 | % | ||||||||
| China | 4,662,468 | 0.5 | % | ||||||||
| Germany | 6,845,999 | 0.7 | % | ||||||||
| Hong Kong | 4,758,340 | 0.5 | % | ||||||||
| Ireland | 11,193,388 | 1.2 | % | ||||||||
| South Africa | 4,692,111 | 0.5 | % | ||||||||
| United Kingdom | 17,428,868 | 1.8 | % | ||||||||
| United States†† | 819,418,028 | 85.7 | % | ||||||||
| Total | $ | 956,760,138 | 100.0 | % | |||||||
††Includes Short-Term Securities and Other Securities (79.7% excluding Short-Term Securities and Other Securities)
See Notes to Schedule of Investments and Financial Statements.
10 Janus Aspen Series December 31, 2007
Statement of Assets and Liabilities
| As of December 31, 2007 (all numbers in thousands except net asset value per share) | Janus Aspen Mid Cap Growth Portfolio | ||||||
| Assets: | |||||||
| Investments at cost(1) | $ | 654,678 | |||||
| Investments at value(1) | $ | 941,162 | |||||
| Affiliated money market investments | 15,598 | ||||||
| Cash | 89 | ||||||
| Receivables: | |||||||
| Investments sold | 10 | ||||||
| Portfolio shares sold | 20,211 | ||||||
| Dividends | 403 | ||||||
| Interest | 101 | ||||||
| Non-interested Trustees' deferred compensation | 15 | ||||||
| Other assets | 10 | ||||||
| Total Assets | 977,599 | ||||||
| Liabilities: | |||||||
| Payables: | |||||||
| Collateral for securities loaned (Note 1) | 41,661 | ||||||
| Investments purchased | 253 | ||||||
| Portfolio shares repurchased | 16 | ||||||
| Advisory fees | 493 | ||||||
| Transfer agent fees and expenses | 1 | ||||||
| Distribution fees - Service Shares | 73 | ||||||
| Non-interested Trustees' fees and expenses | 6 | ||||||
| Non-interested Trustees' deferred compensation fees | 15 | ||||||
| Accrued expenses | 95 | ||||||
| Total Liabilities | 42,613 | ||||||
| Net Assets | $ | 934,986 | |||||
| Net Assets Consist of: | |||||||
| Capital (par value and paid-in-surplus)* | $ | 893,432 | |||||
| Undistributed net investment income/(loss)* | (268 | ) | |||||
| Undistributed net realized gain/(loss) from investments and foreign currency transactions* | (260,262 | ) | |||||
| Unrealized appreciation/(depreciation) of investments, foreign currency translations and non-interested Trustees' deferred compensation | 302,084 | ||||||
| Total Net Assets | $ | 934,986 | |||||
| Net Assets - Institutional Shares | $ | 565,996 | |||||
| Shares Outstanding, $0.001 Par Value (unlimited shares authorized) | 14,164 | ||||||
| Net Asset Value Per Share | $ | 39.96 | |||||
| Net Assets - Service Shares | $ | 368,990 | |||||
| Shares Outstanding, $0.001 Par Value (unlimited shares authorized) | 9,469 | ||||||
| Net Asset Value Per Share | $ | 38.97 | |||||
* See Note 3 in Notes to Financial Statements.
(1) Investments at cost and value include $40,323,274 of securities loaned (Note 1).
See Notes to Financial Statements.
Janus Aspen Series December 31, 2007 11
Statement of Operations
| For the fiscal year ended December 31, 2007 (all numbers in thousands) | Janus Aspen Mid Cap Growth Portfolio | ||||||
| Investment Income: | |||||||
| Interest | $ | 39 | |||||
| Securities lending income | 434 | ||||||
| Dividends | 7,144 | ||||||
| Dividends from affiliates | 491 | ||||||
| Foreign tax withheld | (103 | ) | |||||
| Total Investment Income | 8,005 | ||||||
| Expenses: | |||||||
| Advisory fees | 5,439 | ||||||
| Transfer agent fees and expenses | 6 | ||||||
| Registration fees | 32 | ||||||
| Custodian fees | 33 | ||||||
| Professional fees | 21 | ||||||
| Non-interested Trustees' fees and expenses | 27 | ||||||
| Distribution fees - Service Shares | 751 | ||||||
| Other expenses | 193 | ||||||
| Non-recurring costs (Note 2 | 1 | ||||||
| Costs assumed by Janus Capital Management LLC (Note 2) | (1 | ) | |||||
| Total Expenses | 6,502 | ||||||
| Expense and Fee Offset | (2 | ) | |||||
| Net Expenses | 6,500 | ||||||
| Less: Excess Expense Reimbursement | – | ||||||
| Net Expenses after Expense Reimbursement | 6,500 | ||||||
| Net Investment Income/(Loss) | 1,505 | ||||||
| Net Realized and Unrealized Gain/(Loss) on Investments: | |||||||
| Net realized gain/(loss) from investments and foreign currency transactions | 116,938 | ||||||
| Change in net appreciation/(depreciation) of investments, foreign currency translations and non-interested Trustees' deferred compensation | 47,896 | ||||||
| Net Gain/(Loss) on Investments | 164,834 | ||||||
| Net Increase/(Decrease) in Net Assets Resulting from Operations | $ | 166,339 | |||||
See Notes to Financial Statements.
12 Janus Aspen Series December 31, 2007
Statements of Changes in Net Assets
| For the fiscal years ended December 31 | Janus Aspen Mid Cap Growth Portfolio | ||||||||||
| (all numbers in thousands) | 2007 | 2006 | |||||||||
| Operations: | |||||||||||
| Net investment income/(loss) | $ | 1,505 | $ | (890 | ) | ||||||
| Net realized gain/(loss) from investment and foreign currency transactions | 116,938 | 125,727 | |||||||||
| Change in net appreciation/(depreciation) of investments, foreign currency translations and non-interested Trustees' deferred compensation | 47,896 | (27,369 | ) | ||||||||
| Net Increase/(Decrease) in Net Assets Resulting from Operations | 166,339 | 97,468 | |||||||||
| Dividends and Distributions to Shareholders: | |||||||||||
| Net investment income* | |||||||||||
| Institutional Shares | (1,171 | ) | – | ||||||||
| Service Shares | (217 | ) | – | ||||||||
| Net realized gain/(loss) from investment transactions* | |||||||||||
| Institutional Shares | (2,903 | ) | – | ||||||||
| Service Shares | (1,652 | ) | – | ||||||||
| Net Decrease from Dividends and Distributions | (5,943 | ) | – | ||||||||
| Capital Share Transactions: | |||||||||||
| Shares sold | |||||||||||
| Institutional Shares | 56,218 | 42,627 | |||||||||
| Service Shares | 122,089 | 25,071 | |||||||||
| Reinvested dividends and distributions | |||||||||||
| Institutional Shares | 4,074 | – | |||||||||
| Service Shares | 1,867 | – | |||||||||
| Shares repurchased | |||||||||||
| Institutional Shares | (122,331 | ) | (117,860 | ) | |||||||
| Service Shares | (64,984 | ) | (57,959 | ) | |||||||
| Net Increase/(Decrease) from Capital Share Transactions | (3,067 | ) | (108,121 | ) | |||||||
| Net Increase/(Decrease) in Net Assets | 157,329 | (10,653 | ) | ||||||||
| Net Assets: | |||||||||||
| Beginning of period | 777,657 | 788,310 | |||||||||
| End of period | $ | 934,986 | $ | 777,657 | |||||||
| Undistributed net investment income/(loss)* | $ | (268 | ) | $ | (385 | ) | |||||
* See Note 3 in Notes to Financial Statements.
See Notes to Financial Statements.
Janus Aspen Series December 31, 2007 13
Financial Highlights
| Institutional Shares For a share outstanding during each | Janus Aspen Mid Cap Growth Portfolio | ||||||||||||||||||||||
| fiscal year ended December 31 | 2007 | 2006 | 2005 | 2004 | 2003 | ||||||||||||||||||
| Net Asset Value, Beginning of Period | $ | 32.97 | $ | 29.02 | $ | 25.84 | $ | 21.40 | $ | 15.84 | |||||||||||||
| Income from Investment Operations: | |||||||||||||||||||||||
| Net investment income/(loss) | .12 | .03 | .08 | .02 | .01 | ||||||||||||||||||
| Net gain/(loss) on securities (both realized and unrealized) | 7.15 | 3.92 | 3.10 | 4.42 | 5.55 | ||||||||||||||||||
| Total from Investment Operations | 7.27 | 3.95 | 3.18 | 4.44 | 5.56 | ||||||||||||||||||
| Less Distributions and Other: | |||||||||||||||||||||||
| Dividends (from net investment income)* | (.08 | ) | – | – | – | – | |||||||||||||||||
| Distributions (from capital gains)* | (.20 | ) | – | – | – | – | |||||||||||||||||
| Payment from affiliate | – | – | – | (1) | – | – | |||||||||||||||||
| Total Distributions and Other | (.28 | ) | – | – | – | – | |||||||||||||||||
| Net Asset Value, End of Period | $ | 39.96 | $ | 32.97 | $ | 29.02 | $ | 25.84 | $ | 21.40 | |||||||||||||
| Total Return | 22.10 | % | 13.61 | % | 12.31 | %(2) | 20.75 | % | 35.10 | % | |||||||||||||
| Net Assets, End of Period (in thousands) | $ | 565,996 | $ | 523,173 | $ | 532,085 | $ | 1,205,813 | $ | 1,649,423 | |||||||||||||
| Average Net Assets for the Period (in thousands) | $ | 550,938 | $ | 525,467 | $ | 706,963 | $ | 1,579,383 | $ | 1,461,491 | |||||||||||||
| Ratio of Gross Expenses to Average Net Assets(3)(4) | 0.68 | % | 0.69 | % | 0.67 | % | 0.66 | % | 0.67 | % | |||||||||||||
| Ratio of Net Expenses to Average Net Assets(4) | 0.68 | % | 0.69 | % | 0.67 | % | 0.66 | % | 0.67 | % | |||||||||||||
| Ratio of Net Investment Income/(Loss) to Average Net Assets | 0.27 | % | (0.03 | )% | (0.01 | )% | (0.05 | )% | (0.11 | )% | |||||||||||||
| Portfolio Turnover Rate | 45 | % | 41 | % | 32 | % | 25 | % | 36 | % | |||||||||||||
| Service Shares For a share outstanding during each | Janus Aspen Mid Cap Growth Portfolio | ||||||||||||||||||||||
| fiscal year ended December 31 | 2007 | 2006 | 2005 | 2004 | 2003 | ||||||||||||||||||
| Net Asset Value, Beginning of Period | $ | 32.19 | $ | 28.41 | $ | 25.36 | $ | 21.05 | $ | 15.62 | |||||||||||||
| Income from Investment Operations: | |||||||||||||||||||||||
| Net investment income/(loss) | .04 | (.09 | ) | (.05 | ) | (.05 | ) | (.03 | ) | ||||||||||||||
| Net gain/(loss) on securities (both realized and unrealized) | 6.96 | 3.87 | 3.10 | 4.36 | 5.46 | ||||||||||||||||||
| Total from Investment Operations | 7.00 | 3.78 | 3.05 | 4.31 | 5.43 | ||||||||||||||||||
| Less Distributions and Other: | |||||||||||||||||||||||
| Dividends (from net investment income)* | (.02 | ) | – | – | – | – | |||||||||||||||||
| Distributions (from capital gains)* | (.20 | ) | – | – | – | – | |||||||||||||||||
| Payment from affiliate | – | – | – | (1) | – | – | |||||||||||||||||
| Total Distributions and Other | (.22 | ) | – | – | – | – | |||||||||||||||||
| Net Asset Value, End of Period | $ | 38.97 | $ | 32.19 | $ | 28.41 | $ | 25.36 | $ | 21.05 | |||||||||||||
| Total Return | 21.80 | % | 13.31 | % | 12.03 | %(2) | 20.48 | % | 34.76 | % | |||||||||||||
| Net Assets, End of Period (in thousands) | $ | 368,990 | $ | 254,484 | $ | 256,225 | $ | 240,418 | $ | 204,838 | |||||||||||||
| Average Net Assets for the Period (in thousands) | $ | 300,362 | $ | 253,611 | $ | 244,487 | $ | 211,792 | $ | 167,689 | |||||||||||||
| Ratio of Gross Expenses to Average Net Assets(3)(4) | 0.93 | % | 0.94 | % | 0.92 | % | 0.91 | % | 0.92 | % | |||||||||||||
| Ratio of Net Expenses to Average Net Assets(4) | 0.93 | % | 0.94 | % | 0.92 | % | 0.91 | % | 0.92 | % | |||||||||||||
| Ratio of Net Investment Income/(Loss) to Average Net Assets | 0.01 | % | (0.28 | )% | (0.23 | )% | (0.28 | )% | (0.35 | )% | |||||||||||||
| Portfolio Turnover Rate | 45 | % | 41 | % | 32 | % | 25 | % | 36 | % | |||||||||||||
* See Note 3 in Notes to Financial Statements.
(1) Payment from affiliate aggregated less than $.01 on a per share basis for the fiscal year ended.
(2) During the fiscal year ended, Janus Capital and/or Janus Services LLC fully reimbursed the Portfolio for a loss on a transaction resulting from certain trading, pricing and/or shareholder activity errors, which otherwise would have reduced total return by less than 0.01%.
(3) The effect of non-recurring costs assumed by Janus Capital (Note 2) is included in the ratio of gross expenses to average net assets and was less than 0.01% for the fiscal years ended 2007, 2006, 2005 and 2004.
(4) See "Explanations of Charts, Tables and Financial Statements."
See Notes to Financial Statements.
14 Janus Aspen Series December 31, 2007
Notes to Schedule of Investments
| Lipper Variable Annuity Mid-Cap Growth Funds | Funds that, by portfolio practice, invest at least 75% of their equity assets in companies with market capitalizations (on a three-year weighted basis) less than 300% of the dollar-weighted median market capitalization of the middle 1,000 securities of the S&P SuperComposite 1500 Index. Mid-cap growth funds typically have an above-average price-to-earnings ratio, price-to-book ratio, and three-year sales-per-share growth value, compared to the S&P MidCap 400 Index. | ||||||
| Russell Midcap® Growth Index | Measures the performance of those Russell Midcap® companies with higher price-to-book ratios and higher forecasted growth values. | ||||||
| S&P MidCap 400 Index | Is an unmanaged group of 400 domestic stocks chosen for their market size, liquidity and industry group representation. | ||||||
| ADR | American Depositary Receipt | ||||||
| PLC | Public Limited Company | ||||||
| REIT | Real Estate Investment Trust | ||||||
| U.S. Shares | Securities of foreign companies trading on an American Stock Exchange. | ||||||
* Non-income-producing security.
# Loaned security; a portion or all of the security is on loan at December 31, 2007.
† The security is purchased with the cash collateral received from securities on loan (Note 1).
Janus Aspen Series December 31, 2007 15
Notes to Financial Statements
The following section describes the organization and significant accounting policies and provides more detailed information about the schedules and tables that appear throughout this report. In addition, the Notes to Financial Statements explain the methods used in preparing and presenting this report.
1. ORGANIZATION AND SIGNIFICANT ACCOUNTING POLICIES
Janus Aspen Mid Cap Growth Portfolio (the "Portfolio") is a series fund. The Portfolio is part of Janus Aspen Series (the "Trust"), which is organized as a Delaware statutory trust and is registered under the Investment Company Act of 1940, as amended, (the "1940 Act") as an open-end management investment company. The Trust offers seventeen Portfolios, which include multiple series of shares, with differing investment objectives and policies. The Portfolio invests primarily in equity securities. The Portfolio is classified as diversified, as defined in the 1940 Act. The Portfolio is a no-load investment.
The Portfolio currently offers two classes of shares: Institutional Shares and Service Shares. Institutional Shares are offered only in connection with investment in and payments under variable insurance contracts and to qualified retirement plans. Service Shares are offered only in connection with investment in and payments under variable insurance contracts and to qualified retirement plans that require a fee from Portfolio assets to procure distribution and administrative services to contract owners and plan participants.
The following accounting policies have been consistently followed by the Portfolio and are in conformity with accounting principles generally accepted in the United States of America in the investment company industry.
Investment Valuation
Securities are valued at the last sales price or the official closing price for securities traded on a principal securities exchange (U.S. or foreign) and on the NASDAQ National Market. Securities traded on over-the-counter markets and listed securities for which no sales are reported are valued at the latest bid price (or yield equivalent thereof) obtained from one or more dealers transacting in a market for such securities or by a pricing service approved by the Portfolio's Trustees. Short-term securities with maturities of 60 days or less may be valued at amortized cost, which approximates market value. Debt securities with a remaining maturity of greater than 60 days are valued in accordance with the evaluated bid price supplied by the pricing service. The evaluated bid price supplied by the pricing service is an evaluation that reflects such factors as security prices, yields, maturities and ratings. Foreign securities and currencies ar e converted to U.S. dollars using the applicable exchange rate in effect as of the daily close of the New York Stock Exchange ("NYSE"). When market quotations are not readily available or deemed unreliable, or events or circumstances that may affect the value of portfolio securities held by the Portfolio are identified between the closing of their principal markets and the time the net asset value ("NAV") is determined, securities may be valued at fair value as determined in good faith under procedures established by and under the supervision of the Portfolio's Trustees. Circumstances in which fair value pricing may be utilized include, but are not limited to: (i) when significant events occur which may affect the securities of a single issuer, such as mergers, bankruptcies, or significant issuer specific developments; (ii) when significant events occur which may affect an entire market, such as natural disasters or significant governmen tal actions; and (iii) when non-significant events occur such as markets closing early or not opening, security trading halts, or pricing of non-valued securities and restricted or non-public securities. The Portfolio may use a systematic fair valuation model provided by an independent third party to value international equity securities in order to adjust for stale pricing, which may occur between the close of certain foreign exchanges and the NYSE.
Investment Transactions and Investment Income
Investment transactions are accounted for as of the date purchased or sold (trade date). Dividend income is recorded on the ex-dividend date. Certain dividends from foreign securities will be recorded as soon as the Trust is informed of the dividend if such information is obtained subsequent to the ex-dividend date. Dividends from foreign securities may be subject to withholding taxes in foreign jurisdictions. Interest income is recorded on the accrual basis and includes amortization of premiums and accretion of discounts. Gains and losses are determined on the identified cost basis, which is the same basis used for federal income tax purposes. Income, as well as gains and losses, both realized and unrealized, are allocated daily to each class of shares based upon the ratio of net assets represented by each class as a percentage of total net assets.
Expenses
The Portfolio bears expenses incurred specifically on its behalf as well as a portion of general expenses. Each class of shares bears expenses incurred specifically on its behalf and, in addition, each class bears a portion of general expenses, which may be based upon relative net assets of each class. Expenses are allocated daily to each class of shares based upon the ratio of net assets represented by each class as a percentage of total net assets. Expenses directly attributable to a specific class of shares are charged against the operations of such class.
Securities Lending
Under procedures adopted by the Trustees, the Portfolio may lend securities to qualified parties (typically brokers or other financial institutions) who need to borrow securities in order to complete certain transactions such as covering short sales, avoiding failures to deliver securities or completing arbitrage activities. The Portfolio may seek to earn additional income through securities lending. There is the risk of delay in recovering a loaned security or the risk of loss in collateral rights if the borrower fails financially. Janus Capital Management LLC ("Janus Capital") makes efforts to balance the benefits and risks from granting such loans.
State Street Bank and Trust Company served as the Portfolio's lending agent for the period January 1, 2007 through May 24, 2007. Effective May 25, 2007, Dresdner Bank AG became the lending agent for the Portfolio.
16 Janus Aspen Series December 31, 2007
The Portfolio does not have the right to vote on securities while they are being lent; however, the Portfolio may attempt to call back the loan and vote the proxy if time permits. All loans will be continuously secured by collateral which may consist of cash, U.S. Government securities, domestic and foreign short-term debt instruments, letters of credit, time deposits, repurchase agreements or such other collateral permitted by the Securities and Exchange Commission ("SEC"). Cash collateral may be invested in affiliated money market funds or other accounts advised by Janus Capital to the extent consistent with exemptive relief obtained from the SEC or as permitted by the 1940 Act and rules promulgated thereunder.
Dresdner Bank AG (the "Lending Agent") may also invest the cash collateral in the Allianz Dresdner Daily Asset Fund or investments in unaffiliated money market funds or accounts, mutually agreed to by the Portfolio and the Lending Agent, that comply with Rule 2a-7 of the 1940 Act relating to money market funds.
As of December 31, 2007, the Portfolio had on loan securities valued as indicated:
| Portfolio | Value at December 31, 2007 | ||||||
| Janus Aspen Mid Cap Growth Portfolio | $ | 40,323,274 | |||||
As of December 31, 2007, the Portfolio received cash collateral for securities lending activity as indicated:
| Portfolio | Cash Collateral at December 31, 2007 | ||||||
| Janus Aspen Mid Cap Growth Portfolio | $ | 41,661,385 | |||||
As of December 31, 2007, all cash collateral received by the Portfolio was invested in the Allianz Dresdner Daily Asset Fund, except for $7,214,923 and $5,547,359 which were invested in Repurchase Agreements and Time Deposits, respectively.
The value of the collateral must be at least 102% of the market value of the loaned securities that are denominated in U.S. dollars and 105% of the market value of the loaned securities that are not denominated in U.S. dollars. Loaned securities and related collateral are marked-to-market each business day based upon the market value of the loaned securities at the close of business, employing the most recent available pricing information. Collateral levels are then adjusted based on this mark-to-market evaluation.
The borrower pays fees at the Portfolio's direction to the Lending Agent. The Lending Agent may retain a portion of the interest earned on the cash collateral invested. The cash collateral invested by the Lending Agent is disclosed in the Schedule of Investments (if applicable). The lending fees and the Portfolio's portion of the interest income earned on cash collateral are included on the Statement of Operations (if applicable).
Interfund Lending
Pursuant to an exemptive order received from the SEC, the Portfolio may be party to an interfund lending agreement between the Portfolio and other Janus Capital sponsored mutual funds, which permits it to borrow or lend cash at a rate beneficial to both the borrowing and lending funds. Outstanding borrowings from all sources totaling 10% or more of the borrowing Portfolio's total assets must be collateralized at 102% of the outstanding principal value of the loan; loans of less than 10% may be unsecured. During the fiscal year ended December 31, 2007, there were no outstanding interfund borrowing or lending arrangements for the Portfolio.
Forward Currency Transactions
The Portfolio may enter into forward currency contracts in order to reduce its exposure to changes in foreign currency exchange rates on its foreign portfolio holdings and to lock in the U.S. dollar cost of firm purchase and sale commitments for securities denominated in or exposed to foreign currencies. A forward currency exchange contract is a commitment to purchase or sell a foreign currency at a future date at a negotiated rate. The gain or loss arising from the difference between the U.S. dollar cost of the original contract and the value of the foreign currency in U.S. dollars upon closing a contract is included in "Net realized gain/(loss) from investment and foreign currency transactions" on the Statement of Operations (if applicable).
Forward currency contracts held by the Portfolio are fully collateralized by other securities, which are denoted in the accompanying Schedule of Investments (if applicable). The collateral is evaluated daily to ensure its market value equals or exceeds the current market value of the corresponding forward currency contracts. As of December 31, 2007, the Portfolio was not invested in forward foreign currency contracts.
Futures Contracts
The Portfolio may enter into futures contracts to gain exposure to the stock market pending investment of cash balances or to meet liquidity needs. The Portfolio may also use such derivative instruments to hedge or protect from adverse movements in securities prices, currency rates or interest rates. The use of futures contracts may involve risks such as the possibility of illiquid markets or imperfect correlation between the value of the contracts and the underlying securities, or that the counterparty will fail to perform its obligations.
Futures contracts are marked-to-market daily, and the daily variation margin is recorded as a receivable or payable on the Statement of Assets and Liabilities (if applicable). When a contract is closed, a realized gain or loss is recorded as "Net realized gain/(loss) from futures contracts" on the Statement of Operations (if applicable) equal to the difference between the opening and closing value of the contract. Generally, futures contracts are marked-to-market (i.e., treated as realized and subject to distribution) for federal income tax purposes at fiscal year-end. Securities designated as collateral for market value on futures contracts are noted in the Schedule of Investments (if applicable). Such collateral is in the possession of the Portfolio's custodian. As of December 31, 2007, the Portfolio was not invested in futures contracts.
Short Sales
The Portfolio may engage in "short sales against the box." Short sales against the box involve either selling short a security that the Portfolio owns, or selling short a security that the Portfolio has the right to obtain, for delivery at a specified
Janus Aspen Series December 31, 2007 17
Notes to Financial Statements (continued)
date in the future. The Portfolio may enter into a short sale against the box to hedge against anticipated declines in the market price of portfolio securities by locking in gains. The Portfolio does not deliver from its portfolio the securities sold short and does not immediately receive the proceeds of the short sale. The Portfolio borrows the securities sold short and receives proceeds from the short sale only when it delivers the securities to the lender. If the value of the securities sold short increases prior to the scheduled delivery date, the Portfolio loses the opportunity to participate in the gain.
The Portfolio may engage in short sales when the portfolio manager anticipates that a security's market purchase price will be less than its borrowing price. To complete the transaction, the Portfolio must borrow the security to deliver it to the purchaser and buy that same security in the market to return it to the lender. The total market value of all of the Portfolio's short sale positions will not exceed 10% of its assets. Although the potential for gain is limited to the difference between the price at which the Portfolio sold the security short and the cost of borrowing the security, its potential for loss is theoretically unlimited because there is no limit to the cost of replacing the borrowed security. There is no assurance that the Portfolio will be able to close out a short position at a particular time or at an acceptable price. A gain or a loss will be recognized upon termination of a short sale. There is no limit to the size of any loss that the Portfolio may recognize upon termination of a short sale. Short sales held by the Portfolio are fully collateralized by other securities, which are denoted in the accompanying Schedule of Investments (if applicable). As of December 31, 2007, the Portfolio was not engaged in short sales.
Foreign Currency Translations
The Portfolio does not isolate that portion of the results of operations resulting from changes in foreign exchange rates on investments from the fluctuations arising from changes in market prices of securities held at the date of the financial statements. Net unrealized appreciation or depreciation on investments and foreign currency translation arise from changes in the value of assets and liabilities, including investments in securities held at the date of the financial statements, resulting from changes in the exchange rates and changes in market prices of securities held.
Currency gains and losses are also calculated on payables and receivables that are denominated in foreign currencies. The payables and receivables are generally related to foreign security transactions and income.
Foreign currency-denominated assets and forward currency contracts may involve more risks than domestic transactions, including currency risk, political and economic risk, regulatory risk and market risk. Risks may arise from the potential inability of a counterparty to meet the terms of a contract and from unanticipated movements in the value of foreign currencies relative to the U.S. dollar.
When-issued Securities
The Portfolio may purchase or sell securities on a when-issued or forward commitment basis. The price of the underlying securities and date when the securities will be delivered and paid for are fixed at the time the transaction is negotiated.
Losses may arise due to changes in the market value of the securities or from the inability of counterparties to meet the terms of the contract. In connection with such purchases, the Portfolio may hold liquid assets as collateral with the Portfolio's custodian sufficient to cover the purchase price. As of December 31, 2007, the Portfolio was not invested in when-issued securities.
Equity-Linked Structured Notes
The Portfolio may invest in equity-linked structured notes. Equity-linked structured notes are derivative securities which are specially designed to combine the characteristics of one or more underlying securities and their equity derivatives in a single note form. The return and/or yield or income component may be based on the performance of the underlying equity securities, an equity index, and/or option positions. Equity-linked structured notes are typically offered in limited transactions by financial institutions in either registered or non-registered form. An investment in equity-linked structured notes creates exposure to the credit risk of the issuing financial institution, as well as to the market risk of the underlying securities. There is no guaranteed return of principal with these securities and the appreciation potential of these securities may be limited by a maximum payment or call right. In certain cases, equity-linked struc tured notes may be more volatile and less liquid than less complex securities or other types of fixed-income securities. Such securities may exhibit price behavior that does not correlate with other fixed-income securities. As of December 31, 2007, the Portfolio was not invested in equity-linked structured notes.
Initial Public Offerings
The Portfolio may invest in initial public offerings ("IPOs"). IPOs and other investment techniques may have a magnified performance impact on a fund with a small asset base. The Portfolio may not experience similar performance as its assets grow.
Restricted Security Transactions
Restricted securities held by the Portfolio may not be sold except in exempt transactions or in a public offering registered under the Securities Act of 1933. The risk of investing in such securities is generally greater than the risk of investing in the securities of widely held, publicly traded companies. Lack of a secondary market and resale restrictions may result in the inability of the Portfolio to sell a security at a fair price and may substantially delay the sale of the security. In addition, these securities may exhibit greater price volatility than securities for which secondary markets exist. As of December 31, 2007, the Portfolio was not invested in restricted securities.
Dividend Distributions
The Portfolio may make semiannual distributions of substantially all of its investment income and an annual distribution of its net realized capital gains (if any). The majority of dividends and net realized capital gains distributions from the Portfolio may be automatically reinvested into additional shares of the Portfolio, based upon the discretion of the shareholder.
The Portfolio has made certain investments in real estate investment trusts ("REITs") which pay dividends to their shareholders based upon funds available from operations. It is
18 Janus Aspen Series December 31, 2007
quite common for these dividends to exceed the REIT's taxable earnings and profits resulting in the excess portion of such dividends being designated as a return of capital. If the Portfolio distributes such amounts, such distribution could constitute a return of capital to shareholders for federal income tax purposes.
Estimates
The preparation of financial statements in conformity with accounting principles generally accepted in the United States of America requires management to make estimates and assumptions that affect the reported amount of assets and liabilities and disclosure of contingent assets and liabilities at the date of the financial statements, and the reported amounts of income and expenses during the reporting period. Actual results could differ from those estimates.
Federal Income Taxes
No provision for income taxes is included in the accompanying financial statements, as the Portfolio intends to distribute to shareholders all taxable investment income and realized gains and otherwise comply with Subchapter M of the Internal Revenue Code applicable to regulated investment companies.
New Accounting Pronouncements
In July 2006, the Financial Accounting Standards Board ("FASB") issued Interpretation No. 48, "Accounting for Uncertainty in Income Taxes – an Interpretation of FASB Statement No. 109" (the "Interpretation"). The Interpretation establishes for all entities, including pass-through entities such as the Portfolio, a minimum threshold for financial statement recognition of the benefit of positions taken in filing tax returns (including whether an entity is taxable in a particular jurisdiction), and requires certain expanded tax disclosures. A calendar year open-end or closed-end fund was required to implement the Interpretation no later than June 29, 2007 (the last business day of the semi-annual reporting period), and the Interpretation also applies to all open tax years as of the date of effectiveness. Management has evaluated the application of the Interpretation to the Portfolio and has determined there is no significant impact on the P ortfolio's financial statements.
In September 2006, the FASB issued Statement of Financial Accounting Standards No. 157, "Fair Value Measurements" ("SFAS No. 157"), which defines fair value, establishes a framework for measuring fair value in generally accepted accounting principles, and expands disclosures about fair value measurements. SFAS No. 157 does not require new fair value measurements, but is applied to the extent that other accounting pronouncements require or permit fair value measurements. SFAS No. 157 emphasizes that fair value is a market-based measurement that should be determined based on the assumptions that market participants would use in pricing an asset or liability. SFAS No. 157 is effective for fiscal years beginning after November 15, 2007 and interim periods within those fiscal years. Management does not believe the adoption of SFAS No. 157 will impact the financial statement amounts, however, the Portfolio will be required to disclose the extent t o which fair value is used to measure assets and liabilities and the inputs used to develop the measurements.
2. INVESTMENT ADVISORY AGREEMENTS AND OTHER TRANSACTIONS WITH AFFILIATES
The Portfolio pays a monthly advisory fee to Janus Capital based upon average daily net assets and calculated at the annual rate of 0.64%.
Janus Services LLC ("Janus Services"), a wholly-owned subsidiary of Janus Capital, is the Portfolio's transfer agent. Janus Services receives certain out-of-pocket expenses for transfer agent services.
Certain officers of the Portfolio may also be officers and/or directors of Janus Capital. Such officers receive no compensation from the Portfolio, except for the Portfolio's Chief Compliance Officer. Effective January 1, 2006, the Portfolio began reimbursing the adviser for a portion of the compensation paid to the Chief Compliance Officer of the Trust. Total compensation of $3,078 was paid by the Portfolio during the fiscal year ended December 31, 2007. The Portfolio's portion is reported as part of "Other Expenses" on the Statement of Operations.
The Board of Trustees has adopted a deferred compensation plan (the "Deferred Plan") for independent Trustees to elect to defer receipt of all or a portion of the annual compensation they are entitled to receive from the Portfolio. All deferred fees are credited to an account established in the name of the Trustees. The amounts credited to the account then increase or decrease, as the case may be, in accordance with the performance of one or more of the Janus funds that are selected by the Trustees. The account balance continues to fluctuate in accordance with the performance of the selected fund or funds until final payment of all amounts credited to the account. The fluctuation of the account balance is recorded by the Portfolio as unrealized appreciation/(depreciation) and is shown as of December 31, 2007 on the Statement of Assets and Liabilities as an asset, "Noninterested Trustees' deferred compensation," and a liability, "Nonintereste d Trustees' deferred compensation fees." Additionally, the recorded unrealized appreciation/(depreciation) is included in "Unrealized net appreciation/(depreciation) of investments, foreign currency translations and non-interested Trustees' deferred compensation" on the Statement of Assets and Liabilities. Deferred compensation expenses for the fiscal year ended December 31, 2007 are included in "Non-interested Trustees' fees and expenses" on the Statement of Operations. Trustees are allowed to change their designation of mutual funds from time to time. Amounts will be deferred until distributed in accordance with the Deferred Plan. No deferred fees were paid to any Trustee under the Deferred Plan during the fiscal year ended December 31, 2007.
For the fiscal year ended December 31, 2007, Janus Capital assumed $24,421 of legal, consulting and Trustee costs and fees incurred by the funds in Janus Investment Fund, Janus Aspen Series and Janus Adviser Series (the "Funds") in connection with the regulatory and civil litigation matters discussed in Note 6. These non-recurring costs were allocated to all Funds based on the Funds' respective net assets as of July 31, 2004. Additionally, all future non-recurring costs will be allocated based on the Funds' respective net assets on July 31, 2004. These "Non-recurring costs" and "Costs assumed by Janus Capital" are shown on the Statement of Operations.
Janus Aspen Series December 31, 2007 19
Notes to Financial Statements (continued)
Janus Distributors LLC, a wholly-owned subsidiary of Janus Capital, is a distributor of the Portfolio. Service Shares have adopted a Distribution and Shareholder Servicing Plan (the "Plan") pursuant to Rule 12b-1 under the 1940 Act. The Plan authorizes payments by the Portfolio in connection with the distribution of Service Shares at an annual rate of up to 0.25% of Service Share's average daily net assets.
The Portfolio's expenses may be reduced by expense offsets from an unaffiliated custodian and/or transfer agent. Such credits or offsets are included in "Expense and Fee Offset" on the Statement of Operations. The transfer agent fee offsets received during the period reduce Transfer Agent Fees and Expenses. Custodian offsets received reduce Custodian Fees. The Portfolio could have employed the assets used by the custodian and/or transfer agent to produce income if it had not entered into an expense offset arrangement.
The Portfolio may invest in money market funds, including funds managed by Janus Capital. During the fiscal year ended December 31, 2007, the Portfolio recorded distributions from affiliated investment companies as affiliated dividend income, and had the following affiliated purchases and sales:
| Purchases Shares/Cost | Sales Shares/Cost | Dividend Income | Value at 12/31/07 | ||||||||||||||||
| Janus Aspen Mid Cap Growth Portfolio | |||||||||||||||||||
| Janus Institutional Cash Management Fund – Institutional Shares | $ | 53,741,956 | $ | 38,144,110 | $ | 289,357 | $ | 15,597,846 | |||||||||||
| Janus Institutional Cash Reserves Fund | 2,928,174 | 6,126,003 | 9,463 | – | |||||||||||||||
| Janus Institutional Money Market Fund – Institutional Shares | 124,304,761 | 124,304,761 | 172,333 | – | |||||||||||||||
| Janus Money Market Fund – Institutional Shares | 26,411,500 | 26,411,500 | 20,072 | – | |||||||||||||||
| $ | 207,386,391 | $ | 194,986,374 | $ | 491,225 | $ | 15,597,846 | ||||||||||||
3. FEDERAL INCOME TAX
The tax components of capital shown in the table below represent: (1) distribution requirements the Portfolio must satisfy under the income tax regulations; (2) losses or deductions the Portfolio may be able to offset against income and gains realized in future years; and (3) unrealized appreciation or depreciation of investments for federal income tax purposes (reduced by foreign tax liability).
In 2007, the Portfolio incurred "Post-October" losses during the period from November 1, 2007 through December 31, 2007. These losses will be deferred for tax purposes and recognized in 2008.
Other book to tax differences in the current year may consist of deferred compensation, derivatives, and foreign currency contract adjustments. The Portfolio has elected to treat gains and losses on forward foreign currency contracts as capital gains and losses. Other foreign currency gains and losses on debt instruments are treated as ordinary income for federal income tax purposes pursuant to Section 988 of the Internal Revenue Code.
Accumulated capital losses noted below represent net capital loss carryovers, as of December 31, 2007, that may be available to offset future realized capital gains and thereby reduce future taxable gains distributions.
| Portfolio | Undistributed Ordinary Income | Undistributed Long-Term Gains | Accumulated Capital Losses | Post October Deferral | Other Book to Tax Differences | Net Tax Appreciation/ (Depreciation) | |||||||||||||||||||||
| Janus Aspen Mid Cap Growth Portfolio(1) | $ | 353,972 | $ | 43,814,507 | $ | (303,594,366 | ) | $ | (163 | ) | $ | (6,331 | ) | $ | 300,986,834 | ||||||||||||
(1) Capital Loss Carryover is subject to annual limitations.
The table below shows the expiration dates of the carryovers.
Capital Loss Carryover Expiration Schedule
For the year ended December 31, 2007
| Portfolio | December 31, 2009 | December 31, 2010 | December 31, 2011 | ||||||||||||
| Janus Aspen Mid Cap Growth Portfolio(1) | $ | (226,338,650 | ) | $ | (53,089,575 | ) | $ | (24,166,141 | ) | ||||||
(1) Capital Loss Carryover is subject to annual limitations.
During the year ended December 31, 2007, the following capital loss carryover was utilized by the Portfolio as indicated in the table below.
| Portfolio | Capital Loss Carryover Utilized | ||||||
| Janus Aspen Mid Cap Growth Portfolio | $ | 73,514,791 | |||||
20 Janus Aspen Series December 31, 2007
The aggregate cost of investments and the composition of unrealized appreciation and depreciation of investment securities for federal income tax purposes as of December 31, 2007 are noted below.
Unrealized appreciation and unrealized depreciation in the table below exclude appreciation/depreciation on foreign currency translations. The primary difference between book and tax appreciation or depreciation of investments is wash sale loss deferrals and passive foreign investment companies.
| Portfolio | Federal Tax Cost | Unrealized Appreciation | Unrealized (Depreciation) | ||||||||||||
| Janus Aspen Mid Cap Growth Portfolio | $ | 655,773,304 | $ | 332,807,989 | $ | (31,821,155 | ) | ||||||||
Income and capital gains distributions are determined in accordance with income tax regulations that may differ from accounting principles generally accepted in the United States of America. These differences are due to differing treatments for items such as net short-term gains, deferral of wash sale losses, foreign currency transactions, net investment losses and capital loss carryovers. Certain permanent differences such as tax returns of capital and net investment losses noted below have been reclassified to paid-in capital.
| For the fiscal year ended December 31, 2007 | Distributions | ||||||||||||||||||
| Portfolio | From Ordinary Income | From Long-Term Capital Gains | Tax Return of Capital | Net Investment Loss | |||||||||||||||
| Janus Aspen Mid Cap Growth Portfolio | $ | 1,387,888 | $ | 4,554,706 | $ | – | $ | – | |||||||||||
| For the fiscal year ended December 31, 2006 | Distributions | ||||||||||||||||||
| Portfolio | From Ordinary Income | From Long-Term Capital Gains | Tax Return of Capital | Net Investment Loss | |||||||||||||||
| Janus Aspen Mid Cap Growth Portfolio | $ | – | $ | – | $ | – | $ | (511,307 | ) | ||||||||||
4. CAPITAL SHARE TRANSACTIONS
| For each fiscal year ended December 31 | Janus Aspen Mid Cap Growth Portfolio | ||||||||||
| (all numbers in thousands) | 2007 | 2006 | |||||||||
| Transactions in Portfolio Shares – Institutional Shares | |||||||||||
| Shares sold | 1,523 | 1,390 | |||||||||
| Reinvested dividends and distributions | 109 | – | |||||||||
| Shares repurchased | (3,335 | ) | (3,855 | ) | |||||||
| Net Increase/(Decrease) in Portfolio Shares | (1,703 | ) | (2,465 | ) | |||||||
| Shares Outstanding, Beginning of Period | 15,867 | 18,332 | |||||||||
| Shares Outstanding, End of Period | 14,164 | 15,867 | |||||||||
| Transactions in Portfolio Shares – Service Shares | |||||||||||
| Shares sold | 3,322 | 831 | |||||||||
| Reinvested dividends and distributions | 52 | – | |||||||||
| Shares repurchased | (1,810 | ) | (1,946 | ) | |||||||
| Net Increase/(Decrease) in Portfolio Shares | 1,564 | (1,115 | ) | ||||||||
| Shares Outstanding, Beginning of Period | 7,905 | 9,020 | |||||||||
| Shares Outstanding, End of Period | 9,469 | 7,905 | |||||||||
5. PURCHASES AND SALES OF INVESTMENT SECURITIES
For the fiscal year ended December 31, 2007, the aggregate cost of purchases and proceeds from sales of investment securities (excluding short-term securities) were as follows:
| Portfolio | Purchases of Securities | Proceeds from Sales of Securities | Purchases of Long- Term U.S. Government Obligations | Proceeds from Sales of Long-Term U.S. Government Obligations | |||||||||||||||
| Janus Aspen Mid Cap Growth Portfolio | $ | 382,058,169 | $ | 418,589,427 | $ | – | $ | – | |||||||||||
Janus Aspen Series December 31, 2007 21
Notes to Financial Statements (continued)
6. PENDING LEGAL MATTERS
In the fall of 2003, the Securities and Exchange Commission ("SEC"), the Office of the New York State Attorney General ("NYAG"), the Colorado Attorney General ("COAG"), and the Colorado Division of Securities ("CDS") announced that they were investigating alleged frequent trading practices in the mutual fund industry. On August 18, 2004, Janus Capital announced that it had reached final settlements with the SEC, the NYAG, the COAG, and the CDS related to such regulators' investigations into Janus Capital's frequent trading arrangements.
A number of civil lawsuits were brought against Janus Capital and certain of its affiliates, the Janus funds, and related entities and individuals based on allegations similar to those announced by the above regulators and were filed in several state and federal jurisdictions. Such lawsuits alleged a variety of theories for recovery including, but not limited to, the federal securities laws, other federal statutes (including ERISA), and various common law doctrines. The Judicial Panel on Multidistrict Litigation transferred these actions to the U.S. District Court for the District of Maryland (the "Court") for coordinated proceedings. On September 29, 2004, five consolidated amended complaints were filed with the Court that generally include: (i) claims by a putative class of investors in certain Janus funds asserting claims on behalf of the investor class (Marini, et al. v. Janus Investment Fund, et al., U.S. District Court, District of Maryland, Case No. 04-CV-00497); (ii) derivative claims by investors in certain Janus funds ostensibly on behalf of such funds (Steinberg et al. v. Janus Capital Management, LLC et al., U.S. District Court, District of Maryland, Case No. 04-CV-00518); (iii) claims on behalf of participants in the Janus 401(k) plan (Wangberger v. Janus Capital Group Inc., 401(k) Advisory Committee, et al., U.S. District Court, District of Maryland, Case No. JFM-05-2711); (iv) claims brought on behalf of shareholders of Janus Capital Group Inc. ("JCGI") on a derivative basis against the Board of Directors of JCGI (Chasen v. Whiston, et al., U.S. District Court, District of Maryland, Case No. 04-MD-00855); and (v) claims by a putative class of shareholders of JCGI asserting claims on behalf of the shareholders (Wiggins, et al. v. Janus Capital Group, Inc., et al., U.S. District Court, District of Maryland, Case No. 04-CV-00818). Each of the five complaints initially named JCGI and/or Janus Capita l as a defendant. In addition, the following were also named as defendants in one or more of the actions: Janus Investment Fund ("JIF"), Janus Aspen Series ("JAS"), Janus Adviser Series ("JAD"), Janus Distributors LLC, Enhanced Investment Technologies, LLC ("INTECH"), Bay Isle Financial LLC ("Bay Isle"), Perkins, Wolf, McDonnell and Company, LLC ("Perkins"), the Advisory Committee of the Janus 401(k) plan, and the current or former directors of JCGI.
On August 25, 2005, the Court entered orders dismissing most of the claims asserted against Janus Capital and its affiliates by fund investors in the Marini and Steinberg cases (actions (i) and (ii) above) except certain claims under Section 10(b) of the Securities Exchange Act of 1934 and under Section 36(b) of the Investment Company Act of 1940, as amended (the "1940 Act"). On August 15, 2006, the Wangberger complaint in the 401(k) plan class action (action (iii) above) was dismissed by the district court with prejudice. The plaintiff appealed that dismissal decision to the United States Court of Appeals for the Fourth Circuit. The appeal is still pending and argument in the matter was held in December 2007. The Court also dismissed the Chasen lawsuit (action (iv) above) against JCGI's Board of Directors without leave to amend. Finally, a Motion to Dismiss the Wiggins suit (action (v) above) was granted a nd the matter was dismissed in May 2007. However, in June 2007, Plaintiffs appealed that dismissal to the United States Court of Appeals for the Fourth Circuit. That appeal is currently pending.
In addition to the lawsuits described above, the Auditor of the State of West Virginia ("Auditor"), in his capacity as securities commissioner, has initiated administrative proceedings against many of the defendants in the market timing cases (including JCGI and Janus Capital) and, as a part of its relief, is seeking disgorgement and other monetary relief based on similar market timing allegations (In the Matter of Janus Capital Group Inc. et al., Before the Securities Commissioner, State of West Virginia, Summary Order No. 05-1320). The respondents in these proceedings collectively sought a Writ of Prohibition in state court, which was denied. Their subsequent Petition for Appeal was also denied. Consequently, in September 2006, JCGI and Janus Capital filed their answer to the Auditor's summary order instituting proceedings and requested a hearing. A status conference was held on June 28, 2007, during which the parties were ordered t o submit their proposed scheduling order. To date, no scheduling order has been entered in the case. In addition to the pending Motion to Discharge Order to Show Cause, JCGI and Janus Capital, as well as other similarly situated defendants, continue to challenge the statutory authority of the Auditor to bring such an action.
Additional lawsuits may be filed against certain of the Janus funds, Janus Capital, and related parties in the future. Janus Capital does not currently believe that these pending actions will materially affect its ability to continue providing services it has agreed to provide to the Janus funds.
22 Janus Aspen Series December 31, 2007
Report of Independent Registered Public
Accounting Firm
To the Trustees and Shareholders
of Janus Aspen Mid Cap Growth Portfolio
In our opinion, the accompanying statement of assets and liabilities, including the schedule of investments, and the related statements of operations and of changes in net assets and the financial highlights present fairly, in all material respects, the financial position of Janus Aspen Mid Cap Growth Portfolio (one of the portfolios constituting Janus Aspen Series, hereafter referred to as the "Portfolio") at December 31, 2007, the results of its operations for the year then ended, the changes in its net assets for each of the two years in the period then ended, and the financial highlights for the each of the five years in the period then ended, in conformity with accounting principles generally accepted in the United States of America. These financial statements and financial highlights (hereafter referred to as "financial statements") are the responsibility of the Portfolio's management; our responsibility is to express an opinion on the se financial statements based on our audits. We conducted our audits of these financial statements in accordance with the standards of the Public Company Accounting Oversight Board (United States). Those standards require that we plan and perform the audit to obtain reasonable assurance about whether the financial statements are free of material misstatement. An audit includes examining, on a test basis, evidence supporting the amounts and disclosures in the financial statements, assessing the accounting principles used and significant estimates made by management, and evaluating the overall financial statement presentation. We believe that our audits, which included confirmation of securities at December 31, 2007 by correspondence with the custodian, transfer agent and brokers, and the application of alternative auditing procedures where securities purchased had not been received, provide a reasonable basis for our opinion.

Denver, Colorado
February 15, 2008
Janus Aspen Series December 31, 2007 23
Additional Information (unaudited)
PROXY VOTING POLICIES AND VOTING RECORD
A description of the policies and procedures that the Portfolio uses to determine how to vote proxies relating to its portfolio securities is available: (i) without charge, upon request, by calling 1-800-525-0020 (toll free); (ii) on the Portfolio's website at www.janus.com/proxyvoting; and (iii) on the SEC's website at http://www.sec.gov. Additionally, information regarding the Portfolio's proxy voting record for the most recent twelve-month period ended June 30 is also available, free of charge, through www.janus.com/proxyvoting and from the SEC's website at http://www.sec.gov.
QUARTERLY PORTFOLIO HOLDINGS
The Portfolio files its complete portfolio holdings (schedule of investments) with the SEC for the first and third quarters of each fiscal year on Form N-Q within 60 days of the end of such fiscal quarter. The Portfolio's Form N-Q: (i) is available on the SEC's website at http://www.sec.gov; (ii) may be reviewed and copied at the SEC's Public Reference Room in Washington, D.C. (information on the Public Reference Room may be obtained by calling 1-800-SEC-0330); and (iii) is available without charge, upon request, by calling Janus at 1-800-525-0020 (toll free).
APPROVAL OF ADVISORY AGREEMENTS DURING THE PERIOD
The Trustees of Janus Aspen Series, none of whom has ever been affiliated with Janus Capital ("Independent Trustees"), oversee the management of each Portfolio and, as required by law, determine annually whether to continue the investment advisory agreement for each Portfolio and the subadvisory agreements for the three Portfolios that utilize subadvisers.
In connection with their most recent consideration of those agreements for each Portfolio, the Trustees received and reviewed a substantial amount of information provided by Janus Capital and the respective subadvisers in response to requests of the Independent Trustees and their independent legal counsel. They also received and reviewed a considerable amount of information and analysis provided by their independent fee consultant. Throughout their consideration of the agreements, the Independent Trustees were advised by their independent legal counsel. The Independent Trustees met with management to consider the agreements, and also met separately in executive session with their independent legal counsel and their independent fee consultant.
At a meeting held on December 14, 2007, based on their evaluation of the information provided by Janus Capital, the subadvisers and the independent fee consultant, as well as other information, the Trustees determined that the overall arrangements between each Portfolio and Janus Capital and each subadviser, as applicable, were fair and reasonable in light of the nature, extent and quality of the services provided by Janus Capital, its affiliates and the subadvisers, the fees charged for those services, and other matters that the Trustees considered relevant in the exercise of their business judgment. At that meeting the Trustees unanimously approved the continuation of the investment advisory agreement for each Portfolio, and the subadvisory agreement for each subadvised Portfolio, for the period from February 1, 2008 through February 1, 2009, subject to earlier termina tion as provided for in each agreement.
In considering the continuation of those agreements, the Trustees reviewed and analyzed various factors that they determined were relevant, including the factors described below, none of which by itself was considered dispositive. However, the material factors and conclusions that formed the basis for the Trustees' determination to approve the continuation of the agreements are discussed separately below.
Nature, Extent and Quality of Services
The Trustees reviewed the nature, extent and quality of the services provided by Janus Capital and the subadvisers to the Portfolios, taking into account the investment objective and strategy of each Portfolio, the knowledge of the Trustees gained from their regular meetings with management on at least a quarterly basis, and their ongoing review of information related to the Portfolios. In addition, the Trustees reviewed the resources and key personnel of Janus Capital and each subadviser, especially those who provide investment management services to the Portfolios. The Trustees also considered other services provided to the Portfolios by Janus Capital or the subadvisers, such as managing the execution of portfolio transactions and the selection of broker-dealers for those transactions, serving as the Portfolios' administrator, monitoring adherence to the Portfolios' investment restrictions, producing shareholder reports, providing support services for the Trustees and Trustee committees, communicating with shareholders, and overseeing the activities of other service providers, including monitoring compliance with various policies and procedures of the Portfolios and with applicable securities laws and regulations.
The Trustees concluded that the nature, extent and quality of the services provided by Janus Capital and/or the subadviser to each Portfolio were appropriate and consistent with the terms of the respective advisory and subadvisory agreements; that, taking into account steps taken to address those Portfolios whose performance lagged that of the median of their peers for certain periods, the quality of those services had been consistent with or superior to quality norms in the industry; and that the Portfolios were likely to benefit from the continued provision of those services. They
24 Janus Aspen Series December 31, 2007
also concluded that Janus Capital and each subadviser had sufficient personnel, with the appropriate education and experience, to serve the Portfolios effectively and had demonstrated its continuing ability to attract well-qualified personnel.
Performance of the Portfolios
The Trustees considered the investment results of each Portfolio over various time periods. They reviewed information comparing each Portfolio's performance with the performance of comparable funds and peer groups identified by Lipper Inc., an independent provider of investment company data, and with the Portfolio's benchmark index. They concluded that the performance of many Portfolios was good to very good under current market conditions. Although the performance of some Portfolios lagged that of the median of their peers for certain periods, the Trustees also concluded that Janus Capital had taken appropriate steps to address those instances of under-performance and that the more recent performance of most of those Portfolios had been improving.
Costs of Services Provided
The Trustees examined information on the fees and expenses of each Portfolio in comparison to similar information for comparable funds as provided by Lipper. They also reviewed an analysis of that information provided by their independent fee consultant and noted that the rate of management (investment advisory and administrative) fees for most of the Portfolios, in some cases after contractual expense limitations, was below the mean management fee rate of the respective peer group of funds selected by Lipper.
The Trustees considered the methodology used by Janus Capital and each subadviser in determining compensation payable to portfolio managers, the competitive environment for investment management talent and the competitive market for mutual funds in different distribution channels. They concluded that the compensation methodology provided a good alignment of the interests of the portfolio managers with those of Portfolio shareholders.
The Trustees also reviewed management fees charged by Janus Capital to its separate account clients and to its subadvised funds (for which Janus Capital provides only services related to portfolio management). Although in most instances subadvisory and separate account fee rates for various investment strategies were lower than management fee rates for Portfolios having a similar strategy, the Trustees noted that, under the terms of the management agreements with the Portfolios, Janus Capital performs significant additional services for the Portfolios that it does not provide to those other clients, including administrative services, oversight of the Portfolios' other service providers, Trustee support, regulatory compliance and numerous other services, and that, in serving the Portfolios, Janus Capital assumes many legal risks that it does not assume in servicing its ot her clients. Moreover, the Trustees noted that the spread between the average fee rates charged to the Portfolios and the fee rates that Janus Capital charged to its separate account clients was significantly smaller than the average spread for such fee rates of other advisers, based on publicly available data and research conducted by their independent fee consultant.
The Trustees reviewed information on the profitability to Janus Capital and its affiliates of their relationships with each Portfolio, as well as an explanation of the methodology used in allocating various expenses of Janus Capital and its affiliates among the Portfolios and other clients. They also reviewed the financial statements of Janus Capital's parent company and its corporate structure. In their review, the Trustees considered whether Janus Capital and each subadviser receives adequate incentives to manage the Portfolios effectively. They recognized that profitability comparisons among investment advisers are difficult because very little comparative information is publicly available and profitability of any adviser is affected by numerous factors, including the organizational structure of the particular adviser, the types of funds and other accounts it manages, possible other lines of business, the methodology for allocating expens es, and the adviser's capital structure and cost of capital. However, based on the information available and taking those factors into account, the Trustees concluded that Janus Capital's profitability with respect to each Portfolio in relation to the services rendered was not unreasonable.
The Trustees concluded that the management fees and other compensation payable by each Portfolio to Janus Capital and its affiliates, as well as the fees payable by Janus Capital or the Portfolios to the subadvisers of subadvised Portfolios, were reasonable in relation to the nature, extent and quality of the services provided, taking into account the fees charged by other advisers for managing comparable mutual funds with similar strategies and the fees Janus Capital and the subadvisers charge to other clients. They also concluded that the overall expense ratio of each Portfolio was reasonable, taking into account the size of the Portfolio, the quality of
Janus Aspen Series December 31, 2007 25
Additional Information (unaudited) (continued)
services provided by Janus Capital and any subadviser, the investment performance of the Portfolio and any expense limitations agreed to by Janus Capital.
Economies of Scale
The Trustees considered information about the potential for Janus Capital to realize economies of scale as the assets of the Portfolios increase. They noted that, although most Portfolios pay advisory fees at a fixed rate as a percentage of net assets, without any breakpoints, the management fee rate paid by each Portfolio, after any contractual expense limitations, was below the mean management fee rate of the Portfolio's peer group selected by Lipper; and, for those Portfolios whose expenses are being reduced by the contractual expense limitations of Janus Capital, Janus Capital is subsidizing the Portfolios because they have not reached adequate scale. Moreover, as the assets of many of the Portfolios declined in the past few years, those Portfolios benefited from having advisory fee rates that remained constant rather than increasing as assets declined. In addition, performance fee structures have been implemented for several Portfolios that will cause the effective rate of advisory fees payable by such a Portfolio to vary depending on the investment performance of the Portfolio relative to its benchmark index over the measurement period; and a few Portfolios have fee schedules with breakpoints and reduced fee rates above certain asset levels. The Trustees also noted that the Portfolios share directly in economies of scale through lower charges of third-party service providers, based on the combined scale of all of the Portfolios. Based on all of the information they reviewed, the Trustees concluded that the current fee structure of each Portfolio was reasonable and that the current rates of fees do reflect a sharing between Janus Capital and the Portfolio of economies of scale at the current asset level of the Portfolio.
Other Benefits to Janus Capital
The Trustees also considered benefits that accrue to Janus Capital and its affiliates from their relationships with the Portfolios. They recognized that two affiliates of Janus Capital separately serve the Portfolios as transfer agent and distributor, respectively. They also considered Janus Capital's past and proposed use of commissions paid by Portfolios on their portfolio brokerage transactions to obtain proprietary and third-party research products and services benefiting those Portfolios and/or other clients of Janus Capital. The Trustees concluded that Janus Capital's use of "soft" commission dollars of a Portfolio to obtain proprietary and third-party research products and services was consistent with regulatory requirements and guidelines and was likely to benefit the Portfolios. The Trustees also concluded that, other than the services provided by Janus Capital and its affiliates pursuant to the agreements and the fees to be paid by each Portfolio therefor, the Portfolios and Janus Capital may potentially benefit from their relationship with each other in other ways. They concluded that Janus Capital benefits from the receipt of proprietary research products and services acquired through commissions paid on portfolio transactions of the Portfolios and that the Portfolios benefit from Janus Capital's receipt of those products and services, as well as research products and services acquired through commissions paid by other clients of Janus Capital. They further concluded that success of any Portfolio could attract other business to Janus Capital or other Janus funds and that the success of Janus Capital could enhance Janus Capital's ability to serve the Portfolios.
After full consideration of the above factors, as well as other factors, all of the Trustees, all of whom are Independent Trustees, concluded that the proposed continuation of the investment advisory agreement for each Portfolio, and the subadvisory agreement for each subadvised Portfolio, was in the best interest of the respective Portfolios and their shareholders.
26 Janus Aspen Series December 31, 2007
Explanations of Charts, Tables and
Financial Statements (unaudited)
1. PERFORMANCE OVERVIEWS
The performance overview graph compares the performance of a hypothetical $10,000 investment in the Portfolio with one or more widely used market indices. The hypothetical example does not represent the returns of any particular investment.
When comparing the performance of the Portfolio with an index, keep in mind that market indices do not include brokerage commissions that would be incurred if you purchased the individual securities in the index. They also do not include taxes payable on dividends and interest or operating expenses incurred if you maintained a Portfolio invested in the index.
Average annual total returns are quoted for each class of the Portfolio. Average annual total return is calculated by taking the growth or decline in value of an investment over a period of time, including reinvestment of any dividends, distributions and capital gains, then calculating the annual compounded percentage rate that would have produced the same result had the rate of growth been constant throughout the period. Average annual total return does not reflect the deduction of taxes that a shareholder would pay on Portfolio distributions or redemptions of Portfolio shares.
Pursuant to federal securities rules, expense ratios shown in the performance chart reflect subsidized and unsubsidized ratios for the past fiscal year. The total annual portfolio operating expenses ratio is gross of any fee waivers, reflecting a Portfolio's unsubsidized expense ratio. The net annual portfolio operating expenses ratio (if applicable) includes contractual waivers of Janus Capital and/or Janus Services and reflects a Portfolio's subsidized expense ratio. Both the total annual portfolio operating expenses ratio and net annual portfolio operating expenses ratio are based on average net assets as of the fiscal year ended December 31, 2006. The ratios also include expenses indirectly incurred by the Portfolio as a result of investing in other investment companies or pooled investments, which are not reflected in the "Financial Highlights" of this report. As a result, these ratios may be higher or lower than those shown in the "Fin ancial Highlights" in this report. All expenses are shown without the effect of expense offset arrangements. Pursuant to such arrangements, credits realized as a result of uninvested cash balances are used to reduce custodian and transfer agent expenses.
2. SCHEDULE OF INVESTMENTS
Following the performance overview section is the Portfolio's Schedule of Investments. This schedule reports the industry concentrations and types of securities held in the Portfolio on the last day of the reporting period. Securities are usually listed by type (common stock, corporate bonds, U.S. Government obligations, etc.) and by industry classification (banking, communications, insurance, etc.). Holdings are subject to change without notice.
The value of each security is quoted as of the last day of the reporting period. The value of securities denominated in foreign currencies is converted into U.S. dollars. Certain short-term investments maturing within 60 days are valued at amortized cost, which approximates market value.
A summary of investments by country is provided if the Portfolio invested in foreign securities. This summary reports the Portfolio's exposure to different countries by providing the percentage of securities invested in each country. The country of each security represents the country in which the company is incorporated.
2A. FORWARD CURRENCY CONTRACTS
A table listing forward currency contracts follows the Portfolio's Schedule of Investments (if applicable). Forward currency contracts are agreements to deliver or receive a preset amount of currency at a future date. Forward currency contracts are used to hedge against foreign currency risk in the Portfolio's long-term holdings.
The table provides the name of the foreign currency, the settlement date of the contract, the amount of the contract, the value of the currency in U.S. dollars and the amount of unrealized gain or loss. The amount of unrealized gain or loss reflects the change in currency exchange rates from the time the contract was opened to the last day of the reporting period.
2B. FUTURES
A table listing futures contracts follows the Portfolio's Schedule of Investments (if applicable). Futures contracts are contracts that obligate the buyer to receive and the seller to deliver an instrument or money at a specified price on a specified date. Futures are used to hedge against adverse movements in securities prices, currency risk or interest rates.
The table provides the name of the contract, number of contracts held, the expiration date, the principal amount, value and the amount of unrealized gain or loss. The amount of unrealized gain or loss reflects the marked-to-market amount for the last day of the reporting period.
3. STATEMENT OF ASSETS AND LIABILITIES
This statement is often referred to as the "balance sheet." It lists the assets and liabilities of the Portfolio on the last day of the reporting period.
The Portfolio's assets are calculated by adding the value of the securities owned, the receivable for securities sold but not yet settled, the receivable for dividends declared but not yet received on stocks owned and the receivable for Portfolio shares sold to investors but not yet settled. The Portfolio's liabilities include payables for securities purchased but not yet settled, Portfolio shares redeemed but not yet paid and expenses owed but not yet paid. Additionally, there may be other assets and liabilities such as unrealized gain or loss on forward currency contracts.
The section entitled "Net Assets Consist of" breaks down the components of the Portfolio's net assets. Because the Portfolio
Janus Aspen Series December 31, 2007 27
Explanations of Charts, Tables and
Financial Statements (unaudited) (continued)
must distribute substantially all earnings, you will notice that a significant portion of net assets is shareholder capital.
The last section of this statement reports the net asset value ("NAV") per share on the last day of the reporting period for each class of the Portfolio. The NAV is calculated by dividing the Portfolio's net assets (assets minus liabilities) by the number of shares outstanding.
4. STATEMENT OF OPERATIONS
This statement details the Portfolio's income, expenses, gains and losses on securities and currency transactions, and appreciation or depreciation of current Portfolio holdings. The first section in this statement, entitled "Investment Income," reports the dividends earned from stocks and interest earned from interest-bearing securities in the Portfolio.
The next section reports the expenses and expense offsets incurred by the Portfolio, including the advisory fee paid to the investment adviser, transfer agent fees and expenses, printing and postage for mailing statements, financial reports and prospectuses, and other expenses. Expense offsets, if any, are also shown.
The last section lists the increase or decrease in the value of securities held in the Portfolio. The Portfolio realizes a gain (or loss) when it sells its position in a particular security. An unrealized gain (or loss) refers to the change in net appreciation or depreciation of the Portfolio during the reporting period. "Net Realized and Unrealized Gain/(Loss) on Investments" is affected both by changes in the market value of Portfolio holdings and by gains (or losses) realized during the reporting period.
5. STATEMENT OF CHANGES IN NET ASSETS
This statement reports the increase or decrease in the Portfolio's net assets during the reporting period. Changes in the Portfolio's net assets are attributable to investment operations, dividends, distributions and capital share transactions. This is important to investors because it shows exactly what caused the Portfolio's net asset size to change during the period.
The first section summarizes the information from the Statement of Operations regarding changes in net assets due to the Portfolio's investment performance. The Portfolio's net assets may also change as a result of dividend and capital gains distributions to investors. If investors receive their dividends in cash, money is taken out of the Portfolio to pay the distribution. If investors reinvest their dividends, the Portfolio's net assets will not be affected. If you compare the Portfolio's "Net Decrease from Dividends and Distributions" to the "Reinvested dividends and distributions," you will notice that dividend distributions had little effect on the Portfolio's net assets. This is because the majority of Janus investors reinvest their distributions.
The reinvestment of dividends is included under "Capital Share Transactions." "Capital Shares" refers to the money investors contribute to the Portfolio through purchases or withdraw via redemptions. The Portfolio's net assets will increase and decrease in value as investors purchase and redeem shares from the Portfolio.
6. FINANCIAL HIGHLIGHTS
This schedule provides a per-share breakdown of the components that affect the Portfolio's NAV for current and past reporting periods for each class of the Portfolio. Not only does this table provide you with total return, it also reports total distributions, asset size, expense ratios and portfolio turnover rate.
The first line in the table reflects the NAV per share at the beginning of the reporting period. The next line reports the net investment income per share, which comprises dividends and interest income earned on securities held by the Portfolio. Following is the total of gains/(losses), realized and unrealized. Dividends and distributions are then subtracted to arrive at the NAV per share at the end of the period. The next line reflects the average annual total return reported the last day of the period.
Also included are the expense ratios, or the percentage of average net assets that were used to cover operating expenses during the period. Expense ratios vary for a number of reasons, including the differences in management fees, the average shareholder account size and the extent of foreign investments, which entail greater transaction costs.
The Portfolio's expenses may be reduced through expense reduction arrangements. These arrangements may include the use of balance credits or transfer agent fee offsets. The Statement of Operations reflects total expenses before any such offset, the amount of the offset and the net expenses. The expense ratios listed in the Financial Highlights reflect total expenses prior to any expense offsets (gross expense ratio) and after the expense offsets (net expense ratio). Both expense ratios reflect expenses after waivers (reimbursements), if applicable.
The ratio of net investment income/(loss) summarizes the income earned less expenses, divided by the average net assets of the Portfolio during the reporting period. Don't confuse this ratio with the Portfolio's yield. The net investment income ratio is not a true measure of the Portfolio's yield because it doesn't take into account the dividends distributed to the Portfolio's investors.
The next figure is the portfolio turnover rate, which measures the buying and selling activity in the Portfolio. Portfolio turnover is affected by market conditions, changes in the asset size of the Portfolio, the nature of the Portfolio's investments and the investment style of the portfolio manager. A 100% rate implies that an amount equal to the value of the entire portfolio is turned over in a year; a 50% rate means that an amount equal to the value of half the portfolio is traded in a year; and a 200% rate means that an amount equal to the value of the portfolio is traded every six months.
28 Janus Aspen Series December 31, 2007
Designation Requirements (unaudited)
For federal income tax purposes, the Portfolio designated the following for the year ended December 31, 2007:
Capital Gains Distributions
| Portfolio | |||||||
| Janus Aspen Mid Cap Growth Portfolio | $ | 4,554,706 | |||||
Dividends Received Deduction Percentage
| Portfolio | |||||||
| Janus Aspen Mid Cap Growth Portfolio | 100 | % | |||||
Janus Aspen Series December 31, 2007 29
Trustees and Officers (unaudited)
The Portfolio's Statement of Additional Information includes additional information about the Trustees and officers and is available, without charge, by calling 1-800-525-0020.
The following are the Trustees and officers of the Trust, together with a brief description of their principal occupations during the last five years (principal occupations for certain Trustees may include periods over five years).
Each Trustee has served in that capacity since he or she was originally elected or appointed. The Trustees do not serve a specified term of office. Each Trustee will hold office until the termination of the Trust or his or her earlier death, resignation, retirement, incapacity, or removal. The retirement age for Trustees is 72. The Portfolio's Nominating and Governance Committee will consider nominees for the position of Trustee recommended by shareholders. Shareholders may submit the name of a candidate for consideration by the Committee by submitting their recommendations to the Trust's Secretary. Each Trustee is currently a Trustee of two other registered investment companies advised by Janus Capital: Janus Investment Fund and Janus Adviser Series. As of the date of this report, collectively, these three registered investment companies consist of 75 series or funds.
The Trust's officers are elected annually by the Trustees for a one-year term. Certain officers also serve as officers of Janus Investment Fund and Janus Adviser Series. Certain officers of the Portfolio may also be officers and/or directors of Janus Capital. Portfolio officers receive no compensation from the Portfolio, except for the Portfolio's Chief Compliance Officer, as authorized by the Trustees.
Trustees
| Name, Address, and Age | Positions Held with Portfolio | Length of Time Served | Principal Occupations During the Past Five Years | Number of Portfolios/ Funds in Fund Complex Overseen by Trustee | Other Directorships Held by Trustee | ||||||||||||||||||
| Dennis B. Mullen* 151 Detroit Street Denver, CO 80206 DOB: 1943 | Chairman Trustee | 3/04-12/07 9/93-Present | Chief Executive Officer of Red Robin Gourmet Burgers, Inc. (since 2005). Formerly, private investor. | 75 | ** | Chairman of the Board (since 2005) and Director of Red Robin Gourmet Burgers, Inc., and Director of Janus Capital Funds Plc (Dublin-based, non-U.S. funds). | |||||||||||||||||
| Jerome S. Contro 151 Detroit Street Denver, CO 80206 DOB: 1956 | Trustee | 12/05-Present | Partner of Tango Group, a private investment firm (since 1999). | 75 | Trustee and Chairman of RS Investment Trust (since 2001), and Director of IZZE Beverages and MyFamily.com, Inc. (genealogical research website). | ||||||||||||||||||
| William F. McCalpin 151 Detroit Street Denver, CO 80206 DOB: 1957 | Trustee | 6/02-Present | Private investor. Formerly, Executive Vice President and Chief Operating Officer of The Rockefeller Brothers Fund (a private family foundation), and Vice President of Asian Cultural Council. | 75 | Director of F.B. Heron Foundation (a private grant making foundation). | ||||||||||||||||||
* Mr. McCalpin will succeed Mr. Mullen as Chairman as of January 1, 2008.
** Mr. Mullen also serves as director of Janus Capital Funds Plc, consisting of 16 funds. Including Janus Capital Funds Plc and the 75 funds comprising the Janus funds, Mr. Mullen oversees 91 funds.
30 Janus Aspen Series December 31, 2007
Trustees (cont.)
| Name, Address, and Age | Positions Held with Portfolio | Length of Time Served | Principal Occupations During the Past Five Years | Number of Portfolios/ Funds in Fund Complex Overseen by Trustee | Other Directorships Held by Trustee | ||||||||||||||||||
| John W. McCarter, Jr. 151 Detroit Street Denver, CO 80206 DOB: 1938 | Trustee | 6/02-Present | President and Chief Executive Officer of The Field Museum of Natural History (Chicago, IL) (since 1997). | 75 | Chairman of the Board and Director of Divergence Inc. (biotechnology firm); Director of W.W. Grainger, Inc. (industrial distributor); and Trustee of WTTW (Chicago public television station) and the University of Chicago. | ||||||||||||||||||
| James T. Rothe 151 Detroit Street Denver, CO 80206 DOB: 1943 | Trustee | 1/97-Present | Co-founder and Managing Director of Roaring Fork Capital Management, LLC (private investment in public equity firm), and Professor Emeritus of Business of the University of Colorado, Colorado Springs, CO (since 2004). Formerly, Professor of Business of the University of Colorado (2002-2004) and Distinguished Visiting Professor of Business (2001-2002) of Thunderbird (American Graduate School of International Management), Glendale, AZ. | 75 | Director of Red Robin Gourmet Burgers, Inc. | ||||||||||||||||||
| William D. Stewart 151 Detroit Street Denver, CO 80206 DOB: 1944 | Trustee | 9/93-Present | Corporate Vice President and General Manager of MKS Instruments – HPS Products, Boulder, CO (a manufacturer of vacuum fittings and valves). | 75 | N/A | ||||||||||||||||||
| Martin H. Waldinger 151 Detroit Street Denver, CO 80206 DOB: 1938 | Trustee | 9/93-Present | Private Investor and Consultant to California Planned Unit Developments (since 1994). Formerly, CEO and President of Marwal, Inc. (homeowner association management company). | 75 | N/A | ||||||||||||||||||
| Linda S. Wolf 151 Detroit Street Denver, CO 80206 DOB: 1947 | Trustee | 12/05-Present | Retired. Formerly, Chairman and Chief Executive Officer of Leo Burnett (Worldwide) (advertising agency) (2001-2005). | 75 | Director of Wal-Mart, The Field Museum of Natural History (Chicago, IL), Children's Memorial Hospital (Chicago, IL), Chicago Council on Foreign Relations, Economic Club of Chicago, and InnerWorkings (U.S. provider of print procurement solutions). | ||||||||||||||||||
Janus Aspen Series December 31, 2007 31
Trustees and Officers (unaudited) (continued)
Officers
| Name, Address, and Age | Positions Held with Portfolio | Term of Office* and Length of Time Served | Principal Occupations During the Past Five Years | ||||||||||||
| Brian Demain 151 Detroit Street Denver, CO 80206 DOB: 1977 | Executive Vice President and Portfolio Manager Janus Aspen Mid Cap Growth Portfolio | 11/07-Present | Vice President of Janus Capital. Formerly, Assistant Portfolio Manager (2004-2007) for Mid Cap Growth Portfolio and Analyst (1999-2007) for Janus Capital. | ||||||||||||
| Stephanie Grauerholz-Lofton 151 Detroit Street Denver, CO 80206 DOB: 1970 | Chief Legal Counsel and Secretary Vice President | 1/06-Present 3/06-Present | Vice President and Assistant General Counsel of Janus Capital, and Vice President and Assistant Secretary of Janus Distributors LLC. Formerly, Assistant Vice President of Janus Capital and Janus Distributors LLC (2006), and Associate of Vedder, Price, Kaufman & Kammholz, P.C. (1999-2003). | ||||||||||||
| Andrew J. Iseman 151 Detroit Street Denver, CO 80206 DOB: 1964 | President and Chief Executive Officer | 3/07-Present | Chief Operating Officer and Senior Vice President of Janus Capital Group, Inc. and Janus Capital; President of Janus Services LLC; and Director of Capital Group Partners, Inc. Formerly, Senior Vice President of Enhanced Investment Technologies, LLC (2005-2007); and Vice President of Janus Capital (2003-2005) and Janus Services LLC (2003-2004). | ||||||||||||
| David R. Kowalski 151 Detroit Street Denver, CO 80206 DOB: 1957 | Vice President, Chief Compliance Officer, and Anti-Money Laundering Officer | 6/02-Present | Senior Vice President and Chief Compliance Officer of Janus Capital, Janus Distributors LLC, and Janus Services LLC; Chief Compliance Officer of Bay Isle Financial LLC; and Vice President of Enhanced Investment Technologies, LLC. Formerly, Chief Compliance Officer of Enhanced Investment Technologies, LLC (2003-2005); Vice President of Janus Capital (2000-2005) and Janus Services LLC (2004-2005); and Assistant Vice President of Janus Services LLC (2000-2004). | ||||||||||||
| Jesper Nergaard 151 Detroit Street Denver, CO 80206 DOB: 1962 | Chief Financial Officer Vice President, Treasurer, and Principal Accounting Officer | 3/05-Present 2/05-Present | Vice President of Janus Capital. Formerly, Director of Financial Reporting for OppenheimerFunds, Inc. (2004-2005); Site Manager and First Vice President of Mellon Global Securities Services (2003); and Director of Fund Accounting, Project Development, and Training of INVESCO Funds Group (1994-2003). | ||||||||||||
*Officers are elected at least annually by the Trustees for a one-year term and may also be elected from time to time by the Trustees for an interim period.
32 Janus Aspen Series December 31, 2007
Notes
Janus Aspen Series December 31, 2007 33
Janus provides access to a wide range of investment disciplines.
Growth
Janus growth portfolios focus on companies believed to be the leaders in their respective industries, with solid management teams, expanding market share, margins and efficiencies.
Core
Janus core portfolios seek investments in more stable and predictable companies. These portfolios look for a strategic combination of steady growth and for certain portfolios, some degree of income.
Risk-Managed
Our risk-managed portfolios seek to outperform their respective indices while maintaining a risk profile equal to or lower than the index itself. Managed by INTECH (a Janus subsidiary), these portfolios use a mathematical process in an attempt to build a more "efficient" portfolio than the index.
Value
Janus value portfolios invest in companies they believe are poised for a turnaround or are trading at a significant discount to fair value. The goal is to gain unique insight into a company's true value and identify and evaluate potential catalysts that may unlock shareholder value.
International & Global
Janus international and global portfolios seek to leverage Janus' research capabilities by taking advantage of inefficiencies in foreign markets, where accurate information and analytical insight are often at a premium.
Bond
Janus bond portfolios attempt to provide less risk relative to equities while seeking to deliver a competitive total return through high current income and appreciation.
Money Market
Janus money market portfolios seek maximum current income consistent with stability of capital.
For more information about our funds, contact your investment professional or go to www.janus.com/info
Please consider the charges, risks, expenses and investment objectives carefully before investing. For a prospectus containing this and other information, please call Janus at 1-800-525-0020 or download the file from www.janus.com/info. Read it carefully before you invest or send money.
An investment in a money market portfolio is not insured or guaranteed by the Federal Deposit Insurance Corporation or any other government agency. Although the Portfolio seeks to preserve the value of your investment at $1.00 per share, it is possible to lose money by investing in the Portfolio.

151 Detroit Street
Denver, CO 80206
1-800-525-0020
Portfolio distributed by Janus Distributors LLC (2/08)
C-0108-357 109-02-702 02-08
2007 Annual Report
Janus Aspen Series
Janus Aspen Mid Cap Value Portfolio
Look Inside. . .
• Portfolio management perspective
• Investment strategy behind your portfolio
• Portfolio performance, characteristics and holdings

Table of Contents
| Useful Information About Your Portfolio Report | 1 | ||||||
| Management Commentary and Schedule of Investments | 2 | ||||||
| Statement of Assets and Liabilities | 12 | ||||||
| Statement of Operations | 13 | ||||||
| Statements of Changes in Net Assets | 14 | ||||||
| Financial Highlights | 15 | ||||||
| Notes to Schedule of Investments | 16 | ||||||
| Notes to Financial Statements | 17 | ||||||
| Report of Independent Registered Public Accounting Firm | 27 | ||||||
| Additional Information | 28 | ||||||
| Explanations of Charts, Tables and Financial Statements | 31 | ||||||
| Designation Requirements | 34 | ||||||
| Trustees and Officers | 35 | ||||||
Please consider the charges, risks, expenses and investment objectives carefully before investing. For a prospectus containing this and other information, please call Janus at 1-800-525-0020 or download the file from www.janus.com/info. Read it carefully before you invest or send money.
Useful Information About Your Portfolio Report
Management Commentary
The Management Commentary in this report includes valuable insight from the Portfolio's managers as well as statistical information to help you understand how your Portfolio's performance and characteristics stack up against those of comparable indices.
Please keep in mind that the opinions expressed by the Portfolio's managers in the Management Commentary are just that: opinions. They are a reflection of the managers' best judgment at the time this report was compiled, which was December 31, 2007. As the investing environment changes, so could the managers' opinions. The views are unique to the managers and aren't necessarily shared by their fellow employees or by Janus in general.
Portfolio Expenses
We believe it's important for our shareholders to have a clear understanding of Portfolio expenses and the impact they have on investment return.
The following is important information regarding the Portfolio's Expense Example, which appears in the Management Commentary within this Annual Report. Please refer to this information when reviewing the Expense Example for the Portfolio.
Example
As a shareholder of a Portfolio, you incur two types of costs: (1) transaction costs, including redemption fees (where applicable) (and any related exchange fees) and (2) ongoing costs, including management fees; distribution and shareholder servicing (12b-1) fees (applicable to Service Shares only); administrative services fees (applicable to Service Shares only); and other Portfolio expenses. The example is intended to help you understand your ongoing costs (in dollars) of investing in a Portfolio and to compare these costs with the ongoing costs of investing in other mutual funds. To do so, compare this 5% hypothetical example with the 5% hypothetical examples that appear in the shareholder reports of the other funds. The example is based upon an investment of $1,000 invested at the beginning of the period and held for the six-month period from July 1, 2007 to December 31, 2007.
Actual Expenses
The first line of the table in each example provides information about actual account values and actual expenses. You may use the information in this line, together with the amount you invested, to estimate the expenses that you paid over the period. Simply divide your account value by $1,000 (for example, an $8,600 account value divided by $1,000 = 8.6), then multiply the result by the number in the first line under the heading entitled "Expenses Paid During Period" to estimate the expenses you paid on your account during the period.
Hypothetical Example for Comparison Purposes
The second line of the table in each example provides information about hypothetical account values and hypothetical expenses based upon the Portfolio's actual expense ratio and an assumed rate of return of 5% per year before expenses, which is not the Portfolio's actual return. The hypothetical account values and expenses may not be used to estimate the actual ending account balance or expenses you paid for the period. You may use this information to compare the ongoing costs of investing in the Portfolio and other funds. To do so, compare this 5% hypothetical example with the 5% hypothetical examples that appear in the shareholder reports of the other funds.
Janus Capital Management LLC ("Janus Capital") has contractually agreed to waive the Portfolio's total operating expenses, excluding the distribution and shareholder servicing (12b-1) fees applicable to Service Shares, the administrative services fees applicable to Service Shares, brokerage commissions, interest, taxes and extraordinary expenses to certain limits until at least May 1, 2009. More information regarding the waivers is available in the Portfolio's prospectus.
Please note that the expenses shown in the tables are meant to highlight your ongoing costs only and do not reflect any transaction costs, such as redemption fees (where applicable) and any charges at the separate account level or contract level. Redemption fees are fully described in the prospectus. Therefore, the second line of each table is useful in comparing ongoing costs only, and will not help you determine the relative total costs of owning different funds. In addition, if these transaction costs and separate account or contract level charges were included, your costs would have been higher.
Janus Aspen Series December 31, 2007 1
Janus Aspen Mid Cap Value Portfolio (unaudited)
Portfolio Snapshot
This portfolio seeks to uncover fundamentally strong mid-sized companies with a catalyst for growth not yet recognized by the market.
Managed by Perkins, Wolf, McDonnell and Company, LLC
Performance Overview
During the 12 months ended December 31, 2007, Janus Aspen Mid Cap Value Portfolio's Institutional Shares and Service Shares returned 7.42% and 7.04%, respectively, outpacing the (1.42)% return of the Portfolio's benchmark, the Russell Midcap® Value Index. The S&P MidCap 400 Index returned 7.98% and the S&P 500® Index returned 5.49% during the same period.
After an unusually long period (over six years) of small- and mid-cap value stocks outperforming, larger caps and growth issues did relatively better in 2007. We have been anticipating this for some time as we have been finding more investment opportunities in larger mid-caps and out-of-favor growth stocks. Thus we believe we are relatively well positioned for the market's transition.
The Portfolio's outperformance was broad based during the year as we had positive stock selection in almost every sector and continued to be underweighted in the Index's weakest groups (consumer discretionary and financials) and overweighted in one of the strongest (energy). Although we have been only equally weighted in materials, some of our strongest individual stocks (Mosaic, Agrium and Goldcorp) were in that sector. The first two are fertilizer producers and, along with Deere & Co., have been direct beneficiaries of the strength in agriculture prices, while our purchase of mining company Goldcorp benefited from the rally in gold prices.
As has been the case in each year other than 2002, merger and acquisition activity had a positive impact on the Portfolio. Over the course of the year we had more than 10 buyouts or mergers spread over several industries. With the disruption in the credit markets, this activity nearly came to a halt in recent months. However, during the period, wireless and wireline provider ALLTEL, Hilton Hotels and chemical company Huntsman had buyouts announced (the latter two at more than 30% premiums to their last market price) and drilling services company Global Santa Fe agreed to an attractive merger with Transocean. While private equity activity is likely to decline from the record levels in recent years, we believe that strategic and/or foreign buyers could step in, as evidenced by National Oilwell's fourth quarter buyout of Portfolio holding Grant Prideco. This buyout activity is a reinforcement of our belief that our longstanding investment proce ss is successful in identifying strong, attractively valued franchises.
Sector and Related Holding Performance
We have been overweighted in energy since the early days of the Portfolio. This is a result of consistently finding companies that we believe have undervalued assets in politically safe geographies with strong balance sheets. Many of these companies have benefited in the context of secularly increasing energy prices. In shorter periods of time such as last year, we have been penalized by this emphasis on the long term, as energy prices are volatile. But, staying the course benefited us this year as it often has in the past. Some of our best results in the energy sector this year came from Anadarko Petroleum, Forest Oil and Noble Energy – the latter we owned in the Portfolio's first year. Given the recent spike in oil prices to above $70 per barrel (now approaching $100) we have pared back several of our holdings. Our most significant additions to this sector in the past 12 months have been in energy master limited partnerships such as K inder Morgan Energy, Enterprise Products and Plains All American Pipeline, all of which have 6% current dividend yields which we believe are likely to grow and have been less susceptible to commodity price volatility.
Financials have historically been our heaviest portfolio exposure, but we have been underweighted relative to the benchmark for several years. For the past few years this lower relative exposure was primarily due to our lesser investment in Real Estate Investment Trusts (REITs), which we had reduced after several years of strong returns had taken them to what we felt were expensive levels. This year for the first time since 2000 REITs underperformed and actually declined in recent months. However, we feel they are still somewhat expensive and we remain underweighted. Since the Portfolio's inception, the one area of financials in which we have been overweighted has been the money managers. This is a business that we believe has secular growth, good balance sheets and cash flows and reasonable valuations. In this group, Waddell & Reed Financial gained 35% and our more recent purchase of Invesco provided over 14% returns. This strong result from money managers and from Berkshire Hathaway (up approximately 29%) allowed our financials to hold up significantly better than the financial component of the Index.
2 Janus Aspen Series December 31, 2007
(unaudited)
However, we were not totally immune to these sector declines as Colonial BancGroup and insurer Old Republic International were among the Portfolio's worst performers. Both stocks were affected by real estate credit concerns. However, we believe each of these companies has high-quality credit and asset standards and safe high dividend payouts. Thus we added to Colonial and Old Republic as their stocks weakened.
The sector in which we continue to be under-represented is the utility industry. Since inception we have had limited exposure to these stocks because they have had few of the characteristics that we seek. They generally have leveraged balance sheets, little free cash flow, regulated rates and limited growth. This year our underweighting was a slight detractor, but over the long term we have done well to de-emphasize this sector.
As we have mentioned in our recent reports, for the past few years we have found increasing opportunities in the larger end of our capitalization spectrum and in out-of-favor growth stocks. In the early part of this year many of these stocks sold at price earnings multiple discounts to smaller mid-cap stocks. In contrast, in most years they have sold at a premium. Their risk/reward relationships have become more attractive to us relative to smaller mid-cap stocks primarily because their downside risk appears more limited. Thus we would expect higher-quality, larger stocks to decline relatively less in a market correction or if they had fundamental shortfalls. This is reflected in our experience this year – our only larger-cap positions that declined more than 10% were Wyeth and Telefonaktiebolaget L.M. Ericsson. On the other hand we enjoyed over 20% appreciation from larger-cap issues such as Berkshire Hathaway, Deere, Anadarko Petroleu m, AFLAC, and Alcoa. Our success with these stocks indicates that our investment process has been applicable throughout the capitalization spectrum.
Market Outlook
The market's outlook remains uncertain, and we are sensitive to the risk of further declines. Valuation levels are within normal ranges, especially for stocks outside of the small- and lower mid-cap range. We think these valuation levels combined with higher volatility levels have provided us with good individual stock opportunities. Thus the Portfolio is generally fully invested.
However, from a broader market perspective the possibility of recession and shortfall in earnings has increased. Credit quality questions are widespread and the extent of write-offs is uncertain. In such an environment, credit availability could be reduced, the consumer could finally pull back, and private equity activity is likely to decline from the record levels of recent years. The impact in the financial market could be compounded by weakness in the dollar, leverage and the widespread use of derivatives.
Volatility has already picked up from historically low levels and is likely to remain elevated. We have often said that we like volatility because it presents us with the opportunity to buy high-quality companies on sale. We will continue to add to some stocks in "free fall," which we believe could penalize us in the short term, but provide great long-term opportunity. Simply put, we are willing to take short-term risk in an effort to realize long-term reward.
We believe that our standard emphasis on balance sheet and cash flow strength, combined with valuations that reflect modest investor expectations, should reward us in an uncertain economic environment. Moreover, the increased number of larger mid-caps in our portfolio have greater exposure to relatively stronger overseas economies and are generally less volatile than their smaller counterparts. To further reduce our portfolio risk we have bought some Index puts in an effort to mitigate some of the impact of a possible market decline. Our total investment in these puts represents less than 1% of our assets and we believe may provide some protection for about 20% of the Portfolio. We believe this small investment in market insurance is consistent with our sensitivity to the need to preserve capital and our objective of continuing to provide consistent, above-average long-term investment returns on both an absolute and relative basis. Please se e "Notes to Financial Statements" for a discussion of derivatives used by the Portfolio.
Thank you for your investment in Janus Aspen Mid Cap Value Portfolio.
Janus Aspen Series December 31, 2007 3
Janus Aspen Mid Cap Value Portfolio (unaudited)
Janus Aspen Mid Cap Value Portfolio at a Glance
5 Largest Contributors to Performance – Holdings
| Contribution | |||||||
| Mosaic Co. | 0.97 | % | |||||
| Anadarko Petroleum Corp. | 0.68 | % | |||||
| Deere & Co. | 0.60 | % | |||||
| PPL Corp. | 0.55 | % | |||||
| Agrium, Inc. (U.S. Shares) | 0.54 | % | |||||
5 Largest Detractors from Performance – Holdings
| Contribution | |||||||
| Colonial BancGroup, Inc. | (0.64 | )% | |||||
| Old Republic International Corp. | (0.50 | )% | |||||
| Diebold, Inc. | (0.42 | )% | |||||
| Telefonaktiebolaget L.M. Ericsson (ADR) | (0.35 | )% | |||||
| Starwood Hotels & Resorts Worldwide, Inc. | (0.31 | )% | |||||
5 Largest Contributors to Performance – Sectors
| Portfolio Contribution | Portfolio Weighting (% of Net Assets) | Russell Midcap® Value Index Weighting | |||||||||||||
| Energy | 4.17 | % | 13.58 | % | 5.87 | % | |||||||||
| Materials | 2.46 | % | 7.24 | % | 7.03 | % | |||||||||
| Industrials | 1.68 | % | 12.47 | % | 9.16 | % | |||||||||
| Health Care | 1.36 | % | 10.54 | % | 3.01 | % | |||||||||
| Utilities | 0.96 | % | 4.07 | % | 14.72 | % | |||||||||
5 Lowest Contributors/Detractors to Performance – Sectors
| Portfolio Contribution | Portfolio Weighting (% of Net Assets) | Russell Midcap® Value Index Weighting | |||||||||||||
| Financials | (1.48 | )% | 26.42 | % | 30.27 | % | |||||||||
| Consumer Discretionary | (1.16 | )% | 7.74 | % | 13.44 | % | |||||||||
| Telecommunication Services | (0.31 | )% | 1.90 | % | 2.02 | % | |||||||||
| Information Technology | 0.07 | % | 10.54 | % | 7.30 | % | |||||||||
| Consumer Staples | 0.94 | % | 5.52 | % | 7.18 | % | |||||||||
4 Janus Aspen Series December 31, 2007
(unaudited)
5 Largest Equity Holdings – (% of Net Assets)
| As of December 31, 2007 | |||||||
| Berkshire Hathaway, Inc. - Class B Reinsurance | 2.0 | % | |||||
| AllianceBernstein Holding L.P. Investment Management and Advisory Services | 1.8 | % | |||||
| Protective Life Corp. Life and Health Insurance | 1.5 | % | |||||
| Anadarko Petroleum Corp. Oil Companies - Exploration and Production | 1.5 | % | |||||
| Dover Corp. Diversified Operations | 1.4 | % | |||||
| 8.2 | % | ||||||
Asset Allocation – (% of Net Assets)
As of December 31, 2007
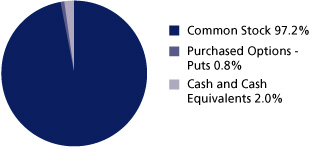
Top Country Allocations – Long Positions (% of Investment Securities)
| As of December 31, 2007 | As of December 31, 2006 | ||||||
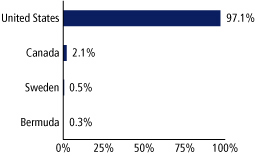 | 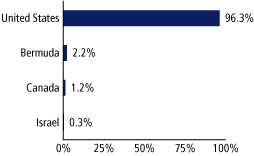 | ||||||
Janus Aspen Series December 31, 2007 5
Janus Aspen Mid Cap Value Portfolio (unaudited)
Performance
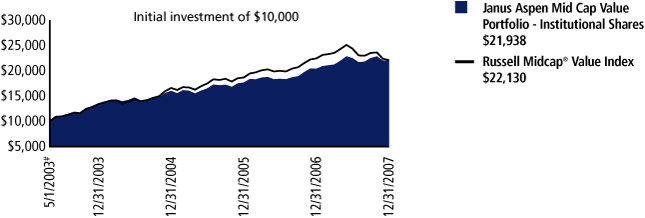
| Average Annual Total Return – for the periods ended December 31, 2007 | Expense Ratios – for the fiscal year ended December 31, 2006 | ||||||||||||||||||||||
| One Year | Five Year | Since Inception | Total Annual Fund Operating Expenses | Net Annual Fund Operating Expenses | |||||||||||||||||||
| Janus Aspen Mid Cap Value Portfolio - Institutional Shares# | 7.42 | % | N/A | 18.33 | % | 0.96 | % | 0.96 | %(a) | ||||||||||||||
| Janus Aspen Mid Cap Value Portfolio - Service Shares* | 7.04 | % | 16.82 | % | 16.82 | % | 1.32 | % | 1.32 | %(b) | |||||||||||||
| Russell Midcap® Value Index | (1.42 | )% | 17.92 | % | 17.92 | %** | |||||||||||||||||
| Lipper Quartile - Institutional Shares | 1 | st | N/A | 1 | st | ||||||||||||||||||
| Lipper Ranking - Institutional Shares based on total returns for Variable Annuity Mid-Cap Value Funds | 8/66 | N/A | 6/51 | ||||||||||||||||||||
Visit janus.com/info to view up-to-date
performance and characteristic information
Data presented reflects past performance, which is no guarantee of future results. Investment results and principal value will fluctuate so that shares, when redeemed, may be worth more or less than their original cost. Due to market volatility, current performance may be higher or lower than the performance shown. Call 877.33JANUS or visit www.janus.com/info for performance current to the most recent month-end.
(a)At December 31, 2006, Janus Capital has contractually agreed to waive the Portfolio's total operating expenses (excluding brokerage commissions, interest, taxes, and extraordinary expenses) to a certain limit until at least May 1, 2008. The net annual fund operating expense shown reflects the application of such limit and is detailed in the Statement of Additional Information. Returns shown include fee waivers, if any, and without such waivers returns would have been lower.
(b)At December 31, 2006, Janus Capital has contractually agreed to waive the Portfolio's total operating expenses (excluding the distribution and shareholder servicing fee, administrative services fee, brokerage commissions, interest, taxes, and extraordinary expenses) to a certain limit until at least May 1, 2008. The net annual fund operating expense shown reflects the application of such limit and is detailed in the Statement of Additional Information. Returns shown include fee waivers, if any, and without such waivers returns would have been lower.
The Portfolio has a performance-based management fee that adjusts upward or downward based on the Portfolio's performance relative to an approved benchmark index over a performance measurement period.
The Portfolio's expense ratios were determined based on average net assets as of the fiscal year ended December 31, 2006. Detailed information is available in the prospectus. Contractual waivers agreed to by Janus Capital are included under "Net Annual Fund Operating Expenses." All expenses are shown without the effect of expense offset arrangements. Pursuant to such arrangements, credits realized as a result of uninvested cash balances are used to reduce custodian and transfer agent expenses.
The Portfolio's total operating expenses did not exceed the expense limit so no waivers were in effect for the fiscal year ended December 31, 2006.
6 Janus Aspen Series December 31, 2007
(unaudited)
Portfolio Expenses
The example below shows you the ongoing costs (in dollars) of investing in your Portfolio and allows you to compare these costs with those of other mutual funds. Please refer to the section Useful Information About Your Portfolio Report for a detailed explanation of the information presented in these charts.
| Expense Example - Institutional Shares | Beginning Account Value (7/1/07) | Ending Account Value (12/31/07) | Expenses Paid During Period (7/1/07-12/31/07)(1) | ||||||||||||
| Actual | $ | 1,000.00 | $ | 973.30 | $ | 5.32 | |||||||||
| Hypothetical (5% return before expenses) | $ | 1,000.00 | $ | 1,019.81 | $ | 5.45 | |||||||||
| Expense Example - Service Shares | Beginning Account Value (7/1/07) | Ending Account Value (12/31/07) | Expenses Paid During Period (7/1/07-12/31/07)(1) | ||||||||||||
| Actual | $ | 1,000.00 | $ | 971.20 | $ | 7.10 | |||||||||
| Hypothetical (5% return before expenses) | $ | 1,000.00 | $ | 1,018.00 | $ | 7.27 | |||||||||
(1) Expenses are equal to the annualized expense ratio of 1.07% for Institutional Shares and 1.43% for Service Shares, multiplied by the average account value over the period, multiplied by 184/365 (to reflect the one-half year period).
The Portfolio's performance may be affected by risks that include those associated with undervalued or overlooked companies and investments in specific industries or countries. Additional risks to the Portfolio may include those associated with investing in foreign securities, emerging markets, initial public offerings ("IPOs"), derivatives and companies with relatively small market capitalizations. Please see a Janus prospectus or www.janus.com/info for more information about risks, portfolio holdings and other details.
Portfolios that invest in Real Estate Investment Trusts (REITs) may be subject to a higher degree of market risk because of concentration in a specific industry, sector or geographic region. REITs may be subject to risks including, but not limited to: liquidity, decline in the value of real estate, risks related to general and economic conditions, changes in the value of the underlying property owned by the trust and defaults by borrowers. To the extent the Portfolio invests in foreign REITs, it may be subject to fluctuations in currency rates or political or economic conditions in a particular country.
These returns do not reflect the charges and expenses of any particular insurance product or qualified plan. Returns shown would have been lower had they included insurance charges.
Returns include reinvestment of dividends from net investment income and distributions from capital gains. The returns shown do not reflect the deduction of taxes that a shareholder would pay on Portfolio distributions or the redemption of Portfolio shares.
Lipper, a wholly-owned subsidiary of Reuters, provides independent insight on global collective investments including mutual funds, retirement funds, hedge funds, fund fees and expenses to the asset management and media communities. Lipper ranks the performance of mutual funds within a classification of funds that have similar investment objectives. Rankings are historical with capital gains and dividends reinvested and do not include the effect of loads.
Lipper ranking is for the Institutional Share class only; other classes may have different performance characteristics.
May 31, 2003 is the date used to calculate the since-inception Lipper ranking, which is slightly different from when the Portfolio began operations since Lipper provides fund rankings as of the last day of the month.
If an expense waiver was in effect, it may have had a material effect on the total return or yield, and therefore the ranking for the period.
There is no assurance that the investment process will consistently lead to successful investing.
The Portfolio will invest at least 80% of its net assets in the type of securities described by its name.
See Notes to Schedule of Investments for index definitions.
The Portfolio may differ significantly from the securities held in the index. The index is unmanaged and not available for direct investment; therefore its performance does not reflect the expenses associated with the active management of an actual Portfolio.
See "Explanations of Charts, Tables and Financial Statements."
# Institutional Shares inception date – May 1, 2003
* Service Shares inception date – December 31, 2002
** The Russell Midcap® Value Index's since inception returns are calculated from December 31, 2002.
Janus Aspen Series December 31, 2007 7
Janus Aspen Mid Cap Value Portfolio
Schedule of Investments
As of December 31, 2007
| Shares/Principal/Contract Amounts | Value | ||||||||||
| Common Stock - 97.2% | |||||||||||
| Advertising Agencies - 0.3% | |||||||||||
| 4,700 | Omnicom Group, Inc. | $ | 223,391 | ||||||||
| Agricultural Chemicals - 1.1% | |||||||||||
| 4,900 | Agrium, Inc. (U.S. Shares) | 353,829 | |||||||||
| 5,300 | Mosaic Co.* | 500,002 | |||||||||
| 853,831 | |||||||||||
| Airlines - 1.0% | |||||||||||
| 61,700 | Southwest Airlines Co. | 752,740 | |||||||||
| Applications Software - 0.3% | |||||||||||
| 7,600 | Intuit, Inc.* | 240,236 | |||||||||
| Automotive - Truck Parts and Equipment - Original - 0.3% | |||||||||||
| 2,600 | Magna International, Inc. - Class A (U.S. Shares) | 209,118 | |||||||||
| Beverages - Non-Alcoholic - 0.8% | |||||||||||
| 8,200 | PepsiCo, Inc. | 622,380 | |||||||||
| Beverages - Wine and Spirits - 0.5% | |||||||||||
| 5,100 | Brown-Forman Corp. - Class B | 377,961 | |||||||||
| Brewery - 0.5% | |||||||||||
| 7,200 | Molson Coors Brewing Co. - Class B | 371,664 | |||||||||
| Building - Residential and Commercial - 0.5% | |||||||||||
| 5,900 | Centex Corp. | 149,034 | |||||||||
| 19,800 | Pulte Homes, Inc. | 208,692 | |||||||||
| 357,726 | |||||||||||
| Cable Television - 0.4% | |||||||||||
| 16,700 | Comcast Corp. - Class A* | 304,942 | |||||||||
| Chemicals - Specialty - 0.9% | |||||||||||
| 17,800 | Chemtura Corp. | 138,840 | |||||||||
| 10,200 | Lubrizol Corp. | 552,432 | |||||||||
| 691,272 | |||||||||||
| Coal - 0.7% | |||||||||||
| 12,100 | Arch Coal, Inc. | 543,653 | |||||||||
| Commercial Banks - 5.1% | |||||||||||
| 18,600 | BB&T Corp. | 570,462 | |||||||||
| 42,400 | Colonial BancGroup, Inc. | 574,096 | |||||||||
| 4,500 | Cullen/Frost Bankers, Inc. | 227,970 | |||||||||
| 16,400 | First Midwest Bancorp, Inc. | 501,840 | |||||||||
| 41,000 | People's United Financial, Inc. | 729,800 | |||||||||
| 31,200 | Synovus Financial Corp. | 751,296 | |||||||||
| 27,235 | Valley National Bancorp# | 519,099 | |||||||||
| 3,874,563 | |||||||||||
| Computers - Integrated Systems - 0.7% | |||||||||||
| 18,300 | Diebold, Inc. | 530,334 | |||||||||
| Consumer Products - Miscellaneous - 1.1% | |||||||||||
| 6,800 | Clorox Co. | 443,156 | |||||||||
| 5,700 | Kimberly-Clark Corp. | 395,238 | |||||||||
| 838,394 | |||||||||||
| Containers - Metal and Glass - 1.0% | |||||||||||
| 16,900 | Ball Corp. | 760,500 | |||||||||
| Containers - Paper and Plastic - 0.3% | |||||||||||
| 8,700 | Pactiv Corp.* | 231,681 | |||||||||
| Cosmetics and Toiletries - 0.9% | |||||||||||
| 9,000 | Procter & Gamble Co. | 660,780 | |||||||||
| Shares/Principal/Contract Amounts | Value | ||||||||||
| Data Processing and Management - 1.2% | |||||||||||
| 9,900 | Fiserv, Inc.* | $ | 549,351 | ||||||||
| 8,600 | Global Payments, Inc. | 400,072 | |||||||||
| 949,423 | |||||||||||
| Distribution/Wholesale - 2.0% | |||||||||||
| 10,300 | Genuine Parts Co. | 476,890 | |||||||||
| 17,800 | Tech Data Corp.* | 671,416 | |||||||||
| 4,500 | W.W. Grainger, Inc. | 393,840 | |||||||||
| 1,542,146 | |||||||||||
| Diversified Operations - 2.0% | |||||||||||
| 24,000 | Dover Corp. | 1,106,160 | |||||||||
| 8,200 | Illinois Tool Works, Inc. | 439,028 | |||||||||
| 1,545,188 | |||||||||||
| E-Commerce/Services - 0.3% | |||||||||||
| 8,200 | IAC/InterActiveCorp* | 220,744 | |||||||||
| Electric - Integrated - 3.7% | |||||||||||
| 34,500 | DPL, Inc.# | 1,022,925 | |||||||||
| 21,100 | PPL Corp. | 1,099,099 | |||||||||
| 6,900 | Public Service Enterprise Group, Inc. | 677,856 | |||||||||
| 2,799,880 | |||||||||||
| Electronic Components - Miscellaneous - 0.7% | |||||||||||
| 49,600 | Vishay Intertechnology, Inc.* | 565,936 | |||||||||
| Electronic Components - Semiconductors - 1.2% | |||||||||||
| 25,400 | QLogic Corp.* | 360,680 | |||||||||
| 23,800 | Xilinx, Inc. | 520,506 | |||||||||
| 881,186 | |||||||||||
| Electronic Connectors - 0.4% | |||||||||||
| 6,700 | Thomas & Betts Corp.* | 328,568 | |||||||||
| Electronic Measuring Instruments - 0.7% | |||||||||||
| 13,600 | Agilent Technologies, Inc.* | 499,664 | |||||||||
| Engineering - Research and Development Services - 0.5% | |||||||||||
| 7,600 | URS Corp.* | 412,908 | |||||||||
| E-Services/Consulting - 0.3% | |||||||||||
| 14,900 | Websense, Inc.* | 253,002 | |||||||||
| Food - Diversified - 1.9% | |||||||||||
| 16,500 | General Mills, Inc. | 940,500 | |||||||||
| 15,500 | Kraft Foods, Inc. - Class A | 505,765 | |||||||||
| 1,446,265 | |||||||||||
| Forestry - 0.3% | |||||||||||
| 3,100 | Weyerhaeuser Co. | 228,594 | |||||||||
| Gas - Distribution - 0.6% | |||||||||||
| 15,000 | Southern Union Co. | 440,400 | |||||||||
| Gold Mining - 1.4% | |||||||||||
| 31,600 | Goldcorp, Inc. (U.S. Shares) | 1,072,188 | |||||||||
| Hotels and Motels - 0.7% | |||||||||||
| 11,300 | Starwood Hotels & Resorts Worldwide, Inc. | 497,539 | |||||||||
| Instruments - Scientific - 2.3% | |||||||||||
| 18,100 | Applera Corp. - Applied Biosystems Group | 613,952 | |||||||||
| 17,800 | PerkinElmer, Inc. | 463,156 | |||||||||
| 11,700 | Thermo Fisher Scientific, Inc.* | 674,856 | |||||||||
| 1,751,964 | |||||||||||
| Internet Infrastructure Equipment - 0.6% | |||||||||||
| 20,600 | Avocent Corp.* | 480,186 | |||||||||
See Notes to Schedule of Investments and Financial Statements.
8 Janus Aspen Series December 31, 2007
Schedule of Investments
As of December 31, 2007
| Shares/Principal/Contract Amounts | Value | ||||||||||
| Investment Management and Advisory Services - 4.2% | |||||||||||
| 18,000 | AllianceBernstein Holding L.P. | $ | 1,354,500 | ||||||||
| 31,700 | Invesco, Ltd. | 994,746 | |||||||||
| 6,800 | Legg Mason, Inc. | 497,420 | |||||||||
| 10,700 | Waddell & Reed Financial, Inc. - Class A | 386,163 | |||||||||
| 3,232,829 | |||||||||||
| Life and Health Insurance - 2.2% | |||||||||||
| 8,800 | AFLAC, Inc. | 551,144 | |||||||||
| 28,500 | Protective Life Corp. | 1,169,070 | |||||||||
| 1,720,214 | |||||||||||
| Machinery - Farm - 0.5% | |||||||||||
| 4,400 | Deere & Co. | 409,728 | |||||||||
| Medical - Drugs - 2.2% | |||||||||||
| 5,700 | Eli Lilly and Co. | 304,323 | |||||||||
| 13,500 | Endo Pharmaceuticals Holdings, Inc.* | 360,045 | |||||||||
| 8,400 | Forest Laboratories, Inc.* | 306,180 | |||||||||
| 15,400 | Wyeth | 680,526 | |||||||||
| 1,651,074 | |||||||||||
| Medical - Generic Drugs - 0.5% | |||||||||||
| 7,900 | Barr Pharmaceuticals, Inc.* | 419,490 | |||||||||
| Medical - HMO - 1.0% | |||||||||||
| 6,500 | Coventry Health Care, Inc.* | 385,125 | |||||||||
| 7,700 | Health Net, Inc.* | 371,910 | |||||||||
| 757,035 | |||||||||||
| Medical - Wholesale Drug Distributors - 0.3% | |||||||||||
| 3,800 | Cardinal Health, Inc. | 219,450 | |||||||||
| Medical Instruments - 0.6% | |||||||||||
| 11,500 | St. Jude Medical, Inc.* | 467,360 | |||||||||
| Medical Labs and Testing Services - 1.0% | |||||||||||
| 10,000 | Laboratory Corporation of America Holdings* | 755,300 | |||||||||
| Medical Products - 3.5% | |||||||||||
| 24,000 | Covidien, Ltd. | 1,062,960 | |||||||||
| 8,500 | Johnson & Johnson | 566,950 | |||||||||
| 4,600 | Varian Medical Systems, Inc.* | 239,936 | |||||||||
| 12,500 | Zimmer Holdings, Inc.* | 826,875 | |||||||||
| 2,696,721 | |||||||||||
| Metal - Aluminum - 0.8% | |||||||||||
| 16,800 | Alcoa, Inc. | 614,040 | |||||||||
| Motorcycle and Motor Scooter Manufacturing - 0.4% | |||||||||||
| 6,300 | Harley-Davidson, Inc. | 294,273 | |||||||||
| Multi-Line Insurance - 1.3% | |||||||||||
| 63,600 | Old Republic International Corp. | 980,076 | |||||||||
| Multimedia - 0.3% | |||||||||||
| 5,100 | McGraw-Hill Companies, Inc. | 223,431 | |||||||||
| Non-Hazardous Waste Disposal - 1.9% | |||||||||||
| 24,300 | Republic Services, Inc. | 761,805 | |||||||||
| 20,900 | Waste Management, Inc.* | 682,803 | |||||||||
| 1,444,608 | |||||||||||
| Office Automation and Equipment - 1.4% | |||||||||||
| 15,700 | Pitney Bowes, Inc. | 597,228 | |||||||||
| 27,100 | Xerox Corp. | 438,749 | |||||||||
| 1,035,977 | |||||||||||
| Oil - Field Services - 0.5% | |||||||||||
| 15,000 | BJ Services Co. | 363,900 | |||||||||
| Shares/Principal/Contract Amounts | Value | ||||||||||
| Oil and Gas Drilling - 1.1% | |||||||||||
| 7,600 | Nabors Industries, Ltd.* | $ | 208,164 | ||||||||
| 4,661 | Transocean, Inc.* | 667,222 | |||||||||
| 875,386 | |||||||||||
| Oil Companies - Exploration and Production - 6.6% | |||||||||||
| 17,400 | Anadarko Petroleum Corp. | 1,143,007 | |||||||||
| 9,100 | Bill Barrett Corp.*,# | 381,017 | |||||||||
| 9,600 | Chesapeake Energy Corp. | 376,320 | |||||||||
| 3,000 | Devon Energy Corp. | 266,730 | |||||||||
| 12,500 | Forest Oil Corp.* | 635,500 | |||||||||
| 15,700 | Newfield Exploration Co.* | 827,390 | |||||||||
| 7,318 | Noble Energy, Inc. | 581,927 | |||||||||
| 6,600 | Sandridge Energy, Inc.* | 236,676 | |||||||||
| 10,100 | Southwestern Energy Co.* | 562,772 | |||||||||
| 5,011,339 | |||||||||||
| Oil Field Machinery and Equipment - 0.3% | |||||||||||
| 3,700 | Grant Prideco, Inc.* | 205,387 | |||||||||
| Oil Refining and Marketing - 0.5% | |||||||||||
| 5,500 | Valero Energy Corp. | 385,165 | |||||||||
| Paper and Related Products - 2.1% | |||||||||||
| 12,100 | Potlatch Corp. | 537,724 | |||||||||
| 11,700 | Rayonier, Inc. | 552,708 | |||||||||
| 24,700 | Temple-Inland, Inc. | 514,995 | |||||||||
| 1,605,427 | |||||||||||
| Pharmacy Services - 0.3% | |||||||||||
| 10,800 | Omnicare, Inc. | 246,348 | |||||||||
| Pipelines - 4.0% | |||||||||||
| 17,700 | Enterprise Products Partners L.P. | 564,276 | |||||||||
| 14,400 | Equitable Resources, Inc. | 767,232 | |||||||||
| 20,000 | Kinder Morgan Energy Partners L.P. | 1,079,800 | |||||||||
| 11,700 | Plains All American Pipeline L.P. | 608,400 | |||||||||
| 3,019,708 | |||||||||||
| Property and Casualty Insurance - 0.9% | |||||||||||
| 34,900 | Progressive Corp.* | 668,684 | |||||||||
| Real Estate Operating/Development - 0.3% | |||||||||||
| 8,233 | Forestar Real Estate Group, Inc.* | 194,216 | |||||||||
| Reinsurance - 2.0% | |||||||||||
| 319 | Berkshire Hathaway, Inc. - Class B* | 1,510,784 | |||||||||
| REIT - Apartments - 1.3% | |||||||||||
| 2,100 | Avalonbay Communities, Inc. | 197,694 | |||||||||
| 12,100 | Equity Residential | 441,287 | |||||||||
| 8,100 | Home Properties, Inc.# | 363,285 | |||||||||
| 1,002,266 | |||||||||||
| REIT - Mortgages - 1.4% | |||||||||||
| 35,200 | Annaly Mortgage Management, Inc. | 639,936 | |||||||||
| 12,000 | Redwood Trust, Inc.# | 410,880 | |||||||||
| 1,050,816 | |||||||||||
| REIT - Office Property - 0.5% | |||||||||||
| 4,500 | SL Green Realty Corp. | 420,570 | |||||||||
| REIT - Regional Malls - 0.9% | |||||||||||
| 3,400 | Macerich Co. | 241,604 | |||||||||
| 15,200 | Pennsylvania Real Estate Investment Trust# | 451,136 | |||||||||
| 692,740 | |||||||||||
See Notes to Schedule of Investments and Financial Statements.
Janus Aspen Series December 31, 2007 9
Janus Aspen Mid Cap Value Portfolio
Schedule of Investments
As of December 31, 2007
| Shares/Principal/Contract Amounts | Value | ||||||||||
| REIT - Warehouse and Industrial - 1.0% | |||||||||||
| 3,900 | AMB Property Corp. | $ | 224,484 | ||||||||
| 8,200 | ProLogis | 519,716 | |||||||||
| 744,200 | |||||||||||
| Retail - Apparel and Shoe - 0.6% | |||||||||||
| 15,800 | Charming Shoppes, Inc.* | 85,478 | |||||||||
| 15,700 | Ross Stores, Inc. | 401,449 | |||||||||
| 486,927 | |||||||||||
| Retail - Auto Parts - 1.3% | |||||||||||
| 25,500 | Advance Auto Parts, Inc. | 968,745 | |||||||||
| Retail - Discount - 0.6% | |||||||||||
| 15,700 | TJX Companies, Inc. | 451,061 | |||||||||
| Retail - Drug Store - 0.6% | |||||||||||
| 12,210 | CVS/Caremark Corp. | 485,348 | |||||||||
| Retail - Mail Order - 0.4% | |||||||||||
| 11,400 | Williams-Sonoma, Inc.# | 295,260 | |||||||||
| Retail - Major Department Stores - 1.3% | |||||||||||
| 22,400 | J.C. Penney Company, Inc. | 985,376 | |||||||||
| Retail - Office Supplies - 0.9% | |||||||||||
| 22,300 | Office Depot, Inc.* | 310,193 | |||||||||
| 17,500 | Staples, Inc. | 403,725 | |||||||||
| 713,918 | |||||||||||
| Retail - Regional Department Stores - 0.3% | |||||||||||
| 9,300 | Macy's, Inc. | 240,591 | |||||||||
| Savings/Loan/Thrifts - 0.6% | |||||||||||
| 15,600 | Astoria Financial Corp. | 363,012 | |||||||||
| 8,233 | Guaranty Financial Group, Inc.* | 131,728 | |||||||||
| 494,740 | |||||||||||
| Semiconductor Equipment - 0.5% | |||||||||||
| 21,200 | Applied Materials, Inc. | 376,512 | |||||||||
| Super-Regional Banks - 2.1% | |||||||||||
| 9,400 | PNC Bank Corp. | 617,110 | |||||||||
| 9,800 | SunTrust Banks, Inc. | 612,402 | |||||||||
| 12,300 | U.S. Bancorp | 390,402 | |||||||||
| 1,619,914 | |||||||||||
| Telecommunication Services - 0.6% | |||||||||||
| 9,100 | Embarq Corp. | 450,723 | |||||||||
| Telephone - Integrated - 1.1% | |||||||||||
| 12,100 | CenturyTel, Inc. | 501,666 | |||||||||
| 25,500 | Sprint Nextel Corp. | 334,815 | |||||||||
| 836,481 | |||||||||||
| Transportation - Railroad - 2.1% | |||||||||||
| 24,900 | Kansas City Southern* | 854,817 | |||||||||
| 15,300 | Norfolk Southern Corp. | 771,732 | |||||||||
| 1,626,549 | |||||||||||
| Transportation - Truck - 0.3% | |||||||||||
| 9,400 | J.B. Hunt Transport Services, Inc. | 258,970 | |||||||||
| Wireless Equipment - 0.9% | |||||||||||
| 18,400 | Motorola, Inc. | 295,136 | |||||||||
| 18,200 | Telefonaktiebolaget L.M. Ericsson (ADR) | 424,970 | |||||||||
| 720,106 | |||||||||||
| Total Common Stock (cost $67,952,755) | 74,290,710 | ||||||||||
| Shares/Principal/Contract Amounts | Value | ||||||||||
| Purchased Options - Puts - 0.8% | |||||||||||
| 136 | iShares Russell Mid-Cap Value Index expires May 2008 exercise price $143.00** | $ | 114,784 | ||||||||
| 196 | Russell Mid-Cap Value Index expires February 2008 exercise price $140.00** | 80,556 | |||||||||
| 1,829 | Russell Mid-Cap Value Index expires February 2008 exercise price $1,093.29 | 68,061 | |||||||||
| 3,733 | Russell Mid-Cap Value Index expires March 2008 exercise price $1,070.99** | 145,725 | |||||||||
| 1,806 | Russell Mid-Cap Value Index expires March 2008 exercise price $1,077.31** | 74,933 | |||||||||
| 3,413 | S&P Mid-Cap 400® Index expires February 2008 exercise price $866.67** | 100,162 | |||||||||
| Total Purchased Options - Puts (premiums paid $808,812) | 584,221 | ||||||||||
| Other Securities - 3.0% | |||||||||||
| 1,626,946 | Allianz Dresdner Daily Asset Fund† | 1,626,946 | |||||||||
| 405,303 | Repurchase Agreements† | 405,303 | |||||||||
| 311,626 | Time Deposits† | 311,626 | |||||||||
| Total Other Securities (cost $2,343,875) | 2,343,875 | ||||||||||
| Repurchase Agreements - 2.2% | |||||||||||
| $ | 1,695,000 | Calyon, New York Branch, 0.95% dated 12/31/07, maturing 1/2/08 to be repurchased at $1,695,089 collateralized by $1,723,241 in U.S. Treasuries 3.25%, 12/31/09 with a value of $1,729,169 (cost $1,695,000) | 1,695,000 | ||||||||
| Total Investments (total cost $72,800,442) – 103.2% | 78,913,806 | ||||||||||
| Liabilities, net of Cash, Receivables and Other Assets – (3.2)% | (2,475,217 | ) | |||||||||
| Net Assets – 100% | $ | 76,438,589 | |||||||||
Summary of Investments by Country – (Long Positions)
| Country | Value | % of Investment Securities | |||||||||
| Bermuda | $ | 208,164 | 0.3 | % | |||||||
| Canada | 1,635,135 | 2.1 | % | ||||||||
| Sweden | 424,970 | 0.5 | % | ||||||||
| United States†† | 76,645,537 | 97.1 | % | ||||||||
| Total | $ | 78,913,806 | 100.0 | % | |||||||
††Includes Short-Term Securities and Other Securities (92.0% excluding Short-Term Securities and Other Securities)
See Notes to Schedule of Investments and Financial Statements.
10 Janus Aspen Series December 31, 2007
Schedule of Investments
As of December 31, 2007
| Value | |||||||
| Schedule of Written Options - Puts | |||||||
| iShares Russell Mid-Cap Value Index expires May 2008 136 contracts exercise price $128.00 | $ | (45,152 | ) | ||||
| Russell Mid-Cap Value Index expires February 2008 98 contracts exercise price $125.00 | (7,840 | ) | |||||
| Russell Mid-Cap Value Index expires March 2008 2,800 contracts exercise price $961.71 | (34,150 | ) | |||||
| Russell Mid-Cap Value Index expires March 2008 903 contracts exercise price $967.38 | (11,759 | ) | |||||
| S&P Mid-Cap 400® Index expires February 2008 1,706 contracts exercise price $780.00 | (12,554 | ) | |||||
| Total Written Options - Puts (Premiums received $176,165) | $ | (111,455 | ) | ||||
See Notes to Schedule of Investments and Financial Statements.
Janus Aspen Series December 31, 2007 11
Statement of Assets and Liabilities
| As of December 31, 2007 (all numbers in thousands except net asset value per share) | Janus Aspen Mid Cap Value Portfolio | ||||||
| Assets: | |||||||
| Investments at cost(1) | $ | 72,800 | |||||
| Investments at value(1) | $ | 78,914 | |||||
| Receivables: | |||||||
| Investments sold | 521 | ||||||
| Portfolio shares sold | 109 | ||||||
| Dividends | 107 | ||||||
| Interest | 2 | ||||||
| Non-interested Trustees' deferred compensation | 1 | ||||||
| Other assets | 1 | ||||||
| Total Assets | 79,655 | ||||||
| Liabilities: | |||||||
| Payables: | |||||||
| Options written, at value (premiums received $176) | 111 | ||||||
| Collateral for securities loaned (Note 1) | 2,344 | ||||||
| Due to Custodian | 153 | ||||||
| Investments purchased | 387 | ||||||
| Portfolio shares repurchased | 21 | ||||||
| Dividends | 3 | ||||||
| Advisory fees | 51 | ||||||
| Transfer agent fees and expenses | 1 | ||||||
| Administrative service fees - Service Shares | 5 | ||||||
| Distribution fees - Service Shares | 14 | ||||||
| Non-interested Trustees' fees and expenses | 2 | ||||||
| Non-interested Trustees' deferred compensation fees | 1 | ||||||
| Accrued expenses | 123 | ||||||
| Total Liabilities | 3,216 | ||||||
| Net Assets | $ | 76,439 | |||||
| Net Assets Consist of: | |||||||
| Capital (par value and paid-in-surplus)* | $ | 63,966 | |||||
| Undistributed net investment income/(loss)* | (1 | ) | |||||
| Undistributed net realized gain/(loss) from investments and foreign currency transactions* | 6,296 | ||||||
| Unrealized net appreciation/(depreciation) of investments, foreign currency translations and non-interested Trustees' deferred compensation | 6,178 | ||||||
| Total Net Assets | $ | 76,439 | |||||
| Net Assets - Institutional Shares | $ | 12,758 | |||||
| Shares Outstanding, $0.001 Par Value (unlimited shares authorized) | 761 | ||||||
| Net Asset Value Per Share | $ | 16.77 | |||||
| Net Assets - Service Shares | $ | 63,681 | |||||
| Shares Outstanding, $0.001 Par Value (unlimited shares authorized) | 3,819 | ||||||
| Net Asset Value Per Share | $ | 16.67 | |||||
* See Note 3 in Notes to Financial Statements.
(1) Investments at cost and value include $2,270,247 of securities loaned for Janus Aspen Mid Cap Value Portfolio (Note 1).
See Notes to Financial Statements.
12 Janus Aspen Series December 31, 2007
Statement of Operations
| For the fiscal year ended December 31, 2007 (all numbers in thousands) | Janus Aspen Mid Cap Value Portfolio | ||||||
| Investment Income: | |||||||
| Interest | $ | 6 | |||||
| Securities lending income | 8 | ||||||
| Dividends | 1,946 | ||||||
| Dividends from affiliates | 146 | ||||||
| Foreign tax withheld | (1 | ) | |||||
| Total Investment Income | 2,105 | ||||||
| Expenses: | |||||||
| Advisory fees | 486 | ||||||
| Transfer agent fees and expenses | 5 | ||||||
| Registration fees | 22 | ||||||
| Custodian fees | 27 | ||||||
| Professional fees | 110 | ||||||
| Non-interested Trustees' fees and expenses | 6 | ||||||
| Printing expenses | 53 | ||||||
| Legal fees | 7 | ||||||
| System fees | 20 | ||||||
| Distribution fees - Service Shares | 172 | ||||||
| Administrative service fees - Service Shares | 69 | ||||||
| Other expenses | 9 | ||||||
| Non-recurring costs (Note 2) | – | ||||||
| Costs assumed by Janus Capital Management LLC (Note 2) | – | ||||||
| Total Expenses | 986 | ||||||
| Expense and Fee Offset | (1 | ) | |||||
| Net Expenses | 985 | ||||||
| Net Investment Income/(Loss) | 1,120 | ||||||
| Net Realized and Unrealized Gain/(Loss) on Investments: | |||||||
| Net realized gain/(loss) from investment and foreign currency transactions | 8,859 | ||||||
| Net realized gain/(loss) from options contracts | 90 | ||||||
| Change in unrealized net appreciation/(depreciation) of investments, foreign currency translations and non-interested Trustees' deferred compensation | (4,049 | ) | |||||
| Net Gain/(Loss) on Investments | 4,900 | ||||||
| Net Increase/(Decrease) in Net Assets Resulting from Operations | $ | 6,020 | |||||
See Notes to Financial Statements.
Janus Aspen Series December 31, 2007 13
Statements of Changes in Net Assets
| For the fiscal years ended December 31 | Janus Aspen Mid Cap Value Portfolio | ||||||||||
| (all numbers in thousands) | 2007 | 2006 | |||||||||
| Operations: | |||||||||||
| Net investment income/(loss) | $ | 1,120 | $ | 770 | |||||||
| Net realized gain/(loss) from investment and foreign currency transactions | 8,859 | 4,749 | |||||||||
| Net realized gain/(loss) from futures contracts | – | (81 | ) | ||||||||
| Net realized gain/(loss) from options contracts | 90 | – | |||||||||
| Change in unrealized net appreciation/(depreciation) of investments, foreign currency translations and non-interested Trustees' deferred compensation | (4,049 | ) | 4,084 | ||||||||
| Net Increase/(Decrease) in Net Assets Resulting from Operations | 6,020 | 9,522 | |||||||||
| Dividends and Distributions to Shareholders: | |||||||||||
| Net investment income* | |||||||||||
| Institutional Shares | (205 | ) | (117 | ) | |||||||
| Service Shares | (872 | ) | (638 | ) | |||||||
| Net realized gain/(loss) from investment transactions* | |||||||||||
| Institutional Shares | (654 | ) | (432 | ) | |||||||
| Service Shares | (3,523 | ) | (2,842 | ) | |||||||
| Net Decrease from Dividends and Distributions | (5,254 | ) | (4,029 | ) | |||||||
| Capital Share Transactions: | |||||||||||
| Shares sold | |||||||||||
| Institutional Shares | 5,736 | 4,879 | |||||||||
| Service Shares | 7,200 | 22,610 | |||||||||
| Reinvested dividends and distributions | |||||||||||
| Institutional Shares | 859 | 549 | |||||||||
| Service Shares | 4,396 | 3,476 | |||||||||
| Shares repurchased | |||||||||||
| Institutional Shares | (5,098 | ) | (4,946 | ) | |||||||
| Service Shares | (17,864 | ) | (7,933 | ) | |||||||
| Net Increase/(Decrease) from Capital Share Transactions | (4,771 | ) | 18,635 | ||||||||
| Net Increase/(Decrease) in Net Assets | (4,005 | ) | 24,128 | ||||||||
| Net Assets: | |||||||||||
| Beginning of period | 80,444 | 56,316 | |||||||||
| End of period | $ | 76,439 | $ | 80,444 | |||||||
| Undistributed net investment income/(loss)* | $ | (1 | ) | $ | – | ||||||
*See Note 3 in Notes to Financial Statements.
See Notes to Financial Statements.
14 Janus Aspen Series December 31, 2007
Financial Highlights
Institutional Shares
| For a share outstanding during each fiscal year or period ended December 31 | Janus Aspen Mid Cap Value Portfolio | ||||||||||||||||||||||
| 2007 | 2006 | 2005 | 2004 | 2003(1) | |||||||||||||||||||
| Net Asset Value, Beginning of Period | $ | 16.64 | $ | 15.32 | $ | 15.54 | $ | 13.61 | $ | 10.07 | |||||||||||||
| Income from Investment Operations: | |||||||||||||||||||||||
| Net investment income/(loss) | .27 | .20 | .19 | .04 | .03 | ||||||||||||||||||
| Net gain/(loss) on securities (both realized and unrealized) | .99 | 2.06 | 1.31 | 2.39 | 3.54 | ||||||||||||||||||
| Total from Investment Operations | 1.26 | 2.26 | 1.50 | 2.43 | 3.57 | ||||||||||||||||||
| Less Distributions and Other: | |||||||||||||||||||||||
| Dividends (from net investment income)* | (.27 | ) | (.20 | ) | (.13 | ) | (.04 | ) | (.03 | ) | |||||||||||||
| Distributions (from capital gains)* | (.86 | ) | (.74 | ) | (1.59 | ) | (.46 | ) | – | ||||||||||||||
| Payment from affiliate | – | – | – | (2) | – | – | |||||||||||||||||
| Total Distributions and Other | (1.13 | ) | (.94 | ) | (1.72 | ) | (.50 | ) | (.03 | ) | |||||||||||||
| Net Asset Value, End of Period | $ | 16.77 | $ | 16.64 | $ | 15.32 | $ | 15.54 | $ | 13.61 | |||||||||||||
| Total Return** | 7.42 | % | 15.42 | % | 10.43 | %(3) | 18.19 | % | 35.41 | % | |||||||||||||
| Net Assets, End of Period (in thousands) | $ | 12,758 | $ | 11,227 | $ | 9,922 | $ | 10,099 | $ | 6,070 | |||||||||||||
| Average Net Assets for the Period (in thousands) | $ | 13,220 | $ | 9,223 | $ | 10,160 | $ | 8,108 | $ | 4,457 | |||||||||||||
| Ratio of Gross Expenses to Average Net Assets***(4) | 0.92 | % | 0.94 | % | 0.87 | % | 1.01 | % | 1.25 | % | |||||||||||||
| Ratio of Net Expenses to Average Net Assets***(4) | 0.91 | % | 0.94 | % | 0.86 | % | 1.01 | % | 1.25 | % | |||||||||||||
| Ratio of Net Investment Income/(Loss) to Average Net Assets*** | 1.66 | % | 1.45 | % | 1.16 | % | 0.31 | % | 0.46 | % | |||||||||||||
| Portfolio Turnover Rate*** | 83 | % | 89 | % | 74 | % | 92 | % | 120 | % | |||||||||||||
Service Shares
For a share outstanding during each fiscal year ended December 31 | Janus Aspen Mid Cap Value Portfolio | ||||||||||||||||||||||
| 2007 | 2006 | 2005 | 2004 | 2003 | |||||||||||||||||||
| Net Asset Value, Beginning of Period | $ | 16.56 | $ | 15.26 | $ | 15.52 | $ | 13.61 | $ | 10.00 | |||||||||||||
| Income from Investment Operations: | |||||||||||||||||||||||
| Net investment income/(loss) | .22 | .14 | .11 | – | .02 | ||||||||||||||||||
| Net gain/(loss) on securities (both realized and unrealized) | .97 | 2.06 | 1.32 | 2.37 | 3.60 | ||||||||||||||||||
| Total from Investment Operations | 1.19 | 2.20 | 1.43 | 2.37 | 3.62 | ||||||||||||||||||
| Less Distributions and Other: | |||||||||||||||||||||||
| Dividends (from net investment income)* | (.22 | ) | (.16 | ) | (.10 | ) | – | (.01 | ) | ||||||||||||||
| Distributions (from capital gains)* | (.86 | ) | (.74 | ) | (1.59 | ) | (.46 | ) | – | ||||||||||||||
| Payment from affiliate | – | – | – | (2) | – | – | |||||||||||||||||
| Total Distributions and Other | (1.08 | ) | (.90 | ) | (1.69 | ) | (.46 | ) | (.01 | ) | |||||||||||||
| Net Asset Value, End of Period | $ | 16.67 | $ | 16.56 | $ | 15.26 | $ | 15.52 | $ | 13.61 | |||||||||||||
| Total Return | 7.04 | % | 15.06 | % | 9.93 | %(3) | 17.79 | % | 36.24 | % | |||||||||||||
| Net Assets, End of Period (in thousands) | $ | 63,681 | $ | 69,217 | $ | 46,394 | $ | 31,465 | $ | 23,628 | |||||||||||||
| Average Net Assets for the Period (in thousands) | $ | 68,765 | $ | 58,793 | $ | 36,590 | $ | 25,782 | $ | 14,025 | |||||||||||||
| Ratio of Gross Expenses to Average Net Assets(4) | 1.26 | % | 1.30 | % | 1.22 | % | 1.36 | % | 1.50 | % | |||||||||||||
| Ratio of Net Expenses to Average Net Assets(4) | 1.26 | % | 1.30 | % | 1.22 | % | 1.36 | % | 1.50 | % | |||||||||||||
| Ratio of Net Investment Income/(Loss) to Average Net Assets | 1.31 | % | 1.08 | % | 0.86 | % | (0.05 | )% | 0.20 | % | |||||||||||||
| Portfolio Turnover Rate | 83 | % | 89 | % | 74 | % | 92 | % | 120 | % | |||||||||||||
* See Note 3 in Notes to Financial Statements.
**Total return not annualized for periods of less than one full year.
***Annualized for periods of less than one full year.
(1) Fiscal period from May 1, 2003 (inception date) through December 31, 2003.
(2) Payment from affiliate aggregated less than $.01 on a per share basis for the fiscal year ended.
(3) During the fiscal year ended, Janus Capital and/or Janus Services LLC fully reimbursed the Portfolio for a loss on a transaction resulting from certain trading, pricing and/or shareholder activity errors, which otherwise would have reduced total return by 0.02%.
(4) See Note 4 in Notes to Financial Statements.
See Notes to Financial Statements.
Janus Aspen Series December 31, 2007 15
Notes to Schedule of Investments
| Lipper Variable Annuity Mid-Cap Value Funds | Funds that, by portfolio practice, invest at least 75% of their equity assets in companies with market capitalizations (on a three-year weighted basis) less than 300% of the dollar-weighted median market capitalization of the middle 1,000 securities of the S&P SuperComposite 1500 Index. Mid-cap value funds typically have a below-average price-to-earnings ratio, price-to-book ratio, and three-year sales-per-share growth value, compared to the S&P MidCap 400 Index. | ||||||
| Russell Midcap® Value Index | Measures the performance of those Russell MidCap companies with lower price-to-book ratios and lower forecasted growth values. | ||||||
| S&P 500® Index | The Standard & Poor's ("S&P") 500® Index is a commonly recognized, market capitalization weighted index of 500 widely held equity securities, designed to measure broad U.S. equity performance. | ||||||
| S&P MidCap 400 Index | An unmanaged group of 400 domestic stocks chosen for their market size, liquidity and industry group representation. | ||||||
| ADR | American Depositary Receipt | ||||||
| REIT | Real Estate Investment Trust | ||||||
| U.S. Shares | Securities of foreign companies trading on an American Stock Exchange. | ||||||
* Non-income-producing security.
** A portion of this holding has been segregated by the custodian to cover margin or segregation requirements on open futures contracts, forward currency contracts, options contracts, short sales, and/or securities with extended settlement dates.
# Loaned security; a portion or all of the security is on loan as of December 31, 2007.
† The security is purchased with the cash collateral received from securities on loan (Note 1).
Aggregate collateral segregated to cover margin, segregation requirements on open futures contracts, forward currency contracts, options contracts, short sales and/or securities with extended settlement dates as of December 31, 2007 is noted below.
| Portfolio | Aggregate Value | ||||||
| Janus Aspen Mid Cap Value Portfolio | $ | 352,720 | |||||
Repurchase agreements held by a Portfolio are fully collateralized, and such collateral is in the possession of the Portfolio's custodian or subcustodian. The collateral is evaluated daily to ensure its market value equals or exceeds the current market value of the repurchase agreements, including accrued interest. In the event of default on the obligation to repurchase, the Portfolio has the right to liquidate the collateral and apply the proceeds in satisfaction of the obligation. In the event of default or bankruptcy by the other party to the agreement, realization and/or retention of the collateral or proceeds may be subject to legal proceedings.
16 Janus Aspen Series December 31, 2007
Notes to Financial Statements
The following section describes the organization and significant accounting policies and provides more detailed information about the schedules and tables that appear throughout this report. In addition, the Notes to Financial Statements explain the methods used in preparing and presenting this report.
1. ORGANIZATION AND SIGNIFICANT ACCOUNTING POLICIES
Janus Aspen Mid Cap Value Portfolio (the "Portfolio") is a series fund. The Portfolio is part of Janus Aspen Series (the "Trust"), which is organized as a Delaware statutory trust and is registered under the Investment Company Act of 1940, as amended, (the "1940 Act") as an open-end management investment company. The Trust offers seventeen Portfolios, which include multiple series of shares, with differing investment objectives and policies. The Portfolio invests primarily in equity securities. The Portfolio is classified as diversified, as defined in the 1940 Act. The Portfolio is a no-load investment.
The Portfolio currently offers two classes of shares: Institutional Shares and Service Shares. Institutional Shares are offered only in connection with investment in and payments under variable insurance contracts and to qualified retirement plans. Service Shares are offered only in connection with investment in and payments under variable insurance contracts and to qualified retirement plans that require a fee from Portfolio assets to procure distribution and administrative services to contract owners and plan participants.
The following accounting policies have been consistently followed by the Portfolio and are in conformity with accounting principles generally accepted in the United States of America in the investment company industry.
Investment Valuation
Securities are valued at the last sales price or the official closing price for securities traded on a principal securities exchange (U.S. or foreign) and on the NASDAQ National Market. Securities traded on over-the-counter markets and listed securities for which no sales are reported are valued at the latest bid price (or yield equivalent thereof) obtained from one or more dealers transacting in a market for such securities or by a pricing service approved by the Portfolio's Trustees. Short-term securities with maturities of 60 days or less may be valued at amortized cost, which approximates market value. Debt securities with a remaining maturity of greater than 60 days are valued in accordance with the evaluated bid price supplied by the pricing service. The evaluated bid price supplied by the pricing service is an evaluation that reflects such factors as security prices, yields, maturities and ratings. Foreign securities and currencies ar e converted to U.S. dollars using the applicable exchange rate in effect as of the daily close of the New York Stock Exchange ("NYSE"). When market quotations are not readily available or deemed unreliable, or events or circumstances that may affect the value of portfolio securities held by the Portfolio are identified between the closing of their principal markets and the time the net asset value ("NAV") is determined, securities may be valued at fair value as determined in good faith under procedures established by and under the supervision of the Portfolio's Trustees. Circumstances in which fair value pricing may be utilized include, but are not limited to: (i) when significant events occur which may affect the securities of a single issuer, such as mergers, bankruptcies, or significant issuer specific developments; (ii) when significant events occur which may affect an entire market, such as natural disasters or significant governmen tal actions; and (iii) when non-significant events occur such as markets closing early or not opening, security trading halts, or pricing of non-valued securities and restricted or non-public securities. The Portfolio may use a systematic fair valuation model provided by an independent third party to value international equity securities in order to adjust for stale pricing, which may occur between the close of certain foreign exchanges and the NYSE.
Investment Transactions and Investment Income
Investment transactions are accounted for as of the date purchased or sold (trade date). Dividend income is recorded on the ex-dividend date. Certain dividends from foreign securities will be recorded as soon as the Trust is informed of the dividend if such information is obtained subsequent to the ex-dividend date. Dividends from foreign securities may be subject to withholding taxes in foreign jurisdictions. Interest income is recorded on the accrual basis and includes amortization of premiums and accretion of discounts. Gains and losses are determined on the identified cost basis, which is the same basis used for federal income tax purposes. Income, as well as gains and losses, both realized and unrealized, are allocated daily to each class of shares based upon the ratio of net assets represented by each class as a percentage of total net assets.
Expenses
The Portfolio bears expenses incurred specifically on its behalf as well as a portion of general expenses. Each class of shares bears expenses incurred specifically on its behalf and, in addition, each class bears a portion of general expenses, which may be based upon relative net assets of each class. Expenses are allocated daily to each class of shares based upon the ratio of net assets represented by each class as a percentage of total net assets. Expenses directly attributable to a specific class of shares are charged against the operations of such class.
Securities Lending
Under procedures adopted by the Trustees, the Portfolio may lend securities to qualified parties (typically brokers or other financial institutions) who need to borrow securities in order to complete certain transactions such as covering short sales, avoiding failures to deliver securities or completing arbitrage activities. The Portfolio may seek to earn additional income through securities lending. There is the risk of delay in recovering a loaned security or the risk of loss in collateral rights if the borrower fails financially. Janus Capital Management LLC ("Janus Capital") makes efforts to balance the benefits and risks from granting such loans.
State Street Bank and Trust Company served as the Portfolio's lending agent for the period January 1, 2007 through May 24,
Janus Aspen Series December 31, 2007 17
Notes to Financial Statements (continued)
2007. Effective May 25, 2007, Dresdner Bank AG became the lending agent for the Portfolio.
The Portfolio does not have the right to vote on securities while they are being lent; however, the Portfolio may attempt to call back the loan and vote the proxy if time permits. All loans will be continuously secured by collateral which may consist of cash, U.S. Government securities, domestic and foreign short-term debt instruments, letters of credit, time deposits, repurchase agreements, or such other collateral permitted by the Securities and Exchange Commission ("SEC"). Cash collateral may be invested in affiliated money market funds or other accounts advised by Janus Capital to the extent consistent with exemptive relief obtained from the SEC or as permitted by the 1940 Act and rules promulgated thereunder.
Dresdner Bank AG (the "Lending Agent") may also invest the cash collateral in the Allianz Dresdner Daily Asset Fund or investments in unaffiliated money market funds or accounts, mutually agreed to by the Portfolio and the Lending Agent, that comply with Rule 2a-7 of the 1940 Act relating to money market funds.
As of December 31, 2007, the Portfolio had on loan securities valued as indicated:
| Portfolio | Value at December 31, 2007 | ||||||
| Janus Aspen Mid Cap Value Portfolio | $ | 2,270,247 | |||||
As of December 31, 2007, the Portfolio received cash collateral for securities lending activity as indicated:
| Portfolio | Cash Collateral at December 31, 2007 | ||||||
| Janus Aspen Mid Cap Value Portfolio | $ | 2,343,875 | |||||
As of December 31, 2007, all cash collateral received by the Portfolio was invested in the Allianz Dresdner Daily Asset Fund, except for $405,303 and $311,626 which were invested in Repurchase Agreements and Time Deposits respectively.
The value of the collateral must be at least 102% of the market value of the loaned securities that are denominated in U.S. dollars and 105% of the market value of the loaned securities that are not denominated in U.S. dollars. Loaned securities and related collateral are marked-to-market each business day based upon the market value of the loaned securities at the close of business, employing the most recent available pricing information. Collateral levels are then adjusted based on this mark-to-market evaluation.
The borrower pays fees at the Portfolio's direction to the Lending Agent. The Lending Agent may retain a portion of the interest earned on the cash collateral invested. The cash collateral invested by the Lending Agent is disclosed in the Schedule of Investments (if applicable). The lending fees and the Portfolio's portion of the interest income earned on cash collateral are included on the Statement of Operations (if applicable).
Interfund Lending
Pursuant to an exemptive order received from the SEC, the Portfolio may be party to an interfund lending agreement between the Portfolio and other Janus Capital sponsored mutual funds, which permits it to borrow or lend cash at a rate beneficial to both the borrowing and lending funds. Outstanding borrowings from all sources totaling 10% or more of the borrowing Portfolio's total assets must be collateralized at 102% of the outstanding principal value of the loan; loans of less than 10% may be unsecured. During the fiscal year ended December 31, 2007, there were no outstanding interfund borrowing or lending arrangements for the Portfolio.
Forward Currency Transactions
The Portfolio may enter into forward currency contracts in order to reduce its exposure to changes in foreign currency exchange rates on its foreign portfolio holdings and to lock in the U.S. dollar cost of firm purchase and sale commitments for securities denominated in or exposed to foreign currencies. A forward currency exchange contract is a commitment to purchase or sell a foreign currency at a future date at a negotiated rate. The gain or loss arising from the difference between the U.S. dollar cost of the original contract and the value of the foreign currency in U.S. dollars upon closing a contract is included in "Net realized gain/(loss) from investment and foreign currency transactions" on the Statement of Operations (if applicable).
Forward currency contracts held by the Portfolio are fully collateralized by other securities, which are denoted in the accompanying Schedule of Investments (if applicable). The collateral is evaluated daily to ensure its market value equals or exceeds the current market value of the corresponding forward currency contracts. As of December 31, 2007, the Portfolio was not invested in forward foreign currency contracts.
Futures Contracts
The Portfolio may enter into futures contracts to gain exposure to the stock market pending investment of cash balances or to meet liquidity needs. The Portfolio may also use such derivative instruments to hedge or protect from adverse movements in securities prices, currency rates or interest rates. The use of futures contracts may involve risks such as the possibility of illiquid markets or imperfect correlation between the value of the contracts and the underlying securities, or that the counterparty will fail to perform its obligations.
Futures contracts are marked-to-market daily, and the daily variation margin is recorded as a receivable or payable on the Statement of Assets and Liabilities (if applicable). When a contract is closed, a realized gain or loss is recorded as "Net realized gain/(loss) from futures contracts" on the Statement of Operations (if applicable) equal to the difference between the opening and closing value of the contract. Generally, futures contracts are marked-to-market (i.e., treated as realized and subject to distribution) for federal income tax purposes at fiscal year-end. Securities designated as collateral for market value on futures contracts are noted in the Schedule of Investments (if applicable). Such collateral is in the possession of the Portfolio's
18 Janus Aspen Series December 31, 2007
custodian. As of December 31, 2007, the Portfolio was not invested in futures contracts.
Options Contracts
The Portfolio may purchase or write put and call options on futures contracts and on portfolio securities for hedging purposes or as a substitute for an investment. The Portfolio may also purchase or write put and call options on foreign currencies in a manner similar to that in which futures or forward contracts on foreign currencies will be utilized. The Portfolio generally invests in options to hedge against adverse movements in the value of portfolio holdings.
When an option is written, the Portfolio receives a premium and becomes obligated to sell or purchase the underlying security at a fixed price, upon exercise of the option. In writing an option, the Portfolio bears the market risk of an unfavorable change in the price of the security underlying the written option. Exercise of an option written by the Portfolio could result in the Portfolio buying or selling a security at a price different from the current market value.
When an option is exercised, the proceeds on sales for a written call option, the purchase cost for a written put option, or the cost of the security for a purchased put or call option is adjusted by the amount of premium received or paid.
The Portfolio may also purchase and write exchange-listed and over-the-counter put and call options on domestic securities indices, and on foreign securities indices listed on domestic and foreign securities exchanges. Options on securities indices are similar to options on securities except that (1) the expiration cycles of securities index options are monthly, while those of securities options are currently quarterly, and (2) the delivery requirements are different. Instead of giving the right to take or make delivery of securities at a specified price, an option on a securities index gives the holder the right to receive a cash ''exercise settlement amount'' equal to (a) the amount, if any, by which the fixed exercise price of the option exceeds (in the case of a put) or is less than (in the case of a call) the closing value of the underlying index on the date of exercise, multiplied by (b) a fixed ''index multiplier.'' Receipt of this ca sh amount will depend upon the closing level of the securities index upon which the option is based being greater than, in the case of a call, or less than, in the case of a put, the exercise price of the index and the exercise price of the option times a specified multiple. The writer of the option is obligated, in return for the premium received, to make delivery of this amount.
Holdings designated to cover outstanding written options are noted in the Schedule of Investments (if applicable). Options written are reported as a liability on the Statement of Assets and Liabilities as "Options written at value" (if applicable). Realized gains and losses are reported as "Net realized gain/(loss) from options contracts" on the Statement of Operations (if applicable). The Portfolio recognized realized losses of $25,921 during the fiscal year ended December 31, 2007.
The risk in writing a call option is that the Portfolio gives up the opportunity for profit if the market price of the security increases and the option is exercised. The risk in writing a put option is that the Portfolio may incur a loss if the market price of the security decreases and the option is exercised. The risk in buying an option is that the Portfolio pays a premium whether or not the option is exercised. The use of such instruments may involve certain additional risks as a result of unanticipated movement in the market. A lack of correlation between the value of an instrument underlying an option and the asset being hedged, or unexpected adverse price movements, could render the Portfolio's hedging strategy unsuccessful. In addition, there can be no assurance that a liquid secondary market will exist for any option purchased or sold. There is no limit to the loss that the Portfolio may recognize due to written call options.
Written option activity for the fiscal year ended December 31, 2007 was as follows:
| Call Options | Number of Contracts | Premiums Received | |||||||||
| Janus Aspen Mid Cap Value Portfolio | |||||||||||
| Options outstanding at December 31, 2006 | – | $ | – | ||||||||
| Options written | 68 | 13,783 | |||||||||
| Options closed | (68 | ) | (13,783 | ) | |||||||
| Options expired | – | – | |||||||||
| Options exercised | – | – | |||||||||
| Options outstanding at December 31, 2007 | – | $ | – | ||||||||
| Put Options | Number of Contracts | Premiums Received | |||||||||
| Janus Aspen Mid Cap Value Portfolio | |||||||||||
| Options outstanding at December 31, 2006 | – | $ | – | ||||||||
| Options written | 8,245 | 198,504 | |||||||||
| Options closed | (2,602 | ) | (22,339 | ) | |||||||
| Options expired | – | – | |||||||||
| Options exercised | – | – | |||||||||
| Options outstanding at December 31, 2007 | 5,643 | $ | 176,165 | ||||||||
Short Sales
The Portfolio may engage in "short sales against the box." Short sales against the box involve either selling short a security that the Portfolio owns, or selling short a security that the Portfolio has the right to obtain, for delivery at a specified date in the future. The Portfolio may enter into a short sale against the box to hedge against anticipated declines in the market price of portfolio securities by locking in gains. The Portfolio does not deliver from its portfolio the securities sold short and does not immediately receive the proceeds of the short sale. The Portfolio borrows the securities sold short and receives proceeds from the short sale only when it delivers the securities to the lender. If the value of the securities sold short increases prior to the scheduled delivery date, the Portfolio loses the opportunity to participate in the gain.
The Portfolio may engage in short sales when the portfolio managers anticipate that a security's market purchase price will be less than its borrowing price. To complete the transaction, the Portfolio must borrow the security to deliver it to the purchaser and buy that same security in the market to
Janus Aspen Series December 31, 2007 19
Notes to Financial Statements (continued)
return it to the lender. The total market value of all of the Portfolio's short sale positions will not exceed 10% of its assets. Although the potential for gain is limited to the difference between the price at which the Portfolio sold the security short and the cost of borrowing the security, its potential for loss is theoretically unlimited because there is no limit to the cost of replacing the borrowed security. There is no assurance that the Portfolio will be able to close out a short position at a particular time or at an acceptable price. A gain or a loss will be recognized upon termination of a short sale. There is no limit to the size of any loss that the Portfolio may recognize upon termination of a short sale. Short sales held by the Portfolio are fully collateralized by other securities, which are denoted in the accompanying Schedule of Investments (if applicable). As of December 31, 2007, the Portfolio was not engaged in short s ales.
Foreign Currency Translations
The Portfolio does not isolate that portion of the results of operations resulting from changes in foreign exchange rates on investments from the fluctuations arising from changes in market prices of securities held at the date of the financial statements. Net unrealized appreciation or depreciation on investments and foreign currency translation arise from changes in the value of assets and liabilities, including investments in securities held at the date of the financial statements, resulting from changes in the exchange rates and changes in market prices of securities held.
Currency gains and losses are also calculated on payables and receivables that are denominated in foreign currencies. The payables and receivables are generally related to foreign security transactions and income.
Foreign currency-denominated assets and forward currency contracts may involve more risks than domestic transactions, including currency risk, political and economic risk, regulatory risk and market risk. Risks may arise from the potential inability of a counterparty to meet the terms of a contract and from unanticipated movements in the value of foreign currencies relative to the U.S. dollar.
When-issued Securities
The Portfolio may purchase or sell securities on a when-issued or forward commitment basis. The price of the underlying securities and date when the securities will be delivered and paid for are fixed at the time the transaction is negotiated. Losses may arise due to changes in the market value of the securities or from the inability of counterparties to meet the terms of the contract. In connection with such purchases, the Portfolio may hold liquid assets as collateral with the Portfolio's custodian sufficient to cover the purchase price. As of December 31, 2007, the Portfolio was not invested in when-issued securities.
Equity-Linked Structured Notes
The Portfolio may invest in equity-linked structured notes. Equity-linked structured notes are derivative securities which are specially designed to combine the characteristics of one or more underlying securities and their equity derivatives in a single note form. The return and/or yield or income component may be based on the performance of the underlying equity securities, an equity index, and/or option positions. Equity-linked structured notes are typically offered in limited transactions by financial institutions in either registered or non-registered form. An investment in equity-linked structured notes creates exposure to the credit risk of the issuing financial institution, as well as to the market risk of the underlying securities. There is no guaranteed return of principal with these securities and the appreciation potential of these securities may be limited b y a maximum payment or call right. In certain cases, equity-linked structured notes may be more volatile and less liquid than less complex securities or other types of fixed-income securities. Such securities may exhibit price behavior that does not correlate with other fixed-income securities. As of December 31, 2007, the Portfolio was not invested in equity-linked structured notes.
Initial Public Offerings
The Portfolio may invest in initial public offerings ("IPOs"). IPOs and other investment techniques may have a magnified performance impact on a fund with a small asset base. The Portfolio may not experience similar performance as its assets grow.
Restricted Security Transactions
Restricted securities held by the Portfolio may not be sold except in exempt transactions or in a public offering registered under the Securities Act of 1933. The risk of investing in such securities is generally greater than the risk of investing in the securities of widely held, publicly traded companies. Lack of a secondary market and resale restrictions may result in the inability of the Portfolio to sell a security at a fair price and may substantially delay the sale of the security. In addition, these securities may exhibit greater price volatility than securities for which secondary markets exist. As of December 31, 2007, the Portfolio was not invested in restricted securities.
Dividend Distributions
The Portfolio may make semiannual distributions of substantially all of its investment income and an annual distribution of its net realized capital gains (if any). The majority of dividends and net realized capital gains distributions from the Portfolio may be automatically reinvested into additional shares of the Portfolio, based upon the discretion of the shareholder.
The Portfolio has made certain investments in real estate investment trusts ("REITs") which pay dividends to their shareholders based upon funds available from operations. It is quite common for these dividends to exceed the REIT's taxable earnings and profits resulting in the excess portion of such dividends being designated as a return of capital. If the Portfolio distributes such amounts, such distribution could constitute a return of capital to shareholders for federal income tax purposes.
Estimates
The preparation of financial statements in conformity with accounting principles generally accepted in the United States of
20 Janus Aspen Series December 31, 2007
America requires management to make estimates and assumptions that affect the reported amount of assets and liabilities and disclosure of contingent assets and liabilities at the date of the financial statements, and the reported amounts of income and expenses during the reporting period. Actual results could differ from those estimates.
Federal Income Taxes
No provision for income taxes is included in the accompanying financial statements, as the Portfolio intends to distribute to shareholders all taxable investment income and realized gains and otherwise comply with Subchapter M of the Internal Revenue Code applicable to regulated investment companies.
New Accounting Pronouncements
In July 2006, the Financial Accounting Standards Board ("FASB") issued Interpretation No. 48, "Accounting for Uncertainty in Income Taxes – an Interpretation of FASB Statement No. 109" (the "Interpretation"). The Interpretation establishes for all entities, including pass-through entities such as the Portfolio, a minimum threshold for financial statement recognition of the benefit of positions taken in filing tax returns (including whether an entity is taxable in a particular jurisdiction), and requires certain expanded tax disclosures. A calendar year open-end or closed-end fund was required to implement the Interpretation no later than June 29, 2007 (the last business day of the semi-annual reporting period), and the Interpretation also applies to all open tax years as of the date of effectiveness. Management has evaluated the application of the Interpretation to the Portfolio and has determined there is no significant impact on the P ortfolio's financial statements.
In September 2006, the FASB issued Statement of Financial Accounting Standards No. 157, "Fair Value Measurements" ("SFAS No. 157"), which defines fair value, establishes a framework for measuring fair value in generally accepted accounting principles, and expands disclosures about fair value measurements. SFAS No. 157 does not require new fair value measurements, but is applied to the extent that other accounting pronouncements require or permit fair value measurements. SFAS No. 157 emphasizes that fair value is a market-based measurement that should be determined based on the assumptions that market participants would use in pricing an asset or liability. SFAS No. 157 is effective for fiscal years beginning after November 15, 2007 and interim periods within those fiscal years. Management does not believe the adoption of SFAS No. 157 will impact the financial statement amounts, however, the Portfolio will be required to disclose the extent t o which fair value is used to measure assets and liabilities and the inputs used to develop the measurements.
2. INVESTMENT ADVISORY AGREEMENTS AND OTHER TRANSACTIONS WITH AFFILIATES
The Portfolio pays a monthly advisory fee to Janus Capital based upon average daily net assets and calculated at the annual rate of 0.64%.
For the Portfolio, the investment advisory fee is determined by calculating a base fee and applying a performance adjustment.
The base fee rate is the same as the investment advisory fee rate shown in the previous paragraph. The performance adjustment either increases or decreases the base fee depending on how well the Portfolio has performed relative to its benchmark, as shown below:
| Portfolio | Benchmark Index | ||||||
| Janus Aspen Mid Cap Value Portfolio | Russell Midcap® Value Index | ||||||
Only the base fee rate applied until February 2007 for the Portfolio, at which time the calculation of the performance adjustment is applied as follows:
(Investment Advisory Fee = Base Fee +/- Performance Adjustment).
The investment advisory fee paid to Janus Capital by the Portfolio consists of two components: (i) a base fee calculated by applying the contractual fixed-rate of the advisory fee to the Portfolio's average daily net assets during the previous month ("Base Fee"), plus or minus (ii) a performance-fee adjustment ("Performance Adjustment") calculated by applying a variable rate of up to 0.15% (positive or negative) to the Portfolio's average daily net assets during the applicable performance measurement period.
The performance measurement period generally is the previous 36 months. When the Portfolio's performance-based fee structure has been in effect for at least 12 months, but less than 36 months, the performance measurement period will be equal to the time that has elapsed since the performance-based fee structure took effect. As noted above, any Performance Adjustment began February 2007 for Janus Aspen Mid Cap Value Portfolio. No Performance Adjustment will be applied unless the difference between the Portfolio's investment performance and the investment record of the Portfolio's benchmark index is 0.50% or greater (positive or negative) during the applicable performance measurement period. Because the Performance Adjustment is tied to the Portfolio's performance relative to its benchmark index (and not its absolute performance), the Performance Adjustment could increase Janus Capital's fee even if the Portfolio's shares lose value during the performance measurement period and could decrease Janus Capital's fee even if the Portfolio's shares increase in value during the performance measurement period. For purposes of computing the Base Fee and the Performance Adjustment, net assets will be averaged over different periods (average daily net assets during the previous month for the Base Fee, versus average daily net assets during the performance measurement period for the Performance Adjustment). Performance of the Portfolio is calculated net of expenses whereas the Portfolio's benchmark index does not have any expenses. Reinvestment of dividends and distributions are included in calculating both the performance of the Portfolio and the Portfolio's benchmark index. The Base Fee is calculated and accrued daily. The Performance Adjustment is calculated monthly in arrears and is accrued evenly each day throughout the month. The investment fee is paid monthly in arrears.
Janus Aspen Series December 31, 2007 21
Notes to Financial Statements (continued)
The investment performance of the Portfolio's Service Shares ("Service Shares") for the performance measurement period will be used to calculate the Performance Adjustment. After Janus Capital determines whether the Portfolio's performance was above or below its benchmark index by comparing the investment performance of the Portfolio's Service Shares against the investment record of its benchmark index, Janus Capital will apply the same Performance Adjustment (positive or negative) across each other class of shares of the Portfolio.
It is not possible to predict the effect of the Performance Adjustment on future overall compensation to Janus Capital since it will depend on the performance of the Portfolio relative to the record of the Portfolio's benchmark index and future changes to the size of the Portfolio.
The Portfolio's prospectus and statement of additional information contains additional information about performance-based fees. The amount shown as Advisory fees on the Statement of Operations reflects the Base Fee plus/minus any Performance Adjustment. During the fiscal year ended December 31, 2007, the Portfolio recorded a negative Performance Adjustment of $35,456.
Perkins, Wolf, McDonnell and Company, LLC. ("Perkins") serves as subadviser to the Portfolio. As compensation for its services, Perkins receives directly from the Portfolio a fee equal to 50% of Janus Capital's management fee (net of any reimbursement of expenses incurred or fees waived by Janus Capital). Janus Capital has a 30% ownership stake in Perkins' investment advisory business.
Janus Capital has agreed until at least May 1, 2009 to reimburse the Portfolio by the amount, if any, that the normal operating expenses in any fiscal year, including the investment advisory fee but excluding the distribution and shareholder servicing (12b-1) fees applicable to Service Shares, the administrative services fees applicable to Service Shares, brokerage commissions, interest, taxes and extraordinary expenses, exceed an annual rate of 1.24% of the average daily net assets of the Portfolio. The Portfolio is not required to repay any such waived fees in future years to Janus Capital.
Janus Services LLC ("Janus Services"), a wholly-owned subsidiary of Janus Capital, is the Portfolio's transfer agent. Janus Services receives from the Portfolio a fee at an annual rate of up to 10% of the average daily net assets of Service Shares of the Portfolio, to compensate Janus Services for providing, or arranging for the provision of record keeping, subaccounting and administrative services.
Janus Services receives certain out-of-pocket expenses for transfer agent services.
Certain officers of the Portfolio may also be officers and/or directors of Janus Capital. Such officers receive no compensation from the Portfolio, except for the Portfolio's Chief Compliance Officer. Effective January 1, 2006, the Portfolio began reimbursing the adviser for a portion of the compensation paid to the Chief Compliance Officer of the Trust. Total compensation of $3,078 was paid by the Portfolio during the fiscal year ended December 31, 2007. The Portfolio's portion is reported as part of "Other Expenses" on the Statement of Operations.
The Board of Trustees has adopted a deferred compensation plan (the "Deferred Plan") for independent Trustees to elect to defer receipt of all or a portion of the annual compensation they are entitled to receive from the Portfolio. All deferred fees are credited to an account established in the name of the Trustees. The amounts credited to the account then increase or decrease, as the case may be, in accordance with the performance of one or more of the Janus funds that are selected by the Trustees. The account balance continues to fluctuate in accordance with the performance of the selected fund or funds until final payment of all amounts credited to the account. The fluctuation of the account balance is recorded by the Portfolio as unrealized appreciation/(depreciation) and is shown as of December 31, 2007 on the Statement of Assets and Liabilities as an asset, "Noninterested Trustees' deferred compensation," and a liability, "Nonintereste d Trustees' deferred compensation fees." Additionally, the recorded unrealized appreciation/(depreciation) is included in "Unrealized net appreciation/(depreciation) of investments, foreign currency translations and non-interested Trustees' deferred compensation" on the Statement of Assets and Liabilities. Deferred compensation expenses for the fiscal year ended December 31, 2007 are included in "Non-interested Trustees' fees and expenses" on the Statement of Operations. Trustees are allowed to change their designation of mutual funds from time to time. Amounts will be deferred until distributed in accordance with the Deferred Plan. No deferred fees were paid to any Trustee under the Deferred Plan during the fiscal year ended December 31, 2007.
For the fiscal year ended December 31, 2007, Janus Capital assumed $24,421 of legal, consulting and Trustee costs and fees incurred by the funds in Janus Investment Fund, Janus Aspen Series and Janus Adviser Series (the "Funds") in connection with the regulatory and civil litigation matters discussed in Note 7. These non-recurring costs were allocated to all Funds based on the Funds' respective net assets as of July 31, 2004. Additionally, all future non-recurring costs will be allocated to the Funds based on the Funds' respective net assets on July 31, 2004. These "Non-recurring costs" and "Costs assumed by Janus Capital" are shown on the Statement of Operations.
Janus Distributors LLC, a wholly-owned subsidiary of Janus Capital, is a distributor of the Portfolio. Service Shares have adopted a Distribution and Shareholder Servicing Plan (the "Plan") pursuant to Rule 12b-1 under the 1940 Act. The Plan authorizes payments by the Portfolio in connection with the distribution of Service Shares at an annual rate of up to 0.25% of Service Share's average daily net assets.
The Portfolio's expenses may be reduced by expense offsets from an unaffiliated custodian and/or transfer agent. Such credits or offsets are included in "Expense and Fee Offset" on the Statement of Operations. The transfer agent fee offsets received during the period reduce Transfer Agent Fees and Expenses. Custodian offsets received reduce Custodian Fees. The Portfolio could have employed the assets used by the
22 Janus Aspen Series December 31, 2007
custodian and/or transfer agent to produce income if it had not entered into an expense offset arrangement.
The Portfolio may invest in money market funds, including funds managed by Janus Capital. During the fiscal year ended December 31, 2007, the Portfolio recorded distributions from affiliated investment companies as affiliated dividend income, and had the following affiliated purchases and sales:
| Purchases Shares/Cost | Sales Shares/Cost | Dividend Income | Value at 12/31/07 | ||||||||||||||||
| Janus Aspen Mid Cap Value Portfolio | |||||||||||||||||||
| Janus Institutional Cash Management Fund – Institutional Shares | $ | 4,857,385 | $ | 4,857,385 | $ | 36,558 | $ | – | |||||||||||
| Janus Institutional Cash Reserves Fund | 653,863 | 1,182,463 | 2,914 | – | |||||||||||||||
| Janus Institutional Money Market Fund – Institutional Shares | 28,325,308 | 28,325,308 | 74,855 | – | |||||||||||||||
| Janus Money Market Fund – Institutional Shares | 3,566,713 | 9,720,418 | 31,814 | – | |||||||||||||||
| $ | 37,403,269 | $ | 44,085,574 | $ | 146,141 | $ | – | ||||||||||||
3. FEDERAL INCOME TAX
The tax components of capital shown in the table below represent: (1) distribution requirements the Portfolio must satisfy under the income tax regulations; (2) losses or deductions the Portfolio may be able to offset against income and gains realized in future years; and (3) unrealized appreciation or depreciation of investments for federal income tax purposes (reduced by foreign tax liability).
Other book to tax differences in the current year may consist of deferred compensation, derivatives, and foreign currency contract adjustments. The Portfolio has elected to treat gains and losses on forward foreign currency contracts as capital gains and losses. Other foreign currency gains and losses on debt instruments are treated as ordinary income for federal income tax purposes pursuant to Section 988 of the Internal Revenue Code.
Accumulated capital losses noted below represent net capital loss carryovers, as of December 31, 2007, that may be available to offset future realized capital gains and thereby reduce future taxable gains distributions.
| Portfolio | Undistributed Ordinary Income | Undistributed Long–Term Gains | Accumulated Capital Losses | Post October Deferral | Other Book to Tax Differences | Net Tax Appreciation/ (Depreciation) | |||||||||||||||||||||
| Janus Aspen Mid Cap Value Portfolio(1) | $ | 1,966,260 | $ | 6,029,403 | $ | (1,920,126 | ) | $ | – | $ | 137,810 | $ | 6,259,282 | ||||||||||||||
(1) Capital loss carryover is subject to annual limitations.
The table below shows the expiration dates of the carryovers.
Capital Loss Carryover Expiration Schedule
For the year ended December 31, 2007
| Portfolio | December 31, 2009 | December 31, 2010 | |||||||||
| Janus Aspen Mid Cap Value Portfolio(1) | $ | (1,280,084 | ) | $ | (640,042 | ) | |||||
(1) Capital loss carryover is subject to annual limitations.
During the year ended December 31, 2007, the following capital loss carryover was utilized by the Portfolio as indicated in the table below.
| Portfolio | Capital Loss Carryover Utilized | ||||||
| Janus Aspen Mid Cap Value Portfolio | $ | 640,042 | |||||
The aggregate cost of investments and the composition of unrealized appreciation and depreciation of investment securities for federal income tax purposes as of December 31, 2007 are noted below.
Unrealized appreciation and unrealized depreciation in the table below exclude appreciation/depreciation on foreign currency translations. The primary difference between book and tax appreciation or depreciation of investments is wash sale loss deferrals.
| Portfolio | Federal Tax Cost | Unrealized Appreciation | Unrealized (Depreciation) | ||||||||||||
| Janus Aspen Mid Cap Value Portfolio | $ | 72,719,234 | $ | 11,450,420 | $ | (5,255,848 | ) | ||||||||
Janus Aspen Series December 31, 2007 23
Notes to Financial Statements (continued)
Income and capital gains distributions are determined in accordance with income tax regulations that may differ from accounting principles generally accepted in the United States of America. These differences are due to differing treatments for items such as net short-term gains, deferral of wash sale losses, foreign currency transactions, net investment losses and capital loss carryovers. Certain permanent differences such as tax returns of capital and net investment losses noted below have been reclassified to paid-in capital.
| Distributions | |||||||||||||||||||
| For the fiscal year ended December 31, 2007 Portfolio | From Ordinary Income | From Long-Term Capital Gains | Tax Return of Capital | Net Investment Loss | |||||||||||||||
| Janus Aspen Mid Cap Value Portfolio | $ | 2,589,024 | $ | 2,665,397 | $ | – | $ | – | |||||||||||
| Distributions | |||||||||||||||||||
| For the fiscal year ended December 31, 2006 Portfolio | From Ordinary Income | From Long-Term Capital Gains | Tax Return of Capital | Net Investment Loss | |||||||||||||||
| Janus Aspen Mid Cap Value Portfolio | $ | 1,943,535 | $ | 2,085,845 | $ | – | $ | – | |||||||||||
4. EXPENSE RATIOS
The expense ratios listed in the Financial Highlights reflect expenses prior to any expense offsets (gross expense ratio) and after expense offsets (net expense ratio). Both expense ratios reflect expenses after waivers (reimbursement). Listed below are the gross expense ratios for the Portfolio that would have been in effect, absent the waiver of certain fees and offsets.
| For each fiscal year or period ended December 31 | Institutional Shares | Service Shares | |||||||||||||||||||||||||||||||||||||||||
| Portfolio | 2007(1) | 2006(1) | 2005(1) | 2004(1) | 2003(2) | 2007(1) | 2006(1) | 2005(1) | 2004(1) | 2003 | |||||||||||||||||||||||||||||||||
| Janus Aspen Mid Cap Value Portfolio | 0.92 | % | 0.94 | % | 0.87 | % | 1.01 | % | 1.36 | % | 1.26 | % | 1.30 | % | 1.22 | % | 1.36 | % | 1.90 | % | |||||||||||||||||||||||
(1) The effect of non-recurring costs assumed by Janus Capital (Note 2) is included in the ratio of operating expenses to average net assets without waivers and/or expense reimbursements and was less than 0.01%.
(2) Fiscal period from May 1, 2003 (inception date) through December 31, 2003.
5. CAPITAL SHARE TRANSACTIONS
| For each fiscal year ended December 31 | Janus Aspen Mid Cap Value Portfolio | ||||||||||
| (all numbers in thousands) | 2007 | 2006 | |||||||||
| Transactions in Portfolio Shares – Institutional Shares | |||||||||||
| Shares sold | 330 | 304 | |||||||||
| Reinvested dividends and distributions | 50 | 36 | |||||||||
| Shares repurchased | (294 | ) | (313 | ) | |||||||
| Net Increase/(Decrease) in Portfolio Shares | 86 | 27 | |||||||||
| Shares Outstanding, Beginning of Period | 675 | 648 | |||||||||
| Shares Outstanding, End of Period | 761 | 675 | |||||||||
| Transactions in Portfolio Shares – Service Shares | |||||||||||
| Shares sold | 418 | 1,413 | |||||||||
| Reinvested dividends and distributions | 254 | 230 | |||||||||
| Shares repurchased | (1,034 | ) | (502 | ) | |||||||
| Net Increase/(Decrease) in Portfolio Shares | (362 | ) | 1,141 | ||||||||
| Shares Outstanding, Beginning of Period | 4,181 | 3,040 | |||||||||
| Shares Outstanding, End of Period | 3,819 | 4,181 | |||||||||
24 Janus Aspen Series December 31, 2007
6. PURCHASES AND SALES OF INVESTMENT SECURITIES
For the fiscal year ended December 31, 2007, the aggregate cost of purchases and proceeds from sales of investment securities (excluding short-term securities and options contracts) were as follows:
| Portfolio | Purchases of Securities | Proceeds from Sales of Securities | Purchases of Long- Term U.S. Government Obligations | Proceeds from Sales of Long-Term U.S. Government Obligations | |||||||||||||||
| Janus Aspen Mid Cap Value Portfolio | $ | 64,999,826 | $ | 70,105,557 | $ | – | $ | – | |||||||||||
7. PENDING LEGAL MATTERS
In the fall of 2003, the Securities and Exchange Commission ("SEC"), the Office of the New York State Attorney General ("NYAG"), the Colorado Attorney General ("COAG"), and the Colorado Division of Securities ("CDS") announced that they were investigating alleged frequent trading practices in the mutual fund industry. On August 18, 2004, Janus Capital announced that it had reached final settlements with the SEC, the NYAG, the COAG, and the CDS related to such regulators' investigations into Janus Capital's frequent trading arrangements.
A number of civil lawsuits were brought against Janus Capital and certain of its affiliates, the Janus funds, and related entities and individuals based on allegations similar to those announced by the above regulators and were filed in several state and federal jurisdictions. Such lawsuits alleged a variety of theories for recovery including, but not limited to, the federal securities laws, other federal statutes (including ERISA), and various common law doctrines. The Judicial Panel on Multidistrict Litigation transferred these actions to the U.S. District Court for the District of Maryland (the "Court") for coordinated proceedings. On September 29, 2004, five consolidated amended complaints were filed with the Court that generally include: (i) claims by a putative class of investors in certain Janus funds asserting claims on behalf of the investor class (Marini, et al. v. Janus Investment Fund, et al., U.S. District Court, District of Maryland, Case No. 04-CV-00497); (ii) derivative claims by investors in certain Janus funds ostensibly on behalf of such funds (Steinberg et al. v. Janus Capital Management, LLC et al., U.S. District Court, District of Maryland, Case No. 04-CV-00518); (iii) claims on behalf of participants in the Janus 401(k) plan (Wangberger v. Janus Capital Group Inc., 401(k) Advisory Committee, et al., U.S. District Court, District of Maryland, Case No. JFM-05-2711); (iv) claims brought on behalf of shareholders of Janus Capital Group Inc. ("JCGI") on a derivative basis against the Board of Directors of JCGI (Chasen v. Whiston, et al., U.S. District Court, District of Maryland, Case No. 04-MD-00855); and (v) claims by a putative class of shareholders of JCGI asserting claims on behalf of the shareholders (Wiggins, et al. v. Janus Capital Group, Inc., et al., U.S. District Court, District of Maryland, Case No. 04-CV-00818). Each of the five complaints initially named JCGI and/or Janus Capital as a defendant. In addition, the following were also named as defendants in one or more of the actions: Janus Investment Fund ("JIF"), Janus Aspen Series ("JAS"), Janus Adviser Series ("JAD"), Janus Distributors LLC, Enhanced Investment Technologies, LLC ("INTECH"), Bay Isle Financial LLC ("Bay Isle"), Perkins, Wolf, McDonnell and Company, LLC ("Perkins"), the Advisory Committee of the Janus 401(k) plan, and the current or former directors of JCGI.
On August 25, 2005, the Court entered orders dismissing most of the claims asserted against Janus Capital and its affiliates by fund investors in the Marini and Steinberg cases (actions (i) and (ii) above) except certain claims under Section 10(b) of the Securities Exchange Act of 1934 and under Section 36(b) of the Investment Company Act of 1940, as amended (the "1940 Act"). On August 15, 2006, the Wangberger complaint in the 401(k) plan class action (action (iii) above) was dismissed by the district court with prejudice. The plaintiff appealed that dismissal decision to the United States Court of Appeals for the Fourth Circuit. The appeal is still pending and argument in the matter was held in December 2007. The Court also dismissed the Chasen lawsuit (action (iv) above) against JCGI's Board of Directors without leave to amend. Finally, a Motion to Dismiss the Wiggins suit (action (v) above) was granted and the matter was dismissed in May 2007. However, in June 2007, Plaintiffs appealed that dismissal to the United States Court of Appeals for the Fourth Circuit. That appeal is currently pending.
In addition to the lawsuits described above, the Auditor of the State of West Virginia ("Auditor"), in his capacity as securities commissioner, has initiated administrative proceedings against many of the defendants in the market timing cases (including JCGI and Janus Capital) and, as a part of its relief, is seeking disgorgement and other monetary relief based on similar market timing allegations (In the Matter of Janus Capital Group Inc. et al., Before the Securities Commissioner, State of West Virginia, Summary Order No. 05-1320). The respondents in these proceedings collectively sought a Writ of
Janus Aspen Series December 31, 2007 25
Notes to Financial Statements (continued)
Prohibition in state court, which was denied. Their subsequent Petition for Appeal was also denied. Consequently, in September 2006, JCGI and Janus Capital filed their answer to the Auditor's summary order instituting proceedings and requested a hearing. A status conference was held on June 28, 2007, during which the parties were ordered to submit their proposed scheduling order. To date, no scheduling order has been entered in the case. In addition to the pending Motion to Discharge Order to Show Cause, JCGI and Janus Capital, as well as other similarly situated defendants, continue to challenge the statutory authority of the Auditor to bring such an action.
Additional lawsuits may be filed against certain of the Janus funds, Janus Capital, and related parties in the future. Janus Capital does not currently believe that these pending actions will materially affect its ability to continue providing services it has agreed to provide to the Janus funds.
26 Janus Aspen Series December 31, 2007
Report of Independent Registered Public Accounting Firm
To the Trustees and Shareholders
of Janus Aspen Mid Cap Value Portfolio
In our opinion, the accompanying statement of assets and liabilities, including the schedule of investments, and the related statements of operations and of changes in net assets and the financial highlights present fairly, in all material respects, the financial position of Janus Aspen Mid Cap Value Portfolio (one of the portfolios constituting Janus Aspen Series, hereafter referred to as the "Portfolio") at December 31, 2007, the results of its operations for the year then ended, the changes in its net assets for each of the two years in the period then ended, and the financial highlights for each of the periods indicated, in conformity with accounting principles generally accepted in the United States of America. These financial statements and financial highlights (hereafter referred to as "financial statements") are the responsibility of the Portfolio's management; our responsibility is to express an opinion on these financial statements based on our audits. We conducted our audits of these financial statements in accordance with the standards of the Public Company Accounting Oversight Board (United States). Those standards require that we plan and perform the audit to obtain reasonable assurance about whether the financial statements are free of material misstatement. An audit includes examining, on a test basis, evidence supporting the amounts and disclosures in the financial statements, assessing the accounting principles used and significant estimates made by management, and evaluating the overall financial statement presentation. We believe that our audits, which included confirmation of securities at December 31, 2007 by correspondence with the custodian, transfer agent and brokers, and the application of alternative auditing procedures where securities purchased had not been received, provide a reasonable basis for our opinion.

Denver, Colorado
February 15, 2008
Janus Aspen Series December 31, 2007 27
Additional Information (unaudited)
PROXY VOTING POLICIES AND VOTING RECORD
A description of the policies and procedures that the Portfolio uses to determine how to vote proxies relating to its portfolio securities is available: (i) without charge, upon request, by calling 1-800-525-0020 (toll free); (ii) on the Portfolio's website at www.janus.com/proxyvoting; and (iii) on the SEC's website at http://www.sec.gov. Additionally, information regarding the Portfolio's proxy voting record for the most recent twelve-month period ended June 30 is also available, free of charge, through www.janus.com/proxyvoting and from the SEC's website at http://www.sec.gov.
QUARTERLY PORTFOLIO HOLDINGS
The Portfolio files its complete portfolio holdings (schedule of investments) with the SEC for the first and third quarters of each fiscal year on Form N-Q within 60 days of the end of such fiscal quarter. The Portfolio's Form N-Q: (i) is available on the SEC's website at http://www.sec.gov; (ii) may be reviewed and copied at the SEC's Public Reference Room in Washington, D.C. (information on the Public Reference Room may be obtained by calling 1-800-SEC-0330); and (iii) is available without charge, upon request, by calling Janus at 1-800-525-0020 (toll free).
APPROVAL OF ADVISORY AGREEMENTS DURING THE PERIOD
The Trustees of Janus Aspen Series, none of whom has ever been affiliated with Janus Capital ("Independent Trustees"), oversee the management of each Portfolio and, as required by law, determine annually whether to continue the investment advisory agreement for each Portfolio and the subadvisory agreements for the three Portfolios that utilize subadvisers.
In connection with their most recent consideration of those agreements for each Portfolio, the Trustees received and reviewed a substantial amount of information provided by Janus Capital and the respective subadvisers in response to requests of the Independent Trustees and their independent legal counsel. They also received and reviewed a considerable amount of information and analysis provided by their independent fee consultant. Throughout their consideration of the agreements, the Independent Trustees were advised by their independent legal counsel. The Independent Trustees met with management to consider the agreements, and also met separately in executive session with their independent legal counsel and their independent fee consultant.
At a meeting held on December 14, 2007, based on their evaluation of the information provided by Janus Capital, the subadvisers and the independent fee consultant, as well as other information, the Trustees determined that the overall arrangements between each Portfolio and Janus Capital and each subadviser, as applicable, were fair and reasonable in light of the nature, extent and quality of the services provided by Janus Capital, its affiliates and the subadvisers, the fees charged for those services, and other matters that the Trustees considered relevant in the exercise of their business judgment. At that meeting the Trustees unanimously approved the continuation of the investment advisory agreement for each Portfolio, and the subadvisory agreement for each subadvised Portfolio, for the period from February 1, 2008 through February 1, 2009, subject to earlier termina tion as provided for in each agreement.
In considering the continuation of those agreements, the Trustees reviewed and analyzed various factors that they determined were relevant, including the factors described below, none of which by itself was considered dispositive. However, the material factors and conclusions that formed the basis for the Trustees' determination to approve the continuation of the agreements are discussed separately below.
Nature, Extent and Quality of Services
The Trustees reviewed the nature, extent and quality of the services provided by Janus Capital and the subadvisers to the Portfolios, taking into account the investment objective and strategy of each Portfolio, the knowledge of the Trustees gained from their regular meetings with management on at least a quarterly basis, and their ongoing review of information related to the Portfolios. In addition, the Trustees reviewed the resources and key personnel of Janus Capital and each subadviser, especially those who provide investment management services to the Portfolios. The Trustees also considered other services provided to the Portfolios by Janus Capital or the subadvisers, such as managing the execution of portfolio transactions and the selection of broker-dealers for those transactions, serving as the Portfolios' administrator, monitoring adherence to the Portfolios' investment restrictions, producing shareholder reports, providing support services for the Trustees and Trustee committees, communicating with shareholders, and overseeing the activities of other service providers, including monitoring compliance with various policies and procedures of the Portfolios and with applicable securities laws and regulations.
The Trustees concluded that the nature, extent and quality of the services provided by Janus Capital and/or the subadviser to each Portfolio were appropriate and consistent with the terms of the respective advisory and subadvisory agreements; that, taking into account steps taken to address those Portfolios whose performance lagged that of the median of their peers for certain periods, the quality of those services had been consistent with or superior to quality norms in the industry; and that the Portfolios were likely to benefit from the continued provision of those services. They also concluded that Janus Capital and each subadviser had sufficient personnel, with the appropriate education and experience, to serve the Portfolios effectively and had demonstrated its continuing ability to attract well-qualified personnel.
28 Janus Aspen Series December 31, 2007
Performance of the Portfolios
The Trustees considered the investment results of each Portfolio over various time periods. They reviewed information comparing each Portfolio's performance with the performance of comparable funds and peer groups identified by Lipper Inc., an independent provider of investment company data, and with the Portfolio's benchmark index. They concluded that the performance of many Portfolios was good to very good under current market conditions. Although the performance of some Portfolios lagged that of the median of their peers for certain periods, the Trustees also concluded that Janus Capital had taken appropriate steps to address those instances of under-performance and that the more recent performance of most of those Portfolios had been improving.
Costs of Services Provided
The Trustees examined information on the fees and expenses of each Portfolio in comparison to similar information for comparable funds as provided by Lipper. They also reviewed an analysis of that information provided by their independent fee consultant and noted that the rate of management (investment advisory and administrative) fees for most of the Portfolios, in some cases after contractual expense limitations, was below the mean management fee rate of the respective peer group of funds selected by Lipper.
The Trustees considered the methodology used by Janus Capital and each subadviser in determining compensation payable to portfolio managers, the competitive environment for investment management talent and the competitive market for mutual funds in different distribution channels. They concluded that the compensation methodology provided a good alignment of the interests of the portfolio managers with those of Portfolio shareholders.
The Trustees also reviewed management fees charged by Janus Capital to its separate account clients and to its subadvised funds (for which Janus Capital provides only services related to portfolio management). Although in most instances subadvisory and separate account fee rates for various investment strategies were lower than management fee rates for Portfolios having a similar strategy, the Trustees noted that, under the terms of the management agreements with the Portfolios, Janus Capital performs significant additional services for the Portfolios that it does not provide to those other clients, including administrative services, oversight of the Portfolios' other service providers, Trustee support, regulatory compliance and numerous other services, and that, in serving the Portfolios, Janus Capital assumes many legal risks that it does not assume in servicing its other clients. Moreover, the Trustees noted that the spread between the av erage fee rates charged to the Portfolios and the fee rates that Janus Capital charged to its separate account clients was significantly smaller than the average spread for such fee rates of other advisers, based on publicly available data and research conducted by their independent fee consultant.
The Trustees reviewed information on the profitability to Janus Capital and its affiliates of their relationships with each Portfolio, as well as an explanation of the methodology used in allocating various expenses of Janus Capital and its affiliates among the Portfolios and other clients. They also reviewed the financial statements of Janus Capital's parent company and its corporate structure. In their review, the Trustees considered whether Janus Capital and each subadviser receives adequate incentives to manage the Portfolios effectively. They recognized that profitability comparisons among investment advisers are difficult because very little comparative information is publicly available and profitability of any adviser is affected by numerous factors, including the organizational structure of the particular adviser, the types of funds and other accounts it manages, possible other lines of business, the methodology for allocating expens es, and the adviser's capital structure and cost of capital. However, based on the information available and taking those factors into account, the Trustees concluded that Janus Capital's profitability with respect to each Portfolio in relation to the services rendered was not unreasonable.
The Trustees concluded that the management fees and other compensation payable by each Portfolio to Janus Capital and its affiliates, as well as the fees payable by Janus Capital or the Portfolios to the subadvisers of subadvised Portfolios, were reasonable in relation to the nature, extent and quality of the services provided, taking into account the fees charged by other advisers for managing comparable mutual funds with similar strategies and the fees Janus Capital and the subadvisers charge to other clients. They also concluded that the overall expense ratio of each Portfolio was reasonable, taking into account the size of the Portfolio, the quality of services provided by Janus Capital and any subadviser, the investment performance of the Portfolio and any expense limitations agreed to by Janus Capital.
Economies of Scale
The Trustees considered information about the potential for Janus Capital to realize economies of scale as the assets of the Portfolios increase. They noted that, although most Portfolios pay advisory fees at a fixed rate as a percentage of net assets, without any breakpoints, the management fee rate paid by each Portfolio, after any contractual expense limitations, was below the mean management fee rate of the Portfolio's peer group selected by Lipper; and, for those Portfolios whose expenses are being reduced by the contractual expense limitations of Janus Capital, Janus Capital is subsidizing the Portfolios because they have not reached adequate scale. Moreover, as the assets of many of the Portfolios declined in the past few years, those Portfolios benefited from having advisory fee rates that remained constant rather than increasing as assets declined. In addition, performance fee
Janus Aspen Series December 31, 2007 29
Additional Information (unaudited) (continued)
structures have been implemented for several Portfolios that will cause the effective rate of advisory fees payable by such a Portfolio to vary depending on the investment performance of the Portfolio relative to its benchmark index over the measurement period; and a few Portfolios have fee schedules with breakpoints and reduced fee rates above certain asset levels. The Trustees also noted that the Portfolios share directly in economies of scale through lower charges of third-party service providers, based on the combined scale of all of the Portfolios. Based on all of the information they reviewed, the Trustees concluded that the current fee structure of each Portfolio was reasonable and that the current rates of fees do reflect a sharing between Janus Capital and the Portfolio of economies of scale at the current asset level of the Portfolio.
Other Benefits to Janus Capital
The Trustees also considered benefits that accrue to Janus Capital and its affiliates from their relationships with the Portfolios. They recognized that two affiliates of Janus Capital separately serve the Portfolios as transfer agent and distributor, respectively. They also considered Janus Capital's past and proposed use of commissions paid by Portfolios on their portfolio brokerage transactions to obtain proprietary and third-party research products and services benefiting those Portfolios and/or other clients of Janus Capital. The Trustees concluded that Janus Capital's use of "soft" commission dollars of a Portfolio to obtain proprietary and third-party research products and services was consistent with regulatory requirements and guidelines and was likely to benefit the Portfolios. The Trustees also concluded that, other than the services provided by Janus Capital and its affiliates pursuant to the agreements and the fees to be paid by each Portfolio therefor, the Portfolios and Janus Capital may potentially benefit from their relationship with each other in other ways. They concluded that Janus Capital benefits from the receipt of proprietary research products and services acquired through commissions paid on portfolio transactions of the Portfolios and that the Portfolios benefit from Janus Capital's receipt of those products and services, as well as research products and services acquired through commissions paid by other clients of Janus Capital. They further concluded that success of any Portfolio could attract other business to Janus Capital or other Janus funds and that the success of Janus Capital could enhance Janus Capital's ability to serve the Portfolios.
After full consideration of the above factors, as well as other factors, all of the Trustees, all of whom are Independent Trustees, concluded that the proposed continuation of the investment advisory agreement for each Portfolio, and the subadvisory agreement for each subadvised Portfolio, was in the best interest of the respective Portfolios and their shareholders.
30 Janus Aspen Series December 31, 2007
Explanations of Charts, Tables and
Financial Statements (unaudited)
1. PERFORMANCE OVERVIEWS
The performance overview graph compares the performance of a hypothetical $10,000 investment in the Portfolio with one or more widely used market indices. The hypothetical example does not represent the returns of any particular investment.
When comparing the performance of the Portfolio with an index, keep in mind that market indices do not include brokerage commissions that would be incurred if you purchased the individual securities in the index. They also do not include taxes payable on dividends and interest or operating expenses incurred if you maintained a Portfolio invested in the index.
Average annual total returns are quoted for each class of the Portfolio. Average annual total return is calculated by taking the growth or decline in value of an investment over a period of time, including reinvestment of any dividends, distributions and capital gains, then calculating the annual compounded percentage rate that would have produced the same result had the rate of growth been constant throughout the period. Average annual total return does not reflect the deduction of taxes that a shareholder would pay on Portfolio distributions or redemptions of Portfolio shares.
Pursuant to federal securities rules, expense ratios shown in the performance chart reflect subsidized and unsubsidized ratios for the past fiscal year. The total annual portfolio operating expenses ratio is gross of any fee waivers, reflecting a Portfolio's unsubsidized expense ratio. The net annual portfolio operating expenses ratio (if applicable) includes contractual waivers of Janus Capital and/or Janus Services and reflects a Portfolio's subsidized expense ratio. Both the total annual portfolio operating expenses ratio and net annual portfolio operating expenses ratio are based on average net assets as of the fiscal year ended December 31, 2006. The ratios also include expenses indirectly incurred by the Portfolio as a result of investing in other investment companies or pooled investments, which are not reflected in the "Financial Highlights" of this report. As a result, these ratios may be higher or lower than those shown in the "Fin ancial Highlights" in this report. All expenses are shown without the effect of expense offset arrangements. Pursuant to such arrangements, credits realized as a result of uninvested cash balances are used to reduce custodian and transfer agent expenses.
2. SCHEDULE OF INVESTMENTS
Following the performance overview section is the Portfolio's Schedule of Investments. This schedule reports the industry concentrations and types of securities held in the Portfolio on the last day of the reporting period. Securities are usually listed by type (common stock, corporate bonds, U.S. Government obligations, etc.) and by industry classification (banking, communications, insurance, etc.). Holdings are subject to change without notice.
The value of each security is quoted as of the last day of the reporting period. The value of securities denominated in foreign currencies is converted into U.S. dollars. Certain short-term investments maturing within 60 days are valued at amortized cost, which approximates market value.
A summary of investments by country is provided if the Portfolio invested in foreign securities. This summary reports the Portfolio's exposure to different countries by providing the percentage of securities invested in each country. The country of each security represents the country in which the company is incorporated.
2A. FORWARD CURRENCY CONTRACTS
A table listing forward currency contracts follows the Portfolio's Schedule of Investments (if applicable). Forward currency contracts are agreements to deliver or receive a preset amount of currency at a future date. Forward currency contracts are used to hedge against foreign currency risk in the Portfolio's long-term holdings.
The table provides the name of the foreign currency, the settlement date of the contract, the amount of the contract, the value of the currency in U.S. dollars and the amount of unrealized gain or loss. The amount of unrealized gain or loss reflects the change in currency exchange rates from the time the contract was opened to the last day of the reporting period.
2B. FUTURES
A table listing futures contracts follows the Portfolio's Schedule of Investments (if applicable). Futures contracts are contracts that obligate the buyer to receive and the seller to deliver an instrument or money at a specified price on a specified date. Futures are used to hedge against adverse movements in securities prices, currency risk or interest rates.
The table provides the name of the contract, number of contracts held, the expiration date, the principal amount, value and the amount of unrealized gain or loss. The amount of unrealized gain or loss reflects the marked-to-market amount for the last day of the reporting period.
2C. OPTIONS
A table listing written option contracts follows the Portfolio's Schedule of Investments (if applicable). Written option contracts are contracts that obligate the Portfolio to sell or purchase an underlying security at a fixed price, upon exercise of the option. Options are used to hedge against adverse movements in securities prices, currency risk or interest rates.
Janus Aspen Series December 31, 2007 31
Explanations of Charts, Tables and
Financial Statements (unaudited) (continued)
The table provides the name of the contract, number of contracts held, the expiration date, exercise price, value and premiums received.
3. STATEMENT OF ASSETS AND LIABILITIES
This statement is often referred to as the "balance sheet." It lists the assets and liabilities of the Portfolio on the last day of the reporting period.
The Portfolio's assets are calculated by adding the value of the securities owned, the receivable for securities sold but not yet settled, the receivable for dividends declared but not yet received on stocks owned and the receivable for Portfolio shares sold to investors but not yet settled. The Portfolio's liabilities include payables for securities purchased but not yet settled, Portfolio shares redeemed but not yet paid and expenses owed but not yet paid. Additionally, there may be other assets and liabilities such as unrealized gain or loss on forward currency contracts.
The section entitled "Net Assets Consist of" breaks down the components of the Portfolio's net assets. Because the Portfolio must distribute substantially all earnings, you will notice that a significant portion of net assets is shareholder capital.
The last section of this statement reports the net asset value ("NAV") per share on the last day of the reporting period for each class of the Portfolio. The NAV is calculated by dividing the Portfolio's net assets (assets minus liabilities) by the number of shares outstanding.
4. STATEMENT OF OPERATIONS
This statement details the Portfolio's income, expenses, gains and losses on securities and currency transactions, and appreciation or depreciation of current Portfolio holdings.
The first section in this statement, entitled "Investment Income," reports the dividends earned from stocks and interest earned from interest-bearing securities in the Portfolio.
The next section reports the expenses and expense offsets incurred by the Portfolio, including the advisory fee paid to the investment adviser, transfer agent fees and expenses, printing and postage for mailing statements, financial reports and prospectuses, and other expenses. Expense offsets, if any, are also shown.
The last section lists the increase or decrease in the value of securities held in the Portfolio. The Portfolio realizes a gain (or loss) when it sells its position in a particular security. An unrealized gain (or loss) refers to the change in net appreciation or depreciation of the Portfolio during the reporting period. "Net Realized and Unrealized Gain/(Loss) on Investments" is affected both by changes in the market value of Portfolio holdings and by gains (or losses) realized during the reporting period.
5. STATEMENT OF CHANGES IN NET ASSETS
This statement reports the increase or decrease in the Portfolio's net assets during the reporting period. Changes in the Portfolio's net assets are attributable to investment operations, dividends, distributions and capital share transactions. This is important to investors because it shows exactly what caused the Portfolio's net asset size to change during the period.
The first section summarizes the information from the Statement of Operations regarding changes in net assets due to the Portfolio's investment performance. The Portfolio's net assets may also change as a result of dividend and capital gains distributions to investors. If investors receive their dividends in cash, money is taken out of the Portfolio to pay the distribution. If investors reinvest their dividends, the Portfolio's net assets will not be affected. If you compare the Portfolio's "Net Decrease from Dividends and Distributions" to the "Reinvested dividends and distributions," you will notice that dividend distributions had little effect on the Portfolio's net assets. This is because the majority of Janus investors reinvest their distributions.
The reinvestment of dividends is included under "Capital Share Transactions." "Capital Shares" refers to the money investors contribute to the Portfolio through purchases or withdraw via redemptions. The Portfolio's net assets will increase and decrease in value as investors purchase and redeem shares from the Portfolio.
6. FINANCIAL HIGHLIGHTS
This schedule provides a per-share breakdown of the components that affect the Portfolio's NAV for current and past reporting periods for each class of the Portfolio. Not only does this table provide you with total return, it also reports total distributions, asset size, expense ratios and portfolio turnover rate.
The first line in the table reflects the NAV per share at the beginning of the reporting period. The next line reports the net investment income per share, which comprises dividends and interest income earned on securities held by the Portfolio. Following is the total of gains/(losses), realized and unrealized. Dividends and distributions are then subtracted to arrive at the NAV per share at the end of the period. The next line reflects the average annual total return reported the last day of the period.
Also included are the expense ratios, or the percentage of average net assets that were used to cover operating expenses during the period. Expense ratios vary for a number of
32 Janus Aspen Series December 31, 2007
reasons, including the differences in management fees, the average shareholder account size and the extent of foreign investments, which entail greater transaction costs.
The Portfolio's expenses may be reduced through expense reduction arrangements. These arrangements may include the use of balance credits or transfer agent fee offsets. The Statement of Operations reflects total expenses before any such offset, the amount of the offset and the net expenses. The expense ratios listed in the Financial Highlights reflect total expenses prior to any expense offsets (gross expense ratio) and after the expense offsets (net expense ratio). Both expense ratios reflect expenses after waivers (reimbursements), if applicable.
The ratio of net investment income/(loss) summarizes the income earned less expenses, divided by the average net assets of the Portfolio during the reporting period. Don't confuse this ratio with the Portfolio's yield. The net investment income ratio is not a true measure of the Portfolio's yield because it doesn't take into account the dividends distributed to the Portfolio's investors.
The next figure is the portfolio turnover rate, which measures the buying and selling activity in the Portfolio. Portfolio turnover is affected by market conditions, changes in the asset size of the Portfolio, the nature of the Portfolio's investments and the investment style of the portfolio manager. A 100% rate implies that an amount equal to the value of the entire portfolio is turned over in a year; a 50% rate means that an amount equal to the value of half the portfolio is traded in a year; and a 200% rate means that an amount equal to the value of the portfolio is traded every six months.
Janus Aspen Series December 31, 2007 33
Designation Requirements (unaudited)
For federal income tax purposes, the Portfolio designated the following for the year ended December 31, 2007:
Capital Gain Distributions
| Portfolio | |||||||
| Janus Aspen Mid Cap Value Portfolio | $ | 2,665,397 | |||||
Dividends Received Deduction Percentage
| Portfolio | |||||||
| Janus Aspen Mid Cap Value Portfolio | 45 | % | |||||
34 Janus Aspen Series December 31, 2007
Trustees and Officers (unaudited)
The Portfolio's Statement of Additional Information includes additional information about the Trustees and officers and is available, without charge, by calling 1-800-525-0020.
The following are the Trustees and officers of the Trust, together with a brief description of their principal occupations during the last five years (principal occupations for certain Trustees may include periods over five years).
Each Trustee has served in that capacity since he or she was originally elected or appointed. The Trustees do not serve a specified term of office. Each Trustee will hold office until the termination of the Trust or his or her earlier death, resignation, retirement, incapacity, or removal. The retirement age for Trustees is 72. The Portfolio's Nominating and Governance Committee will consider nominees for the position of Trustee recommended by shareholders. Shareholders may submit the name of a candidate for consideration by the Committee by submitting their recommendations to the Trust's Secretary. Each Trustee is currently a Trustee of two other registered investment companies advised by Janus Capital: Janus Investment Fund and Janus Adviser Series. As of the date of this report, collectively, these three registered investment companies consist of 75 series or funds.
The Trust's officers are elected annually by the Trustees for a one-year term. Certain officers also serve as officers of Janus Investment Fund and Janus Adviser Series. Certain officers of the Portfolio may also be officers and/or directors of Janus Capital. Portfolio officers receive no compensation from the Portfolio, except for the Portfolio's Chief Compliance Officer, as authorized by the Trustees.
Trustees
| Name, Address, and Age | Positions Held with Portfolio | Length of Time Served | Principal Occupations During the Past Five Years | Number of Portfolios/Funds in Fund Complex Overseen by Trustee | Other Directorships Held by Trustee | ||||||||||||||||||
| Dennis B. Mullen* 151 Detroit Street Denver, CO 80206 DOB: 1943 | Chairman Trustee | 3/04-12/07 9/93-Present | Chief Executive Officer of Red Robin Gourmet Burgers, Inc. (since 2005). Formerly, private investor. | 75 | ** | Chairman of the Board (since 2005) and Director of Red Robin Gourmet Burgers, Inc., and Director of Janus Capital Funds Plc (Dublin-based, non-U.S. funds). | |||||||||||||||||
| Jerome S. Contro 151 Detroit Street Denver, CO 80206 DOB: 1956 | Trustee | 12/05-Present | Partner of Tango Group, a private investment firm (since 1999). | 75 | Trustee and Chairman of RS Investment Trust (since 2001), and Director of IZZE Beverages and MyFamily.com, Inc. (genealogical research website). | ||||||||||||||||||
| William F. McCalpin 151 Detroit Street Denver, CO 80206 DOB: 1957 | Trustee | 6/02-Present | Private investor. Formerly, Executive Vice President and Chief Operating Officer of The Rockefeller Brothers Fund (a private family foundation), and Vice President of Asian Cultural Council. | 75 | Director of F.B. Heron Foundation (a private grant making foundation). | ||||||||||||||||||
| John W. McCarter, Jr. 151 Detroit Street Denver, CO 80206 DOB: 1938 | Trustee | 6/02-Present | President and Chief Executive Officer of The Field Museum of Natural History (Chicago, IL) (since 1997). | 75 | Chairman of the Board and Director of Divergence Inc. (biotechnology firm); Director of W.W. Grainger, Inc. (industrial distributor); and Trustee of WTTW (Chicago public television station) and the University of Chicago. | ||||||||||||||||||
* Mr. McCalpin will succeed Mr. Mullen as Chairman as of January 1, 2008.
** Mr. Mullen also serves as director of Janus Capital Funds Plc, consisting of 16 funds. Including Janus Capital Funds Plc and the 75 funds comprising the Janus funds, Mr. Mullen oversees 91 funds.
Janus Aspen Series December 31, 2007 35
Trustees and Officers (unaudited) (continued)
Trustees (cont.)
| Name, Address, and Age | Positions Held with Portfolio | Length of Time Served | Principal Occupations During the Past Five Years | Number of Portfolios/Funds in Fund Complex Overseen by Trustee | Other Directorships Held by Trustee | ||||||||||||||||||
| James T. Rothe 151 Detroit Street Denver, CO 80206 DOB: 1943 | Trustee | 1/97-Present | Co-founder and Managing Director of Roaring Fork Capital Management, LLC (private investment in public equity firm), and Professor Emeritus of Business of the University of Colorado, Colorado Springs, CO (since 2004). Formerly, Professor of Business of the University of Colorado (2002-2004) and Distinguished Visiting Professor of Business (2001-2002) of Thunderbird (American Graduate School of International Management), Glendale, AZ. | 75 | Director of Red Robin Gourmet Burgers, Inc. | ||||||||||||||||||
| William D. Stewart 151 Detroit Street Denver, CO 80206 DOB: 1944 | Trustee | 9/93-Present | Corporate Vice President and General Manager of MKS Instruments – HPS Products, Boulder, CO (a manufacturer of vacuum fittings and valves). | 75 | N/A | ||||||||||||||||||
| Martin H. Waldinger 151 Detroit Street Denver, CO 80206 DOB: 1938 | Trustee | 9/93-Present | Private Investor and Consultant to California Planned Unit Developments (since 1994). Formerly, CEO and President of Marwal, Inc. (homeowner association management company). | 75 | N/A | ||||||||||||||||||
| Linda S. Wolf 151 Detroit Street Denver, CO 80206 DOB: 1947 | Trustee | 12/05-Present | Retired. Formerly, Chairman and Chief Executive Officer of Leo Burnett (Worldwide) (advertising agency) (2001-2005). | 75 | Director of Wal-Mart, The Field Museum of Natural History (Chicago, IL), Children's Memorial Hospital (Chicago, IL), Chicago Council on Foreign Relations, Economic Club of Chicago, and InnerWorkings (U.S. provider of print procurement solutions). | ||||||||||||||||||
36 Janus Aspen Series December 31, 2007
Officers
| Name, Address, and Age | Positions Held with Portfolio | Term of Office* and Length of Time Served | Principal Occupations During the Past Five Years | ||||||||||||
| Stephanie Grauerholz-Lofton 151 Detroit Street Denver, CO 80206 DOB: 1970 | Chief Legal Counsel and Secretary Vice President | 1/06-Present 3/06-Present | Vice President and Assistant General Counsel of Janus Capital, and Vice President and Assistant Secretary of Janus Distributors LLC. Formerly, Assistant Vice President of Janus Capital and Janus Distributors LLC (2006), and Associate of Vedder, Price, Kaufman & Kammholz, P.C. (1999-2003). | ||||||||||||
| Andrew J. Iseman 151 Detroit Street Denver, CO 80206 DOB: 1964 | President and Chief Executive Officer | 3/07-Present | Chief Operating Officer and Senior Vice President of Janus Capital Group, Inc. and Janus Capital; President of Janus Services LLC; and Director of Capital Group Partners, Inc. Formerly, Senior Vice President of Enhanced Investment Technologies, LLC (2005-2007); and Vice President of Janus Capital (2003-2005) and Janus Services LLC (2003-2004). | ||||||||||||
| David R. Kowalski 151 Detroit Street Denver, CO 80206 DOB: 1957 | Vice President, Chief Compliance Officer, and Anti-Money Laundering Officer | 6/02-Present | Senior Vice President and Chief Compliance Officer of Janus Capital, Janus Distributors LLC, and Janus Services LLC; Chief Compliance Officer of Bay Isle Financial LLC; and Vice President of Enhanced Investment Technologies, LLC. Formerly, Chief Compliance Officer of Enhanced Investment Technologies, LLC (2003-2005); Vice President of Janus Capital (2000-2005) and Janus Services LLC (2004-2005); and Assistant Vice President of Janus Services LLC (2000-2004). | ||||||||||||
| Jesper Nergaard 151 Detroit Street Denver, CO 80206 DOB: 1962 | Chief Financial Officer Vice President, Treasurer, and Principal Accounting Officer | 3/05-Present 2/05-Present | Vice President of Janus Capital. Formerly, Director of Financial Reporting for OppenheimerFunds, Inc. (2004-2005); Site Manager and First Vice President of Mellon Global Securities Services (2003); and Director of Fund Accounting, Project Development, and Training of INVESCO Funds Group (1994-2003). | ||||||||||||
*Officers are elected at least annually by the Trustees for a one-year term and may also be elected from time to time by the Trustees for an interim period.
Janus Aspen Series December 31, 2007 37
Janus provides access to a wide range of investment disciplines.
Growth
Janus growth portfolios focus on companies believed to be the leaders in their respective industries, with solid management teams, expanding market share, margins and efficiencies.
Core
Janus core portfolios seek investments in more stable and predictable companies. These portfolios look for a strategic combination of steady growth and for certain portfolios, some degree of income.
Risk-Managed
Our risk-managed portfolios seek to outperform their respective indices while maintaining a risk profile equal to or lower than the index itself. Managed by INTECH (a Janus subsidiary), these portfolios use a mathematical process in an attempt to build a more "efficient" portfolio than the index.
Value
Janus value portfolios invest in companies they believe are poised for a turnaround or are trading at a significant discount to fair value. The goal is to gain unique insight into a company's true value and identify and evaluate potential catalysts that may unlock shareholder value.
International & Global
Janus international and global portfolios seek to leverage Janus' research capabilities by taking advantage of inefficiencies in foreign markets, where accurate information and analytical insight are often at a premium.
Bond
Janus bond portfolios attempt to provide less risk relative to equities while seeking to deliver a competitive total return through high current income and appreciation.
Money Market
Janus money market portfolios seek maximum current income consistent with stability of capital.
For more information about our funds, contact your investment professional or go to www.janus.com/info
Please consider the charges, risks, expenses and investment objectives carefully before investing. For a prospectus containing this and other information, please call Janus at 1-800-525-0020 or download the file from www.janus.com/info. Read it carefully before you invest or send money.
An investment in a money market portfolio is not insured or guaranteed by the Federal Deposit Insurance Corporation or any other government agency. Although the Portfolio seeks to preserve the value of your investment at $1.00 per share, it is possible to lose money by investing in the Portfolio.

151 Detroit Street
Denver, CO 80206
1-800-525-0020
Portfolio distributed by Janus Distributors LLC (2/08)
C-0108-357 109-02-719 02-08
2007 Annual Report
Janus Aspen Series
Janus Aspen Money Market Portfolio
Look Inside. . .
• Investment strategy behind your portfolio
• Portfolio performance, characteristics and holdings

Table of Contents
| Useful Information About Your Portfolio Report | 1 | ||||||
| Schedule of Investments | 3 | ||||||
| Statement of Assets and Liabilities | 4 | ||||||
| Statement of Operations | 5 | ||||||
| Statements of Changes in Net Assets | 6 | ||||||
| Financial Highlights | 7 | ||||||
| Notes to Schedule of Investments | 8 | ||||||
| Notes to Financial Statements | 9 | ||||||
| Report of Independent Registered Public Accounting Firm | 14 | ||||||
| Additional Information | 15 | ||||||
| Explanations of Charts, Tables and Financial Statements | 18 | ||||||
| Trustees and Officers | 20 | ||||||
Please consider the charges, risks, expenses and investment objectives carefully before investing. For a prospectus containing this and other information, please call Janus at 1-800-525-0020 or download the file from www.janus.com/info. Read it carefully before you invest or send money.
An investment in a money market fund is not insured or guaranteed by the Federal Deposit Insurance Corporation or any other government agency. Although the Portfolio seeks to preserve the value of your investment at $1.00 per share, it is possible to lose money by investing in the Portfolio.
Useful Information About Your Portfolio Report
Portfolio Expenses
We believe it's important for our shareholders to have a clear understanding of Portfolio expenses and the impact they have on investment return.
The following is important information regarding the Portfolio's Expense Example, which appears on page 2 of this Annual Report. Please refer to this information when reviewing the Expense Example for the Portfolio.
Example
As a shareholder of a Portfolio, you incur two types of costs: (1) transaction costs, including redemption fees (where applicable) (and any related exchange fees) and (2) ongoing costs, including management fees and other Portfolio expenses. The example is intended to help you understand your ongoing costs (in dollars) of investing in a Portfolio and to compare these costs with the ongoing costs of investing in other mutual funds. To do so, compare this 5% hypothetical example with the 5% hypothetical examples that appear in the shareholder reports of the other funds. The example is based upon an investment of $1,000 invested at the beginning of the period and held for the six-month period from July 1, 2007 to December 31, 2007.
Actual Expenses
The first line of the table in each example provides information about actual account values and actual expenses. You may use the information in this line, together with the amount you invested, to estimate the expenses that you paid over the period. Simply divide your account value by $1,000 (for example, an $8,600 account value divided by $1,000 = 8.6), then multiply the result by the number in the first line under the heading entitled "Expenses Paid During Period" to estimate the expenses you paid on your account during the period.
Hypothetical Example for Comparison Purposes
The second line of the table in each example provides information about hypothetical account values and hypothetical expenses based upon the Portfolio's actual expense ratio and an assumed rate of return of 5% per year before expenses, which is not the Portfolio's actual return. The hypothetical account values and expenses may not be used to estimate the actual ending account balance or expenses you paid for the period. You may use this information to compare the ongoing costs of investing in the Portfolio and other funds. To do so, compare this 5% hypothetical example with the 5% hypothetical examples that appear in the shareholder reports of the other funds.
Janus Capital Management LLC ("Janus Capital") has agreed to waive one-half of its advisory fee for the Portfolio. Such waiver is voluntary and could change or be terminated at any time at the discretion of Janus Capital. Expenses in the examples reflect application of these waivers. Had the waivers not been in effect, your expenses would have been higher. More information regarding the waivers is available in the Portfolio's prospectus.
Please note that the expenses shown in the tables are meant to highlight your ongoing costs only and do not reflect any transaction costs, such as redemption fees (where applicable) and any charges at the separate account level or contract level. Redemption fees are fully described in the prospectus. Therefore, the second line of each table is useful in comparing ongoing costs only, and will not help you determine the relative total costs of owning different funds. In addition, if these transaction costs and separate account or contract level charges were included, your costs would have been higher.
Janus Aspen Series December 31, 2007 1
Janus Aspen Money Market
Portfolio (unaudited)
Eric Thorderson
co-portfolio manager
Craig Jacobson
co-portfolio manager
| Average Annual Total Return For the periods ended December 31, 2007 | |||||||
| Institutional Shares | |||||||
| 1 Year | 4.87 | % | |||||
| 5 Year | 2.88 | % | |||||
| 10 Year | 3.68 | % | |||||
| Since Inception (May 1, 1995) | 3.99 | % | |||||
| Expense Ratios For the fiscal year ended December 31, 2006 | |||||||
| Institutional Shares | |||||||
| Total Annual Fund Operating Expenses | 1.34 | % | |||||
Data presented represents past performance, which is no guarantee of future results. Current performance may be higher or lower than the performance shown. Call 877.33JANUS or visit www.janus.com/info for performance current to the most recent month-end.
An investment in a money market fund is not insured or guaranteed by the Federal Deposit Insurance Corporation or any other government agency. Although the Portfolio seeks to preserve the value of your investment at $1.00 per share, it is possible to lose money by investing in the Portfolio.
Janus Capital has agreed to waive the Portfolio's total operating expenses (excluding brokerage commissions, interest, taxes, and extraordinary expenses) to the extent the Portfolio's Total Annual Fund Operating Expenses exceed 0.50%. Such waiver is voluntary and could change or be terminated at any time at the discretion of Janus Capital. Returns shown include fee waivers, if any, and without such waivers, the Portfolio's yield and returns would have been lower.
These returns do not reflect the charges and expenses of any particular insurance product or qualified plan. Returns shown would have been lower had they included insurance charges.
Returns include reinvestment of dividends from net investment income and distributions from capital gains.
The yield more closely reflects the current earnings of Money Market Portfolio than the returns.
Effective April 16, 2007, Craig Jacobson became Co-Portfolio Manager of Money Market Portfolio.
See Notes to Schedule of Investments and Financial Statements.
See "Explanations of Charts, Tables and Financial Statements."
Portfolio Expenses
The example below shows you the ongoing costs (in dollars) of investing in your Portfolio and allows you to compare these costs with those of other mutual funds. Please refer to the section Useful Information About Your Portfolio Report for a detailed explanation of the information presented in this chart.
| Expense Example - Institutional Shares | Beginning Account Value (7/1/07) | Ending Account Value (12/31/07) | Expenses Paid During Period (7/1/07-12/31/07)(1) | ||||||||||||
| Actual | $ | 1,000.00 | $ | 1023.60 | $ | 2.55 | |||||||||
| Hypothetical (5% return before expenses) | $ | 1,000.00 | $ | 1022.68 | $ | 2.55 | |||||||||
(1) Expenses are equal to the annualized expense ratio of 0.50% for Institutional Shares multiplied by the average account value over the period, multiplied by 184/365 (to reflect the one-half year period). Expenses include the effect of contractual waivers by Janus Capital.
See Notes to Schedule of Investments and Financial Statements.
2 Janus Aspen Series December 31, 2007
Janus Aspen Money Market Portfolio
Schedule of Investments
As of December 31, 2007
| Principal Amount | Value | ||||||||||
| Commercial Paper - 36.0% | |||||||||||
| $ | 505,000 | Aquinas Funding LLC 5.35%, 3/20/08 (Section 4(2)) | $ | 499,071 | |||||||
| 515,000 | Bryant Park Funding LLC 5.40%, 1/31/08 (Section 4(2)) | 512,682 | |||||||||
| 1,000,000 | Federal Home Loan Discount Note 4.315%, 1/30/08 (Section 4(2)) | 996,524 | |||||||||
| 500,000 | Giro Balanced Funding Corp. 5.15%, 1/24/08 (Section 4(2)) | 498,355 | |||||||||
| 505,000 | Gotham Funding Corp. 6.00%, 1/25/08 (Section 4(2)) | 502,980 | |||||||||
| 515,000 | La Fayette Asset Securitization LLC 5.50%, 1/31/08 (Section 4(2)) | 512,640 | |||||||||
| 500,000 | Lexington Parker Capital LLC 5.25%, 1/17/08 (Section 4(2)) | 498,833 | |||||||||
| 500,000 | Manhattan Asset Funding Company LLC 5.21%, 1/15/08 (Section 4(2)) | 498,987 | |||||||||
| 515,000 | Morrigan TRR Funding LLC 5.50%, 2/4/08 (144A) | 512,325 | |||||||||
| 500,000 | Scaldis Capital LLC 5.00%, 1/24/08 (Section 4(2)) | 498,403 | |||||||||
| 505,000 | Ticonderoga Funding LLC 5.25%, 2/8/08 (144A) | 502,201 | |||||||||
| Total Commercial Paper (amortized cost $6,033,001) | 6,033,001 | ||||||||||
| Floating Rate Notes - 11.9% | |||||||||||
| 300,000 | Anaheim California Housing Authority Multifamily Housing Revenue (Cobblestone) 5.17%, due 7/15/33 | 300,000 | |||||||||
| 400,000 | California Infrastructure and Economic Development, 5.05%, 7/1/33 | 400,000 | |||||||||
| 225,000 | California Statewide Communities Development Authority, 5.17%, 3/15/33 | 225,000 | |||||||||
| 810,000 | Medical Properties, Inc., North Dakota (Dakota Clinic Project), 5.51%, 12/22/24 | 810,000 | |||||||||
| 250,000 | Sacramento California Redevelopment Agency, 5.17%, 1/15/36 | 250,000 | |||||||||
| Total Floating Rate Notes (amortized cost $1,985,000) | 1,985,000 | ||||||||||
| Repurchase Agreements - 29.9% | |||||||||||
| 4,100,000 | Lehman Brothers, Inc. dated 12/31/07, maturing 1/2/08 to be repurchased at $4,100,626 collateralized by $5,134,840 in U.S. Government Agencies 5.00%, 10/1/35 with a value of $4,182,097 (cost $4,100,000) | 4,100,000 | |||||||||
| 900,000 | UBS Financial Services, Inc. dated 12/31/07, maturing 1/2/08 to be repurchased at $900,225 collateralized by $1,074,605 in U.S. Government Agencies 0%, 5/15/36 - 4/15/37 with a value of $918,020 (cost $900,00) | 900,000 | |||||||||
| Total Repurchase Agreements (amortized cost $5,000,000) | 5,000,000 | ||||||||||
| Principal Amount | Value | ||||||||||
| Taxable Variable Rate Demand Notes - 4.6% | |||||||||||
| $ | 200,000 | Anaheim California Housing Authority Multifamily Housing Revenue (Cobblestone) 5.17%, 3/15/33 | $ | 200,000 | |||||||
| 570,000 | Arapahoe County, Colorado, Industrial Development Revenue, (Cottrell) Series B, 5.07%, 10/1/19 | 570,000 | |||||||||
| Total Taxable Variable Rate Demand Notes (amortized cost $770,000) | 770,000 | ||||||||||
| U.S Government Agency Notes - 17.7% | |||||||||||
| 1,000,000 | Federal Home Loan Discount Note 4.55%, 4/16/08 | 986,603 | |||||||||
| Freddie Mac: | |||||||||||
| 1,000,000 | 4.235%, 3/10/08 | 991,883 | |||||||||
| 1,000,000 | 4.15%, 6/16/08 | 980,749 | |||||||||
| Total U.S Government Agency Notes (amortized cost $2,959,235) | 2,959,235 | ||||||||||
| Total Investments (total amortized cost $16,747,236) – 100.1% | 16,747,236 | ||||||||||
| Liabilities, net of Cash, Receivables and Other Assets – (0.1)% | (17,468 | ) | |||||||||
| Net Assets – 100% | $ | 16,729,768 | |||||||||
See Notes to Schedule of Investments and Financial Statements.
Janus Aspen Series December 31, 2007 3
Statement of Assets and Liabilities
| As of December 31, 2007 (all numbers in thousands except net asset value per share) | Janus Aspen Money Market Portfolio | ||||||
| Assets: | |||||||
| Investments at amortized cost | $ | 11,747 | |||||
| Repurchase agreements | 5,000 | ||||||
| Cash | 34 | ||||||
| Receivables: | |||||||
| Interest | 14 | ||||||
| Due from adviser | 14 | ||||||
| Non-interested Trustees' deferred compensation | – | ||||||
| Other assets | – | ||||||
| Total Assets | 16,809 | ||||||
| Liabilities: | |||||||
| Payables: | |||||||
| Portfolio shares repurchased | 30 | ||||||
| Dividends and Distributions | 2 | ||||||
| Advisory fees | 4 | ||||||
| Printing expenses | 14 | ||||||
| Professional fees | 14 | ||||||
| Transfer agent fees and expenses | – | ||||||
| System fees | 5 | ||||||
| Legal fees | 6 | ||||||
| Non-interested Trustees' fees and expenses | 1 | ||||||
| Non-interested Trustees' deferred compensation fees | – | ||||||
| Accrued expenses | 3 | ||||||
| Total Liabilities | 79 | ||||||
| Net Assets | $ | 16,730 | |||||
| Net Assets Consist of: | |||||||
| Capital (par value and paid-in-surplus)* | $ | 16,726 | |||||
| Undistributed net investment income/(loss)* | – | ||||||
| Undistributed net realized gain/(loss) from investments* | 4 | ||||||
| Unrealized appreciation/(depreciation) of non-interested Trustees' deferred compensation | – | ||||||
| Total Net Assets | $ | 16,730 | |||||
| Net Assets - Institutional Shares | $ | 16,730 | |||||
| Shares Outstanding, $0.001 Par Value (unlimited shares authorized) | 16,726 | ||||||
| Net Asset Value Per Share - Institutional | $ | 1.00 | |||||
*See Note 3 in Notes to Financial Statements.
See Notes to Financial Statements.
4 Janus Aspen Series December 31, 2007
Statement of Operations
| For the fiscal year ended December 31, 2007 (all numbers in thousands) | Janus Aspen Money Market Portfolio | ||||||
| Investment Income: | |||||||
| Interest | $ | 813 | |||||
| Total Investment Income | 813 | ||||||
| Expenses: | |||||||
| Advisory fees | 39 | ||||||
| Transfer agent fees and expenses | 3 | ||||||
| Registration fees | 16 | ||||||
| Custodian fees | 7 | ||||||
| Professional fees | 10 | ||||||
| Non-interested Trustees' fees and expenses | 5 | ||||||
| System fees | 16 | ||||||
| Legal fees | 6 | ||||||
| Printing expenses | 41 | ||||||
| Other expenses | 6 | ||||||
| Non-recurring costs (Note 2) | – | ||||||
| Costs assumed by Janus Capital Management LLC (Note 2) | – | ||||||
| Total Expenses | 149 | ||||||
| Expense and Fee Offset | – | ||||||
| Net Expenses | 149 | ||||||
| Less: Excess Expense Reimbursement | (72 | ) | |||||
| Net Expenses after Expense Reimbursement | 77 | ||||||
| Net Investment Income/(Loss) | 736 | ||||||
| Net Realized Gain/(Loss) on Investments: | |||||||
| Net realized gain/(loss) from securities transactions | 4 | ||||||
| Net Gain/(Loss) on Investments | 4 | ||||||
| Net Increase/(Decrease) in Net Assets Resulting from Operations | $ | 740 | |||||
See Notes to Financial Statements.
Janus Aspen Series December 31, 2007 5
Statements of Changes in Net Assets
| For the fiscal years ended December 31 | Janus Aspen Money Market Portfolio | ||||||||||
| (all numbers in thousands) | 2007 | 2006 | |||||||||
| Operations: | |||||||||||
| Net investment income/(loss) | $ | 736 | $ | 573 | |||||||
| Net realized gain/(loss) from investments transactions | 4 | – | |||||||||
| Net Increase/(Decrease) in Net Assets Resulting from Operations | 740 | 573 | |||||||||
| Dividends and Distributions to Shareholders: | |||||||||||
| Net investment income* | |||||||||||
| Institutional Shares | (736 | ) | (573 | ) | |||||||
| Net realized gain/(loss) from investment transactions* | |||||||||||
| Institutional Shares | – | – | |||||||||
| Net Decrease from Dividends and Distributions | (736 | ) | (573 | ) | |||||||
| Capital Share Transactions: | |||||||||||
| Shares sold | |||||||||||
| Institutional Shares | 18,365 | 10,535 | |||||||||
| Reinvested dividends and distributions | |||||||||||
| Institutional Shares | 736 | 571 | |||||||||
| Shares repurchased | |||||||||||
| Institutional Shares | (14,831 | ) | (9,010 | ) | |||||||
| Net Increase/(Decrease) from Capital Share Transactions | 4,270 | 2,096 | |||||||||
| Net Increase/(Decrease) in Net Assets | 4,274 | 2,096 | |||||||||
| Net Assets: | |||||||||||
| Beginning of period | 12,456 | 10,360 | |||||||||
| End of period | $ | 16,730 | $ | 12,456 | |||||||
| Undistributed net investment income/(loss)* | $ | – | $ | – | |||||||
*See Note 3 in Notes to Financial Statements.
See Notes to Financial Statements.
6 Janus Aspen Series December 31, 2007
Financial Highlights
Institutional Shares
| For a share outstanding during each | Janus Aspen Money Market Portfolio | ||||||||||||||||||||||
| fiscal year ended December 31 | 2007 | 2006 | 2005 | 2004 | 2003 | ||||||||||||||||||
| Net Asset Value, Beginning of Period | $ | 1.00 | $ | 1.00 | $ | 1.00 | $ | 1.00 | $ | 1.00 | |||||||||||||
| Income from Investment Operations: | |||||||||||||||||||||||
| Net investment income/(loss) | .05 | .05 | .03 | .01 | .01 | ||||||||||||||||||
| Net gain/(loss) on securities | – | – | – | – | – | ||||||||||||||||||
| Total from Investment Operations | .05 | .05 | .03 | .01 | .01 | ||||||||||||||||||
| Less Distributions: | |||||||||||||||||||||||
| Dividends (from net investment income)* | (.05 | ) | (.05 | ) | (.03 | ) | (.01 | ) | (.01 | ) | |||||||||||||
| Distributions (from capital gains)* | – | – | – | – | – | ||||||||||||||||||
| Total Distributions | (.05 | ) | (.05 | ) | (.03 | ) | (.01 | ) | (.01 | ) | |||||||||||||
| Net Asset Value, End of Period | $ | 1.00 | $ | 1.00 | $ | 1.00 | $ | 1.00 | $ | 1.00 | |||||||||||||
| Total Return | 4.87 | % | 4.73 | % | 2.94 | % | 1.09 | % | 0.86 | % | |||||||||||||
| Net Assets, End of Period (in thousands) | $ | 16,730 | $ | 12,456 | $ | 10,360 | $ | 12,138 | $ | 20,761 | |||||||||||||
| Average Net Assets for the Period (in thousands) | $ | 15,501 | $ | 12,305 | $ | 12,086 | $ | 14,396 | $ | 31,124 | |||||||||||||
| Ratio of Gross Expenses to Average Net Assets(1) | 0.50 | % | 0.50 | % | 0.50 | % | 0.50 | % | 0.50 | % | |||||||||||||
| Ratio of Net Expenses to Average Net Assets(1) | 0.50 | % | 0.50 | % | 0.50 | % | 0.50 | % | 0.50 | % | |||||||||||||
| Ratio of Net Investment Income/(Loss) to Average Net Assets | 4.75 | % | 4.65 | % | 2.87 | % | 1.04 | % | 0.87 | % | |||||||||||||
*See Note 3 in Notes to Financial Statements.
(1) See Note 4 in Notes to Financial Statements.
See Notes to Financial Statements.
Janus Aspen Series December 31, 2007 7
Notes to Schedule of Investments
| 144 | A | Securities sold under Rule 144A of the Securities Act of 1933, as amended, are subject to legal and/or contractual restrictions on resale and may not be publicly sold without registration under the 1933 Act. | |||||
| Section 4(2) | Securities subject to legal and/or contractual restrictions on resale and may not be publicly sold without registration under the Securities Act of 1933. | ||||||
The interest rate on floating rate notes is based on an index or market interest rates and is subject to change. Rates in the security description are as of December 31, 2007.
Money market portfolios may hold securities with stated maturities of greater than 397 days when those securities have features that allow a Portfolio to "put" back the security to the issuer or to a third party within 397 days of acquisition. The maturity dates shown in the security descriptions are the stated maturity dates.
Repurchase agreements held by the Portfolio are fully collateralized, and such collateral is in the possession of the Portfolio's custodian or subcustodian. The collateral is evaluated daily to ensure its market value equals or exceeds the current market value of the repurchase agreements, including accrued interest. In the event of default on the obligation to repurchase, the Portfolio has the right to liquidate the collateral and apply the proceeds in satisfaction of the obligation. In the event of default or bankruptcy by the other party to the agreement, realization and/or retention of the collateral or proceeds may be subject to legal proceedings.
8 Janus Aspen Series December 31, 2007
Notes to Financial Statements
The following section describes the organization and significant accounting policies and provides more detailed information about the schedules and tables that appear throughout this report. In addition, the Notes to Financial Statements explain the methods used in preparing and presenting this report.
1. ORGANIZATION AND SIGNIFICANT ACCOUNTING POLICIES
Janus Aspen Money Market Portfolio (the "Portfolio") is a series fund. The Portfolio is part of Janus Aspen Series (the "Trust"), which is organized as a Delaware statutory trust and is registered under the Investment Company Act of 1940, as amended, (the "1940 Act") as an open-end management investment company. The Trust offers seventeen Portfolios, which include multiple series of shares, with differing investment objectives and policies. The Portfolio invests in short-term money market securities. The Portfolio is classified as diversified, as defined in the 1940 Act. The Portfolio is a no-load investment.
The Portfolio currently offers one class of shares: Institutional Shares. Institutional Shares are offered only in connection with investment in and payments under variable insurance contracts and to qualified retirement plans.
The following accounting policies have been consistently followed by the Portfolio and are in conformity with accounting principles generally accepted in the United States of America in the investment company industry.
Investment Valuation
Investments held by the Portfolio with maturities over 60 days are valued at market value. Short-term securities with maturities of 60 days or less are valued utilizing the amortized cost method of valuation permitted in accordance with Rule 2a-7 under the 1940 Act and certain conditions therein. Under the amortized cost method, which does not take into account unrealized capital gains or losses, an instrument is initially valued at its cost and thereafter assumes a constant accretion/amortization to maturity of any discount or premium. If management believes that such valuation does not reflect the securities' fair value, these securities may be valued at fair value as determined in good faith under procedures established by the Portfolio's Trustees. Circumstances in which fair value pricing may be utilized include, but are not limited to: (i) when significant events occur which may affect the securities of a single issuer, such as mergers , bankruptcies, or significant issuer specific developments; (ii) when significant events occur which may affect an entire market, such as natural disasters or significant governmental actions; and (iii) when non-significant events occur such as markets closing early or not opening, security trading halts, or pricing of non-valued securities and restricted or nonpublic securities. Restricted and illiquid securities are valued in accordance with procedures established by the Portfolio's Trustees.
Investment Transactions and Investment Income
Investment transactions are accounted for as of the date purchased or sold (trade date). Dividend income is recorded on the ex-dividend date. Certain dividends from foreign securities will be recorded as soon as the Trust is informed of the dividend if such information is obtained subsequent to the ex-dividend date. Dividends from foreign securities may be subject to withholding taxes in foreign jurisdictions. Interest income is recorded on the accrual basis and includes amortization of premiums and accretion of discounts. Gains and losses are determined on the identified cost basis, which is the same basis used for federal income tax purposes.
Expenses
The Portfolio bears expenses incurred specifically on its behalf as well as a portion of general expenses, which may be allocated pro rata to the Portfolio.
Interfund Lending
Pursuant to an exemptive order received from the Securities and Exchange Commission ("SEC"), the Portfolio may be party to an interfund lending agreement between the Portfolio and other Janus Capital sponsored mutual funds, which permits it to borrow or lend cash at a rate beneficial to both the borrowing and lending funds. Outstanding borrowings from all sources totaling 10% or more of the borrowing Portfolio's total assets must be collateralized at 102% of the outstanding principal value of the loan; loans of less than 10% may be unsecured. During the fiscal year ended December 31, 2007, there were no outstanding interfund borrowing or lending arrangements for the Portfolio.
When-issued Securities
The Portfolio may purchase or sell securities on a when-issued or forward commitment basis. The price of the underlying securities and date when the securities will be delivered and paid for are fixed at the time the transaction is negotiated. Losses may arise due to changes in the market value of the securities or from the inability of counterparties to meet the terms of the contract. In connection with such purchases, the Portfolio may hold liquid assets as collateral with the Portfolio's custodian sufficient to cover the purchase price. As of December 31, 2007, the Portfolio was not invested in when-issued securities.
Restricted Security Transactions
Restricted securities held by the Portfolio may not be sold except in exempt transactions or in a public offering registered under the Securities Act of 1933. The risk of investing in such securities is generally greater than the risk of investing in the securities of widely held, publicly traded companies. Lack of a
Janus Aspen Series December 31, 2007 9
Notes to Financial Statements (continued)
secondary market and resale restrictions may result in the inability of the Portfolio to sell a security at a fair price and may substantially delay the sale of the security. In addition, these securities may exhibit greater price volatility than securities for which secondary markets exist. As of December 31, 2007, the Portfolio was invested in restricted securities.
Dividend Distributions
Dividends representing substantially all of the Portfolio's net investment income and any net realized capital gains on sales of securities are declared daily and generally distributed monthly. The majority of dividends and capital gains distributions from the Portfolio will be automatically reinvested into additional shares of the Portfolio, based upon the discretion of the shareholder.
Estimates
The preparation of financial statements in conformity with accounting principles generally accepted in the United States of America requires management to make estimates and assumptions that affect the reported amount of assets and liabilities and disclosure of contingent assets and liabilities at the date of the financial statements, and the reported amounts of income and expenses during the reporting period. Actual results could differ from those estimates.
Federal Income Taxes
No provision for income taxes is included in the accompanying financial statements, as the Portfolio intends to distribute to shareholders all taxable investment income and realized gains and otherwise comply with Subchapter M of the Internal Revenue Code applicable to regulated investment companies.
New Accounting Pronouncements
In July 2006, the Financial Accounting Standards Board ("FASB") issued Interpretation No. 48, "Accounting for Uncertainty in Income Taxes – an Interpretation of FASB Statement No. 109" (the "Interpretation"). The Interpretation establishes for all entities, including pass-through entities such as the Portfolio, a minimum threshold for financial statement recognition of the benefit of positions taken in filing tax returns (including whether an entity is taxable in a particular jurisdiction), and requires certain expanded tax disclosures. A calendar year open-end or closed-end fund was required to implement the Interpretation no later than June 29, 2007 (the last business day of the semi-annual reporting period), and the Interpretation also applies to all open tax years as of the date of effectiveness. Management has evaluated the application of the Interpretation to the Portfolio and has determined there is no significant impact on the P ortfolio's financial statements.
In September 2006, the FASB issued Statement of Financial Accounting Standards No. 157, "Fair Value Measurements" ("SFAS No. 157"), which defines fair value, establishes a framework for measuring fair value in generally accepted accounting principles, and expands disclosures about fair value measurements. SFAS No. 157 does not require new fair value measurements, but is applied to the extent that other accounting pronouncements require or permit fair value measurements. SFAS No. 157 emphasizes that fair value is a market-based measurement that should be determined based on the assumptions that market participants would use in pricing an asset or liability. SFAS No. 157 is effective for fiscal years beginning after November 15, 2007 and interim periods within those fiscal years. Management does not believe the adoption of SFAS No. 157 will impact the financial statement a mounts, however, the Portfolio will be required to disclose the extent to which fair value is used to measure assets and liabilities and the inputs used to develop the measurements.
2. INVESTMENT ADVISORY AGREEMENTS AND OTHER TRANSACTIONS WITH AFFILIATES
The Portfolio pays a monthly advisory fee to Janus Capital based upon average daily net assets and calculated at the annual rate of 0.25%.
Janus Capital has agreed to waive the Portfolio's total operating expenses (excluding brokerage commissions, interest, taxes and extraordinary expenses) to the extent the Portfolio's Total Annual Fund Operating Expenses exceed 0.50%. Such waiver is voluntary and could change or be terminated at any time at the discretion of Janus Capital. The Portfolio is not required to repay any such waived fees in future years to Janus Capital.
Janus Services LLC ("Janus Services"), a wholly-owned subsidiary of Janus Capital, is the Portfolio's transfer agent. Janus Services receives certain out-of-pocket expenses for transfer agent services.
Certain officers of the Portfolio may also be officers and/or directors of Janus Capital. Such officers receive no compensation from the Portfolio, except for the Portfolio's Chief Compliance Officer. Effective January 1, 2006, the Portfolio began reimbursing the adviser for a portion of the compensation paid to the Chief Compliance Officer of the Trust. Total compensation of $3,078 was paid by the Portfolio during the fiscal year ended December 31, 2007. The Portfolio's portion is reported as part of "Other Expenses" on the Statement of Operations.
The Board of Trustees has adopted a deferred compensation plan (the "Deferred Plan") for independent Trustees to elect to defer receipt of all or a portion of the annual compensation they are entitled to receive from the Portfolio. All deferred fees are credited to an account established in the name of the Trustees. The amounts credited to the account then increase or decrease, as the case may be, in accordance
10 Janus Aspen Series December 31, 2007
with the performance of one or more of the Janus funds that are selected by the Trustees. The account balance continues to fluctuate in accordance with the performance of the selected fund or funds until final payment of all amounts credited to the account. The fluctuation of the account balance is recorded by the Portfolio as unrealized appreciation/(depreciation) and is shown as of December 31, 2007 on the Statement of Assets and Liabilities as an asset, "Non-interested Trustees' deferred compensation," and a liability, "Non-interested Trustees' deferred compensation fees." Additionally, the recorded unrealized appreciation/(depreciation) is included in "Unrealized net appreciation/(depreciation) of investments and non-interested Trustees' deferred compensation" on the Statement of Assets and Liabilities. Deferred compensation expenses for the fiscal year ended December 31, 2007 are included in "Non-interested Trustees' fees and expenses" on the Statement of Operations. Trustees are allowed to change their designation of mutual funds from time to time. Amounts will be deferred until distributed in accordance with the Deferred Plan. No deferred fees were paid to any Trustee under the Deferred Plan during the fiscal year ended December 31, 2007.
For the fiscal year ended December 31, 2007, Janus Capital assumed $24,421 of legal, consulting and Trustee costs and fees incurred by the funds in Janus Investment Fund, Janus Aspen Series and Janus Adviser Series (the "Funds") in connection with the regulatory and civil litigation matters discussed in Note 6. These non-recurring costs were allocated to all Funds based on the Funds' respective net assets as of July 31, 2004. Additionally, all future non-recurring costs will be allocated to the Funds based on the Funds' respective net assets on July 31, 2004. These "Non-recurring costs" and "Costs assumed by Janus Capital" are shown on the Statement of Operations.
Janus Distributors LLC, a wholly-owned subsidiary of Janus Capital, is a distributor of the Portfolio.
The Portfolio's expenses may be reduced by expense offsets from an unaffiliated transfer agent. Such credits or offsets are included in "Expense and Fee Offset" on the Statement of Operations. The transfer agent fee offsets received during the period reduce Transfer Agent Fees and Expenses. The Portfolio could have employed the assets used by the transfer agent to produce income if it had not entered into an expense offset arrangement.
3. FEDERAL INCOME TAX
"Income and capital gains distributions are determined in accordance with income tax regulations that may differ from accounting principles generally accepted in the United States of America. These differences are due to differing treatments for items such as net short-term gains."
| Undistributed Ordinary Income | Undistributed Long-Term Gains | Accumulated Capital Losses | Other Book to Tax Differences | Net Tax Appreciation/ (Depreciation) | |||||||||||||||||||
| Janus Aspen Money Market Portfolio | $ | – | $ | – | $ | – | $ | – | $ | – | |||||||||||||
| For the fiscal year ended December 31, 2007 | Distributions | ||||||||||||||||||
| From Ordinary Income | From Long-Term Capital Gains | Tax Return of Capital | Net Investment Loss | ||||||||||||||||
| Janus Aspen Money Market Portfolio | $ | 735,908 | $ | – | $ | – | $ | – | |||||||||||
| For the fiscal year ended December 31, 2006 | Distributions | ||||||||||||||||||
| From Ordinary Income | From Long-Term Capital Gains | Tax Return of Capital | Net Investment Loss | ||||||||||||||||
| Janus Aspen Money Market Portfolio | $ | 570,866 | $ | – | $ | – | $ | – | |||||||||||
Janus Aspen Series December 31, 2007 11
Notes to Financial Statements (continued)
4. EXPENSE RATIOS
The expense ratios listed in the Financial Highlights reflect expenses prior to any expense offsets (gross expense ratio) and after expense offsets (net expense ratio). Both expense ratios reflect expenses after waivers (reimbursement). Listed below are the gross expense ratios for the Portfolio that would have been in effect, absent the waiver of certain fees and offsets.
| For each fiscal year ended December 31 | Institutional Shares | ||||||||||||||||||||||
| Portfolio | 2007(1) | 2006(1) | 2005(1) | 2004(1) | 2003 | ||||||||||||||||||
| Janus Aspen Money Market Portfolio | 0.97 | % | 1.34 | % | 0.86 | % | 0.98 | % | 0.78 | % | |||||||||||||
(1) The effect of non-recurring costs assumed by Janus Capital (Note 2) is included in the ratio of operating expenses to average net assets without waivers and/or expense reimbursements and was less than 0.01%.
5. CAPITAL SHARE TRANSACTIONS
| For each fiscal year ended December 31 (all numbers in thousands) | Janus Aspen Money Market Portfolio | ||||||||||
| 2007 | 2006 | ||||||||||
| Transactions in Portfolio Shares - Institutional Shares | |||||||||||
| Shares sold | 18,365 | 10,535 | |||||||||
| Reinvested dividends and distributions | 736 | 571 | |||||||||
| Shares repurchased | (14,831 | ) | (9,010 | ) | |||||||
| Net Increase/(Decrease) in Portfolio Shares | 4,270 | 2,096 | |||||||||
| Shares Outstanding, Beginning of Period | 12,456 | 10,360 | |||||||||
| Shares Outstanding, End of Period | 16,726 | 12,456 | |||||||||
6. PENDING LEGAL MATTERS
In the fall of 2003, the Securities and Exchange Commission ("SEC"), the Office of the New York State Attorney General ("NYAG"), the Colorado Attorney General ("COAG"), and the Colorado Division of Securities ("CDS") announced that they were investigating alleged frequent trading practices in the mutual fund industry. On August 18, 2004, Janus Capital announced that it had reached final settlements with the SEC, the NYAG, the COAG, and the CDS related to such regulators' investigations into Janus Capital's frequent trading arrangements.
A number of civil lawsuits were brought against Janus Capital and certain of its affiliates, the Janus funds, and related entities and individuals based on allegations similar to those announced by the above regulators and were filed in several state and federal jurisdictions. Such lawsuits alleged a variety of theories for recovery including, but not limited to, the federal securities laws, other federal statutes (including ERISA), and various common law doctrines. The Judicial Panel on Multidistrict Litigation transferred these actions to the U.S. District Court for the District of Maryland (the "Court") for coordinated proceedings. On September 29, 2004, five consolidated amended complaints were filed with the Court that generally include: (i) claims by a putative class of investors in certain Janus funds asserting claims on behalf of the investor class (Marini, et al. v. Janus Investment Fund, et al., U.S. District Court, District of Maryland, Case No. 04-CV-00497); (ii) derivative claims by investors in certain Janus funds ostensibly on behalf of such funds (Steinberg et al. v. Janus Capital Management, LLC et al., U.S. District Court, District of Maryland, Case No. 04-CV-00518); (iii) claims on behalf of participants in the Janus 401(k) plan (Wangberger v. Janus Capital Group Inc., 401(k) Advisory Committee, et al., U.S. District Court, District of Maryland, Case No. JFM-05-2711); (iv) claims brought on behalf of shareholders of Janus Capital Group Inc. ("JCGI") on a derivative basis against the Board of Directors of JCGI (Chasen v. Whiston, et al., U.S. District Court, District of Maryland, Case No. 04-MD-00855); and (v) claims by a putative class of shareholders of JCGI asserting claims on behalf of the shareholders (Wiggins, et al. v. Janus Capital Group, Inc., et al., U.S. District Court, District of Maryland, Case No. 04-CV-0081 8). Each of the five complaints initially named JCGI and/or Janus Capital as a defendant. In addition, the following were also named as defendants in one or more of the actions: Janus Investment Fund ("JIF"), Janus Aspen Series ("JAS"), Janus Adviser Series ("JAD"), Janus Distributors LLC, Enhanced Investment Technologies, LLC ("INTECH"), Bay Isle Financial LLC ("Bay Isle"), Perkins, Wolf, McDonnell and Company, LLC ("Perkins"), the Advisory Committee of the Janus 401(k) plan, and the current or former directors of JCGI.
On August 25, 2005, the Court entered orders dismissing most of the claims asserted against Janus Capital and its affiliates by fund investors in the Marini and Steinberg cases (actions (i) and (ii) above) except certain claims under Section 10(b) of the Securities Exchange Act of 1934 and under Section 36(b) of the Investment Company Act of 1940,
12 Janus Aspen Series December 31, 2007
as amended (the "1940 Act"). On August 15, 2006, the Wangberger complaint in the 401(k) plan class action (action (iii) above) was dismissed by the district court with prejudice. The plaintiff appealed that dismissal decision to the United States Court of Appeals for the Fourth Circuit. The appeal is still pending and argument in the matter was held in December 2007. The Court also dismissed the Chasen lawsuit (action (iv) above) against JCGI's Board of Directors without leave to amend. Finally, a Motion to Dismiss the Wiggins suit (action (v) above) was granted and the matter was dismissed in May 2007. However, in June 2007, Plaintiffs appealed that dismissal to the United States Court of Appeals for the Fourth Circuit. That appeal is currently pending.
In addition to the lawsuits described above, the Auditor of the State of West Virginia ("Auditor"), in his capacity as securities commissioner, has initiated administrative proceedings against many of the defendants in the market timing cases (including JCGI and Janus Capital) and, as a part of its relief, is seeking disgorgement and other monetary relief based on similar market timing allegations (In the Matter of Janus Capital Group Inc. et al., Before the Securities Commissioner, State of West Virginia, Summary Order No. 05-1320). The respondents in these proceedings collectively sought a Writ of Prohibition in state court, which was denied. Their subsequent Petition for Appeal was also denied. Consequently, in September 2006, JCGI and Janus Capital filed their answer to the Auditor's summary order instituting proceedings and requested a hearing. A statu s conference was held on June 28, 2007, during which the parties were ordered to submit their proposed scheduling order. To date, no scheduling order has been entered in the case. In addition to the pending Motion to Discharge Order to Show Cause, JCGI and Janus Capital, as well as other similarly situated defendants, continue to challenge the statutory authority of the Auditor to bring such an action.
Additional lawsuits may be filed against certain of the Janus funds, Janus Capital, and related parties in the future. Janus Capital does not currently believe that these pending actions will materially affect its ability to continue providing services it has agreed to provide to the Janus funds.
Janus Aspen Series December 31, 2007 13
Report of Independent Registered Public Accounting Firm
To the Trustees and Shareholders
of Janus Aspen Money Market Portfolio
In our opinion, the accompanying statement of assets and liabilities, including the schedule of investments, and the related statements of operations and of changes in net assets and the financial highlights present fairly, in all material respects, the financial position of Janus Aspen Money Market Portfolio (one of the portfolios constituting Janus Aspen Series, hereafter referred to as the "Portfolio") at December 31, 2007, the results of its operations for the year then ended, the changes in its net assets for each of the two years in the period then ended, and the financial highlights for each of the five years in the period then ended, in conformity with accounting principles generally accepted in the United States of America. These financial statements and financial highlights (hereafter referred to as "financial statements") are the responsibility of the Portfolio's management; our responsibility is to express an opinion on these fin ancial statements based on our audits. We conducted our audits of these financial statements in accordance with the standards of the Public Company Accounting Oversight Board (United States). Those standards require that we plan and perform the audit to obtain reasonable assurance about whether the financial statements are free of material misstatement. An audit includes examining, on a test basis, evidence supporting the amounts and disclosures in the financial statements, assessing the accounting principles used and significant estimates made by management, and evaluating the overall financial statement presentation. We believe that our audits, which included confirmation of securities at December 31, 2007 by correspondence with the custodian, transfer agent and brokers, and the application of alternative auditing procedures where securities purchased had not been received, provide a reasonable basis for our opinion.

Denver, Colorado
February 15, 2008
14 Janus Aspen Series December 31, 2007
Additional Information (unaudited)
PROXY VOTING POLICIES AND VOTING RECORD
A description of the policies and procedures that the Portfolio uses to determine how to vote proxies relating to its portfolio securities is available: (i) without charge, upon request, by calling 1-800-525-0020 (toll free); (ii) on the Portfolio's website at www.janus.com/proxyvoting; and (iii) on the SEC's website at http://www.sec.gov. Additionally, information regarding the Portfolio's proxy voting record for the most recent twelve-month period ended June 30 is also available, free of charge, through www.janus.com/proxyvoting and from the SEC's website at http://www.sec.gov.
QUARTERLY PORTFOLIO HOLDINGS
The Portfolio files its complete portfolio holdings (schedule of investments) with the SEC for the first and third quarters of each fiscal year on Form N-Q within 60 days of the end of such fiscal quarter. The Portfolio's Form N-Q: (i) is available on the SEC's website at http://www.sec.gov; (ii) may be reviewed and copied at the SEC's Public Reference Room in Washington, D.C. (information on the Public Reference Room may be obtained by calling 1-800-SEC-0330); and (iii) is available without charge, upon request, by calling Janus at 1-800-525-0020 (toll free).
APPROVAL OF ADVISORY AGREEMENTS DURING THE PERIOD
The Trustees of Janus Aspen Series, none of whom has ever been affiliated with Janus Capital ("Independent Trustees"), oversee the management of each Portfolio and, as required by law, determine annually whether to continue the investment advisory agreement for each Portfolio and the subadvisory agreements for the three Portfolios that utilize subadvisers.
In connection with their most recent consideration of those agreements for each Portfolio, the Trustees received and reviewed a substantial amount of information provided by Janus Capital and the respective subadvisers in response to requests of the Independent Trustees and their independent legal counsel. They also received and reviewed a considerable amount of information and analysis provided by their independent fee consultant. Throughout their consideration of the agreements, the Independent Trustees were advised by their independent legal counsel. The Independent Trustees met with management to consider the agreements, and also met separately in executive session with their independent legal counsel and their independent fee consultant.
At a meeting held on December 14, 2007, based on their evaluation of the information provided by Janus Capital, the subadvisers and the independent fee consultant, as well as other information, the Trustees determined that the overall arrangements between each Portfolio and Janus Capital and each subadviser, as applicable, were fair and reasonable in light of the nature, extent and quality of the services provided by Janus Capital, its affiliates and the subadvisers, the fees charged for those services, and other matters that the Trustees considered relevant in the exercise of their business judgment. At that meeting the Trustees unanimously approved the continuation of the investment advisory agreement for each Portfolio, and the subadvisory agreement for each subadvised Portfolio, for the period from February 1, 2008 through February 1, 2009, subject to earlier termina tion as provided for in each agreement.
In considering the continuation of those agreements, the Trustees reviewed and analyzed various factors that they determined were relevant, including the factors described below, none of which by itself was considered dispositive. However, the material factors and conclusions that formed the basis for the Trustees' determination to approve the continuation of the agreements are discussed separately below.
Nature, Extent and Quality of Services
The Trustees reviewed the nature, extent and quality of the services provided by Janus Capital and the subadvisers to the Portfolios, taking into account the investment objective and strategy of each Portfolio, the knowledge of the Trustees gained from their regular meetings with management on at least a quarterly basis, and their ongoing review of information related to the Portfolios. In addition, the Trustees reviewed the resources and key personnel of Janus Capital and each subadviser, especially those who provide investment management services to the Portfolios. The Trustees also considered other services provided to the Portfolios by Janus Capital or the subadvisers, such as managing the execution of portfolio transactions and the selection of broker-dealers for those transactions, serving as the Portfolios' administrator, monitoring adherence to the Portfolios' investment restrictions, producing shareholder reports, providing support services for the Trustees and Trustee committees, communicating with shareholders, and overseeing the activities of other service providers, including monitoring compliance with various policies and procedures of the Portfolios and with applicable securities laws and regulations.
The Trustees concluded that the nature, extent and quality of the services provided by Janus Capital and/or the subadviser to each Portfolio were appropriate and consistent with the terms of the respective advisory and subadvisory agreements; that, taking into account steps taken to address those Portfolios whose performance lagged that of the median of their peers for certain periods, the quality of those services had been consistent with or superior to quality norms in the industry; and that the Portfolios were likely to benefit from the continued provision of those services. They also concluded that Janus Capital and each subadviser had sufficient personnel, with the appropriate education and experience, to serve the Portfolios effectively and had demonstrated its continuing ability to attract well-qualified personnel.
Janus Aspen Series December 31, 2007 15
Additional Information (unaudited) (continued)
Performance of the Portfolios
The Trustees considered the investment results of each Portfolio over various time periods. They reviewed information comparing each Portfolio's performance with the performance of comparable funds and peer groups identified by Lipper Inc., an independent provider of investment company data, and with the Portfolio's benchmark index. They concluded that the performance of many Portfolios was good to very good under current market conditions. Although the performance of some Portfolios lagged that of the median of their peers for certain periods, the Trustees also concluded that Janus Capital had taken appropriate steps to address those instances of under-performance and that the more recent performance of most of those Portfolios had been improving.
Costs of Services Provided
The Trustees examined information on the fees and expenses of each Portfolio in comparison to similar information for comparable funds as provided by Lipper. They also reviewed an analysis of that information provided by their independent fee consultant and noted that the rate of management (investment advisory and administrative) fees for most of the Portfolios, in some cases after contractual expense limitations, was below the mean management fee rate of the respective peer group of funds selected by Lipper.
The Trustees considered the methodology used by Janus Capital and each subadviser in determining compensation payable to portfolio managers, the competitive environment for investment management talent and the competitive market for mutual funds in different distribution channels. They concluded that the compensation methodology provided a good alignment of the interests of the portfolio managers with those of Portfolio shareholders.
The Trustees also reviewed management fees charged by Janus Capital to its separate account clients and to its subadvised funds (for which Janus Capital provides only services related to portfolio management). Although in most instances subadvisory and separate account fee rates for various investment strategies were lower than management fee rates for Portfolios having a similar strategy, the Trustees noted that, under the terms of the management agreements with the Portfolios, Janus Capital performs significant additional services for the Portfolios that it does not provide to those other clients, including administrative services, oversight of the Portfolios' other service providers, Trustee support, regulatory compliance and numerous other services, and that, in serving the Portfolios, Janus Capital assumes many legal risks that it does not assume in servicing its other clients. Moreover, the Trustees noted that the spread between the av erage fee rates charged to the Portfolios and the fee rates that Janus Capital charged to its separate account clients was significantly smaller than the average spread for such fee rates of other advisers, based on publicly available data and research conducted by their independent fee consultant.
The Trustees reviewed information on the profitability to Janus Capital and its affiliates of their relationships with each Portfolio, as well as an explanation of the methodology used in allocating various expenses of Janus Capital and its affiliates among the Portfolios and other clients. They also reviewed the financial statements of Janus Capital's parent company and its corporate structure. In their review, the Trustees considered whether Janus Capital and each subadviser receives adequate incentives to manage the Portfolios effectively. They recognized that profitability comparisons among investment advisers are difficult because very little comparative information is publicly available and profitability of any adviser is affected by numerous factors, including the organizational structure of the particular adviser, the types of funds and other accounts it manages, possible other lines of business, the methodology for allocating expens es, and the adviser's capital structure and cost of capital. However, based on the information available and taking those factors into account, the Trustees concluded that Janus Capital's profitability with respect to each Portfolio in relation to the services rendered was not unreasonable.
The Trustees concluded that the management fees and other compensation payable by each Portfolio to Janus Capital and its affiliates, as well as the fees payable by Janus Capital or the Portfolios to the subadvisers of subadvised Portfolios, were reasonable in relation to the nature, extent and quality of the services provided, taking into account the fees charged by other advisers for managing comparable mutual funds with similar strategies and the fees Janus Capital and the subadvisers charge to other clients. They also concluded that the overall expense ratio of each Portfolio was reasonable, taking into account the size of the Portfolio, the quality of services provided by Janus Capital and any subadviser, the investment performance of the Portfolio and any expense limitations agreed to by Janus Capital.
Economies of Scale
The Trustees considered information about the potential for Janus Capital to realize economies of scale as the assets of the Portfolios increase. They noted that, although most Portfolios pay advisory fees at a fixed rate as a percentage of net assets, without any breakpoints, the management fee rate paid by each Portfolio, after any contractual expense limitations, was below the mean management fee rate of the Portfolio's peer group selected by Lipper; and, for those Portfolios whose expenses are being reduced by the contractual expense limitations of Janus Capital, Janus Capital is subsidizing the Portfolios because they have not
16 Janus Aspen Series December 31, 2007
reached adequate scale. Moreover, as the assets of many of the Portfolios declined in the past few years, those Portfolios benefited from having advisory fee rates that remained constant rather than increasing as assets declined. In addition, performance fee structures have been implemented for several Portfolios that will cause the effective rate of advisory fees payable by such a Portfolio to vary depending on the investment performance of the Portfolio relative to its benchmark index over the measurement period; and a few Portfolios have fee schedules with breakpoints and reduced fee rates above certain asset levels. The Trustees also noted that the Portfolios share directly in economies of scale through lower charges of third-party service providers, based on the combined scale of all of the Portfolios. Based on all of the information they reviewed, the Trustees concluded that the current fee structure of each Portfolio was reasonable an d that the current rates of fees do reflect a sharing between Janus Capital and the Portfolio of economies of scale at the current asset level of the Portfolio.
Other Benefits to Janus Capital
The Trustees also considered benefits that accrue to Janus Capital and its affiliates from their relationships with the Portfolios. They recognized that two affiliates of Janus Capital separately serve the Portfolios as transfer agent and distributor, respectively. They also considered Janus Capital's past and proposed use of commissions paid by Portfolios on their portfolio brokerage transactions to obtain proprietary and third-party research products and services benefiting those Portfolios and/or other clients of Janus Capital. The Trustees concluded that Janus Capital's use of "soft" commission dollars of a Portfolio to obtain proprietary and third-party research products and services was consistent with regulatory requirements and guidelines and was likely to benefit the Portfolios. The Trustees also concluded that, other than the services provided by Janus Capital and its affiliates pursuant to the agreements and the fees to be paid by each Portfolio therefor, the Portfolios and Janus Capital may potentially benefit from their relationship with each other in other ways. They concluded that Janus Capital benefits from the receipt of proprietary research products and services acquired through commissions paid on portfolio transactions of the Portfolios and that the Portfolios benefit from Janus Capital's receipt of those products and services, as well as research products and services acquired through commissions paid by other clients of Janus Capital. They further concluded that success of any Portfolio could attract other business to Janus Capital or other Janus funds and that the success of Janus Capital could enhance Janus Capital's ability to serve the Portfolios.
After full consideration of the above factors, as well as other factors, all of the Trustees, all of whom are Independent Trustees, concluded that the proposed continuation of the investment advisory agreement for each Portfolio, and the subadvisory agreement for each subadvised Portfolio, was in the best interest of the respective Portfolios and their shareholders.
Janus Aspen Series December 31, 2007 17
Explanations of Charts, Tables and
Financial Statements (unaudited)
1. PERFORMANCE OVERVIEWS
Average annual total returns are quoted for the Portfolio. Average annual total return is calculated by taking the growth or decline in value of an investment over a period of time, including reinvestment of dividends and distributions, then calculating the annual compounded percentage rate that would have produced the same result had the rate of growth been constant throughout the period. Average annual total return does not reflect the deduction of taxes that a shareholder would pay on Portfolio distributions or redemption of Portfolio shares.
Pursuant to federal securities rules, expense ratios shown in the performance chart reflect subsidized and unsubsidized ratios for the past fiscal year. The total annual portfolio operating expenses ratio is gross of any fee waivers, reflecting a Portfolio's unsubsidized expense ratio. The net annual portfolio operating expenses ratio (if applicable) includes contractual waivers of Janus Capital and/or Janus Services, and reflects a Portfolio's subsidized expense ratio. Both the total annual portfolio operating expenses ratio and net annual portfolio operating expenses ratio are based on average net assets as of the fiscal year ended December 31, 2006. The ratios also include expenses indirectly incurred by the Portfolio as a result of investing in other investment companies or pooled investments, which are not reflected in the "Financial Highlights" of this report. As a result, these ratios may be higher or lower than those shown in the "Fi nancial Highlights" in this report. All expenses are shown without the effect of expense offset arrangements. Pursuant to such arrangements, credits realized as a result of uninvested cash balances are used to reduce custodian and transfer agent expenses.
2. SCHEDULE OF INVESTMENTS
Following the performance overview section is the Portfolio's Schedule of Investments. This schedule reports the industry concentrations and types of securities held in the Portfolio on the last day of the reporting period. Securities are usually listed by type (commercial paper, demand notes, U.S. Government notes, etc.). Holdings are subject to change without notice.
The value of each security is quoted as of the last day of the reporting period. Investments held by the Portfolio with maturities over 60 days are valued at market value. Short-term investments maturing within 60 days are valued using the amortized cost method of valuation permitted in accordance with Rule 2a-7 under the 1940 Act and certain conditions therein.
3. STATEMENT OF ASSETS AND LIABILITIES
This statement is often referred to as the "balance sheet." It lists the assets and liabilities of the Portfolio on the last day of the reporting period.
The Portfolio's assets are calculated by adding the value of the securities owned, the receivable for securities sold but not yet settled and the receivable for Portfolio shares sold to investors but not yet settled. The Portfolio's liabilities include payables for securities purchased but not yet settled, Portfolio shares redeemed but not yet paid and expenses owed but not yet paid.
The section entitled "Net Assets Consist of" breaks down the components of the Portfolio's net assets. Because the Portfolio must distribute substantially all earnings, you will notice that a significant portion of net assets is shareholder capital.
The last section of this statement reports the Portfolio's net asset value ("NAV") per share on the last day of the reporting period. The NAV is calculated by dividing the Portfolio's net assets (assets minus liabilities) by the number of shares outstanding.
4. STATEMENT OF OPERATIONS
This statement details the Portfolio's income, expenses and gains and losses on securities.
The first section in this statement, entitled "Investment Income," reports the interest earned from interest-bearing securities in the Portfolio.
The next section reports the expenses and expense offsets incurred by the Portfolio, including the advisory fee paid to the investment adviser, transfer agent fees and expenses, printing and postage for mailing statements, financial reports and prospectuses, and other expenses. Expense offsets, if any, are also shown.
The last section lists the increase or decrease in the value of securities held in the Portfolio. The Portfolio realizes a gain (or loss) when it sells its position in a particular security.
5. STATEMENT OF CHANGES IN NET ASSETS
This statement reports the increase or decrease in the Portfolio's net assets during the reporting period. Changes in the Portfolio's net assets are attributable to investment operations, dividends, distributions and capital share transactions. This is important to investors because it shows exactly what caused the Portfolio's net asset size to change during the period.
The first section summarizes the information from the Statement of Operations regarding changes in net assets due to the Portfolio's investment performance. The Portfolio's net assets may also change as a result of dividend and capital gains distributions to investors. If investors receive their dividends in cash, money is taken out of the Portfolio to pay the distribution. If investors reinvest their dividends, the Portfolio's net assets will not be affected. If you compare the Portfolio's
18 Janus Aspen Series December 31, 2007
"Net Decrease from Dividends and Distributions" to the "Reinvested dividends and distributions," you will notice that dividend distributions had little effect on the Portfolio's net assets. This is because the majority of Janus investors reinvest their distributions.
The reinvestment of dividends is included under "Capital Share Transactions." "Capital Shares" refers to the money investors contribute to the Portfolio through purchases or withdraw via redemptions. The Portfolio's net assets will increase and decrease in value as investors purchase and redeem shares from the Portfolio.
6. FINANCIAL HIGHLIGHTS
This schedule provides a per-share breakdown of the components that affect the Portfolio's NAV for current and past reporting periods. Not only does this table provide you with total return, it also reports total distributions, asset size and expense ratios.
The first line in the table reflects the NAV per share at the beginning of the reporting period. The next line reports the net investment income per share, which comprises interest income earned on securities held by the Portfolio. Following is the total of realized gains/(losses). Dividends and distributions are then subtracted to arrive at the NAV per share at the end of the period. The next line reflects the average annual total return reported the last day of the period.
Also included are the expense ratios, or the percentage of average net assets that were used to cover operating expenses during the period.
The Portfolio's expenses may be reduced through expense reduction arrangements. These arrangements may include the use of balance credits or transfer agent fee offsets. The Statement of Operations reflects total expenses before any such offset, the amount of the offset and the net expenses. The expense ratios listed in the Financial Highlights reflect total expenses prior to any expense offsets (gross expense ratio) and after the expense offsets (net expense ratio). Both expense ratios reflect expenses after waivers (reimbursements), if applicable.
The ratio of net investment income/(loss) summarizes the income earned less expenses, divided by the average net assets of the Portfolio during the reporting period. Don't confuse this ratio with the Portfolio's yield. The net investment income ratio is not a true measure of the Portfolio's yield because it doesn't take into account the dividends distributed to the Portfolio's investors.
Janus Aspen Series December 31, 2007 19
Trustees and Officers (unaudited)
The Portfolio's Statement of Additional Information includes additional information about the Trustees and officers and is available, without charge, by calling 1-800-525-0020.
The following are the Trustees and officers of the Trust, together with a brief description of their principal occupations during the last five years (principal occupations for certain Trustees may include periods over five years).
Each Trustee has served in that capacity since he or she was originally elected or appointed. The Trustees do not serve a specified term of office. Each Trustee will hold office until the termination of the Trust or his or her earlier death, resignation, retirement, incapacity, or removal. The retirement age for Trustees is 72. The Portfolio's Nominating and Governance Committee will consider nominees for the position of Trustee recommended by shareholders. Shareholders may submit the name of a candidate for consideration by the Committee by submitting their recommendations to the Trust's Secretary. Each Trustee is currently a Trustee of two other registered investment companies advised by Janus Capital: Janus Investment Fund and Janus Adviser Series. As of the date of this report, collectively, these three registered investment companies consist of 75 series or funds.
The Trust's officers are elected annually by the Trustees for a one-year term. Certain officers also serve as officers of Janus Investment Fund and Janus Adviser Series. Certain officers of the Portfolio may also be officers and/or directors of Janus Capital. Portfolio officers receive no compensation from the Portfolio, except for the Portfolio's Chief Compliance Officer, as authorized by the Trustees.
Trustees
| Name, Address, and Age | Positions Held with Portfolio | Length of Time Served | Principal Occupations During the Past Five Years | Number of Portfolios/Funds in Fund Complex Overseen by Trustee | Other Directorships Held by Trustee | ||||||||||||||||||
| Dennis B. Mullen* 151 Detroit Street Denver, CO 80206 DOB: 1943 | Chairman Trustee | 3/04-12/07 9/93-Present | Chief Executive Officer of Red Robin Gourmet Burgers, Inc. (since 2005). Formerly, private investor. | 75 | ** | Chairman of the Board (since 2005) and Director of Red Robin Gourmet Burgers, Inc., and Director of Janus Capital Funds Plc (Dublin-based, non-U.S. funds). | |||||||||||||||||
| Jerome S. Contro 151 Detroit Street Denver, CO 80206 DOB: 1956 | Trustee | 12/05-Present | Partner of Tango Group, a private investment firm (since 1999). | 75 | Trustee and Chairman of RS Investment Trust (since 2001), and Director of IZZE Beverages and MyFamily.com, Inc. (genealogical research website). | ||||||||||||||||||
| William F. McCalpin 151 Detroit Street Denver, CO 80206 DOB: 1957 | Trustee | 6/02-Present | Private investor. Formerly, Executive Vice President and Chief Operating Officer of The Rockefeller Brothers Fund (a private family foundation), and Vice President of Asian Cultural Council. | 75 | Director of F.B. Heron Foundation (a private grant making foundation). | ||||||||||||||||||
| John W. McCarter, Jr. 151 Detroit Street Denver, CO 80206 DOB: 1938 | Trustee | 6/02-Present | President and Chief Executive Officer of The Field Museum of Natural History (Chicago, IL) (since 1997). | 75 | Chairman of the Board and Director of Divergence Inc. (biotechnology firm); Director of W.W. Grainger, Inc. (industrial distributor); and Trustee of WTTW (Chicago public television station) and the University of Chicago. | ||||||||||||||||||
* Mr. McCalpin will succeed Mr. Mullen as Chairman as of January 1, 2008.
** Mr. Mullen also serves as director of Janus Capital Funds Plc, consisting of 16 funds. Including Janus Capital Funds Plc and the 75 funds comprising the Janus funds, Mr. Mullen oversees 91 funds.
20 Janus Aspen Series December 31, 2007
Trustees (cont.)
| Name, Address, and Age | Positions Held with Portfolio | Length of Time Served | Principal Occupations During the Past Five Years | Number of Portfolios/Funds in Fund Complex Overseen by Trustee | Other Directorships Held by Trustee | ||||||||||||||||||
| James T. Rothe 151 Detroit Street Denver, CO 80206 DOB: 1943 | Trustee | 1/97-Present | Co-founder and Managing Director of Roaring Fork Capital Management, LLC (private investment in public equity firm), and Professor Emeritus of Business of the University of Colorado, Colorado Springs, CO (since 2004). Formerly, Professor of Business of the University of Colorado (2002-2004) and Distinguished Visiting Professor of Business (2001-2002) of Thunderbird (American Graduate School of International Management), Glendale, AZ. | 75 | Director of Red Robin Gourmet Burgers, Inc. | ||||||||||||||||||
| William D. Stewart 151 Detroit Street Denver, CO 80206 DOB: 1944 | Trustee | 9/93-Present | Corporate Vice President and General Manager of MKS Instruments – HPS Products, Boulder, CO (a manufacturer of vacuum fittings and valves). | 75 | N/A | ||||||||||||||||||
| Martin H. Waldinger 151 Detroit Street Denver, CO 80206 DOB: 1938 | Trustee | 9/93-Present | Private Investor and Consultant to California Planned Unit Developments (since 1994). Formerly, CEO and President of Marwal, Inc. (homeowner association management company). | 75 | N/A | ||||||||||||||||||
| Linda S. Wolf 151 Detroit Street Denver, CO 80206 DOB: 1947 | Trustee | 12/05-Present | Retired. Formerly, Chairman and Chief Executive Officer of Leo Burnett (Worldwide) (advertising agency) (2001-2005). | 75 | Director of Wal-Mart, The Field Museum of Natural History (Chicago, IL), Children's Memorial Hospital (Chicago, IL), Chicago Council on Foreign Relations, Economic Club of Chicago, and InnerWorkings (U.S. provider of print procurement solutions). | ||||||||||||||||||
Janus Aspen Series December 31, 2007 21
Trustees and Officers (unaudited) (continued)
Officers
| Name, Address, and Age | Positions Held with Portfolio | Term of Office* and Length of Time Served | Principal Occupations During the Past Five Years | ||||||||||||
| Craig Jacobson 151 Detroit Street Denver, CO 80206 DOB: 1970 | Executive Vice President and Co-Portfolio Manager Janus Aspen Money Market Portfolio | 4/07-Present | Portfolio Manager for other Janus accounts and Research Analyst for Janus Capital. | ||||||||||||
| J. Eric Thorderson 151 Detroit Street Denver, CO 80206 DOB: 1961 | Executive Vice President and Co-Portfolio Manager Janus Aspen Money Market Portfolio | 2/99-Present | Vice President of Janus Capital and Portfolio Manager for other Janus accounts. | ||||||||||||
| Stephanie Grauerholz-Lofton 151 Detroit Street Denver, CO 80206 DOB: 1970 | Chief Legal Counsel and Secretary Vice President | 1/06-Present 3/06-Present | Vice President and Assistant General Counsel of Janus Capital, and Vice President and Assistant Secretary of Janus Distributors LLC. Formerly, Assistant Vice President of Janus Capital and Janus Distributors LLC (2006), and Associate of Vedder, Price, Kaufman & Kammholz, P.C. (1999-2003). | ||||||||||||
| Andrew J. Iseman 151 Detroit Street Denver, CO 80206 DOB: 1964 | President and Chief Executive Officer | 3/07-Present | Chief Operating Officer and Senior Vice President of Janus Capital Group, Inc. and Janus Capital; President of Janus Services LLC; and Director of Capital Group Partners, Inc. Formerly, Senior Vice President of Enhanced Investment Technologies, LLC (2005-2007); and Vice President of Janus Capital (2003-2005) and Janus Services LLC (2003-2004). | ||||||||||||
| David R. Kowalski 151 Detroit Street Denver, CO 80206 DOB: 1957 | Vice President, Chief Compliance Officer, and Anti-Money Laundering Officer | 6/02-Present | Senior Vice President and Chief Compliance Officer of Janus Capital, Janus Distributors LLC, and Janus Services LLC; Chief Compliance Officer of Bay Isle Financial LLC; and Vice President of Enhanced Investment Technologies, LLC. Formerly, Chief Compliance Officer of Enhanced Investment Technologies, LLC (2003-2005); Vice President of Janus Capital (2000-2005) and Janus Services LLC (2004-2005); and Assistant Vice President of Janus Services LLC (2000-2004). | ||||||||||||
| Jesper Nergaard 151 Detroit Street Denver, CO 80206 DOB: 1962 | Chief Financial Officer Vice President, Treasurer, and Principal Accounting Officer | 3/05-Present 2/05-Present | Vice President of Janus Capital. Formerly, Director of Financial Reporting for OppenheimerFunds, Inc. (2004-2005); Site Manager and First Vice President of Mellon Global Securities Services (2003); and Director of Fund Accounting, Project Development, and Training of INVESCO Funds Group (1994-2003). | ||||||||||||
*Officers are elected at least annually by the Trustees for a one-year term and may also be elected from time to time by the Trustees for an interim period.
22 Janus Aspen Series December 31, 2007
Notes
Janus Aspen Series December 31, 2007 23
Notes
24 Janus Aspen Series December 31, 2007
Notes
Janus Aspen Series December 31, 2007 25
Janus provides access to a wide range of investment disciplines.
Growth
Janus growth portfolios focus on companies believed to be the leaders in their respective industries, with solid management teams, expanding market share, margins and efficiencies.
Core
Janus core portfolios seek investments in more stable and predictable companies. These portfolios look for a strategic combination of steady growth and for certain portfolios, some degree of income.
Risk-Managed
Our risk-managed portfolios seek to outperform their respective indices while maintaining a risk profile equal to or lower than the index itself. Managed by INTECH (a Janus subsidiary), these portfolios use a mathematical process in an attempt to build a more "efficient" portfolio than the index.
Value
Janus value portfolios invest in companies they believe are poised for a turnaround or are trading at a significant discount to fair value. The goal is to gain unique insight into a company's true value and identify and evaluate potential catalysts that may unlock shareholder value.
International & Global
Janus international and global portfolios seek to leverage Janus' research capabilities by taking advantage of inefficiencies in foreign markets, where accurate information and analytical insight are often at a premium.
Bond
Janus bond portfolios attempt to provide less risk relative to equities while seeking to deliver a competitive total return through high current income and appreciation.
Money Market
Janus money market portfolios seek maximum current income consistent with stability of capital.
For more information about our funds, contact your investment professional or go to www.janus.com/info
Please consider the charges, risks, expenses and investment objectives carefully before investing. For a prospectus containing this and other information, please call Janus at 1-800-525-0020 or download the file from www.janus.com/info. Read it carefully before you invest or send money.
An investment in a money market portfolio is not insured or guaranteed by the Federal Deposit Insurance Corporation or any other government agency. Although the Portfolio seeks to preserve the value of your investment at $1.00 per share, it is possible to lose money by investing in the Portfolio.

151 Detroit Street
Denver, CO 80206
1-800-525-0020
Portfolio distributed by Janus Distributors LLC (2/08)
C-0108-357 109-02-708 02-08
2007 Annual Report
Janus Aspen Series
Janus Aspen Small Company Value Portfolio
Look Inside. . .
• Portfolio management perspective
• Investment strategy behind your portfolio
• Portfolio performance, characteristics and holdings

Table of Contents
| Useful Information About Your Portfolio Report | 1 | ||||||
| Portfolio Management Commentary and Schedule of Investments | 2 | ||||||
| Statement of Assets and Liabilities | 9 | ||||||
| Statement of Operations | 10 | ||||||
| Statements of Changes in Net Assets | 11 | ||||||
| Financial Highlights | 12 | ||||||
| Notes to Schedule of Investments | 13 | ||||||
| Notes to Financial Statements | 14 | ||||||
| Report of Independent Registered Public Accounting Firm | 21 | ||||||
| Additional Information | 22 | ||||||
| Explanations of Charts, Tables and Financial Statements | 25 | ||||||
| Designation Requirements | 27 | ||||||
| Trustees and Officers | 28 | ||||||
Please consider the charges, risks, expenses and investment objectives carefully before investing. For a prospectus containing this and other information, please call Janus at 1-800-525-0020 or download the file from www.janus.com/info. Read it carefully before you invest or send money.
Useful Information About Your Portfolio Report
Management Commentary
The Management Commentary in this report includes valuable insight from the Portfolio's manager as well as statistical information to help you understand how your Portfolio's performance and characteristics stack up against those of comparable indices.
Please keep in mind that the opinions expressed by the Portfolio's manager in the Management Commentary are just that: opinions. They are a reflection of the manager's best judgment at the time this report was compiled, which was December 31, 2007. As the investing environment changes, so could the manager's opinions. The views are unique to the manager and aren't necessarily shared by his fellow employees or by Janus in general.
Portfolio Expenses
We believe it's important for our shareholders to have a clear understanding of Portfolio expenses and the impact they have on investment return.
The following is important information regarding the Portfolio's Expense Example, which appears in the Portfolio Management Commentary within this Annual Report. Please refer to this information when reviewing the Expense Example for the Portfolio.
Example
As a shareholder of a Portfolio, you incur two types of costs: (1) transaction costs, including redemption fees (where applicable) (and any related exchange fees) and (2) ongoing costs, including management fees; distribution and shareholder servicing (12b-1) fees (applicable to Service Shares only); administrative services fees (applicable to Service Shares only); and other Portfolio expenses. The example is intended to help you understand your ongoing costs (in dollars) of investing in a Portfolio and to compare these costs with the ongoing costs of investing in other mutual funds. To do so, compare this 5% hypothetical example with the 5% hypothetical examples that appear in the shareholder reports of the other funds. The example is based upon an investment of $1,000 invested at the beginning of the period and held for the six-month period from July 1, 2007 to December 31, 2007.
Actual Expenses
The first line of the table in each example provides information about actual account values and actual expenses. You may use the information in this line, together with the amount you invested, to estimate the expenses that you paid over the period. Simply divide your account value by $1,000 (for example, an $8,600 account value divided by $1,000 = 8.6), then multiply the result by the number in the first line under the heading entitled "Expenses Paid During Period" to estimate the expenses you paid on your account during the period.
Hypothetical Example for Comparison Purposes
The second line of the table in each example provides information about hypothetical account values and hypothetical expenses based upon the Portfolio's actual expense ratio and an assumed rate of return of 5% per year before expenses, which is not the Portfolio's actual return. The hypothetical account values and expenses may not be used to estimate the actual ending account balance or expenses you paid for the period. You may use this information to compare the ongoing costs of investing in the Portfolio and other funds. To do so, compare this 5% hypothetical example with the 5% hypothetical examples that appear in the shareholder reports of the other funds.
Janus Capital Management LLC ("Janus Capital") has contractually agreed to waive the Portfolio's total operating expenses, excluding the distribution and shareholder servicing (12b-1) fees applicable to Service Shares, the administrative services fees applicable to Service Shares, brokerage commissions, interest, taxes and extraordinary expenses to certain limits until at least May 1, 2009. Expenses in the examples reflect application of these waivers. Had the waivers not been in effect, your expenses would have been higher. More information regarding the waivers is available in the Portfolio's prospectus.
Please note that the expenses shown in the tables are meant to highlight your ongoing costs only and do not reflect any transaction costs, such as redemption fees (where applicable) and any charges at the separate account level or contract level. Redemption fees are fully described in the prospectus. Therefore, the second line of each table is useful in comparing ongoing costs only, and will not help you determine the relative total costs of owning different funds. In addition, if these transaction costs and separate account or contract level charges were included, your costs would have been higher.
Janus Aspen Series December 31, 2007 1
Janus Aspen Small Company Value
Portfolio (unaudited)
Portfolio Snapshot
The portfolio searches for small, out-of-favor companies misunderstood by the broader investment community.

Jakob Holm
portfolio manager
Performance Overview
During the 12-month period ended December 31, 2007, Janus Aspen Small Company Value Portfolio's Service Shares posted returns of (6.11)%, outperforming the Portfolio's benchmark, the Russell 2000® Value Index, which returned (9.78)%.
Economic Overview
Despite a volatile and weak second half of the year, most equity markets worldwide managed to turn in modest gains over the 12-month period ended December 31, 2007. However, following a multi-year period of strong performance, small cap value stocks suffered as a large portion of the Russell 2000® Value Index is tied to the financial sector and many investors called into question the future operating environment for smaller companies. Across equity markets in general, much of the year's gains came during the first half amid continued expansion in the global economy and an active merger and acquisition (M&A) environment, but problems in the U.S. credit markets started to rattle investor confidence in July. Many indices retreated from recent peaks as investors digested a number of issues stemming from the subprime mortgage and structured debt markets. Credit market turmoil, subprime-related write-offs, continued weakness in the U.S. housing market, central bank intervention and the first year-over-year decline in domestic corporate earnings since 2002 were just some of the main themes dominating sentiment during the latter half of 2007. Through all of this, emerging country stocks tended to be the top performers while equities in developed countries struggled to keep pace. Domestic stocks were led by large, growth-oriented companies.
As December came to a close, many items supporting equity prices were fading. While domestic valuations were still considered to be reasonable, particularly with interest rates well off of their period highs, mixed signals on the financial health of the U.S. consumer and slowing earnings momentum were becoming a greater concern. One pillar of strength during the year, the labor market, showed signs that it may be starting to feel the impact of the housing slowdown and subsequent credit market turmoil. While job growth remained strong for much of the year, a weak December reading left some doubt about continued near-term strength. In the end, the questions remained surrounding the magnitude of slowing growth in the U.S. and whether the rest of the world will follow suit.
Standouts During the Period
Stock selection within materials, industrials, information technology, and telecommunication services drove performance. The top performer during the period was materials company Owens-Illinois, which benefited from new management's focus on cost reduction and reduced capital spending. Earlier in the year, market expectations were validated when new CEO Al Stroucken put at least one new capital expenditure project on hold. I believe the restructuring and focus on margin improvement should drive the glass container manufacturer's performance going forward. In addition, I believe high barriers to entry and Owens-Illinois' existing market share support continued investment.
FTI Consulting was another positive contributor to the Portfolio. FTI is a counter-cyclical legal services business focused on reorganization resulting from financial difficulties. The company's services have been in high demand as expectation for bankruptcy potential increases.
Detractors During the Period
Exposure to the financials sector was the primary source of negative attribution. The positive impact of the Portfolio's underweight exposure to the sector versus the benchmark was offset by the performance of select holdings.
Student lender Nelnet suffered over the course of the year on news surrounding competitor SLM Corp., formerly Sallie Mae, including the fourth quarter announcement that the much-anticipated leveraged buyout (LBO) by a consortium of investment banks and private equity firms fell through, as well as the potential for current credit conditions to impact funding costs. With so much negative news surrounding its primary competitor in the space, Nelnet fell nearly 30% in the fourth quarter alone. I believe in Nelnet longer term as the company has some potentially positive catalysts on the horizon, including industry consolidation, and the fact that 50% of its revenue comes from recurring sources outside of lending. At the end of the period, the company was valued at six-times earnings and trading at less than book value. I added to the position on the weakness.
Consumer discretionary holding WCI Communities was the second largest detractor. This homebuilder focused on multi- and single-family residences in Florida has not executed well and, after management turned down a $22 per share bid (prior to the recent sell-off) from investor Carl Ichan, I lost confidence and sold the position.
Looking Forward
With U.S. equity markets struggling late in the year, the investment team will continue to closely monitor several
2 Janus Aspen Series December 31, 2007
(unaudited)
factors for directional cues. First, despite the weakness in the U.S. housing sector and related credit market turmoil, U.S. employment had been a pillar of support for the economy. With signs of weakening at the end of the year, however, I will continue to watch the labor market closely for any sign of prolonged weakness and whether December's weaker-than-expected report was an aberration. I will also be monitoring conditions in the credit markets for signs of further deterioration. As the Federal Reserve (Fed) works to balance its dual mandate of sustainable growth and price stability, I will be watching for signs that suggest the Fed is behind the curve and whether it can be effective in navigating these uncertain economic times. Finally, as "bottom–up" fundamental investors, I will continue to watch the future path of corporate earnings, credit conditions, liqui dity, and balance sheet health of our individual holdings in an effort to determine whether current valuations represent an attractive risk/reward profile.
Thank you for your investment in Janus Aspen Small Company Value Portfolio.
Janus Aspen Small Company Value Portfolio At a Glance
5 Largest Contributors to Performance – Holdings
| Contribution | |||||||
| Owens-Illinois, Inc. | 2.60 | % | |||||
| FTI Consulting, Inc. | 1.82 | % | |||||
| Golden Telecom, Inc. | 1.42 | % | |||||
| Forest Oil Corp. | 0.99 | % | |||||
| Atwood Oceanics, Inc. | 0.90 | % | |||||
5 Largest Detractors from Performance – Holdings
| Contribution | |||||||
| Nelnet, Inc. - Class A | (1.57 | )% | |||||
| WCI Communities, Inc. | (1.19 | )% | |||||
| Ram Holdings, Ltd. | (0.96 | )% | |||||
| RC2 Corp. | (0.79 | )% | |||||
| TETRA Technologies, Inc. | (0.75 | )% | |||||
5 Largest Contributors to Performance – Sectors
| Portfolio Contribution | Portfolio Weighting (% of Net Assets) | Russell 2000® Value Index Weighting | |||||||||||||
| Materials | 2.94 | % | 6.33 | % | 6.61 | % | |||||||||
| Energy | 1.47 | % | 8.12 | % | 4.95 | % | |||||||||
| Telecommunication Services | 1.42 | % | 1.83 | % | 1.52 | % | |||||||||
| Industrials | 1.34 | % | 19.14 | % | 12.33 | % | |||||||||
| Information Technology | 0.71 | % | 15.94 | % | 13.30 | % | |||||||||
5 Lowest Contributors/Detractors to Performance – Sectors
| Portfolio Contribution | Portfolio Weighting (% of Net Assets) | Russell 2000® Value Index Weighting | |||||||||||||
| Financials | (8.61 | )% | 29.01 | % | 33.10 | % | |||||||||
| Consumer Discretionary | (4.09 | )% | 9.94 | % | 14.18 | % | |||||||||
| Utilities | (0.05 | )% | 3.12 | % | 5.37 | % | |||||||||
| Other* | 0.00 | % | 0.04 | % | 0.00 | % | |||||||||
| Consumer Staples | 0.10 | % | 3.22 | % | 3.68 | % | |||||||||
*Industry not classified by Global Industry Classification Standard
Janus Aspen Series December 31, 2007 3
Janus Aspen Small Company Value Portfolio (unaudited)
5 Largest Equity Holdings – (% of Net Assets)
As of December 31, 2007
| FTI Consulting, Inc. Consulting Services | 2.5 | % | |||||
| Deluxe Corp. Commercial Services - Finance | 2.4 | % | |||||
| Steiner Leisure, Ltd. Commercial Services | 2.3 | % | |||||
| Microsemi Corp. Electronic Components - Semiconductors | 2.2 | % | |||||
| Forest Oil Corp. Oil Companies - Exploration and Production | 2.2 | % | |||||
| 11.6 | % | ||||||
Asset Allocation – (% of Net Assets)
As of December 31, 2007

Top Country Allocations – Long Positions (% of Investment Securities)
| As of December 31, 2007 | As of December 31, 2006 | ||||||
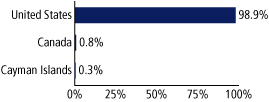 | 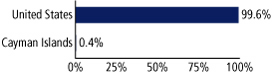 | ||||||
4 Janus Aspen Series December 31, 2007
(unaudited)
Performance
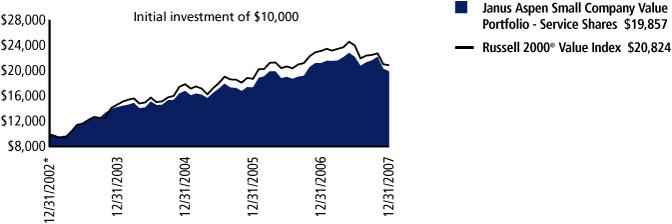
| Average Annual Total Return – for the periods ended December 31, 2007 | Expense Ratios – for the fiscal year ended December 31, 2006 | ||||||||||||||||||||||
| One Year | Five Year | Since Inception* | Total Annual Fund Operating Expenses | Net Annual Fund Operating Expenses | |||||||||||||||||||
| Janus Aspen Small Company Value Portfolio - Service Shares | (6.11 | )% | 14.71 | % | 14.71 | % | 2.20 | % | 1.70 | %(a) | |||||||||||||
| Russell 2000® Value Index | (9.78 | )% | 15.80 | % | 15.80 | % | |||||||||||||||||
| Lipper Quartile - Service Shares | 4 | th | 3 | rd | 3 | rd | |||||||||||||||||
| Lipper Ranking - Service Shares based on total returns for Variable Annuity Small-Cap Core Funds | 100/123 | 60/89 | 60/89 | ||||||||||||||||||||
Visit janus.com/info to view up-to-date
performance and characteristic information
Data presented reflects past performance, which is no guarantee of future results. Investment results and principal value will fluctuate so that shares, when redeemed, may be worth more or less than their original cost. Due to market volatility, current performance may be higher or lower than the performance shown. Call 877.33JANUS or visit www.janus.com/info for performance current to the most recent month-end.
(a) At December 31, 2006, Janus Capital has contractually agreed to waive the Portfolio's total operating expenses (excluding the distribution and shareholder servicing fee, administrative services fee, brokerage commissions, interest, taxes, and extraordinary expenses) to a certain limit until at least May 1, 2008. The net annual fund operating expense shown reflects the application of such limit and is detailed in the Statement of Additional Information. Returns shown include fee waivers, if any, and without such waivers returns would have been lower.
The Portfolio's expense ratio was determined based on average net assets as of the fiscal year ended December 31, 2006. Detailed information is available in the prospectus. Contractual waivers agreed to by Janus Capital are included under "Net Annual Fund Operating Expenses." All expenses are shown without the effect of expense offset arrangements. Pursuant to such arrangements, credits realized as a result of uninvested cash balances are used to reduce custodian and transfer agent expenses.
The Portfolio's performance may be affected by risks that include those associated with undervalued or overlooked companies and investments in specific industries or countries. Additional risks to the Portfolio may include those associated with investing in foreign securities, emerging markets, initial public offerings ("IPOs"), derivatives and companies with relatively small market capitalizations. Please see a Janus prospectus or www.janus.com/info for more information about risks, portfolio holdings and other details.
Portfolios that invest in Real Estate Investment Trusts (REITs) may be subject to a higher degree of market risk because of concentration in a specific industry, sector or geographic region. REITs may be subject to risks including, but not limited to: liquidity, decline in the value of real estate, risks related to general and economic conditions, changes in the value of the underlying property owned by the trust and defaults by borrowers. To the extent the Portfolio invests in foreign REITs, it may be subject to fluctuations in currency rates or political or economic conditions in a particular country.
These returns do not reflect the charges and expenses of any particular insurance product or qualified plan. Returns shown would have been lower had they included insurance charges.
Due to certain investment strategies, the Portfolio may have an increased position in cash.
Returns include reinvestment of dividends from net investment income and distributions from capital gains. The returns shown do not reflect the deduction of taxes that a shareholder would pay on Portfolio distributions or the redemption of Portfolio shares.
Lipper, a wholly-owned subsidiary of Reuters, provides independent insight on global collective investments including mutual funds, retirement funds, hedge funds, fund fees and expenses to the asset management and media communities. Lipper ranks the performance of mutual funds within a classification of funds that have similar investment objectives. Rankings are historical with capital gains and dividends reinvested and do not include the effect of loads.
If an expense waiver was in effect, it may have had a material effect on the total return or yield, and therefore the ranking for the period.
There is no assurance that the investment process will consistently lead to successful investing.
Janus Aspen Series December 31, 2007 5
Janus Aspen Small Company Value Portfolio
(unaudited)
Portfolio Expenses
| Expense Example - Service Shares | Beginning Account Value (7/1/07) | Ending Account Value (12/31/07) | Expenses Paid During Period (7/1/07-12/31/07)(1) | ||||||||||||
| Actual | $ | 1,000.00 | $ | 896.70 | $ | 8.08 | |||||||||
| Hypothetical (5% return before expenses) | $ | 1,000.00 | $ | 1,016.69 | $ | 8.59 | |||||||||
(1) Expenses are equal to the annualized expense ratio of 1.69%, multiplied by the average account value over the period, multiplied by 184/365 (to reflect the one-half year period). Expenses include the effect of contractual waivers by Janus Capital.
The Portfolio will invest at least 80% of its net assets in the type of securities described by its name.
See Notes to Schedule of Investments for index definitions.
The Portfolio may differ significantly from the securities held in the index. The index is unmanaged and not available for direct investment; therefore its performance does not reflect the expenses associated with the active management of an actual Portfolio.
See "Explanations of Charts, Tables and Financial Statements."
*The Portfolio's inception date – December 31, 2002
6 Janus Aspen Series December 31, 2007
Janus Aspen Small Company Value Portfolio
Schedule of Investments
As of December 31, 2007
| Shares or Principal Amount | Value | ||||||||||
| Common Stock - 93.9% | |||||||||||
| Advanced Materials/Products - 1.4% | |||||||||||
| 5,933 | Ceradyne, Inc.* | $ | 278,436 | ||||||||
| Apparel Manufacturers - 1.2% | |||||||||||
| 8,155 | Gymboree Corp.* | 248,401 | |||||||||
| Automotive - Truck Parts and Equipment - Original - 0.5% | |||||||||||
| 13,615 | Spartan Motors, Inc. | 104,019 | |||||||||
| Building - Mobile Home and Manufactured Homes - 2.0% | |||||||||||
| 10,622 | Thor Industries, Inc. | 403,742 | |||||||||
| Building and Construction - Miscellaneous - 1.4% | |||||||||||
| 10,597 | Dycom Industries, Inc.* | 282,410 | |||||||||
| Chemicals - Diversified - 1.4% | |||||||||||
| 5,266 | FMC Corp. | 287,260 | |||||||||
| Collectibles - 1.2% | |||||||||||
| 8,559 | RC2 Corp.* | 240,251 | |||||||||
| Commercial Banks - 8.9% | |||||||||||
| 5,935 | BancFirst Corp. | 254,314 | |||||||||
| 920 | Camden National Corp. | 26,128 | |||||||||
| 13,230 | Cascade Bancorp | 184,162 | |||||||||
| 18,355 | CoBiz Financial, Inc. | 272,938 | |||||||||
| 9,050 | East West Bancorp, Inc. | 219,282 | |||||||||
| 975 | First Citizens BancShares, Inc. - Class A | 142,204 | |||||||||
| 6,256 | Simmons First National Corp. - Class A | 165,784 | |||||||||
| 10,306 | TriCo Bancshares | 198,906 | |||||||||
| 4,892 | UMB Financial Corp. | 187,657 | |||||||||
| 10,183 | United Community Banks, Inc. | 160,891 | |||||||||
| 1,812,266 | |||||||||||
| Commercial Services - 2.3% | |||||||||||
| 10,811 | Steiner Leisure, Ltd.* | 477,414 | |||||||||
| Commercial Services - Finance - 3.5% | |||||||||||
| 14,699 | Deluxe Corp. | 483,449 | |||||||||
| 6,910 | Jackson Hewitt Tax Service, Inc. | 219,393 | |||||||||
| 702,842 | |||||||||||
| Computer Services - 0.6% | |||||||||||
| 2,822 | CACI International, Inc.* | 126,341 | |||||||||
| Consulting Services - 2.5% | |||||||||||
| 8,372 | FTI Consulting, Inc.* | 516,050 | |||||||||
| Consumer Products - Miscellaneous - 2.2% | |||||||||||
| 18,601 | Jarden Corp.* | 439,170 | |||||||||
| Containers - Metal and Glass - 2.0% | |||||||||||
| 8,150 | Owens-Illinois, Inc.* | 403,425 | |||||||||
| Diversified Operations - 2.2% | |||||||||||
| 8,660 | Crane Co. | 371,514 | |||||||||
| 241,259 | Polytec Asset Holdings, Ltd. | 71,788 | |||||||||
| 443,302 | |||||||||||
| Electric - Integrated - 1.8% | |||||||||||
| 5,741 | ALLETE, Inc. | 227,228 | |||||||||
| 4,296 | Otter Tail Corp. | 148,642 | |||||||||
| 375,870 | |||||||||||
| Electronic Components - Semiconductors - 2.5% | |||||||||||
| 20,047 | Microsemi Corp.* | 443,841 | |||||||||
| 14,868 | MIPS Technologies, Inc.* | 73,745 | |||||||||
| 517,586 | |||||||||||
| Finance - Consumer Loans - 1.6% | |||||||||||
| 25,970 | Nelnet, Inc. - Class A | 330,079 | |||||||||
| Shares or Principal Amount | Value | ||||||||||
| Firearms and Ammunition - 0.8% | |||||||||||
| 26,805 | Smith & Wesson Holding Corp.* | $ | 163,511 | ||||||||
| Food - Diversified - 0.6% | |||||||||||
| 4,147 | J & J Snack Foods Corp. | 129,718 | |||||||||
| Food - Retail - 1.9% | |||||||||||
| 5,335 | Ruddick Corp. | 184,964 | |||||||||
| 5,108 | Weis Markets, Inc. | 204,014 | |||||||||
| 388,978 | |||||||||||
| Footwear and Related Apparel - 1.2% | |||||||||||
| 12,595 | Skechers U.S.A., Inc. - Class A* | 245,728 | |||||||||
| Gas - Distribution - 1.0% | |||||||||||
| 3,072 | Atmos Energy Corp. | 86,139 | |||||||||
| 4,137 | Piedmont Natural Gas Company, Inc. | 108,224 | |||||||||
| 194,363 | |||||||||||
| Hazardous Waste Disposal - 0.8% | |||||||||||
| 8,560 | Newalta Income Fund | 158,326 | |||||||||
| Human Resources - 1.0% | |||||||||||
| 10,820 | Resources Connection, Inc.* | 196,491 | |||||||||
| Internet Applications Software - 0.7% | |||||||||||
| 9,788 | Interwoven, Inc.* | 139,185 | |||||||||
| Internet Incubators - 1.4% | |||||||||||
| 157,849 | Safeguard Scientifics, Inc.* | 284,128 | |||||||||
| Internet Infrastructure Equipment – 0.9% | |||||||||||
| 8,300 | Avocent Corp.* | 193,473 | |||||||||
| Investment Companies - 1.3% | |||||||||||
| 19,243 | KKR Financial Holdings LLC | 270,364 | |||||||||
| Investment Management and Advisory Services - 0.9% | |||||||||||
| 4,121 | National Financial Partners Corp. | 187,959 | |||||||||
| Lasers - Systems and Components - 3.6% | |||||||||||
| 9,725 | Cymer, Inc.* | 378,593 | |||||||||
| 12,945 | Excel Technology, Inc.* | 350,810 | |||||||||
| 729,403 | |||||||||||
| Machinery - Electrical - 1.0% | |||||||||||
| 4,352 | Regal-Beloit Corp. | 195,622 | |||||||||
| Machinery - Farm - 0.6% | |||||||||||
| 6,909 | Alamo Group, Inc. | 125,191 | |||||||||
| Machinery - General Industrial - 1.9% | |||||||||||
| 13,515 | Applied Industrial Technologies, Inc. | 392,205 | |||||||||
| Medical - HMO - 0.7% | |||||||||||
| 3,220 | Magellan Health Services, Inc.* | 150,149 | |||||||||
| Medical - Outpatient and Home Medical Care - 0.8% | |||||||||||
| 6,225 | LHC Group LLC* | 155,501 | |||||||||
| Medical Instruments - 0.4% | |||||||||||
| 3,721 | CONMED Corp.* | 85,992 | |||||||||
| Multi-Line Insurance - 1.2% | |||||||||||
| 8,174 | American Financial Group, Inc. | 236,065 | |||||||||
| Non-Ferrous Metals - 1.9% | |||||||||||
| 5,496 | RTI International Metals, Inc.* | 378,839 | |||||||||
| Oil - Field Services - 0.9% | |||||||||||
| 12,208 | TETRA Technologies, Inc.* | 190,079 | |||||||||
| Oil and Gas Drilling - 1.2% | |||||||||||
| 2,400 | Atwood Oceanics, Inc.* | 240,576 | |||||||||
See Notes to Schedule of Investments and Financial Statements.
Janus Aspen Series December 31, 2007 7
Janus Aspen Small Company Value Portfolio
Schedule of Investments
As of December 31, 2007
| Shares or Principal Amount | Value | ||||||||||
| Oil Companies - Exploration and Production - 5.7% | |||||||||||
| 8,642 | Forest Oil Corp.* | $ | 439,358 | ||||||||
| 9,670 | Mariner Energy, Inc.* | 221,250 | |||||||||
| 5,000 | Plains Exploration & Production Co.* | 270,000 | |||||||||
| 5,798 | St. Mary Land & Exploration Co. | 223,861 | |||||||||
| 1,154,469 | |||||||||||
| Printing - Commercial - 3.4% | |||||||||||
| 22,502 | Cenveo, Inc.* | 393,110 | |||||||||
| 6,459 | Consolidated Graphics, Inc.* | 308,869 | |||||||||
| 701,979 | |||||||||||
| Real Estate Management/Services - 0.5% | |||||||||||
| 13,247 | HFF, Inc.* | 102,532 | |||||||||
| Recreational Vehicles - 0.6% | |||||||||||
| 2,370 | Polaris Industries, Inc. | 113,215 | |||||||||
| REIT - Diversified - 0.6% | |||||||||||
| 15,460 | CapLease, Inc. | 130,173 | |||||||||
| REIT - Health Care - 1.0% | |||||||||||
| 6,245 | Nationwide Health Properties, Inc. | 195,906 | |||||||||
| REIT - Office Property - 1.9% | |||||||||||
| 2,222 | Alexandria Real Estate Equities, Inc. | 225,911 | |||||||||
| 3,031 | Kilroy Realty Corp. | 166,584 | |||||||||
| 392,495 | |||||||||||
| REIT - Regional Malls - 1.7% | |||||||||||
| 6,891 | Taubman Centers, Inc. | 338,968 | |||||||||
| REIT - Shopping Centers - 1.0% | |||||||||||
| 7,862 | Acadia Realty Trust | 201,346 | |||||||||
| REIT - Warehouse and Industrial - 0.8% | |||||||||||
| 9,847 | First Potomac Realty Trust | 170,255 | |||||||||
| Resorts and Theme Parks - 1.1% | |||||||||||
| 3,995 | Vail Resorts, Inc.* | 214,971 | |||||||||
| Telecommunication Equipment - 2.0% | |||||||||||
| 40,425 | Arris Group, Inc.* | 403,442 | |||||||||
| Transportation - Equipment and Leasing - 1.5% | |||||||||||
| 8,541 | GATX Corp. | 313,284 | |||||||||
| Transportation - Marine - 2.0% | |||||||||||
| 21,415 | Horizon Lines, Inc. - Class A | 399,176 | |||||||||
| Transportation - Truck - 1.8% | |||||||||||
| 15,620 | Old Dominion Freight Line, Inc.* | 360,978 | |||||||||
| Water - 0.9% | |||||||||||
| 4,673 | American States Water Co. | 176,079 | |||||||||
| Wire and Cable Products - 1.5% | |||||||||||
| 6,694 | Belden, Inc. | 297,883 | |||||||||
| Total Common Stock (cost $18,416,047) | 19,087,861 | ||||||||||
| Money Markets - 6.6% | |||||||||||
| 1,181,700 | Janus Institutional Cash Management Fund - Institutional Shares, 4.98% | 1,181,700 | |||||||||
| 172,000 | Janus Institutional Money Market Fund - Institutional Shares, 4.91% | 172,000 | |||||||||
| Total Money Markets (cost $1,353,700) | 1,353,700 | ||||||||||
| Total Investments (total cost $19,769,747) – 100.5% | 20,441,561 | ||||||||||
| Liabilities, net of Cash, Receivables and Other Assets – (0.5)% | (105,782 | ) | |||||||||
| Net Assets – 100% | $ | 20,335,779 | |||||||||
Summary of Investments by Country – (Long Positions)
| Country | Value | % of Investment Securities | |||||||||
| Canada | $ | 158,326 | 0.8 | % | |||||||
| Cayman Islands | 71,788 | 0.3 | % | ||||||||
| United States†† | 20,211,447 | 98.9 | % | ||||||||
| Total | $ | 20,441,561 | 100.0 | % | |||||||
††Includes Short-Term Securities (92.3% excluding Short-Term Securities)
See Notes to Schedule of Investments and Financial Statements.
8 Janus Aspen Series December 31, 2007
Statement of Assets and Liabilities
| As of December 31, 2007 (all numbers in thousands except net asset value per share) | Janus Aspen Small Company Value Portfolio | ||||||
| Assets: | |||||||
| Investments at cost | $ | 19,770 | |||||
| Investments at value | $ | 19,088 | |||||
| Affiliated money market investments | 1,354 | ||||||
| Cash | 60 | ||||||
| Receivables: | |||||||
| Investments sold | 1,305 | ||||||
| Portfolio shares sold | 643 | ||||||
| Dividends | 30 | ||||||
| Interest | 5 | ||||||
| Non-interested Trustees' deferred compensation | – | ||||||
| Other assets | – | ||||||
| Total Assets | 22,485 | ||||||
| Liabilities: | |||||||
| Payables: | |||||||
| Investments purchased | 2,083 | ||||||
| Portfolio shares repurchased | – | ||||||
| Advisory fees | 8 | ||||||
| Transfer agent fees and expenses | 1 | ||||||
| Distribution fees - Service Shares | 4 | ||||||
| Administrative services fees - Service Shares | 2 | ||||||
| Non-interested Trustees' fees and expenses | 1 | ||||||
| Non-interested Trustees' deferred compensation fees | – | ||||||
| Accrued expenses | 50 | ||||||
| Total Liabilities | 2,149 | ||||||
| Net Assets | $ | 20,336 | |||||
| Net Assets Consist of: | |||||||
| Capital (par value and paid-in-surplus)* | $ | 19,316 | |||||
| Undistributed net investment income/(loss)* | (10 | ) | |||||
| Undistributed net realized gain/(loss) from investments and foreign currency transactions* | 358 | ||||||
| Unrealized net appreciation/(depreciation) of investments, foreign currency translations and non-interested Trustees' deferred compensation | 672 | ||||||
| Total Net Assets | $ | 20,336 | |||||
| Net Assets - Service Shares | $ | 20,336 | |||||
| Shares Outstanding, $0.001 Par Value (unlimited shares authorized) | 1,131 | ||||||
| Net Asset Value Per Share | $ | 17.99 | |||||
*See Note 3 in Notes to Financial Statements.
See Notes to Financial Statements.
Janus Aspen Series December 31, 2007 9
Statement of Operations
| For the fiscal year ended December 31, 2007 (all numbers in thousands) | Janus Aspen Small Company Value Portfolio | ||||||
| Investment Income: | |||||||
| Interest | $ | 1 | |||||
| Dividends | 246 | ||||||
| Dividends from affiliates | 36 | ||||||
| Foreign tax withheld | (1 | ) | |||||
| Total Investment Income | 282 | ||||||
| Expenses: | |||||||
| Advisory fees | 144 | ||||||
| Transfer agent fees and expenses | 3 | ||||||
| Registration fees | 2 | ||||||
| Custodian fees | 14 | ||||||
| Professional fees | 22 | ||||||
| Non-interested Trustees' fees and expenses | 5 | ||||||
| Printing expenses | 44 | ||||||
| Legal fees | 7 | ||||||
| System fees | 19 | ||||||
| Distribution fees - Service Shares | 49 | ||||||
| Administrative service fees – Service Shares | 19 | ||||||
| Other expenses | 6 | ||||||
| Non-recurring costs (Note 2) | – | ||||||
| Costs assumed by Janus Capital Management LLC (Note 2) | – | ||||||
| Total Expenses | 334 | ||||||
| Expense and Fee Offset | – | ||||||
| Net Expenses | 334 | ||||||
| Less: Excess Expense Reimbursement | (5 | ) | |||||
| Net Expenses after Expense Reimbursement | 329 | ||||||
| Net Investment Income/(Loss) | (47 | ) | |||||
| Net Realized and Unrealized Gain/(Loss) on Investments: | |||||||
| Net realized gain/(loss) from investment and foreign currency transactions | 669 | ||||||
| Change in unrealized net appreciation/(depreciation) of investments, foreign currency translations and non-interested Trustees' deferred compensation | (2,075 | ) | |||||
| Net Gain/(Loss) on Investments | (1,406 | ) | |||||
| Net Increase/(Decrease) in Net Assets Resulting from Operations | $ | (1,453 | ) | ||||
See Notes to Financial Statements.
10 Janus Aspen Series December 31, 2007
Statements of Changes in Net Assets
| For the fiscal years ended December 31 | Janus Aspen Small Company Value Portfolio | ||||||||||
| (all numbers in thousands) | 2007 | 2006 | |||||||||
| Operations: | |||||||||||
| Net investment income/(loss) | $ | (47 | ) | $ | (41 | ) | |||||
| Net realized gain/(loss) from investment and foreign currency transactions | 669 | 689 | |||||||||
| Change in unrealized net appreciation/(depreciation) of investments, foreign currency translations and non-interested Trustees' deferred compensation | (2,075 | ) | 1,878 | ||||||||
| Net Increase/(Decrease) in Net Assets Resulting from Operations | (1,453 | ) | 2,526 | ||||||||
| Dividends and Distributions to Shareholders: | |||||||||||
| Net investment income* | |||||||||||
| Service Shares | – | – | |||||||||
| Net realized gain/(loss) from investment transactions* | |||||||||||
| Service Shares | (698 | ) | (125 | ) | |||||||
| Net Decrease from Dividends and Distributions | (698 | ) | (125 | ) | |||||||
| Capital Share Transactions: | |||||||||||
| Shares sold | |||||||||||
| Service Shares | 9,153 | 8,319 | |||||||||
| Reinvested dividends and distributions | |||||||||||
| Service Shares | 698 | 125 | |||||||||
| Shares repurchased | |||||||||||
| Service Shares | (4,209 | ) | (3,013 | ) | |||||||
| Net Increase/(Decrease) from Capital Share Transactions | 5,642 | 5,431 | |||||||||
| Net Increase/(Decrease) in Net Assets | 3,491 | 7,832 | |||||||||
| Net Assets: | |||||||||||
| Beginning of period | 16,845 | 9,013 | |||||||||
| End of period | $ | 20,336 | $ | 16,845 | |||||||
| Undistributed net investment income/(loss)* | $ | (10 | ) | $ | (6 | ) | |||||
*See Note 3 in Notes to Financial Statements.
See Notes to Financial Statements.
Janus Aspen Series December 31, 2007 11
Financial Highlights - Service Shares
| For a share outstanding during each fiscal year ended December 31 | Janus Aspen Small Company Value Portfolio | ||||||||||||||||||||||
| 2007 | 2006 | 2005 | 2004 | 2003 | |||||||||||||||||||
| Net Asset Value, Beginning of Period | $ | 19.89 | $ | 16.45 | $ | 15.90 | $ | 14.20 | $ | 9.92 | |||||||||||||
| Income from Investment Operations: | |||||||||||||||||||||||
| Net investment income/(loss) | – | (.01 | ) | – | .01 | .02 | |||||||||||||||||
| Net gain/(loss) on securities (both realized and unrealized) | (1.16 | ) | 3.60 | .55 | 2.51 | 4.26 | |||||||||||||||||
| Total from Investment Operations | (1.16 | ) | 3.59 | .55 | 2.52 | 4.28 | |||||||||||||||||
| Less Distributions: | |||||||||||||||||||||||
| Dividends (from net investment income)* | – | – | – | (.02 | ) | – | |||||||||||||||||
| Distributions (from capital gains)* | (.74 | ) | (.15 | ) | – | (.80 | ) | – | |||||||||||||||
| Total Distributions | (.74 | ) | (.15 | ) | – | (.82 | ) | – | |||||||||||||||
| Net Asset Value, End of Period | $ | 17.99 | $ | 19.89 | $ | 16.45 | $ | 15.90 | $ | 14.20 | |||||||||||||
| Total Return | (6.11 | )% | 21.80 | % | 3.49 | % | 18.16 | % | 43.15 | % | |||||||||||||
| Net Assets, End of Period (in thousands) | $ | 20,336 | $ | 16,845 | $ | 9,013 | $ | 2,755 | $ | 1,626 | |||||||||||||
| Average Net Assets for the Period (in thousands) | $ | 19,537 | $ | 13,106 | $ | 5,120 | $ | 2,062 | $ | 856 | |||||||||||||
| Ratio of Gross Expenses to Average Net Assets(1) | 1.69 | % | 1.69 | % | 1.69 | % | 1.60 | % | 1.60 | % | |||||||||||||
| Ratio of Net Expenses to Average Net Assets(1) | 1.69 | % | 1.69 | % | 1.69 | % | 1.59 | % | 1.60 | % | |||||||||||||
| Ratio of Net Investment Income/(Loss) to Average Net Assets | (0.24 | )% | (0.32 | )% | (0.25 | )% | (0.05 | )% | 0.14 | % | |||||||||||||
| Portfolio Turnover Rate | 72 | % | 59 | % | 53 | % | 43 | % | 50 | % | |||||||||||||
* See Note 3 in Notes to Financial Statements.
(1) See Note 4 in Notes to Financial Statements.
See Notes to Financial Statements.
12 Janus Aspen Series December 31, 2007
Notes to Schedule of Investments
| Lipper Variable Annuity Small-Cap Core Funds | Funds that, by portfolio practice, invest at least 75% of their equity assets in companies with market capitalizations (on a three-year weighted basis) less than 250% of the dollar-weighted median of the smallest 500 of the middle 1,000 securities of the S&P SuperComposite 1500 Index. Small-cap core funds have more latitude in the companies in which they invest. These funds typically have an average price-to-earnings ratio, price-to-book ratio, and three-year sales-per-share growth value, compared to the S&P SmallCap 600 Index. | ||||||
| Russell 2000® Value Index | Measures the performance of those Russell 2000® companies with lower price-to-book ratios and lower forecasted growth values. | ||||||
| REIT | Real Estate Investment Trust | ||||||
* Non-income-producing security.
Janus Aspen Series December 31, 2007 13
Notes to Financial Statements
The following section describes the organization and significant accounting policies and provides more detailed information about the schedules and tables that appear throughout this report. In addition, the Notes to Financial Statements explain the methods used in preparing and presenting this report.
1. ORGANIZATION AND SIGNIFICANT ACCOUNTING POLICIES
Janus Aspen Small Company Value Portfolio (the "Portfolio") is a series fund. The Portfolio is part of Janus Aspen Series (the "Trust"), which is organized as a Delaware statutory trust and is registered under the Investment Company Act of 1940, as amended, (the "1940 Act") as an open-end management investment company. The Trust offers seventeen Portfolios, which include multiple series of shares, with differing investment objectives and policies. The Portfolio invests primarily in equity securities. The Portfolio is classified as diversified, as defined in the 1940 Act. The Portfolio is a no-load investment.
The Portfolio currently offers one class of shares: Service Shares. Service Shares are offered only in connection with investment in and payments under variable insurance contracts and to qualified retirement plans that require a fee from Portfolio assets to procure distribution and administrative services to contract owners and plan participants.
Janus Capital invested initial seed capital in the amount of $500,000 for the Portfolio on December 31, 2002.
The following accounting policies have been consistently followed by the Portfolio and are in conformity with accounting principles generally accepted in the United States of America in the investment company industry.
Investment Valuation
Securities are valued at the last sales price or the official closing price for securities traded on a principal securities exchange (U.S. or foreign) and on the NASDAQ National Market. Securities traded on over-the-counter markets and listed securities for which no sales are reported are valued at the latest bid price (or yield equivalent thereof) obtained from one or more dealers transacting in a market for such securities or by a pricing service approved by the Portfolio's Trustees. Short-term securities with maturities of 60 days or less may be valued at amortized cost, which approximates market value. Debt securities with a remaining maturity of greater than 60 days are valued in accordance with the evaluated bid price supplied by the pricing service. The evaluated bid price supplied by the pricing service is an evaluation that reflects such factors as security prices, yields, maturities and ratings. Foreign securities and currencies ar e converted to U.S. dollars using the applicable exchange rate in effect as of the daily close of the New York Stock Exchange ("NYSE"). When market quotations are not readily available or deemed unreliable, or events or circumstances that may affect the value of portfolio securities held by the Portfolio are identified between the closing of their principal markets and the time the net asset value ("NAV") is determined, securities may be valued at fair value as determined in good faith under procedures established by and under the supervision of the Portfolio's Trustees. Circumstances in which fair value pricing may be utilized include, but are not limited to: (i) when significant events occur which may affect the securities of a single issuer, such as mergers, bankruptcies, or significant issuer specific developments; (ii) when significant events occur which may affect an entire market, such as natural disasters or significant governmen tal actions; and (iii) when non-significant events occur such as markets closing early or not opening, security trading halts, or pricing of non-valued securities and restricted or non-public securities. The Portfolio may use a systematic fair valuation model provided by an independent third party to value international equity securities in order to adjust for stale pricing, which may occur between the close of certain foreign exchanges and the NYSE.
Investment Transactions and Investment Income
Investment transactions are accounted for as of the date purchased or sold (trade date). Dividend income is recorded on the ex-dividend date. Certain dividends from foreign securities will be recorded as soon as the Trust is informed of the dividend if such information is obtained subsequent to the ex-dividend date. Dividends from foreign securities may be subject to withholding taxes in foreign jurisdictions. Interest income is recorded on the accrual basis and includes amortization of premiums and accretion of discounts. Gains and losses are determined on the identified cost basis, which is the same basis used for federal income tax purposes.
Expenses
The Portfolio bears expenses incurred specifically on its behalf as well as a portion of general expenses, which may be allocated pro rata to the Portfolio.
Interfund Lending
Pursuant to an exemptive order received from the Securities and Exchange Commission ("SEC"), the Portfolio may be party to an interfund lending agreement between the Portfolio and other Janus Capital sponsored mutual funds, which permits it to borrow or lend cash at a rate beneficial to both the borrowing and lending funds. Outstanding borrowings from all sources totaling 10% or more of the borrowing Portfolio's total assets must be collateralized at 102% of the outstanding principal value of the loan; loans of less than 10% may be unsecured. During the fiscal year ended December 31, 2007, there were no outstanding interfund borrowing or lending arrangements for the Portfolio.
Forward Currency Transactions
The Portfolio may enter into forward currency contracts in order to reduce its exposure to changes in foreign currency exchange rates on its foreign portfolio holdings and to lock in the U.S. dollar cost of firm purchase and sale commitments for securities denominated in or exposed to foreign currencies. A forward currency exchange contract is a commitment to purchase or sell a foreign currency at a future date at a negotiated rate. The gain or loss arising from the difference between the U.S. dollar cost of the original contract and the value of the foreign currency in U.S. dollars upon closing a
14 Janus Aspen Series December 31, 2007
contract is included in "Net realized gain/(loss) from investment and foreign currency transactions" on the Statement of Operations (if applicable).
Forward currency contracts held by the Portfolio are fully collateralized by other securities, which are denoted in the accompanying Schedule of Investments (if applicable). The collateral is evaluated daily to ensure its market value equals or exceeds the current market value of the corresponding forward currency contracts. As of December 31, 2007, the Portfolio was not invested in forward foreign currency contracts.
Futures Contracts
The Portfolio may enter into futures contracts to gain exposure to the stock market pending investment of cash balances or to meet liquidity needs. The Portfolio may also use such derivative instruments primarily to hedge or protect from adverse movements in securities prices, currency rates or interest rates. The use of futures contracts may involve risks such as the possibility of illiquid markets or imperfect correlation between the value of the contracts and the underlying securities, or that the counterparty will fail to perform its obligations.
Futures contracts are marked-to-market daily, and the daily variation margin is recorded as a receivable or payable on the Statement of Assets and Liabilities (if applicable). When a contract is closed, a realized gain or loss is recorded as "Net realized gain/(loss) from futures contracts" on the Statement of Operations (if applicable) equal to the difference between the opening and closing value of the contract. Generally, futures contracts are marked-to-market (i.e., treated as realized and subject to distribution) for federal income tax purposes at fiscal year-end. Securities designated as collateral for market value on futures contracts are noted in the Schedule of Investments (if applicable). Such collateral is in the possession of the Portfolio's custodian. As of December 31, 2007, the Portfolio was not invested in futures contracts.
Short Sales
The Portfolio may engage in "short sales against the box." Short sales against the box involve either selling short a security that the Portfolio owns, or selling short a security that the Portfolio has the right to obtain, for delivery at a specified date in the future. The Portfolio may enter into a short sale against the box to hedge against anticipated declines in the market price of portfolio securities by locking in gains. The Portfolio does not deliver from its portfolio the securities sold short and does not immediately receive the proceeds of the short sale. The Portfolio borrows the securities sold short and receives proceeds from the short sale only when it delivers the securities to the lender. If the value of the securities sold short increases prior to the scheduled delivery date, the Portfolio loses the opportunity to participate in the gain.
The Portfolio may engage in short sales when the portfolio manager anticipates that a security's market purchase price will be less than its borrowing price. To complete the transaction, the Portfolio must borrow the security to deliver it to the purchaser and buy that same security in the market to return it to the lender. The total market value of all of the Portfolio's short sale positions will not exceed 10% of its assets. Although the potential for gain is limited to the difference between the price at which the Portfolio sold the security short and the cost of borrowing the security, its potential for loss is theoretically unlimited because there is no limit to the cost of replacing the borrowed security. There is no assurance that the Portfolio will be able to close out a short position at a particular time or at an acceptable price. A gain or a loss will be recog nized upon termination of a short sale. There is no limit to the size of any loss that the Portfolio may recognize upon termination of a short sale. Short sales held by the Portfolio are fully collateralized by other securities, which are denoted in the accompanying Schedule of Investments (if applicable). As of December 31, 2007, the Portfolio was not engaged in short sales.
Foreign Currency Translations
The Portfolio does not isolate that portion of the results of operations resulting from changes in foreign exchange rates on investments from the fluctuations arising from changes in market prices of securities held at the date of the financial statements. Net unrealized appreciation or depreciation on investments and foreign currency translation arise from changes in the value of assets and liabilities, including investments in securities held at the date of the financial statements, resulting from changes in the exchange rates and changes in market prices of securities held.
Currency gains and losses are also calculated on payables and receivables that are denominated in foreign currencies. The payables and receivables are generally related to foreign security transactions and income.
Foreign currency-denominated assets and forward currency contracts may involve more risks than domestic transactions, including currency risk, political and economic risk, regulatory risk and market risk. Risks may arise from the potential inability of a counterparty to meet the terms of a contract and from unanticipated movements in the value of foreign currencies relative to the U.S. dollar.
When-issued Securities
The Portfolio may purchase or sell securities on a when-issued or forward commitment basis. The price of the underlying securities and date when the securities will be delivered and paid for are fixed at the time the transaction is negotiated. Losses may arise due to changes in the market value of the securities or from the inability of counterparties to meet the terms of the contract. In connection with such purchases, the Portfolio may hold liquid assets as collateral with the Portfolio's custodian sufficient to cover the purchase price. As of December 31, 2007, the Portfolio was not invested in when-issued securities.
Equity-Linked Structured Notes
The Portfolio may invest in equity-linked structured notes. Equity-linked structured notes are derivative securities which
Janus Aspen Series December 31, 2007 15
Notes to Financial Statements (continued)
are specially designed to combine the characteristics of one or more underlying securities and their equity derivatives in a single note form. The return and/or yield or income component may be based on the performance of the underlying equity securities, an equity index, and/or option positions. Equity-linked structured notes are typically offered in limited transactions by financial institutions in either registered or non-registered form. An investment in equity-linked structured notes creates exposure to the credit risk of the issuing financial institution, as well as to the market risk of the underlying securities. There is no guaranteed return of principal with these securities and the appreciation potential of these securities may be limited by a maximum payment or call right. In certain cases, equity-linked structured notes may be more volatile and less liquid than less complex securities or other types of fixed-income securities. Su ch securities may exhibit price behavior that does not correlate with other fixed-income securities. As of December 31, 2007, the Portfolio was not invested in equity-linked structured notes.
Initial Public Offerings
The Portfolio may invest in initial public offerings ("IPOs"). IPOs and other investment techniques may have a magnified performance impact on a fund with a small asset base. The Portfolio may not experience similar performance as its assets grow.
Restricted Security Transactions
Restricted securities held by the Portfolio may not be sold except in exempt transactions or in a public offering registered under the Securities Act of 1933. The risk of investing in such securities is generally greater than the risk of investing in the securities of widely held, publicly traded companies. Lack of a secondary market and resale restrictions may result in the inability of the Portfolio to sell a security at a fair price and may substantially delay the sale of the security. In addition, these securities may exhibit greater price volatility than securities for which secondary markets exist. As of December 31, 2007, the Portfolio was not invested in restricted securities.
Dividend Distributions
The Portfolio may make semiannual distributions of substantially all of its investment income and an annual distribution of its net realized capital gains (if any). The majority of dividends and net realized capital gains distributions from the Portfolio may be automatically reinvested into additional shares of the Portfolio, based upon the discretion of the shareholder.
The Portfolio has made certain investments in real estate investment trusts ("REITs") which pay dividends to their shareholders based upon funds available from operations. It is quite common for these dividends to exceed the REIT's taxable earnings and profits resulting in the excess portion of such dividends being designated as a return of capital. If the Portfolio distributes such amounts, such distribution could constitute a return of capital to shareholders for federal income tax purposes.
Estimates
The preparation of financial statements in conformity with accounting principles generally accepted in the United States of America requires management to make estimates and assumptions that affect the reported amount of assets and liabilities and disclosure of contingent assets and liabilities at the date of the financial statements, and the reported amounts of income and expenses during the reporting period. Actual results could differ from those estimates.
Federal Income Taxes
No provision for income taxes is included in the accompanying financial statements, as the Portfolio intends to distribute to shareholders all taxable investment income and realized gains and otherwise comply with Subchapter M of the Internal Revenue Code applicable to regulated investment companies.
New Accounting Pronouncements
In July 2006, the Financial Accounting Standards Board ("FASB") issued Interpretation No. 48, "Accounting for Uncertainty in Income Taxes – an Interpretation of FASB Statement No. 109" (the "Interpretation"). The Interpretation establishes for all entities, including pass-through entities such as the Portfolio, a minimum threshold for financial statement recognition of the benefit of positions taken in filing tax returns (including whether an entity is taxable in a particular jurisdiction), and requires certain expanded tax disclosures. A calendar year open-end or closed-end fund was required to implement the Interpretation no later than June 29, 2007 (the last business day of the semi-annual reporting period), and the Interpretation also applies to all open tax years as of the date of effectiveness. Management has evaluated the application of the Interpretation to the Portfolio and has determined there is no significant impact on the P ortfolio's financial statements.
In September 2006, the FASB issued Statement of Financial Accounting Standards No. 157, "Fair Value Measurements" ("SFAS No. 157"), which defines fair value, establishes a framework for measuring fair value in generally accepted accounting principles, and expands disclosures about fair value measurements. SFAS No. 157 does not require new fair value measurements, but is applied to the extent that other accounting pronouncements require or permit fair value measurements. SFAS No. 157 emphasizes that fair value is a market-based measurement that should be determined based on the assumptions that market participants would use in pricing an asset or liability. SFAS No. 157 is effective for fiscal years beginning after November 15, 2007 and interim periods within those fiscal years. Management does not believe the adoption of SFAS No. 157 will impact the financial statement amounts, however, the Portfolio will be required to disclose the extent t o which fair value is used to measure assets and liabilities and the inputs used to develop the measurements.
2. INVESTMENT ADVISORY AGREEMENTS AND OTHER TRANSACTIONS WITH AFFILIATES
The Portfolio pays a monthly advisory fee to Janus Capital based upon average daily net assets and calculated at the annual rate of 0.74%.
16 Janus Aspen Series December 31, 2007
Janus Capital has agreed until at least May 1, 2009 to reimburse the Portfolio by the amount, if any, that the normal operating expenses in any fiscal year, including the investment advisory fee but excluding the distribution and shareholder servicing (12b-1) fees applicable to Service Shares, the administrative services fees applicable to Service Shares, brokerage commissions, interest, taxes and extraordinary expenses, exceed an annual rate of 1.34% of the average daily net assets of the Portfolio. The Portfolio is not required to repay any such waived fees in future years to Janus Capital.
Janus Services LLC ("Janus Services"), a wholly-owned subsidiary of Janus Capital, is the Portfolio's transfer agent. Janus Services receives from the Portfolio a fee at an annual rate of up to 10% of the average daily net assets of Service Shares of the Portfolio, to compensate Janus Services for providing, or arranging for the provision of record keeping, subaccounting and administrative services.
Janus Services receives certain out-of-pocket expenses for transfer agent services.
Certain officers of the Portfolio may also be officers and/or directors of Janus Capital. Such officers receive no compensation from the Portfolio, except for the Portfolio's Chief Compliance Officer. Effective January 1, 2006, the Portfolio began reimbursing the adviser for a portion of the compensation paid to the Chief Compliance Officer of the Trust. Total compensation of $3,078 was paid by the Portfolio during the fiscal year ended December 31, 2007. The Portfolio's portion is reported as part of "Other Expenses" on the Statement of Operations.
The Board of Trustees has adopted a deferred compensation plan (the "Deferred Plan") for independent Trustees to elect to defer receipt of all or a portion of the annual compensation they are entitled to receive from the Portfolio. All deferred fees are credited to an account established in the name of the Trustees. The amounts credited to the account then increase or decrease, as the case may be, in accordance with the performance of one or more of the Janus funds that are selected by the Trustees. The account balance continues to fluctuate in accordance with the performance of the selected fund or funds until final payment of all amounts credited to the account. The fluctuation of the account balance is recorded by the Portfolio as unrealized appreciation/(depreciation) and is shown as of December 31, 2007 on the Statement of Assets and Liabilities as an asset, "Non-interested Trustees' deferred compensation," and a liability, "Non-interes ted Trustees' deferred compensation fees." Additionally, the recorded unrealized appreciation/(depreciation) is included in "Unrealized net appreciation/(depreciation) of investments, foreign currency translations and non-interested Trustees' deferred compensation" on the Statement of Assets and Liabilities. Deferred compensation expenses for the fiscal year ended December 31, 2007 are included in "Non-interested Trustees' fees and expenses" on the Statement of Operations. Trustees are allowed to change their designation of mutual funds from time to time. Amounts will be deferred until distributed in accordance with the Deferred Plan. No deferred fees were paid to any Trustee under the Deferred Plan during the fiscal year ended December 31, 2007.
For the fiscal year ended December 31, 2007, Janus Capital assumed $24,421 of legal, consulting and Trustee costs and fees incurred by the funds in Janus Investment Fund, Janus Aspen Series and Janus Adviser Series (the "Funds") in connection with the regulatory and civil litigation matters discussed in Note 7. These non-recurring costs were allocated to all Funds based on the Funds' respective net assets as of July 31, 2004. Additionally, all future non-recurring costs will be allocated to the Funds based on the Funds' respective net assets on July 31, 2004. These "Non-recurring costs" and "Costs assumed by Janus Capital" are shown on the Statement of Operations.
Janus Distributors LLC, a wholly-owned subsidiary of Janus Capital, is a distributor of the Portfolio. Service Shares have adopted a Distribution and Shareholder Servicing Plan (the "Plan") pursuant to Rule 12b-1 under the 1940 Act. The Plan authorizes payments by the Portfolio in connection with the distribution of Service Shares at an annual rate of up to 0.25% of Service Share's average daily net assets.
The Portfolio's expenses may be reduced by expense offsets from an unaffiliated custodian and/or transfer agent. Such credits or offsets are included in "Expense and Fee Offset" on the Statement of Operations. The transfer agent fee offsets received during the period reduce Transfer Agent Fees and Expenses. Custodian offsets received reduce Custodian Fees. The Portfolio could have employed the assets used by the custodian and/or transfer agent to produce income if it had not entered into an expense offset arrangement.
The Portfolio may invest in money market funds, including funds managed by Janus Capital. During the fiscal year ended December 31, 2007, the Portfolio recorded distributions from affiliated investment companies as affiliated dividend income, and had the following affiliated purchases and sales:
| Purchases Shares/Cost | Sales Shares/Cost | Dividend Income | Value at 12/31/07 | ||||||||||||||||
| Janus Aspen Small Company Value Portfolio | |||||||||||||||||||
| Janus Institutional Cash Management Fund – Institutional Shares | $ | 6,587,261 | $ | 5,405,561 | $ | 26,739 | $ | 1,181,700 | |||||||||||
| Janus Institutional Cash Reserves Fund | 245,997 | 317,472 | 1,882 | – | |||||||||||||||
| Janus Institutional Money Market Fund – Institutional Shares | 5,205,666 | 5,033,666 | 7,021 | 172,000 | |||||||||||||||
| Janus Money Market Fund – Institutional Shares | 735,254 | 735,254 | 794 | – | |||||||||||||||
| $ | 12,774,178 | $ | 11,491,953 | $ | 36,436 | $ | 1,353,700 | ||||||||||||
Janus Aspen Series December 31, 2007 17
Notes to Financial Statements (continued)
3. FEDERAL INCOME TAX
The tax components of capital shown in the table below represent: (1) distribution requirements the Portfolio must satisfy under the income tax regulations; (2) losses or deductions the Portfolio may be able to offset against income and gains realized in future years; and (3) unrealized appreciation or depreciation of investments for federal income tax purposes (reduced by foreign tax liability).
In 2007, the Portfolio incurred "Post-October" losses during the period from November 1, 2007 through December 31, 2007. These losses will be deferred for tax purposes and recognized in 2008.
Other book to tax differences in the current year may consist of deferred compensation, derivatives, and foreign currency contract adjustments. The Portfolio has elected to treat gains and losses on forward foreign currency contracts as capital gains and losses. Other foreign currency gains and losses on debt instruments are treated as ordinary income for federal income tax purposes pursuant to Section 988 of the Internal Revenue Code.
Accumulated capital losses noted below represent net capital loss carryovers, as of December 31, 2007, that may be available to offset future realized capital gains and thereby reduce future taxable gain distributions.
| Portfolio | Undistributed Ordinary Income | Undistributed Long–Term Gains | Accumulated Capital Losses | Post October Deferral | Other Book to Tax Differences | Net Tax Appreciation/ (Depreciation) | |||||||||||||||||||||
| Janus Aspen Small Company Value Portfolio | $ | – | $ | 451,638 | $ | – | $ | (59 | ) | $ | (101 | ) | $ | 568,079 | |||||||||||||
The aggregate cost of investments and the composition of unrealized appreciation and depreciation of investment securities for federal income tax purposes as of December 31, 2007 are noted below.
Unrealized appreciation and unrealized depreciation in the table below exclude appreciation/depreciation on foreign currency translations. The primary difference between book and tax appreciation or depreciation of investments is wash sale loss deferrals.
| Portfolio | Federal Tax Cost | Unrealized Appreciation | Unrealized (Depreciation) | ||||||||||||
| Janus Aspen Small Company Value Portfolio | $ | 19,873,482 | $ | 2,515,828 | $ | (1,947,749 | ) | ||||||||
Income and capital gains distributions are determined in accordance with income tax regulations that may differ from accounting principles generally accepted in the United States of America. These differences are due to differing treatments for items such as net short-term gains, deferral of wash sale losses, foreign currency transactions, net investment losses and capital loss carryovers. Certain permanent differences such as tax returns of capital and net investment losses noted below have been reclassified to paid-in capital.
| For the fiscal year ended December 31, 2007 | Distributions | ||||||||||||||||||
| Portfolio | From Ordinary Income | From Long-Term Capital Gains | Tax Return of Capital | Net Investment Loss | |||||||||||||||
| Janus Aspen Small Company Value Portfolio | $ | 189,433 | $ | 508,455 | $ | – | $ | (43,465 | ) | ||||||||||
| For the fiscal year ended December 31, 2006 | Distributions | ||||||||||||||||||
| Portfolio | From Ordinary Income | From Long-Term Capital Gains | Tax Return of Capital | Net Investment Loss | |||||||||||||||
| Janus Aspen Small Company Value Portfolio | $ | – | $ | 124,828 | $ | – | $ | – | |||||||||||
18 Janus Aspen Series December 31, 2007
4. EXPENSE RATIOS
The expense ratios listed in the Financial Highlights reflect expenses prior to any expense offsets (gross expense ratio) and after expense offsets (net expense ratio). Both expense ratios reflect expenses after waivers (reimbursement). Listed below are the gross expense ratios for the Portfolio that would have been in effect, absent the waiver of certain fees and offsets.
| For each fiscal year ended December 31 | Services Shares | ||||||||||||||||||||||
| Portfolio | 2007(1) | 2006(1) | 2005(1) | 2004(1) | 2003 | ||||||||||||||||||
| Janus Aspen Small Company Value Portfolio | 1.71 | % | 2.19 | % | 2.79 | % | 4.49 | % | 12.61 | % | |||||||||||||
(1) The effect of non-recurring costs assumed by Janus Capital (Note 2) is included in the ratio of operating expenses to average net assets without waivers and/or expense reimbursements and was less than 0.01%.
5. CAPITAL SHARE TRANSACTIONS
| For each fiscal year ended December 31 | Janus Aspen Small Company Value Portfolio | ||||||||||
| (all numbers in thousands) | 2007 | 2006 | |||||||||
| Transactions in Portfolio Shares - Service Shares | |||||||||||
| Shares sold | 457 | 456 | |||||||||
| Reinvested dividends and distributions | 36 | 6 | |||||||||
| Shares repurchased | (209 | ) | (163 | ) | |||||||
| Net Increase/(Decrease) in Portfolio Shares | 284 | 299 | |||||||||
| Shares Outstanding, Beginning of Period | 847 | 548 | |||||||||
| Shares Outstanding, End of Period | 1,131 | 847 | |||||||||
6. PURCHASES AND SALES OF INVESTMENT SECURITIES
For the fiscal year ended December 31, 2007, the aggregate cost of purchases and proceeds from sales of investment securities (excluding short-term securities) were as follows:
| Portfolio | Purchases of Securities | Proceeds from Sales of Securities | Purchases of Long- Term U.S. Government Obligations | Proceeds from Sales of Long-Term U.S. Government Obligations | |||||||||||||||
| Janus Aspen Small Company Value Portfolio | $ | 17,181,953 | $ | 13,471,850 | $ | – | $ | – | |||||||||||
7. PENDING LEGAL MATTERS
In the fall of 2003, the Securities and Exchange Commission ("SEC"), the Office of the New York State Attorney General ("NYAG"), the Colorado Attorney General ("COAG"), and the Colorado Division of Securities ("CDS") announced that they were investigating alleged frequent trading practices in the mutual fund industry. On August 18, 2004, Janus Capital announced that it had reached final settlements with the SEC, the NYAG, the COAG, and the CDS related to such regulators' investigations into Janus Capital's frequent trading arrangements.
A number of civil lawsuits were brought against Janus Capital and certain of its affiliates, the Janus funds, and related entities and individuals based on allegations similar to those announced by the above regulators and were filed in several state and federal jurisdictions. Such lawsuits alleged a variety of theories for recovery including, but not limited to, the federal securities laws, other federal statutes (including ERISA), and various common law doctrines. The Judicial Panel on Multidistrict Litigation transferred these actions to the U.S. District Court for the District of Maryland (the "Court") for coordinated proceedings. On September 29, 2004, five consolidated amended complaints were filed with the Court that generally include: (i) claims by a putative class of investors in certain Janus funds asserting claims on behalf of the investor class (Marini, et al. v. Janus Investment Fund, et al., U.S. District Court, District of Maryland, Case No. 04-CV-00497); (ii) derivative claims by investors in certain Janus funds ostensibly on behalf of such funds (Steinberg et al. v. Janus Capital Management, LLC et al., U.S. District Court, District of Maryland, Case No. 04-CV-00518); (iii) claims on behalf of participants in the Janus 401(k) plan (Wangberger v.
Janus Aspen Series December 31, 2007 19
Notes to Financial Statements (continued)
Janus Capital Group Inc., 401(k) Advisory Committee, et al., U.S. District Court, District of Maryland, Case No. JFM-05-2711); (iv) claims brought on behalf of shareholders of Janus Capital Group Inc. ("JCGI") on a derivative basis against the Board of Directors of JCGI (Chasen v. Whiston, et al., U.S. District Court, District of Maryland, Case No. 04-MD-00855); and (v) claims by a putative class of shareholders of JCGI asserting claims on behalf of the shareholders (Wiggins, et al. v. Janus Capital Group, Inc., et al., U.S. District Court, District of Maryland, Case No. 04-CV-00818). Each of the five complaints initially named JCGI and/or Janus Capital as a defendant. In addition, the following were also named as defendants in one or more of the actions: Janus Investment Fund ("JIF"), Janus Aspen Series ("JAS"), Janus Adviser Series ("JAD"), Janus Distributors LLC, Enhanced Investment Technologies, LLC ("INTECH"), Bay I sle Financial LLC ("Bay Isle"), Perkins, Wolf, McDonnell and Company, LLC ("Perkins"), the Advisory Committee of the Janus 401(k) plan, and the current or former directors of JCGI.
On August 25, 2005, the Court entered orders dismissing most of the claims asserted against Janus Capital and its affiliates by fund investors in the Marini and Steinberg cases (actions (i) and (ii) above) except certain claims under Section 10(b) of the Securities Exchange Act of 1934 and under Section 36(b) of the Investment Company Act of 1940, as amended (the "1940 Act"). On August 15, 2006, the Wangberger complaint in the 401(k) plan class action (action (iii) above) was dismissed by the district court with prejudice. The plaintiff appealed that dismissal decision to the United States Court of Appeals for the Fourth Circuit. The appeal is still pending and argument in the matter was held in December 2007. The Court also dismissed the Chasen lawsuit (action (iv) above) against JCGI's Board of Directors without leave to amend. Finally, a Motion to Dismiss the Wiggins suit (action (v) above) was granted a nd the matter was dismissed in May 2007. However, in June 2007, Plaintiffs appealed that dismissal to the United States Court of Appeals for the Fourth Circuit. That appeal is currently pending.
In addition to the lawsuits described above, the Auditor of the State of West Virginia ("Auditor"), in his capacity as securities commissioner, has initiated administrative proceedings against many of the defendants in the market timing cases (including JCGI and Janus Capital) and, as a part of its relief, is seeking disgorgement and other monetary relief based on similar market timing allegations (In the Matter of Janus Capital Group Inc. et al., Before the Securities Commissioner, State of West Virginia, Summary Order No. 05-1320). The respondents in these proceedings collectively sought a Writ of Prohibition in state court, which was denied. Their subsequent Petition for Appeal was also denied. Consequently, in September 2006, JCGI and Janus Capital filed their answer to the Auditor's summary order instituting proceedings and requested a hearing. A status confe rence was held on June 28, 2007, during which the parties were ordered to submit their proposed scheduling order. To date, no scheduling order has been entered in the case. In addition to the pending Motion to Discharge Order to Show Cause, JCGI and Janus Capital, as well as other similarly situated defendants, continue to challenge the statutory authority of the Auditor to bring such an action.
Additional lawsuits may be filed against certain of the Janus funds, Janus Capital, and related parties in the future. Janus Capital does not currently believe that these pending actions will materially affect its ability to continue providing services it has agreed to provide to the Janus funds.
20 Janus Aspen Series December 31, 2007
Report of Independent Registered Public Accounting Firm
To the Trustees and Shareholders
of Janus Aspen Small Company Value Portfolio
In our opinion, the accompanying statement of assets and liabilities, including the schedule of investments, and the related statements of operations and of changes in net assets and the financial highlights present fairly, in all material respects, the financial position of Janus Aspen Small Company Value Portfolio (one of the portfolios constituting Janus Aspen Series, hereafter referred to as the "Portfolio") at December 31, 2007, the results of its operations for the year then ended, the changes in its net assets for each of the two years in the period then ended and the financial highlights for each of the five years in the period then ended, in conformity with accounting principles generally accepted in the United States of America. These financial statements and financial highlights (hereafter referred to as "financial statements") are the responsibility of the Portfolio's management; our responsibility is to express an opinion on the se financial statements based on our audits. We conducted our audits of these financial statements in accordance with the standards of the Public Company Accounting Oversight Board (United States). Those standards require that we plan and perform the audit to obtain reasonable assurance about whether the financial statements are free of material misstatement. An audit includes examining, on a test basis, evidence supporting the amounts and disclosures in the financial statements, assessing the accounting principles used and significant estimates made by management, and evaluating the overall financial statement presentation. We believe that our audits, which included confirmation of securities at December 31, 2007 by correspondence with the custodian, transfer agent and brokers, and the application of alternative auditing procedures where securities purchased had not been received, provide a reasonable basis for our opinion.

Denver, Colorado
February 15, 2008
Janus Aspen Series December 31, 2007 21
Additional Information (unaudited)
PROXY VOTING POLICIES AND VOTING RECORD
A description of the policies and procedures that the Portfolio uses to determine how to vote proxies relating to its portfolio securities is available: (i) without charge, upon request, by calling 1-800-525-0020 (toll free); (ii) on the Portfolio's website at www.janus.com/proxyvoting; and (iii) on the SEC's website at http://www.sec.gov. Additionally, information regarding the Portfolio's proxy voting record for the most recent twelve-month period ended June 30 is also available, free of charge, through www.janus.com/proxyvoting and from the SEC's website at http://www.sec.gov.
QUARTERLY PORTFOLIO HOLDINGS
The Portfolio files its complete portfolio holdings (schedule of investments) with the SEC for the first and third quarters of each fiscal year on Form N-Q within 60 days of the end of such fiscal quarter. The Portfolio's Form N-Q: (i) is available on the SEC's website at http://www.sec.gov; (ii) may be reviewed and copied at the SEC's Public Reference Room in Washington, D.C. (information on the Public Reference Room may be obtained by calling 1-800-SEC-0330); and (iii) is available without charge, upon request, by calling Janus at 1-800-525-0020 (toll free).
APPROVAL OF ADVISORY AGREEMENTS DURING THE PERIOD
The Trustees of Janus Aspen Series, none of whom has ever been affiliated with Janus Capital ("Independent Trustees"), oversee the management of each Portfolio and, as required by law, determine annually whether to continue the investment advisory agreement for each Portfolio and the subadvisory agreements for the three Portfolios that utilize subadvisers.
In connection with their most recent consideration of those agreements for each Portfolio, the Trustees received and reviewed a substantial amount of information provided by Janus Capital and the respective subadvisers in response to requests of the Independent Trustees and their independent legal counsel. They also received and reviewed a considerable amount of information and analysis provided by their independent fee consultant. Throughout their consideration of the agreements, the Independent Trustees were advised by their independent legal counsel. The Independent Trustees met with management to consider the agreements, and also met separately in executive session with their independent legal counsel and their independent fee consultant.
At a meeting held on December 14, 2007, based on their evaluation of the information provided by Janus Capital, the subadvisers and the independent fee consultant, as well as other information, the Trustees determined that the overall arrangements between each Portfolio and Janus Capital and each subadviser, as applicable, were fair and reasonable in light of the nature, extent and quality of the services provided by Janus Capital, its affiliates and the subadvisers, the fees charged for those services, and other matters that the Trustees considered relevant in the exercise of their business judgment. At that meeting the Trustees unanimously approved the continuation of the investment advisory agreement for each Portfolio, and the subadvisory agreement for each subadvised Portfolio, for the period from February 1, 2008 through February 1, 2009, subject to earlier termina tion as provided for in each agreement.
In considering the continuation of those agreements, the Trustees reviewed and analyzed various factors that they determined were relevant, including the factors described below, none of which by itself was considered dispositive. However, the material factors and conclusions that formed the basis for the Trustees' determination to approve the continuation of the agreements are discussed separately below.
Nature, Extent and Quality of Services
The Trustees reviewed the nature, extent and quality of the services provided by Janus Capital and the subadvisers to the Portfolios, taking into account the investment objective and strategy of each Portfolio, the knowledge of the Trustees gained from their regular meetings with management on at least a quarterly basis, and their ongoing review of information related to the Portfolios. In addition, the Trustees reviewed the resources and key personnel of Janus Capital and each subadviser, especially those who provide investment management services to the Portfolios. The Trustees also considered other services provided to the Portfolios by Janus Capital or the subadvisers, such as managing the execution of portfolio transactions and the selection of broker-dealers for those transactions, serving as the Portfolios' administrator, monitoring adherence to the Portfolios' investment restrictions, producing shareholder reports, providing support services for the Trustees and Trustee committees, communicating with shareholders, and overseeing the activities of other service providers, including monitoring compliance with various policies and procedures of the Portfolios and with applicable securities laws and regulations.
The Trustees concluded that the nature, extent and quality of the services provided by Janus Capital and/or the subadviser to each Portfolio were appropriate and consistent with the terms of the respective advisory and subadvisory agreements; that, taking into account steps taken to address those Portfolios whose performance lagged that of the median of their peers for certain periods, the quality of those services had been consistent with or superior to quality norms in the industry; and that the Portfolios were likely to benefit from the continued provision of those services. They also concluded that Janus Capital and each subadviser had sufficient personnel, with the appropriate education and experience, to
22 Janus Aspen Series December 31, 2007
serve the Portfolios effectively and had demonstrated its continuing ability to attract well-qualified personnel.
Performance of the Portfolios
The Trustees considered the investment results of each Portfolio over various time periods. They reviewed information comparing each Portfolio's performance with the performance of comparable funds and peer groups identified by Lipper Inc., an independent provider of investment company data, and with the Portfolio's benchmark index. They concluded that the performance of many Portfolios was good to very good under current market conditions. Although the performance of some Portfolios lagged that of the median of their peers for certain periods, the Trustees also concluded that Janus Capital had taken appropriate steps to address those instances of under-performance and that the more recent performance of most of those Portfolios had been improving.
Costs of Services Provided
The Trustees examined information on the fees and expenses of each Portfolio in comparison to similar information for comparable funds as provided by Lipper. They also reviewed an analysis of that information provided by their independent fee consultant and noted that the rate of management (investment advisory and administrative) fees for most of the Portfolios, in some cases after contractual expense limitations, was below the mean management fee rate of the respective peer group of funds selected by Lipper.
The Trustees considered the methodology used by Janus Capital and each subadviser in determining compensation payable to portfolio managers, the competitive environment for investment management talent and the competitive market for mutual funds in different distribution channels. They concluded that the compensation methodology provided a good alignment of the interests of the portfolio managers with those of Portfolio shareholders.
The Trustees also reviewed management fees charged by Janus Capital to its separate account clients and to its subadvised funds (for which Janus Capital provides only services related to portfolio management). Although in most instances subadvisory and separate account fee rates for various investment strategies were lower than management fee rates for Portfolios having a similar strategy, the Trustees noted that, under the terms of the management agreements with the Portfolios, Janus Capital performs significant additional services for the Portfolios that it does not provide to those other clients, including administrative services, oversight of the Portfolios' other service providers, Trustee support, regulatory compliance and numerous other services, and that, in serving the Portfolios, Janus Capital assumes many legal risks that it does not assume in servicing its ot her clients. Moreover, the Trustees noted that the spread between the average fee rates charged to the Portfolios and the fee rates that Janus Capital charged to its separate account clients was significantly smaller than the average spread for such fee rates of other advisers, based on publicly available data and research conducted by their independent fee consultant.
The Trustees reviewed information on the profitability to Janus Capital and its affiliates of their relationships with each Portfolio, as well as an explanation of the methodology used in allocating various expenses of Janus Capital and its affiliates among the Portfolios and other clients. They also reviewed the financial statements of Janus Capital's parent company and its corporate structure. In their review, the Trustees considered whether Janus Capital and each subadviser receives adequate incentives to manage the Portfolios effectively. They recognized that profitability comparisons among investment advisers are difficult because very little comparative information is publicly available and profitability of any adviser is affected by numerous factors, including the organizational structure of the particular adviser, the types of funds and other accounts it manages, possible other lines of business, the methodology for allocating expens es, and the adviser's capital structure and cost of capital. However, based on the information available and taking those factors into account, the Trustees concluded that Janus Capital's profitability with respect to each Portfolio in relation to the services rendered was not unreasonable.
The Trustees concluded that the management fees and other compensation payable by each Portfolio to Janus Capital and its affiliates, as well as the fees payable by Janus Capital or the Portfolios to the subadvisers of subadvised Portfolios, were reasonable in relation to the nature, extent and quality of the services provided, taking into account the fees charged by other advisers for managing comparable mutual funds with similar strategies and the fees Janus Capital and the subadvisers charge to other clients. They also concluded that the overall expense ratio of each Portfolio was reasonable, taking into account the size of the Portfolio, the quality of services provided by Janus Capital and any subadviser, the investment performance of the Portfolio and any expense limitations agreed to by Janus Capital.
Economies of Scale
The Trustees considered information about the potential for Janus Capital to realize economies of scale as the assets of the Portfolios increase. They noted that, although most Portfolios pay advisory fees at a fixed rate as a percentage of net assets, without any breakpoints, the management fee rate paid by each Portfolio, after any contractual expense limitations, was below the mean management fee rate of the Portfolio's peer
Janus Aspen Series December 31, 2007 23
Additional Information (unaudited) (continued)
group selected by Lipper; and, for those Portfolios whose expenses are being reduced by the contractual expense limitations of Janus Capital, Janus Capital is subsidizing the Portfolios because they have not reached adequate scale. Moreover, as the assets of many of the Portfolios declined in the past few years, those Portfolios benefited from having advisory fee rates that remained constant rather than increasing as assets declined. In addition, performance fee structures have been implemented for several Portfolios that will cause the effective rate of advisory fees payable by such a Portfolio to vary depending on the investment performance of the Portfolio relative to its benchmark index over the measurement period; and a few Portfolios have fee schedules with breakpoints and reduced fee rates above certain asset levels. The Trustees also noted that the Portfolios share directly in economies of scale through lower charges of third-party s ervice providers, based on the combined scale of all of the Portfolios. Based on all of the information they reviewed, the Trustees concluded that the current fee structure of each Portfolio was reasonable and that the current rates of fees do reflect a sharing between Janus Capital and the Portfolio of economies of scale at the current asset level of the Portfolio.
Other Benefits to Janus Capital
The Trustees also considered benefits that accrue to Janus Capital and its affiliates from their relationships with the Portfolios. They recognized that two affiliates of Janus Capital separately serve the Portfolios as transfer agent and distributor, respectively. They also considered Janus Capital's past and proposed use of commissions paid by Portfolios on their portfolio brokerage transactions to obtain proprietary and third-party research products and services benefiting those Portfolios and/or other clients of Janus Capital. The Trustees concluded that Janus Capital's use of "soft" commission dollars of a Portfolio to obtain proprietary and third-party research products and services was consistent with regulatory requirements and guidelines and was likely to benefit the Portfolios. The Trustees also concluded that, other than the services provided by Janus Capital and its affiliates pursuant to the agreements and the fees to be paid by each Portfolio therefor, the Portfolios and Janus Capital may potentially benefit from their relationship with each other in other ways. They concluded that Janus Capital benefits from the receipt of proprietary research products and services acquired through commissions paid on portfolio transactions of the Portfolios and that the Portfolios benefit from Janus Capital's receipt of those products and services, as well as research products and services acquired through commissions paid by other clients of Janus Capital. They further concluded that success of any Portfolio could attract other business to Janus Capital or other Janus funds and that the success of Janus Capital could enhance Janus Capital's ability to serve the Portfolios.
After full consideration of the above factors, as well as other factors, all of the Trustees, all of whom are Independent Trustees, concluded that the proposed continuation of the investment advisory agreement for each Portfolio, and the subadvisory agreement for each subadvised Portfolio, was in the best interest of the respective Portfolios and their shareholders.
24 Janus Aspen Series December 31, 2007
Explanations of Charts, Tables and
Financial Statements (unaudited)
1. PERFORMANCE OVERVIEWS
The performance overview graph compares the performance of a hypothetical $10,000 investment in the Portfolio with one or more widely used market indices. The hypothetical example does not represent the returns of any particular investment.
When comparing the performance of the Portfolio with an index, keep in mind that market indices do not include brokerage commissions that would be incurred if you purchased the individual securities in the index. They also do not include taxes payable on dividends and interest or operating expenses incurred if you maintained a Portfolio invested in the index.
Average annual total return is calculated by taking the growth or decline in value of an investment over a period of time, including reinvestment of any dividends, distributions and capital gains, then calculating the annual compounded percentage rate that would have produced the same result had the rate of growth been constant throughout the period. Average annual total return does not reflect the deduction of taxes that a shareholder would pay on Portfolio distributions or redemptions of Portfolio shares.
Pursuant to federal securities rules, expense ratios shown in the performance chart reflect subsidized and unsubsidized ratios for the past fiscal year. The total annual portfolio operating expenses ratio is gross of any fee waivers, reflecting a Portfolio's unsubsidized expense ratio. The net annual portfolio operating expenses ratio (if applicable) includes contractual waivers of Janus Capital and/or Janus Services and reflects a Portfolio's subsidized expense ratio. Both the total annual portfolio operating expenses ratio and net annual portfolio operating expenses ratio are based on average net assets as of the fiscal year ended December 31, 2006. The ratios also include expenses indirectly incurred by the Portfolio as a result of investing in other investment companies or pooled investments, which are not reflected in the "Financial Highlights" of this report. As a result, these ratios may be higher or lower than those shown in the "Fin ancial Highlights" in this report. All expenses are shown without the effect of expense offset arrangements. Pursuant to such arrangements, credits realized as a result of uninvested cash balances are used to reduce custodian and transfer agent expenses.
2. SCHEDULE OF INVESTMENTS
Following the performance overview section is the Portfolio's Schedule of Investments. This schedule reports the industry concentrations and types of securities held in the Portfolio on the last day of the reporting period. Securities are usually listed by type (common stock, corporate bonds, U.S. Government obligations, etc.) and by industry classification (banking, communications, insurance, etc.). Holdings are subject to change without notice.
The value of each security is quoted as of the last day of the reporting period. The value of securities denominated in foreign currencies is converted into U.S. dollars. Certain short-term investments maturing within 60 days are valued at amortized cost, which approximates market value.
A summary of investments by country is provided if the Portfolio invested in foreign securities. This summary reports the Portfolio's exposure to different countries by providing the percentage of securities invested in each country. The country of each security represents the country in which the company is incorporated.
2A. FORWARD CURRENCY CONTRACTS
A table listing forward currency contracts follows the Portfolio's Schedule of Investments (if applicable). Forward currency contracts are agreements to deliver or receive a preset amount of currency at a future date. Forward currency contracts are used to hedge against foreign currency risk in the Portfolio's long-term holdings.
The table provides the name of the foreign currency, the settlement date of the contract, the amount of the contract, the value of the currency in U.S. dollars and the amount of unrealized gain or loss. The amount of unrealized gain or loss reflects the change in currency exchange rates from the time the contract was opened to the last day of the reporting period.
2B. FUTURES
A table listing futures contracts follows the Portfolio's Schedule of Investments (if applicable). Futures contracts are contracts that obligate the buyer to receive and the seller to deliver an instrument or money at a specified price on a specified date. Futures are used to hedge against adverse movements in securities prices, currency risk or interest rates.
The table provides the name of the contract, number of contracts held, the expiration date, the principal amount, value and the amount of unrealized gain or loss. The amount of unrealized gain or loss reflects the marked-to-market amount for the last day of the reporting period.
3. STATEMENT OF ASSETS AND LIABILITIES
This statement is often referred to as the "balance sheet." It lists the assets and liabilities of the Portfolio on the last day of the reporting period.
The Portfolio's assets are calculated by adding the value of the securities owned, the receivable for securities sold but not yet settled, the receivable for dividends declared but not yet received on stocks owned and the receivable for Portfolio shares sold to investors but not yet settled. The Portfolio's liabilities include payables for securities purchased but not yet settled, Portfolio shares redeemed but not yet paid and expenses owed but not yet paid. Additionally, there may be other assets and liabilities such as unrealized gain or loss on forward currency contracts.
The section entitled "Net Assets Consist of" breaks down the components of the Portfolio's net assets. Because the Portfolio
Janus Aspen Series December 31, 2007 25
Explanations of Charts, Tables and
Financial Statements (unaudited) (continued)
must distribute substantially all earnings, you will notice that a significant portion of net assets is shareholder capital.
The last section of this statement reports the net asset value ("NAV") per share on the last day of the reporting period for the Portfolio. The NAV is calculated by dividing the Portfolio's net assets (assets minus liabilities) by the number of shares outstanding.
4. STATEMENT OF OPERATIONS
This statement details the Portfolio's income, expenses, gains and losses on securities and currency transactions, and appreciation or depreciation of current Portfolio holdings.
The first section in this statement, entitled "Investment Income," reports the dividends earned from stocks and interest earned from interest-bearing securities in the Portfolio.
The next section reports the expenses and expense offsets incurred by the Portfolio, including the advisory fee paid to the investment adviser, transfer agent fees and expenses, printing and postage for mailing statements, financial reports and prospectuses, and other expenses. Expense offsets, if any, are also shown.
The last section lists the increase or decrease in the value of securities held in the Portfolio. The Portfolio realizes a gain (or loss) when it sells its position in a particular security. An unrealized gain (or loss) refers to the change in net appreciation or depreciation of the Portfolio during the reporting period. "Net Realized and Unrealized Gain/(Loss) on Investments" is affected both by changes in the market value of Portfolio holdings and by gains (or losses) realized during the reporting period.
5. STATEMENT OF CHANGES IN NET ASSETS
This statement reports the increase or decrease in the Portfolio's net assets during the reporting period. Changes in the Portfolio's net assets are attributable to investment operations, dividends, distributions and capital share transactions. This is important to investors because it shows exactly what caused the Portfolio's net asset size to change during the period.
The first section summarizes the information from the Statement of Operations regarding changes in net assets due to the Portfolio's investment performance. The Portfolio's net assets may also change as a result of dividend and capital gains distributions to investors. If investors receive their dividends in cash, money is taken out of the Portfolio to pay the distribution. If investors reinvest their dividends, the Portfolio's net assets will not be affected. If you compare the Portfolio's "Net Decrease from Dividends and Distributions" to the "Reinvested dividends and distributions," you will notice that dividend distributions had little effect on the Portfolio's net assets. This is because the majority of Janus investors reinvest their distributions.
The reinvestment of dividends is included under "Capital Share Transactions." "Capital Shares" refers to the money investors contribute to the Portfolio through purchases or withdraw via redemptions. The Portfolio's net assets will increase and decrease in value as investors purchase and redeem shares from the Portfolio.
6. FINANCIAL HIGHLIGHTS
This schedule provides a per-share breakdown of the components that affect the Portfolio's NAV for current and past reporting periods. Not only does this table provide you with total return, it also reports total distributions, asset size, expense ratios and portfolio turnover rate.
The first line in the table reflects the NAV per share at the beginning of the reporting period. The next line reports the net investment income per share, which comprises dividends and interest income earned on securities held by the Portfolio. Following is the total of gains/(losses), realized and unrealized. Dividends and distributions are then subtracted to arrive at the NAV per share at the end of the period. The next line reflects the average annual total return reported the last day of the period.
Also included are the expense ratios, or the percentage of average net assets that were used to cover operating expenses during the period. Expense ratios vary for a number of reasons, including the differences in management fees, the average shareholder account size and the extent of foreign investments, which entail greater transaction costs.
The Portfolio's expenses may be reduced through expense reduction arrangements. These arrangements may include the use of balance credits or transfer agent fee offsets. The Statement of Operations reflects total expenses before any such offset, the amount of the offset and the net expenses. The expense ratios listed in the Financial Highlights reflect total expenses prior to any expense offsets (gross expense ratio) and after the expense offsets (net expense ratio). Both expense ratios reflect expenses after waivers (reimbursements), if applicable.
The ratio of net investment income/(loss) summarizes the income earned less expenses, divided by the average net assets of the Portfolio during the reporting period. Don't confuse this ratio with the Portfolio's yield. The net investment income ratio is not a true measure of the Portfolio's yield because it doesn't take into account the dividends distributed to the Portfolio's investors.
The next figure is the portfolio turnover rate, which measures the buying and selling activity in the Portfolio. Portfolio turnover is affected by market conditions, changes in the asset size of the Portfolio, the nature of the Portfolio's investments and the investment style of the portfolio manager. A 100% rate implies that an amount equal to the value of the entire portfolio is turned over in a year; a 50% rate means that an amount equal to the value of half the portfolio is traded in a year; and a 200% rate means that an amount equal to the value of the portfolio is traded every six months.
26 Janus Aspen Series December 31, 2007
Designation Requirements (unaudited)
For federal income tax purposes, the Portfolio designated the following for the year ended December 31, 2007:
Capital Gain Distributions
| Portfolio | |||||||
| Janus Aspen Small Company Value Portfolio | $ | 508,455 | |||||
Janus Aspen Series December 31, 2007 27
Trustees and Officers (unaudited)
The Portfolio's Statement of Additional Information includes additional information about the Trustees and officers and is available, without charge, by calling 1-800-525-0020.
The following are the Trustees and officers of the Trust, together with a brief description of their principal occupations during the last five years (principal occupations for certain Trustees may include periods over five years).
Each Trustee has served in that capacity since he or she was originally elected or appointed. The Trustees do not serve a specified term of office. Each Trustee will hold office until the termination of the Trust or his or her earlier death, resignation, retirement, incapacity, or removal. The retirement age for Trustees is 72. The Portfolio's Nominating and Governance Committee will consider nominees for the position of Trustee recommended by shareholders. Shareholders may submit the name of a candidate for consideration by the Committee by submitting their recommendations to the Trust's Secretary. Each Trustee is currently a Trustee of two other registered investment companies advised by Janus Capital: Janus Investment Fund and Janus Adviser Series. As of the date of this report, collectively, these three registered investment companies consist of 75 series or funds.
The Trust's officers are elected annually by the Trustees for a one-year term. Certain officers also serve as officers of Janus Investment Fund and Janus Adviser Series. Certain officers of the Portfolio may also be officers and/or directors of Janus Capital. Portfolio officers receive no compensation from the Portfolio, except for the Portfolio's Chief Compliance Officer, as authorized by the Trustees.
Trustees
| Name, Address, and Age | Positions Held with Portfolio | Length of Time Served | Principal Occupations During the Past Five Years | Number of Portfolios/ Funds in Fund Complex Overseen by Trustee | Other Directorships Held by Trustee | ||||||||||||||||||
| Dennis B. Mullen* 151 Detroit Street Denver, CO 80206 DOB: 1943 | Chairman Trustee | 3/04-12/07 9/93-Present | Chief Executive Officer of Red Robin Gourmet Burgers, Inc. (since 2005). Formerly, private investor. | 75 | ** | Chairman of the Board (since 2005) and Director of Red Robin Gourmet Burgers, Inc., and Director of Janus Capital Funds Plc (Dublin-based, non-U.S. funds). | |||||||||||||||||
| Jerome S. Contro 151 Detroit Street Denver, CO 80206 DOB: 1956 | Trustee | 12/05-Present | Partner of Tango Group, a private investment firm (since 1999). | 75 | Trustee and Chairman of RS Investment Trust (since 2001), and Director of IZZE Beverages and MyFamily.com, Inc. (genealogical research website). | ||||||||||||||||||
| William F. McCalpin 151 Detroit Street Denver, CO 80206 DOB: 1957 | Trustee | 6/02-Present | Private investor. Formerly, Executive Vice President and Chief Operating Officer of The Rockefeller Brothers Fund (a private family foundation), and Vice President of Asian Cultural Council. | 75 | Director of F.B. Heron Foundation (a private grant making foundation). | ||||||||||||||||||
| John W. McCarter, Jr. 151 Detroit Street Denver, CO 80206 DOB: 1938 | Trustee | 6/02-Present | President and Chief Executive Officer of The Field Museum of Natural History (Chicago, IL) (since 1997). | 75 | Chairman of the Board and Director of Divergence Inc. (biotechnology firm); Director of W.W. Grainger, Inc. (industrial distributor); and Trustee of WTTW (Chicago public television station) and the University of Chicago. | ||||||||||||||||||
* Mr. McCalpin will succeed Mr. Mullen as Chairman as of January 1, 2008.
** Mr. Mullen also serves as director of Janus Capital Funds Plc, consisting of 16 funds. Including Janus Capital Funds Plc and the 75 funds comprising the Janus funds, Mr. Mullen oversees 91 funds.
28 Janus Aspen Series December 31, 2007
Trustees (cont.)
| Name, Address, and Age | Positions Held with Portfolio | Length of Time Served | Principal Occupations During the Past Five Years | Number of Portfolios/ Funds in Fund Complex Overseen by Trustee | Other Directorships Held by Trustee | ||||||||||||||||||
| James T. Rothe 151 Detroit Street Denver, CO 80206 DOB: 1943 | Trustee | 1/97-Present | Co-founder and Managing Director of Roaring Fork Capital Management, LLC (private investment in public equity firm), and Professor Emeritus of Business of the University of Colorado, Colorado Springs, CO (since 2004). Formerly, Professor of Business of the University of Colorado (2002-2004) and Distinguished Visiting Professor of Business (2001-2002) of Thunderbird (American Graduate School of International Management), Glendale, AZ. | 75 | Director of Red Robin Gourmet Burgers, Inc. | ||||||||||||||||||
| William D. Stewart 151 Detroit Street Denver, CO 80206 DOB: 1944 | Trustee | 9/93-Present | Corporate Vice President and General Manager of MKS Instruments - HPS Products, Boulder, CO (a manufacturer of vacuum fittings and valves). | 75 | N/A | ||||||||||||||||||
| Martin H. Waldinger 151 Detroit Street Denver, CO 80206 DOB: 1938 | Trustee | 9/93-Present | Private Investor and Consultant to California Planned Unit Developments (since 1994). Formerly, CEO and President of Marwal, Inc. (homeowner association management company). | 75 | N/A | ||||||||||||||||||
| Linda S. Wolf 151 Detroit Street Denver, CO 80206 DOB: 1947 | Trustee | 12/05-Present | Retired. Formerly, Chairman and Chief Executive Officer of Leo Burnett (Worldwide) (advertising agency) (2001-2005). | 75 | Director of Wal-Mart, The Field Museum of Natural History (Chicago, IL), Children's Memorial Hospital (Chicago, IL), Chicago Council on Foreign Relations, Economic Club of Chicago, and InnerWorkings (U.S. provider of print procurement solutions). | ||||||||||||||||||
Janus Aspen Series December 31, 2007 29
Trustees and Officers (unaudited) (continued)
Officers
| Name, Address, and Age | Positions Held with Portfolio | Term of Office* and Length of Time Served | Principal Occupations During the Past Five Years | ||||||||||||
| Jakob Holm 151 Detroit Street Denver, CO 80206 DOB: 1971 | Executive Vice President and Portfolio Manager Janus Aspen Small Company Value Portfolio | 7/05-Present | Vice President of Janus Capital and Portfolio Manager for other Janus accounts. | ||||||||||||
| Stephanie Grauerholz-Lofton 151 Detroit Street Denver, CO 80206 DOB: 1970 | Chief Legal Counsel and Secretary Vice President | 1/06-Present 3/06-Present | Vice President and Assistant General Counsel of Janus Capital, and Vice President and Assistant Secretary of Janus Distributors LLC. Formerly, Assistant Vice President of Janus Capital and Janus Distributors LLC (2006), and Associate of Vedder, Price, Kaufman & Kammholz, P.C. (1999-2003). | ||||||||||||
| Andrew J. Iseman 151 Detroit Street Denver, CO 80206 DOB: 1964 | President and Chief Executive Officer | 3/07-Present | Chief Operating Officer and Senior Vice President of Janus Capital Group, Inc. and Janus Capital; President of Janus Services LLC; and Director of Capital Group Partners, Inc. Formerly, Senior Vice President of Enhanced Investment Technologies, LLC (2005-2007); and Vice President of Janus Capital (2003-2005) and Janus Services LLC (2003-2004). | ||||||||||||
| David R. Kowalski 151 Detroit Street Denver, CO 80206 DOB: 1957 | Vice President, Chief Compliance Officer, and Anti-Money Laundering Officer | 6/02-Present | Senior Vice President and Chief Compliance Officer of Janus Capital, Janus Distributors LLC, and Janus Services LLC; Chief Compliance Officer of Bay Isle Financial LLC; and Vice President of Enhanced Investment Technologies, LLC. Formerly, Chief Compliance Officer of Enhanced Investment Technologies, LLC (2003-2005); Vice President of Janus Capital (2000-2005) and Janus Services LLC (2004-2005); and Assistant Vice President of Janus Services LLC (2000-2004). | ||||||||||||
| Jesper Nergaard 151 Detroit Street Denver, CO 80206 DOB: 1962 | Chief Financial Officer Vice President, Treasurer, and Principal Accounting Officer | 3/05-Present 2/05-Present | Vice President of Janus Capital. Formerly, Director of Financial Reporting for OppenheimerFunds, Inc. (2004-2005); Site Manager and First Vice President of Mellon Global Securities Services (2003); and Director of Fund Accounting, Project Development, and Training of INVESCO Funds Group (1994-2003). | ||||||||||||
*Officers are elected at least annually by the Trustees for a one-year term and may also be elected from time to time by the Trustees for an interim period.
30 Janus Aspen Series December 31, 2007
Notes
Janus Aspen Series December 31, 2007 31
Notes
32 Janus Aspen Series December 31, 2007
Notes
Janus Aspen Series December 31, 2007 33
Janus provides access to a wide range of investment disciplines.
Growth
Janus growth portfolios focus on companies believed to be the leaders in their respective industries, with solid management teams, expanding market share, margins and efficiencies.
Core
Janus core portfolios seek investments in more stable and predictable companies. These portfolios look for a strategic combination of steady growth and for certain portfolios, some degree of income.
Risk-Managed
Our risk-managed portfolios seek to outperform their respective indices while maintaining a risk profile equal to or lower than the index itself. Managed by INTECH (a Janus subsidiary), these portfolios use a mathematical process in an attempt to build a more "efficient" portfolio than the index.
Value
Janus value portfolios invest in companies they believe are poised for a turnaround or are trading at a significant discount to fair value. The goal is to gain unique insight into a company's true value and identify and evaluate potential catalysts that may unlock shareholder value.
International & Global
Janus international and global portfolios seek to leverage Janus' research capabilities by taking advantage of inefficiencies in foreign markets, where accurate information and analytical insight are often at a premium.
Bond
Janus bond portfolios attempt to provide less risk relative to equities while seeking to deliver a competitive total return through high current income and appreciation.
Money Market
Janus money market portfolios seek maximum current income consistent with stability of capital.
For more information about our funds, contact your investment professional or go to www.janus.com/info
Please consider the charges, risks, expenses and investment objectives carefully before investing. For a prospectus containing this and other information, please call Janus at 1-800-525-0020 or download the file from www.janus.com/info. Read it carefully before you invest or send money.
An investment in a money market portfolio is not insured or guaranteed by the Federal Deposit Insurance Corporation or any other government agency. Although the Portfolio seeks to preserve the value of your investment at $1.00 per share, it is possible to lose money by investing in the Portfolio.

151 Detroit Street
Denver, CO 80206
1-800-525-0020
Portfolio distributed by Janus Distributors LLC (2/08)
C-0108-357 109-02-720 02-08
2007 Annual Report
Janus Aspen Series
Janus Aspen Worldwide Growth Portfolio
Look Inside. . .
• Portfolio management perspective
• Investment strategy behind your portfolio
• Portfolio performance, characteristics and holdings

Table of Contents
| Useful Information About Your Portfolio Report | 1 | ||||||
| Management Commentary and Schedule of Investments | 2 | ||||||
| Statement of Assets and Liabilities | 10 | ||||||
| Statement of Operations | 11 | ||||||
| Statements of Changes in Net Assets | 12 | ||||||
| Financial Highlights | 13 | ||||||
| Notes to Schedule of Investments | 15 | ||||||
| Notes to Financial Statements | 16 | ||||||
| Report of Independent Registered Public Accounting Firm | 25 | ||||||
| Additional Information | 26 | ||||||
| Explanations of Charts, Tables and Financial Statements | 29 | ||||||
| Designation Requirements | 32 | ||||||
| Trustees and Officers | 33 | ||||||
Please consider the charges, risks, expenses and investment objectives carefully before investing. For a prospectus containing this and other information, please call Janus at 1-800-525-0020 or download the file from www.janus.com/info. Read it carefully before you invest or send money.
Useful Information About Your Portfolio Report
Management Commentary
The Management Commentary in this report includes valuable insight from the Portfolio's manager as well as statistical information to help you understand how your Portfolio's performance and characteristics stack up against those of comparable indices.
Please keep in mind that the opinions expressed by the Portfolio's manager in the Management Commentary are just that: opinions. They are a reflection of the manager's best judgment at the time this report was compiled, which was December 31, 2007. As the investing environment changes, so could the manager's opinions. The views are unique to the manager and aren't necessarily shared by his fellow employees or by Janus in general.
Portfolio Expenses
We believe it's important for our shareholders to have a clear understanding of Portfolio expenses and the impact they have on investment return.
The following is important information regarding the Portfolio's Expense Example, which appears in the Management Commentary within this Annual Report. Please refer to this information when reviewing the Expense Example for the Portfolio.
Example
As a shareholder of a Portfolio, you incur two types of costs: (1) transaction costs, including redemption fees (where applicable) (and any related exchange fees) and (2) ongoing costs, including management fees; distribution and shareholder servicing (12b-1) fees (applicable to Service Shares and Service II Shares only); and other Portfolio expenses. The example is intended to help you understand your ongoing costs (in dollars) of investing in a Portfolio and to compare these costs with the ongoing costs of investing in other mutual funds. To do so, compare this 5% hypothetical example with the 5% hypothetical examples that appear in the shareholder reports of the other funds. The example is based upon an investment of $1,000 invested at the beginning of the period and held for the six-month period from July 1, 2007 to December 31, 2007.
Actual Expenses
The first line of the table in each example provides information about actual account values and actual expenses. You may use the information in this line, together with the amount you invested, to estimate the expenses that you paid over the period. Simply divide your account value by $1,000 (for example, an $8,600 account value divided by $1,000 = 8.6), then multiply the result by the number in the first line under the heading entitled "Expenses Paid During Period" to estimate the expenses you paid on your account during the period.
Hypothetical Example for Comparison Purposes
The second line of the table in each example provides information about hypothetical account values and hypothetical expenses based upon the Portfolio's actual expense ratio and an assumed rate of return of 5% per year before expenses, which is not the Portfolio's actual return. The hypothetical account values and expenses may not be used to estimate the actual ending account balance or expenses you paid for the period. You may use this information to compare the ongoing costs of investing in the Portfolio and other funds. To do so, compare this 5% hypothetical example with the 5% hypothetical examples that appear in the shareholder reports of the other funds.
Please note that the expenses shown in the tables are meant to highlight your ongoing costs only and do not reflect any transaction costs, such as redemption fees (where applicable) and any charges at the separate account level or contract level. Redemption fees are fully described in the prospectus. Therefore, the second line of each table is useful in comparing ongoing costs only, and will not help you determine the relative total costs of owning different funds. In addition, if these transaction costs and separate account or contract level charges were included, your costs would have been higher.
Janus Aspen Series December 31, 2007 1
Janus Aspen Worldwide Growth Portfolio (unaudited)
Portfolio Snapshot
Offering true geographic diversification in a single portfolio, this portfolio seeks to provide investors with exposure to some of the best companies global markets have to offer while typically maintaining a domestic component.

Jason Yee
portfolio manager
Performance Overview
Janus Aspen Worldwide Growth Portfolio's Institutional Shares, Service Shares and Service II Shares returned 9.66%, 9.39% and 9.40%, respectively, over the 12-month period ended December 31, 2007. The Portfolio outpaced the benchmark Morgan Stanley Capital International (MSCI) World IndexSM, which returned 9.04% during the period. I was pleased with this strong absolute and relative performance.
Amazon.com, the online retail/e-commerce company, was a top contributing investment for the Portfolio over the past year. After a protracted period of underperformance, the shares broke through to a new all-time high after the company posted a string of positive quarterly results. Sales continued to grow at an extraordinary rate, across many product categories and around the world, while for the first time in a few years Amazon posted improved margins as well. The improvement in margins in particular proved to be a major inflection point for the stock market's view of the company's prospects and thus its share price.
British Sky Broadcasting Group, the leading U.K. pay-TV broadcaster, was a strong contributor during the period. The company reported strong subscriber growth and other fundamental operating metrics in its satellite TV offering, as well as rapid uptake of its new broadband service. Despite lingering worries over threats of increased government regulation and intervention, I believe the solid fundamentals and bargain valuation of the company represent one of the best risk/reward opportunities available today.
Esprit Holdings, an apparel/retail company, was another top contributor. The 2006 fiscal year ended somewhat disappointingly for the company – marked by a "fashion miss" which led to much slower growth than in years past. Esprit Holdings bounced back quickly in fiscal 2007, posting much higher sales growth as well as improved margins. I believe that this performance highlights many of the positive aspects of the company's business model – multiple styles/collections for each season, the build-out of its own retail stores and geographic expansion.
The homebuilder investments, Lennar Corp., Pulte Homes, Centex Corp. and Ryland Group, were the biggest detractors of performance during the year. Throughout the year the housing market continued to worsen – transaction volumes declined, prices declined, supply in the market increased, etc. – thus making it clear that housing exhibited its steepest downturn in at least the last 15-20 years. The stock market acknowledged this fact, with most major homebuilder shares down more than 60% from their 2005 peaks. I believe that the market has overdone the decline in stock prices, giving me the opportunity to buy these companies – which are competitive ly advantaged, have long histories of generating attractive returns on equity and have relatively high levels of insider ownership – at deeply discounted prices.
From a sector perspective, the consumer discretionary group was one of the largest contributors to performance, driven notably by Amazon, BSkyB and Esprit Holdings as mentioned earlier. The information technology and energy groups were the two largest detractors to relative performance during the period.
"May you live in interesting times..." is a phrase I have often heard used in the popular press attributed to an ancient Chinese curse or proverb. This may perhaps be due to a Robert Kennedy speech in South Africa in 1966 where he references as such...and the rest is history, so to speak. Unfortunately, Chinese scholars are unable to find any reference to such a proverb. Perhaps this should at the very least suggest that many Americans have more to learn about China, despite the fact that ironically China is one of the biggest forces behind these interesting times today.
China's stardom on the global stage, particularly in the Western media, vacillates wildly between fame and notoriety. Each day, the newspaper reminds us of its miraculous economic growth, along with its gravity-defying stock markets and fountain of wealth creation. But turn the page, and we will subsequently read about tainted toys and pet food, unfair currency manipulation, and assorted other sordid tales about the costs of the Chinese economic miracle. China is a vast, populous and diverse country with thousands of years of history, culture, and experience in its collective memory. So it is probably not surprising that China defies easy summation in a headline or short news article, much less a few paragraphs in this annual shareholder letter. I am going to focus on a single element of the China-U.S. economic relationship and after a brief explanation of the major issues at hand, I hope to use this example to illustrate how we approach ris k and uncertainty in a portfolio context.
Today's "interesting times" are largely supported by a financial conveyor belt many observers have dubbed "Bretton Woods II." This is in reference to a quaint time in history beginning in 1944 when the U.S. dollar and other currencies had a fixed exchange rate with an ounce of gold, which was subsequently renounced during the Nixon presidency. Financial commentators have written extensively on this subject under many names and guises, which might be cynically oversimplified as "the United States buys containers full of cheap goods from China/Asia that they don't need and can't afford, while China/Asia extends vendor financing to its most profligate customer to stash away over a trillion dollars in U.S. government bonds while building even more factories." Warren Buffett explained this phenomenon of trade and current account deficits in his 2004 Berkshire Hathaway Chairman's letter, so I will not try to improve upon it or other such descripti ons. Suffice it to say, as the U.S. continues to
2 Janus Aspen Series December 31, 2007
(unaudited)
bequeath its assets and become increasingly indebted to foreign nations through overspending, the long-term consequences may continue to have significant implications for investors, particularly for those of us here in America that denominate our wealth primarily in U.S. dollars.
I am describing all of this not because I simply wish to display my basic grasp of macroeconomics, nor because I know the resultant outcome, nor because I wish to moralize the fact that it is impossible for America to borrow itself into prosperity. All that history can assuredly say about the future is that it is certainly uncertain, often very surprising, and suffers no fools who make forecasts and predictions confidently. Much as I emphasized in last year's annual letter and mentioned earlier, this is all for the sake of communicating how we address risk in the Portfolio.
Given there are an infinite number of outcomes and possibilities in describing how this relationship evolves, what framework can we use to help us understand the Portfolio risks and exposures against the eventual "unwinding" of Bretton Woods II, or inversely, the risks involved in its unlikely continuation over the medium term? In explicitly quantifying this risk: at best, I can say the potential impacts are difficult to measure and that it is nearly impossible to predict its ultimate severity. Off-the-shelf-risk management software, a common tool in the investment industry, will likely be very insufficient. Proprietary software may or may not be better, but may still lead to poor outcomes due to overconfidence in the models or poor inputs. But in qualitatively exploring this risk in particular, we can try to parse this risk into certain common sense groupings that help us estimate what sort of margin of error needs to exist:
(1) As a global investor, I am acutely aware of, and attempt to be quite diversified against, risks pertaining to changes to the currency regime. The Portfolio aims to perform reasonably in many different environments, the most obvious today being significant revaluations of the U.S. dollar. My point would be that I believe the Portfolio is positioned to withstand the consensus gradual decline in the U.S. dollar, while still offering sufficient protection against surprising shocks related to either a disorderly devaluation scenario or even a decidedly non-consensus appreciation scenario.
(2) It seems reasonable to presume from history that there will be significant "second order" downside effects from this unwinding, in terms of risk appetite, liquidity, and quality preferences in the financial markets...just as there has been on the upside. In my own narrow observation, these second order effects, while somewhat appreciated and discussed, are not easily captured within traditional risk models, particularly with respect to price, correlation, or volatility histories. I again reach to quote Warren Buffett from his most recent annual letter which more eloquently re-emphasizes this point, about which I also opined about a year ago: "Certain perils that lurk in investment strategies cannot be spotted by use of the models commonly employed today by financial institutions." Common sense is again perhaps the best, and only available, tactic for capital preservation in many instances.
(3) As in many cases in life, abstinence and avoidance are the "perfect" solutions but inevitably come burdened with some significant costs and consequences in their own right. So perhaps it is more realistic, at least in portfolio management, to be reasonable in my goals of risk prudence and chastity by limiting exposure to only the best and advantageous risk/reward situations. A potential cost of this strategy is always lagging short-term returns, as this discipline often means avoiding the momentum, hysteria, and irrational exuberance that characterizes the later stages of a financial bubble. Many investors believe that they will be able to recognize and exit the madness before the proverbial punchbowl is taken away. The technology boom and bust of the late 1990s is an example of many overstaying their welcome. I cannot firmly say whether Bretton Woods II and its resultant consequences are representative of any such madness (it may or may not be), but what I can say is that the Portfolio strives to endure outcomes outside the normal probability distributions in both the positive and negative direction.
In summary, there are always many intrinsic and extrinsic risks contained in every investment portfolio. I have explored just one of them in this letter, albeit one that is au courant in the headlines today, but which may be surprisingly underestimated in severity by the financial markets. With any luck, this example of Bretton Woods II has provided a small degree of insight on the process by which risks are evaluated and analyzed within the Portfolio. While I cannot ever promise that the Portfolio will emerge unscathed from this or any other risk, what I can do is try to remain thoughtful, balanced, rational and cognizant of each risk taken. Buffett has even mentioned as much by saying: "Temperament is also important. Independent thinking, emotional stability, and a keen sense of both human a nd institutional behavior are vital to long-term investment success." There are no simple, formulaic recipes for successful risk management. Many of the truly devastating and catastrophic risks are by nature impossible to see except after the fact, when they are suddenly obvious to everyone. So it is best to think deeply and broadly about the issues, search for any clues that might help improve the process, recognize limitations when confronted with complex and unknowable scenarios, and acknowledge that the future is inherently uncertain.
I think it is always prudent to keep a vigilant watch on overall risk levels in the Portfolio to mitigate potential capital loss. I have spoken at length in this letter to that point, but would remind you that the primary investment and risk management process involves thorough fundamental research, searching for high-quality businesses around the world available at attractive purchase prices. This has historically been a time-honored means for successful outcomes in the investment industry, and I hope to continue to execute better on this goal each and every day.
Thank you for your continued support of Janus Aspen Worldwide Growth Portfolio.
Janus Aspen Series December 31, 2007 3
Janus Aspen Worldwide Growth Portfolio (unaudited)
Janus Aspen Worldwide Growth Portfolio At a Glance
5 Largest Contributors to Performance – Holdings
| Contribution | |||||||
| Amazon.com, Inc. | 2.64 | % | |||||
| Potash Corporation of Saskatchewan, Inc. (U.S. Shares) | 2.54 | % | |||||
| Medco Health Solutions, Inc. | 1.58 | % | |||||
| Nokia Oyj | 1.48 | % | |||||
| British Sky Broadcasting Group PLC | 1.26 | % | |||||
5 Largest Detractors from Performance – Holdings
| Contribution | |||||||
| Pulte Homes, Inc. | (1.82 | )% | |||||
| Lennar Corp. - Class A | (1.71 | )% | |||||
| Centex Corp. | (1.18 | )% | |||||
| Citigroup, Inc. | (0.70 | )% | |||||
| Ryland Group, Inc. | (0.66 | )% | |||||
5 Largest Contributors to Performance – Sectors
| Portfolio Contribution | Portfolio Weighting (% of Net Assets) | Morgan Stanley Capital International WorldSM Index Weighting | |||||||||||||
| Materials | 3.43 | % | 5.39 | % | 6.61 | % | |||||||||
| Consumer Discretionary | 3.28 | % | 33.44 | % | 10.95 | % | |||||||||
| Health Care | 1.93 | % | 7.81 | % | 8.82 | % | |||||||||
| Consumer Staples | 0.87 | % | 3.02 | % | 8.28 | % | |||||||||
| Information Technology | 0.52 | % | 22.71 | % | 10.67 | % | |||||||||
5 Lowest Contributors/Detractors to Performance – Sectors
| Portfolio Contribution | Portfolio Weighting (% of Net Assets) | Morgan Stanley Capital International WorldSM Index Weighting | |||||||||||||
| Financials | (0.06 | )% | 19.77 | % | 24.93 | % | |||||||||
| Utilities | 0.00 | % | 0.00 | % | 4.38 | % | |||||||||
| Energy | 0.00 | % | 0.00 | % | 9.56 | % | |||||||||
| Telecommunication Services | 0.11 | % | 3.24 | % | 4.67 | % | |||||||||
| Industrials | 0.22 | % | 4.62 | % | 11.14 | % | |||||||||
4 Janus Aspen Series December 31, 2007
(unaudited)
5 Largest Equity Holdings – (% of Net Assets)
| As of December 31, 2007 | |||||||
| British Sky Broadcasting Group PLC Television | 5.6 | % | |||||
| Dell, Inc. Computers | 5.5 | % | |||||
| Willis Group Holdings, Ltd. Insurance Brokers | 3.8 | % | |||||
| Yahoo!, Inc. Web Portals/Internet Service Providers | 3.7 | % | |||||
| Berkshire Hathaway, Inc. - Class B Reinsurance | 3.5 | % | |||||
| 22.1 | % | ||||||
Asset Allocation – (% of Net Assets)
As of December 31, 2007
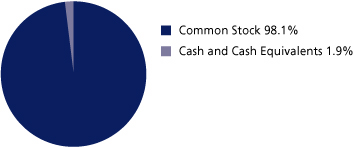
Emerging markets comprised 2.0% of total net assets.
Top Country Allocations – Long Positions (% of Investment Securities)
| As of December 31, 2007 | As of December 31, 2006 | ||||||
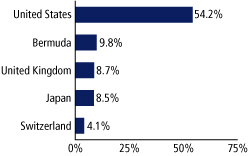 | 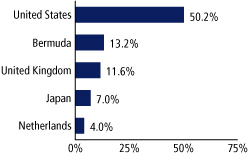 | ||||||
Janus Aspen Series December 31, 2007 5
Janus Aspen Worldwide Growth Portfolio (unaudited)
Performance

| Average Annual Total Return – for the periods ended December 31, 2007 | Expense Ratios – for the fiscal year ended December 31, 2006 | ||||||||||||||||||||||
| One Year | Five Year | Ten Year | Since Inception* | Total Annual Fund Operating Expenses | |||||||||||||||||||
| Janus Aspen Worldwide Growth Portfolio - Institutional Shares | 9.66 | % | 12.25 | % | 6.29 | % | 11.04 | % | 0.64 | % | |||||||||||||
| Janus Aspen Worldwide Growth Portfolio - Service Shares | 9.39 | % | 11.97 | % | 5.99 | % | 10.74 | % | 0.90 | % | |||||||||||||
| Janus Aspen Worldwide Growth Portfolio - Service II Shares | 9.40 | % | 11.98 | % | 5.99 | % | 10.75 | % | 0.90 | % | |||||||||||||
| Morgan Stanley Capital International World IndexSM | 9.04 | % | 16.96 | % | 7.00 | % | 8.70 | % | |||||||||||||||
| Lipper Quartile - Institutional Shares | 2 | nd | 4 | th | 3 | rd | 2 | nd | |||||||||||||||
| Lipper Ranking - Institutional Shares based on total returns for Variable Annuity Global Funds | 47/104 | 65/67 | 21/27 | 4/11 | |||||||||||||||||||
Visit janus.com/info to view up-to-date performance
and characteristic information
Data presented reflects past performance, which is no guarantee of future results. Investment results and principal value will fluctuate so that shares, when redeemed, may be worth more or less than their original cost. Due to market volatility, current performance may be higher or lower than the performance shown. Call 877.33JANUS or visit www.janus.com/info for performance current to the most recent month-end.
For Service II Shares, a 1% redemption fee may be imposed on shares held for 60 days or less. Performance shown does not reflect this redemption fee and, if reflected, performance would have been lower.
For the period from July 1, 2006 through January 31, 2007 ("Waiver Period"), Janus Capital contractually agreed to waive its right to receive a portion of the Portfolio's base management fee, at the annual rate of up to 0.15% of average daily net assets, under certain conditions. This waiver was applied for any calendar month in the Waiver Period if the total return performance of the Portfolio for the period from February 1, 2006 through the end of the preceding calendar month, calculated as though there had been no waiver of the base management fee, was less than performance of the Portfolio's primary benchmark index for that period.
The Portfolio's expense ratio was determined based on average net assets as of the fiscal year ended December 31, 2006. Detailed information is available in the prospectus. All expenses are shown without the effect of expense offset arrangements. Pursuant to such arrangements, credits realized as a result of uninvested cash balances are used to reduce custodian and transfer agent expenses.
The Portfolio has a performance-based management fee that adjusts upward or downward based on the Portfolio's performance relative to an approved benchmark index over a performance measurement period.
6 Janus Aspen Series December 31, 2007
(unaudited)
Portfolio Expenses
The example below shows you the ongoing costs (in dollars) of investing in your Portfolio and allows you to compare these costs with those of other mutual funds. Please refer to the section Useful Information About Your Portfolio Report for a detailed explanation of the information presented in these charts.
| Expense Example - Institutional Shares | Beginning Account Value (7/1/07) | Ending Account Value (12/31/07) | Expenses Paid During Period (7/1/07-12/31/07)(1) | ||||||||||||
| Actual | $ | 1,000.00 | $ | 970.40 | $ | 3.43 | |||||||||
| Hypothetical (5% return before expenses) | $ | 1,000.00 | $ | 1,021.73 | $ | 3.52 | |||||||||
| Expense Example - Service Shares | Beginning Account Value (7/1/07) | Ending Account Value (12/31/07) | Expenses Paid During Period (7/1/07-12/31/07)(1) | ||||||||||||
| Actual | $ | 1,000.00 | $ | 969.40 | $ | 4.67 | |||||||||
| Hypothetical (5% return before expenses) | $ | 1,000.00 | $ | 1,020.47 | $ | 4.79 | |||||||||
| Expense Example - Service II Shares | Beginning Account Value (7/1/07) | Ending Account Value (12/31/07) | Expenses Paid During Period (7/1/07-12/31/07)(1) | ||||||||||||
| Actual | $ | 1,000.00 | $ | 969.30 | $ | 4.67 | |||||||||
| Hypothetical (5% return before expenses) | $ | 1,000.00 | $ | 1,020.47 | $ | 4.79 | |||||||||
(1) Expenses are equal to the annualized expense ratio of 0.69% for Institutional Shares, 0.94% for Service Shares and 0.94% for Service II Shares, multiplied by the average account value over the period, multiplied by 184/365 (to reflect the one-half year period).
The Portfolio's performance may be affected by risks that include those associated with investments in specific industries or countries. Additional risks to the Portfolio may include those associated with investing in foreign securities, emerging markets, initial public offerings ("IPOs") and derivatives. Please see a Janus prospectus or www.janus.com/info for more information about risks, portfolio holdings and other details.
Foreign securities have additional risks including exchange rate changes, political and economic upheaval, the relative lack of information, relatively low market liquidity and the potential lack of strict financial and accounting controls and standards. These risks are magnified in emerging markets. The prices of foreign securities held by the Portfolio, and therefore the Portfolio's performance, may decline in response to such risks.
These returns do not reflect the charges and expenses of any particular insurance product or qualified plan. Returns shown would have been lower had they included insurance charges.
Returns include reinvestment of dividends from net investment income and distributions from capital gains. The returns shown do not reflect the deduction of taxes that a shareholder would pay on Portfolio distributions or the redemption of Portfolio shares.
Returns shown for Service Shares and Service II Shares for periods prior to December 31, 1999 and December 31, 2001, respectively, are derived from the historical performance of Institutional Shares, adjusted to reflect the higher operating expense of Service Shares and Service II Shares.
Net dividends reinvested are the dividends that remain to be reinvested after foreign tax obligations have been met. Such obligations vary from country to country.
Lipper, a wholly-owned subsidiary of Reuters, provides independent insight on global collective investments including mutual funds, retirement funds, hedge funds, fund fees and expenses to the asset management and media communities. Lipper ranks the performance of mutual funds within a classification of funds that have similar investment objectives. Rankings are historical with capital gains and dividends reinvested and do not include the effect of loads.
Lipper ranking is for the Institutional Share class only; other classes may have different performance characteristics.
September 30, 1993 is the date used to calculate the since-inception Lipper ranking, which is slightly different from when the Portfolio began operations since Lipper provides fund rankings as of the last day of the month.
There is no assurance that the investment process will consistently lead to successful investing.
See Notes to Schedule of Investments for index definitions.
The Portfolio may differ significantly from the securities held in the index. The index is unmanaged and not available for direct investment; therefore its performance does not reflect the expenses associated with the active management of an actual Portfolio.
See "Explanations of Charts, Tables and Financial Statements."
* The Portfolio's inception date – September 13, 1993
Janus Aspen Series December 31, 2007 7
Janus Aspen Worldwide Growth Portfolio
Schedule of Investments
As of December 31, 2007
| Shares or Principal Amount | Value | ||||||||||
| Common Stock - 98.1% | |||||||||||
| Agricultural Chemicals - 3.7% | |||||||||||
| 189,765 | Potash Corporation of Saskatchewan, Inc. (U.S. Shares) | $ | 27,318,570 | ||||||||
| 88,983 | Syngenta A.G. | 22,502,078 | |||||||||
| 49,820,648 | |||||||||||
| Apparel Manufacturers - 2.7% | |||||||||||
| 2,422,100 | Esprit Holdings, Ltd. | 36,035,296 | |||||||||
| Applications Software - 1.2% | |||||||||||
| 4,500,665 | Misys PLC | 16,550,185 | |||||||||
| Audio and Video Products - 1.2% | |||||||||||
| 303,500 | Sony Corp. | 16,655,943 | |||||||||
| Automotive - Cars and Light Trucks - 0% | |||||||||||
| 15 | Nissan Motor Company, Ltd. | 162 | |||||||||
| Broadcast Services and Programming - 1.2% | |||||||||||
| 427,760 | Liberty Global, Inc. - Class A* | 16,763,914 | |||||||||
| Building - Residential and Commercial - 6.4% | |||||||||||
| 884,415 | Centex Corp. | 22,340,323 | |||||||||
| 906,000 | Lennar Corp. - Class A# | 16,208,340 | |||||||||
| 1,497,065 | Pulte Homes, Inc. | 15,779,065 | |||||||||
| 1,091,430 | Ryland Group, Inc.# | 30,068,896 | |||||||||
| 84,396,624 | |||||||||||
| Building and Construction Products - Miscellaneous - 1.0% | |||||||||||
| 381,485 | USG Corp.*,# | 13,653,348 | |||||||||
| Casino Hotels - 1.1% | |||||||||||
| 1,092,407 | Crown, Ltd.* | 12,897,424 | |||||||||
| 1,632,000 | Galaxy Entertainment Group, Ltd.* | 1,534,271 | |||||||||
| 14,431,695 | |||||||||||
| Cellular Telecommunications - 1.6% | |||||||||||
| 5,621,288 | Vodafone Group PLC | 21,012,279 | |||||||||
| Chemicals - Diversified - 1.4% | |||||||||||
| 306,600 | Shin-Etsu Chemical Company, Ltd.* | 19,410,720 | |||||||||
| Computers - 5.5% | |||||||||||
| 3,050,325 | Dell, Inc.* | 74,763,466 | |||||||||
| Distribution/Wholesale - 1.0% | |||||||||||
| 3,448,800 | Li & Fung, Ltd. | 13,933,384 | |||||||||
| Diversified Operations - 1.2% | |||||||||||
| 417,788 | Tyco International, Ltd. (U.S. Shares) | 16,565,294 | |||||||||
| E-Commerce/Products - 1.2% | |||||||||||
| 172,453 | Amazon.com, Inc.*,# | 15,976,046 | |||||||||
| E-Commerce/Services - 5.3% | |||||||||||
| 1,242,765 | eBay, Inc.* | 41,247,370 | |||||||||
| 473,745 | Expedia, Inc.*,# | 14,979,817 | |||||||||
| 547,855 | IAC/InterActiveCorp* | 14,748,257 | |||||||||
| 70,975,444 | |||||||||||
| Electronic Components - Miscellaneous - 3.8% | |||||||||||
| 819,119 | Koninklijke (Royal) Philips Electronics N.V. | 35,349,385 | |||||||||
| 417,788 | Tyco Electronics, Ltd. | 15,512,468 | |||||||||
| 50,861,853 | |||||||||||
| Electronic Components - Semiconductors - 2.6% | |||||||||||
| 3,562,540 | ARM Holdings PLC | 8,792,718 | |||||||||
| 16,840 | Samsung Electronics Company, Ltd. | 9,958,574 | |||||||||
| 479,490 | Texas Instruments, Inc. | 16,014,966 | |||||||||
| 34,766,258 | |||||||||||
| Shares or Principal Amount | Value | ||||||||||
| Energy - Alternate Sources - 0.6% | |||||||||||
| 92,620 | Suntech Power Holdings Company, Ltd. (ADR)* | $ | 7,624,478 | ||||||||
| Finance - Investment Bankers/Brokers - 5.2% | |||||||||||
| 360,259 | Citigroup, Inc. | 10,606,025 | |||||||||
| 845,908 | JP Morgan Chase & Co. | 36,923,884 | |||||||||
| 479,704 | UBS A.G. | 22,178,311 | |||||||||
| 69,708,220 | |||||||||||
| Finance - Mortgage Loan Banker - 1.6% | |||||||||||
| 117,450 | Fannie Mae | 4,695,651 | |||||||||
| 239,392 | Housing Development Finance Corporation, Ltd. | 17,480,597 | |||||||||
| 22,176,248 | |||||||||||
| Food - Retail - 0.6% | |||||||||||
| 104,613 | Metro A.G. | 8,742,964 | |||||||||
| Insurance Brokers - 3.8% | |||||||||||
| 1,363,492 | Willis Group Holdings, Ltd. | 51,771,791 | |||||||||
| Investment Companies - 0.2% | |||||||||||
| 125,446 | RHJ International* | 2,053,966 | |||||||||
| Medical - Biomedical and Genetic - 0.9% | |||||||||||
| 267,375 | Amgen, Inc.* | 12,416,895 | |||||||||
| Medical - Drugs - 2.2% | |||||||||||
| 188,145 | Merck & Company, Inc. | 10,933,106 | |||||||||
| 292,080 | Pfizer, Inc. | 6,638,978 | |||||||||
| 71,089 | Roche Holding A.G. | 12,275,938 | |||||||||
| 29,848,022 | |||||||||||
| Medical - HMO - 2.5% | |||||||||||
| 137,845 | Aetna, Inc. | 7,957,792 | |||||||||
| 109,560 | Coventry Health Care, Inc.* | 6,491,430 | |||||||||
| 333,015 | UnitedHealth Group, Inc. | 19,381,473 | |||||||||
| 33,830,695 | |||||||||||
| Medical Products - 1.4% | |||||||||||
| 417,788 | Covidien, Ltd. | 18,503,831 | |||||||||
| Multimedia - 0.3% | |||||||||||
| 1,092,407 | Consolidated Media Holdings, Ltd. | 4,027,448 | |||||||||
| Networking Products - 1.5% | |||||||||||
| 765,620 | Cisco Systems, Inc.* | 20,725,333 | |||||||||
| Pharmacy Services - 1.6% | |||||||||||
| 210,585 | Medco Health Solutions, Inc.* | 21,353,319 | |||||||||
| Property and Casualty Insurance - 4.0% | |||||||||||
| 625,385 | First American Corp. | 21,338,136 | |||||||||
| 958,000 | Millea Holdings, Inc.* | 32,403,252 | |||||||||
| 53,741,388 | |||||||||||
| Real Estate Management/Services - 1.9% | |||||||||||
| 169,100 | Daito Trust Construction Company, Ltd.* | 9,388,119 | |||||||||
| 649,000 | Mitsubishi Estate Company, Ltd. | 15,795,673 | |||||||||
| 25,183,792 | |||||||||||
| Real Estate Operating/Development - 1.0% | |||||||||||
| 3,065,000 | CapitaLand, Ltd. | 13,354,795 | |||||||||
| Reinsurance - 3.5% | |||||||||||
| 9,863 | Berkshire Hathaway, Inc. - Class B* | 46,711,168 | |||||||||
| Retail - Apparel and Shoe - 1.3% | |||||||||||
| 291,224 | Industria de Diseno Textil S.A. | 17,829,785 | |||||||||
See Notes to Schedules of Investments and Financial Statements.
8 Janus Aspen Series December 31, 2007
Schedule of Investments
As of December 31, 2007
| Shares or Principal Amount | Value | ||||||||||
| Retail - Consumer Electronics - 1.9% | |||||||||||
| 223,520 | Yamada Denki Company, Ltd.* | $ | 25,696,871 | ||||||||
| Retail - Drug Store - 1.5% | |||||||||||
| 494,680 | CVS/Caremark Corp. | 19,663,530 | |||||||||
| Retail - Major Department Stores - 0.9% | |||||||||||
| 122,000 | Sears Holdings Corp.*,# | 12,450,100 | |||||||||
| Schools - 0.6% | |||||||||||
| 122,200 | Apollo Group, Inc. - Class A* | 8,572,330 | |||||||||
| Semiconductor Components/Integrated Circuits - 1.4% | |||||||||||
| 1,322,650 | Marvell Technology Group, Ltd.* | 18,490,647 | |||||||||
| Semiconductor Equipment - 0.6% | |||||||||||
| 246,702 | ASML Holding N.V.* | 7,811,773 | |||||||||
| Telecommunication Equipment - Fiber Optics - 0.6% | |||||||||||
| 317,550 | Corning, Inc. | 7,618,025 | |||||||||
| Telephone - Integrated - 1.1% | |||||||||||
| 1,175,765 | Sprint Nextel Corp. | 15,437,794 | |||||||||
| Television - 5.6% | |||||||||||
| 6,174,765 | British Sky Broadcasting Group PLC | 76,076,900 | |||||||||
| Transportation - Services - 1.0% | |||||||||||
| 187,415 | United Parcel Service, Inc. - Class B | 13,253,989 | |||||||||
| Web Portals/Internet Service Providers - 3.7% | |||||||||||
| 2,155,895 | Yahoo!, Inc.* | 50,146,118 | |||||||||
| Wireless Equipment - 3.0% | |||||||||||
| 705,570 | Nokia Oyj | 27,182,145 | |||||||||
| 5,624,295 | Telefonaktiebolaget L.M. Ericsson - Class B | 13,133,278 | |||||||||
| 40,315,423 | |||||||||||
| Total Common Stock (cost $1,125,753,769) | 1,321,710,197 | ||||||||||
| Money Markets - 1.9% | |||||||||||
| 17,520,299 | Janus Institutional Cash Management Fund - Institutional Shares, 4.98% | 17,520,299 | |||||||||
| 8,258,292 | Janus Institutional Money Market Fund - Institutional Shares, 4.91% | 8,258,292 | |||||||||
| Total Money Markets (cost $25,778,591) | 25,778,591 | ||||||||||
| Other Securities - 4.1% | |||||||||||
| 38,789,367 | Allianz Dresdner Daily Asset Fund† | 38,789,367 | |||||||||
| 9,198,022 | Repurchase Agreements† | 9,198,022 | |||||||||
| 7,072,110 | Time Deposit† | 7,072,110 | |||||||||
| Total Other Securities (cost $55,059,499) | 55,059,499 | ||||||||||
| Total Investments (total cost $1,206,591,859) – 104.1% | 1,402,548,287 | ||||||||||
| Liabilities, net of Cash, Receivables and Other Assets – (4.1%) | (55,243,242 | ) | |||||||||
| Net Assets – 100% | $ | 1,347,305,045 | |||||||||
Summary of Investments by Country – (Long Positions)
| Country | Value | % of Investment Securities | |||||||||
| Australia | $ | 16,924,872 | 1.2 | % | |||||||
| Belgium | 2,053,966 | 0.2 | % | ||||||||
| Bermuda | 136,796,412 | 9.8 | % | ||||||||
| Canada | 27,318,570 | 1.9 | % | ||||||||
| Cayman Islands | 7,624,478 | 0.5 | % | ||||||||
| Finland | 27,182,145 | 1.9 | % | ||||||||
| Germany | 8,742,964 | 0.6 | % | ||||||||
| Hong Kong | 1,534,271 | 0.1 | % | ||||||||
| India | 17,480,597 | 1.3 | % | ||||||||
| Japan | 119,350,740 | 8.5 | % | ||||||||
| Netherlands | 43,161,158 | 3.1 | % | ||||||||
| Singapore | 13,354,795 | 1.0 | % | ||||||||
| South Korea | 9,958,574 | 0.7 | % | ||||||||
| Spain | 17,829,785 | 1.3 | % | ||||||||
| Sweden | 13,133,278 | 0.9 | % | ||||||||
| Switzerland | 56,956,327 | 4.1 | % | ||||||||
| United Kingdom | 122,432,082 | 8.7 | % | ||||||||
| United States†† | 760,713,273 | 54.2 | % | ||||||||
| Total | $ | 1,402,548,287 | 100.0 | % | |||||||
††Includes Short-Term Securities and Other Securities (48.5% excluding Short-Term Securities and Other Securities).
See Notes to Schedules of Investments and Financial Statements.
Janus Aspen Series December 31, 2007 9
Statement of Assets and Liabilities
| As of December 31, 2007 (all numbers in thousands except net asset value per share) | Janus Aspen Worldwide Growth Portfolio | ||||||
| Assets: | |||||||
| Investments at cost(1) | $ | 1,206,592 | |||||
| Investments at value(1) | $ | 1,376,769 | |||||
| Affiliated money market investments | 25,779 | ||||||
| Cash | 41 | ||||||
| Receivables: | |||||||
| Portfolio shares sold | 366 | ||||||
| Dividends | 1,125 | ||||||
| Interest | 145 | ||||||
| Non-interested Trustees' deferred compensation | 22 | ||||||
| Other assets | 17 | ||||||
| Total Assets | 1,404,264 | ||||||
| Liabilities: | |||||||
| Payables: | |||||||
| Collateral for securities loaned (Note 1) | 55,059 | ||||||
| Portfolio shares repurchased | 1,042 | ||||||
| Advisory fees | 693 | ||||||
| Transfer agent fees and expenses | 1 | ||||||
| Distribution fees - Service Shares | 49 | ||||||
| Distribution fees - Service II Shares | – | ||||||
| Non-interested Trustees' fees and expenses | 11 | ||||||
| Non-interested Trustees' deferred compensation fees | 22 | ||||||
| Accrued expenses | 82 | ||||||
| Total Liabilities | 56,959 | ||||||
| Net Assets | $ | 1,347,305 | |||||
| Net Assets Consist of: | |||||||
| Capital (par value and paid-in-surplus)* | $ | 2,738,138 | |||||
| Undistributed net investment income/(loss)* | 1,466 | ||||||
| Undistributed net realized gain/(loss) from investments and foreign currency transactions* | (1,588,253 | ) | |||||
| Unrealized appreciation/(depreciation) of investments, foreign currency translations and non-interested Trustees' deferred compensation | 195,954 | ||||||
| Total Net Assets | $ | 1,347,305 | |||||
| Net Assets - Institutional Shares | $ | 1,119,569 | |||||
| Shares Outstanding, $0.001 Par Value (unlimited shares authorized) | 31,670 | ||||||
| Net Asset Value Per Share | $ | 35.35 | |||||
| Net Assets - Service Shares | $ | 227,723 | |||||
| Shares Outstanding, $0.001 Par Value (unlimited shares authorized) | 6,497 | ||||||
| Net Asset Value Per Share | $ | 35.05 | |||||
| Net Assets - Service II Shares | $ | 13 | |||||
| Shares Outstanding, $0.001 Par Value (unlimited shares authorized)** | 372 | ||||||
| Net Asset Value Per Share | $ | 35.14 | |||||
* See Note 3 in Notes to Financial Statements.
** Shares Outstanding - Service II Shares are not in thousands.
(1) Investments at cost and value include $53,693,725 of securities loaned. (Note 1)
See Notes to Financial Statements.
10 Janus Aspen Series December 31, 2007
Statement of Operations
| For the fiscal year ended December 31, 2007 (all numbers in thousands) | Janus Aspen Worldwide Growth Portfolio | ||||||
| Investment Income: | |||||||
| Interest | $ | 4 | |||||
| Securities lending income | 283 | ||||||
| Dividends | 18,657 | ||||||
| Dividends from affiliates | 1,396 | ||||||
| Foreign tax withheld | (569 | ) | |||||
| Total Investment Income | 19,771 | ||||||
| Expenses: | |||||||
| Advisory fees | 9,245 | ||||||
| Transfer agent fees and expenses | 8 | ||||||
| Registration fees | 22 | ||||||
| Custodian fees | 107 | ||||||
| Professional fees | 25 | ||||||
| Non-interested Trustees' fees and expenses | 41 | ||||||
| Distribution fees - Service Shares | 576 | ||||||
| Distribution fees - Service II Shares | – | ||||||
| Other expenses | 209 | ||||||
| Non-recurring costs (Note 2) | 1 | ||||||
| Costs assumed by Janus Capital Management LLC (Note 2) | (1 | ) | |||||
| Total Expenses | 10,233 | ||||||
| Expense and Fee Offset | (5 | ) | |||||
| Net Expenses | 10,228 | ||||||
| Less: Excess Expense Reimbursement | (30 | ) | |||||
| Net Expenses after Expense Reimbursement | 10,198 | ||||||
| Net Investment Income/(Loss) | 9,573 | ||||||
| Net Realized and Unrealized Gain/(Loss) on Investments: | |||||||
| Net realized gain/(loss) from investments and foreign currency transactions | 209,082 | ||||||
| Change in unrealized appreciation/(depreciation) of investments, foreign currency translations and non-interested Trustees' deferred compensation | (85,024 | ) | |||||
| Net Gain/(Loss) on Investments | 124,058 | ||||||
| Net Increase/(Decrease) in Net Assets Resulting from Operations | $ | 133,631 | |||||
See Notes to Financial Statements.
Janus Aspen Series December 31, 2007 11
Statements of Changes in Net Assets
| For the fiscal years ended December 31 | Janus Aspen Worldwide Growth Portfolio | ||||||||||
| (all numbers in thousands) | 2007 | 2006 | |||||||||
| Operations: | |||||||||||
| Net investment income/(loss) | $ | 9,573 | $ | 22,688 | |||||||
| Net realized gain/(loss) from investment and foreign currency transactions | 209,082 | 161,349 | |||||||||
| Change in unrealized net appreciation/(depreciation) of investments, foreign currency translations and non-interested Trustees' deferred compensation | (85,024 | ) | 48,684 | ||||||||
| Payment from affiliate (Note 2) | – | – | |||||||||
| Net Increase/(Decrease) in Net Assets Resulting from Operations | 133,631 | 232,721 | |||||||||
| Dividends and Distributions to Shareholders: | |||||||||||
| Net investment income* | |||||||||||
| Institutional Shares | (8,909 | ) | (20,570 | ) | |||||||
| Service Shares | (1,318 | ) | (3,143 | ) | |||||||
| Service II Shares | – | – | �� | ||||||||
| Net realized gain/(loss) from investment transactions* | |||||||||||
| Institutional Shares | – | – | |||||||||
| Service Shares | – | – | |||||||||
| Service II Shares | – | – | |||||||||
| Net Decrease from Dividends and Distributions | (10,227 | ) | (23,713 | ) | |||||||
| Capital Share Transactions: | |||||||||||
| Shares sold | |||||||||||
| Institutional Shares | 40,104 | 25,723 | |||||||||
| Service Shares | 56,569 | 20,086 | |||||||||
| Service II Shares | – | – | |||||||||
| Redemption fees | |||||||||||
| Service II Shares | – | – | |||||||||
| Reinvested dividends and distributions | |||||||||||
| Institutional Shares | 8,909 | 20,570 | |||||||||
| Service Shares | 1,318 | 3,143 | |||||||||
| Service II Shares | – | – | |||||||||
| Shares repurchased | |||||||||||
| Institutional Shares | (243,305 | ) | (482,013 | ) | |||||||
| Service Shares | (57,812 | ) | (44,091 | ) | |||||||
| Service II Shares | – | – | |||||||||
| Net Increase/(Decrease) from Capital Share Transactions | (194,217 | ) | (456,582 | ) | |||||||
| Net Increase/(Decrease) in Net Assets | (70,813 | ) | (247,574 | ) | |||||||
| Net Assets: | |||||||||||
| Beginning of period | 1,418,118 | 1,665,692 | |||||||||
| End of period | $ | 1,347,305 | $ | 1,418,118 | |||||||
| Undistributed net investment income/(loss)* | $ | 1,466 | $ | 2,196 | |||||||
* See Note 3 in Notes to Financial Statements.
See Notes to Financial Statements.
12 Janus Aspen Series December 31, 2007
Financial Highlights
Institutional Shares
| For a share outstanding during each fiscal year | Janus Aspen Worldwide Growth Portfolio | ||||||||||||||||||||||
| ended December 31 | 2007 | 2006 | 2005 | 2004 | 2003 | ||||||||||||||||||
| Net Asset Value, Beginning of Period | $ | 32.48 | $ | 27.96 | $ | 26.78 | $ | 25.82 | $ | 21.05 | |||||||||||||
| Income from Investment Operations: | |||||||||||||||||||||||
| Net investment income/(loss) | .27 | .54 | .44 | .28 | .23 | ||||||||||||||||||
| Net gain/(loss) on securities (both realized and unrealized) | 2.87 | 4.50 | 1.11 | .94 | 4.79 | ||||||||||||||||||
| Total from Investment Operations | 3.14 | 5.04 | 1.55 | 1.22 | 5.02 | ||||||||||||||||||
| Less Distributions and Other: | |||||||||||||||||||||||
| Dividends (from net investment income)* | (.27 | ) | (.52 | ) | (.37 | ) | (.26 | ) | (.25 | ) | |||||||||||||
| Distributions (from capital gains)* | – | – | – | – | – | ||||||||||||||||||
| Tax return of capital* | – | – | – | – | – | (1) | |||||||||||||||||
| Payment from affiliate | – | – | (2) | – | (2) | – | (2) | – | |||||||||||||||
| Total Distributions and Other | (.27 | ) | (.52 | ) | (.37 | ) | (.26 | ) | (.25 | ) | |||||||||||||
| Net Asset Value, End of Period | $ | 35.35 | $ | 32.48 | $ | 27.96 | $ | 26.78 | $ | 25.82 | |||||||||||||
| Total Return | 9.66 | % | 18.24 | %(3) | 5.87 | %(4) | 4.78 | %(3) | 23.99 | % | |||||||||||||
| Net Assets, End of Period (in thousands) | $ | 1,119,569 | $ | 1,208,155 | $ | 1,464,300 | $ | 2,491,921 | $ | 3,743,762 | |||||||||||||
| Average Net Assets for the Period (in thousands) | $ | 1,207,006 | $ | 1,271,755 | $ | 1,767,226 | $ | 3,232,578 | $ | 3,672,695 | |||||||||||||
| Ratio of Gross Expenses to Average Net Assets(5) | 0.67 | % | 0.61 | % | 0.61 | % | 0.66 | % | 0.71 | % | |||||||||||||
| Ratio of Net Expenses to Average Net Assets(5) | 0.67 | % | 0.61 | % | 0.61 | % | 0.66 | % | 0.71 | % | |||||||||||||
| Ratio of Net Investment Income/(Loss) to Average Net Assets | 0.70 | % | 1.59 | % | 1.33 | % | 0.99 | % | 1.08 | % | |||||||||||||
| Portfolio Turnover Rate | 26 | % | 46 | % | 41 | % | 120 | % | 126 | % | |||||||||||||
Service Shares
| For a share outstanding during each fiscal year | Janus Aspen Worldwide Growth Portfolio | ||||||||||||||||||||||
| ended December 31 | 2007 | 2006 | 2005 | 2004 | 2003 | ||||||||||||||||||
| Net Asset Value, Beginning of Period | $ | 32.22 | $ | 27.76 | $ | 26.62 | $ | 25.70 | $ | 20.95 | |||||||||||||
| Income from Investment Operations: | |||||||||||||||||||||||
| Net investment income/(loss) | .16 | .36 | .29 | .17 | .17 | ||||||||||||||||||
| Net gain/(loss) on securities (both realized and unrealized) | 2.87 | 4.58 | 1.18 | .99 | 4.77 | ||||||||||||||||||
| Total from Investment Operations | 3.03 | 4.94 | 1.47 | 1.16 | 4.94 | ||||||||||||||||||
| Less Distributions and Other: | |||||||||||||||||||||||
| Dividends (from net investment income)* | (.20 | ) | (.48 | ) | (.33 | ) | (.24 | ) | (.19 | ) | |||||||||||||
| Distributions (from capital gains)* | – | – | – | – | – | ||||||||||||||||||
| Tax return of capital* | – | – | – | – | – | (1) | |||||||||||||||||
| Payment from affiliate | – | – | – | (2) | – | (2) | – | ||||||||||||||||
| Total Distributions and Other | (.20 | ) | (.48 | ) | (.33 | ) | (.24 | ) | (.19 | ) | |||||||||||||
| Net Asset Value, End of Period | $ | 35.05 | $ | 32.22 | $ | 27.76 | $ | 26.62 | $ | 25.70 | |||||||||||||
| Total Return | 9.39 | % | 17.97 | % | 5.57 | %(4) | 4.53 | %(3) | 23.68 | % | |||||||||||||
| Net Assets, End of Period (in thousands) | $ | 227,723 | $ | 209,951 | $ | 201,382 | $ | 235,999 | $ | 236,991 | |||||||||||||
| Average Net Assets for the Period (in thousands) | $ | 230,284 | $ | 195,343 | $ | 206,310 | $ | 232,280 | $ | 207,451 | |||||||||||||
| Ratio of Gross Expenses to Average Net Assets(5) | 0.92 | % | 0.86 | % | 0.86 | % | 0.91 | % | 0.96 | % | |||||||||||||
| Ratio of Net Expenses to Average Net Assets(5) | 0.92 | % | 0.86 | % | 0.86 | % | 0.91 | % | 0.96 | % | |||||||||||||
| Ratio of Net Investment Income/(Loss) to Average Net Assets | 0.46 | % | 1.29 | % | 1.11 | % | 0.74 | % | 0.80 | % | |||||||||||||
| Portfolio Turnover Rate | 26 | % | 46 | % | 41 | % | 120 | % | 126 | % | |||||||||||||
* See Note 3 in Notes to Financial Statements.
(1) Tax return of capital aggregated less than $.01 on a per share basis for the fiscal year ended.
(2) Payment from affiliate aggregated less than $.01 on a per share basis for the fiscal year ended.
(3) During the fiscal year ended, Janus Capital and/or Janus Services LLC fully reimbursed the Portfolio for a loss on a transaction resulting from certain trading, pricing, and/or shareholder activity errors, which otherwise would have reduced total return by less than 0.01%
(4) During the fiscal year ended, Janus Capital and/or Janus Services LLC fully reimbursed the Portfolio for a loss on a transaction resulting from certain trading, pricing and/or shareholder activity errors, which otherwise would have reduced total return by 0.02%.
(5) See Note 4 in Notes to Financial Statements.
See Notes to Financial Statements.
Janus Aspen Series December 31, 2007 13
Financial Highlights (continued)
Service II Shares
| For a share outstanding during each fiscal year | Janus Aspen Worldwide Growth Portfolio | ||||||||||||||||||||||
| ended December 31 | 2007 | 2006 | 2005 | 2004 | 2003 | ||||||||||||||||||
| Net Asset Value, Beginning of Period | $ | 32.30 | $ | 27.85 | $ | 26.70 | $ | 25.79 | $ | 21.02 | |||||||||||||
| Income from Investment Operations: | |||||||||||||||||||||||
| Net investment income/(loss) | .16 | .36 | .30 | .17 | .17 | ||||||||||||||||||
| Net gain/(loss) on securities (both realized and unrealized) | 2.88 | 4.58 | 1.19 | .98 | 4.79 | ||||||||||||||||||
| Total from Investment Operations | 3.04 | 4.94 | 1.49 | 1.15 | 4.96 | ||||||||||||||||||
| Distributions and Other: | |||||||||||||||||||||||
| Dividends (from net investment income)* | (.20 | ) | (.49 | ) | (.34 | ) | (.24 | ) | (.19 | ) | |||||||||||||
| Distributions (from capital gains)* | – | – | – | – | – | ||||||||||||||||||
| Tax return of capital* | – | – | – | – | – | (1) | |||||||||||||||||
| Redemption fees | – | – | – | – | – | ||||||||||||||||||
| Payment from affiliate | – | – | – | (2) | – | – | |||||||||||||||||
| Total Distributions and Other | (.20 | ) | (.49 | ) | (.34 | ) | (.24 | ) | (.19 | ) | |||||||||||||
| Net Asset Value, End of Period | $ | 35.14 | $ | 32.30 | $ | 27.85 | $ | 26.70 | $ | 25.79 | |||||||||||||
| Total Return | 9.40 | % | 17.92 | % | 5.63 | %(3) | 4.50 | % | 23.70 | % | |||||||||||||
| Net Assets, End of Period (in thousands) | $ | 13 | $ | 12 | $ | 10 | $ | 10 | $ | 9 | |||||||||||||
| Average Net Assets for the Period (in thousands) | $ | 13 | $ | 11 | $ | 10 | $ | 9 | $ | 8 | |||||||||||||
| Ratio of Gross Expenses to Average Net Assets(4) | 0.92 | % | 0.86 | % | 0.86 | % | 0.91 | % | 0.96 | % | |||||||||||||
| Ratio of Net Expenses to Average Net Assets(4) | 0.92 | % | 0.86 | % | 0.85 | % | 0.91 | % | 0.96 | % | |||||||||||||
| Ratio of Net Investment Income/(Loss) to Average Net Assets | 0.45 | % | 1.26 | % | 1.12 | % | 0.74 | % | 0.80 | % | |||||||||||||
| Portfolio Turnover Rate | 26 | % | 46 | % | 41 | % | 120 | % | 126 | % | |||||||||||||
* See Note 3 in Notes to Financial Statements.
(1) Tax return of capital aggregated less than $.01 on a per share basis for the fiscal year ended.
(2) Payment from affiliate aggregated less than $.01 on a per share basis for the fiscal year ended.
(3) During the fiscal year ended, Janus Capital and/or Janus Services LLC fully reimbursed the Portfolio for a loss on a transaction resulting from certain trading, pricing and/or shareholder activity errors, which otherwise would have reduced total return by 0.02%.
(4) See Note 4 in Notes to Financial Statements.
See Notes to Financial Statements.
14 Janus Aspen Series December 31, 2007
Notes to Schedule of Investments
| Lipper Variable Annuity Global Funds | Funds that invest at least 25% of their portfolio in securities traded outside of the United States and that may own U.S. securities as well. | ||||||
| Morgan Stanley Capital International World IndexSM | Is a market capitalization weighted index composed of companies representative of the market structure of developed market countries in North America, Europe and the Asia/Pacific Region. The index includes reinvestment of dividends, net of foreign withholding taxes. | ||||||
| ADR | American Depositary Receipt | ||||||
| PLC | Public Limited Company | ||||||
| U.S. Shares | Securities of foreign companies trading on an American Stock Exchange. | ||||||
* Non-income-producing security.
# Loaned security; a portion or all of the security is on loan as of December 31, 2007.
† The security is purchased with the cash collateral received from securities on loan (Note 1).
Janus Aspen Series December 31, 2007 15
Notes to Financial Statements
The following section describes the organization and significant accounting policies and provides more detailed information about the schedules and tables that appear throughout this report. In addition, the Notes to Financial Statements explain the methods used in preparing and presenting this report.
1. ORGANIZATION AND SIGNIFICANT ACCOUNTING POLICIES
Janus Aspen Worldwide Growth Portfolio (the "Portfolio") is a series fund. The Portfolio is part of Janus Aspen Series (the "Trust"), which is organized as a Delaware statutory trust and is registered under the Investment Company Act of 1940, as amended, (the "1940 Act") as an open-end management investment company. The Trust offers seventeen Portfolios, which include multiple series of shares, with differing investment objectives and policies. The Portfolio invests primarily in equity securities. The Portfolio is classified as diversified, as defined in the 1940 Act. The Portfolio is a no-load investment.
The Portfolio currently offers three classes of shares: Institutional Shares, Service Shares and Service II Shares. Institutional Shares are offered only in connection with investment in and payments under variable insurance contracts and to qualified retirement plans. Service Shares and Service II Shares are offered only in connection with investment in and payments under variable insurance contracts and to qualified retirement plans that require a fee from Portfolio assets to procure distribution and administrative services to contract owners and plan participants. For Service II Shares, a redemption fee may be imposed on interests in separate accounts or plans held 60 days or less.
Janus Capital Management LLC ("Janus Capital") invested initial seed capital in the amount of $10,000 for the Portfolio - Service II Shares on December 31, 2001.
The following accounting policies have been consistently followed by the Portfolio and are in conformity with accounting principles generally accepted in the United States of America in the investment company industry.
Investment Valuation
Securities are valued at the last sales price or the official closing price for securities traded on a principal securities exchange (U.S. or foreign) and on the NASDAQ National Market. Securities traded on over-the-counter markets and listed securities for which no sales are reported are valued at the latest bid price (or yield equivalent thereof) obtained from one or more dealers transacting in a market for such securities or by a pricing service approved by the Portfolio's Trustees. Short-term securities with maturities of 60 days or less may be valued at amortized cost, which approximates market value. Debt securities with a remaining maturity of greater than 60 days are valued in accordance with the evaluated bid price supplied by the pricing service. The evaluated bid price supplied by the pricing service is an evaluation that reflects such factors as security pric es, yields, maturities and ratings. Foreign securities and currencies are converted to U.S. dollars using the applicable exchange rate in effect as of the daily close of the New York Stock Exchange ("NYSE"). When market quotations are not readily available or deemed unreliable, or events or circumstances that may affect the value of portfolio securities held by the Portfolio are identified between the closing of their principal markets and the time the net asset value ("NAV") is determined, securities may be valued at fair value as determined in good faith under procedures established by and under the supervision of the Portfolio's Trustees. Circumstances in which fair value pricing may be utilized include, but are not limited to: (i) when significant events occur which may affect the securities of a single issuer, such as mergers, bankruptcies, or significant issuer specific developments; (ii) when significant events occur which may affect an entire market, such as natural disasters or significant governmental actions; and (iii) when non-significant events occur such as markets closing early or not opening, security trading halts, or pricing of non-valued securities and restricted or non-public securities. The Portfolio may use a systematic fair valuation model provided by an independent third party to value international equity securities in order to adjust for stale pricing, which may occur between the close of certain foreign exchanges and the NYSE.
Investment Transactions and Investment Income
Investment transactions are accounted for as of the date purchased or sold (trade date). Dividend income is recorded on the ex-dividend date. Certain dividends from foreign securities will be recorded as soon as the Trust is informed of the dividend if such information is obtained subsequent to the ex-dividend date. Dividends from foreign securities may be subject to withholding taxes in foreign jurisdictions. Interest income is recorded on the accrual basis and includes amortization of premiums and accretion of discounts. Gains and losses are determined on the identified cost basis, which is the same basis used for federal income tax purposes. Income, as well as gains and losses, both realized and unrealized, are allocated daily to each class of shares based upon the ratio of net assets represented by each class as a percentage of total net assets.
Expenses
The Portfolio bears expenses incurred specifically on its behalf as well as a portion of general expenses. Each class of shares bears expenses incurred specifically on its behalf and, in addition, each class bears a portion of general expenses, which may be based upon relative net assets of each class. Expenses are allocated daily to each class of shares based upon the ratio of net assets represented by each class as a percentage of total net assets. Expenses directly attributable to a specific class of shares are charged against the operations of such class.
Securities Lending
Under procedures adopted by the Trustees, the Portfolio may lend securities to qualified parties (typically brokers or other financial institutions) who need to borrow securities in order
16 Janus Aspen Series December 31, 2007
to complete certain transactions such as covering short sales, avoiding failures to deliver securities or completing arbitrage activities. The Portfolio may seek to earn additional income through securities lending. There is the risk of delay in recovering a loaned security or the risk of loss in collateral rights if the borrower fails financially. Janus Capital Management LLC ("Janus Capital") makes efforts to balance the benefits and risks from granting such loans.
State Street Bank and Trust Company served as the Portfolio's lending agent for the period January 1, 2007 through May 24, 2007. Effective May 25, 2007, Dresdner Bank AG became the lending agent for the Portfolio.
The Portfolio does not have the right to vote on securities while they are being lent; however, the Portfolio may attempt to call back the loan and vote the proxy if time permits. All loans will be continuously secured by collateral which may consist of cash, U.S. Government securities, domestic and foreign short-term debt instruments, letters of credit, time deposits, repurchase agreements, or such other collateral permitted by the Securities and Exchange Commission ("SEC"). Cash collateral may be invested in affiliated money market funds or other accounts advised by Janus Capital to the extent consistent with exemptive relief obtained from the SEC or as permitted by the 1940 Act and rules promulgated thereunder.
Dresdner Bank AG (the "Lending Agent") may also invest the cash collateral in the Allianz Dresdner Daily Asset Fund or investments in unaffiliated money market funds or accounts, mutually agreed to by the Portfolio and the Lending Agent, that comply with Rule 2a-7 of the 1940 Act relating to money market funds.
As of December 31, 2007, the Portfolio had on loan securities valued as indicated:
| Portfolio | Value at December 31, 2007 | ||||||
| Janus Aspen Worldwide Growth Portfolio | $ | 53,693,725 | |||||
As of December 31, 2007, the Portfolio received cash collateral for securities lending activity as indicated:
| Portfolio | Cash Collateral at December 31, 2007 | ||||||
| Janus Aspen Worldwide Growth Portfolio | $ | 55,059,499 | |||||
As of December 31, 2007, all cash collateral received by the Portfolio was invested in the Allianz Dresdner Daily Asset Fund, except for $9,198,022 and $7,072,110 which were invested in Repurchase Agreements and Time Deposits, respectively.
The value of the collateral must be at least 102% of the market value of the loaned securities that are denominated in U.S. dollars and 105% of the market value of the loaned securities that are not denominated in U.S. dollars. Loaned securities and related collateral are marked-to-market each business day based upon the market value of the loaned securities at the close of business, employing the most recent available pricing information. Collateral levels are then adjusted based on this mark-to-market evaluation.
The borrower pays fees at the Portfolio's direction to the Lending Agent. The Lending Agent may retain a portion of the interest earned on the cash collateral invested. The cash collateral invested by the Lending Agent is disclosed in the Schedule of Investments (if applicable). The lending fees and the Portfolio's portion of the interest income earned on cash collateral are included on the Statement of Operations (if applicable).
Interfund Lending
Pursuant to an exemptive order received from the SEC, the Portfolio may be party to an interfund lending agreement between the Portfolio and other Janus Capital sponsored mutual funds, which permits it to borrow or lend cash at a rate beneficial to both the borrowing and lending funds. Outstanding borrowings from all sources totaling 10% or more of the borrowing Portfolio's total assets must be collateralized at 102% of the outstanding principal value of the loan; loans of less than 10% may be unsecured. During the fiscal year ended December 31, 2007, there were no outstanding interfund borrowing or lending arrangements for the Portfolio.
Forward Currency Transactions
The Portfolio may enter into forward currency contracts in order to reduce its exposure to changes in foreign currency exchange rates on its foreign portfolio holdings and to lock in the U.S. dollar cost of firm purchase and sale commitments for securities denominated in or exposed to foreign currencies. A forward currency exchange contract is a commitment to purchase or sell a foreign currency at a future date at a negotiated rate. The gain or loss arising from the difference between the U.S. dollar cost of the original contract and the value of the foreign currency in U.S. dollars upon closing a contract is included in "Net realized gain/(loss) from investment and foreign currency transactions" on the Statement of Operations (if applicable).
Forward currency contracts held by the Portfolio are fully collateralized by other securities, which are denoted in the accompanying Schedule of Investments (if applicable). The collateral is evaluated daily to ensure its market value equals or exceeds the current market value of the corresponding forward currency contracts. As of December 31, 2007, the Portfolio was not invested in forward foreign currency contracts.
Futures Contracts
The Portfolio may enter into futures contracts to gain exposure to the stock market pending investment of cash balances or to meet liquidity needs. The Portfolio may also use such derivative instruments to hedge or protect from adverse movements in securities prices, currency rates or interest rates. The use of futures contracts may involve risks such as the possibility of illiquid markets or imperfect correlation between
Janus Aspen Series December 31, 2007 17
Notes to Financial Statements (continued)
the value of the contracts and the underlying securities, or that the counterparty will fail to perform its obligations.
Futures contracts are marked-to-market daily, and the daily variation margin is recorded as a receivable or payable on the Statement of Assets and Liabilities (if applicable). When a contract is closed, a realized gain or loss is recorded as "Net realized gain/(loss) from futures contracts" on the Statement of Operations (if applicable) equal to the difference between the opening and closing value of the contract. Generally, futures contracts are marked-to-market (i.e., treated as realized and subject to distribution) for federal income tax purposes at fiscal year-end. Securities designated as collateral for market value on futures contracts are noted in the Schedule of Investments (if applicable). Such collateral is in the possession of the Portfolio's custodian. As of December 31, 2007, the Portfolio was not invested in futures contracts.
Short Sales
The Portfolio may engage in "short sales against the box." Short sales against the box involve either selling short a security that the Portfolio owns, or selling short a security that the Portfolio has the right to obtain, for delivery at a specified date in the future. The Portfolio may enter into a short sale against the box to hedge against anticipated declines in the market price of portfolio securities by locking in gains. The Portfolio does not deliver from its portfolio the securities sold short and does not immediately receive the proceeds of the short sale. The Portfolio borrows the securities sold short and receives proceeds from the short sale only when it delivers the securities to the lender. If the value of the securities sold short increases prior to the scheduled delivery date, the Portfolio loses the opportunity to participate in the gain.
The Portfolio may engage in short sales when the portfolio manager anticipates that a security's market purchase price will be less than its borrowing price. To complete the transaction, the Portfolio must borrow the security to deliver it to the purchaser and buy that same security in the market to return it to the lender. The total market value of all of the Portfolio's short sale positions will not exceed 10% of its assets. Although the potential for gain is limited to the difference between the price at which the Portfolio sold the security short and the cost of borrowing the security, its potential for loss is theoretically unlimited because there is no limit to the cost of replacing the borrowed security. There is no assurance that the Portfolio will be able to close out a short position at a particular time or at an acceptable price. A gain or a loss will be recognized upon termination of a short sale. There is no limit to the size o f any loss that the Portfolio may recognize upon termination of a short sale. Short sales held by the Portfolio are fully collateralized by other securities, which are denoted in the accompanying Schedule of Investments (if applicable). As of December 31, 2007, the Portfolio was not engaged in short sales.
Foreign Currency Translations
The Portfolio does not isolate that portion of the results of operations resulting from changes in foreign exchange rates on investments from the fluctuations arising from changes in market prices of securities held at the date of the financial statements. Net unrealized appreciation or depreciation on investments and foreign currency translation arise from changes in the value of assets and liabilities, including investments in securities held at the date of the financial statements, resulting from changes in the exchange rates and changes in market prices of securities held.
Currency gains and losses are also calculated on payables and receivables that are denominated in foreign currencies. The payables and receivables are generally related to foreign security transactions and income.
Foreign currency-denominated assets and forward currency contracts may involve more risks than domestic transactions, including currency risk, political and economic risk, regulatory risk and market risk. Risks may arise from the potential inability of a counterparty to meet the terms of a contract and from unanticipated movements in the value of foreign currencies relative to the U.S. dollar.
When-issued Securities
The Portfolio may purchase or sell securities on a when-issued or forward commitment basis. The price of the underlying securities and date when the securities will be delivered and paid for are fixed at the time the transaction is negotiated. Losses may arise due to changes in the market value of the securities or from the inability of counterparties to meet the terms of the contract. In connection with such purchases, the Portfolio may hold liquid assets as collateral with the Portfolio's custodian sufficient to cover the purchase price. As of December 31, 2007, the Portfolio was not invested in when-issued securities.
Equity-Linked Structured Notes
The Portfolio may invest in equity-linked structured notes. Equity-linked structured notes are derivative securities which are specially designed to combine the characteristics of one or more underlying securities and their equity derivatives in a single note form. The return and/or yield or income component may be based on the performance of the underlying equity securities, an equity index, and/or option positions. Equity-linked structured notes are typically offered in limited transactions by financial institutions in either registered or non-registered form. An investment in equity-linked structured notes creates exposure to the credit risk of the issuing financial institution, as well as to the market risk of the underlying securities. There is no guaranteed return of principal with these securities and the appreciation potential of these securities may be limited by a maximum payment or call right. In certain cases, equity-linked struc tured notes may be more volatile and less liquid than less complex securities or
18 Janus Aspen Series December 31, 2007
other types of fixed-income securities. Such securities may exhibit price behavior that does not correlate with other fixed-income securities. As of December 31, 2007, the Portfolio was not invested in equity-linked structured notes.
Initial Public Offerings
The Portfolio may invest in initial public offerings ("IPOs"). IPOs and other investment techniques may have a magnified performance impact on a fund with a small asset base. The Portfolio may not experience similar performance as its assets grow.
Restricted Security Transactions
Restricted securities held by the Portfolio may not be sold except in exempt transactions or in a public offering registered under the Securities Act of 1933. The risk of investing in such securities is generally greater than the risk of investing in the securities of widely held, publicly traded companies. Lack of a secondary market and resale restrictions may result in the inability of the Portfolio to sell a security at a fair price and may substantially delay the sale of the security. In addition, these securities may exhibit greater price volatility than securities for which secondary markets exist. As of December 31, 2007, the Portfolio was not invested in restricted securities.
Dividend Distributions
The Portfolio may make semiannual distributions of substantially all of its investment income and an annual distribution of its net realized capital gains (if any). The majority of dividends and net realized capital gains distributions from the Portfolio may be automatically reinvested into additional shares of the Portfolio, based upon the discretion of the shareholder.
Estimates
The preparation of financial statements in conformity with accounting principles generally accepted in the United States of America requires management to make estimates and assumptions that affect the reported amount of assets and liabilities and disclosure of contingent assets and liabilities at the date of the financial statements, and the reported amounts of income and expenses during the reporting period. Actual results could differ from those estimates.
Federal Income Taxes
No provision for income taxes is included in the accompanying financial statements, as the Portfolio intends to distribute to shareholders all taxable investment income and realized gains and otherwise comply with Subchapter M of the Internal Revenue Code applicable to regulated investment companies.
New Accounting Pronouncements
In July 2006, the Financial Accounting Standards Board ("FASB") issued Interpretation No. 48, "Accounting for Uncertainty in Income Taxes – an Interpretation of FASB Statement No. 109" (the "Interpretation"). The Interpretation establishes for all entities, including pass-through entities such as the Portfolio, a minimum threshold for financial statement recognition of the benefit of positions taken in filing tax returns (including whether an entity is taxable in a particular jurisdiction), and requires certain expanded tax disclosures. A calendar year open-end or closed-end fund was required to implement the Interpretation no later than June 29, 2007 (the last business day of the semi-annual reporting period), and the Interpretation also applies to all open tax years as of the date of effectiveness. Management has evaluated the application of the Interpretation to the Portfolio and has determined there is no significant impact on the Portfolio's financial statements.
In September 2006, the FASB issued Statement of Financial Accounting Standards No. 157, "Fair Value Measurements" ("SFAS No. 157"), which defines fair value, establishes a framework for measuring fair value in generally accepted accounting principles, and expands disclosures about fair value measurements. SFAS No. 157 does not require new fair value measurements, but is applie d to the extent that other accounting pronouncements require or permit fair value measurements. SFAS No. 157 emphasizes that fair value is a market-based measurement that should be determined based on the assumptions that market participants would use in pricing an asset or liability. SFAS No. 157 is effective for fiscal years beginning after November 15, 2007 and interim periods within those fiscal years. Management does not believe the adoption of SFAS No. 157 will impact the financial statement amounts, however, the Portfolio will be required to disclose the extent to which fair value is used to measure assets and liabilities and the inputs used to develop the measurements.
2. INVESTMENT ADVISORY AGREEMENTS AND OTHER TRANSACTIONS WITH AFFILIATES
The Portfolio pays a monthly advisory fee to Janus Capital based upon average daily net assets and calculated at the annual rate of 0.60%.
For the Portfolio, the investment advisory fee is determined by calculating a base fee and applying a performance adjustment. The base fee rate is the same as the investment advisory fee rate shown in the previous paragraph. The performance adjustment either increases or decreases the base fee depending on how well the Portfolio has performed relative to its benchmark, as shown below:
| Portfolio | Benchmark Index | ||||||
| Janus Aspen Worldwide Growth Portfolio | MSCI World IndexSM | ||||||
Only the base fee rate applied until February 2007 for the Portfolio, at which time the calculation of the performance adjustment is applied as follows:
(Investment Advisory Fee = Base Fee +/- Performance Adjustment).
The investment advisory fee paid to Janus Capital by the Portfolio consists of two components: (i) a base fee calculated by applying the contractual fixed-rate of the advisory fee to the Portfolio's average daily net assets during the previous month ("Base Fee"), plus or minus (ii) a performance-fee adjustment ("Performance Adjustment") calculated by
Janus Aspen Series December 31, 2007 19
Notes to Financial Statements (continued)
applying a variable rate of up to 0.15% (positive or negative) to the Portfolio's average daily net assets during the applicable performance measurement period.
The performance measurement period generally is the previous 36 months. When the Portfolio's performance-based fee structure has been in effect for at least 12 months, but less than 36 months, the performance measurement period will be equal to the time that has elapsed since the performance-based fee structure took effect. As noted above, any Performance Adjustment began February 2007 for the Portfolio. No Performance Adjustment will be applied unless the difference between the Portfolio's investment performance and the investment record of the Portfolio's benchmark index is 0.50% or greater (positive or negative) during the applicable performance measurement period. Because the Performance Adjustment is tied to the Portfolio's performance relative to its benchmark index (and not its absolute performance), the Performance Adjustment could increase Janus Capital's fee even if the Portfolio's shares lose value during the performance measureme nt period and could decrease Janus Capital's fee even if the Portfolio's shares increase in value during the performance measurement period. For purposes of computing the Base Fee and the Performance Adjustment, net assets will be averaged over different periods (average daily net assets during the previous month for the Base Fee, versus average daily net assets during the performance measurement period for the Performance Adjustment). Performance of the Portfolio is calculated net of expenses whereas the Portfolio's benchmark index does not have any expenses. Reinvestment of dividends and distributions are included in calculating both the performance of the Portfolio and the Portfolio's benchmark index. The Base Fee is calculated and accrued daily. The Performance Adjustment is calculated monthly in arrears and is accrued evenly each day throughout the month. The investment fee is paid monthly in arrears.
The investment performance of the Portfolio's Service Shares ("Service Shares") for the performance measurement period will be used to calculate the Performance Adjustment. After Janus Capital determines whether the Portfolio's performance was above or below its benchmark index by comparing the investment performance of the Portfolio's Service Shares against the investment record of its benchmark index, Janus Capital will apply the same Performance Adjustment (positive or negative) across each other class of shares of the Portfolio.
It is not possible to predict the effect of the Performance Adjustment on future overall compensation to Janus Capital since it will depend on the performance of the Portfolio relative to the record of the Portfolio's benchmark index and future changes to the size of the Portfolio.
The Portfolio's prospectus and statement of additional information contain additional information about performance-based fees. The amount shown as Advisory fees on the Statement of Operations reflects the Base Fee plus/minus any Performance Adjustment. During the fiscal year ended December 31, 2007, the Portfolio recorded a positive Performance Adjustment of $647,784.
Effective for the period from July 1, 2006 through January 31, 2007 ("Waiver Period"), Janus Capital contractually agreed to waive its right to receive a portion of the Portfolio's advisory fee, at the annual rate of up to 0.15% of average daily net assets, under certain conditions. This waiver applied for any calendar month in the Waiver Period if the Portfolio's performance for the period from February 1, 2006 through the end of the preceding calendar month, calculated as though there had been no waiver of the advis ory fee, was less than benchmark performance for that period. The "Excess Expense Reimbursement" line on the Statement of Operations includes the waived amounts for the Portfolio.
Janus Services LLC ("Janus Services"), a wholly-owned subsidiary of Janus Capital, is the Portfolio's transfer agent. Janus Services receives certain out-of-pocket expenses for transfer agent services.
Certain officers of the Portfolio may also be officers and/or directors of Janus Capital. Such officers receive no compensation from the Portfolio, except for the Portfolio's Chief Compliance Officer. Effective January 1, 2006, the Portfolio began reimbursing the adviser for a portion of the compensation paid to the Chief Compliance Officer of the Trust. Total compensation of $3,078 was paid by the Portfolio during the fiscal year ended December 31, 2007. The Portfolio's portion is reported as part of "Other Expenses" on the Statement of Operations.
The Board of Trustees has adopted a deferred compensation plan (the "Deferred Plan") for independent Trustees to elect to defer receipt of all or a portion of the annual compensation they are entitled to receive from the Portfolio. All deferred fees are credited to an account established in the name of the Trustees. The amounts credited to the account then increase or decrease, as the case may be, in accordance with the performance of one or more of the Janus funds that are selected by the Trustees. The account balance continues to fluctuate in accordance with the performance of the selected fund or funds until final payment of all amounts credited to the account. The fluctuation of the account balance is recorded by the Portfolio as unrealized appreciation/(depreciation) and is shown as of December 31, 2007 on the Statement of Assets and Liabilities as an asset, "Noninterested Trustees' deferred compensation," and a liability, "Nonintereste d Trustees' deferred compensation fees." Additionally, the recorded unrealized appreciation/(depreciation) is included in "Unrealized net appreciation/(depreciation) of investments, foreign currency translations and non-interested Trustees' deferred compensation" on the Statement of Assets and Liabilities. Deferred compensation expenses for the fiscal year ended December 31, 2007 are included in "Non-interested Trustees' fees and expenses" on the Statement of Operations. Trustees are allowed to change their designation of mutual funds from time to time. Amounts will be deferred until distributed in accordance with the Deferred Plan. No deferred fees were paid to any Trustee under the Deferred Plan during the fiscal year ended December 31, 2007.
A 1.00% redemption fee may be imposed on Service II Shares of the Portfolio held for 60 days or less. This fee is paid to the
20 Janus Aspen Series December 31, 2007
Portfolio rather than Janus Capital, and is designed to deter excessive short-term trading and to offset the brokerage commissions, market impact, and other costs associated with changes in the Portfolio's asset level and cash flow due to short-term money movements in and out of the Portfolio. The redemption fee is accounted for as an addition to Paid-in Capital. No redemption fees were received by the Portfolio for the fiscal year ended December 31, 2007.
During the fiscal year ended December 31, 2006, Janus Services reimbursed the Portfolio $22 for Institutional Shares, as a result of dilutions caused by incorrectly processed shareholder activity. Reimbursements are included in "Payment from affiliate" on the Statements of Changes in Net Assets.
For the fiscal year ended December 31, 2007, Janus Capital assumed $24,421 of legal, consulting and Trustee costs and fees incurred by the funds in Janus Investment Fund, Janus Aspen Series and Janus Adviser Series (the "Funds") in connection with the regulatory and civil litigation matters discussed in Note 7. These non-recurring costs were allocated to all Funds based on the Funds' respective net assets as of July 31, 2004. Additionally, all future non-recurring costs will be allocated to the Funds based on the Funds' respective net assets on July 31, 2004. These "Non-recurring costs" and "Costs assumed by Janus Capital" are shown on the Statement of Operations.
Janus Distributors LLC, a wholly-owned subsidiary of Janus Capital, is a distributor of the Portfolio. Service Shares and Service II Shares have adopted a Distribution and Shareholder Servicing Plan (the "Plan") pursuant to Rule 12b-1 under the 1940 Act. The Plan authorizes payments by the Portfolio in connection with the distribution of Service Shares and Service II Shares at an annual rate of up to 0.25% of Service Share's and Service II Share's respective average daily net assets.
The Portfolio's expenses may be reduced by expense offsets from an unaffiliated custodian and/or transfer agent. Such credits or offsets are included in "Expense and Fee Offset" on the Statement of Operations. The transfer agent fee offsets received during the period reduce Transfer Agent Fees and Expenses. Custodian offsets received reduce Custodian Fees. The Portfolio could have employed the assets used by the custodian and/or transfer agent to produce income if it had not entered into an expense offset arrangement.
The Portfolio may invest in money market funds, including funds managed by Janus Capital. During the fiscal year ended December 31, 2007, the Portfolio recorded distributions from affiliated investment companies as affiliated dividend income, and had the following affiliated purchases and sales:
| Purchases Shares/Cost | Sales Shares/Cost | Dividend Income | Value at 12/31/07 | ||||||||||||||||
| Janus Aspen Worldwide Growth Portfolio | |||||||||||||||||||
| Janus Institutional Cash Management Fund – Institutional Shares | $ | 64,973,922 | $ | 47,453,623 | $ | 376,041 | $ | 17,520,299 | |||||||||||
| Janus Institutional Cash Reserves Fund | 6,285,126 | 16,169,021 | 79,597 | – | |||||||||||||||
| Janus Institutional Money Market Fund – Institutional Shares | 199,243,352 | 190,985,060 | 888,807 | 8,258,292 | |||||||||||||||
| Janus Money Market Fund – Institutional Shares | 54,609,081 | 54,609,081 | 51,699 | – | |||||||||||||||
| $ | 325,111,481 | $ | 309,216,785 | $ | 1,396,144 | $ | 25,778,591 | ||||||||||||
3. FEDERAL INCOME TAX
The tax components of capital shown in the table below represent: (1) distribution requirements the Portfolio must satisfy under the income tax regulations; (2) losses or deductions the Portfolio may be able to offset against income and gains realized in future years; and (3) unrealized appreciation or depreciation of investments for federal income tax purposes (reduced by foreign tax liability).
Other book to tax differences in the current year may consist of deferred compensation, derivatives, and foreign currency contract adjustments. The Portfolio has elected to treat gains and losses on forward foreign currency contracts as capital gains and losses. Other foreign currency gains and losses on debt instruments are treated as ordinary income for federal income tax purposes pursuant to Section 988 of the Internal Revenue Code. Accumulated capital losses noted below represent net capital loss carryovers, as of December 31, 2007, that may be available to offset future realized capital gains and thereby reduce future taxable gains distributions.
| Portfolio | Undistributed Ordinary Income | Undistributed Long-Term Gains | Accumulated Capital Losses | Post October Deferral | Other Book to Tax Differences | Net Tax Appreciation/ (Depreciation) | |||||||||||||||||||||
| Janus Aspen Worldwide Growth Portfolio | $ | 1,479,240 | $ | – | $ | (1,576,689,969 | ) | $ | – | $ | (15,470 | ) | $ | 184,393,411 | |||||||||||||
Janus Aspen Series December 31, 2007 21
Notes to Financial Statements (continued)
The table below shows the expiration dates of the carryovers.
Capital Loss Carryover Expiration Schedule
For the year ended December 31, 2007
| Portfolio | December 31, 2009 | December 31, 2010 | December 31, 2011 | ||||||||||||
| Janus Aspen Worldwide Growth Portfolio | $ | (334,040,452 | ) | $ | (989,588,014 | ) | $ | (253,061,503 | ) | ||||||
During the year ended December 31, 2007, the following capital loss carryover was utilized by the Portfolio as indicated in the table below.
| Portfolio | Capital Loss Carryover Utilized | ||||||
| Janus Aspen Worldwide Growth Portfolio | $ | 209,495,330 | |||||
The aggregate cost of investments and the composition of unrealized appreciation and depreciation of investment securities for federal income tax purposes as of December 31, 2007 are noted below.
Unrealized appreciation and unrealized depreciation in the table below exclude appreciation/depreciation on foreign currency translations. The primary difference between book and tax appreciation or depreciation of investments is wash sale loss deferrals.
| Portfolio | Federal Tax Cost | Unrealized Appreciation | Unrealized (Depreciation) | ||||||||||||
| Janus Aspen Worldwide Growth Portfolio | $ | 1,218,154,876 | $ | 319,849,664 | $ | (135,456,253 | ) | ||||||||
Income and capital gains distributions are determined in accordance with income tax regulations that may differ from accounting principles generally accepted in the United States of America. These differences are due to differing treatments for items such as net short-term gains, deferral of wash sale losses, foreign currency transactions, net investment losses and capital loss carryovers. Certain permanent differences such as tax returns of capital and net investment losses noted below have been reclassified to paid-in capital.
| For the fiscal year ended December 31, 2007 | Distributions | ||||||||||||||||||
| Portfolio | From Ordinary Income | From Long-Term Capital Gains | Tax Return of Capital | Net Investment Loss | |||||||||||||||
| Janus Aspen Worldwide Growth Portfolio | $ | 10,226,808 | $ | – | $ | – | $ | – | |||||||||||
| For the fiscal year ended December 31, 2006 | Distributions | ||||||||||||||||||
| Portfolio | From Ordinary Income | From Long-Term Capital Gains | Tax Return of Capital | Net Investment Loss | |||||||||||||||
| Janus Aspen Worldwide Growth Portfolio | $ | 23,712,881 | $ | – | $ | – | $ | – | |||||||||||
4. EXPENSE RATIOS
The expense ratios listed in the Financial Highlights reflect expenses prior to any expense offsets (gross expense ratio) and after expense offsets (net expense ratio). Both expense ratios reflect expenses after waivers (reimbursement). Listed below are the gross expense ratios for the Portfolio that would have been in effect, absent the waiver of certain fees and offsets.
| For each fiscal year ended December 31 | Institutional Shares | Service Shares | Service II Shares | ||||||||||||||||||||||||
| Portfolio | 2007(1) | 2006(1) | 2007(1) | 2006(1) | 2007(1) | 2006(1) | |||||||||||||||||||||
Janus Aspen Worldwide Growth Portfolio | 0.67 | % | 0.64 | % | 0.92 | % | 0.90 | % | 0.92 | % | 0.90 | % | |||||||||||||||
(1) The effect of non-recurring costs assumed by Janus Capital (Note 2) is included in the ratio of operating expenses to average net assets without waivers and/or expense reimbursements and was less than 0.01%.
22 Janus Aspen Series December 31, 2007
5. CAPITAL SHARE TRANSACTIONS
| For each fiscal year ended December 31 | Janus Aspen Worldwide Growth Portfolio | ||||||||||
| (all numbers in thousands) | 2007 | 2006 | |||||||||
| Transactions in Portfolio Shares – Institutional Shares | |||||||||||
| Shares sold | 1,130 | 884 | |||||||||
| Reinvested dividends and distributions | 247 | 701 | |||||||||
| Shares repurchased | (6,909 | ) | (16,761 | ) | |||||||
| Net Increase/(Decrease) in Portfolio Shares | (5,532 | ) | (15,176 | ) | |||||||
| Shares Outstanding, Beginning of Period | 37,202 | 52,378 | |||||||||
| Shares Outstanding, End of Period | 31,670 | 37,202 | |||||||||
| Transactions in Portfolio Shares – Service Shares | |||||||||||
| Shares sold | 1,596 | 683 | |||||||||
| Reinvested dividends and distributions | 37 | 108 | |||||||||
| Shares repurchased | (1,653 | ) | (1,527 | ) | |||||||
| Net Increase/(Decrease) in Portfolio Shares | (20 | ) | (736 | ) | |||||||
| Shares Outstanding, Beginning of Period | 6,517 | 7,253 | |||||||||
| Shares Outstanding, End of Period | 6,497 | 6,517 | |||||||||
| Transactions in Portfolio Shares – Service II Shares(1) | |||||||||||
| Shares sold | – | – | |||||||||
| Reinvested dividends and distributions | 2 | 6 | |||||||||
| Shares repurchased | – | – | |||||||||
| Net Increase/(Decrease) in Portfolio Shares | 2 | 6 | |||||||||
| Shares Outstanding, Beginning of Period | 370 | 364 | |||||||||
| Shares Outstanding, End of Period | 372 | 370 | |||||||||
(1) Transactions in Portfolio Shares - Service II Shares are not in thousands.
6. PURCHASES AND SALES OF INVESTMENT SECURITIES
For the fiscal year ended December 31, 2007, the aggregate cost of purchases and proceeds from sales of investment securities (excluding short-term securities) were as follows:
| Portfolio | Purchases of Securities | Proceeds from Sales of Securities | Purchases of Long-Term U.S. Government Obligations | Proceeds from Sales of Long-Term U.S. Government Obligations | |||||||||||||||
| Janus Aspen Worldwide Growth Portfolio | $ | 366,858,664 | $ | 576,792,821 | $ | – | $ | – | |||||||||||
7. PENDING LEGAL MATTERS
In the fall of 2003, the Securities and Exchange Commission ("SEC"), the Office of the New York State Attorney General ("NYAG"), the Colorado Attorney General ("COAG"), and the Colorado Division of Securities ("CDS") announced that they were investigating alleged frequent trading practices in the mutual fund industry. On August 18, 2004, Janus Capital announced that it had reached final settlements with the SEC, the NYAG, the COAG, and the CDS related to such regulators' investigations into Janus Capital's frequent trading arrangements.
A number of civil lawsuits were brought against Janus Capital and certain of its affiliates, the Janus funds, and related entities and individuals based on allegations similar to those announced by the above regulators and were filed in several state and federal jurisdictions. Such lawsuits alleged a variety of theories for recovery including, but not limited to, the federal securities laws, other federal statutes (including ERISA), and various common law doctrines. The Judicial Panel on Multidistrict Litigation transferred these actions to the U.S. District Court for the District of Maryland (the "Court") for coordinated proceedings. On September 29, 2004, five consolidated amended complaints were filed with the Court that generally include: (i) claims by a putative class of investors in certain Janus funds asserting claims on behalf of the investor class (Marini, et al. v. Janus Investment Fund,
Janus Aspen Series December 31, 2007 23
Notes to Financial Statements (continued)
et al., U.S. District Court, District of Maryland, Case No. 04-CV-00497); (ii) derivative claims by investors in certain Janus funds ostensibly on behalf of such funds (Steinberg et al. v. Janus Capital Management, LLC et al., U.S. District Court, District of Maryland, Case No. 04-CV-00518); (iii) claims on behalf of participants in the Janus 401(k) plan (Wangberger v. Janus Capital Group Inc., 401(k) Advisory Committee, et al., U.S. District Court, District of Maryland, Case No. JFM-05-2711); (iv) claims brought on behalf of shareholders of Janus Capital Group Inc. ("JCGI") on a derivative basis against the Board of Directors of JCGI (Chasen v. Whiston, et al., U.S. District Court, District of Maryland, Case No. 04-MD-00855); and (v) claims by a putative class of shareholders of JCGI asserting claims on behalf of the shareholders (Wiggins, et al. v. Janus Capital Group, Inc., et al., U.S. District Court, D istrict of Maryland, Case No. 04-CV-00818). Each of the five complaints initially named JCGI and/or Janus Capital as a defendant. In addition, the following were also named as defendants in one or more of the actions: Janus Investment Fund ("JIF"), Janus Aspen Series ("JAS"), Janus Adviser Series ("JAD"), Janus Distributors LLC, Enhanced Investment Technologies, LLC ("INTECH"), Bay Isle Financial LLC ("Bay Isle"), Perkins, Wolf, McDonnell and Company, LLC ("Perkins"), the Advisory Committee of the Janus 401(k) plan, and the current or former directors of JCGI.
On August 25, 2005, the Court entered orders dismissing most of the claims asserted against Janus Capital and its affiliates by fund investors in the Marini and Steinberg cases (actions (i) and (ii) above) except certain claims under Section 10(b) of the Securities Exchange Act of 1934 and under Section 36(b) of the Investment Company Act of 1940, as amended (the "1940 Act"). On August 15, 2006, the Wangberger complaint in the 401(k) plan class action (action (iii) above) was dismissed by the district court with prejudice. The plaintiff appealed that dismissal decision to the United States Court of Appeals for the Fourth Circuit. The appeal is still pending and argument in the matter was held in December 2007. The Court also dismissed the Chasen lawsuit (action (iv) above) against JCGI's Board of Directors without leave to amend. Finally, a Motion to Dismiss the Wiggins suit (action (v) above) was granted a nd the matter was dismissed in May 2007. However, in June 2007, Plaintiffs appealed that dismissal to the United States Court of Appeals for the Fourth Circuit. That appeal is currently pending.
In addition to the lawsuits described above, the Auditor of the State of West Virginia ("Auditor"), in his capacity as securities commissioner, has initiated administrative proceedings against many of the defendants in the market timing cases (including JCGI and Janus Capital) and, as a part of its relief, is seeking disgorgement and other monetary relief based on similar market timing allegations (In the Matter of Janus Capital Group Inc. et al., Before the Securities Commissioner, State of West Virginia, Summary Order No. 05-1320). The respondents in these proceedings collectively sought a Writ of Prohibition in state court, which was denied. Their subsequent Petition for Appeal was also denied. Consequently, in September 2006, JCGI and Janus Capital filed their answer to the Auditor's summary order instituting proceedings and requested a hearing. A statu s conference was held on June 28, 2007, during which the parties were ordered to submit their proposed scheduling order. To date, no scheduling order has been entered in the case. In addition to the pending Motion to Discharge Order to Show Cause, JCGI and Janus Capital, as well as other similarly situated defendants, continue to challenge the statutory authority of the Auditor to bring such an action.
Additional lawsuits may be filed against certain of the Janus funds, Janus Capital, and related parties in the future. Janus Capital does not currently believe that these pending actions will materially affect its ability to continue providing services it has agreed to provide to the Janus funds.
24 Janus Aspen Series December 31, 2007
Report of Independent Registered Public Accounting Firm
To the Trustees and Shareholders
of Janus Aspen Worldwide Growth Portfolio
In our opinion, the accompanying statement of assets and liabilities, including the schedule of investments, and the related statements of operations and of changes in net assets and the financial highlights present fairly, in all material respects, the financial position of Janus Aspen Worldwide Growth Portfolio (one of the portfolios constituting Janus Aspen Series, hereafter referred to as the "Portfolio") at December 31, 2007, the results of its operations for the year then ended, the changes in its net assets for each of the two years in the period then ended, and the financial highlights for each of the five years in the period then ended, in conformity with accounting principles generally accepted in the United States of America. These financial statements and financial highlights (hereafter referred to as "financial statements") are the responsibility of the Portfolio's management; our responsibility is to express an opinion on these financial statements based on our audits. We conducted our audits of these financial statements in accordance with the standards of the Public Company Accounting Oversight Board (United States). Those standards require that we plan and perform the audit to obtain reasonable assurance about whether the financial statements are free of material misstatement. An audit includes examining, on a test basis, evidence supporting the amounts and disclosures in the financial statements, assessing the accounting principles used and significant estimates made by management, and evaluating the overall financial statement presentation. We believe that our audits, which included confirmation of securities at December 31, 2007 by correspondence with the custodian, transfer agent and brokers, and the application of alternative auditing procedures where securities purchased had not been received, provide a reasonable basis for our opinion.

Denver, Colorado
February 15, 2008
Janus Aspen Series December 31, 2007 25
Additional Information (unaudited)
PROXY VOTING POLICIES AND VOTING RECORD
A description of the policies and procedures that the Portfolio uses to determine how to vote proxies relating to its portfolio securities is available: (i) without charge, upon request, by calling 1-800-525-0020 (toll free); (ii) on the Portfolio's website at www.janus.com/proxyvoting; and (iii) on the SEC's website at http://www.sec.gov. Additionally, information regarding the Portfolio's proxy voting record for the most recent twelve-month period ended June 30 is also available, free of charge, through www.janus.com/proxyvoting and from the SEC's website at http://www.sec.gov.
QUARTERLY PORTFOLIO HOLDINGS
The Portfolio files its complete portfolio holdings (schedule of investments) with the SEC for the first and third quarters of each fiscal year on Form N-Q within 60 days of the end of such fiscal quarter. The Portfolio's Form N-Q: (i) is available on the SEC's website at http://www.sec.gov; (ii) may be reviewed and copied at the SEC's Public Reference Room in Washington, D.C. (information on the Public Reference Room may be obtained by calling 1-800-SEC-0330); and (iii) is available without charge, upon request, by calling Janus at 1-800-525-0020 (toll free).
APPROVAL OF ADVISORY AGREEMENTS DURING THE PERIOD
The Trustees of Janus Aspen Series, none of whom has ever been affiliated with Janus Capital ("Independent Trustees"), oversee the management of each Portfolio and, as required by law, determine annually whether to continue the investment advisory agreement for each Portfolio and the subadvisory agreements for the three Portfolios that utilize subadvisers.
In connection with their most recent consideration of those agreements for each Portfolio, the Trustees received and reviewed a substantial amount of information provided by Janus Capital and the respective subadvisers in response to requests of the Independent Trustees and their independent legal counsel. They also received and reviewed a considerable amount of information and analysis provided by their independent fee consultant. Throughout their consideration of the agreements, the Independent Trustees were advised by their independent legal counsel. The Independent Trustees met with management to consider the agreements, and also met separately in executive session with their independent legal counsel and their independent fee consultant.
At a meeting held on December 14, 2007, based on their evaluation of the information provided by Janus Capital, the subadvisers and the independent fee consultant, as well as other information, the Trustees determined that the overall arrangements between each Portfolio and Janus Capital and each subadviser, as applicable, were fair and reasonable in light of the nature, extent and quality of the services provided by Janus Capital, its affiliates and the subadvisers, the fees charged for those services, and other matters that the Trustees considered relevant in the exercise of their business judgment. At that meeting the Trustees unanimously approved the continuation of the investment advisory agreement for each Portfolio, and the subadvisory agreement for each subadvised Portfolio, for the period from February 1, 2008 through February 1, 2009, subject to earlier termina tion as provided for in each agreement.
In considering the continuation of those agreements, the Trustees reviewed and analyzed various factors that they determined were relevant, including the factors described below, none of which by itself was considered dispositive. However, the material factors and conclusions that formed the basis for the Trustees' determination to approve the continuation of the agreements are discussed separately below.
Nature, Extent and Quality of Services
The Trustees reviewed the nature, extent and quality of the services provided by Janus Capital and the subadvisers to the Portfolios, taking into account the investment objective and strategy of each Portfolio, the knowledge of the Trustees gained from their regular meetings with management on at least a quarterly basis, and their ongoing review of information related to the Portfolios. In addition, the Trustees reviewed the resources and key personnel of Janus Capital and each subadviser, especially those who provide investment management services to the Portfolios. The Trustees also considered other services provided to the Portfolios by Janus Capital or the subadvisers, such as managing the execution of portfolio transactions and the selection of broker-dealers for those transactions, serving as the Portfolios' administrator, monitoring adherence to the Portfolios' investment restrictions, producing shareholder reports, providing support services for the Trustees and Trustee committees, communicating with shareholders, and overseeing the activities of other service providers, including monitoring compliance with various policies and procedures of the Portfolios and with applicable securities laws and regulations.
The Trustees concluded that the nature, extent and quality of the services provided by Janus Capital and/or the subadviser to each Portfolio were appropriate and consistent with the terms of the respective advisory and subadvisory agreements; that, taking into account steps taken to address those Portfolios whose performance lagged that of the median of their peers for certain periods, the quality of those services had been consistent with or superior to quality norms in the industry; and that the Portfolios were likely to benefit from the continued provision of those services. They also concluded that Janus Capital and each subadviser had sufficient personnel, with the appropriate education and experience, to
26 Janus Aspen Series December 31, 2007
serve the Portfolios effectively and had demonstrated its continuing ability to attract well-qualified personnel.
Performance of the Portfolios
The Trustees considered the investment results of each Portfolio over various time periods. They reviewed information comparing each Portfolio's performance with the performance of comparable funds and peer groups identified by Lipper Inc., an independent provider of investment company data, and with the Portfolio's benchmark index. They concluded that the performance of many Portfolios was good to very good under current market conditions. Although the performance of some Portfolios lagged that of the median of their peers for certain periods, the Trustees also concluded that Janus Capital had taken appropriate steps to address those instances of under-performance and that the more recent performance of most of those Portfolios had been improving.
Costs of Services Provided
The Trustees examined information on the fees and expenses of each Portfolio in comparison to similar information for comparable funds as provided by Lipper. They also reviewed an analysis of that information provided by their independent fee consultant and noted that the rate of management (investment advisory and administrative) fees for most of the Portfolios, in some cases after contractual expense limitations, was below the mean management fee rate of the respective peer group of funds selected by Lipper.
The Trustees considered the methodology used by Janus Capital and each subadviser in determining compensation payable to portfolio managers, the competitive environment for investment management talent and the competitive market for mutual funds in different distribution channels. They concluded that the compensation methodology provided a good alignment of the interests of the portfolio managers with those of Portfolio shareholders.
The Trustees also reviewed management fees charged by Janus Capital to its separate account clients and to its subadvised funds (for which Janus Capital provides only services related to portfolio management). Although in most instances subadvisory and separate account fee rates for various investment strategies were lower than management fee rates for Portfolios having a similar strategy, the Trustees noted that, under the terms of the management agreements with the Portfolios, Janus Capital performs significant additional services for the Portfolios that it does not provide to those other clients, including administrative services, oversight of the Portfolios' other service providers, Trustee support, regulatory compliance and numerous other services, and that, in serving the Portfolios, Janus Capital assumes many legal risks that it does not assume in servicing its other clients. Moreover, the Trustees noted that the spread between the av erage fee rates charged to the Portfolios and the fee rates that Janus Capital charged to its separate account clients was significantly smaller than the average spread for such fee rates of other advisers, based on publicly available data and research conducted by their independent fee consultant.
The Trustees reviewed information on the profitability to Janus Capital and its affiliates of their relationships with each Portfolio, as well as an explanation of the methodology used in allocating various expenses of Janus Capital and its affiliates among the Portfolios and other clients. They also reviewed the financial statements of Janus Capital's parent company and its corporate structure. In their review, the Trustees considered whether Janus Capital and each subadviser receives adequate incentives to manage the Portfolios effectively. They recognized that profitability comparisons among investment advisers are difficult because very little comparative information is publicly available and profitability of any adviser is affected by numerous factors, including the organizational structure of the particular adviser, the types of funds and other accounts it manages, possible other lines of business, the methodology for allocating expens es, and the adviser's capital structure and cost of capital. However, based on the information available and taking those factors into account, the Trustees concluded that Janus Capital's profitability with respect to each Portfolio in relation to the services rendered was not unreasonable.
The Trustees concluded that the management fees and other compensation payable by each Portfolio to Janus Capital and its affiliates, as well as the fees payable by Janus Capital or the Portfolios to the subadvisers of subadvised Portfolios, were reasonable in relation to the nature, extent and quality of the services provided, taking into account the fees charged by other advisers for managing comparable mutual funds with similar strategies and the fees Janus Capital and the subadvisers charge to other clients. They also concluded that the overall expense ratio of each Portfolio was reasonable, taking into account the size of the Portfolio, the quality of services provided by Janus Capital and any subadviser, the investment performance of the Portfolio and any expense limitations agreed to by Janus Capital.
Economies of Scale
The Trustees considered information about the potential for Janus Capital to realize economies of scale as the assets of the Portfolios increase. They noted that, although most Portfolios pay advisory fees at a fixed rate as a percentage of net assets, without any breakpoints, the management fee rate paid by each Portfolio, after any contractual expense limitations, was below the mean management fee rate of the Portfolio's peer group selected by Lipper; and, for those Portfolios whose expenses are being reduced by the contractual expense limitations of Janus Capital, Janus Capital is subsidizing the Portfolios because they have not reached adequate scale. Moreover, as the assets of many of the Portfolios declined in the past few years, those Portfolios benefited from having advisory fee rates that remained constant rather than increasing as assets declined. In addition, performance fee
Janus Aspen Series December 31, 2007 27
Additional Information (unaudited) (continued)
structures have been implemented for several Portfolios that will cause the effective rate of advisory fees payable by such a Portfolio to vary depending on the investment performance of the Portfolio relative to its benchmark index over the measurement period; and a few Portfolios have fee schedules with breakpoints and reduced fee rates above certain asset levels. The Trustees also noted that the Portfolios share directly in economies of scale through lower charges of third-party service providers, based on the combined scale of all of the Portfolios. Based on all of the information they reviewed, the Trustees concluded that the current fee structure of each Portfolio was reasonable and that the current rates of fees do reflect a sharing between Janus Capital and the Portfolio of economies of scale at the current asset level of the Portfolio.
Other Benefits to Janus Capital
The Trustees also considered benefits that accrue to Janus Capital and its affiliates from their relationships with the Portfolios. They recognized that two affiliates of Janus Capital separately serve the Portfolios as transfer agent and distributor, respectively. They also considered Janus Capital's past and proposed use of commissions paid by Portfolios on their portfolio brokerage transactions to obtain proprietary and third-party research products and services benefiting those Portfolios and/or other clients of Janus Capital. The Trustees concluded that Janus Capital's use of "soft" commission dollars of a Portfolio to obtain proprietary and third-party research products and services was consistent with regulatory requirements and guidelines and was likely to benefit the Portfolios. The Trustees also concluded that, other than the services provided by Janus Capital and its affiliates pursuant to the agreements and the fees to be paid by each Portfolio therefor, the Portfolios and Janus Capital may potentially benefit from their relationship with each other in other ways. They concluded that Janus Capital benefits from the receipt of proprietary research products and services acquired through commissions paid on portfolio transactions of the Portfolios and that the Portfolios benefit from Janus Capital's receipt of those products and services, as well as research products and services acquired through commissions paid by other clients of Janus Capital. They further concluded that success of any Portfolio could attract other business to Janus Capital or other Janus funds and that the success of Janus Capital could enhance Janus Capital's ability to serve the Portfolios.
After full consideration of the above factors, as well as other factors, all of the Trustees, all of whom are Independent Trustees, concluded that the proposed continuation of the investment advisory agreement for each Portfolio, and the subadvisory agreement for each subadvised Portfolio, was in the best interest of the respective Portfolios and their shareholders.
28 Janus Aspen Series December 31, 2007
Explanations of Charts, Tables and
Financial Statements (unaudited)
1. PERFORMANCE OVERVIEWS
The performance overview graph compares the performance of a hypothetical $10,000 investment in the Portfolio with one or more widely used market indices. The hypothetical example does not represent the returns of any particular investment.
When comparing the performance of the Portfolio with an index, keep in mind that market indices do not include brokerage commissions that would be incurred if you purchased the individual securities in the index. They also do not include taxes payable on dividends and interest or operating expenses incurred if you maintained a Portfolio invested in the index.
Average annual total returns are quoted for each class of the Portfolio. Average annual total return is calculated by taking the growth or decline in value of an investment over a period of time, including reinvestment of any dividends, distributions and capital gains, then calculating the annual compounded percentage rate that would have produced the same result had the rate of growth been constant throughout the period. Average annual total return does not reflect the deduction of taxes that a shareholder would pay on Portfolio distributions or redemptions of Portfolio shares.
Pursuant to federal securities rules, expense ratios shown in the performance chart reflect subsidized and unsubsidized ratios for the past fiscal year. The total annual portfolio operating expenses ratio is gross of any fee waivers, reflecting a Portfolio's unsubsidized expense ratio. The net annual portfolio operating expenses ratio (if applicable) includes contractual waivers of Janus Capital and/or Janus Services, and reflects a Portfolio's subsidized expense ratio. Both the total annual portfolio operating expenses ratio and net annual portfolio operating expenses ratio are based on average net assets as of the fiscal year ended December 31, 2006. The ratios also include expenses indirectly incurred by the Portfolio as a result of investing in other investment companies or pooled investments, which are not reflected in the "Financial Highlights" of this report. As a result, these ratios may be higher or lower than those shown in the "Fi nancial Highlights" in this report. All expenses are shown without the effect of expense offset arrangements. Pursuant to such arrangements, credits realized as a result of uninvested cash balances are used to reduce custodian and transfer agent expenses.
2. SCHEDULE OF INVESTMENTS
Following the performance overview section is the Portfolio's Schedule of Investments. This schedule reports the industry concentrations and types of securities held in the Portfolio on the last day of the reporting period. Securities are usually listed by type (common stock, corporate bonds, U.S. Government obligations, etc.) and by industry classification (banking, communications, insurance, etc.). Holdings are subject to change without notice.
The value of each security is quoted as of the last day of the reporting period. The value of securities denominated in foreign currencies is converted into U.S. dollars. Certain short-term investments maturing within 60 days are valued at amortized cost, which approximates market value.
A summary of investments by country is provided if the Portfolio invested in foreign securities. This summary reports the Portfolio's exposure to different countries by providing the percentage of securities invested in each country. The country of each security represents the country in which the company is incorporated.
2A. FORWARD CURRENCY CONTRACTS
A table listing forward currency contracts follows the Portfolio's Schedule of Investments (if applicable). Forward currency contracts are agreements to deliver or receive a preset amount of currency at a future date. Forward currency contracts are used to hedge against foreign currency risk in the Portfolio's long-term holdings.
The table provides the name of the foreign currency, the settlement date of the contract, the amount of the contract, the value of the currency in U.S. dollars and the amount of unrealized gain or loss. The amount of unrealized gain or loss reflects the change in currency exchange rates from the time the contract was opened to the last day of the reporting period.
2B. FUTURES
A table listing futures contracts follows the Portfolio's Schedule of Investments (if applicable). Futures contracts are contracts that obligate the buyer to receive and the seller to deliver an instrument or money at a specified price on a specified date. Futures are used to hedge against adverse movements in securities prices, currency risk or interest rates.
The table provides the name of the contract, number of contracts held, the expiration date, the principal amount, value and the amount of unrealized gain or loss. The amount of unrealized gain or loss reflects the marked-to-market amount for the last day of the reporting period.
3. STATEMENT OF ASSETS AND LIABILITIES
This statement is often referred to as the "balance sheet." It lists the assets and liabilities of the Portfolio on the last day of the reporting period.
The Portfolio's assets are calculated by adding the value of the securities owned, the receivable for securities sold but not yet settled, the receivable for dividends declared but not yet received on stocks owned and the receivable for Portfolio
Janus Aspen Series December 31, 2007 29
Explanations of Charts, Tables and
Financial Statements (unaudited) (continued)
shares sold to investors but not yet settled. The Portfolio's liabilities include payables for securities purchased but not yet settled, Portfolio shares redeemed but not yet paid and expenses owed but not yet paid. Additionally, there may be other assets and liabilities such as unrealized gain or loss on forward currency contracts.
The section entitled "Net Assets Consist of" breaks down the components of the Portfolio's net assets. Because the Portfolio must distribute substantially all earnings, you will notice that a significant portion of net assets is shareholder capital.
The last section of this statement reports the net asset value ("NAV") per share on the last day of the reporting period for each class of the Portfolio. The NAV is calculated by dividing the Portfolio's net assets (assets minus liabilities) by the number of shares outstanding.
4. STATEMENT OF OPERATIONS
This statement details the Portfolio's income, expenses, gains and losses on securities and currency transactions, and appreciation or depreciation of current Portfolio holdings.
The first section in this statement, entitled "Investment Income," reports the dividends earned from stocks and interest earned from interest-bearing securities in the Portfolio.
The next section reports the expenses and expense offsets incurred by the Portfolio, including the advisory fee paid to the investment adviser, transfer agent fees and expenses, printing and postage for mailing statements, financial reports and prospectuses, and other expenses. Expense offsets, if any, are also shown.
The last section lists the increase or decrease in the value of securities held in the Portfolio. The Portfolio realizes a gain (or loss) when it sells its position in a particular security. An unrealized gain (or loss) refers to the change in net appreciation or depreciation of the Portfolio during the reporting period. "Net Realized and Unrealized Gain/(Loss) on Investments" is affected both by changes in the market value of Portfolio holdings and by gains (or losses) realized during the reporting period.
5. STATEMENT OF CHANGES IN NET ASSETS
This statement reports the increase or decrease in the Portfolio's net assets during the reporting period. Changes in the Portfolio's net assets are attributable to investment operations, dividends, distributions and capital share transactions. This is important to investors because it shows exactly what caused the Portfolio's net asset size to change during the period.
The first section summarizes the information from the Statement of Operations regarding changes in net assets due to the Portfolio's investment performance. The Portfolio's net assets may also change as a result of dividend and capital gains distributions to investors. If investors receive their dividends in cash, money is taken out of the Portfolio to pay the distribution. If investors reinvest their dividends, the Portfolio's net assets will not be affected. If you compare the Portfolio's "Net Decrease from Dividends and Distributions" to the "Reinvested dividends and distributions," you will notice that dividend distributions had little effect on the Portfolio's net assets. This is because the majority of Janus investors reinvest their distributions.
The reinvestment of dividends is included under "Capital Share Transactions." "Capital Shares" refers to the money investors contribute to the Portfolio through purchases or withdraw via redemptions. The "Redemption Fees" refers to the fee paid to the Portfolio for shares held for 60 days or less by a shareholder. The Portfolio's net assets will increase and decrease in value as investors purchase and redeem shares from the Portfolio.
6. FINANCIAL HIGHLIGHTS
This schedule provides a per-share breakdown of the components that affect the Portfolio's NAV for current and past reporting periods for each class of the Portfolio. Not only does this table provide you with total return, it also reports total distributions, asset size, expense ratios and portfolio turnover rate.
The first line in the table reflects the NAV per share at the beginning of the reporting period. The next line reports the net investment income per share, which comprises dividends and interest income earned on securities held by the Portfolio. Following is the total of gains/(losses), realized and unrealized. Dividends and distributions are then subtracted to arrive at the NAV per share at the end of the period. The next line reflects the average annual total return reported the last day of the period.
Also included are the expense ratios, or the percentage of average net assets that were used to cover operating expenses during the period. Expense ratios vary for a number of reasons, including the differences in management fees, the average shareholder account size and the extent of foreign investments, which entail greater transaction costs.
The Portfolio's expenses may be reduced through expense reduction arrangements. These arrangements may include the use of balance credits or transfer agent fee offsets. The Statement of Operations reflects total expenses before any such offset, the amount of the offset and the net expenses. The expense ratios listed in the Financial Highlights reflect total expenses prior to any expense offsets (gross expense ratio) and after the expense offsets (net expense ratio). Both expense
30 Janus Aspen Series December 31, 2007
ratios reflect expenses after waivers (reimbursements), if applicable.
The ratio of net investment income/(loss) summarizes the income earned less expenses, divided by the average net assets of the Portfolio during the reporting period. Don't confuse this ratio with the Portfolio's yield. The net investment income ratio is not a true measure of the Portfolio's yield because it doesn't take into account the dividends distributed to the Portfolio's investors.
The next figure is the portfolio turnover rate, which measures the buying and selling activity in the Portfolio. Portfolio turnover is affected by market conditions, changes in the asset size of the Portfolio, the nature of the Portfolio's investments and the investment style of the portfolio manager. A 100% rate implies that an amount equal to the value of the entire portfolio is turned over in a year; a 50% rate means that an amount equal to the value of half the portfolio is traded in a year; and a 200% rate means that an amount equal to the value of the portfolio is traded every six months.
Janus Aspen Series December 31, 2007 31
Designation Requirements (unaudited)
For federal income tax purposes, the Portfolio designated the following for the year ended December 31, 2007:
Dividends Received Deduction Percentage
| Portfolio | |||||||
| Janus Aspen Worldwide Growth Portfolio | 44 | % | |||||
32 Janus Aspen Series December 31, 2007
Trustees and Officers (unaudited)
The Portfolio's Statement of Additional Information includes additional information about the Trustees and officers and is available, without charge, by calling 1-800-525-0020.
The following are the Trustees and officers of the Trust, together with a brief description of their principal occupations during the last five years (principal occupations for certain Trustees may include periods over five years).
Each Trustee has served in that capacity since he or she was originally elected or appointed. The Trustees do not serve a specified term of office. Each Trustee will hold office until the termination of the Trust or his or her earlier death, resignation, retirement, incapacity, or removal. The retirement age for Trustees is 72. The Portfolio's Nominating and Governance Committee will consider nominees for the position of Trustee recommended by shareholders. Shareholders may submit the name of a candidate for consideration by the Committee by submitting their recommendations to the Trust's Secretary. Each Trustee is currently a Trustee of two other registered investment companies advised by Janus Capital: Janus Investment Fund and Janus Adviser Series. As of the date of this report, collectively, these three registered investment companies consist of 75 series or funds.
The Trust's officers are elected annually by the Trustees for a one-year term. Certain officers also serve as officers of Janus Investment Fund and Janus Adviser Series. Certain officers of the Portfolio may also be officers and/or directors of Janus Capital. Portfolio officers receive no compensation from the Portfolio, except for the Portfolio's Chief Compliance Officer, as authorized by the Trustees.
Trustees
| Name, Address, and Age | Positions Held with Portfolio | Length of Time Served | Principal Occupations During the Past Five Years | Number of Portfolios/ Funds in Fund Complex Overseen by Trustee | Other Directorships Held by Trustee | ||||||||||||||||||
| Dennis B. Mullen* 151 Detroit Street Denver, CO 80206 DOB: 1943 | Chairman Trustee | 3/04-12/07 9/93-Present | Chief Executive Officer of Red Robin Gourmet Burgers, Inc. (since 2005). Formerly, private investor. | 75 | ** | Chairman of the Board (since 2005) and Director of Red Robin Gourmet Burgers, Inc., and Director of Janus Capital Funds Plc (Dublin-based, non-U.S. funds). | |||||||||||||||||
| Jerome S. Contro 151 Detroit Street Denver, CO 80206 DOB: 1956 | Trustee | 12/05-Present | Partner of Tango Group, a private investment firm (since 1999). | 75 | Trustee and Chairman of RS Investment Trust (since 2001), and Director of IZZE Beverages and MyFamily.com, Inc. (genealogical research website). | ||||||||||||||||||
| William F. McCalpin 151 Detroit Street Denver, CO 80206 DOB: 1957 | Trustee | 6/02-Present | Private investor. Formerly, Executive Vice President and Chief Operating Officer of The Rockefeller Brothers Fund (a private family foundation), and Vice President of Asian Cultural Council. | 75 | Director of F.B. Heron Foundation (a private grant making foundation). | ||||||||||||||||||
| John W. McCarter, Jr. 151 Detroit Street Denver, CO 80206 DOB: 1938 | Trustee | 6/02-Present | President and Chief Executive Officer of The Field Museum of Natural History (Chicago, IL) (since 1997). | 75 | Chairman of the Board and Director of Divergence Inc. (biotechnology firm); Director of W.W. Grainger, Inc. (industrial distributor); and Trustee of WTTW (Chicago public television station) and the University of Chicago. | ||||||||||||||||||
* Mr. McCalpin will succeed Mr. Mullen as Chairman as of January 1, 2008.
** Mr. Mullen also serves as director of Janus Capital Funds Plc, consisting of 16 funds. Including Janus Capital Funds Plc and the 75 funds comprising the Janus funds, Mr. Mullen oversees 91 funds.
Janus Aspen Series December 31, 2007 33
Trustees and Officers (unaudited) (continued)
Trustees (cont.)
| Name, Address, and Age | Positions Held with Portfolio | Length of Time Served | Principal Occupations During the Past Five Years | Number of Portfolios/ Funds in Fund Complex Overseen by Trustee | Other Directorships Held by Trustee | ||||||||||||||||||
| James T. Rothe 151 Detroit Street Denver, CO 80206 DOB: 1943 | Trustee | 1/97-Present | Co-founder and Managing Director of Roaring Fork Capital Management, LLC (private investment in public equity firm), and Professor Emeritus of Business of the University of Colorado, Colorado Springs, CO (since 2004). Formerly, Professor of Business of the University of Colorado (2002-2004) and Distinguished Visiting Professor of Business (2001-2002) of Thunderbird (American Graduate School of International Management), Glendale, AZ. | 75 | Director of Red Robin Gourmet Burgers, Inc. | ||||||||||||||||||
| William D. Stewart 151 Detroit Street Denver, CO 80206 DOB: 1944 | Trustee | 9/93-Present | Corporate Vice President and General Manager of MKS Instruments – HPS Products, Boulder, CO (a manufacturer of vacuum fittings and valves). | 75 | N/A | ||||||||||||||||||
| Martin H. Waldinger 151 Detroit Street Denver, CO 80206 DOB: 1938 | Trustee | 9/93-Present | Private Investor and Consultant to California Planned Unit Developments (since 1994). Formerly, CEO and President of Marwal, Inc. (homeowner association management company). | 75 | N/A | ||||||||||||||||||
| Linda S. Wolf 151 Detroit Street Denver, CO 80206 DOB: 1947 | Trustee | 12/05-Present | Retired. Formerly, Chairman and Chief Executive Officer of Leo Burnett (Worldwide) (advertising agency) (2001-2005). | 75 | Director of Wal-Mart, The Field Museum of Natural History (Chicago, IL), Children's Memorial Hospital (Chicago, IL), Chicago Council on Foreign Relations, Economic Club of Chicago, and InnerWorkings (U.S. provider of print procurement solutions). | ||||||||||||||||||
34 Janus Aspen Series December 31, 2007
Officers
| Name, Address, and Age | Positions Held with Portfolio | Term of Office* and Length of Time Served | Principal Occupations During the Past Five Years | ||||||||||||
| Jason P. Yee 151 Detroit Street Denver, CO 80206 DOB: 1969 | Executive Vice President and Portfolio Manager Janus Aspen Worldwide Growth Portfolio | 7/04-Present | Vice President of Janus Capital and Portfolio Manager for other Janus accounts. | ||||||||||||
| Stephanie Grauerholz-Lofton 151 Detroit Street Denver, CO 80206 DOB: 1970 | Chief Legal Counsel and Secretary Vice President | 1/06-Present 3/06-Present | Vice President and Assistant General Counsel of Janus Capital, and Vice President and Assistant Secretary of Janus Distributors LLC. Formerly, Assistant Vice President of Janus Capital and Janus Distributors LLC (2006), and Associate of Vedder, Price, Kaufman & Kammholz, P.C. (1999-2003). | ||||||||||||
| Andrew J. Iseman 151 Detroit Street Denver, CO 80206 DOB: 1964 | President and Chief Executive Officer | 3/07-Present | Chief Operating Officer and Senior Vice President of Janus Capital Group, Inc. and Janus Capital; President of Janus Services LLC; and Director of Capital Group Partners, Inc. Formerly, Senior Vice President of Enhanced Investment Technologies, LLC (2005-2007); and Vice President of Janus Capital (2003-2005) and Janus Services LLC (2003-2004). | ||||||||||||
| David R. Kowalski 151 Detroit Street Denver, CO 80206 DOB: 1957 | Vice President, Chief Compliance Officer, and Anti-Money Laundering Officer | 6/02-Present | Senior Vice President and Chief Compliance Officer of Janus Capital, Janus Distributors LLC, and Janus Services LLC; Chief Compliance Officer of Bay Isle Financial LLC; and Vice President of Enhanced Investment Technologies, LLC. Formerly, Chief Compliance Officer of Enhanced Investment Technologies, LLC (2003-2005); Vice President of Janus Capital (2000-2005) and Janus Services LLC (2004-2005); and Assistant Vice President of Janus Services LLC (2000-2004). | ||||||||||||
| Jesper Nergaard 151 Detroit Street Denver, CO 80206 DOB: 1962 | Chief Financial Officer Vice President, Treasurer, and Principal Accounting Officer | 3/05-Present 2/05-Present | Vice President of Janus Capital. Formerly, Director of Financial Reporting for OppenheimerFunds, Inc. (2004-2005); Site Manager and First Vice President of Mellon Global Securities Services (2003); and Director of Fund Accounting, Project Development, and Training of INVESCO Funds Group (1994-2003). | ||||||||||||
* Officers are elected at least annually by the Trustees for a one-year term and may also be elected from time to time by the Trustees for an interim period.
Janus Aspen Series December 31, 2007 35
Notes
36 Janus Aspen Series December 31, 2007
Notes
Janus Aspen Series December 31, 2007 37
Janus provides access to a wide range of investment disciplines.
Growth
Janus growth portfolios focus on companies believed to be the leaders in their respective industries, with solid management teams, expanding market share, margins and efficiencies.
Core
Janus core portfolios seek investments in more stable and predictable companies. These portfolios look for a strategic combination of steady growth and for certain portfolios, some degree of income.
Risk-Managed
Our risk-managed portfolios seek to outperform their respective indices while maintaining a risk profile equal to or lower than the index itself. Managed by INTECH (a Janus subsidiary), these portfolios use a mathematical process in an attempt to build a more "efficient" portfolio than the index.
Value
Janus value portfolios invest in companies they believe are poised for a turnaround or are trading at a significant discount to fair value. The goal is to gain unique insight into a company's true value and identify and evaluate potential catalysts that may unlock shareholder value.
International & Global
Janus international and global portfolios seek to leverage Janus' research capabilities by taking advantage of inefficiencies in foreign markets, where accurate information and analytical insight are often at a premium.
Bond
Janus bond portfolios attempt to provide less risk relative to equities while seeking to deliver a competitive total return through high current income and appreciation.
Money Market
Janus money market portfolios seek maximum current income consistent with stability of capital.
For more information about our funds, contact your investment professional or go to www.janus.com/info
Please consider the charges, risks, expenses and investment objectives carefully before investing. For a prospectus containing this and other information, please call Janus at 1-800-525-0020 or download the file from www.janus.com/info. Read it carefully before you invest or send money.
An investment in a money market portfolio is not insured or guaranteed by the Federal Deposit Insurance Corporation or any other government agency. Although the Portfolio seeks to preserve the value of your investment at $1.00 per share, it is possible to lose money by investing in the Portfolio.

151 Detroit Street
Denver, CO 80206
1-800-525-0020
Portfolio distributed by Janus Distributors LLC (2/08)
C-0108-357 109-02-703 02-08
Item 2 - Code of Ethics
As of the end of the period covered by this Form N-CSR, the Registrant has adopted a Code of Ethics (as defined in Item 2(b) of Form N-CSR), which is posted on the Registrant’s website: www.janus.com. Registrant intends to post any amendments to, or waivers from (as defined in Item 2 of Form N-CSR), such code on www.janus.com within five business days following the date of such amendment or waiver.
Item 3 - Audit Committee Financial Expert
Janus Aspen Series’ Board of Trustees has determined that the following members of Janus Aspen Series’ Audit Committee are “audit committee financial experts,” as defined in Item 3 to Form N-CSR: Jerome S. Contro (Chairman), John W. McCarter, Jr. and Dennis B. Mullen who are all “independent” under the standards set forth in Item 3 to Form N-CSR.
Item 4 - Principal Accountant Fees and Services
The following table shows the amount of fees that PricewaterhouseCoopers LLP (“Auditor”), Janus Aspen Series’ (the “Fund”) auditor, billed to the Fund during the Fund’s last two fiscal years. For the reporting periods, the Audit Committee approved in advance all audit services and non-audit services that Auditor provided to the Fund, except for those non-audit services that were subject to the pre-approval exception under Rule 2-01 of Regulation S-X (the “pre-approval exception”). The pre-approval exception for services provided directly to the Fund waives the pre-approval requirement for services other than audit, review or attest services if: (A) the aggregate amount of all such services provided constitutes no more than 5% of the total amount of revenues paid by the Fund to Auditor during the fiscal year in which the services are provided; (B) the Fund did not recognize the services as non-audit services at the time of the engagement; and (C) the services are promptly brought to the Audit Committee’s attention, and the Committee (or its delegate) approves the services before the audit is completed.
Services that the Fund’s Auditor Billed to the Fund
Fiscal Year Ended |
| Audit Fees |
| Audit-Related |
| Tax Fees |
| All Other Fees |
| ||||
December 31 |
| Billed to Fund |
| Fees Billed to Fund |
| Billed to Fund |
| Billed to Fund |
| ||||
|
|
|
|
|
|
|
|
|
| ||||
2007 |
| $ | 242,179 |
| $ | 0 |
| $ | 163,268 |
| $ | 0 |
|
Percentage approved pursuant |
|
|
|
|
|
|
|
|
| ||||
to pre-approval exception |
| 0% |
| 0% |
| 0% |
| 0% |
| ||||
|
|
|
|
|
|
|
|
|
| ||||
2006 |
| $ | 229,449 |
| $ | 3,000 |
| $ | 106,221 |
| $ | 0 |
|
Percentage approved pursuant |
|
|
|
|
|
|
|
|
| ||||
to pre-approval exception |
| 0% |
| 0% |
| 0% |
| 0% |
| ||||
|
|
|
|
|
|
|
|
|
| ||||
|
|
|
|
|
|
|
|
|
|
|
|
|
|
The above “Audit Fees” were billed for amounts related to the audit of the Fund’s financial statements and services normally provided by the accountant in connection with statutory and regulatory filings. The above “Audit-Related Fees” were billed for amounts related to proxy statement review. The above “Tax Fees” were billed for amounts related to tax compliance, tax planning, tax advice, and corporate actions review.
Services that the Fund’s Auditor Billed to the Adviser and Affiliated Fund Service Providers
The following table shows the amount of fees billed by Auditor to Janus Capital Management LLC (the “Adviser”), and any entity controlling, controlled by or under common control with the Adviser (“Control Affiliate”) that provides ongoing services to the Fund (“Affiliated Fund Service Provider”), for engagements directly related to the Fund’s operations and financial reporting, during the Fund’s last two fiscal years.
The table also shows the percentage of fees, if any, subject to the pre-approval exception. The pre-approval exception for services provided to Adviser and any Affiliated Fund Service Provider (other than audit, review or attest services) waives the pre-approval requirement if: (A) the aggregate amount of all such services provided constitutes no more than 5% of the total amount of revenues paid to Auditor by the Fund, the Adviser and Affiliated Fund Service Providers during the fiscal year in which the services are provided that would have to be pre-approved by the Audit Committee; (B) the Fund did not recognize the services as non-audit at the time of the engagement; and (C) the services are promptly brought to the Audit Committee’s attention, and the Committee (or its delegate) approves the services before the Fund’s audit is completed.
|
| Audit-Related |
| All Other Fees |
| |||||
|
| Fees Billed to |
| Tax Fees Billed to |
| Billed to Adviser |
| |||
|
| Adviser and |
| Adviser and |
| and Affiliated |
| |||
Fiscal Year Ended |
| Affiliated Fund |
| Affiliated Fund |
| Fund Service |
| |||
December 31 |
| Service Providers |
| Service Providers |
| Providers |
| |||
|
|
|
|
|
|
|
| |||
2007 |
| $ | 102,400 |
| $ | 0 |
| $ | 0 |
|
Percentage approved pursuant |
|
|
|
|
|
|
| |||
to pre-approval exception |
| 0% |
| 0% |
| 0% |
| |||
|
|
|
|
|
|
|
| |||
2006 |
| $ | 129,901 |
| $ | 0 |
| $ | 0 |
|
Percentage approved pursuant |
|
|
|
|
|
|
|
to pre-approval exception |
| 0% |
| 0% |
| 0% |
|
|
|
|
|
|
|
|
|
|
|
|
|
|
|
|
|
The above “Audit-Related Fees” were billed for amounts related to semi-annual financial statement disclosure review and internal control examination.
Non-Audit Services
The following table shows the amount of fees that Auditor billed during the Fund’s last two fiscal years for non-audit services. The Audit Committee is required to pre-approve non-audit services that Auditor provides to the Adviser and any Affiliated Fund Service Provider, if the engagement relates directly to the Fund’s operations and financial reporting (except for those subject to the pre-approval exception described above). The Audit Committee requested and received information from Auditor about any non-audit services that Auditor rendered during the Fund’s last fiscal year to the Adviser and any Affiliated Fund Service Provider. The Committee considered this information in evaluating Auditor’s independence.
|
|
|
| Affiliated Fund Service |
| Total Non-Audit |
|
|
| ||||
|
|
|
| Providers(engagements |
| Fees billed to |
|
|
| ||||
|
|
|
| related directly to the |
| Adviser and |
|
|
| ||||
|
| Total |
| operations and |
| Affiliated Fund |
|
|
| ||||
|
| Non-Audit Fees |
| financial reporting of |
| Service Providers |
|
|
| ||||
Fiscal Year Ended |
| Billed to the Fund |
| the Fund) |
| (all other engagements) |
| Total of (A), (B) |
| ||||
December 31 |
| (A) |
| (B) |
| (C) |
| (C)1 |
| ||||
|
|
|
|
|
|
|
|
|
| ||||
2007 |
| $ | 0 |
| $ | 0 |
| $ | 0 |
| $ | 0 |
|
|
|
|
|
|
|
|
|
|
|
|
|
|
|
2006 |
| $ | 0 |
| $ | 0 |
| $ | 0 |
| $ | 0 |
|
1. The Audit Committee also considered amounts billed by Auditor to all other Control Affiliates in evaluating Auditor’s independence.
Pre-Approval Policies
The Fund’s Audit Committee Charter requires the Fund’s Audit Committee to pre-approve any engagement of Auditor (i) to provide Audit or Non-Audit Services to the Fund or (ii) to provide non-audit services to Adviser or any Affiliated Fund Service Provider, if the engagement relates directly to the operations and financial reporting of the Fund, except for those non-audit services that were subject to the pre-approval exception under Rule 2-01 of Regulation S-X. The Chairman of the Audit Committee or, if the Chairman is unavailable, another member of the Audit Committee who is an independent Trustee, may grant the pre-approval. All such delegated preapprovals must be presented to the Audit Committee no later than the next Audit Committee meeting.
Item 5 - Audit Committee of Listed Registrants
Not applicable.
Item 6 - Schedule of Investments
Please see Schedule of Investments contained in the Reports to Shareholders included under Item 1 of this Form N-CSR.
Item 7 - Disclosure of Proxy Voting Policies and Procedures for Closed-End
Management Investment Companies
Not applicable.
Item 8 - Portfolio Managers of Closed-End Management Investment Companies
Not applicable.
Item 9 - Purchases of Equity Securities by Closed-End Management Investment
Company and Affiliated Purchasers
Not applicable.
Item 10 - Submission of Matters to a Vote of Security Holders
There have been no material changes to the procedures by which shareholders may recommend nominees to the Registrant’s Board of Trustees.
Item 11 - Controls and Procedures
(a) The Registrant’s Principal Executive Officer and Principal Financial Officer have evaluated the Registrant’s disclosure controls and procedures (as defined in Rule 30a-3(c) under the Investment Company Act of 1940) within 90 days of this filing and have concluded that the Registrant’s disclosure controls and procedures were effective, as of that date.
(b) There was no change in the Registrant’s internal control over financial reporting during Registrant’s second fiscal quarter of the period covered by this report that has materially affected, or is reasonably likely to materially affect, the Registrant’s internal control over financial reporting.
Item 12 - Exhibits
(a)(1) Not applicable because the Registrant has posted its Code of Ethics (as defined in Item 2(b) of Form N-CSR) on its website pursuant to paragraph (f)(2) of Item 2 of Form N-CSR.
(a)(2) Separate certifications for the Registrant’s Principal Executive Officer and Principal Financial Officer, as required by Section 302 of the Sarbanes-Oxley Act of 2002 and Rule 30a-2(a) under the Investment Company Act of 1940, are attached as Ex99.CERT.
(a)(3) Not applicable to open-end companies
(b) A certification for the Registrant’s Principal Executive Officer and Principal Financial Officer, as required by Rule 30a-2(b)
under the Investment Company Act of 1940, is attached as Ex99.906CERT. The certification furnished pursuant to this paragraph is not deemed to be “filed” for purposes of Section 18 of the Securities Exchange Act of 1934, or otherwise subject to the liability of that section. Such certification is not deemed to be incorporated by reference into any filing under the Securities Act of 1933 or the Securities Exchange Act of 1934, except to the extent that the Registrant specifically incorporates it by reference.
Signatures
Pursuant to the requirements of the Securities Exchange Act of 1934 and the Investment Company Act of 1940, the Registrant has duly caused this report to be signed on its behalf by the undersigned, thereunto duly authorized.
| ||
| ||
By: | /s/ Andrew J. Iseman |
|
| Andrew J. Iseman, | |
| President and Chief Executive Officer of Janus Aspen Series (Principal | |
| Executive Officer) | |
|
| |
Date: | February 28, 2008 | |
Pursuant to the requirements of the Securities Exchange Act of 1934 and the Investment Company Act of 1940, this report has been signed below by the following persons on behalf of the Registrant and in the capacities and on the dates indicated.
By: | /s/ Andrew J. Iseman |
|
| Andrew J. Iseman, | |
| President and Chief Executive Officer of Janus Aspen Series (Principal | |
| Executive Officer) | |
|
| |
|
| |
Date: | February 28, 2008 | |
By: | /s/ Jesper Nergaard |
|
| Jesper Nergaard, | |
| Vice President, Chief Financial Officer, Treasurer and Principal | |
| Accounting Officer of Janus Aspen Series (Principal Accounting | |
| Officer and Principal Financial Officer) | |
|
| |
|
| |
Date: | February 28, 2008 | |