UNITED STATES SECURITIES AND EXCHANGE COMMISSION
Washington, D.C. 20549
FORM N-CSR
CERTIFIED SHAREHOLDER REPORT OF REGISTERED MANAGEMENT
INVESTMENT COMPANIES
| Investment Company Act file number: | 811-07742 |
| Exact name of registrant as specified in charter: | Voyageur Mutual Funds |
| Address of principal executive offices: | 2005 Market Street |
| Philadelphia, PA 19103 | |
| Name and address of agent for service: | David F. Connor, Esq. |
| 2005 Market Street | |
| Philadelphia, PA 19103 | |
| Registrant’s telephone number, including area code: | (800) 523-1918 |
| Date of fiscal year end: | August 31 |
| Date of reporting period: | August 31, 2009 |
Item 1. Reports to Stockholders
| |
|
 | |
Annual report Delaware Tax-Free Minnesota Fund Delaware Tax-Free Minnesota Intermediate Fund Delaware Minnesota High-Yield Municipal Bond Fund August 31, 2009
Fixed income mutual funds |
This annual report is for the information of Delaware Tax-Free Minnesota Fund, Delaware Tax-Free Minnesota Intermediate Fund, and Delaware Minnesota High-Yield Municipal Bond Fund shareholders, but it may be used with prospective investors when preceded or accompanied by a current prospectus for Delaware Tax-Free Minnesota Fund, Delaware Tax-Free Minnesota Intermediate Fund, and Delaware Minnesota High-Yield Municipal Bond Fund. The figures in the annual report for Delaware Tax-Free Minnesota Fund, Delaware Tax-Free Minnesota Intermediate Fund, and Delaware Minnesota High-Yield Municipal Bond Fund represent past results, which are not a guarantee of future results. The return and principal value of an investment in the investment company will fluctuate so that shares, when redeemed, may be worth more or less than their original cost. Current performance may be higher or lower than the performance data quoted. You should consider the investment objectives, risks, charges, and expenses of the investment company carefully before investing. The Delaware Tax-Free Minnesota Fund, Delaware Tax-Free Minnesota Intermediate Fund, and Delaware Minnesota High-Yield Municipal Bond Fund prospectus contains this and other important information about the investment company. Prospectuses for all open-end funds in the Delaware Investments® Family of Funds are available from your financial advisor, online at www.delawareinvestments.com, or by phone at 800 523-1918. Please read the prospectus carefully before you invest or send money. |
You can obtain shareholder reports and prospectuses online instead of in the mail. Visit www.delawareinvestments.com/edelivery. |
Experience Delaware Investments
Delaware Investments is committed to the pursuit of consistently superior asset management and unparalleled client service. We believe in our investment processes, which seek to deliver consistent results, and in convenient services that help add value for our clients.
If you are interested in learning more about creating an investment plan, contact your financial advisor.
You can learn more about Delaware Investments or obtain a prospectus for Delaware Tax-Free Minnesota Fund, Delaware Tax-Free Minnesota Intermediate Fund, and Delaware Minnesota High-Yield Municipal Bond Fund at www.delawareinvestments.com.
Manage your investments online |
|
Contact information
Investment manager
Delaware Management Company, a series of Delaware Management Business Trust
National distributor
Delaware Distributors, L.P.
Financial intermediary wholesaler
Lincoln Financial Distributors, L.P.
Shareholder servicing, dividend disbursing, and transfer agent
Delaware Service Company, Inc.
Mailing address
2005 Market Street
Philadelphia, PA 19103-7094
Shareholder assistance by phone
800 523-1918, weekdays from 8 a.m. to 7 p.m. Eastern time
For securities dealers and financial institutions representatives only
800 362-7500
| Table of contents | |
| Portfolio management review | 1 |
| Performance summaries | 7 |
| Disclosure of Fund expenses | 16 |
| Sector allocations and credit quality breakdowns | 19 |
| Statements of net assets | 22 |
| Statements of operations | 52 |
| Statements of changes in net assets | 54 |
| Financial highlights | 60 |
| Notes to financial statements | 78 |
| Report of independent registered public accounting firm | 93 |
| Other Fund information | 94 |
| Board of trustees/directors and officers addendum | 100 |
| About the organization | 106 |
Views expressed herein are current as of August 31, 2009 and are subject to change.
Funds are not FDIC insured and are not guaranteed. It is possible to lose the principal amount invested.
Mutual fund advisory services provided by Delaware Management Company, a series of Delaware Management Business Trust, which is a registered investment advisor. Delaware Investments is the marketing name of Delaware Management Holdings, Inc. and its subsidiaries. Lincoln Financial Group is the marketing name for Lincoln National Corporation and its affiliates.
© 2009 Delaware Distributors, L.P.
All third-party trademarks cited are the property of their respective owners.
| Portfolio management review | |
| Delaware Minnesota Municipal Bond Funds | Sept. 8, 2009 |
| Performance preview (for the period ended Aug. 31, 2009) | ||||
| Delaware Tax-Free Minnesota Fund (Class A shares) | 1-year return | +5.04% | ||
| Barclays Capital Municipal Bond Index (benchmark) | 1-year return | +5.67% | ||
| Lipper Minnesota Municipal Debt Funds Average | 1-year return | +3.40% | ||
Past performance does not guarantee future results. |
| Delaware Tax-Free Minnesota Intermediate Fund (Class A shares) | 1-year return | +4.67% | ||
| Barclays Capital 3–15 Year Municipal Bond Index (benchmark) | 1-year return | +6.65% | ||
| Lipper Other States Intermediate Municipal Debt Funds Average | 1-year return | +4.72% |
Past performance does not guarantee future results. |
| Delaware Minnesota High-Yield Municipal Bond Fund (Class A shares) | 1-year return | +3.63% | ||
| Barclays Capital Municipal Bond Index (benchmark) | 1-year return | +5.67% | ||
| Lipper Minnesota Municipal Debt Funds Average | 1-year return | +3.40% |
Past performance does not guarantee future results. |
Fund performance
Delaware Tax-Free Minnesota Fund Class A shares returned +5.04% at net asset value and +0.32% at maximum offer price (both returns include distributions reinvested) for the fiscal year ended Aug. 31, 2009. For the same period, the Fund’s benchmark, the Barclays Capital Municipal Bond Index, formerly the Lehman Brothers Municipal Bond Index, returned +5.67%. For complete annualized performance for Delaware Tax-Free Minnesota Fund, please see the table on page 7.
Delaware Tax-Free Minnesota Intermediate Fund Class A shares returned +4.67% at net asset value and +1.82% at maximum offer price (both returns include distributions reinvested) for the fiscal year ended Aug. 31, 2009. For the same period, the Fund’s benchmark, the Barclays Capital 3–15 Year Municipal Bond Index, formerly the Lehman Brothers 3-15 Year Municipal Bond Index, returned +6.65%. For complete annualized performance for Delaware Tax-Free Minnesota Intermediate Fund, please see the table on page 10.
Data for this portfolio management review were provided by Bloomberg unless otherwise noted. | 1 |
Portfolio management review
Delaware Minnesota Municipal Bond Funds
The 12-month period included one of the most difficult economic and investment climates the portfolio management team has ever seen, followed by a considerable recovery within the municipal bond market and across fixed income markets more broadly.
As the period came to a close, the economy was, if not improving, declining at a far slower pace, and many analysts were anticipating a near-term end to the long recession.
Delaware Minnesota High-Yield Municipal Bond Fund Class A shares returned +3.63% at net asset value and -1.02% at maximum offer price (both returns include distributions reinvested) for the fiscal year ended Aug. 31, 2009. For the same period, the Fund’s benchmark, the Barclays Capital Municipal Bond Index, returned +5.67%. For complete annualized performance for Delaware Minnesota High-Yield Municipal Bond Fund, please see the table on page 13.
Economic environment
The 12-month period included one of the most difficult economic and investment climates the portfolio management team has ever seen, followed by a considerable recovery within the municipal bond market and across fixed income markets more broadly.
The financial markets’ troubles date back to 2007 and turmoil continued into the start of the reporting period in September 2008:
- Falling home prices led to rising mortgage defaults, especially among “subprime” borrowers, or individuals with weak credit.
- As defaults rose, mortgage-backed securities — bonds whose interest is backed by monthly mortgage payments — lost considerable value.
- Credit dried up, and even financially sound companies and municipal borrowers found it increasingly difficult to obtain needed funds.
Several weeks into the period, the financial markets received a jolt with the bankruptcy of storied Wall Street investment bank Lehman Brothers. This event, followed soon after by the near bankruptcy (and ultimate federal bailout) of insurance giant American International Group (AIG), sent the markets
2
into a near panic. Stock and bond prices virtually collapsed, while credit became even less available. On the whole, businesses began to cut their capital spending, and large-scale job losses ensued.
By early 2009, both stock and bond valuations had fallen extremely from their historic highs, reflecting investors’ fears of an economic depression. Though the “worst-case scenarios” that many may have envisioned did not materialize, the U.S. economy did experience its most severe downturn in decades. Gross domestic product (GDP) — a widely used measure of economic activity — fell by 5.4% and 6.4% in the fourth quarter of 2008 and the first quarter of 2009, respectively. It was the country’s worst two-quarter economic performance in more than 50 years.
Within this environment, the Federal Reserve and federal government took a series of steps to loosen tight credit markets and avert a worst-case scenario for the economy. The Fed significantly expanded its balance sheet during the fiscal year. Notably, it employed one of the lesser-used tools that it has at its disposal, in purchasing hundreds of billions of dollars’ worth of longer-term U.S. Treasury debt as well as agency mortgage-backed securities. In December 2008, the Federal Open Market Committee (FOMC) cut the target federal funds rate to a range of zero to 0.25% — an all-time low. For its part, the federal government passed the Troubled Asset Relief Program (TARP), a $700 billion package designed to shore up financial institutions, in October 2008. Several months later, the Obama administration followed up with the American Recovery and Reinvestment Act of 2009, a nearly $800 billion economic stimulus package. (Source: Bloomberg.)
As the period came to a close, the economy was, if not improving, declining at a far slower pace, and, based on our research, many analysts were anticipating a near-term end to the long recession. During the second quarter of 2009, GDP fell by an estimated 1%. This figure was still weak, but it was the best economic performance seen in a year. (Source: Bloomberg.)
Minnesota economic environment
After five months of debates, Governor Pawlenty and the state Legislature failed to reach a final deal that left the state with a $2.675 billion shortfall for the fiscal year that runs from July 1, 2009, through June 30, 2010. The governor exercised an executive authority, called unallotment, to cut already authorized spending to balance the state’s budget when the Legislature is not in session. He plans to use this emergency power to resolve the deficit by employing a massive $1.77 billion accounting shift and slashing more than $900 million from state spending, including cuts to local governments, higher education, and health and human services. All of the allotment adjustments have been implemented except for reductions to fiscal 2011 local government aids, which are expected to be completed by mid-January 2010. (Source: Minnesota Management & Budget.)
The municipal bond market
In our view, the most notable trend within the municipal bond market during the period was the widening performance gap between higher-rated and lower-rated bonds. Demand remained strong for securities with the high (AA or better) credit ratings, for example, but was weak for those in all other rating categories, particularly securities rated BBB or below. As a result, lower-rated bonds
3
Portfolio management review
Delaware Minnesota Municipal Bond Funds
dramatically underperformed their higher-grade counterparts — especially in the first few months of the period when investor confidence was lowest.
This bifurcation, or divergence of performance, within the municipal market largely resulted from the continued financial troubles for monoline municipal bond insurers. For many years, these companies — which insure municipal bond principal and interest payments — received AAA ratings from the major credit rating agencies. As a result, many investors were willing to buy lower-quality bonds as long as they carried this AAA-rated insurance guarantee. Beginning in 2007, however, as credit conditions worsened, many of these monoline insurance companies saw their credit ratings cut dramatically.
Severe capitalization constraints within the investment banking community compounded the municipal markets’ problems during approximately the first half of the fiscal period. Once investment banks’ capital positions were compromised, most banks were less willing to provide liquidity to help bolster the municipal market.
With municipal bond yields high and their prices at historic lows (bond yields and prices move in opposite directions), investors slowly began to return to the tax-exempt bond market beginning in mid-December 2008. At first, they favored highly rated bonds generally associated with minimal credit risk. By the year’s second calendar quarter, as optimism about the economy grew, municipal bond issuance began to grow, and for the first time in months we began to see increased new supply that stemmed from lower-rated, higher-yielding deals.
In this environment, lower-rated bonds generally enjoyed more-favorable performance, and even rallied in the summer months. Credit spreads — which can be interpreted as the additional income paid to investors in exchange for investing in riskier bonds — narrowed sharply from their peak in early January, indicating some initial easing of the general risk aversion that characterized fixed income markets for so long.
Besides generally avoiding credit risk, many municipal bond investors sought to minimize interest rate risk as well during the period. This was indicated by the fact that the yield curve, or the difference in yield offered by shorter-dated AAA-rated general obligation bonds relative to comparable longer-dated issues, rose steadily during the fiscal period. In fact, it reached a high of nearly four percentage points in August 2009 — almost double the historical average. (Source: Barclays Capital.)
Tactical portfolio shifts
Entering the reporting period, we sought to take advantage of market conditions by positioning the Funds more conservatively. We were emphasizing higher-rated securities as well as those with intermediate maturities.
Beginning early in 2009 and continuing through the end of the fiscal period, we became somewhat more confident, as we perceived a positive shift in the outlook for municipal bonds. Believing that municipal bond investors were being unusually well compensated for taking on credit risk, we began to selectively invest more of the Funds’ assets in lower-rated, higher-yielding bonds. Where appropriate, we also sold some of our intermediate-dated holdings and increasingly focused on longer-dated
4
issues — an approach that enabled us to lock higher interest rates into the portfolios for an extended time.
Our approach during approximately the second half of the fiscal year (selectively investing across the credit spectrum) is more representative of how we manage the Funds during more-normalized market conditions. We are bottom-up investors, meaning that we evaluate securities one by one, based on thorough fundamental research to help ensure our comfort with the credit quality of each issuer. We believe that this approach may enable us to uncover value potential that investors with less experience or a less rigorous dedication to research might not be able to identify.
We believe this shift in Fund positioning was well timed. Early on, when the Funds emphasized higher-quality, intermediate-maturity debt, the securities we owned were often less effected by the worst of the market turmoil. As we gradually positioned the funds more aggressively in a more favorable investment environment, we generally benefited from having the types of fundamentally solid, yet higher-than-average yielding bonds that we have historically favored.
Notable sectors and securities
Many of the best-performing sectors in all three funds were those with a large proportion of high-quality bonds. For example, all of the portfolios benefited from their exposure to pre-refunded issues. These securities are found on the short end of the yield curve and have historically faced little if any credit risk. This is because they are backed by the invested debt proceeds of a second bond issue, which typically consists of U.S. Treasury securities. Given investors’ tremendous risk aversion during the period, Treasurys performed extremely well, boosting the performance of our pre-refunded holdings.
Other sectors with predominantly higher-quality issuance added to performance as well. In Delaware Tax-Free Minnesota Intermediate Fund and Delaware Minnesota High-Yield Municipal Bond Fund, for example, the water/sewer bond sector contributed to returns. Bonds from this category have generally been able to withstand the highly challenging economic environment as they are used to fund projects of an essential nature.
Delaware Tax-Free Minnesota Fund and Delaware Tax-Free Minnesota Intermediate Fund benefited from their allocation to state single-family housing bonds, which are exempt from the alternative minimum tax (AMT). These bonds were helped by their backing by federal agencies as well as from the relative scarcity of AMT-exempt bonds.
On the negative side, the industrial development revenue (IDR) bond category — which consists of corporate-backed bonds — was a notable source of underperformance. IDR bonds had a particularly negative impact on Delaware Tax-Free Minnesota Fund and Delaware Minnesota High-Yield Municipal Bond Fund. Bonds in this sector tend to be lower-rated, which on the whole for the year was a negative characteristic in the risk-averse municipal market of the period.
All three Funds saw negative performance from the healthcare sector, which includes two primary bond categories — hospitals and continuing care retirement communities (CCRCs). The difficult housing market combined with the broader economic
5
Portfolio management review
Delaware Minnesota Municipal Bond Funds
recession hurt CCRCs, as it has left fewer individuals able to afford residency in these facilities. Delaware Tax-Free Minnesota Fund’s position in Woodbury, Minn., CCRC holdings was a notable underperformer, while the Eventide CCRC in Moorhead, Minn., was a negative for Delaware Tax-Free Minnesota Intermediate Fund.
Even though the healthcare sector was a source of negative results overall, one of the best individual performers in Delaware Tax-Free Minnesota Fund and Delaware Minnesota High-Yield Municipal Bond Fund was an A-rated Minnesota hospital bond issue, Fairview Health Services. We added this credit to the Tax-Free Minnesota Fund in April 2009, and to the Minnesota High-Yield Municipal Bond Fund in October 2008. In both cases, we felt the issue was offering very attractive values for our shareholders. The bond’s price gained strongly as the period progressed.
Several individual land-transaction bonds — also commonly known as “dirt bonds” — also detracted from total returns. These securities, which help finance property developments, tended to struggle in the wake of the housing market’s boom and subsequent decline. Both Delaware Tax-Free Minnesota Fund and Delaware Minnesota High-Yield Municipal Bond Fund were significantly hurt by their holdings of bonds issued to fund Ivy Tower in Minneapolis. Many of Ivy Tower’s condominium units went unsold, as it was a victim of the poor housing market. Both Funds were also hurt by their positions in Saint Anthony Falls development bonds, another Minneapolis condo conversion project. These securities fell in value as investor pessimism about the land-transaction sector grew. However, we note that all of the condos in this project were fully sold, and we feel that the bonds were unfairly tarnished by the overall troubles in the sector.
6
| Performance summaries | |
Delaware Tax-Free Minnesota Fund | Aug. 31, 2009 |
The performance data quoted represent past performance; past performance does not guarantee future results. Investment return and principal value will fluctuate so your shares, when redeemed, may be worth more or less than their original cost. Please obtain the performance data for the most recent month end by calling 800 523-1918 or visiting our Web site at www.delawareinvestments.com/performance. Current performance may be lower or higher than the performance data quoted.
You should consider the investment objectives, risks, charges, and expenses of the investment company carefully before investing. The Delaware Tax-Free Minnesota Fund prospectus contains this and other important information about the investment company. Please request a prospectus through your financial advisor or by calling 800 523-1918 or visiting our Web site at www.delawareinvestments.com. Read the prospectus carefully before you invest or send money.
A rise or fall in interest rates can have a significant impact on bond prices and the net asset value (NAV) of the Fund. Funds that invest in bonds can lose their value as interest rates rise, and an investor can lose principal.
| Fund performance | Average annual total returns through Aug. 31, 2009 | |||||||||||||||||||
| 1 year | 5 years | 10 years | Lifetime | |||||||||||||||||
| Class A (Est. Feb 27, 1984) | ||||||||||||||||||||
| Excluding sales charge | +5.04 | % | +3.84 | % | +4.95 | % | +6.97 | % | ||||||||||||
| Including sales charge | +0.32 | % | +2.90 | % | +4.47 | % | +6.78 | % | ||||||||||||
| Class B (Est. March 11, 1995) | ||||||||||||||||||||
| Excluding sales charge | +4.26 | % | +3.07 | % | +4.32 | % | +4.85 | % | ||||||||||||
| Including sales charge | +0.26 | % | +2.81 | % | +4.32 | % | +4.85 | % | ||||||||||||
| Class C (Est. May 4, 1994) | ||||||||||||||||||||
| Excluding sales charge | +4.25 | % | +3.08 | % | +4.18 | % | +4.48 | % | ||||||||||||
| Including sales charge | +3.25 | % | +3.08 | % | +4.18 | % | +4.48 | % | ||||||||||||
Returns reflect the reinvestment of all distributions and any applicable sales charges as noted in the following paragraphs.
Performance for Class B and C shares, excluding sales charges, assumes either that contingent deferred sales charges did not apply or that the investment was not redeemed.
Expense limitations were in effect for all classes during the periods shown in the Fund performance chart and in the “Performance of a $10,000 investment” chart. The current expenses for each class are listed on the “Fund expenses” chart. (Note that all charts and graphs referred to in the “Performance summary” section of this report are found on pages 7 through 9.) Performance would have been lower had the expense limitation not been in effect.
7
Performance summaries
Delaware Tax-Free Minnesota Fund
The Fund offers Class A, B, and C shares. Class A shares are sold with a maximum front-end sales charge of up to 4.50%, and have an annual distribution and service fee of up to 0.25% of average daily net assets.
Class B shares may only be purchased through dividend reinvestment and certain permitted exchanges as described in the prospectus. Please see the prospectus for additional information on Class B purchase and sales charges. Class B shares have a contingent deferred sales charge that declines from 4.00% to zero depending on the period of time the shares are held.
Class B shares will automatically convert to Class A shares on a quarterly basis approximately eight years after purchase. They are also subject to an annual distribution and service fee of up to 1.00% of average daily net assets.
Ten-year and lifetime performance figures for Class B shares reflect conversion to Class A shares after approximately eight years.
Class C shares are sold with a contingent deferred sales charge of 1.00% if redeemed during the first 12 months. They are also subject to an annual distribution and service fee of 1.00% of average daily net assets.
The “Fund performance” table and the “Performance of a $10,000 investment” graph do not reflect the deduction of taxes the shareholders would pay on Fund distributions or redemptions of Fund shares.
Fixed income securities and bond funds can lose value, and investors can lose principal, as interest rates rise. They also may be affected by economic conditions that hinder an issuer’s ability to make interest and principal payments on its debt. High yielding, noninvestment grade bonds (junk bonds) involve higher risk than investment grade bonds.
The Fund may also be subject to prepayment risk, the risk that the principal of a fixed income security that is held by the Fund may be prepaid prior to maturity, potentially forcing the Fund to reinvest that money at a lower interest rate.
Substantially all dividend income derived from tax-free funds is exempt from federal income tax. Some income may be subject to the federal alternative minimum tax that applies to certain investors. Capital gains, if any, are taxable.
Funds that invest primarily in a specific state may be more susceptible to the economic, regulatory, and other factors of that state than funds that invest more broadly.
The Fund’s expense ratios, as described in the most recent prospectus, are disclosed in the following “Fund expense ratios” table. Delaware Investments has agreed to reimburse certain expenses and/or waive certain fees from Jan. 1, 2009, through Dec. 31, 2009. Please see the most recent prospectus for additional information on these fee waivers and/or reimbursements.
| Fund expense ratios | Class A | Class B | Class C | ||
| Total annual operating expenses | 1.11% | 1.86% | 1.86% | ||
| (without fee waivers) | |||||
| Net expenses1 | 1.10% | 1.85% | 1.85% | ||
| (including fee waivers, if any) | |||||
| Type of waiver | Contractual | Contractual | Contractual |
8
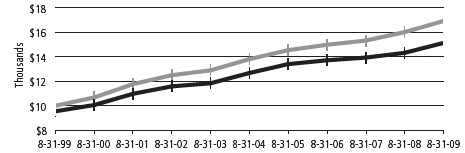
Performance of a $10,000 investment
Average annual total returns from Aug. 31, 1999, through Aug. 31, 2009
![]()
| For period beginning Aug. 31, 1999, through Aug. 31, 2009 | Starting value | Ending value | ||
| Barclays Capital Municipal Bond Index | $10,000 | $16,924 | ||
| Delaware Tax-Free Minnesota Fund — Class A Shares | $9,550 | $15,473 | ||
The chart assumes $10,000 invested in the Fund on Aug. 31, 1999, and includes the effect of a 4.50% front-end sales charge and the reinvestment of all distributions. Please note additional details on these fees in the “Performance summary” section of this report, which includes pages 7 through 9.
The chart also assumes $10,000 invested in the Barclays Capital Municipal Bond Index as of Aug. 31, 1999. The Barclays Capital Municipal Bond Index, formerly the Lehman Brothers Municipal Bond Index, measures the total return performance of the long-term, investment grade tax-exempt bond market.
An index is unmanaged and does not reflect the costs of operating a mutual fund, such as the costs of buying, selling, and holding securities. You cannot invest directly in an index.
Performance of other Fund classes will vary due to different charges and expenses.
The “Fund performance” chart and the “Performance of a $10,000 investment” graph do not reflect the deduction of taxes the shareholders would pay on Fund distributions or redemptions of Fund shares.
Past performance is not a guarantee of future results.
| Stock symbols and CUSIP numbers | |||||||
| Nasdaq symbols | CUSIPs | ||||||
| Class A | DEFFX | 928918101 | |||||
| Class B | DMOBX | 928928696 | |||||
| Class C | DMOCX | 928918408 | |||||
9
| Performance summaries | |
| Delaware Tax-Free Minnesota Intermediate Fund | Aug. 31, 2009 |
The performance data quoted represent past performance; past performance does not guarantee future results. Investment return and principal value will fluctuate so your shares, when redeemed, may be worth more or less than their original cost. Please obtain the performance data for the most recent month end by calling 800 523-1918 or visiting our Web site at www.delawareinvestments.com/performance. Current performance may be lower or higher than the performance data quoted.
You should consider the investment objectives, risks, charges, and expenses of the investment company carefully before investing. The Delaware Tax-Free Minnesota Intermediate Fund prospectus contains this and other important information about the investment company. Please request a prospectus through your financial advisor or by calling 800 523-1918 or visiting our Web site at www.delawareinvestments.com. Read the prospectus carefully before you invest or send money.
A rise or fall in interest rates can have a significant impact on bond prices and the net asset value (NAV) of the Fund. Funds that invest in bonds can lose their value as interest rates rise, and an investor can lose principal.
| Fund performance | Average annual total returns through Aug. 31, 2009 | |||||||||||||||||||
| 1 year | 5 years | 10 years | Lifetime | |||||||||||||||||
| Class A (Est. Oct. 27, 1985) | ||||||||||||||||||||
| Excluding sales charge | +4.67 | % | +3.79 | % | +4.58 | % | +5.22 | % | ||||||||||||
| Including sales charge | +1.82 | % | +3.21 | % | +4.29 | % | +5.10 | % | ||||||||||||
| Class B (Est. Aug. 15, 1995) | ||||||||||||||||||||
| Excluding sales charge | +3.79 | % | +2.91 | % | +4.13 | % | +4.16 | % | ||||||||||||
| Including sales charge | +1.79 | % | +2.91 | % | +4.13 | % | +4.16 | % | ||||||||||||
| Class C (Est. May 4, 1994) | ||||||||||||||||||||
| Excluding sales charge | +3.78 | % | +2.91 | % | +3.71 | % | +3.72 | % | ||||||||||||
| Including sales charge | +2.78 | % | +2.91 | % | +3.71 | % | +3.72 | % | ||||||||||||
Returns reflect the reinvestment of all distributions and any applicable sales charges as noted in the following paragraphs.
Performance for Class B and C shares, excluding sales charges, assumes either that contingent deferred sales charges did not apply or that the investment was not redeemed.
Expense limitations were in effect for all classes during the periods shown in the Fund performance chart and in the “Performance of a $10,000 investment” chart. The current expenses for each class are listed on the “Fund expenses” chart. (Note that all charts and graphs referred to in the “Performance summary” section of this report are found on pages 10 through 12.) Performance would have been lower had the expense limitation not been in effect.
10
The Fund offers Class A, B, and C shares. Class A shares are sold with a maximum front–end sales charge of up to 2.75%, and have an annual distribution and service fee of up to 0.25% of average daily net assets.
Class B shares may only be purchased through dividend reinvestment and certain permitted exchanges as described in the prospectus. Please see the prospectus for additional information on Class B purchase and sales charges. Class B shares have a contingent deferred sales charge that declines from 2.00% to zero depending on the period of time the shares are held.
Class B shares will automatically convert to Class A shares on a quarterly basis approximately five years after purchase. They are also subject to an annual distribution and service fee of up to 1.00% of average daily net assets.
Ten–year and lifetime performance figures for Class B shares reflect conversion to Class A shares after approximately five years.
Class C shares are sold with a contingent deferred sales charge of 1.00% if redeemed during the first 12 months. They are also subject to an annual distribution and service fee of 1.00% of average daily net assets.
The “Fund performance” table and the “Performance of a $10,000 investment” graph do not reflect the deduction of taxes the shareholders would pay on Fund distributions or redemptions of Fund shares.
Fixed income securities and bond funds can lose value, and investors can lose principal, as interest rates rise. They also may be affected by economic conditions that hinder an issuer’s ability to make interest and principal payments on its debt. High yielding, noninvestment grade bonds (junk bonds) involve higher risk than investment grade bonds.
The Fund may also be subject to prepayment risk, the risk that the principal of a fixed income security that is held by the Fund may be prepaid prior to maturity, potentially forcing the Fund to reinvest that money at a lower interest rate.
Substantially all dividend income derived from tax-free funds is exempt from federal income tax. Some income may be subject to the federal alternative minimum tax that applies to certain investors. Capital gains, if any, are taxable.
Funds that invest primarily in a specific state may be more susceptible to the economic, regulatory, and other factors of that state than funds that invest more broadly.
The Fund’s expense ratios, as described in the most recent prospectus, are disclosed in the following “Fund expense ratios” table. Delaware Investments has agreed to reimburse certain expenses and/or waive certain fees from Jan. 1, 2009, through Dec. 31, 2009. Please see the most recent prospectus for additional information on these fee waivers and/or reimbursements.
| Fund expense ratios | Class A | Class B | Class C | ||
| Total annual operating expenses | 0.95% | 1.70% | 1.70% | ||
| (without fee waivers) | |||||
| Net expenses | 0.75% | 1.60% | 1.60% | ||
| (including fee waivers, if any) | |||||
| Type of waiver | Contractual | Contractual | Contractual |
11
Performance summaries
Delaware Tax-Free Minnesota Intermediate Fund
Performance of a $10,000 investment
Average annual total returns from Aug. 31, 1999, through Aug. 31, 2009
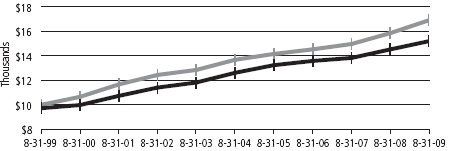
| For period beginning Aug. 31, 1999, through Aug. 31, 2009 | Starting value | Ending value | ||
| Barclays Capital 3–15 Year Municipal Bond Index | $10,000 | $16,917 | ||
| Delaware Tax-Free Minnesota Intermediate Fund — Class A Shares | $9,725 | $15,206 | ||
The chart assumes $10,000 invested in the Fund on Aug. 31, 1999, and includes the effect of a 2.75% front-end sales charge and the reinvestment of all distributions. Please note additional details on these fees in the “Performance summary” section of this report, which includes pages 10 through 12.
The chart also assumes $10,000 invested in the Barclays Capital 3–15 Year Municipal Bond Index as of Aug. 31, 1999. The Barclays Capital 3–15 Year Municipal Bond Index, formerly the Lehman Brothers 3–15 Year Municipal Bond Index, measures the total return performance of investment grade, U.S. tax-exempt bonds with maturities from 2 to 17 years.
An index is unmanaged and does not reflect the costs of operating a mutual fund, such as the costs of buying, selling, and holding securities. You cannot invest directly in an index.
Performance of other Fund classes will vary due to different charges and expenses.
The “Fund performance” chart and the “Performance of a $10,000 investment” graph do not reflect the deduction of taxes the shareholders would pay on Fund distributions or redemptions of Fund shares.
Past performance is not a guarantee of future results.
| Stock symbols and CUSIP numbers | |||||||
| Nasdaq symbols | CUSIPs | ||||||
| Class A | DXCCX | 928930106 | |||||
| Class B | DVSBX | 928928399 | |||||
| Class C | DVSCX | 928930205 | |||||
12
| Delaware Minnesota High-Yield Municipal Bond Fund | Aug. 31, 2009 |
The performance data quoted represent past performance; past performance does not guarantee future results. Investment return and principal value will fluctuate so your shares, when redeemed, may be worth more or less than their original cost. Please obtain the performance data for the most recent month end by calling 800 523-1918 or visiting our Web site at www.delawareinvestments.com/performance. Current performance may be lower or higher than the performance data quoted.
You should consider the investment objectives, risks, charges, and expenses of the investment company carefully before investing. The Delaware Minnesota High-Yield Municipal Bond Fund prospectus contains this and other important information about the investment company. Please request a prospectus through your financial advisor or by calling 800 523-1918 or visiting our Web site at www.delawareinvestments.com. Read the prospectus carefully before you invest or send money.
A rise or fall in interest rates can have a significant impact on bond prices and the net asset value (NAV) of the Fund. Funds that invest in bonds can lose their value as interest rates rise, and an investor can lose principal.
| Fund performance | Average annual total returns through Aug. 31, 2009 | |||||||||||||||||||
| 1 year | 5 years | 10 years | Lifetime | |||||||||||||||||
| Class A (Est. June 4, 1996) | ||||||||||||||||||||
| Excluding sales charge | +3.63 | % | +3.70 | % | +4.81 | % | +5.26 | % | ||||||||||||
| Including sales charge | -1.02 | % | +2.75 | % | +4.33 | % | +4.89 | % | ||||||||||||
| Class B (Est. June 12, 1996) | ||||||||||||||||||||
| Excluding sales charge | +2.86 | % | +2.92 | % | +4.17 | % | +4.96 | % | ||||||||||||
| Including sales charge | -1.10 | % | +2.66 | % | +4.17 | % | +4.96 | % | ||||||||||||
| Class C (Est. June 7, 1996) | ||||||||||||||||||||
| Excluding sales charge | +2.85 | % | +2.94 | % | +4.03 | % | +4.48 | % | ||||||||||||
| Including sales charge | +1.86 | % | +2.94 | % | +4.03 | % | +4.48 | % | ||||||||||||
Returns reflect the reinvestment of all distributions and any applicable sales charges as noted in the following paragraphs.
Performance for Class B and C shares, excluding sales charges, assumes either that contingent deferred sales charges did not apply or that the investment was not redeemed.
Expense limitations were in effect for all classes during the periods shown in the Fund performance chart and in the “Performance of a $10,000 investment” chart. The current expenses for each class are listed on the “Fund expenses” chart. (Note that all charts and graphs referred to in the “Performance summary” section of this report are found on pages 13 through 15.) Performance would have been lower had the expense limitation not been in effect.
13
Performance summaries
Delaware Minnesota High-Yield Municipal Bond Fund
The Fund offers Class A, B, and C shares. Class A shares are sold with a maximum front-end sales charge of up to 4.50%, and have an annual distribution and service fee of up to 0.25% of average daily net assets.
Class B shares may only be purchased through dividend reinvestment and certain permitted exchanges as described in the prospectus. Please see the prospectus for additional information on Class B purchase and sales charges. Class B shares have a contingent deferred sales charge that declines from 4.00% to zero depending on the period of time the shares are held.
Class B shares will automatically convert to Class A shares on a quarterly basis approximately eight years after purchase. They are also subject to an annual distribution and service fee of up to 1.00% of average daily net assets.
Ten-year and lifetime performance figures for Class B shares reflect conversion to Class A shares after approximately eight years.
Class C shares are sold with a contingent deferred sales charge of 1.00% if redeemed during the first 12 months. They are also subject to an annual distribution and service fee of 1.00% of average daily net assets.
The “Fund performance” table and the “Performance of a $10,000 investment” graph do not reflect the deduction of taxes the shareholders would pay on Fund distributions or redemptions of Fund shares.
Fixed income securities and bond funds can lose value, and investors can lose principal, as interest rates rise. They also may be affected by economic conditions that hinder an issuer’s ability to make interest and principal payments on its debt. High yielding, noninvestment grade bonds (junk bonds) involve higher risk than investment grade bonds.
The Fund may also be subject to prepayment risk, the risk that the principal of a fixed income security that is held by the Fund may be prepaid prior to maturity, potentially forcing the Fund to reinvest that money at a lower interest rate.
Substantially all dividend income derived from tax-free funds is exempt from federal income tax. Some income may be subject to the federal alternative minimum tax that applies to certain investors. Capital gains, if any, are taxable.
Funds that invest primarily in a specific state may be more susceptible to the economic, regulatory, and other factors of that state than funds that invest more broadly.
The Fund’s expense ratios, as described in the most recent prospectus, are disclosed in the following “Fund expense ratios” table. Delaware Investments has agreed to reimburse certain expenses and/or waive certain fees from Jan. 1, 2009, through Dec. 31, 2009. Please see the most recent prospectus for additional information on these fee waivers and/or reimbursements.
| Fund expense ratios | Class A | Class B | Class C | ||
| Total annual operating expenses | 0.97% | 1.72% | 1.72% | ||
| (without fee waivers) | |||||
| Net expenses | 0.89% | 1.64% | 1.64% | ||
| (including fee waivers, if any) | |||||
| Type of waiver | Contractual | Contractual | Contractual |
14
Performance of a $10,000 investment
Average annual total returns from Aug. 31, 1999, through Aug. 31, 2009
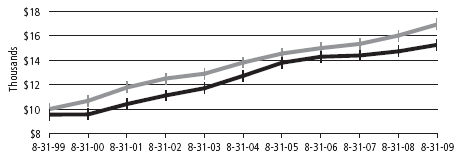
| For period beginning Aug. 31, 1999, through Aug. 31, 2009 | Starting value | Ending value | ||
| Barclays Capital Municipal Bond Index | $10,000 | $16,924 | ||
| Delaware Minnesota High-Yield Municipal Bond Fund — Class A Shares | $9,550 | $15,255 | ||
The chart assumes $10,000 invested in the Fund on Aug. 31, 1999, and includes the effect of a 4.50% front-end sales charge and the reinvestment of all distributions. Please note additional details on these fees in the “Performance summary” section of this report, which includes pages 13 through 15.
The chart also assumes $10,000 invested in the Barclays Capital Municipal Bond Index as of Aug. 31, 1999. The Barclays Capital Municipal Bond Index measures the total return performance of the long-term, investment grade tax-exempt bond market.
An index is unmanaged and does not reflect the costs of operating a mutual fund, such as the costs of buying, selling, and holding securities. You cannot invest directly in an index.
Performance of other Fund classes will vary due to different charges and expenses.
The “Fund performance” chart and the “Performance of a $10,000 investment” graph do not reflect the deduction of taxes the shareholders would pay on Fund distributions or redemptions of Fund shares.
Past perfromance is not a guarantee of future results.
| Stock symbols and CUSIP numbers | |||||||
| Nasdaq symbols | CUSIPs | ||||||
| Class A | DVMHX | 928928316 | |||||
| Class B | DVMYX | 928928290 | |||||
| Class C | DVMMX | 928928282 | |||||
15
Disclosure of Fund expenses
For the period March 1, 2009 to August 31, 2009
As a shareholder of a Fund, you incur two types of costs: (1) transaction costs, including sales charges (loads) on purchase payments, reinvested dividends, or other distributions; redemption fees; and exchange fees; and (2) ongoing costs, including management fees; distribution and/or service (12b-1) fees; and other Fund expenses. These following examples are intended to help you understand your ongoing costs (in dollars) of investing in a Fund and to compare these costs with the ongoing costs of investing in other mutual funds.
The examples are based on an investment of $1,000 invested at the beginning of the period and held for the entire period March 1, 2009 to August 31, 2009.
Actual expenses
The first section of the tables shown, “Actual Fund Return,” provides information about actual account values and actual expenses. You may use the information in this section of the table, together with the amount you invested, to estimate the expenses that you paid over the period. Simply divide your account value by $1,000 (for example, an $8,600 account value divided by $1,000 = 8.6), then multiply the result by the number in the first section under the heading entitled “Expenses Paid During Period” to estimate the expenses you paid on your account during this period.
Hypothetical example for comparison purposes
The second section of the tables shown, “Hypothetical 5% Return,” provides information about hypothetical account values and hypothetical expenses based on the Funds’ actual expense ratios and an assumed rate of return of 5% per year before expenses, which is not the Funds’ actual return. The hypothetical account values and expenses may not be used to estimate the actual ending account balance or expenses you paid for the period. You may use this information to compare the ongoing costs of investing in the Funds and other funds. To do so, compare this 5% hypothetical example with the 5% hypothetical examples that appear in the shareholder reports of the other funds.
Please note that the expenses shown in the tables are meant to highlight your ongoing costs only and do not reflect any transactional costs, such as sales charges (loads), redemption fees, or exchange fees. Therefore, the second section of each table is useful in comparing ongoing costs only, and will not help you determine the relative total costs of owning different funds. In addition, if these transactional costs were included, your costs would have been higher. The Funds’ expenses shown in the tables reflect fee waivers in effect. The expenses shown in each table assume reinvestment of all dividends and distributions.
16
Delaware Tax-Free Minnesota Fund
Expense analysis of an investment of $1,000
| Beginning | Ending | Expenses | |||||||||
| Account Value | Account Value | Annualized | Paid During Period | ||||||||
| 3/1/09 | 8/31/09 | Expense Ratio | 3/1/09 to 8/31/09* | ||||||||
| Actual Fund return | |||||||||||
| Class A | $1,000.00 | $1,057.40 | 0.91% | $4.72 | |||||||
| Class B | 1,000.00 | 1,053.40 | 1.66% | 8.59 | |||||||
| Class C | 1,000.00 | 1,053.30 | 1.66% | 8.59 | |||||||
| Hypothetical 5% return (5% return before expenses) | |||||||||||
| Class A | $1,000.00 | $1,020.62 | 0.91% | $4.63 | |||||||
| Class B | 1,000.00 | 1,016.84 | 1.66% | 8.44 | |||||||
| Class C | 1,000.00 | 1,016.84 | 1.66% | 8.44 | |||||||
Delaware Tax-Free Minnesota Intermediate Fund
Expense analysis of an investment of $1,000
| Beginning | Ending | Expenses | |||||||||
| Account Value | Account Value | Annualized | Paid During Period | ||||||||
| 3/1/09 | 8/31/09 | Expense Ratio | 3/1/09 to 8/31/09* | ||||||||
| Actual Fund return | |||||||||||
| Class A | $1,000.00 | $1,040.90 | 0.75% | $3.86 | |||||||
| Class B | 1,000.00 | 1,036.40 | 1.60% | 8.21 | |||||||
| Class C | 1,000.00 | 1,036.40 | 1.60% | 8.21 | |||||||
| Hypothetical 5% return (5% return before expenses) | |||||||||||
| Class A | $1,000.00 | $1,021.42 | 0.75% | $3.82 | |||||||
| Class B | 1,000.00 | 1,017.14 | 1.60% | 8.13 | |||||||
| Class C | 1,000.00 | 1,017.14 | 1.60% | 8.13 | |||||||
17
Disclosure of Fund expenses
Delaware Minnesota High-Yield Municipal Bond Fund
Expense analysis of an investment of $1,000
| Beginning | Ending | Expenses | |||||||||
| Account Value | Account Value | Annualized | Paid During Period | ||||||||
| 3/1/09 | 8/31/09 | Expense Ratio | 3/1/09 to 8/31/09* | ||||||||
| Actual Fund return | |||||||||||
| Class A | $1,000.00 | $1,082.10 | 0.89% | $4.67 | |||||||
| Class B | 1,000.00 | 1,076.90 | 1.64% | 8.59 | |||||||
| Class C | 1,000.00 | 1,077.90 | 1.64% | 8.59 | |||||||
| Hypothetical 5% return (5% return before expenses) | |||||||||||
| Class A | $1,000.00 | $1,020.72 | 0.89% | $4.53 | |||||||
| Class B | 1,000.00 | 1,016.94 | 1.64% | 8.34 | |||||||
| Class C | 1,000.00 | 1,016.94 | 1.64% | 8.34 | |||||||
*“Expenses Paid During Period” are equal to the Funds’ annualized expense ratio, multiplied by the average account value over the period, multiplied by 184/365 (to reflect the one-half year period).
18
| Sector allocations and credit quality breakdowns | |
| Delaware Tax-Free Minnesota Fund | As of August 31, 2009 |
Sector designations may be different than the sector designations presented in other Fund materials.
| Sector | Percentage of net assets | |
| Municipal Bonds | 99.34 | % |
| Corporate-Backed Revenue Bonds | 3.79 | % |
| Education Revenue Bonds | 5.71 | % |
| Electric Revenue Bonds | 7.84 | % |
| Escrowed to Maturity Bonds | 9.23 | % |
| Health Care Revenue Bonds | 13.69 | % |
| Housing Revenue Bonds | 7.45 | % |
| Lease Revenue Bonds | 3.49 | % |
| Local General Obligation Bonds | 22.01 | % |
| Pre-Refunded Bonds | 17.98 | % |
| Special Tax Revenue Bonds | 3.69 | % |
| State General Obligation Bonds | 2.85 | % |
| Transportation Revenue Bonds | 1.13 | % |
| Water & Sewer Revenue Bonds | 0.48 | % |
| Short-Term Investments | 0.11 | % |
| Total Value of Securities | 99.45 | % |
| Receivables and Other Assets Net of Liabilities | 0.55 | % |
| Total Net Assets | 100.00 | % |
| Credit quality breakdown (as a % of fixed income investments)* | ||
| AAA | 27.75 | % |
| AA | 30.00 | % |
| A | 22.71 | % |
| BBB | 10.39 | % |
| BB | 2.25 | % |
| Not Rated | 6.90 | % |
| Total | 100.00 | % |
*Bond ratings are determined by independent, nationally recognized statistical rating organizations.
19
| Sector allocations and credit quality breakdowns | |
| Delaware Tax-Free Minnesota Intermediate Fund | As of August 31, 2009 |
Sector designations may be different than the sector designations presented in other Fund materials.
| Sector | Percentage of net assets | |
| Municipal Bonds | 97.93 | % |
| Corporate-Backed Revenue Bonds | 1.84 | % |
| Education Revenue Bonds | 10.32 | % |
| Electric Revenue Bonds | 5.63 | % |
| Escrowed to Maturity Bond | 1.36 | % |
| Health Care Revenue Bonds | 11.29 | % |
| Housing Revenue Bonds | 4.30 | % |
| Lease Revenue Bonds | 2.05 | % |
| Local General Obligation Bonds | 28.37 | % |
| Pre-Refunded Bonds | 9.36 | % |
| Special Tax Revenue Bonds | 9.49 | % |
| State General Obligation Bonds | 7.70 | % |
| Transportation Revenue Bonds | 1.46 | % |
| Water & Sewer Revenue Bonds | 4.76 | % |
| Short-Term Investment | 0.32 | % |
| Total Value of Securities | 98.25 | % |
| Receivables and Other Assets Net of Liabilities | 1.75 | % |
| Total Net Assets | 100.00 | % |
| Credit quality breakdown (as a % of fixed income investments)* | ||
| AAA | 33.23 | % |
| AA | 34.29 | % |
| A | 17.67 | % |
| BBB | 7.81 | % |
| BB | 1.24 | % |
| Not Rated | 5.76 | % |
| Total | 100.00 | % |
*Bond ratings are determined by independent, nationally recognized statistical rating organizations.
20
| Delaware Minnesota High-Yield Muni Bond Fund | As of August 31, 2009 |
Sector designations may be different than the sector designations presented in other Fund materials.
| Sector | Percentage of net assets | |
| Municipal Bonds | 97.94 | % |
| Corporate-Backed Revenue Bonds | 3.16 | % |
| Education Revenue Bonds | 8.99 | % |
| Electric Revenue Bonds | 6.32 | % |
| Health Care Revenue Bonds | 26.50 | % |
| Housing Revenue Bonds | 13.15 | % |
| Lease Revenue Bonds | 1.05 | % |
| Local General Obligation Bonds | 11.99 | % |
| Pre-Refunded Bonds | 9.62 | % |
| Special Tax Revenue Bonds | 7.95 | % |
| State General Obligation Bonds | 3.40 | % |
| Transportation Revenue Bond | 1.46 | % |
| Water & Sewer Revenue Bonds | 4.35 | % |
| Short-Term Investment | 0.04 | % |
| Total Value of Securities | 97.98 | % |
| Receivables and Other Assets Net of Liabilities | 2.02 | % |
| Total Net Assets | 100.00 | % |
| Credit quality breakdown (as a % of fixed income investments)* | ||
| AAA | 17.32 | % |
| AA | 21.98 | % |
| A | 23.81 | % |
| BBB | 17.36 | % |
| BB | 2.87 | % |
| Not Rated | 16.66 | % |
| Total | 100.00 | % |
*Bond ratings are determined by independent, nationally recognized statistical rating organizations.
21
| Statements of net assets | |
| Delaware Tax-Free Minnesota Fund | August 31, 2009 |
| Principal amount | Value | ||||||
| Municipal Bonds – 99.34% | |||||||
| Corporate-Backed Revenue Bonds – 3.79% | |||||||
| Cloquet Pollution Control Revenue Refunding | |||||||
| (Potlatch Project) 5.90% 10/1/26 | $ | 6,500,000 | $ | 4,700,670 | |||
| Laurentian Energy Authority I Cogeneration Revenue | |||||||
| Series A 5.00% 12/1/21 | 8,000,000 | 7,357,840 | |||||
| Sartell Environmental Improvement Revenue Refunding | |||||||
| (International Paper) Series A 5.20% 6/1/27 | 7,265,000 | 6,279,430 | |||||
| Seaway Port Authority of Duluth Industrial | |||||||
| Development Dock & Wharf Revenues | |||||||
| (Cargill Project) Series E 6.125% 11/1/14 | 4,500,000 | 4,518,090 | |||||
| 22,856,030 | |||||||
| Education Revenue Bonds – 5.71% | |||||||
| Minnesota Colleges & Universities Revenue Fund Series A | |||||||
| 5.00% 10/1/22 (FSA) | 5,135,000 | 5,329,360 | |||||
| 5.00% 10/1/28 | 8,900,000 | 9,529,942 | |||||
| 5.00% 10/1/29 (NATL-RE) | 5,665,000 | 5,921,341 | |||||
| Minnesota Higher Education Facilities Authority Revenue | |||||||
| (Augsburg College) | |||||||
| Series 6-C 5.00% 5/1/20 | 1,250,000 | 1,234,675 | |||||
| Series 6-J1 5.00% 5/1/36 | 2,225,000 | 2,018,275 | |||||
| (Bethel University) Series 6-R 5.50% 5/1/37 | 2,500,000 | 2,199,475 | |||||
| (Carleton College) Series 6-T 5.00% 1/1/28 | 1,000,000 | 1,050,680 | |||||
| (University of St. Thomas University) | |||||||
| Series 6-X 5.25% 4/1/39 | 5,000,000 | 5,118,750 | |||||
| St. Cloud Housing & Redevelopment Authority Revenue | |||||||
| (State University Foundation Project) 5.00% 5/1/23 | 2,000,000 | 2,060,220 | |||||
| 34,462,718 | |||||||
| Electric Revenue Bonds – 7.84% | |||||||
| Chaska Electric Revenue Refunding | |||||||
| (Generating Facilities) Series A 5.00% 10/1/30 | 3,000,000 | 3,028,050 | |||||
| Minnesota Municipal Power Agency Electric Revenue | |||||||
| 5.00% 10/1/35 | 3,000,000 | 3,020,190 | |||||
| Series A | |||||||
| 5.00% 10/1/34 | 6,250,000 | 6,297,125 | |||||
| 5.125% 10/1/29 | 3,000,000 | 3,066,450 | |||||
22
| Principal amount | Value | ||||||
| Municipal Bonds (continued) | |||||||
| Electric Revenue Bonds (continued) | |||||||
| Northern Municipal Power Agency Electric System | |||||||
| Revenue Refunding | |||||||
| Series A 5.00% 1/1/14 (ASSURED GTY) | $ | 1,000,000 | $ | 1,099,870 | |||
| 5.00% 1/1/16 (ASSURED GTY) | 3,000,000 | 3,334,470 | |||||
| Series B 4.75% 1/1/20 (AMBAC) | 2,500,000 | 2,521,025 | |||||
| Puerto Rico Electric Power Authority Revenue | |||||||
| Refunding Series GG 4.75% 7/1/21 (FSA) | 1,000,000 | 1,002,120 | |||||
| Series TT 5.00% 7/1/37 | 2,500,000 | 2,339,600 | |||||
| Series WW 5.50% 7/1/38 | 4,800,000 | 4,809,600 | |||||
| Southern Minnesota Municipal Power Agency Supply | |||||||
| System Revenue Series A | |||||||
| 5.25% 1/1/14 (AMBAC) | 4,000,000 | 4,433,320 | |||||
| 5.25% 1/1/15 (AMBAC) | 8,900,000 | 9,935,604 | |||||
| ^Capital Appreciation | |||||||
| 4.44% 1/1/25 (NATL-RE) | 5,000,000 | 2,419,650 | |||||
| 47,307,074 | |||||||
| Escrowed to Maturity Bonds – 9.23% | |||||||
| Dakota - Washington Counties Housing & | |||||||
| Redevelopment Authority Single Family | |||||||
| Residential Mortgage Revenue | |||||||
| 8.15% 9/1/16 (GNMA) (NATL-RE) (AMT) | 405,000 | 542,907 | |||||
| (Anoka County) 8.45% 9/1/19 (GNMA) (AMT) | 9,000,000 | 12,792,690 | |||||
| (Bloomington Mortgage) Refunding Series B | |||||||
| 8.375% 9/1/21 (GNMA) (FHA) (VA) (AMT) | 14,115,000 | 20,423,275 | |||||
| Southern Minnesota Municipal Power Agency Supply | |||||||
| System Revenue Refunding Series B | |||||||
| 5.50% 1/1/15 (AMBAC) | 990,000 | 1,049,549 | |||||
| University of Minnesota Series A | |||||||
| 5.50% 7/1/21 | 12,500,000 | 14,702,750 | |||||
| 5.75% 7/1/18 | 3,840,000 | 4,732,723 | |||||
| Western Minnesota Municipal Power Agency Supply | |||||||
| Revenue Series A | |||||||
| 6.60% 1/1/10 | 440,000 | 449,174 | |||||
| 9.75% 1/1/16 (NATL-RE) | 715,000 | 993,600 | |||||
| 55,686,668 | |||||||
23
Statements of net assets
Delaware Tax-Free Minnesota Fund
| Principal amount | Value | ||||||
| Municipal Bonds (continued) | |||||||
| Health Care Revenue Bonds – 13.69% | |||||||
| Aitkin Health Care Facilities Revenue Refunding | |||||||
| (Riverwood Health Care Center) 5.60% 2/1/32 | $ | 2,100,000 | $ | 1,579,284 | |||
| Apple Valley Economic Development Authority Health | |||||||
| Care Revenue (Augustana Home St. Paul Project) | |||||||
| Series A 6.00% 1/1/40 | 2,700,000 | 2,030,211 | |||||
| Bemidji Health Care Facilities First Mortgage Revenue | |||||||
| (North Country Health Services) | |||||||
| 5.00% 9/1/24 (RADIAN) | 740,000 | 691,774 | |||||
| 5.00% 9/1/31 (RADIAN) | 500,000 | 442,145 | |||||
| Breckenridge Catholic Health Initiatives | |||||||
| Series A 5.00% 5/1/30 | 2,500,000 | 2,518,450 | |||||
| Maple Grove Health Care System Revenue | |||||||
| (Maple Grove Hospital) 5.25% 5/1/37 | 2,950,000 | 2,649,189 | |||||
| Minneapolis Health Care Facility Revenue | |||||||
| (Jones-Harrison Residence Project) 5.60% 10/1/30 | 1,050,000 | 787,878 | |||||
| Minneapolis Health Care System Revenue | |||||||
| (Fairview Health Services) | |||||||
| Series A 6.625% 11/15/28 | 3,000,000 | 3,311,610 | |||||
| Series B 6.50% 11/15/38 (ASSURED GTY) | 1,140,000 | 1,287,265 | |||||
| Series D | |||||||
| 5.00% 11/15/30 (AMBAC) | 2,500,000 | 2,414,225 | |||||
| 5.00% 11/15/34 (AMBAC) | 10,750,000 | 10,090,379 | |||||
| Minneapolis - St. Paul Housing & Redevelopment | |||||||
| Authority Health Care System Revenue | |||||||
| (Health Partners Obligation Group Project) | |||||||
| 5.875% 12/1/29 | 1,000,000 | 950,540 | |||||
| Minnesota Agricultural & Economic | |||||||
| Development Board Revenue | |||||||
| (Benedictine Health Systems) 5.75% 2/1/29 | 1,895,000 | 1,466,541 | |||||
| (Fairview Health Care System) | |||||||
| Un-Refunded Balance Series A | |||||||
| 5.75% 11/15/26 (NATL-RE) | 180,000 | 179,984 | |||||
| 6.375% 11/15/29 | 15,000 | 15,224 | |||||
| Northfield Hospital Revenue 5.375% 11/1/26 | 3,785,000 | 3,468,801 | |||||
| Shakopee Health Care Facilities Revenue | |||||||
| (St. Francis Regional Medical Center) | |||||||
| 5.10% 9/1/25 | 2,000,000 | 1,845,520 | |||||
| 5.25% 9/1/34 | 7,000,000 | 6,217,190 | |||||
24
| Principal amount | Value | ||||||
| Municipal Bonds (continued) | |||||||
| Health Care Revenue Bonds (continued) | |||||||
| Sherburne County Health Care Facilities Revenue | |||||||
| (Guardian Angels Health Services) 5.55% 10/1/36 | $ | 1,500,000 | $ | 1,073,220 | |||
| St. Cloud Health Care Revenue (Centracare Health | |||||||
| System Project) Series D Remarketing | |||||||
| 5.50% 5/1/39 (ASSURED GTY) | 6,000,000 | 6,132,660 | |||||
| St. Louis Park Health Care Facilities Revenue Refunding | |||||||
| (Park Nicollet Health Services) Series C | |||||||
| 5.50% 7/1/23 | 3,000,000 | 3,075,690 | |||||
| 5.75% 7/1/30 | 5,000,000 | 5,075,600 | |||||
| St. Paul Housing & Redevelopment Authority Health Care | |||||||
| Facilities Revenue | |||||||
| (Allina Health System) Series A 5.00% 11/15/18 (NATL-RE) | 5,720,000 | 5,953,891 | |||||
| (Health Partners Obligation Group Project) | |||||||
| 5.25% 5/15/36 | 7,900,000 | 6,788,469 | |||||
| St. Paul Housing & Redevelopment Authority | |||||||
| Hospital Revenue (Health East Project) | |||||||
| 6.00% 11/15/30 | 4,000,000 | 3,339,640 | |||||
| 6.00% 11/15/35 | 4,340,000 | 3,544,652 | |||||
| Series A 5.70% 11/1/15 | 1,150,000 | 1,100,654 | |||||
| St. Paul Housing & Redevelopment Authority | |||||||
| Multifamily Housing Revenue Refunding | |||||||
| (Marion Center Project) Series A | |||||||
| 5.30% 11/1/30 | 500,000 | 354,725 | |||||
| 5.375% 5/1/43 | 500,000 | 341,550 | |||||
| Stillwater Health Care Revenue (Health System | |||||||
| Obligation Group) 5.00% 6/1/35 | 1,000,000 | 887,530 | |||||
| Washington County Housing & Redevelopment Authority | |||||||
| Revenue (Health East Project) 5.50% 11/15/27 | 1,000,000 | 831,120 | |||||
| Willmar (Rice Memorial Hospital Project) | |||||||
| 5.00% 2/1/22 (FSA) | 1,000,000 | 1,065,770 | |||||
| 5.00% 2/1/25 (FSA) | 1,000,000 | 1,027,710 | |||||
| 82,539,091 | |||||||
| Housing Revenue Bonds – 7.45% | |||||||
| Brooklyn Center Multifamily Housing Revenue Refunding | |||||||
| (Shingle Creek) 5.40% 5/20/43 (GNMA) (AMT) | 1,000,000 | 987,670 | |||||
| Dakota County Housing & Redevelopment Authority Single | |||||||
| Family Mortgage Revenue | |||||||
| 5.85% 10/1/30 (GNMA) (FNMA) (AMT) | 119,000 | 119,046 | |||||
25
Statements of net assets
Delaware Tax-Free Minnesota Fund
| Principal amount | Value | ||||||
| Municipal Bonds (continued) | |||||||
| Housing Revenue Bonds (continued) | |||||||
| @ | Hutchinson Multifamily Housing Revenue | ||||||
| (Evergreen Apartments Project) | |||||||
| 5.75% 11/1/28 (HUD Section 8) | $ | 765,000 | $ | 569,619 | |||
| Minneapolis Multifamily Housing Revenue | |||||||
| (Bottineau Commons Project) | |||||||
| 5.45% 4/20/43 (GNMA) (AMT) | 1,500,000 | 1,493,010 | |||||
| (Grant Street Apartments Project) Series A 7.25% 11/1/29 | 750,000 | 698,970 | |||||
| (Seward Towers Project) 5.00% 5/20/36 (GNMA) | 8,000,000 | 7,941,040 | |||||
| (Sumner Field) Series A 5.50% 11/20/26 (GNMA) (AMT) | 905,000 | 915,815 | |||||
| (Trinity Apartments) Refunding Series A | |||||||
| 6.75% 5/1/21 (HUD Section 8) | 1,575,000 | 1,452,985 | |||||
| Minnesota Housing Finance Agency Rental Housing | |||||||
| Revenue Series C-2 5.95% 2/1/15 (AMBAC) | 1,495,000 | 1,497,885 | |||||
| Minnesota Housing Finance Agency Residential Housing | |||||||
| Series A 5.30% 7/1/19 | 470,000 | 479,170 | |||||
| Series B-1 5.35% 1/1/33 (AMT) | 2,750,000 | 2,720,878 | |||||
| ŸSeries D 4.80% 7/1/38 (AMT) | 2,500,000 | 2,228,400 | |||||
| Series I 4.85% 7/1/38 (AMT) | 2,000,000 | 1,799,640 | |||||
| Series I 5.15% 7/1/38 (AMT) | 5,530,000 | 5,266,606 | |||||
| Series L 5.10% 7/1/38 (AMT) | 9,910,000 | 9,312,129 | |||||
| Series M 4.875% 7/1/37 (AMT) | 4,500,000 | 4,089,375 | |||||
| Single Family Mortgage Series J 5.90% 7/1/28 (AMT) | 345,000 | 345,597 | |||||
| @ | St. Cloud Housing & Redevelopment Authority | ||||||
| Multifamily Housing Revenue (Sterling Heights | |||||||
| Apartments Project) 7.55% 4/1/39 (AMT) | 1,000,000 | 818,580 | |||||
| @ | Washington County Housing & Redevelopment | ||||||
| Authority Governmental Revenue Refunding | |||||||
| (Briar Pond Project) Series C 7.25% 8/20/34 | 925,000 | 724,580 | |||||
| White Bear Lake Multifamily Revenue Refunding | |||||||
| (Lake Square) Series A 5.875% 2/1/15 (FHA) | 740,000 | 741,369 | |||||
| Willmar Housing & Redevelopment Authority Multifamily | |||||||
| Housing Revenue (Highland Apartments) | |||||||
| 5.85% 6/1/19 (HUD Section 8) | 785,000 | 732,107 | |||||
| 44,934,471 | |||||||
| Lease Revenue Bonds – 3.49% | |||||||
| Minneapolis Special School District #001 Series A | |||||||
| 5.00% 2/1/18 (FSA) | 1,545,000 | 1,639,940 | |||||
| 5.00% 2/1/19 (FSA) | 1,535,000 | 1,629,326 | |||||
| 5.00% 2/1/20 (FSA) | 1,690,000 | 1,793,851 | |||||
26
| Principal amount | Value | ||||||
| Municipal Bonds (continued) | |||||||
| Lease Revenue Bonds (continued) | |||||||
| Puerto Rico Public Buildings Authority Revenue | |||||||
| (Guaranteed Government Facilities) | |||||||
| Un-Refunded Balance Series D 5.25% 7/1/36 | $ | 1,070,000 | $ | 939,064 | |||
| St. Paul Port Authority Lease Revenue | |||||||
| (Cedar Street Office Building Project) | |||||||
| 5.00% 12/1/22 | 2,500,000 | 2,594,250 | |||||
| 5.25% 12/1/27 | 3,840,000 | 3,966,950 | |||||
| �� Series 3-12 5.125% 12/1/27 | 3,000,000 | 3,112,710 | |||||
| (Robert Street Office Building Project) | |||||||
| Series 3-11 4.75% 12/1/23 | 2,000,000 | 2,059,720 | |||||
| Series 3-11 5.00% 12/1/27 | 2,500,000 | 2,581,850 | |||||
| Series 9 5.25% 12/1/27 | 725,000 | 748,969 | |||||
| 21,066,630 | |||||||
| Local General Obligation Bonds – 22.01% | |||||||
| Anoka County Capital Improvement Series A | |||||||
| 5.00% 2/1/19 | 1,270,000 | 1,475,981 | |||||
| 5.00% 2/1/22 | 500,000 | 561,630 | |||||
| Big Lake Independent School District #727 Series A | |||||||
| 5.00% 2/1/17 (FSA) | 1,040,000 | 1,058,002 | |||||
| 5.00% 2/1/20 (FSA) | 1,000,000 | 1,017,310 | |||||
| Bloomington Independent School District #271 | |||||||
| Series B 5.00% 2/1/17 | 5,300,000 | 5,391,743 | |||||
| Centennial Independent School District #012 | |||||||
| Series A 5.00% 2/1/18 (FSA) | 1,270,000 | 1,372,578 | |||||
| Dakota County Capital Improvement Series A | |||||||
| 4.75% 2/1/26 | 1,000,000 | 1,013,780 | |||||
| Dakota County Community Development Agency | |||||||
| (Senior Housing Facilities) 5.00% 1/1/21 | 1,275,000 | 1,315,405 | |||||
| Farmington Independent School District #192 Series B | |||||||
| 5.00% 2/1/27 (FSA) | 10,705,000 | 11,306,727 | |||||
| ^Capital Appreciation 5.34% 2/1/21 (FSA) | 1,500,000 | 880,125 | |||||
| ^Capital Appreciation 5.424% 2/1/20 (FSA) | 1,650,000 | 1,021,119 | |||||
| Hennepin County Regional Railroad Authority | |||||||
| 5.00% 12/1/31 | 4,030,000 | 4,073,524 | |||||
| Lakeville Independent School District #194 | |||||||
| ^Capital Appreciation Series B 5.45% 2/1/19 (FSA) | 8,000,000 | 4,883,200 | |||||
| Series A 4.75% 2/1/22 (FSA) | 6,850,000 | 7,113,246 | |||||
27
Statements of net assets
Delaware Tax-Free Minnesota Fund
| Principal amount | Value | ||||||
| Municipal Bonds (continued) | |||||||
| Local General Obligation Bonds (continued) | |||||||
| ^ | Mahtomedi Independent School District #832 | ||||||
| Capital Appreciation Series B 5.90% 2/1/14 (NATL-RE) | $ | 1,540,000 | $ | 1,384,783 | |||
| Metropolitan Council Minneapolis-St. Paul | |||||||
| Metropolitan Area Waste Water Treatment | |||||||
| Series B 5.00% 12/1/21 | 1,200,000 | 1,331,844 | |||||
| Series C | |||||||
| 5.00% 3/1/16 | 2,440,000 | 2,837,232 | |||||
| 5.00% 3/1/28 | 5,000,000 | 5,319,000 | |||||
| Minneapolis Library 5.00% 12/1/25 | 1,500,000 | 1,561,500 | |||||
| Morris Independent School District #769 Building | |||||||
| 5.00% 2/1/24 (NATL-RE) | 4,875,000 | 5,400,915 | |||||
| Mounds View Independent School District #621 Series A | |||||||
| 5.00% 2/1/20 (NATL-RE) | 2,970,000 | 3,152,507 | |||||
| 5.375% 2/1/24 (FGIC) | 6,170,000 | 6,524,035 | |||||
| New Brighton Tax Increment Series A | |||||||
| 5.00% 2/1/27 (NATL-RE) | 1,000,000 | 1,065,580 | |||||
| Osseo Independent School District #279 Series A | |||||||
| 5.00% 2/1/21 (FSA) | 3,570,000 | 3,789,377 | |||||
| Prior Lake Independent School District #719 Series B | |||||||
| 5.00% 2/1/19 (FSA) | 3,145,000 | 3,404,714 | |||||
| Ramsey County State Aid Series C 5.00% 2/1/28 | 1,060,000 | 1,098,987 | |||||
| Robbinsdale Independent School District #281 | |||||||
| 5.00% 2/1/21 (FSA) | 1,310,000 | 1,397,181 | |||||
| Rockford Independent School District #883 | |||||||
| 5.60% 2/1/21 (FSA) | 3,210,000 | 3,273,558 | |||||
| 5.625% 2/1/23 (FSA) | 7,020,000 | 7,159,768 | |||||
| ^ | Rosemount Independent School District #196 | ||||||
| Capital Appreciation Series B | |||||||
| 5.85% 4/1/10 (FSA) | 2,240,000 | 2,229,203 | |||||
| 5.931% 4/1/11 (FSA) | 2,600,000 | 2,547,194 | |||||
| 5.961% 4/1/12 (FSA) | 1,850,000 | 1,769,026 | |||||
| 6.008% 4/1/13 (FSA) | 1,915,000 | 1,779,092 | |||||
| ^ | Sartell Independent School District #748 | ||||||
| Capital Appreciation Refunding Series B | |||||||
| 5.976% 2/1/13 (NATL-RE) | 540,000 | 498,420 | |||||
| 6.100% 2/1/15 (NATL-RE) | 1,075,000 | 901,796 | |||||
| 6.15% 2/1/16 (NATL-RE) | 1,750,000 | 1,397,095 | |||||
28
| Principal amount | Value | ||||||
| Municipal Bonds (continued) | |||||||
| Local General Obligation Bonds (continued) | |||||||
| ^ | Sauk Rapids Independent School District #047 Series B | ||||||
| 5.983% 2/1/15 (FSA) | $ | 2,700,000 | $ | 2,085,372 | |||
| 6.083% 2/1/17 (FSA) | 2,245,000 | 1,534,592 | |||||
| South Washington County Independent School | |||||||
| District #833 Series A | |||||||
| 4.75% 2/1/25 | 2,500,000 | 2,658,350 | |||||
| 4.75% 2/1/26 | 3,600,000 | 3,807,036 | |||||
| 4.75% 2/1/27 | 2,300,000 | 2,417,139 | |||||
| 5.60% 2/1/20 (NATL-RE) | 6,880,000 | 7,016,224 | |||||
| St. Michael Independent School District #885 | |||||||
| 5.00% 2/1/20 (FSA) | 1,970,000 | 2,129,117 | |||||
| 5.00% 2/1/27 (FSA) | 3,435,000 | 3,712,445 | |||||
| St. Peter’s Hospital Series A 5.00% 9/1/24 (NATL-RE) | 1,905,000 | 1,943,214 | |||||
| Todd Morrison Cass & Wadena Counties United | |||||||
| Hospital District (Health Care Facilities-Lakewood) | |||||||
| 5.00% 12/1/21 | 2,000,000 | 2,069,880 | |||||
| 5.125% 12/1/24 | 1,000,000 | 1,030,280 | |||||
| 132,710,826 | |||||||
| §Pre-Refunded Bonds – 17.98% | |||||||
| Chaska Electric Revenue Series A 6.00% 10/1/25-10 | 1,000,000 | 1,057,940 | |||||
| Duluth Economic Development Authority | |||||||
| Health Care Facilities Revenue | |||||||
| (Benedictine Health System - St. Mary’s Hospital) | |||||||
| 5.25% 2/15/33-14 | 10,000,000 | 11,403,000 | |||||
| 5.50% 2/15/23-14 | 1,000,000 | 1,150,920 | |||||
| Hopkins Housing & Redevelopment Authority | |||||||
| (Public Works & Fire Station) Series A | |||||||
| 5.00% 2/1/23-13 (NATL-RE) | 1,210,000 | 1,356,579 | |||||
| Marshall Medical Center Gross Revenue (Weiner Memorial | |||||||
| Medical Center Project) 6.00% 11/1/28-09 | 1,000,000 | 1,008,760 | |||||
| Minneapolis Health Care System Revenue | |||||||
| (Allina Health Systems) Series A 5.75% 11/15/32-12 | 17,300,000 | 19,744,143 | |||||
| (Fairview Health Services) Series A 5.625% 5/15/32-12 | 16,925,000 | 19,098,170 | |||||
| Minneapolis - St. Paul Metropolitan Airports | |||||||
| Commission Revenue | |||||||
| Series A 5.25% 1/1/32-11 (FGIC) | 5,000,000 | 5,298,950 | |||||
| Series C 5.25% 1/1/32-11 (FGIC) | 8,845,000 | 9,373,843 | |||||
29
Statements of net assets
Delaware Tax-Free Minnesota Fund
| Principal amount | Value | |||||
| Municipal Bonds (continued) | ||||||
| §Pre-Refunded Bonds (continued) | ||||||
| Minnesota Agricultural & Economic Development Revenue | ||||||
| (Fairview Health Care System) | ||||||
| Series A 6.375% 11/15/29-10 | $ | 485,000 | $ | 521,812 | ||
| Minnesota State 5.00% 11/1/20-10 (FSA) | 13,675,000 | 14,334,135 | ||||
| Rochester Electric Utilities Revenue 5.25% 12/1/30-10 | 4,915,000 | 5,192,009 | ||||
| Southern Minnesota Municipal Power Agency Supply | ||||||
| Revenue Series A | ||||||
| 5.75% 1/1/18-13 | 3,790,000 | 4,081,262 | ||||
| 5.75% 1/1/18-13 (AMBAC) | 670,000 | 721,490 | ||||
| 5.75% 1/1/18-13 (NATL-RE) | 1,000,000 | 1,076,850 | ||||
| St. Louis Park Health Care Facilities Revenue | ||||||
| (Park Nicollet Health Services) Series B | ||||||
| 5.25% 7/1/30-14 | 9,420,000 | 10,727,967 | ||||
| 5.50% 7/1/25-14 | 2,000,000 | 2,300,500 | ||||
| 108,448,330 | ||||||
| Special Tax Revenue Bonds – 3.69% | ||||||
| Hennepin County Sales Revenue | ||||||
| (Second Lien - Ballpark Project) Series B | ||||||
| 5.00% 12/15/19 | 2,100,000 | 2,375,499 | ||||
| 5.00% 12/15/20 | 1,000,000 | 1,120,350 | ||||
| 5.00% 12/15/24 | 1,150,000 | 1,251,626 | ||||
| Minneapolis Tax Increment Revenue Refunding | ||||||
| (St. Anthony Falls Project) 5.75% 2/1/27 | 1,000,000 | 687,100 | ||||
| Puerto Rico Commonwealth Highway & Transportation | ||||||
| Authority Revenue Series K 5.00% 7/1/30 | 5,605,000 | 5,010,309 | ||||
| Puerto Rico Commonwealth Infrastructure Financing | ||||||
| Authority Special Tax Revenue Series B 5.00% 7/1/46 | 4,000,000 | 3,323,520 | ||||
| Puerto Rico Sales Tax Financing Corporation | ||||||
| Sales Tax Revenue First Subordinate Series A | ||||||
| ·5.00% 8/1/39 | 925,000 | 946,849 | ||||
| 5.75% 8/1/37 | 5,620,000 | 5,777,921 | ||||
| Virgin Islands Public Finance Authority Revenue | ||||||
| (Senior Lien-Matching Fund Loan) Series A | ||||||
| 5.25% 10/1/22 | 1,785,000 | 1,760,028 | ||||
| 22,253,202 | ||||||
30
| Principal amount | Value | |||||
| Municipal Bonds (continued) | ||||||
| State General Obligation Bonds – 2.85% | ||||||
| Minnesota State | ||||||
| 5.00% 10/1/15 | $ | 5,000,000 | $ | 5,822,350 | ||
| 5.00% 8/1/21 | 2,400,000 | 2,598,840 | ||||
| Series A 5.00% 12/1/21 | 5,000,000 | 5,755,450 | ||||
| Puerto Rico Commonwealth Public Improvement | ||||||
| Un-Refunded Balance | ||||||
| Series A 5.00% 7/1/34 | 1,670,000 | 1,473,257 | ||||
| Series B 5.00% 7/1/35 | 575,000 | 505,391 | ||||
| Puerto Rico Government Development Bank | ||||||
| Senior Notes Series B 5.00% 12/1/14 | 1,000,000 | 1,014,580 | ||||
| 17,169,868 | ||||||
| Transportation Revenue Bonds – 1.13% | ||||||
| Minneapolis - St. Paul Metropolitan Airports | ||||||
| Commission Revenue Series A | ||||||
| 5.00% 1/1/15 (AMT) | 3,095,000 | 3,189,645 | ||||
| 5.00% 1/1/22 (NATL-RE) | 2,000,000 | 2,045,420 | ||||
| 5.25% 1/1/16 (NATL-RE) | 1,460,000 | 1,550,520 | ||||
| 6,785,585 | ||||||
| Water & Sewer Revenue Bonds – 0.48% | ||||||
| Minnesota Public Facilities Authority Drinking Water | ||||||
| Revenue Series B 5.25% 3/1/13 | 1,500,000 | 1,694,940 | ||||
| Minnesota Public Facilities Authority Water Pollution | ||||||
| Control Revenue Refunding Series B 5.00% 3/1/19 | 1,000,000 | 1,170,032 | ||||
| 2,864,972 | ||||||
| Total Municipal Bonds (cost $582,181,593) | 599,085,465 | |||||
| Number of shares | ||||||
| Short-Term Investments – 0.11% | ||||||
| Money Market Instrument – 0.09% | ||||||
| Federated Minnesota Municipal Cash Trust | 553,820 | 553,820 | ||||
| 553,820 | ||||||
| Principal amount | ||||||
| Variable Rate Demand Note – 0.02% | ||||||
| University of Minnesota Series C 0.20% 12/1/36 | $ | 100,000 | 100,000 | |||
| 100,000 | ||||||
| Total Short-Term Investments (cost $653,820) | 653,820 | |||||
31
Statements of net assets
Delaware Tax-Free Minnesota Fund
| Total Value of Securities – 99.45% | ||||
| (cost $582,835,413) | $ | 599,739,285 | ||
| Receivables and Other Assets | ||||
| Net of Liabilities – 0.55% | 3,333,220 | |||
| Net Assets Applicable to 49,484,763 | ||||
| Shares Outstanding – 100.00% | $ | 603,072,505 | ||
| Net Asset Value – Delaware Tax-Free Minnesota Fund | ||||
| Class A ($559,392,714 / 45,909,709 Shares) | $12.18 | |||
| Net Asset Value – Delaware Tax-Free Minnesota Fund | ||||
| Class B ($9,506,019 / 779,525 Shares) | $12.19 | |||
| Net Asset Value – Delaware Tax-Free Minnesota Fund | ||||
| Class C ($34,173,772 / 2,795,529 Shares) | $12.22 | |||
| Components of Net Assets at August 31, 2009: | ||||
| Shares of beneficial interest (unlimited authorization – no par) | $ | 586,243,181 | ||
| Distributions in excess of net investment income | (144,872 | ) | ||
| Accumulated net realized gain on investments | 70,324 | |||
| Net unrealized appreciation of investments | 16,903,872 | |||
| Total net assets | $ | 603,072,505 | ||
| ^ | Zero coupon security. The rate shown is the yield at the time of purchase. |
| · | Variable rate security. The rate shown is the rate as of August 31, 2009. |
| § | Pre-Refunded bonds. Municipal bonds that are generally backed or secured by U.S. Treasury bonds. For Pre-Refunded Bonds, the stated maturity is followed by the year in which the bond is pre-refunded. See Note 9 in “Notes to financial statements.” |
| @ | Illiquid security. At August 31, 2009, the aggregate amount of illiquid securities was $2,112,779, which represented 0.35% of the Fund’s net assets. See Note 9 in “Notes to financial statements.” |
32
Summary of abbreviations: |
| Net Asset Value and Offering Price Per Share – | ||
| Delaware Tax-Free Minnesota Fund | ||
| Net asset value Class A (A) | $ | 12.18 |
| Sales charge (4.50% of offering price) (B) | 0.57 | |
| Offering price | $ | 12.75 |
| (A) | Net asset value per share, as illustrated, is the amount which would be paid upon redemption or repurchase of shares. |
| (B) | See the current prospectus for purchases of $100,000 or more. |
See accompanying notes
33
| Statements of net assets | |
| Delaware Tax-Free Minnesota Intermediate Fund | August 31, 2009 |
| Principal amount | Value | |||||
| Municipal Bonds – 97.93% | ||||||
| Corporate-Backed Revenue Bonds – 1.84% | ||||||
| Laurentian Energy Authority I Cogeneration Revenue | ||||||
| Series A 5.00% 12/1/21 | $ | 750,000 | $ | 689,798 | ||
| Minneapolis Community Development Agency | ||||||
| (Limited Tax Common Bond Fund) | ||||||
| Series 4 6.20% 6/1/17 (AMT) | 960,000 | 962,275 | ||||
| 1,652,073 | ||||||
| Education Revenue Bonds – 10.32% | ||||||
| Minnesota Colleges & Universities Revenue Fund | ||||||
| Series A 5.00% 10/1/28 | 1,000,000 | 1,070,780 | ||||
| Minnesota Higher Education Facilities Authority Revenue | ||||||
| (Carleton College) Series 6-T 4.75% 1/1/23 | 1,000,000 | 1,056,290 | ||||
| (Macalester College) Series 6-P 4.25% 3/1/27 | 750,000 | 744,510 | ||||
| (St. Johns University) Series 6-U | ||||||
| 4.40% 10/1/21 | 325,000 | 330,642 | ||||
| 4.50% 10/1/23 | 265,000 | 268,882 | ||||
| (University of St. Thomas) | ||||||
| Series 5-Y 5.25% 10/1/19 | 1,590,000 | 1,685,432 | ||||
| Series 6-X 5.00% 4/1/24 | 1,000,000 | 1,048,810 | ||||
| St. Cloud Housing & Redevelopment Authority Revenue | ||||||
| (State University Foundation Project) 5.00% 5/1/23 | 1,000,000 | 1,030,110 | ||||
| University of Minnesota Series A 4.00% 4/1/15 | 310,000 | 338,309 | ||||
| University of Minnesota Special Purpose Revenue | ||||||
| (State Supported Stadium Debt) 5.00% 8/1/18 | 1,500,000 | 1,675,170 | ||||
| 9,248,935 | ||||||
| Electric Revenue Bonds – 5.63% | ||||||
| Chaska Electric Revenue Refunding (Generating Facilities) | ||||||
| Series A 5.25% 10/1/25 | 1,000,000 | 1,030,900 | ||||
| Northern Municipal Power Agency | ||||||
| 5.00% 1/1/13 (ASSURED GTY) | 1,200,000 | 1,309,008 | ||||
| Series A | ||||||
| 5.00% 1/1/14 (ASSURED GTY) | 510,000 | 560,934 | ||||
| 5.00% 1/1/15 (ASSURED GTY) | 1,000,000 | 1,107,730 | ||||
| Southern Municipal Power Agency Power Supply System | ||||||
| Series A 5.25% 1/1/30 | 1,000,000 | 1,034,990 | ||||
| 5,043,562 | ||||||
34
| Principal amount | Value | |||||
| Municipal Bonds (continued) | ||||||
| Escrowed to Maturity Bond – 1.36% | ||||||
| University of Minnesota Series A 5.75% 7/1/16 | $ | 1,000,000 | $ | 1,217,320 | ||
| 1,217,320 | ||||||
| Health Care Revenue Bonds – 11.29% | ||||||
| Bemidji Health Care Facilities First Mortgage Revenue | ||||||
| (North Country Health Services) | ||||||
| 5.00% 9/1/31 (RADIAN) | 650,000 | 574,789 | ||||
| Glencoe Health Care Facilities Revenue (Glencoe Regional | ||||||
| Health Services Project) 5.00% 4/1/31 | 1,000,000 | 853,980 | ||||
| Minneapolis Health Care System Revenue | ||||||
| (Fairview Health Services) Series A 6.625% 11/15/28 | 1,500,000 | 1,655,805 | ||||
| Minneapolis-St. Paul Housing & Redevelopment Authority | ||||||
| (Health Partners Obligation Group Project) | ||||||
| 6.00% 12/1/17 | 850,000 | 872,296 | ||||
| Moorhead Economic Development Authority Multifamily | ||||||
| Housing Revenue Refunding | ||||||
| (Eventide Lutheran Home Project) 4.70% 6/1/18 | 475,000 | 394,459 | ||||
| St. Cloud Minnesota Health Care Revenue (Centracare | ||||||
| Health System Project) 5.375% 5/1/31 (ASSURED GTY) | 1,000,000 | 1,026,850 | ||||
| St. Louis Park Health Care Facilities Revenue Refunding | ||||||
| (Park Nicollet Health Services) Series C 5.625% 7/1/26 | 1,500,000 | 1,529,670 | ||||
| St. Paul Housing & Redevelopment Authority Health Care | ||||||
| Revenue (Allina Health System) | ||||||
| Series A 5.00% 11/15/14 (NATL-RE) | 2,000,000 | 2,118,379 | ||||
| St. Paul Housing & Redevelopment Authority Hospital | ||||||
| Revenue (Health East Project) Series B 5.85% 11/1/17 | 1,160,000 | 1,089,948 | ||||
| 10,116,176 | ||||||
| Housing Revenue Bonds – 4.30% | ||||||
| Minneapolis Multifamily Housing Revenue Refunding | ||||||
| (Trinity Apartments) | ||||||
| Series A 6.75% 5/1/21 (HUD Section 8) | 1,635,000 | 1,508,336 | ||||
| Minnesota Housing Finance Agency Residential Housing | ||||||
| ·Series D 4.749% 7/1/32 (AMT) | 750,000 | 705,143 | ||||
| Series I 5.10% 7/1/20 (AMT) | 705,000 | 709,935 | ||||
| Series M 4.85% 7/1/31 (AMT) | 1,000,000 | 933,060 | ||||
| 3,856,474 | ||||||
35
Statements of net assets
Delaware Tax-Free Minnesota Intermediate Fund
| Principal amount | Value | |||||
| Municipal Bonds (continued) | ||||||
| Lease Revenue Bonds – 2.05% | ||||||
| Edina Housing & Redevelopment Authority Public Project | ||||||
| Revenue (Appropriate Lease Obligation) | ||||||
| 5.125% 2/1/19 | $ | 1,000,000 | $ | 1,041,820 | ||
| Virginia Housing & Redevelopment Authority Health Care | ||||||
| Facility Lease Revenue 5.25% 10/1/25 | 880,000 | 797,280 | ||||
| 1,839,100 | ||||||
| Local General Obligation Bonds – 28.37% | ||||||
| Anoka County Capital Improvements | ||||||
| Series A 4.00% 2/1/17 | 1,175,000 | 1,281,808 | ||||
| Series C 5.00% 2/1/27 | 500,000 | 536,525 | ||||
| Anoka-Hennepin Independent School District #11 | ||||||
| Refunding 5.00% 2/1/17 | 1,000,000 | 1,157,850 | ||||
| Big Lake Independent School District #727 | ||||||
| Series C Refunding | ||||||
| 5.00% 2/1/16 (FSA) | 1,180,000 | 1,232,463 | ||||
| 5.00% 2/1/17 (FSA) | 1,000,000 | 1,044,460 | ||||
| Centennial Independent School District #012 Series A | ||||||
| 5.00% 2/1/18 (FSA) | 1,000,000 | 1,080,770 | ||||
| 5.00% 2/1/20 (FSA) | 750,000 | 810,578 | ||||
| Dakota County Capital Improvement Series A | ||||||
| 4.75% 2/1/17 | 1,000,000 | 1,043,420 | ||||
| Duluth Independent School District #709 Revenue | ||||||
| Certificates of Participation | ||||||
| Series A 4.25% 2/1/20 (FSA) | 1,710,000 | 1,836,693 | ||||
| Hennepin County Series B 4.75% 12/1/14 | 1,000,000 | 1,034,900 | ||||
| Hopkins Independent School District #270 | ||||||
| 5.125% 2/1/17 (FGIC) | 2,000,000 | 2,167,439 | ||||
| Mankato Independent School District #77 (Formerly Blue | ||||||
| Earth County Independent School District #10) | ||||||
| 4.125% 2/1/22 | 1,000,000 | 1,045,250 | ||||
| Metropolitan Council Minneapolis-St. Paul Metropolitan | ||||||
| Area Waste Water Treatment Series C | ||||||
| 5.00% 3/1/16 | 560,000 | 651,168 | ||||
| 5.00% 3/1/28 | 1,000,000 | 1,063,800 | ||||
| Minneapolis Various Purposes | ||||||
| 4.00% 12/1/14 | 1,500,000 | 1,655,940 | ||||
| 4.00% 12/1/23 | 1,500,000 | 1,534,260 | ||||
36
| Principal amount | Value | |||||
| Municipal Bonds (continued) | ||||||
| Local General Obligation Bonds (continued) | ||||||
| Osseo Independent School District #279 | ||||||
| Series A 5.00% 2/1/21 (FSA) | $ | 1,500,000 | $ | 1,592,175 | ||
| South Washington County Independent School District #833 | ||||||
| Series A 4.00% 2/1/22 | 750,000 | 774,075 | ||||
| Series B 5.00% 2/1/16 (FSA) | 1,560,000 | 1,678,934 | ||||
| St. Paul Independent School District #625 | ||||||
| (School Building) Series A 4.00% 2/1/15 | 1,020,000 | 1,115,982 | ||||
| White Bear Lake Independent School District #624 | ||||||
| (Formerly Joint Independent Consolidated Ramsey | ||||||
| County School District #39 & Washington & Anoka | ||||||
| Counties School District #103) Series B 4.75% 2/1/22 | 1,000,000 | 1,089,010 | ||||
| 25,427,500 | ||||||
| §Pre-Refunded Bonds – 9.36% | ||||||
| Duluth Economic Development Authority Health Care | ||||||
| Facilities Revenue (Benedictine Health System - - | ||||||
| St. Mary’s Hospital) 5.25% 2/15/33-14 | 1,000,000 | 1,140,300 | ||||
| Minneapolis Health Care System Revenue | ||||||
| (Allina Health Systems) Series A 5.75% 11/15/32-12 | 1,500,000 | 1,711,920 | ||||
| (Fairview Health Services) Series A 5.625% 5/15/32-12 | 1,750,000 | 1,974,699 | ||||
| Minneapolis -St. Paul Metropolitan Airports Commission | ||||||
| Revenue Series C 5.125% 1/1/20-11 (FGIC) | 750,000 | 793,598 | ||||
| Minnesota Higher Education Facilities Authority Revenue | ||||||
| (College of Art & Design) Series 5-D 6.625% 5/1/20-10 | 1,000,000 | 1,040,050 | ||||
| St. Louis Park Health Care Facilities Revenue | ||||||
| (Park Nicollet Health Services) | ||||||
| Series B 5.50% 7/1/25-14 | 1,500,000 | 1,725,375 | ||||
| 8,385,942 | ||||||
| Special Tax Revenue Bonds – 9.49% | ||||||
| Hennepin County Sales Tax Revenue (Second Lien- | ||||||
| Ballpark Project) Series B 5.00% 12/15/17 | 1,740,000 | 2,013,824 | ||||
| Minneapolis Art Center Facilities Revenue (Walker Art | ||||||
| Center Project) 5.125% 7/1/21 | 2,250,000 | 2,310,029 | ||||
| @ | Minneapolis Tax Increment Revenue (Ivy Tower Project) | |||||
| 5.50% 2/1/22 | 415,000 | 303,062 | ||||
| Minnesota 911 Revenue (Public Safety Radio | ||||||
| Communication System Project) | ||||||
| 4.00% 6/1/14 (ASSURED GTY) | 1,370,000 | 1,485,765 | ||||
| 4.25% 6/1/18 (ASSURED GTY) | 1,170,000 | 1,263,986 | ||||
37
Statements of net assets
Delaware Tax-Free Minnesota Intermediate Fund
| Principal amount | Value | |||||
| Municipal Bonds (continued) | ||||||
| Special Tax Revenue Bonds (continued) | ||||||
| Puerto Rico Sales Tax Financing Sales Tax Revenue | ||||||
| First Sub Series A | ||||||
| ·5.00% 8/1/39 | $ | 500,000 | $ | 511,810 | ||
| 6.125% 8/1/29 | 250,000 | 260,508 | ||||
| WCapital Appreciation 5.55% 8/1/32 | 510,000 | 357,000 | ||||
| 8,505,984 | ||||||
| State General Obligation Bonds – 7.70% | ||||||
| Minnesota State | ||||||
| 5.00% 6/1/10 | 1,330,000 | 1,376,178 | ||||
| Refunding 5.00% 8/1/15 | 2,000,000 | 2,323,260 | ||||
| Various Purposes Series A 5.00% 12/1/21 | 1,000,000 | 1,151,090 | ||||
| Puerto Rico Commonwealth Public Improvement | ||||||
| Refunding Series A 5.25% 7/1/15 | 1,000,000 | 1,021,570 | ||||
| · | Puerto Rico Public Finance (Commonwealth | |||||
| Appropriation) (LOC - Puerto Rico Government Bank) | ||||||
| Series A 5.75% 8/1/27 | 1,000,000 | 1,027,360 | ||||
| 6,899,458 | ||||||
| Transportation Revenue Bonds – 1.46% | ||||||
| Minneapolis-St. Paul Metropolitan Airports | ||||||
| Commission Refunding | ||||||
| Series A 5.00% 1/1/13 (AMT) | 500,000 | 520,185 | ||||
| Series 14 5.50% 1/1/11 (AMT) | 750,000 | 784,958 | ||||
| 1,305,143 | ||||||
| Water & Sewer Revenue Bonds – 4.76% | ||||||
| Minnesota Public Facilities Authority Drinking Water | ||||||
| Revenue Series B 5.25% 3/1/13 | 1,000,000 | 1,129,960 | ||||
| Minnesota Public Facilities Authority Water Pollution | ||||||
| Control Revenue Refunding | ||||||
| Series C 5.00% 3/1/18 | 1,000,000 | 1,113,690 | ||||
| Series D 5.00% 3/1/14 | 500,000 | 568,630 | ||||
| St. Paul Sewer Revenue Series D 5.00% 12/1/20 | 1,275,000 | 1,448,566 | ||||
| 4,260,846 | ||||||
| Total Municipal Bonds (cost $84,778,704) | 87,758,513 | |||||
38
| Number of shares | Value | ||||
| Short-Term Investment – 0.32% | |||||
| Money Market Instrument – 0.32% | |||||
| Federated Minnesota Municipal Cash Trust | 289,779 | $ | 289,779 | ||
| Total Short-Term Investment (cost $289,779) | 289,779 | ||||
| Total Value of Securities – 98.25% | |||||
| (cost $85,068,483) | 88,048,292 | ||||
| Receivables and Other Assets | |||||
| Net of Liabilities – 1.75% | 1,565,286 | ||||
| Net Assets Applicable to 8,278,661 | |||||
| Shares Outstanding – 100.00% | $ | 89,613,578 | |||
| Net Asset Value – Delaware Tax-Free Minnesota Intermediate Fund | |||||
| Class A ($78,021,123 / 7,209,666 Shares) | $10.82 | ||||
| Net Asset Value – Delaware Tax-Free Minnesota Intermediate Fund | |||||
| Class B ($317,202 / 29,231 Shares) | $10.85 | ||||
| Net Asset Value – Delaware Tax-Free Minnesota Intermediate Fund | |||||
| Class C ($11,275,253 / 1,039,764 Shares) | $10.84 | ||||
| Components of Net Assets at August 31, 2009: | |||||
| Shares of beneficial interest (unlimited authorization – no par) | $ | 87,643,637 | |||
| Undistributed net investment income | 2,522 | ||||
| Accumulated net realized loss on investments | (1,012,390 | ) | |||
| Net unrealized appreciation of investments | 2,979,809 | ||||
| Total net assets | $ | 89,613,578 | |||
39
Statements of net assets
Delaware Tax-Free Minnesota Intermediate Fund
| @ | Illiquid security. At August 31, 2009, the aggregate amount of illiquid securities was $303,062, which represented 0.34% of the Fund’s net assets. See Note 9 in “Notes to financial statements.” |
| § | Pre-Refunded bonds. Municipal bonds that are generally backed or secured by U.S. Treasury bonds. For Pre-Refunded Bonds, the stated maturity is followed by the year in which the bond is pre-refunded. See Note 9 in “Notes to financial statements.” |
| · | Variable rate security. The rate shown is the rate as of August 31, 2009. |
| W | Step coupon bond. Indicates security that has a zero coupon that remains in effect until a predetermined date at which time the stated interest rate becomes effective. |
Summary of abbreviations:
AMT — Subject to Alternative Minimum Tax
ASSURED GTY — Insured by the Assured Guaranty Corporation
FGIC — Insured by the Financial Guaranty Insurance Company
FSA — Insured by Financial Security Assurance
HUD — Housing and Urban Development
LOC — Letter of Credit
NATL-RE — Insured by the National Public Finance Guarantee Corporation
RADIAN — Insured by Radian Asset Assurance
| Net Asset Value and Offering Price Per Share – | ||
| Delaware Tax-Free Minnesota Intermediate Fund | ||
| Net asset value Class A (A) | $ | 10.82 |
| Sales charge (2.75% of offering price) (B) | 0.31 | |
| Offering price | $ | 11.13 |
| (A) | Net asset value per share, as illustrated, is the amount which would be paid upon redemption or repurchase of shares. |
| (B) | See the current prospectus for purchases of $100,000 or more. |
See accompanying notes
40
| Delaware Minnesota High-Yield Municipal Bond Fund | August 31, 2009 |
| Principal amount | Value | |||||||
| Municipal Bonds – 97.94% | ||||||||
| Corporate-Backed Revenue Bonds – 3.16% | ||||||||
| Cloquet Pollution Control Revenue Refunding | ||||||||
| (Potlatch Project) 5.90% 10/1/26 | $ | 1,700,000 | $ | 1,229,406 | ||||
| Laurentian Energy Authority I Cogeneration Revenue | ||||||||
| Series A 5.00% 12/1/21 | 1,750,000 | 1,609,528 | ||||||
| Sartell Environmental Improvement Revenue Refunding | ||||||||
| (International Paper) Series A 5.20% 6/1/27 | 1,750,000 | 1,512,595 | ||||||
| 4,351,529 | ||||||||
| Education Revenue Bonds – 8.99% | ||||||||
| Baytown Township Lease Revenue | ||||||||
| (St. Croix Preparatory Academy) | ||||||||
| Series A 7.00% 8/1/38 | 500,000 | 430,300 | ||||||
| Minnesota Higher Education Facilities Authority Revenue | ||||||||
| (Augsburg College) | ||||||||
| Series 6-C 5.00% 5/1/23 | 700,000 | 669,865 | ||||||
| Series 6-J1 5.00% 5/1/36 | 1,000,000 | 907,090 | ||||||
| (Bethel University) Refunding | ||||||||
| Series 6-R 5.50% 5/1/37 | 1,500,000 | 1,319,685 | ||||||
| (Macalester College) Series 6-P 4.25% 3/1/32 | 1,000,000 | 928,600 | ||||||
| (St. John’s University) Series 6-U 4.75% 10/1/33 | 825,000 | 781,349 | ||||||
| (St. Olaf) Series 6-O | ||||||||
| 4.50% 10/1/32 | 1,000,000 | 894,380 | ||||||
| 5.00% 10/1/22 | 1,000,000 | 1,050,540 | ||||||
| (University of St. Thomas) Series 6-I 5.00% 4/1/23 | 1,500,000 | 1,568,610 | ||||||
| University of Minnesota Series A 5.125% 4/1/34 | 1,000,000 | 1,055,510 | ||||||
| University of Minnesota Special Purpose Revenue | ||||||||
| (Supported Stadium Debt) 5.00% 8/1/29 | 2,660,000 | 2,768,661 | ||||||
| 12,374,590 | ||||||||
| Electric Revenue Bonds – 6.32% | ||||||||
| Chaska Electric Revenue Refunding | ||||||||
| (Generating Facilities) Series A 5.25% 10/1/25 | 1,000,000 | 1,030,900 | ||||||
| Minnesota Municipal Power Agency Electric Revenue | ||||||||
| Series A 5.00% 10/1/34 | 2,750,000 | 2,770,735 | ||||||
| Northern Municipal Power Agency Electric System Revenue | ||||||||
| 5.00% 1/1/16 (ASSURED GTY) | 1,200,000 | 1,333,788 | ||||||
| 5.00% 1/1/18 (ASSURED GTY) | 1,000,000 | 1,110,620 | ||||||
41
Statements of net assets
Delaware Minnesota High-Yield Municipal Bond Fund
| Principal amount | Value | |||||||
| Municipal Bonds (continued) | ||||||||
| Electric Revenue Bonds (continued) | ||||||||
| Southern Minnesota Municipal Power Agency Supply | ||||||||
| System Revenue Series A 5.25% 1/1/16 (AMBAC) | $ | 1,000,000 | $ | 1,114,210 | ||||
| Western Minnesota Municipal Power Agency Supply | ||||||||
| Revenue Series A 5.00% 1/1/30 (NATL-RE) | 1,335,000 | 1,342,236 | ||||||
| 8,702,489 | ||||||||
| Health Care Revenue Bonds – 26.50% | ||||||||
| Aitkin Health Care Facilities Revenue Refunding | ||||||||
| (Riverwood Health Care Center) 5.50% 2/1/24 | 700,000 | 579,747 | ||||||
| Apple Valley Economic Development Authority Health | ||||||||
| Care Revenue (Augustanna Home St. Paul Project) | ||||||||
| Series A 5.80% 1/1/30 | 1,000,000 | 777,770 | ||||||
| Bemidji Health Care Facilities First Mortgage Revenue | ||||||||
| (North Country Health Services) | ||||||||
| 5.00% 9/1/31 (RADIAN) | 1,350,000 | 1,193,792 | ||||||
| Refunding 5.00% 9/1/20 | 1,150,000 | 1,145,193 | ||||||
| Breckenridge Catholic Health Initiatives | ||||||||
| Series A 5.00% 5/1/30 | 2,000,000 | 2,014,759 | ||||||
| Detroit Lakes Housing & Health Facilities Revenue | ||||||||
| Refunding (Mankato Lutheran Homes) | ||||||||
| Series D 5.50% 8/1/21 | 500,000 | 430,035 | ||||||
| Glencoe Health Care Facilities Revenue | ||||||||
| (Glencoe Regional Health Services Project) | ||||||||
| 5.00% 4/1/20 | 1,100,000 | 1,056,264 | ||||||
| 5.00% 4/1/31 | 1,965,000 | 1,678,071 | ||||||
| Mahtomedi Senior Housing Revenue Refunding | ||||||||
| (St. Andrews Village Project) 5.75% 12/1/40 | 1,000,000 | 740,620 | ||||||
| Maple Grove Health Care Facilities Revenue | ||||||||
| (North Memorial Health Care) 5.00% 9/1/35 | 1,880,000 | 1,627,403 | ||||||
| Maple Grove Health Care System Revenue | ||||||||
| (Maple Grove Hospital) | ||||||||
| 5.25% 5/1/28 | 2,200,000 | 2,082,123 | ||||||
| 5.25% 5/1/37 | 1,000,000 | 898,030 | ||||||
| Minneapolis Health Care System Revenue | ||||||||
| (Fairview Health Services) | ||||||||
| Series A 6.625% 11/15/28 | 1,900,000 | 2,097,352 | ||||||
| Series B 6.50% 11/15/38 (ASSURED GTY) | 250,000 | 282,295 | ||||||
| Series D 5.00% 11/15/34 (AMBAC) | 1,000,000 | 938,640 | ||||||
42
| Principal amount | Value | |||||||
| Municipal Bonds (continued) | ||||||||
| Health Care Revenue Bonds (continued) | ||||||||
| Minneapolis-St. Paul Housing & Redevelopment Authority | ||||||||
| (Health Partners Obligation Group Project) | ||||||||
| 6.00% 12/1/17 | $ | 525,000 | $ | 538,771 | ||||
| Minnesota Agricultural & Economic Development | ||||||||
| Board Revenue (Benedictine Health Systems) | ||||||||
| 5.75% 2/1/29 | 1,000,000 | 773,900 | ||||||
| Moorhead Economic Development Authority | ||||||||
| Multifamily Housing Revenue Refunding | ||||||||
| (Eventide Project) Series A 5.15% 6/1/29 | 550,000 | 395,357 | ||||||
| Northfield Hospital Revenue 5.375% 11/1/31 | 1,000,000 | 874,040 | ||||||
| Owatonna Senior Housing Revenue | ||||||||
| (Senior Living Project) Series A | ||||||||
| 5.80% 10/1/29 | 400,000 | 313,896 | ||||||
| 6.00% 4/1/41 | 1,250,000 | 934,963 | ||||||
| Shakopee Health Care Facilities Revenue | ||||||||
| (St. Francis Regional Medical Center) 5.25% 9/1/34 | 1,000,000 | 888,170 | ||||||
| St. Cloud Minnesota Health Care Revenue | ||||||||
| (Centracare Health System Project) | ||||||||
| 5.50% 5/1/39 (ASSURED GTY) | 1,500,000 | 1,533,165 | ||||||
| St. Louis Park Health Care Facilities Revenue Refunding | ||||||||
| (Park Nicolllet Health Services) | ||||||||
| Series C 5.50% 7/1/23 | 1,000,000 | 1,025,230 | ||||||
| St. Paul Housing & Redevelopment Authority | ||||||||
| Health Care Facilities Revenue | ||||||||
| (Health Partners Obligation Group Project) | ||||||||
| 5.25% 5/15/36 | 1,000,000 | 859,300 | ||||||
| St. Paul Housing & Redevelopment Authority | ||||||||
| Health Care Revenue (Allina Health System) | ||||||||
| Series A 5.00% 11/15/18 (NATL-RE) | 1,900,000 | 1,977,691 | ||||||
| St. Paul Housing & Redevelopment Authority | ||||||||
| Hospital Revenue (Health East Project) | ||||||||
| 6.00% 11/15/25 | 1,000,000 | 894,520 | ||||||
| 6.00% 11/15/30 | 1,000,000 | 834,910 | ||||||
| Series A 5.70% 11/1/15 | 705,000 | 674,748 | ||||||
| Series B 5.85% 11/1/17 | 250,000 | 234,903 | ||||||
| St. Paul Housing and Redevelopment Authority | ||||||||
| Multifamily Housing Revenue Refunding | ||||||||
| (Marion Center Project) Series A 5.375% 5/1/43 | 1,000,000 | 683,100 | ||||||
43
Statements of net assets
Delaware Minnesota High-Yield Municipal Bond Fund
| Principal amount | Value | |||||||
| Municipal Bonds (continued) | ||||||||
| Health Care Revenue Bonds (continued) | ||||||||
| Stillwater Health Care Revenue | ||||||||
| (Health System Obligation Group) | ||||||||
| 5.00% 6/1/25 | $ | 2,000,000 | $ | 1,909,560 | ||||
| 5.00% 6/1/35 | 1,000,000 | 887,530 | ||||||
| @ | Twin Valley Congregate Housing Revenue | |||||||
| (Living Options Project) 5.95% 11/1/28 | 1,825,000 | 1,426,493 | ||||||
| Winona Health Care Facilities Revenue Refunding | ||||||||
| (Winona Health Obligation Group) 5.15% 7/1/31 | 1,500,000 | 1,282,500 | ||||||
| 36,484,841 | ||||||||
| Housing Revenue Bonds – 13.15% | ||||||||
| Chanhassen Multifamily Housing Revenue Refunding | ||||||||
| (Heritage Park Apartments Project) | ||||||||
| 6.20% 7/1/30 (FHA) (AMT) (HUD Section 8) | 300,000 | 300,177 | ||||||
| Chaska Multifamily Housing Revenue (West Suburban | ||||||||
| Housing Partners Project) 5.875% 3/1/31 (AMT) | 1,000,000 | 712,020 | ||||||
| @ | Hutchinson Multifamily Housing Revenue (Evergreen | |||||||
| Apartments Project) 5.75% 11/1/28 (HUD Section 8) | 1,655,000 | 1,232,313 | ||||||
| Minneapolis Multifamily Housing Revenue | ||||||||
| (Grant Street Apartments Project) Refunding | ||||||||
| Series A 7.25% 11/1/29 | 2,085,000 | 1,943,137 | ||||||
| (Olson Townhomes Project) 6.00% 12/1/19 (AMT) | 1,345,000 | 1,329,680 | ||||||
| (Trinity Apartments) Refunding | ||||||||
| Series A 6.75% 5/1/21 (HUD Section 8) | 605,000 | 558,131 | ||||||
| Minneapolis-St. Paul Housing Finance Board Single | ||||||||
| Family Mortgage (City Living Project) | ||||||||
| Series A-2 5.00% 12/1/38 (GNMA) (FNMA) (AMT) | 895,468 | 865,953 | ||||||
| Minnesota Housing Finance Agency | ||||||||
| (Rental Housing) | ||||||||
| Series A 4.875% 8/1/24 (AMT) | 585,000 | 570,744 | ||||||
| Series A-1 5.00% 8/1/40 (AMT) | 2,265,000 | 2,088,012 | ||||||
| (Residential Housing) | ||||||||
| Series G 5.00% 7/1/36 (AMT) | 1,000,000 | 931,540 | ||||||
| Series I 4.85% 7/1/38 (AMT) | 1,145,000 | 1,030,294 | ||||||
| Series L 5.10% 7/1/38 (AMT) | 1,500,000 | 1,409,505 | ||||||
| Series M 4.875% 7/1/37 (AMT) | 2,500,000 | 2,271,874 | ||||||
| (Single Family Mortgage) | ||||||||
| Series E 6.25% 1/1/23 (AMT) | 5,000 | 5,005 | ||||||
44
| Principal amount | Value | |||||||
| Municipal Bonds (continued) | ||||||||
| Housing Revenue Bonds (continued) | ||||||||
| Minnesota Housing Finance Agency (continued) | ||||||||
| (Single Family Mortgage) | ||||||||
| Series J 5.90% 7/1/28 (AMT) | $ | 490,000 | $ | 490,848 | ||||
| Series M 5.875% 1/1/17 | 10,000 | 10,016 | ||||||
| @ | St. Cloud Housing & Redevelopment Authority | |||||||
| Multifamily Housing Revenue (Sterling Heights | ||||||||
| Apartments Project) 7.55% 4/1/39 (AMT) | 530,000 | 433,847 | ||||||
| St. Paul Housing & Redevelopment Authority Multifamily | ||||||||
| Housing Revenue (Shelby Grotto Housing Project) | ||||||||
| 5.50% 9/20/44 (GNMA) (FHA) (AMT) | 750,000 | 757,013 | ||||||
| Stillwater Multifamily Housing Revenue (Orleans Homes | ||||||||
| Project) 5.50% 2/1/42 (AMT) | 750,000 | 507,495 | ||||||
| @ | Washington County Housing & Redevelopment Authority | |||||||
| Revenue Refunding (Briar Pond Project) | ||||||||
| Series B 7.125% 8/20/34 | 810,000 | 660,628 | ||||||
| 18,108,232 | ||||||||
| Lease Revenue Bonds – 1.05% | ||||||||
| Hibbing Economic Development Authority Revenue | ||||||||
| (Public Project - Hibbing Lease Obligation) | ||||||||
| 6.40% 2/1/12 | 410,000 | 408,754 | ||||||
| St. Paul Port Authority Lease Revenue (Robert Street | ||||||||
| Office Building Project) Series 3-11 5.00% 12/1/27 | 1,000,000 | 1,032,740 | ||||||
| 1,441,494 | ||||||||
| Local General Obligation Bonds – 11.99% | ||||||||
| Chaska Independent School District #112 | ||||||||
| Series A 4.50% 2/1/28 (NATL-RE) | 1,000,000 | 1,022,760 | ||||||
| Farmington Independent School District #192 | ||||||||
| Series B 5.00% 2/1/27 (FSA) | 1,000,000 | 1,056,210 | ||||||
| Foley Independent School District #51 (School Building) | ||||||||
| Refunding Series A 5.00% 2/1/21 | 1,105,000 | 1,213,135 | ||||||
| Hopkins Independent School District #270 Facilities | ||||||||
| 5.00% 2/1/26 (NATL-RE) | 1,055,000 | 1,105,893 | ||||||
| Lakeville Independent School District #194 | ||||||||
| Series A 4.75% 2/1/22 (FSA) | 1,000,000 | 1,038,430 | ||||||
45
Statements of net assets
Delaware Minnesota High-Yield Municipal Bond Fund
| Principal amount | Value | |||||||
| Municipal Bonds (continued) | ||||||||
| Local General Obligation Bonds (continued) | ||||||||
| Metropolitan Council Minneapolis-St. Paul | ||||||||
| Metropolitan Area Waste Water Treatment | ||||||||
| Series B 5.00% 12/1/21 | $ | 500,000 | $ | 554,935 | ||||
| Series C 5.00% 3/1/28 | 1,000,000 | 1,063,800 | ||||||
| Minneapolis Various Purposes 4.00% 12/1/23 | 1,500,000 | 1,534,260 | ||||||
| Moorhead Improvement Series B 5.00% 2/1/33 (NATL-RE) | 750,000 | 761,543 | ||||||
| Perham Disposal System 6.00% 5/1/22 (AMT) | 1,500,000 | 1,510,470 | ||||||
| South Washington County Independent | ||||||||
| School District #833 Series A 4.75% 2/1/27 | 1,500,000 | 1,576,395 | ||||||
| Todd Morrison Cass & Wadena Counties United | ||||||||
| Hospital District (Health Care Facilities-Lakewood) | ||||||||
| 5.00% 12/1/21 | 610,000 | 631,313 | ||||||
| 5.125% 12/1/24 | 205,000 | 211,207 | ||||||
| 5.25% 12/1/26 | 1,540,000 | 1,589,727 | ||||||
| White Bear Lake Independent School District #624 | ||||||||
| (Formerly Joint Independent Consolidated | ||||||||
| Ramsey County School District #39 & Washington & | ||||||||
| Anoka Counties School District #103) | ||||||||
| Series B 4.75% 2/1/22 | 1,500,000 | 1,633,515 | ||||||
| 16,503,593 | ||||||||
| §Pre-Refunded Bonds – 9.62% | ||||||||
| Andover Economic Development Authority Public | ||||||||
| Facilities Lease Revenue (Andover Community Center) | ||||||||
| 5.20% 2/1/34-14 | 1,000,000 | 1,115,450 | ||||||
| Duluth Economic Development Authority | ||||||||
| Health Care Facilities Revenue | ||||||||
| (Benedictine Health System - St. Mary’s Hospital) | ||||||||
| 5.25% 2/15/28-14 | 1,000,000 | 1,140,300 | ||||||
| 5.25% 2/15/33-14 | 2,250,000 | 2,565,675 | ||||||
| Minneapolis Community Development Agency Supported | ||||||||
| Development Revenue | ||||||||
| (Limited Tax Common Bond Fund) | ||||||||
| Series G-3 5.45% 12/1/31-11 | 1,000,000 | 1,102,000 | ||||||
| Minneapolis Health Care System Revenue | ||||||||
| (Allina Health Systems) Series A 5.75% 11/15/32-12 | 2,000,000 | 2,282,560 | ||||||
| (Fairview Health Services) Series A 5.625% 5/15/32-12 | 2,000,000 | 2,256,800 | ||||||
| Minnesota Higher Education Facilities Authority Revenue | ||||||||
| (College of Art & Design Project) | ||||||||
| Series 5-D 6.75% 5/1/26-10 | 500,000 | 520,440 | ||||||
46
| Principal amount | Value | |||||||
| Municipal Bonds (continued) | ||||||||
| §Pre-Refunded Bonds (continued) | ||||||||
| Puerto Rico Electric Power Authority Revenue | ||||||||
| Series II 5.25% 7/1/31-12 | $ | 1,000,000 | $ | 1,127,690 | ||||
| St. Louis Park Health Care Facilities Revenue (Park | ||||||||
| Nicollet Health Services) Series B 5.25% 7/1/30-14 | 1,000,000 | 1,138,850 | ||||||
| 13,249,765 | ||||||||
| Special Tax Revenue Bonds – 7.95% | ||||||||
| Hennepin County Sales Tax Revenue | ||||||||
| (First Lien - Ball Park Project) | ||||||||
| Series B 5.00% 12/15/24 | 1,000,000 | 1,097,330 | ||||||
| (Second Lien - Ballpark Project) Series B | ||||||||
| 5.00% 12/15/20 | 1,500,000 | 1,680,525 | ||||||
| 5.00% 12/15/24 | 1,000,000 | 1,088,370 | ||||||
| Minneapolis Supported Development Revenue | ||||||||
| (Limited Tax-Common Bond Fund) | ||||||||
| Series 2A 5.00% 6/1/28 (AMT) | 1,170,000 | 1,030,852 | ||||||
| Minneapolis Tax Increment Revenue | ||||||||
| @(Ivy Tower Project) 5.70% 2/1/29 | 785,000 | 510,941 | ||||||
| (St. Anthony Falls Project) 5.65% 2/1/27 | 500,000 | 339,320 | ||||||
| Minnesota 911 Revenue (Public Safety Radio Commission | ||||||||
| System Project) 5.00% 6/1/24 (ASSURED GTY) | 1,000,000 | 1,081,750 | ||||||
| Puerto Rico Commonwealth Infrastructure Financing | ||||||||
| Authority Special Tax Revenue Series B 5.00% 7/1/46 | 800,000 | 664,704 | ||||||
| Puerto Rico Sales Tax Financing Revenue First Subordinate | ||||||||
| Series A 5.75% 8/1/37 | 930,000 | 956,133 | ||||||
| St. Paul Port Authority (Brownsfields Redevelopment Tax) | ||||||||
| Series 2 5.00% 3/1/37 | 1,500,000 | 1,525,320 | ||||||
| Virgin Islands Public Finance Authority Revenue | ||||||||
| (Senior-Lien-Matching Fund Loan Note) | ||||||||
| Series A 5.25% 10/1/24 | 1,000,000 | 965,610 | ||||||
| 10,940,855 | ||||||||
| State General Obligation Bonds – 3.40% | ||||||||
| Minnesota State | ||||||||
| 5.00% 6/1/14 | 1,000,000 | 1,144,540 | ||||||
| 5.00% 8/1/21 (FSA) | 1,250,000 | 1,372,738 | ||||||
| Puerto Rico Commonwealth Public Improvement | ||||||||
| Series A 5.25% 7/1/22 | 1,000,000 | 990,720 | ||||||
| Un-Refunded Balance 5.00% 7/1/34 | 185,000 | 163,205 | ||||||
47
Statements of net assets
Delaware Minnesota High-Yield Municipal Bond Fund
| Principal amount | Value | |||||||
| Municipal Bonds (continued) | ||||||||
| State General Obligation Bonds (continued) | ||||||||
| Puerto Rico Government Development Bank Senior Notes | ||||||||
| Series B 5.00% 12/1/14 | $ | 1,000,000 | $ | 1,014,580 | ||||
| 4,685,783 | ||||||||
| Transportation Revenue Bond – 1.46% | ||||||||
| Minneapolis - St. Paul Metropolitan Airports | ||||||||
| Commission Revenue Series A 5.00% 1/1/28 (NATL-RE) | 2,000,000 | 2,018,800 | ||||||
| 2,018,800 | ||||||||
| Water & Sewer Revenue Bonds – 4.35% | ||||||||
| Minnesota Public Facilities Authority Clean Water | ||||||||
| Revenue Series B 5.00% 3/1/18 | 2,000,000 | 2,335,880 | ||||||
| Minnesota Public Facilities Authority Water Pollution | ||||||||
| Control Revenue Refunding | ||||||||
| Series C 5.00% 3/1/18 | 1,000,000 | 1,113,690 | ||||||
| Series D 5.00% 3/1/14 | 1,000,000 | 1,137,260 | ||||||
| St. Paul Sewer Revenue Series D 5.00% 12/1/19 | 1,220,000 | 1,400,231 | ||||||
| 5,987,061 | ||||||||
| Total Municipal Bonds (cost $139,325,179) | 134,849,032 | |||||||
| Number of shares | ||||||||
| Short-Term Investment – 0.04% | ||||||||
| Money Market Instrument – 0.04% | ||||||||
| Federated Minnesota Municipal Cash Trust | 50,221 | 50,221 | ||||||
| Total Short-Term Investment (cost $50,221) | 50,221 | |||||||
| Total Value of Securities – 97.98% | ||||||||
| (cost $139,375,400) | 134,899,253 | |||||||
| Receivables and Other Assets | ||||||||
| Net of Liabilities – 2.02% | 2,787,145 | |||||||
| Net Assets Applicable to 13,893,355 | ||||||||
| Shares Outstanding – 100.00% | $ | 137,686,398 | ||||||
48
| Net Asset Value – Delaware Minnesota High-Yield Municipal Bond Fund | ||||
| Class A ($107,950,653 / 10,897,209 Shares) | $9.91 | |||
| Net Asset Value – Delaware Minnesota High-Yield Municipal Bond Fund | ||||
| Class B ($4,995,438 / 503,566 Shares) | $9.92 | |||
| Net Asset Value – Delaware Minnesota High-Yield Municipal Bond Fund | ||||
| Class C ($24,740,307 / 2,492,580 Shares) | $9.93 | |||
| Components of Net Assets at August 31, 2009: | ||||
| Shares of beneficial interest (unlimited authorization – no par) | $ | 146,927,304 | ||
| Undistributed net investment income | 97 | |||
| Accumulated net realized loss on investments | (4,764,856 | ) | ||
| Net unrealized depreciation of investments | (4,476,147 | ) | ||
| Total net assets | $ | 137,686,398 | ||
| § | Pre-Refunded bonds. Municipal bonds that are generally backed or secured by U.S. Treasury bonds. For Pre-Refunded Bonds, the stated maturity is followed by the year in which the bond is pre-refunded. See Note 9 in “Notes to financial statements.” |
| @ | Illiquid security. At August 31, 2009, the aggregate amount of illiquid securities was $4,264,222, which represented 3.10% of the Fund's net assets. See Note 9 in “Notes to financial statements.” |
Summary of abbreviations:
AMBAC — Insured by the AMBAC Assurance Corporation
AMT — Subject to Alternative Minimum Tax
ASSURED GTY — Insured by the Assured Guaranty Corporation
FHA — Insured by the Federal Housing Administration
FNMA — Federal National Mortgage Association Collateral
FSA — Insured by Financial Security Assurance
GNMA — Government National Mortgage Association Collateral
HUD — Housing and Urban Development
NATL-RE — Insured by the National Public Finance Guarantee Corporation
RADIAN — Insured by Radian Asset Assurance
49
Statements of net assets
Delaware Minnesota High-Yield Municipal Bond Fund
| Net Asset Value and Offering Price Per Share – | |||
| Delaware Minnesota High-Yield Municipal Bond Fund | |||
| Net asset value Class A (A) | $ | 9.91 | |
| Sales charge (4.50% of offering price) (B) | 0.47 | ||
| Offering price | $ | 10.38 | |
| (A) | Net asset value per share, as illustrated, is the amount which would be paid upon redemption or repurchase of shares. |
| (B) | See the current prospectus for purchases of $100,000 or more. |
See accompanying notes
50
| Statements of operations | |
| Year Ended August 31, 2009 |
| Delaware | Delaware | |||||||||||
| Delaware | Tax-Free | Minnesota | ||||||||||
| Tax-Free | Minnesota | High-Yield | ||||||||||
| Minnesota | Intermediate | Municipal | ||||||||||
| Fund | Fund | Bond Fund | ||||||||||
| Investment Income: | ||||||||||||
| Interest | $ | 29,197,848 | $ | 3,258,064 | $ | 7,149,571 | ||||||
| Expenses: | ||||||||||||
| Management fees | 3,191,063 | 372,143 | 730,159 | |||||||||
| Distribution expenses – Class A | 1,372,288 | 161,816 | 258,360 | |||||||||
| Distribution expenses – Class B | 102,280 | 5,687 | 51,483 | |||||||||
| Distribution expenses – Class C | 296,236 | 89,830 | 244,073 | |||||||||
| Dividend disbursing and transfer agent | ||||||||||||
| fees and expenses | 283,360 | 44,519 | 87,273 | |||||||||
| Accounting and administration expenses | 235,303 | 29,772 | 53,103 | |||||||||
| Legal fees | 93,849 | 13,661 | 24,286 | |||||||||
| Reports and statements to shareholders | 64,416 | 8,881 | 14,081 | |||||||||
| Registration fees | 50,391 | 31,422 | 2,032 | |||||||||
| Audit and tax | 48,852 | 16,061 | 19,519 | |||||||||
| Interest and related expenses | 46,310 | — | — | |||||||||
| Trustees’ fees | 40,798 | 5,354 | 9,680 | |||||||||
| Insurance fees | 18,829 | 2,172 | 4,191 | |||||||||
| Pricing fees | 17,271 | 7,167 | 11,948 | |||||||||
| Custodian fees | 11,077 | 1,858 | 3,787 | |||||||||
| Consulting fees | 8,152 | 983 | 1,842 | |||||||||
| Trustees’ expenses | 3,344 | 406 | 802 | |||||||||
| Dues and services | 3,254 | 303 | 630 | |||||||||
| 5,887,073 | 792,035 | 1,517,249 | ||||||||||
| Less fees waived | (100,060 | ) | (87,634 | ) | (111,414 | ) | ||||||
| Less waived distribution expenses – Class A | — | (64,726 | ) | — | ||||||||
| Less expenses paid indirectly | (29 | ) | — | — | ||||||||
| Total operating expenses | 5,786,984 | 639,675 | 1,405,835 | |||||||||
| Net Investment Income | 23,410,864 | 2,618,389 | 5,743,736 | |||||||||
52
| Delaware | Delaware | |||||||||
| Delaware | Tax-Free | Minnesota | ||||||||
| Tax-Free | Minnesota | High-Yield | ||||||||
| Minnesota | Intermediate | Municipal | ||||||||
| Fund | Fund | Bond Fund | ||||||||
| Net Realized and Unrealized Gain | ||||||||||
| (Loss) on Investments: | ||||||||||
| Net realized gain (loss) on: | ||||||||||
| Investments | $ | 398,012 | $ | (536,519 | ) | $ | (3,504,426 | ) | ||
| Swap contracts | — | — | 25,000 | |||||||
| Net realized gain (loss) | 398,012 | (536,519 | ) | (3,479,426 | ) | |||||
| Net change in unrealized appreciation/ | ||||||||||
| depreciation of investments | 4,329,928 | 1,614,867 | 509,407 | |||||||
| Net Realized and Unrealized Gain | ||||||||||
| (Loss) on Investments | 4,727,940 | 1,078,348 | (2,970,019 | ) | ||||||
| Net Increase in Net Assets | ||||||||||
| Resulting from Operations | $ | 28,138,804 | $ | 3,696,737 | $ | 2,773,717 | ||||
See accompanying notes
53
Statements of changes in net assets
Delaware Tax-Free Minnesota Fund
| Year Ended | |||||||
| 8/31/09 | 8/31/08 | ||||||
| Increase (Decrease) in Net Assets from Operations: | |||||||
| Net investment income | $ | 23,410,864 | $ | 24,693,217 | |||
| Net realized gain on investments | 398,012 | 1,644,874 | |||||
| Net change in unrealized | |||||||
| appreciation/depreciation of investments | 4,329,928 | (3,545,582 | ) | ||||
| Net increase in net assets resulting from operations | 28,138,804 | 22,792,509 | |||||
| Dividends and Distributions to Shareholders from: | |||||||
| Net Investment Income: | |||||||
| Class A | (22,065,961 | ) | (23,717,797 | ) | |||
| Class B | (336,274 | ) | (452,818 | ) | |||
| Class C | (964,553 | ) | (894,686 | ) | |||
| Net realized gain on investments: | |||||||
| Class A | (2,257,248 | ) | (94,009 | ) | |||
| Class B | (43,630 | ) | (2,390 | ) | |||
| Class C | (114,457 | ) | (4,208 | ) | |||
| (25,782,123 | ) | (25,165,908 | ) | ||||
| Capital Share Transactions: | |||||||
| Proceeds from shares sold: | |||||||
| Class A | 42,839,664 | 43,057,506 | |||||
| Class B | 137,140 | 119,269 | |||||
| Class C | 9,478,506 | 5,336,417 | |||||
| Net asset value of shares issued upon reinvestment | |||||||
| of dividends and distributions: | |||||||
| Class A | 15,962,228 | 15,526,838 | |||||
| Class B | 264,058 | 307,575 | |||||
| Class C | 810,983 | 698,797 | |||||
| 69,492,579 | 65,046,402 | ||||||
54
Statements of changes in net assets
Delaware Tax-Free Minnesota Fund
| Year Ended | |||||||
| 8/31/09 | 8/31/08 | ||||||
| Capital Share Transactions (continued): | |||||||
| Cost of shares repurchased: | |||||||
| Class A | $ | (76,315,603 | ) | $ | (59,622,788 | ) | |
| Class B | (2,471,909 | ) | (4,483,911 | ) | |||
| Class C | (4,080,940 | ) | (5,172,765 | ) | |||
| (82,868,452 | ) | (69,279,464 | ) | ||||
| Decrease in net assets derived from | |||||||
| capital share transactions | (13,375,873 | ) | (4,233,062 | ) | |||
| Net Decrease in Net Assets | (11,019,192 | ) | (6,606,461 | ) | |||
| Net Assets: | |||||||
| Beginning of year | 614,091,697 | 620,698,158 | |||||
| End of year | $ | 603,072,505 | $ | 614,091,697 | |||
| Distributions in excess of net investment income | $ | (144,872 | ) | $ | (22,417 | ) | |
See accompanying notes
55
Statements of changes in net assets
Delaware Tax-Free Minnesota Intermediate Fund
| Year Ended | |||||||
| 8/31/09 | 8/31/08 | ||||||
| Increase (Decrease) in Net Assets from Operations: | |||||||
| Net investment income | $ | 2,618,389 | $ | 2,195,553 | |||
| Net realized gain (loss) on investments | (536,519 | ) | 48,395 | ||||
| Net change in unrealized | |||||||
| appreciation/depreciation of investments | 1,614,867 | 549,365 | |||||
| Net increase in net assets resulting from operations | 3,696,737 | 2,793,313 | |||||
| Dividends and Distributions to Shareholders from: | |||||||
| Net Investment Income: | |||||||
| Class A | (2,352,412 | ) | (1,992,475 | ) | |||
| Class B | (16,198 | ) | (39,255 | ) | |||
| Class C | (247,432 | ) | (165,689 | ) | |||
| (2,616,042 | ) | (2,197,419 | ) | ||||
| Capital Share Transactions: | |||||||
| Proceeds from shares sold: | |||||||
| Class A | 25,615,997 | 14,394,866 | |||||
| Class B | 23,351 | 229,426 | |||||
| Class C | 5,125,080 | 2,683,011 | |||||
| Net asset value of shares issued upon reinvestment | |||||||
| of dividends and distributions: | |||||||
| Class A | 1,512,023 | 1,376,198 | |||||
| Class B | 12,783 | 29,283 | |||||
| Class C | 170,452 | 128,094 | |||||
| 32,459,686 | 18,840,878 | ||||||
56
| Year Ended | |||||||
| 8/31/09 | 8/31/08 | ||||||
| Capital Share Transactions (continued): | |||||||
| Cost of shares repurchased: | |||||||
| Class A | $ | (8,485,220 | ) | $ | (6,309,982 | ) | |
| Class B | (608,734 | ) | (1,078,787 | ) | |||
| Class C | (1,331,367 | ) | (675,375 | ) | |||
| (10,425,321 | ) | (8,064,144 | ) | ||||
| Increase in net assets derived from | |||||||
| capital share transactions | 22,034,365 | 10,776,734 | |||||
| Net Increase in Net Assets | 23,115,060 | 11,372,628 | |||||
| Net Assets: | |||||||
| Beginning of year | 66,498,518 | 55,125,890 | |||||
| End of year | $ | 89,613,578 | $ | 66,498,518 | |||
| Undistributed (Distributions in excess of) | |||||||
| net investment income | $ | 2,522 | $ | (1,866 | ) | ||
See accompanying notes
57
Statements of changes in net assets
Delaware Minnesota High-Yield Municipal Bond Fund
| Year Ended | |||||||
| 8/31/09 | 8/31/08 | ||||||
| Increase (Decrease) in Net Assets from Operations: | |||||||
| Net investment income | $ | 5,743,736 | $ | 5,761,135 | |||
| Net realized loss on investments | (3,479,426 | ) | (153,335 | ) | |||
| Net change in unrealized | |||||||
| appreciation/depreciation of investments | 509,407 | (2,719,275 | ) | ||||
| Net increase in net assets resulting from operations | 2,773,717 | 2,888,525 | |||||
| Dividends and Distributions to Shareholders from: | |||||||
| Net Investment Income: | |||||||
| Class A | (4,628,073 | ) | (4,613,123 | ) | |||
| Class B | (192,230 | ) | (215,135 | ) | |||
| Class C | (911,013 | ) | (921,847 | ) | |||
| (5,731,316 | ) | (5,750,105 | ) | ||||
| Capital Share Transactions: | |||||||
| Proceeds from shares sold: | |||||||
| Class A | 15,056,968 | 29,618,345 | |||||
| Class B | 73,695 | 52,811 | |||||
| Class C | 2,660,111 | 7,621,141 | |||||
| Net asset value of shares issued upon reinvestment | |||||||
| of dividends and distributions: | |||||||
| Class A | 2,988,359 | 3,092,127 | |||||
| Class B | 121,542 | 138,356 | |||||
| Class C | 647,117 | 692,751 | |||||
| 21,547,792 | 41,215,531 | ||||||
58
| Year Ended | |||||||
| 8/31/09 | 8/31/08 | ||||||
| Capital Share Transactions (continued): | |||||||
| Cost of shares repurchased: | |||||||
| Class A | $ | (24,926,201 | ) | $ | (23,292,776 | ) | |
| Class B | (992,296 | ) | (1,519,206 | ) | |||
| Class C | (6,740,684 | ) | (4,943,787 | ) | |||
| (32,659,181 | ) | (29,755,769 | ) | ||||
| Increase (decrease) in net assets derived from | |||||||
| capital share transactions | (11,111,389 | ) | 11,459,762 | ||||
| Net Increase (Decrease) in Net Assets | (14,068,988 | ) | 8,598,182 | ||||
| Net Assets: | |||||||
| Beginning of year | 151,755,386 | 143,157,204 | |||||
| End of year | $ | 137,686,398 | $ | 151,755,386 | |||
| Undistributed net investment income | $ | 97 | $ | — | |||
See accompanying notes
59
Financial highlights
Delaware Tax-Free Minnesota Fund Class A
Selected data for each share of the Fund outstanding throughout each period were as follows:
| Net asset value, beginning of period |
| Income (loss) from investment operations: |
| Net investment income |
| Net realized and unrealized gain (loss) on investments |
| Total from investment operations |
| Less dividends and distributions from: |
| Net investment income |
| Net realized gain on investments |
| Total dividends and distributions |
| Net asset value, end of period |
| Total return1 |
| Ratios and supplemental data: |
| Net assets, end of period (000 omitted) |
| Ratio of expenses to average net assets excluding interest and fees on short-term floating |
| rate notes issued |
| Interest and fees on short-term floating rate notes issued |
| Total expenses2 |
| Ratio of expenses to average net assets excluding interest and fees on short-term floating |
| rate notes issued prior to fees waived and expense paid indirectly |
| Interest and fees on short-term floating rate notes issued |
| Total expenses prior to fees waived and expense paid indirectly2 |
| Ratio of net investment income to average net assets |
| Ratio of net investment income to average net assets |
| prior to fees waived and expense paid indirectly |
| Portfolio turnover |
1 Total investment return is based on the change in net asset value of a share during the period and assumes reinvestment of dividends and distributions at net asset value and does not reflect the impact of a sales charge. Total investment return reflects a waiver by the manager. Performance would have been lower had the waiver not been in effect. |
See accompanying notes
60
| Year Ended | |||||||||||||||
| 8/31/09 | 8/31/08 | 8/31/07 | 8/31/06 | 8/31/05 | |||||||||||
| $12.120 | $12.170 | $12.490 | $12.690 | $12.620 | |||||||||||
| 0.474 | 0.495 | 0.511 | 0.511 | 0.527 | |||||||||||
| 0.107 | (0.041 | ) | (0.313 | ) | (0.172 | ) | 0.222 | ||||||||
| 0.581 | 0.454 | 0.198 | 0.339 | 0.749 | |||||||||||
| (0.473 | ) | (0.502 | ) | (0.507 | ) | (0.513 | ) | (0.526 | ) | ||||||
| (0.048 | ) | (0.002 | ) | (0.011 | ) | (0.026 | ) | (0.153 | ) | ||||||
| (0.521 | ) | (0.504 | ) | (0.518 | ) | (0.539 | ) | (0.679 | ) | ||||||
| $12.180 | $12.120 | $12.170 | $12.490 | $12.690 | |||||||||||
| 5.04% | 3.77% | 1.58% | 2.78% | 6.12% | |||||||||||
| $559,393 | $574,914 | $578,194 | $381,720 | $364,491 | |||||||||||
| 0.92% | 0.93% | 0.94% | 0.93% | 0.93% | |||||||||||
| 0.01% | 0.18% | 0.29% | 0.26% | 0.19% | |||||||||||
| 0.93% | 1.11% | 1.23% | 1.19% | 1.12% | |||||||||||
| 0.94% | 0.93% | 0.96% | 0.94% | 0.94% | |||||||||||
| 0.01% | 0.18% | 0.29% | 0.26% | 0.19% | |||||||||||
| 0.95% | 1.11% | 1.25% | 1.20% | 1.13% | |||||||||||
| 4.03% | 4.05% | 4.12% | 4.11% | 4.19% | |||||||||||
| 4.01% | 4.05% | 4.10% | 4.10% | 4.18% | |||||||||||
| 20% | 17% | 7% | 13% | 10% | |||||||||||
2 Total expenses and total expenses prior to fees waived and expense paid indirectly includes interest and related expenses which include, but are not limited to, interest expense, remarketing fees, liquidity fees, and trustees’ fees in connection with the Fund’s participation in inverse floater programs. See Notes 1 and 8 in “Notes to financial statements.” |
61
Financial highlights
Delaware Tax-Free Minnesota Fund Class B
Selected data for each share of the Fund outstanding throughout each period were as follows:
| Net asset value, beginning of period |
| Income (loss) from investment operations: |
| Net investment income |
| Net realized and unrealized gain (loss) on investments |
| Total from investment operations |
| Less dividends and distributions from: |
| Net investment income |
| Net realized gain on investments |
| Total dividends and distributions |
| Net asset value, end of period |
| Total return1 |
| Ratios and supplemental data: |
| Net assets, end of period (000 omitted) |
| Ratio of expenses to average net assets excluding interest and fees on short-term floating |
| rate notes issued |
| Interest and fees on short-term floating rate notes issued |
| Total expenses2 |
| Ratio of expenses to average net assets excluding interest and fees on short-term floating |
| rate notes issued prior to fees waived and expense paid indirectly |
| Interest and fees on short-term floating rate notes issued |
| Total expenses prior to fees waived and expense paid indirectly2 |
| Ratio of net investment income to average net assets |
| Ratio of net investment income to average net assets |
| prior to fees waived and expense paid indirectly |
| Portfolio turnover |
1 Total investment return is based on the change in net asset value of a share during the period and assumes reinvestment of dividends and distributions at net asset value and does not reflect the impact of a sales charge. Total investment return reflects a waiver by the manager. Performance would have been lower had the waiver not been in effect. |
See accompanying notes
62
| Year Ended | |||||||||||||||
| 8/31/09 | 8/31/08 | 8/31/07 | 8/31/06 | 8/31/05 | |||||||||||
| $12.130 | $12.180 | $12.500 | $12.700 | $12.630 | |||||||||||
| 0.386 | 0.403 | 0.419 | 0.418 | 0.433 | |||||||||||
| 0.107 | (0.041 | ) | (0.314 | ) | (0.172 | ) | 0.222 | ||||||||
| 0.493 | 0.362 | 0.105 | 0.246 | 0.655 | |||||||||||
| (0.385 | ) | (0.410 | ) | (0.414 | ) | (0.420 | ) | (0.432 | ) | ||||||
| (0.048 | ) | (0.002 | ) | (0.011 | ) | (0.026 | ) | (0.153 | ) | ||||||
| (0.433 | ) | (0.412 | ) | (0.425 | ) | (0.446 | ) | (0.585 | ) | ||||||
| $12.190 | $12.130 | $12.180 | $12.500 | $12.700 | |||||||||||
| 4.26% | 2.99% | 0.82% | 2.01% | 5.33% | |||||||||||
| $9,506 | $11,593 | $15,674 | $11,354 | $12,810 | |||||||||||
| 1.67% | 1.68% | 1.69% | 1.68% | 1.68% | |||||||||||
| 0.01% | 0.18% | 0.29% | 0.26% | 0.19% | |||||||||||
| 1.68% | 1.86% | 1.98% | 1.94% | 1.87% | |||||||||||
| 1.69% | 1.68% | 1.71% | 1.69% | 1.69% | |||||||||||
| 0.01% | 0.18% | 0.29% | 0.26% | 0.19% | |||||||||||
| 1.70% | 1.86% | 2.00% | 1.95% | 1.88% | |||||||||||
| 3.28% | 3.30% | 3.37% | 3.36% | 3.44% | |||||||||||
| 3.26% | 3.30% | 3.35% | 3.35% | 3.43% | |||||||||||
| 20% | 17% | 7% | 13% | 10% | |||||||||||
2 Total expenses and total expenses prior to fees waived and expense paid indirectly includes interest and related expenses which include, but are not limited to, interest expense, remarketing fees, liquidity fees, and trustees’ fees in connection with the Fund’s participation in inverse floater programs. See Notes 1 and 8 in “Notes to financial statements.” |
63
Financial highlights
Delaware Tax-Free Minnesota Fund Class C
Selected data for each share of the Fund outstanding throughout each period were as follows:
| Net asset value, beginning of period |
| Income (loss) from investment operations: |
| Net investment income |
| Net realized and unrealized gain (loss) on investments |
| Total from investment operations |
| Less dividends and distributions from: |
| Net investment income |
| Net realized gain on investments |
| Total dividends and distributions |
| Net asset value, end of period |
| Total return1 |
| Ratios and supplemental data: |
| Net assets, end of period (000 omitted) |
| Ratio of expenses to average net assets excluding interest and fees on short-term floating |
| rate notes issued |
| Interest and fees on short-term floating rate notes issued |
| Total expenses2 |
| Ratio of expenses to average net assets excluding interest and fees on short-term floating |
| rate notes issued prior to fees waived and expense paid indirectly |
| Interest and fees on short-term floating rate notes issued |
| Total expenses prior to fees waived and expense paid indirectly2 |
| Ratio of net investment income to average net assets |
| Ratio of net investment income to average net assets |
| prior to fees waived and expense paid indirectly |
| Portfolio turnover |
1 Total investment return is based on the change in net asset value of a share during the period and assumes reinvestment of dividends and distributions at net asset value and does not reflect the impact of a sales charge. Total investment return reflects a waiver by the manager. Performance would have been lower had the waiver not been in effect.
See accompanying notes
64
| Year Ended | |||||||||||||||
| 8/31/09 | 8/31/08 | 8/31/07 | 8/31/06 | 8/31/05 | |||||||||||
| $12.160 | $12.200 | $12.530 | $12.720 | $12.650 | |||||||||||
| 0.386 | 0.403 | 0.418 | 0.418 | 0.433 | |||||||||||
| 0.107 | (0.031 | ) | (0.323 | ) | (0.162 | ) | 0.222 | ||||||||
| 0.493 | 0.372 | 0.095 | 0.256 | 0.655 | |||||||||||
| (0.385 | ) | (0.410 | ) | (0.414 | ) | (0.420 | ) | (0.432 | ) | ||||||
| (0.048 | ) | (0.002 | ) | (0.011 | ) | (0.026 | ) | (0.153 | ) | ||||||
| (0.433 | ) | (0.412 | ) | (0.425 | ) | (0.446 | ) | (0.585 | ) | ||||||
| $12.220 | $12.160 | $12.200 | $12.530 | $12.720 | |||||||||||
| 4.25% | 3.06% | 0.73% | 2.08% | 5.32% | |||||||||||
| $34,174 | $27,585 | $26,830 | $15,125 | $13,971 | |||||||||||
| 1.67% | 1.68% | 1.69% | 1.68% | 1.68% | |||||||||||
| 0.01% | 0.18% | 0.29% | 0.26% | 0.19% | |||||||||||
| 1.68% | 1.86% | 1.98% | 1.94% | 1.87% | |||||||||||
| 1.69% | 1.68% | 1.71% | 1.69% | 1.69% | |||||||||||
| 0.01% | 0.18% | 0.29% | 0.26% | 0.19% | |||||||||||
| 1.70% | 1.86% | 2.00% | 1.95% | 1.88% | |||||||||||
| 3.28% | 3.30% | 3.37% | 3.36% | 3.44% | |||||||||||
| 3.26% | 3.30% | 3.35% | 3.35% | 3.43% | |||||||||||
| 20% | 17% | 7% | 13% | 10% | |||||||||||
2 Total expenses and total expenses prior to fees waived and expense paid indirectly includes interest and related expenses which include, but are not limited to, interest expense, remarketing fees, liquidity fees, and trustees’ fees in connection with the Fund’s participation in inverse floater programs. See Notes 1 and 8 in “Notes to financial statements.”
65
Financial highlights
Delaware Tax-Free Minnesota Intermediate Fund Class A
Selected data for each share of the Fund outstanding throughout each period were as follows:
| Net asset value, beginning of period |
| Income (loss) from investment operations: |
| Net investment income |
| Net realized and unrealized gain (loss) on investments |
| Total from investment operations |
| Less dividends and distributions from: |
| Net investment income |
| Total dividends and distributions |
| Net asset value, end of period |
| Total return1 |
| Ratios and supplemental data: |
| Net assets, end of period (000 omitted) |
| Ratio of expenses to average net assets |
| Ratio of expenses to average net assets |
| prior to fees waived and expense paid indirectly |
| Ratio of net investment income to average net assets |
| Ratio of net investment income to average net assets |
| prior to fees waived and expense paid indirectly |
| Portfolio turnover |
1 Total investment return is based on the change in net asset value of a share during the period and assumes reinvestment of dividends and distributions at net asset value and does not reflect the impact of a sales charge. Total investment return reflects waivers by the manager and distributor, as applicable. Performance would have been lower had the waivers not been in effect.
See accompanying notes
66
| Year Ended | |||||||||||||||
| 8/31/09 | 8/31/08 | 8/31/07 | 8/31/06 | 8/31/05 | |||||||||||
| $10.720 | $10.610 | $10.860 | $11.010 | $10.890 | |||||||||||
| 0.384 | 0.414 | 0.445 | 0.429 | 0.407 | |||||||||||
| 0.100 | 0.110 | (0.250 | ) | (0.150 | ) | 0.120 | |||||||||
| 0.484 | 0.524 | 0.195 | 0.279 | 0.527 | |||||||||||
| (0.384 | ) | (0.414 | ) | (0.445 | ) | (0.429 | ) | (0.407 | ) | ||||||
| (0.384 | ) | (0.414 | ) | (0.445 | ) | (0.429 | ) | (0.407 | ) | ||||||
| $10.820 | $10.720 | $10.610 | $10.860 | $11.010 | |||||||||||
| 4.67% | 5.00% | 1.80% | 2.62% | 4.93% | |||||||||||
| $78,021 | $58,465 | $48,477 | $48,297 | $52,958 | |||||||||||
| 0.75% | 0.75% | 0.76% | 0.75% | 0.79% | |||||||||||
| 0.97% | 0.95% | 1.00% | 0.97% | 0.95% | |||||||||||
| 3.62% | 3.83% | 4.11% | 3.96% | 3.72% | |||||||||||
| 3.40% | 3.63% | 3.87% | 3.74% | 3.56% | |||||||||||
| 12% | 27% | 15% | 11% | 25% | |||||||||||
67
Financial highlights
Delaware Tax-Free Minnesota Intermediate Fund Class B
Selected data for each share of the Fund outstanding throughout each period were as follows:
| Net asset value, beginning of period |
| Income (loss) from investment operations: |
| Net investment income |
| Net realized and unrealized gain (loss) on investments |
| Total from investment operations |
| Less dividends and distributions from: |
| Net investment income |
| Total dividends and distributions |
| Net asset value, end of period |
| Total return1 |
| Ratios and supplemental data: |
| Net assets, end of period (000 omitted) |
| Ratio of expenses to average net assets |
| Ratio of expenses to average net assets |
| prior to fees waived and expense paid indirectly |
| Ratio of net investment income to average net assets |
| Ratio of net investment income to average net assets |
| prior to fees waived and expense paid indirectly |
| Portfolio turnover |
1 Total investment return is based on the change in net asset value of a share during the period and assumes reinvestment of dividends and distributions at net asset value and does not reflect the impact of a sales charge. Total investment return reflects a waiver by the manager. Performance would have been lower had the waiver not been in effect.
See accompanying notes
68
| Year Ended | |||||||||||||||
| 8/31/09 | 8/31/08 | 8/31/07 | 8/31/06 | 8/31/05 | |||||||||||
| $10.750 | $10.640 | $10.890 | $11.040 | $10.920 | |||||||||||
| 0.295 | 0.322 | 0.353 | 0.337 | 0.314 | |||||||||||
| 0.100 | 0.110 | (0.250 | ) | (0.150 | ) | 0.120 | |||||||||
| 0.395 | 0.432 | 0.103 | 0.187 | 0.434 | |||||||||||
| (0.295 | ) | (0.322 | ) | (0.353 | ) | (0.337 | ) | (0.314 | ) | ||||||
| (0.295 | ) | (0.322 | ) | (0.353 | ) | (0.337 | ) | (0.314 | ) | ||||||
| $10.850 | $10.750 | $10.640 | $10.890 | $11.040 | |||||||||||
| 3.79% | 4.10% | 0.94% | 1.75% | 4.03% | |||||||||||
| $317 | $908 | $1,713 | $1,993 | $2,811 | |||||||||||
| 1.60% | 1.60% | 1.61% | 1.60% | 1.64% | |||||||||||
| 1.72% | 1.70% | 1.75% | 1.72% | 1.70% | |||||||||||
| 2.77% | 2.98% | 3.26% | 3.11% | 2.87% | |||||||||||
| 2.65% | 2.88% | 3.12% | 2.99% | 2.81% | |||||||||||
| 12% | 27% | 15% | 11% | 25% | |||||||||||
69
Financial highlights
Delaware Tax-Free Minnesota Intermediate Fund Class C
Selected data for each share of the Fund outstanding throughout each period were as follows:
| Net asset value, beginning of period |
| Income (loss) from investment operations: |
| Net investment income |
| Net realized and unrealized gain (loss) on investments |
| Total from investment operations |
| Less dividends and distributions from: |
| Net investment income |
| Total dividends and distributions |
| Net asset value, end of period |
| Total return1 |
| Ratios and supplemental data: |
| Net assets, end of period (000 omitted) |
| Ratio of expenses to average net assets |
| Ratio of expenses to average net assets |
| prior to fees waived and expense paid indirectly |
| Ratio of net investment income to average net assets |
| Ratio of net investment income to average net assets |
| prior to fees waived and expense paid indirectly |
| Portfolio turnover |
1 Total investment return is based on the change in net asset value of a share during the period and assumes reinvestment of dividends and distributions at net asset value and does not reflect the impact of a sales charge. Total investment return reflects a waiver by the manager. Performance would have been lower had the waiver not been in effect.
See accompanying notes
70
| Year Ended | |||||||||||||||
| 8/31/09 | 8/31/08 | 8/31/07 | 8/31/06 | 8/31/05 | |||||||||||
| $10.740 | $10.630 | $10.880 | $11.030 | $10.910 | |||||||||||
| 0.295 | 0.322 | 0.353 | 0.337 | 0.314 | |||||||||||
| 0.100 | 0.110 | (0.250 | ) | (0.150 | ) | 0.120 | |||||||||
| 0.395 | 0.432 | 0.103 | 0.187 | 0.434 | |||||||||||
| (0.295 | ) | (0.322 | ) | (0.353 | ) | (0.337 | ) | (0.314 | ) | ||||||
| (0.295 | ) | (0.322 | ) | (0.353 | ) | (0.337 | ) | (0.314 | ) | ||||||
| $10.840 | $10.740 | $10.630 | $10.880 | $11.030 | |||||||||||
| 3.78% | 4.10% | 0.94% | 1.75% | 4.04% | |||||||||||
| $11,276 | $7,126 | $4,936 | $5,162 | $5,996 | |||||||||||
| 1.60% | 1.60% | 1.61% | 1.60% | 1.64% | |||||||||||
| 1.72% | 1.70% | 1.75% | 1.72% | 1.70% | |||||||||||
| 2.77% | 2.98% | 3.26% | 3.11% | 2.87% | |||||||||||
| 2.65% | 2.88% | 3.12% | 2.99% | 2.81% | |||||||||||
| 12% | 27% | 15% | 11% | 25% | |||||||||||
71
Financial highlights
Delaware Minnesota High-Yield Municipal Bond Fund Class A
Selected data for each share of the Fund outstanding throughout each period were as follows:
| Net asset value, beginning of period |
| Income (loss) from investment operations: |
| Net investment income |
| Net realized and unrealized gain (loss) on investments |
| Total from investment operations |
| Less dividends and distributions from: |
| Net investment income |
| Total dividends and distributions |
| Net asset value, end of period |
| Total return1 |
| Ratios and supplemental data: |
| Net assets, end of period (000 omitted) |
| Ratio of expenses to average net assets |
| Ratio of expenses to average net assets |
| prior to fees waived and expense paid indirectly |
| Ratio of net investment income to average net assets |
| Ratio of net investment income to average net assets |
| prior to fees waived and expense paid indirectly |
| Portfolio turnover |
1 Total investment return is based on the change in net asset value of a share during the period and assumes reinvestment of dividends and distributions at net asset value and does not reflect the impact of a sales charge. Total investment return reflects a waiver by the manager. Performance would have been lower had the waiver not been in effect.
See accompanying notes
72
| Year Ended | |||||||||||||||
| 8/31/09 | 8/31/08 | 8/31/07 | 8/31/06 | 8/31/05 | |||||||||||
| $10.000 | $10.180 | $10.530 | $10.610 | $10.240 | |||||||||||
| 0.422 | 0.418 | 0.430 | 0.445 | 0.469 | |||||||||||
| (0.091 | ) | (0.180 | ) | (0.350 | ) | (0.082 | ) | 0.372 | |||||||
| 0.331 | 0.238 | 0.080 | 0.363 | 0.841 | |||||||||||
| (0.421 | ) | (0.418 | ) | (0.430 | ) | (0.443 | ) | (0.471 | ) | ||||||
| (0.421 | ) | (0.418 | ) | (0.430 | ) | (0.443 | ) | (0.471 | ) | ||||||
| $ 9.910 | $10.000 | $10.180 | $10.530 | $10.610 | |||||||||||
| 3.63% | 2.35% | 0.71% | 3.54% | 8.40% | |||||||||||
| $107,951 | $116,999 | $109,807 | $87,504 | $63,802 | |||||||||||
| 0.89% | 0.89% | 0.90% | 0.89% | 0.89% | |||||||||||
| 0.97% | 0.97% | 1.00% | 1.00% | 0.98% | |||||||||||
| 4.49% | 4.11% | 4.09% | 4.26% | 4.50% | |||||||||||
| 4.41% | 4.03% | 3.99% | 4.15% | 4.41% | |||||||||||
| 12% | 10% | 10% | 4% | 3% | |||||||||||
73
Financial highlights
Delaware Minnesota High-Yield Municipal Bond Fund Class B
Selected data for each share of the Fund outstanding throughout each period were as follows:
| Net asset value, beginning of period |
| Income (loss) from investment operations: |
| Net investment income |
| Net realized and unrealized gain (loss) on investments |
| Total from investment operations |
| Less dividends and distributions from: |
| Net investment income |
| Total dividends and distributions |
| Net asset value, end of period |
| Total return1 |
| Ratios and supplemental data: |
| Net assets, end of period (000 omitted) |
| Ratio of expenses to average net assets |
| Ratio of expenses to average net assets |
| prior to fees waived and expense paid indirectly |
| Ratio of net investment income to average net assets |
| Ratio of net investment income to average net assets |
| prior to fees waived and expense paid indirectly |
| Portfolio turnover |
1 Total investment return is based on the change in net asset value of a share during the period and assumes reinvestment of dividends and distributions at net asset value and does not reflect the impact of a sales charge. Total investment return reflects a waiver by the manager. Performance would have been lower had the waiver not been in effect.
See accompanying notes
74
| Year Ended | |||||||||||||||
| 8/31/09 | 8/31/08 | 8/31/07 | 8/31/06 | 8/31/05 | |||||||||||
| $10.010 | $10.190 | $10.550 | $10.630 | $10.250 | |||||||||||
| 0.352 | 0.341 | 0.351 | 0.367 | 0.391 | |||||||||||
| (0.091 | ) | (0.179 | ) | (0.360 | ) | (0.082 | ) | 0.381 | |||||||
| 0.261 | 0.162 | (0.009 | ) | 0.285 | 0.772 | ||||||||||
| (0.351 | ) | (0.342 | ) | (0.351 | ) | (0.365 | ) | (0.392 | ) | ||||||
| (0.351 | ) | (0.342 | ) | (0.351 | ) | (0.365 | ) | (0.392 | ) | ||||||
| $9.920 | $10.010 | $10.190 | $10.550 | $10.630 | |||||||||||
| 2.86% | 1.58% | (0.13% | ) | 2.77% | 7.68% | ||||||||||
| $4,995 | $5,907 | $7,334 | $9,578 | $10,505 | |||||||||||
| 1.64% | 1.64% | 1.65% | 1.64% | 1.64% | |||||||||||
| 1.72% | 1.72% | 1.75% | 1.75% | 1.73% | |||||||||||
| 3.74% | 3.36% | 3.34% | 3.51% | 3.75% | |||||||||||
| 3.66% | 3.28% | 3.24% | 3.40% | 3.66% | |||||||||||
| 12% | 10% | 10% | 4% | 3% | |||||||||||
75
Financial highlights
Delaware Minnesota High-Yield Municipal Bond Fund Class C
Selected data for each share of the Fund outstanding throughout each period were as follows:
| Net asset value, beginning of period |
| Income (loss) from investment operations: |
| Net investment income |
| Net realized and unrealized gain (loss) on investments |
| Total from investment operations |
| Less dividends and distributions from: |
| Net investment income |
| Total dividends and distributions |
| Net asset value, end of period |
| Total return1 |
| Ratios and supplemental data: |
| Net assets, end of period (000 omitted) |
| Ratio of expenses to average net assets |
| Ratio of expenses to average net assets |
| prior to fees waived and expense paid indirectly |
| Ratio of net investment income to average net assets |
| Ratio of net investment income to average net assets |
| prior to fees waived and expense paid indirectly |
| Portfolio turnover |
1 Total investment return is based on the change in net asset value of a share during the period and assumes reinvestment of dividends and distributions at net asset value and does not reflect the impact of a sales charge. Total investment return reflects a waiver by the manager. Performance would have been lower had the waiver not been in effect.
See accompanying notes
76
| Year Ended | |||||||||||||||
| 8/31/09 | 8/31/08 | 8/31/07 | 8/31/06 | 8/31/05 | |||||||||||
| $10.020 | $10.200 | $10.550 | $10.630 | $10.250 | |||||||||||
| 0.352 | 0.342 | 0.351 | 0.367 | 0.391 | |||||||||||
| (0.091 | ) | (0.181 | ) | (0.350 | ) | (0.082 | ) | 0.381 | |||||||
| 0.261 | 0.161 | 0.001 | 0.285 | 0.772 | |||||||||||
| (0.351 | ) | (0.341 | ) | (0.351 | ) | (0.365 | ) | (0.392 | ) | ||||||
| (0.351 | ) | (0.341 | ) | (0.351 | ) | (0.365 | ) | (0.392 | ) | ||||||
| $9.930 | $10.020 | $10.200 | $10.550 | $10.630 | |||||||||||
| 2.85% | 1.58% | (0.04% | ) | 2.76% | 7.68% | ||||||||||
| $24,740 | $28,849 | $26,016 | $20,516 | $15,809 | |||||||||||
| 1.64% | 1.64% | 1.65% | 1.64% | 1.64% | |||||||||||
| 1.72% | 1.72% | 1.75% | 1.75% | 1.73% | |||||||||||
| 3.74% | 3.36% | 3.34% | 3.51% | 3.75% | |||||||||||
| 3.66% | 3.28% | 3.24% | 3.40% | 3.66% | |||||||||||
| 12% | 10% | 10% | 4% | 3% | |||||||||||
77
| Notes to financial statements | |
| Delaware Minnesota Municipal Bond Funds | August 31, 2009 |
Voyageur Mutual Funds is organized as a Delaware statutory trust and offers five series: Delaware Minnesota High-Yield Municipal Bond Fund, Delaware National High-Yield Municipal Bond Fund, Delaware Tax-Free California Fund, Delaware Tax-Free Idaho Fund and Delaware Tax-Free New York Fund. Voyageur Tax-Free Funds is organized as a Delaware statutory trust and offers Delaware Tax-Free Minnesota Fund. Voyageur Intermediate Tax-Free Funds is organized as a Delaware statutory trust and offers Delaware Tax-Free Minnesota Intermediate Fund. Voyageur Mutual Funds, Voyageur Tax-Free Funds and Voyageur Intermediate Tax-Free Funds are individually referred to as a “Trust” and collectively as “Trusts.” These financial statements and the related notes pertain to Delaware Tax-Free Minnesota Fund, Delaware Tax-Free Minnesota Intermediate Fund and Delaware Minnesota High-Yield Municipal Bond Fund (each referred to as a “Fund” or collectively as the “Funds”). The above Trusts are open-end investment companies. The Funds are considered diversified under the Investment Company Act of 1940, as amended, and offer Class A, Class B, and Class C shares. Class A shares are sold with a maximum front-end sales charge of up to 4.50% for Delaware Tax-Free Minnesota Fund and Delaware Minnesota High-Yield Municipal Bond Fund and up to 2.75% for Delaware Tax-Free Minnesota Intermediate Fund. Class A share purchases of $1,000,000 or more will incur a contingent deferred sales charge (CDSC) of 1% if redeemed during the first year and 0.50% during the second year for Delaware Tax-Free Minnesota Fund and Delaware Minnesota High-Yield Municipal Bond Fund, and 0.75% for the Delaware Tax-Free Minnesota Intermediate Fund if redeemed within the first year, provided that Delaware Distributors, L.P. (DDLP) paid a financial advisor a commission on the purchase of those shares. Class B shares may be purchased only through dividend reinvestment and certain permitted exchanges. Prior to June 1, 2007, Class B shares were sold with a CDSC that declined from 4% to zero for Delaware Tax-Free Minnesota Fund and Delaware Minnesota High-Yield Municipal Bond Fund, and declined from 2% to zero for Delaware Tax-Free Minnesota Intermediate Fund depending upon the period of time the shares were held. Class B shares will automatically convert to Class A shares on a quarterly basis approximately eight years after purchase for Delaware Tax-Free Minnesota Fund and Delaware Minnesota High-Yield Municipal Bond Fund and approximately five years after purchase for Delaware Tax-Free Minnesota Intermediate Fund. Class C shares are sold with a CDSC of 1%, if redeemed during the first twelve months.
The investment objective of Delaware Tax-Free Minnesota Fund is to seek as high a level of current income exempt from federal income tax and from the Minnesota state personal income tax, as is consistent with preservation of capital.
The investment objective of Delaware Tax-Free Minnesota Intermediate Fund is to seek to provide investors with preservation of capital and, secondarily, current income exempt from federal income tax and the Minnesota state personal income tax, by maintaining a dollar-weighted average effective portfolio maturity of 10 years or less.
The investment objective of Delaware Minnesota High-Yield Municipal Bond Fund is to seek as high a level of current income exempt from federal income tax and the Minnesota state personal income tax, primarily through investment in medium- and lower-grade municipal obligations.
78
1. Significant Accounting Policies
The following accounting policies are in accordance with U.S. generally accepted accounting principles and are consistently followed by the Funds.
Security Valuation — Debt securities and interest rate swap contracts are valued by an independent pricing service or broker. To the extent current market prices are not available, the pricing service may take into account developments related to the specific security, as well as transactions in comparable securities. Open-end investment companies are valued at their published net asset value. Generally, other securities and assets for which market quotations are not readily available are valued at fair value as determined in good faith under the direction of each Fund’s Boards of Trustees (each, a “Board” and collectively, the “Boards”). In determining whether market quotations are readily available or fair valuation will be used, various factors will be taken into consideration, such as market closures or suspension of trading in a security.
Federal Income Taxes — No provision for federal income taxes has been made as each Fund intends to continue to qualify for federal income tax purposes as a regulated investment company under Subchapter M of the Internal Revenue Code of 1986, as amended, and make the requisite distributions to shareholders. The Funds evaluate tax positions taken or expected to be taken in the course of preparing the Funds’ tax returns to determine whether the tax positions are “more-likely-than-not” of being sustained by the applicable tax authority. Tax positions not deemed to meet the more-likely-than-not threshold are recorded as a tax benefit or expense in the current year. Management has analyzed the Funds’ tax positions taken on federal income tax returns for all open tax years (tax years ended August 31, 2006-August 31, 2009), and has concluded that no provision for federal income tax is required in the Funds’ financial statements.
Class Accounting — Investment income and common expenses are allocated to the various classes of the Funds on the basis of “settled shares” of each class in relation to the net assets of the Funds. Realized and unrealized gain (loss) on investments are allocated to the various classes of the Funds on the basis of daily net assets of each class. Distribution expenses relating to a specific class are charged directly to that class.
Interest and Related Expenses — Interest and related expenses include, but are not limited to, interest expense, remarketing fees, liquidity fees, and trustees’ fees from Delaware Tax-Free Minnesota Fund’s participation in inverse floater programs where the Fund has transferred its own bonds to a trust that issues floating rate securities with an aggregate principal amount equal to the principal of the transferred bonds. In conveyance of the bond, a Fund receives the inverse floating rate securities and cash from the trust. As a result of certain rights retained by the Fund, the transfer of the bond is not considered a sale, but rather a form of financing for accounting purposes whereby the cash received is recorded as a liability and interest expense is recorded based on the interest rate of the floating rate securities. Remarketing fees, liquidity fees, and trustees’ fees expenses are recorded on the accrual basis.
79
Notes to financial statements
Delaware Minnesota Municipal Bond Funds
1. Significant Accounting Policies (continued)
Delaware Tax-Free Minnesota Fund sold out of its inverse floater positions on September 29, 2008. For the period ended September 29, 2008, the Fund had an average daily liability from the participation in inverse floater programs of $17,120,000 and recorded interest expense at an average rate of 3.47%.
Use of Estimates — The preparation of financial statements in conformity with U.S. generally accepted accounting principles requires management to make estimates and assumptions that affect the reported amounts of assets and liabilities at the date of the financial statements and the reported amounts of revenues and expenses during the reporting period. Actual results could differ from those estimates.
Other — Expenses directly attributable to the Funds are charged directly to the Funds. Other expenses common to various funds within the Delaware Investments® Family of Funds are generally allocated amongst such funds on the basis of average net assets. Management fees and some other expenses are paid monthly. Security transactions are recorded on the date the securities are purchased or sold (trade date) for financial reporting purposes. Costs used in calculating realized gains and losses on the sale of investment securities are those of the specific securities sold. Interest income is recorded on the accrual basis. Discounts and premiums are amortized to interest income over the lives of the respective securities. Each Fund declares dividends daily from net investment income and pays such dividends monthly and declares and pays distributions from net realized gain on investments, if any, annually.
The Funds may receive earnings credits from their custodian when positive cash balances are maintained, which are used to offset custody fees. The expense paid under this arrangement is included in custodian fees on the statements of operations with the corresponding expense offset shown as “expense paid indirectly.”
80
2. Investment Management, Administration Agreements and Other Transactions with Affiliates
In accordance with the terms of its respective investment management agreement, each Fund pays Delaware Management Company (DMC), a series of Delaware Management Business Trust and the investment manager, an annual fee, which is calculated based on each Fund’s average daily net assets as follows:
| Delaware Tax-Free | Delaware Minnesota | |||||
| Delaware Tax-Free | Minnesota | High-Yield Municipal | ||||
| Minnesota Fund | Intermediate Fund | Bond Fund | ||||
| On the first $500 million | 0.550% | 0.500% | 0.550% | |||
| On the next $500 million | 0.500% | 0.475% | 0.500% | |||
| On the next $1.5 billion | 0.450% | 0.450% | 0.450% | |||
| In excess of $2.5 billion | 0.425% | 0.425% | 0.425% |
DMC has contractually agreed to waive that portion, if any, of its management fee and reimburse each Fund to the extent necessary to ensure that total annual operating expenses (excluding any 12b-1 plan expenses, taxes, interest, inverse floater program expenses, brokerage fees, certain insurance costs and nonroutine expenses or costs including, but not limited to, those relating to reorganizations, litigation, conducting shareholder meetings, and liquidations (collectively, “nonroutine expenses”)) do not exceed specified percentages of average daily net assets as shown below. For purposes of these waivers and reimbursements, nonroutine expenses may also include such additional costs and expenses, as may be agreed upon from time to time by each Fund’s Board and DMC. These expense waivers and reimbursements apply only to expenses paid directly by the Funds.
| Delaware Tax-Free | Delaware Minnesota | |||||
| Delaware Tax Free | Minnesota | High-Yield Municipal | ||||
| Minnesota Fund | Intermediate Fund | Bond Fund | ||||
| Operating expense limitation | ||||||
| as a percentage of average | ||||||
| daily net assets (per annum) | 0.67% | 0.60% | 0.64% | |||
| Expiration date | 12/31/09 | 12/31/09 | 12/31/09 |
Prior to January 1, 2009, DMC had contractually agreed to waive that portion, if any, of Delaware Tax-Free Minnesota Fund’s management fees and reimburse the Fund to the extent necessary to ensure that total annual operating expenses (excluding any 12b-1 plan expenses, taxes, interest, inverse floater program expenses, brokerage fees, certain insurance costs and nonroutine expenses) did not exceed 0.68% of average daily net assets.
81
Notes to financial statements
Delaware Minnesota Municipal Bond Funds
2. Investment Management, Administration Agreements and Other Transactions with Affiliates (continued)
Delaware Service Company, Inc. (DSC), an affiliate of DMC, provides fund accounting and financial administration oversight services to the Funds. For these services, the Funds pay DSC fees based on the aggregate daily net assets of the Delaware Investments® Family of Funds at the following annual rate: 0.0050% of the first $30 billion; 0.0045% of the next $10 billion; 0.0040% of the next $10 billion; and 0.0025% of aggregate average daily net assets in excess of $50 billion. The fees payable to DSC under the service agreement described above are allocated among all Funds in the Delaware Investments Family of Funds on a relative net asset value basis. For the year August 31, 2009, each Fund was charged for these services as follows:
| Delaware Tax-Free | Delaware Minnesota | ||||
| Delaware Tax-Free | Minnesota | High-Yield Municipal | |||
| Minnesota Fund | Intermediate Fund | Bond Fund | |||
| $29,413 | $3,721 | $6,638 |
DSC also provides dividend disbursing and transfer agency services. Each Fund pays DSC a monthly fee based on the number of shareholder accounts for dividend disbursing and transfer agent services.
Pursuant to a distribution agreement and distribution plan, each Fund pays DDLP, the distributor and an affiliate of DMC, an annual distribution and service fee not to exceed 0.25% of the average daily net assets of the Class A shares and 1.00% of the average daily net assets of the Class B and C shares. DDLP has contracted to limit Delaware Tax-Free Minnesota Intermediate Fund’s Class A Shares 12b-1 fees through December 31, 2009 to no more than 0.15% of average daily net assets.
At August 31, 2009, the Funds had liabilities payable to affiliates as follows:
| Delaware Tax-Free | Delaware Minnesota | |||||||||||
| Delaware Tax-Free | Minnesota | High-Yield Municipal | ||||||||||
| Minnesota Fund | Intermediate Fund | Bond Fund | ||||||||||
| Investment management fee | ||||||||||||
| payable to DMC | $266,827 | $16,281 | $55,037 | |||||||||
| Dividend disbursing, transfer | ||||||||||||
| agent and fund accounting | ||||||||||||
| oversight fees and other | ||||||||||||
| expenses payable to DSC | 19,019 | 3,620 | 5,628 | |||||||||
| Distribution fees payable | ||||||||||||
| to DDLP | 155,211 | 19,182 | 47,789 | |||||||||
| Other expenses payable to | ||||||||||||
| DMC and affiliates* | 10,192 | 1,309 | 2,303 | |||||||||
*DMC, as part of its administrative services, pays operating expenses on behalf of each Fund and is reimbursed on a periodic basis. Such expenses include items such as printing of shareholder reports, fees for audit, legal and tax services, registration fees and trustees’ fees.
82
As provided in the investment management agreement, each Fund bears the cost of certain legal and tax services, including internal legal and tax services provided to the Funds by DMC and/or its affiliates’ employees. For the year ended August 31, 2009, each Fund was charged for internal legal and tax services provided by DMC and/or its affiliates’ employees as follows:
| Delaware Tax-Free | Delaware Minnesota | ||||
| Delaware Tax-Free | Minnesota | High-Yield Municipal | |||
| Minnesota Fund | Intermediate Fund | Bond Fund | |||
| $48,348 | $6,541 | $11,392 |
For the year ended August 31, 2009, DDLP earned commissions on sales of Class A shares for each Fund as follows:
| Delaware Tax-Free | Delaware Minnesota | ||||
| Delaware Tax-Free | Minnesota | High-Yield Municipal | |||
| Minnesota Fund | Intermediate Fund | Bond Fund | |||
| $60,294 | $13,727 | $18,152 |
For the year ended August 31, 2009, DDLP received gross CDSC commissions on redemption of each Fund’s Class A, Class B and Class C shares, respectively, and these commissions were entirely used to offset up-front commissions previously paid by DDLP to broker-dealers on sales of those shares. The amounts received were as follows:
| Delaware Tax-Free | Delaware Minnesota | ||||||||||
| Delaware Tax-Free | Minnesota | High-Yield Municipal | |||||||||
| Minnesota Fund | Intermediate Fund | Bond Fund | |||||||||
| Class A | $ | — | $ | — | $ | — | |||||
| Class B | 2,602 | 87 | 6,127 | ||||||||
| Class C | 3,769 | 1,033 | 2,532 | ||||||||
Trustees’ fees include expenses accrued by the Funds for each Trustee’s retainer and meeting fees. Certain officers of DMC, DSC and DDLP are officers and/or Trustees of the Trusts. These officers and Trustees are paid no compensation by the Funds.
3. Investments
For the year ended August 31, 2009, the Funds made purchases and sales of investment securities other than short-term investments as follows:
| Delaware Tax-Free | Delaware Minnesota | ||||||||||
| Delaware Tax-Free | Minnesota | High-Yield Municipal | |||||||||
| Minnesota Fund | Intermediate Fund | Bond Fund | |||||||||
| Purchases | $ | 117,187,912 | $ | 30,023,863 | $ | 15,533,627 | |||||
| Sales | 129,099,226 | 8,518,520 | 24,026,066 | ||||||||
83
Notes to financial statements
Delaware Minnesota Municipal Bond Funds
3. Investments (continued)
At August 31, 2009, the cost of investments and unrealized appreciation (depreciation) for federal income tax purposes for each Fund were as follows:
| Delaware Tax-Free | Delaware Minnesota | |||||||||||
| Delaware Tax-Free | Minnesota | High-Yield Municipal | ||||||||||
| Minnesota Fund | Intermediate Fund | Bond Fund | ||||||||||
| Cost of investments | $ | 582,550,674 | $ | 85,069,982 | $ | 139,257,332 | ||||||
| Aggregate unrealized appreciation | $ | 32,410,416 | $ | 3,644,328 | $ | 3,960,202 | ||||||
| Aggregate unrealized depreciation | (15,221,805 | ) | (666,018 | ) | (8,318,281 | ) | ||||||
| Net unrealized appreciation | ||||||||||||
| (depreciation) | $ | 17,188,611 | $ | 2,978,310 | $ | (4,358,079 | ) | |||||
Effective September 1, 2008, the Funds adopted Financial Accounting Standards No. 157, Fair Value Measurements (FAS 157). FAS 157 defines fair value as the price that each Fund would receive to sell an asset or pay to transfer a liability in an orderly transaction between market participants at the measurement date under current market conditions. FAS 157 also establishes a framework for measuring fair value and a three level hierarchy for fair value measurements based upon the transparency of inputs to the valuation of an asset or liability. Inputs may be observable or unobservable and refer broadly to the assumptions that market participants would use in pricing the asset or liability. Observable inputs reflect the assumptions market participants would use in pricing the asset or liability based on market data obtained from sources independent of the reporting entity. Unobservable inputs reflect the reporting entity’s own assumptions about the assumptions that market participants would use in pricing the asset or liability developed based on the best information available under the circumstances. Each Fund’s investment in its entirety is assigned a level based upon the observability of the inputs which are significant to the overall valuation. The three-tier hierarchy of inputs is summarized below.
Level 1 – inputs are quoted prices in active markets
Level 2 – inputs are observable, directly or indirectly
Level 3 – inputs are unobservable and reflect assumptions on the part of the reporting entity
84
The following table summarizes the valuation of the Funds’ investments by the FAS 157 fair value hierarchy levels as of August 31, 2009:
| Delaware Tax-Free Minnesota Fund | ||||||
| Level 1 | Level 2 | Total | ||||
| Municipal Bonds | $ | — | $599,185,465 | $599,185,465 | ||
| Short-Term | 553,820 | — | 553,820 | |||
| Total | $ | 553,820 | $599,185,465 | $599,739,285 | ||
| Delaware Tax-Free Minnesota Intermediate Fund | ||||||
| Level 1 | Level 2 | Total | ||||
| Municipal Bonds | $ | — | $87,758,513 | $87,758,513 | ||
| Short-Term | 289,779 | — | 289,779 | |||
| Total | $ | 289,779 | $87,758,513 | $88,048,292 | ||
| Delaware Minnesota High-Yield Municipal Bond Fund | ||||||
| Level 1 | Level 2 | Total | ||||
| Municipal Bonds | $ | — | $134,849,032 | $134,849,032 | ||
| Short-Term | 50,221 | — | 50,221 | |||
| Total | $ | 50,221 | $134,849,032 | $134,899,253 | ||
There were no Level 3 securities at the beginning or end of the period.
4. Dividend and Distribution Information
Income and long-term capital gain distributions are determined in accordance with federal income tax regulations, which may differ from U.S. generally accepted accounting principles. Additionally, distributions from net short-term gains on sales of investment securities are treated as ordinary income for federal income tax purposes. The tax character of dividends and distributions paid during the years ended August 31, 2009 and 2008 was as follows:
| Delaware Tax-Free | Delaware Minnesota | |||||||||||||
| Delaware Tax-Free | Minnesota | High-Yield Municipal | ||||||||||||
| Minnesota Fund | Intermediate Fund | Bond Fund | ||||||||||||
| Year Ended 8/31/09 | ||||||||||||||
| Ordinary income | $ | 71,606 | $ | — | $ | 5,947 | ||||||||
| Tax-exempt income | 23,418,382 | 2,616,042 | 5,725,369 | |||||||||||
| Long-term capital gain | 2,292,135 | — | — | |||||||||||
| Total | $ | 25,782,123 | $ | 2,616,042 | $ | 5,731,316 | ||||||||
| Year Ended 8/31/08 | ||||||||||||||
| Ordinary income | $ | 351,958 | $ | — | $ | 7,114 | ||||||||
| Tax-exempt income | 24,713,343 | 2,197,419 | 5,742,991 | |||||||||||
| Long-term capital gain | 100,607 | — | — | |||||||||||
| Total | $ | 25,165,908 | $ | 2,197,419 | $ | 5,750,105 | ||||||||
85
Notes to financial statements
Delaware Minnesota Municipal Bond Funds
5. Components of Net Assets on a Tax Basis
As of August 31, 2009, the components of net assets on a tax basis were as follows:
| Delaware Tax-Free Minnesota Fund | Delaware Tax-Free Minnesota Intermediate Fund | Delaware Minnesota High-Yield Municipal Bond Fund | ||||||||||||||||
| Shares of beneficial interest | $ | 586,243,181 | $ | 87,643,637 | $ | 146,927,304 | ||||||||||||
| Distributions payable | (572,839 | ) | (65,641 | ) | (137,858 | ) | ||||||||||||
| Undistributed tax-exempt income | 427,967 | 68,163 | 137,955 | |||||||||||||||
| Capital loss carryforwards | — | (775,769 | ) | (1,409,732 | ) | |||||||||||||
| Post-October losses | (214,415 | ) | (235,122 | ) | (3,473,192 | ) | ||||||||||||
| Unrealized appreciation (depreciation) | ||||||||||||||||||
| of investments | 17,188,611 | 2,978,310 | (4,358,079 | ) | ||||||||||||||
| Net assets | $ | 603,072,505 | $ | 89,613,578 | $ | 137,686,398 | ||||||||||||
The differences between book basis and tax basis components of net assets are primarily attributable to tax treatment of market discount on debt instruments.
Post-October losses represent losses realized on investment transactions from November 1, 2008 through August 31, 2009 that, in accordance with federal income tax regulations, each Fund has elected to defer and treat as having arisen in the following year.
For financial reporting purposes, capital accounts are adjusted to reflect the tax character of permanent book/tax differences. Reclassifications are primarily due to tax treatment of market discount on certain debt instruments, tax character of distributions, and expiration of capital loss carryforwards. Results of operations and net assets were not affected by these reclassifications. For the year ended August 31, 2009, the Funds recorded the following reclassifications:
| Delaware Tax-Free Minnesota Fund | Delaware Tax-Free Minnesota Intermediate Fund | Delaware Minnesota High-Yield Municipal Bond Fund | ||||||||||||||||
| Undistributed (Distributions in excess of) | ||||||||||||||||||
| net investment income | $ | (166,531 | ) | $ | 2,041 | $ | (12,323 | ) | ||||||||||
| Accumulated realized gain (loss) | 166,531 | 1,021,754 | 1,279,875 | |||||||||||||||
| Paid-in capital | — | (1,023,795 | ) | (1,267,552 | ) | |||||||||||||
86
For federal income tax purposes, capital loss carryforwards may be carried forward and applied against future capital gains. In 2009, $1,023,795 and $1,267,552 of capital loss carryforwards expired for Delaware Tax-Free Minnesota Intermediate Fund and Delaware Minnesota High-Yield Bond Fund respectively. Capital loss carryforwards remaining at August 31, 2009 will expire as follows:
| Year of Expiration | Delaware Tax-Free Minnesota Intermediate Fund | Delaware Minnesota High-Yield Municipal Bond Fund | |||||||||
| 2010 | $ | 4,037 | $ | 57,521 | |||||||
| 2011 | 246,659 | 243,334 | |||||||||
| 2012 | — | 684,248 | |||||||||
| 2014 | 81,340 | — | |||||||||
| 2015 | 109,745 | 96,079 | |||||||||
| 2016 | — | 198,826 | |||||||||
| 2017 | 333,988 | 129,724 | |||||||||
| Total | $ | 775,769 | $ | 1,409,732 | |||||||
6. Capital Shares
Transactions in capital shares were as follows:
| Delaware Tax- Free Minnesota Fund | Delaware Tax-Free Minnesota Intermediate Fund | Delaware Minnesota High-Yield Municipal Bond Fund | ||||||||||||||||
| Year Ended | Year Ended | Year Ended | ||||||||||||||||
| 8/31/09 | 8/31/08 | 8/31/09 | 8/31/08 | 8/31/09 | 8/31/08 | |||||||||||||
| Shares sold: | ||||||||||||||||||
| Class A | 3,674,457 | 3,515,951 | 2,423,967 | 1,344,904 | 1,614,974 | 2,904,516 | ||||||||||||
| Class B | 11,946 | 9,707 | 2,214 | 21,281 | 7,863 | 5,135 | ||||||||||||
| Class C | 807,342 | 434,456 | 486,526 | 249,737 | 281,808 | 746,020 | ||||||||||||
| Shares issued upon reinvestment of dividends and distributions: | ||||||||||||||||||
| Class A | 1,360,233 | 1,268,411 | 143,180 | 128,039 | 317,830 | 304,335 | ||||||||||||
| Class B | 22,511 | 25,099 | 1,215 | 2,715 | 12,919 | 13,584 | ||||||||||||
| Class C | 68,882 | 56,937 | 16,111 | 11,896 | 68,762 | 68,076 | ||||||||||||
| 5,945,371 | 5,310,561 | 3,073,213 | 1,758,572 | 2,304,156 | 4,041,666 | |||||||||||||
| Shares repurchased: | ||||||||||||||||||
| Class A | (6,565,859 | ) | (4,868,284 | ) | (810,239 | ) | (587,645 | ) | (2,739,090 | ) | (2,293,959 | ) | ||||||
| Class B | (210,875 | ) | (366,181 | ) | (58,625 | ) | (100,502 | ) | (107,260 | ) | (148,220 | ) | ||||||
| Class C | (349,626 | ) | (420,993 | ) | (126,181 | ) | (62,535 | ) | (738,199 | ) | (485,164 | ) | ||||||
| (7,126,360 | ) | (5,655,458 | ) | (995,045 | ) | (750,682 | ) | (3,584,549 | ) | (2,927,343 | ) | |||||||
| Net increase (decrease) | (1,180,989 | ) | (344,897 | ) | 2,078,168 | 1,007,890 | (1,280,393 | ) | 1,114,323 | |||||||||
87
Notes to financial statements
Delaware Minnesota Municipal Bond Funds
6. Capital Shares (continued)
For the years ended August 31, 2009 and 2008, the following shares and values were converted from Class B to Class A shares. The respective amounts are included in Class B redemptions and Class A subscriptions in the table above and the statements of changes in net assets.
| Year Ended 8/31/09 | Year Ended 8/31/08 | |||||||||||||||||||||||||
| Class B Shares | Class A Shares | Value | Class B Shares | Class A Shares | Value | |||||||||||||||||||||
| Delaware Tax-Free | ||||||||||||||||||||||||||
| Minnesota Fund | 97,466 | 97,549 | $ | 1,145,062 | 154,023 | 154,149 | $ | 1,885,460 | ||||||||||||||||||
| Delaware Tax-Free Minnesota | ||||||||||||||||||||||||||
| Intermediate Fund | 39,832 | 39,916 | 410,681 | 92,028 | 92,254 | 987,599 | ||||||||||||||||||||
| Delaware Minnesota High-Yield | ||||||||||||||||||||||||||
| Municipal Bond Fund | 38,299 | 38,350 | 356,368 | 56,661 | 56,758 | 583,786 | ||||||||||||||||||||
7. Line of Credit
Each Fund, along with certain other funds in the Delaware Investments® Family of Funds (Participants), was a participant in a $225,000,000 revolving line of credit with The Bank of New York Mellon (BNY Mellon) to be used for temporary or emergency purposes as an additional source of liquidity to fund redemptions of investor shares. Under the agreement, the Participants were charged an annual commitment fee, which was allocated across the Participants on the basis of each Participant’s allocation of the entire facility. Participants were permitted to borrow up to a maximum of one third of their net assets under the agreement. The agreement expired on November 18, 2008.
Effective November 18, 2008, the Funds, along with the other Participants, entered into an amendment to the agreement with BNY Mellon for a $35,000,000 revolving line of credit. The agreement, as amended, is to be used as described above and operates in substantially the same manner as the original agreement. The agreement, as amended, expires on November 17, 2009. The Funds had no amounts outstanding as of August 31, 2009 or at any time during the year then ended.
8. Derivatives
Each Fund applies Financial Accounting Standards No. 161, Disclosures about Derivative Instruments and Hedging Activities (FAS 161). FAS 161 is intended to improve financial reporting about derivative instruments by requiring enhanced disclosures that enable investors to understand: 1) how and why an entity uses derivatives, 2) how they are accounted for, and 3) how they affect an entity’s results of operations and financial position.
Inverse Floaters — The Funds may participate in inverse floater programs where a Fund transfers its own bonds to a trust that issues floating rate securities and inverse floating rate securities (inverse floaters) with an aggregate principal amount equal to the principal of the transferred bonds. The inverse floaters received by the Funds are derivative tax-exempt obligations with floating or variable interest rates that move in the opposite direction of short-term interest
88
rates, usually at an accelerated speed. Consequently, the market values of the inverse floaters will generally be more volatile than other tax-exempt investments. The Funds typically use inverse floaters to adjust the duration of its portfolio. Duration measures a portfolio’s sensitivity to changes in interest rates. By holding inverse floaters with a different duration than the underlying bonds that a Fund transferred to the trust, the Fund seeks to adjust its portfolio’s sensitivity to changes in interest rates. The Funds may also invest in inverse floaters to add additional income to the Funds or to adjust the Funds’ exposure to a specific segment of the yield curve. At August 31, 2009, the Funds held no investments in inverse floaters.
Swap Contracts — The Funds may enter into interest rate swap contracts, index swap contracts and Credit Default Swap (CDS) contracts in the normal course of pursing their investment objectives. The Funds may use interest rate swaps to adjust the Funds’ sensitivity to interest rates or to hedge against changes in interest rates. Index swaps may be used to gain exposure to markets that each Fund invests in, such as the corporate bond market. The Funds may also use index swaps as a substitute for futures or options contracts if such contracts are not directly available to the Funds on favorable terms. The Funds may enter into CDS contracts in order to hedge against a credit event, to enhance total return or to gain exposure to certain securities or markets.
Interest Rate Swaps. An interest rate swap involves payments received by the Funds from another party based on a variable or floating interest rate, in return for making payments based on a fixed interest rate. An interest rate swap can also work in reverse with the Funds receiving payments based on a fixed interest rate and making payments based on a variable or floating interest rate. Interest rate swaps may be used to adjust the Funds’ sensitivity to interest rates or to hedge against changes in interest rates. Periodic payments on such contracts are accrued daily and recorded as unrealized appreciation/depreciation on swap contracts. Upon periodic payment/ receipt or termination of the contract, such amounts are recorded as realized gains or losses on swap contracts. A Fund’s maximum risk of loss from counterparty credit risk is the discounted net value of the cash flows to be received from/paid to the counterparty over the interest rate swap contract’s remaining life, to the extent that the amount is positive. This risk is mitigated by having a netting arrangement between the Funds and the counterparty and by the posting of collateral by the counterparty to the Funds to cover the Funds’ exposure to the counterparty.
During the year ended August 31, 2009, the Funds did not enter into index swap contracts or CDS contracts.
Swaps Generally. Because there is no organized market for swap contracts, the value of open swaps may differ from that which would be realized in the event each Fund terminated its position in the agreement. Risks of entering into these contracts include the potential inability of the counterparty to meet the terms of the contracts. This type of risk is generally limited to the amount of favorable movement in the value of the underlying security, instrument or basket of instruments, if any, at the day of default. Risks also arise from potential losses from adverse market movements and such losses could exceed the unrealized amounts. The Funds did not hold any swap contracts at the end of the year.
89
Notes to financial statements
Delaware Minnesota Municipal Bond Funds
9. Credit and Market Risk
The Funds concentrate their investments in securities issued by municipalities, mainly in Minnesota. The value of these investments may be adversely affected by new legislation within the state, regional or local economic conditions, and differing levels of supply and demand for municipal bonds. Many municipalities insure repayment for their obligations. Although bond insurance reduces the risk of loss due to default by an issuer, such bonds remain subject to the risk that market value may fluctuate for other reasons and there is no assurance that the insurance company will meet its obligations. A real or perceived decline in creditworthiness of a bond insurer can have an adverse impact on the value of insured bonds held in each Fund. At August 31, 2009, the percentage of each Fund’s net assets insured by insurers are listed below:
| Delaware Tax-Free Minnesota Fund | Delaware Tax-Free Minnesota Intermediate Fund | Delaware Minnesota High-Yield Municipal Bond Fund | |||||
| 28 | % | 23 | % | 15 | % | ||
These securities have been identified in the statements of net assets.
The Funds invest a portion of their assets in high yield fixed income securities, which carry ratings of BB or lower by Standard & Poor’s Ratings Group (S&P) and/or Ba or lower by Moody’s Investors Service, Inc. (Moody’s). Investments in these higher yielding securities are generally accompanied by a greater degree of credit risk than higher rated securities. Additionally, lower rated securities may be more susceptible to adverse economic and competitive industry conditions than investment grade securities.
The Funds may invest in advanced refunded bonds, escrow secured bonds or defeased bonds. Under current federal tax laws and regulations, state and local government borrowers are permitted to refinance outstanding bonds by issuing new bonds. The issuer refinances the outstanding debt to either reduce interest costs or to remove or alter restrictive covenants imposed by the bonds being refinanced. A refunding transaction where the municipal securities are being refunded within 90 days from the issuance of the refunding issue is known as a “current refunding.” “Advance refunded bonds” are bonds in which the refunded bond issue remains outstanding for more than 90 days following the issuance of the refunding issue. In an advance refunding, the issuer will use the proceeds of a new bond issue to purchase high grade interest bearing debt securities which are then deposited in an irrevocable escrow account held by an escrow agent to secure all future payments of principal and interest and bond premium of the advance refunded bond. Bonds are “escrowed to maturity” when the proceeds of the refunding issue are deposited in an escrow account for investment sufficient to pay all of the principal and interest on the original interest payment and maturity dates.
Bonds are considered “pre-refunded” when the refunding issue’s proceeds are escrowed only until a permitted call date or dates on the refunded issue with the refunded issue being redeemed at the time, including any required premium. Bonds become “defeased” when the rights and interests
90
of the bondholders and of their lien on the pledged revenues or other security under the terms of the bond contract and are substituted with an alternative source of revenues (the escrow securities) sufficient to meet payments of principal and interest to maturity or to the first call dates. Escrowed secured bonds will often receive a rating of AAA from Moody’s, S&P, and/or Fitch Ratings (Fitch) due to the strong credit quality of the escrow securities and the irrevocable nature of the escrow deposit agreement.
Each Fund may invest up to 15% of its net assets in illiquid securities, which may include securities with contractual restrictions on resale, securities exempt from registration under Rule 144A of the Securities Act of 1933, as amended, and other securities which may not be readily marketable. The relative illiquidity of these securities may impair each Fund from disposing of them in a timely manner and at a fair price when it is necessary or desirable to do so. While maintaining oversight, each Fund’s Board has delegated to DMC the day-to-day functions of determining whether individual securities are liquid for purposes of each Fund’s limitation on investments in illiquid assets. Securities eligible for resale pursuant to Rule 144A, which are determined to be liquid, are not subject to the Funds’ 15% limit on investments in illiquid securities. As of August 31, 2009, there were no Rule 144A securities. Illiquid securities have been identified on the statements of net assets.
10. Contractual Obligations
The Funds enter into contracts in the normal course of business that contain a variety of indemnifications. The Funds’ maximum exposure under these arrangements is unknown. However, the Funds have not had prior claims or losses pursuant to these contracts. Management has reviewed each Fund’s existing contracts and expects the risk of loss to be remote.
11. Sale of Delaware Investments to Macquarie Group
On August 18, 2009, Lincoln National Corporation (the parent company of Delaware Investments) and Macquarie Group (Macquarie) entered into an agreement pursuant to which Delaware Investments, including DMC, DDLP and DSC, will be acquired by Macquarie, an Australia-based global provider of banking, financial, advisory, investment and funds management services (the Transaction). Upon completion of the Transaction, DMC, DDLP and DSC will be wholly-owned subsidiaries of Macquarie.
The Transaction will result in a change of control of DMC which, in turn, will cause the termination of the investment advisory agreement between DMC and the Funds. As a result, a Special Meeting of Shareholders (the Meeting) of the Funds will be scheduled for the purpose of asking shareholders to approve a new investment advisory agreement between DMC and the Funds (the New Agreement). If approved by shareholders, the New Agreement will take effect upon the closing of the Transaction, which is currently anticipated to occur in the fourth quarter of 2009. Shareholders of the Funds will receive proxy materials including more detailed information about the Meeting, the Transaction and the proposed New Agreement.
91
Notes to financial statements
Delaware Minnesota Municipal Bond Funds
12. Subsequent Events
Effective August 31, 2009, the Funds adopted Financial Accounting Standards Board Statement of Financial Accounting Standards No. 165, Subsequent Events (FAS 165). In accordance with FAS 165, management has evaluated whether any events or transactions occurred subsequent to August 31, 2009 through October 19, 2009, the date of issuance of the Funds’ financial statements, and determined that there were no material events or transactions other than those already disclosed that would require recognition or disclosure in the Funds’ financial statements.
13. Tax Information (Unaudited)
The information set forth below is for each Fund’s fiscal year as required by federal income tax laws. Shareholders, however, must report distributions on a calendar year basis for income tax purposes, which may include distributions for portions of two fiscal years of a Fund. Accordingly, the information needed by shareholders for income tax purposes will be sent to them in January of each year. Please consult your tax advisor for proper treatment of this information.
For the fiscal year ended August 31, 2009, each Fund designates distributions paid during the year as follows:
| (A) Long-Term Capital Gains Distributions (Tax Basis) | (B) Ordinary Income Distributions (Tax Basis) | (C) Tax-Exempt Distributions (Tax Basis) | Total Distributions (Tax Basis) | |||||||||||||||||
| Delaware Tax-Free | ||||||||||||||||||||
| Minnesota Fund | 8.89 | % | 0.28 | % | 90.83 | % | 100.00 | % | ||||||||||||
| Delaware Tax-Free Minnesota | ||||||||||||||||||||
| Intermediate Fund | — | — | 100.00 | % | 100.00 | % | ||||||||||||||
| Delaware Minnesota High-Yield | ||||||||||||||||||||
| Municipal Bond Fund | — | 0.10 | % | 99.90 | % | 100.00 | % | |||||||||||||
(A), (B), and (C) are based on a percentage of each Fund’s total distributions.
92
Report of independent
registered public accounting firm
To the Shareholders and Board of Trustees
Voyageur Tax-Free Funds — Delaware Tax-Free Minnesota Fund
Voyageur Intermediate Tax-Free Funds — Delaware Tax-Free Minnesota Intermediate Fund
Voyageur Mutual Funds — Delaware Minnesota High-Yield Municipal Bond Fund
We have audited the accompanying statements of net assets of Delaware Tax-Free Minnesota Fund (the sole series of Voyageur Tax-Free Funds), Delaware Tax-Free Minnesota Intermediate Fund (the sole series of Voyageur Intermediate Tax-Free Funds), and Delaware Minnesota High-Yield Municipal Bond Fund (one of the series constituting Voyageur Mutual Funds) (the “Funds”) as of August 31, 2009, and the related statements of operations for the year then ended, the statements of changes in net assets for each of the two years in the period then ended, and the financial highlights for each of the five years in the period then ended. These financial statements and financial highlights are the responsibility of the Funds’ management. Our responsibility is to express an opinion on these financial statements and financial highlights based on our audits.
We conducted our audits in accordance with the standards of the Public Company Accounting Oversight Board (United States). Those standards require that we plan and perform the audit to obtain reasonable assurance about whether the financial statements and financial highlights are free of material misstatement. We were not engaged to perform an audit of the Funds’ internal control over financial reporting. Our audits included consideration of internal control over financial reporting as a basis for designing audit procedures that are appropriate in the circumstances, but not for the purpose of expressing an opinion on the effectiveness of the Funds’ internal control over financial reporting. Accordingly, we express no such opinion. An audit also includes examining, on a test basis, evidence supporting the amounts and disclosures in the financial statements and financial highlights, assessing the accounting principles used and significant estimates made by management, and evaluating the overall financial statement presentation. Our procedures included confirmation of securities owned as of August 31, 2009 by correspondence with the custodian and brokers or by other appropriate auditing procedures where replies from brokers were not received. We believe that our audits provide a reasonable basis for our opinion.
In our opinion, the financial statements and financial highlights referred to above present fairly, in all material respects, the financial position of the Delaware Tax-Free Minnesota Fund of Voyageur Tax-Free Funds, the Delaware Tax-Free Minnesota Intermediate Fund of Voyageur Intermediate Tax-Free Funds, and the Delaware Minnesota High-Yield Municipal Bond Fund of Voyageur Mutual Funds at August 31, 2009, the results of their operations for the year then ended, the changes in their net assets for each of the two years in the period then ended, and their financial highlights for each of the five years in the period then ended, in conformity with U.S. generally accepted accounting principles.

Philadelphia, Pennsylvania
October 19, 2009
93
Other Fund information
(Unaudited)
Delaware Minnesota Municipal Bond Funds
Board Consideration of Delaware Tax-Free Minnesota Fund, Delaware Tax-Free Minnesota Intermediate Fund and Delaware Minnesota High-Yield Municipal Bond Fund Investment Advisory Agreements
At a meeting held on May 19-21, 2009 (the “Annual Meeting”), the Board of Trustees (the “Board”), including a majority of disinterested or independent Trustees, approved the renewal of the Investment Advisory Agreements for the Delaware Tax-Free Minnesota Fund, Delaware Tax-Free Minnesota Intermediate Fund and Delaware Minnesota High-Yield Municipal Bond Fund (each, a “Fund” and together, the “Funds”). In making its decision, the Board considered information furnished specifically in connection with the renewal of the Investment Advisory Agreements with Delaware Management Company (“DMC”), which included materials provided by DMC and its affiliates (“Delaware Investments”) concerning, among other things, the nature, extent and quality of services provided to the Funds, the costs of such services to the Funds, economies of scale and the financial condition and profitability of Delaware Investments. Reference was made to information furnished at regular quarterly Board meetings, including reports detailing Fund performance, investment strategies and expenses, as well as information prepared specifically in connection with the renewal of the investment advisory and sub-advisory contracts. In addition, in connection with the Annual Meeting, reports were provided in February 2009 and included independent historical and comparative reports prepared by Lipper Inc. (“Lipper”), an independent statistical compilation organization. The Lipper reports compared each Fund’s investment performance and expenses with those of other comparable mutual funds. The independent Trustees reviewed and discussed the Lipper reports with counsel to the independent Trustees. The Board requested and received information regarding DMC’s policy with respect to advisory fee levels and its breakpoint philosophy; the structure of portfolio manager compensation; the investment manager’s profitability; and any constraints or limitations on the availability of securities in certain investment styles which had in the past year inhibited, or which were likely in the future to inhibit, DMC’s ability to invest fully in accordance with Fund policies.
In considering information relating to the approval of each Fund’s advisory agreement, the independent Trustees received assistance and advice from and met separately with counsel to the independent Trustees. Although the Board gave attention to all information furnished, the following discussion identifies, under separate headings, the primary factors taken into account by the Board during its contract renewal considerations.
Nature, Extent and Quality of Service. The Board considered the services provided by Delaware Investments to the Funds and their shareholders. In reviewing the nature, extent and quality of services, the Board considered reports furnished to it throughout the year, which covered matters such as the relative performance of the Funds, compliance of portfolio managers with the investment policies, strategies and restrictions for the Funds, compliance by DMC and Delaware Distributors, L.P. (together, “Management”) personnel with the Code of Ethics adopted throughout the Delaware Investments Family of Funds complex and adherence to fair value pricing procedures as established by the Board. The Board was pleased with the current staffing of the Funds’ investment advisor and the emphasis placed on research in the investment
94
process. The Board gave favorable consideration to DMC’s efforts to control expenditures while maintaining service levels committed to fund matters. The Board also considered the transfer agent and shareholder services provided to Fund shareholders by DMC’s affiliate, Delaware Service Company, Inc. (“DSC”), noting DSC’s high level of service. The Board noted that Management finished upgrading investment accounting functions through outsourcing to improve the quality and lower the cost of delivering investment accounting services to the Funds. The Board once again noted the benefits provided to Fund shareholders through each shareholder’s ability to exchange an investment in one Delaware Investments fund for the same class of shares in another Delaware Investments fund without a sales charge, to reinvest Fund dividends into additional shares of the same Fund or into additional shares of other Delaware Investments funds and the privilege to combine holdings in other Delaware Investments funds to obtain a reduced sales charge. The Board was satisfied with the nature, extent and quality of the overall services provided by Delaware Investments.
Investment Performance. The Board placed significant emphasis on the investment performance of the Funds in view of its importance to shareholders. Although the Board gave appropriate consideration to performance reports and discussions with portfolio managers at Board meetings throughout the year, the Board gave particular weight to the Lipper reports furnished for the Annual Meeting. The Lipper reports prepared for each Fund showed the investment performance of its Class A shares in comparison to a group of similar funds as selected by Lipper (the “Performance Universe”). A fund with the best performance ranked first, and a fund with the poorest performance ranked last. The highest/best performing 25% of funds in the Performance Universe make up the first quartile; the next 25%, the second quartile; the next 25%, the third quartile; and the poorest/worst performing 25% of funds in the Performance Universe make up the fourth quartile. Comparative annualized performance for each Fund was shown for the past one-, three-, five- and ten-year periods ended December 31, 2008. The Board’s objective is that each Fund’s performance for the periods considered be at or above the median of its Performance Universe. The following paragraphs summarize the performance results for the Funds and the Board’s view of such performance.
Delaware Tax-Free Minnesota Fund – The Performance Universe for the Fund consisted of the Fund and all retail and institutional Minnesota municipal debt funds as selected by Lipper. The Lipper report comparison showed that the Fund’s total return for the one-, three-, five- and ten-year periods was in the first quartile of its Performance Universe. The Board was satisfied with performance.
Delaware Tax-Free Minnesota Intermediate Fund – The Performance Universe for the Fund consisted of the Fund and all retail and institutional other state intermediate municipal debt funds as selected by Lipper. The Lipper report comparison showed that the Fund’s total return for the one-year period was in the third quartile of its Performance Universe. The report further showed that the Fund’s total return for the three- and ten-year periods was in the second quartile and the Fund’s total return for the five-year period was in the first quartile. The Board determined that the Fund’s performance results were mixed but on an overall basis tended toward median, which was acceptable.
95
Other Fund information
(Unaudited)
Delaware Minnesota Municipal Bond Funds
Board Consideration of Delaware Tax-Free Minnesota Fund, Delaware Tax-Free Minnesota Intermediate Fund and Delaware Minnesota High-Yield Municipal Bond Fund Investment Advisory Agreements (continued)
Delaware Minnesota High-Yield Municipal Bond Fund – Lipper currently classifies the Fund as a Minnesota municipal debt fund. However, Management believes that it would be more appropriate to include the Fund in the high yield municipal debt funds category, which would provide a comparison to a representative peer group based on credit quality instead of a peer group based on state of issuance. Accordingly, the Lipper report prepared for the Fund compares the Fund’s performance to two separate Performance Universes consisting of the Fund and all retail and institutional Minnesota municipal debt funds and all retail and institutional high yield municipal debt funds. When compared to other Minnesota municipal debt funds, the Lipper report comparison showed that the Fund’s total return for the one- and three-year periods was in the third quartile of its Performance Universe and the Fund’s total return for the five- and ten-year periods was in the second quartile. When compared to other high yield municipal debt funds, the Lipper report comparison showed that the Fund’s total return for the one-, three-, five- and ten-year periods was in the first quartile of the Performance Universe. The Board was satisfied with performance.
Comparative Expenses. The Board considered expense comparison data for the Delaware Investments Family of Funds. Management provided the Board with information on pricing levels and fee structures for each Fund as of October 31, 2008 and, for comparative funds, information as of their respective fiscal year end occurring on or before August 31, 2008. The Board also focused on the comparative analysis of effective management fees and total expense ratios of each Fund versus effective management fees and expense ratios of a group of similar funds as selected by Lipper (the “Expense Group”). In reviewing comparative costs, each Fund’s contractual management fee and the actual management fee incurred by the Fund were compared with the contractual management fees (assuming all funds in the Expense Group were similar in size to the Fund) and actual management fees (as reported by each fund) within the Expense Group, taking into account any applicable breakpoints and fee waivers. Each Fund’s total expenses were also compared with those of its Expense Group. The Lipper total expenses, for comparative consistency, were shown by Lipper for Class A shares and comparative total expenses including 12b-1 and non 12b-1 service fees. The Board considered fees paid to Delaware Investments for nonmanagement services. The Board’s objective is to limit each Fund’s total expense ratio to be competitive with that of the Expense Group. The following paragraphs summarize the expense results for the Funds and the Board’s view of such expenses.
Delaware Tax-Free Minnesota Fund – The expense comparisons for the Fund showed that its actual management fee and total expenses were in the quartile with the highest expenses of its Expense Group. The Board noted that the Fund’s total expenses were not in line with the Board’s objective. In evaluating the total expenses, the Board considered waivers in place through December 2009 and various initiatives implemented by Management, such as the outsourcing
96
of certain transfer agency and investment accounting services, creating an opportunity for a reduction in expenses. The Board was satisfied with Management’s efforts to improve the Fund’s total expense ratio and bring it in line with the Board’s objective.
Delaware Tax-Free Minnesota Intermediate Fund – The expense comparisons for the Fund showed that its actual management fee and total expenses were in the quartile with the lowest expenses of its Expense Group. The Board was satisfied with the management fee and total expenses of the Fund in comparison to those of its Expense Group as shown in the Lipper report.
Delaware Minnesota High-Yield Municipal Bond Fund – When compared to other Minnesota municipal debt funds, the expense comparisons for the Fund showed that its actual management fee and total expenses were in the quartile with the second highest expenses of the Expense Group. When compared to other high yield municipal debt funds, the expense comparisons for the Fund showed that its actual management fee was in the quartile with the lowest expenses of the Expense Group and its total expenses were in the quartile with the second lowest expenses of the Expense Group. The Board noted that, when compared to other Minnesota municipal debt funds, the Fund’s total expenses were not in line with the Board’s objective. In evaluating the total expenses, the Board considered fee waivers in place through December 2009 and various initiatives implemented by Management, such as the outsourcing of certain transfer agency and investment accounting services, creating an opportunity for a reduction in total expenses. The Board also viewed favorably the alternative expense comparison to high yield municipal debt funds. The Board was satisfied with Management’s efforts to improve the Fund’s total expense ratio and bring it in line with the Board’s objective.
Management Profitability. The Board considered the level of profits realized by Delaware Investments in connection with the operation of the Funds. In this respect, the Board reviewed the Investment Management Profitability Analysis that addressed the overall profitability of Delaware Investments’ business in providing management and other services to each of the individual funds and the Delaware Investments Family of Funds as a whole. Specific attention was given to the methodology followed in allocating costs for the purpose of determining profitability. Management stated that the level of profits of Delaware Investments, to a certain extent, reflect recent operational cost savings and efficiencies initiated by Delaware Investments. The Board considered Delaware Investments’ efforts to improve services provided to fund shareholders and to meet additional regulatory and compliance requirements resulting from recent industry-wide Securities and Exchange Commission initiatives. The Board also considered the extent to which Delaware Investments might derive ancillary benefits from fund operations, including the potential for procuring additional business as a result of the prestige and visibility associated with its role as service provider to the Delaware Investments Family of Funds and the benefits from allocation of fund brokerage to improve trading efficiencies. The Board found that the management fees were reasonable in light of the services rendered and the level of profitability of Delaware Investments.
97
Other Fund information
(Unaudited)
Delaware Minnesota Municipal Bond Funds
Board Consideration of Delaware Tax-Free Minnesota Fund, Delaware Tax-Free Minnesota Intermediate Fund and Delaware Minnesota High-Yield Municipal Bond Fund Investment Advisory Agreements (continued)
Economies of Scale. The Trustees considered whether economies of scale are realized by Delaware Investments as each Fund’s assets increase and the extent to which any economies of scale are reflected in the level of management fees charged. The Trustees reviewed the standardized advisory fee pricing and structure, approved by the Board and shareholders, which includes breakpoints. Breakpoints in the advisory fee occur when the advisory fee rate is reduced on assets in excess of specified levels. Breakpoints result in a lower advisory fee than would otherwise be the case on all assets when the asset levels specified are exceeded. The Board noted that the fee under each Fund’s management contract fell within the standard structure. The Board also noted that the Delaware Tax-Free Minnesota Fund’s assets exceeded the first breakpoint level. The Board believed that, given the extent to which economics of scale might be realized by the advisor and its affiliates, the schedule of fees under the Investment Advisory Agreement provides a sharing of benefits with the Fund and its shareholders. Although neither the Delaware Tax-Free Minnesota Intermediate Fund nor the Delaware Minnesota High-Yield Municipal Bond Fund has reached a size at which it can take advantage of breakpoints, the Board recognized that the fee was structured so that when the Fund grows, economies of scale may be shared.
Fund management
Joseph R. Baxter
Senior Vice President, Head of Municipal Bond Department, Senior Portfolio Manager
Joseph R. Baxter is the head of the municipal bond department and is responsible for setting the department’s investment strategy. He is also a co-portfolio manager of the firm’s municipal bond funds and several client accounts. Before joining Delaware Investments in 1999 as head municipal bond trader, he held investment positions with First Union, most recently as a municipal portfolio manager with the Evergreen Funds. Baxter received a bachelor’s degree in finance and marketing from La Salle University.
Stephen J. Czepiel
Senior Vice President, Senior Portfolio Manager
Stephen J. Czepiel is a member of the firm’s municipal fixed income portfolio management team with primary responsibility for portfolio construction and strategic asset allocation. He is a co-portfolio manager of the firm’s municipal bond funds and client accounts. He joined Delaware Investments in July 2004 as a senior bond trader. Previously, he was vice president at both Mesirow Financial and Loop Capital Markets. He began his career in the securities industry in 1982 as a municipal bond trader at Kidder Peabody and now has more than 20 years of experience in the municipal securities industry. Czepiel earned his bachelor’s degree in finance and economics from Duquesne University.
98
Board of trustees/directors and officers addendum
Delaware Investments® Family of Funds
A mutual fund is governed by a Board of Trustees/Directors (“Trustees”), which has oversight responsibility for the management of a fund’s business affairs. Trustees establish procedures and oversee and review the performance of the investment manager, the distributor, and others who perform services for the fund. The independent fund trustees, in particular, are advocates
| Name, Address, | Position(s) | Length of | ||
| and Birth Date | Held with Fund(s) | Time Served | ||
| Interested Trustees | ||||
| Patrick P. Coyne1 | Chairman, President, | Chairman and Trustee | ||
| 2005 Market Street | Chief Executive Officer, | since August 16, 2006 | ||
| Philadelphia, PA 19103 | and Trustee | |||
| April 1963 | President and | |||
| Chief Executive Officer | ||||
| since August 1, 2006 | ||||
| Independent Trustees | ||||
| Thomas L. Bennett | Trustee | Since March 2005 | ||
| 2005 Market Street | ||||
| Philadelphia, PA 19103 | ||||
| October 1947 | ||||
| John A. Fry | Trustee | Since January 2001 | ||
| 2005 Market Street | ||||
| Philadelphia, PA 19103 | ||||
| May 1960 | ||||
| Anthony D. Knerr | Trustee | Since April 1990 | ||
| 2005 Market Street | ||||
| Philadelphia, PA 19103 | ||||
| December 1938 | ||||
| Lucinda S. Landreth | Trustee | Since March 2005 | ||
| 2005 Market Street | ||||
| Philadelphia, PA 19103 | ||||
| June 1947 | ||||
1 Patrick P. Coyne is considered to be an “Interested Trustee” because he is an executive officer of the Fund’s(s’) investment advisor.
100
for shareholder interests. Each trustee has served in that capacity since he or she was elected to or appointed to the Board of Trustees, and will continue to serve until his or her retirement or the election of a new trustee in his or her place. The following is a list of the Trustees and Officers with certain background and related information.
| Number of Portfolios in | ||||
| Principal Occupation(s) | Fund Complex Overseen | Other Directorships | ||
| During Past 5 Years | by Trustee or Officer | Held by Trustee or Officer | ||
| Patrick P. Coyne has served in | 81 | Director | ||
| various executive capacities | Kaydon Corp. | |||
| at different times at | ||||
| Delaware Investments.2 | ||||
| Private Investor | 81 | Director | ||
| (March 2004–Present) | Bryn Mawr Bank Corp. (BMTC) | |||
| (April 2007–Present) | ||||
| Investment Manager | ||||
| Morgan Stanley & Co. | ||||
| (January 1984–March 2004) | ||||
| President | 81 | Director | ||
| Franklin & Marshall College | Community Health Systems | |||
| (June 2002–Present) | ||||
| Executive Vice President | ||||
| University of Pennsylvania | ||||
| (April 1995–June 2002) | ||||
| Founder and | 81 | None | ||
| Managing Director | ||||
| Anthony Knerr & Associates | ||||
| (Strategic Consulting) | ||||
| (1990–Present) | ||||
| Chief Investment Officer | 81 | None | ||
| Assurant, Inc. (Insurance) | ||||
| (2002–2004) | ||||
2 Delaware Investments is the marketing name for Delaware Management Holdings, Inc. and its subsidiaries, including the Fund’s(s’) investment advisor, principal underwriter, and its transfer agent.
101
Board of trustees/directors and officers addendum
Delaware Investments® Family of Funds
| Name, Address, | Position(s) | Length of | ||
| and Birth Date | Held with Fund(s) | Time Served | ||
| Independent Trustees (continued) | ||||
| Ann R. Leven | Trustee | Since October 1989 | ||
| 2005 Market Street | ||||
| Philadelphia, PA 19103 | ||||
| November 1940 | ||||
| Thomas F. Madison | Trustee | Since May 19973 | ||
| 2005 Market Street | ||||
| Philadelphia, PA 19103 | ||||
| February 1936 | ||||
3 In 1997, several funds managed by Voyageur Fund Managers, Inc. (the “Voyageur Funds”) were incorporated into the Delaware Investments Family of Funds. Mr. Madison served as a director of the Voyageur Funds from 1993 until 1997.
102
| Number of Portfolios in | ||||
| Principal Occupation(s) | Fund Complex Overseen | Other Directorships | ||
| During Past 5 Years | by Trustee or Officer | Held by Trustee or Officer | ||
| Consultant | 81 | None | ||
| ARL Associates | ||||
| (Financial Planning) | ||||
| (1983–Present) | ||||
| President and | 81 | Director and Chair of | ||
| Chief Executive Officer | Compensation Committee, | |||
| MLM Partners, Inc. | Governance Committee | |||
| (Small Business Investing | Member | |||
| and Consulting) | CenterPoint Energy | |||
| (January 1993–Present) | ||||
| Lead Director and Chair of | ||||
| Audit and Governance | ||||
| Committees, Member of | ||||
| Compensation Committee | ||||
| Digital River, Inc. | ||||
| Director and Chair of | ||||
| Governance Committee, | ||||
| Audit Committee | ||||
| Member | ||||
| Rimage Corporation | ||||
| Director and Chair of | ||||
| Compensation Committee | ||||
| Spanlink Communications | ||||
| Lead Director and Member of | ||||
| Compensation and | ||||
| Governance Committees | ||||
| Valmont Industries, Inc. | ||||
103
Board of trustees/directors and officers addendum
Delaware Investments® Family of Funds
| Name, Address, | Position(s) | Length of | ||
| and Birth Date | Held with Fund(s) | Time Served | ||
| Independent Trustees (continued) | ||||
| Janet L. Yeomans | Trustee | Since April 1999 | ||
| 2005 Market Street | ||||
| Philadelphia, PA 19103 | ||||
| July 1948 | ||||
| J. Richard Zecher | Trustee | Since March 2005 | ||
| 2005 Market Street | ||||
| Philadelphia, PA 19103 | ||||
| July 1940 | ||||
| Officers | ||||
| David F. Connor | Vice President, | Vice President since | ||
| 2005 Market Street | Deputy General | September 2000 | ||
| Philadelphia, PA 19103 | Counsel, and Secretary | and Secretary since | ||
| December 1963 | October 2005 | |||
| Daniel V. Geatens | Vice President | Treasurer | ||
| 2005 Market Street | and Treasurer | since October 25, 2007 | ||
| Philadelphia, PA 19103 | ||||
| October 1972 | ||||
| David P. O’Connor | Senior Vice President, | Senior Vice President, | ||
| 2005 Market Street | General Counsel, | General Counsel, and | ||
| Philadelphia, PA 19103 | and Chief Legal Officer | Chief Legal Officer | ||
| February 1966 | since October 2005 | |||
| Richard Salus | Senior Vice President | Chief Financial Officer | ||
| 2005 Market Street | and Chief Financial Officer | since November 2006 | ||
| Philadelphia, PA 19103 | ||||
| October 1963 | ||||
4 David F. Connor, Daniel V. Geatens, David P. O’Connor, and Richard Salus serve in similar capacities for the six portfolios of the Optimum Fund Trust, which have the same investment advisor, principal underwriter, and transfer agent as the registrant.
104
| Number of Portfolios in | ||||
| Principal Occupation(s) | Fund Complex Overseen | Other Directorships | ||
| During Past 5 Years | by Trustee or Officer | Held by Trustee or Officer | ||
| Vice President and Treasurer | 81 | None | ||
| (January 2006–Present) | ||||
| Vice President — Mergers & Acquisitions | ||||
| (January 2003–January 2006), and | ||||
| Vice President | ||||
| (July 1995–January 2003) | ||||
| 3M Corporation | ||||
| Founder | 81 | Director and Audit | ||
| Investor Analytics | Committee Member | |||
| (Risk Management) | Investor Analytics | |||
| (May 1999–Present) | ||||
| Founder | ||||
| Sutton Asset Management | ||||
| (Hedge Fund) | ||||
| (September 1996–Present) | ||||
| David F. Connor has served as | 81 | None4 | ||
| Vice President and Deputy | ||||
| General Counsel of | ||||
| Delaware Investments | ||||
| since 2000. | ||||
| Daniel V. Geatens has served | 81 | None4 | ||
| in various capacities at | ||||
| different times at | ||||
| Delaware Investments. | ||||
| David P. O’Connor has served in | 81 | None4 | ||
| various executive and legal | ||||
| capacities at different times | ||||
| at Delaware Investments. | ||||
| Richard Salus has served in | 81 | None4 | ||
| various executive capacities | ||||
| at different times at | ||||
| Delaware Investments. | ||||
The Statement of Additional Information for the Fund(s) includes additional information about the Trustees and Officers and is available, without charge, upon request by calling 800 523-1918.
105
About the organization
Board of trustees | |||
Patrick P. Coyne Thomas L. Bennett John A. Fry | Anthony D. Knerr Lucinda S. Landreth | Ann R. Leven Thomas F. Madison | Janet L. Yeomans J. Richard Zecher |
| Affiliated officers | |||
David F. Connor | Daniel V. Geatens | David P. O’Connor | Richard Salus |
This annual report is for the information of Delaware Tax-Free Minnesota Fund, Delaware Tax-Free Minnesota Intermediate Fund, and Delaware Minnesota High-Yield Municipal Bond Fund shareholders, but it may be used with prospective investors when preceded or accompanied by a current prospectus for Delaware Tax-Free Minnesota Fund, Delaware Tax-Free Minnesota Intermediate Fund, and Delaware Minnesota High-Yield Municipal Bond Fund and the Delaware Investments Fund profile for the most recently completed calendar quarter. These documents are available at www.delawareinvestments.com. The prospectus sets forth details about charges, expenses, investment objectives, and operating policies of the investment company. You should read the prospectus carefully before you invest. The figures in this report represent past results that are not a guarantee of future results. The return and principal value of an investment in the investment company will fluctuate so that shares, when redeemed, may be worth more or less than their original cost. |
Delaware Investments is the marketing name of Delaware Management Holdings, Inc. and its subsidiaries. Each Fund files its complete schedule of portfolio holdings with the Securities and Exchange Commission for the first and third quarters of each fiscal year on Form N-Q. Each Fund’s Forms N-Q, as well as a description of the policies and procedures that each Fund uses to determine how to vote proxies (if any) relating to portfolio securities are available without charge (i) upon request, by calling 800 523-1918; and (ii) on the Commission’s Web site at www.sec.gov. In addition, a description of the policies and procedures that each Fund uses to determine how to vote proxies (if any) relating to portfolio securities and each Fund’s Schedule of Investments are available without charge on each Fund’s Web site at www.delawareinvestments.com. Each Fund’s Forms N-Q may be reviewed and copied at the Commission’s Public Reference Room in Washington, D.C.; information on the operation of the Public Reference Room may be obtained by calling 800 SEC-0330. Information (if any) regarding how each Fund voted proxies relating to portfolio securities during the most recently disclosed 12-month period ended June 30 is available without charge (i) through each Fund’s Web site at www.delawareinvestments.com; and (ii) on the Commission’s Web site at www.sec.gov. |
106
| |
|
| |
Annual report Delaware Tax-Free USA Fund Delaware Tax-Free USA Intermediate Fund Delaware National High-Yield Municipal Bond Fund August 31, 2009
Fixed income mutual funds |
This annual report is for the information of Delaware Tax-Free USA Fund, Delaware Tax-Free USA Intermediate Fund, and Delaware National High-Yield Municipal Bond Fund shareholders, but it may be used with prospective investors when preceded or accompanied by a current prospectus for Delaware Tax-Free USA Fund, Delaware Tax-Free USA Intermediate Fund, and Delaware National High-Yield Municipal Bond Fund. The figures in the annual report for Delaware Tax-Free USA Fund, Delaware Tax-Free USA Intermediate Fund, and Delaware National High-Yield Municipal Bond Fund represent past results, which are not a guarantee of future results. The return and principal value of an investment in the investment company will fluctuate so that shares, when redeemed, may be worth more or less than their original cost. Current performance may be higher or lower than the performance data quoted. You should consider the investment objectives, risks, charges, and expenses of the investment company carefully before investing. The Delaware Tax-Free USA Fund, Delaware Tax-Free USA Intermediate Fund, and Delaware National High-Yield Municipal Bond Fund prospectus contains this and other important information about the investment company. Prospectuses for all open-end funds in the Delaware Investments® Family of Funds are available from your financial advisor, online at www.delawareinvestments.com, or by phone at 800 523-1918. Please read the prospectus carefully before you invest or send money. |
You can obtain shareholder reports and prospectuses online instead of in the mail. |
Experience Delaware Investments
Delaware Investments is committed to the pursuit of consistently superior asset management and unparalleled client service. We believe in our investment processes, which seek to deliver consistent results, and in convenient services that help add value for our clients.
If you are interested in learning more about creating an investment plan, contact your financial advisor.
You can learn more about Delaware Investments or obtain a prospectus for Delaware Tax-Free USA Fund, Delaware Tax-Free USA Intermediate Fund, and Delaware National High-Yield Municipal Bond Fund at www.delawareinvestments.com.
Manage your investments online |
|
Contact information
Investment manager
Delaware Management Company, a series of Delaware Management Business Trust
National distributor
Delaware Distributors, L.P.
Financial intermediary wholesaler
Lincoln Financial Distributors, L.P.
Shareholder servicing, dividend disbursing, and transfer agent
Delaware Service Company, Inc.
Mailing address
2005 Market Street
Philadelphia, PA 19103-7094
Shareholder assistance by phone
800 523-1918, weekdays from 8 a.m. to 7 p.m. Eastern time
For securities dealers and financial institutions representatives only
800 362-7500
| Table of contents | |
| Portfolio management review | 1 |
| Performance summaries | 7 |
| Disclosure of Fund expenses | 18 |
| Sector allocations and credit quality breakdowns | 21 |
| Statements of net assets | 24 |
| Statements of operations | 64 |
| Statements of changes in net assets | 66 |
| Financial highlights | 72 |
| Notes to financial statements | 95 |
| Report of independent registered public accounting firm | 108 |
| Other Fund information | 109 |
| Board of trustees/directors and officers addendum | 114 |
| About the organization | 120 |
Views expressed herein are current as of August 31, 2009 and are subject to change.
Funds are not FDIC insured and are not guaranteed. It is possible to lose the principal amount invested.
Mutual fund advisory services provided by Delaware Management Company, a series of Delaware Management Business Trust, which is a registered investment advisor. Delaware Investments is the marketing name of Delaware Management Holdings, Inc. and its subsidiaries. Lincoln Financial Group is the marketing name for Lincoln National Corporation and its affiliates.
© 2009 Delaware Distributors, L.P.
All third-party trademarks cited are the property of their respective owners.
| Portfolio management review | |
| Delaware National Tax-Free Funds | Sept. 8, 2009 |
| Performance preview (for the period ended Aug. 31, 2009) | ||||
| Delaware Tax-Free USA Fund (Class A shares) | 1-year return | +3.91% | ||
| Barclays Capital Municipal Bond Index (benchmark) | 1-year return | +5.67% | ||
| Lipper General Municipal Debt Funds Average | 1-year return | +2.38% |
Past performance does not guarantee future results. |
| Delaware Tax-Free USA Intermediate Fund (Class A shares) | 1-year return | +5.49% | ||
| Barclays Capital 3–15 Year Municipal Bond Index (benchmark) | 1-year return | +6.65% | ||
| Lipper Intermediate Municipal Debt Funds Average | 1-year return | +4.23% |
Past performance does not guarantee future results. |
| Delaware National High-Yield Municipal Bond Fund (Class A shares) | 1-year return | -0.38% | ||
| Barclays Capital Municipal Bond Index (benchmark) | 1-year return | +5.67% | ||
| Lipper High Yield Municipal Debt Funds Average | 1-year return | -6.66% |
Past performance does not guarantee future results. |
Fund performance
Delaware Tax-Free USA Fund Class A shares returned +3.91% at net asset value and -0.80% at maximum offer price (both returns include distributions reinvested) for the fiscal year ended Aug. 31, 2009. For the same period, the Fund’s benchmark, the Barclays Capital Municipal Bond Index (formerly the Lehman Brothers Municipal Bond Index), returned +5.67%. For complete annualized performance for Delaware Tax-Free USA Fund, please see the table on page 7.
Delaware Tax-Free USA Intermediate Fund Class A shares returned +5.49% at net asset value and +2.57% at maximum offer price (both returns include distributions reinvested) for the fiscal year ended Aug. 31, 2009. For the same period, the Fund’s benchmark, the Barclays Capital 3–15 Year Municipal Bond Index, returned +6.65%. For complete annualized performance for Delaware Tax-Free USA Intermediate Fund, please see the table on page 11.
Data for this portfolio management review were provided by Bloomberg unless otherwise noted.
1
Portfolio management review
Delaware National Tax-Free Funds
The 12-month period included one of the most difficult economic and investment climates the portfolio management team has ever seen, followed by a considerable recovery within the municipal bond market and across fixed income markets more broadly.
As the period came to a close, the economy was, if not improving, declining at a far slower pace, and many analysts were anticipating a near-term end to the long recession.
Delaware National High-Yield Municipal Bond Fund Class A shares returned -0.38% at net asset value and -4.88% at maximum offer price (both returns include distributions reinvested) for the fiscal year ended Aug. 31, 2009. For the same period, the Fund’s benchmark, the Barclays Capital Municipal Bond Index, returned +5.67%. For complete annualized performance for Delaware National High-Yield Municipal Bond Fund, please see the table on page 14.
Economic environment
The 12-month period included one of the most difficult economic and investment climates the portfolio management team has ever seen, followed by a considerable recovery within the municipal bond market and across fixed income markets more broadly.
The financial markets’ troubles date back to 2007 and turmoil continued into the start of the reporting period in September 2008:
- Falling home prices led to rising mortgage defaults, especially among “subprime” borrowers, or individuals with weak credit.
- As defaults rose, mortgage-backed securities — bonds whose interest is backed by monthly mortgage payments — lost considerable value.
- Credit dried up, and even financially sound companies and municipal borrowers found it increasingly difficult to obtain needed funds.
Several weeks into the period, the financial markets received a jolt with the bankruptcy of storied Wall Street investment bank Lehman Brothers. This event, followed soon after by the near bankruptcy (and ultimate federal bailout) of insurance giant American International Group (AIG), sent
2
the markets into a near panic. Stock and bond prices virtually collapsed, while credit became even less available. On the whole, businesses began to cut their capital spending, and large-scale job losses ensued.
By early 2009, both stock and bond valuations had fallen extremely from their highs, reflecting investors’ fears of an economic depression. Though the “worst-case scenarios” that many may have envisioned did not materialize, the U.S. economy did experience its most severe downturn in decades. Gross domestic product (GDP) — a widely used measure of economic activity — fell by 5.4% and 6.4% in the fourth quarter of 2008 and the first quarter of 2009, respectively. It was the country’s worst two-quarter economic performance in more than 50 years.
Within this environment, the Federal Reserve and federal government took a series of steps to loosen tight credit markets and avert a worst-case scenario for the economy. The Fed significantly expanded its balance sheet during the fiscal year. Notably, it employed one of the lesser-used tools that it has at its disposal, in purchasing hundreds of billions of dollars worth of longer-term U.S. Treasury debt as well as agency mortgage-backed securities. In December 2008, the Federal Open Market Committee (FOMC) cut the target federal funds rate to a range of zero to 0.25% — an all-time low. For its part, the federal government passed the Troubled Asset Relief Program (TARP), a $700 billion package designed to shore up financial institutions, in October 2008. Several months later, the Obama administration followed up with the American Recovery and Reinvestment Act of 2009, a nearly $800 billion economic stimulus package. (Source: Bloomberg.)
As the period came to a close, the economy was, if not improving, declining at a far slower pace, and, based on our research, many analysts were anticipating a near-term end to the long recession. During the second quarter of 2009, GDP fell by an estimated 1%. This figure was still weak, but it was the best economic performance seen in a year.
The municipal bond market
In our view, the most notable trend within the municipal bond market during the period was the widening performance gap between higher-rated and lower-rated bonds. Demand remained strong for securities with the high (AA or better) credit ratings, for example, but was weak for those in all other rating categories, particularly securities rated BBB or below. As a result, lower-rated bonds dramatically underperformed their higher-grade counterparts — especially in the first few months of the period when investor confidence was lowest.
This bifurcation, or divergence of performance, within the municipal market largely resulted from the continued financial troubles for monoline municipal bond insurers. For many years, these companies — which insure municipal bond principal and interest payments — received AAA ratings from the major credit rating agencies. As a result, many investors were willing to buy lower-quality bonds as long as they carried this AAA-rated insurance guarantee. Beginning in 2007, however, as credit conditions worsened, many of these monoline insurance companies saw their credit ratings cut dramatically.
Severe capitalization constraints within the investment banking community compounded the municipal markets’ problems during
3
Portfolio management review
Delaware National Tax-Free Funds
approximately the first half of the fiscal period. Once investment banks’ capital positions were compromised, most banks were less willing to provide liquidity to help bolster the municipal market.
With municipal bond yields high and their prices at historic lows (bond yields and prices move in opposite directions), investors slowly began to return to the tax-exempt bond market beginning in mid-December 2008. At first, they favored highly rated bonds generally associated with minimal credit risk. By the year’s second calendar quarter, as optimism about the economy grew, municipal bond issuance began to grow, and for the first time in months we began to see increased new supply that stemmed from lower-rated, higher-yielding deals.
In this environment, lower-rated bonds generally enjoyed more-favorable performance, and even rallied in the summer months. Credit spreads — which can be interpreted as the additional income paid to investors in exchange for investing in riskier bonds — narrowed sharply from their peak in early January, indicating some initial easing of the general risk aversion that characterized fixed income markets for so long.
Besides generally avoiding credit risk, many municipal bond investors sought to minimize interest rate risk as well during the period. This was indicated by the fact that the yield curve, or the difference in yield offered by shorter-dated AAA-rated general obligation bonds relative to comparable longer-dated issues, rose steadily during the fiscal period. In fact, it reached a high of nearly four percentage points in August 2009 — almost double the historical average. (Source: Barclays Capital.)
Tactical portfolio shifts
Entering the reporting period, we sought to take advantage of market conditions by positioning the Funds more conservatively. We were emphasizing higher-rated securities as well as those with intermediate maturities. As the credit crisis deepened, this conservative stance generally contributed to the Funds’ performance versus our peers, especially in the fourth quarter of 2008 and first quarter of 2009.
Beginning early in 2009 and continuing through the end of the fiscal period, we became somewhat more confident, as we perceived a positive shift in the outlook for municipal bonds. Believing that municipal bond investors were being unusually well compensated for taking on credit risk, we began to selectively invest more of the Funds’ assets in lower-rated, higher-yielding bonds. Where appropriate, we also increasingly focused on longer-dated issues — an approach that enabled us to lock higher interest rates into the portfolios for an extended time.
Our approach during approximately the second half of the fiscal year (selectively investing across the credit spectrum) is more representative of how we manage the Funds during more-normalized market conditions. We are bottom-up investors, meaning that we evaluate securities one by one, based on thorough fundamental research to help ensure our comfort with the credit quality of each issuer. We believe that this approach may enable us to uncover value potential that investors with less experience or a less rigorous dedication to research might not be able to identify.
4
We believe this shift in Fund positioning was well timed. Early on, when the Funds emphasized higher-quality, intermediate-maturity debt, the securities we owned were often less affected by the worst of the market turmoil. As we gradually positioned the Funds more aggressively in a more favorable investment environment, we generally benefited from having security selection to the types of fundamentally solid, yet higher-than-average yielding bonds that we have historically favored.
Notable sectors and securities
Given the challenging market conditions overall, it’s not surprising that the best-performing sectors in all three Funds were those with a significant proportion of high-quality bonds — state general obligation bonds and pre-refunded bonds. Pre-refunded debt did particularly well. These securities are found on the short-maturity end of the yield curve and have historically faced little if any credit risk. This is because they are backed by the invested debt proceeds of a second bond issue, which consists of U.S. Treasury securities. Given investors’ tremendous risk aversion during much of the period, Treasurys performed extremely well, boosting the performance of pre-refunded bonds.
The general obligation and pre-refunded bond sectors were significant contributors to the performance of the National High-Yield Municipal Bond Fund. Neither is typically an area of emphasis for the Fund, which on the whole focuses on lower-rated debt. However, given the highly unusual market conditions combined with what we viewed as more attractive relative-value opportunities we saw in these sectors, we invested in these areas when we felt market conditions warranted, eventually shifting back toward higher-yielding, lower-rated investments more typically seen in a high yield municipal bond portfolio.
In all three Funds, many of our best individual-performing securities were those we were able to purchase near the market’s bottom, and that soon managed to recover off their lows. In the Tax-Free USA Fund, for example, these included bonds issued by Harvard University as well as New York City water bonds, both of which were highly rated. In both cases, we bought the bonds with high yields relative to historical norms at low points in the municipal marketplace. When investors returned to the municipal market, the bonds’ prices recovered, providing a healthy return to the Fund.
The Tax-Free USA Intermediate Fund benefited from a highly rated Connecticut state general obligation bond issue that started to recover its lost value shortly after we purchased it in early 2009. The Fund also was helped by an A-rated Minnesota hospital bond issue, Fairview Health Services, which we purchased in the fourth quarter of 2008 when the security was offering exceptional value, in our opinion. Although this security took some time to recover, it did so toward the end of the period and contributed significantly to the Fund’s performance.
Alternatively, all three Funds were hurt by their exposure to the industrial development revenue (IDR) bond category, which consists of corporate-backed bonds, many of which were lower rated. All three Funds, for example, were hurt by positions in Brazos River Authority, Texas, IDR bonds issued for Texas Utilities, which were rated below investment grade. Texas Utilities went through a leveraged buyout in 2007 and recently saw its credit rating downgraded several times.
5
Portfolio management review
Delaware National Tax-Free Funds
The Tax-Free USA Fund and Tax-Free USA Intermediate Fund also were hampered by our allocation to municipal leases — a category that tends to consist primarily of lower-rated, longer-maturity debt, two characteristics that were largely out of favor with investors.
Both the Tax-Free USA Fund and National High-Yield Municipal Bond Fund were weighed down by their allocation to land-transaction bonds, sometimes called “dirt bonds.” These issues, which help finance property developments, were particularly challenged in the regions that experienced the biggest housing boom and subsequent bust. Henderson, Nevada Local Improvement District land transaction bonds were particularly poor performers for the two Funds. These securities suffered significant price declines as the housing market declined and this development project remained unbuilt for a lack of demand and financing.
The Tax-Free USA Intermediate Fund was further hurt by its holdings in bonds issued for the Heldrich Center in central New Jersey. This new conference center opened in early 2008 and was weighed down by the declining economy, which resulted in fewer corporate meetings and therefore reduced conference-related revenue.
6
| Performance summaries | |
| Delaware Tax-Free USA Fund | Aug. 31, 2009 |
The performance data quoted represent past performance; past performance does not guarantee future results. Investment return and principal value will fluctuate so your shares, when redeemed, may be worth more or less than their original cost. Please obtain the performance data for the most recent month end by calling 800 523-1918 or visiting our Web site at www.delawareinvestments.com/performance. Current performance may be lower or higher than the performance data quoted.
You should consider the investment objectives, risks, charges, and expenses of the investment company carefully before investing. The Delaware Tax-Free USA Fund prospectus contains this and other important information about the investment company. Please request a prospectus through your financial advisor or by calling 800 523-1918 or visiting our Web site at www.delawareinvestments.com. Read the prospectus carefully before you invest or send money.
A rise or fall in interest rates can have a significant impact on bond prices and the net asset value (NAV) of the Fund. Funds that invest in bonds can lose their value as interest rates rise, and an investor can lose principal.
| Fund performance | Average annual total returns through Aug. 31, 2009 | |||||||||||||||||||
| 1 year | 5 years | 10 years | Lifetime | |||||||||||||||||
| Class A (Est. Jan. 11, 1984) | ||||||||||||||||||||
| Excluding sales charge | +3.91 | % | +3.27 | % | +4.76 | % | +6.99 | % | ||||||||||||
| Including sales charge | -0.80 | % | +2.32 | % | +4.28 | % | +6.80 | % | ||||||||||||
| Class B (Est. May 2, 1994) | ||||||||||||||||||||
| Excluding sales charge | +3.13 | % | +2.47 | % | +4.10 | % | +4.16 | % | ||||||||||||
| Including sales charge | -0.84 | % | +2.21 | % | +4.10 | % | +4.16 | % | ||||||||||||
| Class C (Est. Nov. 29, 1995) | ||||||||||||||||||||
| Excluding sales charge | +3.13 | % | +2.48 | % | +3.96 | % | +3.49 | % | ||||||||||||
| Including sales charge | +2.13 | % | +2.48 | % | +3.96 | % | +3.49 | % | ||||||||||||
| Institutional Class (Est. Dec. 31, 2008) | ||||||||||||||||||||
| Excluding sales charge | n/a | n/a | n/a | +12.15 | % | |||||||||||||||
| Including sales charge | n/a | n/a | n/a | +12.15 | % | |||||||||||||||
Returns reflect the reinvestment of all distributions and any applicable sales charges as noted in the following paragraphs.
Performance for Class B and C shares, excluding sales charges, assumes either that contingent deferred sales charges did not apply or that the investment was not redeemed.
Expense limitations were in effect for all classes during the periods shown in the Fund performance chart and in the “Performance of a $10,000 investment” chart. The current expenses for each class are listed on the “Fund expenses” chart. (Note that all charts and graphs referred to in the “Performance summary” section of this report are found on pages 7 through 10.) Performance would have been lower had the expense limitation not been in effect.
7
Performance summaries
Delaware Tax-Free USA Fund
The Fund offers Class A, B, C, and Institutional Class shares. Class A shares are sold with a maximum front-end sales charge of up to 4.50%, and have an annual distribution and service fee of up to 0.24% of average daily net assets.
Class B shares may only be purchased through dividend reinvestment and certain permitted exchanges as described in the prospectus. Please see the prospectus for additional information on Class B purchase and sales charges. Class B shares have a contingent deferred sales charge that declines from 4.00% to zero depending on the period of time the shares are held.
Class B shares will automatically convert to Class A shares on a quarterly basis approximately eight years after purchase. They are also subject to an annual distribution and service fee of up to 1.00% of average daily net assets.
The Board of Trustees has adopted a formula for calculating 12b-1 fees for the Fund’s Class A shares that went into effect on June 1, 1992. The total 12b-1 fees to be paid by Class A shareholders of the Fund will be the sum of 0.10% of the average daily net assets representing shares that were acquired prior to June 1, 1992, and 0.30% of the average daily net assets representing shares that were acquired on or after June 1, 1992. Effective April 21, 2006, the maximum amount of the Class A 12b-1 fees was reduced to 0.25%, and the total 12b-1 fees to be paid by Class A shareholders of the Fund will be the sum of 0.10% of the average daily net assets representing shares that were acquired prior to June 1, 1992, and 0.25% of the average daily net assets representing shares that were acquired on or after June 1, 1992. All Class A shareholders will bear 12b-1 fees at the same rate, the blended rate based upon the allocation of the 0.10% and 0.25% rates described above.
Ten-year and lifetime performance figures for Class B shares reflect conversion to Class A shares after approximately eight years.
Class C shares are sold with a contingent deferred sales charge of 1.00% if redeemed during the first 12 months. They are also subject to an annual distribution and service fee of 1.00% of average daily net assets.
Institutional Class shares were first made available Dec. 31, 2008, and are available without sales or asset-based distribution charges only to certain eligible institutional accounts.
The “Fund performance” table and the “Performance of a $10,000 investment” graph do not reflect the deduction of taxes the shareholders would pay on Fund distributions or redemptions of Fund shares.
Fixed income securities and bond funds can lose value, and investors can lose principal, as interest rates rise. They also may be affected by economic conditions that hinder an issuer’s ability to make interest and principal payments on its debt. High yielding, noninvestment grade bonds (junk bonds) involve higher risk than investment grade bonds.
The Fund may also be subject to prepayment risk, the risk that the principal of a fixed income security that is held by the Fund may be prepaid prior to maturity, potentially forcing the Fund to reinvest that money at a lower interest rate.
Substantially all dividend income derived from tax-free funds is exempt from federal income tax. Some income may be subject to the federal alternative minimum tax that applies to certain investors. Capital gains, if any, are taxable.
8
The Fund’s expense ratios, as described in the most recent prospectus, are disclosed in the following “Fund expense ratios” table. Delaware Investments has agreed to reimburse certain expenses and/or waive certain fees from Jan. 1, 2009, through Dec. 31, 2009. Please see the most recent prospectus for additional information on these fee waivers and/or reimbursements.
| Fund expense ratios | Class A | Class B | Class C | Institutional Class | |||
| Total annual operating expenses | 0.94% | 1.70% | 1.70% | 0.70% | |||
| (without fee waivers) | |||||||
| Net expenses | 0.84% | 1.60% | 1.60% | 0.60% | |||
| (including fee waivers, if any) | |||||||
| Type of waiver | Contractual | Contractual | Contractual | Contractual |
Performance of a $10,000 investment
Average annual total returns from Aug. 31, 1999, through Aug. 31, 2009
![]()
| For period beginning Aug. 31, 1999, through Aug. 31, 2009 | Starting value | Ending value | ||
| Barclays Capital Municipal Bond Index | $10,000 | $16,924 | ||
| Delaware Tax-Free USA Fund — Class A Shares | $9,550 | $15,191 | ||
The chart assumes $10,000 invested in the Fund on Aug. 31, 1999 and includes the effect of a 4.50% front-end sales charge and the reinvestment of all distributions. Please note additional details on these fees in the “Performance summary” section of this report, which includes pages 7 through 10.
The chart also assumes $10,000 invested in the Barclays Capital Municipal Bond Index as of Aug. 31, 1999. The Barclays Capital Municipal Bond Index, formerly the Lehman Brothers Municipal Bond Index, measures the total return performance of the long-term, investment grade tax-exempt bond market.
9
Performance summaries
Delaware Tax-Free USA Fund
An index is unmanaged and does not reflect the costs of operating a mutual fund, such as the costs of buying, selling, and holding securities. You cannot invest directly in an index.
Performance of other Fund classes will vary due to different charges and expenses.
The “Fund performance” chart and the “Performance of a $10,000 investment” graph do not reflect the deduction of taxes the shareholders would pay on Fund distributions or redemptions of Fund shares. Past performance does not guarantee future results.
| Stock symbols and CUSIP numbers | |||||||
| Nasdaq symbols | CUSIPs | ||||||
| Class A | DMTFX | 245909106 | |||||
| Class B | DTFCX | 245909403 | |||||
| Class C | DUSCX | 245909700 | |||||
| Institutional Class | DTFIX | 24610H104 | |||||
10
| Delaware Tax-Free USA Intermediate Fund | Aug. 31, 2009 |
The performance data quoted represent past performance; past performance does not guarantee future results. Investment return and principal value will fluctuate so your shares, when redeemed, may be worth more or less than their original cost. Please obtain the performance data for the most recent month end by calling 800 523-1918 or visiting our Web site at www.delawareinvestments.com/performance. Current performance may be lower or higher than the performance data quoted.
You should consider the investment objectives, risks, charges, and expenses of the investment company carefully before investing. The Delaware Tax-Free USA Intermediate Fund prospectus contains this and other important information about the investment company. Please request a prospectus through your financial advisor or by calling 800 523-1918 or visiting our Web site at www.delawareinvestments.com. Read the prospectus carefully before you invest or send money.
A rise or fall in interest rates can have a significant impact on bond prices and the net asset value (NAV) of the Fund. Funds that invest in bonds can lose their value as interest rates rise, and an investor can lose principal.
| Fund performance | Average annual total returns through Aug. 31, 2009 | |||||||||||||||||||
| 1 year | 5 years | 10 years | Lifetime | |||||||||||||||||
| Class A (Est. Jan. 7, 1993) | ||||||||||||||||||||
| Excluding sales charge | +5.49 | % | +3.72 | % | +5.10 | % | +5.27 | % | ||||||||||||
| Including sales charge | +2.57 | % | +3.15 | % | +4.81 | % | +5.09 | % | ||||||||||||
| Class B (Est. May 2, 1994) | ||||||||||||||||||||
| Excluding sales charge | +4.61 | % | +2.85 | % | +4.65 | % | +4.83 | % | ||||||||||||
| Including sales charge | +2.61 | % | +2.85 | % | +4.65 | % | +4.83 | % | ||||||||||||
| Class C (Est. Nov. 29, 1995) | ||||||||||||||||||||
| Excluding sales charge | +4.60 | % | +2.83 | % | +4.20 | % | +4.02 | % | ||||||||||||
| Including sales charge | +3.60 | % | +2.83 | % | +4.20 | % | +4.02 | % | ||||||||||||
| Institutional Class (Est. Dec. 31, 2008) | ||||||||||||||||||||
| Excluding sales charge | n/a | n/a | n/a | +8.68 | % | |||||||||||||||
| Including sales charge | n/a | n/a | n/a | +8.68 | % | |||||||||||||||
Returns reflect the reinvestment of all distributions and any applicable sales charges as noted in the following paragraphs.
Performance for Class B and C shares, excluding sales charges, assumes either that contingent deferred sales charges did not apply or that the investment was not redeemed.
Expense limitations were in effect for all classes during the periods shown in the Fund performance chart and in the “Performance of a $10,000 investment” chart. The current expenses for each class are listed on the “Fund expenses” chart. (Note that all charts and graphs referred to in the “Performance summary” section of this report are found on pages 11 through 13.) Performance would have been lower had the expense limitation not been in effect.
11
Performance summaries
Delaware Tax-Free USA Intermediate Fund
The Fund offers Class A, B, C, and Institutional Class shares. Class A shares are sold with a maximum front-end sales charge of up to 2.75%, and have an annual distribution and service fee of up to 0.30% of average daily net assets.
Class B shares may only be purchased through dividend reinvestment and certain permitted exchanges as described in the prospectus. Please see the prospectus for additional information on Class B purchase and sales charges. Class B shares have a contingent deferred sales charge that declines from 2.00% to zero depending on the period of time the shares are held.
Class B shares will automatically convert to Class A shares on a quarterly basis approximately five years after purchase. They are also subject to an annual distribution and service fee of up to 1.00% of average daily net assets.
Ten-year and lifetime performance figures for Class B shares reflect conversion to Class A shares after approximately five years.
Class C shares are sold with a contingent deferred sales charge of 1.00% if redeemed during the first 12 months. They are also subject to an annual distribution and service fee of 1.00% of average daily net assets.
Institutional Class shares were first made available Dec. 31, 2008, and are available without sales or asset-based distribution charges only to certain eligible institutional accounts.
The “Fund performance” table and the “Performance of a $10,000 investment” graph do not reflect the deduction of taxes the shareholders would pay on Fund distributions or redemptions of Fund shares.
Fixed income securities and bond funds can lose value, and investors can lose principal, as interest rates rise. They also may be affected by economic conditions that hinder an issuer’s ability to make interest and principal payments on its debt. High yielding, noninvestment grade bonds (junk bonds) involve higher risk than investment grade bonds.
The Fund may also be subject to prepayment risk, the risk that the principal of a fixed income security that is held by the Fund may be prepaid prior to maturity, potentially forcing the Fund to reinvest that money at a lower interest rate.
Substantially all dividend income derived from tax-free funds is exempt from federal income tax. Some income may be subject to the federal alternative minimum tax that applies to certain investors. Capital gains, if any, are taxable.
The Fund’s expense ratios, as described in the most recent prospectus, are disclosed in the following “Fund expense ratios” table. Delaware Investments has agreed to reimburse certain expenses and/or waive certain fees from Jan. 1, 2009, through Dec. 31, 2009. Please see the most recent prospectus for additional information on these fee waivers and/or reimbursements.
| Fund expense ratios | Class A | Class B | Class C | Institutional Class | |||
| Total annual operating expenses | 1.03% | 1.73% | 1.73% | 0.73% | |||
| (without fee waivers) | |||||||
| Net expenses | 0.75% | 1.60% | 1.60% | 0.60% | |||
| (including fee waivers, if any) | |||||||
| Type of waiver | Contractual | Contractual | Contractual | Contractual |
12
Performance of a $10,000 investment
Average annual total returns from Aug. 31, 1999, through Aug. 31, 2009
| For period beginning Aug. 31, 1999, through Aug. 31, 2009 | Starting value | Ending value | ||
| Barclays Capital 3–15 Year Municipal Bond Index | $10,000 | $16,917 | ||
| Delaware Tax-Free USA Intermediate Fund — Class A Shares | $9,725 | $15,975 | ||
The chart assumes $10,000 invested in the Fund on Aug. 31, 1999, and includes the effect of a 2.75% front-end sales charge and the reinvestment of all distributions. Please note additional details on these fees in the “Performance summary” section of this report, which includes pages 11 through 13.
The chart also assumes $10,000 invested in the Barclays Capital 3–15 Year Municipal Bond Index as of Aug. 31, 1999. The Barclays Capital 3–15 Year Municipal Bond Index, formerly the Lehman Brothers 3–15 Year Municipal Bond Index, measures the total return performance of investment grade, U.S. tax-exempt bonds with maturities from 2 to 17 years.
An index is unmanaged and does not reflect the costs of operating a mutual fund, such as the costs of buying, selling, and holding securities. You cannot invest directly in an index.
Performance of other Fund classes will vary due to different charges and expenses.
The “Fund performance” chart and the “Performance of a $10,000 investment” graph do not reflect the deduction of taxes the shareholders would pay on Fund distributions or redemptions of Fund shares.
Past performance does not guarantee future results.
| Stock symbols and CUSIP numbers | |||||||
| Nasdaq symbols | CUSIPs | ||||||
| Class A | DMUSX | 245909304 | |||||
| Class B | DUIBX | 245909601 | |||||
| Class C | DUICX | 245909882 | |||||
| Institutional Class | DUSIX | 24610H203 | |||||
13
| Performance summaries | |
| Delaware National High-Yield Municipal Bond Fund | Aug. 31, 2009 |
The performance data quoted represent past performance; past performance does not guarantee future results. Investment return and principal value will fluctuate so your shares, when redeemed, may be worth more or less than their original cost. Please obtain the performance data for the most recent month end by calling 800 523-1918 or visiting our Web site at www.delawareinvestments.com/performance. Current performance may be lower or higher than the performance data quoted.
You should consider the investment objectives, risks, charges, and expenses of the investment company carefully before investing. The Delaware National High-Yield Municipal Bond Fund prospectus contains this and other important information about the investment company. Please request a prospectus through your financial advisor or by calling 800 523-1918 or visiting our Web site at www.delawareinvestments.com. Read the prospectus carefully before you invest or send money.
A rise or fall in interest rates can have a significant impact on bond prices and the net asset value (NAV) of the Fund. Funds that invest in bonds can lose their value as interest rates rise, and an investor can lose principal.
| Fund performance | Average annual total returns through Aug. 31, 2009 | |||||||||||||||||||
| 1 year | 5 years | 10 years | Lifetime | |||||||||||||||||
| Class A (Est. Sept. 22, 1986) | ||||||||||||||||||||
| Excluding sales charge | -0.38 | % | +2.77 | % | +3.81 | % | +5.94 | % | ||||||||||||
| Including sales charge | -4.88 | % | +1.83 | % | +3.33 | % | +5.73 | % | ||||||||||||
| Class B (Est. Dec. 18, 1996) | ||||||||||||||||||||
| Excluding sales charge | -1.11 | % | +2.00 | % | +3.17 | % | +3.82 | % | ||||||||||||
| Including sales charge | -4.86 | % | +1.75 | % | +3.17 | % | +3.82 | % | ||||||||||||
| Class C (Est. May 26, 1997) | ||||||||||||||||||||
| Excluding sales charge | -1.11 | % | +2.02 | % | +3.04 | % | +3.42 | % | ||||||||||||
| Including sales charge | -2.04 | % | +2.02 | % | +3.04 | % | +3.42 | % | ||||||||||||
| Institutional Class (Est. Dec. 31, 2008) | ||||||||||||||||||||
| Excluding sales charge | n/a | n/a | n/a | +22.55 | % | |||||||||||||||
| Including sales charge | n/a | n/a | n/a | +22.55 | % | |||||||||||||||
Returns reflect the reinvestment of all distributions and any applicable sales charges as noted in the following paragraphs.
Performance for Class B and C shares, excluding sales charges, assumes either that contingent deferred sales charges did not apply or that the investment was not redeemed.
Expense limitations were in effect for all classes during the periods shown in the Fund performance chart and in the “Performance of a $10,000 investment” chart. The current expenses for each class are listed on the “Fund expenses” chart. (Note that all charts and graphs referred to in the “Performance summary” section of this report are found on pages 14 through 17.) Performance would have been lower had the expense limitation not been in effect.
14
The Fund offers Class A, B, C, and Institutional Class shares. Class A shares are sold with a maximum front-end sales charge of up to 4.50%, and have an annual distribution and service fee of up to 0.25% of average daily net assets.
Class B shares may only be purchased through dividend reinvestment and certain permitted exchanges as described in the prospectus. Please see the prospectus for additional information on Class B purchase and sales charges. Class B shares have a contingent deferred sales charge that declines from 4.00% to zero depending on the period of time the shares are held.
Class B shares will automatically convert to Class A shares on a quarterly basis approximately eight years after purchase. They are also subject to an annual distribution and service fee of up to 1.00% of average daily net assets.
Class B shares may only be purchased through dividend reinvestment and certain permitted exchanges as described in the prospectus. Please see the prospectus for additional information on Class B purchase and sales charges. Class B shares have a contingent deferred sales charge that declines from 4.00% to zero depending on the period of time the shares are held.
Ten-year and lifetime performance figures for Class B shares reflect conversion to Class A shares after approximately eight years.
Class C shares are sold with a contingent deferred sales charge of 1.00% if redeemed during the first 12 months. They are also subject to an annual distribution and service fee of 1.00% of average daily net assets.
Institutional Class shares were first made available Dec. 31, 2008, and are available without sales or asset-based distribution charges only to certain eligible institutional accounts.
The “Fund performance” table and the “Performance of a $10,000 investment” graph do not reflect the deduction of taxes the shareholder would pay on Fund distributions or redemptions of Fund shares.
Fixed income securities and bond funds can lose value, and investors can lose principal, as interest rates rise. They also may be affected by economic conditions that hinder an issuer’s ability to make interest and principal payments on its debt. High yielding, noninvestment grade bonds (junk bonds) involve higher risk than investment grade bonds.
The Fund may also be subject to prepayment risk, the risk that the principal of a fixed income security that is held by the Fund may be prepaid prior to maturity, potentially forcing the Fund to reinvest that money at a lower interest rate.
Substantially all dividend income derived from tax-free funds is exempt from federal income tax. Some income may be subject to the federal alternative minimum tax that applies to certain investors. Capital gains, if any, are taxable.
15
Performance summaries
Delaware National High-Yield Municipal Bond Fund
The Fund’s expense ratios, as described in the most recent prospectus, are disclosed in the following “Fund expense ratios” table. Delaware Investments has agreed to reimburse certain expenses and/or waive certain fees from Jan. 1, 2009, through Dec. 31, 2009. Please see the most recent prospectus for additional information on these fee waivers and/or reimbursements.
| Fund expense ratios | Class A | Class B | Class C | Institutional Class | |||
| Total annual operating expenses | 1.04% | 1.79% | 1.79% | 0.79% | |||
| (without fee waivers) | |||||||
| Net expenses | 0.90% | 1.65% | 1.65% | 0.65% | |||
| (including fee waivers, if any) | |||||||
| Type of waiver | Contractual | Contractual | Contractual | Contractual |
Performance of a $10,000 investment
Average annual total returns from Aug. 31, 1999, through Aug. 31, 2009
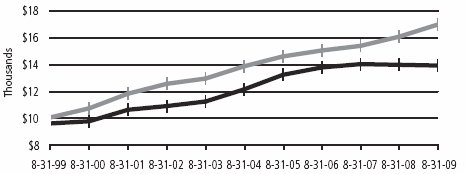
| For period beginning Aug. 31, 1999, through Aug. 31, 2009 | Starting value | Ending value | ||
| Barclays Capital Municipal Bond Index | $10,000 | $16,924 | ||
| Delaware National High-Yield Municipal Bond Fund — Class A Shares | $9,550 | $13,864 | ||
The chart assumes $10,000 invested in the Fund on Aug. 31, 1999, and includes the effect of a 4.50% front-end sales charge and the reinvestment of all distributions. Please note additional details on these fees in the “Performance summary” section of this report, which includes pages 14 through 17.
The chart also assumes $10,000 invested in the Barclays Capital Municipal Bond Fund as of Aug. 31, 1999. The Barclays Capital Municipal Bond Index, formerly the Lehman Brothers Municipal Bond Index, measures the total return performance of the long-term, investment grade tax-exempt bond market.
An index is unmanaged and does not reflect the costs of operating a mutual fund, such as the costs of buying, selling, and holding securities. You cannot invest directly in an index.
16
Performance of other Fund classes will vary due to different charges and expenses.
The “Fund performance” chart and the “Performance of a $10,000 investment” graph do not reflect the deduction of taxes the shareholders would pay on Fund distributions or redemptions of Fund shares.
Past performance does not guarantee future results.
| Stock symbols and CUSIP numbers | |||||||
| Nasdaq symbols | CUSIPs | ||||||
| Class A | CXHYX | 928928241 | |||||
| Class B | DVNYX | 928928233 | |||||
| Class C | DVHCX | 928928225 | |||||
| Institutional Class | DVHIX | 24610H302 | |||||
17
Disclosure of Fund expenses
For the period March 1, 2009 to August 31, 2009
As a shareholder of a Fund, you incur two types of costs: (1) transaction costs, including sales charges (loads) on purchase payments, reinvested dividends, or other distributions; redemption fees; and exchange fees; and (2) ongoing costs, including management fees; distribution and/or service (12b-1) fees; and other Fund expenses. These following examples are intended to help you understand your ongoing costs (in dollars) of investing in a Fund and to compare these costs with the ongoing costs of investing in other mutual funds.
The examples are based on an investment of $1,000 invested at the beginning of the period and held for the entire period March 1, 2009 to August 31, 2009.
Actual expenses
The first section of the tables shown, “Actual Fund Return,” provides information about actual account values and actual expenses. You may use the information in this section of the table, together with the amount you invested, to estimate the expenses that you paid over the period. Simply divide your account value by $1,000 (for example, an $8,600 account value divided by $1,000 = 8.6), then multiply the result by the number in the first section under the heading entitled “Expenses Paid During Period” to estimate the expenses you paid on your account during this period.
Hypothetical example for comparison purposes
The second section of the tables shown, “Hypothetical 5% Return,” provides information about hypothetical account values and hypothetical expenses based on the Funds’ actual expense ratios and an assumed rate of return of 5% per year before expenses, which is not the Funds’ actual return. The hypothetical account values and expenses may not be used to estimate the actual ending account balance or expenses you paid for the period. You may use this information to compare the ongoing costs of investing in the Fund and other funds. To do so, compare this 5% hypothetical example with the 5% hypothetical examples that appear in the shareholder reports of the other funds.
Please note that the expenses shown in the tables are meant to highlight your ongoing costs only and do not reflect any transactional costs, such as sales charges (loads), redemption fees, or exchange fees. Therefore, the second section of each table is useful in comparing ongoing costs only, and will not help you determine the relative total costs of owning different funds. In addition, if these transactional costs were included, your costs would have been higher. The Fund’s expenses shown in the tables reflect fee waivers in effect. The expenses shown in each table assume reinvestment of all dividends and distributions.
18
Delaware Tax-Free USA Fund
Expense analysis of an investment of $1,000
| Beginning | Ending | Expenses | ||||||||||
| Account Value | Account Value | Annualized | Paid During Period | |||||||||
| 3/1/09 | 8/31/09 | Expense Ratio | 3/1/09 to 8/31/09* | |||||||||
| Actual Fund return | ||||||||||||
| Class A | $1,000.00 | $1,075.70 | 0.84% | $4.39 | ||||||||
| Class B | 1,000.00 | 1,070.60 | 1.60% | 8.35 | ||||||||
| Class C | 1,000.00 | 1,070.60 | 1.60% | 8.35 | ||||||||
| Institutional Class | 1,000.00 | 1,076.50 | 0.60% | 3.14 | ||||||||
| Hypothetical 5% return (5% return before expenses) | ||||||||||||
| Class A | $1,000.00 | $1,020.97 | 0.84% | $4.28 | ||||||||
| Class B | 1,000.00 | 1,017.14 | 1.60% | 8.13 | ||||||||
| Class C | 1,000.00 | 1,017.14 | 1.60% | 8.13 | ||||||||
| Institutional Class | 1,000.00 | 1,022.18 | 0.60% | 3.06 | ||||||||
Delaware Tax-Free USA Intermediate Fund
Expense analysis of an investment of $1,000
| Beginning | Ending | Expenses | ||||||||||
| Account Value | Account Value | Annualized | Paid During Period | |||||||||
| 3/1/09 | 8/31/09 | Expense Ratio | 3/1/09 to 8/31/09* | |||||||||
| Actual Fund return | ||||||||||||
| Class A | $1,000.00 | $1,052.90 | 0.75% | $3.88 | ||||||||
| Class B | 1,000.00 | 1,048.50 | 1.60% | 8.26 | ||||||||
| Class C | 1,000.00 | 1,047.40 | 1.60% | 8.26 | ||||||||
| Institutional Class | 1,000.00 | 1,053.30 | 0.60% | 3.11 | ||||||||
| Hypothetical 5% return (5% return before expenses) | ||||||||||||
| Class A | $1,000.00 | $1,021.42 | 0.75% | $3.82 | ||||||||
| Class B | 1,000.00 | 1,017.14 | 1.60% | 8.13 | ||||||||
| Class C | 1,000.00 | 1,017.14 | 1.60% | 8.13 | ||||||||
| Institutional Class | 1,000.00 | 1,022.18 | 0.60% | 3.06 | ||||||||
19
Disclosure of Fund expenses
Delaware National High-Yield Municipal Bond Fund
Expense analysis of an investment of $1,000
| Beginning | Ending | Expenses | ||||||||||
| Account Value | Account Value | Annualized | Paid During Period | |||||||||
| 3/1/09 | 8/31/09 | Expense Ratio | 3/1/09 to 8/31/09* | |||||||||
| Actual Fund return | ||||||||||||
| Class A | $1,000.00 | $1,145.10 | 0.90% | $4.87 | ||||||||
| Class B | 1,000.00 | 1,142.00 | 1.65% | 8.91 | ||||||||
| Class C | 1,000.00 | 1,141.70 | 1.65% | 8.91 | ||||||||
| Institutional Class | 1,000.00 | 1,146.10 | 0.65% | 3.52 | ||||||||
| Hypothetical 5% return (5% return before expenses) | ||||||||||||
| Class A | $1,000.00 | $1,020.67 | 0.90% | $4.58 | ||||||||
| Class B | 1,000.00 | 1,016.89 | 1.65% | 8.39 | ||||||||
| Class C | 1,000.00 | 1,016.89 | 1.65% | 8.39 | ||||||||
| Institutional Class | 1,000.00 | 1,021.93 | 0.65% | 3.31 | ||||||||
*“Expenses Paid During Period” are equal to a Fund’s annualized expense ratio, multiplied by the average account value over the period, multiplied by 184/365 (to reflect the one-half year period).
20
| Sector allocations and credit quality breakdowns | |
| Delaware Tax-Free USA Fund | As of August 31, 2009 |
Sector designations may be different than the sector designations presented in other Fund materials.
| Sector | Percentage of net assets | |
| Municipal Bonds | 98.16 | % |
| Corporate Revenue Bonds | 15.83 | % |
| Education Revenue Bonds | 6.89 | % |
| Electric Revenue Bonds | 2.13 | % |
| Escrowed to Maturity Bonds | 7.09 | % |
| Health Care Revenue Bonds | 13.12 | % |
| Housing Revenue Bonds | 1.24 | % |
| Lease Revenue Bonds | 2.44 | % |
| Local General Obligation Bonds | 5.67 | % |
| Pre-Refunded Bonds | 14.44 | % |
| Special Tax Bonds | 8.73 | % |
| State General Obligation Bonds | 5.38 | % |
| Transportation Revenue Bonds | 11.74 | % |
| Water & Sewer Revenue Bonds | 3.46 | % |
| Total Value of Securities | 98.16 | % |
| Receivables and Other Assets Net of Liabilities | 1.84 | % |
| Total Net Assets | 100.00 | % |
| Credit quality breakdown (as a % of fixed income investments)* | ||
| AAA | 26.09 | % |
| AA | 11.86 | % |
| A | 27.31 | % |
| BBB | 23.61 | % |
| BB | 1.64 | % |
| B | 1.35 | % |
| CCC | 0.68 | % |
| Not Rated | 7.46 | % |
| Total | 100.00 | % |
*Bond ratings are determined by independent, nationally recognized statistical rating organizations.
21
| Sector allocations and credit quality breakdowns | |
| Delaware Tax-Free USA Intermediate Fund | As of August 31, 2009 |
Sector designations may be different than the sector designations presented in other Fund materials.
| Sector | Percentage of net assets | |
| Municipal Bonds | 98.82 | % |
| Corporate Revenue Bonds | 10.09 | % |
| Education Revenue Bonds | 4.02 | % |
| Electric Revenue Bonds | 3.16 | % |
| Escrowed to Maturity Bonds | 0.04 | % |
| Health Care Revenue Bonds | 11.30 | % |
| Housing Revenue Bonds | 1.43 | % |
| Lease Revenue Bonds | 2.54 | % |
| Local General Obligation Bonds | 8.77 | % |
| Pre-Refunded Bonds | 7.06 | % |
| Resource Recovery Bonds | 0.24 | % |
| Special Tax Bonds | 11.74 | % |
| State General Obligation Bonds | 20.40 | % |
| Transportation Revenue Bonds | 11.05 | % |
| Water & Sewer Revenue Bonds | 6.98 | % |
| Short-Term Investments | 1.24 | % |
| Total Value of Securities | 100.06 | % |
| Liabilities Net of Receivables and Other Assets | (0.06 | %) |
| Total Net Assets | 100.00 | % |
| Credit quality breakdown (as a % of fixed income investments)* | ||
| AAA | 21.23 | % |
| AA | 31.80 | % |
| A | 26.95 | % |
| BBB | 14.61 | % |
| BB | 0.95 | % |
| B | 0.42 | % |
| CCC | 0.25 | % |
| Not Rated | 3.79 | % |
| Total | 100.00 | % |
*Bond ratings are determined by independent, nationally recognized statistical rating organizations.
22
| Delaware National High-Yield Municipal Bond Fund | As of August 31, 2009 |
Sector designations may be different than the sector designations presented in other Fund materials.
| Sector | Percentage of net assets | |
| Municipal Bonds | 99.99 | % |
| Corporate Revenue Bonds | 24.03 | % |
| Education Revenue Bonds | 20.34 | % |
| Health Care Revenue Bonds | 26.39 | % |
| Housing Revenue Bonds | 1.29 | % |
| Lease Revenue Bonds | 2.13 | % |
| Pre-Refunded Bonds | 3.67 | % |
| Special Tax Bonds | 13.19 | % |
| State General Obligation Bonds | 2.03 | % |
| Transportation Revenue Bonds | 6.92 | % |
| Short-Term Investment | 0.38 | % |
| Total Value of Securities | 100.37 | % |
| Liabilities Net of Receivables and Other Assets | (0.37 | %) |
| Total Net Assets | 100.00 | % |
| Credit quality breakdown (as a % of fixed income investments)* | ||
| AAA | 3.60 | % |
| AA | 1.28 | % |
| A | 17.77 | % |
| BBB | 40.22 | % |
| BB | 7.93 | % |
| B | 4.82 | % |
| CCC | 0.57 | % |
| Not Rated | 23.81 | % |
| Total | 100.00 | % |
*Bond ratings are determined by independent, nationally recognized statistical rating organizations.
23
| Statements of net assets | |
| Delaware Tax-Free USA Fund | August 31, 2009 |
| Principal amount | Value | |||||||
| Municipal Bonds – 98.16% | ||||||||
| Corporate Revenue Bonds – 15.83% | ||||||||
| Alliance Airport Authority, Texas Special Facilities | ||||||||
| Revenue (American Airlines Project) Series B | ||||||||
| 5.25% 12/1/29 (AMT) | $ | 2,250,000 | $ | 942,413 | ||||
| · | Brazos, Texas Harbor Industrial Development | |||||||
| Environmental Facilities Revenue | ||||||||
| (Dow Chemical Co. Project) 5.90% 5/1/38 (AMT) | 1,940,000 | 1,805,480 | ||||||
| Brazos, Texas River Authority Pollution Control Revenue | ||||||||
| (Texas Utilities) 5.40% 5/1/29 (AMT) | 3,000,000 | 1,271,310 | ||||||
| (TXU Energy Co. Project) Series B 6.30% 7/1/32 (AMT) | 3,500,000 | 1,551,760 | ||||||
| Buckeye, Ohio Tobacco Settlement Financing Authority | ||||||||
| Asset-Backed Series A-2 | ||||||||
| 5.875% 6/1/47 | 8,040,000 | 5,930,384 | ||||||
| 6.50% 6/1/47 | 3,670,000 | 2,959,268 | ||||||
| Cloquet, Minnesota Pollution Control Revenue | ||||||||
| (Potlatch Corp. Project) 5.90% 10/1/26 | 1,695,000 | 1,225,790 | ||||||
| Golden State, California Tobacco Securitization | ||||||||
| Corporation Settlement Revenue Refunding | ||||||||
| Asset-Backed Senior Series A-1 | 1,530,000 | 1,073,984 | ||||||
| 5.125% 6/1/47 | ||||||||
| 5.75% 6/1/47 | 2,150,000 | 1,677,022 | ||||||
| Hawaii State Department Budget & Finance Special | ||||||||
| Purpose Revenue (Hawaiian Electric Co. Subsidiary) | ||||||||
| 6.50% 7/1/39 | 5,350,000 | 5,610,759 | ||||||
| Indianapolis, Indiana Airport Authority Revenue Special | ||||||||
| Facilities (Federal Express Corp. Project) | ||||||||
| 5.10% 1/15/17 (AMT) | 2,750,000 | 2,533,905 | ||||||
| Series 1998 5.50% 5/1/29 (AMT) | 2,000,000 | 1,536,840 | ||||||
| Iowa Finance Authority Pollution Control Facility Revenue | ||||||||
| (Interstate Power) 5.00% 7/1/14 (FGIC) | 3,640,000 | 3,819,561 | ||||||
| Mason County, West Virginia Pollution Control Revenue | ||||||||
| (Appalachian Power Co. Project) Series K | ||||||||
| 6.05% 12/1/24 (AMBAC) | 3,000,000 | 3,012,090 | ||||||
| Michigan Tobacco Settlement Finance Authority | ||||||||
| Asset-Backed Series A 6.00% 6/1/48 | 4,445,000 | 3,424,161 | ||||||
| Mississippi Business Finance Corporation Pollution Control | ||||||||
| Revenue (System Energy Resources, Inc. Project) | ||||||||
| 5.90% 5/1/22 | 3,000,000 | 2,817,600 | ||||||
24
| Principal amount | Value | |||||||
| Municipal Bonds (continued) | ||||||||
| Corporate Revenue Bonds (continued) | ||||||||
| · | Mobile, Alabama Industrial Development Board | |||||||
| Pollution Control Revenue (Alabama Power Co.) | ||||||||
| Series B 4.875% 6/1/34 | $ | 4,750,000 | $ | 5,011,013 | ||||
| M-S-R Energy Authority, California Gas Revenue Series A | ||||||||
| 6.125% 11/1/29 | 1,915,000 | 1,909,312 | ||||||
| 6.50% 11/1/39 | 3,915,000 | 3,946,398 | ||||||
| Nassau County, New York Tobacco Settlement | ||||||||
| Asset-Backed Series A-3 5.125% 6/1/46 | 2,215,000 | 1,626,032 | ||||||
| New Jersey Economic Development Authority Special | ||||||||
| Facility Revenue (Continental Airlines Inc. Project) | ||||||||
| 6.25% 9/15/29 (AMT) | 2,000,000 | 1,611,840 | ||||||
| Ohio State Air Quality Development Authority Revenue | ||||||||
| Environmental Improvement (First Energy Generation) | ||||||||
| Series A 5.70% 8/1/20 | 4,750,000 | 4,909,695 | ||||||
| Pennsylvania Economic Development Financing Authority | ||||||||
| Exempt Facilities Revenue (Allegheny Energy Supply Co.) | ||||||||
| 7.00% 7/15/39 | 6,340,000 | 6,562,978 | ||||||
| Petersburg, Indiana Pollution Control Revenue | ||||||||
| (Indianapolis Power & Light Co. Project) | ||||||||
| 6.375% 11/1/29 (AMT) | 5,000,000 | 4,705,500 | ||||||
| Phenix City, Alabama Industrial Development Board | ||||||||
| Environmental Improvement Revenue | ||||||||
| (Mead Westvaco Corp. Project) | ||||||||
| Series A 6.35% 5/15/35 (AMT) | 3,000,000 | 2,396,430 | ||||||
| Richmond County, Georgia Development Authority | ||||||||
| Environmental Improvement Revenue (International | ||||||||
| Paper Co.) Series B 5.95% 11/15/25 (AMT) | 5,000,000 | 4,497,550 | ||||||
| Salt Verde Financial Corporation, Arizona Senior Gas | ||||||||
| Revenue 5.00% 12/1/37 | 5,500,000 | 4,611,860 | ||||||
| South Carolina Jobs Economic Development Authority | ||||||||
| Industrial Revenue (South Carolina Electric & Gas Co. | ||||||||
| Project) Series B 5.45% 11/1/32 (AMBAC) (AMT) | 500,000 | 471,735 | ||||||
| Sugar Creek, Missouri Industrial Development Revenue | ||||||||
| (Lafarge North America Project) Series A | ||||||||
| 5.65% 6/1/37 (AMT) | 500,000 | 382,160 | ||||||
| Sweetwater County, Wyoming Solid Waste Disposal | ||||||||
| Revenue (FMC Corp. Project) 5.60% 12/1/35 (AMT) | 3,250,000 | 2,855,905 | ||||||
25
Statements of net assets
Delaware Tax-Free USA Fund
| Principal amount | Value | |||||||
| Municipal Bonds (continued) | ||||||||
| Corporate Revenue Bonds (continued) | ||||||||
| Tobacco Settlement Financing Corporation, Virginia Senior | ||||||||
| WConvertible Series B-2 5.20% 6/1/46 | $ | 2,500,000 | $ | 1,350,050 | ||||
| Series B-1 5.00% 6/1/47 | 2,020,000 | 1,414,364 | ||||||
| 89,455,149 | ||||||||
| Education Revenue Bonds – 6.89% | ||||||||
| Amherst, New York Industrial Development Agency Civic | ||||||||
| Facilities Revenue (UBF Faculty Student Housing) | ||||||||
| Series A 5.75% 8/1/30 (AMBAC) | 1,300,000 | 1,325,740 | ||||||
| Broward County, Florida Educational Facilities Authority | ||||||||
| Revenue (Nova Southeastern Project) | ||||||||
| �� 5.25% 4/1/27 (RADIAN) | 1,000,000 | 903,050 | ||||||
| California Statewide Communities Development Authority | ||||||||
| Student Housing Revenue (East Campus Apartments, LLC) | ||||||||
| Series A 5.625% 8/1/34 (ACA) | 3,400,000 | 3,027,428 | ||||||
| Gainesville, Georgia Redevelopment Authority Educational | ||||||||
| Facilities Revenue (Riverside Military Academy Project) | ||||||||
| 5.125% 3/1/37 | 3,735,000 | 2,238,498 | ||||||
| Marietta, Georgia Development Authority Revenue | ||||||||
| (Life University Income Project) 7.00% 6/15/39 | 4,200,000 | 3,506,538 | ||||||
| Massachusetts State Health & Educational Facilities | ||||||||
| Authority Revenue | ||||||||
| (Harvard University) Series A 5.50% 11/15/36 | 4,515,000 | 4,980,767 | ||||||
| (Nichols College Project) Series C 6.125% 10/1/29 | 4,350,000 | 3,780,455 | ||||||
| Missouri State Health & Educational Facilities Authority | ||||||||
| Educational Facilities Revenue (Washington University) | ||||||||
| Series A 5.375% 3/15/39 | 5,000,000 | 5,388,049 | ||||||
| New Hampshire Higher Educational & Health Facilities | ||||||||
| Authority Revenue (New Hampton School Issue) | ||||||||
| 5.375% 10/1/28 | 3,070,000 | 2,370,900 | ||||||
| New Jersey State Educational Facilities Authority Revenue | ||||||||
| (University of Medical & Dentistry) Series B | ||||||||
| 7.50% 12/1/32 | 1,435,000 | 1,586,378 | ||||||
| ^ | Oregon Health & Science University Revenue (Capital | |||||||
| Appreciation Insured) Series A 5.50% 7/1/21 (NATL-RE) | 2,000,000 | 1,034,420 | ||||||
| Provo, Utah Charter School Revenue (Freedom Academy | ||||||||
| Foundation Project) 5.50% 6/15/37 | 1,750,000 | 1,220,310 | ||||||
26
| Principal amount | Value | |||||||
| Municipal Bonds (continued) | ||||||||
| Education Revenue Bonds (continued) | ||||||||
| Saint Louis, Missouri Industrial Development Authority | ||||||||
| Revenue (Confluence Academy Project) Series A | ||||||||
| 5.25% 6/15/25 | $ | 1,150,000 | $ | 844,687 | ||||
| 5.35% 6/15/32 | 2,300,000 | 1,570,900 | ||||||
| Texas A & M University Revenue Financing System | ||||||||
| 5.00% 5/15/17 | 4,060,000 | 4,698,800 | ||||||
| University of the Virgin Islands Series A 5.375% 6/1/34 | 500,000 | 442,350 | ||||||
| 38,919,270 | ||||||||
| Electric Revenue Bonds – 2.13% | ||||||||
| Chelan County, Washington Public Utilities District #001 | ||||||||
| Consolidated Revenue (Chelan Hydro System) | ||||||||
| Series A 5.45% 7/1/37 (AMBAC) (AMT) | 5,000,000 | 4,655,150 | ||||||
| Missouri State Environmental Improvement & Energy | ||||||||
| Resource Authority Pollution Control Revenue Refunding | ||||||||
| (St. Joseph Light & Power Company Project) | ||||||||
| 5.85% 2/1/13 (AMBAC) | 2,200,000 | 2,202,926 | ||||||
| Puerto Rico Electric Power Authority Power Revenue | ||||||||
| Series PP 5.00% 7/1/25 (NATL-RE) (FGIC) | 1,000,000 | 1,000,780 | ||||||
| Series TT 5.00% 7/1/37 | 1,105,000 | 1,034,103 | ||||||
| Series WW 5.50% 7/1/38 | 2,100,000 | 2,104,200 | ||||||
| Sikeston, Missouri Electric Revenue Refunding | ||||||||
| 6.00% 6/1/13 (NATL-RE) | 1,000,000 | 1,062,170 | ||||||
| 12,059,329 | ||||||||
| Escrowed to Maturity Bonds – 7.09% | ||||||||
| Cape Girardeau County, Missouri Industrial Development | ||||||||
| Authority Health Care Facilities Revenue (Southeast | ||||||||
| Missouri Hospital) 5.25% 6/1/16 (NATL-RE) | 440,000 | 495,713 | ||||||
| ^ | Greene County, Missouri Single Family Mortgage Revenue | |||||||
| Municipal Multiplier (Private Mortgage Insurance) | ||||||||
| 6.10% 3/1/16 | 1,225,000 | 1,013,259 | ||||||
| Louisiana Public Facilities Authority Hospital Revenue | ||||||||
| (Southern Baptist Hospital, Inc. Project) | ||||||||
| 8.00% 5/15/12 | 2,715,000 | 3,010,338 | ||||||
| New Jersey State Highway Authority Garden State Parkway | ||||||||
| General Revenue (Senior Parkway) | ||||||||
| 5.50% 1/1/14 (FGIC) | 5,000,000 | 5,773,400 | ||||||
| 5.50% 1/1/15 (FGIC) | 7,310,000 | 8,595,975 | ||||||
| 5.50% 1/1/16 (FGIC) | 1,000,000 | 1,193,090 | ||||||
27
Statements of net assets
Delaware Tax-Free USA Fund
| Principal amount | Value | |||||||
| Municipal Bonds (continued) | ||||||||
| Escrowed to Maturity Bonds (continued) | ||||||||
| Oklahoma State Turnpike Authority Revenue | ||||||||
| (First Senior) 6.00% 1/1/22 | $ | 13,535,000 | $ | 17,220,078 | ||||
| Virgin Islands Public Finance Authority Revenue | ||||||||
| Series A 7.30% 10/1/18 | 2,200,000 | 2,762,804 | ||||||
| 40,064,657 | ||||||||
| Health Care Revenue Bonds – 13.12% | ||||||||
| Allegheny County, Pennsylvania Hospital Development | ||||||||
| Authority Revenue (University of Pittsburgh Medical | ||||||||
| Center) Series A 5.00% 9/1/14 | 5,575,000 | 6,154,521 | ||||||
| Arizona Health Facilities Authority Revenue (Banner Health) | ||||||||
| Series D 5.375% 1/1/32 | 2,500,000 | 2,502,300 | ||||||
| Brevard County, Florida Health Facilities Authority Health | ||||||||
| Care Facilities Revenue (Heath First Inc. Project) | ||||||||
| Series B 7.00% 4/1/39 | 1,610,000 | 1,679,455 | ||||||
| Butler County, Pennsylvania Hospital Authority Revenue | ||||||||
| (Butler Health System Project) 7.125% 7/1/29 | 2,250,000 | 2,432,250 | ||||||
| Cape Girardeau County, Missouri Industrial Development | ||||||||
| Authority Health Care Facilities Revenue Unrefunded | ||||||||
| Balance (St. Francis Medical Center) Series A | ||||||||
| 5.50% 6/1/32 | 1,000,000 | 1,003,260 | ||||||
| Chatham County, Georgia Hospital Authority Revenue | ||||||||
| (Memorial Health Medical Center) Series A | ||||||||
| 6.125% 1/1/24 | 1,805,000 | 1,664,084 | ||||||
| @ | Cleveland-Cuyahoga County, Ohio Port Authority Revenue | |||||||
| Senior Housing (St. Clarence - Geac) Series A | ||||||||
| 6.25% 5/1/38 | 1,500,000 | 1,007,235 | ||||||
| Colorado Health Facilities Authority Revenue | ||||||||
| (Evangelical Lutheran) Series A 5.25% 6/1/34 | 4,275,000 | 3,899,783 | ||||||
| Cuyahoga County, Ohio Revenue (Cleveland Clinic Health | ||||||||
| Systems) Series A 5.50% 1/1/29 | 4,000,000 | 4,142,000 | ||||||
| Escambia County, Florida Health Facilities Authority Health | ||||||||
| Care Facilities Loan (VHA Program) | ||||||||
| 5.95% 7/1/20 (AMBAC) | 465,000 | 477,741 | ||||||
| Fairfax County, Virginia Industrial Development | ||||||||
| Authority Revenue (Inova Health System) Series A | ||||||||
| 5.50% 5/15/35 | 2,500,000 | 2,602,800 | ||||||
28
| Principal amount | Value | |||||||
| Municipal Bonds (continued) | ||||||||
| Health Care Revenue Bonds (continued) | ||||||||
| Gainesville & Hall County, Georgia Development Authority | ||||||||
| Revenue Senior Living Facilities (Lanier Village Estates | ||||||||
| Project) Series C 7.25% 11/15/29 | $ | 1,000,000 | $ | 1,012,390 | ||||
| Illinois Finance Authority Revenue (Silver Cross & Medical | ||||||||
| Centers) 7.00% 8/15/44 | 5,500,000 | 5,578,375 | ||||||
| Illinois Health Facilities Authority Revenue (Elmhurst | ||||||||
| Memorial Healthcare Project) 5.625% 1/1/28 | 2,000,000 | 1,819,880 | ||||||
| Indian River County, Florida Hospital District Revenue | ||||||||
| Refunding 6.10% 10/1/18 (FSA) | 3,000,000 | 3,003,450 | ||||||
| Lucas County, Ohio Health Care Facility Revenue | ||||||||
| (Sunset Retirement Communities) | ||||||||
| Series A 6.625% 8/15/30 | 2,000,000 | 2,001,180 | ||||||
| Maricopa County, Arizona Industrial Development | ||||||||
| Authority Health Facilities Revenue | ||||||||
| (Catholic Healthcare West) Series A 6.00% 7/1/39 | 3,690,000 | 3,714,133 | ||||||
| Michigan State Hospital Finance Authority Revenue | ||||||||
| (Ascension Health Credit Group) Series B | ||||||||
| 5.25% 11/15/26 | 3,500,000 | 3,596,635 | ||||||
| (Trinity Health Credit) Series C 5.375% 12/1/30 | 6,000,000 | 6,007,440 | ||||||
| Montgomery County, Pennsylvania Industrial Development | ||||||||
| Authority Retirement Community Revenue (Acts | ||||||||
| Retirement Communities) Series A 4.50% 11/15/36 | 2,000,000 | 1,506,820 | ||||||
| New York State Dormitory Authority Revenue Non State | ||||||||
| Supported Debt | ||||||||
| (North Shore LI Jewish Health System) Series A 5.50% 5/1/37 | 3,500,000 | 3,465,350 | ||||||
| (Orange Regional Medical Center) 6.50% 12/1/21 | 2,745,000 | 2,540,552 | ||||||
| North Carolina Medical Care Commission Health Care | ||||||||
| Facilities Revenue (First Mortgage - Presbyterian Homes) | ||||||||
| 5.40% 10/1/27 | 3,260,000 | 2,766,371 | ||||||
| Ohio State Higher Educational Facility Community Revenue | ||||||||
| (Cleveland Clinic Health System Obligation Group) | ||||||||
| Series A 5.25% 1/1/33 | 2,000,000 | 2,045,900 | ||||||
| Oregon Health Sciences University Revenue | ||||||||
| Series A 5.75% 7/1/39 | 3,700,000 | 3,823,173 | ||||||
| Puerto Rico Industrial, Tourist, Educational, Medical & | ||||||||
| Environmental Control Facilities Revenue (Hospital Auxilio | ||||||||
| Mutuo Obligated Group) Series A 6.25% 7/1/24 (NATL-RE) | 1,200,000 | 1,200,516 | ||||||
29
Statements of net assets
Delaware Tax-Free USA Fund
| Principal amount | Value | |||||||
| Municipal Bonds (continued) | ||||||||
| Health Care Revenue Bonds (continued) | ||||||||
| Tallahassee, Florida Health Facilities Revenue | ||||||||
| (Tallahassee Memorial Regional Medical Center) | ||||||||
| Series B 6.00% 12/1/15 (NATL-RE) | $ | 2,500,000 | $ | 2,502,725 | ||||
| 74,150,319 | ||||||||
| Housing Revenue Bonds – 1.24% | ||||||||
| Florida Housing Finance Agency | ||||||||
| (Landings at Sea Forest Apartments) Series T | ||||||||
| 5.85% 12/1/18 (AMBAC) (FHA) (AMT) | 310,000 | 310,155 | ||||||
| 6.05% 12/1/36 (AMBAC) (FHA) (AMT) | 700,000 | 699,937 | ||||||
| (Spinnaker Cove Apartments) Series G 6.50% 7/1/36 | ||||||||
| (AMBAC) (FHA) (AMT) | 500,000 | 500,135 | ||||||
| Milwaukee, Wisconsin Redevelopment Authority | ||||||||
| Multifamily Revenue (City Hall Square) | ||||||||
| 6.30% 8/1/38 (FHA) (AMT) | 1,455,000 | 1,459,453 | ||||||
| Missouri State Housing Development Commission | ||||||||
| Mortgage Revenue Single Family Homeowner | ||||||||
| Loan A 5.20% 9/1/33 (GNMA) (FNMA) (AMT) | 210,000 | 206,327 | ||||||
| Missouri State Housing Development Commission | ||||||||
| Multifamily Housing Revenue | ||||||||
| (Hyder) Series 3 5.60% 7/1/34 (FHA) (AMT) | 1,435,000 | 1,442,232 | ||||||
| (San Remo) Series 5 5.45% 1/1/36 (FHA) (AMT) | 500,000 | 497,190 | ||||||
| New Mexico Mortgage Finance Authority Revenue | ||||||||
| Series B Class III 6.75% 7/1/25 (GNMA) (FNMA) | 105,000 | 108,527 | ||||||
| Series E 6.95% 1/1/26 (GNMA) (AMT) | 120,000 | 122,876 | ||||||
| Orange County, Florida Housing Finance Authority | ||||||||
| Homeowner Revenue Series B 5.25% 3/1/33 | ||||||||
| (GNMA) (FNMA) (AMT) | 135,000 | 133,562 | ||||||
| Oregon Health, Housing, Educational, & Cultural Facilities | ||||||||
| Authority Revenue (Pier Park Project) | ||||||||
| Series A 6.05% 4/1/18 (GNMA) (AMT) | 890,000 | 891,050 | ||||||
| Santa Fe, New Mexico Single Family Mortgage Revenue | ||||||||
| Series B -1 6.20% 11/1/16 (GNMA) (FNMA) (AMT) | 135,000 | 135,153 | ||||||
| Volusia County, Florida Multifamily Housing Finance | ||||||||
| Authority (San Marco Apartments) Series A | ||||||||
| 5.60% 1/1/44 (FSA) (AMT) | 500,000 | 500,085 | ||||||
| 7,006,682 | ||||||||
30
| Principal amount | Value | |||||||
| Municipal Bonds (continued) | ||||||||
| Lease Revenue Bonds – 2.44% | ||||||||
| Atlanta, Georgia Development Authority Educational | ||||||||
| Facilities Revenue (Panther Place - Georgia State | ||||||||
| Campus) Series A 4.75% 7/1/32 (ASSURED GTY) | $ | 1,520,000 | $ | 1,523,466 | ||||
| Golden State Tobacco Securitization Corporation | ||||||||
| Settlement Revenue Enhanced Asset-Backed | ||||||||
| Series A 5.00% 6/1/45 | 3,450,000 | 2,975,590 | ||||||
| Loudoun County, Virginia Industrial Development Authority | ||||||||
| Public Safety Facility Lease Revenue Series A | ||||||||
| 5.25% 12/15/23 (FSA) | 700,000 | 755,146 | ||||||
| Missouri State Development Finance Board | ||||||||
| Infrastructure Facilities Revenue | ||||||||
| (Branson Landing Project) Series A | ||||||||
| 5.25% 12/1/19 | 1,435,000 | 1,413,662 | ||||||
| 5.625% 12/1/28 | 2,430,000 | 2,307,940 | ||||||
| (Sewer System Improvement Project) Series C | ||||||||
| 5.00% 3/1/25 | 605,000 | 600,493 | ||||||
| (Triumph Foods Project) Series A 5.25% 3/1/25 | 500,000 | 502,090 | ||||||
| Puerto Rico Commonwealth Industrial Development | ||||||||
| Company General Purpose Revenue Series B | ||||||||
| 5.375% 7/1/16 | 1,000,000 | 1,000,270 | ||||||
| Puerto Rico Public Buildings Authority Revenue | ||||||||
| (Guaranteed Government Facilities) | ||||||||
| Series F 5.25% 7/1/25 | 930,000 | 857,479 | ||||||
| St. Charles County, Missouri Public Water Supply | ||||||||
| District #2 Certificates of Participation (Missouri Project) | ||||||||
| Series B 5.10% 12/1/25 (NATL-RE) | 500,000 | 490,220 | ||||||
| ^ | St. Louis, Missouri Industrial Development Authority | |||||||
| Leasehold Revenue (Convention Center Hotel) | ||||||||
| 5.80% 7/15/20 (AMBAC) | 3,035,000 | 1,376,676 | ||||||
| 13,803,032 | ||||||||
| Local General Obligation Bonds – 5.67% | ||||||||
| Boerne, Texas Independent School District Building | ||||||||
| 5.25% 2/1/27 (PSF) | 4,000,000 | 4,169,720 | ||||||
| Desert, California Community College District Election 2004 | ||||||||
| Series C 5.00% 8/1/37 (FSA) | 4,785,000 | 4,812,753 | ||||||
| Los Angeles, California Unified School District Election of 2005 | ||||||||
| Series F 5.00% 1/1/34 | 6,180,000 | 6,236,979 | ||||||
31
Statements of net assets
Delaware Tax-Free USA Fund
| Principal amount | Value | |||||||
| Municipal Bonds (continued) | ||||||||
| Local General Obligation Bonds (continued) | ||||||||
| Melrose Park, Illinois Tax Increment Series B | ||||||||
| 6.00% 12/15/19 (FSA) | $ | 1,250,000 | $ | 1,311,038 | ||||
| New York City, New York | ||||||||
| Series I 5.125% 3/1/23 | 5,875,000 | 6,067,582 | ||||||
| Series I-1 5.375% 4/1/36 | 5,000,000 | 5,273,600 | ||||||
| Series J 5.25% 6/1/28 | 2,055,000 | 2,111,780 | ||||||
| Powell, Ohio 5.50% 12/1/32 (NATL-RE) | 2,000,000 | 2,068,380 | ||||||
| 32,051,832 | ||||||||
| §Pre-Refunded Bonds – 14.44% | ||||||||
| Alexandria, Virginia Industrial Development Authority | ||||||||
| Revenue (Institute for Defense Analyses) | ||||||||
| Series A 5.90% 10/1/30-10 (AMBAC) | 6,000,000 | 6,413,700 | ||||||
| Deschutes County, Oregon Hospital Facilities Authority | ||||||||
| Hospital Revenue (Cascade Health Services) | ||||||||
| 5.60% 1/1/32-12 | 1,250,000 | 1,378,750 | ||||||
| Duluth, Minnesota Economic Development Authority | ||||||||
| Health Care Facilities Revenue (Benedictine Health | ||||||||
| System - St. Mary’s Hospital) 5.25% 2/15/33-14 | 4,000,000 | 4,561,200 | ||||||
| Florida State Board of Education (Lottery Revenue) | ||||||||
| Series A 6.00% 7/1/14-10 (FGIC) | 1,000,000 | 1,057,330 | ||||||
| Golden State, California Tobacco Securitization | ||||||||
| Corporation Settlement Revenue Series B | ||||||||
| 5.625% 6/1/38-13 | 7,500,000 | 8,504,025 | ||||||
| Henrico County, Virginia Economic Development | ||||||||
| Authority Revenue (Bon Secours Health System) | ||||||||
| Series A 5.60% 11/15/30-11 | 130,000 | 147,844 | ||||||
| Highlands County, Florida Health Facilities Authority | ||||||||
| (Adventist Health System/Sunbelt) Series A | ||||||||
| 6.00% 11/15/31-11 | 1,500,000 | 1,673,805 | ||||||
| Illinois Educational Facilities Authority Student Housing | ||||||||
| Revenue (Educational Advancement Fund - University | ||||||||
| Center Project) 6.25% 5/1/30-12 | 5,000,000 | 5,728,350 | ||||||
| Jackson, Ohio Local School District (Stark & Summit | ||||||||
| Counties) School Facilities Construction & Improvement | ||||||||
| 5.625% 12/1/25-10 (FSA) | 1,000,000 | 1,063,490 | ||||||
| Jackson, Oregon School District #6 Central Point | ||||||||
| 5.25% 6/15/20-10 (FGIC) | 1,175,000 | 1,220,449 | ||||||
32
| Principal amount | Value | |||||||
| Municipal Bonds (continued) | ||||||||
| §Pre-Refunded Bonds (continued) | ||||||||
| Lee County, Florida Airport Revenue Series B | ||||||||
| 5.75% 10/1/33-10 (FSA) | $ | 3,000,000 | $ | 3,202,680 | ||||
| Linn County, Oregon Community School District #9 Lebanon | ||||||||
| 5.60% 6/15/30-13 (FGIC) | 2,000,000 | 2,307,280 | ||||||
| Maryland State Economic Development Corporation, | ||||||||
| Student Housing Revenue (University of Maryland College | ||||||||
| Park Project) 5.625% 6/1/35-13 | 1,125,000 | 1,297,800 | ||||||
| Miami-Dade County, Florida Educational Facilities | ||||||||
| Authority (University of Miami) Series A | ||||||||
| 5.75% 4/1/29-10 (AMBAC) | 2,000,000 | 2,083,020 | ||||||
| Milledgeville-Baldwin County, Georgia Development | ||||||||
| Authority Revenue (Georgia College & State University | ||||||||
| Foundation Student Housing Project) 6.00% 9/1/33-14 | 1,000,000 | 1,207,940 | ||||||
| New Jersey State Educational Facilities Authority Revenue | ||||||||
| (Stevens Institute of Technology) Series B | ||||||||
| 5.25% 7/1/24-14 | 2,085,000 | 2,409,697 | ||||||
| New York City, New York Series J 5.25% 6/1/28-13 | 2,895,000 | 3,303,571 | ||||||
| North Carolina Medical Care Commission Hospital Revenue | ||||||||
| (Northeast Medical Center Project) | ||||||||
| 5.125% 11/1/34-14 | 1,250,000 | 1,448,863 | ||||||
| Osceola County, Florida School Board Certificates of | ||||||||
| Participation Series A 5.25% 6/1/27-12 (AMBAC) | 4,000,000 | 4,446,920 | ||||||
| Payne County, Oklahoma Economic Development | ||||||||
| Authority Student Housing Revenue (Collegiate | ||||||||
| Housing Foundation - Oklahoma State University) | ||||||||
| Series A 6.375% 6/1/30-11 | 4,000,000 | 4,383,840 | ||||||
| Puerto Rico Commonwealth Highway & Transportation | ||||||||
| Authority Revenue Series G 5.00% 7/1/42-13 | 525,000 | 596,447 | ||||||
| Puerto Rico Electric Power Authority Revenue | ||||||||
| Series II 5.25% 7/1/31-12 | 6,000,000 | 6,766,140 | ||||||
| Series NN 5.125% 7/1/29-13 | 1,105,000 | 1,260,529 | ||||||
| Puerto Rico Public Buildings Authority Revenue | ||||||||
| (Guaranteed Government Facilities) Series I | ||||||||
| 5.25% 7/1/33-14 | 175,000 | 199,213 | ||||||
| Richmond, Virginia Public Utilities Revenue | ||||||||
| 5.00% 1/15/27-12 (FSA) | 10,000,000 | 10,935,299 | ||||||
33
Statements of net assets
Delaware Tax-Free USA Fund
| Principal amount | Value | |||||||
| Municipal Bonds (continued) | ||||||||
| §Pre-Refunded Bonds (continued) | ||||||||
| St. Louis, Missouri Airport Revenue (Capital Improvement | ||||||||
| Project) Series A 5.375% 7/1/21-12 (NATL-RE) | $ | 1,635,000 | $ | 1,821,897 | ||||
| Vancouver, Washington Limited Tax | ||||||||
| 5.50% 12/1/25-10 (AMBAC) | 1,250,000 | 1,327,413 | ||||||
| Wisconsin Housing & Economic Developing Authority | ||||||||
| Revenue 6.10% 6/1/21-17 (FHA) | 690,000 | 832,209 | ||||||
| 81,579,701 | ||||||||
| Special Tax Bonds – 8.73% | ||||||||
| @ | Belleville, Illinois Tax Increment Revenue | |||||||
| (Frank Scott Parkway) Series A 5.70% 5/1/36 | 1,350,000 | 874,895 | ||||||
| Florida Enterprise Community Development District Special | ||||||||
| Assessment 6.10% 5/1/16 (NATL-RE) | 695,000 | 697,453 | ||||||
| Henderson, Nevada Local Improvement Districts #T-18 | ||||||||
| 5.30% 9/1/35 | 2,315,000 | 837,336 | ||||||
| Hollywood, Florida Community Redevelopment Agency | ||||||||
| Revenue (Beach CRA) 5.625% 3/1/24 | 1,200,000 | 1,091,868 | ||||||
| Jacksonville, Florida Excise Taxes Revenue Series B | ||||||||
| 5.00% 10/1/26 (AMBAC) | 1,000,000 | 1,009,050 | ||||||
| Lammersville, California School District Community | ||||||||
| Facilities District #2002 (Mountain House) | ||||||||
| 5.125% 9/1/35 | 4,125,000 | 2,774,434 | ||||||
| Middlesex County, New Jersey Improvement Authority | ||||||||
| Senior Revenue (Heldrich Center Hotel/Conference | ||||||||
| Project) Series A | ||||||||
| 5.00% 1/1/32 | 1,500,000 | 762,195 | ||||||
| 5.125% 1/1/37 | 1,500,000 | 762,285 | ||||||
| Missouri State Development Finance Board Infrastructure | ||||||||
| Facilities Revenue (Crackerneck Creek Project) | ||||||||
| Series C 5.00% 3/1/26 | 500,000 | 496,670 | ||||||
| New Jersey Economic Development Authority (Cigarette Tax) | ||||||||
| 5.50% 6/15/31 | 1,000,000 | 894,910 | ||||||
| 5.75% 6/15/34 | 1,935,000 | 1,772,770 | ||||||
| New York City, New York Transitional Finance Authority | ||||||||
| Series D 5.00% 2/1/31 | 5,000,000 | 5,087,650 | ||||||
| New York Sales Tax Asset Receivables | ||||||||
| Series A 5.25% 10/15/27 (AMBAC) | 1,000,000 | 1,087,190 | ||||||
34
| Principal amount | Value | |||||||
| Municipal Bonds (continued) | ||||||||
| Special Tax Bonds (continued) | ||||||||
| New York State Dormitory Authority State | ||||||||
| Personal Income Tax Revenue | ||||||||
| Series A 5.00% 3/15/38 | $ | 4,545,000 | $ | 4,652,262 | ||||
| Series B 5.25% 3/15/38 | 6,000,000 | 6,265,319 | ||||||
| Puerto Rico Sales Tax Financing Corporation | ||||||||
| Sales Tax Revenue | ||||||||
| W(Capital Appreciation) Series A 6.75% 8/1/32 | 10,780,000 | 7,545,999 | ||||||
| ·Series A 5.00% 8/1/39 | 5,500,000 | 5,629,910 | ||||||
| Series A 5.75% 8/1/37 | 5,905,000 | 6,070,931 | ||||||
| Tampa, Florida Sports Authority Revenue | ||||||||
| Sales Tax (Tampa Bay Arena Project) 5.75% 10/1/20 | ||||||||
| (NATL-RE) | 1,000,000 | 1,036,030 | ||||||
| 49,349,157 | ||||||||
| State General Obligation Bonds – 5.38% | ||||||||
| California State | ||||||||
| 6.00% 4/1/38 | 4,060,000 | 4,296,211 | ||||||
| 6.50% 4/1/33 | 2,570,000 | 2,850,233 | ||||||
| Guam Government Series A 7.00% 11/15/39 | 4,295,000 | 4,330,176 | ||||||
| Maryland State & Local Facilities Land Capital | ||||||||
| Improvement Second Series 5.00% 8/1/16 | 4,000,000 | 4,686,320 | ||||||
| New York State Series A 5.00% 2/15/39 | 1,450,000 | 1,495,153 | ||||||
| Puerto Rico Commonwealth Public Improvement Series A | ||||||||
| 5.125% 7/1/31 | 7,880,000 | 7,153,070 | ||||||
| 5.25% 7/1/23 | 500,000 | 490,335 | ||||||
| 5.50% 7/1/19 (NATL-RE) | 5,000,000 | 5,090,800 | ||||||
| 30,392,298 | ||||||||
| Transportation Revenue Bonds – 11.74% | ||||||||
| Bay Area, California Toll Authority Bridge Authority | ||||||||
| Revenue (San Francisco Bay Area) Series F-1 | ||||||||
| 5.625% 4/1/44 | 4,265,000 | 4,536,595 | ||||||
| Branson, Missouri Regional Airport Transportation | ||||||||
| Development District Revenue (Branson Airport Project) | ||||||||
| Series B 6.00% 7/1/37 (AMT) | 1,500,000 | 980,970 | ||||||
| Capital Trust Agency Florida Revenue | ||||||||
| (Fort Lauderdale/Cargo Acquisition Project) | ||||||||
| 5.75% 1/1/32 (AMT) | 3,750,000 | 2,599,800 | ||||||
| (Orlando/Cargo Acquisition Project) | ||||||||
| 6.75% 1/1/32 (AMT) | 2,395,000 | 1,845,491 | ||||||
35
Statements of net assets
Delaware Tax-Free USA Fund
| Principal amount | Value | |||||||
| Municipal Bonds (continued) | ||||||||
| Transportation Revenue Bonds (continued) | ||||||||
| Dallas-Fort Worth, Texas International Airport Revenue | ||||||||
| Series A 5.50% 11/1/31 (NATL-RE) (FGIC) (AMT) | $ | 1,500,000 | $ | 1,499,880 | ||||
| Grapevine, Texas Industrial Development Corporate | ||||||||
| Revenue (Air Cargo) 6.50% 1/1/24 (AMT) | 910,000 | 747,965 | ||||||
| Houston, Texas Industrial Development Corporate | ||||||||
| Revenue (Air Cargo) 6.375% 1/1/23 (AMT) | 1,995,000 | 1,633,526 | ||||||
| Metropolitan Washington DC Airports Authority Dulles Toll | ||||||||
| Road Revenue First Senior Lien Series A | ||||||||
| 5.00% 10/1/39 | 2,500,000 | 2,510,700 | ||||||
| 5.25% 10/1/44 | 6,110,000 | 6,142,505 | ||||||
| Missouri State Highways & Transportation Commission | ||||||||
| State Road Revenue Series B 5.00% 5/1/24 | 9,000,000 | 9,725,491 | ||||||
| New York State Thruway Authority General Revenue | ||||||||
| Series H 5.00% 1/1/19 (NATL-RE) | 6,240,000 | 6,906,432 | ||||||
| North Texas Tollway Authority Revenue (First Tier) | ||||||||
| Series A 6.00% 1/1/24 | 3,345,000 | 3,540,047 | ||||||
| ·Series E-3 5.75% 1/1/38 | 4,320,000 | 4,536,734 | ||||||
| Pennsylvania State Turnpike Commission Turnpike Revenue | ||||||||
| Subordinate Series B 5.25% 6/1/39 | 6,000,000 | 6,105,840 | ||||||
| Puerto Rico Commonwealth Highway & Transportation | ||||||||
| Authority Revenue Series G 5.00% 7/1/42 | 275,000 | 237,474 | ||||||
| Sacramento County, California Airport System Revenue | ||||||||
| (PFC/Grant) Series C 6.00% 7/1/41 | 6,500,000 | 6,585,150 | ||||||
| Saint Louis, Missouri Airport Revenue (Lambert-St. Louis | ||||||||
| International) Series A-1 6.625% 7/1/34 | 5,995,000 | 6,179,826 | ||||||
| 66,314,426 | ||||||||
| Water & Sewer Revenue Bonds – 3.46% | ||||||||
| Atlanta, Georgia Water & Wastewater Revenue | ||||||||
| Series A 6.25% 11/1/39 | 5,500,000 | 5,732,595 | ||||||
| Missouri State Environmental Improvement & Energy | ||||||||
| Resource Authority Water Pollution Control Revenue | ||||||||
| Unrefunded Balance (State Revolving Fund Project) | ||||||||
| Series A 6.05% 7/1/16 (FSA) | 1,060,000 | 1,064,113 | ||||||
| New York City, New York Municipal Water Finance | ||||||||
| Authority Water & Sewer System Revenue | ||||||||
| Fiscal 2009 Series A 5.75% 6/15/40 | 4,000,000 | 4,373,000 | ||||||
| Series A 5.25% 6/15/34 | 3,705,000 | 3,770,986 | ||||||
36
| Principal amount | Value | ||||||||
| Municipal Bonds (continued) | |||||||||
| Water & Sewer Revenue Bonds (continued) | |||||||||
| Tampa, Florida Water and Sewer Revenue | |||||||||
| 6.00% 10/1/16 (FSA) | $ | 1,000,000 | $ | 1,188,380 | |||||
| Virgin Islands Water & Power Authority Water System | |||||||||
| Revenue 5.50% 7/1/17 | 510,000 | 511,749 | |||||||
| West Virginia State Water Development Authority | |||||||||
| Revenue (Loan Program III) Series A | |||||||||
| 6.375% 7/1/39 (AMBAC) (AMT) | 2,890,000 | 2,924,680 | |||||||
| 19,565,503 | |||||||||
| Total Municipal Bonds (cost $545,193,345) | 554,711,355 | ||||||||
| Total Value of Securities – 98.16% | |||||||||
| (cost $545,193,345) | 554,711,355 | ||||||||
| Receivables and Other Assets | |||||||||
| Net of Liabilities – 1.84% | 10,419,922 | ||||||||
| Net Assets Applicable to 51,896,068 | |||||||||
| Shares Outstanding – 100.00% | $ | 565,131,277 | |||||||
| Net Asset Value – Delaware Tax-Free USA Fund | |||||||||
| Class A ($536,420,077 / 49,259,602 Shares) | $10.89 | ||||||||
| Net Asset Value – Delaware Tax-Free USA Fund | |||||||||
| Class B ($8,167,905 / 750,457 Shares) | $10.88 | ||||||||
| Net Asset Value – Delaware Tax-Free USA Fund | |||||||||
| Class C ($20,542,151 / 1,885,904 Shares) | $10.89 | ||||||||
| Net Asset Value – Delaware Tax-Free USA Fund | |||||||||
| Institutional Class ($1,144 / 105.01 Shares) | $10.89 | ||||||||
| Components of Net Assets at August 31, 2009: | |||||||||
| Shares of beneficial interest (unlimited authorization – no par) | $ | 568,373,809 | |||||||
| Undistributed net investment income | 66,893 | ||||||||
| Accumulated net realized loss on investments | (12,827,435 | ) | |||||||
| Net unrealized appreciation of investments | 9,518,010 | ||||||||
| Total net assets | $ | 565,131,277 | |||||||
37
Statements of net assets
Delaware Tax-Free USA Fund
| § | Pre-Refunded Bonds. Municipals that are generally backed or secured by U.S. Treasury bonds. For Pre-Refunded Bonds, the stated maturity is followed by the year in which the bond is pre-refunded. See Note 8 in “Notes to financial statements.” |
| · | Variable rate security. The rate shown is the rate as of August 31, 2009. |
| ^ | Zero coupon security. The rate shown is the yield at the time of purchase. |
| @ | Illiquid security. At August 31, 2009, the aggregate amount of illiquid securities was $1,882,130, which represented 0.33% of the Fund’s net assets. See Note 8 in “Notes to financial statements.” |
| W | Step coupon bond. Indicates security that has a zero coupon that remains in effect until a predetermined date at which time the stated interest rate becomes effective. |
Summary of abbreviations:
ACA — Insured by American Capital Access
AMBAC — Insured by the AMBAC Assurance Corporation
AMT — Subject to Alternative Minimum Tax
ASSURED GTY — Insured by the Assured Guaranty Corporation
FGIC — Insured by the Financial Guaranty Insurance Company
FHA — Insured by the Federal Housing Administration
FNMA — Insured by Federal National Mortgage Association collateral
FSA — Insured by Financial Security Assurance
GNMA — Government National Mortgage Association collateral
NATL-RE — Insured by the National Public Finance Guarantee Corporation
PSF — Insured by the Permanent School Fund
RADIAN — Insured by Radian Asset Assurance
VHA — Veterans Health Administration
| Net Asset Value and Offering Price Per Share – | ||
| Delaware Tax-Free USA Fund | ||
| Net asset value Class A (A) | $ | 10.89 |
| Sales charge (4.50% of offering price) (B) | 0.51 | |
| Offering price | $ | 11.40 |
| (A) | Net asset value per share, as illustrated, is the amount which would be paid upon redemption or repurchase of shares. |
| (B) | See the current prospectus for purchases of $100,000 or more. |
See accompanying notes
38
| Delaware Tax-Free USA Intermediate Fund | August 31, 2009 |
| Principal amount | Value | |||||||
| Municipal Bonds – 98.82% | ||||||||
| Corporate Revenue Bonds – 10.09% | ||||||||
| Alliance Airport Authority, Texas Special Facilities Revenue | ||||||||
| (Federal Express Corp. Project) 4.85% 4/1/21 (AMT) | $ | 2,000,000 | $ | 1,737,300 | ||||
| · | Brazos, Texas Harbor Industrial Development | |||||||
| Environmental Facilities Revenue (Dow Chemical Co. | ||||||||
| Project) 5.90% 5/1/38 (AMT) | 1,010,000 | 939,967 | ||||||
| Brazos, Texas River Authority Pollution Control Revenue | ||||||||
| (Texas Utilities) 5.40% 5/1/29 (AMT) | 1,000,000 | 423,770 | ||||||
| Buckeye, Ohio Tobacco Settlement Financing Authority | ||||||||
| Asset-Backed Series A-2 5.875% 6/1/47 | 9,405,000 | 6,937,221 | ||||||
| · | Chesapeake, Virginia Economic Development Authority | |||||||
| Pollution Control Revenue (Electric & Power Co. | ||||||||
| Project) Series A 3.60% 2/1/32 | 1,150,000 | 1,166,468 | ||||||
| Chesterfield County, Virginia Economic Development | ||||||||
| Authority Pollution Control Revenue (Virginia Electric & | ||||||||
| Power) Series A 5.00% 5/1/23 | 1,460,000 | 1,509,684 | ||||||
| Golden State, California Tobacco Securitization | ||||||||
| Corporation Settlement Revenue Asset-Backed Senior | ||||||||
| Series A-1 5.75% 6/1/47 | 3,860,000 | 3,010,839 | ||||||
| Indianapolis, Indiana Airport Authority Revenue | ||||||||
| Special Facilities (Federal Express Corp. Project) | ||||||||
| 5.10% 1/15/17 (AMT) | 750,000 | 691,065 | ||||||
| Iowa Finance Authority Pollution Control Facilities | ||||||||
| Revenue (Interstate Power) 5.00% 7/1/14 (FGIC) | 2,000,000 | 2,098,660 | ||||||
| Maryland Economic Development Corporation | ||||||||
| Pollution Control Revenue (Potomac Electric Project) | ||||||||
| 6.20% 9/1/22 | 1,780,000 | 1,965,476 | ||||||
| Memphis-Shelby County, Tennessee Airport Authority | ||||||||
| Special Facilities Revenue (Federal Express Corp. | ||||||||
| Project) 5.05% 9/1/12 | 1,000,000 | 1,036,850 | ||||||
| Michigan State Strategic Fund Limited Obligation | ||||||||
| Revenue (Dow Chemical Project) Series B-2 | ||||||||
| 6.25% 6/1/14 | 4,500,000 | 4,632,704 | ||||||
| · | Mobile, Alabama Industrial Development Board | |||||||
| Pollution Control Revenue (Alabama Power Co.) | ||||||||
| Series B 4.875% 6/1/34 | 2,840,000 | 2,996,058 | ||||||
| M-S-R Energy Authority, California Gas Revenue | ||||||||
| Series A 6.125% 11/1/29 | 3,640,000 | 3,629,189 | ||||||
39
Statements of net assets
Delaware Tax-Free USA Intermediate Fund
| Principal amount | Value | |||||||
| Municipal Bonds (continued) | ||||||||
| Corporate Revenue Bonds (continued) | ||||||||
| Ohio State Air Quality Development Authority Revenue | ||||||||
| Environmental Improvement (First Energy) | ||||||||
| Series A 5.70% 2/1/14 | $ | 2,225,000 | $ | 2,358,367 | ||||
| Series A 5.70% 8/1/20 | 4,320,000 | 4,465,238 | ||||||
| Series C 5.625% 6/1/18 | 2,370,000 | 2,457,406 | ||||||
| (USX Project) 5.00% 11/1/15 | 1,000,000 | 1,020,760 | ||||||
| · | Pennsylvania Economic Development Financing Authority | |||||||
| Exempt Facilities Revenue (Exelon Generation Co. | ||||||||
| Project) Series A 5.00% 12/1/42 | 1,355,000 | 1,387,032 | ||||||
| Prattville, Alabama Industrial Development Board | ||||||||
| Environmental Improvement Revenue (International | ||||||||
| Paper Co. Project) Series A 6.70% 3/1/24 (AMT) | 1,000,000 | 977,300 | ||||||
| · | Sabine, Texas River Authority Pollution Control Revenue | |||||||
| (TXU Electric Co. Project) Series A 5.50% 5/1/22 | 1,000,000 | 812,650 | ||||||
| Salt Verde Financial Corporation, Arizona Senior Gas | ||||||||
| Revenue 5.00% 12/1/37 | 4,500,000 | 3,773,340 | ||||||
| Sugar Creek, Missouri Industrial Development Revenue | ||||||||
| (Lafarge North America Project) Series A | ||||||||
| 5.65% 6/1/37 (AMT) | 500,000 | 382,160 | ||||||
| Toledo, Lucas County, Ohio Port Authority Development | ||||||||
| Revenue (Northwest Ohio Bond Fund - Alex Products Inc.) | ||||||||
| Series B 6.125% 11/15/09 (AMT) | 150,000 | 150,260 | ||||||
| 50,559,764 | ||||||||
| Education Revenue Bonds – 4.02% | ||||||||
| California Municipal Finance Authority Educational Revenue | ||||||||
| (American Heritage Education Foundation Project) | ||||||||
| Series A 5.25% 6/1/26 | 1,000,000 | 816,500 | ||||||
| California Statewide Communities Development Authority | ||||||||
| Student Housing Revenue (Irvine, LLC - UCI East Campus) | ||||||||
| 6.00% 5/15/23 | 3,150,000 | 3,183,674 | ||||||
| Chattanooga, Tennessee Health Educational & Housing | ||||||||
| Facilities Board Revenue (CDFI Phase I, LLC Project) | ||||||||
| Series B 5.50% 10/1/20 | 1,095,000 | 912,814 | ||||||
| Fulton County, Georgia Development Authority Revenue | ||||||||
| (Molecular Science Building Project) | ||||||||
| 5.25% 5/1/21 (NATL-RE) | 1,000,000 | 1,092,520 | ||||||
| Grand Traverse, Michigan Public School Academy Revenue | ||||||||
| 5.00% 11/1/36 | 1,000,000 | 607,950 | ||||||
40
| Principal amount | Value | |||||||
| Municipal Bonds (continued) | ||||||||
| Education Revenue Bonds (continued) | ||||||||
| Marietta, Georgia Development Authority Revenue | ||||||||
| (Life University Income Project) 6.25% 6/15/20 | $ | 1,180,000 | $ | 1,035,922 | ||||
| Massachusetts State Health & Educational | ||||||||
| Facilities Authority Revenue | ||||||||
| (Nichols College Project) Series C 6.125% 10/1/29 | 1,000,000 | 869,070 | ||||||
| ·(Northeastern University) 4.125% 10/1/37 | 2,360,000 | 2,414,846 | ||||||
| Michigan Higher Education Facilities Authority Revenue | ||||||||
| (Kalamazoo College Project) 5.50% 12/1/19 | 500,000 | 517,340 | ||||||
| New York State Dormitory Authority Revenue | ||||||||
| (Brooklyn Law School) Series A 5.50% 7/1/18 (RADIAN) | 1,000,000 | 1,031,590 | ||||||
| (Non State Supported Debt - Rockefeller University) | ||||||||
| Series A 5.00% 7/1/27 | 1,055,000 | 1,162,568 | ||||||
| Ohio State Higher Educational Facility Revenue | ||||||||
| (John Carroll University) 5.50% 11/15/18 | 335,000 | 352,135 | ||||||
| ·(Kenyon College Project) 4.70% 7/1/37 | 1,000,000 | 1,051,090 | ||||||
| Ohio State University General Receipts Revenue | ||||||||
| Series B 5.25% 6/1/21 | 1,000,000 | 1,069,290 | ||||||
| University of California Revenue Series A | ||||||||
| 5.125% 5/15/20 (AMBAC) | 250,000 | 266,255 | ||||||
| University of Oklahoma Research Facilities Revenue | ||||||||
| 5.00% 3/1/23 (AMBAC) | 1,065,000 | 1,092,988 | ||||||
| University of Virginia General Revenue Series B | ||||||||
| 5.00% 6/1/20 | 1,250,000 | 1,339,500 | ||||||
| 5.00% 6/1/21 | 1,250,000 | 1,333,000 | ||||||
| 20,149,052 | ||||||||
| Electric Revenue Bonds – 3.16% | ||||||||
| · | Burke County, Georgia Development Authority | |||||||
| Pollution Control Revenue (Oglethorpe Power) | ||||||||
| Series C-2 4.625% 1/1/37 (AMBAC) | 3,320,000 | 3,391,878 | ||||||
| Metropolitan Government Nashville & Davidson County, | ||||||||
| Tennessee Electric Revenue Series B 5.50% 5/15/14 | 1,000,000 | 1,149,420 | ||||||
| Orlando, Florida Utilities Commission Water & Electric | ||||||||
| Revenue 5.25% 10/1/20 | 555,000 | 590,820 | ||||||
| Platte River Power Authority, Colorado Power Revenue | ||||||||
| Series HH 5.00% 6/1/26 | 2,000,000 | 2,161,720 | ||||||
| Rochester, Minnesota Electric Utilities Revenue | ||||||||
| Series C 5.00% 12/1/18 (NATL-RE) | 2,000,000 | 2,243,440 | ||||||
41
Statements of net assets
Delaware Tax-Free USA Intermediate Fund
| Principal amount | Value | |||||||
| Municipal Bonds (continued) | ||||||||
| Electric Revenue Bonds (continued) | ||||||||
| South Carolina State Public Service Authority Revenue | ||||||||
| Refunding Series A 5.125% 1/1/21 (FSA) | $ | 1,000,000 | $ | 1,053,480 | ||||
| Texas Municipal Power Agency Revenue | ||||||||
| 4.00% 9/1/11 (AMBAC) | 750,000 | 751,515 | ||||||
| Vernon, California Electric System Revenue Series A | ||||||||
| 5.125% 8/1/21 | 4,500,000 | 4,501,170 | ||||||
| 15,843,443 | ||||||||
| Escrowed to Maturity Bonds – 0.04% | ||||||||
| Southcentral, Pennsylvania General Authority Revenue | ||||||||
| (Wellspan Health Obligated Project) 5.625% 5/15/26 | 180,000 | 194,017 | ||||||
| 194,017 | ||||||||
| Health Care Revenue Bonds – 11.30% | ||||||||
| Allegheny County, Pennsylvania Municipal Development | ||||||||
| Authority Revenue (University of Pittsburgh Medical Center) | ||||||||
| Series A 5.00% 9/1/14 | 4,000,000 | 4,415,800 | ||||||
| Berks County, Pennsylvania Hospital Authority Revenue | ||||||||
| (Reading Hospital & Medical Center Project) | ||||||||
| Series A-3 5.25% 11/1/24 | 4,405,000 | 4,464,600 | ||||||
| Butler County, Pennsylvania Hospital Authority Revenue | ||||||||
| (Butler Health System Project) 7.125% 7/1/29 | 2,250,000 | 2,432,250 | ||||||
| California Statewide Communities Development Authority | ||||||||
| Revenue (Kaiser Permanente) Series A 5.00% 4/1/19 | 6,070,000 | 6,335,138 | ||||||
| Cape Girardeau County, Missouri Industrial Development | ||||||||
| Authority Health Care Facilities Revenue (St. Francis | ||||||||
| Medical Center) Series A 5.50% 6/1/34 | 640,000 | 641,792 | ||||||
| Chatham County, Georgia Hospital Authority Revenue | ||||||||
| (Memorial Health Medical Center) Series A | ||||||||
| 6.125% 1/1/24 | 905,000 | 834,347 | ||||||
| @ | Cleveland-Cuyahoga County, Ohio Port Authority | |||||||
| Revenue (Saint Clarence - Geac) Series A | ||||||||
| 6.125% 5/1/26 | 715,000 | 541,913 | ||||||
| Cuyahoga County, Ohio Revenue (Cleveland Clinic Health | ||||||||
| System) Series A 6.00% 1/1/21 | 1,000,000 | 1,081,440 | ||||||
| Dauphin County, Pennsylvania General Authority Health | ||||||||
| System Revenue (Pinnacle Health System Project) | ||||||||
| Series A 6.00% 6/1/29 | 4,500,000 | 4,602,825 | ||||||
42
| Principal amount | Value | |||||||
| Municipal Bonds (continued) | ||||||||
| Health Care Revenue Bonds (continued) | ||||||||
| Georgia Medical Center Hospital Authority Revenue | ||||||||
| (Spring Harbor Green Island Project) 5.25% 7/1/37 | $ | 2,300,000 | $ | 1,662,371 | ||||
| · | Highlands County, Florida Health Facilities Authority | |||||||
| Revenue (Adventist Health System) Series I | ||||||||
| 5.00% 11/15/29 | 2,000,000 | 2,015,860 | ||||||
| Maryland State Health & Higher Education Facilities | ||||||||
| Authority Revenue | ||||||||
| ·(John Hopkins Health Systems) 5.00% 5/15/46 | 790,000 | 855,696 | ||||||
| (Union Hospital of Cecil County) 5.625% 7/1/32 | 500,000 | 500,410 | ||||||
| Massachusetts State Health & Educational Facilities | ||||||||
| Authority Revenue (Caregroup) Series E-2 | ||||||||
| 5.375% 7/1/21 | 1,970,000 | 2,012,217 | ||||||
| Michigan State Hospital Finance Authority Revenue | ||||||||
| (Oakwood Obligation Group) 5.50% 11/1/14 | 2,230,000 | 2,261,755 | ||||||
| Minneapolis, Minnesota Health Care System Revenue | ||||||||
| (Fairview Health) Series A 6.375% 11/15/23 | 3,710,000 | 4,076,622 | ||||||
| New Hampshire Health & Education Facilities Authority | ||||||||
| Revenue (Elliot Hospital) Series B 5.60% 10/1/22 | 610,000 | 614,606 | ||||||
| New York State Dormitory Authority Revenue Non State | ||||||||
| Supported Debt | ||||||||
| (North Shore LI Jewish Health System) Series A 5.50% 5/1/30 | 1,700,000 | 1,709,996 | ||||||
| (Orange Regional Medical Center) 6.50% 12/1/21 | 2,000,000 | 1,851,040 | ||||||
| North Carolina Medical Care Commission Health Care | ||||||||
| Facilities Revenue (First Mortgage - Presbyterian Homes) | ||||||||
| 5.40% 10/1/27 | 780,000 | 661,892 | ||||||
| Ohio State Higher Educational Facilities Commission | ||||||||
| Revenue (Cleveland Clinic Health System | ||||||||
| Obligation Group) Series A | ||||||||
| 5.00% 1/1/17 | 2,000,000 | 2,180,300 | ||||||
| 5.00% 1/1/18 | 1,000,000 | 1,085,720 | ||||||
| Scottsdale, Arizona Industrial Development Authority | ||||||||
| Hospital Revenue (Scottsdale Healthcare) Series A | ||||||||
| 5.00% 9/1/19 | 3,065,000 | 3,109,381 | ||||||
| St. Louis Park, Minnesota Health Care Facilities Revenue | ||||||||
| Refunding (Nicollet Health Services) Series C | ||||||||
| 5.50% 7/1/18 | 4,240,000 | 4,533,196 | ||||||
| St. Mary Hospital Authority, Pennsylvania Health System | ||||||||
| Revenue (Catholic Health East) Series A | ||||||||
| 5.25% 11/15/16 | 1,200,000 | 1,243,248 | ||||||
43
Statements of net assets
Delaware Tax-Free USA Intermediate Fund
| Principal amount | Value | |||||||
| Municipal Bonds (continued) | ||||||||
| Health Care Revenue Bonds (continued) | ||||||||
| St. Paul, Minnesota Housing & Redevelopment Authority | ||||||||
| Hospital Revenue (Health East Project) | ||||||||
| 6.00% 11/15/25 | $ | 1,000,000 | $ | 894,520 | ||||
| 56,618,935 | ||||||||
| Housing Revenue Bonds – 1.43% | ||||||||
| California Housing Finance Agency Revenue | ||||||||
| (Home Mortgage) Series M 5.95% 8/1/25 (AMT) | 2,700,000 | 2,603,097 | ||||||
| Puerto Rico Housing Finance Authority Subordinate | ||||||||
| (Capital Fund Modernization) 5.50% 12/1/16 | 4,120,000 | 4,555,278 | ||||||
| 7,158,375 | ||||||||
| Lease Revenue Bonds – 2.54% | ||||||||
| Golden State, California Tobacco Securitization Corporation | ||||||||
| Settlement Revenue Refunding Asset-Backed Series A | ||||||||
| 5.00% 6/1/18 | 1,170,000 | 1,169,906 | ||||||
| 5.00% 6/1/21 (AMBAC) | 1,000,000 | 970,530 | ||||||
| Michigan State Building Authority Revenue Series I | ||||||||
| 5.00% 10/15/09 (FSA) | 1,000,000 | 1,004,970 | ||||||
| 5.00% 10/15/24 | 3,000,000 | 3,022,020 | ||||||
| 5.50% 10/15/18 | 2,175,000 | 2,238,989 | ||||||
| New York State Municipal Bond Bank Agency Special | ||||||||
| School Purpose Revenue Series C 5.25% 6/1/22 | 1,000,000 | 1,043,070 | ||||||
| · | Puerto Rico Public Buildings Authority Revenue | |||||||
| (Guaranteed Government Facilities) Series J | ||||||||
| 5.00% 7/1/28 | 1,000,000 | 1,015,230 | ||||||
| Tobacco Settlement Financing New York Revenue | ||||||||
| (Asset-Backed) Series B 5.00% 6/1/12 | 2,060,000 | 2,231,351 | ||||||
| 12,696,066 | ||||||||
| Local General Obligation Bonds – 8.77% | ||||||||
| Chicago, Illinois Board of Education Refunding Dedicated | ||||||||
| Revenue Series B 5.00% 12/1/23 (AMBAC) | 3,500,000 | 3,621,695 | ||||||
| Chicago, Illinois Modern Schools Across Chicago | ||||||||
| Series J 5.00% 12/1/23 (AMBAC) | 2,865,000 | 2,996,217 | ||||||
| Chicago, Illinois Project & Refunding Series C | ||||||||
| 5.50% 1/1/40 (NATL-RE) (FGIC) | 2,940,000 | 2,967,283 | ||||||
| Dallas, Texas 5.125% 2/15/15 | 3,000,000 | 3,457,770 | ||||||
44
| Principal amount | Value | |||||||
| Municipal Bonds (continued) | ||||||||
| Local General Obligation Bonds (continued) | ||||||||
| Fairfax County, Virginia Refunding & Public Improvement | ||||||||
| 5.25% 4/1/14 | $ | 3,500,000 | $ | 4,040,575 | ||||
| Gwinnett County, Georgia School District 5.00% 2/1/11 | 3,000,000 | 3,182,970 | ||||||
| Lansing, Michigan Community College (College Building | ||||||||
| and Site) 5.00% 5/1/21 (NATL-RE) | 1,325,000 | 1,418,267 | ||||||
| Licking County, Ohio Joint Vocational School District | ||||||||
| School Facilities Construction and Improvement | ||||||||
| 5.00% 12/1/19 (NATL-RE) | 1,000,000 | 1,055,980 | ||||||
| Los Angeles, California Unified School District | ||||||||
| (Election 1997) Series F 5.00% 7/1/21 (FGIC) | 2,880,000 | 2,993,184 | ||||||
| (Election 2004) Series G | ||||||||
| 5.00% 7/1/13 (AMBAC) | 2,000,000 | 2,201,620 | ||||||
| 5.00% 7/1/31 (AMBAC) | 3,955,000 | 4,009,579 | ||||||
| Middlesex County, New Jersey Improvement Authority | ||||||||
| Revenue (County Guaranteed Open Space Trust) | ||||||||
| 5.25% 9/15/20 | 1,000,000 | 1,106,630 | ||||||
| New York City, New York | ||||||||
| Series A-1 5.00% 8/1/19 | 3,500,000 | 3,830,050 | ||||||
| Series G 5.25% 8/1/15 | 1,000,000 | 1,102,630 | ||||||
| Series I 5.00% 8/1/21 | 1,000,000 | 1,049,340 | ||||||
| Series I-1 5.25% 4/1/28 | 4,500,000 | 4,781,835 | ||||||
| Series J 5.50% 6/1/23 | 100,000 | 104,778 | ||||||
| 43,920,403 | ||||||||
| §Pre-Refunded Bonds – 7.06% | ||||||||
| Benton & Linn Counties, Oregon School District #509J | ||||||||
| 5.00% 6/1/21-13 (FSA) | 1,000,000 | 1,130,070 | ||||||
| Cook County, Illinois Series A 5.375% 11/15/21-11 (FGIC) | 2,160,000 | 2,324,398 | ||||||
| Duluth, Minnesota Economic Development | ||||||||
| Authority Health Care Facilities Revenue | ||||||||
| (Benedictine Health System - St. Mary’s Hospital) | ||||||||
| 5.25% 2/15/28-14 | 1,000,000 | 1,140,300 | ||||||
| 5.50% 2/15/23-14 | 1,000,000 | 1,150,920 | ||||||
| Forest Grove, Oregon Revenue Campus (Pacific University) | ||||||||
| 6.30% 5/1/25-10 (RADIAN) | 1,000,000 | 1,039,680 | ||||||
| Illinois Educational Facilities Authority Student Housing | ||||||||
| Revenue (Educational Advancement - | ||||||||
| University Center Project) 6.00% 5/1/22-12 | 750,000 | 854,333 | ||||||
45
Statements of net assets
Delaware Tax-Free USA Intermediate Fund
| Principal amount | Value | ||||||||
| Municipal Bonds (continued) | |||||||||
| §Pre-Refunded Bonds (continued) | |||||||||
| Lancaster County, Pennsylvania Hospital Authority | |||||||||
| Revenue (Lancaster General Hospital Project) | |||||||||
| 5.75% 3/15/21-13 | $ | 1,000,000 | $ | 1,159,210 | |||||
| Lunenburg County, Virginia Series B | |||||||||
| 5.25% 2/1/29-13 (NATL-RE) | 715,000 | 814,907 | |||||||
| Miami-Dade County, Florida Educational Facilities | |||||||||
| Authority Revenue (University of Miami) | |||||||||
| Series A 5.00% 4/1/34-14 (AMBAC) | 3,500,000 | 3,977,329 | |||||||
| Minneapolis, Minnesota Health Care System Revenue | |||||||||
| (Allina Health Systems) Series A 5.75% 11/15/32-12 | 500,000 | 570,640 | |||||||
| New Jersey State Educational Facilities Authority | |||||||||
| Revenue (Georgian Court College Project) Series C | |||||||||
| 6.50% 7/1/33-13 | 500,000 | 592,675 | |||||||
| New York City, New York Series J 5.50% 6/1/23-13 | 900,000 | 1,035,216 | |||||||
| North Texas Health Facilities Development Corporation | |||||||||
| Hospital Revenue (United Regional Health Care | |||||||||
| System, Inc. Project) 6.00% 9/1/23-13 | 1,000,000 | 1,158,380 | |||||||
| Ohio State Higher Education Capital Facilities | |||||||||
| Series B 5.625% 5/1/14-10 | 5,780,000 | 5,980,623 | |||||||
| Pennsylvania State First Series 5.125% 1/15/19-11 | 3,515,000 | 3,760,066 | |||||||
| Pennsylvania State Higher Educational Facilities Authority | |||||||||
| College & University Revenue (Geneva College Project) | |||||||||
| 6.125% 4/1/22-12 | 1,000,000 | 1,125,310 | |||||||
| Puerto Rico Commonwealth Highway & Transportation | |||||||||
| Authority Revenue Series J 5.50% 7/1/21-14 | 1,000,000 | 1,152,230 | |||||||
| Puerto Rico Public Buildings Authority Revenue | |||||||||
| (Guaranteed Government Facilities) Series I | |||||||||
| 5.50% 7/1/23-14 | 2,000,000 | 2,299,500 | |||||||
| Southcentral, Pennsylvania General Authority Revenue | |||||||||
| (Welllspan Health Obligated Project) | |||||||||
| 5.625% 5/15/26-11 | 820,000 | 893,948 | |||||||
| University of North Carolina Revenue (Chapel Hill) | |||||||||
| Series A 5.375% 12/1/14-11 | 2,000,000 | 2,160,520 | |||||||
| Virginia State Resource Authority Clean Water Revenue | |||||||||
| (State Revolving Fund) 6.00% 10/1/16-10 | 1,000,000 | 1,060,080 | |||||||
| 35,380,335 | |||||||||
46
| Principal amount | Value | ||||||||
| Municipal Bonds (continued) | |||||||||
| Resource Recovery Bonds – 0.24% | |||||||||
| Pennsylvania Economic Development Financing Authority | |||||||||
| Resource Recovery Revenue (Subordinate Colver | |||||||||
| Project) Series G 5.125% 12/1/15 (AMT) | $ | 1,400,000 | $ | 1,210,440 | |||||
| 1,210,440 | |||||||||
| Special Tax Bonds – 11.74% | |||||||||
| Baltimore, Maryland Convention Center Hotel Revenue | |||||||||
| Subordinated Series B 5.00% 9/1/16 | 1,200,000 | 1,002,192 | |||||||
| California State Economic Recovery Series A 5.25% 7/1/14 | 1,000,000 | 1,115,740 | |||||||
| Casa Grande, Arizona Excise Tax Revenue | |||||||||
| 5.00% 4/1/22 (AMBAC) | 1,600,000 | 1,613,616 | |||||||
| Columbia County, Georgia Sales Tax 5.00% 4/1/16 | 1,265,000 | 1,460,822 | |||||||
| Dallas, Texas Convention Center Hotel Development | |||||||||
| Revenue Series A | |||||||||
| 5.00% 1/1/24 | 3,420,000 | 3,388,707 | |||||||
| 5.25% 1/1/23 | 5,375,000 | 5,449,819 | |||||||
| Guam Government Limited Obligation Revenue | |||||||||
| (Section 30) Series A | |||||||||
| 5.375% 12/1/24 | 1,750,000 | 1,757,368 | |||||||
| 5.625% 12/1/29 | 1,185,000 | 1,186,256 | |||||||
| Hampton, Virginia Convention Center Revenue | |||||||||
| 5.25% 1/15/23 (AMBAC) | 1,000,000 | 1,010,700 | |||||||
| Louisiana State Citizens Property Insurance Corporation | |||||||||
| Assessment Revenue Series C-2 6.75% 6/1/26 | |||||||||
| (ASSURED GTY) | 3,600,000 | 4,145,904 | |||||||
| Metropolitan Pier & Exposition Authority, Illinois Dedicate | |||||||||
| State Tax Revenue (McCormick Place Expansion Project) | |||||||||
| Series A 5.50% 12/15/24 (NATL-RE) (FGIC) | 2,000,000 | 2,035,360 | |||||||
| Middlesex County, New Jersey Improvement Authority | |||||||||
| Senior Revenue (Heldrich Center Hotel/Conference | |||||||||
| Project) Series A 5.00% 1/1/32 | 1,000,000 | 508,130 | |||||||
| @ | Modesto, California Special Tax Community Facilities | ||||||||
| District #04-1 (Village 2) 5.15% 9/1/36 | 1,500,000 | 996,975 | |||||||
| New Jersey Economic Development Authority Revenue | |||||||||
| (Cigarette Tax) | |||||||||
| 5.00% 6/15/11 (FGIC) | 2,750,000 | 2,785,943 | |||||||
| 5.50% 6/15/31 | 1,000,000 | 894,910 | |||||||
| 5.625% 6/15/18 | 1,000,000 | 987,310 | |||||||
47
Statements of net assets
Delaware Tax-Free USA Intermediate Fund
| Principal amount | Value | ||||||||
| Municipal Bonds (continued) | |||||||||
| Special Tax Bonds (continued) | |||||||||
| · | New York City, New York Transitional Finance Authority | ||||||||
| Revenue Refunding - Future Tax Secured | |||||||||
| Series A 5.50% 11/1/26 | $ | 1,000,000 | $ | 1,085,070 | |||||
| New York State Urban Development Corporation | |||||||||
| Revenue (State Personal Income Tax) | |||||||||
| Series A-1 5.00% 12/15/28 | 4,000,000 | 4,218,600 | |||||||
| Oregon Department of Administrative Services Lottery | |||||||||
| Revenue Series A 5.25% 4/1/26 | 2,000,000 | 2,200,660 | |||||||
| Puerto Rico Sales Tax Financing Corporation Sales Tax Revenue | |||||||||
| W(Capital Appreciation) Series A 6.75% 8/1/32 | 5,585,000 | 3,909,500 | |||||||
| Series A 5.00% 8/1/39 | 4,500,000 | 4,606,290 | |||||||
| Series A 6.125% 8/1/29 | 2,500,000 | 2,605,075 | |||||||
| Richmond Heights, Missouri Tax Increment & Transaction | |||||||||
| Sales Tax Revenue Refunding & Improvement (Francis | |||||||||
| Place Redevelopment Project) 5.625% 11/1/25 | 1,000,000 | 775,590 | |||||||
| @ | St. Joseph, Missouri Industrial Development Authority Tax | ||||||||
| Increment Revenue (Shoppes at North Village Project) | |||||||||
| Series A 5.10% 11/1/19 | 250,000 | 216,473 | |||||||
| Series B 5.375% 11/1/23 | 1,000,000 | 816,770 | |||||||
| Washington State Motor Vehicle Fuel Tax | |||||||||
| Series B 5.00% 7/1/16 | 4,250,000 | 4,893,279 | |||||||
| Wyandotte County, Kansas City, Kansas Unified | |||||||||
| Government Special Obligation Revenue Refunding- | |||||||||
| Sales Tax-2nd Lien-Area B 5.00% 12/1/20 | 1,500,000 | 1,496,055 | |||||||
| Wyoming State Loan & Investment Board Facilities | |||||||||
| Revenue 5.00% 10/1/24 | 1,550,000 | 1,627,516 | |||||||
| 58,790,630 | |||||||||
| State General Obligation Bonds – 20.40% | |||||||||
| California State 5.25% 11/1/17 | 1,000,000 | 1,058,940 | |||||||
| California State Various Purpose 6.50% 4/1/33 | 4,500,000 | 4,990,680 | |||||||
| Connecticut State Series C 5.00% 11/1/24 | 2,000,000 | 2,214,080 | |||||||
| Florida State Board Education Capital Outlay Public | |||||||||
| Education Series D 5.75% 6/1/22 | 2,000,000 | 2,068,000 | |||||||
| Georgia State | |||||||||
| 5.00% 8/1/12 | 3,125,000 | 3,476,813 | |||||||
| 5.00% 7/1/17 | 4,810,000 | 5,651,125 | |||||||
| Series D 5.00% 7/1/11 | 6,865,000 | 7,396,488 | |||||||
| Guam Government Series A 7.00% 11/15/39 | 1,560,000 | 1,572,776 | |||||||
48
| Principal amount | Value | ||||||||
| Municipal Bonds (continued) | |||||||||
| State General Obligation Bonds (continued) | |||||||||
| Illinois State Refunding Series B 5.00% 1/1/13 | $ | 3,475,000 | $ | 3,802,380 | |||||
| Maryland State 5.00% 8/1/17 | 1,500,000 | 1,733,100 | |||||||
| Maryland State & Local Facilities Land Capital | |||||||||
| Improvement 5.00% 3/15/19 | 3,675,000 | 4,204,898 | |||||||
| Massachusetts State Consolidated Loan | |||||||||
| Series A 5.25% 8/1/13 | 5,000,000 | 5,695,400 | |||||||
| Series C 5.00% 9/1/10 | 7,750,000 | 8,097,438 | |||||||
| Minnesota State 5.00% 6/1/14 | 900,000 | 1,030,086 | |||||||
| Mississippi State Series A 5.00% 10/1/17 | 4,860,000 | 5,600,081 | |||||||
| North Carolina State Public Improvement Series A | |||||||||
| 5.00% 3/1/12 | 4,000,000 | 4,393,040 | |||||||
| 5.00% 3/1/15 | 1,200,000 | 1,387,296 | |||||||
| North Carolina State Refunding Series B 5.00% 4/1/15 | 4,000,000 | 4,630,880 | |||||||
| Ohio State | |||||||||
| Series A 5.00% 6/15/13 | 3,750,000 | 4,226,400 | |||||||
| Series D 5.00% 9/15/14 | 3,500,000 | 4,006,485 | |||||||
| Pennsylvania State | |||||||||
| 5.50% 2/1/13 | 3,200,000 | 3,620,160 | |||||||
| Second Series A 5.00% 8/1/13 | 4,000,000 | 4,518,000 | |||||||
| Puerto Rico Commonwealth Public Improvement Series A | |||||||||
| 5.00% 7/1/16 (ASSURED GTY) | 2,110,000 | 2,268,904 | |||||||
| 5.25% 7/1/22 | 3,470,000 | 3,437,798 | |||||||
| 5.25% 7/1/23 | 1,125,000 | 1,103,254 | |||||||
| 5.50% 7/1/17 | 4,415,000 | 4,551,953 | |||||||
| · | Puerto Rico Commonwealth Series A 5.00% 7/1/30 | 1,000,000 | 1,018,430 | ||||||
| · | Puerto Rico Public Finance Corporation Commonwealth | ||||||||
| Appropriation (LOC Puerto Rico Government Bank) | |||||||||
| Series A 5.75% 8/1/27 | 1,000,000 | 1,027,360 | |||||||
| Virginia State 5.00% 6/1/23 | 2,000,000 | 2,244,040 | |||||||
| Washington State Variable Purpose Series A 5.00% 7/1/16 | 1,000,000 | 1,151,360 | |||||||
| 102,177,645 | |||||||||
| Transportation Revenue Bonds – 11.05% | |||||||||
| Bay Area Toll Authority, California Toll Bridge Revenue | |||||||||
| (San Francisco Bay Area) Series F-1 5.25% 4/1/29 | 4,400,000 | 4,657,928 | |||||||
| Broward County, Florida Airport System Revenue | |||||||||
| Series O 5.375% 10/1/29 | 3,895,000 | 3,941,662 | |||||||
| Capital Trust Agency Florida Revenue (Fort Lauderdale/ | |||||||||
| Cargo Acquisition Project) 5.75% 1/1/32 (AMT) | 1,750,000 | 1,213,240 | |||||||
49
Statements of net assets
Delaware Tax-Free USA Intermediate Fund
| Principal amount | Value | ||||||||
| Municipal Bonds (continued) | |||||||||
| Transportation Revenue Bonds (continued) | |||||||||
| Chicago, Illinois O’ Hare International Airport | |||||||||
| Revenue General-Airport-Third Lien | |||||||||
| Series A-2 5.75% 1/1/20 (FSA) (AMT) | $ | 1,000,000 | $ | 1,028,820 | |||||
| Dallas-Fort Worth, Texas International Airport Revenue | |||||||||
| Series A 5.00% 11/1/15 (XLCA) (AMT) | 2,000,000 | 2,002,080 | |||||||
| Georgia Federal Highway Road and Tollway Authority | |||||||||
| Revenue Bonds 5.00% 6/1/10 (NATL-RE) | 2,000,000 | 2,068,900 | |||||||
| Idaho Housing & Finance Association Grant Revenue | |||||||||
| (Antic Federal Highway Transportation) | |||||||||
| Series A 5.25% 7/15/21 (ASSURED GTY) | 2,760,000 | 3,086,011 | |||||||
| Metropolitan, New York Transportation Authority Revenue | |||||||||
| Series A 5.00% 11/15/18 | 2,500,000 | 2,675,675 | |||||||
| Series C 6.50% 11/15/28 | 2,860,000 | 3,234,031 | |||||||
| Metropolitan, Washington D.C. Airport Authority Systems | |||||||||
| Revenue Series A 5.50% 10/1/19 (NATL-RE) (FGIC) (AMT) | 1,000,000 | 1,031,990 | |||||||
| New York State Thruway Authority Revenue | |||||||||
| (General Highway and Bridge Trust Fund) | |||||||||
| Series B 5.25% 4/1/13 (AMBAC) | 3,300,000 | 3,699,432 | |||||||
| North Texas Tollway Authority Revenue System (First Tier) | |||||||||
| Series A 6.00% 1/1/20 | 4,000,000 | 4,278,000 | |||||||
| ·Series E-3 5.75% 1/1/38 | 2,470,000 | 2,593,920 | |||||||
| Pennsylvania State Turnpike Commission Revenue | |||||||||
| Series A 5.25% 12/1/20 (AMBAC) | 1,230,000 | 1,364,144 | |||||||
| Sacramento County, California Airport System | |||||||||
| Revenue (PFC/Grant) Series D | |||||||||
| 5.50% 7/1/28 | 2,020,000 | 2,017,475 | |||||||
| 5.625% 7/1/29 | 1,685,000 | 1,692,414 | |||||||
| Saint Louis, Missouri Airport Revenue (Lambert-St. Louis | |||||||||
| International) Series A-1 6.125% 7/1/24 | 3,780,000 | 3,881,833 | |||||||
| Texas State Transportation Commission Highway Fund | |||||||||
| Revenue (First Tier) 5.00% 4/1/18 | 1,700,000 | 1,935,212 | |||||||
| Triborough, New York Bridge & Tunnel Authority Revenue | |||||||||
| Series A 5.00% 11/15/17 | 1,720,000 | 1,967,818 | |||||||
| ·Series B-1 5.00% 11/15/25 | 4,000,000 | 4,437,200 | |||||||
| ·Series B-3 5.00% 11/15/38 | 1,800,000 | 2,001,618 | |||||||
| Virginia Port Authority Commonwealth Port Fund | |||||||||
| Revenue Resolution 5.00% 7/1/12 (AMT) | 500,000 | 535,105 | |||||||
| 55,344,508 | |||||||||
50
| Principal amount | Value | ||||||||
| Municipal Bonds (continued) | |||||||||
| Water & Sewer Revenue Bonds – 6.98% | |||||||||
| Alabama Water Pollution Control Authority Revenue | |||||||||
| 5.50% 8/15/23 (AMBAC) | $ | 1,000,000 | $ | 1,014,030 | |||||
| Arizona Water Infrastructure Finance Authority Revenue | |||||||||
| (Water Quality) Series A 5.00% 10/1/21 | 2,430,000 | 2,734,601 | |||||||
| Atlanta, Georgia Water & Wastewater Revenue | |||||||||
| Series A 6.00% 11/1/25 | 2,925,000 | 3,065,342 | |||||||
| Dallas, Texas Waterworks & Sewer System Revenue | |||||||||
| 5.00% 10/1/24 (FSA) | 6,500,000 | 6,511,569 | |||||||
| Florida Water Pollution Control Financing Corporation | |||||||||
| Revenue (Water Pollution Control) Series A | |||||||||
| 5.00% 1/15/25 | 5,000,000 | 5,287,150 | |||||||
| King County, Washington Sewer Revenue Refunding | |||||||||
| Series B 5.00% 1/1/14 (NATL-RE) | 3,500,000 | 3,942,960 | |||||||
| Massachusetts State Water Pollution Abatement Trust | |||||||||
| 5.00% 8/1/16 | 2,170,000 | 2,530,263 | |||||||
| New York State Environmental Facilities Corporation | |||||||||
| Revenue (State Clean Water & Drinking Water | |||||||||
| Revolving Foundation) | |||||||||
| Series A 5.00% 6/15/22 | 1,405,000 | 1,562,852 | |||||||
| Series D 5.00% 9/15/23 | 3,360,000 | 3,680,611 | |||||||
| Portland, Oregon Sewer System Revenue (First Lien) | |||||||||
| Series A 5.00% 6/15/18 | 4,000,000 | 4,605,840 | |||||||
| 34,935,218 | |||||||||
| Total Municipal Bonds (cost $480,361,761) | 494,978,831 | ||||||||
| Short-Term Investments – 1.24% | |||||||||
| ·Variable Rate Demand Notes – 1.24% | |||||||||
| Colorado Educational & Cultural Facilities Authority | |||||||||
| Revenue (National Jewish Federation) | |||||||||
| Series A-4 0.18% 2/1/34 | 1,300,000 | 1,300,000 | |||||||
| Series A-8 0.18% 9/1/35 | 1,500,000 | 1,500,000 | |||||||
| Minneapolis, Minnesota Health Care System Revenue | |||||||||
| (Fairview Health Services) Series E 0.20% 11/15/47 | 900,000 | 900,000 | |||||||
| Philadelphia, Pennsylvania Gas Works Revenue | |||||||||
| Series E 0.25% 8/1/31 | 500,000 | 500,000 | |||||||
| University of Minnesota Series C 0.20% 12/1/36 | 2,000,000 | 2,000,000 | |||||||
| Total Short-Term Investments (cost $6,200,000) | 6,200,000 | ||||||||
51
Statements of net assets
Delaware Tax-Free USA Intermediate Fund
| Total Value of Securities – 100.06% | ||||
| (cost $486,561,761) | $ | 501,178,831 | ||
| Liabilities Net of Receivables and | ||||
| Other Assets – (0.06%) | (303,261 | ) | ||
| Net Assets Applicable to 43,716,346 | ||||
| Shares Outstanding – 100.00% | $ | 500,875,570 | ||
| Net Asset Value – Delaware Tax-Free USA Intermediate Fund | ||||
| Class A ($459,781,407 / 40,127,755 Shares) | $11.46 | |||
| Net Asset Value – Delaware Tax-Free USA Intermediate Fund | ||||
| Class B ($860,724 / 75,197 Shares) | $11.45 | |||
| Net Asset Value – Delaware Tax-Free USA Intermediate Fund | ||||
| Class C ($40,232,330 / 3,513,297 Shares) | $11.45 | |||
| Net Asset Value – Delaware Tax-Free USA Intermediate Fund | ||||
| Institutional Class ($1,109 / 96.8 Shares) | $11.46 | |||
| Components of Net Assets at August 31, 2009: | ||||
| Shares of beneficial interest (unlimited authorization – no par) | $ | 495,042,867 | ||
| Undistributed net investment income | 16,225 | |||
| Accumulated net realized loss on investments | (8,800,592 | ) | ||
| Net unrealized appreciation of investments | 14,617,070 | |||
| Total net assets | $ | 500,875,570 |
| § | Pre-Refunded Bonds. Municipals that are generally backed or secured by U.S. Treasury bonds. For Pre-Refunded Bonds, the stated maturity is followed by the year in which the bond is pre-refunded. See Note 8 in “Notes to financial statements.” |
| · | Variable rate security. The rate shown is the rate as of August 31, 2009. |
| @ | Illiquid security. At August 31, 2009, the aggregate amount of illiquid securities was $2,572,131, which represented 0.51% of the Fund’s net assets. See Note 8 in “Notes to financial statements.” |
WStep coupon bond. Indicates security that has a zero coupon that remains in effect until a predetermined date at which time the stated interest rate becomes effective.
52
Summary of abbreviations: |
| Net Asset Value and Offering Price Per Share – | ||
| Delaware Tax-Free USA Intermediate Fund | ||
| Net asset value Class A (A) | $ | 11.46 |
| Sales charge (2.75% of offering price) (B) | 0.32 | |
| Offering price | $ | 11.78 |
| (A) | Net asset value per share, as illustrated, is the amount which would be paid upon redemption or repurchase of shares. |
| (B) | See the current prospectus for purchases of $100,000 or more. |
See accompanying notes
53
| Statements of net assets | |
| Delaware National High-Yield Municipal Bond Fund | August 31, 2009 |
| Principal amount | Value | ||||||||
| Municipal Bonds – 99.99% | |||||||||
| Corporate Revenue Bonds – 24.03% | |||||||||
| · | Beaver County, Pennsylvania Industrial Development | ||||||||
| Authority Pollution Control Revenue (Firstenergy | |||||||||
| General Corp. Project) Series C 7.125% 6/1/28 (AMT) | $ | 1,000,000 | $ | 1,038,820 | |||||
| · | Brazos, Texas Harbor Industrial Development | ||||||||
| Environmental Facilities Revenue (Dow Chemical Co. | |||||||||
| Project) 5.90% 5/1/38 (AMT) | 190,000 | 176,825 | |||||||
| · | Brazos, Texas River Authority Pollution Control Revenue | ||||||||
| (TXU Energy Co. Project) Series B 6.30% 7/1/32 (AMT) | 1,000,000 | 443,360 | |||||||
| Buckeye, Ohio Tobacco Settlement Financing Authority | |||||||||
| Asset-Backed Series A-2 | |||||||||
| 5.875% 6/1/47 | 590,000 | 435,190 | |||||||
| 6.50% 6/1/47 | 1,000,000 | 806,340 | |||||||
| Cloquet, Minnesota Pollution Control Revenue | |||||||||
| (Potlatch Corp. Project) 5.90% 10/1/26 | 750,000 | 542,385 | |||||||
| De Soto Parish, Louisiana Environmental Improvement | |||||||||
| Revenue (International Paper Co. Project) | |||||||||
| Series A 6.35% 2/1/25 (AMT) | 1,650,000 | 1,604,929 | |||||||
| Golden State, California Tobacco Securitization Settlement | |||||||||
| Revenue Refunding Asset-Backed Senior Series A-1 | |||||||||
| 5.75% 6/1/47 | 235,000 | 183,302 | |||||||
| Gulf Coast, Texas Waste Disposal Authority Revenue | |||||||||
| (Valero Energy Corp. Project) 6.65% 4/1/32 (AMT) | 1,000,000 | 979,910 | |||||||
| Hawaii State Department Budget & Finance Special Purpose | |||||||||
| Revenue (Hawaiian Electric Co. Subsidiary) 6.50% 7/1/39 | 970,000 | 1,017,278 | |||||||
| Michigan Tobacco Settlement Finance Authority | |||||||||
| Revenue Asset-Backed Series A 6.00% 6/1/48 | 555,000 | 427,539 | |||||||
| Mississippi Business Finance Corporation Pollution | |||||||||
| Control Revenue (System Energy Resources, Inc. | |||||||||
| Project) 5.90% 5/1/22 | 900,000 | 845,280 | |||||||
| M-S-R Energy Authority, California Gas Revenue | |||||||||
| Series C 6.50% 11/1/39 | 1,000,000 | 1,008,020 | |||||||
| Nassau County, New York Tobacco Settlement | |||||||||
| Asset-Backed Series A-3 5.125% 6/1/46 | 525,000 | 385,403 | |||||||
| New Jersey Economic Development Authority Special | |||||||||
| Facility Revenue (Continental Airlines Inc. Project) | |||||||||
| 6.40% 9/15/23 (AMT) | 1,000,000 | 848,160 | |||||||
| New York City, New York Industrial Development Agency | |||||||||
| Special Facilities Revenue (JetBlue Airways Corp. Project) | |||||||||
| 5.125% 5/15/30 (AMT) | 1,000,000 | 646,090 | |||||||
54
| Principal amount | Value | ||||||||
| Municipal Bonds (continued) | |||||||||
| Corporate Revenue Bonds (continued) | |||||||||
| Pennsylvania Economic Development Financing Authority | |||||||||
| Exempt Facilities Revenue (Allegheny Energy Supply Co.) | |||||||||
| 7.00% 7/15/39 | $ | 1,000,000 | $ | 1,035,170 | |||||
| Petersburg, Indiana Pollution Control Revenue (Indianapolis | |||||||||
| Power & Light Co. Project) 6.375% 11/1/29 (AMT) | 1,000,000 | 941,100 | |||||||
| Phenix City, Alabama Industrial Development Board | |||||||||
| Environmental Improvement Revenue (Mead Westvaco | |||||||||
| Corp. Project) Series A 6.35% 5/15/35 (AMT) | 500,000 | 399,405 | |||||||
| Salt Verde Financial Corporation, Arizona Senior Gas Revenue | |||||||||
| 5.00% 12/1/37 | 1,000,000 | 838,520 | |||||||
| Sugar Creek, Missouri Industrial Development Revenue | |||||||||
| (Lafarge North America Project) Series A | |||||||||
| 5.65% 6/1/37 (AMT) | 500,000 | 382,160 | |||||||
| Sweetwater County, Wyoming Solid Waste Disposal | |||||||||
| Revenue (FMC Corp. Project) 5.60% 12/1/35 (AMT) | 1,000,000 | 878,740 | |||||||
| Tobacco Settlement Financing Corporation, New Jersey | |||||||||
| Refunding Senior Series 1A 5.00% 6/1/41 | 2,000,000 | 1,369,100 | |||||||
| Tobacco Settlement Financing Corporation, Virginia | |||||||||
| Senior Series B-1 5.00% 6/1/47 | 1,000,000 | 700,180 | |||||||
| Toledo, Lucas County, Ohio Port Authority Development | |||||||||
| Revenue (Toledo Express Airport Project) Series C | |||||||||
| 6.375% 11/15/32 (AMT) | 1,000,000 | 817,060 | |||||||
| 18,750,266 | |||||||||
| Education Revenue Bonds – 20.34% | |||||||||
| California Statewide Communities Development | |||||||||
| Authority Revenue (California Baptist University | |||||||||
| Project) Series A 5.50% 11/1/38 | 1,000,000 | 669,180 | |||||||
| California Statewide Communities Development | |||||||||
| Authority Student Housing Revenue (East Campus | |||||||||
| Apartments, LLC) Series A 5.625% 8/1/34 (ACA) | 1,000,000 | 890,420 | |||||||
| Chattanooga, Tennessee Health Educational & Housing | |||||||||
| Facilities Board Revenue (CDFI Phase I, LLC Project) | |||||||||
| Subordinate Series B 6.00% 10/1/35 | 1,000,000 | 754,760 | |||||||
| Idaho Housing & Finance Association Nonprofit | |||||||||
| Facilities Revenue (North Star Charter School Project) | |||||||||
| Series A 9.50% 7/1/39 | 1,000,000 | 1,046,890 | |||||||
| Indiana State Finance Authority Revenue Educational | |||||||||
| Facilities (Irvington Community) Series A 9.00% 7/1/39 | 1,000,000 | 1,096,650 | |||||||
55
Statements of net assets
Delaware National High-Yield Municipal Bond Fund
| Principal amount | Value | ||||||||
| Municipal Bonds (continued) | |||||||||
| Education Revenue Bonds (continued) | |||||||||
| Marietta, Georgia Development Authority Revenue | |||||||||
| (Life University Income Project) 7.00% 6/15/39 | $ | 1,000,000 | $ | 834,890 | |||||
| Maryland State Economic Development Corporation | |||||||||
| Student Housing Revenue (University of Maryland | |||||||||
| College Park Projects) 5.75% 6/1/33 | 930,000 | 907,559 | |||||||
| @ | Maryland State Health & Higher Educational Facilities | ||||||||
| Authority Revenue (Washington Christian | |||||||||
| Academy Project) 5.50% 7/1/38 | 1,170,000 | 592,043 | |||||||
| Massachusetts State Health & Educational Facilities | |||||||||
| Authority Revenue (Nichols College Project) | |||||||||
| Series C 6.125% 10/1/29 | 1,000,000 | 869,070 | |||||||
| Minnesota State Higher Education Facilities Authority | |||||||||
| Revenue (Bethel University) Series 6-R 5.50% 5/1/37 | 1,000,000 | 879,790 | |||||||
| New Jersey State Educational Facilities Authority Revenue | |||||||||
| (Fairleigh Dickinson Project) Series C 5.50% 7/1/23 | 750,000 | 720,120 | |||||||
| (University of Medical & Dentistry) Series B 7.50% 12/1/32 | 1,000,000 | 1,105,489 | |||||||
| New Mexico Educational Assistance Foundation Student | |||||||||
| Loan Revenue 1st Subordinate Series A-2 | |||||||||
| 6.65% 11/1/25 (AMT) | 985,000 | 987,236 | |||||||
| Ohio State Higher Educational Facility Revenue | |||||||||
| (Otterbein College Project) Series A 5.50% 12/1/28 | 950,000 | 991,914 | |||||||
| Oregon State Facilities Authority Revenue | |||||||||
| (College Housing Northwest Project) Series A | |||||||||
| 5.45% 10/1/32 | 1,000,000 | 739,560 | |||||||
| Pennsylvania State Higher Educational Facilities | |||||||||
| Authority Revenue | |||||||||
| (Edinboro University Foundation Student Housing) | |||||||||
| 6.00% 7/1/42 | 1,000,000 | 884,100 | |||||||
| (Widener University) 5.375% 7/15/29 | 650,000 | 633,315 | |||||||
| Philadelphia, Pennsylvania Authority for Industrial | |||||||||
| Development Revenue (First Philadelphia Charter | |||||||||
| Project) Series A 5.75% 8/15/32 | 745,000 | 571,639 | |||||||
| Provo, Utah Charter School Revenue (Freedom Academy | |||||||||
| Foundation Project) 5.50% 6/15/37 | 1,000,000 | 697,320 | |||||||
| 15,871,945 | |||||||||
56
| Principal amount | Value | ||||||||
| Municipal Bonds (continued) | |||||||||
| Health Care Revenue Bonds – 26.39% | |||||||||
| Apple Valley, Minnesota Economic Development | |||||||||
| Authority Health Care Revenue (Augustana Home | |||||||||
| St. Paul Project) Series A 6.00% 1/1/40 | $ | 1,000,000 | $ | 751,930 | |||||
| Brevard County, Florida Health Facilities Authority | |||||||||
| Health Care Facilities Revenue (Heath First Inc. Project) | |||||||||
| Series B 7.00% 4/1/39 | 1,000,000 | 1,043,140 | |||||||
| Butler County, Pennsylvania Hospital Authority Revenue | |||||||||
| (Butler Health System Project) 7.125% 7/1/29 | 900,000 | 972,900 | |||||||
| California Statewide Communities Development | |||||||||
| Authority Revenue (Senior Living - Southern California) | |||||||||
| 7.25% 11/15/41 | 500,000 | 510,760 | |||||||
| Chatham County, Georgia Hospital Authority Revenue | |||||||||
| (Memorial Health Medical Center) Series A | |||||||||
| 6.125% 1/1/24 | 750,000 | 691,448 | |||||||
| @ | Cleveland-Cuyahoga County, Ohio Port Authority | ||||||||
| Revenue Senior Housing (St. Clarence - Geac) | |||||||||
| Series A 6.25% 5/1/38 | 1,000,000 | 671,490 | |||||||
| Colorado Health Facilities Authority Revenue | |||||||||
| (Christian Living Community Project) Series A | |||||||||
| 5.75% 1/1/37 | 500,000 | 371,215 | |||||||
| East Rochester, New York Housing Authority Revenue | |||||||||
| Refunding (Senior Living - Woodland Village Project) | |||||||||
| 5.50% 8/1/33 | 500,000 | 379,455 | |||||||
| Gainesville & Hall County, Georgia Development | |||||||||
| Authority Revenue Senior Living Facilities | |||||||||
| (Lanier Village Estates Project) Series C 7.25% 11/15/29 | 1,000,000 | 1,012,390 | |||||||
| Illinois Finance Authority Revenue | |||||||||
| (Provena Health) Series A 7.75% 8/15/34 | 1,000,000 | 1,035,690 | |||||||
| (Silver Cross & Medical Centers) 7.00% 8/15/44 | 1,000,000 | 1,014,250 | |||||||
| Illinois Health Facilities Authority Revenue | |||||||||
| (Elmhurst Memorial Healthcare Project) 5.625% 1/1/28 | 1,000,000 | 909,940 | |||||||
| Lancaster County, Pennsylvania Hospital Authority Revenue | |||||||||
| (Brethren Village Project) Series A 6.375% 7/1/30 | 725,000 | 665,608 | |||||||
| Lebanon County, Pennsylvania Health Facilities Authority | |||||||||
| Center Revenue (Pleasant View Retirement) | |||||||||
| Series A 5.30% 12/15/26 | 1,000,000 | 824,410 | |||||||
| New Jersey Health Care Facilities Financing Authority | |||||||||
| Revenue (St. Josephs Healthcare System) 6.625% 7/1/38 | 860,000 | 786,117 | |||||||
57
Statements of net assets
Delaware National High-Yield Municipal Bond Fund
| Principal amount | Value | |||||||
| Municipal Bonds (continued) | ||||||||
| Health Care Revenue Bonds (continued) | ||||||||
| New York State Dormitory Authority Revenue Non State | ||||||||
| Supported Debt (Orange Regional Medical Center) | ||||||||
| 6.25% 12/1/37 | $ | 1,000,000 | $ | 811,630 | ||||
| North Carolina Medical Care Commission Health Care | ||||||||
| Facilities Revenue (First Mortgage - Presbyterian Homes) | ||||||||
| 5.60% 10/1/36 | 1,000,000 | 770,280 | ||||||
| Orange County, Florida Health Facilities Authority | ||||||||
| Revenue (Orlando Regional Healthcare) Series C | ||||||||
| 5.25% 10/1/35 | 1,000,000 | 895,650 | ||||||
| Pennsylvania Economic Development Financing Authority | ||||||||
| Health System Revenue (Evalbert Einstein Healthcare) | ||||||||
| Series A 6.25% 10/15/23 | 1,000,000 | 1,020,960 | ||||||
| Richland County, Ohio Hospital Facilities Revenue | ||||||||
| (Medcentral Health System Project) Series B | ||||||||
| 6.375% 11/15/30 | 500,000 | 506,645 | ||||||
| St. Joseph County, Indiana Industrial Economic | ||||||||
| Development Revenue (Madison Center Project) | ||||||||
| 5.50% 2/15/21 | 1,150,000 | 1,105,576 | ||||||
| St. Paul, Minnesota Housing & Redevelopment | ||||||||
| Authority Hospital Revenue (Healtheast Project) | ||||||||
| 6.00% 11/15/30 | 1,000,000 | 834,910 | ||||||
| Washington State Health Care Facilities Authority | ||||||||
| Revenue (Multicare Health System) Series B | ||||||||
| 6.00% 8/15/39 (ASSURED GTY) | 1,250,000 | 1,312,438 | ||||||
| Winchester, Virginia Industrial Development Authority | ||||||||
| Residential Care Facility Revenue (Westminster- | ||||||||
| Canterbury Project) Series A 5.30% 1/1/35 | 1,000,000 | 731,730 | ||||||
| Yavapai County, Arizona Industrial Development Authority | ||||||||
| Hospital Revenue (Yavapai Medical Center Project) | ||||||||
| Series A 6.00% 8/1/33 | 1,000,000 | 960,730 | ||||||
| 20,591,292 | ||||||||
| Housing Revenue Bonds – 1.29% | ||||||||
| North Carolina Housing Finance Agency Homeownership | ||||||||
| Revenue Series 27-A 5.55% 7/1/38 (AMT) | 1,000,000 | 1,004,070 | ||||||
| 1,004,070 | ||||||||
58
| Principal amount | Value | |||||||
| Municipal Bonds (continued) | ||||||||
| Lease Revenue Bonds – 2.13% | ||||||||
| Dauphin County, Pennsylvania General Authority Revenue | ||||||||
| (Riverfront Office & Parking Project) 5.75% 1/1/10 | $ | 970,000 | $ | 963,035 | ||||
| Missouri State Development Finance Board Infrastructure | ||||||||
| Facilities Revenue (Branson Landing Project) | ||||||||
| Series A 5.50% 12/1/24 | 720,000 | 696,845 | ||||||
| 1,659,880 | ||||||||
| §Pre-Refunded Bonds – 3.67% | ||||||||
| Bexar County, Texas Health Facilities Development | ||||||||
| Corporation Revenue (Army Retirement Residence | ||||||||
| Project) 6.30% 7/1/32-12 | 1,000,000 | 1,139,670 | ||||||
| Milledgeville-Baldwin County, Georgia Development | ||||||||
| Authority Revenue (Georgia College & State University | ||||||||
| Foundation Student Housing Project) 6.00% 9/1/33-14 | 1,000,000 | 1,207,940 | ||||||
| Minnesota State Higher Education Facilities Authority | ||||||||
| Revenue (College of Art & Design Project) | ||||||||
| Series 5-D 6.75% 5/1/26-10 | 500,000 | 520,440 | ||||||
| 2,868,050 | ||||||||
| Special Tax Bonds – 13.19% | ||||||||
| Baltimore, Maryland Convention Center Hotel Revenue | ||||||||
| Suborinated Series B 5.875% 9/1/39 | 1,000,000 | 761,890 | ||||||
| Chicago, Illinois Tax Increment Allocation | ||||||||
| (Chatham Ridge Redevelopment Project) | ||||||||
| 5.95% 12/15/12 | 750,000 | 741,248 | ||||||
| Farms New Kent, Virginia Community Development | ||||||||
| Authority Special Assessment Series C 5.80% 3/1/36 | 1,000,000 | 605,830 | ||||||
| Henderson, Nevada Local Improvement Districts #T-18 | ||||||||
| 5.30% 9/1/35 | 665,000 | 240,531 | ||||||
| Lancaster, California Redevelopment Agency Tax Allocation | ||||||||
| (Combined Redevelopment Project Areas) 6.875% 8/1/39 | 500,000 | 503,100 | ||||||
| Middlesex County, New Jersey Improvement Authority | ||||||||
| Senior Revenue (Heldrich Center Hotel/Conference | ||||||||
| Project) Series A | ||||||||
| 5.00% 1/1/32 | 500,000 | 254,065 | ||||||
| 5.125% 1/1/37 | 870,000 | 442,125 | ||||||
| New Jersey Economic Development Authority | ||||||||
| (Cigarette Tax) 5.75% 6/15/34 | 965,000 | 884,094 | ||||||
59
Statements of net assets
Delaware National High-Yield Municipal Bond Fund
| Principal amount | Value | |||||||
| Municipal Bonds (continued) | ||||||||
| Special Tax Bonds (continued) | ||||||||
| Prescott Valley, Arizona Improvement District Special | ||||||||
| Assessment (Sewer Collection System Roadway Repair | ||||||||
| Project) 7.90% 1/1/12 | $ | 168,000 | $ | 174,576 | ||||
| Puerto Rico Sales Tax Financing Corporation Sales Tax Revenue | ||||||||
| W(Capital Appreciation) Series A 6.75% 8/1/32 | 2,030,000 | 1,420,999 | ||||||
| Series A 5.75% 8/1/37 | 940,000 | 966,414 | ||||||
| Richmond Heights, Missouri Tax Increment & Transaction | ||||||||
| Sales Tax Revenue Refunding & Improvement | ||||||||
| (Francis Place Redevelopment Project) 5.625% 11/1/25 | 1,200,000 | 930,708 | ||||||
| @ | Southwestern Illinois Development Authority Revenue | |||||||
| (Local Government Program - Collinsville Limited Project) | ||||||||
| 5.35% 3/1/31 | 500,000 | 346,585 | ||||||
| @ | St. Joseph, Missouri Industrial Development Authority Tax | |||||||
| Increment Revenue (Shoppes at North Village Project) Series A | ||||||||
| 5.375% 11/1/24 | 1,000,000 | 810,480 | ||||||
| 5.50% 11/1/27 | 500,000 | 395,555 | ||||||
| Winter Garden Village at Fowler Groves Community | ||||||||
| Development District, Florida Special Assessment Revenue | ||||||||
| 5.65% 5/1/37 | 975,000 | 815,402 | ||||||
| 10,293,602 | ||||||||
| State General Obligation Bonds – 2.03% | ||||||||
| Guam Government Series A 6.75% 11/15/29 | 1,565,000 | 1,581,213 | ||||||
| 1,581,213 | ||||||||
| Transportation Revenue Bonds – 6.92% | ||||||||
| Branson, Missouri Regional Airport Transportation Development | ||||||||
| District (Airport Project) Series A 6.00% 7/1/37 | 500,000 | 346,400 | ||||||
| Metropolitan Washington DC Airports Authority Dulles Toll | ||||||||
| Road Revenue First Senior Lien Series A 5.25% 10/1/44 | 900,000 | 904,788 | ||||||
| New York City, New York Industrial Development Agency | ||||||||
| Special Airport Facilities (Airis JFK I LLC Project) | ||||||||
| Series A 5.50% 7/1/28 (AMT) | 905,000 | 632,857 | ||||||
| Oklahoma City, Oklahoma Industrial & Cultural Facilities | ||||||||
| Subordinated (Air Cargo Obligated Group Project) | ||||||||
| 6.75% 1/1/23 (AMT) | 1,160,000 | 963,798 | ||||||
| Onondaga County, New York Industrial Development | ||||||||
| Authority Revenue Subordinated (Air Cargo Project) | ||||||||
| 7.25% 1/1/32 (AMT) | 500,000 | 417,545 | ||||||
60
| Principal amount | Value | |||||||||
| Municipal Bonds (continued) | ||||||||||
| Transportation Revenue Bonds (continued) | ||||||||||
| Sacramento County, California Airport Services Revenue | ||||||||||
| (PFC/Grant) Series C 6.00% 7/1/41 | $ | 1,000,000 | $ | 1,013,100 | ||||||
| Saint Louis, Missouri Airport Revenue (Lambert-St. Louis | ||||||||||
| International) Series A-1 6.625% 7/1/34 | 1,090,000 | 1,123,605 | ||||||||
| 5,402,093 | ||||||||||
| Total Municipal Bonds (cost $84,459,936) | 78,022,411 | |||||||||
| Short-Term Investment – 0.38% | ||||||||||
| ·Variable Rate Demand Note – 0.38% | ||||||||||
| Philadelphia, Pennsylvania Gas Works Revenue 8th | ||||||||||
| Series E 0.25% 8/1/31 | 300,000 | 300,000 | ||||||||
| Total Short-Term Investment (cost $300,000) | 300,000 | |||||||||
| Total Value of Securities – 100.37% | ||||||||||
| (cost $84,759,936) | 78,322,411 | |||||||||
| Liabilities Net of Receivables | ||||||||||
| and Other Assets – (0.37%) | (291,298 | ) | ||||||||
| Net Assets Applicable to 8,739,745 | ||||||||||
| Shares Outstanding – 100.00% | $ | 78,031,113 | ||||||||
| Net Asset Value – Delaware National High-Yield Municipal | ||||||||||
| Bond Fund Class A ($68,812,016 / 7,710,832 Shares) | $8.92 | |||||||||
| Net Asset Value – Delaware National High-Yield Municipal | ||||||||||
| Bond Fund Class B ($1,448,068 / 161,945 Shares) | $8.94 | |||||||||
| Net Asset Value – Delaware National High-Yield Municipal | ||||||||||
| Bond Fund Class C ($7,769,786 / 866,829 Shares) | $8.96 | |||||||||
| Net Asset Value – Delaware National High-Yield Municipal | ||||||||||
| Bond Fund Institutional Class ($1,243 / 139.2 Shares) | $8.93 | |||||||||
61
Statements of net assets
Delaware National High-Yield Municipal Bond Fund
| Components of Net Assets at August 31, 2009: | ||||
| Shares of beneficial interest (unlimited authorization – no par) | $ | 87,784,016 | ||
| Undistributed net investment income | 13,405 | |||
| Accumulated net realized loss on investments | (3,328,783 | ) | ||
| Net unrealized depreciation of investments | (6,437,525 | ) | ||
| Total net assets | $ | 78,031,113 | ||
| § | Pre-Refunded Bonds. Municipals that are generally backed or secured by U.S. Treasury bonds. For Pre-Refunded Bonds, the stated maturity is followed by the year in which the bond is pre-refunded. See Note 8 in “Notes to financial statements.” |
| · | Variable rate security. The rate shown is the rate as of August 31, 2009. |
| @ | Illiquid security. At August 31, 2009, the aggregate amount of illiquid securities was $2,816,153, which represented 3.61% of the Fund’s net assets. See Note 8 in “Notes to financial statements.” |
| W | Step coupon bond. Indicates security that has a zero coupon that remains in effect until a predetermined date at which time the stated interest rate becomes effective. |
Summary of abbreviations:
ACA — Insured by American Capital Access
AMT — Subject to Alternative Minimum Tax
ASSURED GTY — Insured by the Assured Guaranty Corporation
CDFI — Community Development Financial Institutions
| Net Asset Value and Offering Price Per Share – | |||
| Delaware National High-Yield Municipal Bond Fund | |||
| Net asset value Class A (A) | $ | 8.92 | |
| Sales charge (4.50% of offering price) (B) | 0.42 | ||
| Offering price | $ | 9.34 |
| (A) | Net asset value per share, as illustrated, is the amount which would be paid upon redemption or repurchase of shares. |
| (B) | See the current prospectus for purchases of $100,000 or more. |
See accompanying notes
62
| Statements of operations | |
| Year Ended August 31, 2009 |
| Delaware | Delaware | Delaware | ||||||||||||
| Tax-Free | Tax-Free USA | National High-Yield | ||||||||||||
| USA Fund | Intermediate Fund | Municipal Bond Fund | ||||||||||||
| Investment Income: | ||||||||||||||
| Interest | $ | 29,239,930 | $ | 18,728,141 | $ | 4,824,027 | ||||||||
| Expenses: | ||||||||||||||
| Management fees | 2,937,212 | 2,194,831 | 381,113 | |||||||||||
| Distribution expenses – Class A | 1,232,597 | 1,219,093 | 152,059 | |||||||||||
| Distribution expenses – Class B | 92,299 | 9,560 | 20,950 | |||||||||||
| Distribution expenses – Class C | 178,247 | 307,441 | 63,888 | |||||||||||
| Dividend disbursing and transfer | ||||||||||||||
| agent fees and expenses | 388,618 | 492,179 | 54,699 | |||||||||||
| Accounting and administration expenses | 214,995 | 175,586 | 27,717 | |||||||||||
| Registration fees | 98,265 | 98,134 | 56,974 | |||||||||||
| Legal fees | 83,688 | 71,578 | 12,668 | |||||||||||
| Reports and statements to shareholders | 64,145 | 59,372 | 10,393 | |||||||||||
| Audit and tax | 45,162 | 40,074 | 15,330 | |||||||||||
| Trustees’ fees | 38,960 | 31,697 | 5,015 | |||||||||||
| Insurance fees | 18,193 | 14,326 | 2,112 | |||||||||||
| Pricing fees | 17,182 | 19,833 | 9,818 | |||||||||||
| Custodian fees | 9,895 | 8,144 | 1,489 | |||||||||||
| Consulting fees | 7,340 | 5,929 | 942 | |||||||||||
| Due and services | 3,445 | 2,329 | 322 | |||||||||||
| Trustees’ expenses | 3,040 | 2,429 | 406 | |||||||||||
| 5,433,283 | 4,752,535 | 815,895 | ||||||||||||
| Less expenses absorbed or waived | (696,758 | ) | (575,527 | ) | (127,504 | ) | ||||||||
| Less waived distribution expenses – Class A | — | (609,546 | ) | — | ||||||||||
| Less expense paid indirectly | (1,825 | ) | (1,433 | ) | (247 | ) | ||||||||
| Total operating expenses | 4,734,700 | 3,566,029 | 688,144 | |||||||||||
| Net Investment Income | 24,505,230 | 15,162,112 | 4,135,883 | |||||||||||
64
| Delaware | Delaware | Delaware | ||||||||||||
| Tax-Free | Tax-Free USA | National High-Yield | ||||||||||||
| USA Fund | Intermediate Fund | Municipal Bond Fund | ||||||||||||
| Net Realized and Unrealized Gain | ||||||||||||||
| (Loss) on Investments: | ||||||||||||||
| Net realized loss on investments | $ | (2,838,744 | ) | $ | (2,348,573 | ) | $ | (898,271 | ) | |||||
| Net change in unrealized appreciation/ | ||||||||||||||
| depreciation of investments | 1,152,242 | 11,254,947 | (3,755,920 | ) | ||||||||||
| Net Realized and Unrealized Gain | ||||||||||||||
| (Loss) on Investments | (1,686,502 | ) | 8,906,374 | (4,654,191 | ) | |||||||||
| Net Increase (Decrease) in Net Assets | ||||||||||||||
| Resulting from Operations | $ | 22,818,728 | $ | 24,068,486 | $ | (518,308 | ) | |||||||
See accompanying notes
65
Statements of changes in net assets
Delaware Tax-Free USA Fund
| Year Ended | ||||||||
| 8/31/09 | 8/31/08 | |||||||
| Increase (Decrease) in Net Assets from Operations: | ||||||||
| Net investment income | $ | 24,505,230 | $ | 27,617,892 | ||||
| Net realized loss on investments | (2,838,744 | ) | (9,007,332 | ) | ||||
| Net change in unrealized | ||||||||
| appreciation/depreciation of investments | 1,152,242 | (6,388,968 | ) | |||||
| Net increase in net assets resulting from operations | 22,818,728 | 12,221,592 | ||||||
| Dividends and Distributions to Shareholders from: | ||||||||
| Net investment income: | ||||||||
| Class A | (23,405,639 | ) | (26,581,925 | ) | ||||
| Class B | (352,615 | ) | (470,633 | ) | ||||
| Class C | (681,841 | ) | (565,334 | ) | ||||
| Institutional Class | (32 | ) | — | |||||
| (24,440,127 | ) | (27,617,892 | ) | |||||
| Capital Share Transactions: | ||||||||
| Proceeds from shares sold: | ||||||||
| Class A | 118,535,984 | 37,572,215 | ||||||
| Class B | 70,203 | 293,560 | ||||||
| Class C | 6,869,985 | 4,557,451 | ||||||
| Institutional Class | 1,022 | — | ||||||
| Net asset value of shares issued upon reinvestment | ||||||||
| of dividends and distributions: | ||||||||
| Class A | 12,514,345 | 13,138,217 | ||||||
| Class B | 172,056 | 251,193 | ||||||
| Class C | 484,088 | 410,918 | ||||||
| Institutional Class | 32 | — | ||||||
| 138,647,715 | 56,223,554 | |||||||
66
| Year Ended | ||||||||
| 8/31/09 | 8/31/08 | |||||||
| Capital Share Transactions (continued): | ||||||||
| Cost of shares repurchased: | ||||||||
| Class A | $ | (104,004,049 | ) | $ | (260,772,109 | ) | ||
| Class B | (3,624,046 | ) | (5,722,909 | ) | ||||
| Class C | (3,541,888 | ) | (4,798,596 | ) | ||||
| (111,169,983 | ) | (271,293,614 | ) | |||||
| Increase (decrease) in net assets derived from | ||||||||
| capital share transactions | 27,477,732 | (215,070,060 | ) | |||||
| Net Increase (Decrease) in Net Assets | 25,856,333 | (230,466,360 | ) | |||||
| Net Assets: | ||||||||
| Beginning of year | 539,274,944 | 769,741,304 | ||||||
| End of year | $ | 565,131,277 | $ | 539,274,944 | ||||
| Undistributed net investment income | $ | 66,893 | $ | 1,790 | ||||
See accompanying notes
67
Statements of changes in net assets
Delaware Tax-Free USA Intermediate Fund
| Year Ended | ||||||||
| 8/31/09 | 8/31/08 | |||||||
| Increase (Decrease) in Net Assets from Operations: | ||||||||
| Net investment income | $ | 15,162,112 | $ | 12,913,451 | ||||
| Net realized loss on investments | (2,348,573 | ) | (3,995,267 | ) | ||||
| Net change in unrealized | ||||||||
| appreciation/depreciation of investments | 11,254,947 | 4,897,895 | ||||||
| Net increase in net assets resulting from operations | 24,068,486 | 13,816,079 | ||||||
| Dividends and Distributions to Shareholders from: | ||||||||
| Net investment income: | ||||||||
| Class A | (14,270,823 | ) | (12,238,496 | ) | ||||
| Class B | (25,400 | ) | (39,714 | ) | ||||
| Class C | (817,862 | ) | (667,017 | ) | ||||
| Institutional Class | (26 | ) | — | |||||
| (15,114,111 | ) | (12,945,227 | ) | |||||
| Capital Share Transactions: | ||||||||
| Proceeds from shares sold: | ||||||||
| Class A | 235,187,166 | 206,786,111 | ||||||
| Class B | 184,940 | 131,370 | ||||||
| Class C | 19,373,068 | 7,290,130 | ||||||
| Institutional Class | 1,022 | — | ||||||
| Net asset value of shares issued upon reinvestment | ||||||||
| of dividends and distributions: | ||||||||
| Class A | 9,817,928 | 9,108,623 | ||||||
| Class B | 18,329 | 31,547 | ||||||
| Class C | 581,579 | 429,923 | ||||||
| Institutional Class | 24 | — | ||||||
| 265,164,056 | 223,777,704 | |||||||
68
| Year Ended | ||||||||
| 8/31/09 | 8/31/08 | |||||||
| Capital Share Transactions (continued): | ||||||||
| Cost of shares repurchased: | ||||||||
| Class A | $ | (201,015,285 | ) | $ | (115,146,849 | ) | ||
| Class B | (616,595 | ) | (680,553 | ) | ||||
| Class C | (5,491,621 | ) | (11,178,428 | ) | ||||
| (207,123,501 | ) | (127,005,830 | ) | |||||
| Increase in net assets derived from | ||||||||
| capital share transactions | 58,040,555 | 96,771,874 | ||||||
| Net Increase in Net Assets | 66,994,930 | 97,642,726 | ||||||
| Net Assets: | ||||||||
| Beginning of year | 433,880,640 | 336,237,914 | ||||||
| End of year | $ | 500,875,570 | $ | 433,880,640 | ||||
| Undistributed (distributions in excess of) | ||||||||
| net investment income | $ | 16,225 | $ | (31,776 | ) | |||
See accompanying notes
69
Statements of changes in net assets
Delaware National High-Yield Municipal Bond Fund
| Year Ended | ||||||||
| 8/31/09 | 8/31/08 | |||||||
| Increase (Decrease) in Net Assets from Operations: | ||||||||
| Net investment income | $ | 4,135,883 | $ | 3,633,791 | ||||
| Net realized gain (loss) on investments | (898,271 | ) | 245,645 | |||||
| Net change in unrealized | ||||||||
| appreciation/depreciation of investments | (3,755,920 | ) | (4,249,383 | ) | ||||
| Net decrease in net assets resulting from operations | (518,308 | ) | (369,947 | ) | ||||
| Dividends and Distributions to Shareholders from: | ||||||||
| Net investment income: | ||||||||
| Class A | (3,657,847 | ) | (3,214,246 | ) | ||||
| Class B | (110,366 | ) | (176,575 | ) | ||||
| Class C | (335,892 | ) | (242,971 | ) | ||||
| Institutional Class | (47 | ) | — | |||||
| (4,104,152 | ) | (3,633,792 | ) | |||||
| Capital Share Transactions: | ||||||||
| Proceeds from shares sold: | ||||||||
| Class A | 12,889,514 | 17,354,089 | ||||||
| Class B | 289,157 | 54,983 | ||||||
| Class C | 2,516,187 | 3,638,033 | ||||||
| Institutional Class | 1,016 | — | ||||||
| Net asset value of shares issued upon reinvestment | ||||||||
| of dividends and distributions: | ||||||||
| Class A | 2,236,012 | 1,920,956 | ||||||
| Class B | 50,724 | 62,814 | ||||||
| Class C | 220,675 | 164,618 | ||||||
| Institutional Class | 45 | — | ||||||
| 18,203,330 | 23,195,493 | |||||||
70
| Year Ended | ||||||||
| 8/31/09 | 8/31/08 | |||||||
| Capital Share Transactions (continued): | ||||||||
| Cost of shares repurchased: | ||||||||
| Class A | $ | (10,110,767 | ) | $ | (13,185,106 | ) | ||
| Class B | (1,746,311 | ) | (2,736,136 | ) | ||||
| Class C | (1,588,149 | ) | (1,338,113 | ) | ||||
| (13,445,227 | ) | (17,259,355 | ) | |||||
| Increase in net assets derived from | ||||||||
| capital share transactions | 4,758,103 | 5,936,138 | ||||||
| Net Increase in Net Assets | 135,643 | 1,932,399 | ||||||
| Net Assets: | ||||||||
| Beginning of year | 77,895,470 | 75,963,071 | ||||||
| End of year | $ | 78,031,113 | $ | 77,895,470 | ||||
| Undistributed (distributions in excess of) | ||||||||
| net investment income | $ | 13,405 | $ | (4,103 | ) | |||
See accompanying notes
71
Financial highlights
Delaware Tax-Free USA Fund Class A
Selected data for each share of the Fund outstanding throughout each period were as follows:
| Net asset value, beginning of period |
| Income (loss) from investment operations: |
| Net investment income |
| Net realized and unrealized gain (loss) on investments |
| Total from investment operations |
| Less dividends and distributions from: |
| Net investment income |
| Total dividends and distributions |
| Net asset value, end of period |
| Total return1 |
| Ratios and supplemental data: |
| Net assets, end of period (000 omitted) |
| Ratio of expenses to average net assets |
| Ratio of expenses to average net assets |
| prior to fees waived and expense paid indirectly |
| Ratio of net investment income to average net assets |
| Ratio of net investment income to average net assets |
| prior to fees waived and expense paid indirectly |
| Portfolio turnover |
1 Total investment return is based on the change in net asset value of a share during the period and assumes reinvestment of dividends and distributions at net asset value and does not reflect the impact of a sales charge. Total investment return reflects waivers by the manager and distributor, as applicable. Performance would have been lower had the waivers not been in effect. |
See accompanying notes
72
| Year Ended | |||||||||||||||
| 8/31/09 | 8/31/08 | 8/31/07 | 8/31/06 | 8/31/05 | |||||||||||
| $10.970 | $11.230 | $11.570 | $11.760 | $11.460 | |||||||||||
| 0.479 | 0.462 | 0.466 | 0.458 | 0.512 | |||||||||||
| (0.081 | ) | (0.260 | ) | (0.337 | ) | (0.186 | ) | 0.300 | |||||||
| 0.398 | 0.202 | 0.129 | 0.272 | 0.812 | |||||||||||
| (0.478 | ) | (0.462 | ) | (0.469 | ) | (0.462 | ) | (0.512 | ) | ||||||
| (0.478 | ) | (0.462 | ) | (0.469 | ) | (0.462 | ) | (0.512 | ) | ||||||
| $10.890 | $10.970 | $11.230 | $11.570 | $11.760 | |||||||||||
| 3.91% | 1.82% | 1.08% | 2.42% | 7.23% | |||||||||||
| $536,420 | $510,822 | $735,584 | $656,813 | $453,982 | |||||||||||
| 0.84% | 0.85% | 0.87% | 0.86% | 0.86% | |||||||||||
| 0.97% | 0.94% | 0.95% | 1.00% | 0.98% | |||||||||||
| 4.60% | 4.13% | 4.03% | 3.97% | 4.43% | |||||||||||
| 4.47% | 4.04% | 3.95% | 3.83% | 4.31% | |||||||||||
| 66% | 28% | 36% | 41% | 47% | |||||||||||
73
Financial highlights
Delaware Tax-Free USA Fund Class B
Selected data for each share of the Fund outstanding throughout each period were as follows:
| Net asset value, beginning of period |
| Income (loss) from investment operations: |
| Net investment income |
| Net realized and unrealized gain (loss) on investments |
| Total from investment operations |
| Less dividends and distributions from: |
| Net investment income |
| Total dividends and distributions |
| Net asset value, end of period |
| Total return1 |
| Ratios and supplemental data: |
| Net assets, end of period (000 omitted) |
| Ratio of expenses to average net assets |
| Ratio of expenses to average net assets |
| prior to fees waived and expense paid indirectly |
| Ratio of net investment income to average net assets |
| Ratio of net investment income to average net assets |
| prior to fees waived and expense paid indirectly |
| Portfolio turnover |
1 Total investment return is based on the change in net asset value of a share during the period and assumes reinvestment of dividends and distributions at net asset value and does not reflect the impact of a sales charge. Total investment return reflects a waiver by the manager. Performance would have been lower had the waiver not been in effect. |
See accompanying notes
74
| Year Ended | |||||||||||||||
| 8/31/09 | 8/31/08 | 8/31/07 | 8/31/06 | 8/31/05 | |||||||||||
| $10.960 | $11.230 | $11.570 | $11.760 | $11.460 | |||||||||||
| 0.399 | 0.378 | 0.378 | 0.370 | 0.423 | |||||||||||
| (0.080 | ) | (0.270 | ) | (0.337 | ) | (0.186 | ) | 0.300 | |||||||
| 0.319 | 0.108 | 0.041 | 0.184 | 0.723 | |||||||||||
| (0.399 | ) | (0.378 | ) | (0.381 | ) | (0.374 | ) | (0.423 | ) | ||||||
| (0.399 | ) | (0.378 | ) | (0.381 | ) | (0.374 | ) | (0.423 | ) | ||||||
| $10.880 | $10.960 | $11.230 | $11.570 | $11.760 | |||||||||||
| 3.13% | 0.96% | 0.32% | 1.63% | 6.42% | |||||||||||
| $8,168 | $11,812 | $17,286 | $22,189 | $16,507 | |||||||||||
| 1.60% | 1.61% | 1.63% | 1.63% | 1.63% | |||||||||||
| 1.73% | 1.70% | 1.71% | 1.73% | 1.71% | |||||||||||
| 3.84% | 3.37% | 3.27% | 3.20% | 3.66% | |||||||||||
| 3.71% | 3.28% | 3.19% | 3.10% | 3.58% | |||||||||||
| 66% | 28% | 36% | 41% | 47% | |||||||||||
75
Financial highlights
Delaware Tax-Free USA Fund Class C
Selected data for each share of the Fund outstanding throughout each period were as follows:
| Net asset value, beginning of period |
| Income (loss) from investment operations: |
| Net investment income |
| Net realized and unrealized gain (loss) on investments |
| Total from investment operations |
| Less dividends and distributions from: |
| Net investment income |
| Total dividends and distributions |
| Net asset value, end of period |
| Total return1 |
| Ratios and supplemental data: |
| Net assets, end of period (000 omitted) |
| Ratio of expenses to average net assets |
| Ratio of expenses to average net assets |
| prior to fees waived and expense paid indirectly |
| Ratio of net investment income to average net assets |
| Ratio of net investment income to average net assets |
| prior to fees waived and expense paid indirectly |
| Portfolio turnover |
1 Total investment return is based on the change in net asset value of a share during the period and assumes reinvestment of dividends and distributions at net asset value and does not reflect the impact of a sales charge. Total investment return reflects a waiver by the manager. Performance would have been lower had the waiver not been in effect. |
See accompanying notes
76
| Year Ended | |||||||||||||||
| 8/31/09 | 8/31/08 | 8/31/07 | 8/31/06 | 8/31/05 | |||||||||||
| $10.970 | $11.230 | $11.570 | $11.760 | $11.460 | |||||||||||
| 0.399 | 0.377 | 0.378 | 0.370 | 0.423 | |||||||||||
| (0.080 | ) | (0.260 | ) | (0.337 | ) | (0.186 | ) | 0.300 | |||||||
| 0.319 | 0.117 | 0.041 | 0.184 | 0.723 | |||||||||||
| (0.399 | ) | (0.377 | ) | (0.381 | ) | (0.374 | ) | (0.423 | ) | ||||||
| (0.399 | ) | (0.377 | ) | (0.381 | ) | (0.374 | ) | (0.423 | ) | ||||||
| $10.890 | $10.970 | $11.230 | $11.570 | $11.760 | |||||||||||
| 3.13% | 0.96% | 0.41% | 1.63% | 6.42% | |||||||||||
| $20,542 | $16,641 | $16,871 | $15,110 | $5,963 | |||||||||||
| 1.60% | 1.61% | 1.63% | 1.63% | 1.63% | |||||||||||
| 1.73% | 1.70% | 1.71% | 1.73% | 1.71% | |||||||||||
| 3.84% | 3.37% | 3.27% | 3.20% | 3.66% | |||||||||||
| 3.71% | 3.28% | 3.19% | 3.10% | 3.58% | |||||||||||
| 66% | 28% | 36% | 41% | 47% | |||||||||||
77
Financial highlights
Delaware Tax-Free USA Fund Institutional Class
Selected data for each share of the Fund outstanding throughout the period were as follows:
| 12/31/081 | ||||
| to 8/31/09 | ||||
| Net asset value, beginning of period | $10.020 | |||
| Income from investment operations: | ||||
| Net investment income | 0.322 | |||
| Net realized and unrealized gain on investments | 0.870 | |||
| Total from investment operations | 1.192 | |||
| Less dividends and distributions from: | ||||
| Net investment income | (0.322 | ) | ||
| Total dividends and distributions | (0.322 | ) | ||
| Net asset value, end of period | $10.890 | |||
| Total return2 | 12.15% | |||
| Ratios and supplemental data: | ||||
| Net assets, end of period (000 omitted) | $1 | |||
| Ratio of expenses to average net assets | 0.60% | |||
| Ratio of expenses to average net assets | ||||
| prior to fees waived and expense paid indirectly | 0.73% | |||
| Ratio of net investment income to average net assets | 4.84% | |||
| Ratio of net investment income to average net assets | ||||
| prior to fees waived and expense paid indirectly | 4.71% | |||
| Portfolio turnover | 66% | 3 | ||
1 Date of commencement of operations; ratios have been annualized and total return has not been annualized. |
2 Total investment return is based on the change in net asset value of a share during the period and assumes reinvestment of dividends and distributions at net asset value. Total investment return reflects a waiver by the manager. Performance would have been lower had the waiver not been in effect. |
3 Portfolio turnover is representative of the Fund for the year ended August 31, 2009. |
See accompanying notes
78
Financial highlights
Delaware Tax-Free USA Intermediate Fund Class A
Selected data for each share of the Fund outstanding throughout each period were as follows:
| Net asset value, beginning of period |
| Income (loss) from investment operations: |
| Net investment income |
| Net realized and unrealized gain (loss) on investments |
| Total from investment operations |
| Less dividends and distributions from: |
| Net investment income |
| Total dividends and distributions |
| Net asset value, end of period |
| Total return1 |
| Ratios and supplemental data: |
| Net assets, end of period (000 omitted) |
| Ratio of expenses to average net assets |
| Ratio of expenses to average net assets |
| prior to fees waived and expense paid indirectly |
| Ratio of net investment income to average net assets |
| Ratio of net investment income to average net assets |
| prior to fees waived and expense paid indirectly |
| Portfolio turnover |
1 Total investment return is based on the change in net asset value of a share during the period and assumes reinvestment of dividends and distributions at net asset value and does not reflect the impact of a sales charge. Total investment return reflects waivers by the manager and distributor. Performance would have been lower had the waivers not been in effect. |
See accompanying notes
80
| Year Ended | |||||||||||||||
| 8/31/09 | 8/31/08 | 8/31/07 | 8/31/06 | 8/31/05 | |||||||||||
| $11.250 | $11.210 | $11.470 | $11.610 | $11.390 | |||||||||||
| 0.388 | 0.383 | 0.414 | 0.408 | 0.410 | |||||||||||
| 0.210 | 0.041 | (0.260 | ) | (0.140 | ) | 0.220 | |||||||||
| 0.598 | 0.424 | 0.154 | 0.268 | 0.630 | |||||||||||
| (0.388 | ) | (0.384 | ) | (0.414 | ) | (0.408 | ) | (0.410 | ) | ||||||
| (0.388 | ) | (0.384 | ) | (0.414 | ) | (0.408 | ) | (0.410 | ) | ||||||
| $11.460 | $11.250 | $11.210 | $11.470 | $11.610 | |||||||||||
| 5.49% | 3.83% | 1.34% | 2.38% | 5.63% | |||||||||||
| $459,782 | $407,729 | $306,215 | $204,525 | $120,273 | |||||||||||
| 0.75% | 0.75% | 0.76% | 0.75% | 0.79% | |||||||||||
| 1.03% | 1.03% | 1.03% | 1.07% | 1.11% | |||||||||||
| 3.51% | 3.38% | 3.60% | 3.56% | 3.55% | |||||||||||
| 3.23% | 3.10% | 3.33% | 3.24% | 3.23% | |||||||||||
| 47% | 28% | 40% | 37% | 18% | |||||||||||
81
Financial highlights
Delaware Tax-Free USA Intermediate Fund Class B
Selected data for each share of the Fund outstanding throughout each period were as follows:
| Net asset value, beginning of period |
| Income (loss) from investment operations: |
| Net investment income |
| Net realized and unrealized gain (loss) on investments |
| Total from investment operations |
| Less dividends and distributions from: |
| Net investment income |
| Total dividends and distributions |
| Net asset value, end of period |
| Total return1 |
| Ratios and supplemental data: |
| Net assets, end of period (000 omitted) |
| Ratio of expenses to average net assets |
| Ratio of expenses to average net assets |
| prior to fees waived and expense paid indirectly |
| Ratio of net investment income to average net assets |
| Ratio of net investment income to average net assets |
| prior to fees waived and expense paid indirectly |
| Portfolio turnover |
1 Total investment return is based on the change in net asset value of a share during the period and assumes reinvestment of dividends and distributions at net asset value and does not reflect the impact of a sales charge. Total investment return reflects a waiver by the manager. Performance would have been lower had the waiver not been in effect. |
See accompanying notes
82
| Year Ended | |||||||||||||||
| 8/31/09 | 8/31/08 | 8/31/07 | 8/31/06 | 8/31/05 | |||||||||||
| $11.240 | $11.200 | $11.460 | $11.610 | $11.380 | |||||||||||
| 0.294 | 0.287 | 0.317 | 0.311 | 0.313 | |||||||||||
| 0.210 | 0.041 | (0.260 | ) | (0.150 | ) | 0.230 | |||||||||
| 0.504 | 0.328 | 0.057 | 0.161 | 0.543 | |||||||||||
| (0.294 | ) | (0.288 | ) | (0.317 | ) | (0.311 | ) | (0.313 | ) | ||||||
| (0.294 | ) | (0.288 | ) | (0.317 | ) | (0.311 | ) | (0.313 | ) | ||||||
| $11.450 | $11.240 | $11.200 | $11.460 | $11.610 | |||||||||||
| 4.61% | 2.95% | 0.48% | 1.43% | 4.83% | |||||||||||
| $861 | $1,272 | $1,786 | $2,413 | $3,203 | |||||||||||
| 1.60% | 1.60% | 1.61% | 1.60% | 1.64% | |||||||||||
| 1.73% | 1.73% | 1.73% | 1.77% | 1.81% | |||||||||||
| 2.66% | 2.53% | 2.75% | 2.71% | 2.70% | |||||||||||
| 2.53% | 2.40% | 2.63% | 2.54% | 2.53% | |||||||||||
| 47% | 28% | 40% | 37% | 18% | |||||||||||
83
Financial highlights
Delaware Tax-Free USA Intermediate Fund Class C
Selected data for each share of the Fund outstanding throughout each period were as follows:
| Net asset value, beginning of period |
| Income (loss) from investment operations: |
| Net investment income |
| Net realized and unrealized gain (loss) on investments |
| Total from investment operations |
| Less dividends and distributions from: |
| Net investment income |
| Total dividends and distributions |
| Net asset value, end of period |
| Total return1 |
| Ratios and supplemental data: |
| Net assets, end of period (000 omitted) |
| Ratio of expenses to average net assets |
| Ratio of expenses to average net assets |
| prior to fees waived and expense paid indirectly |
| Ratio of net investment income to average net assets |
| Ratio of net investment income to average net assets |
| prior to fees waived and expense paid indirectly |
| Portfolio turnover |
1 Total investment return is based on the change in net asset value of a share during the period and assumes reinvestment of dividends and distributions at net asset value and does not reflect the impact of a sales charge. Total investment return reflects a waiver by the manager. Performance would have been lower had the waiver not been in effect.
See accompanying notes
84
| Year Ended | ||||||||||||||||
| 8/31/09 | 8/31/08 | 8/31/07 | 8/31/06 | 8/31/05 | ||||||||||||
| $11.240 | $11.200 | $11.470 | $11.610 | $11.390 | ||||||||||||
| 0.294 | 0.287 | 0.317 | 0.311 | 0.313 | ||||||||||||
| 0.210 | 0.041 | (0.270 | ) | (0.140 | ) | 0.220 | ||||||||||
| 0.504 | 0.328 | 0.047 | 0.171 | 0.533 | ||||||||||||
| (0.294 | ) | (0.288 | ) | (0.317 | ) | (0.311 | ) | (0.313 | ) | |||||||
| (0.294 | ) | (0.288 | ) | (0.317 | ) | (0.311 | ) | (0.313 | ) | |||||||
| $11.450 | $11.240 | $11.200 | $11.470 | $11.610 | ||||||||||||
| 4.60% | 2.95% | 0.39% | 1.52% | 4.74% | ||||||||||||
| $40,232 | $24,880 | $28,237 | $28,004 | $25,125 | ||||||||||||
| 1.60% | 1.60% | 1.61% | 1.60% | 1.64% | ||||||||||||
| 1.73% | 1.73% | 1.73% | 1.77% | 1.81% | ||||||||||||
| 2.66% | 2.53% | 2.75% | 2.71% | 2.70% | ||||||||||||
| 2.53% | 2.40% | 2.63% | 2.54% | 2.53% | ||||||||||||
| 47% | 28% | 40% | 37% | 18% | ||||||||||||
85
Financial highlights
Delaware Tax-Free USA Intermediate Fund Institutional Class
Selected data for each share of the Fund outstanding throughout the period were as follows:
| 12/31/081 | ||||
| to 8/31/09 | ||||
| Net asset value, beginning of period | $10.800 | |||
| Income from investment operations: | ||||
| Net investment income | 0.269 | |||
| Net realized and unrealized gain on investments | 0.660 | |||
| Total from investment operations | 0.929 | |||
| Less dividends and distributions from: | ||||
| Net investment income | (0.269 | ) | ||
| Total dividends and distributions | (0.269 | ) | ||
| Net asset value, end of period | $11.460 | |||
| Total return1 | 8.68% | |||
| Ratios and supplemental data: | ||||
| Net assets, end of period (000 omitted) | $1 | |||
| Ratio of expenses to average net assets | 0.60% | |||
| Ratio of expenses to average net assets | ||||
| prior to fees waived and expense paid indirectly | 0.73% | |||
| Ratio of net investment income to average net assets | 3.65% | |||
| Ratio of net investment income to average net assets | ||||
| prior to fees waived and expense paid indirectly | 3.52% | |||
| Portfolio turnover | 47% | 3 | ||
1 Date of commencement of operations; ratios have been annualized and total return has not been annualized. |
2 Total investment return is based on the change in net asset value of a share during the period and assumes reinvestment of dividends and distributions at net asset value. Total investment return reflects a waiver by the manager. Performance would have been lower had the waiver not been in effect. |
3 Portfolio turnover is representative of the Fund for the year ended August 31, 2009. |
See accompanying notes
86
Financial highlights
Delaware National High-Yield Municipal Bond Fund Class A
Selected data for each share of the Fund outstanding throughout each period were as follows:
| Net asset value, beginning of period |
| Income (loss) from investment operations: |
| Net investment income |
| Net realized and unrealized gain (loss) on investments |
| Total from investment operations |
| Less dividends and distributions from: |
| Net investment income |
| Total dividends and distributions |
| Net asset value, end of period |
| Total return1 |
| Ratios and supplemental data: |
| Net assets, end of period (000 omitted) |
| Ratio of expenses to average net assets |
| Ratio of expenses to average net assets |
| prior to fees waived and expense paid indirectly |
| Ratio of net investment income to average net assets |
| Ratio of net investment income to average net assets |
| prior to fees waived and expense paid indirectly |
| Portfolio turnover |
1 Total investment return is based on the change in net asset value of a share during the period and assumes reinvestment of dividends and distributions at net asset value and does not reflect the impact of a sales charge. Total investment return reflects a waiver by the manager. Performance would have been lower had the waiver not been in effect.
See accompanying notes
88
| Year Ended | ||||||||||||||||
| 8/31/09 | 8/31/08 | 8/31/07 | 8/31/06 | 8/31/05 | ||||||||||||
| $9.510 | $10.030 | $10.320 | $10.380 | $10.010 | ||||||||||||
| 0.505 | 0.484 | 0.482 | 0.477 | 0.503 | ||||||||||||
| (0.595 | ) | (0.520 | ) | (0.290 | ) | (0.060 | ) | 0.371 | ||||||||
| (0.090 | ) | (0.036 | ) | 0.192 | 0.417 | 0.874 | ||||||||||
| (0.500 | ) | (0.484 | ) | (0.482 | ) | (0.477 | ) | (0.504 | ) | |||||||
| (0.500 | ) | (0.484 | ) | (0.482 | ) | (0.477 | ) | (0.504 | ) | |||||||
| $8.920 | $9.510 | $10.030 | $10.320 | $10.380 | ||||||||||||
| (0.38% | ) | (0.37% | ) | 1.82% | 4.15% | 8.93% | ||||||||||
| $68,812 | $67,762 | $65,143 | $68,663 | $66,451 | ||||||||||||
| 0.90% | 0.90% | 0.91% | 0.90% | 0.93% | ||||||||||||
| 1.08% | 1.04% | 1.03% | 1.02% | 1.01% | ||||||||||||
| 6.06% | 4.94% | 4.66% | 4.66% | 4.92% | ||||||||||||
| 5.88% | 4.80% | 4.54% | 4.54% | 4.84% | ||||||||||||
| 67% | 24% | 37% | 73% | 36% | ||||||||||||
89
Financial highlights
Delaware National High-Yield Municipal Bond Fund Class B
Selected data for each share of the Fund outstanding throughout each period were as follows:
| Net asset value, beginning of period |
| Income (loss) from investment operations: |
| Net investment income |
| Net realized and unrealized gain (loss) on investments |
| Total from investment operations |
| Less dividends and distributions from: |
| Net investment income |
| Total dividends and distributions |
| Net asset value, end of period |
| Total return1 |
| Ratios and supplemental data: |
| Net assets, end of period (000 omitted) |
| Ratio of expenses to average net assets |
| Ratio of expenses to average net assets |
| prior to fees waived and expense paid indirectly |
| Ratio of net investment income to average net assets |
| Ratio of net investment income to average net assets |
| prior to fees waived and expense paid indirectly |
| Portfolio turnover |
1 Total investment return is based on the change in net asset value of a share during the period and assumes reinvestment of dividends and distributions at net asset value and does not reflect the impact of a sales charge. Total investment return reflects a waiver by the manager. Performance would have been lower had the waiver not been in effect.
See accompanying notes
90
| Year Ended | ||||||||||||||||
| 8/31/09 | 8/31/08 | 8/31/07 | 8/31/06 | 8/31/05 | ||||||||||||
| $9.530 | $10.050 | $10.350 | $10.400 | $10.030 | ||||||||||||
| 0.440 | 0.410 | 0.404 | 0.400 | 0.426 | ||||||||||||
| (0.592 | ) | (0.520 | ) | (0.300 | ) | (0.050 | ) | 0.371 | ||||||||
| (0.152 | ) | (0.110 | ) | 0.104 | 0.350 | 0.797 | ||||||||||
| (0.438 | ) | (0.410 | ) | (0.404 | ) | (0.400 | ) | (0.427 | ) | |||||||
| (0.438 | ) | (0.410 | ) | (0.404 | ) | (0.400 | ) | (0.427 | ) | |||||||
| $8.940 | $9.530 | $10.050 | $10.350 | $10.400 | ||||||||||||
| (1.11% | ) | (1.12% | ) | 0.96% | 3.47% | 8.10% | ||||||||||
| $1,448 | $3,135 | $5,972 | $9,519 | $13,046 | ||||||||||||
| 1.65% | 1.65% | 1.66% | 1.65% | 1.68% | ||||||||||||
| 1.83% | 1.79% | 1.78% | 1.77% | 1.76% | ||||||||||||
| 5.31% | 4.19% | 3.91% | 3.91% | 4.17% | ||||||||||||
| 5.13% | 4.05% | 3.79% | 3.79% | 4.09% | ||||||||||||
| 67% | 24% | 37% | 73% | 36% | ||||||||||||
91
Financial highlights
Delaware National High-Yield Municipal Bond Fund Class C
Selected data for each share of the Fund outstanding throughout each period were as follows:
| Net asset value, beginning of period |
| Income (loss) from investment operations: |
| Net investment income |
| Net realized and unrealized gain (loss) on investments |
| Total from investment operations |
| Less dividends and distributions from: |
| Net investment income |
| Total dividends and distributions |
| Net asset value, end of period |
| Total return1 |
| Ratios and supplemental data: |
| Net assets, end of period (000 omitted) |
| Ratio of expenses to average net assets |
| Ratio of expenses to average net assets |
| prior to fees waived and expense paid indirectly |
| Ratio of net investment income to average net assets |
| Ratio of net investment income to average net assets |
| prior to fees waived and expense paid indirectly |
| Portfolio turnover |
1 Total investment return is based on the change in net asset value of a share during the period and assumes reinvestment of dividends and distributions at net asset value and does not reflect the impact of a sales charge. Total investment return reflects a waiver by the manager. Performance would have been lower had the waiver not been in effect.
See accompanying notes
92
| Year Ended | ||||||||||||||||
| 8/31/09 | 8/31/08 | 8/31/07 | 8/31/06 | 8/31/05 | ||||||||||||
| $9.550 | $10.070 | $10.360 | $10.420 | $10.040 | ||||||||||||
| 0.441 | 0.410 | 0.404 | 0.400 | 0.426 | ||||||||||||
| (0.592 | ) | (0.520 | ) | (0.290 | ) | (0.060 | ) | 0.381 | ||||||||
| (0.151 | ) | (0.110 | ) | 0.114 | 0.340 | 0.807 | ||||||||||
| (0.439 | ) | (0.410 | ) | (0.404 | ) | (0.400 | ) | (0.427 | ) | |||||||
| (0.439 | ) | (0.410 | ) | (0.404 | ) | (0.400 | ) | (0.427 | ) | |||||||
| $8.960 | $9.550 | $10.070 | $10.360 | $10.420 | ||||||||||||
| (1.11% | ) | (1.12% | ) | 1.06% | 3.36% | 8.19% | ||||||||||
| $7,770 | $6,998 | $4,848 | $5,332 | $5,234 | ||||||||||||
| 1.65% | 1.65% | 1.66% | 1.65% | 1.68% | ||||||||||||
| 1.83% | 1.79% | 1.78% | 1.77% | 1.76% | ||||||||||||
| 5.31% | 4.19% | 3.91% | 3.91% | 4.17% | ||||||||||||
| 5.13% | 4.05% | 3.79% | 3.79% | 4.09% | ||||||||||||
| 67% | 24% | 37% | 73% | 36% | ||||||||||||
93
Financial highlights
Delaware National High-Yield Municipal Bond Fund Institutional Class
Selected data for each share of the Fund outstanding throughout the period were as follows:
| 12/31/081 | ||||
| to 8/31/09 | ||||
| Net asset value, beginning of period | $7.590 | |||
| Income from investment operations: | ||||
| Net investment income | 0.342 | |||
| Net realized and unrealized gain on investments | 1.338 | |||
| Total from investment operations | 1.680 | |||
| Less dividends and distributions from: | ||||
| Net investment income | (0.340 | ) | ||
| Total dividends and distributions | (0.340 | ) | ||
| Net asset value, end of period | $8.930 | |||
| Total return1 | 22.55% | |||
| Ratios and supplemental data: | ||||
| Net assets, end of period (000 omitted) | $1 | |||
| Ratio of expenses to average net assets | 0.65% | |||
| Ratio of expenses to average net assets | ||||
| prior to fees waived and expense paid indirectly | 0.85% | |||
| Ratio of net investment income to average net assets | 6.41% | |||
| Ratio of net investment income to average net assets | ||||
| prior to fees waived and expense paid indirectly | 6.21% | |||
| Portfolio turnover | 67% | 3 | ||
1 Date of commencement of operations; ratios have been annualized and total return has not been annualized. |
2 Total investment return is based on the change in net asset value of a share during the period and assumes reinvestment of dividends and distributions at net asset value. Total investment return reflects a waiver by the manager. Performance would have been lower had the waiver not been in effect. |
3 Portfolio turnover is representative of the Fund for the year ended August 31, 2009. |
See accompanying notes
94
| Notes to financial statements | |
| Delaware National Tax-Free Funds | August 31, 2009 |
Delaware Group® Tax-Free Fund is organized as a Delaware statutory trust and offers two series: Delaware Tax-Free USA Fund and Delaware Tax-Free USA Intermediate Fund. Voyageur Mutual Funds is organized as a Delaware statutory trust and offers five series: Delaware Tax-Free California Fund, Delaware Tax-Free Idaho Fund, Delaware Minnesota High-Yield Municipal Bond Fund, Delaware National High-Yield Municipal Bond Fund and Delaware Tax-Free New York Fund. Delaware Group Tax-Free Fund and Voyageur Mutual Funds are individually referred to as a “Trust” and collectively as the “Trusts.” These financial statements and the related notes pertain to Delaware Tax-Free USA Fund, Delaware Tax-Free USA Intermediate Fund and Delaware National High-Yield Municipal Bond Fund (each referred to as a “Fund” or, collectively, as the “Funds”). The above Trusts are open-end investment companies. The Funds are considered diversified under the Investment Company Act of 1940, as amended. The Funds offer Class A, Class B, Class C and Institutional Class shares. Class A shares are sold with a maximum front-end sales charge of up to 4.50% for Delaware Tax-Free USA Fund and Delaware National High-Yield Municipal Bond Fund, and up to 2.75% for Delaware Tax-Free USA Intermediate Fund. Class A share purchases of $1,000,000 or more will incur a contingent deferred sales charge (CDSC) of 1% if redeemed during the first year and 0.50% during the second year for Delaware Tax-Free USA Fund and Delaware National High-Yield Municipal Bond Fund; and of 0.75% for Delaware Tax-Free USA Intermediate Fund if redeemed within the first year, provided that Delaware Distributors, L.P. (DDLP) paid a financial advisor a commission on the purchase of those shares. Class B shares may be purchased only through dividend reinvestment and certain permitted exchanges. Prior to June 1, 2007, Class B shares of the Delaware Tax-Free USA Fund and Delaware National High-Yield Municipal Bond Fund were sold with a CDSC that declined from 4% to zero depending upon the period of time the shares were held. Class B shares of the Delaware Tax-Free USA Fund and Delaware National High-Yield Municipal Bond Fund will automatically convert to Class A shares on a quarterly basis approximately eight years after purchase. Class B shares of Delaware Tax-Free USA Intermediate Fund were sold with a CDSC that declined from 2% to zero depending upon the period of time the shares were held. Class B shares of the Tax-Free USA Intermediate Fund will automatically convert to Class A shares on a quarterly basis approximately five years after purchase. Class C shares are sold with a CDSC of 1%, if redeemed during the first twelve months. Institutional Class shares are not subject to a sales charge and are offered for sale exclusively to certain eligible investors.
The investment objective of the Delaware Tax-Free USA Fund and Delaware Tax-Free USA Intermediate Fund is to seek as high a level of current interest income exempt from federal income tax as is available from municipal obligations and as is consistent with prudent investment management and preservation of capital.
The investment objective of Delaware National Municipal Bond Fund is to seek a high level of current income exempt from federal income tax primarily through investment in medium- and lower-grade municipal obligations.
1. Significant Accounting Policies
The following accounting policies are in accordance with U.S. generally accepted accounting principles and are consistently followed by the Funds.
Security Valuation — Debt securities are valued by an independent pricing service or broker. To the extent current market prices are not available, the pricing service may take into account
95
Notes to financial statements
Delaware National Tax-Free Funds
1. Significant Accounting Policies (continued)
developments related to the specific security, as well as transactions in comparable securities. Generally, other securities and assets for which market quotations are not readily available are valued at fair value as determined in good faith under the direction of each Fund’s Boards of Trustees (each a Board and collectively the Boards). In determining whether market quotations are readily available or fair valuation will be used, various factors will be taken into consideration, such as market closures or suspension of trading in a security.
Federal Income Taxes — No provision for federal income taxes has been made as each Fund intends to continue to qualify for federal income tax purposes as a regulated investment company under Subchapter M of the Internal Revenue Code of 1986, as amended, and make the requisite distributions to shareholders. The Funds evaluate tax positions taken or expected to be taken in the course of preparing the Funds’ tax returns to determine whether the tax positions are “more-likely-than-not” of being sustained by the applicable tax authority. Tax positions not deemed to meet the more-likely-than-not threshold are recorded as a tax benefit or expense in the current year. Management has analyzed each Fund’s tax position taken on federal income tax returns for all open tax years (tax years ended August 31, 2006 – August 31, 2009), and has concluded that no provision for federal income tax is required for each Fund’s financial statements.
Class Accounting — Investment income and common expenses are allocated to the various classes of each Fund on the basis of “settled shares” of each class in relation to the net assets of each Fund. Realized and unrealized gain (loss) on investments are allocated to the various classes of each Fund on the basis of daily net assets of each class. Distribution expenses relating to a specific class are charged directly to that class.
Use of Estimates — The preparation of financial statements in conformity with U.S. generally accepted accounting principles requires management to make estimates and assumptions that affect the reported amounts of assets and liabilities at the date of the financial statements and the reported amounts of revenues and expenses during the reporting period. Actual results could differ from those estimates.
Other — Expenses directly attributable to a Fund are charged directly to that Fund. Other expenses common to various funds within the Delaware Investments® Family of Funds are generally allocated amongst such funds on the basis of average net assets. Management fees and some other expenses are paid monthly. Security transactions are recorded on the date the securities are purchased or sold (trade date) for financial reporting purposes. Costs used in calculating realized gains and losses on the sale of investment securities are those of the specific securities sold. Interest income is recorded on the accrual basis. Discounts and premiums are amortized to interest income over the lives of the respective securities. Each Fund declares dividends daily from net investment income and pays such dividends monthly and declares and pays distributions from net realized gain on investments, if any, annually.
96
The Funds receive earnings credits from their custodian when positive cash balances are maintained, which are used to offset custody fees. The expense paid under this arrangement is included in custodian fees on the statements of operations with the corresponding expense offset shown as “expense paid indirectly.”
2. Investment Management, Administration Agreements and Other Transactions with Affiliates
In accordance with the terms of its respective investment management agreement, each Fund pays Delaware Management Company (DMC), a series of Delaware Management Business Trust and the investment manager, an annual fee based on each Fund’s average daily net assets as follows:
| Delaware Tax-Free | Delaware Tax-Free | Delaware National High-Yield | ||||
| USA Fund | USA Intermediate Fund | Municipal Bond Fund | ||||
| On the first $500 million | 0.550% | 0.500% | 0.550% | |||
| On the next $500 million | 0.500% | 0.475% | 0.500% | |||
| On the next $1.5 billion | 0.450% | 0.450% | 0.450% | |||
| In excess of $2.5 billion | 0.425% | 0.425% | 0.425% |
DMC has contractually agreed to waive that portion, if any, of its management fee and reimburse each Fund to the extent necessary to ensure that total annual operating expenses, (excluding 12b-1 plan expenses, taxes, interest, inverse floater program expenses, brokerage fees, certain insurance costs and non-routine expenses or costs including, but not limited to, those relating to reorganizations, litigation, conducting shareholder meetings, and liquidations (collectively, “non-routine expenses”)) do not exceed 0.60%, 0.60%, and 0.65% of average daily net assets of Delaware Tax-Free USA Fund, Delaware Tax-Free USA Intermediate Fund, and Delaware National High-Yield Municipal Bond Fund, respectively, through December 31, 2009. For purposes of these waivers and reimbursements, non-routine expenses may also include such additional costs and expenses, as may be agreed upon time to time by the Funds’ Boards and DMC. These expense waivers and reimbursements apply only to expenses paid directly by the Funds.
Delaware Service Company, Inc. (DSC), an affiliate of DMC, provides fund accounting and financial administration oversight services to the Funds. For these services, each Fund pays DSC fees based on the aggregate daily net assets of the Delaware Investments® Family of Funds at the following annual rate: 0.0050% of the first $30 billion; 0.0045% of the next $10 billion; 0.0040% of the next $10 billion; and 0.0025% of aggregate average daily net assets in excess of $50 billion. The fees payable to DSC under the service agreement described above are allocated among all Funds in the Delaware Investments Family of Funds on a relative net asset value basis. For the year ended August 31, 2009, each Fund was charged for these services as follows:
| Delaware Tax-Free | Delaware Tax-Free | Delaware National High-Yield | ||||
| USA Fund | USA Intermediate Fund | Municipal Bond Fund | ||||
| $26,874 | $21,948 | $3,465 |
97
Notes to financial statements
Delaware National Tax-Free Funds
2. Investment Management, Administration Agreements and Other Transactions with Affiliates (continued)
DSC also provides dividend disbursing and transfer agency services. Each Fund pays DSC a monthly fee based on the number of shareholder accounts for dividend disbursing and transfer agent services.
Pursuant to a distribution agreement and distribution plan, each Fund pays DDLP, the distributor and an affiliate of DMC, an annual distribution and service fee not to exceed 0.30% of the average daily net assets of the Class A shares for Delaware Tax-Fee USA Intermediate Fund, 0.25% of the average daily net assets of the Class A shares for the Delaware National High-Yield Municipal Bond Fund and 1.00% of the average daily net assets of the Class B and C shares for all the Funds. The Board for Delaware Tax-Free USA Fund has adopted a formula for calculating 12b-1 plan fees for the Fund’s Class A shares that went into effect on June 1, 1992. The total 12b-1 fees to be paid by Class A shareholders of the Fund will be the sum of 0.10% of the average daily net assets representing shares that were acquired prior to June 1, 1992 and 0.30% of the average daily net assets representing shares that were acquired on or after June 1, 1992. Effective April 21, 2006, the maximum amount of the Class A 12b-1 fees was reduced to 0.25% and the total 12b-1 fees to be paid to Class A shareholders of the Fund will be the sum of 0.10% of the average daily net assets representing shares that were acquired prior to June 1, 1992 and 0.25% of the average daily net assets representing shares that were acquired on or after June 1, 1992. All Class A shareholders will bear 12b-1 fees at the same rate, the blended rate based upon the allocation of the rates described above. Institutional Class shares pay no distribution and service expenses. DDLP has contracted to waive distribution and service fees through December 31, 2009 in order to prevent distribution and service fees of Class A shares from exceeding 0.15% of average daily net assets for the Delaware Tax-Free USA Intermediate Fund.
At August 31, 2009, each Fund had liabilities payable to affiliates as follows:
| Delaware Tax-Free | Delaware Tax-Free | Delaware National High-Yield | ||||||||||
| USA Fund | USA Intermediate Fund | Municipal Bond Fund | ||||||||||
| Investment management fees | ||||||||||||
| payable to DMC | $198,282 | $158,904 | $30,353 | |||||||||
| Dividend disbursing, transfer | ||||||||||||
| agent and fund accounting | ||||||||||||
| oversight fees and other | ||||||||||||
| expenses payable to DSC | 25,854 | 32,380 | 3,960 | |||||||||
| Distribution fees payable | ||||||||||||
| to DDLP | 132,751 | 91,520 | 21,857 | |||||||||
| Other expenses payable to | ||||||||||||
| DMC and affiliates* | 9,361 | 8,303 | 1,299 | |||||||||
*DMC, as part of its administrative services, pays operating expenses on behalf of each Fund and is reimbursed on a periodic basis. Such expenses include items such as printing of shareholder reports, fees for audit, legal and tax services, registration fees and trustees’ fees.
98
As provided in the investment management agreement, each Fund bears the cost of certain legal and tax services, including internal legal and tax services provided to each Fund by DMC and/or its affiliates’ employees. For the year ended August 31, 2009, each Fund was charged for internal legal and tax services provided by DMC and/or its affiliates’ employees as follows:
| Delaware Tax-Free | Delaware Tax-Free | Delaware National High-Yield | ||||
| USA Fund | USA Intermediate Fund | Municipal Bond Fund | ||||
| $45,324 | $38,206 | $5,945 |
For the year ended August 31, 2009, DDLP earned commissions on sales of Class A shares for each Fund as follows:
| Delaware Tax-Free | Delaware Tax-Free | Delaware National High-Yield | ||||
| USA Fund | USA Intermediate Fund | Municipal Bond Fund | ||||
| $38,160 | $29,214 | $12,822 |
For the year ended August 31, 2009, DDLP received gross CDSC commissions on redemption of each Fund’s Class A, Class B and Class C shares, respectively. These commissions were entirely used to offset up-front commissions previously paid by DDLP to broker-dealer on sales of those shares. The amounts received were as follows:
| Delaware Tax-Free | Delaware Tax-Free | Delaware National High-Yield | ||||||||||
| USA Fund | USA Intermediate Fund | Municipal Bond Fund | ||||||||||
| Class A | $ | — | $ | — | $ | — | ||||||
| Class B | 5,596 | — | 3,789 | |||||||||
| Class C | 1,358 | 5,117 | 2,065 | |||||||||
Trustees’ fees include expenses accrued by the Funds for each Trustee’s retainer and meeting fees. Certain officers of DMC, DSC and DDLP are officers and/or Trustees of the Trusts. These officers and Trustees are paid no compensation by the Funds.
3. Investments
For the year ended August 31, 2009, the Funds made purchases and sales of investment securities other than short-term investments as follows:
| Delaware Tax-Free | Delaware Tax-Free | Delaware National High-Yield | ||||||
| USA Fund | USA Intermediate Fund | Municipal Bond Fund | ||||||
| Purchases | $375,585,268 | $263,860,488 | $51,773,218 | |||||
| Sales | 350,779,928 | 202,577,691 | 45,700,444 | |||||
99
Notes to financial statements
Delaware National Tax-Free Funds
3. Investments (continued)
At August 31, 2009, the cost of investments and unrealized appreciation (depreciation) for federal income tax purposes for each Fund were as follows:
| Delaware Tax-Free | Delaware Tax-Free | Delaware National High-Yield | |||||||||||||
| USA Fund | USA Intermediate Fund | Municipal Bond Fund | |||||||||||||
| Cost of investments | $ | 545,193,345 | $ | 486,561,761 | $ | 84,744,459 | |||||||||
| Aggregate unrealized | |||||||||||||||
| appreciation | 34,414,817 | 21,655,219 | 2,763,959 | ||||||||||||
| Aggregate unrealized | |||||||||||||||
| depreciation | (24,896,807 | ) | (7,038,149 | ) | (9,186,007 | ) | |||||||||
| Net unrealized appreciation | |||||||||||||||
| (depreciation) | $ | 9,518,010 | $ | 14,617,070 | $ | (6,422,048 | ) | ||||||||
Effective September 1, 2008, the Funds adopted Financial Accounting Standards No. 157, Fair Value Measurements (FAS 157). FAS 157 defines fair value as the price that the Funds would receive to sell an asset or pay to transfer a liability in an orderly transaction between market participants at the measurement date under current market conditions. FAS 157 also establishes a framework for measuring fair value and a three level hierarchy for fair value measurements based upon the transparency of inputs to the valuation of an asset or liability. Inputs may be observable or unobservable and refer broadly to the assumptions that market participants would use in pricing the asset or liability. Observable inputs reflect the assumptions market participants would use in pricing the asset or liability based on market data obtained from sources independent of the reporting entity. Unobservable inputs reflect the reporting entity’s own assumptions about the assumptions that market participants would use in pricing the asset or liability developed based on the best information available under the circumstances. Each Fund’s investment in its entirety is assigned a level based upon the observability of the inputs which are significant to the overall valuation. The three-tier hierarchy of inputs is summarized below.
Level 1 – inputs are quoted prices in active markets
Level 2 – inputs are observable, directly or indirectly
Level 3 – inputs are unobservable and reflect assumptions on the part of the reporting entity
The following table summarizes the valuation of each Fund’s investments by the FAS 157 fair value hierarchy levels as of August 31, 2009:
| Delaware Tax-Free | Delaware Tax-Free | Delaware National High-Yield | |||||||||||||
| USA Fund | USA Intermediate Fund | Municipal Bond Fund | |||||||||||||
| Level 1 | $ | — | $ | — | $ | — | |||||||||
| Level 2 | 554,711,355 | 501,178,831 | 78,322,411 | ||||||||||||
| Level 3 | — | — | — | ||||||||||||
| Total | $ | 554,711,355 | $ | 501,178,831 | $ | 78,322,411 | |||||||||
There were no Level 3 securities at the beginning or end of the year.
100
4. Dividend and Distribution Information
Income and long-term capital gain distributions are determined in accordance with federal income tax regulations, which may differ from U.S. generally accepted accounting principles. Additionally, distributions from net short-term gains on sales of investment securities are treated as ordinary income for federal income tax purposes. The tax character of dividends and distributions paid during the years ended August 31, 2009 and 2008 was as follows:
| Delaware Tax-Free | Delaware Tax-Free | Delaware National High-Yield | |||||||||||||
| USA Fund | USA Intermediate Fund | Municipal Bond Fund | |||||||||||||
| Year ended 8/31/09 | |||||||||||||||
| Tax-exempt income | $ | 24,389,642 | $ | 15,114,111 | $ | 4,103,777 | |||||||||
| Ordinary income | 50,485 | — | 375 | ||||||||||||
| Total | $ | 24,440,127 | $ | 15,114,111 | $ | 4,104,152 | |||||||||
| Year ended 8/31/08 | |||||||||||||||
| Tax-exempt income | $ | 27,608,512 | $ | 12,780,404 | $ | 3,633,792 | |||||||||
| Ordinary income | 9,380 | 164,823 | — | ||||||||||||
| Total | $ | 27,617,892 | $ | 12,945,227 | $ | 3,633,792 | |||||||||
5. Components of Net Assets on a Tax Basis
As of August 31, 2009, the components of net assets on a tax basis were as follows:
| Delaware Tax-Free | Delaware Tax-Free | Delaware National High-Yield | |||||||||||||
| USA Fund | USA Intermediate Fund | Municipal Bond Fund | |||||||||||||
| Shares of beneficial interest | $ | 568,373,809 | $ | 495,042,867 | $ | 87,784,016 | |||||||||
| Distributions payable | (647,279 | ) | (429,934 | ) | (101,222 | ) | |||||||||
| Undistributed tax-exempt | |||||||||||||||
| income | 714,172 | 446,159 | 114,627 | ||||||||||||
| Post-October losses | (1,510,859 | ) | (525,442 | ) | (564,690 | ) | |||||||||
| Capital loss carryforward | (11,316,576 | ) | (8,275,150 | ) | (2,779,570 | ) | |||||||||
| Unrealized appreciation | |||||||||||||||
| (depreciation) of | |||||||||||||||
| investments | 9,518,010 | 14,617,070 | (6,422,048 | ) | |||||||||||
| Net assets | $ | 565,131,277 | $ | 500,875,570 | $ | 78,031,113 | |||||||||
The differences between book basis and tax basis components of net assets are primarily attributable to tax deferral of losses on wash sales and tax treatment of market discount and premium on debt instruments.
Post-October losses represent losses realized on investment transactions from November 1, 2008 through August 31, 2009 that, in accordance with federal income tax regulations, the Funds have elected to defer and treat as having arisen in the following fiscal year.
101
Notes to financial statements
Delaware National Tax-Free Funds
5. Components of Net Assets on a Tax Basis (continued)
For financial reporting purposes, capital accounts are adjusted to reflect the tax character of permanent book/tax differences. Reclassifications are primarily due to tax treatment of expiration of capital loss carryforwards. Results of operations and net assets were not affected by these reclassifications. For the year ended August 31, 2009, the Funds recorded the following reclassifications:
| Delaware Tax-Free | Delaware National High-Yield | |||||||||
| USA Fund | Municipal Bond Fund | |||||||||
| Paid-in capital | $ | 44,057 | $ | (3,025,716 | ) | |||||
| Accumulated net realized loss | (44,057 | ) | 3,039,939 | |||||||
| Undistributed net investment income | — | (14,223 | ) | |||||||
For federal income tax purposes, capital loss carryforwards may be carried forward and applied against future capital gains. Capital loss carryforwards remaining at August 31, 2009 will expire as follows:
| Delaware Tax- | Delaware Tax-Free | Delaware National High-Yield | ||||||||||||||
| Year of Expiration | Free USA Fund | USA Intermediate Fund | Municipal Bond Fund | |||||||||||||
| 2010 | $ | — | $ | — | $ | 70,671 | ||||||||||
| 2011 | — | 249,429 | 997,721 | |||||||||||||
| 2012 | — | 5,791 | 980,742 | |||||||||||||
| 2014 | — | 119,427 | — | |||||||||||||
| 2015 | — | — | 355,701 | |||||||||||||
| 2016 | 797,494 | 2,127,384 | — | |||||||||||||
| 2017 | 10,519,082 | 5,773,119 | 374,735 | |||||||||||||
| Total | $ | 11,316,576 | $ | 8,275,150 | $ | 2,779,570 | ||||||||||
For the year ended August 31, 2009, capital loss carryforwards expired were $72,146 and $3,025,716 for Delaware Tax-Free USA Fund and Delaware National High-Yield Municipal Bond Fund, respectively.
102
6. Capital Shares
Transactions in capital shares were as follows:
| Delaware Tax-Free | Delaware Tax-Free | Delaware National High-Yield | ||||||||||||||||
| USA Fund | USA Intermediate Fund | Municipal Bond Fund | ||||||||||||||||
| Year Ended | Year Ended | Year Ended | ||||||||||||||||
| 8/31/09 | 8/31/08 | 8/31/09 | 8/31/08 | 8/31/09 | 8/31/08 | |||||||||||||
| Shares sold: | ||||||||||||||||||
| Class A | 11,607,343 | 3,388,412 | 21,288,665 | 18,324,376 | 1,543,457 | 1,773,356 | ||||||||||||
| Class B | 7,042 | 26,584 | 16,760 | 11,589 | 36,455 | 5,607 | ||||||||||||
| Class C | 662,828 | 406,318 | 1,748,249 | 646,630 | 298,334 | 372,132 | ||||||||||||
| Institutional Class | 102 | — | 95 | — | 134 | — | ||||||||||||
| Shares issued upon reinvestment of dividends and distributions: | ||||||||||||||||||
| Class A | 1,198,786 | 1,177,951 | 885,386 | 807,682 | 269,659 | 196,831 | ||||||||||||
| Class B | 16,525 | 22,514 | 1,659 | 2,797 | 6,137 | 6,395 | ||||||||||||
| Class C | 46,310 | 36,841 | 52,363 | 38,135 | 26,475 | 16,806 | ||||||||||||
| Institutional Class | 3 | — | 2 | — | 5 | — | ||||||||||||
| 13,538,939 | 5,058,620 | 23,993,179 | 19,831,209 | 2,180,656 | 2,371,127 | |||||||||||||
| Shares repurchased: | ||||||||||||||||||
| Class A | (10,115,087 | ) | (23,486,561 | ) | (18,287,462 | ) | (10,209,726 | ) | (1,230,554 | ) | (1,336,737 | ) | ||||||
| Class B | (350,505 | ) | (511,114 | ) | (56,382 | ) | (60,640 | ) | (209,703 | ) | (277,041 | ) | ||||||
| Class C | (339,849 | ) | (428,319 | ) | (500,042 | ) | (992,295 | ) | (190,984 | ) | (137,313 | ) | ||||||
| (10,805,441 | ) | (24,425,994 | ) | (18,843,886 | ) | (11,262,661 | ) | (1,631,241 | ) | (1,751,091 | ) | |||||||
| Net increase (decrease) | 2,733,498 | (19,367,374 | ) | 5,149,293 | 8,568,548 | 549,415 | 620,036 | |||||||||||
For the years ended August 31, 2009 and 2008, the following shares and values were converted from Class B to Class A shares. The respective amounts are included in Class B redemptions and Class A subscriptions in the tables above and the statements of changes in net assets.
| Year Ended | Year Ended | |||||||||||
| 8/31/09 | 8/31/08 | |||||||||||
| Class B | Class A | Class B | Class A | |||||||||
| Shares | Shares | Value | Shares | Shares | Value | |||||||
| Delaware Tax-Free | ||||||||||||
| USA Fund | 161,252 | 161,199 | $1,668,006 | 227,491 | 227,437 | $2,547,827 | ||||||
| Delaware Tax-Free | ||||||||||||
| USA Intermediate Fund | 23,056 | 23,046 | 253,527 | 30,904 | 30,876 | 346,313 | ||||||
| Delaware National High-Yield | ||||||||||||
| Municipal Bond Fund | 26,693 | 26,746 | 211,723 | 101,537 | 101,780 | 1,007,808 | ||||||
103
Notes to financial statements
Delaware National Tax-Free Funds
7. Line of Credit
Each Fund, along with certain other funds in the Delaware Investments® Family of Funds (Participants), was a participant in a $225,000,000 revolving line of credit with the Bank of New York Mellon (BNY Mellon) to be used for temporary or emergency purposes as an additional source of liquidity to fund redemptions of investor shares. Under the agreement, the Participants were charged an annual commitment fee, which was allocated across the Participants on the basis of each Participant’s allocation of the entire facility. Participants were permitted to borrow up to a maximum of one third of their net assets under the agreement. The agreement expired on November 18, 2008.
Effective November 18, 2008, the Funds, along with the other Participants, entered into an amendment to the agreement with BNY Mellon for a $35,000,000 revolving line of credit. The agreement, as amended, is to be used as described above and operates in substantially the same manner as the original agreement. The agreement, as amended, expires on November 17, 2009. The Funds had no amounts outstanding as of August 31, 2009, or at any time during the year then ended.
8. Credit and Market Risk
The Funds concentrate their investments in securities issued by municipalities. The value of these investments may be adversely affected by new legislation within the state, regional or local economic conditions, and differing levels of supply and demand for municipal bonds. Many municipalities insure repayment for their obligations. Although bond insurance reduces the risk of loss due to default by an issuer, such bonds remain subject to the risk that market value may fluctuate for other reasons and there is no assurance that the insurance company will meet its obligations. A real or perceived decline in creditworthiness of a bond insurer can have an adverse impact on the value of insured bonds held in the Funds. At August 31, 2009, 20.97% of the Delaware Tax-Free USA Fund’s net assets, 17.00% of the Delaware Tax-Free USA Intermediate Fund’s net assets, and 2.82% of the Delaware National High-Yield Municipal Bond Fund’s net assets were insured by bond insurers. These securities have been identified in the statements of net assets.
Each Fund may invest a portion of its assets in high yield fixed income securities, which carry ratings of BB or lower by Standard & Poor’s Ratings Group (S&P) and/or Ba or lower by Moody’s Investors Service, Inc. (Moody’s). Investments in these higher yielding securities are generally accompanied by a greater degree of credit risk than higher rated securities. Additionally, lower rated securities may be more susceptible to adverse economic and competitive industry conditions than investment grade securities.
The Funds may invest in advanced refunded bonds, escrow secured bonds or defeased bonds. Under current federal tax laws and regulations, state and local government borrowers are permitted to refinance outstanding bonds by issuing new bonds. The issuer refinances the outstanding debt to either reduce interest costs or to remove or alter restrictive covenants imposed by the bonds being refinanced. A refunding transaction where the municipal securities are being refunded within 90 days from the issuance of the refunding issue is known as a “current refunding.” “Advance refunded bonds” are bonds in which the refunded bond issue remains outstanding for more than 90 days following the issuance of the refunding issue. In an advance refunding, the issuer will use the proceeds
104
of a new bond issue to purchase high grade interest bearing debt securities which are then deposited in an irrevocable escrow account held by an escrow agent to secure all future payments of principal and interest and bond premium of the advance refunded bond. Bonds are “escrowed to maturity” when the proceeds of the refunding issue are deposited in an escrow account for investment sufficient to pay all of the principal and interest on the original interest payment and maturity dates.
Bonds are considered “pre-refunded” when the refunding issue’s proceeds are escrowed only until a permitted call date or dates on the refunded issue with the refunded issue being redeemed at the time, including any required premium. Bonds become “defeased” when the rights and interests of the bondholders and of their lien on the pledged revenues or other security under the terms of the bond contract and are substituted with an alternative source of revenues (the escrow securities) sufficient to meet payments of principal and interest to maturity or to the first call dates. Escrowed secured bonds will often receive a rating of AAA from Moody’s, S&P, and/or Fitch Ratings due to the strong credit quality of the escrow securities and the irrevocable nature of the escrow deposit agreement.
Each Fund may invest up to 15% of its net assets in illiquid securities, which may include securities with contractual restrictions on resale, securities exempt from registration under Rule 144A of the Securities Act of 1933, as amended, and other securities which may not be readily marketable. The relative illiquidity of these securities may impair each Fund from disposing of them in a timely manner and at a fair price when it is necessary or desirable to do so. While maintaining oversight, each Fund’s Board has delegated to DMC the day-to-day functions of determining whether individual securities are liquid for purposes of each Fund’s limitation on investments in illiquid assets. Securities eligible for resale pursuant to Rule 144A, which are determined to be liquid, are not subject to each Fund’s 15% limit on investments in illiquid securities. As of August 31, 2009, there were no Rule 144A securities. Illiquid securities have been identified on the statements of net assets.
9. Contractual Obligations
The Funds enter into contracts in the normal course of business that contain a variety of indemnifications. The Funds’ maximum exposure under these arrangements is unknown. However, the Funds have not had prior claims or losses pursuant to these contracts. Management has reviewed each Fund’s existing contracts and expects the risk of loss to be remote.
10. Sale of Delaware Investments to Macquarie Group
On August 18, 2009, Lincoln National Corporation (the parent company of Delaware Investments) and Macquarie Group (Macquarie) entered into an agreement pursuant to which Delaware Investments, including DMC, DDLP and DSC, will be acquired by Macquarie, an Australia-based global provider of banking, financial, advisory, investment and funds management services (Transaction). Upon completion of the Transaction, DMC, DDLP and DSC will be wholly-owned subsidiaries of Macquarie.
105
Notes to financial statements
Delaware National Tax-Free Funds
10. Sale of Delaware Investments to Macquarie Group (continued)
The Transaction will result in a change of control of DMC which, in turn, will cause the termination of the investment advisory agreement between DMC and the Funds. As a result, a Special Meeting of Shareholders (Meeting) of the Funds will be scheduled for the purpose of asking shareholders to approve a new investment advisory agreement between DMC and the Funds (New Agreement). If approved by shareholders, the New Agreement will take effect upon the closing of the Transaction, which is currently anticipated to occur in the fourth quarter of 2009. Shareholders of the Funds will receive proxy materials including more detailed information about the Meeting, the Transaction and the proposed New Agreement.
11. Subsequent Events
Effective August 31, 2009, the Funds adopted Financial Accounting Standards Board Statement of Financial Accounting Standards No. 165, Subsequent Events (FAS 165). In accordance with FAS 165, management has evaluated whether any events or transactions occurred subsequent to August 31, 2009 through October 19, 2009, the date of issuance of the Funds’ financial statements, and determined that there were no material events or transactions other than those already disclosed that would require recognition or disclosure in the Fund’s financial statements.
In addition to the expense cap described in footnote 2, effective September 11, 2009, DMC has agreed to voluntarily waive all or a portion of its investment advisory fees and/or pay/reimburse expenses (excluding any 12b-1 plan expenses, taxes, interest, inverse floater program expenses, brokerage fees, certain insurance costs, and nonroutine expenses) in order to prevent total annual fund operating expenses from exceeding, in an aggregate amount, 0.56% and 0.60% of the Delaware Tax-Free USA Fund and Delaware National High-Yield Municipal Bond Fund’s average daily net assets, respectively until such time as the voluntary expense cap is discontinued. These fee waivers and expense reimbursements apply only to expenses paid directly by the Funds, and may be discontinued at any time because they are voluntary.
12. Tax Information (Unaudited)
The information set forth below is for each Fund’s fiscal year as required by federal laws. Shareholders, however, must report distributions on a calendar year basis for income tax purposes, which may include distributions for portions of two fiscal years of a fund. Accordingly, the information needed by shareholders for income tax purposes will be sent to them in January of each year. Please consult your tax advisor for proper treatment of this information.
106
For the fiscal year ended August 31, 2009, each Fund designates distributions paid during the year as follows:
| (A) | (B) | (C) | ||||||||
| Long-Term Capital | Ordinary Income | Tax Exempt | Total | |||||||
| Gains Distributions | Distributions | Distributions | Distributions | |||||||
| (Tax Basis) | (Tax Basis) | (Tax Basis) | (Tax Basis) | |||||||
| Delaware Tax-Free | ||||||||||
| USA Fund | — | 0.21 | % | 99.79 | % | 100.00% | ||||
| Delaware Tax-Free | ||||||||||
| USA Intermediate Fund | — | — | 100.00 | % | 100.00% | |||||
| Delaware National High-Yield | ||||||||||
| Municipal Bond Fund | — | 0.01 | % | 99.99 | % | 100.00% | ||||
(A), (B), and (C) are based on a percentage of each Fund’s total distributions.
107
Report of independent
registered public accounting firm
To the Shareholders and Board of Trustees
Delaware Group® Tax-Free Funds — Delaware Tax-Free USA Fund, and Delaware Tax-Free USA Intermediate Fund
Voyageur Mutual Funds — Delaware National High-Yield Municipal Bond Fund
We have audited the accompanying statements of net assets of Delaware Group Tax-Free Fund (comprised of Delaware Tax-Free USA Fund and Delaware Tax-Free USA Intermediate Fund) and Delaware National High-Yield Municipal Bond Fund (one of the series constituting Voyageur Mutual Funds) (the “Funds”) as of August 31, 2009, and the related statements of operations for the year then ended, the statements of changes in net assets for each of the two years in the period then ended, and the financial highlights for each of the periods indicated therein. These financial statements and financial highlights are the responsibility of the Funds’ management. Our responsibility is to express an opinion on these financial statements and financial highlights based on our audits.
We conducted our audits in accordance with the standards of the Public Company Accounting Oversight Board (United States). Those standards require that we plan and perform the audit to obtain reasonable assurance about whether the financial statements and financial highlights are free of material misstatement. We were not engaged to perform an audit of the Funds’ internal control over financial reporting. Our audits included consideration of internal control over financial reporting as a basis for designing audit procedures that are appropriate in the circumstances, but not for the purpose of expressing an opinion on the effectiveness of the Funds’ internal control over financial reporting. Accordingly, we express no such opinion. An audit also includes examining, on a test basis, evidence supporting the amounts and disclosures in the financial statements and financial highlights, assessing the accounting principles used and significant estimates made by management, and evaluating the overall financial statement presentation. Our procedures included confirmation of securities owned as of August 31, 2009 by correspondence with the custodian and brokers or by other appropriate auditing procedures where replies from brokers were not received. We believe that our audits provide a reasonable basis for our opinion.
In our opinion, the financial statements and financial highlights referred to above present fairly, in all material respects, the financial position of each of the respective series constituting the Delaware Group Tax-Free Fund and Delaware National High-Yield Municipal Bond Fund of Voyageur Mutual Funds at August 31, 2009, the results of their operations for the year then ended, the changes in their net assets for each of the two years in the period then ended, and their financial highlights for each of the periods indicated therein, in conformity with U.S. generally accepted accounting principles.

Philadelphia, Pennsylvania
October 19, 2009
108
Other Fund information
(Unaudited)
Delaware National Tax-Free Funds
Board Consideration of Delaware Tax-Free USA Fund, Delaware Tax-Free USA Intermediate Fund and Delaware National High-Yield Municipal Bond Fund Investment Advisory Agreements
At a meeting held on May 19-21, 2009 (the “Annual Meeting”), the Board of Trustees (the “Board”), including a majority of disinterested or independent Trustees, approved the renewal of the Investment Advisory Agreements for the Delaware Tax-Free USA Fund, Delaware Tax-Free USA Intermediate Fund and National High-Yield Municipal Bond Fund (each, a “Fund” and together, the “Funds”). In making its decision, the Board considered information furnished specifically in connection with the renewal of the Investment Advisory Agreements with Delaware Management Company (“DMC”), which included materials provided by DMC and its affiliates (“Delaware Investments”) concerning, among other things, the nature, extent and quality of services provided to the Funds, the costs of such services to the Funds, economies of scale and the financial condition and profitability of Delaware Investments. Reference was made to information furnished at regular quarterly Board meetings, including reports detailing Fund performance, investment strategies and expenses, as well as information prepared specifically in connection with the renewal of the investment advisory and sub-advisory contracts. In addition, in connection with the Annual Meeting, reports were provided in February 2009 and included independent historical and comparative reports prepared by Lipper Inc. (“Lipper”), an independent statistical compilation organization. The Lipper reports compared each Fund’s investment performance and expenses with those of other comparable mutual funds. The independent Trustees reviewed and discussed the Lipper reports with counsel to the independent Trustees. The Board requested and received information regarding DMC’s policy with respect to advisory fee levels and its breakpoint philosophy; the structure of portfolio manager compensation; the investment manager’s profitability; and any constraints or limitations on the availability of securities in certain investment styles which had in the past year inhibited, or which were likely in the future to inhibit, DMC’s ability to invest fully in accordance with Fund policies.
In considering information relating to the approval of each Fund’s advisory agreement, the independent Trustees received assistance and advice from and met separately with counsel to the independent Trustees. Although the Board gave attention to all information furnished, the following discussion identifies, under separate headings, the primary factors taken into account by the Board during its contract renewal considerations.
Nature, Extent and Quality of Service. The Board considered the services provided by Delaware Investments to the Funds and their shareholders. In reviewing the nature, extent and quality of services, the Board considered reports furnished to it throughout the year, which covered matters such as the relative performance of the Funds, compliance of portfolio managers with the investment policies, strategies and restrictions for the Funds, compliance by DMC and Delaware Distributors, L.P. (together, “Management”) personnel with the Code of Ethics adopted throughout the Delaware Investments® Family of Funds complex and adherence to fair value pricing procedures as established by the Board. The Board was pleased with the current staffing of the Funds’ investment advisor and the emphasis placed on research in the investment process. The Board gave favorable consideration to DMC’s efforts to control expenditures while maintaining service levels committed to fund matters. The Board also considered the transfer agent and shareholder
109
Other Fund information
(Unaudited)
Delaware National Tax-Free Funds
Board Consideration of Delaware Tax-Free USA Fund, Delaware Tax-Free USA Intermediate Fund and Delaware National High-Yield Municipal Bond Fund Investment Advisory Agreements (continued)
services provided to Fund shareholders by DMC’s affiliate, Delaware Service Company, Inc. (“DSC”), noting DSC’s high level of service. The Board noted that Management finished upgrading investment accounting functions through outsourcing to improve the quality and lower the cost of delivering investment accounting services to the Funds. The Board once again noted the benefits provided to Fund shareholders through each shareholder’s ability to exchange an investment in one Delaware Investments® fund for the same class of shares in another Delaware Investments fund without a sales charge, to reinvest Fund dividends into additional shares of the same Fund or into additional shares of other Delaware Investments funds and the privilege to combine holdings in other Delaware Investments funds to obtain a reduced sales charge. The Board was satisfied with the nature, extent and quality of the overall services provided by Delaware Investments.
Investment Performance. The Board placed significant emphasis on the investment performance of the Funds in view of its importance to shareholders. Although the Board gave appropriate consideration to performance reports and discussions with portfolio managers at Board meetings throughout the year, the Board gave particular weight to the Lipper reports furnished for the Annual Meeting. The Lipper reports prepared for each Fund showed the investment performance of its Class A shares in comparison to a group of similar funds as selected by Lipper (the “Performance Universe”). A fund with the best performance ranked first, and a fund with the poorest performance ranked last. The highest/best performing 25% of funds in the Performance Universe make up the first quartile; the next 25%, the second quartile; the next 25%, the third quartile; and the poorest/worst performing 25% of funds in the Performance Universe make up the fourth quartile. Comparative annualized performance for each Fund was shown for the past one-, three-, five- and ten-year periods ended December 31, 2008. The Board’s objective is that each Fund’s performance for the periods considered be at or above the median of its Performance Universe. The following paragraphs summarize the performance results for the Funds and the Board’s view of such performance.
Delaware Tax-Free USA Fund – The Performance Universe for the Fund consisted of the Fund and all retail and institutional general municipal debt funds as selected by Lipper. The Lipper report comparison showed that the Fund’s total return for the one-, three- and five-year periods was in the second quartile of its Performance Universe. The report further showed that the Fund’s total return for the ten-year period was in the first quartile. The Board was satisfied with performance.
Delaware Tax-Free USA Intermediate Fund – The Performance Universe for the Fund consisted of the Fund and all retail and institutional intermediate municipal debt funds as selected by Lipper. The Lipper report comparison showed that the Fund’s total return for the one-year period was in the second quartile of its Performance Universe. The report further showed that the Fund’s total return for the three-year period was in the third quartile and the Fund’s total return for the five- and ten-year periods was in the first quartile. The Board was satisfied with performance.
Delaware National High-Yield Municipal Bond Fund – The Performance Universe for the Fund consisted of the Fund and all retail and institutional high yield municipal debt funds as selected
110
by Lipper. The Lipper report comparison showed that the Fund’s total return for the one-, three-, five- and ten-year periods was in the first quartile of its Performance Universe. The Board was very satisfied with performance.
Comparative Expenses. The Board considered expense comparison data for the Delaware Investments® Family of Funds. Management provided the Board with information on pricing levels and fee structures for each Fund as of October 31, 2008 and, for comparative funds, information as of their respective fiscal year end occurring on or before August 31, 2008. The Board also focused on the comparative analysis of effective management fees and total expense ratios of each Fund versus effective management fees and expense ratios of a group of similar funds as selected by Lipper (the “Expense Group”). In reviewing comparative costs, each Fund’s contractual management fee and the actual management fee incurred by the Fund were compared with the contractual management fees (assuming all funds in the Expense Group were similar in size to the Fund) and actual management fees (as reported by each fund) within the Expense Group, taking into account any applicable breakpoints and fee waivers. Each Fund’s total expenses were also compared with those of its Expense Group. The Lipper total expenses, for comparative consistency, were shown by Lipper for Class A shares and comparative total expenses including 12b-1 and non 12b-1 service fees. The Board considered fees paid to Delaware Investments for nonmanagement services. The Board’s objective is to limit each Fund’s total expense ratio to be competitive with that of the Expense Group. The following paragraphs summarize the expense results for the Funds and the Board’s view of such expenses.
Delaware Tax-Free USA Fund �� The expense comparisons for the Fund showed that its actual management fee was in the quartile with the second lowest expenses of its Expense Group and its total expenses were in the quartile with the second highest expenses of its Expense Group. The Board gave favorable consideration to the Fund’s management fee, but noted that the Fund’s total expenses were not in line with the Board’s objective. In evaluating the total expenses, the Board considered waivers in place through December 2009 and various initiatives implemented by Management, such as the outsourcing of certain transfer agency and investment accounting services, creating an opportunity for a reduction in expenses. The Board was satisfied with Management’s efforts to improve the Fund’s total expense ratio and bring it in line with the Board’s objective.
Delaware Tax-Free USA Intermediate Fund – The expense comparisons for the Fund showed that its actual management fee and total expenses were in the quartile with the lowest expenses of its Expense Group. The Board was satisfied with the management fee and total expenses of the Fund in comparison to those of its Expense Group as shown in the Lipper report.
Delaware National High-Yield Municipal Bond Fund – The expense comparisons for the Fund showed that its actual management fee was in the quartile with the second lowest expenses of its Expense Group and its total expenses were in the quartile with the second highest expenses of its Expense Group. The Board gave favorable consideration to the Fund’s management fee, but noted that the Fund’s total expenses were not in line with the Board’s objective. In evaluating the total expenses, the Board considered fee waivers in place through December 2009 and various initiatives implemented by Management, such as the outsourcing of certain transfer agency and investment accounting services, creating an opportunity for reduction in expenses. The Board was satisfied with Management’s efforts to improve the Fund’s total expense ratio and bring it in line with the Board’s objective.
111
Other Fund information
(Unaudited)
Delaware National Tax-Free Funds
Board Consideration of Delaware Tax-Free USA Fund, Delaware Tax-Free USA Intermediate Fund and Delaware National High-Yield Municipal Bond Fund Investment Advisory Agreements (continued)
Management Profitability. The Board considered the level of profits realized by Delaware Investments in connection with the operation of the Funds. In this respect, the Board reviewed the Investment Management Profitability Analysis that addressed the overall profitability of Delaware Investments’ business in providing management and other services to each of the individual funds and the Delaware Investments® Family of Funds as a whole. Specific attention was given to the methodology followed in allocating costs for the purpose of determining profitability. Management stated that the level of profits of Delaware Investments, to a certain extent, reflect recent operational cost savings and efficiencies initiated by Delaware Investments. The Board considered Delaware Investments’ efforts to improve services provided to fund shareholders and to meet additional regulatory and compliance requirements resulting from recent industry-wide Securities and Exchange Commission initiatives. The Board also considered the extent to which Delaware Investments might derive ancillary benefits from fund operations, including the potential for procuring additional business as a result of the prestige and visibility associated with its role as service provider to the Delaware Investments Family of Funds and the benefits from allocation of fund brokerage to improve trading efficiencies. The Board found that the management fees were reasonable in light of the services rendered and the level of profitability of Delaware Investments.
Economies of Scale. The Trustees considered whether economies of scale are realized by Delaware Investments as each Fund’s assets increase and the extent to which any economies of scale are reflected in the level of management fees charged. The Trustees reviewed the standardized advisory fee pricing and structure, approved by the Board and shareholders, which includes breakpoints. Breakpoints in the advisory fee occur when the advisory fee rate is reduced on assets in excess of specified levels. Breakpoints result in a lower advisory fee than would otherwise be the case on all assets when the asset levels specified are exceeded. The Board noted that the fee under each Fund’s management contract fell within the standard structure. The Board also noted that the Delaware Tax-Free USA Fund’s assets exceeded the first breakpoint level. The Board believed that, given the extent to which economics of scale might be realized by the advisor and its affiliates, the schedule of fees under the Investment Advisory Agreement provides a sharing of benefits with the Fund and its shareholders. Although neither the Delaware Tax-Free USA Intermediate Fund nor the Delaware National High-Yield Municipal Bond Fund has reached a size at which it can take advantage of breakpoints, the Board recognized that the fee was structured so that when the Fund grows, economies of scale may be shared.
112
Fund management
Joseph R. Baxter
Senior Vice President, Head of Municipal Bond Department, Senior Portfolio Manager
Joseph R. Baxter is the head of the municipal bond department and is responsible for setting the department’s investment strategy. He is also a co-portfolio manager of the firm’s municipal bond funds and several client accounts. Before joining Delaware Investments in 1999 as head municipal bond trader, he held investment positions with First Union, most recently as a municipal portfolio manager with the Evergreen Funds. Baxter received a bachelor’s degree in finance and marketing from La Salle University.
Stephen J. Czepiel
Senior Vice President, Senior Portfolio Manager
Stephen J. Czepiel is a member of the firm’s municipal fixed income portfolio management team with primary responsibility for portfolio construction and strategic asset allocation. He is a co-portfolio manager of the firm’s municipal bond funds and client accounts. He joined Delaware Investments in July 2004 as a senior bond trader. Previously, he was vice president at both Mesirow Financial and Loop Capital Markets. He began his career in the securities industry in 1982 as a municipal bond trader at Kidder Peabody and now has more than 20 years of experience in the municipal securities industry. Czepiel earned his bachelor’s degree in finance and economics from Duquesne University.
113
Board of trustees/directors and officers addendum
Delaware Investments® Family of Funds
A mutual fund is governed by a Board of Trustees/Directors (“Trustees”), which has oversight responsibility for the management of a fund’s business affairs. Trustees establish procedures and oversee and review the performance of the investment manager, the distributor, and others who perform services for the fund. The independent fund trustees, in particular, are advocates
| Name, Address, | Position(s) | Length of | ||
| and Birth Date | Held with Fund(s) | Time Served | ||
| Interested Trustees | ||||
| Patrick P. Coyne1 | Chairman, President, | Chairman and Trustee | ||
| 2005 Market Street | Chief Executive Officer, | since August 16, 2006 | ||
| Philadelphia, PA 19103 | and Trustee | |||
| April 1963 | President and | |||
| Chief Executive Officer | ||||
| since August 1, 2006 | ||||
| Independent Trustees | ||||
| Thomas L. Bennett | Trustee | Since March 2005 | ||
| 2005 Market Street | ||||
| Philadelphia, PA 19103 | ||||
| October 1947 | ||||
| John A. Fry | Trustee | Since January 2001 | ||
| 2005 Market Street | ||||
| Philadelphia, PA 19103 | ||||
| May 1960 | ||||
| Anthony D. Knerr | Trustee | Since April 1990 | ||
| 2005 Market Street | ||||
| Philadelphia, PA 19103 | ||||
| December 1938 | ||||
| Lucinda S. Landreth | Trustee | Since March 2005 | ||
| 2005 Market Street | ||||
| Philadelphia, PA 19103 | ||||
| June 1947 | ||||
1 Patrick P. Coyne is considered to be an “Interested Trustee” because he is an executive officer of the Fund’s(s’) investment advisor.
114
for shareholder interests. Each trustee has served in that capacity since he or she was elected to or appointed to the Board of Trustees, and will continue to serve until his or her retirement or the election of a new trustee in his or her place. The following is a list of the Trustees and Officers with certain background and related information.
| Number of Portfolios in | ||||
| Principal Occupation(s) | Fund Complex Overseen | Other Directorships | ||
| During Past 5 Years | by Trustee or Officer | Held by Trustee or Officer | ||
| Patrick P. Coyne has served in | 81 | Director | ||
| various executive capacities | Kaydon Corp. | |||
| at different times at | ||||
| Delaware Investments.2 | ||||
| Private Investor | 81 | Director | ||
| (March 2004–Present) | Bryn Mawr Bank Corp. (BMTC) | |||
| (April 2007–Present) | ||||
| Investment Manager | ||||
| Morgan Stanley & Co. | ||||
| (January 1984–March 2004) | ||||
| President | 81 | Director | ||
| Franklin & Marshall College | Community Health Systems | |||
| (June 2002–Present) | ||||
| Executive Vice President | ||||
| University of Pennsylvania | ||||
| (April 1995–June 2002) | ||||
| Founder and | 81 | None | ||
| Managing Director | ||||
| Anthony Knerr & Associates | ||||
| (Strategic Consulting) | ||||
| (1990–Present) | ||||
| Chief Investment Officer | 81 | None | ||
| Assurant, Inc. (Insurance) | ||||
| (2002–2004) | ||||
2 Delaware Investments is the marketing name for Delaware Management Holdings, Inc. and its subsidiaries, including the Fund’s(s’) investment advisor, principal underwriter, and its transfer agent.
115
Board of trustees/directors and officers addendum
Delaware Investments® Family of Funds
| Name, Address, | Position(s) | Length of | ||
| and Birth Date | Held with Fund(s) | Time Served | ||
| Independent Trustees (continued) | ||||
| Ann R. Leven | Trustee | Since October 1989 | ||
| 2005 Market Street | ||||
| Philadelphia, PA 19103 | ||||
| November 1940 | ||||
| Thomas F. Madison | Trustee | Since May 19973 | ||
| 2005 Market Street | ||||
| Philadelphia, PA 19103 | ||||
| February 1936 | ||||
3 In 1997, several funds managed by Voyageur Fund Managers, Inc. (the “Voyageur Funds”) were incorporated into the Delaware Investments Family of Funds. Mr. Madison served as a director of the Voyageur Funds from 1993 until 1997.
116
| Number of Portfolios in | ||||
| Principal Occupation(s) | Fund Complex Overseen | Other Directorships | ||
| During Past 5 Years | by Trustee or Officer | Held by Trustee or Officer | ||
| Consultant | 81 | None | ||
| ARL Associates | ||||
| (Financial Planning) | ||||
| (1983–Present) | ||||
| President and | 81 | Director and Chair of | ||
| Chief Executive Officer | Compensation Committee, | |||
| MLM Partners, Inc. | Governance Committee | |||
| (Small Business Investing | Member | |||
| and Consulting) | CenterPoint Energy | |||
| (January 1993–Present) | ||||
| Lead Director and Chair of | ||||
| Audit and Governance | ||||
| Committees, Member of | ||||
| Compensation Committee | ||||
| Digital River, Inc. | ||||
| Director and Chair of | ||||
| Governance Committee, | ||||
| Audit Committee | ||||
| Member | ||||
| Rimage Corporation | ||||
| Director and Chair of | ||||
| Compensation Committee | ||||
| Spanlink Communications | ||||
| Lead Director and Member of | ||||
| Compensation and | ||||
| Governance Committees | ||||
| Valmont Industries, Inc. |
117
Board of trustees/directors and officers addendum
Delaware Investments® Family of Funds
| Name, Address, | Position(s) | Length of | ||
| and Birth Date | Held with Fund(s) | Time Served | ||
| Independent Trustees (continued) | ||||
| Janet L. Yeomans | Trustee | Since April 1999 | ||
| 2005 Market Street | ||||
| Philadelphia, PA 19103 | ||||
| July 1948 | ||||
| J. Richard Zecher | Trustee | Since March 2005 | ||
| 2005 Market Street | ||||
| Philadelphia, PA 19103 | ||||
| July 1940 | ||||
| Officers | ||||
| David F. Connor | Vice President, | Vice President since | ||
| 2005 Market Street | Deputy General | September 2000 | ||
| Philadelphia, PA 19103 | Counsel, and Secretary | and Secretary since | ||
| December 1963 | October 2005 | |||
| Daniel V. Geatens | Vice President | Treasurer | ||
| 2005 Market Street | and Treasurer | since October 25, 2007 | ||
| Philadelphia, PA 19103 | ||||
| October 1972 | ||||
| David P. O’Connor | Senior Vice President, | Senior Vice President, | ||
| 2005 Market Street | General Counsel, | General Counsel, and | ||
| Philadelphia, PA 19103 | and Chief Legal Officer | Chief Legal Officer | ||
| February 1966 | since October 2005 | |||
| Richard Salus | Senior Vice President | Chief Financial Officer | ||
| 2005 Market Street | and Chief Financial Officer | since November 2006 | ||
| Philadelphia, PA 19103 | ||||
| October 1963 | ||||
4 David F. Connor, Daniel V. Geatens, David P. O’Connor, and Richard Salus serve in similar capacities for the six portfolios of the Optimum Fund Trust, which have the same investment advisor, principal underwriter, and transfer agent as the registrant.
118
| Number of Portfolios in | ||
| Principal Occupation(s) | Fund Complex Overseen | Other Directorships |
| During Past 5 Years | by Trustee or Officer | Held by Trustee or Officer |
| Vice President and Treasurer | 81 | None |
| (January 2006–Present) | ||
| Vice President — Mergers & Acquisitions | ||
| (January 2003–January 2006), and | ||
| Vice President | ||
| (July 1995–January 2003) | ||
| 3M Corporation | ||
| Founder | 81 | Director and Audit |
| Investor Analytics | Committee Member | |
| (Risk Management) | Investor Analytics | |
| (May 1999–Present) | ||
| Founder | ||
| Sutton Asset Management | ||
| (Hedge Fund) | ||
| (September 1996–Present) | ||
| David F. Connor has served as | 81 | None4 |
| Vice President and Deputy | ||
| General Counsel of | ||
| Delaware Investments | ||
| since 2000. | ||
| Daniel V. Geatens has served | 81 | None4 |
| in various capacities at | ||
| different times at | ||
| Delaware Investments. | ||
| David P. O’Connor has served in | 81 | None4 |
| various executive and legal | ||
| capacities at different times | ||
| at Delaware Investments. | ||
| Richard Salus has served in | 81 | None4 |
| various executive capacities | ||
| at different times at | ||
| Delaware Investments. | ||
The Statement of Additional Information for the Fund(s) includes additional information about the Trustees and Officers and is available, without charge, upon request by calling 800 523-1918.
119
About the organization
Board of trustees | |||
Patrick P. Coyne Thomas L. Bennett John A. Fry | Anthony D. Knerr Lucinda S. Landreth | Ann R. Leven Thomas F. Madison | Janet L. Yeomans J. Richard Zecher |
| Affiliated officers | |||
David F. Connor | Daniel V. Geatens | David P. O’Connor | Richard Salus |
This annual report is for the information of Delaware Tax-Free USA Fund, Delaware Tax-Free USA Intermediate Fund, and Delaware National High-Yield Municipal Bond Fund shareholders, but it may be used with prospective investors when preceded or accompanied by a current prospectus for Delaware Tax-Free USA Fund, Delaware Tax-Free USA Intermediate Fund, and Delaware National High-Yield Municipal Bond Fund and the Delaware Investments Fund profile for the most recently completed calendar quarter. These documents are available at www.delawareinvestments.com. The prospectus sets forth details about charges, expenses, investment objectives, and operating policies of the investment company. You should read the prospectus carefully before you invest. The figures in this report represent past results that are not a guarantee of future results. The return and principal value of an investment in the investment company will fluctuate so that shares, when redeemed, may be worth more or less than their original cost. |
Delaware Investments is the marketing name of Delaware Management Holdings, Inc. and its subsidiaries. Each Fund files its complete schedule of portfolio holdings with the Securities and Exchange Commission for the first and third quarters of each fiscal year on Form N-Q. Each Fund’s Forms N-Q, as well as a description of the policies and procedures that each Fund uses to determine how to vote proxies (if any) relating to portfolio securities are available without charge (i) upon request, by calling 800 523-1918; and (ii) on the Commission’s Web site at www.sec.gov. In addition, a description of the policies and procedures that each Fund uses to determine how to vote proxies (if any) relating to portfolio securities and each Fund’s Schedule of Investments are available without charge on each Fund’s Web site at www.delawareinvestments.com. Each Fund’s Forms N-Q may be reviewed and copied at the Commission’s Public Reference Room in Washington, D.C.; information on the operation of the Public Reference Room may be obtained by calling 800 SEC-0330. Information (if any) regarding how each Fund voted proxies relating to portfolio securities during the most recently disclosed 12-month period ended June 30 is available without charge (i) through each Fund’s Web site at www.delawareinvestments.com; and (ii) on the Commission’s Web site at www.sec.gov. |
120
| |
|
| |
Annual report Delaware Tax-Free Arizona Fund Delaware Tax-Free California Fund Delaware Tax-Free Colorado Fund Delaware Tax-Free Idaho Fund Delaware Tax-Free New York Fund August 31, 2009 Fixed income mutual funds |
This annual report is for the information of Delaware Tax-Free Arizona Fund, Delaware Tax-Free California Fund, Delaware Tax-Free Colorado Fund, Delaware Tax-Free Idaho Fund, and Delaware Tax-Free New York Fund shareholders, but it may be used with prospective investors when preceded or accompanied by a current prospectus for Delaware Tax-Free Arizona Fund, Delaware Tax-Free California Fund, Delaware Tax-Free Colorado Fund, Delaware Tax-Free Idaho Fund, and Delaware Tax-Free New York Fund. The figures in the annual report for Delaware Tax-Free Arizona Fund, Delaware Tax-Free California Fund, Delaware Tax-Free Colorado Fund, Delaware Tax-Free Idaho Fund, and Delaware Tax-Free New York Fund represent past results, which are not a guarantee of future results. The return and principal value of an investment in the investment company will fluctuate so that shares, when redeemed, may be worth more or less than their original cost. Current performance may be higher or lower than the performance data quoted. You should consider the investment objectives, risks, charges, and expenses of the investment company carefully before investing. The Delaware Tax-Free Arizona Fund, Delaware Tax-Free California Fund, Delaware Tax-Free Colorado Fund, Delaware Tax-Free Idaho Fund, and Delaware Tax-Free New York Fund prospectus contains this and other important information about the investment company. Prospectuses for all open-end funds in the Delaware Investments® Family of Funds are available from your financial advisor, online at www.delawareinvestments.com, or by phone at 800 523-1918. Please read the prospectus carefully before you invest or send money. |
You can obtain shareholder reports and prospectuses online instead of in the mail. |
Experience Delaware Investments
Delaware Investments is committed to the pursuit of consistently superior asset management and unparalleled client service. We believe in our investment processes, which seek to deliver consistent results, and in convenient services that help add value for our clients.
If you are interested in learning more about creating an investment plan, contact your financial advisor.
You can learn more about Delaware Investments or obtain a prospectus for Delaware Tax-Free Arizona Fund, Delaware Tax-Free California Fund, Delaware Tax-Free Colorado Fund, Delaware Tax-Free Idaho Fund, and Delaware Tax-Free New York Fund at www.delawareinvestments.com.
Manage your investments online
- 24-hour access to your account information
- Obtain share prices
- Check your account balance and recent transactions
- Request statements or literature
- Make purchases and redemptions
Contact information
Investment manager
Delaware Management Company, a series of Delaware Management Business Trust
National distributor
Delaware Distributors, L.P.
Financial intermediary wholesaler
Lincoln Financial Distributors, L.P.
Shareholder servicing, dividend disbursing, and transfer agent
Delaware Service Company, Inc.
Mailing address
2005 Market Street
Philadelphia, PA 19103-7094
Shareholder assistance by phone
800 523-1918, weekdays from 8 a.m. to 7 p.m. Eastern time
For securities dealers and financial institutions representatives only
800 362-7500
| Table of contents | |
| Portfolio management review | 1 |
| Performance summaries | 9 |
| Disclosure of Fund expenses | 24 |
| Sector allocations and | |
| credit quality breakdowns | 27 |
| Statements of net assets | 32 |
| Statements of operations | 72 |
| Statements of changes in net assets | 74 |
| Financial highlights | 84 |
| Notes to financial statements | 114 |
| Report of independent registered | |
| public accounting firm | 128 |
| Other Fund information | 129 |
| Board of trustees/directors and | |
| officers addendum | 134 |
| About the organization | 142 |
Views expressed herein are current as of August 31, 2009 and are subject to change.
Funds are not FDIC insured and are not guaranteed. It is possible to lose the principal amount invested.
Mutual fund advisory services provided by Delaware Management Company, a series of Delaware Management Business Trust, which is a registered investment advisor. Delaware Investments is the marketing name of Delaware Management Holdings, Inc. and its subsidiaries. Lincoln Financial Group is the marketing name for Lincoln National Corporation and its affiliates.
© 2009 Delaware Distributors, L.P.
All third-party trademarks cited are the property of their respective owners.
| Portfolio management review | |
| Delaware multi-state funds | Sept. 8, 2009 |
| Performance preview (for the period ended Aug. 31, 2009) | ||||
| Delaware Tax-Free Arizona Fund (Class A shares) | 1-year return | +5.64% | ||
| Barclays Capital Municipal Bond Index (benchmark) | 1-year return | +5.67% | ||
| Lipper Arizona Municipal Debt Funds Average | 1-year return | +1.98% | ||
Past performance does not guarantee future results. |
| Delaware Tax-Free California Fund (Class A shares) | 1-year return | +2.74% | ||
| Barclays Capital Municipal Bond Index (benchmark) | 1-year return | +5.67% | ||
| Lipper California Municipal Debt Funds Average | 1-year return | +0.78% |
Past performance does not guarantee future results. |
| Delaware Tax-Free Colorado Fund (Class A shares) | 1-year return | +4.11% | ||
| Barclays Capital Municipal Bond Index (benchmark) | 1-year return | +5.67% | ||
| Lipper Colorado Municipal Debt Funds Average | 1-year return | +1.95% |
Past performance does not guarantee future results. |
| Delaware Tax-Free Idaho Fund (Class A shares) | 1-year return | +6.12% | ||
| Barclays Capital Municipal Bond Index (benchmark) | 1-year return | +5.67% | ||
| Lipper Other States Municipal Debt Funds Average | 1-year return | +3.29% |
Past performance does not guarantee future results. |
| Data for this portfolio management review were provided by Bloomberg unless otherwise noted. | 1 |
Portfolio management review
Delaware multi-state funds
| Delaware Tax-Free New York Fund (Class A shares) | 1-year return | +5.65% | ||
| Barclays Capital Municipal Bond Index (benchmark) | 1-year return | +5.67% | ||
| Lipper New York Municipal Debt Funds Average | 1-year return | +2.86% |
Past performance does not guarantee future results. |
Fund performance
Delaware Tax-Free Arizona Fund Class A shares returned +5.64% at net asset value and +0.84% at maximum offer price (both returns include distributions reinvested) for the fiscal year ended Aug. 31, 2009. For the same period, the Fund’s benchmark, the Barclays Capital Municipal Bond Index (formerly the Lehman Brothers Municipal Bond Index), returned +5.67%. For complete annualized performance for Delaware Tax-Free Arizona Fund, please see the table on page 9.
Delaware Tax-Free California Fund Class A shares returned +2.74% at net asset value and -1.89% at maximum offer price (both returns include distributions reinvested) for the fiscal year ended Aug. 31, 2009. For the same period, the Fund’s benchmark, the Barclays Capital Municipal Bond Index, returned +5.67%. For complete annualized performance for Delaware Tax-Free California Fund, please see the table on page 12.
Delaware Tax-Free Colorado Fund Class A shares returned +4.11% at net asset value and -0.56% at maximum offer price (both returns include distributions reinvested) for the fiscal year ended Aug. 31, 2009. For the same period, the Fund’s benchmark, the Barclays Capital Municipal Bond Index, returned +5.67%. For complete annualized performance for Delaware Tax-Free Colorado Fund, please see the table on page 15.
Within the municipal bond market:
- In our view, the most notable trend during the early part of the fiscal period was the widening performance gap between higher-rated and lower-rated bonds.
- Eventually, however, with municipal bond yields high and their prices historically low (bond yields and prices move in opposite directions), investors slowly began to return to the tax-exempt bond market beginning in early 2009.
- In this environment, lower-rated bonds enjoyed more-favorable performance, and even rallied in the summer months.
2
Delaware Tax-Free Idaho Fund Class A shares returned +6.12% at net asset value and +1.35% at maximum offer price (both returns include distributions reinvested) for the fiscal year ended Aug. 31, 2009. For the same period, the Fund’s benchmark, the Barclays Capital Municipal Bond Index, returned +5.67%. For complete annualized performance for Delaware Tax-Free Idaho Fund, please see the table on page 18.
Delaware Tax-Free New York Fund Class A shares returned +5.65% at net asset value and +0.86% at maximum offer price (both returns include distributions reinvested) for the fiscal year ended Aug. 31, 2009. For the same period, the Fund’s benchmark, the Barclays Capital Municipal Bond Index, returned +5.67%. For complete annualized performance for Delaware Tax-Free New York Fund, please see the table on page 21.
Economic environment
The 12-month period included one of the most difficult economic and investment climates the portfolio management team has ever seen, followed by a considerable recovery within the municipal bond market and across fixed income markets more broadly.
The financial markets’ troubles date back to 2007 and turmoil continued into the start of the reporting period in September 2008:
- Falling home prices led to rising mortgage defaults, especially among “subprime” borrowers, or individuals with weak credit.
- As defaults rose, mortgage-backed securities — bonds whose interest is backed by monthly mortgage payments — lost considerable value.
- Credit dried up, and even financially sound companies and municipal borrowers found it increasingly difficult to obtain needed funds.
Several weeks into the period, the financial markets received a jolt with the bankruptcy of storied Wall Street investment bank Lehman Brothers. This event, followed soon after by the near bankruptcy (and ultimate federal bailout) of insurance giant American International Group (AIG), sent the markets into a near panic. Stock and bond prices virtually collapsed, while credit became even less available. On the whole, businesses began to cut their capital spending, and large-scale job losses ensued.
By early 2009, both stock and bond valuations had fallen extremely from their highs, reflecting investors’ fears of an economic depression. Though the “worst-case scenarios” that many may have envisioned did not materialize, the U.S. economy did experience its most severe downturn in decades. Gross domestic product (GDP) — a widely used measure of economic activity — fell by 5.4% and 6.4% in the fourth quarter of 2008 and the first quarter of 2009, respectively. It was the country’s worst two-quarter economic performance in more than 50 years.
Within this environment, the Federal Reserve and federal government took a series of steps to loosen tight credit markets and avert a worst-case scenario for the economy. The Fed significantly expanded its balance sheet during the fiscal year. Notably, it employed one of the lesser-used tools that it has at its disposal, in purchasing hundreds of billions of dollars’ worth of longer-term U.S. Treasury debt as well as agency mortgage-backed securities. In December 2008, the Federal Open Market Committee (FOMC) cut the target federal funds rate to a range of zero to 0.25% — an all-time low. For its part,
3
Portfolio management review
Delaware multi-state funds
the federal government passed the Troubled Asset Relief Program (TARP), a $700 billion package designed to shore up financial institutions, in October 2008. Several months later, the Obama administration followed up with the American Recovery and Reinvestment Act of 2009, a nearly $800 billion economic stimulus package. (Source: Bloomberg.)
As the period came to a close, the economy was, if not improving, declining at a far slower pace, and many were anticipating an end to the long recession. During the second quarter of 2009, GDP fell by an estimated 1% (source: Bloomberg). This figure was still weak, but it was the best economic performance seen in a year.
Economic environment by state
As of the end of the fiscal period, Arizona had a budget approved for $8.3 billion of state spending, but a $3.2 billion revenue shortfall meant that the budget wasn’t constitutionally balanced. The Arizona Legislature adjourned its special session on Aug. 25. The governor had until Sept. 5 to sign or veto a budget package (budget negotiations remained at a stalemate as of this writing). The Republican package includes more than $600 million in spending cuts, $250 million in transfers, $735 million from refinancing prisons, $160 million in funding delays, and $1.1 billion in federal stimulus money, while the Democrats’ proposal included the governor’s three-year sales-tax proposal and erased spending cuts for education, healthcare, and social services. (Sources: KTAR.com, Office of the Governor.)
In California, lawmakers passed $23.2 billion of budget balancing measures, closing most of the state’s estimated $24.2 billion deficit for this year. Two important components of the package failed in the Assembly, one that would have allowed oil drilling off the coast of Santa Barbara and another that authorized taking about $1 billion in gas tax revenues from local governments. To eliminate the $156 million deficit and create a $500 million reserve, the governor made $489 million in extra cuts, borrowed $50 million from one of the state’s special funds and found about $117 million in savings from money not spent in the last fiscal year. It has been reported that California will need to borrow approximately $10.5 billion to meet its cash flow needs for the rest of the fiscal year. Officials should begin with a $1.5 billion interim revenue anticipation note (RAN). The interim RANs are to be taken out by mid-September, when the treasurer’s office plans to issue $10.5 billion of RANs in a deal designed to meet the state’s cash flow needs through fiscal 2010. (Sources: Sacramento Bee, State Controller, State Treasurer, Office of the Governor, and The Bond Buyer.)
Colorado Governor Bill Ritter presented the Joint Budget Committee with a budget balancing plan that closes a nearly $320 million shortfall in the current 2010 fiscal year. Most cuts took effect Sept. 1, and come on top of the $1.45 billion the Legislature already has cut from the state budget in the last two years. The plan reflects a 9% reduction in spending from last fiscal year. It includes $265 million in targeted service cuts, the elimination of 270 state jobs, and $48 million in cash-funded program reductions. (Source: Office of the Governor.)
Idaho General Fund revenue finished fiscal 2009 $94.8 million lower than expected
4
based on the February 2009 forecast and $443.8 million lower than 2008 figures. More than half of the fiscal year revenue shortfall was due to weakness in individual income tax. Overall general fund revenues on a budgetary basis are forecasted to decline to $2.5 billion in fiscal 2010, down from $2.6 billion in 2009. It has been reported that spending holdbacks or draws on reserves outside the general fund are likely. However, Idaho has external reserves that are expected to total $280 million at the end of 2010. (Sources: Idaho Division of Financial Management and Standard & Poor’s.)
In New York, total tax revenues of $11.5 billion were $52.6 million below projections and $3.6 billion lower than last year from April through July. Personal income tax collections were $3.3 billion below last year, primarily due to collections in April 2009. While total personal income tax collections are down for the year, personal income tax withholding collections grew by $16 million in July for the second consecutive month this year. Business tax collections were $181 million higher than collections for the same period last year. (Source: New York State Comptroller.)
The municipal bond market
In our view, the most notable trend within the municipal bond market during the period was the widening performance gap between higher-rated and lower-rated bonds. Demand remained strong for securities with high (AA or better) credit ratings, for example, but was weak for those in all other rating categories, particularly securities rated BBB or below. As a result, lower-rated bonds dramatically underperformed their higher-grade counterparts — especially in the first few months of the period when investor confidence was lowest.
This bifurcation, or divergence of performance, within the municipal market largely resulted from the continued financial troubles for monoline municipal bond insurers. For many years, these companies — which insure municipal bond principal and interest payments — received AAA ratings from the major credit rating agencies. As a result, many investors were willing to buy lower-quality bonds as long as they carried this AAA-rated insurance guarantee. Beginning in 2007, however, as credit conditions worsened, many of these monoline insurance companies saw their credit ratings cut dramatically.
Severe capitalization constraints within the investment banking community compounded the municipal markets’ problems during approximately the first half of the fiscal period. Once investment banks’ capital positions were compromised, most were less willing to provide liquidity to help bolster the municipal market.
With municipal bond yields high and their prices at historic lows (bond yields and prices move in opposite directions), investors slowly began to return to the tax-exempt bond market beginning in mid-December 2008. At first, they favored highly rated bonds generally associated with minimal credit risk. By the year’s second calendar quarter, as optimism about the economy grew, municipal bond issuance began to grow, and for the first time in months we began to see increased new supply that stemmed from lower-rated, higher-yielding deals.
In this environment, lower-rated bonds generally enjoyed more-favorable performance, and even rallied in the summer months. Credit spreads — which can be interpreted as the additional income paid to
5
Portfolio management review
Delaware multi-state funds
investors in exchange for investing in riskier bonds — narrowed sharply from their peak in early January, indicating some initial easing of the general risk aversion that characterized fixed income markets for so long.
Besides generally avoiding credit risk, many municipal bond investors sought to minimize interest rate risk as well during the period. This was indicated by the fact that the yield curve, or the difference in yield offered by shorter-dated AAA-rated general obligation bonds relative to comparable longer-dated issues, rose steadily during the fiscal period. In fact, it reached a high of nearly four percentage points in August 2009 — almost double the historical average. (Source: Barclays Capital.)
Tactical portfolio shifts
Entering the reporting period, we sought to take advantage of market conditions by positioning the Funds more conservatively. We were emphasizing higher-rated securities as well as those with intermediate maturities. As the credit crisis deepened, this conservative stance generally contributed to the Funds’ performance versus our peers, especially in the fourth quarter of 2008 and first quarter of 2009.
Beginning early in 2009 and continuing through the end of the fiscal period, we became somewhat more confident, as we perceived a positive shift in the outlook for municipal bonds. Believing that municipal bond investors were being unusually well compensated for taking on credit risk, we began to selectively invest more of the Funds’ assets in lower-rated, higher-yielding bonds. We also sold some of our intermediate-dated holdings and increasingly focused on longer-dated issues — an approach that enabled us to lock higher interest rates into the portfolios for an extended time.
Our approach during approximately the second half of the fiscal year (selectively investing across the credit spectrum) is more representative of how we manage the Funds during more-normalized market conditions. We are bottom-up investors, meaning that we evaluate securities one by one, based on thorough fundamental research to help ensure our comfort with the credit quality of each issuer. We believe that this approach may enable us to uncover value potential that investors with less experience or a less rigorous dedication to research might not be able to identify.
We believe this shift in Fund positioning was well timed. Early on, when the Funds emphasized higher-quality, intermediate-maturity debt, the securities we owned were often less affected by the worst of the market turmoil. As we gradually positioned the Funds more aggressively in a more favorable investment environment, we generally benefited from having security selection to the types of fundamentally solid, yet higher-than-average yielding bonds that we have historically favored.
Of final note, large states with plentiful supplies of tax-free bonds to choose from — such as California and New York — provided us with multiple investment opportunities, while in smaller states with reduced supply, such as Idaho, we attempted to take advantage of opportunities as they surfaced. In the latter category, we made increased use of bonds issued by U.S. territories such as Puerto Rico, which generally are fully exempt from income taxes at all levels of government.
6
Notable sectors and securities
Many of the best-performing sectors in all Funds (regardless of state) were those with a large proportion of high-quality bonds. For example, all Funds benefited greatly from exposure to pre-refunded issues. These securities are found on the short end of the yield curve and have historically faced little if any credit risk. This is because they are backed by the invested debt proceeds of a second bond issue, which typically consists of U.S. Treasury securities. Given investors’ tremendous risk aversion during the period, Treasurys performed extremely well, boosting the performance of our pre-refunded holdings.
Other sectors with predominantly higher-quality issuance added to performance as well. In Delaware Tax-Free Colorado Fund, for example, local general obligation (GO) bonds, and especially an investment in Adams and Arapahoe Counties GO bonds, were particularly helpful. Water/sewer bonds were among the best performers for Delaware Tax-Free California Fund. These bonds benefited from their essential function, which helped them during the challenging economic environment.
Special-tax bonds generally contributed to the Funds’ performances as well, especially in the New York and Arizona Funds. Special-tax bonds are backed by dedicated tax revenue streams, potentially making them less vulnerable to the financial weakness of state and local governments. For example, Delaware Tax-Free New York Fund benefited from its position in Metropolitan Transportation Authority bonds, which were purchased near the market’s bottom and which recovered substantially off of their lows. Similarly, Delaware Tax-Free Arizona Fund benefited from two particularly strong-performing special-tax bonds — Scottsdale Water/Sewer as well as Mesa, Ariz. Street and Highway revenue bonds.
The Funds’ performances in the healthcare sector were mixed overall. We saw strong results from individual healthcare bonds we bought near the market’s bottom and that subsequently recovered off their lows. Within Delaware Tax-Free Idaho Fund, for example, a position in Idaho Health Facilities Authority revenue bonds issued for Trinity Health performed well, while Delaware Tax-Free Colorado Fund was helped by Colorado Health Facilities Authority revenue bonds issued for Catholic Health Initiatives. In Delaware Tax-Free New York Fund, our investment in New York State Dormitory Authority revenue bonds issued for Memorial Sloan-Kettering performed quite well. We were able to purchase these bonds near the bottom of the market, and the holdings rebounded nicely in the second half of the period. Despite the success of our Sloan-Kettering holdings, the healthcare sector was an overall source of underperformance for this Fund.
On the negative side, the industrial development revenue (IDR) bond category, which consists of corporate-backed bonds, many of which were lower rated, was generally a source of underperformance across the state Funds. This was particularly true for Delaware Tax-Free New York Fund and Delaware Tax-Free Idaho Fund. Bonds issued for the Brooklyn Navy Yard were a noteworthy drag on the New York Fund’s returns. The proceeds from this bond issue went to fund electricity generation plants — a cyclical business that lagged as the economy weakened. In the Idaho Fund, Nez Perce County pollution bonds issued for Potlatch Corporation were significant detractors.
7
Portfolio management review
Delaware multi-state funds
Because of their more-limited municipal issuance, both Delaware Tax-Free Arizona Fund and Delaware Tax-Free Idaho Fund had elevated exposure to bonds issued by U.S. territories. In both cases, the Funds were hurt by their exposure to Puerto Rico general obligation bonds, which underperformed because of the territory’s lower credit rating. The Arizona Fund was also hurt by its allocation to U.S. Virgin Islands gross receipt tax bonds.
Lower-rated education bonds had a noteworthy negative impact on both Delaware Tax-Free Colorado Fund and Delaware Tax-Free California Fund. The education bond sector in Colorado includes an unusually large proportion of charter school bonds, many of which carry mid-investment-grade credit ratings at best. These lower-rated bonds underperformed, as did our holdings in bonds issued for the University of Puerto Rico. Although lower-rated education bonds were also a negative within the California Fund, we did benefit from several highly rated university issues that were helped by their strong credit quality.
Several funds, including Delaware Tax-Free Colorado Fund and Delaware Tax-Free California Fund, also were weighed down by their allocation to land-transaction bonds, sometimes called “dirt bonds.” These issues, which help finance property developments, were particularly challenged in the regions that experienced the biggest housing boom and subsequent bust. For example, the Colorado Fund was hurt by the performance of Park Meadows Business Improvement and North Range Metropolitan District bonds, while a handful of California issues, including those of Roseville WestPark Community and Culver City Redevelopment Agency, lagged as well.
8
| Performance summaries | |
| Delaware Tax-Free Arizona Fund | Aug. 31, 2009 |
The performance data quoted represent past performance; past performance does not guarantee future results. Investment return and principal value will fluctuate so your shares, when redeemed, may be worth more or less than their original cost. Please obtain the performance data for the most recent month end by calling 800 523-1918 or visiting our Web site at www.delawareinvestments.com/performance. Current performance may be lower or higher than the performance data quoted.
You should consider the investment objectives, risks, charges, and expenses of the investment company carefully before investing. The Delaware Tax-Free Arizona Fund prospectus contains this and other important information about the investment company. Please request a prospectus through your financial advisor or by calling 800 523-1918 or visiting our Web site at www.delawareinvestments.com. Read the prospectus carefully before you invest or send money.
A rise or fall in interest rates can have a significant impact on bond prices and the net asset value (NAV) of the Fund. Funds that invest in bonds can lose their value as interest rates rise, and an investor can lose principal.
| Fund performance | Average annual total returns through Aug. 31, 2009 | |||||||
| 1 year | 5 years | 10 years | Lifetime | |||||
| Class A (Est. April 1, 1991) | ||||||||
| Excluding sales charge | +5.64% | +3.60% | +4.72% | +5.73% | ||||
| Including sales charge | +0.84% | +2.65% | +4.24% | +5.47% | ||||
| Class B (Est. March 10, 1995) | ||||||||
| Excluding sales charge | +4.85% | +2.83% | +4.09% | +4.71% | ||||
| Including sales charge | +0.85% | +2.57% | +4.09% | +4.71% | ||||
| Class C (Est. May 26, 1994) | ||||||||
| Excluding sales charge | +4.84% | +2.84% | +3.96% | +4.39% | ||||
| Including sales charge | +3.84% | +2.84% | +3.96% | +4.39% | ||||
Returns reflect the reinvestment of all distributions and any applicable sales charges as noted in the following paragraphs.
Performance for Class B and C shares, excluding sales charges, assumes either that contingent deferred sales charges did not apply or that the investment was not redeemed.
Expense limitations were in effect for all classes during the periods shown in the Fund performance chart and in the “Performance of a $10,000 investment” chart. The current expenses for each class are listed on the “Fund expenses” chart. (Note that all charts and graphs referred to in the “Performance summaries” section of this report are found on pages 9 through 11.) Performance would have been lower had the expense limitations not been in effect.
9
Performance summaries
Delaware Tax-Free Arizona Fund
The Fund offers Class A, B, and C shares. Class A shares are sold with a maximum front-end sales charge of up to 4.50%, and have an annual distribution and service fee of up to 0.25% of average daily net assets.
Class B shares may only be purchased through dividend reinvestment and certain permitted exchanges as described in the prospectus. Please see the prospectus for additional information on Class B purchase and sales charges. Class B shares have a contingent deferred sales charge that declines from 4.00% to zero depending on the period of time the shares are held.
Class B shares will automatically convert to Class A shares on a quarterly basis approximately eight years after purchase. They are also subject to an annual distribution and service fee of up to 1.00% of average daily net assets.
Ten-year and lifetime performance figures for Class B shares reflect conversion to Class A shares after approximately eight years.
Class C shares are sold with a contingent deferred sales charge of 1.00% if redeemed during the first 12 months. They are also subject to an annual distribution and service fee of 1.00% of average daily net assets.
The “Fund performance” table and the “Performance of a $10,000 investment” graph do not reflect the deduction of taxes the shareholder would pay on Fund distributions or redemptions of Fund shares.
Fixed income securities and bond funds can lose value, and investors can lose principal, as interest rates rise. They also may be affected by economic conditions that hinder an issuer’s ability to make interest and principal payments on its debt. High yielding, noninvestment grade bonds (junk bonds) involve higher risk than investment grade bonds.
The Fund may also be subject to prepayment risk, the risk that the principal of a fixed income security that is held by the Fund may be prepaid prior to maturity, potentially forcing the Fund to reinvest that money at a lower interest rate.
Substantially all dividend income derived from tax-free funds is exempt from federal income tax. Some income may be subject to the federal alternative minimum tax that applies to certain investors. Capital gains, if any, are taxable.
Funds that invest primarily in a specific state may be more susceptible to the economic, regulatory, and other factors of that state than funds that invest more broadly.
The Fund’s expense ratios, as described in the most recent prospectus, are disclosed in the following “Fund expense ratios” table. Delaware Investments has agreed to reimburse certain expenses and/or waive certain fees from Jan. 1, 2009, through Dec. 31, 2009. Please see the most recent prospectus for additional information on these fee waivers and/or reimbursements.
| Fund expense ratios | Class A | Class B | Class C | ||
| Total annual operating expenses | 0.91% | 1.66% | 1.66% | ||
| (without fee waivers) | |||||
| Net expenses | 0.75% | 1.50% | 1.50% | ||
| (including fee waivers, if any) | |||||
| Type of waiver | Contractual | Contractual | Contractual |
10
Performance of a $10,000 investment
Average annual total returns from Aug. 31, 1999, through Aug. 31, 2009