UNITED STATES SECURITIES AND EXCHANGE COMMISSION
Washington, D.C. 20549
FORM N-CSR
CERTIFIED SHAREHOLDER REPORT OF REGISTERED MANAGEMENT
INVESTMENT COMPANIES
INVESTMENT COMPANIES
| Investment Company Act file number: | 811-07742 | |
| Exact name of registrant as specified in charter: | Voyageur Mutual Funds | |
| Address of principal executive offices: | 2005 Market Street | |
| Philadelphia, PA 19103 | ||
| Name and address of agent for service: | David F. Connor, Esq. | |
| 2005 Market Street | ||
| Philadelphia, PA 19103 | ||
| Registrant’s telephone number, including area code: | (800) 523-1918 | |
| Date of fiscal year end: | August 31 | |
| Date of reporting period: | August 31, 2010 |
Item 1. Reports to Stockholders

Annual report Delaware Tax-Free Minnesota Fund Delaware Tax-Free Minnesota Intermediate Fund Delaware Minnesota High-Yield Municipal Bond Fund August 31, 2010 Fixed income mutual funds |
This annual report is for the information of Delaware Tax-Free Minnesota Fund, Delaware Tax-Free Minnesota Intermediate Fund, and Delaware Minnesota High-Yield Municipal Bond Fund shareholders, but it may be used with prospective investors when preceded or accompanied by a current prospectus for Delaware Tax-Free Minnesota Fund, Delaware Tax-Free Minnesota Intermediate Fund, and Delaware Minnesota High-Yield Municipal Bond Fund. The figures in the annual report for Delaware Tax-Free Minnesota Fund, Delaware Tax-Free Minnesota Intermediate Fund, and Delaware Minnesota High-Yield Municipal Bond Fund represent past results, which are not a guarantee of future results. The return and principal value of an investment in the Funds will fluctuate so that shares, when redeemed, may be worth more or less than their original cost. Current performance may be higher or lower than the performance data quoted. You should consider the investment objectives, risks, charges, and expenses of the Funds carefully before investing. The Delaware Tax-Free Minnesota Fund, Delaware Tax-Free Minnesota Intermediate Fund, and Delaware Minnesota High-Yield Municipal Bond Fund prospectus contains this and other important information about the Funds. Prospectuses for all open-end funds in the Delaware Investments® Family of Funds are available from your financial advisor, online at www.d elawareinvestments.com, or by phone at 800 523-1918. Please read the prospectus carefully before you invest or send money. |
| You can obtain shareholder reports and prospectuses online instead of in the mail. Visit www.delawareinvestments.com/edelivery. |
Experience Delaware Investments
Delaware Investments is committed to the pursuit of consistently superior asset management and unparalleled client service. We believe in our investment processes, which seek to deliver consistent results, and in convenient services that help add value for our clients.
If you are interested in learning more about creating an investment plan, contact your financial advisor.
You can learn more about Delaware Investments or obtain a prospectus for Delaware Tax-Free Minnesota Fund, Delaware Tax-Free Minnesota Intermediate Fund, and Delaware Minnesota High-Yield Municipal Bond Fund at www.delawareinvestments.com.
Manage your investments online
- 24-hour access to your account information
- Obtain share prices
- Check your account balance and recent transactions
- Request statements or literature
- Make purchases and redemptions
Delaware Management Holdings, Inc., and its subsidiaries (collectively known by the marketing name of Delaware Investments) are wholly owned subsidiaries of Macquarie Group Limited, a global provider of banking, financial, advisory, investment and funds management services.
Investments in Delaware Tax-Free Minnesota Fund, Delaware Tax-Free Minnesota Intermediate Fund, and Delaware Minnesota High-Yield Municipal Bond Fund are not and will not be deposits with or liabilities of Macquarie Bank Limited ABN 46 008 583 542 and its holding companies, including their subsidiaries or related companies (Macquarie Group), and are subject to investment risk, including possible delays in repayment and loss of income and capital invested. No Macquarie Group company guarantees or will guarantee the performance of the Funds, the repayment of capital from the Funds, or any particular rate of return.
| Table of contents | |
| Portfolio management review | 1 |
| Performance summaries | 6 |
| Disclosure of Fund expenses | 16 |
| Sector allocations | 19 |
| Statements of net assets | 22 |
| Statements of operations | 50 |
| Statements of changes in net assets | 52 |
| Financial highlights | 58 |
| Notes to financial statements | 76 |
| Report of independent registered | |
| public accounting firm | 90 |
| Other Fund information | 91 |
| Board of trustees/directors and | |
| officers addendum | 92 |
| About the organization | 102 |
Unless otherwise noted, views expressed herein are current as of August 31, 2010, and are subject to change.
Funds are not FDIC insured and are not guaranteed. It is possible to lose the principal amount invested.
Mutual fund advisory services provided by Delaware Management Company, a series of Delaware Management Business Trust, which is a registered investment advisor. Delaware Investments, a member of Macquarie Group, refers to Delaware Management Holdings, Inc. and its subsidiaries, including the Funds’ distributor, Delaware Distributors, L.P. Macquarie Group refers to Macquarie Group Limited and its subsidiaries and affiliates worldwide.
© 2010 Delaware Management Holdings, Inc.
All third-party trademarks cited are the property of their respective owners.
| Portfolio management review | |
| Delaware Minnesota Municipal Bond Funds | September 7, 2010 |
| Performance preview (for the year ended August 31, 2010) | ||||
| Delaware Tax-Free Minnesota Fund (Class A shares) | 1-year return | +8.66% | ||
| Barclays Capital Municipal Bond Index (benchmark) | 1-year return | +9.78% | ||
| Lipper Minnesota Municipal Debt Funds Average | 1-year return | +10.08% | ||
Past performance does not guarantee future results.
For complete, annualized performance for Delaware Tax-Free Minnesota Fund, please see the table on page 6.
The performance of Class A shares excludes the applicable sales charge and reflects the reinvestment of all distributions.
The Lipper Minnesota Municipal Debt Funds Average compares funds that limit assets to those securities that are exempt from taxation in Minnesota (double tax-exempt) or a city in Minnesota (triple tax-exempt).
Index performance returns do not reflect any management fees, transaction costs, or expenses. Indices are unmanaged and one cannot invest directly in an index.
| Delaware Tax-Free Minnesota Intermediate Fund (Class A shares) | 1-year return | +7.96% | ||
| Barclays Capital 3–15 Year Blend Municipal Bond Index (benchmark) | 1-year return | +8.99% | ||
| Lipper Other States Intermediate Municipal Debt Funds Average | 1-year return | +7.54% |
Past performance does not guarantee future results.
For complete, annualized performance for Delaware Tax-Free Minnesota Intermediate Fund, please see the table on page 9.
The performance of Class A shares excludes the applicable sales charge and reflects the reinvestment of all distributions.
The Lipper Other States Intermediate Municipal Debt Funds Average compares funds that invest in municipal debt issues with dollar-weighted average maturities of 5 to 10 years and are exempt from taxation on a specified city or state basis.
Index performance returns do not reflect any management fees, transaction costs, or expenses. Indices are unmanaged and one cannot invest directly in an index.
| Delaware Minnesota High-Yield Municipal Bond Fund (Class A shares) | 1-year return | +12.46% | ||
| Barclays Capital Municipal Bond Index (benchmark) | 1-year return | +9.78% | ||
| Lipper Minnesota Municipal Debt Funds Average | 1-year return | +10.08% |
Past performance does not guarantee future results.
For complete, annualized performance for Delaware Minnesota High-Yield Municipal Bond Fund, please see the table on page 12.
The performance of Class A shares excludes the applicable sales charge and reflects the reinvestment of all distributions.
The Lipper Minnesota Municipal Debt Funds Average compares funds that limit assets to those securities that are exempt from taxation in Minnesota (double tax-exempt) or a city in Minnesota (triple tax-exempt).
Index performance returns do not reflect any management fees, transaction costs, or expenses. Indices are unmanaged and one cannot invest directly in an index.
1
Portfolio management review
Delaware Minnesota Municipal Bond Funds
Delaware Minnesota Municipal Bond Funds
Economic environment
The Funds’ fiscal year, which ended Aug. 31, 2010, was one of continued economic challenges. When the period began, however, financial markets were bolstered by a broad-based sense of optimism about the economy:
- During the third quarter of 2009, the U.S. economy, as measured by gross domestic product (GDP), rose by an annualized 1.6%, marking the economy’s first quarterly expansion in more than a year.
- Growth in the fourth quarter of 2009 was even stronger. Annualized GDP expansion of 5.0% during those three months represented the fastest quarterly growth for the U.S. economy since early 2006. Source: U.S. Commerce Department.
As the reporting period progressed, however, indications began to mount that the U.S. economic environment was slowing once again. For example:
- Unemployment in the United States remained stubbornly high. The jobless rate peaked at 10.1% in October 2009 and finished the Fund’s fiscal period at a still-elevated 9.6%. (Source: U.S. Labor Department.)
- The rate of expansion in GDP decreased to 3.7% in the first three months of 2010, followed by a sluggish 1.6% in the year’s second quarter. This trend led some economists to worry about the potential for a “double-dip” recession. (Source: U.S. Commerce Department.)
- Investors focused their attention on the high levels of sovereign debt across the developed world (and particularly in Greece), fearing that reductions in government spending could exacerbate declining economic growth.
- The U.S. housing market, weighed down by significant foreclosure activity and declining sales, continued to struggle.
Encouragingly, inflation remained low throughout the reporting period, with the Consumer Price Index rising by just 1.2% for the 12 months ending July 31, 2010 (the most recent data available as this report was being prepared). With inflation well under control, the Federal Reserve Board (the Fed) kept its benchmark short-term interest rate under 1% where it has stood since the depths of the financial crisis in late 2008. The low rates were part of the Fed’s ongoing effort to stimulate economic growth — an effort that included a program announced late in the period to buy significant quantities of U.S. government debt.
Minnesota economic environment
We believe Minnesota has a fundamentally sound economy that is not dependent on any one sector. That being said, the state’s fiscal budget was not spared from the lingering effects of the national recession:
- The state’s budget deficit reached $3 billion after the Minnesota Supreme Court ruled that prior budget cuts enacted by the governor were unconstitutional. While the ruling only applied to $5.3 million in prior cuts, political and legal pressure apparently resulted in the restoration of much more funding, thus expanding the deficit. Minnesota lawmakers approved a budget compromise that closed the gap, relying primarily on delaying $1.8 billion in payments to elementary and secondary schools.
2
- Preliminary estimates of tax revenues were down 4.3% from the state’s fiscal 2009 and 12.7% from fiscal 2008. The state expects to end fiscal 2011 with a depleted General Fund balance, and is currently projecting a $5.8 billion deficit in the 2012-2013 biennium. (Data: www.bls.gov; Minnesota Management & Budget; www.twincities.com; Moody’s Investors Service.)
Broad municipal bond market environment
While the sluggish economic backdrop hampered the U.S. equity market, we believe the effect on the municipal market was relatively muted because of a favorable balance between supply and demand. Despite concerns about state and local government finances, tax-exempt bonds of all maturity lengths and credit-quality ratings gained ground throughout most of the reporting period.
Overall, investor demand for tax-exempt securities remained generally strong, driven in part by a growing expectation of higher income-tax rates in the future, while at the same time, supply of municipal bonds became increasingly limited. A major factor behind this shift between supply and demand can be attributed to the introduction of the Build America Bond program, a feature of the February 2009 federal economic stimulus package. As a result of this program, many bond issues that traditionally would have come to market as tax-exempt municipal bonds were instead issued as taxable debt. This left far fewer new issues in the traditional tax-exempt municipal bond market, providing a very positive backdrop for the municipal bond asset class and driving the Funds’ returns throughout the fiscal period. (Source: Barclays Capital.)
Although all types of municipal bonds earned positive returns during the reporting period, those with longer maturity dates and lower credit ratings generally outperformed their shorter-maturity and higher-rated counterparts by a wide margin, as investors tended to favor longer-dated securities — despite their higher interest rate risk — for the potential to earn more income.
A similar situation occurred with regard to credit quality. Many investors increasingly exhibited a willingness to buy higher-yielding bonds, even if it meant taking on more credit risk.
Commitment to our longtime approach
In all three Funds profiled in this report, we continued to follow our basic investment philosophy and approach. We believe successful bond investing requires rigorous credit analysis. In our opinion, there is no substitute for thorough credit research. On a bond-by-bond basis, we scrutinize each security the Funds hold — or might consider holding. It is important to us to ensure our comfort level with a bond issue’s financial outlook and to feel confident that any potential risks are likely offset by the income the security provides. Through this strategy, we believe we can find opportunities that other investors with less experience and research diligence might overlook.
Our investment approach often leads us to an increased focus on bonds with credit ratings of BBB and A — which represent the lower tier of the investment grade bond universe — and a relative de-emphasis of higher-rated bonds, such as those rated AAA and AA. We generally feel that there tends to be an opportunity for us to obtain the most value for shareholders from the lower-rated types of investment grade municipal bonds.
3
Portfolio management review
Delaware Minnesota Municipal Bond Funds
Delaware Minnesota Municipal Bond Funds
As the Funds’ fiscal year progressed, our tactics for managing the Funds became more selective as credit spreads narrowed — meaning that the premium paid to investors for buying riskier, lower-rated bonds declined — and bond prices rose. As these trends continued and interest rates on municipal bonds fell during the period, many of the bonds the Funds already held offered considerably higher levels of income than bonds that became available during the reporting period. For example, the Funds had purchased a number of bonds at the peak of the financial crisis, when tax-exempt municipal bond yields were extremely high because of investors’ concerns about the solvency of bond issuers. Careful research allowed us to eventually get comfortable with the credit quality of these issues. As a result, we were able to add some highly rated municipal bonds paying yields that, at the end of the Funds’ fiscal year, were com parable to what lower-rated A and even some BBB securities were offering.
Because bonds in the marketplace were paying the lower prevailing yields, we felt it was important to look at potential new purchases with an even more discerning eye. It often made little sense to us to sell higher-yielding bonds already in a Fund’s portfolio holdings in favor of new bonds reflecting the lower-interest-rate environment. We often said throughout 2010 that new bonds had to “fight their way into the portfolio.” In other words, we had to feel confident that new bonds offered sufficient value opportunities relative to their potential risks.
When we did add new securities to the Funds’ portfolio holdings as a result of Fund inflows (to accommodate cash generated by maturing bonds, for instance) we continued to follow our “bottom-up” investment strategy, carefully evaluating each issuer to become familiar with its financial position and to assess whether the bond’s return potential was commensurate with the risks involved with holding the securities.
Notable sectors and securities
As mentioned above, lower-rated bonds generally outperformed higher-rated issues throughout the majority of the Funds’ fiscal year. As a result, many of the individual bonds that made the strongest performance contributions across all three Funds were lower-rated issues. The best-performing sectors were often those with a significant amount of lower-rated bond issuance.
In a favorable market environment for tax-exempt debt, even the weakest performers tended to earn modestly positive returns during the reporting period. Generally speaking, the bonds that lagged the overall municipal market on a total return basis were those with higher credit ratings (meaning less credit risk) and shorter maturities (meaning less interest rate risk). With interest rates declining, municipal bond investors looked for ways to capture additional levels of income, leading them toward lower-rated, longer-dated bonds and away from higher-rated, shorter-maturity credits.
In Delaware Tax-Free Minnesota Fund and Delaware Minnesota High-Yield Municipal Bond Fund, the best-performing group was industrial development revenue bonds, a sector that featured a number of securities benefiting from their lower credit ratings and relatively higher yields. Typically, much of the tax-exempt bond issuance that comes to market in Minnesota is of high credit quality,
4
so the relative scarcity of lower-rated, higher-yielding bonds helped boost these securities’ performance in a time of strong demand.
In fact, the best individual performer in Delaware Tax-Free Minnesota Fund and Delaware Minnesota High-Yield Municipal Bond Fund during the reporting period was a Cloquet, Minnesota, Pollution Control Revenue bond whose interest payments were backed by forest-products company Potlatch Corporation. As many investors apparently became more optimistic about Potlatch’s finances, this lower-rated bond performed well. Another strong portfolio holding in Delaware Minnesota High-Yield Municipal Bond Fund was a Hutchinson, Minnesota, multifamily housing bond. This nonrated bond was supported by the favorable market conditions for riskier, higher-yielding debt.
Delaware Tax-Free Minnesota Fund also saw strong results from its holdings in nonrated continuing care retirement community (CCRC) bonds issued for Apple Valley, Minnesota. CCRCs are residential communities for seniors, ranging from independent-living to skilled-nursing-care facilities. This Minnesota CCRC is an established community with strong occupancy that has done reasonably well from a financial perspective.
Meanwhile, the top-performing sector in Delaware Tax-Free Minnesota Intermediate Fund was hospital bonds, which make up a sizeable portion of the marketplace for tax-exempt debt. The Fund’s leading contributors included a revenue bond issue for Glencoe Regional Health Services, which benefited from its presence in a sector that excelled during the Funds’ fiscal period. In addition, its BBB credit rating (lower medium grade) was a positive in an environment favoring lower-rated securities.
The best-performing security overall in Delaware Tax-Free Minnesota Intermediate Fund was a Puerto Rico sales-tax bond. Bonds issued by U.S. territories are generally fully tax-exempt for residents of all 50 states. Particularly in a state such as Minnesota, with reasonably homogenous bond issuance, we feel that investing in Puerto Rico debt provides a good opportunity to help diversify the Fund’s portfolio. We were attracted to the relatively high yields offered by this bond and generally felt confident about the territory’s financial situation.
As mentioned above, even the weakest-performing bonds in all three Funds posted modestly positive results — an indication of the favorable market conditions witnessed by municipal bond investors during the Funds’ fiscal year. The sector making the smallest performance contribution within the Funds was prerefunded bonds. These bonds have very short maturities, and because they are typically backed by U.S. Treasury bonds (or other high-quality securities), they are considered high in credit quality. In an environment in which investors preferred lower-quality to higher-quality bonds, and longer-dated to shorter-dated issues, prerefunded bonds were somewhat left behind.
In Delaware Tax-Free Minnesota Fund, the weakest contributor to overall total return included prerefunded Chaska, Minnesota, electric revenue bonds due in 2025. Within Delaware Tax-Free Minnesota Intermediate Fund, the weakest contributor to overall return included a Minneapolis / St. Paul airport bond due in January 2020, while Minnesota Community Development Authority bonds coming due in December 2031 brought up the rear in Delaware Minnesota High-Yield Municipal Bond Fund.
5
| Performance summaries | |
| Delaware Tax-Free Minnesota Fund | August 31, 2010 |
The performance data quoted represent past performance; past performance does not guarantee future results. Investment return and principal value will fluctuate so your shares, when redeemed, may be worth more or less than their original cost. Please obtain the performance data current for the most recent month end by calling 800 523-1918 or visiting our Web site at www.delawareinvestments.com/performance. Current performance may be lower or higher than the performance data quoted.
You should consider the investment objectives, risks, charges, and expenses of the investment company carefully before investing. The Delaware Tax-Free Minnesota Fund prospectus contains this and other important information about the investment company. Please request a prospectus through your financial advisor or by calling 800 523-1918 or visiting our Web site at www.delawareinvestments.com. Read the prospectus carefully before you invest or send money.
| Fund performance | Average annual total returns through Aug. 31, 2010 | |||||
| 1 year | 5 years | 10 years | ||||
| Class A (Est. Feb. 27, 1984) | ||||||
| Excluding sales charge | +8.66% | +4.34% | +5.37% | |||
| Including sales charge | +3.80% | +3.38% | +4.89% | |||
| Class B (Est. March 11, 1995) | ||||||
| Excluding sales charge | +7.85% | +3.56% | +4.74% | |||
| Including sales charge | +3.85% | +3.29% | +4.74% | |||
| Class C (Est. May 4, 1994) | ||||||
| Excluding sales charge | +7.91% | +3.58% | +4.60% | |||
| Including sales charge | +6.91% | +3.58% | +4.60% | |||
Returns reflect the reinvestment of all distributions and any applicable sales charges as noted in the following paragraphs.
Performance for Class B and C shares, excluding sales charges, assumes either that contingent deferred sales charges did not apply or that the investment was not redeemed.
Expense limitations were in effect for certain classes during the periods shown in the “Fund performance” chart and in the “Performance of a $10,000 investment” chart. The current expenses for each class are listed on the “Fund expense ratios” chart. (Note that all charts and graphs referred to in the “Performance summary” section of this report are found on pages 6 through 8.) Performance would have been lower had the expense limitations not been in effect.
The Fund offers Class A, B, and C shares.
Class A shares are sold with a maximum front-end sales charge of up to 4.50%, and have an annual distribution and service fee of up to 0.25% of average daily net assets.
Class B shares may be purchased only through dividend reinvestment and certain permitted exchanges as described in the prospectus. Please see the prospectus for additional information on Class B purchase and sales charges. Class B shares have a contingent deferred sales charge that declines from 4.00% to zero depending on the period of time the shares are held.
6
Class B shares will automatically convert to Class A shares on a quarterly basis approximately eight years after purchase. They are also subject to an annual distribution and service fee of up to 1.00% of average daily net assets.
Ten-year performance figures for Class B shares reflect conversion to Class A shares after approximately eight years.
Class C shares are sold with a contingent deferred sales charge of 1.00% if redeemed during the first 12 months. They are also subject to an annual distribution and service fee of up to 1.00% of average daily net assets.
The “Fund performance” table and the “Performance of a $10,000 investment” graph do not reflect the deduction of taxes the shareholder would pay on Fund distributions or redemptions of Fund shares.
Fixed income securities and bond funds can lose value, and investors can lose principal, as interest rates rise. They also may be affected by economic conditions that hinder an issuer’s ability to make interest and principal payments on its debt.
The Fund may also be subject to prepayment risk, the risk that the principal of a fixed income security that is held by the Fund may be prepaid prior to maturity, potentially forcing the Fund to reinvest that money at a lower interest rate.
High yielding, noninvestment grade bonds (junk bonds) involve higher risk than investment grade bonds.
Substantially all dividend income derived from tax-free funds is exempt from federal income tax. Some income may be subject to the federal alternative minimum tax (AMT) that applies to certain investors. Capital gains, if any, are taxable.
Funds that invest primarily in one state may be more susceptible to the economic, regulatory, and other factors of that state than funds that invest more broadly.
The Fund’s expense ratios, as described in the most recent prospectus, are disclosed in the following “Fund expense ratios” chart.
| Fund expense ratios | Class A | Class B | Class C | |||||||||
| Total annual operating expenses | 0.95% | 1.70% | 1.70% | |||||||||
| (without fee waivers) | ||||||||||||
| Net expenses | 0.95% | 1.70% | 1.70% | |||||||||
| (including fee waivers, if any) | ||||||||||||
| Type of waiver | n/a | n/a | n/a | |||||||||
7
Performance summaries
Delaware Tax-Free Minnesota Fund
Delaware Tax-Free Minnesota Fund
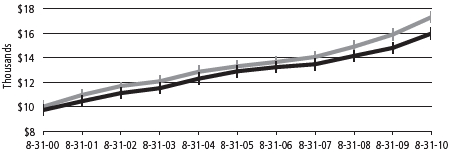
Performance of a $10,000 investment
Average annual total returns from Aug. 31, 2000, through Aug. 31, 2010
Average annual total returns from Aug. 31, 2000, through Aug. 31, 2010
| For period beginning Aug. 31, 2000, through Aug. 31, 2010 | Starting value | Ending value | ||
| Barclays Capital Municipal Bond Index | $10,000 | $17,400 | ||
| Delaware Tax-Free Minnesota Fund — Class A Shares | $9,550 | $16,105 | ||
The chart assumes $10,000 invested in the Fund on Aug. 31, 2000, and includes the effect of a 4.50% front-end sales charge and the reinvestment of all distributions. Please note additional details on these fees in the “Performance summary” section of this report, which includes pages 6 through 8.
The chart also assumes $10,000 invested in the Barclays Capital Municipal Bond Index as of Aug. 31, 2000.
The Barclays Capital Municipal Bond Index measures the total return performance of the long-term, investment grade tax-exempt bond market.
Index performance returns do not reflect any management fees, transaction costs or expenses. Indices are unmanaged and one cannot invest directly in an index. Past performance is not a guarantee of future results.
Performance of other Fund classes will vary due to different charges and expenses.
The “Fund performance” chart and the “Performance of a $10,000 investment” graph do not reflect the deduction of taxes shareholders would pay on Fund distributions or redemptions of Fund shares.
| Nasdaq symbols | CUSIPs | ||||
| Class A | DEFFX | 928918101 | |||
| Class B | DMOBX | 928928696 | |||
| Class C | DMOCX | 928918408 |
8
| Delaware Tax-Free Minnesota Intermediate Fund | August 31, 2010 |
The performance data quoted represent past performance; past performance does not guarantee future results. Investment return and principal value will fluctuate so your shares, when redeemed, may be worth more or less than their original cost. Please obtain the performance data current for the most recent month end by calling 800 523-1918 or visiting our Web site at www.delawareinvestments.com/performance. Current performance may be lower or higher than the performance data quoted.
You should consider the investment objectives, risks, charges, and expenses of the investment company carefully before investing. The Delaware Tax-Free Minnesota Intermediate Fund prospectus contains this and other important information about the investment company. Please request a prospectus through your financial advisor or by calling 800 523-1918 or visiting our Web site at www.delawareinvestments.com. Read the prospectus carefully before you invest or send money.
| Fund performance | Average annual total returns through Aug. 31, 2010 | ||||||
| 1 year | 5 years | 10 years | |||||
| Class A (Est. Oct. 27, 1985) | |||||||
| Excluding sales charge | +7.96% | +4.39% | +5.10% | ||||
| Including sales charge | +4.95% | +3.81% | +4.81% | ||||
| Class B (Est. Aug. 15, 1995) | |||||||
| Excluding sales charge | +7.14% | +3.52% | +4.65% | ||||
| Including sales charge | +5.14% | +3.52% | +4.65% | ||||
| Class C (Est. May 4, 1994) | |||||||
| Excluding sales charge | +7.14% | +3.52% | +4.22% | ||||
| Including sales charge | +6.14% | +3.52% | +4.22% | ||||
Returns reflect the reinvestment of all distributions and any applicable sales charges as noted in the following paragraphs.
Performance for Class B and C shares, excluding sales charges, assumes either that contingent deferred sales charges did not apply or that the investment was not redeemed.
Expense limitations were in effect for certain classes during the periods shown in the “Fund performance” chart and in the “Performance of a $10,000 investment” chart. The current expenses for each class are listed on the “Fund expense ratios” chart. (Note that all charts and graphs referred to in the “Performance summary” section of this report are found on pages 9 through 11.) Performance would have been lower had the expense limitations not been in effect.
The Fund offers Class A, B, and C shares.
Class A shares are sold with a maximum front-end sales charge of up to 2.75%, and have an annual distribution and service fee of up to 0.25% of average daily net assets. This fee has been contractually limited to 0.15% of average daily net assets from Jan. 1, 2010, through Dec. 31, 2010.
Class B shares may be purchased only through dividend reinvestment and certain permitted exchanges as described in the prospectus. Please see the prospectus for additional
9
Performance summaries
Delaware Tax-Free Minnesota Intermediate Fund
Delaware Tax-Free Minnesota Intermediate Fund
information on Class B purchase and sales charges. Class B shares have a contingent deferred sales charge that declines from 2.00% to zero depending on the period of time the shares are held.
Class B shares will automatically convert to Class A shares on a quarterly basis approximately five years after purchase. They are also subject to an annual distribution and service fee of up to 1.00% of average daily net assets.
Ten-year performance figures for Class B shares reflect conversion to Class A shares after approximately five years.
Class C shares are sold with a contingent deferred sales charge of 1.00% if redeemed during the first 12 months. They are also subject to an annual distribution and service fee of up to 1.00% of average daily net assets.
The “Fund performance” table and the “Performance of a $10,000 investment” graph do not reflect the deduction of taxes the shareholder would pay on Fund distributions or redemptions of Fund shares.
Fixed income securities and bond funds can lose value, and investors can lose principal, as interest rates rise. They also may be affected by economic conditions that hinder an issuer’s ability to make interest and principal payments on its debt.
The Fund may also be subject to prepayment risk, the risk that the principal of a fixed income security that is held by the Fund may be prepaid prior to maturity, potentially forcing the Fund to reinvest that money at a lower interest rate.
High yielding, noninvestment grade bonds (junk bonds) involve higher risk than investment grade bonds.
Substantially all dividend income derived from tax-free funds is exempt from federal income tax. Some income may be subject to the federal alternative minimum tax (AMT) that applies to certain investors. Capital gains, if any, are taxable.
Funds that invest primarily in one state may be more susceptible to the economic, regulatory, and other factors of that state than funds that invest more broadly.
The Fund’s expense ratios, as described in the most recent prospectus, are disclosed in the following “Fund expense ratios” chart. Delaware Investments has agreed to reimburse certain expenses and/or waive certain fees from Jan. 1, 2010, through Dec. 31, 2010. Please see the most recent prospectus and any applicable supplement(s) for additional information on these fee waivers and/or reimbursements.
| Fund expense ratios | Class A | Class B | Class C | |||
| Total annual operating expenses | 0.97% | 1.72% | 1.72% | |||
| (without fee waivers) | ||||||
| Net expenses | 0.87% | 1.72% | 1.72% | |||
| (including fee waivers, if any) | ||||||
| Type of waiver | Contractual | n/a | n/a |
10
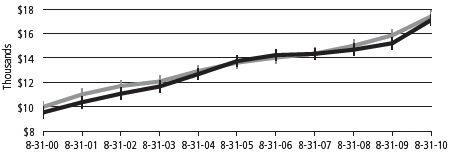
Performance of a $10,000 investment
Average annual total returns from Aug. 31, 2000, through Aug. 31, 2010
| For period beginning Aug. 31, 2000, through Aug. 31, 2010 | Starting value | Ending value | ||
| Barclays Capital 3–15 Year Blend Municipal Bond Index | $10,000 | $17,312 | ||
| Delaware Tax-Free Minnesota Intermediate Fund — Class A Shares | $9,725 | $15,973 | ||
The chart assumes $10,000 invested in the Fund on Aug. 31, 2000, and includes the effect of a 2.75% front-end sales charge and the reinvestment of all distributions. Please note additional details on these fees in the “Performance summary” section of this report, which includes pages 9 through 11.
The chart also assumes $10,000 invested in the Barclays Capital 3–15 Year Blend Municipal Bond Index as of Aug. 31, 2000.
The Barclays Capital 3–15 Year Blend Municipal Bond Index, sometimes also referred to as the Barclays Capital 3–15 Year Municipal Bond Index, measures the total return performance of investment grade, U.S. tax-exempt bonds with maturities from 2 to 17 years.
Index performance returns do not reflect any management fees, transaction costs or expenses. Indices are unmanaged and one cannot invest directly in an index. Past performance is not a guarantee of future results.
Performance of other Fund classes will vary due to different charges and expenses.
The “Fund performance” chart and the “Performance of a $10,000 investment” graph do not reflect the deduction of taxes shareholders would pay on Fund distributions or redemptions of Fund shares.
| Nasdaq symbols | CUSIPs | ||||
| Class A | DXCCX | 928930106 | |||
| Class B | DVSBX | 928928399 | |||
| Class C | DVSCX | 928930205 |
11
| Performance summaries | |
| Delaware Minnesota High-Yield Municipal Bond Fund | August 31, 2010 |
The performance data quoted represent past performance; past performance does not guarantee future results. Investment return and principal value will fluctuate so your shares, when redeemed, may be worth more or less than their original cost. Please obtain the performance data current for the most recent month end by calling 800 523-1918 or visiting our Web site at www.delawareinvestments.com/performance. Current performance may be lower or higher than the performance data quoted.
You should consider the investment objectives, risks, charges, and expenses of the investment company carefully before investing. The Delaware Minnesota High-Yield Municipal Bond Fund prospectus contains this and other important information about the investment company. Please request a prospectus through your financial advisor or by calling 800 523-1918 or visiting our Web site at www.delawareinvestments.com. Read the prospectus carefully before you invest or send money.
| Fund performance | Average annual total returns through Aug. 31, 2010 | ||||||
| 1 year | 5 years | 10 years | |||||
| Class A (Est. June 4, 1996) | |||||||
| Excluding sales charge | +12.46% | +4.46% | +6.01% | ||||
| Including sales charge | +7.37% | +3.50% | +5.53% | ||||
| Class B (Est. June 12, 1996) | |||||||
| Excluding sales charge | +11.62% | +3.66% | +5.37% | ||||
| Including sales charge | +7.62% | +3.40% | +5.37% | ||||
| Class C (Est. June 7, 1996) | |||||||
| Excluding sales charge | +11.61% | +3.68% | +5.23% | ||||
| Including sales charge | +10.61% | +3.68% | +5.23% | ||||
Returns reflect the reinvestment of all distributions and any applicable sales charges as noted in the following paragraphs.
Performance for Class B and C shares, excluding sales charges, assumes either that contingent deferred sales charges did not apply or that the investment was not redeemed.
Expense limitations were in effect for certain classes during the periods shown in the “Fund performance” chart and in the “Performance of a $10,000 investment” chart. The current expenses for each class are listed on the “Fund expense ratios” chart. (Note that all charts and graphs referred to in the “Performance summary” section of this report are found on pages 12 through 14.) Performance would have been lower had the expense limitations not been in effect.
The Fund offers Class A, B, and C shares.
Class A shares are sold with a maximum front-end sales charge of up to 4.50%, and have an annual distribution and service fee of up to 0.25% of average daily net assets.
Class B shares may be purchased only through dividend reinvestment and certain permitted exchanges as described in the prospectus. Please see the prospectus for additional information on Class B purchase and sales charges. Class B shares have a contingent deferred sales charge that declines from 4.00%
12
to zero depending on the period of time the shares are held.
Class B shares will automatically convert to Class A shares on a quarterly basis approximately eight years after purchase. They are also subject to an annual distribution and service fee of up to 1.00% of average daily net assets.
Ten-year performance figures for Class B shares reflect conversion to Class A shares after approximately eight years.
Class C shares are sold with a contingent deferred sales charge of 1.00% if redeemed during the first 12 months. They are also subject to an annual distribution and service fee of up to 1.00% of average daily net assets.
The “Fund performance” table and the “Performance of a $10,000 investment” graph do not reflect the deduction of taxes the shareholder would pay on Fund distributions or redemptions of Fund shares.
Fixed income securities and bond funds can lose value, and investors can lose principal, as interest rates rise. They also may be affected by economic conditions that hinder an issuer’s ability to make interest and principal payments on its debt.
The Fund may also be subject to prepayment risk, the risk that the principal of a fixed income security that is held by the Fund may be prepaid prior to maturity, potentially forcing the Fund to reinvest that money at a lower interest rate.
High yielding, noninvestment grade bonds (junk bonds) involve higher risk than investment grade bonds.
The Fund may invest in derivatives, which may involve additional expenses and are subject to risk, including the risk that an underlying security or securities index moves in the opposite direction from what the portfolio manager anticipated. A derivative transaction depends upon the counterparties’ ability to fulfill their contractual obligations.
Substantially all dividend income derived from tax-free funds is exempt from federal income tax. Some income may be subject to the federal alternative minimum tax (AMT) that applies to certain investors. Capital gains, if any, are taxable.
Funds that invest primarily in one state may be more susceptible to the economic, regulatory, and other factors of that state than funds that invest more broadly.
The Fund’s expense ratios, as described in the most recent prospectus, are disclosed in the following “Fund expense ratios” chart. Delaware Investments has voluntarily agreed to reimburse certain expenses and/or waive certain fees in order to prevent total fund operating expenses from exceeding 0.70% of the Fund’s average daily net assets. Please see the most recent prospectus and any applicable supplement(s) for additional information on these fee waivers and/or reimbursements.
| Fund expense ratios | Class A | Class B | Class C | ||||
| Total annual operating expenses | 0.97% | 1.72% | 1.72% | ||||
| (without fee waivers) | |||||||
| Net expenses | 0.95% | 1.70% | 1.70% | ||||
| (including fee waivers, if any) | |||||||
| Type of waiver | Voluntary | Voluntary | Voluntary |
13
Performance summaries
Delaware Minnesota High-Yield Municipal Bond Fund
Delaware Minnesota High-Yield Municipal Bond Fund
Performance of a $10,000 investment
Average annual total returns from Aug. 31, 2000, through Aug. 31, 2010
| For period beginning Aug. 31, 2000, through Aug. 31, 2010 | Starting value | Ending value | ||
| Barclays Capital Municipal Bond Index | $10,000 | $17,400 | ||
| Delaware Minnesota High-Yield Municipal Bond Fund — Class A Shares | $9,550 | $17,102 | ||
The chart assumes $10,000 invested in the Fund on Aug. 31, 2000, and includes the effect of a 4.50% front-end sales charge and the reinvestment of all distributions. Please note additional details on these fees in the “Performance summary” section of this report, which includes pages 12 through 14.
The chart also assumes $10,000 invested in the Barclays Capital Municipal Bond Index as of Aug. 31, 2000.
The Barclays Capital Municipal Bond Index measures the total return performance of the long-term, investment grade tax-exempt bond market.
Index performance returns do not reflect any management fees, transaction costs or expenses. Indices are unmanaged and one cannot invest directly in an index. Past performance is not a guarantee of future results.
Performance of other Fund classes will vary due to different charges and expenses.
The “Fund performance” chart and the “Performance of a $10,000 investment” graph do not reflect the deduction of taxes shareholders would pay on Fund distributions or redemptions of Fund shares.
| Nasdaq symbols | CUSIPs | ||||
| Class A | DVMHX | 928928316 | |||
| Class B | DVMYX | 928928290 | |||
| Class C | DVMMX | 928928282 |
14
Disclosure of Fund expenses
For the six-month period March 1, 2010 to August 31, 2010
For the six-month period March 1, 2010 to August 31, 2010
As a shareholder of a Fund, you incur two types of costs: (1) transaction costs, including sales charges (loads) on purchase payments, reinvested dividends, or other distributions; redemption fees; and exchange fees; and (2) ongoing costs, including management fees; distribution and/or service (12b-1) fees; and other Fund expenses. These following examples are intended to help you understand your ongoing costs (in dollars) of investing in a Fund and to compare these costs with the ongoing costs of investing in other mutual funds.
The examples are based on an investment of $1,000 invested at the beginning of the period and held for the entire six-month period from March 1, 2010 to August 31, 2010.
Actual expenses
The first section of the tables shown, “Actual Fund return,” provides information about actual account values and actual expenses. You may use the information in this section of the table, together with the amount you invested, to estimate the expenses that you paid over the period. Simply divide your account value by $1,000 (for example, an $8,600 account value divided by $1,000 = 8.6), then multiply the result by the number in the first section under the heading entitled “Expenses Paid During Period” to estimate the expenses you paid on your account during this period.
Hypothetical example for comparison purposes
The second section of the tables shown, “Hypothetical 5% return,” provides information about hypothetical account values and hypothetical expenses based on the Funds’ actual expense ratios and an assumed rate of return of 5% per year before expenses, which is not the Funds’ actual return. The hypothetical account values and expenses may not be used to estimate the actual ending account balance or expenses you paid for the period. You may use this information to compare the ongoing costs of investing in the Funds and other funds. To do so, compare this 5% hypothetical example with the 5% hypothetical examples that appear in the shareholder reports of the other funds.
Please note that the expenses shown in the tables are meant to highlight your ongoing costs only and do not reflect any transactional costs, such as sales charges (loads), redemption fees, or exchange fees. Therefore, the second section of each table is useful in comparing ongoing costs only, and will not help you determine the relative total costs of owning different funds. In addition, if these transactional costs were included, your costs, would have been higher. The Funds’ expenses shown in the tables reflect fee waivers in effect. The expenses shown in each table assume reinvestment of all dividends and distributions.
16
Delaware Tax-Free Minnesota Fund
Expense analysis of an investment of $1,000
Expense analysis of an investment of $1,000
| Beginning | Ending | Expenses | ||||||
| Account Value | Account Value | Annualized | Paid During Period | |||||
| 3/1/10 | 8/31/10 | Expense Ratio | 3/1/10 to 8/31/10* | |||||
| Actual Fund return | ||||||||
| Class A | $1,000.00 | $1,043.70 | 0.93% | $4.79 | ||||
| Class B | 1,000.00 | 1,039.80 | 1.68% | 8.64 | ||||
| Class C | 1,000.00 | 1,040.50 | 1.68% | 8.64 | ||||
| Hypothetical 5% return (5% return before expenses) | ||||||||
| Class A | $1,000.00 | $1,020.52 | 0.93% | $4.74 | ||||
| Class B | 1,000.00 | 1,016.74 | 1.68% | 8.54 | ||||
| Class C | 1,000.00 | 1,016.74 | 1.68% | 8.54 | ||||
Delaware Tax-Free Minnesota Intermediate Fund
Expense analysis of an investment of $1,000
Expense analysis of an investment of $1,000
| Beginning | Ending | Expenses | ||||||
| Account Value | Account Value | Annualized | Paid During Period | |||||
| 3/1/10 | 8/31/10 | Expense Ratio | 3/1/10 to 8/31/10* | |||||
| Actual Fund return | ||||||||
| Class A | $1,000.00 | $1,044.30 | 0.85% | $4.38 | ||||
| Class B | 1,000.00 | 1,040.70 | 1.70% | 8.74 | ||||
| Class C | 1,000.00 | 1,040.70 | 1.70% | 8.74 | ||||
| Hypothetical 5% return (5% return before expenses) | ||||||||
| Class A | $1,000.00 | $1,020.92 | 0.85% | $4.33 | ||||
| Class B | 1,000.00 | 1,016.64 | 1.70% | 8.64 | ||||
| Class C | 1,000.00 | 1,016.64 | 1.70% | 8.64 | ||||
17
Disclosure of Fund expenses
Delaware Minnesota High-Yield Municipal Bond Fund
Expense analysis of an investment of $1,000
Expense analysis of an investment of $1,000
| Beginning | Ending | Expenses | ||||||
| Account Value | Account Value | Annualized | Paid During Period | |||||
| 3/1/10 | 8/31/10 | Expense Ratio | 3/1/10 to 8/31/10* | |||||
| Actual Fund return | ||||||||
| Class A | $1,000.00 | $1,057.60 | 0.95% | $4.93 | ||||
| Class B | 1,000.00 | 1,052.60 | 1.70% | 8.80 | ||||
| Class C | 1,000.00 | 1,053.60 | 1.70% | 8.80 | ||||
| Hypothetical 5% return (5% return before expenses) | ||||||||
| Class A | $1,000.00 | $1,020.42 | 0.95% | $4.84 | ||||
| Class B | 1,000.00 | 1,016.64 | 1.70% | 8.64 | ||||
| Class C | 1,000.00 | 1,016.64 | 1.70% | 8.64 | ||||
| * | “Expenses Paid During Period” are equal to the Funds’ annualized expense ratio, multiplied by the average account value over the period, multiplied by 184/365 (to reflect the one-half year period). |
18
| Sector allocations | |
| Delaware Tax-Free Minnesota Fund | As of August 31, 2010 |
Sector designations may be different than the sector designations presented in other Fund materials.
| Sector | Percentage of net assets | |||
| Municipal Bonds | 100.25% | |||
| Corporate-Backed Revenue Bonds | 4.17% | |||
| Education Revenue Bonds | 6.99% | |||
| Electric Revenue Bonds | 5.52% | |||
| Healthcare Revenue Bonds | 24.50% | |||
| Housing Revenue Bonds | 6.96% | |||
| Lease Revenue Bonds | 3.22% | |||
| Local General Obligation Bonds | 18.22% | |||
| Pre-Refunded/Escrowed to Maturity Bonds | 23.67% | |||
| Special Tax Revenue Bonds | 1.75% | |||
| State General Obligation Bonds | 3.01% | |||
| Transportation Revenue Bonds | 1.87% | |||
| Water & Sewer Revenue Bonds | 0.37% | |||
| Short-Term Investment | 0.11% | |||
| Total Value of Securities | 100.36% | |||
| Liabilities Net of Receivables and Other Assets | (0.36%) | |||
| Total Net Assets | 100.00% | |||
19
| Sector allocations | |
| Delaware Tax-Free Minnesota Intermediate Fund | As of August 31, 2010 |
Sector designations may be different than the sector designations presented in other Fund materials.
| Sector | Percentage of net assets | |
| Municipal Bonds | 98.82% | |
| Corporate-Backed Revenue Bonds | 1.48% | |
| Education Revenue Bonds | 10.66% | |
| Electric Revenue Bonds | 7.61% | |
| Healthcare Revenue Bonds | 21.83% | |
| Housing Revenue Bonds | 3.58% | |
| Lease Revenue Bonds | 2.71% | |
| Local General Obligation Bonds | 25.27% | |
| Pre-Refunded/Escrowed to Maturity Bonds | 9.01% | |
| Special Tax Revenue Bonds | 6.60% | |
| State General Obligation Bonds | 3.76% | |
| Transportation Revenue Bonds | 3.39% | |
| Water & Sewer Revenue Bonds | 2.92% | |
| Short-Term Investments | 0.61% | |
| Total Value of Securities | 99.43% | |
| Receivables and Other Assets Net of Liabilities | 0.57% | |
| Total Net Assets | 100.00% | |
20
| Delaware Minnesota High-Yield Municipal Bond Fund | As of August 31, 2010 |
Sector designations may be different than the sector designations presented in other Fund materials.
| Sector | Percentage of net assets | |
| Municipal Bonds | 98.45% | |
| Corporate-Backed Revenue Bonds | 4.22% | |
| Education Revenue Bonds | 7.58% | |
| Electric Revenue Bonds | 7.08% | |
| Healthcare Revenue Bonds | 33.87% | |
| Housing Revenue Bonds | 11.25% | |
| Lease Revenue Bonds | 2.76% | |
| Local General Obligation Bonds | 11.21% | |
| Pre-Refunded/Escrowed to Maturity Bonds | 7.23% | |
| Special Tax Revenue Bonds | 7.69% | |
| State General Obligation Bonds | 1.64% | |
| Transportation Revenue Bond | 1.34% | |
| Water & Sewer Revenue Bonds | 2.58% | |
| Short-Term Investments | 0.60% | |
| Total Value of Securities | 99.05% | |
| Receivables and Other Assets Net of Liabilities | 0.95% | |
| Total Net Assets | 100.00% | |
21
| Statements of net assets | ||
| Delaware Tax-Free Minnesota Fund | August 31, 2010 | |
| Principal amount | Value | |||||
| Municipal Bonds – 100.25% | ||||||
| Corporate-Backed Revenue Bonds – 4.17% | ||||||
| Cloquet Pollution Control Revenue Refunding | ||||||
| (Potlatch Project) 5.90% 10/1/26 | $ | 6,500,000 | $ | 6,364,280 | ||
| Laurentian Energy Authority I Cogeneration Revenue | ||||||
| Series A 5.00% 12/1/21 | 8,000,000 | 8,233,600 | ||||
| Sartell Environmental Improvement Revenue Refunding | ||||||
| (International Paper) Series A 5.20% 6/1/27 | 7,265,000 | 7,295,731 | ||||
| Seaway Port Authority of Duluth Industrial | ||||||
| Development Dock & Wharf Revenues Refunding | ||||||
| (Cargill Project) Series E 6.125% 11/1/14 | 4,500,000 | 4,520,205 | ||||
| 26,413,816 | ||||||
| Education Revenue Bonds – 6.99% | ||||||
| Minnesota Colleges & Universities Revenue Fund Series A | ||||||
| 5.00% 10/1/22 (AGM) | 5,135,000 | 5,500,047 | ||||
| 5.00% 10/1/28 | 8,900,000 | 10,015,971 | ||||
| 5.00% 10/1/29 (NATL-RE) | 5,665,000 | 6,110,779 | ||||
| Minnesota Higher Education Facilities Authority Revenue | ||||||
| (Augsburg College) | ||||||
| Series 6-C 5.00% 5/1/20 | 1,250,000 | 1,298,225 | ||||
| Series 6-J1 5.00% 5/1/36 | 2,225,000 | 2,239,574 | ||||
| (Bethel University) Series 6-R 5.50% 5/1/37 | 2,500,000 | 2,517,800 | ||||
| (Carleton College) | ||||||
| Series 6-T 5.00% 1/1/28 | 1,000,000 | 1,115,050 | ||||
| Series 7-D 5.00% 3/1/40 | 3,000,000 | 3,251,490 | ||||
| St. Olaf College Series 7-F 4.50% 10/1/30 | 2,000,000 | 2,077,020 | ||||
| (University of St. Thomas) | ||||||
| Series 6-X 5.25% 4/1/39 | 5,000,000 | 5,291,700 | ||||
| Series 7-A 5.00% 10/1/39 | 2,000,000 | 2,114,300 | ||||
| St. Cloud Housing & Redevelopment Authority Revenue | ||||||
| (State University Foundation Project) 5.00% 5/1/23 | 2,000,000 | 2,109,900 | ||||
| University of Minnesota Series C 4.00% 2/1/16 | 515,000 | 585,184 | ||||
| 44,227,040 | ||||||
| Electric Revenue Bonds – 5.52% | ||||||
| Chaska Electric Revenue Refunding | ||||||
| (Generating Facilities) Series A 5.00% 10/1/30 | 3,000,000 | 3,133,860 | ||||
| Minnesota Municipal Power Agency Electric Revenue | ||||||
| 5.00% 10/1/35 | 3,000,000 | 3,100,410 | ||||
| Series A | ||||||
| 5.00% 10/1/34 | 6,250,000 | 6,433,250 | ||||
| 5.125% 10/1/29 | 3,000,000 | 3,138,540 | ||||
22
| Principal amount | Value | |||||
| Municipal Bonds (continued) | ||||||
| Electric Revenue Bonds (continued) | ||||||
| Northern Municipal Power Agency Electric System | ||||||
| Revenue Refunding Series B 4.75% 1/1/20 (AMBAC) | $ | 2,500,000 | $ | 2,507,825 | ||
| Puerto Rico Electric Power Authority Revenue | ||||||
| Series WW 5.50% 7/1/38 | 4,800,000 | 5,087,616 | ||||
| Series XX 5.25% 7/1/40 | 5,000,000 | 5,242,350 | ||||
| Southern Minnesota Municipal Power Agency Supply | ||||||
| System Revenue Series A | ||||||
| 5.25% 1/1/15 (AMBAC) | 2,900,000 | 3,362,492 | ||||
| ^Capital Appreciation 4.44% 1/1/25 (NATL-RE) | 5,000,000 | 2,919,150 | ||||
| 34,925,493 | ||||||
| Healthcare Revenue Bonds – 24.50% | ||||||
| Aitkin Health Care Facilities Revenue Refunding | ||||||
| (Riverwood Health Care Center) 5.60% 2/1/32 | 2,100,000 | 1,972,887 | ||||
| Alexandria Senior Housing Revenue | ||||||
| (Knute Nelson Senior Living) | ||||||
| 6.00% 7/1/35 | 1,500,000 | 1,536,540 | ||||
| 6.20% 7/1/45 | 2,000,000 | 2,054,660 | ||||
| Apple Valley Economic Development Authority Health | ||||||
| Care Revenue (Augustana Home St. Paul Project) | ||||||
| Series A 6.00% 1/1/40 | 2,700,000 | 2,720,169 | ||||
| Bemidji Health Care Facilities First Mortgage Revenue | ||||||
| (North Country Health Services) | ||||||
| 5.00% 9/1/24 (RADIAN) | 740,000 | 745,735 | ||||
| 5.00% 9/1/31 (RADIAN) | 500,000 | 497,425 | ||||
| Breckenridge Catholic Health Initiatives | ||||||
| Series A 5.00% 5/1/30 | 2,500,000 | 2,586,925 | ||||
| Fergus Falls Health Care Facilities Revenue | ||||||
| (Lake Region Health Care) | ||||||
| 5.15% 8/1/35 | 1,250,000 | 1,232,675 | ||||
| 5.40% 8/1/40 | 1,000,000 | 999,950 | ||||
| Maple Grove Health Care System Revenue | ||||||
| (Maple Grove Hospital) 5.25% 5/1/37 | 2,950,000 | 2,992,834 | ||||
| Minneapolis Health Care Facilities Revenue | ||||||
| (Jones-Harrison Residence Project) 5.60% 10/1/30 | 1,050,000 | 976,994 | ||||
| Minneapolis Health Care System Revenue | ||||||
| (Fairview Health Services) | ||||||
| Series A 6.625% 11/15/28 | 3,000,000 | 3,480,000 | ||||
| Series B 6.50% 11/15/38 (ASSURED GTY) | 1,140,000 | 1,313,907 | ||||
23
Statements of net assets
Delaware Tax-Free Minnesota Fund
Delaware Tax-Free Minnesota Fund
| Principal amount | Value | |||||
| Municipal Bonds (continued) | ||||||
| Healthcare Revenue Bonds (continued) | ||||||
| Minneapolis Health Care System Revenue (continued) | ||||||
| Series D | ||||||
| 5.00% 11/15/30 (AMBAC) | $ | 2,500,000 | $ | 2,570,125 | ||
| 5.00% 11/15/34 (AMBAC) | 4,750,000 | 4,838,968 | ||||
| Minneapolis National Marrow Donor Program | ||||||
| Project Revenue 4.875% 8/1/25 | 4,000,000 | 4,056,240 | ||||
| Minneapolis - St. Paul Housing & Redevelopment | ||||||
| Authority Health Care Revenue | ||||||
| (Children’s Hospital) Series A | ||||||
| 5.00% 8/15/30 | 2,750,000 | 2,814,075 | ||||
| 5.25% 8/15/35 | 2,085,000 | 2,176,990 | ||||
| (Health Partners Obligation Group Project) | ||||||
| 5.875% 12/1/29 | 1,000,000 | 1,018,360 | ||||
| Minnesota Agricultural & Economic | ||||||
| Development Board Revenue | ||||||
| (Benedictine Health Systems) 5.75% 2/1/29 | 1,895,000 | 1,819,276 | ||||
| (Essential Remarketing) Series C-1 | ||||||
| 5.00% 2/15/30 (ASSURED GTY) | 5,725,000 | 6,031,288 | ||||
| 5.25% 2/15/23 (ASSURED GTY) | 5,000,000 | 5,670,700 | ||||
| 5.50% 2/15/25 (ASSURED GTY) | 5,120,000 | 5,773,363 | ||||
| (Fairview Health Care System) | ||||||
| Un-Refunded Balance Series A | ||||||
| 5.75% 11/15/26 (NATL-RE) | 180,000 | 180,162 | ||||
| 6.375% 11/15/29 | 15,000 | 15,189 | ||||
| Northfield Hospital Revenue 5.375% 11/1/26 | 3,785,000 | 3,845,598 | ||||
| Rochester Health Care & Housing Revenue Refunding | ||||||
| (Samaritan Bethany) Series A 7.375% 12/1/41 | 5,220,000 | 5,555,437 | ||||
| Rochester Health Care Facilities Revenue | ||||||
| (Mayo Clinic) Remarketing Series D 5.00% 11/15/38 | 3,240,000 | 3,457,987 | ||||
| (Olmsted Medical Center) 5.875% 7/1/30 | 1,850,000 | 1,910,495 | ||||
| Sartell Health Care Facilities Revenue | ||||||
| (Country Manor Campus) Series A 6.375% 9/1/42 | 2,435,000 | 2,480,583 | ||||
| Shakopee Health Care Facilities Revenue | ||||||
| (St. Francis Regional Medical Center) | ||||||
| 5.10% 9/1/25 | 2,000,000 | 2,010,560 | ||||
| 5.25% 9/1/34 | 7,000,000 | 6,943,369 | ||||
| Sherburne County Health Care Facilities Revenue | ||||||
| (Guardian Angels Health Services) 5.55% 10/1/36 | 1,500,000 | 1,362,075 | ||||
24
| Principal amount | Value | |||||
| Municipal Bonds (continued) | ||||||
| Healthcare Revenue Bonds (continued) | ||||||
| St. Cloud Health Care Revenue | ||||||
| (Centracare Health System Project) | ||||||
| Series A | ||||||
| 5.00% 5/1/25 | $ | 1,035,000 | $ | 1,074,723 | ||
| 5.125% 5/1/30 | 5,350,000 | 5,656,716 | ||||
| Series D Remarketing 5.50% 5/1/39 (ASSURED GTY) | 6,000,000 | 6,418,260 | ||||
| St. Louis Park Health Care Facilities Revenue | ||||||
| (Park Nicollet Health Services) | ||||||
| Refunding 5.75% 7/1/39 | 15,200,000 | 15,611,463 | ||||
| Series C | ||||||
| 5.50% 7/1/23 | 3,000,000 | 3,201,120 | ||||
| 5.625% 7/1/26 | 1,925,000 | 2,016,649 | ||||
| 5.75% 7/1/30 | 5,000,000 | 5,223,750 | ||||
| St. Paul Housing & Redevelopment Authority | ||||||
| Health Care Facilities Revenue | ||||||
| (Health Partners Obligation Group Project) | ||||||
| 5.25% 5/15/36 | 4,900,000 | 4,818,121 | ||||
| (Senior Carondelet Village Project) | ||||||
| Series A 6.00% 8/1/42 | 3,075,000 | 3,100,738 | ||||
| St. Paul Housing & Redevelopment Authority | ||||||
| Health Care Revenue (Allina Health System) | ||||||
| Series A 5.00% 11/15/18 (NATL-RE) | 5,720,000 | 6,404,970 | ||||
| Series A-1 5.25% 11/15/29 | 5,605,000 | 5,897,021 | ||||
| St. Paul Housing & Redevelopment Authority | ||||||
| Hospital Revenue (Health East Project) | ||||||
| 6.00% 11/15/30 | 4,000,000 | 3,999,560 | ||||
| Series A 5.70% 11/1/15 | 1,150,000 | 1,150,449 | ||||
| St. Paul Housing & Redevelopment Authority | ||||||
| Multifamily Housing Revenue Refunding | ||||||
| (Marion Center Project) Series A | ||||||
| 5.30% 11/1/30 | 500,000 | 457,040 | ||||
| 5.375% 5/1/43 | 500,000 | 441,715 | ||||
| Stillwater Health Care Revenue (Health System | ||||||
| Obligation Group) 5.00% 6/1/35 | 1,000,000 | 1,003,700 | ||||
| Washington County Housing & Redevelopment | ||||||
| Authority Hospital Facilities Revenue | ||||||
| (Health East Project) 5.50% 11/15/27 | 1,000,000 | 961,210 | ||||
| 155,078,746 | ||||||
25
Statements of net assets
Delaware Tax-Free Minnesota Fund
Delaware Tax-Free Minnesota Fund
| Principal amount | Value | |||||
| Municipal Bonds (continued) | ||||||
| Housing Revenue Bonds – 6.96% | ||||||
| Minneapolis Multifamily Housing Revenue | ||||||
| (Bottineau Commons Project) | ||||||
| 5.45% 4/20/43 (GNMA) (AMT) | $ | 1,500,000 | $ | 1,515,300 | ||
| (Grant Street Apartments Project) Series A 7.25% 11/1/29 | 750,000 | 758,685 | ||||
| (Seward Towers Project) 5.00% 5/20/36 (GNMA) | 8,000,000 | 8,174,640 | ||||
| (Sumner Field) Series A 5.50% 11/20/26 (GNMA) (AMT) | 875,000 | 894,521 | ||||
| (Trinity Apartments) Refunding Series A | ||||||
| 6.75% 5/1/21 (HUD) | 1,495,000 | 1,512,566 | ||||
| Minnesota Housing Finance Agency Rental Housing | ||||||
| Revenue Series C-2 5.95% 2/1/15 (AMBAC) | 1,490,000 | 1,493,978 | ||||
| Minnesota Housing Finance Agency (Residential Housing) | ||||||
| Series A 5.30% 7/1/19 | 425,000 | 431,311 | ||||
| Series B-1 5.35% 1/1/33 (AMT) | 2,450,000 | 2,460,903 | ||||
| •Series D 4.80% 7/1/38 (AMT) | 2,500,000 | 2,480,850 | ||||
| Series I 4.85% 7/1/38 (AMT) | 2,000,000 | 1,999,880 | ||||
| Series I 5.15% 7/1/38 (AMT) | 5,530,000 | 5,617,153 | ||||
| Series L 5.10% 7/1/38 (AMT) | 9,910,000 | 10,043,091 | ||||
| Series M 4.875% 7/1/37 (AMT) | 4,500,000 | 4,509,135 | ||||
| @ | Washington County Housing & Redevelopment | |||||
| Authority Governmental Revenue Refunding | ||||||
| (Briar Pond Project) Series C 7.25% 8/20/34 | 915,000 | 809,674 | ||||
| White Bear Lake Multifamily Revenue Refunding | ||||||
| (Lake Square Apartments) Series A 5.875% 2/1/15 (FHA) | 620,000 | 621,600 | ||||
| Willmar Housing & Redevelopment Authority | ||||||
| Multifamily Housing Revenue | ||||||
| (Highland Apartments) 5.85% 6/1/19 (HUD) | 730,000 | 730,460 | ||||
| 44,053,747 | ||||||
| Lease Revenue Bonds – 3.22% | ||||||
| Minneapolis Special School District #001 Series A | ||||||
| 5.00% 2/1/18 (AGM) | 1,545,000 | 1,635,243 | ||||
| 5.00% 2/1/19 (AGM) | 1,535,000 | 1,624,659 | ||||
| 5.00% 2/1/20 (AGM) | 1,690,000 | 1,788,713 | ||||
| St. Paul Port Authority Lease Revenue | ||||||
| (Cedar Street Office Building Project) | ||||||
| 5.00% 12/1/22 | 2,500,000 | 2,681,475 | ||||
| 5.25% 12/1/27 | 3,840,000 | 3,994,522 | ||||
| Series 3-12 5.125% 12/1/27 | 3,000,000 | 3,159,210 | ||||
26
| Principal amount | Value | |||||
| Municipal Bonds (continued) | ||||||
| Lease Revenue Bonds (continued) | ||||||
| St. Paul Port Authority Lease Revenue | ||||||
| (Robert Street Office Building Project) | ||||||
| Series 3-11 4.75% 12/1/23 | $ | 2,000,000 | $ | 2,107,980 | ||
| Series 3-11 5.00% 12/1/27 | 2,500,000 | 2,622,350 | ||||
| Series 9 5.25% 12/1/27 | 725,000 | 754,174 | ||||
| 20,368,326 | ||||||
| Local General Obligation Bonds – 18.22% | ||||||
| Anoka County Capital Improvement Series A | ||||||
| 5.00% 2/1/19 | 1,270,000 | 1,560,894 | ||||
| 5.00% 2/1/22 | 500,000 | 593,630 | ||||
| Brainerd Independent School District #181 Refunding | ||||||
| (School Building) Series A | ||||||
| 4.00% 2/1/22 | 3,255,000 | 3,587,856 | ||||
| 4.00% 2/1/23 | 5,990,000 | 6,531,676 | ||||
| Centennial Independent School District #012 | ||||||
| Series A 5.00% 2/1/18 (AGM) | 1,270,000 | 1,341,285 | ||||
| Dakota County Capital Improvement | ||||||
| Series A 4.75% 2/1/26 | 1,000,000 | 1,007,670 | ||||
| Farmington Independent School District #192 Series B | ||||||
| 5.00% 2/1/27 (AGM) | 10,705,000 | 11,531,319 | ||||
| ^Capital Appreciation 5.34% 2/1/21 (AGM) | 1,500,000 | 909,135 | ||||
| ^Capital Appreciation 5.424% 2/1/20 (AGM) | 1,650,000 | 1,054,779 | ||||
| Hennepin County Series B 4.00% 12/1/20 | 5,255,000 | 6,144,934 | ||||
| Lakeville Independent School District #194 | ||||||
| Series A 4.75% 2/1/22 (AGM) | 6,850,000 | 7,194,829 | ||||
| ^ | Mahtomedi Independent School District #832 | |||||
| Capital Appreciation Series B 5.90% 2/1/14 (NATL-RE) | 1,540,000 | 1,481,234 | ||||
| Metropolitan Council Minneapolis-St. Paul | ||||||
| Metropolitan Area Waste Water Treatment | ||||||
| Series B 5.00% 12/1/21 | 1,200,000 | 1,375,476 | ||||
| Series C | ||||||
| 5.00% 3/1/16 | 2,440,000 | 2,926,170 | ||||
| 5.00% 3/1/28 | 5,000,000 | 5,486,300 | ||||
| Minneapolis Library 5.00% 12/1/25 | 1,500,000 | 1,571,580 | ||||
| Morris Independent School District #769 Building | ||||||
| 5.00% 2/1/24 (NATL-RE) | 4,875,000 | 5,304,390 | ||||
| Mounds View Independent School District #621 Series A | ||||||
| 5.00% 2/1/20 (NATL-RE) | 2,970,000 | 3,165,070 | ||||
| 5.375% 2/1/24 (FGIC) (TCRS) | 6,170,000 | 6,289,081 | ||||
27
Statements of net assets
Delaware Tax-Free Minnesota Fund
Delaware Tax-Free Minnesota Fund
| Principal amount | Value | |||||||
| Municipal Bonds (continued) | ||||||||
| Local General Obligation Bonds (continued) | ||||||||
| New Brighton Tax Increment Series A | ||||||||
| 5.00% 2/1/27 (NATL-RE) | $ | 1,000,000 | $ | 1,108,840 | ||||
| Osseo Independent School District #279 Series A | ||||||||
| 5.00% 2/1/21 (AGM) | 3,570,000 | 3,766,243 | ||||||
| Prior Lake Independent School District #719 Series B | ||||||||
| 5.00% 2/1/19 (AGM) | 3,145,000 | 3,549,290 | ||||||
| Ramsey County State Aid Series C 5.00% 2/1/28 | 1,060,000 | 1,139,118 | ||||||
| Robbinsdale Independent School District #281 | ||||||||
| 5.00% 2/1/21 (AGM) | 1,310,000 | 1,387,670 | ||||||
| ^ | Rosemount Independent School District #196 | |||||||
| Capital Appreciation Series B | ||||||||
| 5.931% 4/1/11 (AGM) | 2,600,000 | 2,592,746 | ||||||
| 5.961% 4/1/12 (AGM) | 1,850,000 | 1,827,911 | ||||||
| 6.008% 4/1/13 (AGM) | 1,915,000 | 1,868,197 | ||||||
| ^ | Sartell Independent School District #748 | |||||||
| Capital Appreciation Refunding Series B | ||||||||
| 5.976% 2/1/13 (NATL-RE) | 540,000 | 523,201 | ||||||
| 6.10% 2/1/15 (NATL-RE) | 1,075,000 | 987,785 | ||||||
| 6.15% 2/1/16 (NATL-RE) | 1,750,000 | 1,547,525 | ||||||
| ^ | Sauk Rapids Independent School District #047 Series B | |||||||
| 5.983% 2/1/15 (AGM) | 2,700,000 | 2,128,842 | ||||||
| 6.083% 2/1/17 (AGM) | 2,245,000 | 1,566,583 | ||||||
| South Washington County Independent School | ||||||||
| District #833 Series A | ||||||||
| 4.75% 2/1/25 | 2,500,000 | 2,788,050 | ||||||
| 4.75% 2/1/26 | 3,600,000 | 3,976,992 | ||||||
| 4.75% 2/1/27 | 2,300,000 | 2,523,307 | ||||||
| St. Michael Independent School District #885 | ||||||||
| 5.00% 2/1/20 (AGM) | 1,970,000 | 2,080,576 | ||||||
| 5.00% 2/1/27 (AGM) | 3,435,000 | 3,627,807 | ||||||
| St. Peter’s Hospital Series A 5.00% 9/1/24 (NATL-RE) | 1,905,000 | 1,905,000 | ||||||
| Todd Morrison Cass & Wadena Counties Staples United | ||||||||
| Hospital District (Health Care Facilities-Lakewood) | ||||||||
| 5.00% 12/1/21 | 2,000,000 | 2,139,440 | ||||||
| 5.125% 12/1/24 | 1,000,000 | 1,060,360 | ||||||
| Willmar (Rice Memorial Hospital Project) | ||||||||
| 5.00% 2/1/22 (AGM) | 1,000,000 | 1,087,260 | ||||||
| 5.00% 2/1/25 (AGM) | 1,000,000 | 1,039,270 | ||||||
| 115,279,321 | ||||||||
28
| Principal amount | Value | |||||
| Municipal Bonds (continued) | ||||||
| §Pre-Refunded/Escrowed to Maturity Bonds – 23.67% | ||||||
| Dakota County Community Development Agency | ||||||
| (Senior Housing Facilities) 5.00% 1/1/21-12 | $ | 1,275,000 | $ | 1,353,884 | ||
| Dakota-Washington Counties Housing & Redevelopment | ||||||
| Authority Single Family Residential Mortgage Revenue | ||||||
| 8.15% 9/1/16 (GNMA) (NATL-RE) (IBC) (AMT) | 405,000 | 530,364 | ||||
| (Anoka County) 8.45% 9/1/19 (GNMA) (AMT) | 9,000,000 | 12,591,450 | ||||
| (Bloomington Mortgage) Refunding Series B | ||||||
| 8.375% 9/1/21 (GNMA) (FHA) (VA) (AMT) | 14,115,000 | 20,040,195 | ||||
| Duluth Economic Development Authority | ||||||
| Health Care Facilities Revenue | ||||||
| (Benedictine Health System - St. Mary’s Hospital) | ||||||
| 5.25% 2/15/33-14 | 10,000,000 | 11,579,700 | ||||
| 5.50% 2/15/23-14 | 1,000,000 | 1,166,500 | ||||
| Hennepin County Regional Railroad Authority | ||||||
| 5.00% 12/1/31-10 | 4,030,000 | 4,078,481 | ||||
| Hopkins Housing & Redevelopment Authority | ||||||
| (Public Works & Fire Station) Series A | ||||||
| 5.00% 2/1/23-13 (NATL-RE) | 1,210,000 | 1,342,737 | ||||
| Minneapolis Health Care System Revenue | ||||||
| (Allina Health Systems) Series A 5.75% 11/15/32-12 | 17,300,000 | 19,330,155 | ||||
| (Fairview Health Services) Series A 5.625% 5/15/32-12 | 16,925,000 | 18,626,978 | ||||
| Minneapolis - St. Paul Metropolitan Airports | ||||||
| Commission Revenue | ||||||
| Series A 5.25% 1/1/32-11 (FGIC) | 5,000,000 | 5,084,150 | ||||
| Series C 5.25% 1/1/32-11 (FGIC) | 6,845,000 | 6,959,517 | ||||
| Minnesota Agricultural & Economic Development Revenue | ||||||
| (Fairview Health Care System) | ||||||
| Series A 6.375% 11/15/29-10 | 485,000 | 495,980 | ||||
| Rochester Electric Utilities Revenue 5.25% 12/1/30-10 | 4,915,000 | 4,976,044 | ||||
| Southern Minnesota Municipal Power Agency Power | ||||||
| Supply Revenue Series A | ||||||
| 5.75% 1/1/18-13 | 3,790,000 | 4,132,123 | ||||
| 5.75% 1/1/18-13 (AMBAC) (TCRS) | 670,000 | 730,481 | ||||
| 5.75% 1/1/18-13 (NATL-RE) (IBC) | 1,000,000 | 1,090,270 | ||||
| Refunding Series B 5.50% 1/1/15 (AMBAC) | 990,000 | 1,036,332 | ||||
| St. Louis Park Health Care Facilities Revenue | ||||||
| (Park Nicollet Health Services) Series B | ||||||
| 5.25% 7/1/30-14 | 9,420,000 | 10,943,026 | ||||
| 5.50% 7/1/25-14 | 2,000,000 | 2,342,140 | ||||
29
Statements of net assets
Delaware Tax-Free Minnesota Fund
Delaware Tax-Free Minnesota Fund
| Principal amount | Value | ||||||||
| Municipal Bonds (continued) | |||||||||
| §Pre-Refunded/Escrowed to Maturity Bonds (continued) | |||||||||
| University of Minnesota Series A | |||||||||
| 5.50% 7/1/21 | $ | 12,500,000 | $ | 15,574,875 | |||||
| 5.75% 7/1/18 | 3,840,000 | 4,809,562 | |||||||
| Western Minnesota Municipal Power Agency Supply | |||||||||
| Revenue Series A 9.75% 1/1/16 (NATL-RE) | 715,000 | 971,428 | |||||||
| 149,786,372 | |||||||||
| Special Tax Revenue Bonds – 1.75% | |||||||||
| Hennepin County Sales Tax Revenue | |||||||||
| (Second Lien - Ballpark Project) Series B | |||||||||
| 5.00% 12/15/19 | 2,100,000 | 2,494,086 | |||||||
| 5.00% 12/15/20 | 1,000,000 | 1,174,920 | |||||||
| 5.00% 12/15/24 | 1,150,000 | 1,316,210 | |||||||
| Minneapolis Tax Increment Revenue Refunding | |||||||||
| (St. Anthony Falls Project) 5.75% 2/1/27 | 1,000,000 | 958,960 | |||||||
| Puerto Rico Sales Tax Financing Sales Tax Revenue | |||||||||
| First Subordinate Series A 5.75% 8/1/37 | 4,760,000 | 5,102,529 | |||||||
| 11,046,705 | |||||||||
| State General Obligation Bonds – 3.01% | |||||||||
| Minnesota State | |||||||||
| 5.00% 10/1/15 | 5,000,000 | 5,975,100 | |||||||
| 5.00% 8/1/21 | 2,400,000 | 2,593,104 | |||||||
| Series A 5.00% 12/1/21 | 5,000,000 | 6,112,850 | |||||||
| Puerto Rico Commonwealth Public Improvement | |||||||||
| Refunding Series C 6.00% 7/1/39 | 4,045,000 | 4,390,807 | |||||||
| 19,071,861 | |||||||||
| Transportation Revenue Bonds – 1.87% | |||||||||
| Minneapolis - St. Paul Metropolitan Airports | |||||||||
| Commission Revenue Series A | |||||||||
| 5.00% 1/1/15 (AMT) | 3,095,000 | 3,447,830 | |||||||
| 5.00% 1/1/22 (NATL-RE) | 2,000,000 | 2,081,160 | |||||||
| 5.25% 1/1/16 (NATL-RE) | 1,460,000 | 1,574,902 | |||||||
| St. Paul Housing & Redevelopment Authority Parking | |||||||||
| Revenue Refunding (Parking Facilities Project) | |||||||||
| Series A | |||||||||
| 5.00% 8/1/30 | 1,870,000 | 1,984,014 | |||||||
| 5.00% 8/1/35 | 1,500,000 | 1,550,910 | |||||||
| Series B 5.00% 8/1/35 | 1,145,000 | 1,173,877 | |||||||
| 11,812,693 | |||||||||
30
| Principal amount | Value | |||||||||
| Municipal Bonds (continued) | ||||||||||
| Water & Sewer Revenue Bonds – 0.37% | ||||||||||
| Minnesota Public Facilities Authority Drinking Water | ||||||||||
| Revenue Series B 5.25% 3/1/13 | $ | 1,000,000 | $ | 1,120,310 | ||||||
| Minnesota Public Facilities Authority Water Pollution | ||||||||||
| Control Revenue Refunding Series B | ||||||||||
| 5.00% 3/1/19 | 1,000,000 | 1,240,850 | ||||||||
| 2,361,160 | ||||||||||
| Total Municipal Bonds (cost $592,091,766) | 634,425,280 | |||||||||
| Number of shares | ||||||||||
| Short-Term Investment – 0.11% | ||||||||||
| Money Market Instrument – 0.11% | ||||||||||
| Federated Minnesota Municipal Cash Trust | 723,114 | 723,114 | ||||||||
| Total Short-Term Investment (cost $723,114) | 723,114 | |||||||||
| Total Value of Securities – 100.36% | ||||||||||
| (cost $592,814,880) | 635,148,394 | |||||||||
| Liabilities Net of Receivables and | ||||||||||
| Other Assets – (0.36%) | (2,282,329 | ) | ||||||||
| Net Assets Applicable to 49,686,578 | ||||||||||
| Shares Outstanding – 100.00% | $ | 632,866,065 | ||||||||
| Net Asset Value – Delaware Tax-Free Minnesota Fund | ||||||||||
| Class A ($586,651,076 / 46,067,569 Shares) | $12.73 | |||||||||
| Net Asset Value – Delaware Tax-Free Minnesota Fund | ||||||||||
| Class B ($7,234,221 / 567,690 Shares) | $12.74 | |||||||||
| Net Asset Value – Delaware Tax-Free Minnesota Fund | ||||||||||
| Class C ($38,980,768 / 3,051,319 Shares) | $12.78 | |||||||||
| Components of Net Assets at August 31, 2010: | ||||||||||
| Shares of beneficial interest (unlimited authorization – no par) | $ | 588,778,170 | ||||||||
| Distributions in excess of net investment income | (144,194 | ) | ||||||||
| Accumulated net realized gain on investments | 1,898,575 | |||||||||
| Net unrealized appreciation of investments | 42,333,514 | |||||||||
| Total net assets | $ | 632,866,065 | ||||||||
31
Statements of net assets
Delaware Tax-Free Minnesota Fund
Delaware Tax-Free Minnesota Fund
| ^ | Zero coupon security. The rate shown is the yield at the time of purchase. |
| • | Variable rate security. The rate shown is the rate as of August 31, 2010. Interest rates reset periodically. |
| § | Pre-Refunded bonds. Municipal bonds that are generally backed or secured by U.S. Treasury bonds. For Pre-Refunded bonds, the stated maturity is followed by the year in which the bond is pre-refunded. See Note 9 in “Notes to financial statements.” |
| @ | Illiquid security. At August 31, 2010, the aggregate amount of illiquid securities was $809,674, which represented 0.13% of the Fund’s net assets. See Note 9 in “Notes to financial statements.” |
Summary of abbreviations:
AGM — Insured by Assured Guaranty Municipal Corporation
AMBAC — Insured by the AMBAC Assurance Corporation
AMT — Subject to Alternative Minimum Tax
ASSURED GTY — Insured by the Assured Guaranty Corporation
FGIC — Insured by the Financial Guaranty Insurance Company
FHA — Insured by the Federal Housing Administration
GNMA — Government National Mortgage Association Collateral
HUD — Housing and Urban Development Section 8
IBC — Insured Bond Certificate
NATL-RE — Insured by the National Public Finance Guarantee Corporation
RADIAN — Insured by Radian Asset Assurance
TCRS — Temporary Custodial Receipts
VA — Veterans Administration
| Net Asset Value and Offering Price Per Share – | |||
| Delaware Tax-Free Minnesota Fund | |||
| Net asset value Class A (A) | $ | 12.73 | |
| Sales charge (4.50% of offering price) (B) | 0.60 | ||
| Offering price | $ | 13.33 |
| (A) | Net asset value per share, as illustrated, is the amount which would be paid upon redemption or repurchase of shares. |
| (B) | See the current prospectus for purchases of $100,000 or more. |
See accompanying Notes, which are an integral part of the financial statements.
32
| Delaware Tax-Free Minnesota Intermediate Fund | August 31, 2010 |
| Principal amount | Value | ||||||||
| Municipal Bonds – 98.82% | |||||||||
| Corporate-Backed Revenue Bonds – 1.48% | |||||||||
| Laurentian Energy Authority I Cogeneration Revenue | |||||||||
| Series A 5.00% 12/1/21 | $ | 750,000 | $ | 771,900 | |||||
| Minneapolis Community Development Agency (Limited Tax | |||||||||
| Common Bond Fund) Series 4 6.20% 6/1/17 (AMT) | 870,000 | 875,707 | |||||||
| 1,647,607 | |||||||||
| Education Revenue Bonds – 10.66% | |||||||||
| Minnesota Colleges & Universities Revenue Fund | |||||||||
| Series A 5.00% 10/1/28 | 1,000,000 | 1,125,390 | |||||||
| Minnesota Higher Education Facilities Authority Revenue | |||||||||
| (Carleton College) | |||||||||
| Series 6-T 4.75% 1/1/23 | 1,000,000 | 1,131,620 | |||||||
| Series 7-D 5.00% 3/1/30 | 1,500,000 | 1,675,290 | |||||||
| (Hamline University) Series 7-E 5.00% 10/1/29 | 250,000 | 259,008 | |||||||
| (Macalester College) Series 6-P 4.25% 3/1/27 | 750,000 | 777,810 | |||||||
| (St. Johns University) Series 6-U | |||||||||
| 4.40% 10/1/21 | 325,000 | 353,954 | |||||||
| 4.50% 10/1/23 | 265,000 | 284,825 | |||||||
| (University of St. Thomas) | |||||||||
| Series 5-Y 5.25% 10/1/19 | 1,590,000 | 1,742,497 | |||||||
| Series 6-X 5.00% 4/1/24 | 1,000,000 | 1,097,660 | |||||||
| St. Cloud Housing & Redevelopment Authority Revenue | |||||||||
| (State University Foundation Project) 5.00% 5/1/23 | 1,000,000 | 1,054,950 | |||||||
| University of Minnesota | |||||||||
| Series A 4.00% 4/1/15 | 310,000 | 350,591 | |||||||
| Series C 4.00% 2/1/14 | 250,000 | 278,128 | |||||||
| University of Minnesota Special Purpose Revenue | |||||||||
| (State Supported Stadium Debt) 5.00% 8/1/18 | 1,500,000 | 1,744,259 | |||||||
| 11,875,982 | |||||||||
| Electric Revenue Bonds – 7.61% | |||||||||
| Chaska Electric Revenue Refunding | |||||||||
| (Generating Facilities) Series A 5.25% 10/1/25 | 1,000,000 | 1,071,670 | |||||||
| Minnesota Municipal Power Agency Electric Revenue | |||||||||
| 5.25% 10/1/21 | 1,000,000 | 1,106,170 | |||||||
| Northern Municipal Power Agency Electric | |||||||||
| System Revenue Series A | |||||||||
| 5.00% 1/1/13 (ASSURED GTY) | 1,200,000 | 1,314,804 | |||||||
| 5.00% 1/1/14 (ASSURED GTY) | 510,000 | 576,351 | |||||||
| 5.00% 1/1/15 (ASSURED GTY) | 1,000,000 | 1,145,840 | |||||||
33
Statements of net assets
Delaware Tax-Free Minnesota Intermediate Fund
Delaware Tax-Free Minnesota Intermediate Fund
| Principal amount | Value | ||||||||
| Municipal Bonds (continued) | |||||||||
| Electric Revenue Bonds (continued) | |||||||||
| Puerto Rico Electric Power Authority Revenue | |||||||||
| Series XX 5.75% 7/1/36 | $ | 2,000,000 | $ | 2,171,900 | |||||
| Southern Minnesota Municipal Power Agency | |||||||||
| Supply System Revenue Series A 5.25% 1/1/30 | 1,000,000 | 1,089,270 | |||||||
| 8,476,005 | |||||||||
| Healthcare Revenue Bonds – 21.83% | |||||||||
| Bemidji Health Care Facilities First Mortgage Revenue | |||||||||
| (North Country Health Services) 5.00% 9/1/31 (RADIAN) | 650,000 | 646,653 | |||||||
| Fergus Falls Health Care Facilities Revenue | |||||||||
| (Lake Region Health Care) 4.75% 8/1/25 | 500,000 | 507,755 | |||||||
| Glencoe Health Care Facilities Revenue | |||||||||
| (Glencoe Regional Health Services Project) 5.00% 4/1/31 | 1,000,000 | 972,400 | |||||||
| Minneapolis Health Care System Revenue (Fairview Health | |||||||||
| Services) Series A 6.625% 11/15/28 | 1,500,000 | 1,740,000 | |||||||
| Minneapolis National Marrow Donor Program | |||||||||
| Project Revenue 5.00% 8/1/17 | 1,205,000 | 1,309,751 | |||||||
| Minneapolis - St. Paul Housing & Redevelopment | |||||||||
| Authority Health Care Revenue | |||||||||
| (Children’s Hospital) Series A 5.25% 8/15/25 | 1,000,000 | 1,088,770 | |||||||
| (Health Partners Obligation Group Project) 6.00% 12/1/17 | 850,000 | 908,489 | |||||||
| Minnesota Agricultural & Economic Development Board | |||||||||
| Health Care Revenue (Essentia Remarketing) Series C-1 | |||||||||
| 5.50% 2/15/25 (ASSURED GTY) | 2,500,000 | 2,819,024 | |||||||
| Moorhead Economic Development Authority | |||||||||
| Multifamily Housing Revenue Refunding | |||||||||
| (Eventide Lutheran Home Project) 4.70% 6/1/18 | 475,000 | 466,802 | |||||||
| Rochester Health Care & Housing Revenue | |||||||||
| (Samaritan Bethany) Refunding Series A 6.875% 12/1/29 | 950,000 | 1,004,093 | |||||||
| Rochester Health Care Facilities Revenue | |||||||||
| (Olmsted Medical Center) 5.125% 7/1/20 | 1,000,000 | 1,069,260 | |||||||
| Sartell Health Care Facilities (Country Manor Campus) | |||||||||
| Series A 6.125% 9/1/30 | 845,000 | 864,029 | |||||||
| St. Cloud Health Care Revenue | |||||||||
| (Centracare Health System Project) | |||||||||
| 5.375% 5/1/31 (ASSURED GTY) | 1,000,000 | 1,078,910 | |||||||
| Series A 5.125% 5/1/30 | 1,750,000 | 1,850,328 | |||||||
34
| Principal amount | Value | ||||||||
| Municipal Bonds (continued) | |||||||||
| Healthcare Revenue Bonds (continued) | |||||||||
| St. Louis Park Health Care Facilities Revenue Refunding | |||||||||
| (Park Nicollet Health Services) | |||||||||
| 5.50% 7/1/29 | $ | 1,000,000 | $ | 1,030,960 | |||||
| Series C 5.625% 7/1/26 | 2,500,000 | 2,619,024 | |||||||
| St. Paul Housing & Redevelopment Authority Health | |||||||||
| Care Revenue (Allina Health System) Series A-2 | |||||||||
| 5.25% 11/15/28 | 2,000,000 | 2,138,339 | |||||||
| St. Paul Housing & Redevelopment Authority Hospital | |||||||||
| Revenue (Health East Project) Series B 5.85% 11/1/17 | 1,160,000 | 1,160,499 | |||||||
| St. Paul Housing & Redevelopment Authority Housing & | |||||||||
| Health Care Facilities Revenue (Senior Carondelet | |||||||||
| Village Project) Series A 6.25% 8/1/30 | 1,000,000 | 1,046,700 | |||||||
| 24,321,786 | |||||||||
| Housing Revenue Bonds – 3.58% | |||||||||
| Minneapolis Multifamily Housing Revenue Refunding | |||||||||
| (Trinity Apartments) Series A 6.75% 5/1/21 (HUD) | 1,555,000 | 1,573,272 | |||||||
| Minnesota Housing Finance Agency Residential Housing | |||||||||
| •Series D 4.75% 7/1/32 (AMT) | 750,000 | 747,930 | |||||||
| Series I 5.10% 7/1/20 (AMT) | 645,000 | 656,700 | |||||||
| Series M 4.85% 7/1/31 (AMT) | 1,000,000 | 1,007,410 | |||||||
| 3,985,312 | |||||||||
| Lease Revenue Bonds – 2.71% | |||||||||
| Edina Housing & Redevelopment Authority Public Project | |||||||||
| Revenue (Appropriate Lease Obligation) 5.125% 2/1/19 | 1,000,000 | 1,047,390 | |||||||
| Puerto Rico Public Buildings Authority Revenue | |||||||||
| (Guaranteed Government Facilities) | |||||||||
| Un-Refunded Balance Series D 5.25% 7/1/36 | 1,070,000 | 1,077,158 | |||||||
| Virginia Housing & Redevelopment Authority Health | |||||||||
| Care Facility Lease Revenue 5.25% 10/1/25 | 880,000 | 897,046 | |||||||
| 3,021,594 | |||||||||
| Local General Obligation Bonds – 25.27% | |||||||||
| Anoka County Capital Improvements | |||||||||
| Series A 4.00% 2/1/17 | 1,175,000 | 1,346,538 | |||||||
| Series C 5.00% 2/1/27 | 500,000 | 561,975 | |||||||
| Anoka-Hennepin Independent School District #11 | |||||||||
| Refunding 5.00% 2/1/17 | 1,000,000 | 1,208,780 | |||||||
35
Statements of net assets
Delaware Tax-Free Minnesota Intermediate Fund
Delaware Tax-Free Minnesota Intermediate Fund
| Principal amount | Value | ||||||||
| Municipal Bonds (continued) | |||||||||
| Local General Obligation Bonds (continued) | |||||||||
| Big Lake Independent School District #727 Series C Refunding | |||||||||
| 5.00% 2/1/16 (AGM) | $ | 1,180,000 | $ | 1,200,272 | |||||
| 5.00% 2/1/17 (AGM) | 1,000,000 | 1,017,180 | |||||||
| Brainerd Independent School District #181 Refunding | |||||||||
| (School Building) Series A 4.00% 2/1/22 | 2,500,000 | 2,755,649 | |||||||
| Centennial Independent School District #012 Series A | |||||||||
| 5.00% 2/1/18 (AGM) | 1,000,000 | 1,056,130 | |||||||
| 5.00% 2/1/20 (AGM) | 750,000 | 792,098 | |||||||
| Dakota County Capital Improvement Series A 4.75% 2/1/17 | 1,000,000 | 1,016,890 | |||||||
| Duluth Independent School District #709 Revenue | |||||||||
| Certificates of Participation Series A 4.25% 2/1/20 (AGM) | 1,710,000 | 1,933,651 | |||||||
| Hopkins Independent School District #270 5.125% 2/1/17 (FGIC) | 2,000,000 | 2,115,780 | |||||||
| Mankato Independent School District #77 (Formerly | |||||||||
| Blue Earth County Independent School District #10) | |||||||||
| 4.125% 2/1/22 | 1,000,000 | 1,111,640 | |||||||
| Metropolitan Council Minneapolis-St. Paul Metropolitan | |||||||||
| Area Waste Water Treatment Series C | |||||||||
| 5.00% 3/1/16 | 560,000 | 671,580 | |||||||
| 5.00% 3/1/28 | 1,000,000 | 1,097,260 | |||||||
| Minneapolis Various Purposes 4.00% 12/1/23 | 1,500,000 | 1,614,720 | |||||||
| Osseo Independent School District #279 Series A | |||||||||
| 5.00% 2/1/21 (AGM) | 1,500,000 | 1,582,455 | |||||||
| Robbinsdale Independent School District #281 | |||||||||
| Series A 5.00% 2/1/20 | 1,850,000 | 2,276,000 | |||||||
| South Washington County Independent School District #833 | |||||||||
| Series A 4.00% 2/1/22 | 750,000 | 818,445 | |||||||
| Series B 5.00% 2/1/16 (AGM) | 1,560,000 | 1,663,381 | |||||||
| St. Paul Independent School District #625 (School Building) | |||||||||
| Series A 4.00% 2/1/15 | 1,020,000 | 1,150,366 | |||||||
| White Bear Lake Independent School District #624 (Formerly | |||||||||
Joint Independent Consolidated Ramsey County School | |||||||||
District #39 & Washington & Anoka Counties School | �� | ||||||||
District #103) Series B 4.75% 2/1/22 | 1,000,000 | 1,152,380 | |||||||
| 28,143,170 | |||||||||
| §Pre-Refunded/Escrowed to Maturity Bonds – 9.01% | |||||||||
| Hennepin County Series B 4.75% 12/1/14-10 | 1,000,000 | 1,011,330 | |||||||
| Minneapolis Health Care System Revenue | |||||||||
| (Allina Health Systems) Series A 5.75% 11/15/32-12 | 1,500,000 | 1,676,025 | |||||||
| (Fairview Health Services) Series A 5.625% 5/15/32-12 | 1,750,000 | 1,925,980 | |||||||
36
| Principal amount | Value | ||||||||
| Municipal Bonds (continued) | |||||||||
| §Pre-Refunded/Escrowed to Maturity Bonds (continued) | |||||||||
| Minneapolis -St. Paul Metropolitan Airports Commission | |||||||||
| Revenue Series C 5.125% 1/1/20-11 (FGIC) | $ | 750,000 | $ | 762,233 | |||||
| Minnesota Public Facilities Authority Water Pollution | |||||||||
| Control Revenue Refunding Series C 5.00% 3/1/18-15 | 1,000,000 | 1,181,970 | |||||||
| St. Louis Park Health Care Facilities Revenue | |||||||||
| (Park Nicollet Health Services) Series B 5.50% 7/1/25-14 | 1,500,000 | 1,756,605 | |||||||
| University of Minnesota Series A | |||||||||
| 5.75% 7/1/16 | 1,000,000 | 1,222,430 | |||||||
| 5.75% 7/1/18 | 400,000 | 500,996 | |||||||
| 10,037,569 | |||||||||
| Special Tax Revenue Bonds – 6.60% | |||||||||
| Minneapolis Art Center Facilities Revenue | |||||||||
| (Walker Art Center Project) 5.125% 7/1/21 | 2,250,000 | 2,324,700 | |||||||
| @ | Minneapolis Tax Increment Revenue | ||||||||
| (Ivy Tower Project) 5.50% 2/1/22 | 415,000 | 328,730 | |||||||
| Minnesota 911 Revenue (Public Safety Radio | |||||||||
| Communication System Project) | |||||||||
| 4.00% 6/1/14 (ASSURED GTY) | 1,370,000 | 1,530,550 | |||||||
| 4.25% 6/1/18 (ASSURED GTY) | 1,170,000 | 1,351,104 | |||||||
| 4.50% 6/1/25 (ASSURED GTY) | 1,000,000 | 1,108,550 | |||||||
| Puerto Rico Sales Tax Financing Sales Tax Revenue First | |||||||||
| Subordinate Series A | |||||||||
| 6.125% 8/1/29 | 250,000 | 265,160 | |||||||
| Ω(Capital Appreciation) 6.75% 8/1/32 | 510,000 | 440,722 | |||||||
| 7,349,516 | |||||||||
| State General Obligation Bonds – 3.76% | |||||||||
| Minnesota State | |||||||||
| Refunding 5.00% 8/1/15 | 2,000,000 | 2,382,120 | |||||||
| Various Purposes Series A 5.00% 12/1/21 | 1,000,000 | 1,222,570 | |||||||
| Puerto Rico Commonwealth Public Improvement | |||||||||
| Un-Refunded Balance Series B 5.00% 7/1/35 | 575,000 | 581,337 | |||||||
| 4,186,027 | |||||||||
| Transportation Revenue Bonds – 3.39% | |||||||||
| Minneapolis-St. Paul Metropolitan Airports Commission | |||||||||
| 5.00% 1/1/13 (AMT) | 500,000 | 540,510 | |||||||
| Refunding Series 14 5.50% 1/1/11 (AMT) | 750,000 | 761,513 | |||||||
| Refunding Series B 5.00% 1/1/22 (AMT) | 1,000,000 | 1,087,580 | |||||||
| Series A 5.00% 1/1/28 | 1,250,000 | 1,384,487 | |||||||
| 3,774,090 | |||||||||
37
Statements of net assets
Delaware Tax-Free Minnesota Intermediate Fund
Delaware Tax-Free Minnesota Intermediate Fund
| Principal amount | Value | ||||||||
| Municipal Bonds (continued) | |||||||||
| Water & Sewer Revenue Bonds – 2.92% | |||||||||
| Minnesota Public Facilities Authority Water Pollution | |||||||||
| Control Revenue Refunding Series D 5.00% 3/1/14 | $ | 1,500,000 | $ | 1,729,156 | |||||
| St. Paul Sewer Revenue Series D 5.00% 12/1/20 | 1,275,000 | 1,519,048 | |||||||
| 3,248,204 | |||||||||
| Total Municipal Bonds (cost $102,972,266) | 110,066,862 | ||||||||
| Number of shares | |||||||||
| Short-Term Investments – 0.61% | |||||||||
| Money Market Instrument – 0.16% | |||||||||
| Federated Minnesota Municipal Cash Trust | 183,602 | 183,602 | |||||||
| 183,602 | |||||||||
| Principal amount | |||||||||
| Variable Rate Demand Note – 0.45% | |||||||||
| • | Brooklyn Center Revenue Refunding (Brookdale II Project) | ||||||||
| 0.25% 12/1/14 (LOC – U.S. Bank N.A.) | $ | 500,000 | 500,000 | ||||||
| 500,000 | |||||||||
| Total Short-Term Investments (cost $683,602) | 683,602 | ||||||||
| Total Value of Securities – 99.43% | |||||||||
| (cost $103,655,868) | 110,750,464 | ||||||||
| Receivables and Other Assets | |||||||||
| Net of Liabilities – 0.57% | 636,517 | ||||||||
| Net Assets Applicable to 9,858,986 | |||||||||
| Shares Outstanding – 100.00% | $ | 111,386,981 | |||||||
| Net Asset Value – Delaware Tax-Free Minnesota Intermediate Fund | |||||||||
| Class A ($96,567,614 / 8,549,679 Shares) | $11.29 | ||||||||
| Net Asset Value – Delaware Tax-Free Minnesota Intermediate Fund | |||||||||
| Class B ($170,640 / 15,064 Shares) | $11.33 | ||||||||
| Net Asset Value – Delaware Tax-Free Minnesota Intermediate Fund | |||||||||
| Class C ($14,648,727 / 1,294,243 Shares) | $11.32 | ||||||||
38
| Components of Net Assets at August 31, 2010: | ||||
| Shares of beneficial interest (unlimited authorization – no par) | $ | 105,025,082 | ||
| Undistributed net investment income | 2,522 | |||
| Accumulated net realized loss on investments | (735,219 | ) | ||
| Net unrealized appreciation of investments | 7,094,596 | |||
| Total net assets | $ | 111,386,981 |
| @ | Illiquid security. At August 31, 2010, the aggregate amount of illiquid securities was $328,730, which represented 0.30% of the Fund’s net assets. See Note 9 in “Notes to financial statements.” |
| § | Pre-Refunded bonds. Municipal bonds that are generally backed or secured by U.S. Treasury bonds. For Pre-Refunded bonds, the stated maturity is followed by the year in which the bond is pre-refunded. See Note 9 in “Notes to financial statements.” |
• | Variable rate security. The rate shown is the rate as of August 31, 2010. Interest rates reset periodically. |
| Ω | Step coupon bond. Indicates security that has a zero coupon that remains in effect until a predetermined date at which time the stated interest rate becomes effective. |
Summary of abbreviations:
AGM — Insured by Assured Guaranty Municipal Corporation
AMT — Subject to Alternative Minimum Tax
ASSURED GTY — Insured by the Assured Guaranty Corporation
FGIC — Insured by the Financial Guaranty Insurance Company
HUD — Housing and Urban Development Section 8
LOC — Letter of Credit
RADIAN — Insured by Radian Asset Assurance
| Net Asset Value and Offering Price Per Share – | |||
| Delaware Tax-Free Minnesota Intermediate Fund | |||
| Net asset value Class A (A) | $ | 11.29 | |
| Sales charge (2.75% of offering price) (B) | 0.32 | ||
| Offering price | $ | 11.61 |
| (A) | Net asset value per share, as illustrated, is the amount which would be paid upon redemption or repurchase of shares. |
| (B) | See the current prospectus for purchases of $100,000 or more. |
See accompanying Notes, which are an integral part of the financial statements.
39
| Statements of net assets | |
| Delaware Minnesota High-Yield Municipal Bond Fund | August 31, 2010 |
| Principal amount | Value | |||||||
| Municipal Bonds – 98.45% | ||||||||
| Corporate-Backed Revenue Bonds – 4.22% | ||||||||
| Cloquet Pollution Control Revenue Refunding | ||||||||
| (Potlatch Project) 5.90% 10/1/26 | $ | 1,700,000 | $ | 1,664,504 | ||||
| Laurentian Energy Authority I Cogeneration Revenue | ||||||||
| Series A 5.00% 12/1/21 | 1,750,000 | 1,801,100 | ||||||
| Puerto Rico Ports Authority Revenue Special Facilities | ||||||||
| (American Airlines) Series A 6.25% 6/1/26 (AMT) | 1,390,000 | 1,192,968 | ||||||
| Sartell Environmental Improvement Revenue Refunding | ||||||||
| (International Paper) Series A 5.20% 6/1/27 | 1,750,000 | 1,757,403 | ||||||
| 6,415,975 | ||||||||
| Education Revenue Bonds – 7.58% | ||||||||
| Baytown Township Lease Revenue | ||||||||
| (St. Croix Preparatory Academy) Series A 7.00% 8/1/38 | 500,000 | 511,525 | ||||||
| Minnesota Higher Education Facilities Authority Revenue | ||||||||
| (Augsburg College) | ||||||||
| Series 6-C 5.00% 5/1/23 | 700,000 | 716,177 | ||||||
| Series 6-J1 5.00% 5/1/36 | 1,000,000 | 1,006,550 | ||||||
| (Bethel University) Series 6-R 5.50% 5/1/37 | 1,500,000 | 1,510,680 | ||||||
| (Macalester College) Series 6-P 4.25% 3/1/32 | 1,000,000 | 1,011,610 | ||||||
| (St. John’s University) Series 6-U 4.75% 10/1/33 | 825,000 | 848,678 | ||||||
| (St. Olaf) Series 6-O | ||||||||
| 4.50% 10/1/32 | 1,000,000 | 1,002,290 | ||||||
| 5.00% 10/1/22 | 1,000,000 | 1,103,990 | ||||||
| (University of St. Thomas) | ||||||||
| Series 6-I 5.00% 4/1/23 | 1,500,000 | 1,636,455 | ||||||
| Series 7-A 5.00% 10/1/39 | 1,000,000 | 1,057,150 | ||||||
| University of Minnesota Series A 5.125% 4/1/34 | 1,000,000 | 1,102,170 | ||||||
| 11,507,275 | ||||||||
| Electric Revenue Bonds – 7.08% | ||||||||
| Chaska Electric Revenue Refunding | ||||||||
| (Generating Facilities) Series A 5.25% 10/1/25 | 1,000,000 | 1,071,670 | ||||||
| Minnesota Municipal Power Agency Electric Revenue | ||||||||
| Series A 5.00% 10/1/34 | 2,750,000 | 2,830,630 | ||||||
| Northern Municipal Power Agency Electric System Revenue | ||||||||
| Refunding Series A | ||||||||
| 5.00% 1/1/16 (ASSURED GTY) | 1,200,000 | 1,395,072 | ||||||
| 5.00% 1/1/18 (ASSURED GTY) | 1,000,000 | 1,176,790 | ||||||
40
| Principal amount | Value | |||||||
| Municipal Bonds (continued) | ||||||||
| Electric Revenue Bonds (continued) | ||||||||
| Puerto Rico Electric Power Authority Revenue | ||||||||
| Series XX 5.25% 7/1/40 | $ | 1,665,000 | $ | 1,745,703 | ||||
| Southern Minnesota Municipal Power Agency Supply | ||||||||
| System Revenue Series A 5.25% 1/1/16 (AMBAC) | 1,000,000 | 1,176,340 | ||||||
| Western Minnesota Municipal Power Agency Supply | ||||||||
| Revenue Series A 5.00% 1/1/30 (NATL-RE) | 1,335,000 | 1,363,796 | ||||||
| 10,760,001 | ||||||||
| Healthcare Revenue Bonds – 33.87% | ||||||||
| Aitkin Health Care Facilities Revenue Refunding | ||||||||
| (Riverwood Health Care Center) 5.50% 2/1/24 | 700,000 | 700,616 | ||||||
| Anoka County Housing & Redevelopment Authority | ||||||||
| Revenue Series A 6.875% 5/1/40 | 1,000,000 | 1,031,910 | ||||||
| Apple Valley Economic Development Authority | ||||||||
| Health Care Revenue | ||||||||
| (Augustanna Home St. Paul Project) | ||||||||
| Series A 5.80% 1/1/30 | 1,000,000 | 1,008,570 | ||||||
| Bemidji Health Care Facilities First Mortgage Revenue | ||||||||
| (North Country Health Services) | ||||||||
| 5.00% 9/1/31 (RADIAN) | 1,350,000 | 1,343,048 | ||||||
| Refunding 5.00% 9/1/20 | 1,150,000 | 1,207,684 | ||||||
| Breckenridge Catholic Health Initiatives | ||||||||
| Series A 5.00% 5/1/30 | 2,000,000 | 2,069,540 | ||||||
| Detroit Lakes Housing & Health Facilities | ||||||||
| Revenue Refunding (Mankato Lutheran Homes) | ||||||||
| Series D 5.50% 8/1/21 | 500,000 | 500,095 | ||||||
| Glencoe Health Care Facilities Revenue | ||||||||
| (Glencoe Regional Health Services Project) | ||||||||
| 5.00% 4/1/20 | 1,100,000 | 1,129,271 | ||||||
| 5.00% 4/1/31 | 1,965,000 | 1,910,766 | ||||||
| Mahtomedi Senior Housing Revenue Refunding | ||||||||
| (St. Andrews Village Project) 5.75% 12/1/40 | 1,000,000 | 912,190 | ||||||
| Maple Grove Health Care Facilities Revenue | ||||||||
| (North Memorial Health Care) 5.00% 9/1/35 | 1,880,000 | 1,882,463 | ||||||
| Maple Grove Health Care System Revenue | ||||||||
| (Maple Grove Hospital) | ||||||||
| 5.25% 5/1/28 | 2,200,000 | 2,273,501 | ||||||
| 5.25% 5/1/37 | 1,000,000 | 1,014,520 | ||||||
41
Statements of net assets
Delaware Minnesota High-Yield Municipal Bond Fund
Delaware Minnesota High-Yield Municipal Bond Fund
| Principal amount | Value | |||||||
| Municipal Bonds (continued) | ||||||||
| Healthcare Revenue Bonds (continued) | ||||||||
| Minneapolis Health Care System Revenue | ||||||||
| (Fairview Health Services) | ||||||||
| Series A 6.625% 11/15/28 | $ | 1,900,000 | $ | 2,203,999 | ||||
| Series B 6.50% 11/15/38 (ASSURED GTY) | 250,000 | 288,138 | ||||||
| Series D 5.00% 11/15/34 (AMBAC) | 3,000,000 | 3,056,189 | ||||||
| Minneapolis-St. Paul Housing & Redevelopment Authority | ||||||||
| (Health Partners Obligation Group Project) 6.00% 12/1/17 | 525,000 | 561,125 | ||||||
| Minnesota Agricultural & Economic Development Board | ||||||||
| Revenue (Benedictine Health Systems) 5.75% 2/1/29 | 1,000,000 | 960,040 | ||||||
| Moorhead Economic Development Authority Multifamily | ||||||||
| Housing Revenue Refunding | ||||||||
| (Eventide Project) Series A 5.15% 6/1/29 | 550,000 | 511,071 | ||||||
| Northfield Hospital Revenue 5.375% 11/1/31 | 1,000,000 | 1,004,350 | ||||||
| Oak Park Heights Housing Revenue | ||||||||
| (Oakgreen Commons Project) 7.00% 8/1/45 | 1,500,000 | 1,524,510 | ||||||
| Owatonna Senior Housing Revenue | ||||||||
| (Senior Living Project) Series A | ||||||||
| 5.80% 10/1/29 | 400,000 | 394,980 | ||||||
| 6.00% 4/1/41 | 1,250,000 | 1,197,688 | ||||||
| Rochester Health Care & Housing Revenue | ||||||||
| (Samaritan Bethany) Refunding Series A | ||||||||
| 6.875% 12/1/29 | 1,000,000 | 1,056,940 | ||||||
| 7.375% 12/1/41 | 375,000 | 399,098 | ||||||
| Sartell Health Care Facilities Revenue | ||||||||
| (Country Manor Campus) Series A 6.25% 9/1/36 | 925,000 | 940,697 | ||||||
| Shakopee Health Care Facilities Revenue | ||||||||
| (St. Francis Regional Medical Center) 5.25% 9/1/34 | 1,000,000 | 991,910 | ||||||
| St. Cloud Health Care Revenue | ||||||||
| (Centracare Health System Project) | ||||||||
| 5.50% 5/1/39 (ASSURED GTY) | 1,500,000 | 1,604,565 | ||||||
| Series A 5.125% 5/1/30 | 1,125,000 | 1,189,496 | ||||||
| St. Louis Park Health Care Facilities Revenue Refunding | ||||||||
| (Park Nicollet Health Services) | ||||||||
| 5.75% 7/1/39 | 1,500,000 | 1,540,605 | ||||||
| Series C 5.50% 7/1/23 | 1,000,000 | 1,067,040 | ||||||
| St. Paul Housing & Redevelopment Authority | ||||||||
| Health Care Facilities Revenue | ||||||||
| (Health Partners Obligation Group Project) 5.25% 5/15/36 | 1,000,000 | 983,290 | ||||||
| (Senior Carondelet Village Project) Series A 6.00% 8/1/42 | 770,000 | 776,445 | ||||||
42
| Principal amount | Value | |||||||
| Municipal Bonds (continued) | ||||||||
| Healthcare Revenue Bonds (continued) | ||||||||
| St. Paul Housing & Redevelopment Authority Health Care | ||||||||
| Revenue (Allina Health System) | ||||||||
| Series A 5.00% 11/15/18 (NATL-RE) | $ | 1,900,000 | $ | 2,127,525 | ||||
| St. Paul Housing & Redevelopment Authority Hospital | ||||||||
| Revenue (Health East Project) | ||||||||
| 6.00% 11/15/25 | 1,000,000 | 1,012,800 | ||||||
| 6.00% 11/15/30 | 1,000,000 | 999,890 | ||||||
| Series A 5.70% 11/1/15 | 705,000 | 705,275 | ||||||
| Series B 5.85% 11/1/17 | 250,000 | 250,108 | ||||||
| St. Paul Housing & Redevelopment Authority Multifamily | ||||||||
| Housing Revenue Refunding | ||||||||
| (Marion Center Project) Series A 5.375% 5/1/43 | 1,000,000 | 883,430 | ||||||
| Stillwater Health Care Revenue | ||||||||
| (Health System Obligation Group) | ||||||||
| 5.00% 6/1/25 | 2,000,000 | 2,051,840 | ||||||
| 5.00% 6/1/35 | 1,000,000 | �� | 1,003,700 | |||||
| @ | Twin Valley Congregate Housing Revenue | |||||||
| (Living Options Project) 5.95% 11/1/28 | 1,825,000 | 1,743,368 | ||||||
| Winona Health Care Facilities Revenue Refunding | ||||||||
| (Winona Health Obligation Group) 5.15% 7/1/31 | 1,500,000 | 1,437,045 | ||||||
| 51,451,331 | ||||||||
| Housing Revenue Bonds – 11.25% | ||||||||
| Chanhassen Multifamily Housing Revenue Refunding | ||||||||
| (Heritage Park Apartments Project) | ||||||||
| 6.20% 7/1/30 (FHA) (AMT) (HUD) | 300,000 | 300,336 | ||||||
| Chaska Multifamily Housing Revenue (West Suburban | ||||||||
| Housing Partners Project) 5.875% 3/1/31 (AMT) | 1,000,000 | 830,320 | ||||||
| Minneapolis Multifamily Housing Revenue | ||||||||
| (Grant Street Apartments Project) Refunding | ||||||||
| Series A 7.25% 11/1/29 | 2,085,000 | 2,109,144 | ||||||
| (Olson Townhomes Project) 6.00% 12/1/19 (AMT) | 1,265,000 | 1,265,822 | ||||||
| (Trinity Apartments) Refunding | ||||||||
| Series A 6.75% 5/1/21 (HUD) | 575,000 | 581,756 | ||||||
| Minneapolis-St. Paul Housing Finance Board Single | ||||||||
| Family Mortgage (City Living Project) | ||||||||
| Series A-2 5.00% 12/1/38 (GNMA) (FNMA) (AMT) | 782,218 | 795,305 | ||||||
43
Statements of net assets
Delaware Minnesota High-Yield Municipal Bond Fund
Delaware Minnesota High-Yield Municipal Bond Fund
| Principal amount | Value | |||||||
| Municipal Bonds (continued) | ||||||||
| Housing Revenue Bonds (continued) | ||||||||
| Minnesota Housing Finance Agency | ||||||||
| (Rental Housing) | ||||||||
| Series A 4.875% 8/1/24 (AMT) | $ | 585,000 | $ | 590,751 | ||||
| Series A-1 5.00% 8/1/40 (AMT) | 2,265,000 | 2,278,635 | ||||||
| (Residential Housing) | ||||||||
| Series G 5.00% 7/1/36 (AMT) | 1,000,000 | 1,007,180 | ||||||
| Series I 4.85% 7/1/38 (AMT) | 1,145,000 | 1,144,931 | ||||||
| Series L 5.10% 7/1/38 (AMT) | 1,500,000 | 1,520,145 | ||||||
| Series M 4.875% 7/1/37 (AMT) | 2,500,000 | 2,505,075 | ||||||
| (Single Family Mortgage) Series E 6.25% 1/1/23 (AMT) | 5,000 | 5,007 | ||||||
| St. Paul Housing & Redevelopment Authority | ||||||||
| Multifamily Housing Revenue (Shelby Grotto Housing Project) | ||||||||
| 5.50% 9/20/44 (AMT) (GNMA) (FHA) | 750,000 | 769,433 | ||||||
| Stillwater Multifamily Housing Revenue | ||||||||
| (Orleans Homes Project) 5.50% 2/1/42 (AMT) | 750,000 | 623,280 | ||||||
| @ | Washington County Housing & Redevelopment Authority | |||||||
| Revenue Refunding (Briar Pond Project) | ||||||||
| Series B 7.125% 8/20/34 | 800,000 | 761,712 | ||||||
| 17,088,832 | ||||||||
| Lease Revenue Bonds – 2.76% | ||||||||
| Hibbing Economic Development Authority Revenue | ||||||||
| (Public Project - Hibbing Lease Obligation) 6.40% 2/1/12 | 275,000 | 275,242 | ||||||
| St. Paul Port Authority Lease Revenue (Robert Street Office | ||||||||
| Building Project) Series 3-11 5.00% 12/1/27 | 1,000,000 | 1,048,940 | ||||||
| University of Minnesota Special Purpose Revenue | ||||||||
| (State Supported Stadium Debt) 5.00% 8/1/29 | 2,660,000 | 2,863,383 | ||||||
| 4,187,565 | ||||||||
| Local General Obligation Bonds – 11.21% | ||||||||
| Chaska Independent School District #112 | ||||||||
| Series A 4.50% 2/1/28 (NATL-RE) | 1,000,000 | 1,058,470 | ||||||
| Farmington Independent School District #192 | ||||||||
| Series B 5.00% 2/1/27 (AGM) | 1,000,000 | 1,077,190 | ||||||
| Foley Independent School District #51 (School Building) | ||||||||
| Refunding Series A 5.00% 2/1/21 | 1,105,000 | 1,246,020 | ||||||
| Hopkins Independent School District #270 Facilities | ||||||||
| 5.00% 2/1/26 (NATL-RE) | 1,055,000 | 1,140,972 | ||||||
| Lakeville Independent School District #194 | ||||||||
| Series A 4.75% 2/1/22 (AGM) | 1,000,000 | 1,050,340 | ||||||
44
| Principal amount | Value | |||||||
| Municipal Bonds (continued) | ||||||||
| Local General Obligation Bonds (continued) | ||||||||
| Metropolitan Council Minneapolis-St. Paul Metropolitan | ||||||||
| Area Waste Water Treatment | ||||||||
| Series B 5.00% 12/1/21 | $ | 500,000 | $ | 573,115 | ||||
| Series C 5.00% 3/1/28 | 1,000,000 | 1,097,260 | ||||||
| Minneapolis Various Purposes 4.00% 12/1/23 | 1,500,000 | 1,614,720 | ||||||
| Moorhead Improvement Series B 5.00% 2/1/33 (NATL-RE) | 750,000 | 777,833 | ||||||
| Perham Disposal System 6.00% 5/1/22 (AMT) | 1,500,000 | 1,515,690 | ||||||
| South Washington County Independent | ||||||||
| School District #833 Series A 4.75% 2/1/27 | 1,500,000 | 1,645,635 | ||||||
| Todd Morrison Cass & Wadena Counties United | ||||||||
| Hospital District (Health Care Facilities-Lakewood) | ||||||||
| 5.00% 12/1/21 | 610,000 | 652,529 | ||||||
| 5.125% 12/1/24 | 205,000 | 217,374 | ||||||
| 5.25% 12/1/26 | 1,540,000 | 1,632,369 | ||||||
| White Bear Lake Independent School District #624 | ||||||||
| (Formerly Joint Independent Consolidated | ||||||||
| Ramsey County School District #39 & Washington & | ||||||||
| Anoka Counties School District #103) | ||||||||
| Series B 4.75% 2/1/22 | 1,500,000 | 1,728,570 | ||||||
| 17,028,087 | ||||||||
| §Pre-Refunded/Escrowed to Maturity Bonds – 7.23% | ||||||||
| Andover Economic Development Authority Public Facilities | ||||||||
| Lease Revenue (Andover Community Center) | ||||||||
| 5.20% 2/1/34-14 | 1,000,000 | 1,110,090 | ||||||
| Duluth Economic Development Authority Health | ||||||||
| Care Facilities Revenue | ||||||||
| (Benedictine Health System - St. Mary’s Hospital) | ||||||||
| 5.25% 2/15/28-14 | 1,000,000 | 1,157,970 | ||||||
| 5.25% 2/15/33-14 | 2,250,000 | 2,605,433 | ||||||
| Minneapolis Community Development Agency | ||||||||
| Supported Development Revenue | ||||||||
| (Limited Tax Common Bond Fund) | ||||||||
| Series G-3 5.45% 12/1/31-11 | 1,000,000 | 1,062,570 | ||||||
| Minneapolis Health Care System Revenue | ||||||||
| (Allina Health Systems) Series A 5.75% 11/15/32-12 | 1,500,000 | 1,676,025 | ||||||
| (Fairview Health Services) Series A 5.625% 5/15/32-12 | 2,000,000 | 2,201,120 | ||||||
| St. Louis Park Health Care Facilities Revenue | ||||||||
| (Park Nicollet Health Services) Series B 5.25% 7/1/30-14 | 1,000,000 | 1,161,680 | ||||||
| 10,974,888 | ||||||||
45
Statements of net assets
Delaware Minnesota High-Yield Municipal Bond Fund
Delaware Minnesota High-Yield Municipal Bond Fund
| Principal amount | Value | |||||||
| Municipal Bonds (continued) | ||||||||
| Special Tax Revenue Bonds – 7.69% | ||||||||
| Hennepin County Sales Tax Revenue | ||||||||
| (First Lien - Ball Park Project) Series B 5.00% 12/15/24 | $ | 1,000,000 | $ | 1,150,220 | ||||
| (Second Lien - Ballpark Project) Series B | ||||||||
| 5.00% 12/15/20 | 1,500,000 | 1,762,381 | ||||||
| 5.00% 12/15/24 | 1,000,000 | 1,144,530 | ||||||
| Minneapolis Supported Development Revenue | ||||||||
| (Limited Tax Common Bond Fund) | ||||||||
| Series 2-A 5.00% 6/1/28 (AMT) | 1,170,000 | 1,177,909 | ||||||
| Minneapolis Tax Increment Revenue | ||||||||
| @(Ivy Tower Project) 5.70% 2/1/29 | 785,000 | 563,897 | ||||||
| (St. Anthony Falls Project) 5.65% 2/1/27 | 500,000 | 474,360 | ||||||
| Minnesota 911 Revenue (Public Safety Radio Commission | ||||||||
| System Project) 5.00% 6/1/24 (ASSURED GTY) | 1,000,000 | 1,134,160 | ||||||
| Puerto Rico Commonwealth Infrastructure Financing | ||||||||
| Authority Special Tax Revenue Series B 5.00% 7/1/46 | 800,000 | 800,584 | ||||||
| Puerto Rico Sales Tax Financing Sales Tax Revenue | ||||||||
| First Subordinate Series A 5.75% 8/1/37 | 790,000 | 846,848 | ||||||
| St. Paul Port Authority (Brownsfields Redevelopment Tax) | ||||||||
| Series 2 5.00% 3/1/37 | 1,500,000 | 1,581,165 | ||||||
| Virgin Islands Public Finance Authority Revenue | ||||||||
| (Senior Lien Matching Fund Loan Note) | ||||||||
| Series A 5.25% 10/1/24 | 1,000,000 | 1,042,420 | ||||||
| 11,678,474 | ||||||||
| State General Obligation Bonds – 1.64% | ||||||||
| Minnesota State 5.00% 8/1/21 (AGM) | 1,250,000 | 1,393,062 | ||||||
| Puerto Rico Commonwealth Public Improvement | ||||||||
| Refunding Series C 6.00% 7/1/39 | 1,010,000 | 1,096,345 | ||||||
| 2,489,407 | ||||||||
| Transportation Revenue Bond – 1.34% | ||||||||
| Minneapolis - St. Paul Metropolitan Airports Commission | ||||||||
| Revenue Series A 5.00% 1/1/28 (NATL-RE) | 2,000,000 | 2,041,780 | ||||||
| 2,041,780 | ||||||||
| Water & Sewer Revenue Bonds – 2.58% | ||||||||
| Minnesota Public Facilities Authority Clean Water Revenue | ||||||||
| Series B 5.00% 3/1/18 | 2,000,000 | 2,450,900 | ||||||
| St. Paul Sewer Revenue Series D 5.00% 12/1/19 | 1,220,000 | 1,470,429 | ||||||
| 3,921,329 | ||||||||
| Total Municipal Bonds (cost $143,274,492) | 149,544,944 | |||||||
46
| Number of shares | Value | ||||||
| Short-Term Investments – 0.60% | |||||||
| Money Market Instrument – 0.40% | |||||||
| Federated Minnesota Municipal Cash Trust | 600,795 | $ | 600,795 | ||||
| 600,795 | |||||||
| Principal amount | |||||||
| Variable Rate Demand Note – 0.20% | |||||||
| • | Minneapolis-St. Paul Housing & Redevelopment Authority | ||||||
| Health Care Revenue (Allina Health System) Series B-1 | |||||||
| 0.26% 11/15/35 (LOC – JP Morgan Chase Bank) | $300,000 | 300,000 | |||||
| 300,000 | |||||||
| Total Short-Term Investments (cost $900,795) | 900,795 | ||||||
| Total Value of Securities – 99.05% | |||||||
| (cost $144,175,287) | 150,445,739 | ||||||
| Receivables and Other Assets | |||||||
| Net of Liabilities – 0.95% | 1,449,334 | ||||||
| Net Assets Applicable to 14,177,234 | |||||||
| Shares Outstanding – 100.00% | $ | 151,895,073 | |||||
| Net Asset Value – Delaware Minnesota High-Yield Municipal Bond Fund | |||||||
| Class A ($119,038,255 / 11,115,048 Shares) | $10.71 | ||||||
| Net Asset Value – Delaware Minnesota High-Yield Municipal Bond Fund | |||||||
| Class B ($4,130,374 / 385,136 Shares) | $10.72 | ||||||
| Net Asset Value – Delaware Minnesota High-Yield Municipal Bond Fund | |||||||
| Class C ($28,726,444 / 2,677,050 Shares) | $10.73 | ||||||
| Components of Net Assets at August 31, 2010: | |||||||
| Shares of beneficial interest (unlimited authorization – no par) | $ | 149,800,038 | |||||
| Undistributed net investment income | 37 | ||||||
| Accumulated net realized loss on investments | (4,175,454 | ) | |||||
| Net unrealized appreciation of investments | 6,270,452 | ||||||
| Total net assets | $ | 151,895,073 | |||||
47
Statements of net assets
Delaware Minnesota High-Yield Municipal Bond Fund
Delaware Minnesota High-Yield Municipal Bond Fund
| § | Pre-Refunded bonds. Municipal bonds that are generally backed or secured by U.S. Treasury bonds. For Pre-Refunded bonds, the stated maturity is followed by the year in which the bond is pre-refunded. See Note 9 in “Notes to financial statements.” |
| @ | Illiquid security. At August 31, 2010, the aggregate amount of illiquid securities was $3,068,977, which represented 2.02% of the Fund’s net assets. See Note 9 in “Notes to financial statements.” |
| • | Variable rate security. The rate shown is the rate as of August 31, 2010. Interest rates reset periodically. |
Summary of abbreviations:
AGM — Insured by Assured Guaranty Municipal Corporation
AMBAC — Insured by the AMBAC Assurance Corporation
AMT — Subject to Alternative Minimum Tax
ASSURED GTY — Insured by the Assured Guaranty Corporation
FHA — Insured by the Federal Housing Administration
FNMA — Federal National Mortgage Association Collateral
GNMA — Government National Mortgage Association Collateral
HUD — Housing and Urban Development Section 8
LOC — Letter of Credit
NATL-RE — Insured by the National Public Finance Guarantee Corporation
RADIAN — Insured by Radian Asset Assurance
| Net Asset Value and Offering Price Per Share – | ||
| Delaware Minnesota High-Yield Municipal Bond Fund | ||
| Net asset value Class A (A) | $ | 10.71 |
| Sales charge (4.50% of offering price) (B) | 0.50 | |
| Offering price | $ | 11.21 |
| (A) | Net asset value per share, as illustrated, is the amount which would be paid upon redemption or repurchase of shares. |
| (B) | See the current prospectus for purchases of $100,000 or more. |
See accompanying Notes, which are an integral part of the financial statements.
48
Statements of operations
Year Ended August 31, 2010
| Delaware | Delaware | ||||||||||
| Delaware | Tax-Free | Minnesota | |||||||||
| Tax-Free | Minnesota | High-Yield | |||||||||
| Minnesota | Intermediate | Municipal | |||||||||
| Fund | Fund | Bond Fund | |||||||||
| Investment Income: | |||||||||||
| Interest | $ | 29,739,974 | $ | 4,205,202 | $ | 7,181,048 | |||||
| Expenses: | |||||||||||
| Management fees | 3,333,077 | 495,572 | 797,746 | ||||||||
| Distribution expenses – Class A | 1,429,728 | 214,424 | 284,175 | ||||||||
| Distribution expenses – Class B | 81,800 | 1,751 | 46,021 | ||||||||
| Distribution expenses – Class C | 363,559 | 130,038 | 266,649 | ||||||||
| Dividend disbursing and transfer agent | |||||||||||
| fees and expenses | 296,404 | 66,847 | 102,947 | ||||||||
| Accounting and administration expenses | 245,393 | 39,439 | 57,721 | ||||||||
| Legal fees | 64,167 | 17,739 | 18,477 | ||||||||
| Reports and statements to shareholders | 55,532 | 11,542 | 16,181 | ||||||||
| Registration fees | 47,503 | 27,906 | 8,605 | ||||||||
| Audit and tax | 42,494 | 16,232 | 18,419 | ||||||||
| Trustees’ fees | 37,342 | 5,667 | 8,316 | ||||||||
| Insurance fees | 24,021 | 3,573 | 5,535 | ||||||||
| Dues and services | 20,772 | 3,668 | 4,926 | ||||||||
| Pricing fees | 14,101 | 7,264 | 10,069 | ||||||||
| Custodian fees | 10,832 | 1,974 | 2,756 | ||||||||
| Consulting fees | 9,130 | 1,420 | 2,118 | ||||||||
| Trustees’ expenses | 2,688 | 413 | 583 | ||||||||
| 6,078,543 | 1,045,469 | 1,651,244 | |||||||||
| Less fees waived | (34,681 | ) | (34,611 | ) | (65,807 | ) | |||||
| Less waived distribution expenses – Class A | — | (85,694 | ) | — | |||||||
| Less expense paid indirectly | (357 | ) | (73 | ) | (115 | ) | |||||
| Total operating expenses | 6,043,505 | 925,091 | 1,585,322 | ||||||||
| Net Investment Income | 23,696,469 | 3,280,111 | 5,595,726 | ||||||||
50
| Delaware | Delaware | ||||||||
| Delaware | Tax-Free | Minnesota | |||||||
| Tax-Free | Minnesota | High-Yield | |||||||
| Minnesota | Intermediate | Municipal | |||||||
| Fund | Fund | Bond Fund | |||||||
| Net Realized and Unrealized Gain | |||||||||
| on Investments: | |||||||||
| Net realized gain on investments | $ | 1,833,214 | $ | 269,806 | $ | 498,563 | |||
| Net change in unrealized appreciation/ | |||||||||
| depreciation of investments | 25,429,642 | 4,114,787 | 10,746,599 | ||||||
| Net Realized and Unrealized Gain | |||||||||
| on Investments | 27,262,856 | 4,384,593 | 11,245,162 | ||||||
| Net Increase in Net Assets | |||||||||
| Resulting from Operations | $ | 50,959,325 | $ | 7,664,704 | $ | 16,840,888 | |||
See accompanying Notes, which are an integral part of the financial statements.
51
Statements of changes in net assets
Delaware Tax-Free Minnesota Fund
Delaware Tax-Free Minnesota Fund
| Year Ended | |||||||
| 8/31/10 | 8/31/09 | ||||||
| Increase in Net Assets from Operations: | |||||||
| Net investment income | $ | 23,696,469 | $ | 23,410,864 | |||
| Net realized gain on investments | 1,833,214 | 398,012 | |||||
| Net change in unrealized | |||||||
| appreciation/depreciation of investments | 25,429,642 | 4,329,928 | |||||
| Net increase in net assets resulting from operations | 50,959,325 | 28,138,804 | |||||
| Dividends and Distributions to Shareholders from: | |||||||
| Net Investment Income: | |||||||
| Class A | (22,294,999 | ) | (22,065,961 | ) | |||
| Class B | (258,145 | ) | (336,274 | ) | |||
| Class C | (1,147,610 | ) | (964,553 | ) | |||
| Net realized gain on investments: | |||||||
| Class A | — | (2,257,248 | ) | ||||
| Class B | — | (43,630 | ) | ||||
| Class C | — | (114,457 | ) | ||||
| (23,700,754 | ) | (25,782,123 | ) | ||||
| Capital Share Transactions: | |||||||
| Proceeds from shares sold: | |||||||
| Class A | 46,342,217 | 42,839,664 | |||||
| Class B | 307 | 137,140 | |||||
| Class C | 7,044,823 | 9,478,506 | |||||
| Net asset value of shares issued upon reinvestment | |||||||
| of dividends and distributions: | |||||||
| Class A | 14,438,208 | 15,962,228 | |||||
| Class B | 171,205 | 264,058 | |||||
| Class C | 866,714 | 810,983 | |||||
| 68,863,474 | 69,492,579 | ||||||
52
| Year Ended | |||||||
| 8/31/10 | 8/31/09 | ||||||
| Capital Share Transactions (continued): | |||||||
| Cost of shares repurchased: | |||||||
| Class A | $ | (58,794,667 | ) | $ | (76,315,603 | ) | |
| Class B | (2,806,931 | ) | (2,471,909 | ) | |||
| Class C | (4,726,887 | ) | (4,080,940 | ) | |||
| (66,328,485 | ) | (82,868,452 | ) | ||||
| Increase (decrease) in net assets derived from | |||||||
| capital share transactions | 2,534,989 | (13,375,873 | ) | ||||
| Net Increase (Decrease) in Net Assets | 29,793,560 | (11,019,192 | ) | ||||
| Net Assets: | |||||||
| Beginning of year | 603,072,505 | 614,091,697 | |||||
| End of year | $ | 632,866,065 | $ | 603,072,505 | |||
| Distributions in excess of | |||||||
| net investment income | $ | (144,194 | ) | $ | (144,872 | ) | |
See accompanying Notes, which are an integral part of the financial statements.
53
Statements of changes in net assets
Delaware Tax-Free Minnesota Intermediate Fund
Delaware Tax-Free Minnesota Intermediate Fund
| Year Ended | |||||||
| 8/31/10 | 8/31/09 | ||||||
| Increase (Decrease) in Net Assets from Operations: | |||||||
| Net investment income | $ | 3,280,111 | $ | 2,618,389 | |||
| Net realized gain (loss) on investments | 269,806 | (536,519 | ) | ||||
| Net change in unrealized | |||||||
| appreciation/depreciation of investments | 4,114,787 | 1,614,867 | |||||
| Net increase in net assets resulting from operations | 7,664,704 | 3,696,737 | |||||
| Dividends and Distributions to Shareholders from: | |||||||
| Net Investment Income: | |||||||
| Class A | (2,934,175 | ) | (2,352,412 | ) | |||
| Class B | (4,488 | ) | (16,198 | ) | |||
| Class C | (334,083 | ) | (247,432 | ) | |||
| (3,272,746 | ) | (2,616,042 | ) | ||||
| Capital Share Transactions: | |||||||
| Proceeds from shares sold: | |||||||
| Class A | 26,843,282 | 25,615,997 | |||||
| Class B | 71,813 | 23,351 | |||||
| Class C | 5,693,861 | 5,125,080 | |||||
| Net asset value of shares issued upon reinvestment | |||||||
| of dividends and distributions: | |||||||
| Class A | 1,875,774 | 1,512,023 | |||||
| Class B | 4,120 | 12,783 | |||||
| Class C | 241,743 | 170,452 | |||||
| 34,730,593 | 32,459,686 | ||||||
54
| Year Ended | |||||||
| 8/31/10 | 8/31/09 | ||||||
| Capital Share Transactions (continued): | |||||||
| Cost of shares repurchased: | |||||||
| Class A | $ | (13,988,840 | ) | $ | (8,485,220 | ) | |
| Class B | (231,461 | ) | (608,734 | ) | |||
| Class C | (3,128,847 | ) | (1,331,367 | ) | |||
| (17,349,148 | ) | (10,425,321 | ) | ||||
| Increase in net assets derived from | |||||||
| capital share transactions | 17,381,445 | 22,034,365 | |||||
| Net Increase in Net Assets | 21,773,403 | 23,115,060 | |||||
| Net Assets: | |||||||
| Beginning of year | 89,613,578 | 66,498,518 | |||||
| End of year | $ | 111,386,981 | $ | 89,613,578 | |||
| Undistributed net investment income | $ | 2,522 | $ | 2,522 | |||
See accompanying Notes, which are an integral part of the financial statements.
55
Statements of changes in net assets
Delaware Minnesota High-Yield Municipal Bond Fund
Delaware Minnesota High-Yield Municipal Bond Fund
| Year Ended | |||||||
| 8/31/10 | 8/31/09 | ||||||
| Increase (Decrease) in Net Assets from Operations: | |||||||
| Net investment income | $ | 5,595,726 | $ | 5,743,736 | |||
| Net realized gain (loss) on investments | 498,563 | (3,479,426 | ) | ||||
| Net change in unrealized | |||||||
| appreciation/depreciation of investments | 10,746,599 | 509,407 | |||||
| Net increase in net assets resulting from operations | 16,840,888 | 2,773,717 | |||||
| Dividends and Distributions to Shareholders from: | |||||||
| Net Investment Income: | |||||||
| Class A | (4,546,424 | ) | (4,628,073 | ) | |||
| Class B | (149,738 | ) | (192,230 | ) | |||
| Class C | (866,306 | ) | (911,013 | ) | |||
| (5,562,468 | ) | (5,731,316 | ) | ||||
| Capital Share Transactions: | |||||||
| Proceeds from shares sold: | |||||||
| Class A | 14,818,477 | 15,056,968 | |||||
| Class B | 157 | 73,695 | |||||
| Class C | 4,061,927 | 2,660,111 | |||||
| Net asset value of shares issued upon reinvestment | |||||||
| of dividends and distributions: | |||||||
| Class A | 2,929,971 | 2,988,359 | |||||
| Class B | 104,474 | 121,542 | |||||
| Class C | 629,003 | 647,117 | |||||
| 22,544,009 | 21,547,792 | ||||||
56
| Year Ended | |||||||
| 8/31/10 | 8/31/09 | ||||||
| Capital Share Transactions (continued): | |||||||
| Cost of shares repurchased: | |||||||
| Class A | $ | (15,506,059 | ) | $ | (24,926,201 | ) | |
| Class B | (1,328,942 | ) | (992,296 | ) | |||
| Class C | (2,778,753 | ) | (6,740,684 | ) | |||
| (19,613,754 | ) | (32,659,181 | ) | ||||
| Increase (decrease) in net assets derived from | |||||||
| capital share transactions | 2,930,255 | (11,111,389 | ) | ||||
| Net Increase (Decrease) in Net Assets | 14,208,675 | (14,068,988 | ) | ||||
| Net Assets: | |||||||
| Beginning of year | 137,686,398 | 151,755,386 | |||||
| End of year | $ | 151,895,073 | $ | 137,686,398 | |||
| Undistributed net investment income | $ | 37 | $ | 97 | |||
See accompanying Notes, which are an integral part of the financial statements.
57
Financial highlights
Delaware Tax-Free Minnesota Fund Class A
Delaware Tax-Free Minnesota Fund Class A
Selected data for each share of the Fund outstanding throughout each period were as follows:
| Net asset value, beginning of period |
| Income (loss) from investment operations: |
| Net investment income |
| Net realized and unrealized gain (loss) on investments |
| Total from investment operations |
| Less dividends and distributions from: |
| Net investment income |
| Net realized gain on investments |
| Total dividends and distributions |
| Net asset value, end of period |
| Total return1 |
| Ratios and supplemental data: |
| Net assets, end of period (000 omitted) |
| Ratio of expenses to average net assets excluding interest and fees on short-term floating |
| rate notes issued |
| Interest and fees on short-term floating rate notes issued |
| Total expenses2 |
| Ratio of expenses to average net assets excluding interest and fees on short-term floating |
| rate notes issued prior to fees waived and expense paid indirectly |
| Interest and fees on short-term floating rate notes issued |
| Total expenses prior to fees waived and expense paid indirectly2 |
| Ratio of net investment income to average net assets |
| Ratio of net investment income to average net assets |
| prior to fees waived and expense paid indirectly |
| Portfolio turnover |
1 Total investment return is based on the change in net asset value of a share during the period and assumes reinvestment of dividends and distributions at net asset value and does not reflect the impact of a sales charge. Total investment return during some of the periods shown reflects a waiver by the manager. Performance would have been lower had the waiver not been in effect. |
See accompanying Notes, which are an integral part of the financial statements.
58
| Year Ended | |||||||||||||||
| 8/31/10 | 8/31/09 | 8/31/08 | 8/31/07 | 8/31/06 | |||||||||||
| $12.180 | $12.120 | $12.170 | $12.490 | $12.690 | |||||||||||
| 0.484 | 0.474 | 0.495 | 0.511 | 0.511 | |||||||||||
| 0.550 | 0.107 | (0.041 | ) | (0.313 | ) | (0.172 | ) | ||||||||
| 1.034 | 0.581 | 0.454 | 0.198 | 0.339 | |||||||||||
| (0.484 | ) | (0.473 | ) | (0.502 | ) | (0.507 | ) | (0.513 | ) | ||||||
| — | (0.048 | ) | (0.002 | ) | (0.011 | ) | (0.026 | ) | |||||||
| (0.484 | ) | (0.521 | ) | (0.504 | ) | (0.518 | ) | (0.539 | ) | ||||||
| $12.730 | $12.180 | $12.120 | $12.170 | $12.490 | |||||||||||
| 8.66% | 5.04% | 3.77% | 1.58% | 2.78% | |||||||||||
| $586,651 | $559,393 | $574,914 | $578,194 | $381,720 | |||||||||||
| 0.93% | 0.92% | 0.93% | 0.94% | 0.93% | |||||||||||
| — | 0.01% | 0.18% | 0.29% | 0.26% | |||||||||||
| 0.93% | 0.93% | 1.11% | 1.23% | 1.19% | |||||||||||
| 0.93% | 0.94% | 0.93% | 0.96% | 0.94% | |||||||||||
| — | 0.01% | 0.18% | 0.29% | 0.26% | |||||||||||
| 0.93% | 0.95% | 1.11% | 1.25% | 1.20% | |||||||||||
| 3.89% | 4.03% | 4.05% | 4.12% | 4.11% | |||||||||||
| 3.89% | 4.01% | 4.05% | 4.10% | 4.10% | |||||||||||
| 20% | 20% | 17% | 7% | 13% | |||||||||||
2 Total expenses and total expenses prior to fees waived and expense paid indirectly includes interest and related expenses which include, but are not limited to, interest expense, remarketing fees, liquidity fees, and trustees’ fees in connection with the Fund’s participation in inverse floater programs. See Notes 1 and 8 in “Notes to financial statements.” |
59
Financial highlights
Delaware Tax-Free Minnesota Fund Class B
Delaware Tax-Free Minnesota Fund Class B
Selected data for each share of the Fund outstanding throughout each period were as follows:
| Net asset value, beginning of period |
| Income (loss) from investment operations: |
| Net investment income |
| Net realized and unrealized gain (loss) on investments |
| Total from investment operations |
| Less dividends and distributions from: |
| Net investment income |
| Net realized gain on investments |
| Total dividends and distributions |
| Net asset value, end of period |
| Total return1 |
| Ratios and supplemental data: |
| Net assets, end of period (000 omitted) |
| Ratio of expenses to average net assets excluding interest and fees on short-term floating |
| rate notes issued |
| Interest and fees on short-term floating rate notes issued |
| Total expenses2 |
| Ratio of expenses to average net assets excluding interest and fees on short-term floating |
| rate notes issued prior to fees waived and expense paid indirectly |
| Interest and fees on short-term floating rate notes issued |
| Total expenses prior to fees waived and expense paid indirectly2 |
| Ratio of net investment income to average net assets |
| Ratio of net investment income to average net assets |
| prior to fees waived and expense paid indirectly |
| Portfolio turnover |
1 Total investment return is based on the change in net asset value of a share during the period and assumes reinvestment of dividends and distributions at net asset value and does not reflect the impact of a sales charge. Total investment return during some of the periods shown reflects a waiver by the manager. Performance would have been lower had the waiver not been in effect. |
See accompanying Notes, which are an integral part of the financial statements.
60
| Year Ended | ||||||||||||||||
| 8/31/10 | 8/31/09 | 8/31/08 | 8/31/07 | 8/31/06 | ||||||||||||
| $12.190 | $12.130 | $12.180 | $12.500 | $12.700 | ||||||||||||
| 0.391 | 0.386 | 0.403 | 0.419 | 0.418 | ||||||||||||
| 0.550 | 0.107 | (0.041 | ) | (0.314 | ) | (0.172 | ) | |||||||||
| 0.941 | 0.493 | 0.362 | 0.105 | 0.246 | ||||||||||||
| (0.391 | ) | (0.385 | ) | (0.410 | ) | (0.414 | ) | (0.420 | ) | |||||||
| — | (0.048 | ) | (0.002 | ) | (0.011 | ) | (0.026 | ) | ||||||||
| (0.391 | ) | (0.433 | ) | (0.412 | ) | (0.425 | ) | (0.446 | ) | |||||||
| $12.740 | $12.190 | $12.130 | $12.180 | $12.500 | ||||||||||||
| 7.85% | 4.26% | 2.99% | 0.82% | 2.01% | ||||||||||||
| $7,234 | $9,506 | $11,593 | $15,674 | $11,354 | ||||||||||||
| 1.68% | 1.67% | 1.68% | 1.69% | 1.68% | ||||||||||||
| — | 0.01% | 0.18% | 0.29% | 0.26% | ||||||||||||
| 1.68% | 1.68% | 1.86% | 1.98% | 1.94% | ||||||||||||
| 1.68% | 1.69% | 1.68% | 1.71% | 1.69% | ||||||||||||
| — | 0.01% | 0.18% | 0.29% | 0.26% | ||||||||||||
| 1.68% | 1.70% | 1.86% | 2.00% | 1.95% | ||||||||||||
| 3.14% | 3.28% | 3.30% | 3.37% | 3.36% | ||||||||||||
| 3.14% | 3.26% | 3.30% | 3.35% | 3.35% | ||||||||||||
| 20% | 20% | 17% | 7% | 13% | ||||||||||||
2 Total expenses and total expenses prior to fees waived and expense paid indirectly includes interest and related expenses which include, but are not limited to, interest expense, remarketing fees, liquidity fees, and trustees’ fees in connection with the Fund’s participation in inverse floater programs. See Notes 1 and 8 in “Notes to financial statements.”
61
Financial highlights
Delaware Tax-Free Minnesota Fund Class C
Delaware Tax-Free Minnesota Fund Class C
Selected data for each share of the Fund outstanding throughout each period were as follows:
| Net asset value, beginning of period |
| Income (loss) from investment operations: |
| Net investment income |
| Net realized and unrealized gain (loss) on investments |
| Total from investment operations |
| Less dividends and distributions from: |
| Net investment income |
| Net realized gain on investments |
| Total dividends and distributions |
| Net asset value, end of period |
| Total return1 |
| Ratios and supplemental data: |
| Net assets, end of period (000 omitted) |
| Ratio of expenses to average net assets excluding interest and fees on short-term floating |
| rate notes issued |
| Interest and fees on short-term floating rate notes issued |
| Total expenses2 |
| Ratio of expenses to average net assets excluding interest and fees on short-term floating |
| rate notes issued prior to fees waived and expense paid indirectly |
| Interest and fees on short-term floating rate notes issued |
| Total expenses prior to fees waived and expense paid indirectly2 |
| Ratio of net investment income to average net assets |
| Ratio of net investment income to average net assets |
| prior to fees waived and expense paid indirectly |
| Portfolio turnover |
1 Total investment return is based on the change in net asset value of a share during the period and assumes reinvestment of dividends and distributions at net asset value and does not reflect the impact of a sales charge. Total investment return during some of the periods shown reflects a waiver by the manager. Performance would have been lower had the waiver not been in effect.
See accompanying Notes, which are an integral part of the financial statements.
62
| Year Ended | ||||||||||||||||
| 8/31/10 | 8/31/09 | 8/31/08 | 8/31/07 | 8/31/06 | ||||||||||||
| $12.220 | $12.160 | $12.200 | $12.530 | $12.720 | ||||||||||||
| 0.392 | 0.386 | 0.403 | 0.418 | 0.418 | ||||||||||||
| 0.560 | 0.107 | (0.031 | ) | (0.323 | ) | (0.162 | ) | |||||||||
| 0.952 | 0.493 | 0.372 | 0.095 | 0.256 | ||||||||||||
| (0.392 | ) | (0.385 | ) | (0.410 | ) | (0.414 | ) | (0.420 | ) | |||||||
| — | (0.048 | ) | (0.002 | ) | (0.011 | ) | (0.026 | ) | ||||||||
| (0.392 | ) | (0.433 | ) | (0.412 | ) | (0.425 | ) | (0.446 | ) | |||||||
| $12.780 | $12.220 | $12.160 | $12.200 | $12.530 | ||||||||||||
| 7.91% | 4.25% | 3.06% | 0.73% | 2.08% | ||||||||||||
| $38,981 | $34,174 | $27,585 | $26,830 | $15,125 | ||||||||||||
| 1.68% | 1.67% | 1.68% | 1.69% | 1.68% | ||||||||||||
| — | 0.01% | 0.18% | 0.29% | 0.26% | ||||||||||||
| 1.68% | 1.68% | 1.86% | 1.98% | 1.94% | ||||||||||||
| 1.68% | 1.69% | 1.68% | 1.71% | 1.69% | ||||||||||||
| — | 0.01% | 0.18% | 0.29% | 0.26% | ||||||||||||
| 1.68% | 1.70% | 1.86% | 2.00% | 1.95% | ||||||||||||
| 3.14% | 3.28% | 3.30% | 3.37% | 3.36% | ||||||||||||
| 3.14% | 3.26% | 3.30% | 3.35% | 3.35% | ||||||||||||
| 20% | 20% | 17% | 7% | 13% | ||||||||||||
2 Total expenses and total expenses prior to fees waived and expense paid indirectly includes interest and related expenses which include, but are not limited to, interest expense, remarketing fees, liquidity fees, and trustees’ fees in connection with the Fund’s participation in inverse floater programs. See Notes 1 and 8 in “Notes to financial statements.”
63
Financial highlights
Delaware Tax-Free Minnesota Intermediate Fund Class A
Delaware Tax-Free Minnesota Intermediate Fund Class A
Selected data for each share of the Fund outstanding throughout each period were as follows:
| Net asset value, beginning of period |
| Income (loss) from investment operations: |
| Net investment income |
| Net realized and unrealized gain (loss) on investments |
| Total from investment operations |
| Less dividends and distributions from: |
| Net investment income |
| Total dividends and distributions |
| Net asset value, end of period |
| Total return1 |
| Ratios and supplemental data: |
| Net assets, end of period (000 omitted) |
| Ratio of expenses to average net assets |
| Ratio of expenses to average net assets |
| prior to fees waived and expense paid indirectly |
| Ratio of net investment income to average net assets |
| Ratio of net investment income to average net assets |
| prior to fees waived and expense paid indirectly |
| Portfolio turnover |
1 Total investment return is based on the change in net asset value of a share during the period and assumes reinvestment of dividends and distributions at net asset value and does not reflect the impact of a sales charge. Total investment return during all of the periods shown reflects waivers by the manager and/or distributor. Performance would have been lower had the waivers not been in effect.
See accompanying Notes, which are an integral part of the financial statements.
64
| Year Ended | ||||||||||||||||
| 8/31/10 | 8/31/09 | 8/31/08 | 8/31/07 | 8/31/06 | ||||||||||||
| $10.820 | $10.720 | $10.610 | $10.860 | $11.010 | ||||||||||||
| 0.376 | 0.384 | 0.414 | 0.445 | 0.429 | ||||||||||||
| 0.469 | 0.100 | 0.110 | (0.250 | ) | (0.150 | ) | ||||||||||
| 0.845 | 0.484 | 0.524 | 0.195 | 0.279 | ||||||||||||
| (0.375 | ) | (0.384 | ) | (0.414 | ) | (0.445 | ) | (0.429 | ) | |||||||
| (0.375 | ) | (0.384 | ) | (0.414 | ) | (0.445 | ) | (0.429 | ) | |||||||
| $11.290 | $10.820 | $10.720 | $10.610 | $10.860 | ||||||||||||
| 7.96% | 4.67% | 5.00% | 1.80% | 2.62% | ||||||||||||
| $96,568 | $78,021 | $58,465 | $48,477 | $48,297 | ||||||||||||
| 0.82% | 0.75% | 0.75% | 0.76% | 0.75% | ||||||||||||
| 0.96% | 0.97% | 0.95% | 1.00% | 0.97% | ||||||||||||
| 3.42% | 3.62% | 3.83% | 4.11% | 3.96% | ||||||||||||
| 3.28% | 3.40% | 3.63% | 3.87% | 3.74% | ||||||||||||
| 22% | 12% | 27% | 15% | 11% | ||||||||||||
65
Financial highlights
Delaware Tax-Free Minnesota Intermediate Fund Class B
Delaware Tax-Free Minnesota Intermediate Fund Class B
Selected data for each share of the Fund outstanding throughout each period were as follows:
| Net asset value, beginning of period |
| Income (loss) from investment operations: |
| Net investment income |
| Net realized and unrealized gain (loss) on investments |
| Total from investment operations |
| Less dividends and distributions from: |
| Net investment income |
| Total dividends and distributions |
| Net asset value, end of period |
| Total return1 |
| Ratios and supplemental data: |
| Net assets, end of period (000 omitted) |
| Ratio of expenses to average net assets |
| Ratio of expenses to average net assets |
| prior to fees waived and expense paid indirectly |
| Ratio of net investment income to average net assets |
| Ratio of net investment income to average net assets |
| prior to fees waived and expense paid indirectly |
| Portfolio turnover |
1 Total investment return is based on the change in net asset value of a share during the period and assumes reinvestment of dividends and distributions at net asset value and does not reflect the impact of a sales charge. Total investment return during all of the periods shown reflects a waiver by the manager. Performance would have been lower had the waiver not been in effect.
See accompanying Notes, which are an integral part of the financial statements.
66
| Year Ended | ||||||||||||||||
| 8/31/10 | 8/31/09 | 8/31/08 | 8/31/07 | 8/31/06 | ||||||||||||
| $10.850 | $10.750 | $10.640 | $10.890 | $11.040 | ||||||||||||
| 0.284 | 0.295 | 0.322 | 0.353 | 0.337 | ||||||||||||
| 0.479 | 0.100 | 0.110 | (0.250 | ) | (0.150 | ) | ||||||||||
| 0.763 | 0.395 | 0.432 | 0.103 | 0.187 | ||||||||||||
| (0.283 | ) | (0.295 | ) | (0.322 | ) | (0.353 | ) | (0.337 | ) | |||||||
| (0.283 | ) | (0.295 | ) | (0.322 | ) | (0.353 | ) | (0.337 | ) | |||||||
| $11.330 | $10.850 | $10.750 | $10.640 | $10.890 | ||||||||||||
| 7.14% | 3.79% | 4.10% | 0.94% | 1.75% | ||||||||||||
| $170 | $317 | $908 | $1,713 | $1,993 | ||||||||||||
| 1.67% | 1.60% | 1.60% | 1.61% | 1.60% | ||||||||||||
| 1.71% | 1.72% | 1.70% | 1.75% | 1.72% | ||||||||||||
| 2.57% | 2.77% | 2.98% | 3.26% | 3.11% | ||||||||||||
| 2.53% | 2.65% | 2.88% | 3.12% | 2.99% | ||||||||||||
| 22% | 12% | 27% | 15% | 11% | ||||||||||||
67
Financial highlights
Delaware Tax-Free Minnesota Intermediate Fund Class C
Delaware Tax-Free Minnesota Intermediate Fund Class C
Selected data for each share of the Fund outstanding throughout each period were as follows:
| Net asset value, beginning of period |
| Income (loss) from investment operations: |
| Net investment income |
| Net realized and unrealized gain (loss) on investments |
| Total from investment operations |
| Less dividends and distributions from: |
| Net investment income |
| Total dividends and distributions |
| Net asset value, end of period |
| Total return1 |
| Ratios and supplemental data: |
| Net assets, end of period (000 omitted) |
| Ratio of expenses to average net assets |
| Ratio of expenses to average net assets |
| prior to fees waived and expense paid indirectly |
| Ratio of net investment income to average net assets |
| Ratio of net investment income to average net assets |
| prior to fees waived and expense paid indirectly |
| Portfolio turnover |
1 Total investment return is based on the change in net asset value of a share during the period and assumes reinvestment of dividends and distributions at net asset value and does not reflect the impact of a sales charge. Total investment return during all of the periods shown reflects a waiver by the manager. Performance would have been lower had the waiver not been in effect.
See accompanying Notes, which are an integral part of the financial statements.
68
| Year Ended | ||||||||||||||||
| 8/31/10 | 8/31/09 | 8/31/08 | 8/31/07 | 8/31/06 | ||||||||||||
| $10.840 | $10.740 | $10.630 | $10.880 | $11.030 | ||||||||||||
| 0.283 | 0.295 | 0.322 | 0.353 | 0.337 | ||||||||||||
| 0.479 | 0.100 | 0.110 | (0.250 | ) | (0.150 | ) | ||||||||||
| 0.762 | 0.395 | 0.432 | 0.103 | 0.187 | ||||||||||||
| (0.282 | ) | (0.295 | ) | (0.322 | ) | (0.353 | ) | (0.337 | ) | |||||||
| (0.282 | ) | (0.295 | ) | (0.322 | ) | (0.353 | ) | (0.337 | ) | |||||||
| $11.320 | $10.840 | $10.740 | $10.630 | $10.880 | ||||||||||||
| 7.14% | 3.78% | 4.10% | 0.94% | 1.75% | ||||||||||||
| $14,649 | $11,276 | $7,126 | $4,936 | $5,162 | ||||||||||||
| 1.67% | 1.60% | 1.60% | 1.61% | 1.60% | ||||||||||||
| 1.71% | 1.72% | 1.70% | 1.75% | 1.72% | ||||||||||||
| 2.57% | 2.77% | 2.98% | 3.26% | 3.11% | ||||||||||||
| 2.53% | 2.65% | 2.88% | 3.12% | 2.99% | ||||||||||||
| 22% | 12% | 27% | 15% | 11% | ||||||||||||
69
Financial highlights
Delaware Minnesota High-Yield Municipal Bond Fund Class A
Delaware Minnesota High-Yield Municipal Bond Fund Class A
Selected data for each share of the Fund outstanding throughout each period were as follows:
| Net asset value, beginning of period |
| Income (loss) from investment operations: |
| Net investment income |
| Net realized and unrealized gain (loss) on investments |
| Total from investment operations |
| Less dividends and distributions from: |
| Net investment income |
| Total dividends and distributions |
| Net asset value, end of period |
| Total return1 |
| Ratios and supplemental data: |
| Net assets, end of period (000 omitted) |
| Ratio of expenses to average net assets |
| Ratio of expenses to average net assets |
| prior to fees waived and expense paid indirectly |
| Ratio of net investment income to average net assets |
| Ratio of net investment income to average net assets |
| prior to fees waived and expense paid indirectly |
| Portfolio turnover |
1 Total investment return is based on the change in net asset value of a share during the period and assumes reinvestment of dividends and distributions at net asset value and does not reflect the impact of a sales charge. Total investment return during all of the periods shown reflects a waiver by the manager. Performance would have been lower had the waiver not been in effect.
See accompanying Notes, which are an integral part of the financial statements.
70
| Year Ended | |||||||||||||||
| 8/31/10 | 8/31/09 | 8/31/08 | 8/31/07 | 8/31/06 | |||||||||||
| $9.910 | $10.000 | $10.180 | $10.530 | $10.610 | |||||||||||
| 0.415 | 0.422 | 0.418 | 0.430 | 0.445 | |||||||||||
| 0.798 | (0.091 | ) | (0.180 | ) | (0.350 | ) | (0.082 | ) | |||||||
| 1.213 | 0.331 | 0.238 | 0.080 | 0.363 | |||||||||||
| (0.413 | ) | (0.421 | ) | (0.418 | ) | (0.430 | ) | (0.443 | ) | ||||||
| (0.413 | ) | (0.421 | ) | (0.418 | ) | (0.430 | ) | (0.443 | ) | ||||||
| $10.710 | $ 9.910 | $10.000 | $10.180 | $10.530 | |||||||||||
| 12.46% | 3.63% | 2.35% | 0.71% | 3.54% | |||||||||||
| $119,038 | $107,951 | $116,999 | $109,807 | $87,504 | |||||||||||
| 0.93% | 0.89% | 0.89% | 0.90% | 0.89% | |||||||||||
| 0.98% | 0.97% | 0.97% | 1.00% | 1.00% | |||||||||||
| 4.02% | 4.49% | 4.11% | 4.09% | 4.26% | |||||||||||
| 3.97% | 4.41% | 4.03% | 3.99% | 4.15% | |||||||||||
| 11% | 12% | 10% | 10% | 4% | |||||||||||
71
Financial highlights
Delaware Minnesota High-Yield Municipal Bond Fund Class B
Delaware Minnesota High-Yield Municipal Bond Fund Class B
Selected data for each share of the Fund outstanding throughout each period were as follows:
| Net asset value, beginning of period |
| Income (loss) from investment operations: |
| Net investment income |
| Net realized and unrealized gain (loss) on investments |
| Total from investment operations |
| Less dividends and distributions from: |
| Net investment income |
| Total dividends and distributions |
| Net asset value, end of period |
| Total return1 |
| Ratios and supplemental data: |
| Net assets, end of period (000 omitted) |
| Ratio of expenses to average net assets |
| Ratio of expenses to average net assets |
| prior to fees waived and expense paid indirectly |
| Ratio of net investment income to average net assets |
| Ratio of net investment income to average net assets |
| prior to fees waived and expense paid indirectly |
| Portfolio turnover |
1 Total investment return is based on the change in net asset value of a share during the period and assumes reinvestment of dividends and distributions at net asset value and does not reflect the impact of a sales charge. Total investment return during all of the periods shown reflects a waiver by the manager. Performance would have been lower had the waiver not been in effect. |
See accompanying Notes, which are an integral part of the financial statements.
72
| Year Ended | |||||||||||||||
| 8/31/10 | 8/31/09 | 8/31/08 | 8/31/07 | 8/31/06 | |||||||||||
| $9.920 | $10.010 | $10.190 | $10.550 | $10.630 | |||||||||||
| 0.338 | 0.352 | 0.341 | 0.351 | 0.367 | |||||||||||
| 0.798 | (0.091 | ) | (0.179 | ) | (0.360 | ) | (0.082 | ) | |||||||
| 1.136 | 0.261 | 0.162 | (0.009 | ) | 0.285 | ||||||||||
| (0.336 | ) | (0.351 | ) | (0.342 | ) | (0.351 | ) | (0.365 | ) | ||||||
| (0.336 | ) | (0.351 | ) | (0.342 | ) | (0.351 | ) | (0.365 | ) | ||||||
| $10.720 | $9.920 | $10.010 | $10.190 | $10.550 | |||||||||||
| 11.62% | 2.86% | 1.58% | (0.13% | ) | 2.77% | ||||||||||
| $4,130 | $4,995 | $5,907 | $7,334 | $9,578 | |||||||||||
| 1.68% | 1.64% | 1.64% | 1.65% | 1.64% | |||||||||||
| 1.73% | 1.72% | 1.72% | 1.75% | 1.75% | |||||||||||
| 3.27% | 3.74% | 3.36% | 3.34% | 3.51% | |||||||||||
| 3.22% | 3.66% | 3.28% | 3.24% | 3.40% | |||||||||||
| 11% | 12% | 10% | 10% | 4% | |||||||||||
73
Financial highlights
Delaware Minnesota High-Yield Municipal Bond Fund Class C
Delaware Minnesota High-Yield Municipal Bond Fund Class C
Selected data for each share of the Fund outstanding throughout each period were as follows:
| Net asset value, beginning of period |
| Income (loss) from investment operations: |
| Net investment income |
| Net realized and unrealized gain (loss) on investments |
| Total from investment operations |
| Less dividends and distributions from: |
| Net investment income |
| Total dividends and distributions |
| Net asset value, end of period |
| Total return1 |
| Ratios and supplemental data: |
| Net assets, end of period (000 omitted) |
| Ratio of expenses to average net assets |
| Ratio of expenses to average net assets |
| prior to fees waived and expense paid indirectly |
| Ratio of net investment income to average net assets |
| Ratio of net investment income to average net assets |
| prior to fees waived and expense paid indirectly |
| Portfolio turnover |
1 Total investment return is based on the change in net asset value of a share during the period and assumes reinvestment of dividends and distributions at net asset value and does not reflect the impact of a sales charge. Total investment return during all of the periods shown reflects a waiver by the manager. Performance would have been lower had the waiver not been in effect. |
See accompanying Notes, which are an integral part of the financial statements.
74
| Year Ended | |||||||||||||||
| 8/31/10 | 8/31/09 | 8/31/08 | 8/31/07 | 8/31/06 | |||||||||||
| $9.930 | $10.020 | $10.200 | $10.550 | $10.630 | |||||||||||
| 0.338 | 0.352 | 0.342 | 0.351 | 0.367 | |||||||||||
| 0.798 | (0.091 | ) | (0.181 | ) | (0.350 | ) | (0.082 | ) | |||||||
| 1.136 | 0.261 | 0.161 | 0.001 | 0.285 | |||||||||||
| (0.336 | ) | (0.351 | ) | (0.341 | ) | (0.351 | ) | (0.365 | ) | ||||||
| (0.336 | ) | (0.351 | ) | (0.341 | ) | (0.351 | ) | (0.365 | ) | ||||||
| $10.730 | $9.930 | $10.020 | $10.200 | $10.550 | |||||||||||
| 11.61% | 2.85% | 1.58% | (0.04% | ) | 2.76% | ||||||||||
| $28,727 | $24,740 | $28,849 | $26,016 | $20,516 | |||||||||||
| 1.68% | 1.64% | 1.64% | 1.65% | 1.64% | |||||||||||
| 1.73% | 1.72% | 1.72% | 1.75% | 1.75% | |||||||||||
| 3.27% | 3.74% | 3.36% | 3.34% | 3.51% | |||||||||||
| 3.22% | 3.66% | 3.28% | 3.24% | 3.40% | |||||||||||
| 11% | 12% | 10% | 10% | 4% | |||||||||||
75
| Notes to financial statements | |
| Delaware Minnesota Municipal Bond Funds | August 31, 2010 |
Voyageur Mutual Funds is organized as a Delaware statutory trust and offers five series: Delaware Minnesota High-Yield Municipal Bond Fund, Delaware National High-Yield Municipal Bond Fund, Delaware Tax-Free California Fund, Delaware Tax-Free Idaho Fund and Delaware Tax-Free New York Fund. Voyageur Tax-Free Funds is organized as a Delaware statutory trust and offers Delaware Tax-Free Minnesota Fund. Voyageur Intermediate Tax-Free Funds is organized as a Delaware statutory trust and offers Delaware Tax-Free Minnesota Intermediate Fund. Voyageur Mutual Funds, Voyageur Tax-Free Funds and Voyageur Intermediate Tax-Free Funds are individually referred to as a “Trust” and collectively as “Trusts”. These financial statements and the related notes pertain to Delaware Tax-Free Minnesota Fund, Delaware Tax-Free Minnesota Intermediate Fund and Delaware Minnesota High-Yield Municipal Bond Fund (each referred to as a “Fund ” or collectively as the “Funds”). The above Trusts are open-end investment companies. The Funds are considered diversified under the Investment Company Act of 1940, as amended, and offer Class A, Class B, and Class C shares. Class A shares are sold with a maximum front-end sales charge of up to 4.50% for Delaware Tax-Free Minnesota Fund and Delaware Minnesota High-Yield Municipal Bond Fund and up to 2.75% for Delaware Tax-Free Minnesota Intermediate Fund. Class A share purchases of $1,000,000 or more will incur a contingent deferred sales charge (CDSC) of 1% if redeemed during the first year and 0.50% during the second year for the Delaware Tax-Free Minnesota Fund and Delaware Minnesota High-Yield Municipal Bond Fund, and 0.75% for the Delaware Tax-Free Minnesota Intermediate Fund if redeemed within the first year, provided that Delaware Distributors, L.P. (DDLP) paid a financial advisor a commission on the purchase of those shares. Class B shares may be purchased only through dividend rei nvestment and certain permitted exchanges. Prior to June 1, 2007, Class B shares were sold with a CDSC that declined from 4% to zero for Delaware Tax-Free Minnesota Fund and Delaware Minnesota High-Yield Municipal Bond Fund, and declined from 2% to zero for Delaware Tax-Free Minnesota Intermediate Fund depending upon the period of time the shares were held. Class B shares will automatically convert to Class A shares on a quarterly basis approximately eight years after purchase for Delaware Tax-Free Minnesota Fund and Delaware Minnesota High-Yield Municipal Bond Fund and approximately five years after purchase for Delaware Tax-Free Minnesota Intermediate Fund. Class C shares are sold with a CDSC of 1%, if redeemed during the first twelve months.
The investment objective of Delaware Tax-Free Minnesota Fund is to seek as high a level of current income exempt from federal income tax and from the Minnesota state personal income tax, as is consistent with preservation of capital.
The investment objective of Delaware Tax-Free Minnesota Intermediate Fund is to seek to provide investors with preservation of capital and, secondarily, current income exempt from federal income tax and the Minnesota state personal income tax, by maintaining a dollar-weighted average effective portfolio maturity of 10 years or less.
76
The investment objective of Delaware Minnesota High-Yield Municipal Bond Fund is to seek as high a level of current income exempt from federal income tax and the Minnesota state personal income tax, primarily through investment in medium- and lower-grade municipal obligations.
1. Significant Accounting Policies
The following accounting policies are in accordance with U.S. generally accepted accounting principles (U.S. GAAP) and are consistently followed by the Funds.
Security Valuation — Debt securities are valued by an independent pricing service or broker. To the extent current market prices are not available, the pricing service may take into account developments related to the specific security, as well as transactions in comparable securities. Short-term debt securities are valued at market value. These securities will generally be categorized as Level 2 investments. Open-end investment companies are valued at their published net asset value. These securities will generally be categorized as Level 1 investments. Generally, other securities and assets for which market quotations are not readily available are valued at fair value as determined in good faith under the direction of each Fund’s Board of Trustees (each, a Board or, collectively, the Boards). In determining wheth er market quotations are readily available or fair valuation will be used, various factors will be taken into consideration, such as market closures or suspension of trading in a security. These securities will generally be categorized as Level 3 investments.
Federal Income Taxes — No provision for federal income taxes has been made as each Fund intends to continue to qualify for federal income tax purposes as a regulated investment company under Subchapter M of the Internal Revenue Code of 1986, as amended, and make the requisite distributions to shareholders. The Funds evaluate tax positions taken or expected to be taken in the course of preparing the Funds’ tax returns to determine whether the tax positions are “more likely- than-not” of being sustained by the applicable tax authority. Tax positions not deemed to meet the more-likely-than-not threshold are recorded as a tax benefit or expense in the current year. Management has analyzed the Funds’ tax positions taken on federal income tax returns for all open tax years (August 31, 2007 – Augus t 31, 2010), and has concluded that no provision for federal income tax is required in the Funds’ financial statements.
Class Accounting — Investment income and common expenses are allocated to the various classes of the Funds on the basis of “settled shares” of each class in relation to the net assets of the Funds. Realized and unrealized gain (loss) on investments are allocated to the various classes of the Funds on the basis of daily net assets of each class. Distribution expenses relating to a specific class are charged directly to that class.
Use of Estimates — The preparation of financial statements in conformity with U.S. GAAP requires management to make estimates and assumptions that affect the reported amounts of assets and liabilities and disclosure of contingent assets and liabilities at the date of the financial statements and the reported amounts of revenues and expenses during the reporting period. Actual results could differ from those estimates and such differences could be material.
77
Notes to financial statements
Delaware Minnesota Municipal Bond Funds
Delaware Minnesota Municipal Bond Funds
1. Significant Accounting Policies (continued)
Interest and Related Expenses — Interest and related expenses include, but are not limited to, interest expense, remarketing fees, liquidity fees, and trustees’ fees from the Funds’ participation in inverse floater programs where a Fund has transferred its own bonds to a trust that issues floating rate securities with an aggregate principal amount equal to the principal of the transferred bonds. In conveyance of the bond, the Funds receive the inverse floating rate securities and cash from the trust. As a result of certain rights retained by the Funds, the transfer of the bond is not considered a sale, but rather a form of financing for accounting purposes whereby the cash received is recorded as a liability and interest expense is recorded based on the interest rate of the floating rate securities. Remarketi ng fees, liquidity fees, and trustees’ expenses are recorded on the accrual basis. There were no interest and related expenses for the year ended August 31, 2010.
Other — Expenses directly attributable to the Funds are charged directly to the Funds. Other expenses common to various funds within the Delaware Investments® Family of Funds are generally allocated amongst such funds on the basis of average net assets. Management fees and some other expenses are paid monthly. Security transactions are recorded on the date the securities are purchased or sold (trade date) for financial reporting purposes. Costs used in calculating realized gains and losses on the sale of investment securities are those of the specific securities sold. Interest income is recorded on the accrual basis. Discounts and premiums are amortized to interest income over the lives of the respective securities. Each Fund declares dividends daily from net investment income and pays such dividends monthly and declares and pays distributions from net realized gain on investments, if any, annually. Such dividends and distributions, if any, are recorded on the ex-dividend date.
The Funds may receive earnings credits from their custodian when positive cash balances are maintained, which are used to offset custody fees. There were no earnings credits for the year ended August 31, 2010.
The Funds may receive earnings credits from their transfer agent when positive cash balances are maintained, which may be used to offset transfer agent fees. The expense paid under this arrangement is included in dividend disbursing and transfer agent fees and expenses on the statement of operations with the corresponding offset shown as “expense paid indirectly.” For the year ended August 31, 2010, the Funds earned the following under this agreement:
| Delaware Tax-Free | Delaware Minnesota | ||||
| Delaware Tax-Free | Minnesota | High-Yield Municipal | |||
| Minnesota Fund | Intermediate Fund | Bond Fund | |||
| $357 | $73 | $115 |
78
2. Investment Management, Administration Agreements and Other Transactions with Affiliates
In accordance with the terms of its respective investment management agreement, each Fund pays Delaware Management Company (DMC), a series of Delaware Management Business Trust and the investment manager, an annual fee, which is calculated based on each Fund’s average daily net assets as follows:
| Delaware Tax-Free | Delaware Minnesota | |||||
| Delaware Tax-Free | Minnesota | High-Yield Municipal | ||||
| Minnesota Fund | Intermediate Fund | Bond Fund | ||||
| On the first $500 million | 0.550% | 0.500% | 0.550% | |||
| On the next $500 million | 0.500% | 0.475% | 0.500% | |||
| On the next $1.5 billion | 0.450% | 0.450% | 0.450% | |||
| In excess of $2.5 billion | 0.425% | 0.425% | 0.425% |
DMC has voluntarily agreed to waive that portion, if any, of its management fee and reimburse Delaware Minnesota High-Yield Municipal Bond Fund to the extent necessary to ensure that total annual operating expenses, (excluding any 12b-1 plan expenses, taxes, interest, inverse floater program expenses, short sale and dividend interest expenses, brokerage fees, certain insurance costs, and nonroutine expenses or costs, including, but not limited to, those relating to reorganizations, litigation, conducting shareholder meetings, and liquidations) do not exceed 0.70% of average daily net assets from January 1, 2010 until such time as the waiver is discontinued. For purposes of this waiver and reimbursement, nonroutine expenses may also include such additional costs and expenses, as may be agreed upon from time to time by Delaware Minnesota High-Yield Municipal Bond Fund’s Board and DMC. This expense waiver and reimbursement applies only to expenses paid directly by the Fund, and may be discontinued at any time because it is voluntary. Prior to January 1, 2010, DMC had contractually agreed to waive that portion, if any, of each Fund’s management fees and reimburse the Funds to the extent necessary to ensure that total annual operating expenses (excluding any 12b-1 plan expenses, taxes, interest, inverse floater program expenses, brokerage fees, certain insurance costs and nonroutine expenses) did not exceed the specified percentages of average daily net assets as shown below:
| Delaware Tax-Free | Delaware Minnesota | |||||
| Delaware Tax Free | Minnesota | High-Yield Municipal | ||||
| Minnesota Fund | Intermediate Fund | Bond Fund | ||||
| Through December 31, 2009 | ||||||
| Operating expense limitation | ||||||
| as a percentage of average | ||||||
| daily net assets (per annum) | 0.67% | 0.60% | 0.64% | |||
| Expiration date | 12/31/09 | 12/31/09 | 12/31/09 |
79
Notes to financial statements
Delaware Minnesota Municipal Bond Funds
Delaware Minnesota Municipal Bond Funds
2. Investment Management, Administration Agreements and Other Transactions with Affiliates (continued)
Delaware Service Company, Inc. (DSC), an affiliate of DMC, provides fund accounting and financial administration oversight services to the Funds. For these services, the Funds pay DSC fees based on the aggregate daily net assets of the Delaware Investments® Family of Funds at the following annual rate: 0.0050% of the first $30 billion; 0.0045% of the next $10 billion; 0.0040% of the next $10 billion; and 0.0025% of aggregate average daily net assets in excess of $50 billion. The fees payable to DSC under the service agreement described above are allocated among all Funds in the Delaware Investments Family of Funds on a relative net asset value basis. For the year ended August 31, 2010, each Fund was charged for these services as follows:
| Delaware Tax-Free | Delaware Minnesota | ||||
| Delaware Tax-Free | Minnesota | High-Yield Municipal | |||
| Minnesota Fund | Intermediate Fund | Bond Fund | |||
| $30,831 | $4,956 | $7,252 |
DSC also provides dividend disbursing and transfer agency services. Each Fund pays DSC a monthly fee based on the number of shareholder accounts for dividend disbursing and transfer agent services.
Pursuant to a distribution agreement and distribution plan, each Fund pays DDLP, the distributor and an affiliate of DMC, an annual distribution and service fee not to exceed 0.25% of the average daily net assets of the Class A shares and 1.00% of the average daily net assets of the Class B and C shares. DDLP has contracted to limit Delaware Tax-Free Minnesota Intermediate Fund’s Class A shares 12b-1 fees through December 31, 2010 to no more than 0.15% of average daily net assets.
At August 31, 2010, the Funds had liabilities payable to affiliates as follows:
| Delaware Tax-Free | Delaware Minnesota | ||||||||||||||
| Delaware Tax-Free | Minnesota | High-Yield Municipal | |||||||||||||
| Minnesota Fund | Intermediate Fund | Bond Fund | |||||||||||||
| Investment management fee | |||||||||||||||
| payable to DMC | $ | 287,984 | $ | 46,652 | $ | 70,763 | |||||||||
| Dividend disbursing, transfer | |||||||||||||||
| agent and fund accounting | |||||||||||||||
| oversight fees and other | |||||||||||||||
| expenses payable to DSC | 13,066 | 2,579 | 3,816 | ||||||||||||
| Distribution fees payable | |||||||||||||||
| to DDLP | 162,547 | 24,485 | 52,545 | ||||||||||||
| Other expenses payable to | |||||||||||||||
| DMC and affiliates* | 17,777 | 3,810 | 5,434 | ||||||||||||
*DMC, as part of its administrative services, pays operating expenses on behalf of each Fund and is reimbursed on a periodic basis. Such expenses include items such as printing of shareholder reports, fees for audit, legal and tax services, registration fees and trustees’ fees.
80
As provided in the investment management agreement, each Fund bears the cost of certain legal and tax services, including internal legal and tax services provided to each Fund by DMC and/or its affiliates’ employees. For the year ended August 31, 2010, each Fund was charged for internal legal and tax services provided by DMC and/or its affiliates’ employees as follows:
| Delaware Tax-Free | Delaware Minnesota | ||||
| Delaware Tax-Free | Minnesota | High-Yield Municipal | |||
| Minnesota Fund | Intermediate Fund | Bond Fund | |||
| $26,635 | $4,225 | $5,824 |
For the year ended August 31, 2010, DDLP earned commissions on sales of Class A shares for each Fund as follows:
| Delaware Tax-Free | Delaware Minnesota | ||||
| Delaware Tax-Free | Minnesota | High-Yield Municipal | |||
| Minnesota Fund | Intermediate Fund | Bond Fund | |||
| $87,187 | $18,674 | $26,494 |
For the year ended August 31, 2010 DDLP received gross CDSC commissions on redemption of each Fund’s Class A, Class B and Class C shares, respectively, and these commissions were entirely used to offset up-front commissions previously paid by DDLP to broker/dealers on sales of those shares. The amounts received were as follows:
| Delaware Tax-Free | Delaware Minnesota | ||||||||||
| Delaware Tax-Free | Minnesota | High-Yield Municipal | |||||||||
| Minnesota Fund | Intermediate Fund | Bond Fund | |||||||||
| Class A | $ | 0 | $ | 0 | $ | 0 | |||||
| Class B | 1,355 | 0 | 3,969 | ||||||||
| Class C | 1,877 | 1,972 | 471 | ||||||||
Trustees’ fees include expenses accrued by the Funds for each Trustee’s retainer and meeting fees. Certain officers of DMC, DSC and DDLP are officers and/or Trustees of the Trusts. These officers and Trustees are paid no compensation by the Funds.
3. Investments
For the year ended August 31, 2010, the Funds made purchases and sales of investment securities other than short-term investments as follows:
| Delaware Tax-Free | Delaware Minnesota | |||||||
| Delaware Tax-Free | Minnesota | High-Yield Municipal | ||||||
| Minnesota Fund | Intermediate Fund | Bond Fund | ||||||
| Purchases | $129,078,299 | $40,066,852 | $19,834,598 | |||||
| Sales | 120,700,410 | 21,747,149 | 16,114,275 | |||||
81
Notes to financial statements
Delaware Minnesota Municipal Bond Funds
Delaware Minnesota Municipal Bond Funds
3. Investments (continued)
At August 31, 2010, the cost of investments and unrealized appreciation (depreciation) for federal income tax purposes for each Fund were as follows:
| Delaware Tax-Free | Delaware Minnesota | |||||||||||||
| Delaware Tax-Free | Minnesota | High-Yield Municipal | ||||||||||||
| Minnesota Fund | Intermediate Fund | Bond Fund | ||||||||||||
| Cost of investments | $ | 592,553,572 | $ | 103,650,005 | $ | 144,024,018 | ||||||||
| Aggregate unrealized appreciation | $ | 43,544,336 | $ | 7,195,034 | $ | 7,691,438 | ||||||||
| Aggregate unrealized depreciation | (949,514 | ) | (94,575 | ) | (1,269,717 | ) | ||||||||
| Net unrealized appreciation | $ | 42,594,822 | $ | 7,100,459 | $ | 6,421,721 | ||||||||
U.S. GAAP defines fair value as the price that the Funds would receive to sell an asset or pay to transfer a liability in an orderly transaction between market participants at the measurement date under current market conditions. A three level hierarchy for fair value measurements has been established based upon the transparency of inputs to the valuation of an asset or liability. Inputs may be observable or unobservable and refer broadly to the assumptions that market participants would use in pricing the asset or liability. Observable inputs reflect the assumptions market participants would use in pricing the asset or liability based on market data obtained from sources independent of the reporting entity. Unobservable inputs reflect the reporting entity’s own assumptions about the assumptions that market participants would use in pricing the asset or liability developed based on the best information available under the circumstanc es. Each Fund’s investment in its entirety is assigned a level based upon the observability of the inputs which are significant to the overall valuation. The three level hierarchy of inputs is summarized below.
| Level 1 | – | inputs are quoted prices in active markets for identical investments | ||
| Level 2 | – | other observable inputs (including, but not limited to: quoted prices for similar assets or liabilities in markets that are active, quoted prices for identical or similar assets or liabilities in markets that are not active, inputs other than quoted prices that are observable for the assets or liabilities (such as interest rates, yield curves, volatilities, prepayment speeds, loss severities, credit risks and default rates) or other market-corroborated inputs) | ||
| Level 3 | – | inputs are significant unobservable inputs (including the Funds’ own assumptions used to determine the fair value of investments.) |
82
The following table summarizes the valuation of the Funds’ investments by fair value hierarchy levels as of August 31, 2010:
| Delaware Tax-Free Minnesota Fund | ||||||||
| Level 1 | Level 2 | Total | ||||||
| Municipal Bonds | $ | — | $ | 634,425,280 | $ | 634,425,280 | ||
| Short-Term | 723,114 | — | 723,114 | |||||
| Total | $ | 723,114 | $ | 634,425,280 | $ | 635,148,394 | ||
| Delaware Tax-Free Minnesota Intermediate Fund | ||||||||
| Level 1 | Level 2 | Total | ||||||
| Municipal Bonds | $ | — | $ | 110,066,862 | $ | 110,066,862 | ||
| Short-Term | 183,602 | 500,000 | 683,602 | |||||
| Total | $ | 183,602 | $ | 110,566,862 | $ | 110,750,464 | ||
| Delaware Minnesota High-Yield Municipal Bond Fund | ||||||||
| Level 1 | Level 2 | Total | ||||||
| Municipal Bonds | $ | — | $ | 149,544,944 | $ | 149,544,944 | ||
| Short-Term | 600,795 | 300,000 | 900,795 | |||||
| Total | $ | 600,795 | $ | 149,844,944 | $ | 150,445,739 | ||
There were no Level 3 securities at the beginning or end of the year.
In January 2010, the Financial Accounting Standards Board issued an Accounting Standards Update, Improving Disclosures about Fair Value Measurements, which introduced new disclosure requirements and clarified certain existing disclosure requirements around fair value measurements currently presented above. The new disclosures and clarifications of existing disclosures are generally effective for the Funds’ fiscal year ending August 31, 2010 and interim periods therein. During the year ended August 31, 2010, there were no transfers between Level 1 investments and Level 2 investments and Level 3 investments that had a material impact to the Funds.
83
Notes to financial statements
Delaware Minnesota Municipal Bond Funds
Delaware Minnesota Municipal Bond Funds
4. Dividend and Distribution Information
Income and long-term capital gain distributions are determined in accordance with federal income tax regulations, which may differ from U.S. GAAP. Additionally, distributions from net short-term gains on sales of investment securities are treated as ordinary income for federal income tax purposes. The tax character of dividends and distributions paid during the years ended August 31, 2010 and 2009 was as follows:
| Delaware Tax-Free | Delaware Minnesota | |||||||||||||
| Delaware Tax-Free | Minnesota | High-Yield Municipal | ||||||||||||
| Minnesota Fund | Intermediate Fund | Bond Fund | ||||||||||||
| Year Ended 8/31/10 | ||||||||||||||
| Ordinary income | $ | 45,305 | $ | 17,672 | $ | 9,495 | ||||||||
| Tax-exempt income | 23,655,449 | 3,255,074 | 5,552,973 | |||||||||||
| Total | $ | 23,700,754 | $ | 3,272,746 | $ | 5,562,468 | ||||||||
| Year Ended 8/31/09 | ||||||||||||||
| Ordinary income | $ | 71,606 | $ | — | $ | 5,947 | ||||||||
| Tax-exempt income | 23,418,382 | 2,616,042 | 5,725,369 | |||||||||||
| Long-term capital gain | 2,292,135 | — | — | |||||||||||
| Total | $ | 25,782,123 | $ | 2,616,042 | $ | 5,731,316 | ||||||||
5. Components of Net Assets on a Tax Basis
As of August 31, 2010 the components of net assets on a tax basis were as follows:
| Delaware Tax-Free | �� | Delaware Minnesota | ||||||||||||
| Delaware Tax-Free | Minnesota | High-Yield Municipal | ||||||||||||
| Minnesota Fund | Intermediate Fund | Bond Fund | ||||||||||||
| Shares of beneficial interest | $ | 588,778,170 | $ | 105,025,082 | $ | 149,800,038 | ||||||||
| Distributions payable | (598,987 | ) | (89,337 | ) | (138,105 | ) | ||||||||
| Undistributed ordinary income | 971,790 | — | — | |||||||||||
| Undistributed long-term capital gain | 665,477 | — | — | |||||||||||
| Undistributed tax-exempt income | 454,793 | 91,859 | 138,142 | |||||||||||
| Capital loss carryforwards | — | (741,082 | ) | (4,326,723 | ) | |||||||||
| Unrealized appreciation of investments | 42,594,822 | 7,100,459 | 6,421,721 | |||||||||||
| Net assets | $ | 632,866,065 | $ | 111,386,981 | $ | 151,895,073 | ||||||||
The differences between book basis and tax basis components of net assets are primarily attributable to tax treatment of market discount and premium on debt instruments and distribution payables.
84
For financial reporting purposes, capital accounts are adjusted to reflect the tax character of permanent book/tax differences. Reclassifications are primarily due to tax treatment of market discount and premium on certain debt instruments and expiration of capital loss carryforwards. Results of operations and net assets were not affected by these reclassifications. For the year ended August 31, 2010 the Funds recorded the following reclassifications:
| Delaware Tax-Free | Delaware Minnesota | |||||||||||||
| Delaware Tax-Free | Minnesota | High-Yield Municipal | ||||||||||||
| Minnesota Fund | Intermediate Fund | Bond Fund | ||||||||||||
| Undistributed net investment income | $ | 4,963 | $ | (7,365 | ) | $ | (33,318 | ) | ||||||
| Accumulated realized gain | (4,963 | ) | 7,365 | 90,839 | ||||||||||
| Paid-in capital | — | — | (57,521 | ) | ||||||||||
For federal income tax purposes, capital loss carryforwards may be carried forward and applied against future capital gains. In 2010, $57,521 of capital loss carryforwards expired for the Delaware Minnesota High-Yield Municipal Bond Fund. In 2010, $34,687 of capital loss carryforwards was utilized for the Delaware Tax-Free Minnesota Intermediate Fund. Capital loss carryforwards remaining at August 31, 2010 will expire as follows:
| Delaware Tax-Free | Delaware Minnesota | |||||||||
| Minnesota | High-Yield Municipal | |||||||||
| Year of Expiration | Intermediate Fund | Bond Fund | ||||||||
| 2011 | $ | 216,009 | $ | 243,334 | ||||||
| 2012 | — | 684,248 | ||||||||
| 2014 | 81,340 | — | ||||||||
| 2015 | 109,745 | 96,079 | ||||||||
| 2016 | — | 198,826 | ||||||||
| 2017 | 333,988 | 129,724 | ||||||||
| 2018 | — | 2,974,512 | ||||||||
| Total | $ | 741,082 | $ | 4,326,723 | ||||||
85
Notes to financial statements
Delaware Minnesota Municipal Bond Funds
Delaware Minnesota Municipal Bond Funds
6. Capital Shares
Transactions in capital shares were as follows:
| Delaware | Delaware Tax-Free | Delaware Minnesota | |||||||||||||||
| Tax-Free | Minnesota | High-Yield Municipal | |||||||||||||||
| Minnesota Fund | Intermediate Fund | Bond Fund | |||||||||||||||
| Year Ended | Year Ended | Year Ended | |||||||||||||||
| 8/31/10 | 8/31/09 | 8/31/10 | 8/31/09 | 8/31/10 | 8/31/09 | ||||||||||||
| Shares sold: | |||||||||||||||||
| Class A | 3,733,307 | 3,674,457 | 2,446,624 | 2,423,967 | 1,436,037 | 1,614,974 | |||||||||||
| Class B | 25 | 11,946 | 6,542 | 2,214 | 15 | 7,863 | |||||||||||
| Class C | 565,348 | 807,342 | 516,889 | 486,526 | 393,200 | 281,808 | |||||||||||
| Shares issued upon reinvestment of dividends and distributions: | |||||||||||||||||
| Class A | 1,161,269 | 1,360,233 | 170,638 | 143,180 | 283,278 | 317,830 | |||||||||||
| Class B | 13,769 | 22,511 | 374 | 1,215 | 10,093 | 12,919 | |||||||||||
| Class C | 69,468 | 68,882 | 21,937 | 16,111 | 60,655 | 68,762 | |||||||||||
| 5,543,186 | 5,945,371 | 3,163,004 | 3,073,213 | 2,183,278 | 2,304,156 | ||||||||||||
| Shares repurchased: | |||||||||||||||||
| Class A | (4,736,716 | ) | (6,565,859 | ) | (1,277,249 | ) | (810,239 | ) | (1,501,476 | ) | (2,739,090 | ) | |||||
| Class B | (225,629 | ) | (210,875 | ) | (21,083 | ) | (58,625 | ) | (128,538 | ) | (107,260 | ) | |||||
| Class C | (379,026 | ) | (349,626 | ) | (284,347 | ) | (126,181 | ) | (269,385 | ) | (738,199 | ) | |||||
| (5,341,371 | ) | (7,126,360 | ) | (1,582,679 | ) | (995,045 | ) | (1,899,399 | ) | (3,584,549 | ) | ||||||
| Net increase (decrease) | 201,815 | (1,180,989 | ) | 1,580,325 | 2,078,168 | 283,879 | (1,280,393 | ) | |||||||||
For the year ended August 31, 2010 and 2009, the following shares and values were converted from Class B to Class A shares. The respective amounts are included in Class B redemptions and Class A subscriptions in the table above and the statements of changes in net assets.
| Year Ended | Year Ended | ||||||||||
| 8/31/10 | 8/31/09 | ||||||||||
| Class B | Class A | Class B | Class A | ||||||||
| Shares | Shares | Value | Shares | Shares | Value | ||||||
| Delaware Tax-Free | |||||||||||
| Minnesota Fund | 143,907 | 144,023 | $1,790,535 | 97,466 | 97,549 | $1,145,062 | |||||
| Delaware Tax-Free Minnesota | |||||||||||
| Intermediate Fund | 16,599 | 16,648 | 182,669 | 39,832 | 39,916 | 410,681 | |||||
| Delaware Minnesota High-Yield | |||||||||||
| Municipal Bond Fund | 77,229 | 77,360 | 799,041 | 38,299 | 38,350 | 356,368 | |||||
86
7. Line of Credit
Each Fund, along with certain other funds in the Delaware Investments® Family of Funds (Participants), participate in a $35,000,000 revolving line of credit with The Bank of New York Mellon (BNY Mellon) to be used for temporary or emergency purposes as an additional source of liquidity to fund redemptions of investor shares. Under the agreement, the Participants are charged an annual commitment fee, which is allocated across the Participants on the basis of each Participant’s allocation of the entire facility. The Participants may borrow up to a maximum of one third of their net assets under the agreement. The agreement expires on November 16, 2010. The Funds had no amounts outstanding as of August 31, 2010 or at any time during the year then ended.
8. Derivatives
U.S. GAAP requires enhanced disclosures that enable investors to understand: 1) how and why an entity uses derivatives, 2) how they are accounted for, and 3) how they affect an entity’s results of operations and financial position.
Inverse Floaters — Each Fund may participate in inverse floater programs where a Fund transfers its own bonds to a trust that issues floating rate securities and inverse floating rate securities (inverse floaters) with an aggregate principal amount equal to the principal of the transferred bonds. The inverse floaters received by the Funds are derivative tax-exempt obligations with floating or variable interest rates that move in the opposite direction of short-term interest rates, usually at an accelerated speed. Consequently, the market values of the inverse floaters will generally be more volatile than other tax-exempt investments. The Funds typically use inverse floaters to adjust the duration of their portfolio. Duration measures a portfolio’s sensitivity to changes in interest rates. By holding inverse floater s with a different duration than the underlying bonds that a Fund transferred to the trust, the Fund seeks to adjust its portfolio’s sensitivity to changes in interest rates. The Funds may also invest in inverse floaters to add additional income to the Funds or to adjust the Funds’ exposure to a specific segment of the yield curve. At August 31, 2010, the Funds held no investments in inverse floaters.
9. Credit and Market Risk
The Funds concentrate their investments in securities issued by municipalities, mainly in Minnesota. The value of these investments may be adversely affected by new legislation within the state, regional or local economic conditions, and differing levels of supply and demand for municipal bonds. Many municipalities insure repayment for their obligations. Although bond insurance reduces the risk of loss due to default by an issuer, such bonds remain subject to the risk that market value may fluctuate for other reasons and there is no assurance that the insurance company will meet its obligations. A real or perceived decline in creditworthiness of a bond insurer can have an adverse impact on the value of insured bonds held in each Fund. At August 31, 2010, the percentages of each Fund’s net assets insured by insurers are listed below and these securities have been identified in the statements of net assets.
| Delaware Tax-Free | Delaware Minnesota | |||||
| Delaware Tax-Free | Minnesota | High-Yield Municipal | ||||
| Minnesota Fund | Intermediate Fund | Bond Fund | ||||
| 22% | 21% | 15% |
87
Notes to financial statements
Delaware Minnesota Municipal Bond Funds
Delaware Minnesota Municipal Bond Funds
The Funds invest a portion of their assets in high yield fixed income securities, which carry ratings of BB or lower by Standard & Poor’s Ratings Group (S&P) and/or Ba or lower by Moody’s Investors Service, Inc. (Moody’s). Investments in these higher yielding securities are generally accompanied by a greater degree of credit risk than higher rated securities. Additionally, lower rated securities may be more susceptible to adverse economic and competitive industry conditions than investment grade securities.
The Funds may invest in advanced refunded bonds, escrow secured bonds or defeased bonds. Under current federal tax laws and regulations, state and local government borrowers are permitted to refinance outstanding bonds by issuing new bonds. The issuer refinances the outstanding debt to either reduce interest costs or to remove or alter restrictive covenants imposed by the bonds being refinanced. A refunding transaction where the municipal securities are being refunded within 90 days from the issuance of the refunding issue is known as a “current refunding.” “Advance refunded bonds” are bonds in which the refunded bond issue remains outstanding for more than 90 days following the issuance of the refunding issue. In an advance refunding, the issuer will use the proceeds of a new bond issue to purchase high grade interest bearing debt securities which are then deposited in an irrevocable escrow account held by an escro w agent to secure all future payments of principal and interest and bond premium of the advance refunded bond. Bonds are “escrowed to maturity” when the proceeds of the refunding issue are deposited in an escrow account for investment sufficient to pay all of the principal and interest on the original interest payment and maturity dates.
Bonds are considered “pre-refunded” when the refunding issue’s proceeds are escrowed only until a permitted call date or dates on the refunded issue with the refunded issue being redeemed at the time, including any required premium. Bonds become “defeased” when the rights and interests of the bondholders and of their lien on the pledged revenues or other security under the terms of the bond contract and are substituted with an alternative source of revenues (the escrow securities) sufficient to meet payments of principal and interest to maturity or to the first call dates. Escrowed secured bonds will often receive a rating of AAA from Moody’s, S&P, and/or Fitch Ratings due to the strong credit quality of the escrow securities and the irrevocable nature of the escrow deposit agreement.
Each Fund may invest up to 15% of its net assets in illiquid securities, which may include securities with contractual restrictions on resale, securities exempt from registration under Rule 144A of the Securities Act of 1933, as amended, and other securities which may not be readily marketable. The relative illiquidity of these securities may impair each Fund from disposing of them in a timely manner and at a fair price when it is necessary or desirable to do so. While maintaining oversight, each Fund’s Board has delegated to DMC the day-to-day functions of determining whether individual securities are liquid for purposes of each Fund’s limitation on investments in illiquid assets. Securities eligible for resale pursuant to Rule 144A, which are determined to be liquid, are not subject to the Funds’ 15% limit on investments in illiquid securities. As of August 31, 2010, there were no Rule 144A securities. Illiquid securiti es have been identified on the statements of net assets.
88
10. Contractual Obligations
The Funds enter into contracts in the normal course of business that contain a variety of indemnifications. The Funds’ maximum exposure under these arrangements is unknown. However, the Funds have not had prior claims or losses pursuant to these contracts. Management has reviewed each Fund’s existing contracts and expects the risk of loss to be remote.
11. Subsequent Events
Management has determined no material events or transactions occurred subsequent to August 31, 2010 that would require recognition or disclosure in the Funds’ financial statements.
12. Tax Information (Unaudited)
The information set forth below is for each Fund’s fiscal year as required by federal income tax laws. Shareholders, however, must report distributions on a calendar year basis for income tax purposes, which may include distributions for portions of two fiscal years of a Fund. Accordingly, the information needed by shareholders for income tax purposes will be sent to them in January of each year. Please consult your tax advisor for proper treatment of this information.
For the fiscal year ended August 31, 2010, each Fund designates distributions paid during the year as follows:
| (A) | (B) | ||||
| Ordinary Income | Tax-Exempt | Total | |||
| Distributions | Distributions | Distributions | |||
| (Tax Basis) | (Tax Basis) | (Tax Basis) | |||
| Delaware Tax-Free Minnesota Fund | 0.19% | 99.81% | 100.00% | ||
| Delaware Tax-Free Minnesota Intermediate Fund | 0.54% | 99.46% | 100.00% | ||
| Delaware Minnesota High-Yield Municipal Bond Fund | 0.17% | 99.83% | 100.00% |
(A) and (B) are based on a percentage of each Fund’s total distributions.
89
Report of independent
registered public accounting firm
registered public accounting firm
To the Board of Trustees of Voyageur Tax-Free Funds, Voyageur Intermediate Tax-Free Funds and Voyageur Mutual Funds and the Shareholders of Delaware Tax-Free Minnesota Fund, Delaware Tax-Free Minnesota Intermediate Fund and Delaware Minnesota High-Yield Municipal Bond Fund:
In our opinion, the accompanying statements of net assets and the related statements of operations and of changes in net assets and the financial highlights present fairly, in all material respects, the financial position of Delaware Tax-Free Minnesota Fund (constituting Voyageur Tax-Free Funds), Delaware Tax-Free Minnesota Intermediate Fund (constituting Voyageur Intermediate Tax-Free Funds) and Delaware Minnesota High-Yield Municipal Bond Fund (one of the series constituting Voyageur Mutual Funds) (hereafter collectively referred to as the “Funds”) at August 31, 2010, and the results of their operations, the changes in each of their net assets and the financial highlights for the year then ended, in conformity with accounting principles generally accepted in the United States of America. These financial statements and financial highlights (hereafter referred to as “financial statements”) are the responsibility of the Funds’ management; our responsibility is to express an opinion on these financial statements based on our audits. We conducted our audits of these financial statements in accordance with the standards of the Public Company Accounting Oversight Board (United States). Those standards require that we plan and perform the audit to obtain reasonable assurance about whether the financial statements are free of material misstatement. An audit includes examining, on a test basis, evidence supporting the amounts and disclosures in the financial statements, assessing the accounting principles used and significant estimates made by management, and evaluating the overall financial statement presentation. We believe that our audits, which included confirmation of securities at August 31, 2010 by correspondence with the custodian and brokers, provide a reasonable basis for our opinion. The statement of changes in net assets for the year ended August 31, 2009 and the financial highlights for each of the four year s in the period ended August 31, 2009 were audited by other independent accountants whose report dated October 19, 2009 expressed an unqualified opinion on those statements.
PricewaterhouseCoopers LLP
Philadelphia, Pennsylvania
October 19, 2010
Philadelphia, Pennsylvania
October 19, 2010
90
Other Fund information
(Unaudited)
Delaware Minnesota Municipal Bond Funds
(Unaudited)
Delaware Minnesota Municipal Bond Funds
Change in Independent Registered Public Accounting Firm
Due to independence matters under the Securities and Exchange Commission’s auditor independence rules relating to the January 4, 2010 acquisition of Delaware Investments (including DMC, DDLP and DSC) by Macquarie Group, Ernst & Young LLP (E&Y) has resigned as the independent registered public accounting firm for Voyageur Mutual Funds, Voyageur Tax-Free Funds and Voyageur Tax-Free Intermediate Funds (the Trusts) effective May 20, 2010. At a meeting held on May 20, 2010, the Board of Trustees of the Trusts, upon recommendation of the Audit Committee, selected PricewaterhouseCoopers LLP (PwC) to serve as the independent registered public accounting firm for the Trusts for the fiscal year ending August 31, 2010. During the fiscal years ended August 31, 2009 and 2008, E&Y’s audit reports on the financial statements of the Funds did not contain any adverse opinion or disclaimer of opinion, nor were they qualified or modif ied as to uncertainty, audit scope, or accounting principles. In addition, there were no disagreements between the Trusts and E&Y on accounting principles, financial statements disclosures or audit scope, which, if not resolved to the satisfaction of E&Y, would have caused them to make reference to the disagreement in their reports. Neither the Trusts nor anyone on its behalf has consulted with PwC at any time prior to their selection with respect to the application of accounting principles to a specified transaction, either completed or proposed or the type of audit opinion that might be rendered on the Funds’ financial statements.
91
Board of trustees/directors and officers addendum
Delaware Investments® Family of Funds
Delaware Investments® Family of Funds
A mutual fund is governed by a Board of Trustees/Directors (“Trustees”), which has oversight responsibility for the management of a fund’s business affairs. Trustees establish procedures and oversee and review the performance of the investment manager, the distributor, and others who perform services for the fund. The independent fund trustees, in particular, are advocates
| Name, Address, | Position(s) | Length of |
| and Birth Date | Held with Fund(s) | Time Served |
| Interested Trustees | ||
| Patrick P. Coyne1 | Chairman, President, | Chairman and Trustee |
| 2005 Market Street | Chief Executive Officer, | since August 16, 2006 |
| Philadelphia, PA 19103 | and Trustee | |
| April 1963 | President and | |
| Chief Executive Officer | ||
| since August 1, 2006 | ||
1 Patrick P. Coyne is considered to be an “Interested Trustee” because he is an executive officer of the Fund’s(s’) investment advisor.
92
for shareholder interests. Each trustee has served in that capacity since he or she was elected to or appointed to the Board of Trustees, and will continue to serve until his or her retirement or the election of a new trustee in his or her place. The following is a list of the Trustees and Officers with certain background and related information.
| Number of Portfolios in | ||
| Principal Occupation(s) | Fund Complex Overseen | Other Directorships |
| During Past 5 Years | by Trustee or Officer | Held by Trustee or Officer |
| Patrick P. Coyne has served in | 81 | Director |
| various executive capacities | Kaydon Corp. | |
| at different times at | ||
| Delaware Investments.2 | Board of Governors Member | |
| Investment Company | ||
| Institute (ICI) | ||
| Finance Committee Member | ||
| St. John Vianney Roman | ||
| Catholic Church | ||
| Board of Trustees | ||
| Agnes Irwin School | ||
| Member of Investment | ||
| Committee | ||
| Cradle of Liberty Council, | ||
| BSA | ||
| (2007 – 2010) | ||
2 Delaware Investments is the marketing name for Delaware Management Holdings, Inc. and its subsidiaries, including the Fund’s(s’) investment advisor, principal underwriter, and its transfer agent.
93
Board of trustees/directors and officers addendum
Delaware Investments® Family of Funds
Delaware Investments® Family of Funds
| Name, Address, | Position(s) | Length of |
| and Birth Date | Held with Fund(s) | Time Served |
| Independent Trustees | ||
| Thomas L. Bennett | Trustee | Since March 2005 |
| 2005 Market Street | ||
| Philadelphia, PA 19103 | ||
| October 1947 | ||
| John A. Fry | Trustee | Since January 2001 |
| 2005 Market Street | ||
| Philadelphia, PA 19103 | ||
| May 1960 | ||
| Anthony D. Knerr | Trustee | Since April 1990 |
| 2005 Market Street | ||
| Philadelphia, PA 19103 | ||
| December 1938 | ||
| Lucinda S. Landreth | Trustee | Since March 2005 |
| 2005 Market Street | ||
| Philadelphia, PA 19103 | ||
| June 1947 | ||
94
| Number of Portfolios in | ||
| Principal Occupation(s) | Fund Complex Overseen | Other Directorships |
| During Past 5 Years | by Trustee or Officer | Held by Trustee or Officer |
| Private Investor | 81 | Director |
| (March 2004–Present) | Bryn Mawr Bank Corp. (BMTC) | |
| Investment Manager | Chairman of Investment | |
| Morgan Stanley & Co. | Committee | |
| (January 1984–March 2004) | Pennsylvania Academy of | |
| Fine Arts | ||
| Investment Committee and | ||
| Governance Committee | ||
| Member | ||
| Pennsylvania Horticultural | ||
| Society | ||
| President | 81 | Director |
| Drexel University | Community Health Systems | |
| (August 2010–Present) | ||
| Director — Ecore | ||
| President | International | |
| Franklin & Marshall College | (2009-2010) | |
| (July 2002–July 2010) | ||
| Director — Allied | ||
| Executive Vice President | Barton Securities Holdings | |
| University of Pennsylvania | (2005 to 2008) | |
| (April 1995–June 2002) | ||
| Founder and | 81 | None |
| Managing Director | ||
| Anthony Knerr & Associates | ||
| (Strategic Consulting) | ||
| (1990–Present) | ||
| Chief Investment Officer | 81 | None |
| Assurant, Inc. (Insurance) | ||
| (2002–2004) | ||
95
Board of trustees/directors and officers addendum
Delaware Investments® Family of Funds
Delaware Investments® Family of Funds
| Name, Address, | Position(s) | Length of |
| and Birth Date | Held with Fund(s) | Time Served |
| Independent Trustees (continued) | ||
| Ann R. Leven | Trustee | Since October 1989 |
| 2005 Market Street | ||
| Philadelphia, PA 19103 | ||
| November 1940 | ||
| Thomas F. Madison | Trustee | Since May 19973 |
| 2005 Market Street | ||
| Philadelphia, PA 19103 | ||
| February 1936 | ||
3 In 1997, several funds managed by Voyageur Fund Managers, Inc. (the “Voyageur Funds”) were incorporated into the Delaware Investments Family of Funds. Mr. Madison served as a director of the Voyageur Funds from 1993 until 1997.
96
| Number of Portfolios in | ||
| Principal Occupation(s) | Fund Complex Overseen | Other Directorships |
| During Past 5 Years | by Trustee or Officer | Held by Trustee or Officer |
| Consultant | 81 | Director and Audit |
| ARL Associates | Committee Chair – | |
| (Financial Planning) | Systemax Inc. | |
| (1983–Present) | (2001 – 2009) | |
| Director and Audit | ||
| Committee Chairperson – | ||
| Andy Warhol Foundation | ||
| (1999 – 2007) | ||
| President and | 81 | Director and Chair of |
| Chief Executive Officer | Compensation Committee, | |
| MLM Partners, Inc. | Governance Committee | |
| (Small Business Investing | Member | |
| and Consulting) | CenterPoint Energy | |
| (January 1993–Present) | ||
| Lead Director and Chair of | ||
| Audit and Governance | ||
| Committees, Member of | ||
| Compensation Committee | ||
| Digital River, Inc. | ||
| Director and Chair of | ||
| Governance Committee, | ||
| Audit Committee | ||
| Member | ||
| Rimage Corporation | ||
| Director and Chair of | ||
| Compensation Committee | ||
| Spanlink Communications | ||
| Lead Director and Member of | ||
| Compensation and | ||
| Governance Committees | ||
| Valmont Industries, Inc. | ||
| (1987 – 2010) | ||
97
Board of trustees/directors and officers addendum
Delaware Investments® Family of Funds
Delaware Investments® Family of Funds
| Name, Address, | Position(s) | Length of |
| and Birth Date | Held with Fund(s) | Time Served |
| Independent Trustees (continued) | ||
| Thomas F. Madison | ||
| 2005 Market Street | ||
| Philadelphia, PA 19103 | ||
| February 1936 | ||
| Janet L. Yeomans | Trustee | Since April 1999 |
| 2005 Market Street | ||
| Philadelphia, PA 19103 | ||
| July 1948 | ||
| J. Richard Zecher | Trustee | Since March 2005 |
| 2005 Market Street | ||
| Philadelphia, PA 19103 | ||
| July 1940 | ||
98
| Number of Portfolios in | ||
| Principal Occupation(s) | Fund Complex Overseen | Other Directorships |
| During Past 5 Years | by Trustee or Officer | Held by Trustee or Officer |
| Director | ||
| Banner Health | ||
| (1996 to 2007) | ||
| Vice President and Treasurer | 81 | Director |
| (January 2006–Present) | Okabena Company | |
| Vice President — Mergers & Acquisitions | ||
| (January 2003–January 2006), and | ||
| Vice President | ||
| (July 1995–January 2003) | ||
| 3M Corporation | ||
| Founder | 81 | Director and Audit |
| Investor Analytics | Committee Member | |
| (Risk Management) | Investor Analytics | |
| (May 1999–Present) | ||
| Founder | Director | |
| Sutton Asset Management | Oxigene, Inc. | |
| (Hedge Fund) | (2003 to 2008) | |
| (September 1996–Present) | ||
99
Board of trustees/directors and officers addendum
Delaware Investments® Family of Funds
Delaware Investments® Family of Funds
| Name, Address, | Position(s) | Length of |
| and Birth Date | Held with Fund(s) | Time Served |
| Officers | ||
| David F. Connor | Vice President, | Vice President since |
| 2005 Market Street | Deputy General | September 2000 |
| Philadelphia, PA 19103 | Counsel, and Secretary | and Secretary since |
| December 1963 | October 2005 | |
| Daniel V. Geatens | Vice President | Treasurer |
| 2005 Market Street | and Treasurer | since October 25, 2007 |
| Philadelphia, PA 19103 | ||
| October 1972 | ||
| David P. O’Connor | Senior Vice President, | Senior Vice President, |
| 2005 Market Street | General Counsel, | General Counsel, and |
| Philadelphia, PA 19103 | and Chief Legal Officer | Chief Legal Officer |
| February 1966 | since October 2005 | |
| Richard Salus | Senior Vice President | Chief Financial Officer |
| 2005 Market Street | and Chief Financial Officer | since November 2006 |
| Philadelphia, PA 19103 | ||
| October 1963 | ||
The Statement of Additional Information for the Fund(s) includes additional information about the Trustees and Officers and is available, without charge, upon request by calling 800 523-1918.
100
| Number of Portfolios in | ||
| Principal Occupation(s) | Fund Complex Overseen | Other Directorships |
| During Past 5 Years | by Trustee or Officer | Held by Trustee or Officer |
| David F. Connor has served as | 81 | None4 |
| Vice President and Deputy | ||
| General Counsel of | ||
| Delaware Investments | ||
| since 2000. | ||
| Daniel V. Geatens has served | 81 | None4 |
| in various capacities at | ||
| different times at | ||
| Delaware Investments. | ||
| David P. O’Connor has served in | 81 | None4 |
| various executive and legal | ||
| capacities at different times | ||
| at Delaware Investments. | ||
| Richard Salus has served in | 81 | None4 |
| various executive capacities | ||
| at different times at | ||
| Delaware Investments. | ||
4 David F. Connor, Daniel V. Geatens, David P. O’Connor, and Richard Salus serve in similar capacities for the six portfolios of the Optimum Fund Trust, which have the same investment advisor, principal underwriter, and transfer agent as the registrant.
101
About the organization
| Board of trustees | |||
Patrick P. Coyne Chairman, President, and Chief Executive Officer Delaware Investments® Family of Funds Philadelphia, PA Thomas L. Bennett Private Investor Rosemont, PA John A. Fry President Drexel University Philadelphia, PA | Anthony D. Knerr Founder and Managing Director Anthony Knerr & Associates New York, NY Lucinda S. Landreth Former Chief Investment Officer Assurant, Inc. Philadelphia, PA | Ann R. Leven Consultant ARL Associates New York, NY Thomas F. Madison President and Chief Executive Officer MLM Partners, Inc. Minneapolis, MN | Janet L. Yeomans Vice President and Treasurer 3M Corporation St. Paul, MN J. Richard Zecher Founder Investor Analytics Scottsdale, AZ |
| Affiliated officers | |||
David F. Connor Vice President, Deputy General Counsel, and Secretary Delaware Investments Family of Funds Philadelphia, PA | Daniel V. Geatens Vice President and Treasurer Delaware Investments Family of Funds Philadelphia, PA | David P. O’Connor Senior Vice President, General Counsel, and Chief Legal Officer Delaware Investments Family of Funds Philadelphia, PA | Richard Salus Senior Vice President and Chief Financial Officer Delaware Investments Family of Funds Philadelphia, PA |
This annual report is for the information of Delaware Tax-Free Minnesota Fund, Delaware Tax-Free Minnesota Intermediate Fund, and Delaware Minnesota High-Yield Municipal Bond Fund shareholders, but it may be used with prospective investors when preceded or accompanied by a current prospectus for Delaware Tax-Free Minnesota Fund, Delaware Tax-Free Minnesota Intermediate Fund, and Delaware Minnesota High-Yield Municipal Bond Fund and the Delaware Investments Fund fact sheet for the most recently completed calendar quarter. These documents are available at www.delawareinvestments.com. The prospectus sets forth details about charges, expenses, investment objectives, and operating policies of the investment company. You should read the prospectus carefully before you invest. The figures in this report represent past results that are not a guarantee of future results. The return and principal value of an investment in the investment company will fluctuate so that shares, when redeemed, may be worth more or less than their original cost. |
Delaware Investments is the marketing name of Delaware Management Holdings, Inc. and its subsidiaries. Each Fund files its complete schedule of portfolio holdings with the Securities and Exchange Commission (SEC) for the first and third quarters of each fiscal year on Form N-Q. Each Fund’s Forms N-Q, as well as a description of the policies and procedures that each Fund uses to determine how to vote proxies (if any) relating to portfolio securities are available without charge (i) upon request, by calling 800 523-1918; and (ii) on the SEC’s Web site at www.sec.gov. In addition, a description of the policies and procedures that each Fund uses to determine how to vote proxies (if any) relating to portfolio securities and each Fund’s Schedule of Investments are available without charge on each Fund’s Web site at www.delawareinvestments.com. Each Fund’s Forms N-Q may be reviewed and copied at the SEC’s Public Reference Room in Washington, D.C.; information on the operation of the Public Reference Room may be obtained by calling 800 SEC-0330. Information (if any) regarding how each Fund voted proxies relating to portfolio securities during the most recently disclosed 12-month period ended June 30 is available without charge (i) through each Fund’s Web site at www.delawareinvestments.com; and (ii) on the SEC’s Web site at www.sec.gov. |
102
Annual report Delaware Tax-Free USA Fund Delaware Tax-Free USA Intermediate Fund Delaware National High-Yield Municipal Bond Fund August 31, 2010 Fixed income mutual funds |
This annual report is for the information of Delaware Tax-Free USA Fund, Delaware Tax-Free USA Intermediate Fund, and Delaware National High-Yield Municipal Bond Fund shareholders, but it may be used with prospective investors when preceded or accompanied by a current prospectus for Delaware Tax-Free USA Fund, Delaware Tax-Free USA Intermediate Fund, and Delaware National High-Yield Municipal Bond Fund. The figures in the annual report for Delaware Tax-Free USA Fund, Delaware Tax-Free USA Intermediate Fund, and Delaware National High-Yield Municipal Bond Fund represent past results, which are not a guarantee of future results. The return and principal value of an investment in the Funds will fluctuate so that shares, when redeemed, may be worth more or less than their original cost. Current performance may be higher or lower than the performance data quoted. You should consider the investment objectives, risks, charges, and expenses of the Funds carefully before investing. The Delaware Tax-Free USA Fund, Delaware Tax-Free USA Intermediate Fund, and Delaware National High-Yield Municipal Bond Fund prospectus contains this and other important information about the Funds. Prospectuses for all open-end funds in the Delaware Investments® Family of Funds are available from your financial advisor, online at www.delawareinvestments.com, or by phone at 800 523-1918. Please read the prospectus carefully before you invest or send money. |
| You can obtain shareholder reports and prospectuses online instead of in the mail. Visit www.delawareinvestments.com/edelivery. |
Experience Delaware Investments
Delaware Investments is committed to the pursuit of consistently superior asset management and unparalleled client service. We believe in our investment processes, which seek to deliver consistent results, and in convenient services that help add value for our clients.
If you are interested in learning more about creating an investment plan, contact your financial advisor.
You can learn more about Delaware Investments or obtain a prospectus for Delaware Tax-Free USA Fund, Delaware Tax-Free USA Intermediate Fund, and Delaware National High-Yield Municipal Bond Fund at www.delawareinvestments.com.
Manage your investments online
- 24-hour access to your account information
- Obtain share prices
- Check your account balance and recent transactions
- Request statements or literature
- Make purchases and redemptions
Delaware Management Holdings, Inc., and its subsidiaries (collectively known by the marketing name of Delaware Investments) are wholly owned subsidiaries of Macquarie Group Limited, a global provider of banking, financial, advisory, investment and funds management services.
Investments in Delaware Tax-Free USA Fund, Delaware Tax-Free USA Intermediate Fund, and Delaware National High-Yield Municipal Bond Fund are not and will not be deposits with or liabilities of Macquarie Bank Limited ABN 46 008 583 542 and its holding companies, including their subsidiaries or related companies (Macquarie Group), and are subject to investment risk, including possible delays in repayment and loss of income and capital invested. No Macquarie Group company guarantees or will guarantee the performance of the Funds, the repayment of capital from the Funds, or any particular rate of return.
| Table of contents | |
| Portfolio management review | 1 |
| Performance summaries | 6 |
| Disclosure of Fund expenses | 18 |
| Sector allocations | 21 |
| Statements of net assets | 24 |
| Statements of operations | 68 |
| Statements of changes in net assets | 70 |
| Financial highlights | 76 |
| Notes to financial statements | 100 |
| Report of independent registered | |
| public accounting firm | 112 |
| Other Fund information | 113 |
| Board of trustees/directors and | |
| officers addendum | 114 |
| About the organization | 124 |
Unless otherwise noted, views expressed herein are current as of Aug. 31, 2010, and are subject to change.
Funds are not FDIC insured and are not guaranteed. It is possible to lose the principal amount invested.
Mutual fund advisory services provided by Delaware Management Company, a series of Delaware Management Business Trust, which is a registered investment advisor. Delaware Investments, a member of Macquarie Group, refers to Delaware Management Holdings, Inc. and its subsidiaries, including the Funds’ distributor, Delaware Distributors, L.P. Macquarie Group refers to Macquarie Group Limited and its subsidiaries and affiliates worldwide.
© 2010 Delaware Management Holdings, Inc.
All third-party trademarks cited are the property of their respective owners.
| Portfolio management review | ||
| Delaware National Tax-Free Funds | September 7, 2010 |
| Performance preview (for the year ended August 31, 2010) | ||||
| Delaware Tax-Free USA Fund (Class A shares) | 1-year return | +11.85% | ||
| Barclays Capital Municipal Bond Index (benchmark) | 1-year return | +9.78% | ||
| Lipper General Municipal Debt Funds Average | 1-year return | +10.34% | ||
Past performance does not guarantee future results. For complete, annualized performance for Delaware Tax-Free USA Fund, please see the table on page 6. The performance of Class A shares excludes the applicable sales charge and reflects the reinvestment of all distributions. The Lipper General Municipal Debt Funds Average compares funds that invest at least 65% of assets in municipal debt issues in the top four credit ratings. Index performance returns do not reflect any management fees, transaction costs, or expenses. Indices are unmanaged and one cannot invest directly in an index. |
| Delaware Tax-Free USA Intermediate Fund (Class A shares) | 1-year return | +9.53% | ||
| Barclays Capital 3–15 Year Blend Municipal Bond Index (benchmark) | 1-year return | +8.99% | ||
| Lipper Intermediate Municipal Debt Funds Average | 1-year return | +8.54% |
Past performance does not guarantee future results. For complete, annualized performance for Delaware Tax-Free USA Intermediate Fund, please see the table on page 10. The performance of Class A shares excludes the applicable sales charge and reflects the reinvestment of all distributions. The Lipper Intermediate Municipal Debt Funds Average compares funds that invest in municipal debt issues with dollar-weighted average maturities of 5 to 10 years. Index performance returns do not reflect any management fees, transaction costs, or expenses. Indices are unmanaged and one cannot invest directly in an index. |
| Delaware National High-Yield Municipal Bond Fund (Class A shares) | 1-year return | +19.29% | ||
| Barclays Capital Municipal Bond Index (benchmark) | 1-year return | +9.78% | ||
| Lipper High Yield Municipal Debt Funds Average | 1-year return | +17.25% |
Past performance does not guarantee future results. For complete, annualized performance for Delaware National High-Yield Municipal Bond Fund, please see the table on page 14. The performance of Class A shares excludes the applicable sales charge and reflects the reinvestment of all distributions. The Lipper High Yield Municipal Debt Funds Average compares funds that invest at least 50% of assets in lower-rated municipal debt issues. Index performance returns do not reflect any management fees, transaction costs, or expenses. Indices are unmanaged and one cannot invest directly in an index. |
1
Portfolio management review
Delaware National Tax-Free Funds
Delaware National Tax-Free Funds
Economic environment
The Funds’ fiscal year, which ended Aug. 31, 2010, was one of continued economic challenges. When the period began, however, financial markets were bolstered by a broad-based sense of optimism about the economy:
- During the third quarter of 2009, the U.S. economy, as measured by gross domestic product (GDP), rose by an annualized 1.6%, marking the economy’s first quarterly expansion in more than a year.
- Growth in the fourth quarter of 2009 was even stronger. Annualized GDP expansion of 5.0% during those three months represented the fastest quarterly growth for the U.S. economy since early 2006.
(Source: U.S. Commerce Department.)
As the reporting period progressed, however, indications began to mount that the U.S. economic environment was slowing once again. For example:
- Unemployment in the United States remained stubbornly high. The jobless rate peaked at 10.1% in October 2009 and finished the Fund’s fiscal period at a still-elevated 9.6%.
(Source: U.S. Labor Department.) - The rate of expansion in GDP decreased to 3.7% in the first three months of 2010, followed by a sluggish 1.6% in the year’s second quarter. This trend led some economists to worry about the potential for a “double-dip” recession.
(Source: U.S. Commerce Department.) - Investors focused their attention on the high levels of sovereign debt across the developed world (and particularly in Greece), fearing that reductions in government spending could exacerbate declining economic growth.
- The U.S. housing market, weighed down by significant foreclosure activity and declining sales, continued to struggle.
Encouragingly, inflation remained low throughout the reporting period, with the Consumer Price Index rising by just 1.2% for the 12 months ending July 31, 2010 (the most recent data available as this report was being prepared). With inflation well under control, the Federal Reserve Board (the Fed) kept its benchmark short-term interest rate 1%, where it has stood since the depths of the financial crisis in late 2008. The low rates were part of the Fed’s ongoing effort to stimulate economic growth — an effort that included a program announced late in the period to buy significant quantities of U.S. government debt.
Municipal bond market environment
While the sluggish economic backdrop hampered the U.S. equity market, we believe the effect on the municipal market was relatively muted because of a favorable balance between supply and demand. Despite concerns about state and local government finances, tax-exempt bonds of all maturity lengths and credit-quality ratings gained ground throughout most of the reporting period.
Overall, investor demand for tax-exempt securities remained generally strong, driven in part by a growing expectation of higher income-tax rates in the future, while at the same time supply of municipal bonds became increasingly limited. A major factor behind this shift between supply and demand can be attributed to the introduction of the Build America Bond program, a feature of the February 2009 federal economic stimulus package. As a result of this program, many bond issues that traditionally would have come to market as tax-exempt municipal bonds were instead issued as taxable debt. This left far
2
fewer new issues in the traditional tax-exempt municipal bond market, providing a very positive backdrop for the municipal bond asset class and driving the Funds’ returns throughout the fiscal period. (Source: Barclays Capital.)
Although all types of municipal bonds earned positive returns during the reporting period, those with longer maturity dates and lower credit ratings generally outperformed their shorter-maturity and higher-rated counterparts by a wide margin, as investors tended to favor longer-dated securities — despite their higher interest rate risk — for the potential to earn more income.
A similar situation occurred with regard to credit quality. Many investors increasingly exhibited a willingness to buy higher-yielding bonds, even if it meant taking on more credit risk.
Commitment to our longtime approach
In all three Funds profiled in this report, we continued to follow our basic investment philosophy and approach. We believe successful bond investing requires rigorous credit analysis. In our opinion, there is no substitute for thorough credit research. On a bond-by-bond basis, we scrutinize each security the Funds hold — or consider holding — to ensure our comfort level with its financial position and to feel confident that any potential risks are likely offset by the income the security provides. Through this strategy, we believe we can find opportunities that other investors with less experience and research diligence might overlook.
Our investment approach often leads us to an increased focus on bonds with credit ratings of BBB and A — which represent the lower tier of the investment grade bond universe — and a relative de-emphasis on higher-rated bonds, such as those rated AAA and AA. We generally feel that we may have an opportunity to obtain the most value for our shareholders from the lower-rated opportunities among investment grade municipal bonds.
As the Funds’ fiscal year progressed, our tactics for managing the Funds became more selective as credit spreads narrowed — meaning that the premium paid to investors for buying riskier, lower-rated bonds declined — and bond prices rose. As these trends continued and interest rates on municipal bonds fell during the period, many of the bonds the Funds already owned offered considerably higher levels of income than bonds that became available during the reporting period. For example, the team selected for purchase a number of bonds at the peak of the financial crisis, when tax-exempt municipal bond yields were extremely high because of investors’ concerns about the solvency of bond issuers. Careful research allowed us to eventually get comfortable with the credit quality of these issues. As a result, we were able to add some highly rated municipal bonds paying yields that, at the end of the Funds’ fiscal year, were comparable to what lower-rated A and even some BBB securities were offering.
Because bonds in the marketplace were paying the lower prevailing yields, we felt it was important to look at potential new purchases with an even more discerning eye. It often made little sense to us to sell higher-yielding bonds already in the Funds’ portfolio holdings in favor of new bonds reflecting the lower-interest-rate environment. We have often said throughout 2010 that new bonds had to “fight their way into the portfolio.” In other words, we had to feel confident that new bonds offered sufficient value opportunities relative to their potential risks.
3
Portfolio management review
Delaware National Tax-Free Funds
Delaware National Tax-Free Funds
When we did add new securities to the Funds’ portfolio holdings as a result of Fund inflows (to accommodate cash generated by maturing bonds, for instance) we continued to follow our “bottom-up” investment strategy, carefully evaluating each issuer to become familiar with its financial position and to assess whether the bond’s return potential was commensurate with the risks involved with owning the securities.
Notable sectors and securities
As mentioned above, lower-rated bonds generally outperformed higher-rated issues through the majority of the Funds’ fiscal year. As a result, many of the individual bonds that made the strongest performance contributions across all three Funds were lower-rated issues. The best-performing sectors were often those with a significant amount of lower-rated bond issuance.
In a very favorable market environment for tax-exempt debt, even the weakest performers tended to earn modestly positive returns during the reporting period. Generally speaking, the bonds that lagged the overall municipal market on a total return basis were those with higher credit ratings (meaning less credit risk) and shorter maturities (meaning less interest rate risk). With interest rates declining, municipal bond investors looked for ways to capture additional levels of income, leading them toward lower-rated, longer-dated bonds and away from higher-rated, shorter-maturity credits.
In Delaware Tax-Free USA Fund and Delaware Tax-Free USA Intermediate Fund, education was the top-performing sector, with a number of lower-rated bonds in this group performing notably well on a total return basis. For example, the best individual performer in Delaware Tax-Free USA Intermediate Fund during the fiscal year was a Grand Traverse, Michigan, charter school bond issue — a lower-rated bond that benefited considerably from declining yields (and, thus, rising prices). The team originally bought the security at what we felt was an attractive yield relative to comparable higher-rated debt.
Both Delaware Tax-Free USA Fund and Delaware Tax-Free USA Intermediate Fund saw strong gains from a position in air cargo bonds issued by Capital Trust for Florida. These bonds are in the lease sector — a group that also contributed substantially to the results of Delaware National High-Yield Municipal Bond Fund. These air cargo bonds have been in the Funds for some time, and we have long felt they had the potential to provide good value to shareholders. Despite their sensitivity to the economy, they continued to perform even as the economic picture darkened during the Funds’ fiscal year.
In addition, performance within Delaware Tax-Free USA Fund was helped by Alliance, Texas, industrial development bonds issued on behalf of AMR, the parent company of American Airlines. After a brutal downturn amid the recession, the airline business has apparently rebounded well, as airlines have been aided by a number of factors that include increased general optimism about the economy, stable oil prices, new revenue streams generated by baggage fees (and other charges), and reduced flight schedules that have resulted in fuller planes. These bonds were the best individual performers overall during Delaware Tax-Free USA Fund’s fiscal year.
The top-returning individual bond within Delaware National High-Yield Municipal Bond Fund was issued by a continuing care
4
retirement community (CCRC) in Apple Valley, Minnesota. CCRCs are residential communities for seniors, ranging from independent-living to skilled-nursing-care facilities. This Minnesota CCRC is an established community with strong occupancy that has done reasonably well from a financial perspective. The Fund also gained from its position in New York industrial development revenue bonds issued on behalf of the airline Jet Blue. Like the American Airlines bonds, these securities benefited from the improving financial position of the airline industry.
As we mentioned earlier, even the weakest-performing bonds in all three Funds posted modestly positive results — an indication of the highly favorable market conditions enjoyed by municipal bond investors during the Funds’ fiscal year. Across all three Funds, the sector making the smallest total-return contribution was prerefunded bonds. These bonds have very short maturities, and because they are typically backed by U.S. Treasury bonds (or other very high-quality securities), they are considered high in credit quality. In an environment in which investors preferred lower-quality to higher-quality bonds, and longer-dated over shorter-dated issues, prerefunded bonds were left behind.
Within Delaware Tax-Free USA Intermediate Fund, the weakest contributors included prerefunded Virginia water revenue bonds due in October 2016. Payne County, Oklahoma, Economic Development Authority bonds, maturing in June 2030, were among Delaware Tax-Free USA Fund’s poorest contributors, while Bexar County, Texas, Health Authority bonds, coming due in July 2032, brought up the rear within Delaware National High-Yield Municipal Bond Fund.
5
| Performance summaries | |
| Delaware Tax-Free USA Fund | August 31, 2010 |
The performance data quoted represent past performance; past performance does not guarantee future results. Investment return and principal value will fluctuate so your shares, when redeemed, may be worth more or less than their original cost. Please obtain the performance data current for the most recent month end by calling 800 523-1918 or visiting our Web site at www.delawareinvestments.com/performance. Current performance may be lower or higher than the performance data quoted.
Carefully consider the Fund’s investment objectives, risk factors, charges, and expenses before investing. This and other information can be found in the Fund’s prospectus and, if available, its summary prospectus, which may be obtained by visiting www.delawareinvestments.com or calling 800 523-1918. Investors should read the prospectus and, if available, the summary prospectus carefully before investing.
| Fund performance | Average annual total returns through Aug. 31, 2010 | |||||||||||||||
| 1 year | 5 years | 10 years | Lifetime | |||||||||||||
| Class A (Est. Jan. 11, 1984) | ||||||||||||||||
| Excluding sales charge | +11.85% | +4.14% | +5.42% | n/a | ||||||||||||
| Including sales charge | +6.84% | +3.19% | +4.93% | n/a | ||||||||||||
| Class B (Est. May 2, 1994) | ||||||||||||||||
| Excluding sales charge | +11.01% | +3.34% | +4.76% | n/a | ||||||||||||
| Including sales charge | +7.01% | +3.08% | +4.76% | n/a | ||||||||||||
| Class C (Est. Nov. 29, 1995) | ||||||||||||||||
| Excluding sales charge | +11.00% | +3.35% | +4.61% | n/a | ||||||||||||
| Including sales charge | +10.00% | +3.35% | +4.61% | n/a | ||||||||||||
| Institutional Class (Est. Dec. 31, 2008) | ||||||||||||||||
| Excluding sales charge | +12.84% | n/a | n/a | +15.15% | ||||||||||||
| Including sales charge | +12.84% | n/a | n/a | +15.15% | ||||||||||||
Returns reflect the reinvestment of all distributions and any applicable sales charges as noted in the following paragraphs.
Performance for Class B and C shares, excluding sales charges, assumes either that contingent deferred sales charges did not apply or that the investment was not redeemed.
Expense limitations were in effect for certain classes during the periods shown in the “Fund performance” chart and in the “Performance of a $10,000 investment” chart. The current expenses for each class are listed on the “Fund expense ratios” chart. (Note that all charts and graphs referred to in the “Performance summary” section of this report are found on pages 6 through 9.) Performance would have been lower had the expense limitations not been in effect.
The Fund offers Class A, B, C, and Institutional Class shares.
Class A shares are sold with a maximum front-end sales charge of up to 4.50%, and have an annual distribution and service fee of up to 0.24% of average daily net assets.
6
The Board of Trustees has adopted a formula for calculating 12b-1 fees for the Fund’s Class A shares that went into effect on June 1, 1992. The total 12b-1 fees to be paid by Class A shareholders of the Fund will be the sum of 0.10% of the average daily net assets representing shares that were acquired prior to June 1, 1992 and 0.30% of the average daily net assets representing shares that were acquired on or after June 1, 1992. Effective April 21, 2006, the maximum amount of the Class A 12b-1 fees was reduced to 0.25%, and the total 12b-1 fees to be paid by Class A shareholders of the Fund will be the sum of 0.10% of the average daily net assets representing shares that were acquired prior to June 1, 1992, and 0.25% of the average daily net assets representing shares that were acquired on or after June 1, 1992. All Class A shareholders will bear 12b-1 fees at the same rate, the blended rate based upon the allocation of the 0.10% and 0.25% rates described above.
Class B shares may be purchased only through dividend reinvestment and certain permitted exchanges as described in the prospectus. Please see the prospectus for additional information on Class B purchase and sales charges. Class B shares have a contingent deferred sales charge that declines from 4.00% to zero depending on the period of time the shares are held.
Class B shares will automatically convert to Class A shares on a quarterly basis approximately eight years after purchase. They are also subject to an annual distribution and service fee of up to 1.00% of average daily net assets.
Ten-year performance figures for Class B shares reflect conversion to Class A shares after approximately eight years.
Class C shares are sold with a contingent deferred sales charge of 1.00% if redeemed during the first 12 months. They are also subject to an annual distribution and service fee of up to 1.00% of average daily net assets.
Institutional Class shares are available without sales or asset-based distribution charges only to certain eligible institutional accounts.
The “Fund performance” table and the “Performance of a $10,000 investment” graph do not reflect the deduction of taxes the shareholder would pay on Fund distributions or redemptions of Fund shares.
Fixed income securities and bond funds can lose value, and investors can lose principal, as interest rates rise. They also may be affected by economic conditions that hinder an issuer’s ability to make interest and principal payments on its debt.
The Fund may also be subject to prepayment risk, the risk that the principal of a fixed income security that is held by the Fund may be prepaid prior to maturity, potentially forcing the Fund to reinvest that money at a lower interest rate.
High yielding, noninvestment grade bonds (junk bonds) involve higher risk than investment grade bonds.
Substantially all dividend income derived from tax-free funds is exempt from federal income tax. Some income may be subject to the federal alternative minimum tax (AMT) that applies to certain investors. Capital gains, if any, are taxable.
7
Performance summaries
Delaware Tax-Free USA Fund
Delaware Tax-Free USA Fund
The Fund’s expense ratios, as described in the most recent prospectus, are disclosed in the following “Fund expense ratios” chart. Delaware Investments has voluntarily agreed to reimburse certain expenses and/or waive certain fees in order to prevent total fund operating expenses from exceeding 0.56% of the Fund’s average daily net assets from Jan. 1, 2010, until the voluntary cap is discontinued. Please see the most recent prospectus and any applicable supplement(s) for additional information on these fee waivers and/or reimbursements.
| Fund expense ratios | Class A | Class B | Class C | Institutional Class | ||||
| Total annual operating expenses | 0.97% | 1.73% | 1.73% | 0.73% | ||||
| (without fee waivers) | ||||||||
| Net expenses | 0.80% | 1.56% | 1.56% | 0.56% | ||||
| (including fee waivers, if any) | ||||||||
| Type of waiver | Voluntary | Voluntary | Voluntary | Voluntary |
Performance of a $10,000 investment
Average annual total returns from Aug. 31, 2000, through Aug. 31, 2010
| For period beginning Aug. 31, 2000, through Aug. 31, 2010 | Starting value | Ending value | ||
| Barclays Capital Municipal Bond Index | $10,000 | $17,400 | ||
| Delaware Tax-Free USA Fund — Class A Shares | $9,550 | $16,165 | ||
The chart assumes $10,000 invested in the Fund on Aug. 31, 2000, and includes the effect of a 4.50% front-end sales charge and the reinvestment of all distributions. Please note additional details on these fees in the “Performance summary” section of this report, which includes pages 6 through 9.
The chart also assumes $10,000 invested in the Barclays Capital Municipal Bond Index as of Aug. 31, 2000.
The Barclays Capital Municipal Bond Index measures the total return performance of the long-term, investment grade tax-exempt bond market.
8
Index performance returns do not reflect any management fees, transaction costs or expenses. Indices are unmanaged and one cannot invest directly in an index. Past performance is not a guarantee of future results.
Performance of other Fund classes will vary due to different charges and expenses.
The “Fund performance” chart and the “Performance of a $10,000 investment” graph do not reflect the deduction of taxes shareholders would pay on Fund distributions or redemptions of Fund shares.
| Nasdaq symbols | CUSIPs | ||||
| Class A | DMTFX | 245909106 | |||
| Class B | DTFCX | 245909403 | |||
| Class C | DUSCX | 245909700 | |||
| Institutional Class | DTFIX | 24610H104 |
9
| Performance summaries | |
| Delaware Tax-Free USA Intermediate Fund | August 31, 2010 |
The performance data quoted represent past performance; past performance does not guarantee future results. Investment return and principal value will fluctuate so your shares, when redeemed, may be worth more or less than their original cost. Please obtain the performance data current for the most recent month end by calling 800 523-1918 or visiting our Web site at www.delawareinvestments.com/performance. Current performance may be lower or higher than the performance data quoted.
Carefully consider the Fund’s investment objectives, risk factors, charges, and expenses before investing. This and other information can be found in the Fund’s prospectus and, if available, its summary prospectus, which may be obtained by visiting www.delawareinvestments.com or calling 800 523-1918. Investors should read the prospectus and, if available, the summary prospectus carefully before investing.
| Fund performance | Average annual total returns through Aug. 31, 2010 | |||||||||||||||
| 1 year | 5 years | 10 years | Lifetime | |||||||||||||
| Class A (Est. Jan. 7, 1993) | ||||||||||||||||
| Excluding sales charge | +9.53% | +4.47% | +5.47% | n/a | ||||||||||||
| Including sales charge | +6.56% | +3.89% | +5.18% | n/a | ||||||||||||
| Class B (Est. May 2, 1994) | ||||||||||||||||
| Excluding sales charge | +8.62% | +3.58% | +5.01% | n/a | ||||||||||||
| Including sales charge | +6.62% | +3.58% | +5.01% | n/a | ||||||||||||
| Class C (Est. Nov. 29, 1995) | ||||||||||||||||
| Excluding sales charge | +8.70% | +3.59% | +4.58% | n/a | ||||||||||||
| Including sales charge | +7.70% | +3.59% | +4.58% | n/a | ||||||||||||
| Institutional Class (Est. Dec. 31, 2008) | ||||||||||||||||
| Excluding sales charge | +10.62% | n/a | n/a | +11.67% | ||||||||||||
| Including sales charge | +10.62% | n/a | n/a | +11.67% | ||||||||||||
Returns reflect the reinvestment of all distributions and any applicable sales charges as noted in the following paragraphs.
Performance for Class B and C shares, excluding sales charges, assumes either that contingent deferred sales charges did not apply or that the investment was not redeemed.
Expense limitations were in effect for certain classes during the periods shown in the “Fund performance” chart and in the “Performance of a $10,000 investment” chart. The current expenses for each class are listed on the “Fund expense ratios” chart. (Note that all charts and graphs referred to in the “Performance summary” section of this report are found on pages 10 through 13.) Performance would have been lower had the expense limitations not been in effect.
The Fund offers Class A, B, C, and Institutional Class shares.
10
Class A shares are sold with a maximum front-end sales charge of up to 2.75%, and have an annual distribution and service fee of up to 0.30% of average daily net assets. This fee has been contractually limited to 0.15% of average daily net assets from Jan. 1, 2010, through Dec. 31, 2010.
Class B shares may be purchased only through dividend reinvestment and certain permitted exchanges as described in the prospectus. Please see the prospectus for additional information on Class B purchase and sales charges. Class B shares have a contingent deferred sales charge that declines from 2.00% to zero depending on the period of time the shares are held.
Class B shares will automatically convert to Class A shares on a quarterly basis approximately five years after purchase. They are also subject to an annual distribution and service fee of up to 1.00% of average daily net assets.
Ten-year performance figures for Class B shares reflect conversion to Class A shares after approximately five years.
Class C shares are sold with a contingent deferred sales charge of 1.00% if redeemed during the first 12 months. They are also subject to an annual distribution and service fee of up to 1.00% of average daily net assets.
Institutional Class shares are available without sales or asset-based distribution charges only to certain eligible institutional accounts.
The “Fund performance” table and the “Performance of a $10,000 investment” graph do not reflect the deduction of taxes the shareholder would pay on Fund distributions or redemptions of Fund shares.
Fixed income securities and bond funds can lose value, and investors can lose principal, as interest rates rise. They also may be affected by economic conditions that hinder an issuer’s ability to make interest and principal payments on its debt.
The Fund may also be subject to prepayment risk, the risk that the principal of a fixed income security that is held by the Fund may be prepaid prior to maturity, potentially forcing the Fund to reinvest that money at a lower interest rate.
High yielding, noninvestment grade bonds (junk bonds) involve higher risk than investment grade bonds.
Substantially all dividend income derived from tax-free funds is exempt from federal income tax. Some income may be subject to the federal alternative minimum tax (AMT) that applies to certain investors. Capital gains, if any, are taxable.
11
Performance summaries
Delaware Tax-Free USA Intermediate Fund
Delaware Tax-Free USA Intermediate Fund
The Fund’s expense ratios, as described in the most recent prospectus, are disclosed in the following “Fund expense ratios” chart. Delaware Investments has agreed to (1) voluntarily waive all or a portion of its investment advisory fees and/or reimburse certain expenses (excluding certain expenses) to prevent total annual fund operating expenses from exceeding 0.60% of the Fund’s average daily net assets from Jan. 1, 2010, until the voluntary cap is discontinued; and (2) contractually limit the Class A shares distribution and service fees from Jan. 1, 2010, through Dec. 31, 2010, to 0.15% of its average daily net assets. Please see the most recent prospectus and any applicable supplement(s) for additional information on these fee waivers and/or reimbursements.
| Fund expense ratios | Class A | Class B | Class C | Institutional Class | |||
| Total annual operating expenses | 1.03% | 1.73% | 1.73% | 0.73% | |||
| (without fee waivers) | |||||||
| Net expenses | 0.75% | 1.60% | 1.60% | 0.60% | |||
| (including fee waivers, if any) | |||||||
| Type of waiver | Contractual and | ||||||
| Voluntary | Voluntary | Voluntary | Voluntary |
Performance of a $10,000 investment
Average annual total returns from Aug. 31, 2000, through Aug. 31, 2010
Average annual total returns from Aug. 31, 2000, through Aug. 31, 2010
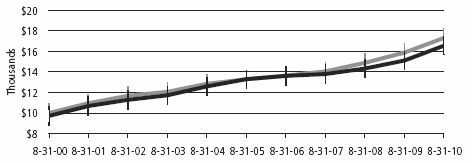
| For period beginning Aug. 31, 2000, through Aug. 31, 2010 | Starting value | Ending value | |||||
| Barclays Capital 3–15 Year Blend Municipal Bond Index | $10,000 | $17,312 | |||||
| Delaware Tax-Free USA | |||||||
| Intermediate Fund — Class A Shares | $9,725 | $16,557 | |||||
12
The chart assumes $10,000 invested in the Fund on Aug. 31, 2000, and includes the effect of a 2.75% front-end sales charge and the reinvestment of all distributions. Please note additional details on these fees in the “Performance summary” section of this report, which includes pages 10 through 13.
The chart also assumes $10,000 invested in the Barclays Capital 3–15 Year Blend Municipal Bond Index as of Aug. 31, 2000.
The Barclays Capital 3–15 Year Blend Municipal Bond Index, sometimes also referred to as the Barclays Capital 3–15 Year Municipal Bond Index, measures the total return performance of investment grade, U.S. tax-exempt bonds with maturities from 2 to 17 years.
Index performance returns do not reflect any management fees, transaction costs or expenses. Indices are unmanaged and one cannot invest directly in an index. Past performance is not a guarantee of future results.
Performance of other Fund classes will vary due to different charges and expenses. The “Fund performance” chart and the “Performance of a $10,000 investment” graph do not reflect the deduction of taxes shareholders would pay on Fund distributions or redemptions of Fund shares.
| Nasdaq symbols | CUSIPs | ||||||
| Class A | DMUSX | 245909304 | |||||
| Class B | DUIBX | 245909601 | |||||
| Class C | DUICX | 245909882 | |||||
| Institutional Class | DUSIX | 24610H203 | |||||
13
| Performance summaries | |
| Delaware National High-Yield Municipal Bond Fund | August 31, 2010 |
The performance data quoted represent past performance; past performance does not guarantee future results. Investment return and principal value will fluctuate so your shares, when redeemed, may be worth more or less than their original cost. Please obtain the performance data current for the most recent month end by calling 800 523-1918 or visiting our Web site at www.delawareinvestments.com/performance. Current performance may be lower or higher than the performance data quoted.
Carefully consider the Fund’s investment objectives, risk factors, charges, and expenses before investing. This and other information can be found in the Fund’s prospectus and, if available, its summary prospectus, which may be obtained by visiting www.delawareinvestments.com or calling 800 523-1918. Investors should read the prospectus and, if available, the summary prospectus carefully before investing.
| Fund performance | Average annual total returns through Aug. 31, 2010 | ||||||||||||
| 1 year | 5 years | 10 years | Lifetime | ||||||||||
| Class A (Est. Sept. 22, 1986) | |||||||||||||
| Excluding sales charge | +19.29 | % | +4.66 | % | +5.46 | % | n/a | ||||||
| Including sales charge | +13.93 | % | +3.70 | % | +4.98 | % | n/a | ||||||
| Class B (Est. Dec. 18, 1996) | |||||||||||||
| Excluding sales charge | +18.37 | % | +3.87 | % | +4.81 | % | n/a | ||||||
| Including sales charge | +14.37 | % | +3.62 | % | +4.81 | % | n/a | ||||||
| Class C (Est. May 26, 1997) | |||||||||||||
| Excluding sales charge | +18.33 | % | +3.86 | % | +4.67 | % | n/a | ||||||
| Including sales charge | +17.33 | % | +3.86 | % | +4.67 | % | n/a | ||||||
| Institutional Class (Est. Dec. 31, 2008) | |||||||||||||
| Excluding sales charge | +20.55 | % | n/a | n/a | +26.34 | % | |||||||
| Including sales charge | +20.55 | % | n/a | n/a | +26.34 | % | |||||||
Returns reflect the reinvestment of all distributions and any applicable sales charges as noted in the following paragraphs.
Performance for Class B and C shares, excluding sales charges, assumes either that contingent deferred sales charges did not apply or that the investment was not redeemed.
Expense limitations were in effect for certain classes during the periods shown in the “Fund performance” chart and in the “Performance of a $10,000 investment” chart. The current expenses for each class are listed on the “Fund expense ratios” chart. (Note that all charts and graphs referred to in the “Performance summary” section of this report are found on pages 14 through 17.) Performance would have been lower had the expense limitations not been in effect.
The Fund offers Class A, B, C, and Institutional Class shares.
Class A shares are sold with a maximum front-end sales charge of up to 4.50%, and have an annual distribution and service fee of up to 0.25% of average daily net assets.
14
Class B shares may be purchased only through dividend reinvestment and certain permitted exchanges as described in the prospectus. Please see the prospectus for additional information on Class B purchase and sales charges. Class B shares have a contingent deferred sales charge that declines from 4.00% to zero depending on the period of time the shares are held.
Class B shares will automatically convert to Class A shares on a quarterly basis approximately eight years after purchase. They are also subject to an annual distribution and service fee of up to 1.00% of average daily net assets.
Ten-year performance figures for Class B shares reflect conversion to Class A shares after approximately eight years.
Class C shares are sold with a contingent deferred sales charge of 1.00% if redeemed during the first 12 months. They are also subject to an annual distribution and service fee of up to 1.00% of average daily net assets.
Institutional Class shares are available without sales or asset-based distribution charges only to certain eligible institutional accounts.
The “Fund performance” table and the “Performance of a $10,000 investment” graph do not reflect the deduction of taxes the shareholder would pay on Fund distributions or redemptions of Fund shares.
Instances of high double-digit returns are unusual, cannot be sustained, and were primarily achieved during favorable market conditions.
Fixed income securities and bond funds can lose value, and investors can lose principal, as interest rates rise. They also may be affected by economic conditions that hinder an issuer’s ability to make interest and principal payments on its debt.
The Fund may also be subject to prepayment risk, the risk that the principal of a fixed income security that is held by the Fund may be prepaid prior to maturity, potentially forcing the Fund to reinvest that money at a lower interest rate.
High yielding, noninvestment grade bonds (junk bonds) involve higher risk than investment grade bonds.
The Fund may invest in derivatives, which may involve additional expenses and are subject to risk, including the risk that an underlying security or securities index moves in the opposite direction from what the portfolio manager anticipated. A derivative transaction depends upon the counterparties’ ability to fulfill their contractual obligations.
Substantially all dividend income derived from tax-free funds is exempt from federal income tax. Some income may be subject to the federal alternative minimum tax (AMT) that applies to certain investors. Capital gains, if any, are taxable.
15
Performance summaries
Delaware National High-Yield Municipal Bond Fund
Delaware National High-Yield Municipal Bond Fund
The Fund’s expense ratios, as described in the most recent prospectus, are disclosed in the following “Fund expense ratios” chart. Delaware Investments has voluntarily agreed to reimburse certain expenses and/or waive certain fees in order to prevent total fund operating expenses from exceeding 0.60% of the Fund’s average daily net assets. Please see the most recent prospectus and any applicable supplement(s) for additional information on these fee waivers and/or reimbursements.
| Fund expense ratios | Class A | Class B | Class C | Institutional Class | |||
| Total annual operating expenses | 1.08% | 1.83% | 1.83% | 0.83% | |||
| (without fee waivers) | |||||||
| Net expenses | 0.85% | 1.60% | 1.60% | 0.60% | |||
| (including fee waivers, if any) | |||||||
| Type of waiver | Voluntary | Voluntary | Voluntary | Voluntary |
Performance of a $10,000 investment
Average annual total returns from Aug. 31, 2000, through Aug. 31, 2010
Average annual total returns from Aug. 31, 2000, through Aug. 31, 2010
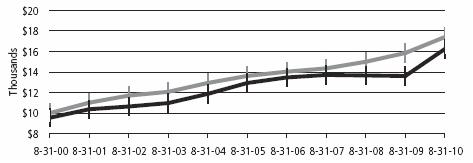
| For period beginning Aug. 31, 2000, through Aug. 31, 2010 | Starting value | Ending value | |||||
| Barclays Capital Municipal Bond Index | $10,000 | $17,400 | |||||
| Delaware National High-Yield | |||||||
| Municipal Bond Fund — Class A Shares | $9,550 | $16,239 | |||||
The chart assumes $10,000 invested in the Fund on Aug. 31, 2000, and includes the effect of a 4.50% front-end sales charge and the reinvestment of all distributions. Please note additional details on these fees in the “Performance summary” section of this report, which includes pages 14 through 17.
The chart also assumes $10,000 invested in the Barclays Capital Municipal Bond Index as of Aug. 31, 2000.
The Barclays Capital Municipal Bond Index measures the total return performance of the long-term, investment grade tax-exempt bond market.
16
Index performance returns do not reflect any management fees, transaction costs or expenses. Indices are unmanaged and one cannot invest directly in an index. Past performance is not a guarantee of future results.
Performance of other Fund classes will vary due to different charges and expenses.
The “Fund performance” chart and the “Performance of a $10,000 investment” graph do not reflect the deduction of taxes shareholders would pay on Fund distributions or redemptions of Fund shares.
| Nasdaq symbols | CUSIPs | ||||||
| Class A | CXHYX | 928928241 | |||||
| Class B | DVNYX | 928928233 | |||||
| Class C | DVHCX | 928928225 | |||||
| Institutional Class | DVHIX | 24610H302 | |||||
17
Disclosure of Fund expenses
For the six-month period March 1, 2010 to August 31, 2010
For the six-month period March 1, 2010 to August 31, 2010
As a shareholder of a Fund, you incur two types of costs: (1) transaction costs, including sales charges (loads) on purchase payments, reinvested dividends, or other distributions; redemption fees; and exchange fees; and (2) ongoing costs, including management fees; distribution and/or service (12b-1) fees; and other Fund expenses. These following examples are intended to help you understand your ongoing costs (in dollars) of investing in a Fund and to compare these costs with the ongoing costs of investing in other mutual funds.
The examples are based on an investment of $1,000 invested at the beginning of the period and held for the entire six-month period from March 1, 2010 to August 31, 2010.
Actual expenses
The first section of the tables shown, “Actual Fund return,” provides information about actual account values and actual expenses. You may use the information in this section of the table, together with the amount you invested, to estimate the expenses that you paid over the period. Simply divide your account value by $1,000 (for example, an $8,600 account value divided by $1,000 = 8.6), then multiply the result by the number in the first section under the heading entitled “Expenses Paid During Period” to estimate the expenses you paid on your account during this period.
Hypothetical example for comparison purposes
The second section of the tables shown, “Hypothetical 5% return,” provides information about hypothetical account values and hypothetical expenses based on the Funds’ actual expense ratios and an assumed rate of return of 5% per year before expenses, which is not the Funds’ actual return. The hypothetical account values and expenses may not be used to estimate the actual ending account balance or expenses you paid for the period. You may use this information to compare the ongoing costs of investing in the Funds and other funds. To do so, compare this 5% hypothetical example with the 5% hypothetical examples that appear in the shareholder reports of the other funds.
Please note that the expenses shown in the tables are meant to highlight your ongoing costs only and do not reflect any transactional costs, such as sales charges (loads), redemption fees, or exchange fees. Therefore, the second section of each table is useful in comparing ongoing costs only, and will not help you determine the relative total costs of owning different funds. In addition, if these transactional costs were included, your costs would have been higher. The Funds’ expenses shown in the tables reflect fee waivers in effect. The expenses shown in each table assume reinvestment of all dividends and distributions.
18
Delaware Tax-Free USA Fund
Expense analysis of an investment of $1,000
Expense analysis of an investment of $1,000
| Beginning | Ending | Expenses | ||||||||||||||||||
| Account Value | Account Value | Annualized | Paid During Period | |||||||||||||||||
| 3/1/10 | 8/31/10 | Expense Ratio | 3/1/10 to 8/31/10* | |||||||||||||||||
| Actual Fund return | ||||||||||||||||||||
| Class A | $ | 1,000.00 | $ | 1,059.10 | 0.80 | % | $ | 4.15 | ||||||||||||
| Class B | 1,000.00 | 1,055.20 | 1.56 | % | 8.08 | |||||||||||||||
| Class C | 1,000.00 | 1,055.10 | 1.56 | % | 8.08 | |||||||||||||||
| Institutional Class | 1,000.00 | 1,061.00 | 0.56 | % | 2.91 | |||||||||||||||
| Hypothetical 5% return (5% return before expenses) | ||||||||||||||||||||
| Class A | $ | 1,000.00 | $ | 1,021.17 | 0.80 | % | $ | 4.08 | ||||||||||||
| Class B | 1,000.00 | 1,017.34 | 1.56 | % | 7.93 | |||||||||||||||
| Class C | 1,000.00 | 1,017.34 | 1.56 | % | 7.93 | |||||||||||||||
| Institutional Class | 1,000.00 | 1,022.38 | 0.56 | % | 2.85 | |||||||||||||||
Delaware Tax-Free USA Intermediate Fund
Expense analysis of an investment of $1,000
Expense analysis of an investment of $1,000
| Beginning | Ending | Expenses | ||||||||||||||||||
| Account Value | Account Value | Annualized | Paid During Period | |||||||||||||||||
| 3/1/10 | 8/31/10 | Expense Ratio | 3/1/10 to 8/31/10* | |||||||||||||||||
| Actual Fund return | ||||||||||||||||||||
| Class A | $ | 1,000.00 | $ | 1,049.80 | 0.75 | % | $ | 3.87 | ||||||||||||
| Class B | 1,000.00 | 1,045.40 | 1.60 | % | 8.25 | |||||||||||||||
| Class C | 1,000.00 | 1,046.20 | 1.60 | % | 8.25 | |||||||||||||||
| Institutional Class | 1,000.00 | 1,050.30 | 0.60 | % | 3.10 | |||||||||||||||
| Hypothetical 5% return (5% return before expenses) | ||||||||||||||||||||
| Class A | $ | 1,000.00 | $ | 1,021.42 | 0.75 | % | $ | 3.82 | ||||||||||||
| Class B | 1,000.00 | 1,017.14 | 1.60 | % | 8.13 | |||||||||||||||
| Class C | 1,000.00 | 1,017.14 | 1.60 | % | 8.13 | |||||||||||||||
| Institutional Class | 1,000.00 | 1,022.18 | 0.60 | % | 3.06 | |||||||||||||||
19
Disclosure of Fund expenses
Delaware National High-Yield Municipal Bond Fund
Expense analysis of an investment of $1,000
Expense analysis of an investment of $1,000
| Beginning | Ending | Expenses | |||||||||||||||||
| Account Value | Account Value | Annualized | Paid During Period | ||||||||||||||||
| 3/1/10 | 8/31/10 | Expense Ratio | 3/1/10 to 8/31/10* | ||||||||||||||||
| Actual Fund return | |||||||||||||||||||
| Class A | $ | 1,000.00 | $ | 1,081.80 | 0.85 | % | $ | 4.46 | |||||||||||
| Class B | 1,000.00 | 1,077.70 | 1.60 | % | 8.38 | ||||||||||||||
| Class C | 1,000.00 | 1,077.50 | 1.60 | % | 8.38 | ||||||||||||||
| Institutional Class | 1,000.00 | 1,082.50 | 0.60 | % | 3.15 | ||||||||||||||
| Hypothetical 5% return (5% return before expenses) | |||||||||||||||||||
| Class A | $ | 1,000.00 | $ | 1,020.92 | 0.85 | % | $ | 4.33 | |||||||||||
| Class B | 1,000.00 | 1,017.14 | 1.60 | % | 8.13 | ||||||||||||||
| Class C | 1,000.00 | 1,017.14 | 1.60 | % | 8.13 | ||||||||||||||
| Institutional Class | 1,000.00 | 1,022.18 | 0.60 | % | 3.06 | ||||||||||||||
*“Expenses Paid During Period” are equal to Funds’ annualized expense ratio, multiplied by the average account value over the period, multiplied by 184/365 (to reflect the one-half year period).
20
| Sector allocations | |
| Delaware Tax-Free USA Fund | As of August 31, 2010 |
Sector designations may be different than the sector designations presented in other Fund materials.
| Sector | Percentage of net assets | ||
| Municipal Bonds | 98.93 | % | |
| Corporate Revenue Bonds | 19.29 | % | |
| Education Revenue Bonds | 9.51 | % | |
| Electric Revenue Bonds | 3.32 | % | |
| Healthcare Revenue Bonds | 10.68 | % | |
| Housing Revenue Bonds | 0.86 | % | |
| Lease Revenue Bonds | 3.22 | % | |
| Local General Obligation Bonds | 4.52 | % | |
| Pre-Refunded/Escrowed to Maturity Bonds | 17.36 | % | |
| Special Tax Revenue Bonds | 12.97 | % | |
| State General Obligation Bonds | 5.04 | % | |
| Transportation Revenue Bonds | 9.04 | % | |
| Water & Sewer Revenue Bonds | 3.12 | % | |
| Short-Term Investment | 0.32 | % | |
| Total Value of Securities | 99.25 | % | |
| Receivables and Other Assets Net of Liabilities | 0.75 | % | |
| Total Net Assets | 100.00 | % | |
21
| Sector allocations | |
| Delaware Tax-Free USA Intermediate Fund | As of August 31, 2010 |
Sector designations may be different than the sector designations presented in other Fund materials.
| Sector | Percentage of net assets | ||
| Municipal Bonds | 98.31 | % | |
| Corporate Revenue Bonds | 8.54 | % | |
| Education Revenue Bonds | 5.90 | % | |
| Electric Revenue Bonds | 4.23 | % | |
| Healthcare Revenue Bonds | 10.30 | % | |
| Housing Revenue Bonds | 1.03 | % | |
| Lease Revenue Bonds | 1.78 | % | |
| Local General Obligation Bonds | 6.67 | % | |
| Pre-Refunded/Escrowed to Maturity Bonds | 5.07 | % | |
| Resource Recovery Revenue Bonds | 0.17 | % | |
| Special Tax Revenue Bonds | 11.61 | % | |
| State General Obligation Bonds | 23.24 | % | |
| Transportation Revenue Bonds | 12.96 | % | |
| Water & Sewer Revenue Bonds | 6.81 | % | |
| Short-Term Investments | 0.70 | % | |
| Total Value of Securities | 99.01 | % | |
| Receivables and Other Assets Net of Liabilities | 0.99 | % | |
| Total Net Assets | 100.00 | % | |
22
| Delaware National High-Yield Municipal Bond Fund | As of August 31, 2010 |
Sector designations may be different than the sector designations presented in other Fund materials.
| Sector | Percentage of net assets | |
| Municipal Bonds | 95.60 | % |
| Corporate Revenue Bonds | 18.02 | % |
| Education Revenue Bonds | 19.06 | % |
| Electric Revenue Bonds | 2.87 | % |
| Healthcare Revenue Bonds | 25.05 | % |
| Housing Revenue Bond | 0.51 | % |
| Lease Revenue Bonds | 4.83 | % |
| Local General Obligation Bonds | 0.32 | % |
| Pre-Refunded/Escrowed to Maturity Bonds | 0.57 | % |
| Special Tax Revenue Bonds | 13.47 | % |
| State General Obligation Bonds | 3.78 | % |
| Transportation Revenue Bonds | 7.12 | % |
| Short-Term Investments | 1.29 | % |
| Total Value of Securities | 96.89 | % |
| Receivables and Other Assets Net of Liabilities | 3.11 | % |
| Total Net Assets | 100.00 | % |
23
| Statements of net assets | |
| Delaware Tax-Free USA Fund | August 31, 2010 |
| Principal amount | Value | |||||||
| Municipal Bonds – 98.93% | ||||||||
| Corporate Revenue Bonds – 19.29% | ||||||||
| Alliance Airport Authority, Texas Special Facilities Revenue | ||||||||
| (American Airlines Project) Series B 5.25% 12/1/29 (AMT) | $ | 2,250,000 | $ | 1,699,155 | ||||
| • | Brazos, Texas Harbor Industrial Development | |||||||
| Environmental Facilities Revenue | ||||||||
| (Dow Chemical Co. Project) 5.90% 5/1/38 (AMT) | 1,940,000 | 2,013,623 | ||||||
| Brazos, Texas River Authority Pollution Control Revenue | ||||||||
| (Texas Utilities) 5.40% 5/1/29 (AMT) | 3,000,000 | 1,205,340 | ||||||
| •(TXU Energy Co. Project) Series B 6.30% 7/1/32 (AMT) | 3,500,000 | 1,476,055 | ||||||
| Buckeye, Ohio Tobacco Settlement Financing Authority | ||||||||
| Asset-Backed Series A-2 5.875% 6/1/47 | 14,405,000 | 10,518,964 | ||||||
| Clayton County, Georgia Development Authority Special Facilities | ||||||||
| Revenue (Delta Airlines) Series B 9.00% 6/1/35 (AMT) | 3,800,000 | 4,095,602 | ||||||
| Cloquet, Minnesota Pollution Control Revenue | ||||||||
| (Potlatch Corp. Project) 5.90% 10/1/26 | 1,695,000 | 1,659,608 | ||||||
| • | Gulf Coast Waste Disposal Authority Texas Environmental | |||||||
| Facilities Revenue (BP Products North America) | ||||||||
| 2.30% 1/1/26 | 720,000 | 700,099 | ||||||
| 2.30% 1/1/42 | 1,445,000 | 1,405,060 | ||||||
| Harris County, Texas Industrial Development Corporation | ||||||||
| Solid Waste Disposal Revenue | ||||||||
| (Deer Park Refining Project) 5.00% 2/1/23 | 2,880,000 | 3,089,606 | ||||||
| Hawaii State Department Budget & | ||||||||
| Finance Special Purpose Revenue (Hawaiian | ||||||||
| Electric Co. Subsidiary) 6.50% 7/1/39 | 5,350,000 | 5,961,398 | ||||||
| Indiana State Finance Authority Environmental Revenue | ||||||||
| (U.S. Steel Corp. Project) 6.00% 12/1/26 | 2,610,000 | 2,774,639 | ||||||
| Indianapolis, Indiana Airport Authority Revenue | ||||||||
| Special Facilities (Federal Express Corp. Project) | ||||||||
| 5.10% 1/15/17 (AMT) | 2,750,000 | 2,956,965 | ||||||
| Series 1998 5.50% 5/1/29 (AMT) | 2,000,000 | 1,999,820 | ||||||
| Iowa Finance Authority Pollution Control Facility Revenue | ||||||||
| (Interstate Power) 5.00% 7/1/14 (FGIC) | 3,640,000 | 3,972,623 | ||||||
| Louisiana Local Government Environmental Facilities & | ||||||||
| Community Development Authority Revenue | ||||||||
| (Westlake Chemical Corp.) Series A 6.50% 8/1/29 | 4,855,000 | 5,074,397 | ||||||
| Mason County, West Virginia Pollution Control Revenue | ||||||||
| (Appalachian Power Co. Project) | ||||||||
| Series K 6.05% 12/1/24 (AMBAC) | 3,000,000 | 3,037,980 | ||||||
24
| Principal amount | Value | |||||||
| Municipal Bonds (continued) | ||||||||
| Corporate Revenue Bonds (continued) | ||||||||
| Mississippi Business Finance Corporation Pollution Control | ||||||||
| Revenue (System Energy Resources, Inc. Project) | ||||||||
| 5.90% 5/1/22 | $ | 3,000,000 | $ | 3,000,210 | ||||
| Missouri State Environmental Improvement & Energy | ||||||||
| Resource Authority Pollution Control | ||||||||
| Revenue Refunding (St. Joseph Light & Power Co. Project) | ||||||||
| 5.85% 2/1/13 (AMBAC) | 2,200,000 | 2,206,116 | ||||||
| • | Mobile, Alabama Industrial Development Board Pollution | |||||||
| Control Revenue (Alabama Power Co.) Series B | ||||||||
| 4.875% 6/1/34 | 4,750,000 | 5,147,955 | ||||||
| M-S-R Energy Authority, California Gas Revenue Series A | ||||||||
| 6.125% 11/1/29 | 1,915,000 | 2,125,650 | ||||||
| 6.50% 11/1/39 | 3,915,000 | 4,562,815 | ||||||
| New Jersey Economic Development Authority | ||||||||
| Special Facility Revenue (Continental Airlines, Inc. Project) | ||||||||
| 6.25% 9/15/29 (AMT) | 2,000,000 | 1,942,800 | ||||||
| • | New York City, New York Industrial Development Agency | |||||||
| Special Facilities Revenue (American Airlines - | ||||||||
| JFK International Airport) | ||||||||
| 7.625% 8/1/25 (AMT) | 4,620,000 | 4,847,627 | ||||||
| 7.75% 8/1/31 (AMT) | 2,000,000 | 2,110,560 | ||||||
| New York Liberty Development Corporation Revenue | ||||||||
| Second Priority (Bank of America Tower) | ||||||||
| Class 2 5.625% 7/15/47 | 6,000,000 | 6,247,380 | ||||||
| Nez Perce County, Idaho Pollution Control Revenue | ||||||||
| (Potlatch Corp. Project) 6.00% 10/1/24 | 1,250,000 | 1,236,713 | ||||||
| Ohio State Air Quality Development Authority Revenue | ||||||||
| Environmental Improvement (First Energy Generation) | ||||||||
| Series A 5.70% 8/1/20 | 4,750,000 | 5,372,250 | ||||||
| Owen County, Kentucky Waterworks System Revenue | ||||||||
| (American Water Co.) Series B 5.625% 9/1/39 | 3,300,000 | 3,474,900 | ||||||
| Pennsylvania Economic Development Financing Authority | ||||||||
| Exempt Facilities Revenue (Allegheny Energy Supply Co.) | ||||||||
| 7.00% 7/15/39 | 6,340,000 | 7,268,557 | ||||||
| Petersburg, Indiana Pollution Control Revenue (Indianapolis | ||||||||
| Power & Light Co. Project) 6.375% 11/1/29 (AMT) | 5,000,000 | 5,138,200 | ||||||
| Phenix City, Alabama Industrial Development Board | ||||||||
| Environmental Improvement Revenue (Mead Westvaco Corp. | ||||||||
| Project) Series A 6.35% 5/15/35 (AMT) | 3,000,000 | 2,976,720 | ||||||
25
Statements of net assets
Delaware Tax-Free USA Fund
Delaware Tax-Free USA Fund
| Principal amount | Value | |||||||
| Municipal Bonds (continued) | ||||||||
| Corporate Revenue Bonds (continued) | ||||||||
| Richmond County, Georgia Development Authority | ||||||||
| Environmental Improvement Revenue (International | ||||||||
| Paper Co.) Series B 5.95% 11/15/25 (AMT) | $ | 5,000,000 | $ | 5,094,450 | ||||
| South Carolina Jobs-Economic Development Authority | ||||||||
| Industrial Revenue (South Carolina Electric & Gas Co. | ||||||||
| Project) Series B 5.45% 11/1/32 (AMBAC) (AMT) | 500,000 | 504,480 | ||||||
| Sugar Creek, Missouri Industrial Development Revenue (Lafarge | ||||||||
| North America Project) Series A 5.65% 6/1/37 (AMT) | 500,000 | 483,365 | ||||||
| Sweetwater County, Wyoming Solid Waste Disposal Revenue | ||||||||
| (FMC Corp. Project) 5.60% 12/1/35 (AMT) | 3,250,000 | 3,263,910 | ||||||
| 120,645,592 | ||||||||
| Education Revenue Bonds – 9.51% | ||||||||
| Amherst, New York Industrial Development Agency Civic | ||||||||
| Facilities Revenue (UBF Faculty Student Housing) | ||||||||
| Series A 5.75% 8/1/30 (AMBAC) | 1,300,000 | 1,316,250 | ||||||
| Bowling Green, Ohio Student Housing Revenue CFP I | ||||||||
| (State University Project) 6.00% 6/1/45 | 5,390,000 | 5,509,119 | ||||||
| Broward County, Florida Educational Facilities Authority Revenue | ||||||||
| (Nova Southeastern Project) 5.25% 4/1/27 (RADIAN) | 1,000,000 | 1,001,310 | ||||||
| California Statewide Communities Development Authority School | ||||||||
| Facility Revenue (Aspire Public Schools) 6.125% 7/1/46 | 5,160,000 | 5,269,082 | ||||||
| California Statewide Communities Development Authority | ||||||||
| Student Housing Revenue (East Campus Apartments, LLC) | ||||||||
| Series A 5.625% 8/1/34 (ACA) | 3,400,000 | 3,403,774 | ||||||
| Connecticut State Health & Educational Facilities Authority | ||||||||
| Revenue (Yale University) Series A-1 5.00% 7/1/25 | 3,000,000 | 3,478,380 | ||||||
| Gainesville, Georgia Redevelopment Authority Educational Facilities | ||||||||
| Revenue (Riverside Military Academy Project) 5.125% 3/1/37 | 3,735,000 | 2,703,654 | ||||||
| Marietta, Georgia Development Authority Revenue | ||||||||
| (Life University Income Project) 7.00% 6/15/39 | 4,200,000 | 4,252,080 | ||||||
| Massachusetts State Health & Educational Facilities | ||||||||
| Authority Revenue | ||||||||
| (Harvard University) Series A 5.50% 11/15/36 | 4,515,000 | 5,285,620 | ||||||
| (Nichols College Project) Series C 6.125% 10/1/29 | 4,350,000 | 4,373,447 | ||||||
| Michigan Finance Authority Educational Facilities Revenue | ||||||||
| Senior (Saint Catherine Siena) Series A | ||||||||
| 8.00% 10/1/30 | 2,315,000 | 2,325,093 | ||||||
| 8.50% 10/1/45 | 1,000,000 | 1,013,100 | ||||||
26
| Principal amount | Value | |||||||
| Municipal Bonds (continued) | ||||||||
| Education Revenue Bonds (continued) | ||||||||
| Missouri State Health & Educational Facilities Authority | ||||||||
| Revenue (Washington University) Series A 5.375% 3/15/39 | $ | 5,000,000 | $ | 5,590,100 | ||||
| New Hampshire Higher Educational & Health Facilities | ||||||||
| Authority Revenue (New Hampton School Issue) | ||||||||
| 5.375% 10/1/28 | 3,070,000 | 2,948,121 | ||||||
| New Jersey Economic Development Authority Revenue | ||||||||
| (Provident Group - Montclair) 5.875% 6/1/42 | 4,285,000 | 4,453,786 | ||||||
| New Jersey State Educational Facilities Authority Revenue | ||||||||
| (University of Medicine & Dentistry) Series B 7.50% 12/1/32 | 1,435,000 | 1,689,368 | ||||||
| Provo, Utah Charter School Revenue (Freedom Academy | ||||||||
| Foundation Project) 5.50% 6/15/37 | 1,665,000 | 1,373,142 | ||||||
| Saint Louis, Missouri Industrial Development Authority | ||||||||
| Revenue (Confluence Academy Project) Series A | ||||||||
| 5.25% 6/15/25 | 1,150,000 | 1,023,627 | ||||||
| 5.35% 6/15/32 | 2,300,000 | 1,955,897 | ||||||
| University of the Virgin Islands Series A 5.375% 6/1/34 | 500,000 | 505,725 | ||||||
| 59,470,675 | ||||||||
| Electric Revenue Bonds – 3.32% | ||||||||
| Chelan County, Washington Public Utilities District #001 | ||||||||
| Consolidated Revenue (Chelan Hydro System) Series A | ||||||||
| 5.45% 7/1/37 (AMBAC) (AMT) | 5,000,000 | 5,030,300 | ||||||
| Puerto Rico Electric Power Authority Revenue | ||||||||
| Series PP 5.00% 7/1/25 (NATL-RE) (FGIC) | 1,000,000 | 1,038,400 | ||||||
| Series WW 5.50% 7/1/38 | 2,100,000 | 2,225,832 | ||||||
| Series XX 5.75% 7/1/36 | 10,495,000 | 11,397,045 | ||||||
| Sikeston, Missouri Electric Revenue Refunding | ||||||||
| 6.00% 6/1/13 (NATL-RE) | 1,000,000 | 1,069,690 | ||||||
| 20,761,267 | ||||||||
| Healthcare Revenue Bonds – 10.68% | ||||||||
| Brevard County, Florida Health Care Facilities Authority | ||||||||
| Revenue (Heath First Inc. Project) Series B 7.00% 4/1/39 | 1,610,000 | 1,819,220 | ||||||
| Butler County, Pennsylvania Hospital Authority Revenue | ||||||||
| (Butler Health System Project) 7.125% 7/1/29 | 2,250,000 | 2,615,783 | ||||||
| Cape Girardeau County, Missouri Industrial Development | ||||||||
| Authority Health Care Facilities Revenue Unrefunded | ||||||||
| Balance (St. Francis Medical Center) Series A | ||||||||
| 5.50% 6/1/32 | 1,000,000 | 1,017,490 | ||||||
27
Statements of net assets
Delaware Tax-Free USA Fund
Delaware Tax-Free USA Fund
| Principal amount | Value | |||||||
| Municipal Bonds (continued) | ||||||||
| Health Care Revenue Bonds (continued) | ||||||||
| Cleveland-Cuyahoga County, Ohio Port Authority Revenue | ||||||||
| Senior Housing (St. Clarence - Geac) Series A 6.25% 5/1/38 | $ | 1,500,000 | $ | 1,321,755 | ||||
| Colorado Health Facilities Authority Revenue | ||||||||
| (Evangelical Lutheran) Series A 5.25% 6/1/34 | 4,275,000 | 4,280,387 | ||||||
| Cuyahoga County, Ohio Revenue (Cleveland Clinic Health | ||||||||
| Systems) Series A 5.50% 1/1/29 | 4,000,000 | 4,301,320 | ||||||
| Fairfax County, Virginia Industrial Development Authority | ||||||||
| Revenue (Inova Health Services) Series A 5.50% 5/15/35 | 2,500,000 | 2,742,400 | ||||||
| Gainesville & Hall County, Georgia Development Authority | ||||||||
| Revenue Senior Living Facilities (Lanier Village Estates | ||||||||
| Project) Series C 7.25% 11/15/29 | 1,000,000 | 1,020,610 | ||||||
| Illinois Finance Authority Revenue | ||||||||
| (Silver Cross & Medical Centers) 7.00% 8/15/44 | 5,500,000 | 6,014,414 | ||||||
| Illinois Health Facilities Authority Revenue | ||||||||
| (Elmhurst Memorial Healthcare Project) 5.625% 1/1/28 | 2,000,000 | 2,005,660 | ||||||
| Lucas County, Ohio Health Care Facility Revenue (Sunset | ||||||||
| Retirement Communities) Series A 6.625% 8/15/30 | 2,000,000 | 2,020,780 | ||||||
| Maricopa County, Arizona Industrial Development Authority | ||||||||
| Health Facilities Revenue (Catholic Healthcare West) | ||||||||
| Series A 6.00% 7/1/39 | 3,690,000 | 4,005,458 | ||||||
| Michigan State Hospital Finance Authority Revenue | ||||||||
| (Ascension Health Credit Group) Series B 5.25% 11/15/26 | 3,500,000 | 3,639,930 | ||||||
| (Trinity Health Credit) Series C 5.375% 12/1/30 | 6,000,000 | 6,050,639 | ||||||
| Montana Facility Finance Authority Revenue | ||||||||
| (Sisters Leavenworth) Series A 5.25% 1/1/40 | 3,750,000 | 4,057,238 | ||||||
| New York State Dormitory Authority Revenue Non State | ||||||||
| Supported Debt | ||||||||
| (North Shore LI Jewish Health System) Series A 5.50% 5/1/37 | 3,500,000 | 3,702,300 | ||||||
| (Orange Regional Medical Center) 6.50% 12/1/21 | 2,745,000 | 2,947,389 | ||||||
| North Carolina Medical Care Commission Health Care | ||||||||
| Facilities Revenue (First Mortgage - Presbyterian Homes) | ||||||||
| 5.40% 10/1/27 | 3,260,000 | 3,234,702 | ||||||
| Ohio State Higher Educational Facility Community Revenue | ||||||||
| (Cleveland Clinic Health System Obligation Group) | ||||||||
| Series A 5.25% 1/1/33 | 2,000,000 | 2,124,760 | ||||||
| ^ | Oregon Health Science University Revenue | |||||||
| (Capital Appreciation Insured) | ||||||||
| Series A 5.50% 7/1/21 (NATL-RE) | 2,000,000 | 1,252,100 | ||||||
28
| Principal amount | Value | |||||||
| Municipal Bonds (continued) | ||||||||
| Health Care Revenue Bonds (continued) | ||||||||
| Puerto Rico Industrial, Tourist, Educational, Medical & | ||||||||
| Environmental Control Facilities Revenue (Hospital Auxilio | ||||||||
| Mutuo Obligated Group) Series A 6.25% 7/1/24 (NATL-RE) | $ | 1,200,000 | $ | 1,201,788 | ||||
| St. Paul, Minnesota Housing & Redevelopment Authority | ||||||||
| Hospital Revenue (Healtheast Project) 6.00% 11/15/35 | 3,000,000 | 2,919,930 | ||||||
| Tallahassee, Florida Health Facilities Revenue | ||||||||
| (Tallahassee Memorial Regional Medical Center) | ||||||||
| Series B 6.00% 12/1/15 (NATL-RE) | 2,500,000 | 2,506,025 | ||||||
| 66,802,078 | ||||||||
| Housing Revenue Bonds – 0.86% | ||||||||
| Florida Housing Finance Agency | ||||||||
| (Landings at Sea Forest Apartments) Series T | ||||||||
| 5.85% 12/1/18 (AMBAC) (FHA) (AMT) | 285,000 | 285,168 | ||||||
| 6.05% 12/1/36 (AMBAC) (FHA) (AMT) | 700,000 | 699,951 | ||||||
| (Spinnaker Cove Apartments) Series G | ||||||||
| 6.50% 7/1/36 (AMBAC) (FHA) (AMT) | 500,000 | 500,140 | ||||||
| Missouri State Housing Development Commission Mortgage | ||||||||
| Revenue Single Family Homeowner Loan A 5.20% 9/1/33 | ||||||||
| (GNMA) (FNMA) (AMT) | 170,000 | 171,637 | ||||||
| Missouri State Housing Development Commission | ||||||||
| Multifamily Housing Revenue | ||||||||
| (Hyder) Series 3 5.60% 7/1/34 (FHA) (AMT) | 1,435,000 | 1,464,202 | ||||||
| (San Remo) Series 5 5.45% 1/1/36 (FHA) (AMT) | 500,000 | 510,695 | ||||||
| New Mexico Mortgage Finance Authority Revenue | ||||||||
| Series B Class III 6.75% 7/1/25 (GNMA) (FNMA) | 85,000 | 88,675 | ||||||
| Series E 6.95% 1/1/26 (GNMA) (FNMA) | 95,000 | 96,677 | ||||||
| Orange County, Florida Housing Finance Authority | ||||||||
| Homeowner Revenue Series B | ||||||||
| 5.25% 3/1/33 (GNMA) (FNMA) (AMT) | 105,000 | 106,110 | ||||||
| Oregon Health, Housing, Educational, & Cultural Facilities | ||||||||
| Authority Revenue (Pier Park Project) Series A | ||||||||
| 6.05% 4/1/18 (GNMA) (AMT) | 815,000 | 816,345 | ||||||
| Santa Fe, New Mexico Single Family Mortgage Revenue | ||||||||
| Series B-1 6.20% 11/1/16 (GNMA) (FNMA) (AMT) | 130,000 | 130,350 | ||||||
| Volusia County, Florida Multifamily Housing Finance | ||||||||
| Authority (San Marco Apartments) | ||||||||
| Series A 5.60% 1/1/44 (AGM) (AMT) | 500,000 | 506,030 | ||||||
| 5,375,980 | ||||||||
29
Statements of net assets
Delaware Tax-Free USA Fund
Delaware Tax-Free USA Fund
| Principal amount | Value | |||||||
| Municipal Bonds (continued) | ||||||||
| Lease Revenue Bonds – 3.22% | ||||||||
| Capital Area Cultural Education Facilities Finance | ||||||||
| Corporation Texas Revenue (Roman Catholic Diocese) | ||||||||
| Series B 6.125% 4/1/45 | $ | 2,045,000 | $ | 2,111,422 | ||||
| Capital Trust Agency Florida Revenue | ||||||||
| (Fort Lauderdale/Cargo Acquisition Project) | ||||||||
| 5.75% 1/1/32 (AMT) | 3,750,000 | 3,429,487 | ||||||
| (Orlando/Cargo Acquisition Project) 6.75% 1/1/32 (AMT) | 2,395,000 | 2,253,072 | ||||||
| Grapevine, Texas Industrial Development Corporate Revenue | ||||||||
| (Air Cargo) 6.50% 1/1/24 (AMT) | 905,000 | 907,896 | ||||||
| Houston, Texas Industrial Development Corporate Revenue | ||||||||
| (Air Cargo) 6.375% 1/1/23 (AMT) | 1,990,000 | 1,993,184 | ||||||
| Loudoun County, Virginia Industrial Development Authority Public | ||||||||
| Safety Facility Lease Revenue Series A 5.25% 12/15/23 (AGM) | 700,000 | 789,691 | ||||||
| Missouri State Development Finance Board Infrastructure | ||||||||
| Facilities Revenue | ||||||||
| (Branson Landing Project) Series A | ||||||||
| 5.25% 12/1/19 | 1,435,000 | 1,534,962 | ||||||
| 5.625% 12/1/28 | 2,430,000 | 2,534,247 | ||||||
| (Sewer System Improvement Project) Series C 5.00% 3/1/25 | 605,000 | 611,510 | ||||||
| (Triumph Foods Project) Series A 5.25% 3/1/25 | 500,000 | 505,090 | ||||||
| Puerto Rico Commonwealth Industrial Development Company | ||||||||
| General Purpose Revenue Series B 5.375% 7/1/16 | 1,000,000 | 1,001,650 | ||||||
| Puerto Rico Public Buildings Authority Revenue (Guaranteed | ||||||||
| Government Facilities) Series F 5.25% 7/1/25 | 930,000 | 1,006,939 | ||||||
| ^ | St. Louis, Missouri Industrial Development Authority | |||||||
| Leasehold Revenue (Convention Center Hotel) | ||||||||
| 5.80% 7/15/20 (AMBAC) | 3,035,000 | 1,439,531 | ||||||
| 20,118,681 | ||||||||
| Local General Obligation Bonds – 4.52% | ||||||||
| Boerne, Texas Independent School District Building | ||||||||
| 5.25% 2/1/27 (PSF) | 4,000,000 | 4,202,920 | ||||||
| Los Angeles, California Unified School District Election of 2005 | ||||||||
| Series F 5.00% 1/1/34 | 6,180,000 | 6,497,096 | ||||||
| Melrose Park, Illinois Tax Increment | ||||||||
| Series B 6.00% 12/15/19 (AGM) | 1,250,000 | 1,266,300 | ||||||
30
| Principal amount | Value | |||||||
| Municipal Bonds (continued) | ||||||||
| Local General Obligation Bonds (continued) | ||||||||
| New York City, New York | ||||||||
| Series I 5.125% 3/1/23 | $ | 5,875,000 | $ | 6,366,091 | ||||
| Series I-1 5.375% 4/1/36 | 5,000,000 | 5,539,200 | ||||||
| Series J 5.25% 6/1/28 | 2,055,000 | 2,218,599 | ||||||
| Powell, Ohio 5.50% 12/1/32 (NATL-RE) | 2,000,000 | 2,164,980 | ||||||
| 28,255,186 | ||||||||
| §Pre-Refunded/Escrowed to Maturity Bonds – 17.36% | ||||||||
| Cape Girardeau County, Missouri Industrial Development | ||||||||
| Authority Health Care Facilities Revenue (Southeast | ||||||||
| Missouri Hospital) 5.25% 6/1/16 (NATL-RE) | 440,000 | 495,770 | ||||||
| Deschutes County, Oregon Hospital Facilities Authority Hospital | ||||||||
| Revenue (Cascade Health Services) 5.60% 1/1/32-12 | 1,250,000 | 1,337,300 | ||||||
| Duluth, Minnesota Economic Development Authority Health | ||||||||
| Care Facilities Revenue (Benedictine Health System - | ||||||||
| St. Mary’s Hospital) 5.25% 2/15/33-14 | 4,000,000 | 4,631,880 | ||||||
| Golden State, California Tobacco Securitization Corporation | ||||||||
| Settlement Revenue Series B 5.625% 6/1/38-13 | 7,500,000 | 8,528,100 | ||||||
| ^ | Greene County, Missouri Single Family Mortgage Revenue | |||||||
| Municipal Multiplier (Private Mortgage Insurance) 6.10% 3/1/16 | 1,225,000 | 1,110,144 | ||||||
| Henrico County, Virginia Economic Development Authority | ||||||||
| Revenue (Bon Secours Health System) | ||||||||
| Series A 5.60% 11/15/30-11 | 130,000 | 144,615 | ||||||
| Highlands County, Florida Health Facilities Authority | ||||||||
| (Adventist Health System/Sunbelt) | ||||||||
| Series A 6.00% 11/15/31-11 | 1,500,000 | 1,613,640 | ||||||
| Illinois Educational Facilities Authority Student Housing | ||||||||
| Revenue (Educational Advancement Fund - University | ||||||||
| Center Project) 6.25% 5/1/30-12 | 5,000,000 | 5,538,400 | ||||||
| Linn County, Oregon Community School District #9 | ||||||||
| Lebanon 5.60% 6/15/30-13 (FGIC) | 2,000,000 | 2,285,060 | ||||||
| Louisiana Public Facilities Authority Hospital Revenue | ||||||||
| (Southern Baptist Hospital, Inc. Project) 8.00% 5/15/12 | 1,880,000 | 2,006,148 | ||||||
| Maryland State Economic Development Corporation, | ||||||||
| Student Housing Revenue (University of Maryland College | ||||||||
| Park Project) 5.625% 6/1/35-13 | 1,125,000 | 1,284,098 | ||||||
| Milledgeville-Baldwin County, Georgia Development | ||||||||
| Authority Revenue (Georgia College & State University | ||||||||
| Foundation Student Housing Project) 6.00% 9/1/33-14 | 1,000,000 | 1,217,540 | ||||||
31
Statements of net assets
Delaware Tax-Free USA Fund
Delaware Tax-Free USA Fund
| Principal amount | Value | |||||||
| Municipal Bonds (continued) | ||||||||
| §Pre-Refunded/Escrowed to Maturity Bonds (continued) | ||||||||
| New Jersey State Educational Facilities Authority Revenue | ||||||||
| (Stevens Institute of Technology) Series B 5.25% 7/1/24-14 | $ | 2,085,000 | $ | 2,445,351 | ||||
| New Jersey State Highway Authority Garden State Parkway | ||||||||
| General Revenue (Senior Parkway) | ||||||||
| 5.50% 1/1/14 (FGIC) | 5,000,000 | 5,813,600 | ||||||
| 5.50% 1/1/15 (FGIC) | 7,310,000 | 8,751,313 | ||||||
| 5.50% 1/1/16 (FGIC) | 1,000,000 | 1,220,040 | ||||||
| New York City, New York Series J 5.25% 6/1/28-13 | 2,895,000 | 3,280,469 | ||||||
| North Carolina Medical Care Commission Hospital Revenue | ||||||||
| (Northeast Medical Center Project) 5.125% 11/1/34-14 | 1,250,000 | 1,470,200 | ||||||
| Oklahoma State Turnpike Authority Revenue (First Senior) | ||||||||
| 6.00% 1/1/22 | 13,535,000 | 18,050,275 | ||||||
| Osceola County, Florida School Board Certificates of | ||||||||
| Participation Series A 5.25% 6/1/27-12 (AMBAC) | 4,000,000 | 4,372,640 | ||||||
| Payne County, Oklahoma Economic Development Authority | ||||||||
| Student Housing Revenue (Collegiate Housing Foundation - | ||||||||
| Oklahoma State University) Series A 6.375% 6/1/30-11 | 4,000,000 | 4,183,280 | ||||||
| Puerto Rico Commonwealth Highway & Transportation | ||||||||
| Authority Revenue Series G 5.00% 7/1/42-13 | 525,000 | 592,888 | ||||||
| Puerto Rico Electric Power Authority Revenue | ||||||||
| Series II 5.25% 7/1/31-12 | 6,000,000 | 6,602,820 | ||||||
| Series NN 5.125% 7/1/29-13 | 1,105,000 | 1,251,777 | ||||||
| Puerto Rico Public Buildings Authority Revenue (Guaranteed | ||||||||
| Government Facilities) Series I 5.25% 7/1/33-14 | 175,000 | 204,376 | ||||||
| • | Puerto Rico Sales Tax Financing Corporation Sales Tax Revenue | |||||||
| Series A 5.00% 8/1/39-11 | 4,000,000 | 4,174,800 | ||||||
| Richmond, Virginia Public Utilities Revenue | ||||||||
| 5.00% 1/15/27-12 (AGM) | 10,000,000 | 10,646,399 | ||||||
| St. Louis, Missouri Airport Revenue (Capital Improvement | ||||||||
| Project) Series A 5.375% 7/1/21-12 (NATL-RE) | 1,635,000 | 1,781,055 | ||||||
| Virgin Islands Public Finance Authority Revenue | ||||||||
| Series A 7.30% 10/1/18 | 2,200,000 | 2,730,970 | ||||||
| Wisconsin Housing & Economic Developing Authority | ||||||||
| Revenue 6.10% 6/1/21-17 (FHA) | 645,000 | 781,540 | ||||||
| 108,546,488 | ||||||||
32
| Principal amount | Value | |||||||
| Municipal Bonds (continued) | ||||||||
| Special Tax Revenue Bonds – 12.97% | ||||||||
| Brooklyn Arena Local Development Corporation, New York | ||||||||
| Pilot Revenue (Barclays Center Project) 6.50% 7/15/30 | $ | 8,230,000 | $ | 8,999,176 | ||||
| California State Economic Recovery Refunding | ||||||||
| Series A 5.25% 7/1/21 | 3,130,000 | 3,752,056 | ||||||
| Florida Enterprise Community Development District Special | ||||||||
| Assessment 6.10% 5/1/16 (NATL-RE) | 695,000 | 697,815 | ||||||
| Henderson, Nevada Local Improvement | ||||||||
| Districts #T-18 5.30% 9/1/35 | 2,315,000 | 1,142,013 | ||||||
| Hollywood, Florida Community Redevelopment Agency | ||||||||
| Revenue (Beach CRA) 5.625% 3/1/24 | 1,200,000 | 1,241,112 | ||||||
| Jacksonville, Florida Excise Tax Revenue | ||||||||
| Series B 5.00% 10/1/26 (AMBAC) | 1,000,000 | 1,056,000 | ||||||
| Lammersville, California School District Community Facilities | ||||||||
| District #2002 (Mountain House) 5.125% 9/1/35 | 4,125,000 | 3,636,435 | ||||||
| Manchester, Missouri Tax Increment & Transportation Revenue | ||||||||
| (Highway 141/Manchester Road Project) 6.875% 11/1/39 | 3,120,000 | 3,216,845 | ||||||
| Middlesex County, New Jersey Improvement Authority Senior | ||||||||
| Revenue (Heldrich Center Hotel/Conference Project) Series A | ||||||||
| 5.00% 1/1/32 | 1,500,000 | 848,520 | ||||||
| 5.125% 1/1/37 | 1,500,000 | 848,490 | ||||||
| Missouri State Development Finance Board Infrastructure | ||||||||
| Facilities Revenue (Crackerneck Creek Project) | ||||||||
| Series C 5.00% 3/1/26 | 500,000 | 507,690 | ||||||
| Missouri State Environmental Improvement & Energy Water | ||||||||
| Pollution Control Revenue (State Revolving Fund Project) | ||||||||
| Series A 6.05% 7/1/16 (AGM) | 1,030,000 | 1,034,491 | ||||||
| Missouri State Highways & Transportation Commission State | ||||||||
| Road Revenue Series B 5.00% 5/1/24 | 9,000,000 | 10,460,430 | ||||||
| New Jersey Economic Development Authority Revenue | ||||||||
| (Cigarette Tax) | ||||||||
| 5.50% 6/15/31 | 1,000,000 | 988,200 | ||||||
| 5.75% 6/15/34 | 1,935,000 | 1,915,011 | ||||||
| New York City, New York Transitional Finance Authority | ||||||||
| Series D 5.00% 2/1/31 | 5,000,000 | 5,314,400 | ||||||
| New York Sales Tax Asset Receivables | ||||||||
| Series A 5.25% 10/15/27 (AMBAC) | 1,000,000 | 1,116,150 | ||||||
33
Statements of net assets
Delaware Tax-Free USA Fund
Delaware Tax-Free USA Fund
| Principal amount | Value | |||||||
| Municipal Bonds (continued) | ||||||||
| Special Tax Revenue Bonds (continued) | ||||||||
| New York State Dormitory Authority State Personal Income | ||||||||
| Tax Revenue | ||||||||
| Series A 5.00% 3/15/38 | $ | 4,545,000 | $ | 4,899,919 | ||||
| Series B 5.25% 3/15/38 | 6,000,000 | 6,640,800 | ||||||
| Puerto Rico Sales Tax Financing Corporation Sales | ||||||||
| Corporation Tax Revenue | ||||||||
| Ω(Capital Appreciation) Series A 6.75% 8/1/32 | 10,780,000 | 9,315,645 | ||||||
| Series A 5.75% 8/1/37 | 5,000,000 | 5,359,800 | ||||||
| Series A 6.00% 8/1/39 | 3,530,000 | 3,907,957 | ||||||
| Tampa, Florida Sports Authority Revenue Sales Tax | ||||||||
| (Tampa Bay Arena Project) 5.75% 10/1/20 (NATL-RE) | 1,000,000 | 1,157,500 | ||||||
| ^ | Wyandotte County/Kansas City, Kansas Unified Government | |||||||
| Special Obligation Revenue (Capital Appreciation-Sales Tax) | ||||||||
| Subordinate Lien 6.07% 6/1/21 | 5,230,000 | 3,031,465 | ||||||
| 81,087,920 | ||||||||
| State General Obligation Bonds – 5.04% | ||||||||
| California State | ||||||||
| 6.00% 4/1/38 | 4,060,000 | 4,533,883 | ||||||
| 6.50% 4/1/33 | 2,570,000 | 3,017,488 | ||||||
| Guam Government Series A 7.00% 11/15/39 | 4,295,000 | 4,810,056 | ||||||
| Maryland State & Local Facilities Land Capital Improvement | ||||||||
| Second Series 5.00% 8/1/16 | 4,000,000 | 4,842,200 | ||||||
| Puerto Rico Commonwealth Public Improvement Series A | ||||||||
| 5.125% 7/1/31 | 4,415,000 | 4,435,265 | ||||||
| 5.25% 7/1/23 | 500,000 | 516,415 | ||||||
| 5.50% 7/1/19 (NATL-RE) | 5,000,000 | 5,674,651 | ||||||
| Series C 6.00% 7/1/39 | 3,370,000 | 3,658,101 | ||||||
| 31,488,059 | ||||||||
| Transportation Revenue Bonds – 9.04% | ||||||||
| Bay Area, California Toll Bridge Authority Revenue | ||||||||
| (San Francisco Bay Area) Series F-1 5.625% 4/1/44 | 4,265,000 | 4,805,418 | ||||||
| Branson, Missouri Regional Airport Transportation | ||||||||
| Development District Revenue (Branson Airport Project) | ||||||||
| Series B 6.00% 7/1/37 (AMT) | 1,500,000 | 861,990 | ||||||
| Dallas-Fort Worth, Texas International Airport Revenue | ||||||||
| Series A 5.50% 11/1/31 (NATL-RE) (FGIC) (AMT) | 1,500,000 | 1,515,660 | ||||||
34
| Principal amount | Value | |||||||
| Municipal Bonds (continued) | ||||||||
| Transportation Revenue Bonds (continued) | ||||||||
| Maryland State Economic Development Corporation Revenue | ||||||||
| (Transportation Facilities Project) Series A 5.75% 6/1/35 | $ | 5,075,000 | $ | 5,329,461 | ||||
| New York State Thruway Authority General Revenue Series H | ||||||||
| 5.00% 1/1/19 (NATL-RE) | 6,240,000 | 7,263,235 | ||||||
| North Texas Tollway Authority Revenue (First Tier) | ||||||||
| Series A 6.00% 1/1/24 | 3,345,000 | 3,807,346 | ||||||
| •Series E-3 5.75% 1/1/38 | 4,320,000 | 5,003,942 | ||||||
| Phoenix, Arizona Civic Improvement Corporation Airport | ||||||||
| Revenue Junior Lien Series A 5.00% 7/1/26 | 1,800,000 | 1,961,874 | ||||||
| Sacramento County, California Airport System Revenue | ||||||||
| (PFC/Grant) Series C 6.00% 7/1/41 | 6,500,000 | 7,150,715 | ||||||
| St. Louis, Missouri Airport Revenue (Lambert-St Louis | ||||||||
| International) Series A-1 6.625% 7/1/34 | 5,995,000 | 6,546,780 | ||||||
| Texas Private Activity Bond Surface Transportation | ||||||||
| Corporation Senior Lien | ||||||||
| (LBJ Infrastructure) 7.00% 6/30/40 | 5,715,000 | 6,245,295 | ||||||
| (Mobility Partners) 6.875% 12/31/39 | 5,500,000 | 6,037,350 | ||||||
| 56,529,066 | ||||||||
| Water & Sewer Revenue Bonds – 3.12% | ||||||||
| Atlanta, Georgia Water & Wastewater Revenue | ||||||||
| Series A 6.25% 11/1/39 | 5,500,000 | 6,284,904 | ||||||
| New York City, New York Municipal Water Finance | ||||||||
| Authority Water & Sewer System Revenue | ||||||||
| Fiscal 2009 Series A 5.75% 6/15/40 | 4,000,000 | 4,613,120 | ||||||
| Series A 5.25% 6/15/34 | 3,705,000 | 3,928,115 | ||||||
| Tampa, Florida Water and Sewer Revenue | ||||||||
| 6.00% 10/1/16 (AGM) | 1,000,000 | 1,233,500 | ||||||
| Virgin Islands Water & Power Authority Water System | ||||||||
| Revenue 5.50% 7/1/17 | 510,000 | 511,046 | ||||||
| West Virginia State Water Development Authority Revenue | ||||||||
| (Loan Program III) Series A 6.375% 7/1/39 (AMBAC) (AMT) | 2,890,000 | 2,921,848 | ||||||
| 19,492,533 | ||||||||
| Total Municipal Bonds (cost $575,301,239) | 618,573,525 | |||||||
35
Statements of net assets
Delaware Tax-Free USA Fund
Delaware Tax-Free USA Fund
| Principal amount | Value | |||||||||
| Short-Term Investment – 0.32% | ||||||||||
| Variable Rate Demand Note – 0.32% | ||||||||||
| • | Minneapolis & St. Paul, Minnesota Housing & Redevelopment | |||||||||
| Authority Health Care Revenue (Allina Health System) | ||||||||||
| Series B-2 0.25% 11/15/35 (LOC–JP Morgan Chase Bank) | $ | 2,000,000 | $ | 2,000,000 | ||||||
| Total Short-Term Investment (cost $2,000,000) | 2,000,000 | |||||||||
| Total Value of Securities – 99.25% | ||||||||||
| (cost $577,301,239) | 620,573,525 | |||||||||
| Receivables and Other Assets | ||||||||||
| Net of Liabilities – 0.75% | 4,666,601 | |||||||||
| Net Assets Applicable to 53,753,813 | ||||||||||
| Shares Outstanding – 100.00% | $ | 625,240,126 | ||||||||
| Net Asset Value – Delaware Tax-Free USA Fund | ||||||||||
| Class A ($581,931,552 / 50,035,311 Shares) | $11.63 | |||||||||
| Net Asset Value – Delaware Tax-Free USA Fund | ||||||||||
| Class B ($5,373,081 / 462,226 Shares) | $11.62 | |||||||||
| Net Asset Value – Delaware Tax-Free USA Fund | ||||||||||
| Class C ($30,301,786 / 2,604,795 Shares) | $11.63 | |||||||||
| Net Asset Value – Delaware Tax-Free USA Fund | ||||||||||
| Institutional Class ($7,633,707 / 651,481 Shares) | $11.72 | |||||||||
| Components of Net Assets at August 31, 2010: | ||||||||||
| Shares of beneficial interest (unlimited authorization – no par) | $ | 589,352,077 | ||||||||
| Undistributed net investment income | 66,895 | |||||||||
| Accumulated net realized loss on investments | (7,451,132 | ) | ||||||||
| Net unrealized appreciation of investments | 43,272,286 | |||||||||
| Total net assets | $ | 625,240,126 | ||||||||
36
| § | Pre-Refunded/Escrowed to Maturity bonds. Municipals that are generally backed or secured by U.S. Treasury bonds. For Pre-Refunded bonds, the stated maturity is followed by the year in which the bond is pre-refunded. See Note 8 in “Notes to financial statements.” |
| • | Variable rate security. The rate shown is the rate as of August 31, 2010. |
| ^ | Zero coupon security. The rate shown is the yield at the time of purchase. Interest rates reset periodically. |
| Ω | Step coupon bond. Indicates security that has a zero coupon that remains in effect until a predetermined date at which time the stated interest rate becomes effective. |
Summary of abbreviations:
ACA — Insured by American Capital Access
AGM — Insured by Assured Guaranty Municipal Corporation
AMBAC — Insured by the AMBAC Assurance Corporation
AMT — Subject to Alternative Minimum Tax
FGIC — Insured by the Financial Guaranty Insurance Company
FHA — Insured by the Federal Housing Administration
FNMA — Federal National Mortgage Association collateral
GNMA — Government National Mortgage Association collateral
LOC — Letter of Credit
NATL-RE — Insured by the National Public Finance Guarantee Corporation
PSF — Insured by the Permanent School Fund
RADIAN — Insured by Radian Asset Assurance
| Net Asset Value and Offering Price Per Share – | |||
| Delaware Tax-Free USA Fund | |||
| Net asset value Class A (A) | $ | 11.63 | |
| Sales charge (4.50% of offering price) (B) | 0.55 | ||
| Offering price | $ | 12.18 | |
| (A) | Net asset value per share, as illustrated, is the amount which would be paid upon redemption or repurchase of shares. | |
| (B) | See the current prospectus for purchases of $100,000 or more. |
See accompanying Notes, which are an integral part of the financial statements.
37
| Statements of net assets | |
| Delaware Tax-Free USA Intermediate Fund | August 31, 2010 |
| Principal amount | Value | |||||||
| Municipal Bonds – 98.31% | ||||||||
| Corporate Revenue Bonds – 8.54% | ||||||||
| Allegheny County, Pennsylvania Industrial Development | ||||||||
| Authority Revenue (Environmental Improvement - | ||||||||
| U.S. Steel Corp. Project) 6.50% 5/1/17 | $ | 2,315,000 | $ | 2,513,720 | ||||
| Alliance Airport Authority, Texas Special Facilities Revenue | ||||||||
| (Federal Express Corp. Project) 4.85% 4/1/21 (AMT) | 2,000,000 | 2,017,920 | ||||||
| • | Brazos, Texas Harbor Industrial Development Environmental | |||||||
| Facilities Revenue (Dow Chemical Co. Project) | ||||||||
| 5.90% 5/1/38 (AMT) | 1,010,000 | 1,048,330 | ||||||
| Brazos, Texas River Authority Pollution Control Revenue | ||||||||
| (Texas Utilities) 5.40% 5/1/29 (AMT) | 1,000,000 | 401,780 | ||||||
| Buckeye, Ohio Tobacco Settlement Financing Authority | ||||||||
| Asset-Backed Series A-2 5.875% 6/1/47 | 5,645,000 | 4,122,148 | ||||||
| • | Chesapeake, Virginia Economic Development Authority | |||||||
| Pollution Control Revenue (Electric & Power Co. Project) | ||||||||
| Series A 3.60% 2/1/32 | 1,150,000 | 1,199,565 | ||||||
| Chesterfield County, Virginia Economic Development | ||||||||
| Authority Pollution Control Revenue (Virginia Electric & | ||||||||
| Power) Series A 5.00% 5/1/23 | 1,460,000 | 1,621,286 | ||||||
| Clayton County, Georgia Development Authority Special | ||||||||
| Facilities Revenue (Delta Air Lines) Series A 8.75% 6/1/29 | 1,770,000 | 2,004,684 | ||||||
| • | Gulf Coast Waste Disposal Authority, Texas Environmental | |||||||
| Facilities Revenue (BP Products North America) | ||||||||
| 2.30% 1/1/26 | 780,000 | 758,441 | ||||||
| 2.30% 1/1/42 | 1,500,000 | 1,458,540 | ||||||
| Harris County, Texas Industrial Development Corporation | ||||||||
| Solid Waste Disposal Revenue (Deer Park Refining Project) | ||||||||
| 5.00% 2/1/23 | 2,750,000 | 2,950,145 | ||||||
| Indianapolis, Indiana Airport Authority Revenue Special | ||||||||
| Facilities (Federal Express Corp. Project) | ||||||||
| 5.10% 1/15/17 (AMT) | 750,000 | 806,445 | ||||||
| Iowa Finance Authority Pollution Control Facilities Revenue | ||||||||
| (Interstate Power) 5.00% 7/1/14 (FGIC) | 2,000,000 | 2,182,760 | ||||||
| • | Maricopa County, Arizona Corporation Pollution Control | |||||||
| Revenue (Public Service Co. - Palo Verde Project) | ||||||||
| Series B 5.20% 6/1/43 | 6,000,000 | 6,251,101 | ||||||
| Maryland Economic Development Corporation Pollution | ||||||||
| Control Revenue (Potomac Electric Project) | ||||||||
| 6.20% 9/1/22 | 1,780,000 | 2,114,871 | ||||||
38
| Principal amount | Value | |||||||
| Municipal Bonds (continued) | ||||||||
| Corporate Revenue Bonds (continued) | ||||||||
| Memphis-Shelby County, Tennessee Airport Authority | ||||||||
| Special Facilities Revenue (Federal Express Corp. Project) | ||||||||
| 5.05% 9/1/12 | $ | 1,000,000 | $ | 1,060,110 | ||||
| Michigan State Strategic Fund Limited Obligation Revenue | ||||||||
| (Dow Chemical Project) Series B-2 6.25% 6/1/14 | 4,500,000 | 5,068,440 | ||||||
| • | Mobile, Alabama Industrial Development Board Pollution | |||||||
| Control Revenue (Alabama Power Co.) | ||||||||
| Series B 4.875% 6/1/34 | 2,840,000 | 3,077,935 | ||||||
| M-S-R Energy Authority, California Gas Revenue | ||||||||
| Series A 6.125% 11/1/29 | 3,640,000 | 4,040,400 | ||||||
| New Jersey Economic Development Authority Special | ||||||||
| Facilities Revenue (Continental Airlines, Inc. Project) | ||||||||
| 6.625% 9/15/12 (AMT) | 3,295,000 | 3,359,681 | ||||||
| Ohio State Air Quality Development Authority Revenue | ||||||||
| Environmental Improvement (First Energy) | ||||||||
| Series A 5.70% 2/1/14 | 2,225,000 | 2,475,112 | ||||||
| Series A 5.70% 8/1/20 | 4,320,000 | 4,885,920 | ||||||
| Series C 5.625% 6/1/18 | 2,370,000 | 2,691,040 | ||||||
| (USX Project) 5.00% 11/1/15 | 1,000,000 | 1,043,090 | ||||||
| • | Pennsylvania Economic Development Financing Authority | |||||||
| Exempt Facilities Revenue (Exelon Generation Co. | ||||||||
| Project) Series A 5.00% 12/1/42 | 1,355,000 | 1,433,197 | ||||||
| Prattville, Alabama Industrial Development Board | ||||||||
| Environmental Improvement Revenue (International | ||||||||
| Paper Co. Project) Series A 6.70% 3/1/24 (AMT) | 1,075,000 | 1,086,868 | ||||||
| • | Sabine, Texas River Authority Pollution Control Revenue | |||||||
| (TXU Electric Co. Project) Series A 5.50% 5/1/22 | 1,000,000 | 955,630 | ||||||
| Sugar Creek, Missouri Industrial Development | ||||||||
| Revenue (Lafarge North America Project) | ||||||||
| Series A 5.65% 6/1/37 (AMT) | 500,000 | 483,365 | ||||||
| 63,112,524 | ||||||||
| Education Revenue Bonds – 5.90% | ||||||||
| California Municipal Finance Authority Educational Revenue | ||||||||
| (American Heritage Education Foundation Project) Series A | ||||||||
| 5.25% 6/1/26 | 1,000,000 | 974,820 | ||||||
| California Statewide Communities Development Authority | ||||||||
| Student Housing Revenue (Irvine, LLC - UCI East | ||||||||
| Campus) 6.00% 5/15/23 | 3,150,000 | 3,439,548 | ||||||
39
Statements of net assets
Delaware Tax-Free USA Intermediate Fund
Delaware Tax-Free USA Intermediate Fund
| Principal amount | Value | |||||||
| Municipal Bonds (continued) | ||||||||
| Education Revenue Bonds (continued) | ||||||||
| Chattanooga, Tennessee Health Educational & Housing | ||||||||
| Facilities Board Revenue (CDFI Phase I, LLC Project) | ||||||||
| Series B 5.50% 10/1/20 | $ | 1,030,000 | $ | 1,032,318 | ||||
| Clifton, Texas Higher Education Finance Corporation | ||||||||
| Revenue (Uplift Education) Series A 6.00% 12/1/30 | 1,100,000 | 1,139,061 | ||||||
| Connecticut State Health & Educational Facilities Authority | ||||||||
| Revenue (Yale University) Series A-1 5.00% 7/1/25 | 5,000,000 | 5,797,300 | ||||||
| Fulton County, Georgia Development Authority Revenue | ||||||||
| (Molecular Science Building Project) 5.25% 5/1/21 (NATL-RE) | 1,000,000 | 1,110,200 | ||||||
| Grand Traverse, Michigan Public School Academy Revenue | ||||||||
| 5.00% 11/1/36 | 1,000,000 | 822,150 | ||||||
| Marietta, Georgia Development Authority Revenue | ||||||||
| (Life University Income Project) 6.25% 6/15/20 | 1,180,000 | 1,184,189 | ||||||
| Massachusetts State Health & Educational Facilities | ||||||||
| Authority Revenue | ||||||||
| (Nichols College Project) Series C 6.125% 10/1/29 | 1,000,000 | 1,005,390 | ||||||
| •(Northeastern University) 4.125% 10/1/37 | 2,360,000 | 2,440,924 | ||||||
| Michigan Higher Education Facilities Authority Revenue | ||||||||
| (Kalamazoo College Project) 5.50% 12/1/19 | 500,000 | 524,750 | ||||||
| Nassau County, New York Industrial Development Agency | ||||||||
| Civic Facility Revenue (New York Institute of Technology | ||||||||
| Project) Series A 4.75% 3/1/26 | 1,710,000 | 1,775,579 | ||||||
| New Jersey Economic Development Authority Revenue | ||||||||
| (Provident Group - Montclair Properties) 5.75% 6/1/31 | 2,500,000 | 2,635,200 | ||||||
| New York State Dormitory Authority Revenue | ||||||||
| (Brooklyn Law School) Series A 5.50% 7/1/18 (RADIAN) | 1,000,000 | 1,061,500 | ||||||
| (Non State Supported Debt - Rockefeller University) Series A | ||||||||
| 5.00% 7/1/27 | 1,055,000 | 1,218,071 | ||||||
| 5.00% 7/1/41 | 8,070,000 | 8,910,329 | ||||||
| (Non State Supported Debt - St. Joseph’s College) | ||||||||
| 5.25% 7/1/25 | 1,000,000 | 1,049,630 | ||||||
| Ohio State Higher Educational Facility Revenue | ||||||||
| (John Carroll University) 5.50% 11/15/18 | 335,000 | 362,212 | ||||||
| Ohio State University General Receipts Revenue | ||||||||
| Series B 5.25% 6/1/21 | 180,000 | 199,913 | ||||||
| Troy, New York Capital Resource Corporation Revenue | ||||||||
| (Rensselaer Polytechnic) Series B 5.00% 9/1/18 | 2,500,000 | 2,876,300 | ||||||
| University of California Series A 5.125% 5/15/20 (AMBAC) | 210,000 | 231,347 | ||||||
40
| Principal amount | Value | |||||||
| Municipal Bonds (continued) | ||||||||
| Education Revenue Bonds (continued) | ||||||||
| University of Oklahoma Research Facilities Revenue | ||||||||
| 5.00% 3/1/23 (AMBAC) | $ | 1,065,000 | $ | 1,109,975 | ||||
| University of Virginia General Revenue Series B | ||||||||
| 5.00% 6/1/20 | 1,250,000 | 1,347,375 | ||||||
| 5.00% 6/1/21 | 1,250,000 | 1,341,925 | ||||||
| 43,590,006 | ||||||||
| Electric Revenue Bonds – 4.23% | ||||||||
| Metropolitan Government Nashville & Davidson County, | ||||||||
| Tennessee Electric Revenue Series B 5.50% 5/15/14 | 1,000,000 | 1,172,780 | ||||||
| Orlando, Florida Utilities Commission Water & Electric | ||||||||
| Revenue 5.25% 10/1/20 | 555,000 | 587,712 | ||||||
| Puerto Rico Electric Power Authority Revenue | ||||||||
| Series TT 5.00% 7/1/37 | 2,500,000 | 2,562,325 | ||||||
| Series XX 5.75% 7/1/36 | 13,000,000 | 14,117,350 | ||||||
| Rochester, Minnesota Electric Utilities Revenue | ||||||||
| Series C 5.00% 12/1/18 (NATL-RE) | 2,000,000 | 2,358,520 | ||||||
| South Carolina State Public Service Authority Revenue | ||||||||
| Series A 5.125% 1/1/21 (AGM) | 1,000,000 | 1,087,250 | ||||||
| Texas Municipal Power Agency Revenue | ||||||||
| 4.00% 9/1/11 (AMBAC) | 110,000 | 110,000 | ||||||
| (Subordinated Lien - Transmission) | ||||||||
| 5.00% 9/1/27 | 1,000,000 | 1,107,840 | ||||||
| 5.00% 9/1/28 | 2,000,000 | 2,198,120 | ||||||
| Turlock, California Irrigation District Revenue | ||||||||
| Series A 5.00% 1/1/30 | 1,000,000 | 1,069,960 | ||||||
| Vernon, California Electric System Revenue | ||||||||
| Series A 5.125% 8/1/21 | 4,500,000 | 4,868,325 | ||||||
| 31,240,182 | ||||||||
| Healthcare Revenue Bonds – 10.30% | ||||||||
| Allegheny County, Pennsylvania Municipal Development | ||||||||
| Authority Revenue (University of Pittsburgh Medical Center) | ||||||||
| Series A 5.00% 9/1/14 | 4,000,000 | 4,540,880 | ||||||
| Berks County, Pennsylvania Hospital Authority Revenue | ||||||||
| (Reading Hospital & Medical Center Project) | ||||||||
| Series A-3 5.25% 11/1/24 | 4,405,000 | 4,753,656 | ||||||
| Butler County, Pennsylvania Hospital Authority Revenue | ||||||||
| (Butler Health System Project) 7.125% 7/1/29 | 2,250,000 | 2,615,783 | ||||||
41
Statements of net assets
Delaware Tax-Free USA Intermediate Fund
Delaware Tax-Free USA Intermediate Fund
| Principal amount | Value | |||||||
| Municipal Bonds (continued) | ||||||||
| Healthcare Revenue Bonds (continued) | ||||||||
| California Municipal Finance Authority Certificates of | ||||||||
| Participation (Community Hospitals Center) | ||||||||
| 5.25% 2/1/24 | $ | 1,350,000 | $ | 1,373,828 | ||||
| California Statewide Communities Development Authority | ||||||||
| Revenue (Kaiser Permanente) Series A 5.00% 4/1/19 | 5,325,000 | 6,067,144 | ||||||
| Cape Girardeau County, Missouri Industrial Development | ||||||||
| Authority Health Care Facilities Revenue (St. Francis | ||||||||
| Medical Center) Series A 5.50% 6/1/34 | 640,000 | 654,278 | ||||||
| Cleveland-Cuyahoga County, Ohio Port Authority Revenue | ||||||||
| (Saint Clarence - Geac) Series A 6.125% 5/1/26 | 715,000 | 668,840 | ||||||
| Cumberland County, Pennsylvania Municipal Authority | ||||||||
| Revenue (Diakon Lutheran Social Ministries) | ||||||||
| 6.25% 1/1/24 | 2,625,000 | 2,831,325 | ||||||
| Cuyahoga County, Ohio Revenue (Cleveland Clinic | ||||||||
| Health System) Series A 6.00% 1/1/21 | 1,000,000 | 1,108,740 | ||||||
| Dauphin County, Pennsylvania General Authority Health | ||||||||
| System Revenue (Pinnacle Health System Project) | ||||||||
| Series A 6.00% 6/1/29 | 4,500,000 | 4,908,600 | ||||||
| Georgia Medical Center Hospital Authority Revenue | ||||||||
| (Spring Harbor Green Island Project) 5.25% 7/1/37 | 2,300,000 | 1,939,521 | ||||||
| Lycoming County, Pennsylvania Authority Health System | ||||||||
| Revenue (Susquehanna Health System Project) Series A | ||||||||
| 5.50% 7/1/28 | 2,500,000 | 2,608,150 | ||||||
| Maryland State Health & Higher Education Facilities | ||||||||
| Authority Revenue | ||||||||
| •(John Hopkins Health Systems) 5.00% 5/15/46 | 790,000 | 864,086 | ||||||
| (Union Hospital of Cecil County) 5.625% 7/1/32 | 500,000 | 508,615 | ||||||
| Massachusetts State Health & Educational Facilities | ||||||||
| Authority Revenue (Caregroup) | ||||||||
| Series E-2 5.375% 7/1/21 | 1,970,000 | 2,167,197 | ||||||
| Michigan State Hospital Finance Authority Revenue | ||||||||
| (Oakwood Obligation Group) 5.50% 11/1/14 | 2,230,000 | 2,407,843 | ||||||
| Minneapolis, Minnesota Health Care System Revenue | ||||||||
| (Fairview Health) Series A 6.375% 11/15/23 | 3,710,000 | 4,383,254 | ||||||
| Minneapolis, Minnesota Revenue (National Marrow Donor | ||||||||
| Program Project) | ||||||||
| 5.00% 8/1/16 | 4,720,000 | 5,174,536 | ||||||
| 5.00% 8/1/18 | 2,500,000 | 2,708,175 | ||||||
42
| Principal amount | Value | |||||||
| Municipal Bonds (continued) | ||||||||
| Healthcare Revenue Bonds (continued) | ||||||||
| New York State Dormitory Authority Revenue Non State | ||||||||
| Supported Debt (North Shore LI Jewish Health System) | ||||||||
| Series A 5.50% 5/1/30 | $ | 1,700,000 | $ | 1,822,043 | ||||
| (Orange Regional Medical Center) 6.50% 12/1/21 | 2,000,000 | 2,147,460 | ||||||
| North Carolina Medical Care Commission Health Care | ||||||||
| Facilities Revenue (First Mortgage - Presbyterian Homes) | ||||||||
| 5.40% 10/1/27 | 780,000 | 773,947 | ||||||
| Ohio State Higher Educational Facilities Commission Revenue | ||||||||
| (Cleveland Clinic Health System Obligation Group) Series A | ||||||||
| 5.00% 1/1/17 | 2,000,000 | 2,303,780 | ||||||
| 5.00% 1/1/18 | 1,000,000 | 1,160,710 | ||||||
| Scottsdale, Arizona Industrial Development Authority | ||||||||
| Hospital Revenue (Scottsdale Healthcare) | ||||||||
| Series A 5.00% 9/1/19 | 3,065,000 | 3,360,313 | ||||||
| South Carolina Jobs-Economic Development Authority | ||||||||
| Hospital Revenue (Palmetto Health) 5.50% 8/1/26 | 5,000,000 | 5,223,199 | ||||||
| St. Louis Park, Minnesota Health Care Facilities Revenue | ||||||||
| (Nicollet Health Services) Series C 5.50% 7/1/18 | 4,240,000 | 4,733,282 | ||||||
| St. Mary Hospital Authority, Pennsylvania Health System | ||||||||
| Revenue (Catholic Health East) | ||||||||
| Series A 5.25% 11/15/16 | 1,200,000 | 1,306,620 | ||||||
| St. Paul, Minnesota Housing & Redevelopment Authority | ||||||||
| Hospital Revenue (Health East Project) 6.00% 11/15/25 | 1,000,000 | 1,012,800 | ||||||
| 76,128,605 | ||||||||
| Housing Revenue Bonds – 1.03% | ||||||||
| California Housing Finance Agency Revenue | ||||||||
| (Home Mortgage) Series M 5.95% 8/1/25 (AMT) | 2,670,000 | 2,830,547 | ||||||
| Puerto Rico Housing Finance Authority Subordinate | ||||||||
| (Capital Fund Modernization) 5.50% 12/1/16 | 4,120,000 | 4,753,327 | ||||||
| 7,583,874 | ||||||||
| Lease Revenue Bonds – 1.78% | ||||||||
| Capital Trust Agency Florida Revenue (Fort Lauderdale/ | ||||||||
| Cargo Acquisition Project) 5.75% 1/1/32 (AMT) | 1,750,000 | 1,600,428 | ||||||
| Golden State, California Tobacco Securitization Corporation | ||||||||
| Settlement Revenue Refunding Asset-Backed Series A | ||||||||
| 5.00% 6/1/18 | 1,170,000 | 1,170,468 | ||||||
| 5.00% 6/1/21 (AMBAC) | 1,000,000 | 1,001,920 | ||||||
43
Statements of net assets
Delaware Tax-Free USA Intermediate Fund
Delaware Tax-Free USA Intermediate Fund
| Principal amount | Value | |||||||
| Municipal Bonds (continued) | ||||||||
| Lease Revenue Bonds (continued) | ||||||||
| Michigan State Building Authority Revenue Series I | ||||||||
| 5.00% 10/15/24 | $ | 2,860,000 | $ | 2,911,766 | ||||
| 5.50% 10/15/18 | 2,050,000 | 2,132,451 | ||||||
| New York State Municipal Bond Bank Agency Special | ||||||||
| School Purpose Revenue Series C 5.25% 6/1/22 | 1,000,000 | 1,086,480 | ||||||
| • | Puerto Rico Public Buildings Authority Revenue | |||||||
| (Guaranteed Government Facilities) Series J 5.00% 7/1/28 | 1,000,000 | 1,039,560 | ||||||
| Tobacco Settlement Financing New York Revenue | ||||||||
| (Asset-Backed) Series B 5.00% 6/1/12 | 2,060,000 | 2,214,335 | ||||||
| 13,157,408 | ||||||||
| Local General Obligation Bonds – 6.67% | ||||||||
| Chicago, Illinois Board of Education Refunding Dedicated | ||||||||
| Revenue Series B 5.00% 12/1/23 (AMBAC) | 3,500,000 | 3,867,150 | ||||||
| Chicago, Illinois Modern Schools Across Chicago | ||||||||
| Series J 5.00% 12/1/23 (AMBAC) | 2,865,000 | 3,154,394 | ||||||
| Chicago, Illinois Project & Refunding | ||||||||
| Series C 5.50% 1/1/40 (NATL-RE) (FGIC) | 2,940,000 | 2,978,837 | ||||||
| Dallas, Texas 5.125% 2/15/15 | 3,000,000 | 3,532,200 | ||||||
| Fairfax County, Virginia Refunding & Public Improvement | ||||||||
| 5.25% 4/1/14 | 3,500,000 | 4,080,160 | ||||||
| Gwinnett County, Georgia School District | ||||||||
| 5.00% 2/1/11 | 3,000,000 | 3,059,610 | ||||||
| 5.00% 2/1/21 | 4,975,000 | 6,187,806 | ||||||
| Henrico County, Virginia Refunding Public Improvement | ||||||||
| 5.00% 7/15/19 | 4,000,000 | 4,991,280 | ||||||
| Lansing, Michigan Community College (College Building & Site) | ||||||||
| 5.00% 5/1/21 (NATL-RE) | 1,325,000 | 1,455,884 | ||||||
| Los Angeles, California Unified School District | ||||||||
| (Election 1997) Series F 5.00% 7/1/21 (FGIC) | 2,880,000 | 3,150,979 | ||||||
| (Election 2004) Series G | ||||||||
| 5.00% 7/1/13 (AMBAC) | 2,000,000 | 2,235,140 | ||||||
| 5.00% 7/1/31 (AMBAC) | 2,825,000 | 2,963,792 | ||||||
| Middlesex County, New Jersey Improvement Authority | ||||||||
| Revenue (County Guaranteed Open Space Trust) | ||||||||
| 5.25% 9/15/20 | 1,000,000 | 1,120,340 | ||||||
44
| Principal amount | Value | |||||||
| Municipal Bonds (continued) | ||||||||
| Local General Obligation Bonds (continued) | ||||||||
| New York City, New York | ||||||||
| Series A-1 5.00% 8/1/19 | $ | 3,500,000 | $ | 4,134,655 | ||||
| Series G 5.25% 8/1/15 | 1,000,000 | 1,135,240 | ||||||
| Series I 5.00% 8/1/21 | 1,000,000 | 1,125,650 | ||||||
| Series J 5.50% 6/1/23 | 100,000 | 110,190 | ||||||
| 49,283,307 | ||||||||
| §Pre-Refunded/Escrowed to Maturity Bonds – 5.07% | ||||||||
| Benton & Linn Counties, Oregon School District #509J | ||||||||
| 5.00% 6/1/21-13 (AGM) | 1,000,000 | 1,121,920 | ||||||
| California State Economic Recovery Series A 5.25% 7/1/14 | 225,000 | 264,355 | ||||||
| Cook County, Illinois Series A 5.375% 11/15/21-11 (FGIC) | 2,160,000 | 2,238,365 | ||||||
| Duluth, Minnesota Economic Development | ||||||||
| Authority Health Care Facilities Revenue | ||||||||
| (Benedictine Health System - St. Mary’s Hospital) | ||||||||
| 5.25% 2/15/28-14 | 1,000,000 | 1,157,970 | ||||||
| 5.50% 2/15/23-14 | 1,000,000 | 1,166,500 | ||||||
| Illinois Educational Facilities Authority Student Housing | ||||||||
| Revenue (Educational Advancement - | ||||||||
| University Center Project) 6.00% 5/1/22-12 | 750,000 | 827,648 | ||||||
| Lancaster County, Pennsylvania Hospital Authority Revenue | ||||||||
| (Lancaster General Hospital Project) | ||||||||
| 5.75% 3/15/21-13 | 1,000,000 | 1,144,800 | ||||||
| Lunenburg County, Virginia Series B 5.25% 2/1/29-13 (NATL-RE) | 715,000 | 805,305 | ||||||
| Miami-Dade County, Florida Educational Facilities Authority | ||||||||
| Revenue (University of Miami) Series A | ||||||||
| 5.00% 4/1/34-14 (AMBAC) | 3,500,000 | 4,010,859 | ||||||
| Michigan State Building Authority Revenue | ||||||||
| (Facilities Program) Series I | ||||||||
| 5.00% 10/15/24-11 | 140,000 | 147,396 | ||||||
| 5.50% 10/15/18-11 | 125,000 | 132,304 | ||||||
| Minneapolis, Minnesota Health Care System Revenue | ||||||||
| (Allina Health Systems) Series A 5.75% 11/15/32-12 | 500,000 | 558,675 | ||||||
| New Jersey State Educational Facilities Authority Revenue | ||||||||
| (Georgian Court College Project) Series C 6.50% 7/1/33-13 | 500,000 | 584,835 | ||||||
| New Jersey State Transportation Trust Fund Authority | ||||||||
| (Transportation System) Series C 5.50% 6/15/22-13 | 1,700,000 | 1,938,629 | ||||||
| New York City, New York Series J 5.50% 6/1/23-13 | 900,000 | 1,025,991 | ||||||
45
Statements of net assets
Delaware Tax-Free USA Intermediate Fund
Delaware Tax-Free USA Intermediate Fund
| Principal amount | Value | |||||||
| Municipal Bonds (continued) | ||||||||
| §Pre-Refunded/Escrowed to Maturity Bonds (continued) | ||||||||
| North Texas Health Facilities Development Corporation | ||||||||
| Hospital Revenue (United Regional Health Care System, | ||||||||
| Inc. Project) 6.00% 9/1/23-13 | $ | 1,000,000 | $ | 1,153,450 | ||||
| • | Ohio State Higher Educational Facility Revenue Adjustable | |||||||
| Medium Term (Kenyon College Project) 4.70% 7/1/37-13 | 1,000,000 | 1,119,060 | ||||||
| Ohio State University General Receipts (Ohio State | ||||||||
| University) Series B 5.25% 6/1/21-13 | 820,000 | 927,256 | ||||||
| Pennsylvania State First Series 5.125% 1/15/19-11 | 3,515,000 | 3,614,509 | ||||||
| Pennsylvania State Higher Educational Facilities | ||||||||
| Authority College & University Revenue | ||||||||
| (Geneva College Project) 6.125% 4/1/22-12 | 1,000,000 | 1,090,180 | ||||||
| Puerto Rico Commonwealth Highway & Transportation | ||||||||
| Authority Revenue Series J 5.50% 7/1/21-14 | 1,000,000 | 1,175,620 | ||||||
| Puerto Rico Public Buildings Authority Revenue | ||||||||
| (Guaranteed Government Facilities) Series I 5.50% 7/1/23-14 | 2,000,000 | 2,354,560 | ||||||
| • | Puerto Rico Sales Tax Financing Corporation Sales Tax | |||||||
| Revenue Series A 5.00% 8/1/39-11 | 4,500,000 | 4,696,650 | ||||||
| Southcentral, Pennsylvania General Authority Revenue | ||||||||
| (Welllspan Health Obligated Project) | ||||||||
| 5.625% 5/15/26-11 | 820,000 | 859,565 | ||||||
| 5.625% 5/15/26 | 180,000 | 187,848 | ||||||
| University of California Revenue | ||||||||
| Series A 5.125% 5/15/20-13 (AMBAC) | 40,000 | 44,764 | ||||||
| University of North Carolina Revenue (Chapel Hill) | ||||||||
| Series A 5.375% 12/1/14-11 | 2,000,000 | 2,078,120 | ||||||
| Virginia State Resource Authority Clean Water Revenue | ||||||||
| (State Revolving Fund) 6.00% 10/1/16-10 | 1,000,000 | 1,004,840 | ||||||
| 37,431,974 | ||||||||
| Resource Recovery Revenue Bonds – 0.17% | ||||||||
| Pennsylvania Economic Development Financing Authority | ||||||||
| Resource Recovery Revenue (Subordinate Colver Project) | ||||||||
| Series G 5.125% 12/1/15 (AMT) | 1,300,000 | 1,258,088 | ||||||
| 1,258,088 | ||||||||
| Special Tax Revenue Bonds – 11.61% | ||||||||
| Baltimore, Maryland Convention Center Hotel Revenue | ||||||||
| Subordinated Series B 5.00% 9/1/16 | 1,200,000 | 1,147,836 | ||||||
| Brooklyn Arena Local Development Corporation New York | ||||||||
| Pilot Revenue (Barclays Center Project) 6.50% 7/15/30 | 5,500,000 | 6,014,029 | ||||||
46
| Principal amount | Value | |||||||
| Municipal Bonds (continued) | ||||||||
| Special Tax Revenue Bonds (continued) | ||||||||
| California State Economic Recovery Series A | ||||||||
| 5.25% 7/1/14 | $ | 775,000 | $ | 895,234 | ||||
| 5.25% 7/1/21 | 2,740,000 | 3,284,548 | ||||||
| Casa Grande, Arizona Excise Tax Revenue | ||||||||
| 5.00% 4/1/22 (AMBAC) | 1,600,000 | 1,683,152 | ||||||
| Columbia County, Georgia Sales Tax 5.00% 4/1/16 | 1,265,000 | 1,513,256 | ||||||
| Dallas, Texas Convention Center Hotel Development | ||||||||
| Revenue Series A | ||||||||
| 5.00% 1/1/24 | 3,420,000 | 3,614,222 | ||||||
| 5.25% 1/1/23 | 5,375,000 | 5,844,883 | ||||||
| Guam Government Limited Obligation Revenue | ||||||||
| (Section 30) Series A | ||||||||
| 5.375% 12/1/24 | 1,750,000 | 1,867,425 | ||||||
| 5.625% 12/1/29 | 1,185,000 | 1,259,963 | ||||||
| Hampton, Virginia Convention Center Revenue | ||||||||
| 5.25% 1/15/23 (AMBAC) | 1,000,000 | 1,075,780 | ||||||
| Louisiana State Citizens Property Insurance Corporation | ||||||||
| Assessment Revenue Series C-2 | ||||||||
| 6.75% 6/1/26 (ASSURED GTY) | 3,600,000 | 4,293,000 | ||||||
| Metropolitan Pier & Exposition Authority, Illinois Dedicate | ||||||||
| State Tax Revenue (McCormick Place Expansion Project) | ||||||||
| Series A 5.50% 12/15/24 (NATL-RE) (FGIC) | 2,000,000 | 2,027,920 | ||||||
| Middlesex County, New Jersey Improvement Authority | ||||||||
| Senior Revenue (Heldrich Center Hotel/Conference | ||||||||
| Project) Series A 5.00% 1/1/32 | 1,000,000 | 565,680 | ||||||
| @ | Modesto, California Special Tax Community Facilities | |||||||
| District #04-1 (Village 2) 5.15% 9/1/36 | 1,500,000 | 1,193,880 | ||||||
| New Jersey Economic Development Authority Revenue | ||||||||
| (Cigarette Tax) | ||||||||
| 5.00% 6/15/11 (FGIC) | 2,750,000 | 2,789,408 | ||||||
| 5.50% 6/15/31 | 1,000,000 | 988,200 | ||||||
| 5.625% 6/15/18 | 1,000,000 | 1,000,430 | ||||||
| • | New York City, New York Transitional Finance Authority | |||||||
| Revenue Refunding - Future Tax Secured | ||||||||
| Series A 5.50% 11/1/26 | 1,000,000 | 1,054,670 | ||||||
| New York State Local Government Assistance Corporation | ||||||||
| Refunding Subordinate Lien Series A 5.00% 4/1/20 | 3,360,000 | 4,097,419 | ||||||
| New York State Urban Development Corporation Revenue | ||||||||
| (State Personal Income Tax) Series A-1 5.00% 12/15/28 | 4,000,000 | 4,478,640 | ||||||
47
Statements of net assets
Delaware Tax-Free USA Intermediate Fund
Delaware Tax-Free USA Intermediate Fund
| Principal amount | Value | |||||||
| Municipal Bonds (continued) | ||||||||
| Special Tax Revenue Bonds (continued) | ||||||||
| Oregon Department of Administrative Services Lottery | ||||||||
| Revenue Series A 5.25% 4/1/26 | $ | 2,000,000 | $ | 2,337,420 | ||||
| Puerto Rico Sales Tax Financing Corporation Sales Tax | ||||||||
| Revenue Series A | ||||||||
| 5.25% 8/1/27 | 6,685,000 | 7,274,950 | ||||||
| 6.125% 8/1/29 | 2,500,000 | 2,651,600 | ||||||
| Series C 6.50% 8/1/35 | 6,500,000 | 7,474,284 | ||||||
| Richmond Heights, Missouri Tax Increment & Transaction | ||||||||
| Sales Tax Revenue Refunding & Improvement (Francis | ||||||||
| Place Redevelopment Project) 5.625% 11/1/25 | 1,000,000 | 922,650 | ||||||
| @ | St. Joseph, Missouri Industrial Development Authority Tax | |||||||
| Increment Revenue (Shoppes at North Village Project) | ||||||||
| Series A 5.10% 11/1/19 | 250,000 | 245,393 | ||||||
| Series B 5.375% 11/1/23 | 1,000,000 | 960,270 | ||||||
| Virgin Islands Public Finance Authority Revenue (Senior | ||||||||
| Lien Matching Fund Loan) Series A 5.25% 10/1/22 | 1,785,000 | 1,875,232 | ||||||
| Washington State Motor Vehicle Fuel Tax | ||||||||
| Series B 5.00% 7/1/16 | 4,250,000 | 5,094,858 | ||||||
| Wyandotte County, Kansas City, Kansas Unified | ||||||||
| Government Special Obligation Revenue | ||||||||
| ^(Capital Appreciation-Sales Tax - Subordinate Lien) | ||||||||
| 6.07% 6/1/21 | 5,230,000 | 3,031,465 | ||||||
| (Sales Tax-2nd Lien-Area B) 5.00% 12/1/20 | 1,500,000 | 1,574,655 | ||||||
| Wyoming State Loan & Investment Board Facilities | ||||||||
| Revenue 5.00% 10/1/24 | 1,550,000 | 1,664,561 | ||||||
| 85,796,913 | ||||||||
| State General Obligation Bonds – 23.24% | ||||||||
| California State 5.25% 11/1/17 | 1,000,000 | 1,109,720 | ||||||
| California State Various Purpose | ||||||||
| 5.00% 10/1/18 | 5,000,000 | 5,824,100 | ||||||
| 6.50% 4/1/33 | 4,500,000 | 5,283,540 | ||||||
| California Statewide Communities Development Authority | ||||||||
| Revenue (Purchase Proposition 1A Receivables Program) | ||||||||
| 5.00% 6/15/13 | 2,690,000 | 2,963,089 | ||||||
| Connecticut State Economic Recovery Series A | ||||||||
| 5.00% 1/1/16 | 4,700,000 | 5,583,835 | ||||||
48
| Principal amount | Value | |||||||
| Municipal Bonds (continued) | ||||||||
| State General Obligation Bonds (continued) | ||||||||
| Connecticut State Series C 5.00% 11/1/24 | $ | 2,000,000 | $ | 2,347,520 | ||||
| Georgia State | ||||||||
| 5.00% 8/1/12 | 3,125,000 | 3,406,563 | ||||||
| 5.00% 7/1/17 | 4,810,000 | 5,885,420 | ||||||
| Series D 5.00% 7/1/11 | 6,865,000 | 7,137,746 | ||||||
| Guam Government Series A 7.00% 11/15/39 | 1,560,000 | 1,747,075 | ||||||
| Illinois State Refunding Series B 5.00% 1/1/13 | 3,475,000 | 3,732,046 | ||||||
| Maryland State 5.00% 8/1/17 | 1,500,000 | 1,798,890 | ||||||
| Maryland State & Local Facilities Loan Capital Improvement | ||||||||
| First Series 5.00% 3/15/19 | 3,675,000 | 4,372,148 | ||||||
| Second Series 5.00% 7/15/14 | 975,000 | 1,138,137 | ||||||
| Series B 5.00% 3/1/21 | 7,700,000 | 9,487,246 | ||||||
| Series C 5.00% 11/1/17 | 2,750,000 | 3,386,103 | ||||||
| Massachusetts State Consolidated Loan | ||||||||
| Series A 5.25% 8/1/13 | 5,000,000 | 5,687,600 | ||||||
| Series C 5.50% 11/1/15 | 4,090,000 | 4,968,655 | ||||||
| Minnesota State 5.00% 6/1/14 | 900,000 | 1,045,890 | ||||||
| Minnesota State Various Purpose Series A 5.00% 8/1/19 | 8,020,000 | 10,004,789 | ||||||
| Mississippi State Series A 5.00% 10/1/17 | 4,860,000 | 5,882,641 | ||||||
| North Carolina State Public Improvement Series A | ||||||||
| 5.00% 3/1/12 | 4,000,000 | 4,284,160 | ||||||
| 5.00% 3/1/15 | 1,200,000 | 1,416,264 | ||||||
| North Carolina State Refunding | ||||||||
| Series A 5.00% 3/1/16 | 6,000,000 | 7,202,579 | ||||||
| Series B 5.00% 4/1/15 | 4,000,000 | 4,730,760 | ||||||
| Ohio State | ||||||||
| Series A 5.00% 6/15/13 | 3,750,000 | 4,218,975 | ||||||
| Series D 5.00% 9/15/14 | 3,500,000 | 4,085,515 | ||||||
| Pennsylvania State | ||||||||
| 5.50% 2/1/13 | 3,200,000 | 3,591,680 | ||||||
| Second Series 5.00% 7/1/20 | 2,300,000 | 2,840,247 | ||||||
| Second Series A | ||||||||
| 5.00% 8/1/13 | 4,000,000 | 4,524,880 | ||||||
| 5.00% 5/1/21 | 10,000,000 | 12,216,399 | ||||||
| Puerto Rico Commonwealth Government Development Bank | ||||||||
| 4.75% 12/1/15 (NATL-RE) | 4,765,000 | 4,975,041 | ||||||
49
Statements of net assets
Delaware Tax-Free USA Intermediate Fund
Delaware Tax-Free USA Intermediate Fund
| Principal amount | Value | |||||||
| Municipal Bonds (continued) | ||||||||
| State General Obligation Bonds (continued) | ||||||||
| Puerto Rico Commonwealth Public Improvement Series A | ||||||||
| 5.00% 7/1/16 (ASSURED GTY) | $ | 2,110,000 | $ | 2,395,209 | ||||
| 5.25% 7/1/22 | 3,470,000 | 3,595,267 | ||||||
| 5.25% 7/1/23 | 1,125,000 | 1,161,934 | ||||||
| 5.50% 7/1/17 | 4,415,000 | 4,954,425 | ||||||
| • | Puerto Rico Commonwealth Series A 5.00% 7/1/30 | 1,000,000 | 1,040,930 | |||||
| • | Puerto Rico Public Finance Corporation Commonwealth | |||||||
| Appropriation (LOC-Puerto Rico Government Bank) | ||||||||
| Series A 5.75% 8/1/27 | 1,000,000 | 1,040,480 | ||||||
| Virginia State | ||||||||
| 5.00% 6/1/23 | 2,000,000 | 2,349,760 | ||||||
| Series D 5.00% 6/1/19 | 5,715,000 | 7,121,690 | ||||||
| Washington State Variable Purpose Series A 5.00% 7/1/16 | 1,000,000 | 1,198,790 | ||||||
| 171,737,738 | ||||||||
| Transportation Revenue Bonds – 12.96% | ||||||||
| Broward County, Florida Airport System Revenue | ||||||||
| Series O 5.375% 10/1/29 | 3,895,000 | 4,222,219 | ||||||
| Charlotte, North Carolina Airport Revenue | ||||||||
| (Charlotte Douglas) Series A | ||||||||
| 5.00% 7/1/13 | 2,375,000 | 2,646,059 | ||||||
| 5.00% 7/1/15 | 750,000 | 863,265 | ||||||
| Chicago, Illinois O’Hare International Airport Revenue | ||||||||
| General-Airport-Third Lien Series A-2 | ||||||||
| 5.75% 1/1/20 (AGM) (AMT) | 1,000,000 | 1,077,830 | ||||||
| Dallas-Fort Worth, Texas International Airport Revenue Series A | ||||||||
| 5.00% 11/1/22 | 680,000 | 755,616 | ||||||
| 5.00% 11/1/23 | 750,000 | 828,375 | ||||||
| 5.00% 11/1/24 | 400,000 | 439,284 | ||||||
| Idaho Housing & Finance Association Grant Revenue | ||||||||
| (Antic Federal Highway Transportation) | ||||||||
| Series A 5.25% 7/15/21 (ASSURED GTY) | 2,760,000 | 3,225,971 | ||||||
| Maryland State Economic Development Revenue | ||||||||
| (Transportation Facilities Project) | ||||||||
| Series A 5.375% 6/1/25 | 2,470,000 | 2,597,057 | ||||||
| Massachusetts State Department of Transportation Metro | ||||||||
| Highway System Revenue Series B 5.00% 1/1/27 | 8,080,000 | 8,882,181 | ||||||
50
| Principal amount | Value | |||||||
| Municipal Bonds (continued) | ||||||||
| Transportation Revenue Bonds (continued) | ||||||||
| Metropolitan, New York Transportation Authority Revenue | ||||||||
| Series A 5.00% 11/15/18 | $ | 2,500,000 | $ | 2,943,725 | ||||
| Series C 6.50% 11/15/28 | 2,860,000 | 3,435,546 | ||||||
| Metropolitan, Washington D.C. Airport Authority Systems | ||||||||
| Revenue Series A | ||||||||
| 5.00% 10/1/30 | 6,000,000 | 6,564,060 | ||||||
| 5.50% 10/1/19 (NATL-RE) (FGIC) (AMT) | 1,000,000 | 1,087,540 | ||||||
| Missouri State Highways & Transportation Commission | ||||||||
| State Road Revenue Second Lien | ||||||||
| 5.25% 5/1/23 | 1,940,000 | 2,260,236 | ||||||
| New York State Thruway Authority Revenue | ||||||||
| (General Highway and Bridge Trust Fund) | ||||||||
| Series B 5.25% 4/1/13 (AMBAC) | 3,300,000 | 3,699,102 | ||||||
| North Texas Tollway Authority Revenue System (First Tier) | ||||||||
| Series A 6.00% 1/1/20 | 3,925,000 | 4,615,643 | ||||||
| •Series E-3 5.75% 1/1/38 | 2,470,000 | 2,861,050 | ||||||
| Pennsylvania State Turnpike Commission Revenue | ||||||||
| Series A 5.25% 12/1/20 (AMBAC) | 1,230,000 | 1,412,077 | ||||||
| Phoenix, Arizona Civic Improvement Airport Revenue | ||||||||
| Series A 5.00% 7/1/26 | 7,500,000 | 8,174,475 | ||||||
| Regional Transportation District, Colorado Private Activity | ||||||||
| Revenue (Denver Transportation Partners) | ||||||||
| 6.50% 1/15/30 | 4,440,000 | 4,920,763 | ||||||
| Sacramento County, California Airport System Revenue | ||||||||
| 5.00% 7/1/24 | 1,425,000 | 1,571,533 | ||||||
| (PFC/Grant) Series D | ||||||||
| 5.50% 7/1/28 | 2,020,000 | 2,204,891 | ||||||
| 5.625% 7/1/29 | 1,685,000 | 1,837,897 | ||||||
| Saint Louis, Missouri Airport Revenue (Lambert-St. Louis | ||||||||
| International) Series A-1 6.125% 7/1/24 | 3,780,000 | 4,239,194 | ||||||
| Texas Private Activity Bond Surface Transportation | ||||||||
| Corporate Senior Lien Revenue | ||||||||
| (LBJ Infrastructure) 7.50% 6/30/33 | 2,650,000 | 3,041,617 | ||||||
| (Mobility Partners) 7.50% 12/31/31 | 3,565,000 | 4,102,210 | ||||||
| Texas State Transportation Commission Highway Fund | ||||||||
| Revenue (First Tier) 5.00% 4/1/18 | 1,700,000 | 2,033,948 | ||||||
51
Statements of net assets
Delaware Tax-Free USA Intermediate Fund
Delaware Tax-Free USA Intermediate Fund
| Principal amount | Value | |||||||
| Municipal Bonds (continued) | ||||||||
| Transportation Revenue Bonds (continued) | ||||||||
| Triborough, New York Bridge & Tunnel Authority Revenue | ||||||||
| Series A 5.00% 11/15/17 | $ | 1,720,000 | $ | 2,079,102 | ||||
| •Series B-1 5.00% 11/15/25 | 4,000,000 | 4,508,600 | ||||||
| •Series B-3 5.00% 11/15/38 | 1,800,000 | 2,095,470 | ||||||
| Virginia Port Authority Commonwealth Port Fund Revenue | ||||||||
| Resolution 5.00% 7/1/12 (AMT) | 500,000 | 535,620 | ||||||
| 95,762,156 | ||||||||
| Water & Sewer Revenue Bonds – 6.81% | ||||||||
| Alabama Water Pollution Control Authority Revenue | ||||||||
| 5.50% 8/15/23 (AMBAC) | 1,000,000 | 1,005,950 | ||||||
| Arizona Water Infrastructure Finance Authority Revenue | ||||||||
| (Water Quality) Series A 5.00% 10/1/21 | 2,430,000 | 2,890,096 | ||||||
| Atlanta, Georgia Water & Wastewater Revenue | ||||||||
| Series A 6.00% 11/1/25 | 2,925,000 | 3,390,748 | ||||||
| Series B 5.50% 11/1/23 (AGM) | 3,000,000 | 3,425,670 | ||||||
| California State Department Water Resources Power | ||||||||
| Supply Revenue Series L 5.00% 5/1/19 | 6,000,000 | 7,319,940 | ||||||
| Florida Water Pollution Control Financing Corporation | ||||||||
| Revenue (Water Pollution Control) | ||||||||
| Series A 5.00% 1/15/25 | 5,000,000 | 5,713,450 | ||||||
| King County, Washington Sewer Revenue Refunding | ||||||||
| Series B 5.00% 1/1/14 (NATL-RE) | 3,500,000 | 3,999,345 | ||||||
| Massachusetts State Water Pollution Abatement Trust | ||||||||
| 5.00% 8/1/16 | 2,170,000 | 2,617,280 | ||||||
| New York City, New York Municipal Water Finance | ||||||||
| Authority Water & Sewer System | ||||||||
| (Second General) Series FF 5.00% 6/15/31 | 6,500,000 | 7,196,735 | ||||||
| Series B 5.00% 6/15/21 (AMBAC) | 2,085,000 | 2,385,115 | ||||||
| New York State Environmental Facilities Corporation | ||||||||
| Revenue (State Clean Water & Drinking Water | ||||||||
| Revolving Foundation) | ||||||||
| Series A 5.00% 6/15/22 | 1,405,000 | 1,650,622 | ||||||
| Series D 5.00% 9/15/23 | 3,360,000 | 3,864,202 | ||||||
| Portland, Oregon Sewer System Revenue (First Lien) | ||||||||
| Series A 5.00% 6/15/18 | 4,000,000 | 4,869,800 | ||||||
| 50,328,953 | ||||||||
| Total Municipal Bonds (cost $680,339,835) | 726,411,728 | |||||||
52
| Principal amount | Value | ||||||||
| Short-Term Investments – 0.70% | |||||||||
| •Variable Rate Demand Notes – 0.70% | |||||||||
| Harris County, Texas Cultural Education Facilities Finance | |||||||||
| Corporation Special Facilities Revenue (Texas Medical Center) | |||||||||
| Series B-1 0.25% 9/1/31 (LOC-JPMorgan Chase Bank) | $ | 2,900,000 | $ | 2,900,000 | |||||
| Minneapolis & St. Paul, Minnesota Housing & | |||||||||
| Redevelopment Authority Health Care Revenue | |||||||||
| (Allina Health System) Series B-2 0.25% 11/15/35 | |||||||||
| (LOC-JPMorgan Chase Bank) | 1,350,000 | 1,350,000 | |||||||
| Pittsburgh, Pennsylvania Water & Sewer Authority | |||||||||
| Water & Sewer System Revenue (First Lien) | |||||||||
| Series B2 0.26% 9/1/39 (LOC-PNC Bank N.A.) | 500,000 | 500,000 | |||||||
| Robbinsdale, Minnesota Revenue (North Memorial) | |||||||||
| Series A-3 0.25% 5/1/33 (LOC-Wells Fargo Bank N.A.) | 400,000 | 400,000 | |||||||
| Total Short-Term Investments (cost $5,150,000) | 5,150,000 | ||||||||
| Total Value of Securities – 99.01% | |||||||||
| (cost $685,489,835) | 731,561,728 | ||||||||
| Receivables and Other Assets | |||||||||
| Net of Liabilities – 0.99% | 7,322,028 | ||||||||
| Net Assets Applicable to 60,845,155 | |||||||||
| Shares Outstanding – 100.00% | $ | 738,883,756 | |||||||
| Net Asset Value – Delaware Tax-Free USA Intermediate Fund | |||||||||
| Class A ($481,004,143 / 39,707,133 Shares) | $12.11 | ||||||||
| Net Asset Value – Delaware Tax-Free USA Intermediate Fund | |||||||||
| Class B ($511,176 / 42,240 Shares) | $12.10 | ||||||||
| Net Asset Value – Delaware Tax-Free USA Intermediate Fund | |||||||||
| Class C ($65,342,502 / 5,396,932 Shares) | $12.11 | ||||||||
| Net Asset Value – Delaware Tax-Free USA Intermediate Fund | |||||||||
| Institutional Class ($192,025,935 / 15,698,850 Shares) | $12.23 | ||||||||
53
Statements of net assets
Delaware Tax-Free USA Intermediate Fund
Delaware Tax-Free USA Intermediate Fund
| Components of Net Assets at August 31, 2010: | |||
| Shares of beneficial interest (unlimited authorization – no par) | $ | 698,494,946 | |
| Undistributed net investment income | 16,225 | ||
| Accumulated net realized loss on investments | (5,699,308 | ) | |
| Net unrealized appreciation of investments | 46,071,893 | ||
| Total net assets | $ | 738,883,756 |
| § | Pre-Refunded/Escrowed to Maturity bonds. Municipals that are generally backed or secured by U.S. Treasury bonds. For Pre-Refunded bonds, the stated maturity is followed by the year in which the bond is pre-refunded. See Note 8 in “Notes to financial statements.” |
| ^ | Zero coupon security. The rate shown is the yield at the time of purchase. |
| • | Variable rate security. The rate shown is the rate as of August 31, 2010. Interest rates reset periodically. |
| @ | Illiquid security. At August 31, 2010, the aggregate amount of illiquid securities was $2,399,543, which represented 0.32% of the Fund’s net assets. See Note 8 in “Notes to financial statements.” |
Summary of abbreviations:
AGM — Insured by Assured Guaranty Municipal Corporation
AMBAC — Insured by the AMBAC Assurance Corporation
AMT — Subject to Alternative Minimum Tax
ASSURED GTY — Insured by the Assured Guaranty Corporation
CDFI — Community Development Financial Institutions
FGIC — Insured by the Financial Guaranty Insurance Company
LOC — Letter of Credit
NATL-RE — Insured by the National Public Finance Guarantee Corporation
RADIAN — Insured by Radian Asset Assurance
| Net Asset Value and Offering Price per Share – | ||
| Delaware Tax-Free USA Intermediate Fund | ||
| Net asset value Class A (A) | $ | 12.11 |
| Sales charge (2.75% of offering price) (B) | 0.34 | |
| Offering price | $ | 12.45 |
| (A) | Net asset value per share, as illustrated, is the amount which would be paid upon redemption or repurchase of shares. | |
| (B) | See the current prospectus for purchases of $100,000 or more. |
See accompanying Notes, which are an integral part of the financial statements.
54
| Delaware National High-Yield Municipal Bond Fund | August 31, 2010 |
| Principal amount | Value | |||||||
| Municipal Bonds – 95.60% | ||||||||
| Corporate Revenue Bonds – 18.02% | ||||||||
| Allegheny County, Pennsylvania Industrial Development | ||||||||
| Authority Revenue (Environmental Improvement - | ||||||||
| U.S. Steel Corp.) 6.875% 5/1/30 | $ | 1,000,000 | $ | 1,103,920 | ||||
| • | Beaver County, Pennsylvania Industrial Development | |||||||
| Authority Pollution Control Revenue (First Energy | ||||||||
| General Corp. Project) Series C 7.125% 6/1/28 (AMT) | 1,000,000 | 1,039,640 | ||||||
| • | Brazos, Texas Harbor Industrial Development Environmental | |||||||
| Facilities Revenue (Dow Chemical Co. Project) | ||||||||
| 5.90% 5/1/38 (AMT) | 190,000 | 197,211 | ||||||
| • | Brazos, Texas River Authority Pollution Control Revenue | |||||||
| (TXU Energy Co. Project) Series B 6.30% 7/1/32 (AMT) | 1,000,000 | 421,730 | ||||||
| Buckeye, Ohio Tobacco Settlement Financing Authority | ||||||||
| Asset-Backed Series A-2 | ||||||||
| 5.875% 6/1/47 | 1,500,000 | 1,095,345 | ||||||
| 6.50% 6/1/47 | 1,000,000 | 801,430 | ||||||
| Cass County, Texas Industrial Development Corporation | ||||||||
| Environmental Improvement Revenue (International | ||||||||
| Paper Co. Project) Series A 6.00% 9/1/25 (AMT) | 1,000,000 | 1,018,240 | ||||||
| Clayton County, Georgia Development Authority Special | ||||||||
| Facilities Revenue (Delta Airlines) Series B | ||||||||
| 9.00% 6/1/35 (AMT) | 1,000,000 | 1,077,790 | ||||||
| Cloquet, Minnesota Pollution Control Revenue | ||||||||
| (Potlatch Corp. Project) 5.90% 10/1/26 | 750,000 | 734,340 | ||||||
| Columbus County, North Carolina Industrial Facilities & | ||||||||
| Pollution Control Financing (International Paper Co. Project) | ||||||||
| Series A 5.70% 5/1/34 | 1,000,000 | 1,050,720 | ||||||
| De Soto Parish, Louisiana Environmental Improvement | ||||||||
| Revenue (International Paper Co. Project) Series A | ||||||||
| 6.35% 2/1/25 (AMT) | 1,650,000 | 1,675,558 | ||||||
| Golden State, California Tobacco Securitization Settlement | ||||||||
| Revenue Refunding Asset-Backed Senior Series A-1 | ||||||||
| 5.75% 6/1/47 | 4,400,000 | 3,295,907 | ||||||
| Gulf Coast, Texas Waste Disposal Authority Revenue | ||||||||
| (Valero Energy Corp. Project) 6.65% 4/1/32 (AMT) | 1,000,000 | 1,014,800 | ||||||
| • | Gulf Coast, Texas Waste Disposal Authority Texas Environmental | |||||||
| Facilities Revenue (BP Products North America) | ||||||||
| 2.30% 1/1/26 | 285,000 | 277,123 | ||||||
| 2.30% 1/1/42 | 550,000 | 534,798 | ||||||
55
Statements of net assets
Delaware National High-Yield Municipal Bond Fund
Delaware National High-Yield Municipal Bond Fund
| Principal amount | Value | |||||||
| Municipal Bonds (continued) | ||||||||
| Corporate Revenue Bonds (continued) | ||||||||
| Hawaii State Department Budget & Finance Special | ||||||||
| Purpose Revenue (Hawaiian Electric Co. Subsidiary) | ||||||||
| 6.50% 7/1/39 | $ | 970,000 | $ | 1,080,852 | ||||
| Indiana State Finance Authority Environmental Revenue | ||||||||
| (U.S. Steel Corp.) 6.00% 12/1/26 | 1,000,000 | 1,063,080 | ||||||
| Louisiana Local Government Environmental Facilities & | ||||||||
| Community Development Authority Revenue | ||||||||
| (Westlake Chemical Corp.) Series A 6.50% 8/1/29 | 1,500,000 | 1,567,785 | ||||||
| Michigan Tobacco Settlement Finance Authority Revenue | ||||||||
| Asset-Backed Series A 6.00% 6/1/48 | 555,000 | 422,832 | ||||||
| Mississippi Business Finance Corporation Pollution Control | ||||||||
| Revenue (System Energy Resources, Inc. Project) | ||||||||
| 5.90% 5/1/22 | 900,000 | 900,063 | ||||||
| M-S-R Energy Authority, California Gas Revenue Series C | ||||||||
| 6.50% 11/1/39 | 1,000,000 | 1,165,470 | ||||||
| New Jersey Economic Development Authority Special | ||||||||
| Facility Revenue (Continental Airlines Inc. Project) | ||||||||
| 6.40% 9/15/23 (AMT) | 1,000,000 | 987,810 | ||||||
| • | New York City, New York Industrial Development Agency | |||||||
| Special Facilities Revenue | ||||||||
| (American Airlines - JFK International Airport) | ||||||||
| 7.75% 8/1/31 (AMT) | 1,000,000 | 1,055,280 | ||||||
| (JetBlue Airways Corp. Project) 5.125% 5/15/30 (AMT) | 1,000,000 | 860,160 | ||||||
| New York Liberty Development Corporation Revenue | ||||||||
| Second Priority (Bank of America Tower) Class Z | ||||||||
| 5.625% 7/15/47 | 2,000,000 | 2,082,460 | ||||||
| Ohio County, Kentucky Pollution Control Revenue (Big | ||||||||
| Rivers Electric Corp. Project) Series A 6.00% 7/15/31 | 1,250,000 | 1,306,713 | ||||||
| Pennsylvania Economic Development Financing Authority | ||||||||
| Exempt Facilities Revenue (Allegheny Energy Supply Co.) | ||||||||
| 7.00% 7/15/39 | 1,000,000 | 1,146,460 | ||||||
| Petersburg, Indiana Pollution Control Revenue (Indianapolis | ||||||||
| Power & Light Co. Project) 6.375% 11/1/29 (AMT) | 1,000,000 | 1,027,640 | ||||||
| Phenix City, Alabama Industrial Development Board | ||||||||
| Environmental Improvement Revenue (Mead Westvaco | ||||||||
| Corp. Project) Series A 6.35% 5/15/35 (AMT) | 500,000 | 496,120 | ||||||
| Salt Verde Financial Corporation, Arizona Gas Revenue | ||||||||
| Senior 5.00% 12/1/37 | 1,000,000 | 954,150 | ||||||
56
| Principal amount | Value | |||||||
| Municipal Bonds (continued) | ||||||||
| Corporate Revenue Bonds (continued) | ||||||||
| St. John Baptist Parish, Louisiana Revenue (Marathon Oil Corp.) | ||||||||
| Series A 5.125% 6/1/37 | $ | 1,000,000 | $ | 1,001,950 | ||||
| Sugar Creek, Missouri Industrial Development Revenue | ||||||||
| (Lafarge North America Project) Series A | ||||||||
| 5.65% 6/1/37 (AMT) | 500,000 | 483,365 | ||||||
| Sweetwater County, Wyoming Solid Waste Disposal | ||||||||
| Revenue (FMC Corp. Project) 5.60% 12/1/35 (AMT) | 1,000,000 | 1,004,280 | ||||||
| Toledo, Lucas County, Ohio Port Authority Development | ||||||||
| Revenue (Toledo Express Airport Project) Series C | ||||||||
| 6.375% 11/15/32 (AMT) | 1,000,000 | 1,005,100 | ||||||
| 34,950,122 | ||||||||
| Education Revenue Bonds – 19.06% | ||||||||
| Bowling Green, Ohio Student Housing Revenue CFP I | ||||||||
| (State University Project) 6.00% 6/1/45 | 1,250,000 | 1,277,625 | ||||||
| California Statewide Communities Development Authority | ||||||||
| Revenue (California Baptist University Project) Series A | ||||||||
| 5.50% 11/1/38 | 1,000,000 | 870,290 | ||||||
| California Statewide Communities Development Authority | ||||||||
| School Facility Revenue (Aspire Public Schools Project) | ||||||||
| 6.00% 7/1/40 | 1,000,000 | 1,022,920 | ||||||
| California Statewide Communities Development Authority | ||||||||
| Student Housing Revenue (East Campus Apartments, LLC) | ||||||||
| Series A 5.625% 8/1/34 (ACA) | 1,000,000 | 1,001,110 | ||||||
| Chattanooga, Tennessee Health Educational & Housing | ||||||||
| Facilities Board Revenue (CDFI Phase I, LLC Project) | ||||||||
| Subordinate Series B 6.00% 10/1/35 | 1,500,000 | 1,450,875 | ||||||
| Clifton, Texas Higher Education Finance Corporation | ||||||||
| Revenue (Uplift Education) Series A 6.25% 12/1/45 | 1,000,000 | 1,028,070 | ||||||
| Gainesville, Georgia Redevelopment Authority Educational | ||||||||
| Facilities Revenue (Riverside Military Academy Project) | ||||||||
| 5.125% 3/1/37 | 1,850,000 | 1,339,160 | ||||||
| Idaho Housing & Finance Association Nonprofit Facilities | ||||||||
| Revenue (North Star Charter School Project) Series A | ||||||||
| 9.50% 7/1/39 | 1,000,000 | 1,175,480 | ||||||
| Indiana State Finance Authority Revenue Educational Facilities | ||||||||
| (Drexel Foundation – Thea Bowman Academy Charter | ||||||||
| School) 7.00% 10/1/39 | 1,000,000 | 1,077,890 | ||||||
| (Irvington Community) Series A 9.00% 7/1/39 | 1,000,000 | 1,214,760 | ||||||
57
Statements of net assets
Delaware National High-Yield Municipal Bond Fund
Delaware National High-Yield Municipal Bond Fund
| Principal amount | Value | |||||||
| Municipal Bonds (continued) | ||||||||
| Education Revenue Bonds (continued) | ||||||||
| Iowa Higher Education Loan Authority Revenue | ||||||||
| (Private College Facilities) 6.00% 9/1/39 | $ | 1,500,000 | $ | 1,558,620 | ||||
| Marietta, Georgia Development Authority Revenue | ||||||||
| (Life University Income Project) 7.00% 6/15/39 | 1,000,000 | 1,012,400 | ||||||
| Maryland State Economic Development Corporation | ||||||||
| Student Housing Revenue (University of Maryland | ||||||||
| College Park Projects) 5.75% 6/1/33 | 930,000 | 960,764 | ||||||
| Maryland State Health & Higher Educational Facilities | ||||||||
| Authority Revenue | ||||||||
| (Patterson Park Public Charter School) | ||||||||
| Series A 6.125% 7/1/45 | 1,000,000 | 1,038,220 | ||||||
| @(Washington Christian Academy Project) | ||||||||
| Series A 5.50% 7/1/38 | 1,170,000 | 503,135 | ||||||
| Massachusetts State Health & Educational Facilities | ||||||||
| Authority Revenue | ||||||||
| (Nichols College Project) Series C 6.125% 10/1/29 | 1,000,000 | 1,005,390 | ||||||
| (Springfield College) 5.625% 10/15/40 | 1,000,000 | 1,052,760 | ||||||
| Michigan Finance Authority Education Facilities Revenue | ||||||||
| (St. Catherine Siena) Series A 8.50% 10/1/45 | 2,000,000 | 2,026,200 | ||||||
| Michigan Public Education Facilities Authority Revenue | ||||||||
| (Limited-Obligation - Landmark Academy) 7.00% 12/1/39 | 1,000,000 | 1,057,000 | ||||||
| Minnesota State Higher Education Facilities Authority | ||||||||
| Revenue (Bethel University) Series 6-R 5.50% 5/1/37 | 1,000,000 | 1,007,120 | ||||||
| New Jersey Economic Development Authority Revenue | ||||||||
| (Provident Group - Montclair) 5.875% 6/1/42 | 1,500,000 | 1,559,084 | ||||||
| New Jersey State Educational Facilities Authority Revenue | ||||||||
| (Fairleigh Dickinson Project) Series C 5.50% 7/1/23 | 750,000 | 764,978 | ||||||
| (University of Medicine & Dentistry) Series B 7.50% 12/1/32 | 1,000,000 | 1,177,260 | ||||||
| Ohio State Higher Educational Facility Revenue (Otterbein | ||||||||
| College Project) Series A 5.50%12/1/28 | 950,000 | 1,048,886 | ||||||
| Oregon State Facilities Authority Revenue (College Housing | ||||||||
| Northwest Project) Series A 5.45% 10/1/32 | 1,000,000 | 933,120 | ||||||
| Pennsylvania State Higher Educational Facilities | ||||||||
| Authority Revenue | ||||||||
| (Edinboro University Foundation) 5.80% 7/1/30 | 1,300,000 | 1,359,345 | ||||||
| (Edinboro University Foundation Student Housing) | ||||||||
| 6.00% 7/1/42 | 1,000,000 | 1,035,240 | ||||||
| •Foundation Indiana University) Series A | ||||||||
| 0.795% 7/1/39 (XLCA) | 2,400,000 | 1,454,808 | ||||||
58
| Principal amount | Value | |||||||
| Municipal Bonds (continued) | ||||||||
| Education Revenue Bonds (continued) | ||||||||
| Philadelphia, Pennsylvania Authority for Industrial | ||||||||
| Development Revenue (First Philadelphia Charter Project) | ||||||||
| Series A 5.75% 8/15/32 | $ | 745,000 | $ | 722,412 | ||||
| Philadelphia, Pennsylvania Redevelopment Authority | ||||||||
| Revenue (Beech Student Housing Complex Project) | ||||||||
| Series A 5.50% 7/1/35 (ACA) | 1,500,000 | 1,261,290 | ||||||
| Provo, Utah Charter School Revenue (Freedom Academy | ||||||||
| Foundation Project) 5.50% 6/15/37 | 1,000,000 | 824,710 | ||||||
| Troy, New York Capital Resource Corporation Revenue | ||||||||
| (Rensselaer Polytechnic) Series A 5.125% 9/1/40 | 800,000 | 831,416 | ||||||
| Utah State Charter School Finance Authority Revenue | ||||||||
| (North Davis Preparatory) 6.375% 7/15/40 | 1,290,000 | 1,324,082 | ||||||
| 36,976,420 | ||||||||
| Electric Revenue Bonds – 2.87% | ||||||||
| Puerto Rico Electric Power Authority Revenue Series | ||||||||
| Series XX 5.25% 7/1/40 | 3,205,000 | 3,360,346 | ||||||
| Series ZZ 5.25% 7/1/26 | 2,000,000 | 2,204,920 | ||||||
| 5,565,266 | ||||||||
| Healthcare Revenue Bonds – 25.05% | ||||||||
| Alhambra, California Revenue (Atherton Baptist Homes) | ||||||||
| Series A 7.625% 1/1/40 | 1,000,000 | 1,073,470 | ||||||
| Apple Valley, Minnesota Economic Development Authority | ||||||||
| Health Care Revenue (Augustana Home St. Paul Project) | ||||||||
| Series A 6.00% 1/1/40 | 1,000,000 | 1,007,470 | ||||||
| Bexar County, Texas Health Facilities Development | ||||||||
| Corporation Revenue (Army Retirement Residence Project) | ||||||||
| 5.875% 7/1/30 | 1,000,000 | 1,035,020 | ||||||
| Brevard County, Florida Healthcare Facilities Authority | ||||||||
| Health Care Facilities Revenue (Heath First Inc. Project) | ||||||||
| Series B 7.00% 4/1/39 | 1,000,000 | 1,129,950 | ||||||
| Butler County, Pennsylvania Hospital Authority Revenue | ||||||||
| (Butler Health System Project) 7.125% 7/1/29 | 900,000 | 1,046,313 | ||||||
| California Municipal Finance Authority Revenue | ||||||||
| (Eisenhower Medical Center) Series A 5.75% 7/1/40 | 1,750,000 | 1,794,765 | ||||||
| California Statewide Communities Development Authority | ||||||||
| Revenue (Senior Living - Southern California) | ||||||||
| 7.25% 11/15/41 | 500,000 | 557,515 | ||||||
59
Statements of net assets
Delaware National High-Yield Municipal Bond Fund
Delaware National High-Yield Municipal Bond Fund
| Principal amount | Value | |||||||
| Municipal Bonds (continued) | ||||||||
| Healthcare Revenue Bonds (continued) | ||||||||
| Cleveland-Cuyahoga County, Ohio Port Authority Revenue | ||||||||
| Senior Housing (St. Clarence - Geac) Series A | ||||||||
| 6.25% 5/1/38 | $ | 1,000,000 | $ | 881,170 | ||||
| Colorado Health Facilities Authority Revenue (Christian | ||||||||
| Living Community Project) Series A 5.75% 1/1/37 | 500,000 | 454,710 | ||||||
| Connecticut State Health & Educational Facilities Authority | ||||||||
| Revenue (Stamford Hospital) Series I 5.00% 7/1/30 | 1,400,000 | 1,458,436 | ||||||
| Cumberland County, Pennsylvania Municipal Authority | ||||||||
| Revenue (Diakon Lutheran Ministries Project) | ||||||||
| 6.375% 1/1/39 | 1,000,000 | 1,050,950 | ||||||
| East Rochester, New York Housing Authority Revenue | ||||||||
| Refunding (Senior Living - Woodland Village Project) | ||||||||
| 5.50% 8/1/33 | 500,000 | 444,065 | ||||||
| Franklin County, Pennsylvania Industrial Development | ||||||||
| Authority Revenue (Chambersburg Hospital Project) | ||||||||
| 5.375% 7/1/42 | 2,000,000 | 2,063,839 | ||||||
| Gainesville & Hall County, Georgia Development Authority | ||||||||
| Revenue Senior Living Facilities (Lanier Village Estates Project) | ||||||||
| Series C 7.25% 11/15/29 | 1,000,000 | 1,020,610 | ||||||
| Hamden, Connecticut Facilities Revenue (Whitney Center | ||||||||
| Project) Series A 7.75% 1/1/43 | 1,000,000 | 1,108,770 | ||||||
| Hawaii Pacific Health Special Purpose Revenue Series A | ||||||||
| 5.50% 7/1/40 | 1,250,000 | 1,257,438 | ||||||
| Hawaii State Department Budget & Finance Special | ||||||||
| Purpose Senior Living Revenue (Craigside Project) | ||||||||
| Series A 9.00% 11/15/44 | 1,000,000 | 1,164,200 | ||||||
| Illinois Finance Authority Revenue | ||||||||
| (Provena Health) Series A 7.75% 8/15/34 | 1,000,000 | 1,184,630 | ||||||
| (Silver Cross & Medical Centers) 7.00% 8/15/44 | 1,000,000 | 1,093,530 | ||||||
| Illinois Health Facilities Authority Revenue (Elmhurst | ||||||||
| Memorial Healthcare Project) 5.625% 1/1/28 | 1,000,000 | 1,002,830 | ||||||
| Kentucky Economic Development Finance Authority | ||||||||
| Hospital Revenue (Owensboro Medical Health System) | ||||||||
| Series A 6.50% 3/1/45 | 1,000,000 | 1,077,710 | ||||||
| Lancaster County, Pennsylvania Hospital Authority Revenue | ||||||||
| (Brethren Village Project) Series A 6.375% 7/1/30 | 725,000 | 733,106 | ||||||
| Lebanon County, Pennsylvania Health Facilities Authority | ||||||||
| Center Revenue (Pleasant View Retirement) Series A | ||||||||
| 5.30% 12/15/26 | 1,000,000 | 966,060 | ||||||
60
| Principal amount | Value | |||||||
| Municipal Bonds (continued) | ||||||||
| Healthcare Revenue Bonds (continued) | ||||||||
| Maryland State Health & Higher Educational Facilities | ||||||||
| Authority Revenue (Doctors Community Hospital) | ||||||||
| 5.75% 7/1/38 | $ | 1,000,000 | $ | 1,003,630 | ||||
| Medford, Oregon Hospital Facilities Authority Revenue | ||||||||
| (Asante Health System) Series A 5.00% 8/15/40 (AGM) | 1,000,000 | 1,040,810 | ||||||
| Montana Facility Finance Authority Revenue | ||||||||
| (Sisters Leavenworth) Series A 5.25% 1/1/40 | 1,250,000 | 1,352,413 | ||||||
| Montgomery County, Pennsylvania Industrial Development | ||||||||
| Authority Revenue (Meeting - Whitemarsh Continuing Care) | ||||||||
| 6.25% 2/1/35 | 1,500,000 | 1,278,600 | ||||||
| New Jersey Health Care Facilities Financing Authority | ||||||||
| Revenue (St. Josephs Healthcare System) 6.625% 7/1/38 | 860,000 | 911,282 | ||||||
| New York State Dormority Authority Revenue Non State | ||||||||
| Supported Debt (Orange Regional Medical Center) | ||||||||
| 6.25% 12/1/37 | 1,000,000 | 1,020,530 | ||||||
| North Carolina Medical Care Commission Health Care | ||||||||
| Facilities Revenue (First Mortgage - Presbyterian Homes) | ||||||||
| 5.60% 10/1/36 | 1,000,000 | 960,250 | ||||||
| Orange County, Florida Health Facilities Authority Revenue | ||||||||
| (Orlando Regional Healthcare) Series C 5.25% 10/1/35 | 1,000,000 | 1,023,090 | ||||||
| Oregon State Facilities Authority Revenue (Samaritan | ||||||||
| Health Services) Series A 5.25% 10/1/40 | 1,000,000 | 1,042,090 | ||||||
| Pennsylvania Economic Development Financing Authority | ||||||||
| Health System Revenue (Evalbert Einstein Healthcare) | ||||||||
| Series A 6.25% 10/15/23 | 1,000,000 | 1,102,770 | ||||||
| Richland County, Ohio Hospital Facilities Revenue | ||||||||
| (Medcentral Health System Project) Series B | ||||||||
| 6.375% 11/15/30 | 500,000 | 506,370 | ||||||
| South Carolina Jobs-Economic Development Authority | ||||||||
| Hospital Revenue (Palmetto Health) 5.75% 8/1/39 | 1,000,000 | 1,032,310 | ||||||
| St. Johns County, Florida Industrial Development Authority | ||||||||
| Revenue (Presbyterian Retirement) Series A | ||||||||
| 5.875% 8/1/40 | 1,000,000 | 1,039,160 | ||||||
| St. Louis Park, Minnesota Health Care Facilities Revenue | ||||||||
| (Park Nicollet Health Services) 5.75% 7/1/39 | 1,000,000 | 1,027,070 | ||||||
| St. Paul, Minnesota Housing & Redevelopment Authority | ||||||||
| Health Care Facilities Revenue (Health Partners | ||||||||
| Obligation Group Project) 5.25% 5/15/36 | 3,000,000 | 2,949,869 | ||||||
61
Statements of net assets
Delaware National High-Yield Municipal Bond Fund
Delaware National High-Yield Municipal Bond Fund
| Principal amount | Value | |||||||
| Municipal Bonds (continued) | ||||||||
| Healthcare Revenue Bonds (continued) | ||||||||
| St. Paul, Minnesota Housing & Redevelopment Authority | ||||||||
| Hospital Revenue (Health East Project) | ||||||||
| 6.00% 11/15/30 | $ | 1,000,000 | $ | 999,890 | ||||
| 6.00% 11/15/35 | 1,340,000 | 1,304,235 | ||||||
| Travis County, Texas Health Facilities Development | ||||||||
| Corporation Revenue (Westminister Manor Project) | ||||||||
| 7.125% 11/1/40 | 1,000,000 | 1,046,980 | ||||||
| Washington State Health Care Facilities Authority Revenue | ||||||||
| (Multicare Health System) Series B 6.00% 8/15/39 | ||||||||
| (ASSURED GTY) | 1,250,000 | 1,379,075 | ||||||
| Winchester, Virginia Industrial Development Authority | ||||||||
| Residential Care Facility Revenue (Westminster - | ||||||||
| Canterbury Project) Series A 5.30% 1/1/35 | 1,000,000 | 933,920 | ||||||
| Yavapai County, Arizona Industrial Development Authority | ||||||||
| Hospital Revenue (Yavapai Regional Medical Center) | ||||||||
| Series A 6.00% 8/1/33 | 1,000,000 | 1,018,090 | ||||||
| 48,578,991 | ||||||||
| Housing Revenue Bonds – 0.51% | ||||||||
| North Carolina Housing Finance Agency Homeownership | ||||||||
| Revenue Series 27-A 5.55% 7/1/38 (AMT) | 950,000 | 994,736 | ||||||
| 994,736 | ||||||||
| Lease Revenue Bonds – 4.83% | ||||||||
| Capital Area Cultural Education Facilities Finance | ||||||||
| Corporation Texas Revenue (Roman Catholic Diocese) | ||||||||
| Series B 6.125% 4/1/45 | 1,000,000 | 1,032,480 | ||||||
| Guam Government Department of Education Certificates | ||||||||
| of Participation (John F. Kennedy High School) | ||||||||
| Series A 6.875% 12/1/40 | 2,000,000 | 2,041,260 | ||||||
| Hudson Yards Infrastructure Corporation New York | ||||||||
| Series A 5.00% 2/15/47 | 2,000,000 | 2,005,300 | ||||||
| Missouri State Development Finance Board Infrastructure | ||||||||
| Facilities Revenue (Branson Landing Project) Series A | ||||||||
| 5.50% 12/1/24 | 720,000 | 758,498 | ||||||
| New York City, New York Industrial Development Agency | ||||||||
| Revenue (Queens Baseball Stadium) 5.00% 1/1/46 (AMBAC) | 1,200,000 | 1,125,444 | ||||||
| New York City, New York Industrial Development Agency | ||||||||
| Special Airport Facilities (Airis JFK I, LLC. Project) | ||||||||
| Series A 5.50% 7/1/28 (AMT) | 905,000 | 819,740 | ||||||
62
| Principal amount | Value | |||||||
| Municipal Bonds (continued) | ||||||||
| Lease Revenue Bonds (continued) | ||||||||
| Oklahoma City, Oklahoma Industrial & Cultural Facilities | ||||||||
| Subordinated (Air Cargo - Obligated Group) | ||||||||
| 6.75% 1/1/23 (AMT) | $ | 1,160,000 | $ | 1,100,701 | ||||
| Onondaga County, New York Industrial Development | ||||||||
| Authority Revenue Subordinated (Air Cargo Project) | ||||||||
| 7.25% 1/1/32 (AMT) | 500,000 | 489,270 | ||||||
| 9,372,693 | ||||||||
| Local General Obligation Bonds – 0.32% | ||||||||
| Henrico County, Virginia Refunding Public Improvement | ||||||||
| 5.00% 7/15/19 | 500,000 | 623,910 | ||||||
| 623,910 | ||||||||
| §Pre-Refunded/Escrowed to Maturity Bonds – 0.57% | ||||||||
| Bexar County, Texas Health Facilities Development | ||||||||
| Corporation Revenue (Army Retirement Residence | ||||||||
| Project) 6.30% 7/1/32-12 | 1,000,000 | 1,109,250 | ||||||
| 1,109,250 | ||||||||
| Special Tax Revenue Bonds – 13.47% | ||||||||
| Anne Arundel County, Maryland Special Obligation | ||||||||
| (National Business Park - North Project) 6.10% 7/1/40 | 1,500,000 | 1,533,225 | ||||||
| Baltimore, Maryland Convention Center Hotel Revenue | ||||||||
| Suborinated Series B 5.875% 9/1/39 | 1,000,000 | 954,050 | ||||||
| Brooklyn Arena Local Development Corporation, New York | ||||||||
| Pilot Revenue (Barclays Center Project) 6.50% 7/15/30 | 1,000,000 | 1,093,460 | ||||||
| Chicago, Illinois Tax Increment Allocation (Chatham Ridge | ||||||||
| Redevelopment Project) 5.95% 12/15/12 | 750,000 | 770,055 | ||||||
| Farms New Kent, Virginia Community Development | ||||||||
| Authority Special Assessment Series C 5.80% 3/1/36 | 1,000,000 | 796,630 | ||||||
| Henderson, Nevada Local Improvement Districts #T-18 | ||||||||
| 5.30% 9/1/35 | 660,000 | 325,585 | ||||||
| Lancaster, California Redevelopment Agency Tax Allocation | ||||||||
| (Combined Redevelopment Project Areas) 6.875% 8/1/39 | 500,000 | 571,205 | ||||||
| Manchester, Missouri Tax Increment & Transaction Revenue | ||||||||
| Refunding (Highway 141 Manchester Road Project) | ||||||||
| 6.875% 11/1/39 | 1,250,000 | 1,288,800 | ||||||
| Middlesex County, New Jersey Improvement Authority Senior | ||||||||
| Revenue (Heldrich Center Hotel/Conference Project) Series A | ||||||||
| 5.00% 1/1/32 | 500,000 | 282,840 | ||||||
| 5.125% 1/1/37 | 870,000 | 492,124 | ||||||
63
Statements of net assets
Delaware National High-Yield Municipal Bond Fund
Delaware National High-Yield Municipal Bond Fund
| Principal amount | Value | |||||||
| Municipal Bonds (continued) | ||||||||
| Special Tax Revenue Bonds (continued) | ||||||||
| New Jersey Economic Development Authority Revenue | ||||||||
| (Cigarette Tax) 5.75% 6/15/34 | $ | 965,000 | $ | 955,032 | ||||
| New York State Local Government Assistance Refunding | ||||||||
| Subordinate Lien Series A 5.00% 4/1/20 | 1,000,000 | 1,219,470 | ||||||
| Norco, California Redevelopment Agency Tax Allocation | ||||||||
| (Area #1 Project) 6.00% 3/1/36 | 1,000,000 | 1,028,790 | ||||||
| Palm Drive Health Care District Parcel Tax Revenue | ||||||||
| 5.25% 4/1/30 | 2,000,000 | 1,571,800 | ||||||
| Prescott Valley, Arizona Improvement District Special Assessment | ||||||||
| (Sewer Collection System Roadway Repair Project) | ||||||||
| 7.90% 1/1/12 | 80,000 | 83,279 | ||||||
| Puerto Rico Commonwealth Highway & Transportation | ||||||||
| Authority Revenue Series K 5.00% 7/1/30 | 1,855,000 | 1,893,974 | ||||||
| Puerto Rico Sales Tax Financing Corporation Sales | ||||||||
| Tax Revenue | ||||||||
| Ω(Capital Appreciation) Series A 6.75% 8/1/32 | 2,030,000 | 1,754,245 | ||||||
| Series A 5.75% 8/1/37 | 800,000 | 857,568 | ||||||
| Series C 5.25% 8/1/41 | 2,000,000 | 2,094,399 | ||||||
| Richmond Heights, Missouri Tax Increment & Transaction | ||||||||
| Sales Tax Revenue Refunding & Improvement (Francis | ||||||||
| Place Redevelopment Project) 5.625% 11/1/25 | 1,200,000 | 1,107,180 | ||||||
| @ | Southwestern Illinois Development Authority Revenue | |||||||
| (Local Government Program - Collinsville Limited Project) | ||||||||
| 5.35% 3/1/31 | 500,000 | 397,600 | ||||||
| @ | St. Joseph, Missouri Industrial Development Authority | |||||||
| Tax Increment Revenue (Shoppes at North Village | ||||||||
| Project) Series A | ||||||||
| 5.375% 11/1/24 | 1,000,000 | 952,740 | ||||||
| 5.50% 11/1/27 | 500,000 | 470,840 | ||||||
| Virgin Islands Public Finance Authority Revenue Matching | ||||||||
| Fund Loan Note Senior Lien Series A 5.00% 10/1/29 | 2,000,000 | 2,065,520 | ||||||
| Winter Garden Village at Fowler Groves Community | ||||||||
| Development District, Florida Special Assessment Revenue | ||||||||
| 5.65% 5/1/37 | 960,000 | 934,147 | ||||||
| ^ | Wyandotte County, Kansas City, Kansas Unified | |||||||
| Government Special Obligation Revenue (Capital | ||||||||
| Appreciation-Sales Tax) Subordinate Lien 6.07% 6/1/21 | 1,090,000 | 631,797 | ||||||
| 26,126,355 | ||||||||
64
| Principal amount | Value | |||||||
| Municipal Bonds (continued) | ||||||||
| State General Obligation Bonds – 3.78% | ||||||||
| Georgia State Series I 5.00% 7/1/20 | $ | 1,000,000 | $ | 1,252,880 | ||||
| Guam Government Series A 6.75% 11/15/29 | 1,565,000 | 1,724,865 | ||||||
| Minnesota State Variable Series A 5.00% 8/1/24 | 3,000,000 | 3,617,879 | ||||||
| Puerto Rico Commonwealth Refunding | ||||||||
| (Public Improvement) Series C 6.00% 7/1/39 | 675,000 | 732,706 | ||||||
| 7,328,330 | ||||||||
| Transportation Revenue Bonds – 7.12% | ||||||||
| Branson, Missouri Regional Airport Transportation | ||||||||
| Development District (Airport Project) Series A | ||||||||
| 6.00% 7/1/37 | 500,000 | 287,330 | ||||||
| Maryland State Economic Development Corporation | ||||||||
| Revenue (Transportation Facilities Project) Series A | ||||||||
| 5.75% 6/1/35 | 1,000,000 | 1,050,140 | ||||||
| Phoenix, Arizona Civic Improvement Corporation Airport | ||||||||
| Revenue Junior Lien Series A 5.00% 7/1/26 | 1,920,000 | 2,092,666 | ||||||
| Regional Transportation District Colorado Private Activity | ||||||||
| (Denver Transit Partners) 6.00% 1/15/41 | 1,500,000 | 1,573,920 | ||||||
| Sacramento County, California Airport System Revenue | ||||||||
| (PFC/Grant) Series C 6.00% 7/1/41 | 1,000,000 | 1,100,110 | ||||||
| St. Louis, Missouri Airport Revenue (Lambert–St. Louis | ||||||||
| International) Series A-1 6.625% 7/1/34 | 1,090,000 | 1,190,324 | ||||||
| Texas Private Activity Bond Surface Transportation | ||||||||
| Corporation Senior Lien | ||||||||
| (LBJ Infrastructure) 7.00% 6/30/40 | 4,000,000 | 4,371,160 | ||||||
| (Mobility Partners) 6.875% 12/31/39 | 1,960,000 | 2,151,492 | ||||||
| 13,817,142 | ||||||||
| Total Municipal Bonds (cost $178,639,838) | 185,443,215 | |||||||
| •Short-Term Investments – 1.29% | ||||||||
| Variable Rate Demand Notes – 1.29% | ||||||||
| Minneapolis & St. Paul, Minnesota Housing & | ||||||||
| Redevelopment Authority Health Care System Revenue | ||||||||
| (Allina Health System) Series B-1 0.26% 11/15/35 | ||||||||
| (LOC–JPMorgan Chase Bank) | 1,000,000 | 1,000,000 | ||||||
| Power County, Idaho Pollution Control Revenue (FMC Corp. | ||||||||
| Project) 0.23% 12/1/10 (LOC–Wachovia Bank N.A.) | 1,500,000 | 1,500,000 | ||||||
| Total Short-Term Investments (cost $2,500,000) | 2,500,000 | |||||||
65
Statements of net assets
Delaware National High-Yield Municipal Bond Fund
Delaware National High-Yield Municipal Bond Fund
| Total Value of Securities – 96.89% | ||||
| (cost $181,139,838) | $ | 187,943,215 | ||
| Receivables and Other Assets | ||||
| Net of Liabilities – 3.11% | 6,027,025 | |||
| Net Assets Applicable to 19,191,615 | ||||
| Shares Outstanding – 100.00% | $ | 193,970,240 | ||
| Net Asset Value – Delaware National High-Yield Municipal Bond Fund | ||||
| Class A ($139,627,972 / 13,837,234 Shares) | $10.09 | |||
| Net Asset Value – Delaware National High-Yield Municipal Bond Fund | ||||
| Class B ($1,118,383 / 110,627 Shares) | $10.11 | |||
| Net Asset Value – Delaware National High-Yield Municipal Bond Fund | ||||
| Class C ($36,384,104 / 3,590,512 Shares) | $10.13 | |||
| Net Asset Value – Delaware National High-Yield Municipal Bond Fund | ||||
| Institutional Class ($16,839,781 / 1,653,242 Shares) | $10.19 | |||
| Components of Net Assets at August 31, 2010: | ||||
| Shares of beneficial interest (unlimited authorization – no par) | $ | 189,460,313 | ||
| Distribution in excess of net investment income | (4,408 | ) | ||
| Accumulated net realized loss on investments | (2,289,042 | ) | ||
| Net unrealized appreciation of investments | 6,803,377 | |||
| Total net assets | $ | 193,970,240 | ||
| @ | Illiquid security. At August 31, 2010, the aggregate amount of illiquid securities was $2,324,315, which represented 1.20% of the Fund’s net assets. See Note 8 in “Notes to Financial Statements.” |
| § | Pre-Refunded/Escrowed to Maturity bonds. Municipals that are generally backed or secured by U.S. Treasury bonds. For Pre-Refunded bonds, the stated maturity is followed by the year in which the bond is pre-refunded. See Note 8 in “Notes to Financial Statements.” |
| Ω | Step coupon bond. Indicates security that has a zero coupon that remains in effect until a predetermined date at which time the stated interest rate becomes effective. |
| • | Variable rate security. The rate shown is the rate as of August 31, 2010. Interest rates reset periodically. |
| ^ | Zero coupon security. The rate shown is the yield at the time of purchase. |
66
Summary of abbreviations:
ACA – Insured by American Capital Access
AGM – Insured by Assured Guaranty Municipal Corporation
AMBAC – Insured by the AMBAC Assurance Corporation
AMT – Subject to Alternative Minimum Tax
ASSURED GTY – Insured by the Assured Guaranty Corporation
CDFI – Community Development Financial Institutions
LOC – Letter of Credit
XLCA – Insured by XL Capital Assurance
| Net Asset Value and Offering Price Per Share – | ||
| Delaware National High Yield Municipal Bond Fund | ||
| Net asset value Class A (A) | $ | 10.09 |
| Sales charge (4.50% of offering price) (B) | 0.48 | |
| Offering price | $ | 10.57 |
| (A) | Net asset value per share, as illustrated, is the amount which would be paid upon redemption or repurchase of shares. |
| (B) | See the current prospectus for purchases of $100,000 or more. |
See accompanying Notes, which are an integral part of the financial statements.
67
| Statements of operations | |
| Year Ended August 31, 2010 |
| Delaware | Delaware | Delaware | |||||||||||||
| Tax-Free | Tax-Free USA | National High-Yield | |||||||||||||
| USA Fund | Intermediate Fund | Municipal Bond Fund | |||||||||||||
| Investment Income: | |||||||||||||||
| Interest | $ | 32,481,035 | $ | 25,730,182 | $ | 7,081,049 | |||||||||
| Expenses: | |||||||||||||||
| Management fees | 3,233,905 | 2,943,847 | 636,119 | ||||||||||||
| Distribution expenses – Class A | 1,363,846 | 1,439,108 | 226,838 | ||||||||||||
| Distribution expenses – Class B | 68,261 | 6,793 | 13,590 | ||||||||||||
| Distribution expenses – Class C | 244,252 | 514,771 | 176,573 | ||||||||||||
| Dividend disbursing and transfer | |||||||||||||||
| agent fees and expenses | 413,219 | 546,095 | 94,450 | ||||||||||||
| Accounting and administration expenses | 237,489 | 236,097 | 45,990 | ||||||||||||
| Registration fees | 67,132 | 115,625 | 61,353 | ||||||||||||
| Reports and statements to shareholders | 64,181 | 65,353 | 8,289 | ||||||||||||
| Legal fees | 59,036 | 59,529 | 19,099 | ||||||||||||
| Audit and tax | 41,852 | 43,665 | 17,979 | ||||||||||||
| Trustees’ fees | 34,206 | 33,723 | 6,440 | ||||||||||||
| Due and services | 23,481 | 19,752 | 7,818 | ||||||||||||
| Insurance fees | 22,711 | 20,229 | 3,324 | ||||||||||||
| Pricing fees | 18,935 | 19,170 | 10,383 | ||||||||||||
| Custodian fees | 10,585 | 10,979 | 2,095 | ||||||||||||
| Consulting fees | 8,764 | 8,563 | 1,581 | ||||||||||||
| Trustees’ expenses | 2,565 | 2,398 | 406 | ||||||||||||
| 5,914,420 | 6,085,697 | 1,332,327 | |||||||||||||
| Less expenses absorbed or waived | (882,367 | ) | (561,272 | ) | (221,486 | ) | |||||||||
| Less waived distribution expenses – Class A | — | (716,263 | ) | — | |||||||||||
| Less expense paid indirectly | (505 | ) | (569 | ) | (94 | ) | |||||||||
| Total operating expenses | 5,031,548 | 4,807,593 | 1,110,747 | ||||||||||||
| Net Investment Income | 27,449,487 | 20,922,589 | 5,970,302 | ||||||||||||
68
| Delaware | Delaware | Delaware | ||||||||||||
| Tax-Free | Tax-Free USA | National High-Yield | ||||||||||||
| USA Fund | Intermediate Fund | Municipal Bond Fund | ||||||||||||
| Net Realized and Unrealized Gain | ||||||||||||||
| on Investments: | ||||||||||||||
| Net realized gain on investments | 5,376,303 | 3,101,284 | 1,001,919 | |||||||||||
| Net change in unrealized appreciation/ | ||||||||||||||
| depreciation of investments | 33,754,276 | 31,454,823 | 13,240,902 | |||||||||||
| Net Realized and Unrealized Gain | ||||||||||||||
| on Investments | 39,130,579 | 34,556,107 | 14,242,821 | |||||||||||
| Net Increase in Net Assets | ||||||||||||||
| Resulting from Operations | $ | 66,580,066 | $ | 55,478,696 | $ | 20,213,123 | ||||||||
See accompanying Notes, which are an integral part of the financial statements.
69
Statements of changes in net assets
Delaware Tax-Free USA Fund
Delaware Tax-Free USA Fund
| Year Ended | |||||||
| 8/31/10 | 8/31/09 | ||||||
| Increase (Decrease) in Net Assets from Operations: | |||||||
| Net investment income | $ | 27,449,487 | $ | 24,505,230 | |||
| Net realized gain (loss) on investments | 5,376,303 | (2,838,744 | ) | ||||
| Net change in unrealized | |||||||
| appreciation/depreciation of investments | 33,754,276 | 1,152,242 | |||||
| Net increase in net assets resulting from operations | 66,580,066 | 22,818,728 | |||||
| Dividends and Distributions to Shareholders from: | |||||||
| Net investment income: | |||||||
| Class A | (26,109,963 | ) | (23,405,639 | ) | |||
| Class B | (265,094 | ) | (352,615 | ) | |||
| Class C | (948,392 | ) | (681,841 | ) | |||
| Institutional Class | (126,036 | ) | (32 | ) | |||
| (27,449,485 | ) | (24,440,127 | ) | ||||
| Capital Share Transactions: | |||||||
| Proceeds from shares sold: | |||||||
| Class A | 61,819,342 | 118,535,984 | |||||
| Class B | 87,469 | 70,203 | |||||
| Class C | 9,773,385 | 6,869,985 | |||||
| Institutional Class | 10,975,123 | 1,022 | |||||
| Net asset value of shares issued upon reinvestment | |||||||
| of dividends and distributions: | |||||||
| Class A | 13,870,753 | 12,514,345 | |||||
| Class B | 116,921 | 172,056 | |||||
| Class C | 691,115 | 484,088 | |||||
| Institutional Class | 69,762 | 32 | |||||
| 97,403,870 | 138,647,715 | ||||||
70
| Year Ended | |||||||
| 8/31/10 | 8/31/09 | ||||||
| Capital Share Transactions (continued): | |||||||
| Cost of shares repurchased: | |||||||
| Class A | $ | (67,005,588 | ) | $ | (104,004,049 | ) | |
| Class B | (3,446,173 | ) | (3,624,046 | ) | |||
| Class C | (2,360,456 | ) | (3,541,888 | ) | |||
| Institutional Class | (3,613,385 | ) | — | ||||
| (76,425,602 | ) | (111,169,983 | ) | ||||
| Increase in net assets derived from | |||||||
| capital share transactions | 20,978,268 | 27,477,732 | |||||
| Net Increase in Net Assets | 60,108,849 | 25,856,333 | |||||
| Net Assets: | |||||||
| Beginning of year | 565,131,277 | 539,274,944 | |||||
| End of year | $ | 625,240,126 | $ | 565,131,277 | |||
| Undistributed net investment income | $ | 66,895 | $ | 66,893 | |||
See accompanying Notes, which are an integral part of the financial statements.
71
Statements of changes in net assets
Delaware Tax-Free USA Intermediate Fund
Delaware Tax-Free USA Intermediate Fund
| Year Ended | |||||||
| 8/31/10 | 8/31/09 | ||||||
| Increase (Decrease) in Net Assets from Operations: | |||||||
| Net investment income | $ | 20,922,589 | $ | 15,162,112 | |||
| Net realized gain (loss) on investments | 3,101,284 | (2,348,573 | ) | ||||
| Net change in unrealized | |||||||
| appreciation/depreciation of investments | 31,454,823 | 11,254,947 | |||||
| Net increase in net assets resulting from operations | 55,478,696 | 24,068,486 | |||||
| Dividends and Distributions to Shareholders from: | |||||||
| Net investment income: | |||||||
| Class A | (17,243,762 | ) | (14,270,823 | ) | |||
| Class B | (18,866 | ) | (25,400 | ) | |||
| Class C | (1,408,918 | ) | (817,862 | ) | |||
| Institutional Class | (2,251,043 | ) | (26 | ) | |||
| (20,922,589 | ) | (15,114,111 | ) | ||||
| Capital Share Transactions: | |||||||
| Proceeds from shares sold: | |||||||
| Class A | 240,540,308 | 235,187,166 | |||||
| Class B | 5,061 | 184,940 | |||||
| Class C | 32,062,484 | 19,373,068 | |||||
| Institutional Class | 201,735,695 | 1,022 | |||||
| Net asset value of shares issued upon reinvestment | |||||||
| of dividends and distributions: | |||||||
| Class A | 11,793,891 | 9,817,928 | |||||
| Class B | 12,602 | 18,329 | |||||
| Class C | 1,043,543 | 581,579 | |||||
| Institutional Class | 1,022,951 | 24 | |||||
| 488,216,535 | 265,164,056 | ||||||
72
| Year Ended | |||||||
| 8/31/10 | 8/31/09 | ||||||
| Capital Share Transactions (continued): | |||||||
| Cost of shares repurchased: | |||||||
| Class A | $ | (257,852,688 | ) | $ | (201,015,285 | ) | |
| Class B | (403,130 | ) | (616,595 | ) | |||
| Class C | (11,028,080 | ) | (5,491,621 | ) | |||
| Institutional Class | (15,480,558 | ) | — | ||||
| (284,764,456 | ) | (207,123,501 | ) | ||||
| Increase in net assets derived from | |||||||
| capital share transactions | 203,452,079 | 58,040,555 | |||||
| Net Increase in Net Assets | 238,008,186 | 66,994,930 | |||||
| Net Assets: | |||||||
| Beginning of year | 500,875,570 | 433,880,640 | |||||
| End of year | $ | 738,883,756 | $ | 500,875,570 | |||
| Undistributed net investment income | $ | 16,225 | $ | 16,225 | |||
See accompanying Notes, which are an integral part of the financial statements.
73
Statements of changes in net assets
Delaware National High-Yield Municipal Bond Fund
Delaware National High-Yield Municipal Bond Fund
| Year Ended | |||||||
| 8/31/10 | 8/31/09 | ||||||
| Increase (Decrease) in Net Assets from Operations: | |||||||
| Net investment income | $ | 5,970,302 | $ | 4,135,883 | |||
| Net realized gain (loss) on investments | 1,001,919 | (898,271 | ) | ||||
| Net change in unrealized | |||||||
| appreciation/depreciation of investments | 13,240,902 | (3,755,920 | ) | ||||
| Net increase (decrease) in net assets resulting | |||||||
| from operations | 20,213,123 | (518,308 | ) | ||||
| Dividends and Distributions to Shareholders from: | |||||||
| Net investment income: | |||||||
| Class A | (4,828,032 | ) | (3,657,847 | ) | |||
| Class B | (63,201 | ) | (110,366 | ) | |||
| Class C | (793,575 | ) | (335,892 | ) | |||
| Institutional Class | (265,485 | ) | (47 | ) | |||
| (5,950,293 | ) | (4,104,152 | ) | ||||
| Capital Share Transactions: | |||||||
| Proceeds from shares sold: | |||||||
| Class A | 80,165,567 | 12,889,514 | |||||
| Class B | 25,758 | 289,157 | |||||
| Class C | 28,127,837 | 2,516,187 | |||||
| Institutional Class | 21,613,556 | 1,016 | |||||
| Net asset value of shares issued upon reinvestment | |||||||
| of dividends and distributions: | |||||||
| Class A | 3,020,007 | 2,236,012 | |||||
| Class B | 31,120 | 50,724 | |||||
| Class C | 528,580 | 220,675 | |||||
| Institutional Class | 144,889 | 45 | |||||
| 133,657,314 | 18,203,330 | ||||||
74
| Year Ended | |||||||
| 8/31/10 | 8/31/09 | ||||||
| Capital Share Transactions (continued): | |||||||
| Cost of shares repurchased: | |||||||
| Class A | $ | (23,646,518 | ) | $ | (10,110,767 | ) | |
| Class B | (553,592 | ) | (1,746,311 | ) | |||
| Class C | (2,204,078 | ) | (1,588,149 | ) | |||
| Institutional Class | (5,576,829 | ) | — | ||||
| (31,981,017 | ) | (13,445,227 | ) | ||||
| Increase in net assets derived from | |||||||
| capital share transactions | 101,676,297 | 4,758,103 | |||||
| Net Increase in Net Assets | 115,939,127 | 135,643 | |||||
| Net Assets: | |||||||
| Beginning of year | 78,031,113 | 77,895,470 | |||||
| End of year | $ | 193,970,240 | $ | 78,031,113 | |||
| Undistributed (distributions in excess of) | |||||||
| net investment income | $ | (4,408 | ) | $ | 13,405 | ||
See accompanying Notes, which are an integral part of the financial statements.
75
Financial highlights
Delaware Tax-Free USA Fund Class A
Delaware Tax-Free USA Fund Class A
Selected data for each share of the Fund outstanding throughout each period were as follows:
| Net asset value, beginning of period |
| Income (loss) from investment operations: |
| Net investment income |
| Net realized and unrealized gain (loss) on investments |
| Total from investment operations |
| Less dividends and distributions from: |
| Net investment income |
| Total dividends and distributions |
| Net asset value, end of period |
| Total return1 |
| Ratios and supplemental data: |
| Net assets, end of period (000 omitted) |
| Ratio of expenses to average net assets |
| Ratio of expenses to average net assets |
| prior to fees waived and expense paid indirectly |
| Ratio of net investment income to average net assets |
| Ratio of net investment income to average net assets |
| prior to fees waived and expense paid indirectly |
| Portfolio turnover |
1 Total investment return is based on the change in net asset value of a share during the period and assumes reinvestment of dividends and distributions at net asset value and does not reflect the impact of a sales charge. Total investment return during some of the periods shown reflects waivers by the manager and distributor. Performance would have been lower had the waivers not been in effect. |
See accompanying Notes, which are an integral part of the financial statements.
76
| Year Ended | |||||||||||||||
| 8/31/10 | 8/31/09 | 8/31/08 | 8/31/07 | 8/31/06 | |||||||||||
| $10.890 | $10.970 | $11.230 | $11.570 | $11.760 | |||||||||||
| 0.522 | 0.479 | 0.462 | 0.466 | 0.458 | |||||||||||
| 0.740 | (0.081 | ) | (0.260 | ) | (0.337 | ) | (0.186 | ) | |||||||
| 1.262 | 0.398 | 0.202 | 0.129 | 0.272 | |||||||||||
| (0.522 | ) | (0.478 | ) | (0.462 | ) | (0.469 | ) | (0.462 | ) | ||||||
| (0.522 | ) | (0.478 | ) | (0.462 | ) | (0.469 | ) | (0.462 | ) | ||||||
| $11.630 | $10.890 | $10.970 | $11.230 | $11.570 | |||||||||||
| 11.85% | 3.91% | 1.82% | 1.08% | 2.42% | |||||||||||
| $581,931 | $536,420 | $510,822 | $735,584 | $656,813 | |||||||||||
| 0.80% | 0.84% | 0.85% | 0.87% | 0.86% | |||||||||||
| 0.95% | 0.97% | 0.94% | 0.95% | 1.00% | |||||||||||
| 4.64% | 4.60% | 4.13% | 4.03% | 3.97% | |||||||||||
| 4.49% | 4.47% | 4.04% | 3.95% | 3.83% | |||||||||||
| 32% | 66% | 28% | 36% | 41% | |||||||||||
77
Financial highlights
Delaware Tax-Free USA Fund Class B
Delaware Tax-Free USA Fund Class B
Selected data for each share of the Fund outstanding throughout each period were as follows:
| Net asset value, beginning of period |
| Income (loss) from investment operations: |
| Net investment income |
| Net realized and unrealized gain (loss) on investments |
| Total from investment operations |
| Less dividends and distributions from: |
| Net investment income |
| Total dividends and distributions |
| Net asset value, end of period |
| Total return1 |
| Ratios and supplemental data: |
| Net assets, end of period (000 omitted) |
| Ratio of expenses to average net assets |
| Ratio of expenses to average net assets |
| prior to fees waived and expense paid indirectly |
| Ratio of net investment income to average net assets |
| Ratio of net investment income to average net assets |
| prior to fees waived and expense paid indirectly |
| Portfolio turnover |
1 Total investment return is based on the change in net asset value of a share during the period and assumes reinvestment of dividends and distributions at net asset value and does not reflect the impact of a sales charge. Total investment return during all of the periods shown reflects a waiver by the manager. Performance would have been lower had the waiver not been in effect. |
See accompanying Notes, which are an integral part of the financial statements.
78
| Year Ended | |||||||||||||||
| 8/31/10 | 8/31/09 | 8/31/08 | 8/31/07 | 8/31/06 | |||||||||||
| $10.880 | $10.960 | $11.230 | $11.570 | $11.760 | |||||||||||
| 0.437 | 0.399 | 0.378 | 0.378 | 0.370 | |||||||||||
| 0.740 | (0.080 | ) | (0.270 | ) | (0.337 | ) | (0.186 | ) | |||||||
| 1.177 | 0.319 | 0.108 | 0.041 | 0.184 | |||||||||||
| (0.437 | ) | (0.399 | ) | (0.378 | ) | (0.381 | ) | (0.374 | ) | ||||||
| (0.437 | ) | (0.399 | ) | (0.378 | ) | (0.381 | ) | (0.374 | ) | ||||||
| $11.620 | $10.880 | $10.960 | $11.230 | $11.570 | |||||||||||
| 11.01% | 3.13% | 0.96% | 0.32% | 1.63% | |||||||||||
| $5,373 | $8,168 | $11,812 | $17,286 | $22,189 | |||||||||||
| 1.56% | 1.60% | 1.61% | 1.63% | 1.63% | |||||||||||
| 1.71% | 1.73% | 1.70% | 1.71% | 1.73% | |||||||||||
| 3.88% | 3.84% | 3.37% | 3.27% | 3.20% | |||||||||||
| 3.73% | 3.71% | 3.28% | 3.19% | 3.10% | |||||||||||
| 32% | 66% | 28% | 36% | 41% | |||||||||||
79
Financial highlights
Delaware Tax-Free USA Fund Class C
Delaware Tax-Free USA Fund Class C
Selected data for each share of the Fund outstanding throughout each period were as follows:
| Net asset value, beginning of period |
| Income (loss) from investment operations: |
| Net investment income |
| Net realized and unrealized gain (loss) on investments |
| Total from investment operations |
| Less dividends and distributions from: |
| Net investment income |
| Total dividends and distributions |
| Net asset value, end of period |
| Total return1 |
| Ratios and supplemental data: |
| Net assets, end of period (000 omitted) |
| Ratio of expenses to average net assets |
| Ratio of expenses to average net assets |
| prior to fees waived and expense paid indirectly |
| Ratio of net investment income to average net assets |
| Ratio of net investment income to average net assets |
| prior to fees waived and expense paid indirectly |
| Portfolio turnover |
1 Total investment return is based on the change in net asset value of a share during the period and assumes reinvestment of dividends and distributions at net asset value and does not reflect the impact of a sales charge. Total investment return during all of the periods shown reflects a waiver by the manager. Performance would have been lower had the waiver not been in effect. |
See accompanying Notes, which are an integral part of the financial statements.
80
| Year Ended | |||||||||||||||
| 8/31/10 | 8/31/09 | 8/31/08 | 8/31/07 | 8/31/06 | |||||||||||
| $10.890 | $10.970 | $11.230 | $11.570 | $11.760 | |||||||||||
| 0.437 | 0.399 | 0.377 | 0.378 | 0.370 | |||||||||||
| 0.740 | (0.080 | ) | (0.260 | ) | (0.337 | ) | (0.186 | ) | |||||||
| 1.177 | 0.319 | 0.117 | 0.041 | 0.184 | |||||||||||
| (0.437 | ) | (0.399 | ) | (0.377 | ) | (0.381 | ) | (0.374 | ) | ||||||
| (0.437 | ) | (0.399 | ) | (0.377 | ) | (0.381 | ) | (0.374 | ) | ||||||
| $11.630 | $10.890 | $10.970 | $11.230 | $11.570 | |||||||||||
| 11.00% | 3.13% | 0.96% | 0.41% | 1.63% | |||||||||||
| $30,302 | $20,542 | $16,641 | $16,871 | $15,110 | |||||||||||
| 1.56% | 1.60% | 1.61% | 1.63% | 1.63% | |||||||||||
| 1.71% | 1.73% | 1.70% | 1.71% | 1.73% | |||||||||||
| 3.88% | 3.84% | 3.37% | 3.27% | 3.20% | |||||||||||
| 3.73% | 3.71% | 3.28% | 3.19% | 3.10% | |||||||||||
| 32% | 66% | 28% | �� | 36% | 41% | ||||||||||
81
Financial highlights
Delaware Tax-Free USA Fund Institutional Class
Delaware Tax-Free USA Fund Institutional Class
Selected data for each share of the Fund outstanding throughout each period were as follows:
| 12/31/081 | ||||||
| Year Ended | to | |||||
| 8/31/10 | 8/31/09 | |||||
| Net asset value, beginning of period | $10.890 | $10.020 | ||||
| Income from investment operations: | ||||||
| Net investment income | 0.549 | 0.322 | ||||
| Net realized and unrealized gain on investments | 0.830 | 0.870 | ||||
| Total from investment operations | 1.379 | 1.192 | ||||
| Less dividends and distributions from: | ||||||
| Net investment income | (0.549 | ) | (0.322 | ) | ||
| Total dividends and distributions | (0.549 | ) | (0.322 | ) | ||
| Net asset value, end of period | $11.720 | $10.890 | ||||
| Total return2 | 12.84% | 12.15% | ||||
| Ratios and supplemental data: | ||||||
| Net assets, end of period (000 omitted) | $7,634 | $1 | ||||
| Ratio of expenses to average net assets | 0.56% | 0.60% | ||||
| Ratio of expenses to average net assets | ||||||
| prior to fees waived and expense paid indirectly | 0.71% | 0.73% | ||||
| Ratio of net investment income to average net assets | 4.88% | 4.84% | ||||
| Ratio of net investment income to average net assets | ||||||
| prior to fees waived and expense paid indirectly | 4.73% | 4.71% | ||||
| Portfolio turnover | 32% | 66% | 3 | |||
1 Date of commencement of operations; ratios have been annualized and total return has not been annualized. |
2 Total investment return is based on the change in net asset value of a share during the period and assumes reinvestment of dividends and distributions at net asset value. Total investment return during all of the periods shown reflects a waiver by the manager. Performance would have been lower had the waiver not been in effect. |
3 Portfolio turnover is representative of the Fund for the entire year. |
See accompanying Notes, which are an integral part of the financial statements.
82
Financial highlights
Delaware Tax-Free USA Intermediate Fund Class A
Delaware Tax-Free USA Intermediate Fund Class A
Selected data for each share of the Fund outstanding throughout each period were as follows:
| Net asset value, beginning of period |
| Income (loss) from investment operations: |
| Net investment income |
| Net realized and unrealized gain (loss) on investments |
| Total from investment operations |
| Less dividends and distributions from: |
| Net investment income |
| Total dividends and distributions |
| Net asset value, end of period |
| Total return1 |
| Ratios and supplemental data: |
| Net assets, end of period (000 omitted) |
| Ratio of expenses to average net assets |
| Ratio of expenses to average net assets |
| prior to fees waived and expense paid indirectly |
| Ratio of net investment income to average net assets |
| Ratio of net investment income to average net assets |
| prior to fees waived and expense paid indirectly |
| Portfolio turnover |
1 Total investment return is based on the change in net asset value of a share during the period and assumes reinvestment of dividends and distributions at net asset value and does not reflect the impact of a sales charge. Total investment return during all of the periods shown reflects waivers by the manager and distributor. Performance would have been lower had the waivers not been in effect.
See accompanying Notes, which are an integral part of the financial statements.
84
| Year Ended | |||||||||||||||
| 8/31/10 | 8/31/09 | 8/31/08 | 8/31/07 | 8/31/06 | |||||||||||
| $11.460 | $11.250 | $11.210 | $11.470 | $11.610 | |||||||||||
| 0.423 | 0.388 | 0.383 | 0.414 | 0.408 | |||||||||||
| 0.650 | 0.210 | 0.041 | (0.260 | ) | (0.140 | ) | |||||||||
| 1.073 | 0.598 | 0.424 | 0.154 | 0.268 | |||||||||||
| (0.423 | ) | (0.388 | ) | (0.384 | ) | (0.414 | ) | (0.408 | ) | ||||||
| (0.423 | ) | (0.388 | ) | (0.384 | ) | (0.414 | ) | (0.408 | ) | ||||||
| $12.110 | $11.460 | $11.250 | $11.210 | $11.470 | |||||||||||
| 9.53% | 5.49% | 3.83% | 1.34% | 2.38% | |||||||||||
| $481,004 | $459,782 | $407,729 | $306,215 | $204,525 | |||||||||||
| 0.75% | 0.75% | 0.75% | 0.76% | 0.75% | |||||||||||
| 1.00% | 1.03% | 1.03% | 1.03% | 1.07% | |||||||||||
| 3.59% | 3.51% | 3.38% | 3.60% | 3.56% | |||||||||||
| 3.34% | 3.23% | 3.10% | 3.33% | 3.24% | |||||||||||
| 27% | 47% | 28% | 40% | 37% | |||||||||||
85
Financial highlights
Delaware Tax-Free USA Intermediate Fund Class B
Delaware Tax-Free USA Intermediate Fund Class B
Selected data for each share of the Fund outstanding throughout each period were as follows:
| Net asset value, beginning of period |
| Income (loss) from investment operations: |
| Net investment income |
| Net realized and unrealized gain (loss) on investments |
| Total from investment operations |
| Less dividends and distributions from: |
| Net investment income |
| Total dividends and distributions |
| Net asset value, end of period |
| Total return1 |
| Ratios and supplemental data: |
| Net assets, end of period (000 omitted) |
| Ratio of expenses to average net assets |
| Ratio of expenses to average net assets |
| prior to fees waived and expense paid indirectly |
| Ratio of net investment income to average net assets |
| Ratio of net investment income to average net assets |
| prior to fees waived and expense paid indirectly |
| Portfolio turnover |
1 Total investment return is based on the change in net asset value of a share during the period and assumes reinvestment of dividends and distributions at net asset value and does not reflect the impact of a sales charge. Total investment return during all of the periods shown reflects a waiver by the manager. Performance would have been lower had the waiver not been in effect.
See accompanying Notes, which are an integral part of the financial statements.
86
| Year Ended | |||||||||||||||
| 8/31/10 | 8/31/09 | 8/31/08 | 8/31/07 | 8/31/06 | |||||||||||
| $11.450 | $11.240 | $11.200 | $11.460 | $11.610 | |||||||||||
| 0.324 | 0.294 | 0.287 | 0.317 | 0.311 | |||||||||||
| 0.650 | 0.210 | 0.041 | (0.260 | ) | (0.150 | ) | |||||||||
| 0.974 | 0.504 | 0.328 | 0.057 | 0.161 | |||||||||||
| (0.324 | ) | (0.294 | ) | (0.288 | ) | (0.317 | ) | (0.311 | ) | ||||||
| (0.324 | ) | (0.294 | ) | (0.288 | ) | (0.317 | ) | (0.311 | ) | ||||||
| $12.100 | $11.450 | $11.240 | $11.200 | $11.460 | |||||||||||
| 8.62% | 4.61% | 2.95% | 0.48% | 1.43% | |||||||||||
| $511 | $861 | $1,272 | $1,786 | $2,413 | |||||||||||
| 1.60% | 1.60% | 1.60% | 1.61% | 1.60% | |||||||||||
| 1.70% | 1.73% | 1.73% | 1.73% | 1.77% | |||||||||||
| 2.74% | 2.66% | 2.53% | 2.75% | 2.71% | |||||||||||
| 2.64% | 2.53% | 2.40% | 2.63% | 2.54% | |||||||||||
| 27% | 47% | 28% | 40% | 37% | |||||||||||
87
Financial highlights
Delaware Tax-Free USA Intermediate Fund Class C
Delaware Tax-Free USA Intermediate Fund Class C
Selected data for each share of the Fund outstanding throughout each period were as follows:
| Net asset value, beginning of period |
| Income (loss) from investment operations: |
| Net investment income |
| Net realized and unrealized gain (loss) on investments |
| Total from investment operations |
| Less dividends and distributions from: |
| Net investment income |
| Total dividends and distributions |
| Net asset value, end of period |
| Total return1 |
| Ratios and supplemental data: |
| Net assets, end of period (000 omitted) |
| Ratio of expenses to average net assets |
| Ratio of expenses to average net assets |
| prior to fees waived and expense paid indirectly |
| Ratio of net investment income to average net assets |
| Ratio of net investment income to average net assets |
| prior to fees waived and expense paid indirectly |
| Portfolio turnover |
1 Total investment return is based on the change in net asset value of a share during the period and assumes reinvestment of dividends and distributions at net asset value and does not reflect the impact of a sales charge. Total investment return during all of the periods shown reflects a waiver by the manager. Performance would have been lower had the waiver not been in effect.
See accompanying Notes, which are an integral part of the financial statements.
88
| Year Ended | |||||||||||||||
| 8/31/10 | 8/31/09 | 8/31/08 | 8/31/07 | 8/31/06 | |||||||||||
| $11.450 | $11.240 | $11.200 | $11.470 | $11.610 | |||||||||||
| 0.323 | 0.294 | 0.287 | 0.317 | 0.311 | |||||||||||
| 0.660 | 0.210 | 0.041 | (0.270 | ) | (0.140 | ) | |||||||||
| 0.983 | 0.504 | 0.328 | 0.047 | 0.171 | |||||||||||
| (0.323 | ) | (0.294 | ) | (0.288 | ) | (0.317 | ) | (0.311 | ) | ||||||
| (0.323 | ) | (0.294 | ) | (0.288 | ) | (0.317 | ) | (0.311 | ) | ||||||
| $12.110 | $11.450 | $11.240 | $11.200 | $11.470 | |||||||||||
| 8.70% | 4.60% | 2.95% | 0.39% | 1.52% | |||||||||||
| $65,343 | $40,232 | $24,880 | $28,237 | $28,004 | |||||||||||
| 1.60% | 1.60% | 1.60% | 1.61% | 1.60% | |||||||||||
| 1.70% | 1.73% | 1.73% | 1.73% | 1.77% | |||||||||||
| 2.74% | 2.66% | 2.53% | 2.75% | 2.71% | |||||||||||
| 2.64% | 2.53% | 2.40% | 2.63% | 2.54% | |||||||||||
| 27% | 47% | 28% | 40% | 37% | |||||||||||
89
Financial highlights
Delaware Tax-Free USA Intermediate Fund Institutional Class
Delaware Tax-Free USA Intermediate Fund Institutional Class
Selected data for each share of the Fund outstanding throughout each period were as follows:
| 12/31/081 | |||||||
| Year Ended | to | ||||||
| 8/31/10 | 8/31/09 | ||||||
| Net asset value, beginning of period | $11.460 | $10.800 | |||||
| Income from investment operations: | |||||||
| Net investment income | 0.424 | 0.269 | |||||
| Net realized and unrealized gain on investments | 0.770 | 0.660 | |||||
| Total from investment operations | 1.194 | 0.929 | |||||
| Less dividends and distributions from: | |||||||
| Net investment income | (0.424 | ) | (0.269 | ) | |||
| Total dividends and distributions | (0.424 | ) | (0.269 | ) | |||
| Net asset value, end of period | $12.230 | $11.460 | |||||
| Total return2 | 10.62% | 8.68% | |||||
| Ratios and supplemental data: | |||||||
| Net assets, end of period (000 omitted) | $192,026 | $1 | |||||
| Ratio of expenses to average net assets | 0.60% | 0.60% | |||||
| Ratio of expenses to average net assets | |||||||
| prior to fees waived and expense paid indirectly | 0.70% | 0.73% | |||||
| Ratio of net investment income to average net assets | 3.74% | 3.65% | |||||
| Ratio of net investment income to average net assets | |||||||
| prior to fees waived and expense paid indirectly | 3.64% | 3.52% | |||||
| Portfolio turnover | 27% | 47% | 3 | ||||
1 Date of commencement of operations; ratios have been annualized and total return has not been annualized.
2 Total investment return is based on the change in net asset value of a share during the period and assumes reinvestment of dividends and distributions at net asset value. Total investment return during all of the periods shown reflects a waiver by the manager. Performance would have been lower had the waiver not been in effect.
3 Portfolio turnover is representative of the Fund for the entire year.
See accompanying Notes, which are an integral part of the financial statements.
90
Financial highlights
Delaware National High-Yield Municipal Bond Fund Class A
Delaware National High-Yield Municipal Bond Fund Class A
Selected data for each share of the Fund outstanding throughout each period were as follows:
| Net asset value, beginning of period |
| Income (loss) from investment operations: |
| Net investment income |
| Net realized and unrealized gain (loss) on investments |
| Total from investment operations |
| Less dividends and distributions from: |
| Net investment income |
| Total dividends and distributions |
| Net asset value, end of period |
| Total return1 |
| Ratios and supplemental data: |
| Net assets, end of period (000 omitted) |
| Ratio of expenses to average net assets |
| Ratio of expenses to average net assets |
| prior to fees waived and expense paid indirectly |
| Ratio of net investment income to average net assets |
| Ratio of net investment income to average net assets |
| prior to fees waived and expense paid indirectly |
| Portfolio turnover |
1 Total investment return is based on the change in net asset value of a share during the period and assumes reinvestment of dividends and distributions at net asset value and does not reflect the impact of a sales charge. Total investment return during all of the periods shown reflects a waiver by the manager. Performance would have been lower had the waiver not been in effect.
See accompanying Notes, which are an integral part of the financial statements.
92
| Year Ended | |||||||||||||||
| 8/31/10 | 8/31/09 | 8/31/08 | 8/31/07 | 8/31/06 | |||||||||||
| $8.920 | $9.510 | $10.030 | $10.320 | $10.380 | |||||||||||
| 0.513 | 0.505 | 0.484 | 0.482 | 0.477 | |||||||||||
| 1.169 | (0.595 | ) | (0.520 | ) | (0.290 | ) | (0.060 | ) | |||||||
| 1.682 | (0.090 | ) | (0.036 | ) | 0.192 | 0.417 | |||||||||
| (0.512 | ) | (0.500 | ) | (0.484 | ) | (0.482 | ) | (0.477 | ) | ||||||
| (0.512 | ) | (0.500 | ) | (0.484 | ) | (0.482 | ) | (0.477 | ) | ||||||
| $10.090 | $8.920 | $9.510 | $10.030 | $10.320 | |||||||||||
| 19.29% | (0.38% | ) | (0.37% | ) | 1.82% | 4.15% | |||||||||
| $139,628 | $68,812 | $67,762 | $65,143 | $68,663 | |||||||||||
| 0.85% | 0.90% | 0.90% | 0.91% | 0.90% | |||||||||||
| 1.04% | 1.08% | 1.04% | 1.03% | 1.02% | |||||||||||
| 5.24% | 6.06% | 4.94% | 4.66% | 4.66% | |||||||||||
| 5.05% | 5.88% | 4.80% | 4.54% | 4.54% | |||||||||||
| 37% | 67% | 24% | 37% | 73% | |||||||||||
93
Financial highlights
Delaware National High-Yield Municipal Bond Fund Class B
Delaware National High-Yield Municipal Bond Fund Class B
Selected data for each share of the Fund outstanding throughout each period were as follows:
| Net asset value, beginning of period |
| Income (loss) from investment operations: |
| Net investment income |
| Net realized and unrealized gain (loss) on investments |
| Total from investment operations |
| Less dividends and distributions from: |
| Net investment income |
| Total dividends and distributions |
| Net asset value, end of period |
| Total return1 |
| Ratios and supplemental data: |
| Net assets, end of period (000 omitted) |
| Ratio of expenses to average net assets |
| Ratio of expenses to average net assets |
| prior to fees waived and expense paid indirectly |
| Ratio of net investment income to average net assets |
| Ratio of net investment income to average net assets |
| prior to fees waived and expense paid indirectly |
| Portfolio turnover |
1 Total investment return is based on the change in net asset value of a share during the period and assumes reinvestment of dividends and distributions at net asset value and does not reflect the impact of a sales charge. Total investment return during all of the periods shown reflects a waiver by the manager. Performance would have been lower had the waiver not been in effect.
See accompanying Notes, which are an integral part of the financial statements.
94
| Year Ended | |||||||||||||||
| 8/31/10 | 8/31/09 | 8/31/08 | 8/31/07 | 8/31/06 | |||||||||||
| $8.940 | $9.530 | $10.050 | $10.350 | $10.400 | |||||||||||
| 0.442 | 0.440 | 0.410 | 0.404 | 0.400 | |||||||||||
| 1.169 | (0.592 | ) | (0.520 | ) | (0.300 | ) | (0.050 | ) | |||||||
| 1.611 | (0.152 | ) | (0.110 | ) | 0.104 | 0.350 | |||||||||
| (0.441 | ) | (0.438 | ) | (0.410 | ) | (0.404 | ) | (0.400 | ) | ||||||
| (0.441 | ) | (0.438 | ) | (0.410 | ) | (0.404 | ) | (0.400 | ) | ||||||
| $10.110 | $8.940 | $9.530 | $10.050 | $10.350 | |||||||||||
| 18.37% | (1.11% | ) | (1.12% | ) | 0.96% | 3.47% | |||||||||
| $1,118 | $1,448 | $3,135 | $5,972 | $9,519 | |||||||||||
| 1.60% | 1.65% | 1.65% | 1.66% | 1.65% | |||||||||||
| 1.79% | 1.83% | 1.79% | 1.78% | 1.77% | |||||||||||
| 4.49% | 5.31% | 4.19% | 3.91% | 3.91% | |||||||||||
| 4.30% | 5.13% | 4.05% | 3.79% | 3.79% | |||||||||||
| 37% | 67% | 24% | 37% | 73% | |||||||||||
95
Financial highlights
Delaware National High-Yield Municipal Bond Fund Class C
Delaware National High-Yield Municipal Bond Fund Class C
Selected data for each share of the Fund outstanding throughout each period were as follows:
| Net asset value, beginning of period |
| Income (loss) from investment operations: |
| Net investment income |
| Net realized and unrealized gain (loss) on investments |
| Total from investment operations |
| Less dividends and distributions from: |
| Net investment income |
| Total dividends and distributions |
| Net asset value, end of period |
| Total return1 |
| Ratios and supplemental data: |
| Net assets, end of period (000 omitted) |
| Ratio of expenses to average net assets |
| Ratio of expenses to average net assets |
| prior to fees waived and expense paid indirectly |
| Ratio of net investment income to average net assets |
| Ratio of net investment income to average net assets |
| prior to fees waived and expense paid indirectly |
| Portfolio turnover |
1 Total investment return is based on the change in net asset value of a share during the period and assumes reinvestment of dividends and distributions at net asset value and does not reflect the impact of a sales charge. Total investment return during all of the periods shown reflects a waiver by the manager. Performance would have been lower had the waiver not been in effect.
See accompanying Notes, which are an integral part of the financial statements.
96
| Year Ended | |||||||||||||||
| 8/31/10 | 8/31/09 | 8/31/08 | 8/31/07 | 8/31/06 | |||||||||||
| $8.960 | $9.550 | $10.070 | $10.360 | $10.420 | |||||||||||
| 0.442 | 0.441 | 0.410 | 0.404 | 0.400 | |||||||||||
| 1.169 | (0.592 | ) | (0.520 | ) | (0.290 | ) | (0.060 | ) | |||||||
| 1.611 | (0.151 | ) | (0.110 | ) | 0.114 | 0.340 | |||||||||
| (0.441 | ) | (0.439 | ) | (0.410 | ) | (0.404 | ) | (0.400 | ) | ||||||
| (0.441 | ) | (0.439 | ) | (0.410 | ) | (0.404 | ) | (0.400 | ) | ||||||
| $10.130 | $8.960 | $9.550 | $10.070 | $10.360 | |||||||||||
| 18.33% | (1.11% | ) | (1.12% | ) | 1.06% | 3.36% | |||||||||
| $36,384 | $7,770 | $6,998 | $4,848 | $5,332 | |||||||||||
| 1.60% | 1.65% | 1.65% | 1.66% | 1.65% | |||||||||||
| 1.79% | 1.83% | 1.79% | 1.78% | 1.77% | |||||||||||
| 4.49% | 5.31% | 4.19% | 3.91% | 3.91% | |||||||||||
| 4.30% | 5.13% | 4.05% | 3.79% | 3.79% | |||||||||||
| 37% | 67% | 24% | 37% | 73% | |||||||||||
97
Financial highlights
Delaware National High-Yield Municipal Bond Fund Institutional Class
Delaware National High-Yield Municipal Bond Fund Institutional Class
Selected data for each share of the Fund outstanding throughout each period were as follows:
| 12/31/081 | |||||||||
| Year Ended | to | ||||||||
| 8/31/10 | 8/31/09 | ||||||||
| Net asset value, beginning of period | $ | 8.930 | $ | 7.590 | |||||
| Income from investment operations: | |||||||||
| Net investment income | 0.534 | 0.342 | |||||||
| Net realized and unrealized gain on investments | 1.259 | 1.338 | |||||||
| Total from investment operations | 1.793 | 1.680 | |||||||
| Less dividends and distributions from: | |||||||||
| Net investment income | (0.533 | ) | (0.340 | ) | |||||
| Total dividends and distributions | (0.533 | ) | (0.340 | ) | |||||
| Net asset value, end of period | $ | 10.190 | $ | 8.930 | |||||
| Total return2 | 20.55 | % | 22.55 | % | |||||
| Ratios and supplemental data: | |||||||||
| Net assets, end of period (000 omitted) | $ | 16,840 | $1 | ||||||
| Ratio of expenses to average net assets | 0.60 | % | 0.65 | % | |||||
| Ratio of expenses to average net assets | |||||||||
| prior to fees waived and expense paid indirectly | 0.79 | % | 0.85 | % | |||||
| Ratio of net investment income to average net assets | 5.49 | % | 6.41 | % | |||||
| Ratio of net investment income to average net assets | |||||||||
| prior to fees waived and expense paid indirectly | 5.30 | % | 6.21 | % | |||||
| Portfolio turnover | 37 | % | 67 | %3 | |||||
| 1 | Date of commencement of operations; ratios have been annualized and total return has not been annualized. | |
| 2 | Total investment return is based on the change in net asset value of a share during the period and assumes reinvestment of dividends and distributions at net asset value. Total investment return during all of the periods shown reflects a waiver by the manager. Performance would have been lower had the waiver not been in effect. | |
| 3 | Portfolio turnover is representative of the Fund for the entire year. | |
See accompanying Notes, which are an integral part of the financial statements.
98
| Notes to financial statements | ||
| Delaware National Tax-Free Funds | August 31, 2010 |
Delaware Group® Tax-Free Fund is organized as a Delaware statutory trust and offers two series: Delaware Tax-Free USA Fund and Delaware Tax-Free USA Intermediate Fund. Voyageur Mutual Funds is organized as a Delaware statutory trust and offers five series: Delaware Tax-Free California Fund, Delaware Tax-Free Idaho Fund, Delaware Minnesota High-Yield Municipal Bond Fund, Delaware National High-Yield Municipal Bond Fund and Delaware Tax-Free New York Fund. Delaware Group Tax-Free Fund and Voyageur Mutual Funds are individually referred to as a Trust and collectively as the Trusts. These financial statements and the related notes pertain to Delaware Tax-Free USA Fund, Delaware Tax-Free USA Intermediate Fund and Delaware National High-Yield Municipal Bond Fund (each referred to as a Fund or, collectively, as the Funds). The above Trusts are open-end investment companies. The Fu nds are considered diversified under the Investment Company Act of 1940, as amended. The Funds offer Class A, Class B, Class C and Institutional Class shares. Class A shares are sold with a maximum front-end sales charge of up to 4.50% for Delaware Tax-Free USA Fund and Delaware National High-Yield Municipal Bond Fund, and up to 2.75% for Delaware Tax-Free USA Intermediate Fund. Class A share purchases of $1,000,000 or more will incur a contingent deferred sales charge (CDSC) of 1% if redeemed during the first year and 0.50% during the second year for Delaware Tax-Free USA Fund and Delaware National High-Yield Municipal Bond Fund; and of 0.75% for Delaware Tax-Free USA Intermediate Fund if redeemed within the first year, provided that Delaware Distributors, L.P. (DDLP) paid a financial advisor a commission on the purchase of those shares. Class B shares may be purchased only through dividend reinvestment and certain permitted exchanges. Prior to June 1, 2007, Class B shares of the Delaware Tax-Free USA Fund and Delaware National High-Yield Municipal Bond Fund were sold with a CDSC that declined from 4% to zero depending upon the period of time the shares were held. Class B shares of the Delaware Tax-Free USA Fund and Delaware National High-Yield Municipal Bond Fund will automatically convert to Class A shares on a quarterly basis approximately eight years after purchase. Class B shares of Delaware Tax-Free USA Intermediate Fund were sold with a CDSC that declines from 2% to zero depending upon the period of time the shares were held. Class B shares of the Tax-Free USA Intermediate Fund will automatically convert to Class A shares on a quarterly basis approximately five years after purchase. Class C shares are sold with a CDSC of 1%, if redeemed during the first twelve months. Institutional Class shares are not subject to a sales charge and are offered for sale exclusively to certain eligible investors.
The investment objective of the Delaware Tax-Free USA Fund and Delaware Tax-Free USA Intermediate Fund is to seek as high a level of current interest income exempt from federal income tax as is available from municipal obligations and as is consistent with prudent investment management and preservation of capital.
The investment objective of Delaware National Municipal Bond Fund is to seek a high level of current income exempt from federal income tax primarily through investment in medium- and lower-grade municipal obligations.
100
1. Significant Accounting Policies
The following accounting policies are in accordance with U.S. generally accepted accounting principles (U.S. GAAP) and are consistently followed by the Funds.
Security Valuation — Debt securities are valued by an independent pricing service or broker. To the extent current market prices are not available, the pricing service may take into account developments related to the specific security, as well as transactions in comparable securities. Short-term debt securities are valued at market value. These securities will generally be categorized as Level 2 investments. Generally, other securities and assets for which market quotations are not readily available are valued at fair value as determined in good faith under the direction of each Fund’s Board of Trustees (each, a Board or, collectively, the Boards). In determining whether market quotations are readily available or fair valuation will be used, various factors will be taken into consideration, such as market closures or suspension of trading in a security. These securities will generally be categorized as Level 3 investments.
Federal Income Taxes — No provision for federal income taxes has been made as each Fund intends to continue to qualify for federal income tax purposes as a regulated investment company under Subchapter M of the Internal Revenue Code of 1986, as amended, and make the requisite distributions to shareholders. The Funds evaluate tax positions taken or expected to be taken in the course of preparing the Funds’ tax returns to determine whether the tax positions are “more-likely-than-not” of being sustained by the applicable tax authority. Tax positions not deemed to meet the more-likely-than-not threshold are recorded as a tax benefit or expense in the current year. Management has analyzed each Fund’s tax positions taken on federal income tax returns for all open tax years (August 31, 2007 – Augus t 31, 2010), and has concluded that no provision for federal income tax is required for each Fund’s financial statements.
Class Accounting — Investment income and common expenses are allocated to the various classes of each Fund on the basis of “settled shares” of each class in relation to the net assets of each Fund. Realized and unrealized gain (loss) on investments are allocated to the various classes of each Fund on the basis of daily net assets of each class. Distribution expenses relating to a specific class are charged directly to that class.
Use of Estimates — The preparation of financial statements in conformity with U.S. GAAP requires management to make estimates and assumptions that affect the reported amounts of assets and liabilities and disclosure of contingent assets and liabilities at the date of the financial statements and the reported amounts of revenues and expenses during the reporting period. Actual results could differ from those estimates and such differences could be material.
Other — Expenses directly attributable to a Fund are charged directly to that Fund. Other expenses common to various funds within the Delaware Investments® Family of Funds are generally allocated amongst such funds on the basis of average net assets. Management fees and some other expenses are paid monthly. Security transactions are recorded on the date the
101
Notes to financial statements
Delaware National Tax-Free Funds
Delaware National Tax-Free Funds
1. Significant Accounting Policies (continued)
securities are purchased or sold (trade date) for financial reporting purposes. Costs used in calculating realized gains and losses on the sale of investment securities are those of the specific securities sold. Interest income is recorded on the accrual basis. Discounts and premiums are amortized to interest income over the lives of the respective securities. Each Fund declares dividends daily from net investment income and pays such dividends monthly and declares and pays distributions from net realized gain on investments, if any, annually. Such dividends and distributions, if any, are recorded on ex-dividend date.
The Funds receive earnings credits from their custodian when positive cash balances are maintained, which are used to offset custody fees. There were no earnings credits for the year ended August 31, 2010.
The Funds may receive earnings credits from their transfer agent when positive cash balances are maintained, which may be used to offset transfer agent fees. The expense paid under this arrangement is included in dividend disbursing and transfer agent fees and expenses on the statement of operations with the corresponding offset shown as “expense paid indirectly.” For the year ended August 31, 2010, the Funds earned the following under this agreement:
| Delaware Tax-Free | Delaware Tax-Free | Delaware National High-Yield | ||||
| USA Fund | USA Intermediate Fund | Municipal Bond Fund | ||||
| $505 | $569 | $94 |
2. Investment Management, Administration Agreements and Other Transactions with Affiliates
In accordance with the terms of its respective investment management agreement, each Fund pays Delaware Management Company (DMC), a series of Delaware Management Business Trust and the investment manager, an annual fee which is calculated based on each Fund’s average daily net assets as follows:
| Delaware Tax-Free | Delaware Tax-Free | Delaware National High-Yield | ||||||||||
| USA Fund | USA Intermediate Fund | Municipal Bond Fund | ||||||||||
| On the first $500 million | 0.550 | % | 0.500 | % | 0.550 | % | ||||||
| On the next $500 million | 0.500 | % | 0.475 | % | 0.500 | % | ||||||
| On the next $1.5 billion | 0.450 | % | 0.450 | % | 0.450 | % | ||||||
| In excess of $2.5 billion | 0.425 | % | 0.425 | % | 0.425 | % | ||||||
Effective January 1, 2010, DMC has voluntarily agreed to waive that portion, if any, of its management fee and/or pay/reimburse each Fund to the extent necessary to ensure that total annual operating expenses (excluding any 12b-1 plan expenses, taxes, interest, inverse floater program expenses, short sale and dividend interest expenses, brokerage fees, certain insurance costs, and nonroutine expenses or costs including, but not limited to, those relating to reorganizations, litigation, conducting shareholder meetings, and liquidations ), do not exceed
102
0.56%, 0.60%, and 0.60% of average daily net assets of Delaware Tax-Free USA Fund, Delaware Tax-Free USA Intermediate Fund, and Delaware National High-Yield Municipal Bond Fund, respectively, until such time as the voluntary expense cap is discontinued. For purposes of these waivers and reimbursements, nonroutine expenses may also include such additional costs and expenses, as may be agreed upon from time to time by the Funds’ Boards and DMC. These expense waivers and reimbursements apply only to expenses paid directly by the Funds and may be discontinued at any time because they are voluntary. Prior to January 1, 2010, DMC had contractually agreed to waive that portion, if any, of its management fee and reimburse each Fund to the extent necessary to ensure that total annual operating expenses (excluding any 12b-1 plan expenses, taxes, interest, inverse floater program expenses, brokerage fees, certain insurance costs, and nonroutine expenses), did not exceed 0.60%, 0.60%, and 0.65% of average daily net assets of Delaware Tax-Free USA Fund, Delaware Tax-Free USA Intermediate Fund, and Delaware National High-Yield Municipal Bond Fund, respectively.
Delaware Service Company, Inc. (DSC), an affiliate of DMC, provides fund accounting and financial administration oversight services to the Funds. For these services, each Fund pays DSC fees based on the aggregate daily net assets of the Delaware Investments® Family of Funds at the following annual rate: 0.0050% of the first $30 billion; 0.0045% of the next $10 billion; 0.0040% of the next $10 billion; and 0.0025% of aggregate average daily net assets in excess of $50 billion. The fees payable to DSC under the service agreement described above are allocated among all Funds in the Delaware Investments® Family of Funds on a relative net asset value basis. For the six months ended February 28, 2010, each Fund was charged for these services as follows:
| Delaware Tax-Free | Delaware Tax-Free | Delaware National High-Yield | ||||
| USA Fund | USA Intermediate Fund | Municipal Bond Fund | ||||
| $29,839 | $29,672 | $5,783 |
DSC also provides dividend disbursing and transfer agency services. Each Fund pays DSC a monthly fee based on the number of shareholder accounts for dividend disbursing and transfer agent services.
Pursuant to a distribution agreement and distribution plan, each Fund pays DDLP, the distributor and an affiliate of DMC, an annual distribution and service fee not to exceed 0.30% of the average daily net assets of the Class A shares for Delaware Tax-Fee USA Intermediate Fund, 0.25% of the average daily net assets of the Class A shares for the Delaware National High-Yield Municipal Bond Fund and 1.00% of the average daily net assets of the Class B and C shares for all the Funds. The Board for Delaware Tax-Free USA Fund has adopted a formula for calculating 12b-1 plan fees for the Fund’s Class A shares that went into effect on June 1, 1992. The total 12b-1 fees to be paid by Class A shareholders of the Fund will be the sum of 0.10% of the average daily net assets representing shares that were acquired prior to June 1, 1992 and 0.30% of the average daily net assets representing shares that were acquired on or after June 1, 1992. Effec tive April 21, 2006, the maximum amount of the Class A 12b-1 fees was reduced to 0.25% and the total 12b-1 fees to be
103
Notes to financial statements
Delaware National Tax-Free Funds
Delaware National Tax-Free Funds
2. Investment Management, Administration Agreements and Other Transactions with Affiliates (continued)
paid to Class A shareholders of the Fund will be the sum of 0.10% of the average daily net assets representing shares that were acquired prior to June 1, 1992 and 0.25% of the average daily net assets representing shares that were acquired on or after June 1, 1992. All Class A shareholders will bear 12b-1 fees at the same rate, the blended rate based upon the allocation of the rates described above. Institutional Class shares pay no distribution and service expenses. DDLP has contracted to waive distribution and service fees through December 31, 2010 in order to prevent distribution and service fees of Class A shares from exceeding 0.15% of average daily net assets for the Delaware Tax-Free USA Intermediate Fund.
At August 31, 2010, each Fund had liabilities payable to affiliates as follows:
| Delaware Tax-Free | Delaware Tax-Free | Delaware National High-Yield | |||||||||
| USA Fund | USA Intermediate Fund | Municipal Bond Fund | |||||||||
| Investment management fees | |||||||||||
| payable to DMC | $238,990 | $258,025 | $44,821 | ||||||||
| Dividend disbursing, transfer | |||||||||||
| agent and fund accounting | |||||||||||
| oversight fees and other | |||||||||||
| expenses payable to DSC | 15,994 | 23,166 | 4,555 | ||||||||
| Distribution fees payable | |||||||||||
| to DDLP | 148,260 | 114,688 | 55,613 | ||||||||
| Other expenses payable to | |||||||||||
| DMC and affiliates* | 22,620 | 38,861 | 8,478 | ||||||||
| * | DMC, as part of its administrative services, pays operating expenses on behalf of each Fund and is reimbursed on a periodic basis. Such expenses include items such as printing of shareholder reports, fees for audit, legal and tax services, registration fees and trustees’ fees. |
As provided in the investment management agreement, each Fund bears the cost of certain legal and tax services, including internal legal and tax services provided to each Fund by DMC and/or its affiliates’ employees. For the year ended August 31, 2010, each Fund was charged for internal legal and tax services provided by DMC and/or its affiliates’ employees as follows:
| Delaware Tax-Free | Delaware Tax-Free | Delaware National High-Yield | ||||
| USA Fund | USA Intermediate Fund | Municipal Bond Fund | ||||
| $23,918 | $26,202 | $5,742 |
For the year ended August 31, 2010, DDLP earned commissions on sales of Class A shares for each Fund as follows:
| Delaware Tax-Free | Delaware Tax-Free | Delaware National High-Yield | ||||
| USA Fund | USA Intermediate Fund | Municipal Bond Fund | ||||
| $49,648 | $52,896 | $63,515 |
104
For the year ended August 31, 2010, DDLP received gross CDSC commissions on redemption of each Fund’s Class A, Class B and Class C shares, respectively. These commissions were entirely used to offset up-front commissions previously paid by DDLP to broker-dealer on sales of those shares. The amounts received were as follows:
| Delaware Tax-Free | Delaware Tax-Free | Delaware National High-Yield | |||||||||||||
| USA Fund | USA Intermediate Fund | Municipal Bond Fund | |||||||||||||
| Class A | $ | 0 | $ | 0 | $ | 0 | |||||||||
| Class B | 5,373 | 1,270 | 375 | ||||||||||||
| Class C | 1,246 | 9,750 | 1,140 | ||||||||||||
Trustees’ fees include expenses accrued by the Funds for each Trustee’s retainer and meeting fees. Certain officers of DMC, DSC and DDLP are officers and/or Trustees of the Trust. These officers and Trustees are paid no compensation by the Funds.
3. Investments
For the year ended August 31, 2010, the Funds made purchases and sales of investment securities other than short-term investments as follows:
| Delaware Tax-Free | Delaware Tax-Free | Delaware National High-Yield | ||||||||||
| USA Fund | USA Intermediate Fund | Municipal Bond Fund | ||||||||||
| Purchases | $210,009,192 | $357,482,598 | $135,622,590 | |||||||||
| Sales | 185,863,574 | 161,060,661 | 42,872,980 | |||||||||
At August 31, 2010, the cost of investments and unrealized appreciation (depreciation) for federal income tax purposes for each Fund were as follows:
| Delaware Tax-Free | Delaware Tax-Free | Delaware National High-Yield | ||||||||||||||||
| USA Fund | USA Intermediate Fund | Municipal Bond Fund | ||||||||||||||||
| Cost of investments | $ | 577,301,239 | $ | 685,489,835 | $ | 181,086,675 | ||||||||||||
| Aggregate unrealized | ||||||||||||||||||
| appreciation | $ | 53,679,485 | $ | 48,474,876 | $ | 10,587,411 | ||||||||||||
| Aggregate unrealized | ||||||||||||||||||
| depreciation | (10,407,199 | ) | (2,402,983 | ) | (3,730,871 | ) | ||||||||||||
| Net unrealized | ||||||||||||||||||
| appreciation | $ | 43,272,286 | $ | 46,071,893 | $ | 6,856,540 | ||||||||||||
U.S. GAAP defines fair value as the price that the Funds would receive to sell an asset or pay to transfer a liability in an orderly transaction between market participants at the measurement date under current market conditions. A three level hierarchy for fair value measurements has been established based upon the transparency of inputs to the valuation of an asset or liability. Inputs may be observable or unobservable and refer broadly to the assumptions that market participants would use in pricing the asset or liability. Observable inputs reflect the assumptions market participants would use in pricing the asset or liability based on market data obtained from sources independent of the reporting entity. Unobservable inputs reflect the reporting entity’s own assumptions about the assumptions that market participants would use in pricing the asset or
105
Notes to financial statements
Delaware National Tax-Free Funds
Delaware National Tax-Free Funds
3. Investments (continued)
liability developed based on the best information available under the circumstances. Each Fund’s investment in its entirety is assigned a level based upon the observability of the inputs which are significant to the overall valuation. The three level hierarchy of inputs is summarized below.
| Level 1 | – | inputs are quoted prices in active markets for identical investments |
| Level 2 | – | other observable inputs (including, but not limited to quoted prices for similar assets or liabilities in markets that are active, quoted prices for identical or similar assets or liabilities in markets that are not active, inputs other than quoted prices that are observable for the assets or liabilities (such as interest rates, yield curves, volatilities, prepayment speeds, loss severities, credit risks and default rates) or other market-corroborated inputs) |
| Level 3 | – | inputs are significant unobservable inputs (including the Funds’ own assumptions used to determine the fair value of investments) |
The following table summarizes the valuation of each Fund’s investments by fair value hierarchy levels as of August 31, 2010:
| Delaware Tax-Free | Delaware Tax-Free | Delaware National High-Yield | |||||
| Municipal Bonds | USA Fund | USA Intermediate Fund | Municipal Bond Fund | ||||
| Level 2 | $620,573,525 | $731,561,728 | $187,943,215 | ||||
There were no Level 3 securities at the beginning or end of the year.
In January 2010, the FASB issued an Accounting Standards Update, Improving Disclosures about Fair Value Measurements, which introduced new disclosure requirements and clarified certain existing disclosure requirements around fair value measurements currently presented above. The new disclosures and clarifications of existing disclosures are generally effective for each Fund’s fiscal year ending August 31, 2011 and interim periods therein. Management has evaluated the impact of this update on its current disclosures and determined that there were no transfers of securities between Level 1 investments, Level 2 investments or Level 3 investments that had a material impact to the Funds.
4. Dividend and Distribution Information
Income and long-term capital gain distributions are determined in accordance with federal income tax regulations, which may differ from U.S. GAAP. Additionally, distributions from net short-term gains on sales of investment securities are treated as ordinary income for federal income tax purposes. The tax character of dividends and distributions paid during the years ended August 31, 2010 and 2009 was as follows:
106
| Delaware Tax-Free | Delaware Tax-Free | Delaware National High-Yield | |||||||||||||
| USA Fund | USA Intermediate Fund | Municipal Bond Fund | |||||||||||||
| Year ended 8/31/10 | |||||||||||||||
| Tax-exempt income | $ | 26,946,651 | $ | 20,788,197 | $ | 5,854,908 | |||||||||
| Ordinary income | 502,834 | 134,392 | 95,385 | ||||||||||||
| Total | $ | 27,449,485 | $ | 20,922,589 | $ | 5,950,293 | |||||||||
| Year ended 8/31/09 | |||||||||||||||
| Tax-exempt income | $ | 24,389,642 | $ | 15,114,111 | $ | 4,103,777 | |||||||||
| Ordinary income | 50,485 | — | 375 | ||||||||||||
| Total | $ | 24,440,127 | $ | 15,114,111 | $ | 4,104,152 | |||||||||
5. Components of Net Assets on a Tax Basis
As of August 31, 2010, the components of net assets on a tax basis were as follows:
| Delaware Tax-Free | Delaware Tax-Free | Delaware National High-Yield | ||||||||||||||
| USA Fund | USA Intermediate Fund | Municipal Bond Fund | ||||||||||||||
| Shares of beneficial interest | $ | 589,352,077 | $ | 698,494,946 | $ | 189,460,313 | ||||||||||
| Distributions payable | (690,821 | ) | (567,550 | ) | (214,145 | ) | ||||||||||
| Undistributed tax-exempt | ||||||||||||||||
| income | 757,716 | 583,775 | 209,737 | |||||||||||||
| Capital loss carryforward | (7,451,132 | ) | (5,699,308 | ) | (2,342,205 | ) | ||||||||||
| Unrealized appreciation | ||||||||||||||||
| of investments | 43,272,286 | 46,071,893 | 6,856,540 | |||||||||||||
| Net assets | $ | 625,240,126 | $ | 738,883,756 | $ | 193,970,240 | ||||||||||
The differences between book basis and tax basis components of the net assets are primarily attributable to tax deferral of losses on wash sales and tax treatment of market discount and premium on debt instruments and tax treatment of distributions payable.
For financial reporting purposes, capital accounts are adjusted to reflect the tax character of permanent book/tax differences. Reclassifications are primarily due to tax treatment of market discount and premium on debt instruments. Results of operations and net assets were not affected by these reclassifications. For the year ended August 31, 2010, the Delaware National High-Yield Municipal Bond Fund recorded the following reclassifications:
| Undistributed net investment income | $(37,822 | ) | |
| Accumulated net realized gain | 37,822 |
107
Notes to financial statements
Delaware National Tax-Free Funds
Delaware National Tax-Free Funds
5. Components of Net Assets on a Tax Basis (continued)
For federal income tax purposes, capital loss carryforwards may be carried forward and applied against future capital gains. Capital loss carryforwards remaining at August 31, 2010 will expire as follows:
| Delaware Tax-Free | Delaware Tax-Free | Delaware National High-Yield | ||||||||||||||
| Year of Expiration | USA Fund | USA Intermediate Fund | Municipal Bond Fund | |||||||||||||
| 2011 | $ | — | $ | — | $ | 631,027 | ||||||||||
| 2012 | — | — | 980,742 | |||||||||||||
| 2015 | — | — | 355,701 | |||||||||||||
| 2017 | 7,451,132 | 5,699,308 | 374,735 | |||||||||||||
| Total | $ | 7,451,132 | $ | 5,699,308 | $ | 2,342,205 | ||||||||||
For the year ended August 31, 2010, $3,865,444, $2,575,842, and $437,365 of capital loss carryforwards were utilized for Delaware Tax-Free USA Fund, Delaware Tax-Free USA Intermediate Fund, and Delaware National High-Yield Municipal Bond Fund, respectively.
6. Capital Shares
Transactions in capital shares were as follows:
| Delaware Tax-Free | Delaware Tax-Free | Delaware National High-Yield | ||||||||||||||||
| USA Fund | USA Intermediate Fund | Municipal Bond Fund | ||||||||||||||||
| Year Ended | Year Ended | Year Ended | ||||||||||||||||
| 8/31/10 | 8/31/09 | 8/31/10 | 8/31/09 | 8/31/10 | 8/31/09 | |||||||||||||
| Shares sold: | ||||||||||||||||||
| Class A | 5,499,136 | 11,607,343 | 20,561,913 | 21,288,665 | 8,272,964 | 1,543,457 | ||||||||||||
| Class B | 7,807 | 7,042 | 427 | 16,760 | 2,718 | 36,455 | ||||||||||||
| Class C | 866,259 | 662,828 | 2,735,842 | 1,748,249 | 2,898,321 | 298,334 | ||||||||||||
| Institutional Class | 962,114 | 102 | 16,911,847 | 95 | 2,202,319 | 134 | ||||||||||||
| Shares issued upon reinvestment of dividends and distributions: | ||||||||||||||||||
| Class A | 1,229,783 | 1,198,786 | 1,005,351 | 885,386 | 313,502 | 269,659 | ||||||||||||
| Class B | 10,383 | 16,525 | 1,078 | 1,659 | 3,238 | 6,137 | ||||||||||||
| Class C | 61,213 | 46,310 | 88,888 | 52,363 | 54,352 | 26,475 | ||||||||||||
| Institutional Class | 6,078 | 3 | 85,605 | 2 | 14,620 | 5 | ||||||||||||
| 8,642,773 | 13,538,939 | 41,390,951 | 23,993,179 | 13,762,034 | 2,180,656 | |||||||||||||
| Shares repurchased: | ||||||||||||||||||
| Class A | (5,953,210) | (10,115,087 | ) | (21,987,886) | (18,287,462 | ) | (2,460,064 | ) | (1,230,554 | ) | ||||||||
| Class B | (306,421 | ) | (350,505 | ) | (34,462 | ) | (56,382 | ) | (57,274 | ) | (209,703 | ) | ||||||
| Class C | (208,581 | ) | (339,849 | ) | (941,095 | ) | (500,042 | ) | (228,990 | ) | (190,984 | ) | ||||||
| Institutional Class | (316,816 | ) | — | (1,298,699 | ) | — | (563,836 | ) | — | |||||||||
| (6,785,028 | ) | (10,805,441 | ) | (24,262,142) | (18,843,886 | ) | (3,310,164) | (1,631,241 | ) | |||||||||
| Net increase | 1,857,745 | 2,733,498 | 17,128,809 | 5,149,293 | 10,451,870 | 549,415 | ||||||||||||
108
For the years ended August 31, 2010 and 2009, the following shares and values were converted from Class B to Class A shares. The respective amounts are included in Class B redemptions and Class A subscriptions in the tables above and the statements of changes in net assets.
| Year Ended | Year Ended | |||||||||||||
| 8/31/10 | 8/31/09 | |||||||||||||
| Class B | Class A | Class B | Class A | |||||||||||
| Shares | Shares | Value | Shares | Shares | Value | |||||||||
| Delaware Tax-Free | ||||||||||||||
| USA Fund | 104,388 | 104,295 | $ | 1,173,700 | 161,252 | 161,199 | $ | 1,668,006 | ||||||
| Delaware Tax-Free | ||||||||||||||
| USA Intermediate Fund | 8,148 | 8,141 | 95,087 | 23,056 | 23,046 | 253,527 | ||||||||
| Delaware National High-Yield | ||||||||||||||
| Municipal Bond Fund | 8,566 | 8,583 | 81,217 | 26,693 | 26,746 | 211,723 | ||||||||
7. Line of Credit
Each Fund, along with certain other funds in the Delaware Investments® Family of Funds (Participants), participates in a $35,000,000 revolving line of credit with The Bank of New York Mellon (BNY Mellon) to be used for temporary or emergency purposes as an additional source of liquidity to fund redemptions of investor shares. Under the agreement, the Participants are charged an annual commitment fee, which is allocated across the Participants on the basis of each Participant’s allocation of the entire facility. The Participants may borrow up to a maximum of one third of their net assets under the agreement. The agreement expires on November 16, 2010. The Funds had no amounts outstanding as of August 31, 2010, or at any time during the year then ended.
8. Credit and Market Risk
The Funds concentrate their investments in securities issued by municipalities. The value of these investments may be adversely affected by new legislation within the states, regional or local economic conditions, and differing levels of supply and demand for municipal bonds. Many municipalities insure repayment for their obligations. Although bond insurance reduces the risk of loss due to default by an issuer, such bonds remain subject to the risk that value may fluctuate for other reasons and there is no assurance that the insurance company will meet its obligations. A real or perceived decline in creditworthiness of a bond insurer can have an adverse impact on the value of insured bonds held in the Funds. At August 31, 2010, 9.18% of the Delaware Tax-Free USA Fund’s net assets, 10.67% of the Delaware Tax-Free USA Intermediate Fund’s net assets, and 3.74% of the Delaware National High-Yield Municipal Bond Fund’s net ass ets were insured by bond insurers. These securities have been identified in the statements of net assets.
As of August 31, 2010, the Tax-Free USA Fund invested in municipal bonds issued by the state of New York and the territory of Puerto Rico which constituted approximately 13% and 10%, respectively, of the Fund’s portfolio. As of August 31, 2010, the Tax-Free USA Intermediate Fund invested in municipal bonds issued by the state of New York which constituted approximately 11%
109
Notes to financial statements
Delaware National Tax-Free Funds
Delaware National Tax-Free Funds
8. Credit and Market Risk (continued)
of the Fund’s portfolio. These investments could make each Fund more sensitive to economic conditions in those states than other more geographically diversified national municipal income funds.
Each Fund may invest a portion of its assets in high yield fixed income securities, which carry ratings of BB or lower by Standard & Poor’s Ratings Group (S&P) and/or Ba or lower by Moody’s Investors Service, Inc. (Moody’s). Investments in these higher yielding securities are generally accompanied by a greater degree of credit risk than higher rated securities. Additionally, lower rated securities may be more susceptible to adverse economic and competitive industry conditions than investment grade securities.
The Funds may invest in advanced refunded bonds, escrow secured bonds or defeased bonds. Under current federal tax laws and regulations, state and local government borrowers are permitted to refinance outstanding bonds by issuing new bonds. The issuer refinances the outstanding debt to either reduce interest costs or to remove or alter restrictive covenants imposed by the bonds being refinanced. A refunding transaction where the municipal securities are being refunded within 90 days from the issuance of the refunding issue is known as a “current refunding.” “Advance refunded bonds” are bonds in which the refunded bond issue remains outstanding for more than 90 days following the issuance of the refunding issue. In an advance refunding, the issuer will use the proceeds of a new bond issue to purchase high grade interest bearing debt securities which are then deposited in an irrevocable escrow account held by an escro w agent to secure all future payments of principal and interest and bond premium of the advance refunded bond. Bonds are “escrowed to maturity” when the proceeds of the refunding issue are deposited in an escrow account for investment sufficient to pay all of the principal and interest on the original interest payment and maturity dates.
Bonds are considered “pre-refunded” when the refunding issue’s proceeds are escrowed only until a permitted call date or dates on the refunded issue with the refunded issue being redeemed at the time, including any required premium. Bonds become “defeased” when the rights and interests of the bondholders and of their lien on the pledged revenues or other security under the terms of the bond contract and are substituted with an alternative source of revenues (the escrow securities) sufficient to meet payments of principal and interest to maturity or to the first call dates. Escrowed secured bonds will often receive a rating of AAA from Moody’s, S&P, and/or Fitch Ratings due to the strong credit quality of the escrow securities and the irrevocable nature of the escrow deposit agreement.
Each Fund may invest up to 15% of its net assets in illiquid securities, which may include securities with contractual restrictions on resale, securities exempt from registration under Rule 144A of the Securities Act of 1933, as amended, and other securities which may not be readily marketable. The relative illiquidity of these securities may impair each Fund from disposing of them in a timely manner and at a fair price when it is necessary or desirable to do so. While maintaining oversight, each Fund’s Board has delegated to DMC the day-to-day functions of determining whether
110
individual securities are liquid for purposes of each Fund’s limitation on investments in illiquid assets. Securities eligible for resale pursuant to Rule 144A, which are determined to be liquid, are not subject to each Fund’s 15% limit on investments in illiquid securities. As of August 31, 2010, there were no Rule 144A securities. Illiquid securities have been identified on the statements of net assets.
9. Contractual Obligations
The Funds enter into contracts in the normal course of business that contain a variety of indemnifications. The Funds’ maximum exposure under these arrangements is unknown. However, the Funds have not had prior claims or losses pursuant to these contracts. Management has reviewed each Fund’s existing contracts and expects the risk of loss to be remote.
10. Subsequent Events
Management has determined no material events or transactions occurred subsequent to August 31, 2010 that would require recognition or disclosure in the Funds’ financial statements.
11. Tax Information (Unaudited)
The information set forth below is for each Fund’s fiscal year as required by federal income tax laws. Shareholders, however, must report distributions on a calendar year basis for income tax purposes, which may include distributions for portions of two fiscal years of a fund. Accordingly, the information needed by shareholders for income tax purposes will be sent to them in January of each year. Please consult your tax advisor for proper treatment of this information.
For the fiscal year ended August 31, 2010, each Fund designates distributions paid during the year as follows:
| (A) | (B) | |||||||||||
| Ordinary Income | Tax-Exempt | Total | ||||||||||
| Distributions | Distributions | Distributions | ||||||||||
| (Tax Basis) | (Tax Basis) | (Tax Basis) | ||||||||||
| Delaware Tax-Free USA Fund | 1.83 | % | 98.17 | % | 100.00 | % | ||||||
| Delaware Tax-Free USA Intermediate Fund | 0.64 | % | 99.36 | % | 100.00 | % | ||||||
| Delaware National High-Yield Municipal Bond Fund | 1.60 | % | 98.40 | % | 100.00 | % | ||||||
(A) and (B) are based on a percentage of each Fund’s total distributions.
111
Report of independent
registered public accounting firm
registered public accounting firm
To the Board of Trustees of Delaware Group® Tax-Free Fund and Voyageur Mutual Funds and the Shareholders of Delaware Tax-Free USA Fund, Delaware Tax-Free USA Intermediate Fund and Delaware National High-Yield Municipal Bond Fund:
In our opinion, the accompanying statements of net assets and the related statements of operations and of changes in net assets and the financial highlights present fairly, in all material respects, the financial position of Delaware Tax-Free USA Fund and Delaware Tax-Free USA Intermediate Fund (constituting Delaware Group Tax-Free Fund) and Delaware National High-Yield Municipal Bond Fund (one of the series constituting Voyageur Mutual Funds) (hereafter collectively referred to as the “Funds”) at August 31, 2010, and the results of their operations, the changes in each of their net assets and the financial highlights for the year then ended, in conformity with accounting principles generally accepted in the United States of America. These financial statements and financial highlights (hereafter referred to as “financial statements”) are the responsibility of the Funds’ management; our responsibility is to exp ress an opinion on these financial statements based on our audits. We conducted our audits of these financial statements in accordance with the standards of the Public Company Accounting Oversight Board (United States). Those standards require that we plan and perform the audit to obtain reasonable assurance about whether the financial statements are free of material misstatement. An audit includes examining, on a test basis, evidence supporting the amounts and disclosures in the financial statements, assessing the accounting principles used and significant estimates made by management, and evaluating the overall financial statement presentation. We believe that our audits, which included confirmation of securities at August 31, 2010 by correspondence with the custodian and brokers, provide a reasonable basis for our opinion. The statement of changes in net assets for the year ended August 31, 2009 and the financial highlights for each of the four years in the period ended August 31, 2009 were audited by oth er independent accountants whose report dated October 19, 2009 expressed an unqualified opinion on those statements.
PricewaterhouseCoopers LLP
Philadelphia, Pennsylvania
October 19, 2010
Philadelphia, Pennsylvania
October 19, 2010
112
Other Fund information
(Unaudited)
Delaware National Tax-Free Funds
(Unaudited)
Delaware National Tax-Free Funds
Change in Independent Registered Public Accounting Firm
Due to independence matters under the Securities and Exchange Commission’s auditor independence rules relating to the January 4, 2010 acquisition of Delaware Investments (including DMC, DDLP and DSC) by Macquarie Group, Ernst & Young LLP (E&Y) has resigned as the independent registered public accounting firm for Delaware Group Tax-Free Fund and Voyageur Mutual Funds (the Trusts) effective May 20, 2010. At a meeting held on May 20, 2010, the Boards of Trustees of the Trusts, upon recommendation of the Audit Committee, selected PricewaterhouseCoopers LLP (PwC) to serve as the independent registered public accounting firm for the Trusts for the fiscal year ending August 31, 2010. During the fiscal years ended August 31, 2009 and 2008, E&Y’s audit reports on the financial statements of the Funds did not contain any adverse opinion or disclaimer of opinion, nor were they qualified or modified as to uncertainty, audit sco pe, or accounting principles. In addition, there were no disagreements between the Trusts and E&Y on accounting principles, financial statements disclosures or audit scope, which, if not resolved to the satisfaction of E&Y, would have caused them to make reference to the disagreement in their reports. Neither the Trusts nor anyone on its behalf has consulted with PwC at any time prior to their selection with respect to the application of accounting principles to a specified transaction, either completed or proposed or the type of audit opinion that might be rendered on the Funds’ financial statements.
113
Board of trustees/directors and officers addendum
Delaware Investments® Family of Funds
Delaware Investments® Family of Funds
A mutual fund is governed by a Board of Trustees/Directors (“Trustees”), which has oversight responsibility for the management of a fund’s business affairs. Trustees establish procedures and oversee and review the performance of the investment manager, the distributor, and others who perform services for the fund. The independent fund trustees, in particular, are advocates
| Name, Address, | Position(s) | Length of |
| and Birth Date | Held with Fund(s) | Time Served |
| Interested Trustees | ||
| Patrick P. Coyne1 | Chairman, President, | Chairman and Trustee |
| 2005 Market Street | Chief Executive Officer, | since August 16, 2006 |
| Philadelphia, PA 19103 | and Trustee | |
| April 1963 | President and | |
| Chief Executive Officer | ||
| since August 1, 2006 | ||
1 Patrick P. Coyne is considered to be an “Interested Trustee” because he is an executive officer of the Fund’s(s’) investment advisor.
114
for shareholder interests. Each trustee has served in that capacity since he or she was elected to or appointed to the Board of Trustees, and will continue to serve until his or her retirement or the election of a new trustee in his or her place. The following is a list of the Trustees and Officers with certain background and related information.
| Number of Portfolios in | ||
| Principal Occupation(s) | Fund Complex Overseen | Other Directorships |
| During Past 5 Years | by Trustee or Officer | Held by Trustee or Officer |
| Patrick P. Coyne has served in | 81 | Director |
| various executive capacities | Kaydon Corp. | |
| at different times at | ||
| Delaware Investments.2 | Board of Governors Member | |
| Investment Company | ||
| Institute (ICI) | ||
| Finance Committee Member | ||
| St. John Vianney Roman | ||
| Catholic Church | ||
| Board of Trustees | ||
| Agnes Irwin School | ||
| Member of Investment | ||
| Committee | ||
| Cradle of Liberty Council, | ||
| BSA | ||
| (2007 – 2010) | ||
2 Delaware Investments is the marketing name for Delaware Management Holdings, Inc. and its subsidiaries, including the Fund’s(s’) investment advisor, principal underwriter, and its transfer agent.
115
Board of trustees/directors and officers addendum
Delaware Investments® Family of Funds
Delaware Investments® Family of Funds
| Name, Address, | Position(s) | Length of |
| and Birth Date | Held with Fund(s) | Time Served |
| Independent Trustees | ||
| Thomas L. Bennett | Trustee | Since March 2005 |
| 2005 Market Street | ||
| Philadelphia, PA 19103 | ||
| October 1947 | ||
| John A. Fry | Trustee | Since January 2001 |
| 2005 Market Street | ||
| Philadelphia, PA 19103 | ||
| May 1960 | ||
| Anthony D. Knerr | Trustee | Since April 1990 |
| 2005 Market Street | ||
| Philadelphia, PA 19103 | ||
| December 1938 | ||
| Lucinda S. Landreth | Trustee | Since March 2005 |
| 2005 Market Street | ||
| Philadelphia, PA 19103 | ||
| June 1947 | ||
116
| Number of Portfolios in | ||
| Principal Occupation(s) | Fund Complex Overseen | Other Directorships |
| During Past 5 Years | by Trustee or Officer | Held by Trustee or Officer |
| Private Investor | 81 | Director |
| (March 2004–Present) | Bryn Mawr Bank Corp. (BMTC) | |
| Investment Manager | Chairman of Investment | |
| Morgan Stanley & Co. | Committee | |
| (January 1984–March 2004) | Pennsylvania Academy of | |
| Fine Arts | ||
| Investment Committee and | ||
| Governance Committee | ||
| Member | ||
| Pennsylvania Horticultural | ||
| Society | ||
| President | 81 | Director |
| Drexel University | Community Health Systems | |
| (August 2010–Present) | ||
| Director — Ecore | ||
| President | International | |
| Franklin & Marshall College | (2009-2010) | |
| (July 2002–July 2010) | ||
| Director — Allied | ||
| Executive Vice President | Barton Securities Holdings | |
| University of Pennsylvania | (2005 to 2008) | |
| (April 1995–June 2002) | ||
| Founder and | 81 | None |
| Managing Director | ||
| Anthony Knerr & Associates | ||
| (Strategic Consulting) | ||
| (1990–Present) | ||
| Chief Investment Officer | 81 | None |
| Assurant, Inc. (Insurance) | ||
| (2002–2004) | ||
117
Board of trustees/directors and officers addendum
Delaware Investments® Family of Funds
Delaware Investments® Family of Funds
| Name, Address, | Position(s) | Length of |
| and Birth Date | Held with Fund(s) | Time Served |
| Independent Trustees (continued) | ||
| Ann R. Leven | Trustee | Since October 1989 |
| 2005 Market Street | ||
| Philadelphia, PA 19103 | ||
| November 1940 | ||
| Thomas F. Madison | Trustee | Since May 19973 |
| 2005 Market Street | ||
| Philadelphia, PA 19103 | ||
| February 1936 | ||
3 In 1997, several funds managed by Voyageur Fund Managers, Inc. (the “Voyageur Funds”) were incorporated into the Delaware Investments Family of Funds. Mr. Madison served as a director of the Voyageur Funds from 1993 until 1997.
118
| Number of Portfolios in | ||
| Principal Occupation(s) | Fund Complex Overseen | Other Directorships |
| During Past 5 Years | by Trustee or Officer | Held by Trustee or Officer |
| Consultant | 81 | Director and Audit |
| ARL Associates | Committee Chair – | |
| (Financial Planning) | Systemax Inc. | |
| (1983–Present) | (2001 – 2009) | |
| Director and Audit | ||
| Committee Chairperson – | ||
| Andy Warhol Foundation | ||
| (1999 – 2007) | ||
| President and | 81 | Director and Chair of |
| Chief Executive Officer | Compensation Committee, | |
| MLM Partners, Inc. | Governance Committee | |
| (Small Business Investing | Member | |
| and Consulting) | CenterPoint Energy | |
| (January 1993–Present) | ||
| Lead Director and Chair of | ||
| Audit and Governance | ||
| Committees, Member of | ||
| Compensation Committee | ||
| Digital River, Inc. | ||
| Director and Chair of | ||
| Governance Committee, | ||
| Audit Committee | ||
| Member | ||
| Rimage Corporation | ||
| Director and Chair of | ||
| Compensation Committee | ||
| Spanlink Communications | ||
| Lead Director and Member of | ||
| Compensation and | ||
| Governance Committees | ||
| Valmont Industries, Inc. | ||
| (1987 – 2010) | ||
119
Board of trustees/directors and officers addendum
Delaware Investments® Family of Funds
Delaware Investments® Family of Funds
| Name, Address, | Position(s) | Length of |
| and Birth Date | Held with Fund(s) | Time Served |
| Independent Trustees (continued) | ||
| Thomas F. Madison | ||
| 2005 Market Street | ||
| Philadelphia, PA 19103 | ||
| February 1936 | ||
| Janet L. Yeomans | Trustee | Since April 1999 |
| 2005 Market Street | ||
| Philadelphia, PA 19103 | ||
| July 1948 | ||
| J. Richard Zecher | Trustee | Since March 2005 |
| 2005 Market Street | ||
| Philadelphia, PA 19103 | ||
| July 1940 | ||
120
| Number of Portfolios in | ||
| Principal Occupation(s) | Fund Complex Overseen | Other Directorships |
| During Past 5 Years | by Trustee or Officer | Held by Trustee or Officer |
| Director | ||
| Banner Health | ||
| (1996 to 2007) | ||
| Vice President and Treasurer | 81 | Director |
| (January 2006–Present) | Okabena Company | |
| Vice President — Mergers & Acquisitions | ||
| (January 2003–January 2006), and | ||
| Vice President | ||
| (July 1995–January 2003) | ||
| 3M Corporation | ||
| Founder | 81 | Director and Audit |
| Investor Analytics | Committee Member | |
| (Risk Management) | Investor Analytics | |
| (May 1999–Present) | ||
| Founder | Director | |
| Sutton Asset Management | Oxigene, Inc. | |
| (Hedge Fund) | (2003 to 2008) | |
| (September 1996–Present) | ||
121
Board of trustees/directors and officers addendum
Delaware Investments® Family of Funds
Delaware Investments® Family of Funds
| Name, Address, | Position(s) | Length of |
| and Birth Date | Held with Fund(s) | Time Served |
| Officers | ||
| David F. Connor | Vice President, | Vice President since |
| 2005 Market Street | Deputy General | September 2000 |
| Philadelphia, PA 19103 | Counsel, and Secretary | and Secretary since |
| December 1963 | October 2005 | |
| Daniel V. Geatens | Vice President | Treasurer |
| 2005 Market Street | and Treasurer | since October 25, 2007 |
| Philadelphia, PA 19103 | ||
| October 1972 | ||
| David P. O’Connor | Senior Vice President, | Senior Vice President, |
| 2005 Market Street | General Counsel, | General Counsel, and |
| Philadelphia, PA 19103 | and Chief Legal Officer | Chief Legal Officer |
| February 1966 | since October 2005 | |
| Richard Salus | Senior Vice President | Chief Financial Officer |
| 2005 Market Street | and Chief Financial Officer | since November 2006 |
| Philadelphia, PA 19103 | ||
| October 1963 | ||
The Statement of Additional Information for the Fund(s) includes additional information about the Trustees and Officers and is available, without charge, upon request by calling 800 523-1918.
122
| Number of Portfolios in | ||
| Principal Occupation(s) | Fund Complex Overseen | Other Directorships |
| During Past 5 Years | by Trustee or Officer | Held by Trustee or Officer |
| David F. Connor has served as | 81 | None4 |
| Vice President and Deputy | ||
| General Counsel of | ||
| Delaware Investments | ||
| since 2000. | ||
| Daniel V. Geatens has served | 81 | None4 |
| in various capacities at | ||
| different times at | ||
| Delaware Investments. | ||
| David P. O’Connor has served in | 81 | None4 |
| various executive and legal | ||
| capacities at different times | ||
| at Delaware Investments. | ||
| Richard Salus has served in | 81 | None4 |
| various executive capacities | ||
| at different times at | ||
| Delaware Investments. | ||
4 David F. Connor, Daniel V. Geatens, David P. O’Connor, and Richard Salus serve in similar capacities for the six portfolios of the Optimum Fund Trust, which have the same investment advisor, principal underwriter, and transfer agent as the registrant.
123
About the organization
| Board of trustees | |||
Patrick P. Coyne Chairman, President, and Chief Executive Officer Delaware Investments® Family of Funds Philadelphia, PA Thomas L. Bennett Private Investor Rosemont, PA John A. Fry President Drexel University Philadelphia, PA | Anthony D. Knerr Founder and Managing Director Anthony Knerr & Associates New York, NY Lucinda S. Landreth Former Chief Investment Officer Assurant, Inc. Philadelphia, PA | Ann R. Leven Consultant ARL Associates New York, NY Thomas F. Madison President and Chief Executive Officer MLM Partners, Inc. Minneapolis, MN | Janet L. Yeomans Vice President and Treasurer 3M Corporation St. Paul, MN J. Richard Zecher Founder Investor Analytics Scottsdale, AZ |
| Affiliated officers | |||
David F. Connor Vice President, Deputy General Counsel, and Secretary Delaware Investments Family of Funds Philadelphia, PA | Daniel V. Geatens Vice President and Treasurer Delaware Investments Family of Funds Philadelphia, PA | David P. O’Connor Senior Vice President, General Counsel, and Chief Legal Officer Delaware Investments Family of Funds Philadelphia, PA | Richard Salus Senior Vice President and Chief Financial Officer Delaware Investments Family of Funds Philadelphia, PA |
This annual report is for the information of Delaware Tax-Free USA Fund, Delaware Tax-Free USA Intermediate Fund, and Delaware National High-Yield Municipal Bond Fund shareholders, but it may be used with prospective investors when preceded or accompanied by a current prospectus for Delaware Tax-Free USA Fund, Delaware Tax-Free USA Intermediate Fund, and Delaware National High-Yield Municipal Bond Fund and the Delaware Investments Fund fact sheet for the most recently completed calendar quarter. These documents are available at www.delawareinvestments.com. The prospectus sets forth details about charges, expenses, investment objectives, and operating policies of the investment company. You should read the prospectus carefully before you invest. The figures in this report represent past results that are not a guarantee of future results. The return and principal value of an investment in the investment company will fluctuate so that shares, when redeemed, may be worth more or less than their original cost. |
Delaware Investments is the marketing name of Delaware Management Holdings, Inc. and its subsidiaries. Each Fund files its complete schedule of portfolio holdings with the Securities and Exchange Commission (SEC) for the first and third quarters of each fiscal year on Form N-Q. Each Fund’s Forms N-Q, as well as a description of the policies and procedures that each Fund uses to determine how to vote proxies (if any) relating to portfolio securities are available without charge (i) upon request, by calling 800 523-1918; and (ii) on the SEC’s Web site at www.sec.gov. In addition, a description of the policies and procedures that each Fund uses to determine how to vote proxies (if any) relating to portfolio securities and each Fund’s Schedule of Investments are available without charge on each Fund’s Web site at www.delawareinvestments.com. Each Fund’s Forms N-Q may be reviewed and copied at the SEC’s Public Reference Room in Washington, D.C.; information on the operation of the Public Reference Room may be obtained by calling 800 SEC-0330. Information (if any) regarding how each Fund voted proxies relating to portfolio securities during the most recently disclosed 12-month period ended June 30 is available without charge (i) through each Fund’s Web site at www.delawareinvestments.com; and (ii) on the SEC’s Web site at www.sec.gov. |
124
Annual report Delaware Tax-Free Arizona Fund Delaware Tax-Free California Fund Delaware Tax-Free Colorado Fund Delaware Tax-Free Idaho Fund Delaware Tax-Free New York Fund August 31, 2010 Fixed income mutual funds |
This annual report is for the information of Delaware Tax-Free Arizona Fund, Delaware Tax-Free California Fund, Delaware Tax-Free Colorado Fund, Delaware Tax-Free Idaho Fund, and Delaware Tax-Free New York Fund shareholders, but it may be used with prospective investors when preceded or accompanied by a current prospectus for Delaware Tax-Free Arizona Fund, Delaware Tax-Free California Fund, Delaware Tax-Free Colorado Fund, Delaware Tax-Free Idaho Fund, and Delaware Tax-Free New York Fund. The figures in the annual report for Delaware Tax-Free Arizona Fund, Delaware Tax-Free California Fund, Delaware Tax-Free Colorado Fund, Delaware Tax-Free Idaho Fund, and Delaware Tax-Free New York Fund represent past results, which are not a guarantee of future results. The return and principal value of an investment in the Funds will fluctuate so that shares, when redeemed, may be worth more or less than their original cost. Current performance may be higher or lower than the performance data quoted. You should consider the investment objectives, risks, charges, and expenses of the Funds carefully before investing. The Delaware Tax-Free Arizona Fund, Delaware Tax-Free California Fund, Delaware Tax-Free Colorado Fund, Delaware Tax-Free Idaho Fund, and Delaware Tax-Free New York Fund prospectus contains this and other important information about the Funds. Prospectuses for all open-end funds in the Delaware Investments® Family of Funds are available from your financial advisor, online at www.delawareinvestments.com, or by phone at 800 523-1918. Please read the prospectus carefully before you invest or send money. |
| You can obtain shareholder reports and prospectuses online instead of in the mail. Visit www.delawareinvestments.com/edelivery. |
Experience Delaware Investments
Delaware Investments is committed to the pursuit of consistently superior asset management and unparalleled client service. We believe in our investment processes, which seek to deliver consistent results, and in convenient services that help add value for our clients.
If you are interested in learning more about creating an investment plan, contact your financial advisor.
You can learn more about Delaware Investments or obtain a prospectus for Delaware Tax-Free Arizona Fund, Delaware Tax-Free California Fund, Delaware Tax-Free Colorado Fund, Delaware Tax-Free Idaho Fund, and Delaware Tax-Free New York Fund at www.delawareinvestments.com.
Manage your investments online
- 24-hour access to your account information
- Obtain share prices
- Check your account balance and recent transactions
- Request statements or literature
- Make purchases and redemptions
Delaware Management Holdings, Inc., and its subsidiaries (collectively known by the marketing name of Delaware Investments) are wholly owned subsidiaries of Macquarie Group Limited, a global provider of banking, financial, advisory, investment and funds management services.
Investments in Delaware Tax-Free Arizona Fund, Delaware Tax-Free California Fund, Delaware Tax-Free Colorado Fund, Delaware Tax-Free Idaho Fund, and Delaware Tax-Free New York Fund are not and will not be deposits with or liabilities of Macquarie Bank Limited ABN 46 008 583 542 and its holding companies, including their subsidiaries or related companies (Macquarie Group), and are subject to investment risk, including possible delays in repayment and loss of income and capital invested. No Macquarie Group company guarantees or will guarantee the performance of the Funds, the repayment of capital from the Funds, or any particular rate of return.
| Table of contents | |
| Portfolio management review | 1 |
| Performance summaries | 8 |
| Disclosure of Fund expenses | 23 |
| Sector allocations | 27 |
| Statements of net assets | 32 |
| Statements of operations | 72 |
| Statements of changes in net assets | 74 |
| Financial highlights | 84 |
| Notes to financial statements | 114 |
| Report of independent registered | |
| public accounting firm | 128 |
| Other Fund information | 129 |
| Board of trustees/directors and | |
| officers addendum | 130 |
| About the organization | 140 |
Unless otherwise noted, views expressed herein are current as of Aug. 31, 2010, and are subject to change.
Funds are not FDIC insured and are not guaranteed. It is possible to lose the principal amount invested.
Mutual fund advisory services provided by Delaware Management Company, a series of Delaware Management Business Trust, which is a registered investment advisor. Delaware Investments, a member of Macquarie Group, refers to Delaware Management Holdings, Inc. and its subsidiaries, including the Funds’ distributor, Delaware Distributors, L.P. Macquarie Group refers to Macquarie Group Limited and its subsidiaries and affiliates worldwide.
© 2010 Delaware Management Holdings, Inc.
All third-party trademarks cited are the property of their respective owners.
| Portfolio management review | ||
| Delaware multiple state tax-free funds | September 7, 2010 |
| Performance preview (for the year ended August 31, 2010) | |||
| Delaware Tax-Free Arizona Fund (Class A shares) | 1-year return | +10.27% | |
| Barclays Capital Municipal Bond Index (benchmark) | 1-year return | +9.78% | |
| Lipper Arizona Municipal Debt Funds Average | 1-year return | +11.53% | |
Past performance does not guarantee future results. For complete, annualized performance for Delaware Tax-Free Arizona Fund, please see the table on page 8. The performance of Class A shares excludes the applicable sales charge and reflects the reinvestment of all distributions. Index performance returns do not reflect any management fees, transaction costs, or expenses. Indices are unmanaged and one cannot invest directly in an index. The Lipper Arizona Municipal Debt Funds Average compares funds that limit assets to those securities that are exempt from taxation in Arizona (double tax-exempt) or a city in Arizona (triple tax-exempt). |
| Delaware Tax-Free California Fund (Class A shares) | 1-year return | +13.92% | |
| Barclays Capital Municipal Bond Index (benchmark) | 1-year return | +9.78% | |
| Lipper California Municipal Debt Funds Average | 1-year return | +11.99% |
Past performance does not guarantee future results. For complete, annualized performance for Delaware Tax-Free California Fund, please see the table on page 11. The performance of Class A shares excludes the applicable sales charge and reflects the reinvestment of all distributions. Index performance returns do not reflect any management fees, transaction costs, or expenses. Indices are unmanaged and one cannot invest directly in an index. The Lipper California Municipal Debt Funds Average compares funds that limit assets to those securities that are exempt from taxation in California (double tax-exempt) or a city in California (triple tax-exempt). |
| Delaware Tax-Free Colorado Fund (Class A shares) | 1-year return | +10.74% | |
| Barclays Capital Municipal Bond Index (benchmark) | 1-year return | +9.78% | |
| Lipper Colorado Municipal Debt Funds Average | 1-year return | +10.15% |
Past performance does not guarantee future results. For complete, annualized performance for Delaware Tax-Free Colorado Fund, please see the table on page 14. The performance of Class A shares excludes the applicable sales charge and reflects the reinvestment of all distributions. Index performance returns do not reflect any management fees, transaction costs, or expenses. Indices are unmanaged and one cannot invest directly in an index. The Lipper Colorado Municipal Debt Funds Average compares funds that limit assets to those securities that are exempt from taxation in Colorado (double tax-exempt) or a city in Colorado (triple tax-exempt). |
1
Portfolio management review
Delaware multiple state tax-free funds
Delaware multiple state tax-free funds
| Delaware Tax-Free Idaho Fund (Class A shares) | 1-year return | +9.44% | |
| Barclays Capital Municipal Bond Index (benchmark) | 1-year return | +9.78% | |
| Lipper Other States Municipal Debt Funds Average | 1-year return | +9.29% |
Past performance does not guarantee future results. For complete, annualized performance for Delaware Tax-Free Idaho Fund, please see the table on page 17. The performance of Class A shares excludes the applicable sales charge and reflects the reinvestment of all distributions. Index performance returns do not reflect any management fees, transaction costs, or expenses. Indices are unmanaged and one cannot invest directly in an index. The Lipper Other States Municipal Debt Funds Average compares funds that limit assets to those securities that are exempt from taxation on a specified city or state basis. |
| Delaware Tax-Free New York Fund (Class A shares) | 1-year return | +11.02% | |
| Barclays Capital Municipal Bond Index (benchmark) | 1-year return | +9.78% | |
| Lipper New York Municipal Debt Funds Average | 1-year return | +10.67% |
Past performance does not guarantee future results. For complete, annualized performance for Delaware Tax-Free New York Fund, please see the table on page 20. The performance of Class A shares excludes the applicable sales charge and reflects the reinvestment of all distributions. Index performance returns do not reflect any management fees, transaction costs, or expenses. Indices are unmanaged and one cannot invest directly in an index. The Lipper New York Municipal Debt Funds Average compares funds that limit assets to those securities that are exempt from taxation in New York (double tax-exempt) or a city in New York (triple tax-exempt). |
Economic environment
The Funds’ fiscal year, which ended Aug. 31, 2010, was one of continued economic challenges. When the period began, however, financial markets were bolstered by a broad-based sense of optimism about the economy:
- During the third quarter of 2009, the U.S. economy, as measured by gross domestic product (GDP), rose by an annualized 1.6%, marking the economy’s first quarterly expansion in more than a year.
- Growth in the fourth quarter of 2009 was even stronger. Annualized GDP expansion of 5.0% during those three months represented the fastest quarterly growth for the U.S. economy since early 2006.
Source: U.S. Commerce Department.
As the reporting period progressed, however, indications began to mount that the U.S. economic environment was slowing once again. For example:
- Unemployment in the United States remained stubbornly high. The jobless rate peaked at 10.1% in October 2009 and finished the Funds’ fiscal period at a still-elevated 9.6%.
(Source: U.S. Labor Department.) - The rate of expansion in GDP decreased to 3.7% in the first three months of 2010, followed by a sluggish 1.6% in the year’s second quarter. This trend led some economists to worry about the potential for a “double-dip” recession. (Source: U.S. Commerce Department.)
- Investors focused their attention on the high levels of sovereign debt across the developed world (and particularly
2
in Greece), fearing that reductions in government spending could exacerbate declining economic growth.
- The U.S. housing market, weighed down by significant foreclosure activity and declining sales, continued to struggle.
Encouragingly, inflation remained low throughout the reporting period, with the Consumer Price Index rising by just 1.2% for the 12 months ending July 31, 2010 (the most recent data available as this report was being prepared). With inflation well under control, the Federal Reserve Board (the Fed) kept its benchmark short-term interest rate under 1%, where it has stood since the depths of the financial crisis in late 2008. The low rates were part of the Fed’s ongoing effort to stimulate economic growth — an effort that included a program announced late in the period to buy significant quantities of U.S. government debt.
Economic environment by state
We believe the effect of Arizona’s housing downturn has been significant, leading to a recovery period that may be longer than that of most other states. The unemployment rate in July 2010 was 9.6%, slightly above the national rate of 9.5%, while Arizona’s personal income per capita is below the national level. In addition, revenues have declined here more than in most other states, and preliminary fiscal 2010 revenues are approximately 1% below estimates. Amid falling revenue, Arizona has turned to borrowing to cover its operating costs.
The state’s fiscal 2011 budget faces a gap of $3 billion. Measures intended to close the gap include expenditure cuts, deficit bonds, payment delays, fund shifts, and a one-cent per-dollar increase in the sales tax for three years. (Sources: www.bls.gov, Moody’s Investors Service.)
California’s unemployment rate as of July 2010 was 12.3%, well above the national rate of 9.5%. California enjoys a large, diverse, and wealthy economy that mirrors that of the nation. However, its progressive tax structure makes the state tax-revenue system vulnerable to small shifts in income levels at the high end. The state has been hard hit by the national housing slowdown, and while most housing indicators remain negative, there has been some improvement. (Sources: www.bls.gov, Controller Monthly Reports, Legislative Analyst’s Office.)
Colorado’s economy is arguably quite diverse, with below-average employment concentration in manufacturing and strength in a variety of service sectors. Its economic outlook is favorable, reflecting a growing population and workforce, relatively low costs of living and doing business, and a mix of technology and service industries. While nonfarm employment lagged the rest of the nation, the unemployment rate in July 2010 was 8.0%, well below the national rate of 9.5%. (Sources: www.bls.gov, Colorado Office of State Planning and Budgeting, Moody’s Investors Service.)
In Idaho, the unemployment rate as of July 2010 was 8.8%, below the national rate. Idaho’s economy has expanded and diversified in recent years. However, the state continues to have an above-average dependence on the natural resource sector. Idaho ended fiscal 2010 approximately $8 million short. However, this figure represented a marked improvement over estimates earlier this year, when the deficit appeared on track to exceed $50 million. The State Board of Examiners decided to handle the shortfall in a way that we believe should have little effect on most government agencies, by pulling
3
Portfolio management review
Delaware multiple state tax-free funds
Delaware multiple state tax-free funds
money from the permanent building fund. (Sources: U.S. Labor Department, Idaho Division of Management, State of Idaho, Office of the State Controller.)
In New York, the unemployment rate in July 2010 was 8.2%. Job losses in the state have not been as severe as in the nation as a whole. However, employment figures themselves are not as meaningful here as they are in other states, due to New York’s high reliance on taxes paid by individuals in the financial services industry. The state has lost roughly 55,000 finance jobs in the recent economic downturn. Fiscal 2010 general fund receipts totaled $37.1 billion, representing a 2.3% decline from fiscal 2009. (Sources: U.S. Labor Department, New York Division of Budget, Moody’s Investors Service.)
Municipal bond market environment
While the sluggish economic backdrop hampered the U.S. equity market, the effect on the municipal market was relatively muted because of a favorable balance between supply and demand. Despite concerns about state and local government finances, tax-exempt bonds of all maturity lengths and credit-quality ratings gained ground throughout most of the reporting period.
Overall, investor demand for tax-exempt securities remained generally strong, driven in part by a growing expectation of higher income-tax rates in the future, while at the same time supply of municipal bonds became increasingly limited. A major factor behind this shift between supply and demand can be attributed to the introduction of the Build America Bond program, a feature of the February 2009 federal economic stimulus package. As a result of this program, many bond issues that traditionally would have come to market as tax-exempt municipal bonds were instead issued as taxable debt. This left far fewer new issues in the traditional tax-exempt municipal bond market, providing a very positive backdrop for the municipal bond asset class and driving the Funds’ returns throughout the fiscal period. (Source: Barclays Capital.)
Although all types of municipal bonds earned positive returns during the reporting period, those with longer maturity dates and lower credit ratings generally outperformed their shorter-maturity and higher-rated counterparts by a wide margin, as investors tended to favor longer-dated securities — despite their higher interest rate risk — for the potential to earn more income.
A similar situation occurred with regard to credit quality. Many investors increasingly exhibited a willingness to buy higher-yielding bonds, even if it meant taking on more credit risk.
Commitment to our longtime approach
In all five Funds profiled in this report, we continued to follow our basic investment philosophy and approach. We believe successful bond investing requires rigorous credit analysis. In our opinion, there is no substitute for thorough credit research. On a bond-by-bond basis, we scrutinize each security that the Funds hold — or consider holding. It is important to us to ensure our comfort level with a bond issue’s financial outlook and to feel confident that any risks are likely offset by the potential income the security provides. Through this strategy, we believe we can find opportunities that other investors with less experience and research diligence might overlook.
Our investment approach often leads us to an increased focus on bonds with credit ratings of BBB and A — which represent the lower
4
tier of the investment grade bond universe — and a relative de-emphasis of higher-rated bonds, such as those rated AAA and AA. We generally feel that there tends to be an opportunity for us to obtain the most value for shareholders from the lower-rated types of investment grade municipal bonds.
As the Funds’ fiscal year progressed, our tactics for managing the Funds became more selective as credit spreads narrowed — meaning that the premium paid to investors for buying riskier, lower-rated bonds declined — and bond prices rose. As these trends continued and interest rates on municipal bonds fell during the period, many of the bonds the Funds already held offered considerably higher levels of income than bonds that became available during the reporting period. For example, the Funds had purchased a number of bonds at the peak of the financial crisis, when tax-exempt municipal bond yields were extremely high because of investors’ concerns about the solvency of bond issuers. Careful research allowed us to eventually get comfortable with the credit quality of these issues. As a result, we were able to add some highly rated municipal bonds paying yields that, at the end of the Funds’ fiscal year, were com parable to what lower-rated A and even some BBB securities were offering.
Because bonds in the marketplace were paying the lower prevailing yields, we felt it was important to look at potential new purchases with an even more discerning eye. It often made little sense to us to sell higher-yielding bonds already in the Funds’ portfolio holdings in favor of new bonds reflecting the lower-interest-rate environment. We often said throughout 2010 that new bonds had to “fight their way into the portfolio.” In other words, we had to feel confident that new bonds offered sufficient value opportunities relative to their potential risks.
When we did add new securities to the Funds’ portfolio holdings as a result of Fund inflows (to accommodate cash generated by maturing bonds, for instance) we continued to follow our “bottom-up” investment strategy, carefully evaluating each issuer to become familiar with its financial position and to assess whether the bond’s return potential was commensurate with the risks involved with holding the securities.
Market conditions in California periodically offered attractive but temporary buying opportunities. California was a prolific issuer of debt during the Fund’s fiscal year, as the state sought to manage its serious budget challenges. This gave us the opportunity to buy existing bonds at what we considered attractive prices. We took advantage of this situation twice during the fiscal year, and in both cases our willingness to invest against the grain was rewarded: we generated additional income within Delaware Tax-Free California Fund, and the bonds the team selected for purchase subsequently rose off of their depressed levels.
Notable sectors and securities
As we mentioned above, lower-rated bonds generally outperformed higher-rated issues throughout the majority of the Funds’ fiscal year. As a result, many of the individual bonds that made the strongest performance contributions across all five Funds were lower-rated issues. The best-performing sectors were often those with a significant amount of lower-rated bond issuance. In
5
Portfolio management review
Delaware multiple state tax-free funds
Delaware multiple state tax-free funds
a favorable market environment for tax-exempt debt, even the worst performers tended to earn modestly positive returns. Generally speaking, the bonds that lagged the overall municipal market were those with higher credit ratings (meaning less credit risk) and shorter maturities (meaning less interest rate risk). With interest rates declining, municipal bond investors looked for ways to capture additional levels of income, leading them toward lower-rated, longer-dated bonds.
Within Delaware Tax-Free Colorado Fund and Delaware Tax-Free Arizona Fund, the best-performing group overall was industrial development revenue bonds, a sector that featured a number of securities benefiting from their lower credit ratings and relatively higher yields. The top contributors overall within Delaware Tax-Free California Fund included special-tax bonds, which are projects funded by a dedicated tax stream. The lease sector made the strongest performance contribution to total return within Delaware Tax-Free New York Fund, while utility bonds did the best as a group within Delaware Tax-Free Idaho Fund.
Across all five Funds, nearly all of the most notable individual performers were lower-rated bonds. Within Delaware Tax-Free Arizona Fund, for example, a Pima County Industrial Development Authority revenue bond for a charter school in Tucson was among the strongest performers. The bond, rated BBB- by S&P, benefited from its lower credit rating in an environment of increased risk tolerance.
Delaware Tax-Free Arizona Fund and Delaware Tax-Free Idaho Fund were supported by a Puerto Rico sales-tax bond. Bonds issued by U.S. territories are generally fully tax-exempt for residents of all 50 states. Territorial bonds can help provide valuable portfolio diversification, especially in Funds for smaller states such as Idaho, where it can be difficult to obtain a wide variety of securities. We were attracted to the relatively high yields offered by this bond, and felt confident about the territory’s financial situation. Of course, diversification may not protect against market risk.
Delaware Tax-Free Idaho Fund also benefited from BB-rated (by S&P) Idaho Housing and Finance Association charter school bonds. Despite these securities’ below-investment-grade credit rating, we were very comfortable with their credit quality and felt they offered favorable performance potential relative to their risk.
Topping the list of performers within Delaware Tax-Free California Fund were California Statewide Community Development Authority bonds for Valley Care Hospital, an unrated bond issue with a 2031 maturity date. Land-development district bonds issued by the Fremont Community Development District aided the Fund as well.
Delaware Tax-Free Colorado Fund saw strong results from its holdings in nonrated Colorado Health Facility for Christian Living Communities continuing care retirement community (CCRC) bonds. CCRCs are residential communities for seniors, ranging from independent-living to skilled-nursing-care facilities. In addition, Puerto Rico infrastructure bonds rated BBB+ by S&P with a maturity date of 2046 were among the strongest performers within the Fund.
The leading performers within Delaware Tax-Free New York Fund included industrial development revenue bonds issued on behalf of ARRIS, a communications
6
technology company, and New York Industrial Authority bonds for Orange County Regional Medical Center.
As we mentioned, even the weakest-performing bonds across the Funds posted modestly positive results — an indication of the highly favorable market conditions enjoyed by municipal bond investors during the Funds’ fiscal year. The sector making the smallest contribution to total return across the Funds was prerefunded bonds. These bonds are short-maturity issues, and, because they are typically backed by U.S. Treasury bonds or other very high-quality securities, they are considered high in credit quality. In an environment in which investors preferred lower-quality to higher-quality bonds, and longer-dated to shorter-dated issues, prerefunded bonds were left behind.
Within Delaware Tax-Free Arizona Fund, for example, the weakest contributors included prerefunded University of Arizona bonds due in June 2021. Colorado Educational and Cultural Facility bonds for the University of Denver, due in March 2012, were among the weakest contributors within Delaware Tax-Free Colorado Fund; University of Idaho bonds coming due in April 2031 brought up the rear within Delaware Tax-Free Idaho Fund, while Albany Parking Authority bonds, scheduled to mature in July 2025, were among the weakest contributors within Delaware Tax-Free New York Fund.
Delaware Tax-Free California Fund was most hindered by California Community Development Authority multifamily housing bonds. Although these were not prerefunded bonds, these AAA-rated securities faced a near-term call date, so they lagged other bonds whose prices reflected a longer expected holding period.
7
| Performance summaries | |
| Delaware Tax-Free Arizona Fund | August 31, 2010 |
The performance data quoted represent past performance; past performance does not guarantee future results. Investment return and principal value will fluctuate so your shares, when redeemed, may be worth more or less than their original cost. Please obtain the performance data current for the most recent month end by calling 800 523-1918 or visiting our Web site at www.delawareinvestments.com/performance. Current performance may be lower or higher than the performance data quoted.
Carefully consider the Fund’s investment objectives, risk factors, charges, and expenses before investing. This and other information can be found in the Fund’s prospectus and, if available, its summary prospectus, which may be obtained by visiting www.delawareinvestments.com or calling 800 523-1918. Investors should read the prospectus and, if available, the summary prospectus carefully before investing.
| Fund performance | Average annual total returns through Aug. 31, 2010 | |||||||||||
| 1 year | 5 years | 10 years | ||||||||||
| Class A (Est. April 1, 1991) | ||||||||||||
| Excluding sales charge | +10.27% | +4.48% | +5.19% | |||||||||
| Including sales charge | +5.33% | +3.53% | +4.70% | |||||||||
| Class B (Est. March 10, 1995) | ||||||||||||
| Excluding sales charge | +9.35% | +3.68% | +4.56% | |||||||||
| Including sales charge | +5.35% | +3.42% | +4.56% | |||||||||
| Class C (Est. May 26, 1994) | ||||||||||||
| Excluding sales charge | +9.43% | +3.71% | +4.42% | |||||||||
| Including sales charge | +8.43% | +3.71% | +4.42% | |||||||||
Returns reflect the reinvestment of all distributions and any applicable sales charges as noted in the following paragraphs.
Performance for Class B and C shares, excluding sales charges, assumes either that contingent deferred sales charges did not apply or that the investment was not redeemed.
Expense limitations were in effect for certain classes during some of the periods shown in the “Fund performance” chart and in the “Performance of a $10,000 investment” chart. The current expenses for each class are listed on the “Fund expense ratios” chart. (Note that all charts and graphs referred to in the “Performance summaries” section of this report are found on pages 8 through 10.) Performance would have been lower had the expense limitations not been in effect.
The Fund offers Class A, B, and C shares.
Class A shares are sold with a maximum front-end sales charge of up to 4.50%, and have an annual distribution and service fee of up to 0.25% of average daily net assets.
8
Class B shares may be purchased only through dividend reinvestment and certain permitted exchanges as described in the prospectus. Please see the prospectus for additional information on Class B purchase and sales charges. Class B shares have a contingent deferred sales charge that declines from 4.00% to zero depending on the period of time the shares are held.
Class B shares will automatically convert to Class A shares on a quarterly basis approximately eight years after purchase. They are also subject to an annual distribution and service fee of up to 1.00% of average daily net assets.
Ten-year performance figures for Class B shares reflect conversion to Class A shares after approximately eight years.
Class C shares are sold with a contingent deferred sales charge of 1.00% if redeemed during the first 12 months. They are also subject to an annual distribution and service fee of up to 1.00% of average daily net assets.
The “Fund performance” table and the “Performance of a $10,000 investment” graph do not reflect the deduction of taxes the shareholder would pay on Fund distributions or redemptions of Fund shares.
Fixed income securities and bond funds can lose value, and investors can lose principal, as interest rates rise. They also may be affected by economic conditions that hinder an issuer’s ability to make interest and principal payments on its debt.
The Fund may also be subject to prepayment risk, the risk that the principal of a fixed income security that is held by the Fund may be prepaid prior to maturity, potentially forcing the Fund to reinvest that money at a lower interest rate.
High yielding, noninvestment grade bonds (junk bonds) involve higher risk than investment grade bonds.
Substantially all dividend income derived from tax-free funds is exempt from federal income tax. Some income may be subject to the federal alternative minimum tax (AMT) that applies to certain investors. Capital gains, if any, are taxable.
Funds that invest primarily in one state may be more susceptible to the economic, regulatory, and other factors of that state than funds that invest more broadly.
The Fund’s expense ratios, as described in the most recent prospectus, are disclosed in the following “Fund expense ratios” chart.
| Fund expense ratios | Class A | Class B | Class C | |||
| Total annual operating expenses | 0.91% | 1.66% | 1.66% | |||
| (without fee waivers) | ||||||
| Net expenses | 0.91% | 1.66% | 1.66% | |||
| (including fee waivers, if any) | ||||||
| Type of waiver | n/a | n/a | n/a |
9
Performance summaries
Delaware Tax-Free Arizona Fund
Delaware Tax-Free Arizona Fund
Performance of a $10,000 investment
Average annual total returns from Aug. 31, 2000, through Aug. 31, 2010
| For period beginning Aug. 31, 2000, through Aug. 31, 2010 | Starting value | Ending value | ||
| Barclays Capital Municipal Bond Index | $10,000 | $17,400 | ||
| Delaware Tax-Free Arizona Fund — Class A Shares | $9,550 | $15,822 | ||
The chart assumes $10,000 invested in the Fund on Aug. 31, 2000, and includes the effect of a 4.50% front-end sales charge and the reinvestment of all distributions. Please note additional details on these fees in the “Performance summaries” section of this report, which includes pages 8 through 10.
The chart also assumes $10,000 invested in the Barclays Capital Municipal Bond Index as of Aug. 31, 2000.
The Barclays Capital Municipal Bond Index measures the total return performance of the long-term, investment grade tax-exempt bond market.
Index performance returns do not reflect any management fees, transaction costs, or expenses. Indices are unmanaged and one cannot invest directly in an index. Past performance is not a guarantee of future results.
Performance of other Fund classes will vary due to different charges and expenses.
The “Fund performance” chart and the “Performance of a $10,000 investment” graph do not reflect the deduction of taxes shareholders would pay on Fund distributions or redemptions of Fund shares.
| Nasdaq symbols | CUSIPs | ||||
| Class A | VAZIX | 928916204 | |||
| Class B | DVABX | 928928639 | |||
| Class C | DVACX | 928916501 |
10
| Delaware Tax-Free California Fund | August 31, 2010 |
The performance data quoted represent past performance; past performance does not guarantee future results. Investment return and principal value will fluctuate so your shares, when redeemed, may be worth more or less than their original cost. Please obtain the performance data current for the most recent month end by calling 800 523-1918 or visiting our Web site at www.delawareinvestments.com/performance. Current performance may be lower or higher than the performance data quoted.
Carefully consider the Fund’s investment objectives, risk factors, charges, and expenses before investing. This and other information can be found in the Fund’s prospectus and, if available, its summary prospectus, which may be obtained by visiting www.delawareinvestments.com or calling 800 523-1918. Investors should read the prospectus and, if available, the summary prospectus carefully before investing.
| Fund performance | Average annual total returns through Aug. 31, 2010 | ||||||
| 1 year | 5 years | 10 years | |||||
| Class A (Est. March 2, 1995) | |||||||
| Excluding sales charge | +13.92% | +4.42% | +5.66% | ||||
| Including sales charge | +8.80% | +3.46% | +5.18% | ||||
| Class B (Est. Aug. 23, 1995) | |||||||
| Excluding sales charge | +12.93% | +3.63% | +5.01% | ||||
| Including sales charge | +8.93% | +3.37% | +5.01% | ||||
| Class C (Est. April 9, 1996) | |||||||
| Excluding sales charge | +13.06% | +3.65% | +4.87% | ||||
| Including sales charge | +12.06% | +3.65% | +4.87% | ||||
Returns reflect the reinvestment of all distributions and any applicable sales charges as noted in the following paragraphs.
Performance for Class B and C shares, excluding sales charges, assumes either that contingent deferred sales charges did not apply or that the investment was not redeemed.
Expense limitations were in effect during the periods shown in the “Fund performance” chart and in the “Performance of a $10,000 investment” chart. The current expenses for each class are listed on the “Fund expense ratios” chart. (Note that all charts and graphs referred to in the “Performance summaries” section of this report are found on pages 11 through 13.) Performance would have been lower had the expense limitations not been in effect.
The Fund offers Class A, B, and C shares.
Class A shares are sold with a maximum front-end sales charge of up to 4.50%, and have an annual distribution and service fee of up to 0.25% of average daily net assets.
Class B shares may be purchased only through dividend reinvestment and certain permitted exchanges as described in the prospectus.
11
Performance summaries
Delaware Tax-Free California Fund
Delaware Tax-Free California Fund
Please see the prospectus for additional information on Class B purchase and sales charges. Class B shares have a contingent deferred sales charge that declines from 4.00% to zero depending on the period of time the shares are held.
Class B shares will automatically convert to Class A shares on a quarterly basis approximately eight years after purchase. They are also subject to an annual distribution and service fee of up to 1.00% of average daily net assets.
Ten-year performance figures for Class B shares reflect conversion to Class A shares after approximately eight years.
Class C shares are sold with a contingent deferred sales charge of 1.00% if redeemed during the first 12 months. They are also subject to an annual distribution and service fee of up to 1.00% of average daily net assets.
The “Fund performance” table and the “Performance of a $10,000 investment” graph do not reflect the deduction of taxes the shareholder would pay on Fund distributions or redemptions of Fund shares.
Fixed income securities and bond funds can lose value, and investors can lose principal, as interest rates rise. They also may be affected by economic conditions that hinder an issuer’s ability to make interest and principal payments on its debt.
The Fund may also be subject to prepayment risk, the risk that the principal of a fixed income security that is held by the Fund may be prepaid prior to maturity, potentially forcing the Fund to reinvest that money at a lower interest rate.
High yielding, noninvestment grade bonds (junk bonds) involve higher risk than investment grade bonds.
Substantially all dividend income derived from tax-free funds is exempt from federal income tax. Some income may be subject to the federal alternative minimum tax (AMT) that applies to certain investors. Capital gains, if any, are taxable.
Funds that invest primarily in one state may be more susceptible to the economic, regulatory, and other factors of that state than funds that invest more broadly.
The Fund’s expense ratios, as described in the most recent prospectus, are disclosed in the following “Fund expense ratios” chart. Delaware Investments has voluntarily agreed to reimburse certain expenses and/or waive certain fees in order to prevent total fund operating expenses from exceeding 0.57% of the Fund’s average daily net assets. Please see the most recent prospectus and any applicable supplement(s) for additional information on these fee waivers and/or reimbursements.
| Fund expense ratios | Class A | Class B | Class C | |||
| Total annual operating expenses | 0.97% | 1.72% | 1.72% | |||
| (without fee waivers) | ||||||
| Net expenses | 0.82% | 1.57% | 1.57% | |||
| (including fee waivers, if any) | ||||||
| Type of waiver | Voluntary | Voluntary | Voluntary |
12
Performance of a $10,000 investment
Average annual total returns from Aug. 31, 2000, through Aug. 31, 2010
Average annual total returns from Aug. 31, 2000, through Aug. 31, 2010
| For period beginning Aug. 31, 2000, through Aug. 31, 2010 | Starting value | Ending value | ||
| Barclays Capital Municipal Bond Index | $10,000 | $17,400 | ||
| Delaware Tax-Free California Fund — Class A Shares | $9,550 | $16,543 | ||
The chart assumes $10,000 invested in the Fund on Aug. 31, 2000, and includes the effect of a 4.50% front-end sales charge and the reinvestment of all distributions. Please note additional details on these fees in the “Performance summaries” section of this report, which includes pages 11 through 13.
The chart also assumes $10,000 invested in the Barclays Capital Municipal Bond Index as of Aug. 31, 2000.
The Barclays Capital Municipal Bond Index measures the total return performance of the long-term, investment grade tax-exempt bond market.
Index performance returns do not reflect any management fees, transaction costs, or expenses. Indices are unmanaged and one cannot invest directly in an index. Past performance is not a guarantee of future results.
Performance of other Fund classes will vary due to different charges and expenses.
The “Fund performance” chart and the “Performance of a $10,000 investment” graph do not reflect the deduction of taxes shareholders would pay on Fund distributions or redemptions of Fund shares.
| Nasdaq symbols | CUSIPs | ||||
| Class A | DVTAX | 928928829 | |||
| Class B | DVTFX | 928928811 | |||
| Class C | DVFTX | 928928795 |
13
| Performance summaries | |
| Delaware Tax-Free Colorado Fund | August 31, 2010 |
The performance data quoted represent past performance; past performance does not guarantee future results. Investment return and principal value will fluctuate so your shares, when redeemed, may be worth more or less than their original cost. Please obtain the performance data current for the most recent month end by calling 800 523-1918 or visiting our Web site at www.delawareinvestments.com/performance. Current performance may be lower or higher than the performance data quoted.
Carefully consider the Fund’s investment objectives, risk factors, charges, and expenses before investing. This and other information can be found in the Fund’s prospectus and, if available, its summary prospectus, which may be obtained by visiting www.delawareinvestments.com or calling 800 523-1918. Investors should read the prospectus and, if available, the summary prospectus carefully before investing.
| Fund performance | Average annual total returns through Aug. 31, 2010 | |||||||
| 1 year | 5 years | 10 years | ||||||
| Class A (Est. April 23, 1987) | ||||||||
| Excluding sales charge | +10.74% | +4.48% | +5.22% | |||||
| Including sales charge | +5.75% | +3.52% | +4.74% | |||||
| Class B (Est. March 22, 1995) | ||||||||
| Excluding sales charge | +9.91% | +3.72% | +4.59% | |||||
| Including sales charge | +5.91% | +3.46% | +4.59% | |||||
| Class C (Est. May 6, 1994) | ||||||||
| Excluding sales charge | +9.90% | +3.71% | +4.45% | |||||
| Including sales charge | +8.90% | +3.71% | +4.45% | |||||
Returns reflect the reinvestment of all distributions and any applicable sales charges as noted in the following paragraphs.
Performance for Class B and C shares, excluding sales charges, assumes either that contingent deferred sales charges did not apply or that the investment was not redeemed.
Expense limitations were in effect for certain classes during some of the periods shown in the “Fund performance” chart and in the “Performance of a $10,000 investment” chart. The current expenses for each class are listed on the “Fund expense ratios” chart. (Note that all charts and graphs referred to in the “Performance summaries” section of this report are found on pages 14 through 16.) Performance would have been lower had the expense limitations not been in effect.
The Fund offers Class A, B, and C shares.
Class A shares are sold with a maximum front-end sales charge of up to 4.50%, and have an annual distribution and service fee of up to 0.25% of average daily net assets.
Class B shares may be purchased only through dividend reinvestment and certain permitted exchanges as described in the prospectus. Please see the prospectus for additional information on Class B purchase and sales charges. Class B shares have a contingent deferred sales charge that declines from 4.00%
14
to zero depending on the period of time the shares are held.
Class B shares will automatically convert to Class A shares on a quarterly basis approximately eight years after purchase. They are also subject to an annual distribution and service fee of up to 1.00% of average daily net assets.
Ten-year performance figures for Class B shares reflect conversion to Class A shares after approximately eight years.
Class C shares are sold with a contingent deferred sales charge of 1.00% if redeemed during the first 12 months. They are also subject to an annual distribution and service fee of up to 1.00% of average daily net assets.
The “Fund performance” table and the “Performance of a $10,000 investment” graph do not reflect the deduction of taxes the shareholder would pay on Fund distributions or redemptions of Fund shares.
Fixed income securities and bond funds can lose value, and investors can lose principal, as interest rates rise. They also may be affected by economic conditions that hinder an issuer’s ability to make interest and principal payments on its debt.
The Fund may also be subject to prepayment risk, the risk that the principal of a fixed income security that is held by the Fund may be prepaid prior to maturity, potentially forcing the Fund to reinvest that money at a lower interest rate.
High yielding, noninvestment grade bonds (junk bonds) involve higher risk than investment grade bonds.
The Fund may invest in derivatives, which may involve additional expenses and are subject to risk, including the risk that an underlying security or securities index moves in the opposite direction from what the portfolio manager anticipated. A derivative transaction depends upon the counterparties’ ability to fulfill their contractual obligations.
Substantially all dividend income derived from tax-free funds is exempt from federal income tax. Some income may be subject to the federal alternative minimum tax (AMT) that applies to certain investors. Capital gains, if any, are taxable.
Funds that invest primarily in one state may be more susceptible to the economic, regulatory, and other factors of that state than funds that invest more broadly.
The Fund’s expense ratios, as described in the most recent prospectus, are disclosed in the following “Fund expense ratios” chart.
| Fund expense ratios | Class A | Class B | Class C | ||||||
| Total annual operating expenses | 0.95 | % | 1.70 | % | 1.70 | % | |||
| (without fee waivers) | |||||||||
| Net expenses | 0.95 | % | 1.70 | % | 1.70 | % | |||
| (including fee waivers, if any) | |||||||||
| Type of waiver | n/a | n/a | n/a | ||||||
15
Performance summaries
Delaware Tax-Free Colorado Fund
Delaware Tax-Free Colorado Fund
Performance of a $10,000 investment
Average annual total returns from Aug. 31, 2000, through Aug. 31, 2010
Average annual total returns from Aug. 31, 2000, through Aug. 31, 2010
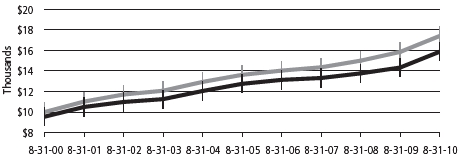
| For period beginning Aug. 31, 2000, through Aug. 31, 2010 | Starting value | Ending value | ||
| Barclays Capital Municipal Bond Index | $10,000 | $17,400 | ||
| Delaware Tax-Free Colorado Fund — Class A Shares | $9,550 | $15,870 | ||
The chart assumes $10,000 invested in the Fund on Aug. 31, 2000, and includes the effect of a 4.50% front-end sales charge and the reinvestment of all distributions. Please note additional details on these fees in the “Performance summaries” section of this report, which includes pages 14 through 16.
The chart also assumes $10,000 invested in the Barclays Capital Municipal Bond Index as of Aug. 31, 2000.
The Barclays Capital Municipal Bond Index measures the total return performance of the long-term, investment grade tax-exempt bond market.
Index performance returns do not reflect any management fees, transaction costs, or expenses. Indices are unmanaged and one cannot invest directly in an index. Past performance is not a guarantee of future results.
Performance of other Fund classes will vary due to different charges and expenses.
The “Fund performance” chart and the “Performance of a $10,000 investment” graph do not reflect the deduction of taxes shareholders would pay on Fund distributions or redemptions of Fund shares.
| Nasdaq symbols | CUSIPs | ||||
| Class A | VCTFX | 928920107 | |||
| Class B | DVBTX | 928928787 | |||
| Class C | DVCTX | 92907R101 |
16
| Delaware Tax-Free Idaho Fund | August 31, 2010 |
The performance data quoted represent past performance; past performance does not guarantee future results. Investment return and principal value will fluctuate so your shares, when redeemed, may be worth more or less than their original cost. Please obtain the performance data current for the most recent month end by calling 800 523-1918 or visiting our Web site at www.delawareinvestments.com/performance. Current performance may be lower or higher than the performance data quoted.
Carefully consider the Fund’s investment objectives, risk factors, charges, and expenses before investing. This and other information can be found in the Fund’s prospectus and, if available, its summary prospectus, which may be obtained by visiting www.delawareinvestments.com or calling 800 523-1918. Investors should read the prospectus and, if available, the summary prospectus carefully before investing.
| Fund performance | Average annual total returns through Aug. 31, 2010 | ||||||
| 1 year | 5 years | 10 years | |||||
| Class A (Est. Jan. 4, 1995) | |||||||
| Excluding sales charge | +9.44% | +4.80% | +5.51% | ||||
| Including sales charge | +4.53% | +3.83% | +5.02% | ||||
| Class B (Est. March 16, 1995) | |||||||
| Excluding sales charge | +8.64% | +4.03% | +4.87% | ||||
| Including sales charge | +4.64% | +3.77% | +4.87% | ||||
| Class C (Est. Jan. 11, 1995) | |||||||
| Excluding sales charge | +8.63% | +4.00% | +4.72% | ||||
| Including sales charge | +7.63% | +4.00% | +4.72% | ||||
Returns reflect the reinvestment of all distributions and any applicable sales charges as noted in the following paragraphs.
Performance for Class B and C shares, excluding sales charges, assumes either that contingent deferred sales charges did not apply or that the investment was not redeemed.
Expense limitations were in effect for certain classes during some of the periods shown in the “Fund performance” chart and in the “Performance of a $10,000 investment” chart. The current expenses for each class are listed on the “Fund expense ratios” chart. (Note that all charts and graphs referred to in the “Performance summaries” section of this report are found on pages 17 through 19.) Performance would have been lower had the expense limitations not been in effect.
The Fund offers Class A, B, and C shares.
Class A shares are sold with a maximum front-end sales charge of up to 4.50%, and have an annual distribution and service fee of up to 0.25% of average daily net assets.
Class B shares may be purchased only through dividend reinvestment and certain permitted exchanges as described in the prospectus.
17
Performance summaries
Delaware Tax-Free Idaho Fund
Delaware Tax-Free Idaho Fund
Please see the prospectus for additional information on Class B purchase and sales charges. Class B shares have a contingent deferred sales charge that declines from 4.00% to zero depending on the period of time the shares are held.
Class B shares will automatically convert to Class A shares on a quarterly basis approximately eight years after purchase. They are also subject to an annual distribution and service fee of up to 1.00% of average daily net assets.
Ten-year performance figures for Class B shares reflect conversion to Class A shares after approximately eight years.
Class C shares are sold with a contingent deferred sales charge of 1.00% if redeemed during the first 12 months. They are also subject to an annual distribution and service fee of up to 1.00% of average daily net assets.
The “Fund performance” table and the “Performance of a $10,000 investment” graph do not reflect the deduction of taxes the shareholder would pay on Fund distributions or redemptions of Fund shares.
Fixed income securities and bond funds can lose value, and investors can lose principal, as interest rates rise. They also may be affected by economic conditions that hinder an issuer’s ability to make interest and principal payments on its debt.
The Fund may also be subject to prepayment risk, the risk that the principal of a fixed income security that is held by the Fund may be prepaid prior to maturity, potentially forcing the Fund to reinvest that money at a lower interest rate.
High yielding, noninvestment grade bonds (junk bonds) involve higher risk than investment grade bonds.
Substantially all dividend income derived from tax-free funds is exempt from federal income tax. Some income may be subject to the federal alternative minimum tax (AMT) that applies to certain investors. Capital gains, if any, are taxable.
Funds that invest primarily in one state may be more susceptible to the economic, regulatory, and other factors of that state than funds that invest more broadly.
The Fund’s expense ratios, as described in the most recent prospectus, are disclosed in the following “Fund expense ratios” chart.
| Fund expense ratios | Class A | Class B | Class C | ||||||
| Total annual operating expenses | 0.96 | % | 1.71 | % | 1.71 | % | |||
| (without fee waivers) | |||||||||
| Net expenses | 0.96 | % | 1.71 | % | 1.71 | % | |||
| (including fee waivers, if any) | |||||||||
| Type of waiver | n/a | n/a | n/a | ||||||
18
Performance of a $10,000 investment
Average annual total returns from Aug. 31, 2000, through Aug. 31, 2010
Average annual total returns from Aug. 31, 2000, through Aug. 31, 2010
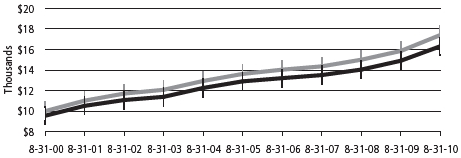
| For period beginning Aug. 31, 2000, through Aug. 31, 2010 | Starting value | Ending value | ||
| Barclays Capital Municipal Bond Index | $10,000 | $17,400 | ||
| Delaware Tax-Free Idaho Fund — Class A Shares | $9,550 | $16,307 | ||
The chart assumes $10,000 invested in the Fund on Aug. 31, 2000, and includes the effect of a 4.50% front-end sales charge and the reinvestment of all distributions. Please note additional details on these fees in the “Performance summaries” section of this report, which includes pages 17 through 19.
The chart also assumes $10,000 invested in the Barclays Capital Municipal Bond Index as of Aug. 31, 2000.
The Barclays Capital Municipal Bond Index measures the total return performance of the long-term, investment grade tax-exempt bond market.
Index performance returns do not reflect any management fees, transaction costs, or expenses. Indices are unmanaged and one cannot invest directly in an index. Past performance is not a guarantee of future results.
Performance of other Fund classes will vary due to different charges and expenses.
The “Fund performance” chart and the “Performance of a $10,000 investment” graph do not reflect the deduction of taxes shareholders would pay on Fund distributions or redemptions of Fund shares.
| Nasdaq symbols | CUSIPs | ||||
| Class A | VIDAX | 928928704 | |||
| Class B | DVTIX | 928928746 | |||
| Class C | DVICX | 928928803 |
19
| Performance summaries | |
| Delaware Tax-Free New York Fund | August 31, 2010 |
The performance data quoted represent past performance; past performance does not guarantee future results. Investment return and principal value will fluctuate so your shares, when redeemed, may be worth more or less than their original cost. Please obtain the performance data current for the most recent month end by calling 800 523-1918 or visiting our Web site at www.delawareinvestments.com/performance. Current performance may be lower or higher than the performance data quoted.
Carefully consider the Fund’s investment objectives, risk factors, charges, and expenses before investing. This and other information can be found in the Fund’s prospectus and, if available, its summary prospectus, which may be obtained by visiting www.delawareinvestments.com or calling 800 523-1918. Investors should read the prospectus and, if available, the summary prospectus carefully before investing.
| Fund performance | Average annual total returns through Aug. 31, 2010 | |||||||
| 1 year | 5 years | 10 years | ||||||
| Class A (Est. Nov. 6, 1987) | ||||||||
| Excluding sales charge | +11.02% | +5.02% | +5.84% | |||||
| Including sales charge | +6.05% | +4.07% | +5.36% | |||||
| Class B (Est. Nov. 14, 1994) | ||||||||
| Excluding sales charge | +10.21% | +4.25% | +5.20% | |||||
| Including sales charge | +6.21% | +3.99% | +5.20% | |||||
| Class C (Est. April 26, 1995) | ||||||||
| Excluding sales charge | +10.20% | +4.25% | +5.05% | |||||
| Including sales charge | +9.20% | +4.25% | +5.05% | |||||
Returns reflect the reinvestment of all distributions and any applicable sales charges as noted in the following paragraphs.
Performance for Class B and C shares, excluding sales charges, assumes either that contingent deferred sales charges did not apply or that the investment was not redeemed.
Expense limitations were in effect for certain classes during the periods shown in the “Fund performance” chart and in the “Performance of a $10,000 investment” chart. The current expenses for each class are listed on the “Fund expense ratios” chart. (Note that all charts and graphs referred to in the “Performance summaries” section of this report are found on pages 20 through 22.) Performance would have been lower had the expense limitations not been in effect.
The Fund offers Class A, B, and C shares.
Class A shares are sold with a maximum front-end sales charge of up to 4.50%, and have an annual distribution and service fee of up to 0.25% of average daily net assets.
Class B shares may be purchased only through dividend reinvestment and certain permitted exchanges as described in the prospectus.
20
Please see the prospectus for additional information on Class B purchase and sales charges. Class B shares have a contingent deferred sales charge that declines from 4.00% to zero depending on the period of time the shares are held.
Class B shares will automatically convert to Class A shares on a quarterly basis approximately eight years after purchase. They are also subject to an annual distribution and service fee of up to 1.00% of average daily net assets.
Ten-year performance figures for Class B shares reflect conversion to Class A shares after approximately eight years.
Class C shares are sold with a contingent deferred sales charge of 1.00% if redeemed during the first 12 months. They are also subject to an annual distribution and service fee of up to 1.00% of average daily net assets.
The “Fund performance” table and the “Performance of a $10,000 investment” graph do not reflect the deduction of taxes the shareholder would pay on Fund distributions or redemptions of Fund shares.
Fixed income securities and bond funds can lose value, and investors can lose principal, as interest rates rise. They also may be affected by economic conditions that hinder an issuer’s ability to make interest and principal payments on its debt.
The Fund may also be subject to prepayment risk, the risk that the principal of a fixed income security that is held by the Fund may be prepaid prior to maturity, potentially forcing the Fund to reinvest that money at a lower interest rate.
High yielding, noninvestment grade bonds (junk bonds) involve higher risk than investment grade bonds.
Substantially all dividend income derived from tax-free funds is exempt from federal income tax. Some income may be subject to the federal alternative minimum tax (AMT) that applies to certain investors. Capital gains, if any, are taxable.
Funds that invest primarily in one state may be more susceptible to the economic, regulatory, and other factors of that state than funds that invest more broadly.
The Fund’s expense ratios, as described in the most recent prospectus, are disclosed in the following “Fund expense ratios” chart. Delaware Investments has voluntarily agreed to reimburse certain expenses and/or waive certain fees in order to prevent total fund operating expenses from exceeding 0.55% of the Fund’s average daily net assets. Please see the most recent prospectus and any applicable supplement(s) for additional information on these fee waivers and/or reimbursements.
| Fund expense ratios | Class A | Class B | Class C | |||
| Total annual operating expenses | 1.10% | 1.85% | 1.85% | |||
| (without fee waivers) | ||||||
| Net expenses | 0.80% | 1.55% | 1.55% | |||
| (including fee waivers, if any) | ||||||
| Type of waiver | Voluntary | Voluntary | Voluntary |
21
Performance summaries
Delaware Tax-Free New York Fund
Delaware Tax-Free New York Fund
Performance of a $10,000 investment
Average annual total returns from Aug. 31, 2000, through Aug. 31, 2010
Average annual total returns from Aug. 31, 2000, through Aug. 31, 2010
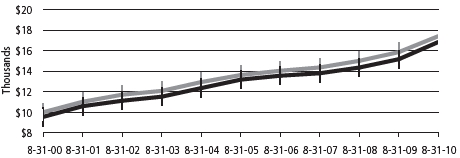
| For period beginning Aug. 31, 2000, through Aug. 31, 2010 | Starting value | Ending value | ||
| Barclays Capital Municipal Bond Index | $10,000 | $17,400 | ||
| Delaware Tax-Free New York Fund — Class A Shares | $9,550 | $16,832 | ||
The chart assumes $10,000 invested in the Fund on Aug. 31, 2000, and includes the effect of a 4.50% front-end sales charge and the reinvestment of all distributions. Please note additional details on these fees in the “Performance summaries” section of this report, which includes pages 20 through 22.
The chart also assumes $10,000 invested in the Barclays Capital Municipal Bond Index as of Aug. 31, 2000.
The Barclays Capital Municipal Bond Index measures the total return performance of the long-term, investment grade tax-exempt bond market.
Index performance returns do not reflect any management fees, transaction costs, or expenses. Indices are unmanaged and one cannot invest directly in an index. Past performance is not a guarantee of future results.
Performance of other Fund classes will vary due to different charges and expenses.
The “Fund performance” chart and the “Performance of a $10,000 investment” graph do not reflect the deduction of taxes shareholders would pay on Fund distributions or redemptions of Fund shares.
| Nasdaq symbols | CUSIPs | ||||
| Class A | FTNYX | 928928274 | |||
| Class B | DVTNX | 928928266 | |||
| Class C | DVFNX | 928928258 |
22
Disclosure of Fund expenses
For the six-month period March 1, 2010 to August 31, 2010
For the six-month period March 1, 2010 to August 31, 2010
As a shareholder of a Fund, you incur two types of costs: (1) transaction costs, including sales charges (loads) on purchase payments, reinvested dividends, or other distributions; redemption fees; and exchange fees; and (2) ongoing costs, including management fees; distribution and/or service (12b-1) fees; and other Fund expenses. These following examples are intended to help you understand your ongoing costs (in dollars) of investing in a Fund and to compare these costs with the ongoing costs of investing in other mutual funds.
The examples are based on an investment of $1,000 invested at the beginning of the period and held for the entire six-month period from March 1, 2010 to August 31, 2010.
Actual expenses
The first section of the tables shown, “Actual Fund return,” provides information about actual account values and actual expenses. You may use the information in this section of the table, together with the amount you invested, to estimate the expenses that you paid over the period. Simply divide your account value by $1,000 (for example, an $8,600 account value divided by $1,000 = 8.6), then multiply the result by the number in the first section under the heading entitled “Expenses Paid During Period” to estimate the expenses you paid on your account during this period.
Hypothetical example for comparison purposes
The second section of the tables shown, “Hypothetical 5% return,” provides information about hypothetical account values and hypothetical expenses based on the Funds’ actual expense ratios and an assumed rate of return of 5% per year before expenses, which is not the Funds’ actual return. The hypothetical account values and expenses may not be used to estimate the actual ending account balance or expenses you paid for the period. You may use this information to compare the ongoing costs of investing in the Funds and other funds. To do so, compare this 5% hypothetical example with the 5% hypothetical examples that appear in the shareholder reports of the other funds.
Please note that the expenses shown in the tables are meant to highlight your ongoing costs only and do not reflect any transactional costs, such as sales charges (loads), redemption fees, or exchange fees. Therefore, the second section of each table is useful in comparing ongoing costs only, and will not help you determine the relative total costs of owning different funds. In addition, if these transactional costs were included, your costs would have been higher. The Delaware Tax-Free California Fund and Delaware Tax-Free New York Fund’s expenses shown in the tables reflect fee waivers in effect. The expenses shown in each table assume reinvestment of all dividends and distributions.
23
Disclosure of Fund expenses
Delaware Tax-Free Arizona Fund
Expense analysis of an investment of $1,000
Expense analysis of an investment of $1,000
| Beginning | Ending | Expenses | |||||||||||||
| Account Value | Account Value | Annualized | Paid During Period | ||||||||||||
| 3/1/10 | 8/31/10 | Expense Ratio | 3/1/10 to 8/31/10* | ||||||||||||
| Actual Fund return | |||||||||||||||
| Class A | $ | 1,000.00 | $ | 1,057.50 | 0.91 | % | $ | 4.72 | |||||||
| Class B | 1,000.00 | 1,052.60 | 1.66 | % | 8.59 | ||||||||||
| Class C | 1,000.00 | 1,053.40 | 1.66 | % | 8.59 | ||||||||||
| Hypothetical 5% return (5% return before expenses) | |||||||||||||||
| Class A | $ | 1,000.00 | $ | 1,020.62 | 0.91 | % | $ | 4.63 | |||||||
| Class B | 1,000.00 | 1,016.84 | 1.66 | % | 8.44 | ||||||||||
| Class C | 1,000.00 | 1,016.84 | 1.66 | % | 8.44 | ||||||||||
Delaware Tax-Free California Fund
Expense analysis of an investment of $1,000
Expense analysis of an investment of $1,000
| Beginning | Ending | Expenses | |||||||||||||
| Account Value | Account Value | Annualized | Paid During Period | ||||||||||||
| 3/1/10 | 8/31/10 | Expense Ratio | 3/1/10 to 8/31/10* | ||||||||||||
| Actual Fund return | |||||||||||||||
| Class A | $ | 1,000.00 | $ | 1,071.50 | 0.82 | % | $ | 4.28 | |||||||
| Class B | 1,000.00 | 1,066.30 | 1.57 | % | 8.18 | ||||||||||
| Class C | 1,000.00 | 1,067.40 | 1.57 | % | 8.18 | ||||||||||
| Hypothetical 5% return (5% return before expenses) | |||||||||||||||
| Class A | $ | 1,000.00 | $ | 1,021.07 | 0.82 | % | $ | 4.18 | |||||||
| Class B | 1,000.00 | 1,017.29 | 1.57 | % | 7.98 | ||||||||||
| Class C | 1,000.00 | 1,017.29 | 1.57 | % | 7.98 | ||||||||||
24
Delaware Tax-Free Colorado Fund
Expense analysis of an investment of $1,000
Expense analysis of an investment of $1,000
| Beginning | Ending | Expenses | |||||||||||||
| Account Value | Account Value | Annualized | Paid During Period | ||||||||||||
| 3/1/10 | 8/31/10 | Expense Ratio | 3/1/10 to 8/31/10* | ||||||||||||
| Actual Fund return | |||||||||||||||
| Class A | $ | 1,000.00 | $ | 1,056.50 | 0.95 | % | $ | 4.92 | |||||||
| Class B | 1,000.00 | 1,053.50 | 1.70 | % | 8.80 | ||||||||||
| Class C | 1,000.00 | 1,053.40 | 1.70 | % | 8.80 | ||||||||||
| Hypothetical 5% return (5% return before expenses) | |||||||||||||||
| Class A | $ | 1,000.00 | $ | 1,020.42 | 0.95 | % | $ | 4.84 | |||||||
| Class B | 1,000.00 | 1,016.64 | 1.70 | % | 8.64 | ||||||||||
| Class C | 1,000.00 | 1,016.64 | 1.70 | % | 8.64 | ||||||||||
Delaware Tax-Free Idaho Fund
Expense analysis of an investment of $1,000
Expense analysis of an investment of $1,000
| Beginning | Ending | Expenses | |||||||||||||
| Account Value | Account Value | Annualized | Paid During Period | ||||||||||||
| 3/1/10 | 8/31/10 | Expense Ratio | 3/1/10 to 8/31/10* | ||||||||||||
| Actual Fund return | |||||||||||||||
| Class A | $ | 1,000.00 | $ | 1,052.30 | 0.95 | % | $ | 4.91 | |||||||
| Class B | 1,000.00 | 1,048.40 | 1.70 | % | 8.78 | ||||||||||
| Class C | 1,000.00 | 1,048.40 | 1.70 | % | 8.78 | ||||||||||
| Hypothetical 5% return (5% return before expenses) | |||||||||||||||
| Class A | $ | 1,000.00 | $ | 1,020.42 | 0.95 | % | $ | 4.84 | |||||||
| Class B | 1,000.00 | 1,016.64 | 1.70 | % | 8.64 | ||||||||||
| Class C | 1,000.00 | 1,016.64 | 1.70 | % | 8.64 | ||||||||||
25
Disclosure of Fund expenses
Delaware Tax-Free New York Fund
Expense analysis of an investment of $1,000
Expense analysis of an investment of $1,000
| Beginning | Ending | Expenses | |||||||||||||
| Account Value | Account Value | Annualized | Paid During Period | ||||||||||||
| 3/1/10 | 8/31/10 | Expense Ratio | 3/1/10 to 8/31/10* | ||||||||||||
| Actual Fund return | |||||||||||||||
| Class A | $ | 1,000.00 | $ | 1,057.50 | 0.80 | % | $ | 4.15 | |||||||
| Class B | 1,000.00 | 1,053.70 | 1.55 | % | 8.02 | ||||||||||
| Class C | 1,000.00 | 1,053.60 | 1.55 | % | 8.02 | ||||||||||
| Hypothetical 5% return (5% return before expenses) | |||||||||||||||
| Class A | $ | 1,000.00 | $ | 1,021.17 | 0.80 | % | $ | 4.08 | |||||||
| Class B | 1,000.00 | 1,017.39 | 1.55 | % | 7.88 | ||||||||||
| Class C | 1,000.00 | 1,017.39 | 1.55 | % | 7.88 | ||||||||||
*“Expenses Paid During Period” are equal to a Fund’s annualized expense ratios, multiplied by the average account value over the period, multiplied by 184/365 (to reflect the one-half year period).
26
| Sector allocations | |
| Delaware Tax-Free Arizona Fund | As of August 31, 2010 |
Sector designations may be different than the sector designations presented in other Fund materials.
| Sector | Percentage of net assets | ||
| Municipal Bonds | 99.13 | % | |
| Corporate Revenue Bonds | 8.27 | % | |
| Education Revenue Bonds | 11.69 | % | |
| Electric Revenue Bonds | 8.17 | % | |
| Healthcare Revenue Bonds | 12.74 | % | |
| Housing Revenue Bond | 0.01 | % | |
| Lease Revenue Bonds | 10.58 | % | |
| Local General Obligation Bonds | 4.55 | % | |
| Pre-Refunded Bonds | 8.44 | % | |
| Special Tax Revenue Bonds | 13.51 | % | |
| State & Territory General Obligation Bonds | 6.38 | % | |
| Transportation Revenue Bonds | 6.67 | % | |
| Water & Sewer Revenue Bonds | 8.12 | % | |
| Short-Term Investment | 1.05 | % | |
| Total Value of Securities | 100.18 | % | |
| Liabilities Net of Receivables and Other Assets | (0.18 | %) | |
| Total Net Assets | 100.00 | % | |
27
| Sector allocations | |
| Delaware Tax-Free California Fund | As of August 31, 2010 |
Sector designations may be different than the sector designations presented in other Fund materials.
| Sector | Percentage of net assets | ||
| Municipal Bonds | 97.06 | % | |
| Corporate Revenue Bonds | 6.58 | % | |
| Education Revenue Bonds | 9.13 | % | |
| Electric Revenue Bonds | 6.65 | % | |
| Healthcare Revenue Bonds | 14.59 | % | |
| Housing Revenue Bonds | 6.61 | % | |
| Lease Revenue Bonds | 7.35 | % | |
| Local General Obligation Bonds | 5.88 | % | |
| Pre-Refunded Bonds | 3.83 | % | |
| Resource Recovery Revenue Bond | 1.17 | % | |
| Special Tax Revenue Bonds | 20.02 | % | |
| State General Obligation Bonds | 8.33 | % | |
| Transportation Revenue Bonds | 4.51 | % | |
| Water & Sewer Revenue Bonds | 2.41 | % | |
| Short-Term Investments | 1.59 | % | |
| Total Value of Securities | 98.65 | % | |
| Receivables and Other Assets Net of Liabilities | 1.35 | % | |
| Total Net Assets | 100.00 | % | |
28
| Delaware Tax-Free Colorado Fund | As of August 31, 2010 |
Sector designations may be different than the sector designations presented in other Fund materials.
| Sector | Percentage of net assets | ||
| Municipal Bonds | 98.63 | % | |
| Corporate Revenue Bond | 1.14 | % | |
| Education Revenue Bonds | 11.68 | % | |
| Electric Revenue Bonds | 8.51 | % | |
| Healthcare Revenue Bonds | 23.22 | % | |
| Housing Revenue Bonds | 2.10 | % | |
| Lease Revenue Bonds | 3.59 | % | |
| Local General Obligation Bonds | 13.38 | % | |
| Pre-Refunded/Escrowed to Maturity Bonds | 11.92 | % | |
| Special Tax Revenue Bonds | 10.52 | % | |
| State & Territory General Obligation Bonds | 5.78 | % | |
| Transportation Revenue Bonds | 4.49 | % | |
| Water & Sewer Revenue Bonds | 2.30 | % | |
| Short-Term Investment | 0.15 | % | |
| Total Value of Securities | 98.78 | % | |
| Receivables and Other Assets Net of Liabilities | 1.22 | % | |
| Total Net Assets | 100.00 | % | |
29
| Sector allocations | |
| Delaware Tax-Free Idaho Fund | As of August 31, 2010 |
Sector designations may be different than the sector designations presented in other Fund materials.
| Sector | Percentage of net assets | ||
| Municipal Bonds | 98.42 | % | |
| Corporate Revenue Bonds | 3.43 | % | |
| Education Revenue Bonds | 10.95 | % | |
| Electric Revenue Bonds | 5.85 | % | |
| Healthcare Revenue Bonds | 3.62 | % | |
| Housing Revenue Bonds | 5.97 | % | |
| Lease Revenue Bonds | 3.12 | % | |
| Local General Obligation Bonds | 20.04 | % | |
| Pre-Refunded Bonds | 12.29 | % | |
| Special Tax Revenue Bonds | 17.27 | % | |
| State General Obligation Bonds | 6.41 | % | |
| Transportation Revenue Bonds | 7.06 | % | |
| Water & Sewer Revenue Bonds | 2.41 | % | |
| Short-Term Investments | 2.11 | % | |
| Total Value of Securities | 100.53 | % | |
| Liabilities Net of Receivables and Other Assets | (0.53 | %) | |
| Total Net Assets | 100.00 | % | |
30
| Delaware Tax-Free New York Fund | As of August 31, 2010 |
Sector designations may be different than the sector designations presented in other Fund materials.
| Sector | Percentage of net assets | |
| Municipal Bonds | 95.94 | % |
| Corporate Revenue Bonds | 6.47 | % |
| Education Revenue Bonds | 23.75 | % |
| Electric Revenue Bonds | 5.44 | % |
| Healthcare Revenue Bonds | 8.89 | % |
| Housing Revenue Bonds | 1.48 | % |
| Lease Revenue Bonds | 8.45 | % |
| Local General Obligation Bonds | 3.56 | % |
| Pre-Refunded Bonds | 4.44 | % |
| Special Tax Revenue Bonds | 19.77 | % |
| State & Territory General Obligation Bonds | 4.50 | % |
| Transportation Revenue Bonds | 6.69 | % |
| Water & Sewer Revenue Bonds | 2.50 | % |
| Short-Term Investments | 2.31 | % |
| Total Value of Securities | 98.25 | % |
| Receivables and Other Assets Net of Liabilities | 1.75 | % |
| Total Net Assets | 100.00 | % |
31
| Statements of net assets | |
| Delaware Tax-Free Arizona Fund | August 31, 2010 |
| Principal amount | Value | |||||||
| Municipal Bonds – 99.13% | ||||||||
| Corporate Revenue Bonds – 8.27% | ||||||||
| Maricopa County Pollution Control (Palo Verde Project) | ||||||||
| Series A 5.05% 5/1/29 (AMBAC) | $ | 2,000,000 | $ | 2,000,060 | ||||
| •Series B 5.20% 6/1/43 | 1,500,000 | 1,562,775 | ||||||
| • | Navajo County Pollution Control Revenue | |||||||
| (Arizona Public Services-Cholla) | ||||||||
| Series D 5.75% 6/1/34 | 1,500,000 | 1,626,570 | ||||||
| Pima County Industrial Development Authority Pollution | ||||||||
| Control Revenue (Tucson Electric Power-San Juan) | ||||||||
| 5.75% 9/1/29 | 750,000 | 776,805 | ||||||
| Series A 4.95% 10/1/20 | 1,500,000 | 1,592,925 | ||||||
| Puerto Rico Port Authority Revenue (American Airlines) | ||||||||
| Series A 6.25% 6/1/26 | 1,115,000 | 956,949 | ||||||
| Salt Verde Financial Corporation, Senior Gas Revenue | ||||||||
| 5.00% 12/1/37 | 1,395,000 | 1,331,039 | ||||||
| 9,847,123 | ||||||||
| Education Revenue Bonds – 11.69% | ||||||||
| Arizona Board of Regents | ||||||||
University of Arizona System Revenue Series A | ||||||||
5.00% 6/1/21 | 1,255,000 | 1,457,770 | ||||||
5.00% 6/1/39 | 1,500,000 | 1,595,490 | ||||||
| Arizona Health Facilities Authority Healthcare Education | ||||||||
| Revenue (Kirksville College) | ||||||||
| 5.125% 1/1/30 | 1,500,000 | 1,538,505 | ||||||
| Arizona State University Certificates of Participation | ||||||||
| (Research Infrastructure Project) | ||||||||
| 5.00% 9/1/30 (AMBAC) | 2,000,000 | 2,055,380 | ||||||
| Arizona State University Energy Management Revenue | ||||||||
| (Arizona State University-Tempe Campus II Project) | ||||||||
| 4.50% 7/1/24 | 1,385,000 | 1,476,382 | ||||||
| Energy Management Services Conservation Revenue | ||||||||
| (Arizona State University-Main Campus Project) | ||||||||
| 5.25% 7/1/17 (NATL-RE) | 1,500,000 | 1,614,510 | ||||||
| Glendale Industrial Development Authority Revenue | ||||||||
| (Midwestern University) 5.125% 5/15/40 | 1,200,000 | 1,228,956 | ||||||
| Pima County Industrial Development Authority Educational | ||||||||
Revenue (Tucson Country Day School Project) | ||||||||
5.00% 6/1/37 | 1,000,000 | 833,940 | ||||||
32
| Principal amount | Value | |||||||
| Municipal Bonds (continued) | ||||||||
| Education Revenue Bonds (continued) | ||||||||
| South Campus Group Student Housing Revenue | ||||||||
| (Arizona State University-South Campus Project) | ||||||||
| 5.625% 9/1/35 (NATL-RE) | $ | 1,000,000 | $ | 1,016,520 | ||||
| Tucson Industrial Development Authority Lease Revenue | ||||||||
| (University of Arizona-Marshall Foundation) | ||||||||
| Series A 5.00% 7/15/27 (AMBAC) | 1,000,000 | 1,016,100 | ||||||
| University of Arizona Certificates of Participation | ||||||||
| (University of Arizona Project) | ||||||||
| Series A 5.125% 6/1/21 (AMBAC) | 85,000 | 90,595 | ||||||
| 13,924,148 | ||||||||
| Electric Revenue Bonds – 8.17% | ||||||||
| Mesa Utilities System Revenue 5.00% 7/1/18 (NATL-RE) (FGIC) | 2,150,000 | 2,563,875 | ||||||
| Puerto Rico Electric Power Authority Revenue | ||||||||
| Series WW 5.00% 7/1/28 | 1,430,000 | 1,500,742 | ||||||
| Series WW 5.50% 7/1/38 | 600,000 | 635,952 | ||||||
| Series XX 5.25% 7/1/40 | 1,250,000 | 1,310,588 | ||||||
| Series ZZ 5.25% 7/1/26 | 1,500,000 | 1,653,690 | ||||||
| Salt River Project Agricultural Improvement & | ||||||||
| Power District Electric System Revenue Series B | ||||||||
| 5.00% 1/1/31 (NATL-RE) (IBC) | 2,000,000 | 2,067,240 | ||||||
| 9,732,087 | ||||||||
| Healthcare Revenue Bonds – 12.74% | ||||||||
| Arizona Health Facilities Authority Revenue | ||||||||
| (Catholic Healthcare West) Series D 5.00% 7/1/28 | 1,500,000 | 1,540,860 | ||||||
| Glendale Industrial Development Authority Hospital | ||||||||
| Revenue (John C. Lincoln Health) 5.00% 12/1/42 | 2,500,000 | 2,369,700 | ||||||
| Maricopa County Industrial Development Authority | ||||||||
| Health Facilities Revenue | ||||||||
| (Catholic Healthcare West) Series A | ||||||||
| 5.50% 7/1/26 | 1,000,000 | 1,040,320 | ||||||
| 6.00% 7/1/39 | 2,500,000 | 2,713,725 | ||||||
| Scottsdale Industrial Development Authority | ||||||||
| Hospital Revenue (Scottsdale Healthcare) | ||||||||
| Series A 5.25% 9/1/30 | 1,250,000 | 1,274,275 | ||||||
| University Medical Center Hospital Revenue | ||||||||
| 5.00% 7/1/35 | 1,500,000 | 1,466,505 | ||||||
| 6.50% 7/1/39 | 2,500,000 | 2,740,625 | ||||||
33
Statements of net assets
Delaware Tax-Free Arizona Fund
Delaware Tax-Free Arizona Fund
| Principal amount | Value | |||||||
| Municipal Bonds (continued) | ||||||||
| Healthcare Revenue Bonds (continued) | ||||||||
| Yavapai County Industrial Development Authority | ||||||||
| Revenue (Yavapai Regional Medical Center) | ||||||||
| Series A 5.25% 8/1/21 (RADIAN) | $ | 2,000,000 | $ | 2,036,120 | ||||
| 15,182,130 | ||||||||
| Housing Revenue Bond – 0.01% | ||||||||
| Pima County Industrial Development Authority | ||||||||
| Single Family Housing Revenue Series A-1 | ||||||||
| 6.125% 11/1/33 (GNMA) (FNMA) (FHLMC) (AMT) | 15,000 | 15,016 | ||||||
| 15,016 | ||||||||
| Lease Revenue Bonds – 10.58% | ||||||||
| Arizona Game & Fish Department & | ||||||||
| Community Beneficial Interest Certificates | ||||||||
| (Administration Building Project) 5.00% 7/1/32 | 1,300,000 | 1,330,602 | ||||||
| Arizona State Certificates of Participation Department | ||||||||
| Administration Series A 5.25% 10/1/25 (AGM) | 1,500,000 | 1,666,920 | ||||||
| Marana Municipal Property Facilities Revenue | ||||||||
| 5.00% 7/1/28 (AMBAC) | 575,000 | 597,339 | ||||||
| Maricopa County Industrial Development Authority | ||||||||
| Correctional Contract Revenue (Phoenix West Prison) | ||||||||
| Series B 5.375% 7/1/22 (ACA) | 1,000,000 | 1,006,590 | ||||||
| Phoenix Industrial Development Authority Lease | ||||||||
| Revenue (Capitol Mall II, LLC Project) | ||||||||
| 5.00% 9/15/28 (AMBAC) | 2,000,000 | 2,018,820 | ||||||
| Pima County Industrial Development Authority Lease | ||||||||
| Revenue Metro Police Facility (Nevada Project) Series A | ||||||||
| 5.25% 7/1/31 | 1,500,000 | 1,595,775 | ||||||
| 5.375% 7/1/39 | 1,500,000 | 1,582,395 | ||||||
| Pinal County Certificates of Participation 5.00% 12/1/29 | 1,300,000 | 1,313,780 | ||||||
| Puerto Rico Public Buildings Authority Revenue | ||||||||
| (Guaranteed Government Facilities) Series D | ||||||||
| 5.25% 7/1/27 | 470,000 | 475,527 | ||||||
| University of Arizona Certificates of Participation | ||||||||
| (University of Arizona Project) | ||||||||
| Series B 5.00% 6/1/31 (AMBAC) | 1,000,000 | 1,016,090 | ||||||
| 12,603,838 | ||||||||
34
| Principal amount | Value | |||||||
| Municipal Bonds (continued) | ||||||||
| Local General Obligation Bonds – 4.55% | ||||||||
| Coconino & Yavapai Counties Joint Unified School | ||||||||
| District #9 (Sedona Oak Creek Project of 2007) | ||||||||
| Series A 4.50% 7/1/18 (AGM) | $ | 1,520,000 | $ | 1,810,000 | ||||
| Series B 5.375% 7/1/28 | 1,350,000 | 1,504,994 | ||||||
| DC Ranch Community Facilities 5.00% 7/15/27 (AMBAC) | 1,000,000 | 1,008,850 | ||||||
| • | Gila County Unified School District #10 | |||||||
| (Payson School Improvement Project of 2006) Series A | ||||||||
| 5.25% 7/1/27 (AMBAC) | 1,000,000 | 1,090,890 | ||||||
| 5,414,734 | ||||||||
| §Pre-Refunded Bonds – 8.44% | ||||||||
| Phoenix Variable Purpose Series B 5.00% 7/1/27-12 | 2,435,000 | 2,518,715 | ||||||
| Pinal County Certificates of Participation | ||||||||
| 5.125% 6/1/21-11 (AMBAC) | 2,000,000 | 2,092,420 | ||||||
| Puerto Rico Commonwealth Highway & | ||||||||
Transportation Authority Revenue Series K | ||||||||
5.00% 7/1/35-15 | 750,000 | 893,348 | ||||||
| Puerto Rico Public Buildings Authority Revenue | ||||||||
| (Guaranteed Government Facilities) Series I | ||||||||
| 5.25% 7/1/33-14 | 5,000 | 5,839 | ||||||
| Southern Arizona Capital Facilities Finance Revenue | ||||||||
| (University of Arizona Project) | ||||||||
| 5.10% 9/1/33-12 (NATL-RE) | 3,250,000 | 3,557,255 | ||||||
| University of Arizona Certificates of Participation | ||||||||
| (University of Arizona Project) Series A | ||||||||
| 5.125% 6/1/21-12 (AMBAC) | 915,000 | 989,170 | ||||||
| 10,056,747 | ||||||||
| Special Tax Revenue Bonds – 13.51% | ||||||||
| Arizona Tourism & Sports Authority Tax Revenue | ||||||||
| (Multipurpose Stadium Facilities) Series A | ||||||||
| 5.00% 7/1/28 (NATL-RE) | 1,345,000 | 1,364,234 | ||||||
| Flagstaff Aspen Place Sawmill Improvement District | ||||||||
| Revenue 5.00% 1/1/32 | 1,350,000 | 1,350,864 | ||||||
| Gilbert Public Facilities Municipal Property | ||||||||
| Revenue 5.00% 7/1/25 | 1,250,000 | 1,385,338 | ||||||
| Marana Tangerine Farm Road Improvement District | ||||||||
| Revenue 4.60% 1/1/26 | 924,000 | 915,924 | ||||||
| Mesa Street & Highway Revenue 5.00% 7/1/20 (AGM) | 1,000,000 | 1,181,800 | ||||||
35
Statements of net assets
Delaware Tax-Free Arizona Fund
Delaware Tax-Free Arizona Fund
| Principal amount | Value | |||||||
| Municipal Bonds (continued) | ||||||||
| Special Tax Revenue Bonds (continued) | ||||||||
| Peoria Municipal Development Authority Transition | ||||||||
| Sales Tax, Excise Tax & State Shared Revenue | ||||||||
| (Senior Lien & Subordinated Lien) 4.50% 1/1/16 | $ | 1,000,000 | $ | 1,138,610 | ||||
| Phoenix Civic Improvement Transition Excise Tax Revenue | ||||||||
| (Light Rail Project) 5.00% 7/1/20 (AMBAC) | 1,570,000 | 1,744,458 | ||||||
| Puerto Rico Commonwealth Infrastructure Financing | ||||||||
| Authority Special Tax Revenue | ||||||||
| Series C 5.50% 7/1/25 (AMBAC) | 1,955,000 | 2,185,084 | ||||||
| Puerto Rico Sales Tax Financing Corporation | ||||||||
Revenue First Subordinate | ||||||||
ΩCapital Appreciation Series A 6.75% 8/1/32 | 3,045,000 | 2,631,367 | ||||||
Series A 5.75% 8/1/37 | 1,190,000 | 1,275,632 | ||||||
Series C 6.00% 8/1/39 | 835,000 | 924,403 | ||||||
| 16,097,714 | ||||||||
| State & Territory General Obligation Bonds – 6.38% | ||||||||
| Guam Government Series A | ||||||||
| 6.75% 11/15/29 | 115,000 | 126,747 | ||||||
| 7.00% 11/15/39 | 1,250,000 | 1,399,900 | ||||||
| Puerto Rico Commonwealth Public Improvement | ||||||||
| Series A 5.50% 7/1/19 | 1,300,000 | 1,473,316 | ||||||
| Series C 6.00% 7/1/39 | 1,010,000 | 1,096,345 | ||||||
| Un-Refunded Balance Series A | ||||||||
| 5.125% 7/1/30 (AGM) | 480,000 | 483,216 | ||||||
| 5.125% 7/1/31 | 2,000,000 | 2,009,180 | ||||||
| Virgin Islands Public Finance Authority Revenue | ||||||||
| (Gross Receipts Taxes Loan Note) 5.00% 10/1/31 (ACA) | 1,000,000 | 1,012,840 | ||||||
| 7,601,544 | ||||||||
| Transportation Revenue Bonds – 6.67% | ||||||||
| Arizona State Transportation Board Grant Anticipation | ||||||||
| Notes Series A 5.00% 7/1/14 | 1,250,000 | 1,447,538 | ||||||
| Arizona State Transportation Board Highway | ||||||||
| Revenue Subordinated Series A 5.00% 7/1/23 | 1,000,000 | 1,120,760 | ||||||
| Phoenix Civic Improvement Airport Revenue | ||||||||
| (Junior Lien) Series A 5.25% 7/1/33 | 1,250,000 | 1,340,188 | ||||||
| (Senior Lien) Series B | ||||||||
| 5.25% 7/1/27 (NATL-RE) (FGIC) (AMT) | 1,000,000 | 1,015,370 | ||||||
| 5.25% 7/1/32 (NATL-RE) (FGIC) (AMT) | 3,000,000 | 3,025,559 | ||||||
| 7,949,415 | ||||||||
36
| Principal amount | Value | ||||||||
| Municipal Bonds (continued) | |||||||||
| Water & Sewer Revenue Bonds – 8.12% | |||||||||
| Phoenix Civic Improvement Corporation | |||||||||
| Waste System Revenue (Junior Lien) | |||||||||
| 5.00% 7/1/26 (NATL-RE) (FGIC) | $ | 3,750,000 | $ | 3,933,750 | |||||
| Phoenix Civic Improvement Wastewater Corporation | |||||||||
| Systems Revenue (Junior Lien) | |||||||||
| 5.00% 7/1/19 (NATL-RE) | 2,750,000 | 3,217,885 | |||||||
| Refunding 5.00% 7/1/24 (NATL-RE) (FGIC) | 1,000,000 | 1,030,800 | |||||||
| Scottsdale Water & Sewer Revenue 5.25% 7/1/22 | 1,150,000 | 1,488,595 | |||||||
| 9,671,030 | |||||||||
| Total Municipal Bonds (cost $110,512,406) | 118,095,526 | ||||||||
| Number of shares | |||||||||
| Short-Term Investment – 1.05% | |||||||||
| Money Market Instrument – 1.05% | |||||||||
| Federated Arizona Municipal Cash Trust | 1,245,703 | 1,245,703 | |||||||
| Total Short-Term Investment (cost $1,245,703) | 1,245,703 | ||||||||
| Total Value of Securities – 100.18% | |||||||||
| (cost $111,758,109) | 119,341,229 | ||||||||
| Liabilities Net of Receivables and | |||||||||
| Other Assets – (0.18%) | (214,757 | ) | |||||||
| Net Assets Applicable to 10,131,602 | |||||||||
| Shares Outstanding – 100.00% | $ | 119,126,472 | |||||||
| Net Asset Value – Delaware Tax-Free Arizona Fund | |||||||||
| Class A ($108,213,691 / 9,205,300 Shares) | $11.76 | ||||||||
| Net Asset Value – Delaware Tax-Free Arizona Fund | |||||||||
| Class B ($2,917,187 / 247,972 Shares) | $11.76 | ||||||||
| Net Asset Value – Delaware Tax-Free Arizona Fund | |||||||||
| Class C ($7,995,594 / 678,330 Shares) | $11.79 | ||||||||
| Components of Net Assets at August 31, 2010: | |||||||||
| Shares of beneficial interest (unlimited authorization – no par) | $ | 111,486,795 | |||||||
| Undistributed net investment income | 26,196 | ||||||||
| Accumulated net realized gain on investments | 30,361 | ||||||||
| Net unrealized appreciation of investments | 7,583,120 | ||||||||
| Total net assets | $ | 119,126,472 | |||||||
37
Statements of net assets
Delaware Tax-Free Arizona Fund
Delaware Tax-Free Arizona Fund
| • | Variable rate security. The rate shown is the rate as of August 31, 2010. Interest rates reset periodically. |
| § | Pre-Refunded bonds. Municipals that are generally backed or secured by U.S. Treasury bonds. For Pre-Refunded Bonds, the stated maturity is followed by the year in which the bond is pre-refunded. See Note 8 in “Notes to financial statements.” |
| Ω | Step coupon bond. Indicates security that has a zero coupon that remains in effect until a predetermined date at which time the stated interest rate becomes effective. |
Summary of abbreviations:
ACA — Insured by American Capital Access
AGM — Insured by Assured Guaranty Municipal Corporation
AMBAC — Insured by the AMBAC Assurance Corporation
AMT — Subject to Alternative Minimum Tax
FGIC — Insured by the Financial Guaranty Insurance Company
FHLMC — Insured by the Federal Home Loan Mortgage Corporation
FNMA — Federal National Mortgage Association collateral
GNMA — Government National Mortgage Association collateral
IBC — Insured by Integrity Building Corporation
NATL-RE — Insured by the National Public Finance Guarantee Corporation
RADIAN — Insured by Radian Asset Assurance
| Net Asset Value and Offering Price Per Share – | |||
| Delaware Tax-Free Arizona Fund | |||
| Net asset value Class A (A) | $ | 11.76 | |
| Sales charge (4.50% of offering price) (B) | 0.55 | ||
| Offering price | $ | 12.31 |
| (A) | Net asset value per share, as illustrated, is the amount which would be paid upon redemption or repurchase of shares. | |
| (B) | See the current prospectus for purchases of $100,000 or more. |
See accompanying Notes, which are an integral part of the financial statements.
38
| Delaware Tax-Free California Fund | August 31, 2010 |
| Principal amount | Value | |||||||
| Municipal Bonds – 97.06% | ||||||||
| Corporate Revenue Bonds – 6.58% | ||||||||
| California Pollution Control Financing Authority | ||||||||
| Environmental I Municipal Revenue | ||||||||
| •(BP West Coast Products, LLC) 2.60% 12/1/46 | $ | 500,000 | $ | 489,495 | ||||
| # | California Pollution Control Financing Authority Water | |||||||
| Facilities Revenue (American Water Capital Project) | ||||||||
| 144A 5.25% 8/1/40 | 1,000,000 | 1,019,320 | ||||||
| Chula Vista Industrial Development Revenue | ||||||||
| (San Diego Gas & Electric) Series D 5.875% 1/1/34 | 1,000,000 | 1,131,690 | ||||||
| Golden State Tobacco Securitization Corporate | ||||||||
| Settlement Revenue (Asset-Backed Senior Notes) | ||||||||
| Series A-1 5.75% 6/1/47 | 2,000,000 | 1,498,140 | ||||||
| M-S-R Energy Authority Gas Revenue Series A 6.50% 11/1/39 | 1,000,000 | 1,165,470 | ||||||
| Puerto Rico Ports Authority Special Facilities Revenue | ||||||||
| (American Airlines) Series A 6.30% 6/1/23 (AMT) | 825,000 | 724,218 | ||||||
| 6,028,333 | ||||||||
| Education Revenue Bonds – 9.13% | ||||||||
| California Educational Facilities Authority Revenue | ||||||||
| (University of the Pacific) 5.50% 11/1/39 | 1,000,000 | 1,041,560 | ||||||
| (Woodbury University) 5.00% 1/1/36 | 1,000,000 | 935,900 | ||||||
| California Municipal Finance Authority Educational | ||||||||
| Revenue (American Heritage Foundation Project) | ||||||||
| Series A 5.25% 6/1/36 | 1,000,000 | 923,070 | ||||||
| California Statewide Communities Development Authority Revenue | ||||||||
| (California Baptist University Project) Series A 5.50% 11/1/38 | 1,000,000 | 870,290 | ||||||
| (Viewpoint School Project) 5.75% 10/1/33 (ACA) | 1,000,000 | 991,110 | ||||||
| California Statewide Communities Development Authority | ||||||||
| School Facility Revenue (Aspire Public Schools Project) | ||||||||
| 6.00% 7/1/40 | 1,000,000 | 1,022,920 | ||||||
| California Statewide Communities Development Authority | ||||||||
| Student Housing Revenue (East Campus Apartments, LLC) | ||||||||
| Series A 5.625% 8/1/34 (ACA) | 1,000,000 | 1,001,110 | ||||||
| San Diego County Certificates of Participation | ||||||||
| (University of San Diego) 5.375% 10/1/41 | 1,000,000 | 1,004,120 | ||||||
| University of California Revenue (Multiple Purpose Projects) | ||||||||
| Series L 5.00% 5/15/19 | 500,000 | 580,275 | ||||||
| 8,370,355 | ||||||||
39
Statements of net assets
Delaware Tax-Free California Fund
Delaware Tax-Free California Fund
| Principal amount | Value | |||||||
| Municipal Bonds (continued) | ||||||||
| Electric Revenue Bonds – 6.65% | ||||||||
| Chino Basin Regional Financing Authority Revenue | ||||||||
| Series A 5.00% 11/1/24 (AMBAC) | $ | 845,000 | $ | 928,055 | ||||
| Puerto Rico Electric Power Authority Revenue | ||||||||
| Series WW 5.50% 7/1/38 | 400,000 | 423,968 | ||||||
| Series XX 5.75% 7/1/36 | 1,000,000 | 1,085,950 | ||||||
| Southern California Public Power Authority Revenue | ||||||||
| (Transmission Project) Series A 5.00% 7/1/22 | 1,000,000 | 1,152,600 | ||||||
| Turlock Irrigation District Revenue Series A 5.00% 1/1/30 | 1,335,000 | 1,428,397 | ||||||
| Vernon Electric System Revenue Series A 5.125% 8/1/21 | 1,000,000 | 1,081,850 | ||||||
| 6,100,820 | ||||||||
| Healthcare Revenue Bonds – 14.59% | ||||||||
| Association Bay Area Governments Finance Authority | ||||||||
| for California Nonprofit Corporations | ||||||||
| (San Diego Hospital Association) Series A 6.125% 8/15/20 | 1,155,000 | 1,176,263 | ||||||
| (Sharp Health Care) Series B 6.25% 8/1/39 | 1,000,000 | 1,131,250 | ||||||
| California Health Facilities Financing Authority Revenue | ||||||||
| (Catholic Health Care West) | ||||||||
| Series A 6.00% 7/1/39 | 1,000,000 | 1,104,430 | ||||||
| Series E 5.625% 7/1/25 | 1,000,000 | 1,104,970 | ||||||
| Series G 5.25% 7/1/23 | 1,000,000 | 1,045,230 | ||||||
| (Children’s Hospital Orange County) Series A 6.50% 11/1/38 | 1,000,000 | 1,089,940 | ||||||
| (St. Joseph Health System) Series A 5.75% 7/1/39 | 1,000,000 | 1,075,120 | ||||||
| �� (The Episcopal Home) Series A 5.30% 2/1/32 (RADIAN) | 1,000,000 | 1,002,720 | ||||||
| California Infrastructure & Economic Development Bank | ||||||||
| Revenue (Kaiser Hospital Associates I, LLC) | ||||||||
| Series A 5.55% 8/1/31 | 1,000,000 | 1,022,870 | ||||||
| California Municipal Finance Authority Revenue | ||||||||
| (Eisenhower Medical Center) Series A 5.75% 7/1/40 | 1,000,000 | 1,025,580 | ||||||
| California Statewide Communities Development Authority Revenue | ||||||||
| (Kaiser Performance) Series A 5.00% 4/1/19 | 1,000,000 | 1,139,370 | ||||||
| (Southern California Senior Living) 7.25% 11/15/41 | 500,000 | 557,515 | ||||||
| (Valleycare Health Systems) Series A 5.125% 7/15/31 | 1,000,000 | 899,850 | ||||||
| 13,375,108 | ||||||||
| Housing Revenue Bonds – 6.61% | ||||||||
| California Housing Finance Agency Revenue (Home Mortgage) | ||||||||
| Series K 5.30% 8/1/23 (AMT) | 1,000,000 | 1,002,250 | ||||||
| Series M 5.95% 8/1/25 (AMT) | 990,000 | 1,049,529 | ||||||
40
| Principal amount | Value | |||||||
| Municipal Bonds (continued) | ||||||||
| Housing Revenue Bonds (continued) | ||||||||
| California Statewide Communities Development | ||||||||
| Multifamily Housing Authority Revenue | ||||||||
| (Citrus Gardens Apartments) Series D-1 5.375% 7/1/32 | $ | 1,000,000 | $ | 979,170 | ||||
| •(Silver Ridge Apartments) Series H 5.80% 8/1/33 (FNMA) (AMT) | 1,000,000 | 1,026,560 | ||||||
| Palm Springs Mobile Home Park Revenue | ||||||||
| (Sahara Mobile Home Park) Series A 5.75% 5/15/37 | 1,000,000 | 1,003,540 | ||||||
| Santa Clara County Multifamily Housing Authority Revenue | ||||||||
| (Rivertown Apartments Project) Series A 5.85% 8/1/31 (AMT) | 1,000,000 | 1,003,290 | ||||||
| 6,064,339 | ||||||||
| Lease Revenue Bonds – 7.35% | ||||||||
| California State Public Works Board Lease Revenue | ||||||||
| (General Services) Series A 6.25% 4/1/34 | 1,000,000 | 1,091,060 | ||||||
| Elsinore Valley Municipal Water District Certificates of | ||||||||
| Participation Series A 5.00% 7/1/24 (BHAC) | 1,000,000 | 1,127,130 | ||||||
| Franklin-McKinley School District Certificates of Participation | ||||||||
| (Financing Project) Series B 5.00% 9/1/27 (AMBAC) | 1,060,000 | 1,087,125 | ||||||
| Puerto Rico Public Buildings Authority Revenue (Guaranteed | ||||||||
| Government Facilities) Series M-2 5.50% 7/1/35 (AMBAC) | 700,000 | 764,386 | ||||||
| San Diego Public Facilities Financing Authority Lease | ||||||||
| Revenue (Master Project) Series A 5.25% 3/1/40 | 1,000,000 | 1,019,880 | ||||||
| San Mateo Joint Powers Financing Authority Lease | ||||||||
| Revenue (Capital Projects) Series A 5.25% 7/15/26 | 1,000,000 | 1,131,080 | ||||||
| Ω | San Mateo Unified High School District Certificates of | |||||||
| Participation Capital Appreciation (Partnership Phase I | ||||||||
| Projects) Series B 5.00% 12/15/43 (AMBAC) | 1,000,000 | 513,500 | ||||||
| 6,734,161 | ||||||||
| Local General Obligation Bonds – 5.88% | ||||||||
| ^ | Anaheim School District Election 2002 4.58% 8/1/25 (NATL-RE) | 1,000,000 | 442,320 | |||||
| Central Unified School District Election 2008 | ||||||||
| Series A 5.625% 8/1/33 (ASSURED GTY) | 1,000,000 | 1,110,140 | ||||||
| Fairfield-Suisun Unified School District Election 2002 | ||||||||
| 5.50% 8/1/28 (NATL-RE) | 500,000 | 546,590 | ||||||
| Grossmont Union High School District Election 2004 | ||||||||
| 5.00% 8/1/23 (NATL-RE) | 1,000,000 | 1,080,700 | ||||||
| Santa Barbara Community College District Election 2008 | ||||||||
| Series A 5.25% 8/1/33 | 1,000,000 | 1,085,130 | ||||||
| Sierra Joint Community College Improvement District #2 | ||||||||
| (Western Nevada) Series A 5.25% 8/1/21 (BHAC) (FGIC) | 1,000,000 | 1,128,680 | ||||||
| 5,393,560 | ||||||||
41
Statements of net assets
Delaware Tax-Free California Fund
Delaware Tax-Free California Fund
| Principal amount | Value | |||||||
| Municipal Bonds (continued) | ||||||||
| §Pre-Refunded Bonds – 3.83% | ||||||||
| California Department of Water Resources (Central Valley | ||||||||
| Project) Series X 5.00% 12/1/29-12 (NATL-RE) (FGIC) | $ | 5,000 | $ | 5,517 | ||||
| Commerce Joint Powers Financing Authority | ||||||||
| Revenue (Redevelopment Projects) | ||||||||
| Series A 5.00% 8/1/28-13 (RADIAN) | 60,000 | 67,885 | ||||||
| Golden State Tobacco Securitization | ||||||||
| Corporation Settlement Revenue | ||||||||
| (Asset-Backed Senior Notes) Series B | ||||||||
| 5.50% 6/1/43-13 (RADIAN) | 1,000,000 | 1,133,670 | ||||||
| 5.625% 6/1/33-13 | 1,000,000 | 1,137,080 | ||||||
| Port Oakland Revenue Series L 5.375% 11/1/27-12 | ||||||||
| (NATL-RE) (FGIC) (AMT) | 110,000 | 121,814 | ||||||
| • | Puerto Rico Sales Tax Financing Corporation Revenue | |||||||
| (First Subordinate) Series A 5.00% 8/1/39-11 | 1,000,000 | 1,043,700 | ||||||
| 3,509,666 | ||||||||
| Resource Recovery Revenue Bond – 1.17% | ||||||||
| South Bayside Waste Management Authority Revenue | ||||||||
| (Shoreway Environmental Center) Series A 6.00% 9/1/36 | 1,000,000 | 1,068,400 | ||||||
| 1,068,400 | ||||||||
| Special Tax Revenue Bonds – 20.02% | ||||||||
| California State Economic Recovery Refunding | ||||||||
| Series A 5.25% 7/1/21 | 1,000,000 | 1,198,740 | ||||||
| Commerce Joint Powers Financing Authority Revenue | ||||||||
| (Redevelopment Projects) Un-Refunded Balance | ||||||||
| Series A 5.00% 8/1/28 (RADIAN) | 940,000 | 883,769 | ||||||
| Fremont Community Facilities District #1 (Special Tax Pacific | ||||||||
| Commons) 5.375% 9/1/36 | 1,000,000 | 985,540 | ||||||
| Glendale Redevelopment Agency Tax Allocation Revenue | ||||||||
| (Central Glendale Redevelopment Project) 5.50% 12/1/24 | 1,000,000 | 1,039,250 | ||||||
| Lake Elsinore Public Financing Authority Tax Allocation | ||||||||
| Series A 5.50% 9/1/30 | 1,000,000 | 1,000,160 | ||||||
| Lammersville School District Community Facilities | ||||||||
| District #2002 (Mountain House) 5.125% 9/1/35 | 500,000 | 440,780 | ||||||
| Lancaster Redevelopment Agency Tax Allocation Revenue | ||||||||
| (Combined Redevelopment Project Areas) 6.875% 8/1/39 | 500,000 | 571,205 | ||||||
| @ | Modesto Special Tax Community Facilities | |||||||
| District #04-1 (Village 2) 5.15% 9/1/36 | 1,000,000 | 795,920 | ||||||
42
| Principal amount | Value | |||||||
| Municipal Bonds (continued) | ||||||||
| Special Tax Revenue Bonds (continued) | ||||||||
| Poway Redevelopment Agency Tax Allocation Revenue | ||||||||
| 5.75% 6/15/33 (NATL-RE) | $ | 270,000 | $ | 272,128 | ||||
| Poway Unified School District Community Facilities District #1 | ||||||||
| Special Tax Refunding 5.00% 10/1/17 (AGM) | 1,000,000 | 1,187,180 | ||||||
| Puerto Rico Sales Tax Financing Corporation | ||||||||
| Revenue First Subordinate | ||||||||
| ΩCapital Appreciation Series A 6.75% 8/1/32 | 2,040,000 | 1,762,886 | ||||||
| Series A 5.25% 8/1/27 | 1,000,000 | 1,088,250 | ||||||
| Series A 5.75% 8/1/37 | 790,000 | 846,848 | ||||||
| Series C 6.00% 8/1/39 | 700,000 | 774,949 | ||||||
| Riverside County Redevelopment Agency Tax Allocation | ||||||||
| Housing Series A 6.00% 10/1/39 | 1,000,000 | 1,041,000 | ||||||
| Roseville Westpark Special Tax Public Community Facilities | ||||||||
| District #1 5.25% 9/1/37 | 500,000 | 434,600 | ||||||
| San Bernardino County Special Tax Community Facilities | ||||||||
| District #2002-1 5.90% 9/1/33 | 2,000,000 | 1,982,620 | ||||||
| San Diego Redevelopment Agency Tax Allocation Revenue | ||||||||
| (Naval Training Center) Series A 5.75% 9/1/40 | 1,000,000 | 1,019,030 | ||||||
| Virgin Islands Public Finance Authority Revenue (Senior | ||||||||
| Lien-Matching Fund Loan Note) Series A 5.00% 10/1/29 | 1,000,000 | 1,032,760 | ||||||
| 18,357,615 | ||||||||
| State General Obligation Bonds – 8.33% | ||||||||
| California State Various Purposes | ||||||||
| 5.25% 3/1/30 | 1,000,000 | 1,065,020 | ||||||
| 6.00% 3/1/33 | 1,000,000 | 1,141,920 | ||||||
| 6.00% 4/1/38 | 515,000 | 575,111 | ||||||
| Guam Government Series A 6.75% 11/15/29 | 1,755,000 | 1,934,273 | ||||||
| Puerto Rico Commonwealth Government Development Bank | ||||||||
| Senior Notes Series B 5.00% 12/1/15 | 1,000,000 | 1,089,540 | ||||||
| Puerto Rico Commonwealth Public Improvement | ||||||||
| Series A 5.25% 7/1/15 | 1,000,000 | 1,098,410 | ||||||
| Series C 6.00% 7/1/39 | 675,000 | 732,706 | ||||||
| 7,636,980 | ||||||||
| Transportation Revenue Bonds – 4.51% | ||||||||
| Bay Area Toll Bridge Authority Revenue | ||||||||
| (San Francisco Bay Area) Series F-1 5.625% 4/1/44 | 1,000,000 | 1,126,710 | ||||||
| Port Oakland Revenue Series L 5.375% 11/1/27 | ||||||||
| (NATL-RE) (FGIC) (AMT) | 890,000 | 900,075 | ||||||
43
Statements of net assets
Delaware Tax-Free California Fund
Delaware Tax-Free California Fund
| Principal amount | Value | |||||||
| Municipal Bonds (continued) | ||||||||
| Transportation Revenue Bonds (continued) | ||||||||
| Sacramento County Airport Services Revenue (PFC/Grant) | ||||||||
| Series C 6.00% 7/1/41 | $ | 1,000,000 | $ | 1,100,110 | ||||
| San Diego Redevelopment Agency (Centre City Redevelopment | ||||||||
| Project) Series A 6.40% 9/1/25 | 1,000,000 | 1,005,420 | ||||||
| 4,132,315 | ||||||||
| Water & Sewer Revenue Bonds – 2.41% | ||||||||
| California Department of Water Resources Systems Revenue | ||||||||
| (Central Valley Project) | ||||||||
| Series A 5.00% 12/1/24 | 1,000,000 | 1,146,800 | ||||||
| Un-Refunded Balance Series X 5.00% 12/1/29 (NATL-RE) (FGIC) | 995,000 | 1,064,779 | ||||||
| 2,211,579 | ||||||||
| Total Municipal Bonds (cost $84,612,164) | 88,983,231 | |||||||
| Number of shares | ||||||||
| Short-Term Investments – 1.59% | ||||||||
| Money Market Instrument – 0.50% | ||||||||
| Federated California Municipal Cash Trust | 460,608 | 460,608 | ||||||
| 460,608 | ||||||||
| Principal amount | ||||||||
| •Variable Rate Demand Note – 1.09% | ||||||||
| California State Various (Kindergarten-B1) 0.25% 5/1/34 | $ | 1,000,000 | 1,000,000 | |||||
| 1,000,000 | ||||||||
| Total Short-Term Investments (cost $1,460,608) | 1,460,608 | |||||||
| Total Value of Securities – 98.65% (cost $86,072,772) | 90,443,839 | |||||||
| Receivables and Other Assets | ||||||||
| Net of Liabilities – 1.35% | 1,237,744 | |||||||
| Net Assets Applicable to 7,923,210 | ||||||||
| Shares Outstanding – 100.00% | $ | 91,681,583 | ||||||
44
| Net Asset Value – Delaware Tax-Free California Fund | ||||||
| Class A ($72,901,567 / 6,302,934 Shares) | $11.57 | |||||
| Net Asset Value – Delaware Tax-Free California Fund | ||||||
| Class B ($3,254,299 / 280,193 Shares) | $11.61 | |||||
| Net Asset Value – Delaware Tax-Free California Fund | ||||||
| Class C ($15,525,717 / 1,340,083 Shares) | $11.59 | |||||
| Components of Net Assets at August 31, 2010: | ||||||
| Shares of beneficial interest (unlimited authorization – no par) | $ | 87,796,897 | ||||
| Undistributed net investment income | 18,763 | |||||
| Accumulated net realized loss on investments | (505,144 | ) | ||||
| Net unrealized appreciation of investments | 4,371,067 | |||||
| Total net assets | $ | 91,681,583 | ||||
| • | Variable rate security. The rate shown is the rate as of August 31, 2010. Interest rates reset periodically. |
| # | Security exempt from registration under Rule 144A of the Securities Act of 1933, as amended. At August 31, 2010, the aggregate amount of Rule 144A securities was $1,019,320, which represented 1.11% of the Fund’s net assets. See Note 8 in “Notes to financial statements.” |
| Ω | Step coupon bond. Indicates security that has a zero coupon that remains in effect until a predetermined date at which time the stated interest rate becomes effective. |
| ^ | Zero coupon security. The rate shown is the yield at the time of purchase. |
| § | Pre-Refunded bonds. Municipal bonds that are generally backed or secured by U.S. Treasury bonds. For Pre-Refunded Bonds, the stated maturity is followed by the year in which the bond is pre-refunded. See Note 8 in “Notes to financial statements.” |
| @ | Illiquid security. At August 31, 2010, the aggregate amount of illiquid securities was $795,920, which represented 0.87% of the Fund’s net assets. See Note 8 in “Notes to financial statements.” |
45
Statements of net assets
Delaware Tax-Free California Fund
Delaware Tax-Free California Fund
Summary of abbreviations:
ACA — Insured by American Capital Access
AGM — Insured by Assured Guaranty Municipal Corporation
AMBAC — Insured by the AMBAC Assurance Corporation
AMT — Subject to Alternative Minimum Tax
ASSURED GTY — Insured by the Assured Guaranty Corporation
BHAC — Insured by the Berkshire Hathaway Assurance Company
FGIC — Insured by the Financial Guaranty Insurance Company
FNMA — Federal National Mortgage Association collateral
NATL-RE — Insured by the National Public Finance Guarantee Corporation
RADIAN — Insured by Radian Asset Assurance
| Net Asset Value and Offering Price Per Share – | |||
| Delaware Tax-Free California Fund | |||
| Net asset value Class A (A) | $ | 11.57 | |
| Sales charge (4.50% of offering price) (B) | 0.55 | ||
| Offering price | $ | 12.12 |
| (A) | Net asset value per share, as illustrated, is the amount which would be paid upon redemption or repurchase of shares. | |
| (B) | See the current prospectus for purchases of $100,000 or more. |
See accompanying Notes, which are an integral part of the financial statements.
46
| Delaware Tax-Free Colorado Fund | August 31, 2010 | |||||||
| Principal amount | Value | |||||||
| Municipal Bonds – 98.63% | ||||||||
| Corporate Revenue Bond – 1.14% | ||||||||
| Public Authority Energy National Gas Purpose | ||||||||
| Revenue Series 2008 6.50% 11/15/38 | $ | 2,500,000 | $ | 2,903,750 | ||||
| 2,903,750 | ||||||||
| Education Revenue Bonds – 11.68% | ||||||||
| Boulder County Development Revenue | ||||||||
| (University Corporation for Atmospheric Research) | ||||||||
| 5.00% 9/1/33 (NATL-RE) | 1,000,000 | 1,010,030 | ||||||
| 5.00% 9/1/35 (AMBAC) | 1,000,000 | 1,019,220 | ||||||
| Colorado Educational & Cultural Facilities | ||||||||
| Authority Revenue | ||||||||
| (Charter School Project) 5.50% 5/1/36 (XLCA) | 2,280,000 | 2,320,265 | ||||||
| (Johnson & Wales University Project) Series A | ||||||||
| 5.00% 4/1/28 (XLCA) | 1,000,000 | 1,001,040 | ||||||
| (Liberty Common Charter School Project) | ||||||||
| 5.125% 12/1/33 (XLCA) | 2,740,000 | 2,760,139 | ||||||
| (Montessori Districts Charter School Projects) | ||||||||
| 6.125% 7/15/32 | 5,590,000 | 5,626,222 | ||||||
| (Pinnacle Charter School Project) 5.00% 6/1/33 (XLCA) | 2,170,000 | 2,176,749 | ||||||
| (University of Northern Colorado Student Housing Project) | ||||||||
| 5.125% 7/1/37 (NATL-RE) | 4,000,000 | 4,000,680 | ||||||
| (Woodrow Wilson Charter School Project) | ||||||||
| 5.25% 12/1/34 (XLCA) | 1,960,000 | 1,979,071 | ||||||
| Colorado School Mines Auxiliary Facilities | ||||||||
| 5.00% 12/1/37 (AMBAC) | 425,000 | 428,838 | ||||||
| Colorado State Board Governors University | ||||||||
| Enterprise System Revenue Series A | ||||||||
| 5.00% 3/1/39 | 2,300,000 | 2,463,507 | ||||||
| University of Colorado Enterprise System Revenue Series A | ||||||||
| 5.00% 6/1/30 (AMBAC) | 2,000,000 | 2,139,320 | ||||||
| University of Puerto Rico System Revenue Series Q | ||||||||
| 5.00% 6/1/36 | 2,750,000 | 2,755,225 | ||||||
| 29,680,306 | ||||||||
| Electric Revenue Bonds – 8.51% | ||||||||
| Colorado Springs Utilities Revenue Series A | ||||||||
| 5.00% 11/15/29 | 5,000,000 | 5,200,850 | ||||||
| Platte River Power Authority Revenue Series HH | ||||||||
| 5.00% 6/1/27 | 2,795,000 | 3,191,079 | ||||||
| 5.00% 6/1/29 | 2,355,000 | 2,650,341 | ||||||
47
Statements of net assets
Delaware Tax-Free Colorado Fund
Delaware Tax-Free Colorado Fund
| Principal amount | Value | |||||||
| Municipal Bonds (continued) | ||||||||
| Electric Revenue Bonds (continued) | ||||||||
| Puerto Rico Electric Power Authority Revenue | ||||||||
| Series TT 5.00% 7/1/37 | $ | 525,000 | $ | 538,088 | ||||
| Series WW 5.00% 7/1/28 | 2,400,000 | 2,518,728 | ||||||
| Series WW 5.50% 7/1/38 | 1,000,000 | 1,059,920 | ||||||
| Series XX 5.25% 7/1/40 | 2,500,000 | 2,621,175 | ||||||
| Series ZZ 5.25% 7/1/26 | 3,500,000 | 3,858,610 | ||||||
| 21,638,791 | ||||||||
| Healthcare Revenue Bonds – 23.22% | ||||||||
| Aurora Hospital Revenue | ||||||||
| (Childrens Hospital Association Project) | ||||||||
| Series A 5.00% 12/1/40 | 2,000,000 | 2,047,920 | ||||||
| (Childrens Hospital) Series D 5.00% 12/1/23 (AGM) | 2,775,000 | 3,054,470 | ||||||
| Colorado Health Facilities Authority Revenue | ||||||||
| •(Adventist Health/Sunbelt) 5.125% 11/15/24 | 1,375,000 | 1,449,910 | ||||||
| (Catholic Health Initiatives) | ||||||||
| Series A 4.75% 9/1/40 | 1,000,000 | 1,022,520 | ||||||
| Series A 5.00% 7/1/39 | 2,500,000 | 2,608,650 | ||||||
| Series D 6.25% 10/1/33 | 2,000,000 | 2,277,460 | ||||||
| (Christian Living Community Project) | ||||||||
| Series A 5.75% 1/1/37 | 1,500,000 | 1,364,130 | ||||||
| (Covenant Retirement Communities) | ||||||||
| Series A 5.50% 12/1/33 (RADIAN) | 5,000,000 | 4,784,750 | ||||||
| (Evangelical Lutheran) | ||||||||
| 5.00% 6/1/35 | 2,000,000 | 1,952,660 | ||||||
| 6.125% 6/1/38 | 5,250,000 | 5,411,227 | ||||||
| Series A 5.25% 6/1/34 | 2,750,000 | 2,753,465 | ||||||
| (Parkview Medical Center) 5.00% 9/1/25 | 1,000,000 | 1,018,000 | ||||||
| (Porter Place) Series A 6.00% 1/20/36 (GNMA) | 5,000,000 | 5,053,500 | ||||||
| (Vail Valley Medical Center Project) 5.80% 1/15/27 | 3,475,000 | 3,509,368 | ||||||
| (Valley View Hospital Association) 5.50% 5/15/28 | 1,000,000 | 1,036,740 | ||||||
| Colorado Springs Hospital Revenue 6.25% 12/15/33 | 2,500,000 | 2,749,225 | ||||||
| Delta County Memorial Hospital District Enterprise | ||||||||
| Revenue 5.35% 9/1/17 | 4,000,000 | 4,081,960 | ||||||
| Denver Health & Hospital Authority Health Care Revenue | ||||||||
| 5.625% 12/1/40 | 2,500,000 | 2,545,575 | ||||||
| Series A 4.75% 12/1/36 | 1,500,000 | 1,310,730 | ||||||
48
| Principal amount | Value | |||||||
| Municipal Bonds (continued) | ||||||||
| Healthcare Revenue Bonds (continued) | ||||||||
| University of Colorado Hospital Authority Revenue Series A | ||||||||
| 5.00% 11/15/37 | $ | 2,690,000 | $ | 2,708,373 | ||||
| 5.25% 11/15/39 | 3,500,000 | 3,575,775 | ||||||
| 6.00% 11/15/29 | 2,460,000 | 2,681,203 | ||||||
| 58,997,611 | ||||||||
| Housing Revenue Bonds – 2.10% | ||||||||
| Colorado Housing & Finance Authority | ||||||||
| (Multifamily Housing Insured Mortgage) | ||||||||
| Series C3 6.15% 10/1/41 | 1,590,000 | 1,591,670 | ||||||
| (Single Family Mortgage) Series A 5.50% 11/1/29 (FHA) | 1,500,000 | 1,617,735 | ||||||
| Puerto Rico Housing Finance Authority | ||||||||
| Subordinate (Capital Foundation of Modernization) | ||||||||
| 5.125% 12/1/27 | 2,040,000 | 2,126,210 | ||||||
| 5,335,615 | ||||||||
| Lease Revenue Bonds – 3.59% | ||||||||
| Aurora Certificates of Participation Refunding Series A | ||||||||
| 5.00% 12/1/30 | 2,370,000 | 2,570,669 | ||||||
| Colorado Educational & Cultural National | ||||||||
| Conference of State Legislatures Office Building | ||||||||
| Facilities Authority Revenue 5.25% 6/1/21 | 2,000,000 | 2,022,160 | ||||||
| @ | Conejos & Alamosa Counties School #11J | |||||||
| Certificates of Participation 6.50% 4/1/11 | 355,000 | 355,777 | ||||||
| El Paso County Certificates of Participation | ||||||||
| (Detention Facilities Project) Series B | ||||||||
| 5.00% 12/1/27 (AMBAC) | 1,500,000 | 1,595,265 | ||||||
| Puerto Rico Public Buildings Authority Revenue | ||||||||
| (Guaranteed Government Facilities) | ||||||||
| Series I 5.25% 7/1/33 | 1,475,000 | 1,498,408 | ||||||
| •Series M-2 5.50% 7/1/35 (AMBAC) | 1,000,000 | 1,091,980 | ||||||
| 9,134,259 | ||||||||
| Local General Obligation Bonds – 13.38% | ||||||||
| Adams & Arapahoe Counties Joint School | ||||||||
| District #28J (Aurora) 6.00% 12/1/28 | 2,500,000 | 2,996,875 | ||||||
| Arapahoe County Water & Wastewater Public | ||||||||
| Improvement District Refunding Series A | ||||||||
| 5.125% 12/1/32 (NATL-RE) | 2,555,000 | 2,588,624 | ||||||
49
Statements of net assets
Delaware Tax-Free Colorado Fund
Delaware Tax-Free Colorado Fund
| Principal amount | Value | |||||||
| Municipal Bonds (continued) | ||||||||
| Local General Obligation Bonds (continued) | ||||||||
| Boulder Larimer & Weld Counties | ||||||||
| (St. Vrain Valley School District #1J) | ||||||||
| 5.00% 12/15/33 | $ | 2,500,000 | $ | 2,686,625 | ||||
| Denver City & County Justice System | ||||||||
| 5.50% 8/1/16 | 2,000,000 | 2,466,340 | ||||||
| (Facilities & Zoo) 5.00% 8/1/19 | 1,020,000 | 1,173,428 | ||||||
| Denver City & County School District #1 Series A | ||||||||
| 5.00% 12/1/29 | 960,000 | 1,062,720 | ||||||
| Denver West Metropolitan District | ||||||||
| 5.00% 12/1/33 (RADIAN) | 1,400,000 | 1,315,650 | ||||||
| Douglas County School District #1 | ||||||||
| (Douglas & Elbert Counties) Series B | ||||||||
| 5.00% 12/15/24 | 2,355,000 | 2,655,522 | ||||||
| El Paso County School District #2 (Harrison) | ||||||||
| 5.00% 12/1/27 (NATL-RE) | 2,115,000 | 2,258,968 | ||||||
| Garfield County School District #2 | ||||||||
| 5.00% 12/1/25 (AGM) | 2,280,000 | 2,559,414 | ||||||
| Grand County School District #2 (East Grand) | ||||||||
| 5.25% 12/1/25 (AGM) | 2,485,000 | 2,804,447 | ||||||
| Gunnison Watershed School District #1J Series 2009 | ||||||||
| 5.25% 12/1/33 | 1,400,000 | 1,536,808 | ||||||
| Jefferson County School District #R-001 | ||||||||
| 5.25% 12/15/24 | 2,500,000 | 3,205,524 | ||||||
| La Plata County School District #9-R (Durango) | ||||||||
| 5.125% 11/1/24 (NATL-RE) | 1,000,000 | 1,106,310 | ||||||
| @ | North Range Metropolitan | |||||||
| District #1 4.50% 12/15/31 (ACA) | 1,500,000 | 868,710 | ||||||
| District #2 5.50% 12/15/37 | 1,200,000 | 961,236 | ||||||
| Sand Creek Metropolitan District Refunding & Improvement | ||||||||
| 5.00% 12/1/31 (XLCA) | 500,000 | 470,945 | ||||||
| Weld County School District #4 5.00% 12/1/19 (AGM) | 1,085,000 | 1,293,613 | ||||||
| 34,011,759 | ||||||||
| §Pre-Refunded/Escrowed to Maturity Bonds – 11.92% | ||||||||
| Colorado Educational & Cultural Facilities | ||||||||
| Authority Revenue | ||||||||
| (Littleton Academy Charter School Project) | ||||||||
| 6.125% 1/15/31-12 | 2,000,000 | 2,155,160 | ||||||
| (Stargate Charter School Project) 6.125% 5/1/33-13 | 2,000,000 | 2,291,000 | ||||||
50
| Principal amount | Value | |||||||
| Municipal Bonds (continued) | ||||||||
| §Pre-Refunded/Escrowed to Maturity Bonds (continued) | ||||||||
| Colorado Educational & Cultural Facilities | ||||||||
| Authority Revenue (continued) | ||||||||
| (University of Denver Project) Series A | ||||||||
| 5.00% 3/1/27-12 (NATL-RE) | $ | 5,000,000 | $ | 5,347,399 | ||||
| Colorado Health Facilities Authority Revenue | ||||||||
| (Adventist Health/Sunbelt) 5.125% 11/15/24-16 | 75,000 | 91,563 | ||||||
| (Catholic Health Initiatives) Series A 5.50% 3/1/32 | 5,000,000 | 5,384,749 | ||||||
| Douglas County School District #1 | ||||||||
| (Douglas & Elbert Counties) Series B | ||||||||
| 5.125% 12/15/25-12 (AGM) | 2,000,000 | 2,214,700 | ||||||
| Fremont County School District #1 (Canon City) | ||||||||
| 5.00% 12/1/24-13 (NATL-RE) | 1,735,000 | 1,985,222 | ||||||
| Garfield County School District #2 | ||||||||
| 5.00% 12/1/25 (AGM) | 1,000,000 | 1,101,930 | ||||||
| Garfield Pitkin & Eagle County School District #Re-1 | ||||||||
| (Roaring Fork County) Series A 5.00% 12/15/27-14 (AGM) | 1,500,000 | 1,759,125 | ||||||
| Lincoln Park Metropolitan District 7.75% 12/1/26-11 | 2,500,000 | 2,744,225 | ||||||
| North Range Metropolitan District #1 7.25% 12/15/31-11 | 3,385,000 | 3,671,980 | ||||||
| Puerto Rico Commonwealth Series A 5.25% 7/1/30-16 | 1,235,000 | 1,509,331 | ||||||
| Puerto Rico Public Buildings Authority Revenue | ||||||||
| (Guaranteed Government Facilities) Series I | ||||||||
| 5.25% 7/1/33-14 | 25,000 | 29,197 | ||||||
| 30,285,581 | ||||||||
| Special Tax Revenue Bonds – 10.52% | ||||||||
| Aspen Sales Tax Revenue (Parks & Open Spaces) | ||||||||
| Series B 5.25% 11/1/23 (AGM) | 2,040,000 | 2,263,033 | ||||||
| @ | Baptist Road Rural Transportation Authority Sales & | |||||||
| Use Tax Revenue 5.00% 12/1/26 | 2,000,000 | 1,368,960 | ||||||
| Park Meadows Business Improvement District | ||||||||
| Shared Sales Tax Revenue | ||||||||
| 5.30% 12/1/27 | 950,000 | 879,045 | ||||||
| 5.35% 12/1/31 | 720,000 | 646,618 | ||||||
| Puerto Rico Commonwealth Highway & Transportation | ||||||||
| Authority Revenue Series K 5.00% 7/1/30 | 4,700,000 | 4,798,747 | ||||||
| Puerto Rico Sales Tax Financing Corporation | ||||||||
| Revenue First Subordinate | ||||||||
| ΩCapital Appreciation Series A | ||||||||
| 6.75% 8/1/32 | 5,075,000 | 4,385,612 | ||||||
51
Statements of net assets
Delaware Tax-Free Colorado Fund
Delaware Tax-Free Colorado Fund
| Principal amount | Value | |||||||
| Municipal Bonds (continued) | ||||||||
| Special Tax Revenue Bonds (continued) | ||||||||
| • | Puerto Rico Sales Tax Financing Corporation | |||||||
| Revenue First Subordinate | ||||||||
| Series A 5.00% 8/1/39 | $ | 2,500,000 | $ | 2,609,250 | ||||
| Series A 5.00% 7/1/46 | 1,200,000 | 1,200,876 | ||||||
| Series A 5.25% 8/1/27 | 1,100,000 | 1,197,075 | ||||||
| Series A 5.75% 8/1/37 | 2,620,000 | 2,808,535 | ||||||
| Series C 6.00% 8/1/39 | 1,900,000 | 2,103,433 | ||||||
| Regional Transportation District Sales Tax Revenue | ||||||||
| Series A 5.25% 11/1/18 | 2,000,000 | 2,465,420 | ||||||
| 26,726,604 | ||||||||
| State & Territory General Obligation Bonds – 5.78% | ||||||||
| Guam Government Series A 7.00% 11/15/39 | 2,500,000 | 2,799,800 | ||||||
| Puerto Rico Commonwealth Government Development | ||||||||
| Bank Senior Notes Series B 5.00% 12/1/15 | 1,000,000 | 1,089,540 | ||||||
| Puerto Rico Commonwealth Public Improvement | ||||||||
| Series A 5.25% 7/1/21 | 4,000,000 | 4,157,999 | ||||||
| Series C 6.00% 7/1/39 | 1,685,000 | 1,829,051 | ||||||
| Refunding Series A 5.25% 7/1/15 | 1,650,000 | 1,812,377 | ||||||
| Puerto Rico Commonwealth | ||||||||
| Series A 5.25% 7/1/30 | 765,000 | 793,703 | ||||||
| Series B 5.00% 7/1/35 | 190,000 | 192,094 | ||||||
| Virgin Islands Public Finance Authority Revenue | ||||||||
| (Gross Receipts Taxes Loan Note) | ||||||||
| 5.00% 10/1/31 (ACA) | 2,000,000 | 2,025,680 | ||||||
| 14,700,244 | ||||||||
| Transportation Revenue Bonds – 4.49% | ||||||||
| Denver City & County Airport Revenue | ||||||||
| 5.25% 11/15/36 | 2,500,000 | 2,672,925 | ||||||
| Series A 5.00% 11/15/25 (FGIC) (NATL-RE) | 2,000,000 | 2,160,140 | ||||||
| Series B 5.00% 11/15/33 (XLCA) | 4,000,000 | 4,051,680 | ||||||
| Regional Transportation District Private Activity Revenue | ||||||||
| (Denver Transit Partners) 6.00% 1/15/41 | 2,400,000 | 2,518,272 | ||||||
| 11,403,017 | ||||||||
52
| Principal amount | Value | |||||||||
| Municipal Bonds (continued) | ||||||||||
| Water & Sewer Revenue Bonds – 2.30% | ||||||||||
| Colorado Springs Utilities Systems Improvement Revenue | ||||||||||
| Series C 5.50% 11/15/48 | $ | 3,250,000 | $ | 3,528,265 | ||||||
| Eagle River Water & Sanitation District Enterprise Revenue | ||||||||||
| 5.00% 12/1/29 (ASSURED GTY) | 250,000 | 274,940 | ||||||||
| 5.125% 12/1/39 (ASSURED GTY) | 850,000 | 908,013 | ||||||||
| Pueblo Board Waterworks Revenue 5.00% 11/1/21 (AGM) | 1,000,000 | 1,125,390 | ||||||||
| 5,836,608 | ||||||||||
| Total Municipal Bonds (cost $237,107,743) | 250,654,145 | |||||||||
| Number of shares | ||||||||||
| Short-Term Investment – 0.15% | ||||||||||
| Money Market Instrument – 0.15% | ||||||||||
| Dreyfus Cash Management Fund | 378,388 | 378,388 | ||||||||
| Total Short-Term Investment (cost $378,388) | 378,388 | |||||||||
| Total Value of Securities – 98.78% | ||||||||||
| (cost $237,486,131) | 251,032,533 | |||||||||
| Receivables and Other Assets | ||||||||||
| Net of Liabilities – 1.22% | 3,096,639 | |||||||||
| Net Assets Applicable to 22,562,720 | ||||||||||
| Shares Outstanding – 100.00% | $ | 254,129,172 | ||||||||
| Net Asset Value – Delaware Tax-Free Colorado Fund | ||||||||||
| Class A ($237,544,608 / 21,093,720 Shares) | $11.26 | |||||||||
| Net Asset Value – Delaware Tax-Free Colorado Fund | ||||||||||
| Class B ($1,429,564 / 126,844 Shares) | $11.27 | |||||||||
| Net Asset Value – Delaware Tax-Free Colorado Fund | ||||||||||
| Class C ($15,155,000 / 1,342,156 Shares) | $11.29 | |||||||||
| Components of Net Assets at August 31, 2010: | ||||||||||
| Shares of beneficial interest (unlimited authorization – no par) | $ | 243,576,419 | ||||||||
| Accumulated net realized loss on investments | (2,993,649 | ) | ||||||||
| Net unrealized appreciation of investments | 13,546,402 | |||||||||
| Total net assets | $ | 254,129,172 | ||||||||
53
Statements of net assets
Delaware Tax-Free Colorado Fund
Delaware Tax-Free Colorado Fund
| • | Variable rate security. The rate shown is the rate as of August 31, 2010. Interest rates reset periodically. |
| @ | Illiquid security. At August 31, 2010, the aggregate amount of illiquid securities was $3,554,683, which represented 1.40% of the Fund’s net assets. See Note 8 in “Notes to financial statements.” |
| § | Pre-Refunded bonds. Municipal bonds that are generally backed or secured by U.S. Treasury bonds. For Pre-Refunded Bonds, the stated maturity is followed by the year in which the bond is pre-refunded. See Note 8 in “Notes to financial statements.” |
| Ω | Step coupon bond. Indicates security that has a zero coupon that remains in effect until a predetermined date at which time the stated interest rate becomes effective. |
Summary of abbreviations:
ACA — Insured by American Capital Access
AGM — Insured by Assured Guaranty Municipal Corporation
AMBAC — Insured by the AMBAC Assurance Corporation
ASSURED GTY — Insured by the Assured Guaranty Corporation
FGIC — Insured by the Financial Guaranty Insurance Company
FHA — Insured by the Federal Housing Administration
GNMA — Government National Mortgage Association collateral
NATL-RE — Insured by the National Public Finance Guarantee Corporation
RADIAN — Insured by Radian Asset Assurance
XLCA — Insured by XL Capital Assurance
| Net Asset Value and Offering Price Per Share – | ||
| Delaware Tax-Free Colorado Fund | ||
| Net asset value Class A (A) | $ | 11.26 |
| Sales charge (4.50% of offering price) (B) | 0.53 | |
| Offering price | $ | 11.79 |
| (A) | Net asset value per share, as illustrated, is the amount which would be paid upon redemption or repurchase of shares. | |
| (B) | See the current prospectus for purchases of $100,000 or more. |
See accompanying Notes, which are an integral part of the financial statements.
54
| Delaware Tax-Free Idaho Fund | August 31, 2010 |
| Principal amount | Value | |||||||
| Municipal Bonds – 98.42% | ||||||||
| Corporate Revenue Bonds – 3.43% | ||||||||
| Nez Perce County Pollution Control Revenue | ||||||||
| (Potlatch Project) 6.00% 10/1/24 | $ | 1,285,000 | $ | 1,271,340 | ||||
| Power County Pollution Control Revenue | ||||||||
| (FMC Project) 5.625% 10/1/14 | 2,475,000 | 2,475,520 | ||||||
| Puerto Rico Ports Authority Revenue | ||||||||
| (American Airlines Special Facilities) | ||||||||
| 6.30% 6/1/23 (AMT) | 1,295,000 | 1,136,803 | ||||||
| 4,883,663 | ||||||||
| Education Revenue Bonds – 10.95% | ||||||||
| Boise State University Revenue | ||||||||
| 5.00% 4/1/17 (AMBAC) | 500,000 | 536,110 | ||||||
| Series A 4.25% 4/1/32 (NATL-RE) | 1,500,000 | 1,517,145 | ||||||
| Series A 5.00% 4/1/18 (NATL-RE) (FGIC) | 1,500,000 | 1,638,510 | ||||||
| Series A 5.00% 4/1/39 | 1,000,000 | 1,069,760 | ||||||
| Un-Refunded Series 07 5.375% 4/1/22 (FGIC) | 15,000 | 15,872 | ||||||
| Idaho Housing & Financing Association Nonprofit | ||||||||
| Facilities Revenue (North Star Charter School Project) | ||||||||
| Series A 9.50% 7/1/39 | 1,000,000 | 1,175,480 | ||||||
| Idaho State University Revenue Refunding & Improvement | ||||||||
| 5.00% 4/1/20 (AGM) | 1,130,000 | 1,234,808 | ||||||
| 5.00% 4/1/23 (AGM) | 2,115,000 | 2,217,196 | ||||||
| University Idaho (General Refunding) | ||||||||
| •Series 2011 5.25% 4/1/41 | 2,000,000 | 2,198,660 | ||||||
| Series A 5.00% 4/1/21 (AMBAC) | 1,150,000 | 1,254,110 | ||||||
| •Series B 4.50% 4/1/41 (AGM) | 1,000,000 | 1,083,950 | ||||||
| Series B 5.00% 4/1/28 | 1,000,000 | 1,104,060 | ||||||
| Series B 5.00% 4/1/32 | 500,000 | 537,810 | ||||||
| 15,583,471 | ||||||||
| Electric Revenue Bonds – 5.85% | ||||||||
| Boise-Kuna Idaho Irrigation District Revenue | ||||||||
| (Arrowrock Hydroelectric Project) 6.30% 6/1/31 | 1,000,000 | 1,105,230 | ||||||
| Puerto Rico Electric Power Authority Revenue | ||||||||
| Series TT 5.00% 7/1/37 | 210,000 | 215,235 | ||||||
| Series WW 5.50% 7/1/38 | 400,000 | 423,968 | ||||||
| Series XX 5.25% 7/1/40 | 4,170,000 | 4,372,120 | ||||||
| Series ZZ 5.25% 7/1/26 | 2,000,000 | 2,204,920 | ||||||
| 8,321,473 | ||||||||
55
Statements of net assets
Delaware Tax-Free Idaho Fund
Delaware Tax-Free Idaho Fund
| Principal amount | Value | |||||||
| Municipal Bonds (continued) | ||||||||
| Healthcare Revenue Bonds – 3.62% | ||||||||
| Idaho Health Facilities Authority Revenue | ||||||||
| (St. Luke’s Medical Center Project) | ||||||||
| 5.00% 7/1/35 (AGM) | $ | 2,500,000 | $ | 2,581,225 | ||||
| 6.75% 11/1/37 | 1,250,000 | 1,422,025 | ||||||
| (Trinity Health Credit Group) Series B 6.125% 12/1/28 | 1,000,000 | 1,142,710 | ||||||
| 5,145,960 | ||||||||
| Housing Revenue Bonds – 5.97% | ||||||||
| Idaho Housing Agency Single Family Mortgage Revenue | ||||||||
| Series A 6.05% 7/1/13 (AMBAC) (FHA) (VA) (AMT) | 10,000 | 10,019 | ||||||
| Series A 6.10% 7/1/16 (FHA) (VA) (AMT) | 20,000 | 20,037 | ||||||
| Series B 6.45% 7/1/15 (AMT) | 10,000 | 10,020 | ||||||
| Series C-2 6.35% 7/1/15 (AMT) | 10,000 | 10,020 | ||||||
| Series E 6.35% 7/1/15 (FHA) (AMT) | 15,000 | 15,029 | ||||||
| Series G-2 6.15% 7/1/15 (FHA) (VA) (AMT) | 55,000 | 55,103 | ||||||
| Idaho Housing & Finance Association Single | ||||||||
| Family Mortgage Revenue | ||||||||
| Series B Class I 5.00% 7/1/37 (AMT) | 815,000 | 825,073 | ||||||
| Series B Class I 5.50% 7/1/38 | 900,000 | 955,512 | ||||||
| Series C Class II 4.95% 7/1/31 | 1,000,000 | 1,034,650 | ||||||
| Series C Class III 5.35% 1/1/25 (AMT) | 215,000 | 221,050 | ||||||
| Series D Class III 5.45% 7/1/23 (AMT) | 750,000 | 771,518 | ||||||
| Series E 4.85% 7/1/28 (AMT) | 1,475,000 | 1,490,090 | ||||||
| Series E Class III 4.875% 1/1/26 (AMT) | 140,000 | 141,873 | ||||||
| Series E Class III 5.00% 1/1/28 (AMT) | 865,000 | 866,808 | ||||||
| Series I Class I 5.45% 1/1/39 (AMT) | 1,000,000 | 1,022,170 | ||||||
| Puerto Rico Housing Finance Authority Subordinate- | ||||||||
| Capital Foundation Modernization | ||||||||
| 5.125% 12/1/27 | 1,000,000 | 1,042,260 | ||||||
| 8,491,232 | ||||||||
| Lease Revenue Bonds – 3.12% | ||||||||
| Boise City Certificate of Participation | ||||||||
| 5.375% 9/1/20 (NATL-RE) (FGIC) (AMT) | 2,100,000 | 2,115,246 | ||||||
| Boise City Revenue Series A 5.375% 12/1/31 (NATL-RE) | 500,000 | 522,425 | ||||||
| Idaho State Building Authority Revenue | ||||||||
| Series A 5.00% 9/1/43 (XLCA) | 1,000,000 | 1,016,900 | ||||||
| Series B 5.00% 9/1/21 (NATL-RE) | 750,000 | 779,873 | ||||||
| 4,434,444 | ||||||||
56
| Principal amount | Value | |||||||
| Municipal Bonds (continued) | ||||||||
| Local General Obligation Bonds – 20.04% | ||||||||
| Ada & Canyon Counties Joint School District #2 | ||||||||
| Meridian (School Board Guaranteed Program) | ||||||||
| 4.50% 7/30/22 | $ | 1,500,000 | $ | 1,758,855 | ||||
| 4.75% 2/15/20 | 1,000,000 | 1,108,010 | ||||||
| 5.50% 7/30/16 | 1,305,000 | 1,606,860 | ||||||
| Bannock County School District #025 | ||||||||
| (Pocatello Idaho School Board Guaranteed Program) | ||||||||
| 5.00% 8/15/15 | 1,040,000 | 1,198,881 | ||||||
| 5.00% 8/15/16 | 1,100,000 | 1,254,132 | ||||||
| Boise City Independent School District | ||||||||
| 5.00% 8/1/24 (AGM) | 1,500,000 | 1,715,595 | ||||||
| Canyon County School District #132 Caldwell | ||||||||
| 5.00% 7/30/15 (NATL-RE) | 2,000,000 | 2,319,540 | ||||||
| Series A 5.00% 9/15/22 (AGM) | 1,725,000 | 2,023,632 | ||||||
| Series A 5.00% 9/15/23 (AGM) | 1,810,000 | 2,107,112 | ||||||
| City of Nampa 5.00% 8/1/21 (NATL-RE) | 2,475,000 | 2,707,822 | ||||||
| Idaho Board Bank Authority Revenue | ||||||||
| Series A 5.00% 9/15/28 | 1,000,000 | 1,135,550 | ||||||
| Series A 5.25% 9/15/26 | 2,000,000 | 2,349,080 | ||||||
| Series C 4.00% 9/15/29 | 1,320,000 | 1,380,654 | ||||||
| Lemhi County 5.20% 8/1/27 (AGM) | 2,145,000 | 2,299,912 | ||||||
| Power & Cassia Counties Joint School District #381 | ||||||||
| American Falls 5.00% 8/1/17 | 1,155,000 | 1,202,101 | ||||||
| Twin Falls County School District #413 Filer 5.25% 9/15/25 | 2,000,000 | 2,354,439 | ||||||
| 28,522,175 | ||||||||
| §Pre-Refunded Bonds – 12.29% | ||||||||
| Ada & Canyon Counties Joint School District #2 | ||||||||
| Meridian (School Board Guaranteed Program) | ||||||||
| 5.00% 7/30/20-12 | 1,555,000 | 1,689,958 | ||||||
| 5.125% 7/30/19-12 | 1,005,000 | 1,094,626 | ||||||
| Un-Refunded 5.00% 7/30/20-12 | 600,000 | 652,074 | ||||||
| Boise State University Revenue Refunding & Improvement | ||||||||
| 5.125% 4/1/31-12 (FGIC) | 1,000,000 | 1,076,400 | ||||||
| 5.375% 4/1/22-12 (FGIC) | 985,000 | 1,064,145 | ||||||
| Puerto Rico Commonwealth Highway & Transportation | ||||||||
| Authority Revenue | ||||||||
| Series D 5.25% 7/1/38-12 | 1,000,000 | 1,086,280 | ||||||
| Series Y 5.00% 7/1/36-16 | 1,250,000 | 1,510,150 | ||||||
57
Statements of net assets
Delaware Tax-Free Idaho Fund
Delaware Tax-Free Idaho Fund
| Principal amount | Value | |||||||
| Municipal Bonds (continued) | ||||||||
| §Pre-Refunded Bonds (continued) | ||||||||
| Puerto Rico Commonwealth Infrastructure Financing | ||||||||
| Authority Revenue Series A 5.375% 10/1/24-10 | $ | 1,750,000 | $ | 1,775,060 | ||||
| Puerto Rico Commonwealth Public Improvement | ||||||||
| Revenue Series A 5.125% 7/1/31-11 | 1,010,000 | 1,051,784 | ||||||
| Puerto Rico Electric Power Authority Revenue | ||||||||
| Series II 5.25% 7/1/31-12 | 1,000,000 | 1,100,470 | ||||||
| Series NN 5.125% 7/1/29-13 | 105,000 | 118,947 | ||||||
| Series RR 5.00% 7/1/35-15 (FGIC) | 1,545,000 | 1,840,296 | ||||||
| Puerto Rico Public Buildings Authority Revenue | ||||||||
| (Guaranteed Government Facilities) | ||||||||
| Series I 5.50% 7/1/23-14 | 1,000,000 | 1,177,280 | ||||||
| University of Idaho Revenue (Student Fee Housing | ||||||||
| Improvements Project) 5.25% 4/1/31-11 (FGIC) | 2,195,000 | 2,258,852 | ||||||
| 17,496,322 | ||||||||
| Special Tax Revenue Bonds – 17.27% | ||||||||
| Boise Urban Renewal Agency Parking | ||||||||
| Revenue (Tax Increment) | ||||||||
| Series A 6.125% 9/1/15 | 1,160,000 | 1,177,330 | ||||||
| Series B 6.125% 9/1/15 | 950,000 | 964,193 | ||||||
| Coeur D’Alene Local Improvement District #6 | ||||||||
| Series 1997 6.10% 7/1/12 | 40,000 | 40,523 | ||||||
| Series 1998 6.10% 7/1/14 | 45,000 | 45,529 | ||||||
| Idaho Board Bank Authority Revenue Series B | ||||||||
| 4.125% 9/15/36 (NATL-RE) | 755,000 | 761,418 | ||||||
| 5.00% 9/15/30 (NATL-RE) | 725,000 | 787,633 | ||||||
| Ketchum Urban Renewal Agency 5.50% 10/15/34 | 1,500,000 | 1,519,650 | ||||||
| Puerto Rico Commonwealth Highway & Transportation | ||||||||
| Authority Revenue | ||||||||
| Series K 5.00% 7/1/30 | 890,000 | 908,699 | ||||||
| Series W 5.50% 7/1/15 | 175,000 | 194,175 | ||||||
| Puerto Rico Sales Tax Financing Corporate | ||||||||
| Revenue First Subordinate | ||||||||
| ΩCapital Appreciation Series A 6.75% 8/1/32 | 5,040,000 | 4,355,366 | ||||||
| Series A 5.25% 8/1/27 | 3,000,000 | 3,264,750 | ||||||
| Series A 5.50% 8/1/42 | 1,500,000 | 1,593,915 | ||||||
| Series A 6.00% 8/1/39 | 1,000,000 | 1,107,070 | ||||||
| Series C 5.25% 8/1/41 | 1,500,000 | 1,570,800 | ||||||
| Series C 5.75% 8/1/37 | 2,660,000 | 2,851,414 | ||||||
58
| Principal amount | Value | |||||||
| Municipal Bonds (continued) | ||||||||
| Special Tax Revenue Bonds (continued) | ||||||||
| Virgin Islands Public Finance Authority Revenue | ||||||||
| (Senior Lien-Matching Fund Loan Note) Series A | ||||||||
| 5.00% 10/1/29 | $ | 1,500,000 | $ | 1,549,140 | ||||
| 5.25% 10/1/20 | 500,000 | 530,995 | ||||||
| 5.25% 10/1/21 | 500,000 | 527,845 | ||||||
| 5.25% 10/1/24 | 800,000 | 833,936 | ||||||
| 24,584,381 | ||||||||
| State General Obligation Bonds – 6.41% | ||||||||
| Guam Government Series A 6.75% 11/15/29 | 1,565,000 | 1,724,865 | ||||||
| Puerto Rico Commonwealth Government Development | ||||||||
| Bank Refunding Remarketed 4.75% 12/1/15 (NATL-RE) | 1,000,000 | 1,044,080 | ||||||
| Puerto Rico Commonwealth Public Improvement | ||||||||
| Series A 5.125% 7/1/31 | 1,815,000 | 1,823,331 | ||||||
| Series A 5.25% 7/1/22 | 1,000,000 | 1,036,100 | ||||||
| Series C 6.00% 7/1/39 | 1,500,000 | 1,628,235 | ||||||
| Un-Refunded Balance Series A 5.00% 7/1/34 | 1,855,000 | 1,871,602 | ||||||
| 9,128,213 | ||||||||
| Transportation Revenue Bonds – 7.06% | ||||||||
| Idaho Housing & Finance Association Grant Revenue | ||||||||
| (Anticipated Federal Highway Trust) | ||||||||
| 4.00% 7/15/17 | 500,000 | 562,190 | ||||||
| 4.75% 7/15/19 | 1,410,000 | 1,662,348 | ||||||
| 5.00% 7/15/24 (NATL-RE) | 2,000,000 | 2,188,340 | ||||||
| 5.25% 7/15/20 (ASSURED GTY) | 2,750,000 | 3,244,889 | ||||||
| 5.25% 7/15/25 (ASSURED GTY) | 1,500,000 | 1,698,495 | ||||||
| Puerto Rico Commonwealth Highway & Transportation | ||||||||
| Authority Revenue Un-Refunded Balance | ||||||||
| Series G 5.00% 7/1/33 | 690,000 | 695,755 | ||||||
| 10,052,017 | ||||||||
| Water & Sewer Revenue Bonds – 2.41% | ||||||||
| Idaho Bond Bank Authority Revenue | ||||||||
| Series C 5.375% 9/15/38 | 1,000,000 | 1,111,500 | ||||||
| Moscow Sewer Revenue 5.00% 11/1/22 (AGM) | 2,175,000 | 2,326,380 | ||||||
| 3,437,880 | ||||||||
| Total Municipal Bonds (cost $130,331,043) | 140,081,231 | |||||||
59
Statements of net assets
Delaware Tax-Free Idaho Fund
Delaware Tax-Free Idaho Fund
| Number of shares | Value | |||||||||
| Short-Term Investments – 2.11% | ||||||||||
| Money Market Instrument – 0.21% | ||||||||||
| Dreyfus Cash Management Fund | 297,518 | $ | 297,518 | |||||||
| 297,518 | ||||||||||
| Principal amount | ||||||||||
| •Variable Rate Demand Note – 1.90% | ||||||||||
| Power County Pollution Control Revenue | ||||||||||
| (FMC Project) 0.25% 12/1/10 | $ | 2,700,000 | 2,700,000 | |||||||
| 2,700,000 | ||||||||||
| Total Short-Term Investments | ||||||||||
| (cost $2,997,518) | 2,997,518 | |||||||||
| Total Value of Securities – 100.53% | ||||||||||
| (cost $133,328,561) | 143,078,749 | |||||||||
| Liabilities Net of Receivables | ||||||||||
| and Other Assets – (0.53%) | (751,149 | ) | ||||||||
| Net Assets Applicable to 11,742,239 | ||||||||||
| Shares Outstanding – 100.00% | $ | 142,327,600 | ||||||||
| Net Asset Value – Delaware Tax-Free Idaho Fund | ||||||||||
| Class A ($104,287,008 / 8,601,896 Shares) | $12.12 | |||||||||
| Net Asset Value – Delaware Tax-Free Idaho Fund | ||||||||||
| Class B ($2,449,594 / 202,425 Shares) | $12.10 | |||||||||
| Net Asset Value – Delaware Tax-Free Idaho Fund | ||||||||||
| Class C ($35,590,998 / 2,937,918 Shares) | $12.11 | |||||||||
| Components of Net Assets at August 31, 2010: | ||||||||||
| Shares of beneficial interest (unlimited authorization – no par) | $ | 132,577,310 | ||||||||
| Distributions in excess of net investment income | (11,219 | ) | ||||||||
| Accumulated net realized gain on investments | 11,321 | |||||||||
| Net unrealized appreciation of investments | 9,750,188 | |||||||||
| Total net assets | $ | 142,327,600 | ||||||||
60
| • | Variable rate security. The rate shown is the rate as of August 31, 2010. Interest rates reset periodically. |
| § | Pre-Refunded bonds. Municipal bonds that are generally backed or secured by U.S. Treasury bonds. For Pre-Refunded Bonds, the stated maturity is followed by the year in which the bond is pre-refunded. See Note 8 in “Notes to financial statements.” |
| Ω | Step coupon bond. Indicates security that has a zero coupon that remains in effect until a predetermined date at which time the stated interest rate becomes effective. |
Summary of abbreviations:
AGM — Insured by Assured Guaranty Municipal Corporation
AMBAC — Insured by the AMBAC Assurance Corporation
AMT — Subject to Alternative Minimum Tax
ASSURED GTY — Insured by the Assured Guaranty Corporation
FGIC — Insured by the Financial Guaranty Insurance Company
FHA — Insured by the Federal Housing Administration
NATL-RE — Insured by the National Public Finance Guarantee Corporation
VA — Veterans Administration collateral
XLCA — Insured by XL Capital Assurance
| Net Asset Value and Offering Price Per Share – | ||
| Delaware Tax-Free Idaho Fund | ||
| Net asset value Class A (A) | $12.12 | |
| Sales charge (4.50% of offering price) (B) | 0.57 | |
| Offering price | $12.69 |
| (A) | Net asset value per share, as illustrated, is the amount which would be paid upon redemption or repurchase of shares. | |
| (B) | See the current prospectus for purchases of $100,000 or more. |
See accompanying Notes, which are an integral part of the financial statements.
61
| Statements of net assets | ||
| Delaware Tax-Free New York Fund | August 31, 2010 |
| Principal amount | Value | |||||||
| Municipal Bonds – 95.94% | ||||||||
| Corporate Revenue Bonds – 6.47% | ||||||||
| Jefferson County Industrial Development Agency Solid | ||||||||
| Waste Disposal (International Paper) Series A | ||||||||
| 5.20% 12/1/20 (AMT) | $ | 350,000 | $ | 352,779 | ||||
| Liberty Development Corporation Revenue | ||||||||
| (Goldman Sachs Headquarters) 5.25% 10/1/35 | 500,000 | 528,969 | ||||||
| Nassau County Tobacco Settlement Refunding | ||||||||
| (Asset-Backed) Series A-3 5.125% 6/1/46 | 600,000 | 476,964 | ||||||
| • | New York City Industrial Development Agency | |||||||
| Special Facilities Revenue (American Airlines-JFK | ||||||||
| International Airport) | ||||||||
| 7.625% 8/1/25 (AMT) | 250,000 | 262,318 | ||||||
| 7.75% 8/1/31 (AMT) | 250,000 | 263,820 | ||||||
| New York Energy Research & Development | ||||||||
| Authority Pollution Control Revenue Refunding | ||||||||
| (Central Hudson Gas) Series A 5.45% 8/1/27 (AMBAC) | 500,000 | 501,625 | ||||||
| New York Liberty Development Corporation Revenue | ||||||||
| (Second Priority-Bank American Tower) | ||||||||
| 5.625% 7/15/47 | 500,000 | 520,615 | ||||||
| Suffolk County Industrial Development Agency Revenue | ||||||||
| (Keyspan-Port Jefferson Energy Center) | ||||||||
| 5.25% 6/1/27 (AMT) | 250,000 | 252,078 | ||||||
| TSASC Tobacco Settlement Refunding (Asset-Backed) | ||||||||
| Series 1 5.125% 6/1/42 | 250,000 | 202,613 | ||||||
| 3,361,781 | ||||||||
| Education Revenue Bonds – 23.75% | ||||||||
| Albany Industrial Development Agency Civic Facilities | ||||||||
| Revenue (Brighter Choice Charter School) | ||||||||
| Series A 5.00% 4/1/37 | 250,000 | 225,863 | ||||||
| Amherst Industrial Development Agency Civic Facilities | ||||||||
| Revenue (UBF Faculty Student Housing) | ||||||||
| Series A 5.75% 8/1/30 (AMBAC) | 200,000 | 202,500 | ||||||
| Dutchess County Industrial Development Agency | ||||||||
| (Marist College) 5.00% 7/1/20 | 500,000 | 521,785 | ||||||
| Hempstead Town Local Development Corporation Revenue | ||||||||
| (Molloy College Project) 5.75% 7/1/23 | 400,000 | 457,396 | ||||||
| Madison County Capital Resource Corporation Revenue | ||||||||
| (Colgate University Project) Series A 5.00% 7/1/28 | 400,000 | 453,992 | ||||||
62
| Principal amount | Value | |||||||
| Municipal Bonds (continued) | ||||||||
| Education Revenue Bonds (continued) | ||||||||
| Madison County Industrial Development Agency Civic | ||||||||
| Facility Revenue (Colgate University Project) | ||||||||
| Series A 5.00% 7/1/39 (NATL-RE) | $ | 400,000 | $ | 413,416 | ||||
| • | New York City Trust for Cultural Resources Revenue | |||||||
| (Julliard School) Series C 2.10% 4/1/36 | 500,000 | 511,040 | ||||||
| New York State Dormitory Authority Revenue | ||||||||
| (Columbia University) Series A 5.00% 7/1/23 | 500,000 | 547,920 | ||||||
| (Pratt Institute) Series C 5.125% 7/1/39 (ASSURED GTY) | 300,000 | 320,400 | ||||||
| •Series B 5.25% 11/15/23 | 250,000 | 268,575 | ||||||
| Series B 7.50% 5/15/11 | 125,000 | 131,014 | ||||||
| New York State Dormitory Authority Revenue Non-State | ||||||||
| Supported Debt | ||||||||
| (Brooklyn Law School) 5.75% 7/1/33 | 340,000 | 376,026 | ||||||
| (Cornell University) Series A | ||||||||
| 4.75% 7/1/29 | 100,000 | 109,942 | ||||||
| 5.00% 7/1/34 | 170,000 | 187,391 | ||||||
| 5.00% 7/1/39 | 500,000 | 548,374 | ||||||
| 5.00% 7/1/40 | 500,000 | 552,494 | ||||||
| (Manhattan Marymount) 5.00% 7/1/24 | 350,000 | 369,807 | ||||||
| (Mt. Sinai School Medicine) 5.125% 7/1/39 | 500,000 | 515,730 | ||||||
| (New York University) | ||||||||
| Series A 5.25% 7/1/34 | 500,000 | 552,164 | ||||||
| Series A 5.25% 7/1/48 | 400,000 | 432,760 | ||||||
| (Rockefeller University) Series A 5.00% 7/1/27 | 250,000 | 288,643 | ||||||
| (St. Joseph’s College) 5.25% 7/1/25 | 500,000 | 524,815 | ||||||
| (Teachers College) 5.50% 3/1/39 | 250,000 | 270,248 | ||||||
| (University of Rochester) | ||||||||
| Series A 5.125% 7/1/39 | 250,000 | 268,913 | ||||||
| ΩSeries A-2 4.375% 7/1/20 | 250,000 | 260,563 | ||||||
| Onondaga Civic Development Corporation Revenue | ||||||||
| (Le Moyne College Project) 5.20% 7/1/29 | 500,000 | 516,290 | ||||||
| Onondaga County Trust for Cultural Resources Revenue | ||||||||
| (Syracuse University Project) Series B 5.00% 12/1/19 | 350,000 | 425,884 | ||||||
| St. Lawrence County Industrial Development Agency | ||||||||
| Civic Faculty Revenue (St. Lawrence University) | ||||||||
| Series A 5.00% 10/1/16 | 500,000 | 581,459 | ||||||
| Suffolk County Industrial Development Agency Civic | ||||||||
| Faculty Revenue Refunding (New York Institute of | ||||||||
| Technology Project) Series A 5.00% 3/1/26 | 600,000 | 617,141 | ||||||
63
Statements of net assets
Delaware Tax-Free New York Fund
Delaware Tax-Free New York Fund
| Principal amount | Value | |||||||
| Municipal Bonds (continued) | ||||||||
| Education Revenue Bonds (continued) | ||||||||
| Troy Capital Resource Corporation Revenue | ||||||||
| (Rensselaer Polytechnic) Series A 5.125% 9/1/40 | $ | 500,000 | $ | 519,635 | ||||
| Yonkers Industrial Development Agency Civic | ||||||||
| Faculty Revenue (Sarah Lawrence) | ||||||||
| Series A 6.00% 6/1/29 | 325,000 | 357,692 | ||||||
| 12,329,872 | ||||||||
| Electric Revenue Bonds – 5.44% | ||||||||
| Long Island Power Authority New York Electric System Revenue | ||||||||
| Series A 5.75% 4/1/39 | 350,000 | 394,114 | ||||||
| Series B 5.75% 4/1/33 | 250,000 | 279,968 | ||||||
| Puerto Rico Electric Power Authority Revenue | ||||||||
| Series TT 5.00% 7/1/37 | 100,000 | 102,493 | ||||||
| Series WW 5.00% 7/1/28 | 190,000 | 199,399 | ||||||
| Series WW 5.50% 7/1/38 | 200,000 | 211,984 | ||||||
| Series XX 5.75% 7/1/36 | 1,000,000 | 1,085,950 | ||||||
| Series ZZ 5.25% 7/1/26 | 500,000 | 551,230 | ||||||
| 2,825,138 | ||||||||
| Healthcare Revenue Bonds – 8.89% | ||||||||
| Albany Industrial Development Agency Civic Facility | ||||||||
| Revenue (St. Peter’s Hospital Project) | ||||||||
| Series A 5.25% 11/15/32 | 500,000 | 502,340 | ||||||
| East Rochester Housing Authority Revenue Refunding | ||||||||
| (Senior Living-Woodland Village Project) 5.50% 8/1/33 | 200,000 | 177,626 | ||||||
| New York Dormitory Authority Revenue | ||||||||
| (Catholic Health Long Island Obligation Group) 5.00% 7/1/27 | 400,000 | 408,356 | ||||||
| (Chapel Oaks) 5.45% 7/1/26 (LOC, Allied Irish Bank) | 450,000 | 450,747 | ||||||
| (Millard Fillmore Hospital) 5.375% 2/1/32 (AMBAC) (FHA) | 225,000 | 225,104 | ||||||
| (Winthrop South Nassau Hospital) Series B 5.50% 7/1/23 | 500,000 | 516,015 | ||||||
| New York Dormitory Authority Revenue Non-State | ||||||||
| Supported Debt | ||||||||
| (Memorial Sloan-Kettering) | ||||||||
| Series 1 5.00% 7/1/35 | 225,000 | 235,341 | ||||||
| Series A-2 5.00% 7/1/26 | 500,000 | 552,235 | ||||||
| (Mt. Sinai Hospital) Series A 5.00% 7/1/26 | 600,000 | 643,056 | ||||||
| (North Shore Long Island Jewish Group) | ||||||||
| Series A 5.50% 5/1/37 | 500,000 | 528,900 | ||||||
| (Orange Regional Medical Center) 6.125% 12/1/29 | 365,000 | 377,972 | ||||||
| 4,617,692 | ||||||||
64
| Principal amount | Value | |||||||
| Municipal Bonds (continued) | ||||||||
| Housing Revenue Bonds – 1.48% | ||||||||
| New York City Housing Development Multifamily Housing | ||||||||
| Revenue Series G-1 4.875% 11/1/39 (AMT) | $ | 250,000 | $ | 251,638 | ||||
| New York State Housing Finance Agency Revenue | ||||||||
| (Affordable Housing) Series A 5.25% 11/1/41 | 500,000 | 518,640 | ||||||
| 770,278 | ||||||||
| Lease Revenue Bonds – 8.45% | ||||||||
| Battery Park City Authority Revenue | ||||||||
| Series A 5.00% 11/1/26 | 250,000 | 276,025 | ||||||
| Erie County Industrial Development Agency School | ||||||||
| Faculty Revenue (City School District Buffalo) | ||||||||
| Series A 5.25% 5/1/25 | 500,000 | 572,949 | ||||||
| Hudson Yards Infrastructure Revenue | ||||||||
| Series A 5.00% 2/15/47 | 500,000 | 501,325 | ||||||
| New York City Industrial Development Agency Revenue | ||||||||
| (Queens Baseball Stadium-Pilot) 5.00% 1/1/46 (AMBAC) | 500,000 | 468,935 | ||||||
| (Yankee Stadium Project-Pilot) 5.00% 3/1/46 (FGIC) | 300,000 | 300,831 | ||||||
| New York City Industrial Development Agency Special | ||||||||
| Airport Facility Revenue (Airis JFK I Project) | ||||||||
| Series A 5.50% 7/1/28 (AMT) | 500,000 | 452,895 | ||||||
| Onondaga County Industrial Development Authority | ||||||||
| Revenue Subordinated (Air Cargo) 7.25% 1/1/32 (AMT) | 500,000 | 489,270 | ||||||
| Tobacco Settlement Financing Authority Revenue | ||||||||
| (Asset-Backed) Series B-1C | ||||||||
| 5.50% 6/1/20 | 200,000 | 219,808 | ||||||
| 5.50% 6/1/21 | 500,000 | 548,120 | ||||||
| United Nations Development Corporation Revenue | ||||||||
| Refunding Series A 5.00% 7/1/26 | 500,000 | 554,335 | ||||||
| 4,384,493 | ||||||||
| Local General Obligation Bonds – 3.56% | ||||||||
| New York City | ||||||||
| Series C-1 5.00% 10/1/19 | 500,000 | 592,075 | ||||||
| Series D 5.00% 11/1/34 | 125,000 | 135,070 | ||||||
| Series I-1 5.375% 4/1/36 | 500,000 | 553,920 | ||||||
| New York State Dormitory Authority Revenue Non-State | ||||||||
| Supported Debt (School Districts-Financing Program) | ||||||||
| Series A 5.00% 10/1/25 (AGM) | 500,000 | 565,060 | ||||||
| 1,846,125 | ||||||||
65
Statements of net assets
Delaware Tax-Free New York Fund
Delaware Tax-Free New York Fund
| Principal amount | Value | |||||||
| Municipal Bonds (continued) | ||||||||
| §Pre-Refunded Bonds – 4.44% | ||||||||
| Albany Parking Authority Revenue | ||||||||
| Series A 5.625% 7/15/25-11 | $ | 280,000 | $ | 296,209 | ||||
| New York Dormitory Authority Revenue (North Shore Long | ||||||||
| Island Jewish Group Project) 5.50% 5/1/33-13 | 500,000 | 567,695 | ||||||
| Puerto Rico Commonwealth Highway & Transportation | ||||||||
| Authority Revenue Series Y 5.50% 7/1/36-16 | 475,000 | 587,167 | ||||||
| Puerto Rico Commonwealth Series B 5.25% 7/1/32-16 | 155,000 | 189,430 | ||||||
| Puerto Rico Electric Power Authority Revenue Series NN | ||||||||
| 5.125% 7/1/29-13 | 125,000 | 141,604 | ||||||
| • | Puerto Rico Sales Tax Financing Corporation Revenue First | |||||||
| Subordinate Series A 5.00% 8/1/39-11 | 500,000 | 521,850 | ||||||
| 2,303,955 | ||||||||
| Special Tax Revenue Bonds – 19.77% | ||||||||
| Brooklyn Arena Local Development Corporation Pilot | ||||||||
| Revenue (Barclays Center Project) 6.50% 7/15/30 | 500,000 | 546,730 | ||||||
| Metropolitan Transportation Authority Revenue | ||||||||
| (Dedicated Tax Fund) Series B | ||||||||
| 5.00% 11/15/34 | 500,000 | 539,760 | ||||||
| 5.25% 11/15/22 | 500,000 | 591,565 | ||||||
| New York City Transitional Finance Authority Revenue | ||||||||
| (Subordinated Future Tax Secured) Series B 5.00% 11/1/18 | 500,000 | 592,004 | ||||||
| New York City Trust for Cultural Resources Revenue Refunding | ||||||||
| (American Museum of National History) | ||||||||
| Series A 5.00% 7/1/44 (NATL-RE) | 250,000 | 258,295 | ||||||
| (Museum of Modern Art) Series A1 | ||||||||
| 5.00% 10/1/17 | 250,000 | 303,533 | ||||||
| 5.00% 4/1/31 | 250,000 | 274,995 | ||||||
| New York Dormitory Authority State Personal Income Tax | ||||||||
| Revenue Series C 5.00% 3/15/15 | 250,000 | 293,403 | ||||||
| New York Dormitory Authority State Supported Debt Revenue | ||||||||
| (Consolidated Services Contract) 5.00% 7/1/17 (AGM) | 500,000 | 590,965 | ||||||
| New York Sales Tax Asset Receivables Series A 5.25% | ||||||||
| 10/15/27 (AMBAC) | 500,000 | 558,075 | ||||||
| New York State Thruway Authority (State Personal Income | ||||||||
| Tax Revenue-Education) Series A 5.00% 3/15/38 | 500,000 | 539,045 | ||||||
| New York State Urban Development Revenue Personal | ||||||||
| Income Tax Series A-1 5.00% 12/15/22 | 250,000 | 288,628 | ||||||
| Puerto Rico Commonwealth Highway & Transportation | ||||||||
| Authority Revenue Series K 5.00% 7/1/30 | 735,000 | 750,441 | ||||||
66
| Principal amount | Value | |||||||
| Municipal Bonds (continued) | ||||||||
| Special Tax Revenue Bonds (continued) | ||||||||
| Puerto Rico Commonwealth Infrastructure Financing | ||||||||
| Authority Revenue Series B 5.00% 7/1/15 | $ | 250,000 | $ | 270,820 | ||||
| Puerto Rico Sales Tax Financing Corporation | ||||||||
| Revenue First Subordinate | ||||||||
| ΩCapital Appreciation Series A 6.75% 8/1/32 | 510,000 | 440,722 | ||||||
| Series A 5.25% 8/1/57 | 325,000 | 332,166 | ||||||
| Series A 5.50% 8/1/42 | 500,000 | 531,305 | ||||||
| Series A 5.75% 8/1/37 | 410,000 | 439,504 | ||||||
| Series C 5.25% 8/1/41 | 500,000 | 523,600 | ||||||
| Series C 6.00% 8/1/39 | 500,000 | 553,535 | ||||||
| Schenectady Metroplex Development Authority Revenue | ||||||||
| Series A 5.375% 12/15/21 | 500,000 | 526,270 | ||||||
| Virgin Islands Public Finance Authority Revenue (Matching | ||||||||
| Fund Loan Note-Senior Lien) Series A 5.00% 10/1/29 | 500,000 | 516,380 | ||||||
| 10,261,741 | ||||||||
| State & Territory General Obligation Bonds – 4.50% | ||||||||
| Guam Government Series A 7.00% 11/15/39 | 395,000 | 442,368 | ||||||
| New York State | ||||||||
| 5.00% 2/15/18 | 380,000 | 460,321 | ||||||
| 5.00% 3/1/38 | 500,000 | 532,956 | ||||||
| 5.00% 2/15/39 | 250,000 | 268,245 | ||||||
| Puerto Rico Commonwealth Government Development | ||||||||
| Bank Refunded Remarketed 4.75% 12/1/15 (NATL-RE) | 230,000 | 240,138 | ||||||
| Puerto Rico Commonwealth Public Improvement Refunding | ||||||||
| Series C 6.00% 7/1/39 | 270,000 | 293,082 | ||||||
| Puerto Rico Commonwealth Series B 5.25% 7/1/32 | 95,000 | 98,072 | ||||||
| 2,335,182 | ||||||||
| Transportation Revenue Bonds – 6.69% | ||||||||
| Albany Parking Authority Revenue Series A 5.625% 7/15/25 | 220,000 | 224,759 | ||||||
| Metropolitan Transportation Authority Revenue | ||||||||
| Series 2008C 6.50% 11/15/28 | 200,000 | 240,248 | ||||||
| •Series B 5.00% 11/15/27 | 200,000 | 222,010 | ||||||
| Series F 5.00% 11/15/15 | 150,000 | 173,165 | ||||||
| New York State Thruway Authority General Revenue | ||||||||
| (Bond Antic Notes) | ||||||||
| Series A 4.00% 7/15/11 | 1,000,000 | 1,030,789 | ||||||
| Series H 5.00% 1/1/14 (NATL-RE) | 500,000 | 564,960 | ||||||
| Series H 5.00% 1/1/15 (NATL-RE) | 250,000 | 287,538 | ||||||
67
Statements of net assets
Delaware Tax-Free New York Fund
Delaware Tax-Free New York Fund
| Principal amount | Value | |||||||
| Municipal Bonds (continued) | ||||||||
| Transportation Revenue Bonds (continued) | ||||||||
| Port Authority New York & New Jersey | ||||||||
| (Consolidated-One Hundred Fifty-Third) 5.00% 7/15/35 | $ | 250,000 | $ | 271,565 | ||||
| Triborough Bridge & Tunnel Authority Revenue | ||||||||
| •Series B-1 5.00% 11/15/25 | 200,000 | 225,430 | ||||||
| Series C 5.00% 11/15/24 | 200,000 | 230,402 | ||||||
| 3,470,866 | ||||||||
| Water & Sewer Revenue Bonds – 2.50% | ||||||||
| New York City Municipal Water Finance Authority | ||||||||
| Water & Sewer System Revenue | ||||||||
| (Fiscal 2009) Series A 5.75% 6/15/40 | 200,000 | 230,656 | ||||||
| (Second General Resolution) Series FF 5.00% 6/15/31 | 500,000 | 553,595 | ||||||
| Series FF-2 5.50% 6/15/40 | 250,000 | 284,998 | ||||||
| New York State Environmental Facilities Corporation State | ||||||||
| Clean Water & Drinking Water Revolving Funds | ||||||||
| (New York City Municipal Project) Subordinated | ||||||||
| Series B 5.00% 6/15/21 | 200,000 | 229,836 | ||||||
| 1,299,085 | ||||||||
| Total Municipal Bonds (cost $46,225,551) | 49,806,208 | |||||||
| Short-Term Investments – 2.31% | ||||||||
| •Variable Rate Demand Notes – 2.31% | ||||||||
| New York City | 900,000 | 900,000 | ||||||
| Series A-7 0.22% 8/1/21 | ||||||||
| Series E2 0.22% 8/1/21 | ||||||||
| (LOC, JPMorgan Chase Bank) | 300,000 | 300,000 | ||||||
| Total Short-Term Investments (cost $1,200,000) | 1,200,000 | |||||||
| Total Value of Securities – 98.25% | ||||||||
| (cost $47,425,551) | 51,006,208 | |||||||
| Receivables and Other Assets | ||||||||
| Net of Liabilities – 1.75% | 908,106 | |||||||
| Net Assets Applicable to 4,660,483 | ||||||||
| Shares Outstanding – 100.00% | $ | 51,914,314 | ||||||
68
| Net Asset Value – Delaware Tax-Free New York Fund | ||||
| Class A ($37,715,646 / 3,383,582 Shares) | $11.15 | |||
| Net Asset Value – Delaware Tax-Free New York Fund | ||||
| Class B ($736,630 / 66,230 Shares) | $11.12 | |||
| Net Asset Value – Delaware Tax-Free New York Fund | ||||
| Class C ($13,462,038 / 1,210,671 Shares) | $11.12 | |||
| Components of Net Assets at August 31, 2010: | ||||
| Shares of beneficial interest (unlimited authorization – no par) | $ | 48,369,674 | ||
| Distributions in excess of net investment income | (651 | ) | ||
| Accumulated net realized loss on investments | (35,366 | ) | ||
| Net unrealized appreciation of investments | 3,580,657 | |||
| Total net assets | $ | 51,914,314 | ||
| • | Variable rate security. The rate shown is the rate as of August 31, 2010. Interest rates reset periodically. |
| Ω | Step coupon bond. Indicates security that has a zero coupon that remains in effect until a predetermined date at which time the stated interest rate becomes effective. |
| § | Pre-Refunded Bonds. Municipals that are generally backed or secured by U.S. Treasury bonds. For Pre-Refunded Bonds, the stated maturity is followed by the year in which the bond is pre-refunded. See Note 8 in “Notes to financial statements.” |
Summary of abbreviations:
AGM — Insured by Assured Guaranty Municipal Corporation
AMBAC — Insured by the AMBAC Assurance Corporation
AMT — Subject to Alternative Minimum Tax
ASSURED GTY — Insured by the Assured Guaranty Corporation
FHA — Insured by the Federal Housing Administration
FGIC — Insured by the Financial Guaranty Insurance Company
LOC — Letter of Credit
NATL-RE — Insured by the National Public Finance Guarantee Corporation
69
Statements of net assets
Delaware Tax-Free New York Fund
Delaware Tax-Free New York Fund
| Net Asset Value and Offering Price Per Share – | |||
| Delaware Tax-Free New York Fund | |||
| Net asset value Class A (A) | $ | 11.15 | |
| Sales charge (4.50% of offering price) (B) | 0.53 | ||
| Offering price | $ | 11.68 | |
| (A) | Net asset value per share, as illustrated, is the amount which would be paid upon redemption or repurchase of shares. | |
| (B) | See the current prospectus for purchases of $100,000 or more. |
See accompanying Notes, which are an integral part of the financial statements.
70
| Statements of operations | |
| Year Ended August 31, 2010 |
| Delaware Tax-Free | Delaware Tax-Free | Delaware Tax-Free | |||||||||||||
| Arizona Fund | California Fund | Colorado Fund | |||||||||||||
| Investment Income: | |||||||||||||||
| Interest | $ | 5,849,783 | $ | 4,408,103 | $ | 12,643,605 | |||||||||
| Expenses: | |||||||||||||||
| Management fees | 609,119 | 456,995 | 1,364,806 | ||||||||||||
| Distribution expenses – Class A | 273,770 | 163,093 | 580,811 | ||||||||||||
| Distribution expenses – Class B | 44,721 | 39,019 | 20,831 | ||||||||||||
| Distribution expenses – Class C | 76,412 | 138,361 | 136,433 | ||||||||||||
| Dividend disbursing and transfer agent | |||||||||||||||
| fees and expenses | 65,648 | 53,512 | 128,674 | ||||||||||||
| Accounting and administration expenses | 48,326 | 33,065 | 98,757 | ||||||||||||
| Legal fees | 19,953 | 9,911 | 29,277 | ||||||||||||
| Audit and tax | 16,975 | 15,306 | 23,609 | ||||||||||||
| Registration fees | 15,632 | 8,106 | 7,946 | ||||||||||||
| Reports and statements to shareholders | 13,200 | 9,204 | 29,898 | ||||||||||||
| Pricing fees | 7,573 | 7,748 | 9,025 | ||||||||||||
| Trustees’ fees | 7,011 | 4,752 | 14,237 | ||||||||||||
| Dues and services | 5,270 | 3,476 | 9,020 | ||||||||||||
| Insurance fees | 5,011 | 3,229 | 9,704 | ||||||||||||
| Custodian fees | 2,339 | 1,555 | 4,634 | ||||||||||||
| Consulting fees | 1,789 | 1,207 | 3,644 | ||||||||||||
| Trustees’ expenses | 503 | 332 | 1,078 | ||||||||||||
| 1,213,252 | 948,871 | 2,472,384 | |||||||||||||
| Less fees waived | (70,644 | ) | (132,474 | ) | (48,381 | ) | |||||||||
| Less expense paid indirectly | (66 | ) | (46 | ) | (147 | ) | |||||||||
| Total operating expenses | 1,142,542 | 816,351 | 2,423,856 | ||||||||||||
| Net Investment Income | 4,707,241 | 3,591,752 | 10,219,749 | ||||||||||||
| Net Realized and Unrealized Gain (Loss) | |||||||||||||||
| on Investments: | |||||||||||||||
| Net realized gain (loss) on investments | 1,415,533 | (292,440 | ) | 2,102,920 | |||||||||||
| Net change in unrealized appreciation/ | |||||||||||||||
| depreciation of investments | 5,624,262 | 7,517,014 | 12,877,406 | ||||||||||||
| Net Realized and Unrealized Gain | |||||||||||||||
| on Investments | 7,039,795 | 7,224,574 | 14,980,326 | ||||||||||||
| Net Increase in Net Assets | |||||||||||||||
| Resulting from Operations | $ | 11,747,036 | $ | 10,816,326 | $ | 25,200,075 | |||||||||
See accompanying Notes, which are an integral part of the financial statements.
72
| Delaware Tax-Free | Delaware Tax-Free | |||||||||
| Idaho Fund | New York Fund | |||||||||
| Investment Income: | ||||||||||
| Interest | $ | 5,686,271 | $ | 1,852,251 | ||||||
| Expenses: | ||||||||||
| Management fees | 678,992 | 214,893 | ||||||||
| Distribution expenses – Class A | 234,723 | 72,531 | ||||||||
| Distribution expenses – Class B | 29,131 | 7,947 | ||||||||
| Distribution expenses – Class C | 266,548 | 91,643 | ||||||||
| Dividend disbursing and transfer | ||||||||||
| agent fees and expenses | 64,113 | 39,851 | ||||||||
| Accounting and administration expenses | 49,119 | 15,541 | ||||||||
| Audit and tax | 17,679 | 13,123 | ||||||||
| Reports and statements to shareholders | 15,696 | 4,349 | ||||||||
| Legal fees | 15,596 | 5,126 | ||||||||
| Pricing fees | 9,013 | 9,340 | ||||||||
| Registration fees | 8,374 | 11,164 | ||||||||
| Trustees’ fees | 7,047 | 2,206 | ||||||||
| Insurance fees | 4,312 | 1,193 | ||||||||
| Dues and services | 3,499 | 1,717 | ||||||||
| Custodian fees | 2,393 | 797 | ||||||||
| Consulting fees | 1,783 | 563 | ||||||||
| Trustees’ expenses | 607 | 148 | ||||||||
| 1,408,625 | 492,132 | |||||||||
| Less fees waived | (22,204 | ) | (104,739 | ) | ||||||
| Less expense paid indirectly | (67 | ) | (25 | ) | ||||||
| Total operating expenses | 1,386,354 | 387,368 | ||||||||
| Net Investment Income | 4,299,917 | 1,464,883 | ||||||||
| Net Realized and Unrealized Gain (Loss) | ||||||||||
| on Investments: | ||||||||||
| Net realized gain (loss) on investments | 89,825 | (26,599 | ) | |||||||
| Net change in unrealized appreciation/ | ||||||||||
| depreciation of investments | 6,715,627 | 2,648,873 | ||||||||
| Net Realized and Unrealized Gain | ||||||||||
| on Investments | 6,805,452 | 2,622,274 | ||||||||
| Net Increase in Net Assets | ||||||||||
| Resulting from Operations | $ | 11,105,369 | $ | 4,087,157 | ||||||
See accompanying Notes, which are an integral part of the financial statements.
73
Statements of changes in net assets
Delaware Tax-Free Arizona Fund
Delaware Tax-Free Arizona Fund
| Year Ended | ||||||||
| 8/31/10 | 8/31/09 | |||||||
| Increase in Net Assets from Operations: | ||||||||
| Net investment income | $ | 4,707,241 | $ | 4,979,083 | ||||
| Net realized gain on investments | 1,415,533 | 676,245 | ||||||
| Net change in unrealized | ||||||||
| appreciation/depreciation of investments | 5,624,262 | 283,443 | ||||||
| Net increase in net assets resulting from operations | 11,747,036 | 5,938,771 | ||||||
| Dividends and Distributions to Shareholders from: | ||||||||
| Net investment income: | ||||||||
| Class A | (4,303,466 | ) | (4,473,743 | ) | ||||
| Class B | (142,123 | ) | (247,800 | ) | ||||
| Class C | (242,383 | ) | (235,244 | ) | ||||
| (4,687,972 | ) | (4,956,787 | ) | |||||
| Capital Share Transactions: | ||||||||
| Proceeds from shares sold: | ||||||||
| Class A | 5,867,126 | 8,072,718 | ||||||
| Class B | 66 | 20,443 | ||||||
| Class C | 1,248,843 | 1,098,183 | ||||||
| Net asset value of shares issued upon reinvestment | ||||||||
| of dividends and distributions: | ||||||||
| Class A | 2,128,544 | 2,209,302 | ||||||
| Class B | 73,667 | 128,925 | ||||||
| Class C | 150,229 | 146,249 | ||||||
| 9,468,475 | 11,675,820 | |||||||
74
| Year Ended | ||||||||
| 8/31/10 | 8/31/09 | |||||||
| Capital Share Transactions (continued): | ||||||||
| Cost of shares repurchased: | ||||||||
| Class A | $ | (19,829,331 | ) | $ | (19,633,059 | ) | ||
| Class B | (3,923,060 | ) | (3,235,890 | ) | ||||
| Class C | (1,103,623 | ) | (2,787,126 | ) | ||||
| (24,856,014 | ) | (25,656,075 | ) | |||||
| Decrease in net assets derived from | ||||||||
| capital share transactions | (15,387,539 | ) | (13,980,255 | ) | ||||
| Net Decrease in Net Assets | (8,328,475 | ) | (12,998,271 | ) | ||||
| Net Assets: | ||||||||
| Beginning of year | 127,454,947 | 140,453,218 | ||||||
| End of year1 | $ | 119,126,472 | $ | 127,454,947 | ||||
| 1Including undistributed net investment income | $ | 26,196 | $ | 26,196 | ||||
See accompanying Notes, which are an integral part of the financial statements.
75
Statements of changes in net assets
Delaware Tax-Free California Fund
Delaware Tax-Free California Fund
| Year Ended | ||||||||
| 8/31/10 | 8/31/09 | |||||||
| Increase (Decrease) in Net Assets from Operations: | ||||||||
| Net investment income | $ | 3,591,752 | $ | 3,401,520 | ||||
| Net realized gain (loss) on investments | (292,440 | ) | 709,018 | |||||
| Net change in unrealized | ||||||||
| appreciation/depreciation of investments | 7,517,014 | (2,723,629 | ) | |||||
| Net increase in net assets resulting from operations | 10,816,326 | 1,386,909 | ||||||
| Dividends and Distributions to Shareholders from: | ||||||||
| Net investment income: | ||||||||
| Class A | (2,925,853 | ) | (2,701,738 | ) | ||||
| Class B | (146,321 | ) | (195,352 | ) | ||||
| Class C | (516,624 | ) | (487,982 | ) | ||||
| (3,588,798 | ) | (3,385,072 | ) | |||||
| Capital Share Transactions: | ||||||||
| Proceeds from shares sold: | ||||||||
| Class A | 15,942,030 | 8,313,126 | ||||||
| Class B | 140,364 | 90,914 | ||||||
| Class C | 3,335,303 | 2,115,521 | ||||||
| Net asset value of shares issued upon reinvestment | ||||||||
| of dividends and distributions: | ||||||||
| Class A | 1,696,001 | 1,547,832 | ||||||
| Class B | 105,254 | 137,850 | ||||||
| Class C | 357,093 | 358,106 | ||||||
| 21,576,045 | 12,563,349 | |||||||
76
| Year Ended | ||||||||
| 8/31/10 | 8/31/09 | |||||||
| Capital Share Transactions (continued): | ||||||||
| Cost of shares repurchased: | ||||||||
| Class A | $ | (11,521,238 | ) | $ | (14,448,671 | ) | ||
| Class B | (2,270,312 | ) | (1,676,431 | ) | ||||
| Class C | (2,930,338 | ) | (3,594,180 | ) | ||||
| (16,721,888 | ) | (19,719,282 | ) | |||||
| Increase (decrease) in net assets derived from | ||||||||
| capital share transactions | 4,854,157 | (7,155,933 | ) | |||||
| Net Increase (Decrease) in Net Assets | 12,081,685 | (9,154,096 | ) | |||||
| Net Assets: | ||||||||
| Beginning of year | 79,599,898 | 88,753,994 | ||||||
| End of year1 | $ | 91,681,583 | $ | 79,599,898 | ||||
| 1Including undistributed net investment income | $ | 18,763 | $ | 18,763 | ||||
See accompanying Notes, which are an integral part of the financial statements.
77
Statements of changes in net assets
Delaware Tax-Free Colorado Fund
Delaware Tax-Free Colorado Fund
| Year Ended | ||||||||
| 8/31/10 | 8/31/09 | |||||||
| Increase (Decrease) in Net Assets from Operations: | ||||||||
| Net investment income | $ | 10,219,749 | $ | 10,196,318 | ||||
| Net realized gain on investments | 2,102,920 | 3,397,919 | ||||||
| Net change in unrealized | ||||||||
| appreciation/depreciation of investments | 12,877,406 | (4,848,204 | ) | |||||
| Net increase in net assets resulting from operations | 25,200,075 | 8,746,033 | ||||||
| Dividends and Distributions to Shareholders from: | ||||||||
| Net investment income: | ||||||||
| Class A | (9,708,463 | ) | (9,697,369 | ) | ||||
| Class B | (71,622 | ) | (116,434 | ) | ||||
| Class C | (467,286 | ) | (355,221 | ) | ||||
| (10,247,371 | ) | (10,169,024 | ) | |||||
| Capital Share Transactions: | ||||||||
| Proceeds from shares sold: | ||||||||
| Class A | 15,893,257 | 14,183,751 | ||||||
| Class B | — | 10,613 | ||||||
| Class C | 4,043,038 | 2,881,769 | ||||||
| Net asset value of shares issued upon reinvestment | ||||||||
| of dividends and distributions: | ||||||||
| Class A | 6,184,316 | 6,074,319 | ||||||
| Class B | 36,966 | 50,248 | ||||||
| Class C | 340,428 | 248,362 | ||||||
| 26,498,005 | 23,449,062 | |||||||
78
| Year Ended | ||||||||
| 8/31/10 | 8/31/09 | |||||||
| Capital Share Transactions (continued): | �� | |||||||
| Cost of shares repurchased: | ||||||||
| Class A | $ | (24,936,523 | ) | $ | (27,122,635 | ) | ||
| Class B | (1,418,824 | ) | (1,264,891 | ) | ||||
| Class C | (1,594,446 | ) | (1,437,234 | ) | ||||
| (27,949,793 | ) | (29,824,760 | ) | |||||
| Decrease in net assets derived from | ||||||||
| capital share transactions | (1,451,788 | ) | (6,375,698 | ) | ||||
| Net Increase (Decrease) in Net Assets | 13,500,916 | (7,798,689 | ) | |||||
| Net Assets: | ||||||||
| Beginning of year | 240,628,256 | 248,426,945 | ||||||
| End of year1 | $ | 254,129,172 | $ | 240,628,256 | ||||
| 1Including undistributed net investment income | $ | — | $ | 43,501 | ||||
See accompanying Notes, which are an integral part of the financial statements.
79
Statements of changes in net assets
Delaware Tax-Free Idaho Fund
Delaware Tax-Free Idaho Fund
| Year Ended | ||||||||
| 8/31/10 | 8/31/09 | |||||||
| Increase in Net Assets from Operations: | ||||||||
| Net investment income | $ | 4,299,917 | $ | 3,502,126 | ||||
| Net realized gain on investments | 89,825 | 242,232 | ||||||
| Net change in unrealized | ||||||||
| appreciation/depreciation of investments | 6,715,627 | 2,073,940 | ||||||
| Net increase in net assets resulting from operations | 11,105,369 | 5,818,298 | ||||||
| Dividends and Distributions to Shareholders from: | ||||||||
| Net investment income: | ||||||||
| Class A | (3,460,797 | ) | (2,944,277 | ) | ||||
| Class B | (86,212 | ) | (136,217 | ) | ||||
| Class C | (781,910 | ) | (403,213 | ) | ||||
| (4,328,919 | ) | (3,483,707 | ) | |||||
| Capital Share Transactions: | ||||||||
| Proceeds from shares sold: | ||||||||
| Class A | 18,620,022 | 17,915,127 | ||||||
| Class B | 9,917 | 63,569 | ||||||
| Class C | 17,105,840 | 8,501,134 | ||||||
| Net asset value of shares issued upon reinvestment | ||||||||
| of dividends and distributions: | ||||||||
| Class A | 2,431,970 | 1,894,609 | ||||||
| Class B | 62,082 | 98,426 | ||||||
| Class C | 568,025 | 249,454 | ||||||
| 38,797,856 | 28,722,319 | |||||||
80
| Year Ended | ||||||||
| 8/31/10 | 8/31/09 | |||||||
| Capital Share Transactions (continued): | ||||||||
| Cost of shares repurchased: | ||||||||
| Class A | $ | (8,321,667 | ) | $ | (7,521,138 | ) | ||
| Class B | (1,131,494 | ) | (1,954,363 | ) | ||||
| Class C | (2,773,980 | ) | (1,450,880 | ) | ||||
| (12,227,141 | ) | (10,926,381 | ) | |||||
| Increase in net assets derived from | ||||||||
| capital share transactions | 26,570,715 | 17,795,938 | ||||||
| Net Increase in Net Assets | 33,347,165 | 20,130,529 | ||||||
| Net Assets: | ||||||||
| Beginning of year | 108,980,435 | 88,849,906 | ||||||
| End of year1 | $ | 142,327,600 | $ | 108,980,435 | ||||
| 1Including undistributed (distributions in excess of) | ||||||||
| net investment income | $ | (11,219 | ) | $ | 5,851 | |||
See accompanying Notes, which are an integral part of the financial statements.
81
Statements of changes in net assets
Delaware Tax-Free New York Fund
Delaware Tax-Free New York Fund
| Year Ended | ||||||||
| 8/31/10 | 8/31/09 | |||||||
| Increase (Decrease) in Net Assets from Operations: | ||||||||
| Net investment income | $ | 1,464,883 | $ | 900,508 | ||||
| Net realized gain (loss) on investments | (26,599 | ) | 190,585 | |||||
| Net change in unrealized | ||||||||
| appreciation/depreciation of investments | 2,648,873 | 482,416 | ||||||
| Net increase in net assets resulting from operations | 4,087,157 | 1,573,509 | ||||||
| Dividends and Distributions to Shareholders from: | ||||||||
| Net investment income: | ||||||||
| Class A | (1,144,578 | ) | (738,485 | ) | ||||
| Class B | (25,736 | ) | (39,735 | ) | ||||
| Class C | (290,855 | ) | (116,762 | ) | ||||
| (1,461,169 | ) | (894,982 | ) | |||||
| Capital Share Transactions: | ||||||||
| Proceeds from shares sold: | ||||||||
| Class A | 16,389,706 | 10,366,325 | ||||||
| Class B | 9,343 | 47,828 | ||||||
| Class C | 8,918,180 | 3,939,824 | ||||||
| Net asset value of shares issued upon reinvestment | ||||||||
| of dividends and distributions: | ||||||||
| Class A | 717,620 | 403,783 | ||||||
| Class B | 15,971 | 22,930 | ||||||
| Class C | 198,252 | 62,861 | ||||||
| 26,249,072 | 14,843,551 | |||||||
82
| Year Ended | ||||||||
| 8/31/10 | 8/31/09 | |||||||
| Capital Share Transactions (continued): | ||||||||
| Cost of shares repurchased: | ||||||||
| Class A | $ | (4,117,174 | ) | $ | (3,831,875 | ) | ||
| Class B | (362,784 | ) | (593,493 | ) | ||||
| Class C | (1,929,785 | ) | (585,220 | ) | ||||
| (6,409,743 | ) | (5,010,588 | ) | |||||
| Increase in net assets derived from | ||||||||
| capital share transactions | 19,839,329 | 9,832,963 | ||||||
| Net Increase in Net Assets | 22,465,317 | 10,511,490 | ||||||
| Net Assets: | ||||||||
| Beginning of year | 29,448,997 | 18,937,507 | ||||||
| End of year1 | $ | 51,914,314 | $ | 29,448,997 | ||||
| 1Including undistributed (distributions in excess of) | ||||||||
| net investment income | $ | (651 | ) | $ | 3,746 | |||
See accompanying Notes, which are an integral part of the financial statements.
83
Financial highlights
Delaware Tax-Free Arizona Fund Class A
Delaware Tax-Free Arizona Fund Class A
Selected data for each share of the Fund outstanding throughout each period were as follows:
| Net asset value, beginning of period |
| Income (loss) from investment operations: |
| Net investment income |
| Net realized and unrealized gain (loss) on investments |
| Total from investment operations |
| Less dividends and distributions from: |
| Net investment income |
| Total dividends and distributions |
| Net asset value, end of period |
| Total return1 |
| Ratios and supplemental data: |
| Net assets, end of period (000 omitted) |
| Ratio of expenses to average net assets |
| Ratio of expenses to average net assets |
| prior to fees waived and expense paid indirectly |
| Ratio of net investment income to average net assets |
| Ratio of net investment income to average net assets |
| prior to fees waived and expense paid indirectly |
| Portfolio turnover |
| 1 | Total investment return is based on the change in net asset value of a share during the period and assumes reinvestment of dividends and distributions at net asset value and does not reflect the impact of a sales charge. Total investment return during some of the periods shown reflects a waiver by the manager. Performance would have been lower had the waiver not been in effect. |
See accompanying Notes, which are an integral part of the financial statements.
84
| Year Ended | |||||||||||||||
| 8/31/10 | 8/31/09 | 8/31/08 | 8/31/07 | 8/31/06 | |||||||||||
| $11.090 | $10.930 | $11.070 | $11.350 | $11.560 | |||||||||||
| 0.447 | 0.431 | 0.444 | 0.465 | 0.467 | |||||||||||
| 0.668 | 0.158 | (0.140 | ) | (0.280 | ) | (0.210 | ) | ||||||||
| 1.115 | 0.589 | 0.304 | 0.185 | 0.257 | |||||||||||
| (0.445 | ) | (0.429 | ) | (0.444 | ) | (0.465 | ) | (0.467 | ) | ||||||
| (0.445 | ) | (0.429 | ) | (0.444 | ) | (0.465 | ) | (0.467 | ) | ||||||
| $11.760 | $11.090 | $10.930 | $11.070 | $11.350 | |||||||||||
| 10.27% | 5.64% | 2.78% | 1.63% | 2.31% | |||||||||||
| $108,214 | $113,689 | $122,027 | $125,636 | $131,468 | |||||||||||
| 0.86% | 0.75% | 0.75% | 0.76% | 0.76% | |||||||||||
| 0.92% | 0.91% | 0.91% | 0.91% | 0.91% | |||||||||||
| 3.94% | 4.07% | 4.02% | 4.11% | 4.12% | |||||||||||
| 3.88% | 3.91% | 3.86% | 3.96% | 3.97% | |||||||||||
| 15% | 27% | 29% | 9% | 8% | |||||||||||
85
Financial highlights
Delaware Tax-Free Arizona Fund Class B
Delaware Tax-Free Arizona Fund Class B
Selected data for each share of the Fund outstanding throughout each period were as follows:
| Net asset value, beginning of period |
| Income (loss) from investment operations: |
| Net investment income |
| Net realized and unrealized gain (loss) on investments |
| Total from investment operations |
| Less dividends and distributions from: |
| Net investment income |
| Total dividends and distributions |
| Net asset value, end of period |
| Total return1 |
| Ratios and supplemental data: |
| Net assets, end of period (000 omitted) |
| Ratio of expenses to average net assets |
| Ratio of expenses to average net assets |
| prior to fees waived and expense paid indirectly |
| Ratio of net investment income to average net assets |
| Ratio of net investment income to average net assets |
| prior to fees waived and expense paid indirectly |
| Portfolio turnover |
| 1 | Total investment return is based on the change in net asset value of a share during the period and assumes reinvestment of dividends and distributions at net asset value and does not reflect the impact of a sales charge. Total investment return during some of the periods shown reflects a waiver by the manager. Performance would have been lower had the waiver not been in effect. |
See accompanying Notes, which are an integral part of the financial statements.
86
| Year Ended | |||||||||||||||
| 8/31/10 | 8/31/09 | 8/31/08 | 8/31/07 | 8/31/06 | |||||||||||
| $11.100 | $10.940 | $11.070 | $11.360 | $11.570 | |||||||||||
| 0.362 | 0.352 | 0.361 | 0.380 | 0.382 | |||||||||||
| 0.658 | 0.158 | (0.130 | ) | (0.290 | ) | (0.210 | ) | ||||||||
| 1.020 | 0.510 | 0.231 | 0.090 | 0.172 | |||||||||||
| (0.360 | ) | (0.350 | ) | (0.361 | ) | (0.380 | ) | (0.382 | ) | ||||||
| (0.360 | ) | (0.350 | ) | (0.361 | ) | (0.380 | ) | (0.382 | ) | ||||||
| $11.760 | $11.100 | $10.940 | $11.070 | $11.360 | |||||||||||
| 9.35% | 4.85% | 2.10% | 0.78% | 1.54% | |||||||||||
| $2,917 | $6,509 | $9,620 | $12,407 | $16,413 | |||||||||||
| 1.61% | 1.50% | 1.50% | 1.51% | 1.51% | |||||||||||
| 1.67% | 1.66% | 1.66% | 1.66% | 1.66% | |||||||||||
| 3.19% | 3.32% | 3.27% | 3.36% | 3.37% | |||||||||||
| 3.13% | 3.16% | 3.11% | 3.21% | 3.22% | |||||||||||
| 15% | 27% | 29% | 9% | 8% | |||||||||||
87
Financial highlights
Delaware Tax-Free Arizona Fund Class C
Delaware Tax-Free Arizona Fund Class C
Selected data for each share of the Fund outstanding throughout each period were as follows:
| Net asset value, beginning of period |
| Income (loss) from investment operations: |
| Net investment income |
| Net realized and unrealized gain (loss) on investments |
| Total from investment operations |
| Less dividends and distributions from: |
| Net investment income |
| Total dividends and distributions |
| Net asset value, end of period |
| Total return1 |
| Ratios and supplemental data: |
| Net assets, end of period (000 omitted) |
| Ratio of expenses to average net assets |
| Ratio of expenses to average net assets |
| prior to fees waived and expense paid indirectly |
| Ratio of net investment income to average net assets |
| Ratio of net investment income to average net assets |
| prior to fees waived and expense paid indirectly |
| Portfolio turnover |
| 1 | Total investment return is based on the change in net asset value of a share during the period and assumes reinvestment of dividends and distributions at net asset value and does not reflect the impact of a sales charge. Total investment return during some of the periods shown reflects a waiver by the manager. Performance would have been lower had the waiver not been in effect. |
See accompanying Notes, which are an integral part of the financial statements.
88
| Year Ended | |||||||||||||||
| 8/31/10 | 8/31/09 | 8/31/08 | 8/31/07 | 8/31/06 | |||||||||||
| $11.120 | $10.960 | $11.090 | $11.380 | $11.580 | |||||||||||
| 0.363 | 0.352 | 0.361 | 0.380 | 0.381 | |||||||||||
| 0.668 | 0.158 | (0.130 | ) | (0.290 | ) | (0.200 | ) | ||||||||
| 1.031 | 0.510 | 0.231 | 0.090 | 0.181 | |||||||||||
| (0.361 | ) | (0.350 | ) | (0.361 | ) | (0.380 | ) | (0.381 | ) | ||||||
| (0.361 | ) | (0.350 | ) | (0.361 | ) | (0.380 | ) | (0.381 | ) | ||||||
| $11.790 | $11.120 | $10.960 | $11.090 | $11.380 | |||||||||||
| 9.43% | 4.84% | 2.09% | 0.77% | 1.63% | |||||||||||
| $7,995 | $7,257 | $8,806 | $7,609 | $8,117 | |||||||||||
| 1.61% | 1.50% | 1.50% | 1.51% | 1.51% | |||||||||||
| 1.67% | 1.66% | 1.66% | 1.66% | 1.66% | |||||||||||
| 3.19% | 3.32% | 3.27% | 3.36% | 3.37% | |||||||||||
| 3.13% | 3.16% | 3.11% | 3.21% | 3.22% | |||||||||||
| 15% | 27% | 29% | 9% | 8% | |||||||||||
89
Financial highlights
Delaware Tax-Free California Fund Class A
Delaware Tax-Free California Fund Class A
Selected data for each share of the Fund outstanding throughout each period were as follows:
| Net asset value, beginning of period |
| Income (loss) from investment operations: |
| Net investment income |
| Net realized and unrealized gain (loss) on investments |
| Total from investment operations |
| Less dividends and distributions from: |
| Net investment income |
| Total dividends and distributions |
| Net asset value, end of period |
| Total return1 |
| Ratios and supplemental data: |
| Net assets, end of period (000 omitted) |
| Ratio of expenses to average net assets |
| Ratio of expenses to average net assets |
| prior to fees waived and expense paid indirectly |
| Ratio of net investment income to average net assets |
| Ratio of net investment income to average net assets |
| prior to fees waived and expense paid indirectly |
| Portfolio turnover |
| 1 | Total investment return is based on the change in net asset value of a share during the period and assumes reinvestment of dividends and distributions at net asset value and does not reflect the impact of a sales charge. Total investment return during all of the periods shown reflects a waiver by the manager. Performance would have been lower had the waiver not been in effect. |
See accompanying Notes, which are an integral part of the financial statements.
90
| Year Ended | |||||||||||||||
| 8/31/10 | 8/31/09 | 8/31/08 | 8/31/07 | 8/31/06 | |||||||||||
| $10.620 | $10.800 | $11.010 | $11.400 | $11.490 | |||||||||||
| 0.497 | 0.448 | 0.449 | 0.454 | 0.450 | |||||||||||
| 0.950 | (0.182 | ) | (0.210 | ) | (0.390 | ) | (0.090 | ) | |||||||
| 1.447 | 0.266 | 0.239 | 0.064 | 0.360 | |||||||||||
| (0.497 | ) | (0.446 | ) | (0.449 | ) | (0.454 | ) | (0.450 | ) | ||||||
| (0.497 | ) | (0.446 | ) | (0.449 | ) | (0.454 | ) | (0.450 | ) | ||||||
| $11.570 | $10.620 | $10.800 | $11.010 | $11.400 | |||||||||||
| 13.92% | 2.74% | 2.21% | 0.51% | 3.24% | |||||||||||
| $72,902 | $61,132 | $67,174 | $76,537 | $75,995 | |||||||||||
| 0.82% | 0.88% | 0.88% | 0.89% | 0.88% | |||||||||||
| 0.98% | 0.97% | 0.97% | 0.97% | 0.97% | |||||||||||
| 4.48% | 4.42% | 4.11% | 3.98% | 3.97% | |||||||||||
| 4.32% | 4.33% | 4.02% | 3.90% | 3.88% | |||||||||||
| 35% | 59% | 34% | 21% | 14% | |||||||||||
91
Financial highlights
Delaware Tax-Free California Fund Class B
Delaware Tax-Free California Fund Class B
Selected data for each share of the Fund outstanding throughout each period were as follows:
| Net asset value, beginning of period |
| Income (loss) from investment operations: |
| Net investment income |
| Net realized and unrealized gain (loss) on investments |
| Total from investment operations |
| Less dividends and distributions from: |
| Net investment income |
| Total dividends and distributions |
| Net asset value, end of period |
| Total return1 |
| Ratios and supplemental data: |
| Net assets, end of period (000 omitted) |
| Ratio of expenses to average net assets |
| Ratio of expenses to average net assets |
| prior to fees waived and expense paid indirectly |
| Ratio of net investment income to average net assets |
| Ratio of net investment income to average net assets |
| prior to fees waived and expense paid indirectly |
| Portfolio turnover |
| 1 | Total investment return is based on the change in net asset value of a share during the period and assumes reinvestment of dividends and distributions at net asset value and does not reflect the impact of a sales charge. Total investment return during all of the periods shown reflects a waiver by the manager. Performance would have been lower had the waiver not been in effect. |
See accompanying Notes, which are an integral part of the financial statements.
92
| Year Ended | |||||||||||||||
| 8/31/10 | 8/31/09 | 8/31/08 | 8/31/07 | 8/31/06 | |||||||||||
| $10.670 | $10.840 | $11.060 | $11.440 | $11.530 | |||||||||||
| 0.416 | 0.373 | 0.367 | 0.368 | 0.365 | |||||||||||
| 0.940 | (0.172 | ) | (0.220 | ) | (0.380 | ) | (0.090 | ) | |||||||
| 1.356 | 0.201 | 0.147 | (0.012 | ) | 0.275 | ||||||||||
| (0.416 | ) | (0.371 | ) | (0.367 | ) | (0.368 | ) | (0.365 | ) | ||||||
| (0.416 | ) | (0.371 | ) | (0.367 | ) | (0.368 | ) | (0.365 | ) | ||||||
| $11.610 | $10.670 | $10.840 | $11.060 | $11.440 | |||||||||||
| 12.93% | 2.07% | 1.34% | (0.15% | ) | 2.46% | ||||||||||
| $3,254 | $4,938 | $6,589 | $9,384 | $14,918 | |||||||||||
| 1.57% | 1.63% | 1.63% | 1.64% | 1.63% | |||||||||||
| 1.73% | 1.72% | 1.72% | 1.72% | 1.72% | |||||||||||
| 3.73% | 3.67% | 3.36% | 3.23% | 3.22% | |||||||||||
| 3.57% | 3.58% | 3.27% | 3.15% | 3.13% | |||||||||||
| 35% | 59% | 34% | 21% | 14% | |||||||||||
93
Financial highlights
Delaware Tax-Free California Fund Class C
Delaware Tax-Free California Fund Class C
Selected data for each share of the Fund outstanding throughout each period were as follows:
| Net asset value, beginning of period |
| Income (loss) from investment operations: |
| Net investment income |
| Net realized and unrealized gain (loss) on investments |
| Total from investment operations |
| Less dividends and distributions from: |
| Net investment income |
| Total dividends and distributions |
| Net asset value, end of period |
| Total return1 |
| Ratios and supplemental data: |
| Net assets, end of period (000 omitted) |
| Ratio of expenses to average net assets |
| Ratio of expenses to average net assets |
| prior to fees waived and expense paid indirectly |
| Ratio of net investment income to average net assets |
| Ratio of net investment income to average net assets |
| prior to fees waived and expense paid indirectly |
| Portfolio turnover |
| 1 | Total investment return is based on the change in net asset value of a share during the period and assumes reinvestment of dividends and distributions at net asset value and does not reflect the impact of a sales charge. Total investment return during all of the periods shown reflects a waiver by the manager. Performance would have been lower had the waiver not been in effect. |
See accompanying Notes, which are an integral part of the financial statements.
94
| Year Ended | |||||||||||||||
| 8/31/10 | 8/31/09 | 8/31/08 | 8/31/07 | 8/31/06 | |||||||||||
| $10.640 | $10.810 | $11.030 | $11.420 | $11.500 | |||||||||||
| 0.415 | 0.373 | 0.367 | 0.368 | 0.365 | |||||||||||
| 0.950 | (0.172 | ) | (0.220 | ) | (0.390 | ) | (0.080 | ) | |||||||
| 1.365 | 0.201 | 0.147 | (0.022 | ) | 0.285 | ||||||||||
| (0.415 | ) | (0.371 | ) | (0.367 | ) | (0.368 | ) | (0.365 | ) | ||||||
| (0.415 | ) | (0.371 | ) | (0.367 | ) | (0.368 | ) | (0.365 | ) | ||||||
| $11.590 | $10.640 | $10.810 | $11.030 | $11.420 | |||||||||||
| 13.06% | 2.07% | 1.35% | (0.24% | ) | 2.56% | ||||||||||
| $15,526 | $13,530 | $14,991 | $13,453 | $12,768 | |||||||||||
| 1.57% | 1.63% | 1.63% | 1.64% | 1.63% | |||||||||||
| 1.73% | 1.72% | 1.72% | 1.72% | 1.72% | |||||||||||
| 3.73% | 3.67% | 3.36% | 3.23% | 3.22% | |||||||||||
| 3.57% | 3.58% | 3.27% | 3.15% | 3.13% | |||||||||||
| 35% | 59% | 34% | 21% | 14% | |||||||||||
95
Financial highlights
Delaware Tax-Free Colorado Fund Class A
Delaware Tax-Free Colorado Fund Class A
Selected data for each share of the Fund outstanding throughout each period were as follows:
| Net asset value, beginning of period |
| Income (loss) from investment operations: |
| Net investment income |
| Net realized and unrealized gain (loss) on investments |
| Total from investment operations |
| Less dividends and distributions from: |
| Net investment income |
| Total dividends and distributions |
| Net asset value, end of period |
| Total return1 |
| Ratios and supplemental data: |
| Net assets, end of period (000 omitted) |
| Ratio of expenses to average net assets |
| Ratio of expenses to average net assets |
| prior to fees waived and expense paid indirectly |
| Ratio of net investment income to average net assets |
| Ratio of net investment income to average net assets |
| prior to fees waived and expense paid indirectly |
| Portfolio turnover |
| 1 | Total investment return is based on the change in net asset value of a share during the period and assumes reinvestment of dividends and distributions at net asset value and does not reflect the impact of a sales charge. Total investment return during some of the periods shown reflects a waiver by the manager. Performance would have been lower had the waiver not been in effect. |
See accompanying Notes, which are an integral part of the financial statements.
96
| Year Ended | |||||||||||||||
| 8/31/10 | 8/31/09 | 8/31/08 | 8/31/07 | 8/31/06 | |||||||||||
| $10.600 | $10.640 | $10.730 | $11.040 | $11.200 | |||||||||||
| 0.455 | 0.452 | 0.448 | 0.464 | 0.488 | |||||||||||
| 0.661 | (0.041 | ) | (0.089 | ) | (0.310 | ) | (0.160 | ) | |||||||
| 1.116 | 0.411 | 0.359 | 0.154 | 0.328 | |||||||||||
| (0.456 | ) | (0.451 | ) | (0.449 | ) | (0.464 | ) | (0.488 | ) | ||||||
| (0.456 | ) | (0.451 | ) | (0.449 | ) | (0.464 | ) | (0.488 | ) | ||||||
| $11.260 | $10.600 | $10.640 | $10.730 | $11.040 | |||||||||||
| 10.74% | 4.11% | 3.38% | 1.38% | 3.03% | |||||||||||
| $237,545 | $226,393 | $234,630 | $246,695 | $258,773 | |||||||||||
| 0.93% | 0.90% | 0.93% | 0.94% | 0.93% | |||||||||||
| 0.95% | 0.95% | 0.95% | 0.96% | 0.94% | |||||||||||
| 4.16% | 4.43% | 4.16% | 4.22% | 4.43% | |||||||||||
| 4.14% | 4.38% | 4.14% | 4.20% | 4.42% | |||||||||||
| 17% | 27% | 15% | 12% | 8% | |||||||||||
97
Financial highlights
Delaware Tax-Free Colorado Fund Class B
Delaware Tax-Free Colorado Fund Class B
Selected data for each share of the Fund outstanding throughout each period were as follows:
| Net asset value, beginning of period |
| Income (loss) from investment operations: |
| Net investment income |
| Net realized and unrealized gain (loss) on investments |
| Total from investment operations |
| Less dividends and distributions from: |
| Net investment income |
| Total dividends and distributions |
| Net asset value, end of period |
| Total return1 |
| Ratios and supplemental data: |
| Net assets, end of period (000 omitted) |
| Ratio of expenses to average net assets |
| Ratio of expenses to average net assets |
| prior to fees waived and expense paid indirectly |
| Ratio of net investment income to average net assets |
| Ratio of net investment income to average net assets |
| prior to fees waived and expense paid indirectly |
| Portfolio turnover |
1 Total investment return is based on the change in net asset value of a share during the period and assumes reinvestment of dividends and distributions at net asset value and does not reflect the impact of a sales charge. Total investment return during some of the periods shown reflects a waiver by the manager. Performance would have been lower had the waiver not been in effect.
See accompanying Notes, which are an integral part of the financial statements.
98
| Year Ended | |||||||||||||||
| 8/31/10 | 8/31/09 | 8/31/08 | 8/31/07 | 8/31/06 | |||||||||||
| $10.610 | $10.640 | $10.730 | $11.050 | $11.200 | |||||||||||
| 0.373 | 0.375 | 0.367 | 0.382 | 0.405 | |||||||||||
| 0.661 | (0.031 | ) | (0.089 | ) | (0.320 | ) | (0.150 | ) | |||||||
| 1.034 | 0.344 | 0.278 | 0.062 | 0.255 | |||||||||||
| (0.374 | ) | (0.374 | ) | (0.368 | ) | (0.382 | ) | (0.405 | ) | ||||||
| (0.374 | ) | (0.374 | ) | (0.368 | ) | (0.382 | ) | (0.405 | ) | ||||||
| $11.270 | $10.610 | $10.640 | $10.730 | $11.050 | |||||||||||
| 9.91% | 3.43% | 2.60% | 0.53% | 2.35% | |||||||||||
| $1,429 | $2,693 | $3,961 | $5,326 | $8,221 | |||||||||||
| 1.68% | 1.65% | 1.68% | 1.69% | 1.68% | |||||||||||
| 1.70% | 1.70% | 1.70% | 1.71% | 1.69% | |||||||||||
| 3.41% | 3.68% | 3.41% | 3.47% | 3.68% | |||||||||||
| �� | |||||||||||||||
| 3.39% | 3.63% | 3.39% | 3.45% | 3.67% | |||||||||||
| 17% | 27% | 15% | 12% | 8% | |||||||||||
99
Financial highlights
Delaware Tax-Free Colorado Fund Class C
Delaware Tax-Free Colorado Fund Class C
Selected data for each share of the Fund outstanding throughout each period were as follows:
| Net asset value, beginning of period |
| Income (loss) from investment operations: |
| Net investment income |
| Net realized and unrealized gain (loss) on investments |
| Total from investment operations |
| Less dividends and distributions from: |
| Net investment income |
| Total dividends and distributions |
| Net asset value, end of period |
| Total return1 |
| Ratios and supplemental data: |
| Net assets, end of period (000 omitted) |
| Ratio of expenses to average net assets |
| Ratio of expenses to average net assets |
| prior to fees waived and expense paid indirectly |
| Ratio of net investment income to average net assets |
| Ratio of net investment income to average net assets |
| prior to fees waived and expense paid indirectly |
| Portfolio turnover |
1 Total investment return is based on the change in net asset value of a share during the period and assumes reinvestment of dividends and distributions at net asset value and does not reflect the impact of a sales charge. Total investment return during some of the periods shown reflects a waiver by the manager. Performance would have been lower had the waiver not been in effect.
See accompanying Notes, which are an integral part of the financial statements.
100
| Year Ended | |||||||||||||||
| 8/31/10 | 8/31/09 | 8/31/08 | 8/31/07 | 8/31/06 | |||||||||||
| $10.630 | $10.660 | $10.750 | $11.070 | $11.220 | |||||||||||
| 0.374 | 0.375 | 0.367 | 0.382 | 0.405 | |||||||||||
| 0.661 | (0.031 | ) | (0.089 | ) | (0.320 | ) | (0.150 | ) | |||||||
| 1.035 | 0.344 | 0.278 | 0.062 | 0.255 | |||||||||||
| (0.375 | ) | (0.374 | ) | (0.368 | ) | (0.382 | ) | (0.405 | ) | ||||||
| (0.375 | ) | (0.374 | ) | (0.368 | ) | (0.382 | ) | (0.405 | ) | ||||||
| $11.290 | $10.630 | $10.660 | $10.750 | $11.070 | |||||||||||
| 9.90% | 3.43% | 2.60% | 0.53% | 2.34% | |||||||||||
| $15,155 | $11,542 | $9,836 | $10,152 | $9,971 | |||||||||||
| 1.68% | 1.65% | 1.68% | 1.69% | 1.68% | |||||||||||
| 1.70% | 1.70% | 1.70% | 1.71% | 1.69% | |||||||||||
| 3.41% | 3.68% | 3.41% | 3.47% | 3.68% | |||||||||||
| 3.39% | 3.63% | 3.39% | 3.45% | 3.67% | |||||||||||
| 17% | 27% | 15% | 12% | 8% | |||||||||||
101
Financial highlights
Delaware Tax-Free Idaho Fund Class A
Delaware Tax-Free Idaho Fund Class A
Selected data for each share of the Fund outstanding throughout each period were as follows:
| Net asset value, beginning of period |
| Income (loss) from investment operations: |
| Net investment income |
| Net realized and unrealized gain (loss) on investments |
| Total from investment operations |
| Less dividends and distributions from: |
| Net investment income |
| Total dividends and distributions |
| Net asset value, end of period |
| Total return1 |
| Ratios and supplemental data: |
| Net assets, end of period (000 omitted) |
| Ratio of expenses to average net assets |
| Ratio of expenses to average net assets |
| prior to fees waived and expense paid indirectly |
| Ratio of net investment income to average net assets |
| Ratio of net investment income to average net assets |
| prior to fees waived and expense paid indirectly |
| Portfolio turnover |
1 Total investment return is based on the change in net asset value of a share during the period and assumes reinvestment of dividends and distributions at net asset value and does not reflect the impact of a sales charge. Total investment return during some of the periods shown reflects a waiver by the manager. Performance would have been lower had the waiver not been in effect.
See accompanying Notes, which are an integral part of the financial statements.
102
| Year Ended | |||||||||||||||
| 8/31/10 | 8/31/09 | 8/31/08 | 8/31/07 | 8/31/06 | |||||||||||
| $11.490 | $11.260 | $11.260 | $11.450 | $11.630 | |||||||||||
| 0.431 | 0.436 | 0.437 | 0.448 | 0.449 | |||||||||||
| 0.633 | 0.228 | — | (0.190 | ) | (0.180 | ) | |||||||||
| 1.064 | 0.664 | 0.437 | 0.258 | 0.269 | |||||||||||
| (0.434 | ) | (0.434 | ) | (0.437 | ) | (0.448 | ) | (0.449 | ) | ||||||
| (0.434 | ) | (0.434 | ) | (0.437 | ) | (0.448 | ) | (0.449 | ) | ||||||
| $12.120 | $11.490 | $11.260 | $11.260 | $11.450 | |||||||||||
| 9.44% | 6.12% | 3.93% | 2.27% | 2.40% | |||||||||||
| $104,287 | $86,445 | $72,237 | $69,931 | $62,808 | |||||||||||
| 0.94% | 0.88% | 0.85% | 0.86% | 0.85% | |||||||||||
| 0.96% | 0.96% | 0.96% | 0.98% | 0.98% | |||||||||||
| 3.66% | 3.94% | 3.87% | 3.92% | 3.95% | |||||||||||
| 3.64% | 3.86% | 3.76% | 3.80% | 3.82% | |||||||||||
| 7% | 10% | 11% | 8% | 15% | |||||||||||
103
Financial highlights
Delaware Tax-Free Idaho Fund Class B
Delaware Tax-Free Idaho Fund Class B
Selected data for each share of the Fund outstanding throughout each period were as follows:
| Net asset value, beginning of period |
| Income (loss) from investment operations: |
| Net investment income |
| Net realized and unrealized gain (loss) on investments |
| Total from investment operations |
| Less dividends and distributions from: |
| Net investment income |
| Total dividends and distributions |
| Net asset value, end of period |
| Total return1 |
| Ratios and supplemental data: |
| Net assets, end of period (000 omitted) |
| Ratio of expenses to average net assets |
| Ratio of expenses to average net assets |
| prior to fees waived and expense paid indirectly |
| Ratio of net investment income to average net assets |
| Ratio of net investment income to average net assets |
| prior to fees waived and expense paid indirectly |
| Portfolio turnover |
1 Total investment return is based on the change in net asset value of a share during the period and assumes reinvestment of dividends and distributions at net asset value and does not reflect the impact of a sales charge. Total investment return during some of the periods shown reflects a waiver by the manager. Performance would have been lower had the waiver not been in effect.
See accompanying Notes, which are an integral part of the financial statements.
104
| Year Ended | |||||||||||||||
| 8/31/10 | 8/31/09 | 8/31/08 | 8/31/07 | 8/31/06 | |||||||||||
| $11.470 | $11.240 | $11.240 | $11.430 | $11.610 | |||||||||||
| 0.343 | 0.353 | 0.353 | 0.363 | 0.364 | |||||||||||
| 0.633 | 0.228 | — | (0.190 | ) | (0.180 | ) | |||||||||
| 0.976 | 0.581 | 0.353 | 0.173 | 0.184 | |||||||||||
| (0.346 | ) | (0.351 | ) | (0.353 | ) | (0.363 | ) | (0.364 | ) | ||||||
| (0.346 | ) | (0.351 | ) | (0.353 | ) | (0.363 | ) | (0.364 | ) | ||||||
| $12.100 | $11.470 | $11.240 | $11.240 | $11.430 | |||||||||||
| 8.64% | 5.34% | 3.17% | 1.51% | 1.64% | |||||||||||
| $2,450 | $3,359 | $5,123 | $6,003 | $7,892 | |||||||||||
| 1.69% | 1.63% | 1.60% | 1.61% | 1.60% | |||||||||||
| 1.71% | 1.71% | 1.71% | 1.73% | 1.73% | |||||||||||
| 2.91% | 3.19% | 3.12% | 3.17% | 3.20% | |||||||||||
| 2.89% | 3.11% | 3.01% | 3.05% | 3.07% | |||||||||||
| 7% | 10% | 11% | 8% | 15% | |||||||||||
105
Financial highlights
Delaware Tax-Free Idaho Fund Class C
Delaware Tax-Free Idaho Fund Class C
Selected data for each share of the Fund outstanding throughout each period were as follows:
| Net asset value, beginning of period |
| Income (loss) from investment operations: |
| Net investment income |
| Net realized and unrealized gain (loss) on investments |
| Total from investment operations |
| Less dividends and distributions from: |
| Net investment income |
| Total dividends and distributions |
| Net asset value, end of period |
| Total return1 |
| Ratios and supplemental data: |
| Net assets, end of period (000 omitted) |
| Ratio of expenses to average net assets |
| Ratio of expenses to average net assets |
| prior to fees waived and expense paid indirectly |
| Ratio of net investment income to average net assets |
| Ratio of net investment income to average net assets |
| prior to fees waived and expense paid indirectly |
| Portfolio turnover |
1 Total investment return is based on the change in net asset value of a share during the period and assumes reinvestment of dividends and distributions at net asset value and does not reflect the impact of a sales charge. Total investment return during some of the periods shown reflects a waiver by the manager. Performance would have been lower had the waiver not been in effect.
See accompanying Notes, which are an integral part of the financial statements.
106
| Year Ended | |||||||||||||||
| 8/31/10 | 8/31/09 | 8/31/08 | 8/31/07 | 8/31/06 | |||||||||||
| $11.480 | $11.250 | $11.250 | $11.440 | $11.630 | |||||||||||
| 0.342 | 0.353 | 0.352 | 0.363 | 0.364 | |||||||||||
| 0.633 | 0.228 | — | (0.190 | ) | (0.190 | ) | |||||||||
| 0.975 | 0.581 | 0.352 | 0.173 | 0.174 | |||||||||||
| (0.345 | ) | (0.351 | ) | (0.352 | ) | (0.363 | ) | (0.364 | ) | ||||||
| (0.345 | ) | (0.351 | ) | (0.352 | ) | (0.363 | ) | (0.364 | ) | ||||||
| $12.110 | $11.480 | $11.250 | $11.250 | $11.440 | |||||||||||
| 8.63% | 5.34% | 3.16% | 1.51% | 1.56% | |||||||||||
| $35,591 | $19,176 | $11,490 | $11,535 | $13,430 | |||||||||||
| 1.69% | 1.63% | 1.60% | 1.61% | 1.60% | |||||||||||
| 1.71% | 1.71% | 1.71% | 1.73% | 1.73% | |||||||||||
| 2.91% | 3.19% | 3.12% | 3.17% | 3.20% | |||||||||||
| 2.89% | 3.11% | 3.01% | 3.05% | 3.07% | |||||||||||
| 7% | 10% | 11% | 8% | 15% | |||||||||||
107
Financial highlights
Delaware Tax-Free New York Fund Class A
Delaware Tax-Free New York Fund Class A
Selected data for each share of the Fund outstanding throughout each period were as follows:
| Net asset value, beginning of period |
| Income (loss) from investment operations: |
| Net investment income |
| Net realized and unrealized gain (loss) on investments |
| Total from investment operations |
| Less dividends and distributions from: |
| Net investment income |
| Total dividends and distributions |
| Net asset value, end of period |
| Total return1 |
| Ratios and supplemental data: |
| Net assets, end of period (000 omitted) |
| Ratio of expenses to average net assets |
| Ratio of expenses to average net assets |
| prior to fees waived and expense paid indirectly |
| Ratio of net investment income to average net assets |
| Ratio of net investment income to average net assets |
| prior to fees waived and expense paid indirectly |
| Portfolio turnover |
1 Total investment return is based on the change in net asset value of a share during the period and assumes reinvestment of dividends and distributions at net asset value and does not reflect the impact of a sales charge. Total investment return during all of the periods shown reflects a waiver by the manager. Performance would have been lower had the waiver not been in effect.
See accompanying Notes, which are an integral part of the financial statements.
108
| Year Ended | |||||||||||||||
| 8/31/10 | 8/31/09 | 8/31/08 | 8/31/07 | 8/31/06 | |||||||||||
| $10.450 | $10.300 | $10.300 | $10.550 | $10.700 | |||||||||||
| 0.429 | 0.409 | 0.411 | 0.435 | 0.449 | |||||||||||
| 0.700 | 0.148 | — | (0.250 | ) | (0.150 | ) | |||||||||
| 1.129 | 0.557 | 0.411 | 0.185 | 0.299 | |||||||||||
| (0.429 | ) | (0.407 | ) | (0.411 | ) | (0.435 | ) | (0.449 | ) | ||||||
| (0.429 | ) | (0.407 | ) | (0.411 | ) | (0.435 | ) | (0.449 | ) | ||||||
| $11.150 | $10.450 | $10.300 | $10.300 | $10.550 | |||||||||||
| 11.02% | 5.65% | 4.04% | 1.75% | 2.90% | |||||||||||
| $37,716 | $22,780 | $15,340 | $14,817 | $13,519 | |||||||||||
| 0.80% | 0.85% | 0.85% | 0.79% | 0.65% | |||||||||||
| 1.07% | 1.10% | 1.09% | 1.10% | 1.09% | |||||||||||
| 3.94% | 4.10% | 3.97% | 4.13% | 4.28% | |||||||||||
| 3.67% | 3.85% | 3.73% | 3.82% | 3.84% | |||||||||||
| 15% | 36% | 28% | 14% | 20% | |||||||||||
109
Financial highlights
Delaware Tax-Free New York Fund Class B
Delaware Tax-Free New York Fund Class B
Selected data for each share of the Fund outstanding throughout each period were as follows:
| Net asset value, beginning of period |
| Income (loss) from investment operations: |
| Net investment income |
| Net realized and unrealized gain (loss) on investments |
| Total from investment operations |
| Less dividends and distributions from: |
| Net investment income |
| Total dividends and distributions |
| Net asset value, end of period |
| Total return1 |
| Ratios and supplemental data: |
| Net assets, end of period (000 omitted) |
| Ratio of expenses to average net assets |
| Ratio of expenses to average net assets |
| prior to fees waived and expense paid indirectly |
| Ratio of net investment income to average net assets |
| Ratio of net investment income to average net assets |
| prior to fees waived and expense paid indirectly |
| Portfolio turnover |
1 Total investment return is based on the change in net asset value of a share during the period and assumes reinvestment of dividends and distributions at net asset value and does not reflect the impact of a sales charge. Total investment return during all of the periods shown reflects a waiver by the manager. Performance would have been lower had the waiver not been in effect.
See accompanying Notes, which are an integral part of the financial statements.
110
| Year Ended | |||||||||||||||
| 8/31/10 | 8/31/09 | 8/31/08 | 8/31/07 | 8/31/06 | |||||||||||
| $10.420 | $10.270 | $10.280 | $10.530 | $10.670 | |||||||||||
| 0.347 | 0.334 | 0.333 | 0.357 | 0.370 | |||||||||||
| 0.700 | 0.148 | (0.010 | ) | (0.250 | ) | (0.140 | ) | ||||||||
| 1.047 | 0.482 | 0.323 | 0.107 | 0.230 | |||||||||||
| (0.347 | ) | (0.332 | ) | (0.333 | ) | (0.357 | ) | (0.370 | ) | ||||||
| (0.347 | ) | (0.332 | ) | (0.333 | ) | (0.357 | ) | (0.370 | ) | ||||||
| $11.120 | $10.420 | $10.270 | $10.280 | $10.530 | |||||||||||
| 10.21% | 4.88% | 3.17% | 0.99% | 2.23% | |||||||||||
| $736 | $1,018 | $1,549 | $2,164 | $2,858 | |||||||||||
| 1.55% | 1.60% | 1.60% | 1.54% | 1.40% | |||||||||||
| 1.82% | 1.85% | 1.84% | 1.85% | 1.84% | |||||||||||
| 3.19% | 3.35% | 3.22% | 3.38% | 3.53% | |||||||||||
| 2.92% | 3.10% | 2.98% | 3.07% | 3.09% | |||||||||||
| 15% | 36% | 28% | 14% | 20% | |||||||||||
111
Financial highlights
Delaware Tax-Free New York Fund Class C
Delaware Tax-Free New York Fund Class C
Selected data for each share of the Fund outstanding throughout each period were as follows:
| Net asset value, beginning of period |
| Income (loss) from investment operations: |
| Net investment income |
| Net realized and unrealized gain (loss) on investments |
| Total from investment operations |
| Less dividends and distributions from: |
| Net investment income |
| Total dividends and distributions |
| Net asset value, end of period |
| Total return1 |
| Ratios and supplemental data: |
| Net assets, end of period (000 omitted) |
| Ratio of expenses to average net assets |
| Ratio of expenses to average net assets |
| prior to fees waived and expense paid indirectly |
| Ratio of net investment income to average net assets |
| Ratio of net investment income to average net assets |
| prior to fees waived and expense paid indirectly |
| Portfolio turnover |
1 Total investment return is based on the change in net asset value of a share during the period and assumes reinvestment of dividends and distributions at net asset value and does not reflect the impact of a sales charge. Total investment return during all of the periods shown reflects a waiver by the manager. Performance would have been lower had the waiver not been in effect.
See accompanying Notes, which are an integral part of the financial statements.
112
| Year Ended | ||||||||||||||||
| 8/31/10 | 8/31/09 | 8/31/08 | 8/31/07 | 8/31/06 | ||||||||||||
| $10.420 | $10.270 | $10.280 | $10.530 | $10.670 | ||||||||||||
| 0.346 | 0.333 | 0.333 | 0.357 | 0.370 | ||||||||||||
| 0.700 | 0.148 | (0.010 | ) | (0.250 | ) | (0.140 | ) | |||||||||
| 1.046 | 0.481 | 0.323 | 0.107 | 0.230 | ||||||||||||
| (0.346 | ) | (0.331 | ) | (0.333 | ) | (0.357 | ) | (0.370 | ) | |||||||
| (0.346 | ) | (0.331 | ) | (0.333 | ) | (0.357 | ) | (0.370 | ) | |||||||
| $11.120 | $10.420 | $10.270 | $10.280 | $10.530 | ||||||||||||
| 10.20% | 4.88% | 3.17% | 0.99% | 2.23% | ||||||||||||
| $13,462 | $5,651 | $2,049 | $2,131 | $2,068 | ||||||||||||
| 1.55% | 1.60% | 1.60% | 1.54% | 1.40% | ||||||||||||
| 1.82% | 1.85% | 1.84% | 1.85% | 1.84% | ||||||||||||
| 3.19% | 3.35% | 3.22% | 3.38% | 3.53% | ||||||||||||
| 2.92% | 3.10% | 2.98% | 3.07% | 3.09% | ||||||||||||
| 15% | 36% | 28% | 14% | 20% | ||||||||||||
113
| Notes to financial statements | |
| Delaware multiple state tax-free funds | August 31, 2010 |
Voyageur Mutual Funds is organized as a Delaware statutory trust and offers five series: Delaware Minnesota High-Yield Municipal Bond Fund, Delaware National High-Yield Municipal Bond Fund, Delaware Tax-Free California Fund, Delaware Tax-Free Idaho Fund, and Delaware Tax-Free New York Fund. Voyageur Mutual Funds II is organized as a Delaware statutory trust and offers one series: Delaware Tax-Free Colorado Fund. Voyageur Insured Funds is organized as a Delaware statutory trust and offers one series: Delaware Tax-Free Arizona Fund. Voyageur Mutual Funds, Voyageur Mutual Funds II, and Voyageur Insured Funds are individually referred to as a Trust and collectively as the Trusts. These financial statements and related notes pertain to Delaware Tax-Free Arizona Fund, Delaware Tax-Free California Fund, Delaware Tax-Free Colorado Fund, Delaware Tax-Free Idaho Fund, and Delaware Tax-Free New York Fund (each, a Fund or, collectively, the Funds). Th e above Trusts are open-end investment companies. The Funds are considered non-diversified under the Investment Company Act of 1940, as amended, and offer Class A, Class B, and Class C shares. Class A shares are sold with a maximum front-end sales charge of up to 4.50%. Class A share purchases of $1,000,000 or more will incur a contingent deferred sales charge (CDSC) of 1% if redeemed during the first year and 0.50% during the second year, provided that Delaware Distributors, L.P. (DDLP) paid a financial advisor a commission on the purchase of those shares. Class B shares may be purchased only through dividend reinvestment and certain permitted exchanges. Prior to June 1, 2007, Class B shares were sold with a CDSC that declined from 4% to zero depending upon the period of time the shares were held. Class B shares will automatically convert to Class A shares on a quarterly basis approximately eight years after purchase. Class C shares are sold with a CDSC of 1%, if redeemed during the first twelve months.
The investment objective of each Fund is to seek as high a level of current income exempt from federal income tax and personal income tax in its respective state, as is consistent with preservation of capital.
1. Significant Accounting Policies
The following accounting policies are in accordance with U.S. generally accepted accounting principles (U.S. GAAP) and are consistently followed by the Funds.
Security Valuation — Debt securities are valued by an independent pricing service or broker. To the extent current market prices are not available, the pricing service may take into account developments related to the specific security, as well as transactions in comparable securities. Short-term debt securities are valued at market value. These securities will generally be categorized as Level 2 investments. Open-end investment companies are valued at their published net asset value. These securities will generally be categorized as Level 1 investments. Generally, other securities and assets for which market quotations are not readily available are valued at fair value as determined in good faith under the direction of each Fund’s Board of Trustees (each, a Board or, collectively, the Boards). In determining wheth er market quotations are readily available or fair valuation will be used, various factors will be taken into consideration, such as market closures or suspension of trading in a security. These securities will generally be categorized as Level 3 investments.
114
Federal Income Taxes — No provision for federal income taxes has been made as each Fund intends to continue to qualify for federal income tax purposes as a regulated investment company under Subchapter M of the Internal Revenue Code of 1986, as amended, and make the requisite distributions to shareholders. The Funds evaluate tax positions taken or expected to be taken in the course of preparing the Funds’ tax returns to determine whether the tax positions are “more-likely-than-not” of being sustained by the applicable tax authority. Tax positions not deemed to meet the more-likely-than-not threshold are recorded as a tax benefit or expense in the current year. Management has analyzed the Funds’ tax positions taken on federal income tax returns for all open tax years (August 31, 2007 - August 31, 2 010), and has concluded that no provision for federal income tax is required in the Funds’ financial statements.
Class Accounting — Investment income and common expenses are allocated to the various classes of each Fund on the basis of “settled shares” of each class in relation to the net assets of each Fund. Realized and unrealized gain (loss) on investments are allocated to the various classes of each Fund on the basis of daily net assets of each class. Distribution expenses relating to a specific class are charged directly to that class.
Use of Estimates — The preparation of financial statements in conformity with U.S. GAAP requires management to make estimates and assumptions that affect the reported amounts of assets and liabilities and disclosure of contingent assets and liabilities at the date of the financial statements and the reported amounts of revenues and expenses during the reporting period. Actual results could differ from those estimates and such differences could be material.
Other — Expenses directly attributable to the Funds are charged directly to the Funds. Other expenses common to various funds within the Delaware Investments® Family of Funds are generally allocated amongst such funds on the basis of average net assets. Management fees and some other expenses are paid monthly. Security transactions are recorded on the date the securities are purchased or sold (trade date) for financial reporting purposes. Costs used in calculating real ized gains and losses on the sale of investment securities are those of the specific securities sold. Interest income is recorded on the accrual basis. Discounts and premiums are amortized to interest income over the lives of the respective securities. Each Fund declares dividends daily from net investment income and pays such dividends monthly and declares and pays distributions from net realized gain on investments, if any, annually. Such dividends and distributions, if any, are recorded on the ex-dividend date.
The Funds receive earnings credits from their custodian when positive cash balances are maintained, which are used to offset custody fees. There were no earnings credits for the year ended August 31, 2010.
115
Notes to financial statements
Delaware multiple state tax-free funds
Delaware multiple state tax-free funds
1. Significant Accounting Policies (continued)
The Funds may receive earnings credits from their transfer agent when positive cash balances are maintained, which may be used to offset transfer agent fees. The expense paid under this arrangement is included in dividend disbursing and transfer agent fees and expenses on the statements of operations with the corresponding offset shown as “expense paid indirectly.” For the year ended August 31, 2010, the Funds earned the following amounts under this agreement:
| Delaware Tax-Free | Delaware Tax-Free | Delaware Tax-Free | Delaware Tax-Free | Delaware Tax-Free | ||||
| Arizona Fund | California Fund | Colorado Fund | Idaho Fund | New York Fund | ||||
| $66 | $46 | $147 | $67 | $25 |
2. Investment Management, Administration Agreements and Other Transactions with Affiliates
In accordance with the terms of its respective investment management agreement, each Fund pays Delaware Management Company (DMC), a series of Delaware Management Business Trust and the investment manager, an annual fee, which is calculated based on each Fund’s average daily net assets as follows:
| Delaware | Delaware | Delaware | Delaware | Delaware | ||||||||||
| Tax-Free | Tax-Free | Tax-Free | Tax-Free | Tax-Free | ||||||||||
| Arizona Fund | California Fund | Colorado Fund | Idaho Fund | New York Fund | ||||||||||
| On the first $500 million | 0.500 | % | 0.550 | % | 0.550 | % | 0.550 | % | 0.550 | % | ||||
| On the next $500 million | 0.475 | % | 0.500 | % | 0.500 | % | 0.500 | % | 0.500 | % | ||||
| On the next $1.5 billion | 0.450 | % | 0.450 | % | 0.450 | % | 0.450 | % | 0.450 | % | ||||
| In excess of $2.5 billion | 0.425 | % | 0.425 | % | 0.425 | % | 0.425 | % | 0.425 | % | ||||
DMC has voluntarily agreed to waive that portion, if any, of its management fee and reimburse each Fund to the extent necessary to ensure that total annual operating expenses, (excluding any 12b-1 plan expenses, taxes, interest, inverse floater program expenses, brokerage fees, certain insurance costs, and nonroutine expenses or costs, including, but not limited to, those relating to reorganizations, litigation, conducting shareholder meetings, and liquidations (collectively, nonroutine expenses)), do not exceed specified percentages of average daily net assets as shown below until such time as the waivers are discontinued. For purposes of these waivers and reimbursements, nonroutine expenses may also include such additional costs and expenses, as may be agreed upon from time to time by each Fund’s Board and DMC. These expense waivers and reimbursements apply only to expenses paid directly by the Funds.
116
| Delaware | Delaware | Delaware | Delaware | Delaware | ||||||||||
| Tax-Free | Tax-Free | Tax-Free | Tax-Free | Tax-Free | ||||||||||
| Arizona Fund | California Fund | Colorado Fund | Idaho Fund | New York Fund | ||||||||||
| Effective January 1, 2010 | ||||||||||||||
| operating expense limitation | ||||||||||||||
| as a percentage of average | ||||||||||||||
| daily net assets (per annum) | —% | 0.57% | —% | —% | 0.55% | |||||||||
| Through December 31, 2009, | ||||||||||||||
| operating expense | ||||||||||||||
| limitation as a percentage | ||||||||||||||
| of average daily net assets | ||||||||||||||
| (per annum) | 0.50% | 0.63% | 0.64% | 0.65% | 0.60% | |||||||||
| Expiration date | 12/31/09 | 12/31/09 | 12/31/09 | 12/31/09 | 12/31/09 | |||||||||
Delaware Service Company, Inc. (DSC), an affiliate of DMC, provides fund accounting and financial administration oversight services to each Fund. For these services, the Funds pay DSC fees based on the aggregate daily net assets of the Delaware Investments® Family of Funds at the following annual rate: 0.0050% of the first $30 billion; 0.0045% of the next $10 billion; 0.0040% of the next $10 billion; and 0.0025% of aggregate average daily net assets in excess of $50 billion. The fees payable to DSC under the service agreement described above are allocated among all Funds in the Delaware Investments Family of Funds on a relative net asset value basis. For the year ended August 31, 2010, each Fund was charged for these services as follows:
| Delaware | Delaware | Delaware | Delaware | Delaware | ||||||
| Tax-Free | Tax-Free | Tax-Free | Tax-Free | Tax-Free | ||||||
| Arizona Fund | California Fund | Colorado Fund | Idaho Fund | New York Fund | ||||||
| $6,091 | $4,155 | $12,407 | $6,173 | $1,954 |
DSC also provides dividend disbursing and transfer agency services. Each Fund pays DSC a monthly fee based on the number of shareholder accounts for dividend disbursing and transfer agent services.
Pursuant to a distribution agreement and distribution plan, each Fund pays DDLP, the distributor and an affiliate of DMC, an annual distribution and service fee not to exceed 0.25% of the average daily net assets of the Class A shares and 1.00% of the average daily net assets of the Class B and C shares.
117
Notes to financial statements
Delaware multiple state tax-free funds
Delaware multiple state tax-free funds
2. Investment Management, Administration Agreements and Other Transactions with Affiliates (continued)
At August 31, 2010, each Fund had liabilities payable to affiliates as follows:
| Delaware | Delaware | Delaware | Delaware | Delaware | |||||||||||||||
| Tax-Free | Tax-Free | Tax-Free | Tax-Free | Tax-Free | |||||||||||||||
| Arizona Fund | California Fund | Colorado Fund | Idaho Fund | New York Fund | |||||||||||||||
| Investment management | |||||||||||||||||||
| fee payable to DMC | $ | 50,132 | $ | 30,131 | $ | 117,462 | $ | 64,741 | $ | 11,850 | |||||||||
| Dividend disbursing, | |||||||||||||||||||
| transfer agent and fund | |||||||||||||||||||
| accounting oversight | |||||||||||||||||||
| fees and other expenses | |||||||||||||||||||
| payable to DSC | 2,270 | 1,804 | 5,108 | 2,650 | 1,246 | ||||||||||||||
| Distribution fees | |||||||||||||||||||
| payable to DDLP | 31,912 | 30,784 | 63,700 | 52,383 | 19,105 | ||||||||||||||
| Other expenses payable to | |||||||||||||||||||
| DMC and affiliates* | 4,228 | 3,412 | 7,983 | 3,995 | 2,455 | ||||||||||||||
*DMC, as part of its administrative services, pays operating expenses on behalf of each Fund and is reimbursed on a periodic basis. Such expenses include items such as printing of shareholder reports, fees for audit, legal and tax services, registration fees and trustees’ fees.
As provided in the investment management agreement, each Fund bears the cost of certain legal and tax services, including internal legal and tax services provided to each Fund by DMC and/or its affiliates’ employees. For the year ended August 31, 2010, each Fund was charged for internal legal and tax services provided by DMC and/or its affiliates’ employees as follows:
| Delaware | Delaware | Delaware | Delaware | Delaware | ||||||
| Tax-Free | Tax-Free | Tax-Free | Tax-Free | Tax-Free | ||||||
| Arizona Fund | California Fund | Colorado Fund | Idaho Fund | New York Fund | ||||||
| $4,563 | $3,294 | $9,785 | $5,373 | $1,848 |
For the year ended August 31, 2010, DDLP earned commissions on sales of Class A shares for each Fund as follows:
| Delaware | Delaware | Delaware | Delaware | Delaware | |||||
| Tax-Free | Tax-Free | Tax-Free | Tax-Free | Tax-Free | |||||
| Arizona Fund | California Fund | Colorado Fund | Idaho Fund | New York Fund | |||||
| $10,452 | $14,210 | $23,982 | $57,128 | $45,905 |
118
For the year ended August 31, 2010, DDLP received gross CDSC commissions on redemptions of each Fund’s Class A, Class B and Class C shares, and these commissions were entirely used to offset up-front commissions previously paid by DDLP to broker/dealers on sales of those shares. The amounts received were as follows:
| Delaware | Delaware | Delaware | Delaware | Delaware | ||||||||||||||||
| Tax-Free | Tax-Free | Tax-Free | Tax-Free | Tax-Free | ||||||||||||||||
| Arizona Fund | California Fund | Colorado Fund | Idaho Fund | New York Fund | ||||||||||||||||
| Class A | $ | — | $ | — | $ | — | $ | — | $ | — | ||||||||||
| Class B | 1,009 | 261 | 303 | 535 | — | |||||||||||||||
| Class C | 445 | 1,803 | 1,085 | 9,119 | 844 | |||||||||||||||
Trustees’ fees include expenses accrued by the Funds for each Trustee’s retainer and meeting fees. Certain officers of DMC, DSC and DDLP are officers and/or Trustees of the Trusts. These officers and Trustees are paid no compensation by the Funds.
3. Investments
For the year ended August 31, 2010, the Funds made purchases and sales of investment securities other than short-term investments as follows:
| Delaware | Delaware | Delaware | Delaware | Delaware | |||||
| Tax-Free | Tax-Free | Tax-Free | Tax-Free | Tax-Free | |||||
| Arizona Fund | California Fund | Colorado Fund | Idaho Fund | New York Fund | |||||
| Purchases | $18,431,501 | $30,471,028 | $41,337,553 | $37,688,730 | $24,034,969 | ||||
| Sales | 33,144,867 | 28,406,921 | 42,191,387 | 8,050,034 | 5,779,101 |
At August 31, 2010, the cost of investments and unrealized appreciation (depreciation) for federal income tax purposes for each Fund were as follows:
| Delaware | Delaware | Delaware | Delaware | Delaware | ||||||||||||||||
| Tax-Free | Tax-Free | Tax-Free | Tax-Free | Tax-Free | ||||||||||||||||
| Arizona Fund | California Fund | Colorado Fund | Idaho Fund | New York Fund | ||||||||||||||||
| Cost of | ||||||||||||||||||||
| investments | $ | 111,694,928 | $ | 86,068,606 | $ | 237,480,796 | $ | 133,317,440 | $ | 47,417,949 | ||||||||||
| Aggregate | ||||||||||||||||||||
| unrealized | ||||||||||||||||||||
| appreciation | $ | 7,992,529 | $ | 5,393,989 | $ | 15,897,546 | $ | 9,768,272 | $ | 3,675,703 | ||||||||||
| Aggregate | ||||||||||||||||||||
| unrealized | ||||||||||||||||||||
| depreciation | (346,228 | ) | (1,018,756 | ) | (2,345,809 | ) | (6,963 | ) | (87,444 | ) | ||||||||||
| Net unrealized | ||||||||||||||||||||
| appreciation | $ | 7,646,301 | $ | 4,375,233 | $ | 13,551,737 | $ | 9,761,309 | $ | 3,588,259 | ||||||||||
U.S. GAAP defines fair value as the price that the Funds would receive to sell an asset or pay to transfer a liability in an orderly transaction between market participants at the measurement date under current market conditions. A three level hierarchy for fair value
119
Notes to financial statements
Delaware multiple state tax-free funds
Delaware multiple state tax-free funds
3. Investments (continued)
measurements has been established based upon the transparency of inputs to the valuation of an asset or liability. Inputs may be observable or unobservable and refer broadly to the assumptions that market participants would use in pricing the asset or liability. Observable inputs reflect the assumptions market participants would use in pricing the asset or liability based on market data obtained from sources independent of the reporting entity. Unobservable inputs reflect the reporting entity’s own assumptions about the assumptions that market participants would use in pricing the asset or liability developed based on the best information available under the circumstances. Each Fund’s investment in its entirety is assigned a level based upon the observability of the inputs which are significant to the overall valuation. The three level hierarchy of inputs is summarized below.
| Level 1 – | inputs are quoted prices in active markets for identical investments |
| Level 2 – | other observable inputs (including, but not limited to: quoted prices for similar assets or liabilities in markets that are active, quoted prices for identical or similar assets or liabilities in markets that are not active, inputs other than quoted prices that are observable for the assets or liabilities (such as interest rates, yield curves, volatilities, prepayment speeds, loss severities, credit risks and default rates) or other market-corroborated inputs) |
| Level 3 – | inputs are significant unobservable inputs (including the fund’s own assumptions used to determine the fair value of investments) |
The following table summarizes the valuation of the Funds’ investments by fair value hierarchy levels as of August 31, 2010:
| Delaware Tax-Free Arizona Fund | ||||||||
| Level 1 | Level 2 | Total | ||||||
| Municipal Bonds | $ | — | $ | 118,095,526 | $ | 118,095,526 | ||
| Short-Term Investment | 1,245,703 | — | 1,245,703 | |||||
| Total | $ | 1,245,703 | $ | 118,095,526 | $ | 119,341,229 | ||
| Delaware Tax-Free California Fund | ||||||||
| Level 1 | Level 2 | Total | ||||||
| Municipal Bonds | $ | — | $ | 88,983,231 | $ | 88,983,231 | ||
| Short-Term Investments | 460,608 | 1,000,000 | 1,460,608 | |||||
| Total | $ | 460,608 | $ | 89,983,231 | $ | 90,443,839 | ||
| Delaware Tax-Free Colorado Fund | ||||||||
| Level 1 | Level 2 | Total | ||||||
| Municipal Bonds | $ | — | $ | 250,654,145 | $ | 250,654,145 | ||
| Short-Term Investment | 378,388 | — | 378,388 | |||||
| Total | $ | 378,388 | $ | 250,654,145 | $ | 251,032,533 | ||
120
| Delaware Tax-Free Idaho Fund | ||||||||
| Level 1 | Level 2 | Total | ||||||
| Municipal Bonds | $ | — | $ | 140,081,231 | $ | 140,081,231 | ||
| Short-Term Investments | 297,518 | 2,700,000 | 2,997,518 | |||||
| Total | $ | 297,518 | $ | 142,781,231 | $ | 143,078,749 | ||
| Delaware Tax-Free New York Fund | ||||||||
| Level 2 | ||||||||
| Municipal Bonds | $ | 49,806,208 | ||||||
| Short-Term Investments | 1,200,000 | |||||||
| Total | $ | 51,006,208 | ||||||
There were no Level 3 securities at the beginning or end of the year.
In January 2010, the Financial Accounting Standards Board issued an Accounting Standards Update, Improving Disclosures about Fair Value Measurements, which introduced new disclosure requirements and clarified certain existing disclosure requirements around fair value measurements currently presented above. The new disclosures and clarifications of existing disclosures are generally effective for the Funds’ fiscal year ending August 31, 2010 and interim periods therein. During the year ended August 31, 2010, there were no transfers of securities between Level 1 investments, Level 2 investments or Level 3 investments that had a material impact to the Funds.
4. Dividend and Distribution Information
Income and long-term capital gain distributions are determined in accordance with federal income tax regulations, which may differ from U.S. GAAP. Additionally, distributions from net short-term gains on sales of investment securities are treated as ordinary income for federal income tax purposes. The tax character of dividends and distributions paid during the years ended August 31, 2010 and 2009 was as follows:
| Delaware | Delaware | Delaware | Delaware | Delaware | ||||||||||||||||||||
| Tax-Free | Tax-Free | Tax-Free | Tax-Free | Tax-Free | ||||||||||||||||||||
| Arizona Fund | California Fund | Colorado Fund | Idaho Fund | New York Fund | ||||||||||||||||||||
| Year Ended 8/31/10 | ||||||||||||||||||||||||
| Tax-exempt income | $ | 4,579,114 | $ | 3,488,842 | $ | 10,068,514 | $ | 4,144,275 | $ | 1,443,380 | ||||||||||||||
| Ordinary income | 108,858 | 99,956 | 178,857 | 184,644 | 17,789 | |||||||||||||||||||
| Total | $ | 4,687,972 | $ | 3,588,798 | $ | 10,247,371 | $ | 4,328,919 | $ | 1,461,169 | ||||||||||||||
| Year Ended 8/31/09 | ||||||||||||||||||||||||
| Tax-exempt income | $ | 4,956,787 | $ | 3,385,072 | $ | 10,156,494 | $ | 3,483,707 | $ | 894,982 | ||||||||||||||
| Ordinary income | — | — | 12,530 | — | — | |||||||||||||||||||
| Total | $ | 4,956,787 | $ | 3,385,072 | $ | 10,169,024 | $ | 3,483,707 | $ | 894,982 | ||||||||||||||
121
Notes to financial statements
Delaware multiple state tax-free funds
Delaware multiple state tax-free funds
5. Components of Net Assets on a Tax Basis
As of August 31, 2010, the components of net assets on a tax basis were as follows:
| Delaware | Delaware | Delaware | Delaware | Delaware | ||||||||||||||
| Tax-Free | Tax-Free | Tax-Free | Tax-Free | Tax-Free | ||||||||||||||
| Arizona Fund | California Fund | Colorado Fund | Idaho Fund | New York Fund | ||||||||||||||
| Shares of beneficial | ||||||||||||||||||
| interest | $ | 111,486,795 | $ | 87,796,897 | $ | 243,576,419 | $ | 132,577,310 | $48,369,674 | |||||||||
| Undistributed | ||||||||||||||||||
| long-term | ||||||||||||||||||
| capital gains | — | — | — | 200 | — | |||||||||||||
| Distributions | ||||||||||||||||||
| payable | (110,017 | ) | (89,889 | ) | (246,421 | ) | (116,278 | ) | (42,305 | ) | ||||||||
| Undistributed | ||||||||||||||||||
| tax-exempt | ||||||||||||||||||
| income | 136,213 | 108,652 | 246,421 | 105,059 | 41,654 | |||||||||||||
| Post-October | ||||||||||||||||||
| losses | — | (499,093 | ) | — | — | (19,786 | ) | |||||||||||
| Capital loss | ||||||||||||||||||
| carryforwards | (32,820 | ) | (10,217 | ) | (2,998,984 | ) | — | (23,182 | ) | |||||||||
| Unrealized | ||||||||||||||||||
| appreciation of | ||||||||||||||||||
| investments | 7,646,301 | 4,375,233 | 13,551,737 | 9,761,309 | 3,588,259 | |||||||||||||
| Net assets | $ | 119,126,472 | $ | 91,681,583 | $ | 254,129,172 | $ | 142,327,600 | $51,914,314 | |||||||||
The differences between book basis and tax basis components of net assets are primarily attributable to tax deferral of losses on wash sales, tax treatment of distribution payables and tax treatment of market discount on debt instruments.
Post-October losses represent losses realized on investment transactions from November 1, 2009 through August 31, 2010 that, in accordance with federal income tax regulations, the identified Funds have elected to defer and treat as having arisen in the following fiscal year.
122
For financial reporting purposes, capital accounts are adjusted to reflect the tax character of permanent book/tax differences. Reclassifications are primarily due to tax treatment of market discount on debt instruments. Results of operations and net assets were not affected by these reclassifications. For the year ended August 31, 2010, the Funds recorded the following reclassifications:
| Delaware | Delaware | Delaware | Delaware | Delaware | |||||||||||||||
| Tax-Free | Tax-Free | Tax-Free | Tax-Free | Tax-Free | |||||||||||||||
| Arizona Fund | California Fund | Colorado Fund | Idaho Fund | New York Fund | |||||||||||||||
| Undistributed | |||||||||||||||||||
| (distributions in excess of) | |||||||||||||||||||
| net investment income | $ | (19,269 | ) | $ | (2,954 | ) | $ | (15,879 | ) | $ | 11,932 | $ | (8,111 | ) | |||||
| Accumulated net realized | |||||||||||||||||||
| gain (loss) | 19,269 | 2,954 | 15,879 | (11,932 | ) | 8,111 | |||||||||||||
For federal income tax purposes, capital loss carryforwards may be carried forward and applied against future capital gains. In 2010, the Funds utilized capital loss carryforwards as follows:
| Delaware | Delaware | Delaware | Delaware | ||||
| Tax-Free | Tax-Free | Tax-Free | Tax-Free | ||||
| Arizona Fund | California Fund | Colorado Fund | Idaho Fund | ||||
| $1,415,651 | $217,477 | $2,102,969 | $89,623 |
Capital loss carryforwards remaining at August 31, 2010 will expire as follows:
| Delaware | Delaware | Delaware | Delaware | ||||||||||||||||||
| Year of | Tax-Free | Tax-Free | Tax-Free | Tax-Free | |||||||||||||||||
| Expiration | Arizona Fund | California Fund | Colorado Fund | New York Fund | |||||||||||||||||
| 2012 | $ | 32,820 | $ | — | $ | 693,591 | $ | — | |||||||||||||
| 2013 | — | — | 57,695 | — | |||||||||||||||||
| 2014 | — | — | 2,203,520 | — | |||||||||||||||||
| 2016 | — | 10,217 | 44,178 | 14,929 | |||||||||||||||||
| 2018 | — | — | — | 8,253 | |||||||||||||||||
| Total | $ | 32,820 | $ | 10,217 | $ | 2,998,984 | $ | 23,182 | |||||||||||||
123
Notes to financial statements
Delaware multiple state tax-free funds
Delaware multiple state tax-free funds
6. Capital Shares
Transactions in capital shares were as follows:
| Delaware Tax-Free | Delaware Tax-Free | Delaware Tax-Free | |||||||||||||||
| Arizona Fund | California Fund | Colorado Fund | |||||||||||||||
| Year Ended | Year Ended | Year Ended | |||||||||||||||
| 8/31/10 | 8/31/09 | 8/31/10 | 8/31/09 | 8/31/10 | 8/31/09 | ||||||||||||
| Shares sold: | |||||||||||||||||
| Class A | 515,840 | 756,808 | 1,434,211 | 825,013 | 1,455,185 | 1,387,638 | |||||||||||
| Class B | 6 | 1,968 | 12,712 | 9,030 | — | 1,049 | |||||||||||
| Class C | 109,633 | 102,547 | 298,932 | 208,816 | 370,563 | 281,038 | |||||||||||
| Shares issued upon reinvestment of dividends and distributions: | |||||||||||||||||
| Class A | 187,152 | 207,965 | 152,556 | 152,565 | 566,146 | 595,084 | |||||||||||
| Class B | 6,483 | 12,138 | 9,449 | 13,524 | 3,385 | 4,925 | |||||||||||
| Class C | 13,172 | 13,735 | 32,069 | 35,227 | 31,073 | 24,239 | |||||||||||
| 832,286 | 1,095,161 | 1,939,929 | 1,244,175 | 2,426,352 | 2,293,973 | ||||||||||||
| Shares repurchased: | |||||||||||||||||
| Class A | (1,748,428 | ) | (1,879,717 | ) | (1,038,915 | ) | (1,444,076 | ) | (2,288,864 | ) | (2,677,810 | ) | |||||
| Class B | (344,965 | ) | (307,293 | ) | (204,969 | ) | (167,397 | ) | (130,484 | ) | (124,079 | ) | |||||
| Class C | (97,006 | ) | (267,390 | ) | (262,607 | ) | (358,482 | ) | (145,599 | ) | (141,654 | ) | |||||
| (2,190,399 | ) | (2,454,400 | ) | (1,506,491 | ) | (1,969,955 | ) | (2,564,947 | ) | (2,943,543 | ) | ||||||
| Net increase | |||||||||||||||||
| (decrease) | (1,358,113 | ) | (1,359,239 | ) | 433,438 | (725,780 | ) | (138,595 | ) | (649,570 | ) | ||||||
| Delaware Tax-Free | Delaware Tax-Free | ||||||||||
| Idaho Fund | New York Fund | ||||||||||
| Year Ended | Year Ended | ||||||||||
| 8/31/10 | 8/31/09 | 8/31/10 | 8/31/09 | ||||||||
| Shares sold: | |||||||||||
| Class A | 1,582,213 | 1,615,020 | 1,519,766 | 1,035,723 | |||||||
| Class B | 853 | 5,765 | 880 | 4,787 | |||||||
| Class C | 1,457,021 | 758,087 | 830,745 | 396,933 | |||||||
| Shares issued upon reinvestment of dividends and distributions: | |||||||||||
| Class A | 206,666 | 171,510 | 66,469 | 40,258 | |||||||
| Class B | 5,292 | 8,957 | 1,486 | 2,303 | |||||||
| Class C | 48,259 | 22,570 | 18,395 | 6,249 | |||||||
| 3,300,304 | 2,581,909 | 2,437,741 | 1,486,253 | ||||||||
| Shares repurchased: | |||||||||||
| Class A | (709,358 | ) | (679,777 | ) | (383,035 | ) | (385,163 | ) | |||
| Class B | (96,566 | ) | (177,717 | ) | (33,835 | ) | (60,185 | ) | |||
| Class C | (237,236 | ) | (131,937 | ) | (180,662 | ) | (60,407 | ) | |||
| (1,043,160 | ) | (989,431 | ) | (597,532 | ) | (505,755 | ) | ||||
| Net increase | 2,257,144 | 1,592,478 | 1,840,209 | 980,498 | |||||||
124
For the years ended August 31, 2010 and 2009, the following shares and values were converted from Class B to Class A shares. The respective amounts are included in Class B redemptions and Class A subscriptions in the tables on page 123 and the statements of changes in net assets.
| Year Ended | Year Ended | ||||||||||
| 8/31/10 | 8/31/09 | ||||||||||
| Class B | Class A | Class B | Class A | ||||||||
| Shares | Shares | Value | Shares | Shares | Value | ||||||
| Delaware Tax-Free | |||||||||||
| Arizona Fund | 202,963 | 203,104 | $2,307,336 | 126,754 | 126,825 | $1,338,820 | |||||
| Delaware Tax-Free | |||||||||||
| California Fund | 118,852 | 119,295 | 1,315,929 | 92,283 | 92,659 | 913,283 | |||||
| Delaware Tax-Free | |||||||||||
| Colorado Fund | 80,300 | 80,348 | 875,705 | 28,997 | 29,016 | 288,928 | |||||
| Delaware Tax-Free | |||||||||||
| Idaho Fund | 67,072 | 66,958 | 786,291 | 58,929 | 58,820 | 644,988 | |||||
| Delaware Tax-Free | |||||||||||
| New York Fund | 24,033 | 23,966 | 257,369 | 33,488 | 33,413 | 327,019 | |||||
7. Line of Credit
The Funds, along with certain other funds in the Delaware Investments® Family of Funds (Participants), participate in a $35,000,000 revolving line of credit with The Bank of New York Mellon to be used for temporary or emergency purposes as an additional source of liquidity to fund redemptions of investor shares. Under the agreement, the Participants are charged an annual commitment fee, which is allocated across the Participants on the basis of each Participant’s allocation of the entire facility. The Participants may borrow up to a maximum of one third of their net assets under the agreement. The agreement expires on November 16, 2010. The Funds had no amounts outstanding as of August 31, 2010 or at any time during the year then ended.
125
Notes to financial statements
Delaware multiple state tax-free funds
Delaware multiple state tax-free funds
8. Credit and Market Risk
The Funds concentrate their investments in securities issued by municipalities. The value of these investments may be adversely affected by new legislation within the states, regional or local economic conditions, as applicable, and differing levels of supply and demand for municipal bonds. Many municipalities insure repayment for their obligations. Although bond insurance reduces the risk of loss due to default by an issuer, such bonds remain subject to the risk that value may fluctuate for other reasons and there is no assurance that the insurance company will meet its obligations. A real or perceived decline in creditworthiness of a bond insurer can have an adverse impact on the value of insured bonds held in the Funds. At August 31, 2010, the percentages of each Fund’s net assets insured by bond insurers are listed below and these securities have been identified in the statements of net assets.
| Delaware | Delaware | Delaware | Delaware | Delaware | |||||
| Tax-Free | Tax-Free | Tax-Free | Tax-Free | Tax-Free | |||||
| Arizona Fund | California Fund | Colorado Fund | Idaho Fund | New York Fund | |||||
| 37.67% | 18.94% | 25.23% | 29.40% | 10.59% |
The Funds may invest in advanced refunded bonds, escrow secured bonds or defeased bonds. Under current federal tax laws and regulations, state and local government borrowers are permitted to refinance outstanding bonds by issuing new bonds. The issuer refinances the outstanding debt to either reduce interest costs or to remove or alter restrictive covenants imposed by the bonds being refinanced. A refunding transaction where the municipal securities are being refunded within 90 days from the issuance of the refunding issue is known as a “current refunding.” Advance refunded bonds are bonds in which the refunded bond issue remains outstanding for more than 90 days following the issuance of the refunding issue. In an advance refunding, the issuer will use the proceeds of a new bond issue to purchase high grade interest bearing debt securities which are then deposited in an irrevocable escrow account held by an escrow agent to sec ure all future payments of principal and interest and bond premium of the advance refunded bond. Bonds are “escrowed to maturity” when the proceeds of the refunding issue are deposited in an escrow account for investment sufficient to pay all of the principal and interest on the original interest payment and maturity dates.
Bonds are considered “pre-refunded” when the refunding issue’s proceeds are escrowed only until a permitted call date or dates on the refunded issue with the refunded issue being redeemed at the time, including any required premium. Bonds become “defeased” when the rights and interests of the bondholders and of their lien on the pledged revenues or other security under the terms of the bond contract are substituted with an alternative source of revenues (the escrow securities) sufficient to meet payments of principal and interest to maturity or to the first call dates. Escrowed secured bonds will often receive a rating of AAA from Moody’s Investors Service Inc., Standard & Poor’s Rating Group, and/or Fitch Ratings due to the strong credit quality of the escrow securities and the irrevocable nature of the escrow deposit agreement.
126
Each Fund may invest up to 15% of its net assets in illiquid securities, which may include securities with contractual restrictions on resale, securities exempt from registration under Rule 144A of the Securities Act of 1933, as amended, and other securities which may not be readily marketable. The relative illiquidity of these securities may impair each Fund from disposing of them in a timely manner and at a fair price when it is necessary or desirable to do so. While maintaining oversight, each Fund’s Board has delegated to DMC the day-to-day functions of determining whether individual securities are liquid for purposes of each Fund’s limitation on investments in illiquid assets. Securities eligible for resale pursuant to Rule 144A, which are determined to be liquid, are not subject to each Fund’s 15% limit on investments in illiquid securities. As of August 31, 2010, Rule 144A and illiquid securities have been identifi ed on the statements of net assets.
9. Contractual Obligations
The Funds enter into contracts in the normal course of business that contain a variety of indemnifications. The Funds’ maximum exposure under these arrangements is unknown. However, the Funds have not had prior claims or losses pursuant to these contracts. Management has reviewed the Funds’ existing contracts and expects the risk of loss to be remote.
10. Subsequent Events
Management has determined no material events or transactions occurred subsequent to August 31, 2010 that would require recognition or disclosure in the Funds’ financial statements.
11. Tax Information (Unaudited)
The information set forth below is for each Fund’s fiscal year as required by federal income tax laws. Shareholders, however, must report distributions on a calendar year basis for income tax purposes, which may include distributions for portions of two fiscal years of a fund. Accordingly, the information needed by shareholders for income tax purposes will be sent to them in January of each year. Please consult your tax advisor for proper treatment of this information.
For the fiscal year ended August 31, 2010, each Fund designates distributions paid during the year as follows:
| (A) | ||||||
| Ordinary | (B) | |||||
| Income | Tax-Exempt | Total | ||||
| Distributions | Distributions | Distributions | ||||
| (Tax Basis) | (Tax Basis) | (Tax Basis) | ||||
| Delaware Tax-Free Arizona Fund | 2.32% | 97.68% | 100.00% | |||
| Delaware Tax-Free California Fund | 2.79% | 97.21% | 100.00% | |||
| Delaware Tax-Free Colorado Fund | 1.75% | 98.25% | 100.00% | |||
| Delaware Tax-Free Idaho Fund | 4.27% | 95.73% | 100.00% | |||
| Delaware Tax-Free New York Fund | 1.22% | 98.78% | 100.00% |
(A) and (B) are based on a percentage of each Fund’s total distributions.
127
Report of independent
registered public accounting firm
registered public accounting firm
To the Board of Trustees of Voyageur Insured Funds, Voyageur Mutual Funds and Voyageur Mutual Funds II and the Shareholders of Delaware Tax-Free Arizona Fund, Delaware Tax-Free California Fund, Delaware Tax-Free Idaho Fund, Delaware Tax-Free New York Fund and Delaware Tax-Free Colorado Fund:
In our opinion, the accompanying statements of net assets and the related statements of operations and of changes in net assets and the financial highlights present fairly, in all material respects, the financial position of Delaware Tax-Free Arizona Fund (constituting Voyageur Insured Funds), Delaware Tax-Free California Fund, Delaware Tax-Free Idaho Fund and Delaware Tax-Free New York Fund (three of the series constituting Voyageur Mutual Funds) and Delaware Tax-Free Colorado Fund (constituting Voyageur Mutual Funds II) (hereafter collectively referred to as the “Funds”) at August 31, 2010, and the results of their operations, the changes in each of their net assets and the financial highlights for the year then ended, in conformity with accounting principles generally accepted in the United States of America. These financial statements and financial highlights (hereafter referred to as “financial statements”) are the responsibility of the Funds’ management; our responsibility is to express an opinion on these financial statements based on our audits. We conducted our audits of these financial statements in accordance with the standards of the Public Company Accounting Oversight Board (United States). Those standards require that we plan and perform the audit to obtain reasonable assurance about whether the financial statements are free of material misstatement. An audit includes examining, on a test basis, evidence supporting the amounts and disclosures in the financial statements, assessing the accounting principles used and significant estimates made by management, and evaluating the overall financial statement presentation. We believe that our audits, which included confirmation of securities at August 31, 2010 by correspondence with the custodian and brokers, provide a reasonable basis for our opinion. The statement of changes in net assets for the year ended August 31, 2009 and the financial highlights fo r each of the four years in the period ended August 31, 2009 were audited by other independent accountants whose report dated October 19, 2009 expressed an unqualified opinion on those statements.
PricewaterhouseCoopers LLP
Philadelphia, Pennsylvania
October 19, 2010
Philadelphia, Pennsylvania
October 19, 2010
128
Other Fund information
(Unaudited)
Delaware multiple state tax-free funds
(Unaudited)
Delaware multiple state tax-free funds
Change in Independent Registered Public Accounting Firm
Due to independence matters under the Securities and Exchange Commission’s auditor independence rules relating to the January 4, 2010 acquisition of Delaware Investments (including DMC, DDLP and DSC) by Macquarie Group, Ernst & Young LLP (“E&Y”) has resigned as the independent registered public accounting firm for Voyageur Mutual Funds, Voyageur Mutual Funds II, and Voyageur Insured Funds (the “ Trusts”) effective May 20, 2010. At a meeting held on May 20, 2010, the Board of Trustees of the Trusts, upon recommendation of the Audit Committee, selected PricewaterhouseCoopers LLP (“PwC”) to serve as the independent registered public accounting firm for the Funds for the fiscal year ending Aug. 31, 2010. During the fiscal y ears ended Aug. 31, 2009 and 2008, E&Y’s audit reports on the financial statements of the Funds did not contain any adverse opinion or disclaimer of opinion, nor were they qualified or modified as to uncertainty, audit scope, or accounting principles. In addition, there were no disagreements between the Funds and E&Y on accounting principles, financial statements disclosures or audit scope, which, if not resolved to the satisfaction of E&Y, would have caused them to make reference to the disagreement in their reports. Neither the Funds nor anyone on their behalf has consulted with PwC at any time prior to their selection with respect to the application of accounting principles to a specified transaction, either completed or proposed or the type of audit opinion that might be rendered on the Funds’ financial statements.
129
Board of trustees/directors and officers addendum
Delaware Investments® Family of Funds
Delaware Investments® Family of Funds
A mutual fund is governed by a Board of Trustees/Directors (“Trustees”), which has oversight responsibility for the management of a fund’s business affairs. Trustees establish procedures and oversee and review the performance of the investment manager, the distributor, and others who perform services for the fund. The independent fund trustees, in particular, are advocates
| Name, Address, | Position(s) | Length of |
| and Birth Date | Held with Fund(s) | Time Served |
| Interested Trustees | ||
| Patrick P. Coyne1 | Chairman, President, | Chairman and Trustee |
| 2005 Market Street | Chief Executive Officer, | since August 16, 2006 |
| Philadelphia, PA 19103 | and Trustee | |
| April 1963 | President and | |
| Chief Executive Officer | ||
| since August 1, 2006 | ||
1 Patrick P. Coyne is considered to be an “Interested Trustee” because he is an executive officer of the Fund’s(s’) investment advisor.
130
for shareholder interests. Each trustee has served in that capacity since he or she was elected to or appointed to the Board of Trustees, and will continue to serve until his or her retirement or the election of a new trustee in his or her place. The following is a list of the Trustees and Officers with certain background and related information.
| Number of Portfolios in | ||
| Principal Occupation(s) | Fund Complex Overseen | Other Directorships |
| During Past 5 Years | by Trustee or Officer | Held by Trustee or Officer |
| Patrick P. Coyne has served in | 81 | Director |
| various executive capacities | Kaydon Corp. | |
| at different times at | ||
| Delaware Investments.2 | Board of Governors Member | |
| Investment Company | ||
| Institute (ICI) | ||
| Finance Committee Member | ||
| St. John Vianney Roman | ||
| Catholic Church | ||
| Board of Trustees | ||
| Agnes Irwin School | ||
| Member of Investment | ||
| Committee | ||
| Cradle of Liberty Council, | ||
| BSA | ||
| (2007 – 2010) | ||
2 Delaware Investments is the marketing name for Delaware Management Holdings, Inc. and its subsidiaries, including the Fund’s(s’) investment advisor, principal underwriter, and its transfer agent.
131
Board of trustees/directors and officers addendum
Delaware Investments® Family of Funds
Delaware Investments® Family of Funds
| Name, Address, | Position(s) | Length of |
| and Birth Date | Held with Fund(s) | Time Served |
| Independent Trustees | ||
| Thomas L. Bennett | Trustee | Since March 2005 |
| 2005 Market Street | ||
| Philadelphia, PA 19103 | ||
| October 1947 | ||
| John A. Fry | Trustee | Since January 2001 |
| 2005 Market Street | ||
| Philadelphia, PA 19103 | ||
| May 1960 | ||
| Anthony D. Knerr | Trustee | Since April 1990 |
| 2005 Market Street | ||
| Philadelphia, PA 19103 | ||
| December 1938 | ||
| Lucinda S. Landreth | Trustee | Since March 2005 |
| 2005 Market Street | ||
| Philadelphia, PA 19103 | ||
| June 1947 | ||
132
| Number of Portfolios in | ||
| Principal Occupation(s) | Fund Complex Overseen | Other Directorships |
| During Past 5 Years | by Trustee or Officer | Held by Trustee or Officer |
| Private Investor | 81 | Director |
| (March 2004–Present) | Bryn Mawr Bank Corp. (BMTC) | |
| Investment Manager | Chairman of Investment | |
| Morgan Stanley & Co. | Committee | |
| (January 1984–March 2004) | Pennsylvania Academy of | |
| Fine Arts | ||
| Investment Committee and | ||
| Governance Committee | ||
| Member | ||
| Pennsylvania Horticultural | ||
| Society | ||
| President | 81 | Director |
| Drexel University | Community Health Systems | |
| (August 2010–Present) | ||
| Director — Ecore | ||
| President | International | |
| Franklin & Marshall College | (2009-2010) | |
| (July 2002–July 2010) | ||
| Director — Allied | ||
| Executive Vice President | Barton Securities Holdings | |
| University of Pennsylvania | (2005 to 2008) | |
| (April 1995–June 2002) | ||
| Founder and | 81 | None |
| Managing Director | ||
| Anthony Knerr & Associates | ||
| (Strategic Consulting) | ||
| (1990–Present) | ||
| Chief Investment Officer | 81 | None |
| Assurant, Inc. (Insurance) | ||
| (2002–2004) | ||
133
Board of trustees/directors and officers addendum
Delaware Investments® Family of Funds
Delaware Investments® Family of Funds
| Name, Address, | Position(s) | Length of |
| and Birth Date | Held with Fund(s) | Time Served |
| Independent Trustees (continued) | ||
| Ann R. Leven | Trustee | Since October 1989 |
| 2005 Market Street | ||
| Philadelphia, PA 19103 | ||
| November 1940 | ||
| Thomas F. Madison | Trustee | Since May 19973 |
| 2005 Market Street | ||
| Philadelphia, PA 19103 | ||
| February 1936 | ||
3 In 1997, several funds managed by Voyageur Fund Managers, Inc. (the “Voyageur Funds”) were incorporated into the Delaware Investments Family of Funds. Mr. Madison served as a director of the Voyageur Funds from 1993 until 1997.
134
| Number of Portfolios in | ||
| Principal Occupation(s) | Fund Complex Overseen | Other Directorships |
| During Past 5 Years | by Trustee or Officer | Held by Trustee or Officer |
| Consultant | 81 | Director and Audit |
| ARL Associates | Committee Chair – | |
| (Financial Planning) | Systemax Inc. | |
| (1983–Present) | (2001 – 2009) | |
| Director and Audit | ||
| Committee Chairperson – | ||
| Andy Warhol Foundation | ||
| (1999 – 2007) | ||
| President and | 81 | Director and Chair of |
| Chief Executive Officer | Compensation Committee, | |
| MLM Partners, Inc. | Governance Committee | |
| (Small Business Investing | Member | |
| and Consulting) | CenterPoint Energy | |
| (January 1993–Present) | ||
| Lead Director and Chair of | ||
| Audit and Governance | ||
| Committees, Member of | ||
| Compensation Committee | ||
| Digital River, Inc. | ||
| Director and Chair of | ||
| Governance Committee, | ||
| Audit Committee | ||
| Member | ||
| Rimage Corporation | ||
| Director and Chair of | ||
| Compensation Committee | ||
| Spanlink Communications | ||
| Lead Director and Member of | ||
| Compensation and | ||
| Governance Committees | ||
| Valmont Industries, Inc. | ||
| (1987 – 2010) | ||
135
Board of trustees/directors and officers addendum
Delaware Investments® Family of Funds
Delaware Investments® Family of Funds
| Name, Address, | Position(s) | Length of |
| and Birth Date | Held with Fund(s) | Time Served |
| Independent Trustees (continued) | ||
| Thomas F. Madison | ||
| 2005 Market Street | ||
| Philadelphia, PA 19103 | ||
| February 1936 | ||
| Janet L. Yeomans | Trustee | Since April 1999 |
| 2005 Market Street | ||
| Philadelphia, PA 19103 | ||
| July 1948 | ||
| J. Richard Zecher | Trustee | Since March 2005 |
| 2005 Market Street | ||
| Philadelphia, PA 19103 | ||
| July 1940 | ||
136
| Number of Portfolios in | ||
| Principal Occupation(s) | Fund Complex Overseen | Other Directorships |
| During Past 5 Years | by Trustee or Officer | Held by Trustee or Officer |
| Director | ||
| Banner Health | ||
| (1996 to 2007) | ||
| Vice President and Treasurer | 81 | Director |
| (January 2006–Present) | Okabena Company | |
| Vice President — Mergers & Acquisitions | ||
| (January 2003–January 2006), and | ||
| Vice President | ||
| (July 1995–January 2003) | ||
| 3M Corporation | ||
| Founder | 81 | Director and Audit |
| Investor Analytics | Committee Member | |
| (Risk Management) | Investor Analytics | |
| (May 1999–Present) | ||
| Founder | Director | |
| Sutton Asset Management | Oxigene, Inc. | |
| (Hedge Fund) | (2003 to 2008) | |
| (September 1996–Present) | ||
137
Board of trustees/directors and officers addendum
Delaware Investments® Family of Funds
Delaware Investments® Family of Funds
| Name, Address, | Position(s) | Length of |
| and Birth Date | Held with Fund(s) | Time Served |
| Officers | ||
| David F. Connor | Vice President, | Vice President since |
| 2005 Market Street | Deputy General | September 2000 |
| Philadelphia, PA 19103 | Counsel, and Secretary | and Secretary since |
| December 1963 | October 2005 | |
| Daniel V. Geatens | Vice President | Treasurer |
| 2005 Market Street | and Treasurer | since October 25, 2007 |
| Philadelphia, PA 19103 | ||
| October 1972 | ||
| David P. O’Connor | Senior Vice President, | Senior Vice President, |
| 2005 Market Street | General Counsel, | General Counsel, and |
| Philadelphia, PA 19103 | and Chief Legal Officer | Chief Legal Officer |
| February 1966 | since October 2005 | |
| Richard Salus | Senior Vice President | Chief Financial Officer |
| 2005 Market Street | and Chief Financial Officer | since November 2006 |
| Philadelphia, PA 19103 | ||
| October 1963 | ||
The Statement of Additional Information for the Fund(s) includes additional information about the Trustees and Officers and is available, without charge, upon request by calling 800 523-1918.
138
| Number of Portfolios in | ||
| Principal Occupation(s) | Fund Complex Overseen | Other Directorships |
| During Past 5 Years | by Trustee or Officer | Held by Trustee or Officer |
| David F. Connor has served as | 81 | None4 |
| Vice President and Deputy | ||
| General Counsel of | ||
| Delaware Investments | ||
| since 2000. | ||
| Daniel V. Geatens has served | 81 | None4 |
| in various capacities at | ||
| different times at | ||
| Delaware Investments. | ||
| David P. O’Connor has served in | 81 | None4 |
| various executive and legal | ||
| capacities at different times | ||
| at Delaware Investments. | ||
| Richard Salus has served in | 81 | None4 |
| various executive capacities | ||
| at different times at | ||
| Delaware Investments. | ||
4 David F. Connor, Daniel V. Geatens, David P. O’Connor, and Richard Salus serve in similar capacities for the six portfolios of the Optimum Fund Trust, which have the same investment advisor, principal underwriter, and transfer agent as the registrant.
139
About the organization
| Board of trustees | |||
Patrick P. Coyne Chairman, President, and Chief Executive Officer Delaware Investments® Family of Funds Philadelphia, PA Thomas L. Bennett Private Investor Rosemont, PA John A. Fry President Drexel University Philadelphia, PA | Anthony D. Knerr Founder and Managing Director Anthony Knerr & Associates New York, NY Lucinda S. Landreth Former Chief Investment Officer Assurant, Inc. Philadelphia, PA | Ann R. Leven Consultant ARL Associates New York, NY Thomas F. Madison President and Chief Executive Officer MLM Partners, Inc. Minneapolis, MN | Janet L. Yeomans Vice President and Treasurer 3M Corporation St. Paul, MN J. Richard Zecher Founder Investor Analytics Scottsdale, AZ |
| Affiliated officers | |||
David F. Connor Vice President, Deputy General Counsel, and Secretary Delaware Investments Family of Funds Philadelphia, PA | Daniel V. Geatens Vice President and Treasurer Delaware Investments Family of Funds Philadelphia, PA | David P. O’Connor Senior Vice President, General Counsel, and Chief Legal Officer Delaware Investments Family of Funds Philadelphia, PA | Richard Salus Senior Vice President and Chief Financial Officer Delaware Investments Family of Funds Philadelphia, PA |
This annual report is for the information of Delaware Tax-Free Arizona Fund, Delaware Tax-Free California Fund, Delaware Tax-Free Colorado Fund, Delaware Tax-Free Idaho Fund, and Delaware Tax-Free New York Fund shareholders, but it may be used with prospective investors when preceded or accompanied by a current prospectus for Delaware Tax-Free Arizona Fund, Delaware Tax-Free California Fund, Delaware Tax-Free Colorado Fund, Delaware Tax-Free Idaho Fund, and Delaware Tax-Free New York Fund and the Delaware Investments Fund fact sheet for the most recently completed calendar quarter. These documents are available at www.delawareinvestments.com. The prospectus sets forth details about charges, expenses, investment objectives, and operating policies of the investment company. You should read the prospectus carefully before you invest. The figures in this report represent past results that are not a guarantee of future results. The return and principal value of an investment in the investment company will fluctuate so that shares, when redeemed, may be worth more or less than their original cost. |
Delaware Investments is the marketing name of Delaware Management Holdings, Inc. and its subsidiaries. Each Fund files its complete schedule of portfolio holdings with the Securities and Exchange Commission (SEC) for the first and third quarters of each fiscal year on Form N-Q. Each Fund’s Forms N-Q, as well as a description of the policies and procedures that each Fund uses to determine how to vote proxies (if any) relating to portfolio securities are available without charge (i) upon request, by calling 800 523-1918; and (ii) on the SEC’s Web site at www.sec.gov. In addition, a description of the policies and procedures that each Fund uses to determine how to vote proxies (if any) relating to portfolio securities and each Fund’s Schedule of Investments are available without charge on each Fund’s Web site at www.delawareinvestments.com. Each Fund’s Forms N-Q may be reviewed and copied at the SEC’s Public Reference Room in Washington, D.C.; information on the operation of the Public Reference Room may be obtained by calling 800 SEC-0330. Information (if any) regarding how each Fund voted proxies relating to portfolio securities during the most recently disclosed 12-month period ended June 30 is available without charge (i) through each Fund’s Web site at www.delawareinvestments.com; and (ii) on the SEC’s Web site at www.sec.gov. |
140
Item 2. Code of Ethics
The registrant has adopted a code of ethics that applies to the registrant’s principal executive officer, principal financial officer, principal accounting officer or controller, or persons performing similar functions, regardless of whether these individuals are employed by the registrant or a third party. A copy of the registrant’s Code of Business Ethics has been posted on Delaware Investments’ internet website at www.delawareinvestments.com. Any amendments to the Code of Business Ethics, and information on any waiver from its provisions granted by the registrant, will also be posted on this website within five business days of such amendment or waiver and will remain on the website for at least 12 months.
Item 3. Audit Committee Financial Expert
The registrant’s Board of Trustees/Directors has determined that each member of the registrant’s Audit Committee is an audit committee financial expert, as defined below. For purposes of this item, an “audit committee financial expert” is a person who has the following attributes:
a. An understanding of generally accepted accounting principles and financial statements;
b. The ability to assess the general application of such principles in connection with the accounting for estimates, accruals, and reserves;
c. Experience preparing, auditing, analyzing, or evaluating financial statements that present a breadth and level of complexity of accounting issues that are generally comparable to the breadth and complexity of issues that can reasonably be expected to be raised by the registrant’s financial statements, or experience actively supervising one or more persons engaged in such activities;
d. An understanding of internal controls and procedures for financial reporting; and
e. An understanding of audit committee functions.
An “audit committee financial expert” shall have acquired such attributes through:
a. Education and experience as a principal financial officer, principal accounting officer, controller, public accountant, or auditor or experience in one or more positions that involve the performance of similar functions;
b. Experience actively supervising a principal financial officer, principal accounting officer, controller, public accountant, auditor, or person performing similar functions;
c. Experience overseeing or assessing the performance of companies or public accountants with respect to the preparation, auditing, or evaluation of financial statements; or
d. Other relevant experience.
The registrant’s Board of Trustees/Directors has also determined that each member of the registrant’s Audit Committee is independent. In order to be “independent” for purposes of this item, the Audit Committee member may not: (i) other than in his or her capacity as a member of the Board of Trustees/Directors or any committee thereof, accept directly or indirectly any consulting, advisory or other compensatory fee from the issuer; or (ii) be an “interested person” of the registrant as defined in Section 2(a)(19) of the Investment Company Act of 1940.
The names of the audit committee financial experts on the registrant’s Audit Committee are set forth below:
Thomas L. Bennett 1
John A. Fry
Thomas F. Madison
Janet L. Yeomans
J. Richard Zecher
John A. Fry
Thomas F. Madison
Janet L. Yeomans
J. Richard Zecher
Item 4. Principal Accountant Fees and Services
(a) Audit fees.
The aggregate fees billed for services provided to the registrant by its independent auditors for the audit of the registrant’s annual financial statements and for services normally provided by the independent auditors in connection with statutory and regulatory filings or engagements were $68,700 for the fiscal year ended August 31, 2010.
____________________
1 The instructions to Form N-CSR require disclosure on the relevant experience of persons who qualify as audit committee financial experts based on “other relevant experience.” The Board of Trustees/Directors has determined that Mr. Bennett qualifies as an audit committee financial expert by virtue of his education, Chartered Financial Analyst designation, and his experience as a credit analyst, portfolio manager and the manager of other credit analysts and portfolio managers.
The aggregate fees billed for services provided to the registrant by its independent auditors for the audit of the registrant’s annual financial statements and for services normally provided by the independent auditors in connection with statutory and regulatory filings or engagements were $64,400 for the fiscal year ended August 31, 2009.
(b) Audit-related fees.
The aggregate fees billed by the registrant’s independent auditors for services relating to the performance of the audit of the registrant’s financial statements and not reported under paragraph (a) of this Item were $0 for the fiscal year ended August 31, 2010.
The aggregate fees billed by the registrant’s independent auditors for services relating to the performance of the audit of the financial statements of the registrant’s investment adviser and other service providers under common control with the adviser and that relate directly to the operations or financial reporting of the registrant were $84,000 for the registrant’s fiscal year ended August 31, 2010. The percentage of these fees relating to services approved by the registrant’s Audit Committee pursuant to the de minimis exception from the pre-approval requirement in Rule 2-01(c)(7)(i)(C) of Regulation S-X was 0%. These audit-related services were as follows: audit procedures performed on Delaware Investments for its consolidation into Macquarie’s financial statements as of March 31, 2010.
The aggregate fees billed by the registrant’s independent auditors for services relating to the performance of the audit of the registrant’s financial statements and not reported under paragraph (a) of this Item were $0 for the fiscal year ended August 31, 2009.
The aggregate fees billed by the registrant’s independent auditors for services relating to the performance of the audit of the financial statements of the registrant’s investment adviser and other service providers under common control with the adviser and that relate directly to the operations or financial reporting of the registrant were $19,074 for the registrant’s fiscal year ended August 31, 2009. The percentage of these fees relating to services approved by the registrant’s Audit Committee pursuant to the de minimis exception from the pre-approval requirement in Rule 2-01(c)(7)(i)(C) of Regulation S-X was 0%. These audit-related services were as follows: issuance of report concerning transfer agent's system of internal accounting control pursuant to Rule 17Ad-13 of the Securities Exchange Act.
(c) Tax fees.
The aggregate fees billed by the registrant’s independent auditors for tax-related services provided to the registrant were $12,350 for the fiscal year ended August 31, 2010. The percentage of these fees relating to services approved by the registrant’s Audit Committee pursuant to the de minimis exception from the pre-approval requirement in Rule 2-01(c)(7)(i)(C) of Regulation S-X was 0%. These tax-related services were as follows: review of income tax returns and review of annual excis e distribution calculations.
The aggregate fees billed by the registrant’s independent auditors for tax-related services provided to the registrant’s investment adviser and other service providers under common control with the adviser and that relate directly to the operations or financial reporting of the registrant were $0 for the registrant’s fiscal year ended August 31, 2010.
The aggregate fees billed by the registrant’s independent auditors for tax-related services provided to the registrant were $16,750 for the fiscal year ended August 31, 2009. The percentage of these fees relating to services approved by the registrant’s Audit Committee pursuant to the de minimis exception from the pre-approval requirement in Rule 2-01(c)(7)(i)(C) of Regulation S-X was 0%. These tax-related services were as follows: review of income tax returns and review of annual excis e distribution calculations.
The aggregate fees billed by the registrant’s independent auditors for tax-related services provided to the registrant’s investment adviser and other service providers under common control with the adviser and that relate directly to the operations or financial reporting of the registrant were $0 for the registrant’s fiscal year ended August 31, 2009.
(d) All other fees.
The aggregate fees billed for all services provided by the independent auditors to the registrant other than those set forth in paragraphs (a), (b) and (c) of this Item were $0 for the fiscal year ended August 31, 2010.
The aggregate fees billed for all services other than those set forth in paragraphs (b) and (c) of this Item provided by the registrant’s independent auditors to the registrant’s adviser and other service providers under common control with the adviser and that relate directly to the operations or financial reporting of the registrant were $0 for the registrant’s fiscal year ended August 31, 2010.
The aggregate fees billed for all services provided by the independent auditors to the registrant other than those set forth in paragraphs (a), (b) and (c) of this Item were $0 for the fiscal year ended August 31, 2009.
The aggregate fees billed for all services other than those set forth in paragraphs (b) and (c) of this Item provided by the registrant’s independent auditors to the registrant’s adviser and other service providers under common control with the adviser and that relate directly to the operations or financial reporting of the registrant were $0 for the registrant’s fiscal year ended August 31, 2009.
(e) The registrant’s Audit Committee has established pre-approval policies and procedures as permitted by Rule 2-01(c)(7)(i)(B) of Regulation S-X (the “Pre-Approval Policy”) with respect to services provided by the registrant’s independent auditors. Pursuant to the Pre-Approval Policy, the Audit Committee has pre-approved the services set forth in the table below with respect to the registrant up to the specified fee limits. Certain fee limits are based on aggregate fees to the registrant and other registrants within the Delaware Investments Family of Funds.
| Service | Range of Fees |
| Audit Services | |
| Statutory audits or financial audits for new Funds | up to $25,000 per Fund |
| Services associated with SEC registration statements (e.g., Form N-1A, Form N-14, etc.), periodic reports and other documents filed with the SEC or other documents issued in connection with securities offerings (e.g., comfort letters for closed-end Fund offerings, consents), and assistance in responding to SEC comment letters | up to $10,000 per Fund |
| Consultations by Fund management as to the accounting or disclosure treatment of transactions or events and/or the actual or potential impact of final or proposed rules, standards or interpretations by the SEC, FASB, or other regulatory or standard-setting bodies (Note: Under SEC rules, some consultations may be considered “audit-related services” rather than “audit services”) | up to $25,000 in the aggregate |
| Audit-Related Services | |
| Consultations by Fund management as to the accounting or disclosure treatment of transactions or events and /or the actual or potential impact of final or proposed rules, standards or interpretations by the SEC, FASB, or other regulatory or standard-setting bodies (Note: Under SEC rules, some consultations may be considered “audit services” rather than “audit-related services”) | up to $25,000 in the aggregate |
| Tax Services | |
| U.S. federal, state and local and international tax planning and advice (e.g., consulting on statutory, regulatory or administrative developments, evaluation of Funds’ tax compliance function, etc.) | up to $25,000 in the aggregate |
| U.S. federal, state and local tax compliance (e.g., excise distribution reviews, etc.) | up to $5,000 per Fund |
| Review of federal, state, local and international income, franchise and other tax returns | up to $5,000 per Fund |
Under the Pre-Approval Policy, the Audit Committee has also pre-approved the services set forth in the table below with respect to the registrant’s investment adviser and other entities controlling, controlled by or under common control with the investment adviser that provide ongoing services to the registrant (the “Control Affiliates”) up to the specified fee limit. This fee limit is based on aggregate fees to the investment adviser and its Control Affiliates.
| Service | Range of Fees |
| Non-Audit Services | |
| Services associated with periodic reports and other documents filed with the SEC and assistance in responding to SEC comment letters | up to $10,000 in the aggregate |
The Pre-Approval Policy requires the registrant’s independent auditors to report to the Audit Committee at each of its regular meetings regarding all services initiated since the last such report was rendered, including those services authorized by the Pre-Approval Policy.
(f) Not applicable.
(g) The aggregate non-audit fees billed by the registrant’s independent auditors for services rendered to the registrant and to its investment adviser and other service providers under common control with the adviser were $0 and $216,464 for the registrant’s fiscal years ended August 31, 2010 and August 31, 2009, respectively.
(h) In connection with its selection of the independent auditors, the registrant’s Audit Committee has considered the independent auditors’ provision of non-audit services to the registrant’s investment adviser and other service providers under common control with the adviser that were not required to be pre-approved pursuant to Rule 2-01(c)(7)(ii) of Regulation S-X. The Audit Committee has determined that the independent auditors’ provision of these services is compatible with maintaining the auditors’ independence.
Item 5. Audit Committee of Listed Registrants
Not applicable.
Item 6. Investments
(a) Included as part of report to shareholders filed under Item 1 of this Form N-CSR.
(b) Divestment of securities in accordance with Section 13(c) of the Investment Company Act of 1940.
Not applicable.
Item 7. Disclosure of Proxy Voting Policies and Procedures for Closed-End Management Investment Companies
Not applicable.
Item 8. Portfolio Managers of Closed-End Management Investment Companies
Not applicable.
Item 9. Purchases of Equity Securities by Closed-End Management Investment Company and Affiliated Purchasers
Not applicable.
Item 10. Submission of Matters to a Vote of Security Holders
Not applicable.
Item 11. Controls and Procedures
The registrant’s principal executive officer and principal financial officer have evaluated the registrant’s disclosure controls and procedures within 90 days of the filing of this report and have concluded that they are effective in providing reasonable assurance that the information required to be disclosed by the registrant in its reports or statements filed under the Securities Exchange Act of 1934 is recorded, processed, summarized and reported within the time periods specified in the rules and forms of the Securities and Exchange Commission.
There were no significant changes in the registrant’s internal control over financial reporting that occurred during the second fiscal quarter of the period covered by the report to stockholders included herein (i.e., the registrant’s fourth fiscal quarter) that have materially affected, or are reasonably likely to materially affect, the registrant’s internal control over financial reporting.
Item 12. Exhibits
(a) (1) Code of Ethics
Not applicable.
(2) Certifications of Principal Executive Officer and Principal Financial Officer pursuant to Rule 30a-2 under the Investment Company Act of 1940 are attached hereto as Exhibit 99.CERT.
(3) Written solicitations to purchase securities pursuant to Rule 23c-1 under the Securities Exchange Act of 1934.
Not applicable.
(b) Certifications pursuant to Section 906 of the Sarbanes-Oxley Act of 2002 are furnished herewith as Exhibit 99.906CERT.
SIGNATURES
Pursuant to the requirements of the Securities Exchange Act of 1934 and the Investment Company Act of 1940, the registrant has duly caused this report to be signed on its behalf, by the undersigned, thereunto duly authorized.
Name of Registrant: VOYAGEUR MUTUAL FUNDS
| /s/ PATRICK P. COYNE | |
| By: | Patrick P. Coyne |
| Title: | Chief Executive Officer |
| Date: | November 3, 2010 |
Pursuant to the requirements of the Securities Exchange Act of 1934 and the Investment Company Act of 1940, this report has been signed below by the following persons on behalf of the registrant and in the capacities and on the dates indicated.
| /s/ PATRICK P. COYNE | |
| By: | Patrick P. Coyne |
| Title: | Chief Executive Officer |
| Date: | November 3, 2010 |
| /s/ RICHARD SALUS | |
| By: | Richard Salus |
| Title: | Chief Financial Officer |
| Date: | November 3, 2010 |