UNITED STATES SECURITIES AND EXCHANGE COMMISSION
Washington, D.C. 20549
FORM N-CSR
CERTIFIED SHAREHOLDER REPORT OF REGISTERED MANAGEMENT
INVESTMENT COMPANIES
| Investment Company Act file number: | 811-07742 | |
| Exact name of registrant as specified in charter: | Voyageur Mutual Funds | |
| Address of principal executive offices: | 2005 Market Street | |
| Philadelphia, PA 19103 | ||
| Name and address of agent for service: | David F. Connor, Esq. | |
| 2005 Market Street | ||
| Philadelphia, PA 19103 | ||
| Registrant’s telephone number, including area code: | (800) 523-1918 | |
| Date of fiscal year end: | August 31 | |
| Date of reporting period: | August 31, 2012 |
Item 1. Reports to Stockholders

Annual report Delaware Tax-Free Minnesota Fund Delaware Tax-Free Minnesota Intermediate Fund Delaware Minnesota High-Yield Municipal Bond Fund August 31, 2012 Fixed income mutual funds |
Carefully consider the Funds’ investment objectives, risk factors, charges, and expenses before investing. This and other information can be found in the Funds’ prospectuses and, if available, their summary prospectuses, which may be obtained by visiting delawareinvestments.com or calling 800 523-1918. Investors should read the prospectus and, if available, the summary prospectus carefully before investing. |
You can obtain shareholder reports and prospectuses online instead of in the mail. Visit delawareinvestments.com/edelivery. |
Experience Delaware Investments
Delaware Investments is committed to the pursuit of consistently superior asset management and unparalleled client service. We believe in our investment processes, which seek to deliver consistent results, and in convenient services that help add value for our clients.
If you are interested in learning more about creating an investment plan, contact your financial advisor.
You can learn more about Delaware Investments or obtain a prospectus for Delaware Tax-Free Minnesota Fund, Delaware Tax-Free Minnesota Intermediate Fund, and Delaware Minnesota High-Yield Municipal Bond Fund at delawareinvestments.com.
Manage your investments online
- 24-hour access to your account information
- Obtain share prices
- Check your account balance and recent transactions
- Request statements or literature
- Make purchases and redemptions
Delaware Management Holdings, Inc. and its subsidiaries (collectively known by the marketing name of Delaware Investments) are wholly owned subsidiaries of Macquarie Group Limited, a global provider of banking, financial, advisory, investment and funds management services.
Investments in Delaware Tax-Free Minnesota Fund, Delaware Tax-Free Minnesota Intermediate Fund, and Delaware Minnesota High-Yield Municipal Bond Fund are not and will not be deposits with or liabilities of Macquarie Bank Limited ABN 46 008 583 542 and its holding companies, including their subsidiaries or related companies (Macquarie Group), and are subject to investment risk, including possible delays in repayment and loss of income and capital invested. No Macquarie Group company guarantees or will guarantee the performance of the Funds, the repayment of capital from the Funds, or any particular rate of return.
| Table of contents | ||
| Portfolio management review | 1 | |
| Performance summaries | 5 | |
| Disclosure of Fund expenses | 14 | |
| Security type/sector allocations | 17 | |
| Statements of net assets | 20 | |
| Statements of operations | 50 | |
| Statements of changes in net assets | 52 | |
| Financial highlights | 58 | |
| Notes to financial statements | 76 | |
| Report of independent registered | ||
| public accounting firm | 90 | |
| Other Fund information | 91 | |
| Board of trustees/directors and | ||
| officers addendum | 98 | |
| About the organization | 108 |
Unless otherwise noted, views expressed herein are current as of Aug. 31, 2012, and subject to change.
Funds are not FDIC insured and are not guaranteed. It is possible to lose the principal amount invested.
Mutual fund advisory services provided by Delaware Management Company, a series of Delaware Management Business Trust, which is a registered investment advisor. Delaware Investments, a member of Macquarie Group, refers to Delaware Management Holdings, Inc. and its subsidiaries, including the Funds’ distributor, Delaware Distributors, L.P. Macquarie Group refers to Macquarie Group Limited and its subsidiaries and affiliates worldwide.
© 2012 Delaware Management Holdings, Inc.
All third-party marks cited are the property of their respective owners.
| Portfolio management review | |
| Delaware Investments® Minnesota Municipal Bond Funds | September 11, 2012 |
| Performance preview (for the year ended August 31, 2012) | ||||
| Delaware Tax-Free Minnesota Fund (Class A shares) | 1-year return | +9.41% | ||
| Barclays Municipal Bond Index (benchmark) | 1-year return | +8.78% | ||
| Lipper Minnesota Municipal Debt Funds Average | 1-year return | +9.14% |
For complete, annualized performance for Delaware Tax-Free Minnesota Fund, please see the table on page 5.
The performance of Class A shares excludes the applicable sales charge and reflects the reinvestment of all distributions.
The Lipper Minnesota Municipal Debt Funds Average compares funds that limit assets to those securities that are exempt from taxation in Minnesota (double tax-exempt) or a city in Minnesota (triple tax-exempt).
Index performance returns do not reflect any management fees, transaction costs, or expenses. Indices are unmanaged and one cannot invest directly in an index.
| Delaware Tax-Free Minnesota Intermediate Fund (Class A shares) | 1-year return | +6.88% | ||
| Barclays 3–15 Year Blend Municipal Bond Index (benchmark) | 1-year return | +6.84% | ||
| Lipper Other States Intermediate Municipal Debt Funds Average | 1-year return | +5.72% |
For complete, annualized performance for Delaware Tax-Free Minnesota Intermediate Fund, please see the table on page 8.
The performance of Class A shares excludes the applicable sales charge and reflects the reinvestment of all distributions.
The Lipper Other States Intermediate Municipal Debt Funds Average compares funds that invest in municipal debt issues with dollar-weighted average maturities of 5 to 10 years and are exempt from taxation on a specified city or state basis.
Index performance returns do not reflect any management fees, transaction costs, or expenses. Indices are unmanaged and one cannot invest directly in an index.
| Delaware Minnesota High-Yield Municipal Bond Fund (Class A shares) | 1-year return | +9.86% | ||
| Barclays Municipal Bond Index (benchmark) | 1-year return | +8.78% | ||
| Lipper Minnesota Municipal Debt Funds Average | 1-year return | +9.14% |
For complete, annualized performance for Delaware Minnesota High-Yield Municipal Bond Fund, please see the table on page 11.
The performance of Class A shares excludes the applicable sales charge and reflects the reinvestment of all distributions.
The Lipper Minnesota Municipal Debt Funds Average compares funds that limit assets to those securities that are exempt from taxation in Minnesota (double tax-exempt) or a city in Minnesota (triple tax-exempt).
Index performance returns do not reflect any management fees, transaction costs, or expenses. Indices are unmanaged and one cannot invest directly in an index.
1
Portfolio management review
Delaware Investments® Minnesota Municipal Bond Funds
Economic backdrop
As the Funds’ fiscal year got under way in September 2011, signs were mounting that the U.S. economy was gradually improving. While this situation was interpreted positively for economically sensitive asset classes, it was also expected to lead to higher interest rates — a negative situation for most types of bonds. By the second half of the fiscal year, however, it became clear that the economy’s momentum was stalling:
- U.S. gross domestic product (GDP) — a measure of the goods and services produced by the nation — grew at an annualized rate of just 2.0% in the first quarter of 2012, down from 4.1% in the previous three-month period. In the second quarter of 2012, the rate of GDP growth slowed further, to an estimated 1.7%.
- Job creation remained persistently sluggish, as the unemployment rate fluctuated within a historically high range of 8.1% to 8.3% between January and August 2012.
(U.S. Commerce Department, U.S. Labor Department)
Although individual localities around the country continued to experience fiscal struggles, we did not view this as an indication of deeply rooted risk in the municipal bond market as a whole. Instead, we saw isolated cases of municipalities dealing with specific challenges unique to their circumstances (such as underfunded pension plans or weak revenue streams).
Outside the United States, elevated debt levels in several European countries — most notably Greece, Spain, and Italy — continued to foster the region’s economic volatility. European policy makers hoped to avoid the worst-case scenario of a breakup of the shared euro currency, which would likely result in a massive disruption to the global economy. As the Funds’ fiscal year progressed, it appeared that a tentative framework for resolution was in place, but financial markets remained highly sensitive to the uncertainty of a successful ending to this fiscal crisis.
Economic conditions within Minnesota
(Note: Data cited below are from sources that include: U.S. Labor Department, Minnesota Management & Budget, and Moody’s Investors Service.)
As the Funds’ fiscal year came to a close, the state of Minnesota exhibited a fundamentally sound economy that was reasonably diversified, with a mix of manufacturing, services, and trade industries. Nonfarm payrolls for July 2012 came in at 2.7 million, up 2.2% from July 2011 and higher than the national average of 1.4%.
While the state’s unemployment rate has historically lagged national unemployment, it has seen its unemployment rate increase in recent months; the jobless rate increased from 5.6% in June 2012 to 5.8% in July 2012.
Minnesota’s fiscal 2012 proved to be strong, with revenues surpassing estimates more than once throughout the year. According to estimates released in July, General Fund receipts for fiscal 2012 were up $336 million (2.1%) above earlier forecasts. The state projects a $1.05 billion budget gap for the upcoming 2014-2015 biennium, down from the previous forecast of $1.9 billion.
Municipal bond market conditions
The Funds’ fiscal year coincided with a beneficial environment for many municipal bond investors. Amid the sluggish U.S. economic backdrop and potential fallout
2
from the European debt situation, yields on U.S. Treasury debt stayed dramatically low. Investors therefore looked elsewhere for sources of competitive yield, and municipal bonds benefited from this attention.
Another factor helping to lift municipal bond prices was a favorable relationship between supply and demand. The relatively limited supply of tax-exempt bonds, paired with extremely strong demand from some investors, provided support for the asset class.
Several factors fueled the demand side of the equation. First, there were heavy flows back into investors’ hands through bond redemptions. Second, new inflows into municipal bond mutual funds remained high, as did demand from institutional investors. Institutional investors don’t often purchase municipal securities and don’t traditionally drive the market, but in this case they likely saw certain municipal bonds offering unusually attractive values relative to comparable opportunities among taxable bonds.
Another factor underlying the demand for municipal securities was investors’ search for higher yield amid a low interest rate environment. Accordingly, bonds that exhibited higher yields, including those with longer maturities and lower credit ratings, generally outperformed their counterparts. In fact, the best-performing maturity range of the municipal bond market (as measured by the Barclays Municipal Bond Index) was 22 years and longer, which gained 14.52%, compared with an advance of just 0.89% for bonds with maturities of less than two years. Similarly, BBB-rated bonds were up 15.40% for the same time period, compared with a gain of just 6.07% for the AAA segment within that index.
Maintaining a consistent strategy
Across the Funds, we maintained a consistent management approach, emphasizing bottom-up security selection. We made investment decisions based on our research on individual bonds, instead of reacting to macroeconomic trends or trying to predict interest rate movements.
The Funds’ portfolios regularly emphasize A-rated and BBB-rated bonds and also maintain some allocation to bonds rated below investment grade. Simultaneously, they tend to underweight AAA-rated and AA-rated securities, as these higher-quality bonds generally offer fewer prospects to uncover hidden value.
Our comfort level with the Funds’ elevated weighting in relatively credit-sensitive securities stems from the thoroughness of our credit research process and our confidence in its ability to help identify tax-exempt securities that offer a positive risk-versus-reward tradeoff.
The Funds entered the fiscal year well positioned in our view, given the income being generated by certain holdings acquired in a higher interest rate environment during 2009 and 2010. We did not make major changes to the Funds’ portfolio holdings during the fiscal year. The majority of activity focused on investing new cash that came into the Funds. We invested opportunistically, taking advantage of individual securities that we believed fit into each portfolio’s respective structure.
One noteworthy source of bond supply during the Funds’ fiscal year was Puerto Rico, and in late 2011 we added a number of Puerto Rican bonds that we believed were priced attractively. With a large amount of Puerto Rican issuance coming to market in a
3
Portfolio management review
Delaware Investments® Minnesota Municipal Bond Funds
relatively short time period, we followed our rigorous research process in identifying what we believed to be meaningful additions to each Fund’s portfolio.
Notable sectors and securities
As we mentioned earlier, the best-performing bonds in the municipal marketplace were those with longer maturity dates and relatively lower credit ratings. By a similar token, the municipal bond market’s best-performing sectors were those composed predominantly of bonds with these characteristics.
The outperformance of lower-rated bonds proved favorable for our style of investing. Looking at the strongest individual contributors to each Fund’s results, we note that they are representative of the trend in which long-dated, lower-credit-quality issues enjoyed a performance advantage.
Within the Funds
Delaware Tax-Free Minnesota Fund benefited from owning a variety of bonds in the healthcare sector. Notable performers included nonrated senior housing bonds issued for the Marian Center, a St. Paul continuing care retirement community (CCRC), with a 2043 maturity date. Another strong performer was a healthcare bond for Guardian Angels Health Services, a CCRC in Sherburne County, maturing in 2036.
In contrast, relatively weaker performers included electric utility bonds for the Western Minnesota Municipal Power Agency as well as local general obligation debt issued by the Morris Independent School District, the latter of which were short-dated, high-quality bonds. Both of these securities turned in positive gains for the year, but they lagged the overall gains posted by longer-dated and lower-rated securities.
The strongest-performing securities within Delaware Tax Free Minnesota Intermediate Fund included Minnesota Tobacco Securitization Authority tobacco settlement revenue bonds with a 2031 maturity date and an A- rating from Standard & Poor’s (S&P). The Fund’s strong performers also included nonrated Rochester healthcare and housing bonds for Samaritan Bethany, a CCRC. These securities bore a 2029 maturity date.
On the other hand, the Fund’s position in Minnesota state general obligation bonds was among the relative laggards, given that these securities maintained S&P’s highest credit rating of AAA and were scheduled to mature in 2015. Other underperformers included Minnesota 911 revenue bonds (part of a public safety project), which advanced mildly during the fiscal year, as their 2014 maturity date and AA+ S&P rating rendered them somewhat out of favor.
Within Delaware Minnesota High-Yield Municipal Bond Fund, the strongest performers included bonds for the Marian Center CCRC in St. Paul, as well as bonds issued for Orleans Homes, a residential homebuilder with a maturity date of 2042. In contrast, underperformers included Minnesota state general obligation bonds maturing in 2016 and Southern Minnesota Municipal Power Agency bonds maturing in 2012; both issues failed to gain much ground during the Fund’s fiscal year, due in large part to their near-term maturity dates.
4
| Performance summaries | |
| Delaware Tax-Free Minnesota Fund | August 31, 2012 |
The performance data quoted represent past performance; past performance does not guarantee future results. Investment return and principal value will fluctuate so your shares, when redeemed, may be worth more or less than their original cost. Please obtain the performance data current for the most recent month end by calling 800 523-1918 or visiting our website at delawareinvestments.com/performance. Current performance may be lower or higher than the performance data quoted.
| Fund performance1,2 | Average annual total returns through August 31, 2012 | |||||
| 1 year | 5 years | 10 years | ||||
| Class A (Est. Feb. 27, 1984) | ||||||
| Excluding sales charge | +9.41% | +5.84% | +5.11% | |||
| Including sales charge | +4.47% | +4.87% | +4.63% | |||
| Class B (Est. March 11, 1995) | ||||||
| Excluding sales charge | +8.59% | +5.05% | +4.47% | |||
| Including sales charge | +4.59% | +4.80% | +4.47% | |||
| Class C (Est. May 4, 1994) | ||||||
| Excluding sales charge | +8.58% | +5.06% | +4.32% | |||
| Including sales charge | +7.58% | +5.06% | +4.32% | |||
1 Returns reflect the reinvestment of all distributions and are presented both with and without the applicable sales charges described below. Returns do not reflect the deduction of taxes the shareholder would pay on Fund distributions or redemptions of Fund shares.
Expense limitations were in effect for certain classes during some or all of the periods shown in the “Fund performance” chart. The current expenses for each class are listed on the “Fund expense ratios” table on page 6. Performance would have been lower had expense limitations not been in effect.
Class A shares are sold with a maximum front-end sales charge of 4.50%, and have an annual distribution and service fee of 0.25% of average daily net assets. Performance for Class A shares, excluding sales charges, assumes that no front-end sales charge applied.
Class B shares may be purchased only through dividend reinvestment and certain permitted exchanges as described in the prospectus. Please see the prospectus for additional information on Class B shares. Class B shares have a contingent deferred sales charge that declines from 4.00% to zero depending on the period of time the shares are held. They are also subject to an annual distribution and service fee of 1.00% of average daily net assets. Class B shares will automatically convert to Class A shares on a quarterly basis approximately eight years after purchase. Ten-year and lifetime performance figures for Class B shares reflect conversion to Class A shares after approximately eight years.
Class C shares are sold with a contingent deferred sales charge of 1.00% if redeemed during the first 12 months. They are also subject to an annual distribution and service fee of 1.00% of average daily net assets.
5
Performance summaries
Delaware Tax-Free Minnesota Fund
Performance for Class B and C shares, excluding sales charges, assumes either that contingent deferred sales charges did not apply or that the investment was not redeemed.
The “Fund performance” table and the “Performance of a $10,000 investment” graph do not reflect the deduction of taxes the shareholder would pay on Fund distributions or redemptions of Fund shares.
Fixed income securities and bond funds can lose value, and investors can lose principal, as interest rates rise. They also may be affected by economic conditions that hinder an issuer’s ability to make interest and principal payments on its debt.
The Fund may also be subject to prepayment risk, the risk that the principal of a fixed income security that is held by the Fund may be prepaid prior to maturity, potentially forcing the Fund to reinvest that money at a lower interest rate.
Funds that invest primarily in one state may be more susceptible to the economic, regulatory, and other factors of that state than funds that invest more broadly.
Substantially all dividend income derived from tax-free funds is exempt from federal income tax. Some income may be subject to the federal alternative minimum tax (AMT) that applies to certain investors. Capital gains, if any, are taxable.
Bond ratings are determined by a nationally recognized statistical rating organization.
2 The Fund’s expense ratios, as described in the most recent prospectus, are disclosed in the following “Fund expense ratios” table. Delaware Investments has agreed to reimburse certain expenses and/or waive certain fees in order to prevent total fund operating expenses (excluding certain fees and expenses) from exceeding 0.65% of the Fund’s average daily net assets from Dec. 29, 2011, through Dec. 28, 2012. Please see the most recent prospectus and any applicable supplement(s) for additional information on these fee waivers and/or reimbursements.
| Fund expense ratios | Class A | Class B | Class C | |||
| Total annual operating expenses | 0.92% | 1.67% | 1.67% | |||
| (without fee waivers) | ||||||
| Net expenses | 0.90% | 1.65% | 1.65% | |||
| (including fee waivers, if any) | ||||||
| Type of waiver | Contractual | Contractual | Contractual |
6
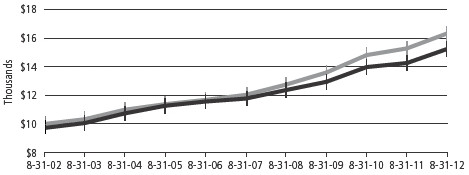
Performance of a $10,000 investment1
Average annual total returns from Aug. 31, 2002, through Aug. 31, 2012

| For period beginning Aug. 31, 2002, through Aug. 31, 2012 | Starting value | Ending value | ||
| Barclays Municipal Bond Index | $10,000 | $16,596 | ||
| Delaware Tax-Free Minnesota Fund — Class A shares | $9,550 | $15,698 | ||
1 The “Performance of a $10,000 investment” graph assumes $10,000 invested in Class A shares of the Fund on Aug. 31, 2002, and includes the effect of a 4.50% front-end sales charge and the reinvestment of all distributions. The graph does not reflect the deduction of taxes the shareholders would pay on Fund distributions or redemptions of Fund shares. Expense limitations were in effect for some or all of the periods shown. Performance would have been lower had expense limitations not been in effect. Current expenses are listed in the “Fund expense ratios” table on page 6. Please note additional details on pages 5 through 7.
The chart also assumes $10,000 invested in the Barclays Municipal Bond Index as of Aug. 31, 2002. The Barclays Municipal Bond Index measures the total return performance of the long-term, investment grade tax-exempt bond market.
Index performance returns do not reflect any management fees, transaction costs, or expenses. Indices are unmanaged and one cannot invest directly in an index. Past performance is not a guarantee of future results.
Performance of other Fund classes will vary due to different charges and expenses.
| Nasdaq symbols | CUSIPs | ||||||
| Class A | DEFFX | 928918101 | |||||
| Class B | DMOBX | 928928696 | |||||
| Class C | DMOCX | 928918408 | |||||
7
Performance summaries
Delaware Tax-Free Minnesota Intermediate Fund
The performance data quoted represent past performance; past performance does not guarantee future results. Investment return and principal value will fluctuate so your shares, when redeemed, may be worth more or less than their original cost. Please obtain the performance data current for the most recent month end by calling 800 523-1918 or visiting our website at delawareinvestments.com/performance. Current performance may be lower or higher than the performance data quoted.
| Fund performance1,2 | Average annual total returns through August 31, 2012 | ||||||
| 1 year | 5 years | 10 years | |||||
| Class A (Est. Oct. 27, 1985) | |||||||
| Excluding sales charge | +6.88% | +5.28% | +4.60% | ||||
| Including sales charge | +3.98% | +4.70% | +4.31% | ||||
| Class B (Est. Aug. 15, 1995) | |||||||
| Excluding sales charge | +5.96% | +4.41% | +4.15% | ||||
| Including sales charge | +3.96% | +4.41% | +4.15% | ||||
| Class C (Est. May 4, 1994) | |||||||
| Excluding sales charge | +5.96% | +4.41% | +3.73% | ||||
| Including sales charge | +4.96% | +4.41% | +3.73% | ||||
1 Returns reflect the reinvestment of all distributions and are presented both with and without the applicable sales charges described below. Returns do not reflect the deduction of taxes the shareholder would pay on Fund distributions or redemptions of Fund shares.
Expense limitations were in effect for certain classes during some or all of the periods shown in the “Fund performance” chart. The current expenses for each class are listed on the “Fund expense ratios” table on page 9. Performance would have been lower had expense limitations not been in effect.
Class A shares are sold with a maximum front-end sales charge of 2.75%, and have an annual distribution and service fee of 0.25% of average daily net assets. This fee has been contractually limited to 0.15% of average daily net assets from Dec. 29, 2011, through Dec. 28, 2012. Performance for Class A shares, excluding sales charges, assumes that no front-end sales charge applied.
Class B shares may be purchased only through dividend reinvestment and certain permitted exchanges as described in the prospectus. Please see the prospectus for additional information on Class B shares. Class B shares have a contingent deferred sales charge that declines from 2.00% to zero depending on the period of time the shares are held. They are also subject to an annual distribution and service fee of 1.00% of average daily net assets. Class B shares will automatically convert to Class A shares on a quarterly basis approximately five years after purchase. Ten-year and lifetime performance figures for Class B shares reflect conversion to Class A shares after approximately five years.
Class C shares are sold with a contingent deferred sales charge of 1.00% if redeemed during the first 12 months. They are also subject to an annual distribution and service fee of 1.00% of average daily net assets.
8
Performance for Class B and C shares, excluding sales charges, assumes either that contingent deferred sales charges did not apply or that the investment was not redeemed.
The “Fund performance” table and the “Performance of a $10,000 investment” graph do not reflect the deduction of taxes the shareholder would pay on Fund distributions or redemptions of Fund shares.
Fixed income securities and bond funds can lose value, and investors can lose principal, as interest rates rise. They also may be affected by economic conditions that hinder an issuer’s ability to make interest and principal payments on its debt.
The Fund may also be subject to prepayment risk, the risk that the principal of a fixed income security that is held by the Fund may be prepaid prior to maturity, potentially forcing the Fund to reinvest that money at a lower interest rate.
Funds that invest primarily in one state may be more susceptible to the economic, regulatory, and other factors of that state than funds that invest more broadly.
Substantially all dividend income derived from tax-free funds is exempt from federal income tax. Some income may be subject to the federal alternative minimum tax (AMT) that applies to certain investors. Capital gains, if any, are taxable.
Bond ratings are determined by a nationally recognized statistical rating organization.
2 The Fund’s expense ratios, as described in the most recent prospectus, are disclosed in the following “Fund expense ratios” table. Delaware Investments has agreed to reimburse certain expenses and/or waive certain fees in order to prevent total fund operating expenses (excluding certain fees and expenses) from exceeding 0.69% of the Fund’s average daily net assets from Dec. 29, 2011, through Dec. 28, 2012. Please see the most recent prospectus and any applicable supplement(s) for additional information on these fee waivers and/or reimbursements.
| Fund expense ratios | Class A | Class B | Class C | |||
| Total annual operating expenses | 0.95% | 1.70% | 1.70% | |||
| (without fee waivers) | ||||||
| Net expenses | 0.84% | 1.69% | 1.69% | |||
| (including fee waivers, if any) | ||||||
| Type of waiver | Contractual | Contractual | Contractual |
9
Performance summaries
Delaware Tax-Free Minnesota Intermediate Fund
Performance of a $10,000 investment1
Average annual total returns from Aug. 31, 2002, through Aug. 31, 2012
| For period beginning Aug. 31, 2002, through Aug. 31, 2012 | Starting value | Ending value | ||||||
| Barclays 3–15 Year Blend Municipal Bond Index | $10,000 | $16,321 | ||||||
| Delaware Tax-Free Minnesota Intermediate Fund — Class A shares | $9,725 | $15,236 | ||||||
1 The “Performance of a $10,000 investment” graph assumes $10,000 invested in Class A shares of the Fund on Aug. 31, 2002, and includes the effect of a 2.75% front-end sales charge and the reinvestment of all distributions. The graph does not reflect the deduction of taxes the shareholders would pay on Fund distributions or redemptions of Fund shares. Expense limitations were in effect for some or all of the periods shown. Performance would have been lower had expense limitations not been in effect. Current expenses are listed in the “Fund expense ratios” table on page 9. Please note additional details on pages 8 through 10.
The chart also assumes $10,000 invested in the Barclays 3–15 Year Blend Municipal Bond Index as of Aug. 31, 2002. The Barclays 3–15 Year Blend Municipal Bond Index measures the total return performance of investment grade, U.S. tax-exempt bonds with maturities from 2 to 17 years.
Index performance returns do not reflect any management fees, transaction costs, or expenses. Indices are unmanaged and one cannot invest directly in an index. Past performance is not a guarantee of future results.
Performance of other Fund classes will vary due to different charges and expenses.
| Nasdaq symbols | CUSIPs | ||||
| Class A | DXCCX | 928930106 | |||
| Class B | DVSBX | 928928399 | |||
| Class C | DVSCX | 928930205 |
10
| Performance summaries | |
| Delaware Minnesota High-Yield Municipal Bond Fund | August 31, 2012 |
The performance data quoted represent past performance; past performance does not guarantee future results. Investment return and principal value will fluctuate so your shares, when redeemed, may be worth more or less than their original cost. Please obtain the performance data current for the most recent month end by calling 800 523-1918 or visiting our website at delawareinvestments.com/performance. Current performance may be lower or higher than the performance data quoted.
Fund performance1,2 | Average annual total returns through August 31, 2012 | ||||||
| 1 year | 5 years | 10 years | |||||
| Class A (Est. June 4, 1996) | |||||||
| Excluding sales charge | +9.86% | +6.00% | +5.64% | ||||
| Including sales charge | +4.95% | +5.03% | +5.15% | ||||
| Class B (Est. June 12, 1996) | |||||||
| Excluding sales charge | +8.93% | +5.21% | +5.00% | ||||
| Including sales charge | +4.93% | +4.96% | +5.00% | ||||
| Class C (Est. June 7, 1996) | |||||||
| Excluding sales charge | +9.03% | +5.20% | +4.84% | ||||
| Including sales charge | +8.03% | +5.20% | +4.84% | ||||
1 Returns reflect the reinvestment of all distributions and are presented both with and without the applicable sales charges described below. Returns do not reflect the deduction of taxes the shareholder would pay on Fund distributions or redemptions of Fund shares.
Expense limitations were in effect for certain classes during some or all of the periods shown in the “Fund performance” chart. The current expenses for each class are listed on the “Fund expense ratios” table on page 12. Performance would have been lower had expense limitations not been in effect.
Class A shares are sold with a maximum front-end sales charge of 4.50%, and have an annual distribution and service fee of 0.25% of average daily net assets. Performance for Class A shares, excluding sales charges, assumes that no front-end sales charge applied.
Class B shares may be purchased only through dividend reinvestment and certain permitted exchanges as described in the prospectus. Please see the prospectus for additional information on Class B shares. Class B shares have a contingent deferred sales charge that declines from 4.00% to zero depending on the period of time the shares are held. They are also subject to an annual distribution and service fee of 1.00% of average daily net assets. Class B shares will automatically convert to Class A shares on a quarterly basis approximately eight years after purchase. Ten-year and lifetime performance figures for Class B shares reflect conversion to Class A shares after approximately eight years.
Class C shares are sold with a contingent deferred sales charge of 1.00% if redeemed during the first 12 months. They are also subject to an annual distribution and service fee of 1.00% of average daily net assets.
11
Performance summaries
Delaware Minnesota High-Yield Municipal Bond Fund
Performance for Class B and C shares, excluding sales charges, assumes either that contingent deferred sales charges did not apply or that the investment was not redeemed.
The “Fund performance” table and the “Performance of a $10,000 investment” graph do not reflect the deduction of taxes the shareholder would pay on Fund distributions or redemptions of Fund shares.
Fixed income securities and bond funds can lose value, and investors can lose principal, as interest rates rise. They also may be affected by economic conditions that hinder an issuer’s ability to make interest and principal payments on its debt.
The Fund may also be subject to prepayment risk, the risk that the principal of a fixed income security that is held by the Fund may be prepaid prior to maturity, potentially forcing the Fund to reinvest that money at a lower interest rate.
High yielding, noninvestment grade bonds (junk bonds) involve higher risk than investment grade bonds. The high yield secondary market is particularly susceptible to liquidity problems when institutional investors, such as mutual funds and certain other financial institutions, temporarily stop buying bonds for regulatory, financial, or other reasons. In addition, a less liquid secondary market makes it more difficult for the Fund to obtain precise valuations of the high yield securities in its portfolio.
Funds that invest primarily in one state may be more susceptible to the economic, regulatory, and other factors of that state than funds that invest more broadly.
Substantially all dividend income derived from tax-free funds is exempt from federal income tax. Some income may be subject to the federal alternative minimum tax (AMT) that applies to certain investors. Capital gains, if any, are taxable.
Bond ratings are determined by a nationally recognized statistical rating organization.
2 The Fund’s expense ratios, as described in the most recent prospectus, are disclosed in the following “Fund expense ratios” table. Delaware Investments has agreed to reimburse certain expenses and/or waive certain fees in order to prevent total fund operating expenses (excluding certain fees and expenses) from exceeding 0.64% of the Fund’s average daily net assets from Dec. 29, 2011, through Dec. 28, 2012. Please see the most recent prospectus and any applicable supplement(s) for additional information on these fee waivers and/or reimbursements.
| Fund expense ratios | Class A | Class B | Class C | |||
| Total annual operating expenses | 0.98% | 1.73% | 1.73 | |||
| (without fee waivers) | ||||||
| Net expenses | 0.89% | 1.64% | 1.64 | |||
| (including fee waivers, if any) | ||||||
| Type of waiver | Contractual | Contractual | Contractual |
12
Performance of a $10,000 investment1
Average annual total returns from Aug. 31, 2002, through Aug. 31, 2012

| For period beginning Aug. 31, 2002, through Aug. 31, 2012 | Starting value | Ending value | ||||||
| Barclays Municipal Bond Index | $10,000 | $16,596 | ||||||
| Delaware Minnesota High-Yield Municipal Bond Fund — Class A shares | $9,550 | $16,515 | ||||||
1 The “Performance of a $10,000 investment” graph assumes $10,000 invested in Class A shares of the Fund on Aug. 31, 2002, and includes the effect of a 4.50% front-end sales charge and the reinvestment of all distributions. The graph does not reflect the deduction of taxes the shareholders would pay on Fund distributions or redemptions of Fund shares. Expense limitations were in effect for some or all of the periods shown. Performance would have been lower had expense limitations not been in effect. Current expenses are listed in the “Fund expense ratios” table on page 12. Please note additional details on pages 11 through 13.
The chart also assumes $10,000 invested in the Barclays Municipal Bond Index as of Aug. 31, 2002. The Barclays Municipal Bond Index measures the total return performance of the long-term, investment grade tax-exempt bond market.
Index performance returns do not reflect any management fees, transaction costs, or expenses. Indices are unmanaged and one cannot invest directly in an index. Past performance is not a guarantee of future results.
Performance of other Fund classes will vary due to different charges and expenses.
| Nasdaq symbols | CUSIPs | ||||
| Class A | DVMHX | 928928316 | |||
| Class B | DVMYX | 928928290 | |||
| Class C | DVMMX | 928928282 |
13
Disclosure of Fund expenses
For the six-month period from March 1, 2012 to August 31, 2012 (Unaudited)
As a shareholder of a Fund, you incur two types of costs: (1) transaction costs, including sales charges (loads) on purchase payments, reinvested dividends, or other distributions; redemption fees; and exchange fees; and (2) ongoing costs, including management fees; distribution and/or service (12b-1) fees; and other Fund expenses. These following examples are intended to help you understand your ongoing costs (in dollars) of investing in a Fund and to compare these costs with the ongoing costs of investing in other mutual funds.
The examples are based on an investment of $1,000 invested at the beginning of the period and held for the entire six-month period from March 1, 2012 to August 31, 2012.
Actual expenses
The first section of the tables shown, “Actual Fund return,” provides information about actual account values and actual expenses. You may use the information in this section of the table, together with the amount you invested, to estimate the expenses that you paid over the period. Simply divide your account value by $1,000 (for example, an $8,600 account value divided by $1,000 = 8.6), then multiply the result by the number in the first section under the heading entitled “Expenses Paid During Period” to estimate the expenses you paid on your account during this period.
Hypothetical example for comparison purposes
The second section of the tables shown, “Hypothetical 5% return,” provides information about hypothetical account values and hypothetical expenses based on the Funds’ actual expense ratios and an assumed rate of return of 5% per year before expenses, which is not the Funds’ actual return. The hypothetical account values and expenses may not be used to estimate the actual ending account balance or expenses you paid for the period. You may use this information to compare the ongoing costs of investing in a Fund and other funds. To do so, compare this 5% hypothetical example with the 5% hypothetical examples that appear in the shareholder reports of the other funds.
Please note that the expenses shown in the tables are meant to highlight your ongoing costs only and do not reflect any transactional costs, such as sales charges (loads), redemption fees, or exchange fees. Therefore, the second section of each table is useful in comparing ongoing costs only, and will not help you determine the relative total costs of owning different funds. In addition, if these transactional costs were included, your costs would have been higher. The Funds’ expenses shown in the tables reflect fee waivers in effect. The expenses shown in each table assume reinvestment of all dividends and distributions.
14
Delaware Tax-Free Minnesota Fund
Expense analysis of an investment of $1,000
| Beginning | Ending | Expenses | ||||||||||||
| Account Value | Account Value | Annualized | Paid During Period | |||||||||||
| 3/1/12 | 8/31/12 | Expense Ratio | 3/1/12 to 8/31/12* | |||||||||||
| Actual Fund return | ||||||||||||||
| Class A | $1,000.00 | $1,029.20 | 0.90% | $4.59 | ||||||||||
| Class B | 1,000.00 | 1,025.30 | 1.65% | 8.40 | ||||||||||
| Class C | 1,000.00 | 1,025.30 | 1.65% | 8.40 | ||||||||||
| Hypothetical 5% return (5% return before expenses) | ||||||||||||||
| Class A | $1,000.00 | $1,020.61 | 0.90% | $4.57 | ||||||||||
| Class B | 1,000.00 | 1,016.84 | 1.65% | 8.36 | ||||||||||
| Class C | 1,000.00 | 1,016.84 | 1.65% | 8.36 | ||||||||||
| Delaware Tax-Free Minnesota Intermediate Fund | ||||||||||||||
| Expense analysis of an investment of $1,000 | ||||||||||||||
| Beginning | Ending | Expenses | ||||||||||||
| Account Value | Account Value | Annualized | Paid During Period | |||||||||||
| 3/1/12 | 8/31/12 | Expense Ratio | 3/1/12 to 8/31/12* | |||||||||||
| Actual Fund return | ||||||||||||||
| Class A | $1,000.00 | $1,019.70 | 0.84% | $4.26 | ||||||||||
| Class B | 1,000.00 | 1,016.30 | 1.69% | 8.57 | ||||||||||
| Class C | 1,000.00 | 1,016.30 | 1.69% | 8.57 | ||||||||||
| Hypothetical 5% return (5% return before expenses) | ||||||||||||||
| Class A | $1,000.00 | $1,020.91 | 0.84% | $4.27 | ||||||||||
| Class B | 1,000.00 | 1,016.64 | 1.69% | 8.57 | ||||||||||
| Class C | 1,000.00 | 1,016.64 | 1.69% | 8.57 | ||||||||||
15
Disclosure of Fund expenses
Delaware Minnesota High-Yield Municipal Bond Fund
Expense analysis of an investment of $1,000
| Beginning | Ending | Expenses | ||||||||||||||
| Account Value | Account Value | Annualized | Paid During Period | |||||||||||||
| 3/1/12 | 8/31/12 | Expense Ratio | 3/1/12 to 8/31/12* | |||||||||||||
| Actual Fund return | ||||||||||||||||
| Class A | $1,000.00 | $1,035.90 | 0.89% | $4.55 | ||||||||||||
| Class B | 1,000.00 | 1,032.00 | 1.64% | 8.38 | ||||||||||||
| Class C | 1,000.00 | 1,032.00 | 1.64% | 8.38 | ||||||||||||
| Hypothetical 5% return (5% return before expenses) | ||||||||||||||||
| Class A | $1,000.00 | $1,020.66 | 0.89% | $4.52 | ||||||||||||
| Class B | 1,000.00 | 1,016.89 | 1.64% | 8.31 | ||||||||||||
| Class C | 1,000.00 | 1,016.89 | 1.64% | 8.31 | ||||||||||||
*“Expenses Paid During Period” are equal to the relevant Fund’s annualized expense ratio, multiplied by the average account value over the period, multiplied by 184/366 (to reflect the one-half year period).
16
| Security type/sector allocations | |
| Delaware Tax-Free Minnesota Fund | As of August 31, 2012 (Unaudited) |
Sector designations may be different than the sector designations presented in other Fund materials.
| Security type/sector | Percentage of net assets | |
| Municipal Bonds | 99.76 | % |
| Corporate-Backed Revenue Bonds | 7.28 | % |
| Education Revenue Bonds | 8.06 | % |
| Electric Revenue Bonds | 4.74 | % |
| Healthcare Revenue Bonds | 34.94 | % |
| Housing Revenue Bonds | 6.27 | % |
| Lease Revenue Bonds | 3.15 | % |
| Local General Obligation Bonds | 11.11 | % |
| Pre-Refunded/Escrowed to Maturity Bonds | 11.86 | % |
| Special Tax Revenue Bonds | 3.75 | % |
| State General Obligation Bonds | 5.91 | % |
| Transportation Revenue Bonds | 1.60 | % |
| Water & Sewer Revenue Bonds | 1.09 | % |
| Short-Term Investments | 0.32 | % |
| Total Value of Securities | 100.08 | % |
| Liabilities Net of Receivables and Other Assets | (0.08 | %) |
| Total Net Assets | 100.00 | % |
17
| Security type/sector allocations | |
| Delaware Tax-Free Minnesota Intermediate Fund | As of August 31, 2012 (Unaudited) |
Sector designations may be different than the sector designations presented in other Fund materials.
| Security type/sector | Percentage of net assets | ||
| Municipal Bonds | 100.12 | % | |
| Corporate-Backed Revenue Bonds | 6.72 | % | |
| Education Revenue Bonds | 13.37 | % | |
| Electric Revenue Bonds | 8.91 | % | |
| Healthcare Revenue Bonds | 28.70 | % | |
| Housing Revenue Bonds | 1.51 | % | |
| Lease Revenue Bonds | 2.95 | % | |
| Local General Obligation Bonds | 18.58 | % | |
| Pre-Refunded/Escrowed to Maturity Bonds | 3.93 | % | |
| Special Tax Revenue Bonds | 4.08 | % | |
| State General Obligation Bonds | 5.20 | % | |
| Transportation Revenue Bonds | 3.70 | % | |
| Water & Sewer Revenue Bonds | 2.47 | % | |
| Total Value of Securities | 100.12 | % | |
| Liabilities Net of Receivables and Other Assets | (0.12 | %) | |
| Total Net Assets | 100.00 | % | |
18
| Delaware Minnesota High-Yield Municipal Bond Fund | As of August 31, 2012 (Unaudited) |
Sector designations may be different than the sector designations presented in other Fund materials.
| Security type/sector | Percentage of net assets | |
| Municipal Bonds | 99.47 | % |
| Corporate-Backed Revenue Bonds | 6.78 | % |
| Education Revenue Bonds | 10.00 | % |
| Electric Revenue Bonds | 6.48 | % |
| Healthcare Revenue Bonds | 38.40 | % |
| Housing Revenue Bonds | 9.54 | % |
| Lease Revenue Bonds | 2.56 | % |
| Local General Obligation Bonds | 10.32 | % |
| Pre-Refunded Bonds | 3.16 | % |
| Special Tax Revenue Bonds | 8.26 | % |
| State General Obligation Bonds | 2.08 | % |
| Transportation Revenue Bonds | 1.48 | % |
| Water & Sewer Revenue Bonds | 0.41 | % |
| Short-Term Investments | 0.89 | % |
| Total Value of Securities | 100.36 | % |
| Liabilities Net of Receivables and Other Assets | (0.36 | %) |
| Total Net Assets | 100.00 | % |
19
| Statements of net assets | |
| Delaware Tax-Free Minnesota Fund | August 31, 2012 |
| Principal amount | Value | |||||
| Municipal Bonds – 99.76% | ||||||
| Corporate-Backed Revenue Bonds – 7.28% | ||||||
| Cloquet Pollution Control Revenue Refunding | ||||||
| (Potlatch Project) 5.90% 10/1/26 | $ | 7,000,000 | $ | 7,019,460 | ||
| Laurentian Energy Authority I Cogeneration Revenue | ||||||
| Series A 5.00% 12/1/21 | 8,000,000 | 8,385,280 | ||||
| Minnesota Tobacco Securitization Authority | ||||||
| (Tobacco Settlement Revenue) Refunding | ||||||
| Series B 5.25% 3/1/31 | 19,775,000 | 22,355,242 | ||||
| Sartell Environmental Improvement Revenue Refunding | ||||||
| (International Paper) Series A 5.20% 6/1/27 | 7,265,000 | 7,400,274 | ||||
| 45,160,256 | ||||||
| Education Revenue Bonds – 8.06% | ||||||
| Duluth Housing & Redevelopment Authority Lease Revenue | ||||||
| (Public Schools Academy) | ||||||
| Series A 5.875% 11/1/40 | 3,500,000 | 3,622,325 | ||||
| Minnesota Colleges & Universities Revenue Fund Series A | ||||||
| 5.00% 10/1/28 | 8,900,000 | 10,177,950 | ||||
| 5.00% 10/1/29 (NATL-RE) | 5,665,000 | 6,232,236 | ||||
| Refunding 5.00% 10/1/20 | 1,060,000 | 1,313,372 | ||||
| Refunding 5.00% 10/1/21 | 1,340,000 | 1,680,963 | ||||
| Minnesota Higher Education Facilities Authority Revenue | ||||||
| (Augsburg College) | ||||||
| Series 6-C 5.00% 5/1/20 | 1,250,000 | 1,291,013 | ||||
| Series 6-J1 5.00% 5/1/36 | 2,225,000 | 2,264,561 | ||||
| (Bethel University) Series 6-R 5.50% 5/1/37 | 2,500,000 | 2,612,575 | ||||
| (Carleton College) | ||||||
| Series 6-T 5.00% 1/1/28 | 1,000,000 | 1,127,000 | ||||
| Series 7-D | ||||||
| 5.00% 3/1/30 | 1,500,000 | 1,716,435 | ||||
| 5.00% 3/1/40 | 3,000,000 | 3,328,560 | ||||
| (St. Catherine University) Series 7-Q | ||||||
| 5.00% 10/1/21 | 1,300,000 | 1,519,206 | ||||
| 5.00% 10/1/23 | 350,000 | 406,543 | ||||
| 5.00% 10/1/24 | 475,000 | 548,402 | ||||
| 5.00% 10/1/27 | 200,000 | 227,852 | ||||
| (St. Olaf College) Series 7-F 4.50% 10/1/30 | 2,000,000 | 2,185,440 | ||||
| (University of St. Thomas) | ||||||
| Series 6-X 5.25% 4/1/39 | 5,000,000 | 5,452,550 | ||||
| Series 7-A 5.00% 10/1/39 | 2,000,000 | 2,236,580 | ||||
| State Scholastic College) Series 7-J 6.30% 12/1/40 | 1,800,000 | 2,064,888 | ||||
| 50,008,451 | ||||||
20
| Principal amount | Value | |||||
| Municipal Bonds (continued) | ||||||
| Electric Revenue Bonds – 4.74% | ||||||
| Central Minnesota Municipal Power Agency | ||||||
| (Brookings Twin Cities Transmission Project) | ||||||
| Series E 5.00% 1/1/42 | $ | 1,500,000 | $ | 1,678,395 | ||
| Chaska Electric Revenue Refunding | ||||||
| (Generating Facilities) Series A 5.00% 10/1/30 | 3,000,000 | 3,183,090 | ||||
| Hutchinson Public Utilities Commission Revenue Series A | ||||||
| 4.00% 12/1/21 | 700,000 | 793,387 | ||||
| 5.00% 12/1/19 | 520,000 | 629,699 | ||||
| Minnesota Municipal Power Agency Electric Revenue | ||||||
| 5.00% 10/1/35 | 3,000,000 | 3,172,200 | ||||
| Series A | ||||||
| 5.00% 10/1/34 | 6,250,000 | 6,698,563 | ||||
| 5.125% 10/1/29 | 3,000,000 | 3,221,700 | ||||
| Puerto Rico Electric Power Authority Revenue | ||||||
| Series WW 5.50% 7/1/38 | 2,000,000 | 2,139,020 | ||||
| ^ | Southern Minnesota Municipal Power Agency Supply | |||||
| System Revenue Capital Appreciation | ||||||
| Series A 6.70% 1/1/25 (NATL-RE) | 5,000,000 | 3,309,050 | ||||
| Western Minnesota Municipal Power Agency Refunding | ||||||
| Series A 5.00% 1/1/27 | 3,750,000 | 4,589,400 | ||||
| 29,414,504 | ||||||
| Healthcare Revenue Bonds – 34.94% | ||||||
| Aitkin Health Care Facilities Revenue Refunding | ||||||
| (Riverwood Healthcare Center) 5.60% 2/1/32 | 2,100,000 | 2,159,850 | ||||
| Alexandria Senior Housing Revenue | ||||||
| (Knute Nelson Senior Living) | ||||||
| 6.00% 7/1/35 | 1,500,000 | 1,617,225 | ||||
| 6.20% 7/1/45 | 2,000,000 | 2,150,020 | ||||
| Anoka Health Care Facilities Revenue | ||||||
| (Homestead Anoka Project) Series A | ||||||
| 7.00% 11/1/40 | 1,000,000 | 1,076,750 | ||||
| 7.00% 11/1/46 | 1,220,000 | 1,302,033 | ||||
| Anoka Housing Facilities Revenue | ||||||
| (Senior Homestead Anoka Project) | ||||||
| Series B 6.875% 11/1/34 | 2,015,000 | 2,180,290 | ||||
| Apple Valley Economic Development Authority Health | ||||||
| Care Revenue (Augustana Home St. Paul Project) | ||||||
| Series A 6.00% 1/1/40 | 2,700,000 | 2,782,566 | ||||
21
Statements of net assets
Delaware Tax-Free Minnesota Fund
| Principal amount | Value | |||||
| Municipal Bonds (continued) | ||||||
| Healthcare Revenue Bonds (continued) | ||||||
| Breckenridge Catholic Health Initiatives | ||||||
| Series A 5.00% 5/1/30 | $ | 2,500,000 | $ | 2,637,275 | ||
| Fergus Falls Health Care Facilities Revenue | ||||||
| (Lake Region Health Care) | ||||||
| 5.15% 8/1/35 | 1,250,000 | 1,309,850 | ||||
| 5.40% 8/1/40 | 1,000,000 | 1,047,120 | ||||
| Glencoe Health Care Facilities Revenue | ||||||
| (Glencoe Regional Health Services Project) | ||||||
| 5.00% 4/1/31 | 1,000,000 | 1,014,080 | ||||
| Maple Grove Health Care System Revenue | ||||||
| (Maple Grove Hospital) 5.25% 5/1/37 | 2,950,000 | 3,088,119 | ||||
| Minneapolis Health Care System Revenue | ||||||
| (Fairview Health Services) | ||||||
| Series A 6.625%11/15/28 | 3,000,000 | 3,595,440 | ||||
| Series B 6.50% 11/15/38 (ASSURED GTY) | 1,140,000 | 1,363,258 | ||||
| Series D | ||||||
| 5.00% 11/15/30 (AMBAC) | 2,500,000 | 2,592,275 | ||||
| 5.00% 11/15/34 (AMBAC) | 4,750,000 | 4,915,158 | ||||
| (Jones-Harrison Residence Project) 5.60% 10/1/30 | 1,050,000 | 1,060,080 | ||||
| Minneapolis National Marrow Donor Program Revenue | ||||||
| 4.875% 8/1/25 | 6,430,000 | 6,653,700 | ||||
| Minneapolis - St. Paul Housing & Redevelopment | ||||||
| Authority Health Care Revenue | ||||||
| (Children’s Hospital) Series A | ||||||
| 5.00% 8/15/30 | 2,750,000 | 2,888,105 | ||||
| 5.25% 8/15/35 | 2,085,000 | 2,382,300 | ||||
| (Health Partners Obligation Group Project) | ||||||
| 5.875% 12/1/29 | 1,000,000 | 1,028,920 | ||||
| Minnesota Agricultural & Economic | ||||||
| Development Board Revenue | ||||||
| (Benedictine Health Systems) 5.75% 2/1/29 | 1,895,000 | 1,895,834 | ||||
| (Essentia Remarketing) Series C-1 | ||||||
| 5.00% 2/15/30 (ASSURED GTY) | 5,725,000 | 6,345,533 | ||||
| 5.25% 2/15/23 (ASSURED GTY) | 5,000,000 | 5,887,500 | ||||
| 5.50% 2/15/25 (ASSURED GTY) | 5,120,000 | 6,048,461 | ||||
| (Fairview Health Care System) | ||||||
| Un-refunded Balance Series A | ||||||
| 5.75% 11/15/26 (NATL-RE) | 180,000 | 180,311 | ||||
| 6.375% 11/15/29 | 15,000 | 15,031 | ||||
22
| Principal amount | Value | |||||
| Municipal Bonds (continued) | ||||||
| Healthcare Revenue Bonds (continued) | ||||||
| Northfield Hospital & Skilled Nursing Revenue | ||||||
| 5.375% 11/1/26 | $ | 3,785,000 | $ | 3,973,077 | ||
| Rochester Health Care & Housing Revenue Refunding | ||||||
| (Samaritan Bethany) | ||||||
| Series A 7.375% 12/1/41 | 5,220,000 | 5,893,902 | ||||
| Rochester Health Care Facilities Revenue | ||||||
| (Mayo Clinic) 4.00% 11/15/41 | 9,750,000 | 10,209,225 | ||||
| (Mayo Clinic) Remarketing Series D 5.00% 11/15/38 | 6,405,000 | 7,427,750 | ||||
| (Olmsted Medical Center) 5.875% 7/1/30 | 1,850,000 | 2,029,672 | ||||
| Sartell Health Care Facilities Revenue | ||||||
| (Country Manor Campus Project) Series A | ||||||
| 5.25% 9/1/27 | 1,280,000 | 1,320,192 | ||||
| 6.375% 9/1/42 | 2,435,000 | 2,598,389 | ||||
| Shakopee Health Care Facilities Revenue | ||||||
| (St. Francis Regional Medical Center) | ||||||
| 5.10% 9/1/25 | 2,000,000 | 2,047,380 | ||||
| 5.25% 9/1/34 | 7,000,000 | 7,144,340 | ||||
| Sherburne County Health Care Facilities Revenue | ||||||
| (Guardian Angels Health Services) | ||||||
| 5.55% 10/1/36 | 1,500,000 | 1,529,880 | ||||
| St. Cloud Health Care Revenue | ||||||
| (Centracare Health System Project) | ||||||
| 5.375% 5/1/31 (ASSURED GTY) | 1,000,000 | 1,121,630 | ||||
| 5.50% 5/1/39 (ASSURED GTY) | 6,000,000 | 6,667,020 | ||||
| Series A | ||||||
| 5.00% 5/1/25 | 1,035,000 | 1,080,302 | ||||
| 5.125% 5/1/30 | 10,350,000 | 11,431,574 | ||||
| St. Louis Park Health Care Facilities Revenue | ||||||
| (Park Nicollet Health Services) Series C | ||||||
| 5.50% 7/1/23 | 3,000,000 | 3,362,670 | ||||
| 5.625% 7/1/26 | 1,925,000 | 2,148,185 | ||||
| 5.75% 7/1/30 | 5,000,000 | 5,606,900 | ||||
| Refunding 5.75% 7/1/39 | 16,975,000 | 19,085,501 | ||||
| St. Paul Housing & Redevelopment Authority | ||||||
| Health Care Facilities Revenue | ||||||
| (Health Partners Obligation Group Project) | ||||||
| 5.25% 5/15/36 | 7,900,000 | 8,223,979 | ||||
| (Senior Carondelet Village Project) | ||||||
| Series A 6.00% 8/1/42 | 3,075,000 | 3,264,451 | ||||
23
Statements of net assets
Delaware Tax-Free Minnesota Fund
| Principal amount | Value | |||||
| Municipal Bonds (continued) | ||||||
| Healthcare Revenue Bonds (continued) | ||||||
| St. Paul Housing & Redevelopment Authority Health Care | ||||||
| Revenue (Allina Health System) | ||||||
| Series A 5.00% 11/15/18 (NATL-RE) | $ | 5,720,000 | $ | 6,693,773 | ||
| Series A-1 5.25% 11/15/29 | 5,605,000 | 6,260,561 | ||||
| St. Paul Housing & Redevelopment Authority Hospital | ||||||
| Revenue (Health East Project) | ||||||
| 6.00% 11/15/30 | 4,000,000 | 4,227,080 | ||||
| 6.00% 11/15/35 | 10,340,000 | 10,863,513 | ||||
| St. Paul Housing & Redevelopment Authority Multifamily | ||||||
| Housing Revenue Refunding | ||||||
| (Marian Center Project) Series A | ||||||
| 5.30% 11/1/30 | 500,000 | 495,820 | ||||
| 5.375% 5/1/43 | 500,000 | 486,560 | ||||
| Stillwater Health Care Revenue | ||||||
| (Health System Obligation Group) 5.00% 6/1/35 | 1,000,000 | 1,026,920 | ||||
| Washington County Housing & Redevelopment | ||||||
| Authority Healthcare & Housing Revenue | ||||||
| (Birchwood & Woodbury Projects) | ||||||
| Series A 5.625% 6/1/37 | 1,500,000 | 1,527,975 | ||||
| Washington County Housing & Redevelopment Authority | ||||||
| Hospital Facilities Revenue | ||||||
| (Health East Project) 5.50% 11/15/27 | 1,000,000 | 1,001,030 | ||||
| Wayzata Senior Housing Revenue | ||||||
| (Folkestone Senior Living Community) Series A | ||||||
| 5.50% 11/1/32 | 1,050,000 | 1,083,495 | ||||
| 5.75% 11/1/39 | 2,365,000 | 2,466,364 | ||||
| 6.00% 5/1/47 | 3,685,000 | 3,880,379 | ||||
| Winona Health Care Facilities Revenue Refunding | ||||||
| (Winona Health Obligation) | ||||||
| 4.50% 7/1/25 | 850,000 | 887,111 | ||||
| 4.65% 7/1/26 | 540,000 | 562,977 | ||||
| 216,846,661 | ||||||
| Housing Revenue Bonds – 6.27% | ||||||
| Minneapolis Multifamily Housing Revenue | ||||||
| (Bottineau Commons Project) | ||||||
| 5.45% 4/20/43 (GNMA) (AMT) | 1,500,000 | 1,502,445 | ||||
| (Grant Street Apartments Project) Refunding | ||||||
| Series A 7.25% 11/1/29 | 730,000 | 731,044 | ||||
24
| Principal amount | Value | |||||
| Municipal Bonds (continued) | ||||||
| Housing Revenue Bonds (continued) | ||||||
| Minneapolis Multifamily Housing Revenue (continued) | ||||||
| (Seward Towers Project) 5.00% 5/20/36 (GNMA) | $ | 8,000,000 | $ | 8,233,200 | ||
| (Sumner Field) Series A 5.50% 11/20/26 (GNMA) (AMT) | 815,000 | 818,333 | ||||
| (Trinity Apartments) Refunding | ||||||
| Series A 6.75% 5/1/21 (HUD) | 1,320,000 | 1,321,808 | ||||
| Minnesota Housing Finance Agency | ||||||
| (Residential Housing) | ||||||
| •Series D 4.80% 7/1/38 (AMT) | 2,295,000 | 2,347,647 | ||||
| Series I 4.85% 7/1/38 (AMT) | 1,790,000 | 1,834,213 | ||||
| Series I 5.15% 7/1/38 (AMT) | 4,780,000 | 4,926,364 | ||||
| Series L 5.10% 7/1/38 (AMT) | 8,970,000 | 9,302,518 | ||||
| Series M 4.875% 7/1/37 (AMT) | 4,425,000 | 4,527,129 | ||||
| Minnesota Housing Finance Agency | ||||||
| Homeownership Finance | ||||||
| (Non-Agency Mortgage-Backed Securities Program) | ||||||
| Series D 4.70% 1/1/31 (GNMA) (FNMA) (FHLMC) | 2,455,000 | 2,732,317 | ||||
| Willmar Housing & Redevelopment Authority | ||||||
| Multifamily Housing Revenue (Highland Apartments) | ||||||
| 5.85% 6/1/19 (HUD) | 600,000 | 600,708 | ||||
| 38,877,726 | ||||||
| Lease Revenue Bonds – 3.15% | ||||||
| St. Paul Port Authority Lease Revenue | ||||||
| (Cedar Street Office Building Project) | ||||||
| 5.00% 12/1/22 | 2,500,000 | 2,527,975 | ||||
| 5.25% 12/1/27 | 3,840,000 | 3,864,998 | ||||
| Series 3-12 5.125% 12/1/27 | 3,000,000 | 3,144,630 | ||||
| (Robert Street Office Building Project) | ||||||
| Series 3-11 4.75% 12/1/23 | 2,000,000 | 2,099,300 | ||||
| Series 3-11 5.00% 12/1/27 | 2,500,000 | 2,607,325 | ||||
| Series 9 5.25% 12/1/27 | 725,000 | 729,720 | ||||
| University of Minnesota Special Purpose Revenue | ||||||
| (State Supported Biomed Science | ||||||
| Research Facilities Funding Program) | ||||||
| Series A 5.00% 8/1/35 | 3,960,000 | 4,558,000 | ||||
| 19,531,948 | ||||||
25
Statements of net assets
Delaware Tax-Free Minnesota Fund
| Principal amount | Value | |||||
| Municipal Bonds (continued) | ||||||
| Local General Obligation Bonds – 11.11% | ||||||
| Anoka County Capital Improvement | ||||||
| Series A 5.00% 2/1/22 | $ | 500,000 | $ | 594,840 | ||
| Brainerd Independent School District #181 Refunding | ||||||
| (School Building) Series A | ||||||
| 4.00% 2/1/22 | 2,255,000 | 2,507,921 | ||||
| 4.00% 2/1/23 | 5,990,000 | 6,612,601 | ||||
| Farmington Independent School District #192 | ||||||
| (School Building) Series B 5.00% 2/1/27 (AGM) | 10,705,000 | 11,642,864 | ||||
| Lakeville Independent School District #194 | ||||||
| (School Building) Refunding | ||||||
| Series A 4.75% 2/1/22 (AGM) | 6,850,000 | 6,957,682 | ||||
| ^ | Mahtomedi Independent School District #832 Capital | |||||
| Appreciation Series B 5.85% 2/1/14 (NATL-RE) | 1,540,000 | 1,529,143 | ||||
| Metropolitan Council Waste Water Treatment | ||||||
| Series B 5.00% 12/1/21 | 1,200,000 | 1,306,284 | ||||
| Series C 5.00% 3/1/28 | 5,000,000 | 5,577,650 | ||||
| Minneapolis Library 5.00% 12/1/25 | 1,500,000 | 1,516,605 | ||||
| Morris Independent School District #769 | ||||||
| (School Building) 5.00% 2/1/24 (NATL-RE) | 4,875,000 | 4,960,605 | ||||
| New Brighton Tax Increment | ||||||
| Series A 5.00% 2/1/27 (NATL-RE) | 1,000,000 | 1,149,580 | ||||
| Prior Lake-Savage Independent School District #719 | ||||||
| (School Building) Series B 5.00% 2/1/19 (AGM) | 3,145,000 | 3,453,493 | ||||
| Ramsey County State Aid Series C 5.00% 2/1/28 | 1,060,000 | 1,077,925 | ||||
| ^ | Sartell-St. Stephen Independent School District #748 | |||||
| Capital Appreciation Refunding Series B | ||||||
| 6.05% 2/1/15 (NATL-RE) | 1,075,000 | 1,043,406 | ||||
| 6.10% 2/1/16 (NATL-RE) | 1,750,000 | 1,669,675 | ||||
| South Washington County Independent School District #833 | ||||||
| (School Building) Series A | ||||||
| 4.75% 2/1/25 | 2,500,000 | 2,806,425 | ||||
| 4.75% 2/1/26 | 3,600,000 | 4,026,096 | ||||
| 4.75% 2/1/27 | 2,300,000 | 2,563,557 | ||||
| Staples United Hospital District (Todd Morrison ETC | ||||||
| Hospital Health Care Facilities-Lakewood) | ||||||
| 5.00% 12/1/21 | 2,000,000 | 2,122,980 | ||||
| 5.125% 12/1/24 | 1,000,000 | 1,055,810 | ||||
26
| Principal amount | Value | |||||
| Municipal Bonds (continued) | ||||||
| Local General Obligation Bonds (continued) | ||||||
| Thief River Falls Independent School District #564 | ||||||
| (School Building) 4.00% 2/1/30 | $ | 800,000 | $ | 891,232 | ||
| Willmar City (Rice Memorial Hospital Project) | ||||||
| Refunding Series A | ||||||
| 5.00% 2/1/25 | 2,210,000 | 2,662,696 | ||||
| 5.00% 2/1/27 | 1,000,000 | 1,192,360 | ||||
| 68,921,430 | ||||||
| §Pre-Refunded / Escrowed to Maturity Bonds – 11.86% | ||||||
| Dakota-Washington Counties Housing & Redevelopment | ||||||
| Authority Single Family Residential Mortgage Revenue | ||||||
| 8.15% 9/1/16 (NATL-RE) (IBC) (GNMA) (AMT) | 405,000 | 511,835 | ||||
| (Anoka County) 8.45% 9/1/19 (GNMA) (AMT) | 9,000,000 | 12,730,320 | ||||
| (Bloomington Mortgage) Refunding | ||||||
| Series B 8.375% 9/1/21 (GNMA) (FHA) (VA) (AMT) | 14,115,000 | 20,820,189 | ||||
| Minneapolis - St. Paul Metropolitan Airports Commission | ||||||
| Revenue Subordinate Series A 5.00% | ||||||
| 1/1/22-13 (NATL-RE) | 2,000,000 | 2,032,200 | ||||
| Minnesota Colleges & Universities Revenue Fund | ||||||
| Series A 5.00% 10/1/22-12 (AGM) | 5,135,000 | 5,155,694 | ||||
| Southern Minnesota Municipal Power Agency Power | ||||||
| Supply Revenue Refunding | ||||||
| 5.75% 1/1/18-13 (AMBAC) (TCRS) | 670,000 | 719,319 | ||||
| 5.75% 1/1/18-13 (NATL-RE) (IBC) | 1,000,000 | 1,073,610 | ||||
| Series A 5.75% 1/1/18-13 | 3,790,000 | 4,068,982 | ||||
| Series B 5.50% 1/1/15 (AMBAC) | 270,000 | 271,995 | ||||
| St. Louis Park Health Care Facilities Revenue | ||||||
| (Park Nicollet Health Services) Series B | ||||||
| 5.25% 7/1/30-14 | 7,000,000 | 7,622,860 | ||||
| University of Minnesota Series A 5.50% 7/1/21 | 12,500,000 | 15,665,875 | ||||
| Western Minnesota Municipal Power Agency Supply | ||||||
| Revenue Series A 9.75% 1/1/16 (NATL-RE) | 715,000 | 893,500 | ||||
| Willmar (Rice Memorial Hospital Project) | ||||||
| 5.00% 2/1/22-13 (AGM) | 1,000,000 | 1,020,130 | ||||
| 5.00% 2/1/25-13 (AGM) | 1,000,000 | 1,020,130 | ||||
| 73,606,639 | ||||||
27
Statements of net assets
Delaware Tax-Free Minnesota Fund
| Principal amount | Value | ||||||
| Municipal Bonds (continued) | |||||||
| Special Tax Revenue Bonds – 3.75% | |||||||
| Hennepin County Sales Tax Revenue | |||||||
| (Second Lien - Ballpark Project) Series B | |||||||
| 5.00% 12/15/19 | $ | 2,100,000 | $ | 2,477,958 | |||
| 5.00% 12/15/20 | 1,000,000 | 1,179,980 | |||||
| 5.00% 12/15/24 | 1,150,000 | 1,336,220 | |||||
| Minneapolis Development Revenue | |||||||
| (Limited-Tax Supported Common Bond Fund) | |||||||
| Series 2A 6.00% 12/1/40 | 3,000,000 | 3,492,330 | |||||
| Minneapolis Tax Increment Revenue Refunding | |||||||
| (St. Anthony Falls Project) 5.75% 2/1/27 | 1,000,000 | 1,005,880 | |||||
| Minnesota 911 Revenue | |||||||
| (Public Safety Radio Commission System Project) | |||||||
| 5.00% 6/1/24 | 2,925,000 | 3,441,643 | |||||
| 5.00% 6/1/25 | 2,000,000 | 2,340,260 | |||||
| Puerto Rico Sales Tax Financing Corporation Sales Tax | |||||||
| Revenue First Subordinated Series A | |||||||
| 5.50% 8/1/42 | 2,500,000 | 2,702,700 | |||||
| 5.75% 8/1/37 | 4,760,000 | 5,315,158 | |||||
| 23,292,129 | |||||||
| State General Obligation Bonds – 5.91% | |||||||
| Minnesota State | |||||||
| Series A | |||||||
| 5.00% 10/1/24 | 8,750,000 | 10,926,037 | |||||
| 5.00% 10/1/27 | 5,280,000 | 6,495,034 | |||||
| (State Trunk Highway) Series B 5.00% 10/1/29 | 5,000,000 | 6,098,550 | |||||
| (Various Purposes) Series A 4.00% 8/1/27 | 3,250,000 | 3,681,568 | |||||
| Puerto Rico Commonwealth Public Improvement Refunding | |||||||
| Series C 6.00% 7/1/39 | 2,800,000 | 3,067,792 | |||||
| Series D 5.75% 7/1/41 | 6,000,000 | 6,417,180 | |||||
| 36,686,161 | |||||||
| Transportation Revenue Bonds – 1.60% | |||||||
| Minneapolis - St. Paul Metropolitan Airports Commission | |||||||
| Revenue Series A 5.00% 1/1/28 | 1,250,000 | 1,428,900 | |||||
| St. Paul Housing & Redevelopment Authority Parking | |||||||
| Revenue Refunding (Parking Facilities Project) Series A | |||||||
| 5.00% 8/1/30 | 1,870,000 | 2,084,844 | |||||
| 5.00% 8/1/35 | 1,145,000 | 1,214,696 | |||||
| (Smith Avenue Project) Series B 5.00% 8/1/35 | 1,500,000 | 1,648,350 | |||||
28
| Principal amount | Value | ||||||||
| Municipal Bonds (continued) | |||||||||
| Transportation Revenue Bonds (continued) | |||||||||
| St. Paul Port Authority Revenue Refunding | |||||||||
| (Amherst H Wilder Foundation) Series 3 | |||||||||
| 5.00% 12/1/36 | $ | 3,200,000 | $ | 3,556,960 | |||||
| 9,933,750 | |||||||||
| Water & Sewer Revenue Bonds – 1.09% | |||||||||
| Metropolitan Council Waste Water Revenue Series B | |||||||||
| 4.00% 9/1/27 | 2,400,000 | 2,682,552 | |||||||
| 5.00% 9/1/25 | 3,245,000 | 4,108,235 | |||||||
| 6,790,787 | |||||||||
| Total Municipal Bonds (cost $567,355,032) | 619,070,442 | ||||||||
| Short-Term Investments – 0.32% | |||||||||
| ¤Variable Rate Demand Notes – 0.32% | |||||||||
| Brooklyn Center Revenue Refunding | |||||||||
| (Brookdale Corporation II Project) | |||||||||
| 0.21% 12/1/14 (LOC-US Bank N.A.) | 100,000 | 100,000 | |||||||
| Center City Health Care Facilities Revenue | |||||||||
| (Hazelden Foundation Project) | |||||||||
| 0.21% 11/1/35 (LOC-US Bank N.A.) | 400,000 | 400,000 | |||||||
| Minneapolis & St. Paul Housing & Redevelopment | |||||||||
| Authority (Allina Health System) | |||||||||
| Series B-1 0.18% 11/15/35 | |||||||||
| (LOC–JPMorgan Chase Bank N.A.) | 500,000 | 500,000 | |||||||
| St. Paul Housing & Redevelopment Authority Revenue | |||||||||
| (Minnesota Public Radio Project) | |||||||||
| 0.20% 5/1/22 (LOC–JPMorgan Chase Bank N.A.) | 700,000 | 700,000 | |||||||
| St. Paul Port Authority Revenue | |||||||||
| (Minnesota Public Radio Project) | |||||||||
| Series 7 0.20% 5/1/25 | |||||||||
| (LOC–JPMorgan Chase Bank N.A.) | 265,000 | 265,000 | |||||||
| Total Short-Term Investments (cost $1,965,000) | 1,965,000 | ||||||||
29
Statements of net assets
Delaware Tax-Free Minnesota Fund
| Total Value of Securities – 100.08% | ||||
| (cost $569,320,032) | $ | 621,035,442 | ||
| Liabilities Net of Receivables and | ||||
| Other Assets – (0.08%) | (491,558 | ) | ||
| Net Assets Applicable to 47,626,266 | ||||
| Shares Outstanding – 100.00% | $ | 620,543,884 | ||
| Net Asset Value – Delaware Tax-Free Minnesota Fund | ||||
| Class A ($577,061,150 / 44,298,485 Shares) | $13.03 | |||
| Net Asset Value – Delaware Tax-Free Minnesota Fund | ||||
| Class B ($2,114,438 / 162,192 Shares) | $13.04 | |||
| Net Asset Value – Delaware Tax-Free Minnesota Fund | ||||
| Class C ($41,368,296 / 3,165,589 Shares) | $13.07 | |||
| Components of Net Assets at August 31, 2012: | ||||
| Shares of beneficial interest (unlimited authorization – no par) | $ | 565,231,623 | ||
| Distributions in excess of net investment income | (150,996 | ) | ||
| Accumulated net realized gain on investments | 3,747,847 | |||
| Net unrealized appreciation of investments | 51,715,410 | |||
| Total net assets | $ | 620,543,884 | ||
| ^ | Zero coupon security. The rate shown is the yield at the time of purchase. |
| • | Variable rate security. The rate shown is the rate as of August 31, 2012. Interest rates reset periodically. |
| § | Pre-refunded bonds. Municipal bonds that are generally backed or secured by U.S. Treasury bonds. For pre-refunded bonds, the stated maturity is followed by the year in which the bond is pre-refunded. See Note 9 in “Notes to financial statements.” |
| ¤ | Tax-exempt obligations that contain a floating or variable interest rate adjustment formula and an unconditional right of demand to receive payment of the unpaid principal balance plus accrued interest upon a short notice period (generally up to 30 days) prior to specified dates either from the issuer or by drawing on a bank letter of credit, a guarantee or insurance issued with respect to such instrument. The rate shown is the rate as of August 31, 2012. |
30
| Net Asset Value and Offering Price Per Share – | ||
| Delaware Tax-Free Minnesota Fund | ||
| Net asset value Class A (A) | $ | 13.03 |
| Sales charge (4.50% of offering price) (B) | 0.61 | |
| Offering price | $ | 13.64 |
| (A) | Net asset value per share, as illustrated, is the amount which would be paid upon redemption or repurchase of shares. |
| (B) | See the current prospectus for purchases of $100,000 or more. |
Summary of abbreviations:
AGM — Insured by Assured Guaranty Municipal Corporation
AMBAC — Insured by AMBAC Assurance Corporation
AMT — Subject to Alternative Minimum Tax
ASSURED GTY — Insured by Assured Guaranty Corporation
FHA — Federal Housing Administration
FHLMC — Federal Home Loan Mortgage Corporation Collateral
FNMA — Federal National Mortgage Association Collateral
GNMA — Government National Mortgage Association Collateral
HUD — Housing and Urban Development Section 8
IBC — Insured Bond Certificate
LOC — Letter of Credit
NATL-RE — Insured by National Public Finance Guarantee Corporation
TCRS — Temporary Custodial Receipts
VA — Veterans Administration Collateral
See accompanying notes, which are an integral part of the financial statements.
31
| Statements of net assets Delaware Tax-Free Minnesota Intermediate Fund | August 31, 2012 |
| Principal amount | Value | ||||||
| Municipal Bonds – 100.12% | |||||||
| Corporate-Backed Revenue Bonds – 6.72% | |||||||
| Cloquet Pollution Control Revenue Refunding | |||||||
| (Potlatch Project) 5.90% 10/1/26 | $ | 1,695,000 | $ | 1,699,712 | |||
| Laurentian Energy Authority I Cogeneration Revenue | |||||||
| Series A 5.00% 12/1/21 | 750,000 | 786,120 | |||||
| Minneapolis Community Planning & Economic | |||||||
| Development Agency (Limited Tax Common Bond Fund) | |||||||
| Series 4 6.20% 6/1/17 (AMT) | 610,000 | 615,527 | |||||
| Minnesota Tobacco Securitization Authority | |||||||
| (Tobacco Settlement Revenue) Refunding | |||||||
| Series B 5.25% 3/1/31 | 4,000,000 | 4,521,920 | |||||
| 7,623,279 | |||||||
| Education Revenue Bonds – 13.37% | |||||||
| Minnesota Colleges & Universities Revenue Fund Series A | |||||||
| 4.00% 10/1/18 | 1,000,000 | 1,164,420 | |||||
| 5.00% 10/1/28 | 1,000,000 | 1,143,590 | |||||
| Refunding 4.00% 10/1/18 | 1,190,000 | 1,385,660 | |||||
| Minnesota Higher Education Facilities Authority Revenue | |||||||
| (Carleton College) Series 6-T 4.75% 1/1/23 | 1,000,000 | 1,134,370 | |||||
| (Hamline University) Series 7-E 5.00% 10/1/29 | 250,000 | 273,525 | |||||
| (Macalester College) Series 6-P 4.25% 3/1/27 | 750,000 | 803,648 | |||||
| (St. Catherine University) Series 7-Q 5.00% 10/1/22 | 425,000 | 497,590 | |||||
| (St. Johns University) Series 6-U | |||||||
| 4.40% 10/1/21 | 325,000 | 367,673 | |||||
| 4.50% 10/1/23 | 265,000 | 296,686 | |||||
| (State Scholastic College) Series H 5.125% 12/1/30 | 1,000,000 | 1,092,160 | |||||
| (University of St. Thomas) | |||||||
| Series 5-Y 5.25% 10/1/19 | 1,590,000 | 1,706,626 | |||||
| Series 6-X 5.00% 4/1/24 | 1,000,000 | 1,110,120 | |||||
| University of Minnesota Series A | |||||||
| 5.00% 12/1/23 | 1,000,000 | 1,229,730 | |||||
| 5.00% 12/1/26 | 1,000,000 | 1,237,500 | |||||
| University of Minnesota Special Purpose Revenue | |||||||
| (State Supported Stadium Debt) | |||||||
| 5.00% 8/1/18 | 1,500,000 | 1,716,749 | |||||
| 15,160,047 | |||||||
32
| Principal amount | Value | ||||||
| Municipal Bonds (continued) | |||||||
| Electric Revenue Bonds – 8.91% | |||||||
| Central Minnesota Municipal Power Agency | |||||||
| (Brookings Twin Cities Transmission Project) Series E | |||||||
| 5.00% 1/1/21 | $ | 1,095,000 | $ | 1,305,645 | |||
| 5.00% 1/1/23 | 1,000,000 | 1,194,520 | |||||
| 5.00% 1/1/24 | 500,000 | 591,810 | |||||
| Chaska Electric Revenue Refunding | |||||||
| (Generating Facilities) Series A 5.25% 10/1/25 | 1,000,000 | 1,079,090 | |||||
| Hutchinson Public Utility Commission Revenue Series A | |||||||
| 5.00% 12/1/19 | 500,000 | 605,480 | |||||
| Minnesota Municipal Power Agency Electric Revenue | |||||||
| 5.25% 10/1/21 | 1,000,000 | 1,094,750 | |||||
| Northern Municipal Power Agency Electric | |||||||
| System Revenue | |||||||
| 5.00% 1/1/17 (ASSURED GTY) | 1,000,000 | 1,168,970 | |||||
| Series A 5.00% 1/1/15 (ASSURED GTY) | 1,000,000 | 1,099,950 | |||||
| Series A 5.00% 1/1/16 (ASSURED GTY) | 700,000 | 797,125 | |||||
| Southern Minnesota Municipal Power Agency | |||||||
| System Revenue Series A | |||||||
| 5.25% 1/1/16 (AMBAC) | 500,000 | 574,555 | |||||
| Western Minnesota Municipal Power Agency Refunding | |||||||
| Series A 4.00% 1/1/29 | 540,000 | 591,430 | |||||
| 10,103,325 | |||||||
| Healthcare Revenue Bonds – 28.70% | |||||||
| Anoka Housing Facilities Revenue | |||||||
| (Senior Homestead Anoka Project) | |||||||
| Series B 6.875% 11/1/34 | 750,000 | 811,523 | |||||
| Fergus Falls Health Care Facilities Revenue | |||||||
| (Lake Region Health Care) 4.75% 8/1/25 | 500,000 | 522,360 | |||||
| Minneapolis Health Care System Revenue | |||||||
| (Fairview Health Services) | |||||||
| Series A 6.625% 11/15/28 | 1,500,000 | 1,797,720 | |||||
| Series B 6.50% 11/15/38 (ASSURED GTY) | 1,000,000 | 1,195,840 | |||||
| Minneapolis National Marrow Donor Program Revenue | |||||||
| 5.00% 8/1/17 | 1,205,000 | 1,334,586 | |||||
33
Statements of net assets
Delaware Tax-Free Minnesota Intermediate Fund
| Principal amount | Value | |||||||
| Municipal Bonds (continued) | ||||||||
| Healthcare Revenue Bonds (continued) | ||||||||
| Minneapolis-St. Paul Housing & Redevelopment | ||||||||
| Authority Health Care Revenue | ||||||||
| (Children’s Hospital) Series A 5.25% 8/15/25 | $ | 1,000,000 | $ | 1,166,180 | ||||
| (Health Partners Obligation Group Project) | ||||||||
| 6.00% 12/1/17 | 850,000 | 890,860 | ||||||
| Minnesota Agricultural & Economic Development Board | ||||||||
| Health Care Revenue (Essentia Remarketing) | ||||||||
| Series A 4.75% 2/15/15 | 1,000,000 | 1,026,860 | ||||||
| Series C-1 5.50% 2/15/25 (ASSURED GTY) | 2,500,000 | 2,953,350 | ||||||
| Moorhead Economic Development Authority | ||||||||
| Multifamily Housing Revenue Refunding | ||||||||
| (Eventide Lutheran Home Project) 4.70% 6/1/18 | 475,000 | 477,807 | ||||||
| Puerto Rico Industrial Tourist Educational Medical & | ||||||||
| Environmental Control Facilities Financing Authority | ||||||||
| (Auxilio Mutuo) Refunding Series A | ||||||||
| 6.00% 7/1/33 | 890,000 | 1,014,556 | ||||||
| Rochester Health Care & Housing Revenue | ||||||||
| (Samaritan Bethany) Refunding | ||||||||
| Series A 6.875% 12/1/29 | 950,000 | 1,061,891 | ||||||
| Rochester Health Care Facilities Revenue | ||||||||
| • | (Mayo Clinic) Series A 4.00% 11/15/30 | 1,000,000 | 1,155,550 | |||||
| • | (Mayo Clinic) Series C 4.50% 11/15/38 | 3,000,000 | 3,643,949 | |||||
| (Olmsted Medical Center) 5.125% 7/1/20 | 1,000,000 | 1,094,660 | ||||||
| Sartell Health Care Revenue | ||||||||
| (Country Manor Campus Project) Series A | ||||||||
| 5.00% 9/1/21 | 1,050,000 | 1,095,612 | ||||||
| 6.125% 9/1/30 | 845,000 | 897,559 | ||||||
| St. Cloud Health Care Revenue | ||||||||
| (Centracare Health System Project) | ||||||||
| Series A 5.00% 5/1/16 | 500,000 | 566,505 | ||||||
| St. Louis Park Health Care Facilities Revenue Refunding | ||||||||
| (Park Nicollet Health Services) | ||||||||
| 5.50% 7/1/29 | 1,000,000 | 1,115,100 | ||||||
| Series C 5.625% 7/1/26 | 2,500,000 | 2,789,850 | ||||||
| St. Paul Housing & Redevelopment Authority | ||||||||
| Health Care Revenue (Allina Health System) | ||||||||
| Series A-2 5.25% 11/15/28 | 2,000,000 | 2,236,620 | ||||||
34
| Principal amount | Value | ||||||
| Municipal Bonds (continued) | |||||||
| Healthcare Revenue Bonds (continued) | |||||||
| St. Paul Housing & Redevelopment Authority | |||||||
| Housing & Health Care Facilities Revenue | |||||||
| (Gillette Children’s Specialty Project) | |||||||
| 5.00% 2/1/20 | $ | 500,000 | $ | 515,985 | |||
| 5.00% 2/1/27 | 1,000,000 | 1,074,450 | |||||
| (Senior Carondelet Village Project) | |||||||
| Series A 6.25% 8/1/30 | 1,000,000 | 1,081,180 | |||||
| Wayzata Senior Housing Revenue | |||||||
| (Folkestone Senior Living Community) | |||||||
| Series B 4.875% 5/1/19 | 1,000,000 | 1,011,550 | |||||
| 32,532,103 | |||||||
| Housing Revenue Bonds – 1.51% | |||||||
| Minneapolis Multifamily Housing Revenue Refunding | |||||||
| (Trinity Apartments) Series A | |||||||
| 6.75% 5/1/21 (HUD) | 1,375,000 | 1,376,883 | |||||
| Minnesota Housing Finance Agency Residential Housing | |||||||
| Series I 5.10% 7/1/20 (AMT) | 330,000 | 330,535 | |||||
| 1,707,418 | |||||||
| Lease Revenue Bonds – 2.95% | |||||||
| Puerto Rico Public Finance (Commonwealth Appropriate) | |||||||
| Series B 6.00% 8/1/25 | 1,125,000 | 1,296,135 | |||||
| St. Paul Housing & Redevelopment Authority Refunding | |||||||
| (Minnesota Public Radio) | |||||||
| 5.00% 12/1/25 | 1,000,000 | 1,138,500 | |||||
| Virginia Housing & Redevelopment Authority | |||||||
| Health Care Facility Lease Revenue | |||||||
| 5.25% 10/1/25 | 880,000 | 913,343 | |||||
| 3,347,978 | |||||||
| Local General Obligation Bonds – 18.58% | |||||||
| Anoka County Capital Improvements | |||||||
| Series C 5.00% 2/1/27 | 500,000 | 587,435 | |||||
| Anoka-Hennepin Independent School District #11 | |||||||
| (School Building) Refunding 5.00% 2/1/17 | 1,000,000 | 1,181,560 | |||||
| Brainerd Independent School District #181 Refunding | |||||||
| (School Building) Series A 4.00% 2/1/22 | 2,500,000 | 2,780,400 | |||||
| Duluth Independent School District #709 | |||||||
| Series A 4.25% 2/1/20 (AGM) | 1,710,000 | 1,946,305 | |||||
35
Statements of net assets
Delaware Tax-Free Minnesota Intermediate Fund
| Principal amount | Value | ||||||
| Municipal Bonds (continued) | |||||||
| Local General Obligation Bonds (continued) | |||||||
| Hennepin County Series B 4.00% 12/1/20 | $ | 500,000 | $ | 597,805 | |||
| Mankato Independent School District #77 | |||||||
| (School Building) Series A 4.125% 2/1/22 | 1,000,000 | 1,126,650 | |||||
| Metropolitan Council Minneapolis-St. Paul Metropolitan | |||||||
| Area Waste Water Treatment Series C | |||||||
| 5.00% 3/1/16 | 560,000 | 648,211 | |||||
| 5.00% 3/1/28 | 1,000,000 | 1,115,530 | |||||
| Minneapolis Various Purposes 4.00% 12/1/23 | 1,500,000 | 1,626,135 | |||||
| Olmsted County Refunding Series A 4.00% 2/1/24 | 2,000,000 | 2,319,600 | |||||
| Robbinsdale Independent School District #281 | |||||||
| Series A 5.00% 2/1/20 | 1,850,000 | 2,351,332 | |||||
| South Washington County Independent School District #833 | |||||||
| (School Building) Series A 4.00% 2/1/22 | 750,000 | 824,970 | |||||
| St. Paul Independent School District #625 | |||||||
| (School Building) Series A 4.00% 2/1/15 | 1,020,000 | 1,105,853 | |||||
| Thief River Falls Independent School District #564 | |||||||
| 4.00% 2/1/30 | 500,000 | 557,020 | |||||
| White Bear Lake Independent School District #624 | |||||||
| (Alternative Facilities) Series B | |||||||
| 4.75% 2/1/22 | 1,000,000 | 1,159,920 | |||||
| Willmar City (Rice Memorial Hospital Project) | |||||||
| Refunding Series A | |||||||
| 5.00% 2/1/23 | 500,000 | 610,845 | |||||
| 5.00% 2/1/27 | 440,000 | 524,638 | |||||
| 21,064,209 | |||||||
| §Pre-Refunded/Escrowed to Maturity Bonds – 3.93% | |||||||
| Minnesota Public Facilities Authority Water Pollution | |||||||
| Control Revenue Refunding | |||||||
| Series C 5.00% 3/1/18-15 | 1,000,000 | 1,116,310 | |||||
| Puerto Rico Sales Tax Financing Corporation Sales Tax | |||||||
| Revenue Series A 6.125% 8/1/29-14 | 5,000 | 5,418 | |||||
| St. Louis Park Health Care Facilities Revenue | |||||||
| (Park Nicollet Health Services) Series B 5.50% 7/1/25-14 | 1,500,000 | 1,640,310 | |||||
| University of Minnesota Series A | |||||||
| 5.75% 7/1/16 | 1,000,000 | 1,187,530 | |||||
| 5.75% 7/1/18 | 400,000 | 502,104 | |||||
| 4,451,672 | |||||||
36
| Principal amount | Value | ||||||||
| Municipal Bonds (continued) | |||||||||
| Special Tax Revenue Bonds – 4.08% | |||||||||
| @Minneapolis Tax Increment Revenue | |||||||||
| (Ivy Tower Project) 5.50% 2/1/22 | $ | 415,000 | $ | 396,765 | |||||
| Minnesota 911 Revenue | |||||||||
| (Public Safety Radio Communication System Project) | |||||||||
| 4.00% 6/1/14 (ASSURED GTY) | 1,370,000 | 1,457,652 | |||||||
| 4.25% 6/1/18 (ASSURED GTY) | 1,170,000 | 1,376,002 | |||||||
| 4.50% 6/1/25 (ASSURED GTY) | 1,000,000 | 1,132,310 | |||||||
| Puerto Rico Sales Tax Financing Corporation | |||||||||
| Sales Tax Revenue First Subordinate | |||||||||
| Un-refunded Series A 6.125% 8/1/29 | 245,000 | 261,114 | |||||||
| 4,623,843 | |||||||||
| State General Obligation Bonds – 5.20% | |||||||||
| Minnesota State | |||||||||
| Refunding 5.00% 8/1/15 | 2,000,000 | 2,267,560 | |||||||
| State Trunk Highway Series B 5.00% 10/1/22 | 400,000 | 507,004 | |||||||
| Minnesota State Refunding (Various Purposes) | |||||||||
| Series A 5.00% 12/1/21 | 1,000,000 | 1,246,180 | |||||||
| Series D 4.00% 8/1/17 | 645,000 | 748,677 | |||||||
| Puerto Rico Commonwealth Public Improvement | |||||||||
| Series A 5.50% 7/1/19 (NATL-RE) (IBC) | 1,000,000 | 1,120,630 | |||||||
| 5,890,051 | |||||||||
| Transportation Revenue Bonds – 3.70% | |||||||||
| Minneapolis - St. Paul Metropolitan Airports Commission | |||||||||
| Revenue Refunding Senior Series A | |||||||||
| 5.00% 1/1/13 (AMT) | 500,000 | 508,035 | |||||||
| 5.00% 1/1/22 (AMBAC) | 1,260,000 | 1,417,513 | |||||||
| Senior Series B 5.00% 1/1/22 (AMT) | 1,000,000 | 1,133,970 | |||||||
| Subordinate Series D 5.00% 1/1/22 (AMT) | 1,000,000 | 1,138,150 | |||||||
| 4,197,668 | |||||||||
| Water & Sewer Revenue Bonds – 2.47% | |||||||||
| Minnesota Public Facilities Authority | |||||||||
| Series A 5.00% 3/1/22 | 1,000,000 | 1,286,540 | |||||||
| St. Paul Sewer Revenue Series D 5.00% 12/1/20 | 1,275,000 | 1,517,225 | |||||||
| 2,803,765 | |||||||||
| Total Municipal Bonds (cost $105,255,114) | 113,505,358 | ||||||||
37
Statements of net assets
Delaware Tax-Free Minnesota Intermediate Fund
| Total Value of Securities – 100.12% | ||||
| (cost $105,255,114) | $ | 113,505,358 | ||
| Liabilities Net of Receivables | ||||
| and Other Assets – (0.12%) | (136,255 | ) | ||
| Net Assets Applicable to 9,826,217 | ||||
| Shares Outstanding – 100.00% | $ | 113,369,103 | ||
| Net Asset Value – Delaware Tax-Free Minnesota Intermediate Fund | ||||
| Class A ($97,032,239 / 8,412,750 Shares) | $ | 11.53 | ||
| Net Asset Value – Delaware Tax-Free Minnesota Intermediate Fund | ||||
| Class B ($126,636 / 10,947 Shares) | $ | 11.57 | ||
| Net Asset Value – Delaware Tax-Free Minnesota Intermediate Fund | ||||
| Class C ($16,210,228 / 1,402,520 Shares) | $ | 11.56 | ||
| Components of Net Assets at August 31, 2012: | ||||
| Shares of beneficial interest (unlimited authorization – no par) | $ | 105,093,096 | ||
| Undistributed net investment income | 2,522 | |||
| Accumulated net realized gain on investments | 23,241 | |||
| Net unrealized appreciation of investments | 8,250,244 | |||
| Total net assets | $ | 113,369,103 |
• | Variable rate security. The rate shown is the rate as of August 31, 2012. Interest rates reset periodically. |
§ | Pre-refunded bonds. Municipal bonds that are generally backed or secured by U.S. Treasury bonds. For pre-refunded bonds, the stated maturity is followed by the year in which the bond is pre-refunded. See Note 9 in “Notes to financial statements.” |
@ | Illiquid security. At August 31, 2012, the aggregate value of illiquid securities was $396,765, which represented 0.35% of the Fund’s net assets. See Note 9 in “Notes to financial statements.” |
38
| Net Asset Value and Offering Price Per Share – | |||
| Delaware Tax-Free Minnesota Intermediate Fund | |||
| Net asset value Class A (A) | $ | 11.53 | |
| Sales charge (2.75% of offering price) (B) | 0.33 | ||
| Offering price | $ | 11.86 | |
| (A) | Net asset value per share, as illustrated, is the amount which would be paid upon redemption or repurchase of shares. | |
| (B) | See the current prospectus for purchases of $100,000 or more. |
Summary of abbreviations:
AGM — Insured by Assured Guaranty Municipal Corporation
AMBAC — Insured by AMBAC Assurance Corporation
AMT — Subject to Alternative Minimum Tax
ASSURED GTY — Insured by Assured Guaranty Corporation
HUD — Housing and Urban Development Section 8
IBC — Insured Bond Certificate
NATL-RE — Insured by National Public Finance Guarantee Corporation
See accompanying notes, which are an integral part of the financial statements.
39
| Delaware Minnesota High-Yield Municipal Bond Fund | August 31, 2012 |
| Principal amount | Value | |||||
| Municipal Bonds – 99.47% | ||||||
| Corporate-Backed Revenue Bonds – 6.78% | ||||||
| Cloquet Pollution Control Revenue Refunding | ||||||
| (Potlatch Project) 5.90% 10/1/26 | $ | 2,700,000 | $ | 2,707,506 | ||
| Laurentian Energy Authority I Cogeneration Revenue | ||||||
| Series A 5.00% 12/1/21 | 1,750,000 | 1,834,280 | ||||
| Minnesota Tobacco Securitization Authority | ||||||
| (Tobacco Settlement Revenue) Refunding | ||||||
| Series B 5.25% 3/1/31 | 4,000,000 | 4,521,920 | ||||
| Sartell Environmental Improvement Revenue Refunding | ||||||
| (International Paper) Series A | ||||||
| 5.20% 6/1/27 | 1,750,000 | 1,782,585 | ||||
| 10,846,291 | ||||||
| Education Revenue Bonds – 10.00% | ||||||
| Baytown Township Lease Revenue | ||||||
| (St. Croix Preparatory Academy) Series A 7.00% 8/1/38 | 500,000 | 533,610 | ||||
| Duluth Housing & Redevelopment Authority | ||||||
| (Public School Academy) | ||||||
| Series A 5.875% 11/1/40 | 1,000,000 | 1,034,950 | ||||
| Minnesota Higher Education Facilities Authority Revenue | ||||||
| (Augsburg College) | ||||||
| Series 6-C 5.00% 5/1/23 | 700,000 | 717,220 | ||||
| Series 6-J1 5.00% 5/1/36 | 1,000,000 | 1,017,780 | ||||
| (Bethel University) Series 6-R 5.50% 5/1/37 | 1,500,000 | 1,567,545 | ||||
| (Macalester College) Series 6-P 4.25% 3/1/32 | 1,000,000 | 1,042,190 | ||||
| (St. Catherine University) Series 7-Q | ||||||
| 5.00% 10/1/25 | 325,000 | 373,497 | ||||
| 5.00% 10/1/26 | 280,000 | 320,410 | ||||
| (St. John’s University) Series 6-U 4.75% 10/1/33 | 825,000 | 902,558 | ||||
| (St. Olaf) Series 6-O | ||||||
| 4.50% 10/1/32 | 1,000,000 | 1,041,390 | ||||
| 5.00% 10/1/22 | 1,000,000 | 1,107,030 | ||||
| (State Scholastic College) Series H 5.125% 12/1/40 | 750,000 | 807,248 | ||||
| (University of St. Thomas) | ||||||
| Series 6-I 5.00% 4/1/23 | 1,500,000 | 1,637,324 | ||||
| Series 7-A 5.00% 10/1/39 | 1,000,000 | 1,118,290 | ||||
| St. Paul Housing & Redevelopment Authority Charter | ||||||
| School Lease Revenue (Nova Classical Academy) | ||||||
| Series A 6.625% 9/1/42 | 1,500,000 | 1,632,075 | ||||
| University of Minnesota Series A 5.125% 4/1/34 | 1,000,000 | 1,148,460 | ||||
| 16,001,577 | ||||||
40
| Principal amount | Value | |||||
| Municipal Bonds (continued) | ||||||
| Electric Revenue Bonds – 6.48% | ||||||
| Chaska Electric Revenue Refunding | ||||||
| (Generating Facilities) Series A 5.25% 10/1/25 | $ | 1,000,000 | $ | 1,079,090 | ||
| Hutchinson Utilities Commission Series A | ||||||
| 5.00% 12/1/22 | 490,000 | 602,235 | ||||
| 5.00% 12/1/26 | 360,000 | 431,446 | ||||
| Minnesota Municipal Power Agency Electric Revenue | ||||||
| Series A 5.00% 10/1/34 | 2,750,000 | 2,947,367 | ||||
| Northern Municipal Power Agency Electric System Revenue | ||||||
| Series A 5.00% 1/1/18 (ASSURED GTY) | 1,000,000 | 1,193,160 | ||||
| Puerto Rico Electric Power Authority Revenue | ||||||
| Series XX 5.25% 7/1/40 | 1,665,000 | 1,732,616 | ||||
| Southern Minnesota Municipal Power Agency Supply | ||||||
| System Revenue Series A 5.25% 1/1/16 (AMBAC) | 500,000 | 574,555 | ||||
| Western Minnesota Municipal Power Agency Refunding | ||||||
| Series A 5.00% 1/1/29 | 1,500,000 | 1,816,004 | ||||
| 10,376,473 | ||||||
| Healthcare Revenue Bonds – 38.40% | ||||||
| Aitkin Health Care Facilities Revenue Refunding | ||||||
| (Riverwood Health Care Center) 5.50% 2/1/24 | 700,000 | 728,658 | ||||
| Anoka Health Care Facility Revenue | ||||||
| (Homestead Anoka Project) Series A 7.00% 11/1/46 | 1,650,000 | 1,760,946 | ||||
| Anoka Housing & Redevelopment Authority Revenue | ||||||
| (Fridley Medical Center Project) | ||||||
| Series A 6.875% 5/1/40 | 1,000,000 | 1,098,080 | ||||
| Apple Valley Economic Development Authority Health | ||||||
| Care Revenue (Augustanna Home St. Paul Project) | ||||||
| Series A 5.80% 1/1/30 | 1,000,000 | 1,031,320 | ||||
| Breckenridge Catholic Health Initiatives | ||||||
| Series A 5.00% 5/1/30 | 2,000,000 | 2,109,820 | ||||
| Detroit Lakes Housing & Health Facilities Revenue | ||||||
| Refunding (Mankato Lutheran Homes) | ||||||
| Series D 5.50% 8/1/21 | 500,000 | 500,450 | ||||
| Glencoe Health Care Facilities Revenue | ||||||
| (Glencoe Regional Health Services Project) | ||||||
| 5.00% 4/1/20 | 1,100,000 | 1,121,989 | ||||
| 5.00% 4/1/31 | 1,965,000 | 1,992,667 | ||||
41
Statements of net assets
Delaware Minnesota High-Yield Municipal Bond Fund
| Principal amount | Value | |||||
| Municipal Bonds (continued) | ||||||
| Healthcare Revenue Bonds (continued) | ||||||
| Mahtomedi Senior Housing Revenue Refunding | ||||||
| (St. Andrews Village Project) 5.75% 12/1/40 | $ | 1,000,000 | $ | 1,019,450 | ||
| Maple Grove Health Care System Revenue | ||||||
| (Maple Grove Hospital) | ||||||
| 5.25% 5/1/28 | 2,200,000 | 2,321,154 | ||||
| 5.25% 5/1/37 | 1,000,000 | 1,046,820 | ||||
| Minneapolis Health Care System Revenue | ||||||
| (Fairview Health Services) | ||||||
| Series A 6.625% 11/15/28 | 1,900,000 | 2,277,112 | ||||
| Series B 6.50% 11/15/38 (ASSURED GTY) | 250,000 | 298,960 | ||||
| Series D 5.00% 11/15/34 (AMBAC) | 3,000,000 | 3,104,310 | ||||
| Minneapolis-St. Paul Housing & Redevelopment Authority | ||||||
| (Health Partners Obligation Group Project) | ||||||
| 6.00% 12/1/17 | 525,000 | 550,237 | ||||
| Minnesota Agricultural & Economic Development | ||||||
| Board Revenue (Benedictine Health Systems) | ||||||
| 5.75% 2/1/29 | 1,000,000 | 1,000,440 | ||||
| Moorhead Economic Development Authority | ||||||
| Multifamily Housing Revenue Refunding | ||||||
| (Eventide Luthern Home Project) Series A 5.15% 6/1/29 | 550,000 | 550,127 | ||||
| Northfield Hospital Skilled Nursing Revenue | ||||||
| 5.375% 11/1/31 | 1,000,000 | 1,046,180 | ||||
| Oak Park Heights Housing Revenue | ||||||
| (Oakgreen Commons Project) 7.00% 8/1/45 | 1,500,000 | 1,627,725 | ||||
| Owatonna Senior Housing Revenue | ||||||
| (Senior Living Project) Series A | ||||||
| 5.80% 10/1/29 | 400,000 | 413,032 | ||||
| 6.00% 4/1/41 | 1,250,000 | 1,283,063 | ||||
| Rochester Health Care & Housing Revenue | ||||||
| (Samaritan Bethany) Refunding Series A | ||||||
| 6.875% 12/1/29 | 1,000,000 | 1,117,780 | ||||
| 7.375% 12/1/41 | 375,000 | 423,413 | ||||
| Rochester Health Care Facilities Revenue (Mayo Clinic) | ||||||
| 4.00% 11/15/41 | 3,750,000 | 3,926,625 | ||||
| Sartell Health Care Facilities Revenue | ||||||
| (Country Manor Campus Project) Series A | ||||||
| 5.25% 9/1/22 | 1,080,000 | 1,137,532 | ||||
| 6.25% 9/1/36 | 925,000 | 988,168 | ||||
42
| Principal amount | Value | |||||
| Municipal Bonds (continued) | ||||||
| Healthcare Revenue Bonds (continued) | ||||||
| Shakopee Health Care Facilities Revenue | ||||||
| (St. Francis Regional Medical Center) 5.25% 9/1/34 | $ | 1,000,000 | $ | 1,020,620 | ||
| St. Cloud Health Care Revenue | ||||||
| (Centracare Health System Project) | ||||||
| 5.50% 5/1/39 (ASSURED GTY) | 1,500,000 | 1,666,755 | ||||
| Series A 5.125% 5/1/30 | 2,125,000 | 2,347,063 | ||||
| St. Louis Park Health Care Facilities Revenue | ||||||
| (Park Nicollet Health Services) | ||||||
| Refunding 5.75% 7/1/39 | 3,830,000 | 4,306,183 | ||||
| Series C 5.50% 7/1/23 | 1,000,000 | 1,120,890 | ||||
| St. Paul Housing & Redevelopment Authority | ||||||
| Health Care Facilities Revenue | ||||||
| (Health Partners Obligation Group Project) | ||||||
| 5.25% 5/15/36 | 1,000,000 | 1,041,010 | ||||
| (Senior Carondelet Village Project) | ||||||
| Series A 6.00% 8/1/42 | 770,000 | 817,440 | ||||
| St. Paul Housing & Redevelopment Authority Health | ||||||
| Care Revenue (Allina Health System) | ||||||
| Series A 5.00% 11/15/18 (NATL-RE) | 1,900,000 | 2,223,456 | ||||
| St. Paul Housing & Redevelopment Authority | ||||||
| Hospital Revenue (Health East Project) | ||||||
| 6.00% 11/15/25 | 1,000,000 | 1,061,400 | ||||
| 6.00% 11/15/30 | 1,000,000 | 1,056,770 | ||||
| St. Paul Housing & Redevelopment Authority Multifamily | ||||||
| Housing Revenue Refunding (Marion Center Project) | ||||||
| Series A 5.375% 5/1/43 | 1,000,000 | 973,120 | ||||
| Stillwater Health Care Revenue | ||||||
| (Health System Obligation Group) | ||||||
| 5.00% 6/1/25 | 2,000,000 | 2,070,140 | ||||
| 5.00% 6/1/35 | 1,000,000 | 1,026,920 | ||||
@ | Twin Valley Congregate Housing Revenue | |||||
| (Living Options Project) 5.95% 11/1/28 | 1,825,000 | 1,825,018 | ||||
| Washington County Housing & Redevelopment | ||||||
| Authority Healthcare & Housing Revenue | ||||||
| (Birchwood & Woodbury Projects) | ||||||
| Series A 5.625% 6/1/37 | 1,000,000 | 1,018,650 | ||||
| Wayzata Senior Housing Revenue | ||||||
| (Folkestone Senior Living Community) Series A | ||||||
| 5.50% 11/1/32 | 260,000 | 268,294 | ||||
| 5.75% 11/1/39 | 590,000 | 615,287 | ||||
| 6.00% 5/1/47 | 920,000 | 968,778 | ||||
43
Statements of net assets
Delaware Minnesota High-Yield Municipal Bond Fund
| Principal amount | Value | |||||
| Municipal Bonds (continued) | ||||||
| Healthcare Revenue Bonds (continued) | ||||||
| Winona Health Care Facilities Revenue Refunding | ||||||
| (Winona Health Obligation Group) 5.15% 7/1/31 | $ | 1,500,000 | $ | 1,570,410 | ||
| 61,474,262 | ||||||
| Housing Revenue Bonds – 9.54% | ||||||
| Chaska Multifamily Housing Revenue | ||||||
| (West Suburban Housing Partners Project) | ||||||
| 5.875% 3/1/31 (AMT) | 1,000,000 | 926,210 | ||||
| Minneapolis Multifamily Housing Revenue | ||||||
| (Grant Street Apartments Project) Refunding | ||||||
| Series A 7.25% 11/1/29 | 2,025,000 | 2,027,896 | ||||
| (Olson Townhomes Project) 6.00% 12/1/19 (AMT) | 1,090,000 | 1,090,371 | ||||
| (Trinity Apartments) Series A 6.75% 5/1/21 (HUD) | 510,000 | 510,699 | ||||
| Minneapolis-St. Paul Housing Finance Board Single | ||||||
| Family Mortgage (City Living Project) Series A-2 | ||||||
| 5.00% 12/1/38 (GNMA) (FNMA) (AMT) | 461,533 | 475,577 | ||||
| Minnesota Housing Finance Agency | ||||||
| (Rental Housing) | ||||||
| Series A 4.875% 8/1/24 (AMT) | 585,000 | 591,885 | ||||
| Series A-1 5.00% 8/1/40 (AMT) | 2,265,000 | 2,316,370 | ||||
| (Residential Housing) | ||||||
| Series G 5.00% 7/1/36 (AMT) | 855,000 | 875,913 | ||||
| Series I 4.85% 7/1/38 (AMT) | 1,030,000 | 1,055,441 | ||||
| Series L 5.10% 7/1/38 (AMT) | 1,365,000 | 1,415,601 | ||||
| Series M 4.875% 7/1/37 (AMT) | 2,455,000 | 2,511,660 | ||||
| St. Paul Housing & Redevelopment Authority | ||||||
| Multifamily Housing Revenue | ||||||
| (Shelby Grotto Housing Project) | ||||||
| 5.50% 9/20/44 (GNMA) (FHA) (AMT) | 750,000 | 760,268 | ||||
| Stillwater Multifamily Housing Revenue | ||||||
| (Orleans Homes Project) 5.50% 2/1/42 (AMT) | 750,000 | 706,313 | ||||
| 15,264,204 | ||||||
| Lease Revenue Bonds – 2.56% | ||||||
| St. Paul Port Authority Lease Revenue | ||||||
| (Robert Street Office Building Project) Series 3-11 | ||||||
| 5.00% 12/1/27 | 1,000,000 | 1,042,930 | ||||
| University of Minnesota Special Purpose Revenue | ||||||
| (State Supported Stadium Debt) | ||||||
| 5.00% 8/1/29 | 2,660,000 | 3,054,611 | ||||
| 4,097,541 | ||||||
44
| Principal amount | Value | |||||
| Municipal Bonds (continued) | ||||||
| Local General Obligation Bonds – 10.32% | ||||||
| Chaska Independent School District #112 | ||||||
| (School Building) Series A 4.50% 2/1/28 (NATL-RE) | $ | 1,000,000 | $ | 1,078,560 | ||
| Farmington Independent School District #192 | ||||||
| (School Building) Series B 5.00% 2/1/27 (AGM) | 1,000,000 | 1,087,610 | ||||
| Foley Independent School District #51 (School Building) | ||||||
| Refunding Series A 5.00% 2/1/21 | 1,105,000 | 1,249,026 | ||||
| Hopkins Independent School District #270 | ||||||
| (Alternative Facilities) 5.00% 2/1/26 (NATL-RE) | 1,055,000 | 1,146,110 | ||||
| Lakeville Independent School District #194 | ||||||
| (School Building ) Refunding | ||||||
| Series A 4.75% 2/1/22 (AGM) | 1,000,000 | 1,015,720 | ||||
| Metropolitan Council Waste Water Treatment | ||||||
| Series B 5.00% 12/1/21 | 500,000 | 544,285 | ||||
| Series C 5.00% 3/1/28 | 1,000,000 | 1,115,530 | ||||
| Minneapolis Various Purposes 4.00% 12/1/23 | 1,500,000 | 1,626,135 | ||||
| Moorhead Improvement Series B 5.00% 2/1/33 (NATL-RE) | 750,000 | 792,398 | ||||
| South Washington County Independent School District #833 | ||||||
| (School Building) Series A 4.75% 2/1/27 | 1,500,000 | 1,671,884 | ||||
| Thief River Falls Independent School District #564 | ||||||
| (School Building) Series A 4.00% 2/1/30 | 865,000 | 963,645 | ||||
| Staples United Hospital District (Todd Morrison ETC | ||||||
| Hospital-Health Care Facilities-Lakewood) | ||||||
| 5.00% 12/1/21 | 610,000 | 647,509 | ||||
| 5.125% 12/1/24 | 205,000 | 216,441 | ||||
| 5.25% 12/1/26 | 1,540,000 | 1,624,269 | ||||
| White Bear Lake Independent School District #624 | ||||||
| (Alternative Facilities) Series B 4.75% 2/1/22 | 1,500,000 | 1,739,879 | ||||
| 16,519,001 | ||||||
| §Pre-Refunded Bonds – 3.16% | ||||||
| Andover Economic Development Authority Public | ||||||
| Facilities Lease Revenue (Andover Community Center) | ||||||
| 5.20% 2/1/34-14 | 1,000,000 | 1,059,330 | ||||
| Bemidji Health Care Facilities First Mortgage Revenue | ||||||
| (North Country Health Services) | ||||||
| Refunding 5.00% 9/1/20-16 | 1,150,000 | 1,343,131 | ||||
| Minnesota State 5.00% 8/1/21-13 (AGM) | 1,250,000 | 1,304,825 | ||||
| Western Minnesota Municipal Power Agency Supply | ||||||
| Revenue Series A 5.00% 1/1/30-13 (NATL-RE) | 1,335,000 | 1,356,453 | ||||
| 5,063,739 | ||||||
45
Statements of net assets
Delaware Minnesota High-Yield Municipal Bond Fund
| Principal amount | Value | |||||
| Municipal Bonds (continued) | ||||||
| Special Tax Revenue Bonds – 8.26% | ||||||
| Hennepin County Sales Tax Revenue | ||||||
| (First Lien - Ball Park Project) Series B 5.00% 12/15/24 | $ | 1,000,000 | $ | 1,186,700 | ||
| (Second Lien - Ballpark Project) Series B | ||||||
| 5.00% 12/15/20 | 1,500,000 | 1,769,970 | ||||
| 5.00% 12/15/24 | 1,000,000 | 1,161,930 | ||||
| Minneapolis Supported Development Revenue | ||||||
| (Limited Tax-Common Bond Fund) | ||||||
| Series 2A 5.00% 6/1/28 (AMT) | 1,170,000 | 1,215,876 | ||||
| Minneapolis Tax Increment Revenue | ||||||
| @(Ivy Tower Project) 5.70% 2/1/29 | 785,000 | 713,306 | ||||
| (St. Anthony Falls Project) 5.65% 2/1/27 | 500,000 | 502,265 | ||||
| Minnesota 911 Revenue | ||||||
| (Public Safety Radio Commission System Project) | ||||||
| 5.00% 6/1/24 (ASSURED GTY) | 1,000,000 | 1,175,520 | ||||
| Puerto Rico Sales Tax Financing Corporation Sales Tax | ||||||
| Revenue First Subordinated | ||||||
| Series A 5.00% 8/1/46 | 1,750,000 | 1,888,827 | ||||
| Series C 5.75% 8/1/37 | 790,000 | 882,138 | ||||
| St. Paul Port Authority (Brownsfields Redevelopment Tax) | ||||||
| Series 2 5.00% 3/1/37 | 1,500,000 | 1,676,820 | ||||
| Virgin Islands Public Finance Authority Revenue | ||||||
| (Senior Lien-Matching Fund Loan Note) | ||||||
| Series A 5.25% 10/1/24 | 1,000,000 | 1,054,110 | ||||
| 13,227,462 | ||||||
| State General Obligation Bonds – 2.08% | ||||||
| Minnesota State Series A | ||||||
| 5.00% 10/1/24 | 1,000,000 | 1,248,690 | ||||
| 5.00% 10/1/27 | 1,000,000 | 1,230,120 | ||||
| (Various Purposes) 4.00% 8/1/27 | 750,000 | 849,593 | ||||
| 3,328,403 | ||||||
| Transportation Revenue Bonds – 1.48% | ||||||
| Minneapolis - St. Paul Metropolitan Airports Commission | ||||||
| Revenue Series A Refunding 5.00% 1/1/15 (AMT) | 1,000,000 | 1,097,740 | ||||
| Unrefunded Portion 5.00% 1/1/28 (NATL-RE) | 1,260,000 | 1,268,996 | ||||
| 2,366,736 | ||||||
46
| Principal amount | Value | ||||||
| Municipal Bonds (continued) | |||||||
| Water & Sewer Revenue Bonds – 0.41% | |||||||
| Puerto Rico Commonwealth Aqueduct & Sewer Authority | |||||||
| Revenue (Senior Lien) Series A | |||||||
| 5.25% 7/1/42 | $ | 260,000 | $ | 261,669 | |||
| 6.00% 7/1/47 | 365,000 | 399,734 | |||||
| 661,403 | |||||||
| Total Municipal Bonds (cost $149,525,137) | 159,227,092 | ||||||
| Number of shares | |||||||
| Short-Term Investments – 0.89% | |||||||
| Money Market Instrument – 0.27% | |||||||
| Minnesota Municipal Cash Trust | 429,529 | 429,529 | |||||
| 429,529 | |||||||
| Principal amount | |||||||
| ¤Variable Rate Demand Notes – 0.62% | |||||||
| Center City Health Care Facilities Revenue | |||||||
| (Hazelden Foundation Project) | |||||||
| 0.21% 11/1/35 (LOC–US Bank N.A.) | $ | 500,000 | 500,000 | ||||
| Minneapolis & St. Paul Housing & Redevelopment | |||||||
| Authority Health Care (Allina Health System) | |||||||
| Series B-1 0.18% 11/15/35 | |||||||
| (LOC-JPMorgan Chase Bank N.A.) | 500,000 | 500,000 | |||||
| 1,000,000 | |||||||
| Total Short-Term Investments (cost $1,429,529) | 1,429,529 | ||||||
| Total Value of Securities – 100.36% | |||||||
| (cost $150,954,666) | 160,656,621 | ||||||
| Liabilities Net of Receivables | |||||||
| and Other Assets – (0.36%) | (579,257 | ) | |||||
| Net Assets Applicable to 14,443,082 | |||||||
| Shares Outstanding – 100.00% | $ | 160,077,364 | |||||
47
Statements of net assets
Delaware Minnesota High-Yield Municipal Bond Fund
| Net Asset Value – Delaware Minnesota High-Yield Municipal Bond Fund | ||||
| Class A ($124,717,631 / 11,257,482 Shares) | $11.08 | |||
| Net Asset Value – Delaware Minnesota High-Yield Municipal Bond Fund | ||||
| Class B ($1,927,850 / 173,763 Shares) | $11.09 | |||
| Net Asset Value – Delaware Minnesota High-Yield Municipal Bond Fund | ||||
| Class C ($33,431,883 / 3,011,837 Shares) | $11.10 | |||
| Components of Net Assets at August 31, 2012: | ||||
| Shares of beneficial interest (unlimited authorization – no par) | $ | 153,706,617 | ||
| Accumulated net realized loss on investments | (3,331,208 | ) | ||
| Net unrealized appreciation of investments | 9,701,955 | |||
| Total net assets | $ | 160,077,364 | ||
| @ | Illiquid security. At August 31, 2012, the aggregate value of illiquid securities was $2,538,324, which represented 1.59% of the Fund’s net assets. See Note 9 “Notes to financial statements.” |
| § | Pre-refunded bonds. Municipal bonds that are generally backed or secured by U.S. Treasury bonds. For pre-refunded bonds, the stated maturity is followed by the year in which the bond is pre-refunded. See Note 9 “Notes to financial statements.” |
| ¤ | Tax-exempt obligations that contain a floating or variable interest rate adjustment formula and an unconditional right of demand to receive payment of the unpaid principal balance plus accrued interest upon a short notice period (generally up to 30 days) prior to specified dates either from the issuer or by drawing on a bank letter of credit, a guarantee or insurance issued with respect to such instrument. The rate shown is the rate as of August 31, 2012. |
| Net Asset Value and Offering Price Per Share – | ||
| Delaware Minnesota High-Yield Municipal Bond Fund | ||
| Net asset value Class A (A) | $ | 11.08 |
| Sales charge (4.50% of offering price) (B) | 0.52 | |
| Offering price | $ | 11.60 |
| (A) | Net asset value per share, as illustrated, is the amount which would be paid upon redemption or repurchase of shares. |
| (B) | See the current prospectus for purchases of $100,000 or more. |
48
| Summary of abbreviations: AGM — Insured by Assured Guaranty Municipal Corporation AMBAC — Insured by AMBAC Assurance Corporation AMT — Subject to Alternative Minimum Tax ASSURED GTY — Insured by Assured Guaranty Corporation FHA — Federal Housing Administration FNMA — Federal National Mortgage Association Collateral GNMA — Government National Mortgage Association Collateral HUD — Housing and Urban Development Section 8 LOC — Letter of Credit NATL-RE — Insured by National Public Finance Guarantee Corporation |
See accompanying notes, which are an integral part of the financial statements.
49
| Statements of operations | |||
| Year Ended August 31, 2012 | |||
| Delaware | Delaware | ||||||||||
| Delaware | Tax-Free | Minnesota | |||||||||
| Tax-Free | Minnesota | High-Yield | |||||||||
| Minnesota | Intermediate | Municipal | |||||||||
| Fund | Fund | Bond Fund | |||||||||
| Investment Income: | |||||||||||
| Interest | $ | 28,073,874 | $ | 4,283,023 | $ | 7,054,320 | |||||
| Expenses: | |||||||||||
| Management fees | 3,232,727 | 541,102 | 812,205 | ||||||||
| Distribution expenses – Class A | 1,391,877 | 233,441 | 289,777 | ||||||||
| Distribution expenses – Class B | 26,867 | 1,304 | 22,745 | ||||||||
| Distribution expenses – Class C | 369,395 | 146,455 | 293,434 | ||||||||
| Dividend disbursing and transfer agent fees | |||||||||||
| and expenses | 298,134 | 85,867 | 117,334 | ||||||||
| Accounting and administration expenses | 233,719 | 42,398 | 57,852 | ||||||||
| Legal fees | 55,925 | 10,689 | 14,026 | ||||||||
| Reports and statements to shareholders | 45,978 | 11,544 | 15,276 | ||||||||
| Registration fees | 39,672 | 22,280 | 11,006 | ||||||||
| Trustees’ fees | 28,770 | 5,219 | 7,102 | ||||||||
| Audit and tax | 23,463 | 13,483 | 14,030 | ||||||||
| Pricing fees | 15,094 | 8,962 | 11,086 | ||||||||
| Custodian fees | 12,598 | 2,525 | 3,376 | ||||||||
| Insurance fees | 10,712 | 2,431 | 2,598 | ||||||||
| Consulting fees | 5,297 | 967 | 1,322 | ||||||||
| Trustees’ expenses | 1,748 | 314 | 425 | ||||||||
| Dues and services | — | 2,048 | 1,160 | ||||||||
| 5,791,976 | 1,131,029 | 1,674,754 | |||||||||
| Less fees waived | (125,525 | ) | (3,233 | ) | (123,726 | ) | |||||
| Less waived distribution expenses – Class A | — | (93,377 | ) | — | |||||||
| Less expense paid indirectly | (240 | ) | (52 | ) | (79 | ) | |||||
| Total operating expenses | 5,666,211 | 1,034,367 | 1,550,949 | ||||||||
| Net Investment Income | 22,407,663 | 3,248,656 | 5,503,371 | ||||||||
50
| Delaware | Delaware | ||||||||
| Delaware | Tax-Free | Minnesota | |||||||
| Tax-Free | Minnesota | High-Yield | |||||||
| Minnesota | Intermediate | Municipal | |||||||
| Fund | Fund | Bond Fund | |||||||
| Net Realized and Unrealized Gain (Loss): | |||||||||
| Net realized gain (loss) on investments | $ | 3,795,510 | $ | 736,277 | $ | (37,455 | ) | ||
| Net change in unrealized appreciation | |||||||||
| (depreciation) of investments | 26,931,845 | 3,068,062 | 8,052,212 | ||||||
| Net Realized and Unrealized Gain | |||||||||
| on Investments | 30,727,355 | 3,804,339 | 8,014,757 | ||||||
| Net Increase in Net Assets Resulting | |||||||||
| from Operations | $ | 53,135,018 | $ | 7,052,995 | $ | 13,518,128 | |||
See accompanying notes, which are an integral part of the financial statements.
51
Statements of changes in net assets
Delaware Tax-Free Minnesota Fund
| Year Ended | |||||||
| 8/31/12 | 8/31/11 | ||||||
| Increase (Decrease) in Net Assets from Operations: | |||||||
| Net investment income | $ | 22,407,663 | $ | 23,219,831 | |||
| Net realized gain | 3,795,510 | 5,727,375 | |||||
| Net change in unrealized appreciation (depreciation) | 26,931,845 | (17,549,949 | ) | ||||
| Net increase in net assets resulting from operations | 53,135,018 | 11,397,257 | |||||
| Dividends and Distributions to Shareholders from: | |||||||
| Net investment income: | |||||||
| Class A | (21,261,629 | ) | (21,934,140 | ) | |||
| Class B | (83,053 | ) | (166,719 | ) | |||
| Class C | (1,131,487 | ) | (1,159,231 | ) | |||
| Net realized gain: | |||||||
| Class A | (4,685,181 | ) | (2,377,491 | ) | |||
| Class B | (27,936 | ) | (25,548 | ) | |||
| Class C | (298,043 | ) | (157,451 | ) | |||
| (27,487,329 | ) | (25,820,580 | ) | ||||
| Capital Share Transactions: | |||||||
| Proceeds from shares sold: | |||||||
| Class A | 39,518,270 | 33,925,958 | |||||
| Class B | 550 | 114 | |||||
| Class C | 8,153,603 | 4,786,945 | |||||
| Net asset value of shares issued upon reinvestment | |||||||
| of dividends and distributions: | |||||||
| Class A | 19,125,817 | 16,441,608 | |||||
| Class B | 84,436 | 130,489 | |||||
| Class C | 1,250,679 | 1,079,596 | |||||
| 68,133,355 | 56,364,710 | ||||||
52
| Year Ended | |||||||
| 8/31/12 | 8/31/11 | ||||||
| Capital Share Transactions (continued): | |||||||
| Cost of shares redeemed: | |||||||
| Class A | $ | (43,720,146 | ) | $ | (85,566,853 | ) | |
| Class B | (1,780,758 | ) | (3,466,023 | ) | |||
| Class C | (4,028,713 | ) | (9,482,119 | ) | |||
| (49,529,617 | ) | (98,514,995 | ) | ||||
| Increase (decrease) in net assets derived from | |||||||
| capital share transactions | 18,603,738 | (42,150,285 | ) | ||||
| Net Increase (Decrease) in Net Assets | 44,251,427 | (56,573,608 | ) | ||||
| Net Assets: | |||||||
| Beginning of year | 576,292,457 | 632,866,065 | |||||
| End of year | $ | 620,543,884 | $ | 576,292,457 | |||
| Distributions in excess of net investment income | $ | (150,996 | ) | $ | (150,996 | ) | |
See accompanying notes, which are an integral part of the financial statements.
53
Statements of changes in net assets
Delaware Tax-Free Minnesota Intermediate Fund
| Year Ended | |||||||
| 8/31/12 | 8/31/11 | ||||||
| Increase (Decrease) in Net Assets from Operations: | |||||||
| Net investment income | $ | 3,248,656 | $ | 3,410,499 | |||
| Net realized gain | 736,277 | 27,316 | |||||
| Net change in unrealized appreciation (depreciation) | 3,068,062 | (1,912,414 | ) | ||||
| Net increase in net assets resulting from operations | 7,052,995 | 1,525,401 | |||||
| Dividends and Distributions to Shareholders from: | |||||||
| Net investment income: | |||||||
| Class A | (2,916,637 | ) | (3,042,351 | ) | |||
| Class B | (2,974 | ) | (3,741 | ) | |||
| Class C | (332,568 | ) | (366,017 | ) | |||
| (3,252,179 | ) | (3,412,109 | ) | ||||
| Capital Share Transactions: | |||||||
| Proceeds from shares sold: | |||||||
| Class A | 15,579,059 | 14,007,052 | |||||
| Class C | 3,942,041 | 2,568,568 | |||||
| Net asset value of shares issued upon reinvestment | |||||||
| of dividends and distributions: | |||||||
| Class A | 2,210,168 | 1,999,803 | |||||
| Class B | 2,974 | 3,714 | |||||
| Class C | 283,219 | 282,643 | |||||
| 22,017,461 | 18,861,780 | ||||||
54
| Year Ended | |||||||
| 8/31/12 | 8/31/11 | ||||||
| Capital Share Transactions (continued): | |||||||
| Cost of shares redeemed: | |||||||
| Class A | $ | (11,973,276 | ) | $ | (23,024,565 | ) | |
| Class B | (15,778 | ) | (36,216 | ) | |||
| Class C | (2,468,234 | ) | (3,293,158 | ) | |||
| (14,457,288 | ) | (26,353,939 | ) | ||||
| Increase (decrease) in net assets derived from | |||||||
| capital share transactions | 7,560,173 | (7,492,159 | ) | ||||
| Net Increase (Decrease) in Net Assets | 11,360,989 | (9,378,867 | ) | ||||
| Net Assets: | |||||||
| Beginning of year | 102,008,114 | 111,386,981 | |||||
| End of year | $ | 113,369,103 | $ | 102,008,114 | |||
| Undistributed net investment income | $ | 2,522 | $ | 2,522 | |||
See accompanying notes, which are an integral part of the financial statements.
55
Statements of changes in net assets
Delaware Minnesota High-Yield Municipal Bond Fund
| Year Ended | |||||||
| 8/31/12 | 8/31/11 | ||||||
| Increase (Decrease) in Net Assets from Operations: | |||||||
| Net investment income | $ | 5,503,371 | $ | 5,703,713 | |||
| Net realized gain (loss) | (37,455 | ) | 901,530 | ||||
| Net change in unrealized appreciation (depreciation) | 8,052,212 | (4,620,709 | ) | ||||
| Net increase in net assets resulting from operations | 13,518,128 | 1,984,534 | |||||
| Dividends and Distributions to Shareholders from: | |||||||
| Net investment income: | |||||||
| Class A | (4,569,906 | ) | (4,637,136 | ) | |||
| Class B | (72,794 | ) | (116,820 | ) | |||
| Class C | (935,918 | ) | (920,280 | ) | |||
| (5,578,618 | ) | (5,674,236 | ) | ||||
| Capital Share Transactions: | |||||||
| Proceeds from shares sold: | |||||||
| Class A | 20,963,432 | 13,547,458 | |||||
| Class B | 190 | 717 | |||||
| Class C | 7,092,669 | 3,701,679 | |||||
| Net asset value of shares issued upon reinvestment | |||||||
| of dividends and distributions: | |||||||
| Class A | 3,294,287 | 2,968,440 | |||||
| Class B | 66,747 | 98,527 | |||||
| Class C | 784,031 | 738,115 | |||||
| 32,201,356 | 21,054,936 | ||||||
56
| Year Ended | |||||||
| 8/31/12 | 8/31/11 | ||||||
| Capital Share Transactions (continued): | |||||||
| Cost of shares redeemed: | |||||||
| Class A | $ | (14,616,517 | ) | $ | (23,834,496 | ) | |
| Class B | (1,154,495 | ) | (1,224,390 | ) | |||
| Class C | (2,732,207 | ) | (5,761,704 | ) | |||
| (18,503,219 | ) | (30,820,590 | ) | ||||
| Increase (decrease) in net assets derived from | |||||||
| capital share transactions | 13,698,137 | (9,765,654 | ) | ||||
| Net Increase (Decrease) in Net Assets | 21,637,647 | (13,455,356 | ) | ||||
| Net Assets: | |||||||
| Beginning of year | 138,439,717 | 151,895,073 | |||||
| End of year | $ | 160,077,364 | $ | 138,439,717 | |||
| Distributions in excess of net investment income | $ | — | $ | (122 | ) | ||
See accompanying notes, which are an integral part of the financial statements.
57
Financial highlights
Delaware Tax-Free Minnesota Fund Class A
Selected data for each share of the Fund outstanding throughout each period were as follows:
| Net asset value, beginning of period |
| Income (loss) from investment operations: |
| Net investment income |
| Net realized and unrealized gain (loss) |
| Total from investment operations |
| Less dividends and distributions from: |
| Net investment income |
| Net realized gain |
| Total dividends and distributions |
| Net asset value, end of period |
| Total return1 |
| Ratios and supplemental data: |
| Net assets, end of period (000 omitted) |
| Ratio of expenses to average net assets excluding interest and fees on short-term floating |
| rate notes issued |
| Interest and fees on short-term floating rate notes issued |
| Total expenses2 |
| Ratio of expenses to average net assets excluding interest and fees on short-term floating |
| rate notes issued prior to fees waived |
| Interest and fees on short-term floating rate notes issued |
| Total expenses prior to fees waived2 |
| Ratio of net investment income to average net assets |
| Ratio of net investment income to average net assets |
| prior to fees waived |
| Portfolio turnover |
1 Total investment return is based on the change in net asset value of a share during the period and assumes reinvestment of dividends and distributions at net asset value and does not reflect the impact of a sales charge. Total investment return during some of the periods shown reflects a waiver by the manager. Performance would have been lower had the waiver not been in effect.
See accompanying notes, which are an integral part of the financial statements.
58
| Year Ended | ||||||||||||||||
| 8/31/12 | 8/31/11 | 8/31/10 | 8/31/09 | 8/31/08 | ||||||||||||
| $12.480 | $12.730 | $12.180 | $12.120 | $12.170 | ||||||||||||
| 0.487 | 0.492 | 0.484 | 0.474 | 0.495 | ||||||||||||
| 0.660 | (0.198 | ) | 0.550 | 0.107 | (0.041 | ) | ||||||||||
| 1.147 | 0.294 | 1.034 | 0.581 | 0.454 | ||||||||||||
| (0.488 | ) | (0.492 | ) | (0.484 | ) | (0.473 | ) | (0.502 | ) | |||||||
| (0.109 | ) | (0.052 | ) | — | (0.048 | ) | (0.002 | ) | ||||||||
| (0.597 | ) | (0.544 | ) | (0.484 | ) | (0.521 | ) | (0.504 | ) | |||||||
| $13.030 | $12.480 | $12.730 | $12.180 | $12.120 | ||||||||||||
| 9.41% | 2.50% | 8.66% | 5.04% | 3.77% | ||||||||||||
| $577,061 | $538,170 | $586,651 | $559,393 | $574,914 | ||||||||||||
| 0.90% | 0.91% | 0.93% | 0.92% | 0.93% | ||||||||||||
| — | — | — | 0.01% | 0.18% | ||||||||||||
| 0.90% | 0.91% | 0.93% | 0.93% | 1.11% | ||||||||||||
| 0.92% | 0.93% | 0.93% | 0.94% | 0.93% | ||||||||||||
| — | — | — | 0.01% | 0.18% | ||||||||||||
| 0.92% | 0.93% | 0.93% | 0.95% | 1.11% | ||||||||||||
| 3.81% | 4.02% | 3.89% | 4.03% | 4.05% | ||||||||||||
| 3.79% | 4.00% | 3.89% | 4.01% | 4.05% | ||||||||||||
| 16% | 12% | 20% | 20% | 17% | ||||||||||||
2 Total expenses and total expenses prior to fees waived and expense paid indirectly includes interest and related expenses which include, but are not limited to, interest expense, remarketing fees, liquidity fees, and trustees’ fees in connection with the Fund’s participation in inverse floater programs. See Notes 1 and 8 in “Notes to financial statements.”
59
Financial highlights
Delaware Tax-Free Minnesota Fund Class B
Selected data for each share of the Fund outstanding throughout each period were as follows:
| Net asset value, beginning of period |
| Income (loss) from investment operations: |
| Net investment income |
| Net realized and unrealized gain (loss) |
| Total from investment operations |
| Less dividends and distributions from: |
| Net investment income |
| Net realized gain |
| Total dividends and distributions |
| Net asset value, end of period |
| Total return1 |
| Ratios and supplemental data: |
| Net assets, end of period (000 omitted) |
| Ratio of expenses to average net assets excluding interest and fees on short-term floating |
| rate notes issued |
| Interest and fees on short-term floating rate notes issued |
| Total expenses2 |
| Ratio of expenses to average net assets excluding interest and fees on short-term floating |
| rate notes issued prior to fees waived |
| Interest and fees on short-term floating rate notes issued |
| Total expenses prior to fees waived2 |
| Ratio of net investment income to average net assets |
| Ratio of net investment income to average net assets |
| prior to fees waived |
| Portfolio turnover |
1 Total investment return is based on the change in net asset value of a share during the period and assumes reinvestment of dividends and distributions at net asset value and does not reflect the impact of a sales charge. Total investment return during some of the periods shown reflects a waiver by the manager. Performance would have been lower had the waiver not been in effect.
See accompanying notes, which are an integral part of the financial statements.
60
| Year Ended | ||||||||||||||||
| 8/31/12 | 8/31/11 | 8/31/10 | 8/31/09 | 8/31/08 | ||||||||||||
| $12.490 | $12.740 | $12.190 | $12.130 | $12.180 | ||||||||||||
| 0.391 | 0.400 | 0.391 | 0.386 | 0.403 | ||||||||||||
| 0.660 | (0.197 | ) | 0.550 | 0.107 | (0.041 | ) | ||||||||||
| 1.051 | 0.203 | 0.941 | 0.493 | 0.362 | ||||||||||||
| (0.392 | ) | (0.401 | ) | (0.391 | ) | (0.385 | ) | (0.410 | ) | |||||||
| (0.109 | ) | (0.052 | ) | — | (0.048 | ) | (0.002 | ) | ||||||||
| (0.501 | ) | (0.453 | ) | (0.391 | ) | (0.433 | ) | (0.412 | ) | |||||||
| $13.040 | $12.490 | $12.740 | $12.190 | $12.130 | ||||||||||||
| 8.59% | 1.74% | 7.85% | 4.26% | 2.99% | ||||||||||||
| $2,115 | $3,697 | $7,234 | $9,506 | $11,593 | ||||||||||||
| 1.65% | 1.66% | 1.68% | 1.67% | 1.68% | ||||||||||||
| — | — | — | 0.01% | 0.18% | ||||||||||||
| 1.65% | 1.66% | 1.68% | 1.68% | 1.86% | ||||||||||||
| 1.67% | 1.68% | 1.68% | 1.69% | 1.68% | ||||||||||||
| — | — | — | 0.01% | 0.18% | ||||||||||||
| 1.67% | 1.68% | 1.68% | 1.70% | 1.86% | ||||||||||||
| 3.06% | 3.27% | 3.14% | 3.28% | 3.30% | ||||||||||||
| 3.04% | 3.25% | 3.14% | 3.26% | 3.30% | ||||||||||||
| 16% | 12% | 20% | 20% | 17% | ||||||||||||
2 Total expenses and total expenses prior to fees waived and expense paid indirectly includes interest and related expenses which include, but are not limited to, interest expense, remarketing fees, liquidity fees, and trustees’ fees in connection with the Fund’s participation in inverse floater programs. See Notes 1 and 8 in “Notes to financial statements.”
61
Financial highlights
Delaware Tax-Free Minnesota Fund Class C
Selected data for each share of the Fund outstanding throughout each period were as follows:
| Net asset value, beginning of period |
| Income (loss) from investment operations: |
| Net investment income |
| Net realized and unrealized gain (loss) |
| Total from investment operations |
| Less dividends and distributions from: |
| Net investment income |
| Net realized gain |
| Total dividends and distributions |
| Net asset value, end of period |
| Total return1 |
| Ratios and supplemental data: |
| Net assets, end of period (000 omitted) |
| Ratio of expenses to average net assets excluding interest and fees on short-term floating |
| rate notes issued |
| Interest and fees on short-term floating rate notes issued |
| Total expenses2 |
| Ratio of expenses to average net assets excluding interest and fees on short-term floating |
| rate notes issued prior to fees waived |
| Interest and fees on short-term floating rate notes issued |
| Total expenses prior to fees waived2 |
| Ratio of net investment income to average net assets |
| Ratio of net investment income to average net assets |
| prior to fees waived |
| Portfolio turnover |
1 Total investment return is based on the change in net asset value of a share during the period and assumes reinvestment of dividends and distributions at net asset value and does not reflect the impact of a sales charge. Total investment return during some of the periods shown reflects a waiver by the manager. Performance would have been lower had the waiver not been in effect.
See accompanying notes, which are an integral part of the financial statements.
62
| Year Ended | ||||||||||||||||
| 8/31/12 | 8/31/11 | 8/31/10 | 8/31/09 | 8/31/08 | ||||||||||||
| $12.520 | $12.780 | $12.220 | $12.160 | $12.200 | ||||||||||||
| 0.392 | 0.401 | 0.392 | 0.386 | 0.403 | ||||||||||||
| 0.660 | (0.207 | ) | 0.560 | 0.107 | (0.031 | ) | ||||||||||
| 1.052 | 0.194 | 0.952 | 0.493 | 0.372 | ||||||||||||
| (0.393 | ) | (0.402 | ) | (0.392 | ) | (0.385 | ) | (0.410 | ) | |||||||
| (0.109 | ) | (0.052 | ) | — | (0.048 | ) | (0.002 | ) | ||||||||
| (0.502 | ) | (0.454 | ) | (0.392 | ) | (0.433 | ) | (0.412 | ) | |||||||
| $13.070 | $12.520 | $12.780 | $12.220 | $12.160 | ||||||||||||
| 8.58% | 1.66% | 7.91% | 4.25% | 3.06% | ||||||||||||
| $41,368 | $34,425 | $38,981 | $34,174 | $27,585 | ||||||||||||
| 1.65% | 1.66% | 1.68% | 1.67% | 1.68% | ||||||||||||
| — | — | — | 0.01% | 0.18% | ||||||||||||
| 1.65% | 1.66% | 1.68% | 1.68% | 1.86% | ||||||||||||
| 1.67% | 1.68% | 1.68% | 1.69% | 1.68% | ||||||||||||
| — | — | — | 0.01% | 0.18% | ||||||||||||
| 1.67% | 1.68% | 1.68% | 1.70% | 1.86% | ||||||||||||
| 3.06% | 3.27% | 3.14% | 3.28% | 3.30% | ||||||||||||
| 3.04% | 3.25% | 3.14% | 3.26% | 3.30% | ||||||||||||
| 16% | 12% | 20% | 20% | 17% | ||||||||||||
2 Total expenses and total expenses prior to fees waived and expense paid indirectly includes interest and related expenses which include, but are not limited to, interest expense, remarketing fees, liquidity fees, and trustees’ fees in connection with the Fund’s participation in inverse floater programs. See Notes 1 and 8 in “Notes to financial statements.”
63
Financial highlights
Delaware Tax-Free Minnesota Intermediate Fund Class A
Selected data for each share of the Fund outstanding throughout each period were as follows:
| Net asset value, beginning of period |
| Income (loss) from investment operations: |
| Net investment income |
| Net realized and unrealized gain (loss) |
| Total from investment operations |
| Less dividends and distributions from: |
| Net investment income |
| Total dividends and distributions |
| Net asset value, end of period |
| Total return1 |
| Ratios and supplemental data: |
| Net assets, end of period (000 omitted) |
| Ratio of expenses to average net assets |
| Ratio of expenses to average net assets |
| prior to fees waived |
| Ratio of net investment income to average net assets |
| Ratio of net investment income to average net assets |
| prior to fees waived |
| Portfolio turnover |
1 Total investment return is based on the change in net asset value of a share during the period and assumes reinvestment of dividends and distributions at net asset value and does not reflect the impact of a sales charge. Total investment return during all of the periods shown reflects waivers by the manager and/or distributor. Performance would have been lower had the waivers not been in effect.
See accompanying notes, which are an integral part of the financial statements.
64
| Year Ended | ||||||||||||||||
| 8/31/12 | 8/31/11 | 8/31/10 | 8/31/09 | 8/31/08 | ||||||||||||
| $11.130 | $11.290 | $10.820 | $10.720 | $10.610 | ||||||||||||
| 0.355 | 0.375 | 0.376 | 0.384 | 0.414 | ||||||||||||
| 0.400 | (0.160 | ) | 0.469 | 0.100 | 0.110 | |||||||||||
| 0.755 | 0.215 | 0.845 | 0.484 | 0.524 | ||||||||||||
| (0.355 | ) | (0.375 | ) | (0.375 | ) | (0.384 | ) | (0.414 | ) | |||||||
| (0.355 | ) | (0.375 | ) | (0.375 | ) | (0.384 | ) | (0.414 | ) | |||||||
| $11.530 | $11.130 | $11.290 | $10.820 | $10.720 | ||||||||||||
| 6.88% | 2.02% | 7.96% | 4.67% | 5.00% | ||||||||||||
| $97,032 | $87,924 | $96,568 | $78,021 | $58,465 | ||||||||||||
| 0.84% | 0.84% | 0.82% | 0.75% | 0.75% | ||||||||||||
| 0.94% | 0.95% | 0.96% | 0.97% | 0.95% | ||||||||||||
| 3.12% | 3.43% | 3.42% | 3.62% | 3.83% | ||||||||||||
| 3.02% | 3.32% | 3.28% | 3.40% | 3.63% | ||||||||||||
| 21% | 24% | 22% | 12% | 27% | ||||||||||||
65
Financial highlights
Delaware Tax-Free Minnesota Intermediate Fund Class B
Selected data for each share of the Fund outstanding throughout each period were as follows:
| Net asset value, beginning of period |
| Income (loss) from investment operations: |
| Net investment income |
| Net realized and unrealized gain (loss) |
| Total from investment operations |
| Less dividends and distributions from: |
| Net investment income |
| Total dividends and distributions |
| Net asset value, end of period |
| Total return1 |
| Ratios and supplemental data: |
| Net assets, end of period (000 omitted) |
| Ratio of expenses to average net assets |
| Ratio of expenses to average net assets |
| prior to fees waived |
| Ratio of net investment income to average net assets |
| Ratio of net investment income to average net assets |
| prior to fees waived |
| Portfolio turnover |
1 Total investment return is based on the change in net asset value of a share during the period and assumes reinvestment of dividends and distributions at net asset value and does not reflect the impact of a sales charge. Total investment return during some of the periods shown reflects a waiver by the manager. Performance would have been lower had the waiver not been in effect.
See accompanying notes, which are an integral part of the financial statements.
66
| Year Ended | ||||||||||||||||
| 8/31/12 | 8/31/11 | 8/31/10 | 8/31/09 | 8/31/08 | ||||||||||||
| $11.170 | $11.330 | $10.850 | $10.750 | $10.640 | ||||||||||||
| 0.259 | 0.283 | 0.284 | 0.295 | 0.322 | ||||||||||||
| 0.400 | (0.160 | ) | 0.479 | 0.100 | 0.110 | |||||||||||
| 0.659 | 0.123 | 0.763 | 0.395 | 0.432 | ||||||||||||
| (0.259 | ) | (0.283 | ) | (0.283 | ) | (0.295 | ) | (0.322 | ) | |||||||
| (0.259 | ) | (0.283 | ) | (0.283 | ) | (0.295 | ) | (0.322 | ) | |||||||
| $11.570 | $11.170 | $11.330 | $10.850 | $10.750 | ||||||||||||
| 5.96% | 1.16% | 7.14% | 3.79% | 4.10% | ||||||||||||
| $127 | $135 | $170 | $317 | $908 | ||||||||||||
| 1.69% | 1.69% | 1.67% | 1.60% | 1.60% | ||||||||||||
| 1.69% | 1.70% | 1.71% | 1.72% | 1.70% | ||||||||||||
| 2.27% | 2.58% | 2.57% | 2.77% | 2.98% | ||||||||||||
| 2.27% | 2.57% | 2.53% | 2.65% | 2.88% | ||||||||||||
| 21% | 24% | 22% | 12% | 27% | ||||||||||||
67
Financial highlights
Delaware Tax-Free Minnesota Intermediate Fund Class C
Selected data for each share of the Fund outstanding throughout each period were as follows:
| Net asset value, beginning of period |
| Income (loss) from investment operations: |
| Net investment income |
| Net realized and unrealized gain (loss) |
| Total from investment operations |
| Less dividends and distributions from: |
| Net investment income |
| Total dividends and distributions |
| Net asset value, end of period |
| Total return1 |
| Ratios and supplemental data: |
| Net assets, end of period (000 omitted) |
| Ratio of expenses to average net assets |
| Ratio of expenses to average net assets |
| prior to fees waived |
| Ratio of net investment income to average net assets |
| Ratio of net investment income to average net assets |
| prior to fees waived |
| Portfolio turnover |
1 Total investment return is based on the change in net asset value of a share during the period and assumes reinvestment of dividends and distributions at net asset value and does not reflect the impact of a sales charge. Total investment return during some of the periods shown reflects a waiver by the manager. Performance would have been lower had the waiver not been in effect.
See accompanying notes, which are an integral part of the financial statements.
68
| Year Ended | ||||||||||||||||
| 8/31/12 | 8/31/11 | 8/31/10 | 8/31/09 | 8/31/08 | ||||||||||||
| $11.160 | $11.320 | $10.840 | $10.740 | $10.630 | ||||||||||||
| 0.259 | 0.283 | 0.283 | 0.295 | 0.322 | ||||||||||||
| 0.400 | (0.160 | ) | 0.479 | 0.100 | 0.110 | |||||||||||
| 0.659 | 0.123 | 0.762 | 0.395 | 0.432 | ||||||||||||
| (0.259 | ) | (0.283 | ) | (0.282 | ) | (0.295 | ) | (0.322 | ) | |||||||
| (0.259 | ) | (0.283 | ) | (0.282 | ) | (0.295 | ) | (0.322 | ) | |||||||
| $11.560 | $11.160 | $11.320 | $10.840 | $10.740 | ||||||||||||
| 5.96% | 1.16% | 7.14% | 3.78% | 4.10% | ||||||||||||
| $16,210 | $13,949 | $14,649 | $11,276 | $7,126 | ||||||||||||
| 1.69% | 1.69% | 1.67% | 1.60% | 1.60% | ||||||||||||
| 1.69% | 1.70% | 1.71% | 1.72% | 1.70% | ||||||||||||
| 2.27% | 2.58% | 2.57% | 2.77% | 2.98% | ||||||||||||
| 2.27% | 2.57% | 2.53% | 2.65% | 2.88% | ||||||||||||
| 21% | 24% | 22% | 12% | 27% | ||||||||||||
69
Financial highlights
Delaware Minnesota High-Yield Municipal Bond Fund Class A
Selected data for each share of the Fund outstanding throughout each period were as follows:
| Net asset value, beginning of period |
| Income (loss) from investment operations: |
| Net investment income |
| Net realized and unrealized gain (loss) |
| Total from investment operations |
| Less dividends and distributions from: |
| Net investment income |
| Total dividends and distributions |
| Net asset value, end of period |
| Total return1 |
| Ratios and supplemental data: |
| Net assets, end of period (000 omitted) |
| Ratio of expenses to average net assets |
| Ratio of expenses to average net assets |
| prior to fees waived |
| Ratio of net investment income to average net assets |
| Ratio of net investment income to average net assets |
| prior to fees waived |
| Portfolio turnover |
1 Total investment return is based on the change in net asset value of a share during the period and assumes reinvestment of dividends and distributions at net asset value and does not reflect the impact of a sales charge. Total investment return during all of the periods shown reflects a waiver by the manager. Performance would have been lower had the waiver not been in effect.
See accompanying notes, which are an integral part of the financial statements.
70
| Year Ended | ||||||||||||||||
| 8/31/12 | 8/31/11 | 8/31/10 | 8/31/09 | 8/31/08 | ||||||||||||
| $10.490 | $10.710 | $9.910 | $10.000 | $10.180 | ||||||||||||
| 0.420 | 0.430 | 0.415 | 0.422 | 0.418 | ||||||||||||
| 0.596 | (0.222 | ) | 0.798 | (0.091 | ) | (0.180 | ) | |||||||||
| 1.016 | 0.208 | 1.213 | 0.331 | 0.238 | ||||||||||||
| (0.426 | ) | (0.428 | ) | (0.413 | ) | (0.421 | ) | (0.418 | ) | |||||||
| (0.426 | ) | (0.428 | ) | (0.413 | ) | (0.421 | ) | (0.418 | ) | |||||||
| $11.080 | $10.490 | $10.710 | $9.910 | $10.000 | ||||||||||||
| 9.86% | 2.12% | 12.46% | 3.63% | 2.35% | ||||||||||||
| $124,717 | $108,830 | $119,038 | $107,951 | $116,999 | ||||||||||||
| 0.89% | 0.91% | 0.93% | 0.89% | 0.89% | ||||||||||||
| 0.97% | 0.98% | 0.98% | 0.97% | 0.97% | ||||||||||||
| 3.89% | 4.20% | 4.02% | 4.49% | 4.11% | ||||||||||||
| 3.81% | 4.13% | 3.97% | 4.41% | 4.03% | ||||||||||||
| 13% | 5% | 11% | 12% | 10% | ||||||||||||
71
Financial highlights
Delaware Minnesota High-Yield Municipal Bond Fund Class B
Selected data for each share of the Fund outstanding throughout each period were as follows:
| Net asset value, beginning of period |
| Income (loss) from investment operations: |
| Net investment income |
| Net realized and unrealized gain (loss) |
| Total from investment operations |
| Less dividends and distributions from: |
| Net investment income |
| Total dividends and distributions |
| Net asset value, end of period |
| Total return1 |
| Ratios and supplemental data: |
| Net assets, end of period (000 omitted) |
| Ratio of expenses to average net assets |
| Ratio of expenses to average net assets |
| prior to fees waived |
| Ratio of net investment income to average net assets |
| Ratio of net investment income to average net assets |
| prior to fees waived |
| Portfolio turnover |
1 Total investment return is based on the change in net asset value of a share during the period and assumes reinvestment of dividends and distributions at net asset value and does not reflect the impact of a sales charge. Total investment return during all of the periods shown reflects a waiver by the manager. Performance would have been lower had the waiver not been in effect.
See accompanying notes, which are an integral part of the financial statements.
72
| Year Ended | ||||||||||||||||
| 8/31/12 | 8/31/11 | 8/31/10 | 8/31/09 | 8/31/08 | ||||||||||||
| $10.510 | $10.720 | $9.920 | $10.010 | $10.190 | ||||||||||||
| 0.340 | 0.354 | 0.338 | 0.352 | 0.341 | ||||||||||||
| 0.586 | (0.212 | ) | 0.798 | (0.091 | ) | (0.179 | ) | |||||||||
| 0.926 | 0.142 | 1.136 | 0.261 | 0.162 | ||||||||||||
| (0.346 | ) | (0.352 | ) | (0.336 | ) | (0.351 | ) | (0.342 | ) | |||||||
| (0.346 | ) | (0.352 | ) | (0.336 | ) | (0.351 | ) | (0.342 | ) | |||||||
| $11.090 | $10.510 | $10.720 | $9.920 | $10.010 | ||||||||||||
| 8.93% | 1.46% | 11.62% | 2.86% | 1.58% | ||||||||||||
| $1,928 | $2,892 | $4,130 | $4,995 | $5,907 | ||||||||||||
| 1.64% | 1.66% | 1.68% | 1.64% | 1.64% | ||||||||||||
| 1.72% | 1.73% | 1.73% | 1.72% | 1.72% | ||||||||||||
| 3.14% | 3.45% | 3.27% | 3.74% | 3.36% | ||||||||||||
| 3.06% | 3.38% | 3.22% | 3.66% | 3.28% | ||||||||||||
| 13% | 5% | 11% | 12% | 10% | ||||||||||||
73
Financial highlights
Delaware Minnesota High-Yield Municipal Bond Fund Class C
Selected data for each share of the Fund outstanding throughout each period were as follows:
| Net asset value, beginning of period |
| Income (loss) from investment operations: |
| Net investment income |
| Net realized and unrealized gain (loss) |
| Total from investment operations |
| Less dividends and distributions from: |
| Net investment income |
| Total dividends and distributions |
| Net asset value, end of period |
| Total return1 |
| Ratios and supplemental data: |
| Net assets, end of period (000 omitted) |
| Ratio of expenses to average net assets |
| Ratio of expenses to average net assets |
| prior to fees waived |
| Ratio of net investment income to average net assets |
| Ratio of net investment income to average net assets |
| prior to fees waived |
| Portfolio turnover |
1 Total investment return is based on the change in net asset value of a share during the period and assumes reinvestment of dividends and distributions at net asset value and does not reflect the impact of a sales charge. Total investment return during all of the periods shown reflects a waiver by the manager. Performance would have been lower had the waiver not been in effect.
See accompanying notes, which are an integral part of the financial statements.
74
| Year Ended | ||||||||||||||||
| 8/31/12 | 8/31/11 | 8/31/10 | 8/31/09 | 8/31/08 | ||||||||||||
| $10.510 | $10.730 | $9.930 | $10.020 | $10.200 | ||||||||||||
| 0.340 | 0.354 | 0.338 | 0.352 | 0.342 | ||||||||||||
| 0.596 | (0.222 | ) | 0.798 | (0.091 | ) | (0.181 | ) | |||||||||
| 0.936 | 0.132 | 1.136 | 0.261 | 0.161 | ||||||||||||
| (0.346 | ) | (0.352 | ) | (0.336 | ) | (0.351 | ) | (0.341 | ) | |||||||
| (0.346 | ) | (0.352 | ) | (0.336 | ) | (0.351 | ) | (0.341 | ) | |||||||
| $11.100 | $10.510 | $10.730 | $9.930 | $10.020 | ||||||||||||
| 9.03% | 1.36% | 11.61% | 2.85% | 1.58% | ||||||||||||
| $33,432 | $26,718 | $28,727 | $24,740 | $28,849 | ||||||||||||
| 1.64% | 1.66% | 1.68% | 1.64% | 1.64% | ||||||||||||
| 1.72% | 1.73% | 1.73% | 1.72% | 1.72% | ||||||||||||
| 3.14% | 3.45% | 3.27% | 3.74% | 3.36% | ||||||||||||
| 3.06% | 3.38% | 3.22% | 3.66% | 3.28% | ||||||||||||
| 13% | 5% | 11% | 12% | 10% | ||||||||||||
75
| Notes to financial statements | |
| Delaware Investments® Minnesota Municipal Bond Funds | August 31, 2012 |
Voyageur Mutual Funds is organized as a Delaware statutory trust and offers five series: Delaware Minnesota High-Yield Municipal Bond Fund, Delaware National High-Yield Municipal Bond Fund, Delaware Tax-Free California Fund, Delaware Tax-Free Idaho Fund and Delaware Tax-Free New York Fund. Voyageur Tax-Free Funds is organized as a Delaware statutory trust and offers Delaware Tax-Free Minnesota Fund. Voyageur Intermediate Tax-Free Funds is organized as a Delaware statutory trust and offers Delaware Tax-Free Minnesota Intermediate Fund. Voyageur Mutual Funds, Voyageur Tax-Free Funds and Voyageur Intermediate Tax-Free Funds are individually referred to as a Trust and collectively as Trusts. These financial statements and the related notes pertain to Delaware Tax-Free Minnesota Fund, Delaware Tax-Free Minnesota Intermediate Fund and Delaware Minnesota High-Yield Municipal Bond Fund (each referred to as a Fund or collectively as the Funds). The above Trusts are open-end investment companies. The Funds are considered diversified under the Investment Company Act of 1940, as amended, and offer Class A, Class B, and Class C shares. Class A shares are sold with a maximum front-end sales charge of 4.50% for Delaware Tax-Free Minnesota Fund and Delaware Minnesota High-Yield Municipal Bond Fund and 2.75% for Delaware Tax-Free Minnesota Intermediate Fund. Class A share purchases of $1,000,000 or more will incur a contingent deferred sales charge (CDSC) of 1% if redeemed during the first year and 0.50% during the second year for Delaware Tax-Free Minnesota Fund and Delaware Minnesota High-Yield Municipal Bond Fund, and 0.75% for Delaware Tax-Free Minnesota Intermediate Fund if redeemed within the first year, provided that Delaware Distributors, L.P. (DDLP) paid a financial advisor a commission on the purchase of those shares. Class B shares may be purchased only through dividend reinvestment and certain permitted exchanges. Prior to June 1, 2007, Class B shares were sold with a CDSC that declined from 4% to zero for Delaware Tax-Free Minnesota Fund and Delaware Minnesota High-Yield Municipal Bond Fund, and declined from 2% to zero for Delaware Tax-Free Minnesota Intermediate Fund depending upon the period of time the shares were held. Class B shares will automatically convert to Class A shares on a quarterly basis approximately eight years after purchase for Delaware Tax-Free Minnesota Fund and Delaware Minnesota High-Yield Municipal Bond Fund and approximately five years after purchase for Delaware Tax-Free Minnesota Intermediate Fund. Class C shares are sold with a CDSC of 1%, if redeemed during the first twelve months.
The investment objective of Delaware Tax-Free Minnesota Fund is to seek as high a level of current income exempt from federal income tax and from the Minnesota state personal income tax as is consistent with preservation of capital.
The investment objective of Delaware Tax-Free Minnesota Intermediate Fund is to seek to provide investors with preservation of capital and, secondarily, current income exempt from federal income tax and the Minnesota state personal income tax, by maintaining a dollar-weighted average effective portfolio maturity of 10 years or less.
The investment objective of Delaware Minnesota High-Yield Municipal Bond Fund is to seek as high a level of current income exempt from federal income tax and from Minnesota state personal income taxes, primarily through investment in medium- and lower-grade municipal obligations.
76
1. Significant Accounting Policies
The following accounting policies are in accordance with U.S. generally accepted accounting principles (U.S. GAAP) and are consistently followed by the Funds.
Security Valuation — Open-end investment companies are valued at their published net asset value. Debt securities are valued based upon valuations provided by an independent pricing service or broker and reviewed by management. To the extent current market prices are not available, the pricing service may take into account developments related to the specific security, as well as transactions in comparable securities. Valuations for fixed income securities utilize matrix systems, which reflect such factors as security prices, yields, maturities, and ratings, and are supplemented by dealer and exchange quotations. Generally, other securities and assets for which market quotations are not readily available are valued at fair value as determined in good faith under the direction of each Fund’s Board of Trustees (each, a Board or, collectively, the Boards). In determining whether market quotations are readily available or fair valuation will be used, various factors will be taken into consideration, such as market closures or suspension of trading in a security.
Federal Income Taxes — No provision for federal income taxes has been made as each Fund intends to continue to qualify for federal income tax purposes as a regulated investment company under Subchapter M of the Internal Revenue Code of 1986, as amended, and make the requisite distributions to shareholders. The Funds evaluate tax positions taken or expected to be taken in the course of preparing the Funds’ tax returns to determine whether the tax positions are “more likely-than-not” of being sustained by the applicable tax authority. Tax positions not deemed to meet the more-likely-than-not threshold are recorded as a tax benefit or expense in the current year. Management has analyzed the Funds’ tax positions taken on federal income tax returns for all open tax years (August 31, 2009–August 31, 2012), and has concluded that no provision for federal income tax is required in the Funds’ financial statements.
Class Accounting — Investment income and common expenses are allocated to the various classes of the Funds on the basis of “settled shares” of each class in relation to the net assets of the Funds. Realized and unrealized gain (loss) on investments are allocated to the various classes of the Funds on the basis of daily net assets of each class. Distribution expenses relating to a specific class are charged directly to that class.
Use of Estimates — The preparation of financial statements in conformity with U.S. GAAP requires management to make estimates and assumptions that affect the fair value of investments, the reported amounts of assets and liabilities and disclosure of contingent assets and liabilities at the date of the financial statements and the reported amounts of revenues and expenses during the reporting period. Actual results could differ from those estimates and the differences could be material.
77
Notes to financial statements
Delaware Investments® Minnesota Municipal Bond Funds
1. Significant Accounting Policies (continued)
Interest and Related Expenses — Interest and related expenses include, but are not limited to, interest expense, remarketing fees, liquidity fees, and trustees’ fees from a Fund’s participation in inverse floater programs where the Fund has transferred its own bonds to a trust that issues floating rate securities with an aggregate principal amount equal to the principal of the transferred bonds. In conveyance of the bond, a Fund receives the inverse floating rate securities and cash from the trust. As a result of certain rights retained by a Fund, the transfer of the bond is not considered a sale, but rather a form of financing for accounting purposes whereby the cash received is recorded as a liability and interest expense is recorded based on the interest rate of the floating rate securities. Remarketing fees, liquidity fees, and trustees’ expenses are recorded on the accrual basis. There were no interest and related expenses for the year ended August 31, 2012.
Other — Expenses directly attributable to the Funds are charged directly to the Funds. Other expenses common to various funds within the Delaware Investments® Family of Funds are generally allocated amongst such funds on the basis of average net assets. Management fees and some other expenses are paid monthly. Security transactions are recorded on the date the securities are purchased or sold (trade date) for financial reporting purposes. Costs used in calculating realized gains and losses on the sale of investment securities are those of the specific securities sold. Interest income is recorded on the accrual basis. Discounts and premiums are amortized to interest income over the lives of the respective securities using the effective interest method. Each Fund declares dividends daily from net investment income and pays such dividends monthly and declares and pays distributions from net realized gain on investments, if any, annually. The Funds may distribute income dividends and capital gains more frequently, if necessary for tax purposes. Dividends and distributions, if any, are recorded on the ex-dividend date.
The Funds may receive earnings credits from their custodian when positive cash balances are maintained, which are used to offset custody fees. There were no earnings credits for the year ended August 31, 2012.
The Funds receive earnings credits from their transfer agent when positive cash balances are maintained, which are used to offset transfer agent fees. The expense paid under this arrangement is included in dividend disbursing and transfer agent fees and expenses on the statements of operations with the corresponding expense offset shown as “expense paid indirectly.” For the year ended August 31, 2012, the Funds earned the following under this agreement:
| Delaware Tax-Free | Delaware Minnesota | |||||
| Delaware Tax-Free | Minnesota | High-Yield Municipal | ||||
| Minnesota Fund | Intermediate Fund | Bond Fund | ||||
| $240 | $52 | $79 |
78
2. Investment Management, Administration Agreements and Other Transactions with Affiliates
In accordance with the terms of its respective investment management agreement, each Fund pays Delaware Management Company (DMC), a series of Delaware Management Business Trust and the investment manager, an annual fee, which is calculated based on each Fund’s average daily net assets as follows:
| Delaware Tax-Free | Delaware Minnesota | ||||
| Delaware Tax-Free | Minnesota | High-Yield Municipal | |||
| Minnesota Fund | Intermediate Fund | Bond Fund | |||
| On the first $500 million | 0.550% | 0.500% | 0.550% | ||
| On the next $500 million | 0.500% | 0.475% | 0.500% | ||
| On the next $1.5 billion | 0.450% | 0.450% | 0.450% | ||
| In excess of $2.5 billion | 0.425% | 0.425% | 0.425% |
DMC has contractually agreed to waive that portion, if any, of its management fee and reimburse the Funds to the extent necessary to prevent total annual fund operating expenses (excluding any 12b-1 plan expenses, taxes, interest, inverse floater program expenses, short sale and dividend interest expenses, brokerage fees, certain insurance costs, and nonroutine expenses or costs, including, but not limited to, those relating to reorganizations, litigation, conducting shareholder meetings, and liquidations) from exceeding the following percentages of each Fund’s average daily net assets through December 28, 2012. For purposes of these waivers and reimbursements, nonroutine expenses may also include such additional costs and expenses as may be agreed upon from time to time by the Funds’ Boards and DMC. These expense waivers and reimbursements apply only to expenses paid directly by the Funds and may only be terminated by agreement of DMC and the Funds.
| Delaware Tax-Free | Delaware Minnesota | ||||
| Delaware Tax-Free | Minnesota | High-Yield Municipal | |||
| Minnesota Fund | Intermediate Fund | Bond Fund | |||
| Operating expense limitation as a | |||||
| percentage of average daily net | |||||
| assets (per annum) | 0.65% | 0.69% | 0.64% |
Delaware Service Company, Inc. (DSC), an affiliate of DMC, provides fund accounting and financial administration oversight services to the Funds. For these services, the Funds pay DSC fees based on the aggregate daily net assets of the Delaware Investments® Family of Funds at the following annual rate: 0.0050% of the first $30 billion; 0.0045% of the next $10 billion; 0.0040% of the next $10 billion; and 0.0025% of aggregate average daily net assets in excess of $50 billion. The fees payable to DSC under the service agreement described above are allocated among all Funds in the Delaware Investments Family of Funds on a relative net asset value basis. For the year ended August 31, 2012, each Fund was charged for these services as follows:
| Delaware Tax-Free | Delaware Minnesota | ||||
| Delaware Tax-Free | Minnesota | High-Yield Municipal | |||
| Minnesota Fund | Intermediate Fund | Bond Fund | |||
| $29,346 | $5,323 | $7,264 |
79
Notes to financial statements
Delaware Investments® Minnesota Municipal Bond Funds
2. Investment Management, Administration Agreements and Other Transactions with Affiliates (continued)
DSC also provides dividend disbursing and transfer agency services. The Funds pay DSC a monthly asset-based fee for these services.
Pursuant to a distribution agreement and distribution plan, each Fund pays DDLP, the distributor and an affiliate of DMC, an annual distribution and service fee of 0.25% of the average daily net assets of the Class A shares and 1.00% of the average daily net assets of the Class B and Class C shares. DDLP has contracted to limit Delaware Tax-Free Minnesota Intermediate Fund’s Class A shares 12b-1 fees through December 28, 2012 to 0.15% of average daily net assets.
At August 31, 2012, each Fund had liabilities payable to affiliates as follows:
| Delaware Tax-Free | Delaware Minnesota | |||||||||||||
| Delaware Tax-Free | Minnesota | High-Yield Municipal | ||||||||||||
| Minnesota Fund | Intermediate Fund | Bond Fund | ||||||||||||
| Investment management fees | ||||||||||||||
| payable to DMC | $ | 275,063 | $ | 55,668 | $ | 67,795 | ||||||||
| Dividend disbursing, transfer | ||||||||||||||
| agent and fund accounting | ||||||||||||||
| oversight fees and other | ||||||||||||||
| expenses payable to DSC | 14,436 | 2,633 | 3,691 | |||||||||||
| Distribution fees payable | ||||||||||||||
| to DDLP | 158,042 | 25,911 | 55,636 | |||||||||||
| Other expenses payable to | ||||||||||||||
| DMC and affiliates* | 10,211 | 2,138 | 3,247 | |||||||||||
*DMC, as part of its administrative services, pays operating expenses on behalf of each Fund and is reimbursed on a periodic basis. Expenses include items such as printing of shareholder reports, fees for audit, legal and tax services, registration fees and trustees’ fees.
As provided in the investment management agreement, each Fund bears the cost of certain legal and tax services, including internal legal and tax services provided to each Fund by DMC and/or its affiliates’ employees. For the year ended August 31, 2012, each Fund was charged for internal legal and tax services provided by DMC and/or its affiliates’ employees as follows:
| Delaware Tax-Free | Delaware Minnesota | |||||
| Delaware Tax-Free | Minnesota | High-Yield Municipal | ||||
| Minnesota Fund | Intermediate Fund | Bond Fund | ||||
| $16,515 | $3,007 | $4,077 |
80
For the year ended August 31, 2012, DDLP earned commissions on sales of Class A shares for each Fund as follows:
| Delaware Tax-Free | Delaware Minnesota | ||||
| Delaware Tax-Free | Minnesota | High-Yield Municipal | |||
| Minnesota Fund | Intermediate Fund | Bond Fund | |||
| $77,384 | $12,143 | $40,721 |
For the year ended August 31, 2012, DDLP received gross CDSC commissions on redemption of each Fund’s Class A, Class B and Class C shares, and these commissions were entirely used to offset up-front commissions previously paid by DDLP to broker/dealers on sales of those shares. The amounts received were as follows:
| Delaware Tax-Free | Delaware Minnesota | ||||||||||
| Delaware Tax-Free | Minnesota | High-Yield Municipal | |||||||||
| Minnesota Fund | Intermediate Fund | Bond Fund | |||||||||
| Class A | $ | 0 | $ | 0 | $ | 3,125 | |||||
| Class B | 358 | 0 | 652 | ||||||||
| Class C | 592 | 284 | 1,295 | ||||||||
Trustees’ fees include expenses accrued by the Funds for each Trustee’s retainer and meeting fees. Certain officers of DMC, DSC and DDLP are officers and/or Trustees of the Trust. These officers and Trustees are paid no compensation by the Funds.
3. Investments
For the year ended August 31, 2012, the Funds made purchases and sales of investment securities other than short-term investments as follows:
| Delaware Tax-Free | Delaware Minnesota | |||||||||
| Delaware Tax-Free | Minnesota | High-Yield Municipal | ||||||||
| Minnesota Fund | Intermediate Fund | Bond Fund | ||||||||
| Purchases | $ | 113,707,693 | $ | 33,119,107 | $ | 35,222,578 | ||||
| Sales | 92,783,822 | 22,504,384 | 19,105,735 | |||||||
At August 31, 2012, the cost of investments and unrealized appreciation (depreciation) for federal income tax purposes for each Fund were as follows:
| Delaware Tax-Free | Delaware Minnesota | |||||||||||
| Delaware Tax-Free | Minnesota | High-Yield Municipal | ||||||||||
| Minnesota Fund | Intermediate Fund | Bond Fund | ||||||||||
| Cost of investments | $ | 569,187,915 | $ | 105,255,165 | $ | 150,862,894 | ||||||
| Aggregate unrealized appreciation | $ | 51,867,627 | $ | 8,280,897 | $ | 10,016,382 | ||||||
| Aggregate unrealized depreciation | (20,100 | ) | (30,704 | ) | (222,655 | ) | ||||||
| Net unrealized appreciation | $ | 51,847,527 | $ | 8,250,193 | $ | 9,793,727 | ||||||
U.S. GAAP defines fair value as the price that each Fund would receive to sell an asset or pay to transfer a liability in an orderly transaction between market participants at the measurement date under current market conditions. A three level hierarchy for fair value measurements has been established based upon the transparency of inputs to the valuation of an asset or liability. Inputs may be observable or unobservable and refer broadly to the assumptions that market
81
Notes to financial statements
Delaware Investments® Minnesota Municipal Bond Funds
3. Investments (continued)
participants would use in pricing the asset or liability. Observable inputs reflect the assumptions market participants would use in pricing the asset or liability based on market data obtained from sources independent of the reporting entity. Unobservable inputs reflect the reporting entity’s own assumptions about the assumptions that market participants would use in pricing the asset or liability developed based on the best information available under the circumstances. Each Fund’s investment in its entirety is assigned a level based upon the observability of the inputs which are significant to the overall valuation. The three level hierarchy of inputs is summarized below.
| Level 1 – | inputs are quoted prices in active markets for identical investments (e.g., equity securities, open-end investment companies, futures contracts, exchange-traded options contracts) |
| Level 2 – | other observable inputs (including, but not limited to: quoted prices for similar assets or liabilities in markets that are active, quoted prices for identical or similar assets or liabilities in markets that are not active, inputs other than quoted prices that are observable for the assets or liabilities (such as interest rates, yield curves, volatilities, prepayment speeds, loss severities, credit risks and default rates) or other market-corroborated inputs) (e.g., debt securities, government securities, swap contracts, foreign currency exchange contracts, foreign securities utilizing international fair value pricing, broker-quoted securities, fair valued securities) |
| Level 3 – | inputs are significant unobservable inputs (including each Fund’s own assumptions used to determine the fair value of investments) (e.g., broker-quoted securities, fair valued securities) |
Level 3 investments are valued using significant unobservable inputs, including related or comparable assets or liabilities, book values and other relevant information for the investment to determine the fair value of the investment. The Fund may also use an income-based valuation approach in which the anticipated future cash flows of the investment are discounted to calculate fair value. Discounts may also be applied due to the nature or duration of any restrictions on the disposition of the investments. Valuations may also be based upon current market prices of securities that are comparable in coupon, rating, maturity and industry. The derived value of a Level 3 investment may not represent the value which is received upon disposition and this could impact the results of operations.
The following tables summarize the valuation of the each Fund’s investments by fair value hierarchy levels as of August 31, 2012:
| Delaware Tax-Free Minnesota Fund | ||||
| Level 2 | ||||
| Municipal Bonds | $ | 619,070,442 | ||
| Short-Term Investments | 1,965,000 | |||
| Total | $ | 621,035,442 | ||
82
| Delaware Tax-Free Minnesota Intermediate Fund | ||||||||
| Level 2 | ||||||||
| Municipal Bonds | $ | 113,505,358 | ||||||
| Delaware Minnesota High-Yield Municipal Bond Fund | ||||||||
| Level 1 | Level 2 | Total | ||||||
| Municipal Bonds | $ | — | $ | 159,227,092 | $ | 159,227,092 | ||
| Short-Term Investments | 429,529 | 1,000,000 | 1,429,529 | |||||
| Total | $ | 429,529 | $ | 160,227,092 | $ | 160,656,621 | ||
During the year ended August 31, 2012, there were no transfers between Level 1 investments, Level 2 investments or Level 3 investments that had a material impact to the Funds. Each Fund’s policy is to recognize transfers between levels at the beginning of the reporting period.
4. Dividend and Distribution Information
Income and long-term capital gain distributions are determined in accordance with federal income tax regulations, which may differ from U.S. GAAP. Additionally, distributions from net short-term gains on sales of investment securities are treated as ordinary income for federal income tax purposes. The tax character of dividends and distributions paid during the years ended August 31, 2012 and 2011 was as follows:
| Delaware Tax-Free | Delaware Minnesota | |||||||||||||
| Delaware Tax-Free | Minnesota | High-Yield Municipal | ||||||||||||
| Minnesota Fund | Intermediate Fund | Bond Fund | ||||||||||||
| Year Ended 8/31/12 | ||||||||||||||
| Ordinary income | $ | 99,433 | $ | 3,837 | $ | 83,396 | ||||||||
| Tax-exempt income | 22,376,736 | 3,248,342 | 5,495,222 | |||||||||||
| Long-term capital gain | 5,011,160 | — | — | |||||||||||
| Total | $ | 27,487,329 | $ | 3,252,179 | $ | 5,578,618 | ||||||||
| Year Ended 8/31/11 | ||||||||||||||
| Ordinary income | $ | 1,050,612 | $ | 10,335 | $ | 9,171 | ||||||||
| Tax-exempt income | 23,194,282 | 3,401,774 | 5,665,065 | |||||||||||
| Long-term capital gain | 1,575,686 | — | — | |||||||||||
| Total | $ | 25,820,580 | $ | 3,412,109 | $ | 5,674,236 | ||||||||
83
Notes to financial statements
Delaware Investments® Minnesota Municipal Bond Funds
5. Components of Net Assets on a Tax Basis
As of August 31, 2012, the components of net assets on a tax basis were as follows:
| Delaware Tax-Free | Delaware Minnesota | ||||||||||||||||
| Delaware Tax-Free | Minnesota | High-Yield Municipal | |||||||||||||||
| Minnesota Fund | Intermediate Fund | Bond Fund | |||||||||||||||
| Shares of beneficial interest | $ | 565,231,623 | $ | 105,093,096 | $ | 153,706,617 | |||||||||||
| Distributions payable | (537,798 | ) | (77,922 | ) | (138,127 | ) | |||||||||||
| Undistributed ordinary income | 548,251 | — | — | ||||||||||||||
| Undistributed long-term capital gains | 3,067,479 | 23,292 | — | ||||||||||||||
| Undistributed tax-exempt income | 386,802 | 80,444 | 138,127 | ||||||||||||||
| Capital loss carryforwards | — | — | (3,404,628 | ) | |||||||||||||
| Qualified late year losses deferred | — | — | (18,352 | ) | |||||||||||||
| Unrealized appreciation of investments | 51,847,527 | 8,250,193 | 9,793,727 | ||||||||||||||
| Net assets | $ | 620,543,884 | $ | 113,369,103 | $ | 160,077,364 | |||||||||||
The differences between book basis and tax basis components of net assets are primarily attributable to tax treatment of market discount and premium on debt instruments and distributions payable.
Qualified late year losses represent losses realized on investment transactions from November 1, 2011 through August 31, 2012 that, in accordance with federal income tax regulations, the Funds have elected to defer and treat as having arisen in the following fiscal year.
For financial reporting purposes, capital accounts are adjusted to reflect the tax character of permanent book/tax differences. Reclassifications are primarily due to tax treatment of market discount and premium on certain debt instruments and capital loss carryforwards expired. Results of operations and net assets were not affected by these reclassifications. For the year ended August 31, 2012 the Funds recorded the following reclassifications:
| Delaware Tax-Free | Delaware Minnesota | ||||||||||||||||
| Delaware Tax-Free | Minnesota | High-Yield Municipal | |||||||||||||||
| Minnesota Fund | Intermediate Fund | Bond Fund | |||||||||||||||
| Paid-in capital | $ | — | $ | — | $ | (25,904 | ) | ||||||||||
| Undistributed (Distributions in excess of) | |||||||||||||||||
| net investment income | 68,506 | 3,523 | 75,369 | ||||||||||||||
| Accumulated net realized gain (loss) | (68,506 | ) | (3,523 | ) | (49,465 | ) | |||||||||||
84
For federal income tax purposes, capital loss carryforwards may be carried forward and applied against future capital gains. $25,904 expired in 2012 for Delaware Minnesota High- Yield Municipal Bond Fund. In 2012, the Funds utilized capital loss carryforwards as follows:
| Delaware Tax-Free | Delaware Minnesota | ||||
| Delaware Tax-Free | Minnesota | High-Yield Municipal | |||
| Minnesota Fund | Intermediate Fund | Bond Fund | |||
| $— | $517,048 | $— |
Capital loss carryforwards remaining at August 31, 2012 will expire as follows:
| Delaware Tax-Free | Delaware Minnesota | |||||||||||
| Delaware Tax-Free | Minnesota | High-Yield Municipal | ||||||||||
| Year of Expiration | Minnesota Fund | Intermediate Fund | Bond Fund | |||||||||
| 2015 | $— | $— | $ 96,079 | |||||||||
| 2016 | — | — | 198,826 | |||||||||
| 2017 | — | — | 129,724 | |||||||||
| 2018 | — | — | 2,974,512 | |||||||||
| Total | $— | $— | $3,399,141 | |||||||||
On December 22, 2010, the Regulated Investment Company Modernization Act of 2010 (Act) was enacted, which changed various technical rules governing the tax treatment of regulated investment companies. The changes are generally effective for taxable years beginning after the date of enactment. Under the Act, the Funds are permitted to carry forward capital losses incurred in taxable years beginning after the date of enactment for an unlimited period. However, any losses incurred during those future taxable years will be required to be utilized prior to the losses incurred in pre-enactment taxable years, which carry an expiration date. As a result of this ordering rule, pre-enactment capital loss carryforwards may be more likely to expire unused. Additionally, post-enactment capital loss carryforwards will retain their character as either short-term or long-term capital losses rather than being considered all short-term as permitted under previous regulation. Losses incurred that will be carried forward under the Act are as follows:
| Delaware Minnesota | ||
| High-Yield Municipal | ||
| Bond Fund | ||
| Long-term | $5,487 |
85
Notes to financial statements
Delaware Investments® Minnesota Municipal Bond Funds
6. Capital Shares
Transactions in capital shares were as follows:
| Delaware | Delaware Tax-Free | Delaware Minnesota | |||||||||||||||
| Tax-Free | Minnesota | High-Yield Municipal | |||||||||||||||
| Minnesota Fund | Intermediate Fund | Bond Fund | |||||||||||||||
| Year Ended | Year Ended | Year Ended | |||||||||||||||
| 8/31/12 | 8/31/11 | 8/31/12 | 8/31/11 | 8/31/12 | 8/31/11 | ||||||||||||
| Shares sold: | |||||||||||||||||
| Class A | 3,091,804 | 2,784,944 | 1,383,234 | 1,278,854 | 1,931,325 | 1,315,787 | |||||||||||
| Class B | 36 | 9 | — | — | 18 | 70 | |||||||||||
| Class C | 632,910 | 389,789 | 345,207 | 233,759 | 651,422 | 355,964 | |||||||||||
| Shares issued upon reinvestment of dividends and distributions: | |||||||||||||||||
| Class A | 1,504,779 | 1,346,957 | 194,658 | 182,978 | 304,071 | 289,772 | |||||||||||
| Class B | 6,665 | 10,683 | 262 | 339 | 6,170 | 9,606 | |||||||||||
| Class C | 98,132 | 88,175 | 24,905 | 25,813 | 72,228 | 71,925 | |||||||||||
| 5,334,326 | 4,620,557 | 1,948,266 | 1,721,743 | 2,965,234 | 2,043,124 | ||||||||||||
| Shares redeemed: | |||||||||||||||||
| Class A | (3,426,551 | ) | (7,071,017 | ) | (1,061,511 | ) | (2,115,142 | ) | (1,349,135 | ) | (2,349,386 | ) | |||||
| Class B | (140,567 | ) | (282,324 | ) | (1,396 | ) | (3,322 | ) | (107,644 | ) | (119,593 | ) | |||||
| Class C | (315,576 | ) | (779,160 | ) | (217,764 | ) | (303,643 | ) | (253,002 | ) | (563,750 | ) | |||||
| (3,882,694 | ) | (8,132,501 | ) | (1,280,671 | ) | (2,422,107 | ) | (1,709,781 | ) | (3,032,729 | ) | ||||||
| Net increase (decrease) | 1,451,632 | (3,511,944 | ) | 667,595 | (700,364 | ) | 1,255,453 | (989,605 | ) | ||||||||
For the years ended August 31, 2012 and 2011, the following shares and values were converted from Class B shares to Class A shares. The amounts are included in Class B redemptions and Class A subscriptions in the tables on the previous page and the statements of changes in net assets.
| Year Ended | Year Ended | ||||||||||||
| 8/31/12 | 8/31/11 | ||||||||||||
| Class B | Class A | Class B | Class A | ||||||||||
| Shares | Shares | Value | Shares | Shares | Value | ||||||||
| Delaware Tax-Free | |||||||||||||
| Minnesota Fund | 100,968 | 101,119 | $ | 1,278,778 | 175,162 | 175,266 | $ | 2,154,184 | |||||
| Delaware Tax-Free Minnesota | |||||||||||||
| Intermediate Fund | 132 | 133 | 1,499 | 1,576 | 1,580 | 17,494 | |||||||
| Delaware Minnesota High-Yield | |||||||||||||
| Municipal Bond Fund | 30,819 | 30,882 | 330,849 | 46,556 | 46,619 | 480,052 | |||||||
86
7. Line of Credit
Each Fund, along with certain other funds in the Delaware Investments® Family of Funds (Participants), was a participant in a $100,000,000 revolving line of credit to be used for temporary or emergency purposes as an additional source of liquidity to fund redemptions of investor shares. Under the agreement, the Participants were charged an annual commitment fee, which was allocated across the Participants on the basis of each Participant’s allocation of the entire facility. The Participants were permitted to borrow up to a maximum of one third of their net assets under the agreement. The line of credit under the agreement expired on November 15, 2011.
On November 15, 2011, the Funds, along with the other Participants, entered into an amendment to the agreement for a $125,000,000 revolving line of credit. The agreement is to be used as described above and operates in substantially the same manner as the original agreement. The agreement expires on November 13, 2012. The Funds had no amounts outstanding as of August 31, 2012 or at any time during the year then ended.
8. Derivatives
U.S. GAAP requires disclosures that enable investors to understand: 1) how and why an entity uses derivatives; 2) how they are accounted for; and 3) how they affect an entity’s results of operations and financial position.
Inverse Floaters — Each Fund may participate in inverse floater programs where a Fund transfers its own bonds to a trust that issues floating rate securities and inverse floating rate securities (inverse floaters) with an aggregate principal amount equal to the principal of the transferred bonds. The inverse floaters received by the Funds are derivative tax-exempt obligations with floating or variable interest rates that move in the opposite direction of short-term interest rates, usually at an accelerated speed. Consequently, the market values of the inverse floaters will generally be more volatile than other tax-exempt investments. The Funds typically use inverse floaters to adjust the duration of their portfolio. Duration measures a portfolio’s sensitivity to changes in interest rates. By holding inverse floaters with a different duration than the underlying bonds that a Fund transferred to the trust, the Fund seeks to adjust its portfolio’s sensitivity to changes in interest rates. The Funds may also invest in inverse floaters to add additional income to the Funds or to adjust the Funds’ exposure to a specific segment of the yield curve. At August 31, 2012, the Funds held no investments in inverse floaters.
9. Credit and Market Risk
The Funds concentrate their investments in securities issued by municipalities, mainly in Minnesota. The value of these investments may be adversely affected by new legislation within the state, regional or local economic conditions, and differing levels of supply and demand for municipal bonds. Many municipalities insure repayment for their obligations. Although bond insurance reduces the risk of loss due to default by an issuer, such bonds remain subject to the risk that market value may fluctuate for other reasons and there is no assurance that the insurance company will meet its obligations. A real or perceived decline in creditworthiness of
87
Notes to financial statements
Delaware Investments® Minnesota Municipal Bond Funds
9. Credit and Market Risk (continued)
a bond insurer can have an adverse impact on the value of insured bonds held in each Fund. At August 31, 2012, the percentages of each Fund’s net assets insured by insurers are listed below and these securities have been identified in the statements of net assets.
| Delaware Tax-Free | Delaware Minnesota | |||||
| Delaware Tax-Free | Minnesota | High-Yield Municipal | ||||
| Minnesota Fund | Intermediate Fund | Bond Fund | ||||
| 14% | 14% | 10% |
Each Fund invests a portion of its assets in high yield fixed income securities, which are securities rated lower than BBB- by Standard & Poor’s (S&P) and Baa3 by Moody’s Investors Service, Inc. (Moody’s), or similarly rated by another nationally recognized statistical rating organization. Investments in these higher yielding securities are generally accompanied by a greater degree of credit risk than higher rated securities. Additionally, lower rated securities may be more susceptible to adverse economic and competitive industry conditions than investment-grade securities.
The Funds may invest in advance refunded bonds, escrow secured bonds or defeased bonds. Under current federal tax laws and regulations, state and local government borrowers are permitted to refinance outstanding bonds by issuing new bonds. The issuer refinances the outstanding debt to either reduce interest costs or to remove or alter restrictive covenants imposed by the bonds being refinanced. A refunding transaction where the municipal securities are being refunded within 90 days from the issuance of the refunding issue is known as a “current refunding.” Advance refunded bonds are bonds in which the refunded bond issue remains outstanding for more than 90 days following the issuance of the refunding issue. In an advance refunding, the issuer will use the proceeds of a new bond issue to purchase high grade interest bearing debt securities, which are then deposited in an irrevocable escrow account held by an escrow agent to secure all future payments of principal and interest and bond premium of the advance refunded bond. Bonds are “escrowed to maturity” when the proceeds of the refunding issue are deposited in an escrow account for investment sufficient to pay all of the principal and interest on the original interest payment and maturity dates.
Bonds are considered “pre-refunded” when the refunding issue’s proceeds are escrowed only until a permitted call date or dates on the refunded issue with the refunded issue being redeemed at the time, including any required premium. Bonds become “defeased” when the rights and interests of the bondholders and of their lien on the pledged revenues or other security under the terms of the bond contract and are substituted with an alternative source of revenues (the escrow securities) sufficient to meet payments of principal and interest to maturity or to the first call dates. Escrowed secured bonds will often receive a rating of AAA from Moody’s, S&P, and/or Fitch Ratings due to the strong credit quality of the escrow securities and the irrevocable nature of the escrow deposit agreement.
88
Each Fund may invest up to 15% of its net assets in illiquid securities, which may include securities with contractual restrictions on resale, securities exempt from registration under Rule 144A of the Securities Act of 1933, as amended, and other securities which may not be readily marketable. The relative illiquidity of these securities may impair each Fund from disposing of them in a timely manner and at a fair price when it is necessary or desirable to do so. While maintaining oversight, each Fund’s Board has delegated to DMC the day-to-day functions of determining whether individual securities are liquid for purposes of each Fund’s limitation on investments in illiquid securities. Securities eligible for resale pursuant to Rule 144A, which are determined to be liquid, are not subject to the Funds’ 15% limit on investments in illiquid securities. As of August 31, 2012, there were no Rule 144A securities. Illiquid securities have been identified on the statements of net assets.
10. Contractual Obligations
The Funds enter into contracts in the normal course of business that contain a variety of indemnifications. The Funds’ maximum exposure under these arrangements is unknown. However, the Funds have not had prior claims or losses pursuant to these contracts. Management has reviewed each Fund’s existing contracts and expects the risk of loss to be remote.
11. Subsequent Events
Management has determined that no material events or transactions occurred subsequent to August 31, 2012 that would require recognition or disclosure in the Funds’ financial statements.
89
Report of independent
registered public accounting firm
To the Board of Trustees of Voyageur Tax Free Funds, Voyageur Intermediate Tax Free Funds and Voyageur Mutual Funds and the Shareholders of Delaware Tax-Free Minnesota Fund, Delaware Tax-Free Minnesota Intermediate Fund and Delaware Minnesota High-Yield Municipal Bond Fund:
In our opinion, the accompanying statements of net assets and the related statements of operations and of changes in net assets and the financial highlights present fairly, in all material respects, the financial position of Delaware Tax-Free Minnesota Fund (constituting Voyageur Tax Free Funds), Delaware Tax-Free Minnesota Intermediate Fund (constituting Voyageur Intermediate Tax Free Funds) and Delaware Minnesota High-Yield Municipal Bond Fund (one of the series constituting Voyageur Mutual Funds) (hereafter collectively referred to as the “Funds”) at August 31, 2012, the results of each of their operations for the year then ended, the changes in each of their net assets for each of the two years in the period then ended and the financial highlights for each of the three years in the period then ended, in conformity with accounting principles generally accepted in the United States of America. These financial statements and financial highlights (hereafter referred to as “financial statements”) are the responsibility of the Funds’ management; our responsibility is to express an opinion on these financial statements based on our audits. We conducted our audits of these financial statements in accordance with the standards of the Public Company Accounting Oversight Board (United States). Those standards require that we plan and perform the audit to obtain reasonable assurance about whether the financial statements are free of material misstatement. An audit includes examining, on a test basis, evidence supporting the amounts and disclosures in the financial statements, assessing the accounting principles used and significant estimates made by management, and evaluating the overall financial statement presentation. We believe that our audits, which included confirmation of securities at August 31, 2012 by correspondence with the custodian and broker, provide a reasonable basis for our opinion. The financial highlights for each of the two years in the period ended August 31, 2009 were audited by other independent accountants whose report dated October 19, 2009 expressed an unqualified opinion on those statements.
PricewaterhouseCoopers LLP
Philadelphia, Pennsylvania
October 18, 2012
90
Other Fund information
(Unaudited)
Delaware Investments® Minnesota Municipal Bond Funds
Board Consideration of Delaware Minnesota High-Yield Municipal Bond Fund, Delaware Tax-Free Minnesota Fund and Delaware Tax-Free Minnesota Intermediate Fund Investment Advisory Agreements
At a meeting held on August 21-23, 2012 (the “Annual Meeting”), the Board of Trustees (the “Board”), including a majority of disinterested or independent Trustees, approved the renewal of the Investment Advisory Agreement for each of the Delaware Minnesota High-Yield Municipal Bond Fund, Delaware Tax-Free Minnesota Fund and Delaware Tax-Free Minnesota Intermediate Fund (each, a “Fund” and together, the “Funds”). In making its decision, the Board considered information furnished at regular quarterly Board meetings, including reports detailing Fund performance, investment strategies and expenses, as well as information prepared specifically in connection with the renewal of the investment advisory and sub-advisory contracts. Information furnished specifically in connection with the renewal of the Investment Advisory Agreements with Delaware Management Company (“DMC”) included materials provided by DMC and its affiliates (“Delaware Investments”) concerning, among other things, the nature, extent and quality of services provided to the Funds, the costs of such services to the Funds, economies of scale and the financial condition and profitability of Delaware Investments. In addition, in connection with the Annual Meeting, reports were provided in May 2012 and included independent historical and comparative reports provided by Lipper, Inc., an independent statistical compilation organization (“Lipper”). The Lipper reports compared each Fund’s investment performance and expenses with those of other comparable mutual funds. The Independent Trustees reviewed and discussed the Lipper reports with independent legal counsel to the Independent Trustees. The Board requested and received information regarding DMC’s policy with respect to advisory fee levels and its breakpoint philosophy; the structure of portfolio manager compensation; the investment manager’s profitability; comparative client fee information; and any constraints or limitations on the availability of securities in certain investment styles, which had in the past year inhibited, or which were likely in the future to inhibit, DMC’s ability to invest fully in accordance with Fund policies.
In considering information relating to the approval of each Fund’s advisory agreement, the Independent Trustees received assistance and advice from and met separately with independent legal counsel to the Independent Trustees. Although the Board gave attention to all information furnished, the following discussion identifies, under separate headings, the primary factors taken into account by the Board during its contract renewal considerations.
Nature, Extent and Quality of Service. The Board considered the services provided by Delaware Investments to the Funds and their shareholders. In reviewing the nature, extent and quality of services, the Board considered reports furnished to it throughout the year, which covered matters such as the relative performance of the Funds, compliance of portfolio managers with the investment policies, strategies and restrictions for the Funds, compliance by DMC and Delaware Distributors, L.P. (together, “Management”) personnel with the Code of Ethics adopted throughout the Delaware Investments Family of Funds complex and adherence to fair value pricing procedures as established by the Board. The Board was pleased with the current staffing of
91
Other Fund information
(Unaudited)
Delaware Investments® Minnesota Municipal Bond Funds
Board Consideration of Delaware Minnesota High-Yield Municipal Bond Fund, Delaware Tax-Free Minnesota Fund and Delaware Tax-Free Minnesota Intermediate Fund Investment Advisory Agreements (continued)
the Funds’ investment advisor and the emphasis placed on research in the investment process. The Board recognized DMC’s receipt of several industry awards, including being named best fund family for 2011 by Barron’s and best mixed asset small company by Lipper for the second year in a row. The Board gave favorable consideration to DMC’s efforts to control expenditures while maintaining service levels committed to fund matters. The Board noted that in July 2011 Management implemented measures to reduce overall costs and improve transfer agent and shareholder servicing functions through outsourcing. The Board noted the benefits provided to Fund shareholders through each shareholder’s ability to exchange an investment in one Delaware Investments fund for the same class of shares in another Delaware Investments fund without a sales charge, to reinvest Fund dividends into additional shares of the same Fund or into additional shares of other Delaware Investments funds and the privilege to combine holdings in other Delaware Investments funds to obtain a reduced sales charge. The Board was satisfied with the nature, extent and quality of the overall services provided by Delaware Investments.
Investment Performance. The Board placed significant emphasis on the investment performance of the Funds in view of the importance of investment performance to shareholders. Although the Board gave appropriate consideration to performance reports and discussions with portfolio managers at Investment Committee meetings throughout the year, the Board gave particular weight to the Lipper reports furnished for the Annual Meeting. The Lipper reports prepared for each Fund showed the investment performance of its Class A shares in comparison to a group of similar funds as selected by Lipper (the “Performance Universe”). A fund with the best performance ranked first, and a fund with the poorest performance ranked last. The highest/best performing 25% of funds in the Performance Universe make up the first quartile; the next 25%, the second quartile; the next 25%, the third quartile; and the poorest/ worst performing 25% of funds in the Performance Universe make up the fourth quartile. Comparative annualized performance for each Fund was shown for the past one-, three-, five- and ten-year periods, as applicable, ended March 31, 2012. The Board’s objective is that each Fund’s performance for the periods considered be at or above the median of its Performance Universe. The following paragraphs summarize the performance results for the Funds and the Board’s view of such performance.
Delaware Minnesota High-Yield Municipal Bond Fund — Lipper currently classifies the Fund as a Minnesota municipal debt fund. However, Management believes that it would be more appropriate to include the Fund in the high yield municipal debt funds category, which would provide a comparison to a representative peer group based on credit quality instead of a peer group based on state of issuance. Accordingly, the Lipper report prepared for the Fund compares the Fund’s performance to two separate Performance Universes-one consisting of the Fund and all retail and institutional Minnesota municipal debt funds and the other consisting of the Fund and all retail and institutional high yield municipal debt funds. When compared to other Minnesota
92
municipal debt funds, the Lipper report comparison showed that the Fund’s total return for the one-, three- and ten-year periods was in the first quartile of its Performance Universe and the Fund’s total return for the five-year period was in the second quartile. When compared to other high yield municipal debt funds, the Lipper report comparison showed that the Fund’s total return for the one- and three-year periods was in the fourth quartile of the Performance Universe and the Fund’s total return for the five- and ten-year periods was in the first quartile. The Board observed that, when compared to other high yield municipal debt funds, the Fund’s shorter-term performance results were not in line with the Board’s objective. In evaluating the Fund’s performance, the Board considered the numerous investment and performance reports delivered by Management personnel to the Board’s Investments Committee. The Board was satisfied that Management was taking action to improve Fund performance and meet the Board’s performance objective.
Delaware Tax-Free Minnesota Fund — The Performance Universe for the Fund consisted of the Fund and all retail and institutional Minnesota municipal debt funds as selected by Lipper. The Lipper report comparison showed that the Fund’s total return for the one- and three-year periods was in the second quartile of its Performance Universe. The report further showed that the Fund’s total return for the five- and ten-year periods was in the first quartile. The Board was satisfied with performance.
Delaware Tax-Free Minnesota Intermediate Fund — The Performance Universe for the Fund consisted of the Fund and all retail and institutional other state intermediate municipal debt funds as selected by Lipper. The Lipper report comparison showed that the Fund’s total return for the one- and ten-year periods was in the first quartile of its Performance Universe. The report further showed that the Fund’s total return for the three- and five-year periods was in the second quartile. The Board was satisfied with performance.
Comparative Expenses. The Board considered expense comparison data for the Delaware Investments® Family of Funds. Management provided the Board with information on pricing levels and fee structures for each Fund as of its most recently completed fiscal year. The Board also focused on the comparative analysis of effective management fees and total expense ratios of each Fund versus effective management fees and expense ratios of a group of similar funds as selected by Lipper (the “Expense Group”). In reviewing comparative costs, each Fund’s contractual management fee and the actual management fee incurred by the Fund were compared with the contractual management fees (assuming all funds in the Expense Group were similar in size to the Fund) and actual management fees (as reported by each fund) within the Expense Group, taking into account any applicable breakpoints and fee waivers. Each Fund’s total expenses were also compared with those of its Expense Group. The Lipper total expenses, for comparative consistency, were shown by Lipper for Class A shares and comparative total expenses including 12b-1 and non 12b-1 service fees. The Board considered fees paid to Delaware Investments for non-management services. The Board’s objective is to limit each Fund’s total expense ratio to be competitive with that of the Expense Group. The following paragraphs summarize the expense results for the Funds and the Board’s view of such expenses.
93
Other Fund information
(Unaudited)
Delaware Investments® Minnesota Municipal Bond Funds
Board Consideration of Delaware Minnesota High-Yield Municipal Bond Fund, Delaware Tax-Free Minnesota Fund and Delaware Tax-Free Minnesota Intermediate Fund Investment Advisory Agreements (continued)
Delaware Minnesota High-Yield Municipal Bond Fund — When compared to other Minnesota municipal debt funds, the expense comparisons for the Fund showed that its actual management fee was in the quartile with the second highest expenses of the Expense Group and its total expenses were in the quartile with the highest expenses of the Expense Group. When compared to other high yield municipal debt funds, the expense comparisons for the Fund showed that its actual management fee was in the quartile with the second lowest expenses of its Expense Group and its total expenses were in the quartile with the second highest expenses of the Expense. The Board noted that the Fund’s total expenses were not in line with the Board’s objective. In evaluating the total expenses, the Board considered fee waivers in place through December 2012 and various initiatives implemented by Management, such as the outsourcing of certain transfer agency services, creating an opportunity for a reduction in total expenses. The Board was satisfied with Management’s efforts to improve the Fund’s total expense ratio and bring it in line with the Board’s objective.
Delaware Tax-Free Minnesota Fund — The expense comparisons for the Fund showed that its actual management fee was in the quartile with the second highest expenses of its Expense Group and its total expenses were in the quartile with the highest expenses of its Expense Group. The Board noted that the Fund’s total expenses were not in line with the Board’s objective. In evaluating the total expenses, the Board considered waivers in place through December 2012 and various initiatives implemented by Management, such as the outsourcing of certain transfer agency services, creating an opportunity for a reduction in expenses. The Board was satisfied with Management’s efforts to improve the Fund’s total expense ratio and bring it in line with the Board’s objective.
Delaware Tax-Free Minnesota Intermediate Fund - The expense comparisons for the Fund showed that its actual management fee and total expenses were in the quartile with the second highest expenses of its Expense Group. The Board noted that the Fund’s total expenses were not in line with the Board’s objective. In evaluating the total expenses, the Board considered waivers in place through December 2012 and various initiatives implemented by Management, such as the outsourcing of certain transfer agency services, creating an opportunity for a reduction in expenses. The Board was satisfied with Management’s efforts to improve the Fund’s total expense ratio and bring it in line with the Board’s objective.
Management Profitability. The Board considered the level of profits realized by Delaware Investments in connection with the operation of the Funds. In this respect, the Board reviewed the Investment Management Profitability Analysis that addressed the overall profitability of Delaware Investments’ business in providing management and other services to each of the individual funds and the Delaware Investments Family of Funds as a whole. Specific attention was given to the methodology followed in allocating costs for the purpose of determining profitability. Management stated that the level of profits of Delaware Investments, to a certain extent, reflects
94
recent operational cost savings and efficiencies initiated by Delaware Investments. The Board considered Delaware Investments’ efforts to improve services provided to fund shareholders and to meet additional regulatory and compliance requirements resulting from recent industry-wide Securities and Exchange Commission initiatives. The Board also considered the extent to which Delaware Investments might derive ancillary benefits from fund operations, including the potential for procuring additional business as a result of the prestige and visibility associated with its role as service provider to the Delaware Investments® Family of Funds and the benefits from allocation of fund brokerage to improve trading efficiencies. The Board found that the management fees were reasonable in light of the services rendered and the level of profitability of Delaware Investments.
Economies of Scale. The Trustees considered whether economies of scale are realized by Delaware Investments as each Fund’s assets increase and the extent to which any economies of scale are reflected in the level of management fees charged. The Trustees reviewed the standardized advisory fee pricing and structure, approved by the Board and shareholders, which includes breakpoints. Breakpoints in the advisory fee occur when the advisory fee rate is reduced on assets in excess of specified levels. Breakpoints result in a lower advisory fee than would otherwise be the case on all assets when the asset levels specified are exceeded. The Board noted that the fee under each Fund’s management contract fell within the standard structure. Although the Delaware Minnesota High-Yield Municipal Bond Fund and Delaware Tax-Free Minnesota Intermediate Fund have not reached a size at which they can take advantage of breakpoints, the Board recognized that each Fund’s fee was structured so that when the Fund grows, economies of scale may be shared. The Board also noted that the Delaware Tax-Free Minnesota Fund’s assets exceeded the first breakpoint level. The Board believed that, given the extent to which economics of scale might be realized by the advisor and its affiliates, the schedule of fees under the Investment Advisory Agreement provides a sharing of benefits with the Fund and its shareholders.
Tax Information
The information set forth below is for the Funds’ fiscal year as required by federal income tax laws. Shareholders, however, must report distributions on a calendar year basis for income tax purposes, which may include distributions for portions of two fiscal years of a fund. Accordingly, the information needed by shareholders for income tax purposes will be sent to them in January of each year. Please consult your tax advisor for proper treatment of this information.
All designations are based on financial information available as of the date of this annual report and, accordingly are subject to change. For any and all items requiring designation, it is the intention of each Fund to designate the maximum amount permitted under the Internal Revenue Code and the regulations thereunder.
95
Other Fund information
(Unaudited)
Delaware Investments® Minnesota Municipal Bond Funds
Tax Information (continued)
For the fiscal year ended August 31, 2012, each Fund designates distributions paid during the year as follows:
| (A) | (B) | (C) | |||||||
| Long-Term | Ordinary | Tax-Exempt | |||||||
| Capital Gain | Income | Income | Total | ||||||
| Distributions | Distributions | Distributions | Distributions | ||||||
| (Tax Basis) | (Tax Basis) | (Tax Basis) | (Tax Basis) | ||||||
| Delaware Tax-Free Minnesota Fund | 18.23 | % | 0.36% | 81.41% | 100.00% | ||||
| Delaware Tax-Free Minnesota | |||||||||
| Intermediate Fund | — | 0.12% | 99.88% | 100.00% | |||||
| Delaware Minnesota High-Yield | |||||||||
| Municipal Bond Fund | — | 1.50% | 98.50% | 100.00% | |||||
(A), (B) and (C) are based on a percentage of each Fund’s total distributions.
96
Board of trustees/directors and officers addendum
Delaware Investments® Family of Funds
A mutual fund is governed by a Board of Trustees/Directors (“Trustees”), which has oversight responsibility for the management of a fund’s business affairs. Trustees establish procedures and oversee and review the performance of the investment manager, the distributor, and others who perform services for the fund. The independent fund trustees, in particular, are advocates
| Name, Address, | Position(s) | Length of | ||
| and Birth Date | Held with Fund(s) | Time Served | ||
| Interested Trustees | ||||
| Patrick P. Coyne1 | Chairman, President, | Chairman and Trustee | ||
| 2005 Market Street | Chief Executive Officer, | since August 16, 2006 | ||
| Philadelphia, PA 19103 | and Trustee | |||
| April 1963 | President and | |||
| Chief Executive Officer | ||||
| since August 1, 2006 | ||||
1 Patrick P. Coyne is considered to be an “Interested Trustee” because he is an executive officer of the Fund’s(s’) investment advisor.
98
for shareholder interests. Each trustee has served in that capacity since he or she was elected to or appointed to the Board of Trustees, and will continue to serve until his or her retirement or the election of a new trustee in his or her place. The following is a list of the Trustees and Officers with certain background and related information.
| Number of Portfolios in | ||||
| Principal Occupation(s) | Fund Complex Overseen | Other Directorships | ||
| During Past 5 Years | by Trustee or Officer | Held by Trustee or Officer | ||
| Patrick P. Coyne has served in | 71 | Director and Audit | ||
| various executive capacities | Committee Member | |||
| at different times at | Kaydon Corp. | |||
| Delaware Investments.2 | ||||
| Board of Governors Member | ||||
| Investment Company | ||||
| Institute (ICI) | ||||
2 Delaware Investments is the marketing name for Delaware Management Holdings, Inc. and its subsidiaries, including the Fund’s(s’) investment advisor, principal underwriter, and its transfer agent.
99
Board of trustees/directors and officers addendum
Delaware Investments® Family of Funds
| Name, Address, | Position(s) | Length of | ||
| and Birth Date | Held with Fund(s) | Time Served | ||
| Independent Trustees | ||||
| Thomas L. Bennett | Trustee | Since March 2005 | ||
| 2005 Market Street | ||||
| Philadelphia, PA 19103 | ||||
| October 1947 | ||||
| John A. Fry | Trustee | Since January 2001 | ||
| 2005 Market Street | ||||
| Philadelphia, PA 19103 | ||||
| May 1960 | ||||
| Anthony D. Knerr | Trustee | Since April 1990 | ||
| 2005 Market Street | ||||
| Philadelphia, PA 19103 | ||||
| December 1938 | ||||
| Lucinda S. Landreth | Trustee | Since March 2005 | ||
| 2005 Market Street | ||||
| Philadelphia, PA 19103 | ||||
| June 1947 | ||||
100
| Number of Portfolios in | ||||
| Principal Occupation(s) | Fund Complex Overseen | Other Directorships | ||
| During Past 5 Years | by Trustee or Officer | Held by Trustee or Officer | ||
| Private Investor | 71 | Director | ||
| (March 2004–Present) | Bryn Mawr Bank Corp. (BMTC) | |||
| (2007–2011) | ||||
| President | 71 | Board of Governors Member — | ||
| Drexel University | NASDAQ OMX PHLX LLC | |||
| (August 2010–Present) | ||||
| Director and Audit | ||||
| President | Committee Member | |||
| Franklin & Marshall College | Community Health Systems | |||
| (July 2002–July 2010) | ||||
| Director — Ecore | ||||
| International | ||||
| (2009–2010) | ||||
| Director — Allied | ||||
| Barton Securities Holdings | ||||
| (2005–2008) | ||||
| Managing Director | 71 | None | ||
| Anthony Knerr & Associates | ||||
| (Strategic Consulting) | ||||
| (1990–Present) | ||||
| Private Investor | 71 | None | ||
| (2004–Present) | ||||
101
Board of trustees/directors and officers addendum
Delaware Investments® Family of Funds
| Name, Address, | Position(s) | Length of | ||
| and Birth Date | Held with Fund(s) | Time Served | ||
| Independent Trustees (continued) | ||||
| Frances A. Sevilla-Sacasa | Trustee | Since September 2011 | ||
| 2005 Market Street | ||||
| Philadelphia, PA 19103 | ||||
| January 1956 | ||||
102
| Number of Portfolios in | ||||
| Principal Occupation(s) | Fund Complex Overseen | Other Directorships | ||
| During Past 5 Years | by Trustee or Officer | Held by Trustee or Officer | ||
| Chief Executive Officer — | 71 | Trust Manager — Camden | ||
| Banco Itaú Europa | Property Trust | |||
| International | (since August 2011) | |||
| (since April 2012) | ||||
| Executive Advisor to Dean | ||||
| (August 2011–March 2012) | ||||
| and Interim Dean | ||||
| (January 2011–July 2011) — | ||||
| University of Miami School of | ||||
| Business Administration | ||||
| President — U.S. Trust, | ||||
| Bank of America Private | ||||
| Wealth Management | ||||
| (Private Banking) | ||||
| (July 2007–December 2008) | ||||
103
Board of trustees/directors and officers addendum
Delaware Investments® Family of Funds
| Name, Address, | Position(s) | Length of | ||
| and Birth Date | Held with Fund(s) | Time Served | ||
| Independent Trustees (continued) | ||||
| Janet L. Yeomans | Trustee | Since April 1999 | ||
| 2005 Market Street | ||||
| Philadelphia, PA 19103 | ||||
| July 1948 | ||||
| J. Richard Zecher | Trustee | Since March 2005 | ||
| 2005 Market Street | ||||
| Philadelphia, PA 19103 | ||||
| July 1940 | ||||
104
| Number of Portfolios in | ||||
| Principal Occupation(s) | Fund Complex Overseen | Other Directorships | ||
| During Past 5 Years | by Trustee or Officer | Held by Trustee or Officer | ||
| Vice President and Treasurer | 71 | Director, Audit | ||
| (January 2006–July 2012) | Committee Member and | |||
| Vice President — Mergers & Acquisitions | Investment Committee | |||
| (January 2003–January 2006), and | Member | |||
| Vice President and Treasurer | Okabena Company | |||
| (July 1995–January 2003) | ||||
| 3M Corporation | Chair — 3M | |||
| Investment Management | ||||
| Company | ||||
| (January 2005–July 2012) | ||||
| Founder | 71 | Director and Compensation | ||
| Investor Analytics | Committee Member | |||
| (Risk Management) | Investor Analytics | |||
| (May 1999–Present) | ||||
| Director | ||||
| Founder | Oxigene, Inc. | |||
| P/E Investments | (2003–2008) | |||
| (Hedge Fund) | ||||
| (September 1996–Present) | ||||
105
Board of trustees/directors and officers addendum
Delaware Investments® Family of Funds
| Name, Address, | Position(s) | Length of | ||
| and Birth Date | Held with Fund(s) | Time Served | ||
| Officers | ||||
| David F. Connor | Vice President, | Vice President since | ||
| 2005 Market Street | Deputy General | September 2000 | ||
| Philadelphia, PA 19103 | Counsel, and Secretary | and Secretary since | ||
| December 1963 | October 2005 | |||
| Daniel V. Geatens | Vice President | Treasurer | ||
| 2005 Market Street | and Treasurer | since October 2007 | ||
| Philadelphia, PA 19103 | ||||
| October 1972 | ||||
| David P. O’Connor | Executive Vice President, | Executive Vice President | ||
| 2005 Market Street | General Counsel | since February 2012; | ||
| Philadelphia, PA 19103 | and Chief Legal Officer | Senior Vice President | ||
| February 1966 | October 2005– | |||
| February 2012; | ||||
| General Counsel and | ||||
| Chief Legal Officer | ||||
| since October 2005 | ||||
| Richard Salus | Senior Vice President | Chief Financial Officer | ||
| 2005 Market Street | and Chief Financial Officer | since November 2006 | ||
| Philadelphia, PA 19103 | ||||
| October 1963 | ||||
The Statement of Additional Information for the Fund(s) includes additional information about the Trustees and Officers and is available, without charge, upon request by calling 800 523-1918.
106
| Number of Portfolios in | ||||
| Principal Occupation(s) | Fund Complex Overseen | Other Directorships | ||
| During Past 5 Years | by Trustee or Officer | Held by Trustee or Officer | ||
| David F. Connor has served as | 71 | None3 | ||
| Vice President and Deputy | ||||
| General Counsel of | ||||
| Delaware Investments | ||||
| since 2000. | ||||
| Daniel V. Geatens has served | 71 | None3 | ||
| in various capacities at | ||||
| different times at | ||||
| Delaware Investments. | ||||
| David P. O’Connor has served in | 71 | None3 | ||
| various executive and legal | ||||
| capacities at different times | ||||
| at Delaware Investments. | ||||
| Richard Salus has served in | 71 | None3 | ||
| various executive capacities | ||||
| at different times at | ||||
| Delaware Investments. | ||||
3 David F. Connor, Daniel V. Geatens, David P. O’Connor, and Richard Salus serve in similar capacities for the six portfolios of the Optimum Fund Trust, which have the same investment advisor, principal underwriter, and transfer agent as the registrant.
107
| Board of trustees | |||
Patrick P. Coyne Chairman, President, and Chief Executive Officer Delaware Investments® Family of Funds Philadelphia, PA Thomas L. Bennett | John A. Fry President Drexel University Philadelphia, PA Anthony D. Knerr | Lucinda S. Landreth Former Chief Investment Officer Assurant, Inc. Philadelphia, PA Frances A. | Janet L. Yeomans Former Vice President and Treasurer 3M Corporation St. Paul, MN J. Richard Zecher |
| Affiliated officers | |||
David F. Connor Vice President, Deputy General Counsel, and Secretary Delaware Investments Family of Funds Philadelphia, PA | Daniel V. Geatens Vice President and Treasurer Delaware Investments Family of Funds Philadelphia, PA | David P. O’Connor Executive Vice President, General Counsel, and Chief Legal Officer Delaware Investments Family of Funds Philadelphia, PA | Richard Salus Senior Vice President and Chief Financial Officer Delaware Investments Family of Funds Philadelphia, PA |
| This annual report is for the information of Delaware Tax-Free Minnesota Fund, Delaware Tax-Free Minnesota Intermediate Fund, and Delaware Minnesota High-Yield Municipal Bond Fund shareholders, but it may be used with prospective investors when preceded or accompanied by the Delaware Investments Fund fact sheet for the most recently completed calendar quarter. These documents are available at delawareinvestments.com. |
Delaware Investments is the marketing name of Delaware Management Holdings, Inc. and its subsidiaries. Each Fund files its complete schedule of portfolio holdings with the Securities and Exchange Commission (SEC) for the first and third quarters of each fiscal year on Form N-Q. Each Fund’s Forms N-Q, as well as a description of the policies and procedures that each Fund uses to determine how to vote proxies (if any) relating to portfolio securities are available without charge (i) upon request, by calling 800 523-1918; and (ii) on the SEC’s website at sec.gov. In addition, a description of the policies and procedures that each Fund uses to determine how to vote proxies (if any) relating to portfolio securities and each Fund’s Schedule of Investments are available without charge on the Funds’ website at delawareinvestments.com. Each Fund’s Forms N-Q may be reviewed and copied at the SEC’s Public Reference Room in Washington, D.C.; information on the operation of the Public Reference Room may be obtained by calling 800 SEC-0330. Information (if any) regarding how each Fund voted proxies relating to portfolio securities during the most recently disclosed 12-month period ended June 30 is available without charge (i) through the Funds’ website at delawareinvestments.com; and (ii) on the SEC’s website at sec.gov. |
108
Annual report Delaware Tax-Free USA Fund Delaware Tax-Free USA Intermediate Fund Delaware National High-Yield Municipal Bond Fund August 31, 2012 Fixed income mutual funds |
| Carefully consider the Funds’ investment objectives, risk factors, charges, and expenses before investing. This and other information can be found in the Funds’ prospectuses and, if available, their summary prospectuses, which may be obtained by visiting delawareinvestments.com or calling 800 523-1918. Investors should read the prospectus and, if available, the summary prospectus carefully before investing. |
You can obtain shareholder reports and prospectuses online instead of in the mail. Visit delawareinvestments.com/edelivery. |
Experience Delaware Investments
Delaware Investments is committed to the pursuit of consistently superior asset management and unparalleled client service. We believe in our investment processes, which seek to deliver consistent results, and in convenient services that help add value for our clients.
If you are interested in learning more about creating an investment plan, contact your financial advisor.
You can learn more about Delaware Investments or obtain a prospectus for Delaware Tax-Free USA Fund, Delaware Tax-Free USA Intermediate Fund, and Delaware National High-Yield Municipal Bond Fund at delawareinvestments.com.
| Manage your investments online |
|
Delaware Management Holdings, Inc. and its subsidiaries (collectively known by the marketing name of Delaware Investments) are wholly owned subsidiaries of Macquarie Group Limited, a global provider of banking, financial, advisory, investment and funds management services.
Investments in Delaware Tax-Free USA Fund, Delaware Tax-Free USA Intermediate Fund, and Delaware National High-Yield Municipal Bond Fund are not and will not be deposits with or liabilities of Macquarie Bank Limited ABN 46 008 583 542 and its holding companies, including their subsidiaries or related companies (Macquarie Group), and are subject to investment risk, including possible delays in repayment and loss of income and capital invested. No Macquarie Group company guarantees or will guarantee the performance of the Funds, the repayment of capital from the Funds, or any particular rate of return.
| Table of contents | |
| Portfolio management review | 1 |
| Performance summaries | 5 |
| Disclosure of Fund expenses | 14 |
| Security type/sector allocations | 17 |
| Statements of net assets | 20 |
| Statements of operations | 67 |
| Statements of changes in net assets | 68 |
| Financial highlights | 74 |
| Notes to financial statements | 98 |
| Report of independent registered | |
| public accounting firm | 111 |
| Other Fund information | 112 |
| Board of trustees/directors and | |
| officers addendum | 118 |
| About the organization | 128 |
Unless otherwise noted, views expressed herein are current as of Aug. 31, 2012, and subject to change.
Funds are not FDIC insured and are not guaranteed. It is possible to lose the principal amount invested.
Mutual fund advisory services provided by Delaware Management Company, a series of Delaware Management Business Trust, which is a registered investment advisor. Delaware Investments, a member of Macquarie Group, refers to Delaware Management Holdings, Inc. and its subsidiaries, including the Funds’ distributor, Delaware Distributors, L.P. Macquarie Group refers to Macquarie Group Limited and its subsidiaries and affiliates worldwide.
© 2012 Delaware Management Holdings, Inc.
All third-party marks cited are the property of their respective owners.
| Delaware Investments® National Tax-Free Funds | September 11, 2012 |
| Performance preview (for the year ended August 31, 2012) | ||||
| Delaware Tax-Free USA Fund (Class A shares) | 1-year return | +13.01% | ||
| Barclays Municipal Bond Index (benchmark) | 1-year return | +8.78% | ||
| Lipper General & Insured Municipal Debt Funds Average | 1-year return | +11.00% |
For complete, annualized performance for Delaware Tax-Free USA Fund, please see the table on page 5.
The performance of Class A shares excludes the applicable sales charge and reflects the reinvestment of all distributions. The Lipper General & Insured Municipal Debt Funds Average compares funds that either invest primarily in municipal debt issues in the top four credit ratings or invest primarily in municipal debt issues insured as to timely payment. Index performance returns do not reflect any management fees, transaction costs, or expenses. Indices are unmanaged and one cannot invest directly in an index.
| Delaware Tax-Free USA Intermediate Fund (Class A shares) | 1-year return | +7.89% | ||
| Barclays 3–15 Year Blend Municipal Bond Index (benchmark) | 1-year return | +6.84% | ||
| Lipper Intermediate Municipal Debt Funds Average | 1-year return | +6.57% |
For complete, annualized performance for Delaware Tax-Free USA Intermediate Fund, please see the table on page 8. The performance of Class A shares excludes the applicable sales charge and reflects the reinvestment of all distributions. The Lipper Intermediate Municipal Debt Funds Average compares funds that invest in municipal debt issues with dollar-weighted average maturities of 5 to 10 years.
Index performance returns do not reflect any management fees, transaction costs, or expenses. Indices are unmanaged and one cannot invest directly in an index.
| Delaware National High-Yield Municipal Bond Fund (Class A shares) | 1-year return | +17.28% | ||
| Barclays Municipal Bond Index (benchmark) | 1-year return | +8.78% | ||
| Lipper High-Yield Municipal Debt Funds Average | 1-year return | +14.98% |
For complete, annualized performance for Delaware National High-Yield Municipal Bond Fund, please see the table on page 11.
The performance of Class A shares excludes the applicable sales charge and reflects the reinvestment of all distributions. The Lipper High-Yield Municipal Debt Funds Average compares funds that invest at least 50% of assets in lower-rated municipal debt issues.
Index performance returns do not reflect any management fees, transaction costs, or expenses. Indices are unmanaged and one cannot invest directly in an index.
1
Portfolio management review
Delaware Investments® National Tax-Free Funds
Economic backdrop
As the Funds’ fiscal year got under way in September 2011, signs were mounting that the U.S. economy was gradually improving. While this situation was interpreted positively for economically sensitive asset classes, it was also expected to lead to higher interest rates — a negative situation for most types of bonds.
By the second half of the Funds’ fiscal year, however, it became clear that the economy’s momentum was stalling:
- U.S. gross domestic product (GDP) — a measure of the goods and services produced by the nation — grew at an annualized rate of just 2.0% in the first quarter of 2012, down from 4.1% in the previous three-month period. In the second quarter of 2012, the rate of GDP growth slowed further, to an estimated 1.7%.
- Job creation remained persistently sluggish, as the unemployment rate fluctuated within a historically high range of 8.1% to 8.3% between January and August 2012.
(Data: U.S. Commerce Department, U.S. Labor Department)
Although individual localities around the country continued to experience fiscal struggles, we did not view this as an indication of deeply rooted risk in the municipal bond market as a whole. Instead, we saw isolated cases of municipalities dealing with specific challenges unique to their circumstances (such as underfunded pension plans or weak revenue streams). Outside the United States, elevated debt levels in several European countries — most notably Greece, Spain, and Italy — continued to foster the region’s economic volatility. European policy makers hoped to avoid the worst-case scenario of a breakup of the shared euro currency, which would likely result in a massive disruption to the global economy. As the Funds’ fiscal year progressed, it appeared that a tentative framework for resolution was in place, but financial markets remained highly sensitive to the uncertainty of a successful ending to this fiscal crisis.
Municipal bond market conditions
The Funds’ fiscal year coincided with a beneficial environment for many municipal bond investors. Amid the sluggish U.S. economic backdrop and potential fallout from the European debt situation, yields on U.S. Treasury debt stayed dramatically low. Investors therefore looked elsewhere for sources of competitive yield, and municipal bonds benefited from this attention.
Another factor helping to lift municipal bond prices was a favorable relationship between supply and demand. The relatively limited supply of tax-exempt bonds, paired with extremely strong demand from some investors, provided support for the asset class.
Several factors fueled the demand side of the equation. First, there were heavy flows back into investors’ hands through bond redemptions. Second, new inflows into municipal bond mutual funds remained high, as did demand from institutional investors. Institutional investors don’t often purchase municipal securities and don’t traditionally drive the market, but in this case they likely saw certain municipal bonds offering unusually attractive values relative to comparable opportunities among taxable bonds.
2
Another factor underlying the demand for municipal securities was investors’ search for a higher yield amid a low interest rate environment. Accordingly, bonds that exhibited higher yields, including those with longer maturities and lower credit ratings, generally outperformed their counterparts. In fact, the best-performing maturity range of the municipal bond market (as measured by the Barclays Municipal Bond Index) was 22 years and longer, which gained 14.52%, compared with an advance of just 0.89% for bonds with maturities of less than two years. Similarly, BBB-rated bonds were up 15.40% for the same time period, compared with a gain of just 6.07% for the AAA segment within that index.
Maintaining a consistent strategy
Across the Funds, we maintained a consistent management approach, emphasizing bottom-up security selection. We made investment decisions based on our research on individual bonds, instead of reacting to macroeconomic trends or trying to predict interest rate movements.
The Funds’ portfolios regularly emphasize A-rated and BBB-rated bonds and also maintain some allocation to bonds rated below investment grade. Simultaneously, they tend to underweight AAA-rated and AA-rated securities, as these higher-quality bonds generally offer fewer prospects to uncover hidden value.
Our comfort level with the Funds’ elevated weighting in relatively credit-sensitive securities stems from the thoroughness of our credit research process and our confidence in our ability to identify tax-exempt securities that offer a positive risk-versus-reward tradeoff.
The Funds entered the fiscal year well positioned in our view, given the income being generated by certain holdings acquired in a higher interest rate environment during 2009 and 2010. We did not make major changes to the Funds’ portfolio holdings during the fiscal year. The majority of activity focused on investing new cash that came into the Funds. We invested opportunistically, taking advantage of individual securities that we believed fit into each portfolio’s respective structure.
One noteworthy source of bond supply during the Funds’ fiscal year was Puerto Rico, and in late 2011 we added a number of Puerto Rican bonds that we believed were priced attractively. With a large amount of Puerto Rican issuance coming to market in a relatively short time period, we followed our rigorous research process in identifying what we believed to be meaningful additions to each Fund’s portfolio.
Notable sectors and securities
As we mentioned earlier, the best-performing bonds in the municipal marketplace were those with longer maturity dates and relatively lower credit ratings. By a similar token, the municipal bond market’s best-performing sectors were those composed predominantly of bonds with these characteristics.
The outperformance of lower-rated bonds proved favorable for our style of investing. Looking at the strongest individual contributors to each of the Funds’ results, we note that they are representative of the trend in which long-dated, lower-credit-quality issues enjoyed a performance advantage.
3
Portfolio management review
Delaware Investments® National Tax-Free Funds
Among the strongest-performing securities within Delaware Tax-Free USA Fund were Florida revenue bonds issued for Fort Lauderdale cargo acquisition projects. These bonds had a 2032 maturity date and a Moody’s Investors Service (Moody’s) credit rating of Ba2. Another notable contributor was an Ohio nonrated bond issued for senior-housing facilities, with a 2038 maturity date. Both of these bonds experienced significant price increases in tandem with what we saw as investors’ increased tolerance for credit risk.
On the other hand, the Fund’s relatively weaker holdings included Greene County, Mo., single-family mortgage bonds, which were rated Aaa by Moody’s and were set to mature in 2016. Other relative laggards included Ohio general obligation bonds with a December 2012 maturity.
Within Delaware Tax-Free USA Intermediate Fund, strong performers included the same Florida cargo acquisition bonds mentioned earlier. Another outperforming issue was a Modesto, Calif., special taxing district bond maturing in 2036.
In contrast, bonds with relatively weaker performance included Duluth, Minn., healthcare bonds that had a maturity date of 2014, and Pennsylvania general obligation bonds maturing in May 2013. Both of these securities turned in positive performance, but they trailed the stronger advance posted by longer-dated bonds.
The story was similar for Delaware National High-Yield Municipal Bond Fund, as its two top contributing securities were the same as those mentioned above for Delaware Tax-Free USA Fund. In contrast, New York State Dormitory Authority personal income tax revenue bonds (maturing in 2024) and Massachusetts State Development Finance Agency revenue bonds for Harvard University (maturing in 2020) were among those that posted relatively weaker gains within the Fund’s portfolio holdings.
4
| Delaware Tax-Free USA Fund | August 31, 2012 |
The performance data quoted represent past performance; past performance does not guarantee future results. Investment return and principal value will fluctuate so your shares, when redeemed, may be worth more or less than their original cost. Please obtain the performance data current for the most recent month end by calling 800 523-1918 or visiting our website at delawareinvestments.com/performance. Current performance may be lower or higher than the performance data quoted.
| Fund performance1,2 | Average annual total returns through August 31, 2012 | ||||||||
| 1 year | 5 years | 10 years | Lifetime | ||||||
| Class A (Est. Jan. 11, 1984) | |||||||||
| Excluding sales charge | +13.01% | +6.33% | +5.35% | n/a | |||||
| Including sales charge | +7.95% | +5.35% | +4.87% | n/a | |||||
| Class B (Est. May 2, 1994) | |||||||||
| Excluding sales charge | +12.27% | +5.53% | +4.70% | n/a | |||||
| Including sales charge | +8.27% | +5.29% | +4.70% | n/a | |||||
| Class C (Est. Nov. 29, 1995) | |||||||||
| Excluding sales charge | +12.26% | +5.53% | +4.56% | n/a | |||||
| Including sales charge | +11.26% | +5.53% | +4.56% | n/a | |||||
| Institutional Class (Est. Dec. 31, 2008) | |||||||||
| Excluding sales charge | +13.41% | n/a | n/a | +10.89% | |||||
| Including sales charge | +13.41% | n/a | n/a | +10.89% | |||||
1 Returns reflect the reinvestment of all distributions and are presented both with and without the applicable sales charges described below. Returns do not reflect the deduction of taxes the shareholder would pay on Fund distributions or redemptions of Fund shares.
Expense limitations were in effect for certain classes during some or all of the periods shown in the “Fund performance” chart. The current expenses for each class are listed on the “Fund expense ratios” table on page 6. Performance would have been lower had expense limitations not been in effect.
Class A shares are sold with a maximum front-end sales charge of 4.50%, and have an annual distribution and service fee of up to 0.25% of average daily net assets. The Board of Trustees (Board) has adopted a formula for calculating 12b-1 plan fees for the Fund’s Class A shares that went into effect on June 1, 1992. The Fund’s Class A shares are currently subject to a blended 12b-1 fee equal to the sum of: (i) 0.10% of average daily net assets representing shares acquired prior to June 1, 1992, and (ii) 0.25% of average daily net assets representing shares acquired on or after June 1, 1992. All Class A shares currently bear 12b-1 fees at the same rate, the blended rate, currently 0.24% of average daily net assets, based on the formula described above. This method of calculating Class A 12b-1 fees may be discontinued at the sole discretion of the Board. Performance for Class A shares, excluding sales charges, assumes that no front-end sales charge applied.
Class B shares may be purchased only through dividend reinvestment and certain permitted exchanges as described in the prospectus. Please see the prospectus for additional information on Class B shares. Class B shares have a contingent deferred sales charge that declines from 4.00% to zero depending on the period of time the shares are held. They are also subject to an annual distribution
5
Performance summaries
Delaware Tax-Free USA Fund
and service fee of 1.00% of average daily net assets. Class B shares will automatically convert to Class A shares on a quarterly basis approximately eight years after purchase. Ten-year and lifetime performance figures for Class B shares reflect conversion to Class A shares after approximately eight years.
Class C shares are sold with a contingent deferred sales charge of 1.00% if redeemed during the first 12 months. They are also subject to an annual distribution and service fee of 1.00% of average daily net assets.
Performance for Class B and C shares, excluding sales charges, assumes either that contingent deferred sales charges did not apply or that the investment was not redeemed.
Institutional Class shares are available without sales or asset-based distribution charges only to certain eligible institutional accounts.
The “Fund performance” table and the “Performance of a $10,000 investment” graph do not reflect the deduction of taxes the shareholder would pay on Fund distributions or redemptions of Fund shares.
Fixed income securities and bond funds can lose value, and investors can lose principal, as interest rates rise. They also may be affected by economic conditions that hinder an issuer’s ability to make interest and principal payments on its debt.
The Fund may also be subject to prepayment risk, the risk that the principal of a fixed income security that is held by the Fund may be prepaid prior to maturity, potentially forcing the Fund to reinvest that money at a lower interest rate.
High yielding, noninvestment grade bonds (junk bonds) involve higher risk than investment grade bonds. The high yield secondary market is particularly susceptible to liquidity problems when institutional investors, such as mutual funds and certain other financial institutions, temporarily stop buying bonds for regulatory, financial, or other reasons. In addition, a less liquid secondary market makes it more difficult for the Fund to obtain precise valuations of the high yield securities in its portfolio.
Substantially all dividend income derived from tax-free funds is exempt from federal income tax. Some income may be subject to the federal alternative minimum tax (AMT) that applies to certain investors. Capital gains, if any, are taxable.
Bond ratings are determined by a nationally recognized statistical rating organization.
2 The Fund’s expense ratios, as described in the most recent prospectus, are disclosed in the following “Fund expense ratios” table. Delaware Investments has agreed to reimburse certain expenses and/or waive certain fees in order to prevent total fund operating expenses (excluding certain fees and expenses) from exceeding 0.56% of the Fund’s average daily net assets from Dec. 29, 2011, through Dec. 28, 2012. Please see the most recent prospectus and any applicable supplement(s) for additional information on these fee waivers and/or reimbursements.
| Fund expense ratios | Class A | Class B | Class C | Institutional Class | |||
| Total annual operating expenses | 0.94% | 1.70% | 1.70% | 0.70% | |||
| (without fee waivers) | |||||||
| Net expenses | 0.80% | 1.56% | 1.56% | 0.56% | |||
| (including fee waivers, if any) | |||||||
| Type of waiver | Contractual | Contractual | Contractual | Contractual |
6
Performance of a $10,000 investment1
Average annual total returns from Aug. 31, 2002, through Aug. 31, 2012
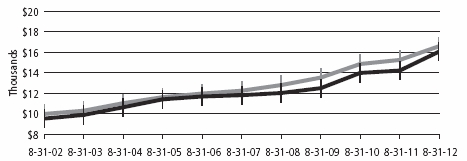
| For period beginning Aug. 31, 2002, through Aug. 31, 2012 | Starting value | Ending value | ||||
| Barclays Municipal Bond Index | $10,000 | $16,596 | ||||
| Delaware Tax-Free USA Fund — Class A shares | $9,550 | $16,075 | ||||
1 The “Performance of a $10,000 investment” graph assumes $10,000 invested in Class A shares of the Fund on Aug. 31, 2002, and includes the effect of a 4.50% front-end sales charge and the reinvestment of all distributions. The graph does not reflect the deduction of taxes the shareholders would pay on Fund distributions or redemptions of Fund shares. Expense limitations were in effect for some or all of the periods shown. Performance would have been lower had expense limitations not been in effect. Current expenses are listed in the “Fund expense ratios” table on page 6. Please note additional details on pages 5 through 7.
The chart also assumes $10,000 invested in the Barclays Municipal Bond Index as of Aug. 31, 2002. The Barclays Municipal Bond Index measures the total return performance of the long-term, investment grade tax-exempt bond market.
Index performance returns do not reflect any management fees, transaction costs, or expenses. Indices are unmanaged and one cannot invest directly in an index. Past performance is not a guarantee of future results.
Performance of other Fund classes will vary due to different charges and expenses.
| Nasdaq symbols | CUSIPs | ||||||
| Class A | DMTFX | 245909106 | |||||
| Class B | DTFCX | 245909403 | |||||
| Class C | DUSCX | 245909700 | |||||
| Institutional Class | DTFIX | 24610H104 | |||||
7
| Performance summaries | |
| Delaware Tax-Free USA Intermediate Fund | August 31, 2012 |
The performance data quoted represent past performance; past performance does not guarantee future results. Investment return and principal value will fluctuate so your shares, when redeemed, may be worth more or less than their original cost. Please obtain the performance data current for the most recent month end by calling 800 523-1918 or visiting our website at delawareinvestments.com/performance. Current performance may be lower or higher than the performance data quoted.
| Fund performance1,2 | Average annual total returns through August 31, 2012 | |||||||
| 1 year | 5 years | 10 years | Lifetime | |||||
| Class A (Est. Jan. 7, 1993) | ||||||||
| Excluding sales charge | +7.89% | +5.52% | +4.81% | n/a | ||||
| Including sales charge | +4.88% | +4.93% | +4.52% | n/a | ||||
| Class B (Est. May 2, 1994) | ||||||||
| Excluding sales charge | +6.90% | +4.63% | +4.35% | n/a | ||||
| Including sales charge | +4.90% | +4.63% | +4.35% | n/a | ||||
| Class C (Est. Nov. 29, 1995) | ||||||||
| Excluding sales charge | +6.89% | +4.64% | +3.92% | n/a | ||||
| Including sales charge | +5.89% | +4.64% | +3.92% | n/a | ||||
| Institutional Class (Est. Dec. 31, 2008) | ||||||||
| Excluding sales charge | +8.00% | n/a | n/a | +7.75% | ||||
| Including sales charge | +8.00% | n/a | n/a | +7.75% | ||||
1 Returns reflect the reinvestment of all distributions and are presented both with and without the applicable sales charges described below. Returns do not reflect the deduction of taxes the shareholder would pay on Fund distributions or redemptions of Fund shares.
Expense limitations were in effect for certain classes during some or all of the periods shown in the “Fund performance” chart. The current expenses for each class are listed on the “Fund expense ratios” table on page 9. Performance would have been lower had expense limitations not been in effect.
Class A shares are sold with a maximum front-end sales charge of 2.75%, and have an annual distribution and service fee of 0.30% of average daily net assets. This fee has been contractually limited to 0.15% of average daily net assets from Dec. 29, 2011, through Dec. 28, 2012.
Performance for Class A shares, excluding sales charges, assumes that no front-end sales charge applied.
Class B shares may be purchased only through dividend reinvestment and certain permitted exchanges as described in the prospectus. Please see the prospectus for additional information on Class B shares. Class B shares have a contingent deferred sales charge that declines from 2.00% to zero depending on the period of time the shares are held. They are also subject to an annual distribution and service fee of 1.00% of average daily net assets. Class B shares will automatically convert to Class A shares on a quarterly basis approximately five years after purchase. Ten-year and lifetime performance figures for Class B shares reflect conversion to Class A shares after approximately five years.
8
Class C shares are sold with a contingent deferred sales charge of 1.00% if redeemed during the first 12 months. They are also subject to an annual distribution and service fee of 1.00% of average daily net assets.
Performance for Class B and C shares, excluding sales charges, assumes either that contingent deferred sales charges did not apply or that the investment was not redeemed.
Institutional Class shares are available without sales or asset-based distribution charges only to certain eligible institutional accounts.
The “Fund performance” table and the “Performance of a $10,000 investment” graph do not reflect the deduction of taxes the shareholder would pay on Fund distributions or redemptions of Fund shares.
Fixed income securities and bond funds can lose value, and investors can lose principal, as interest rates rise. They also may be affected by economic conditions that hinder an issuer’s ability to make interest and principal payments on its debt.
The Fund may also be subject to prepayment risk, the risk that the principal of a fixed income security that is held by the Fund may be prepaid prior to maturity, potentially forcing the Fund to reinvest that money at a lower interest rate.
High yielding, noninvestment grade bonds (junk bonds) involve higher risk than investment grade bonds. The high yield secondary market is particularly susceptible to liquidity problems when institutional investors, such as mutual funds and certain other financial institutions, temporarily stop buying bonds for regulatory, financial, or other reasons. In addition, a less liquid secondary market makes it more difficult for the Fund to obtain precise valuations of the high yield securities in its portfolio.
Substantially all dividend income derived from tax-free funds is exempt from federal income tax. Some income may be subject to the federal alternative minimum tax (AMT) that applies to certain investors. Capital gains, if any, are taxable.
Bond ratings are determined by a nationally recognized statistical rating organization.
2 The Fund’s expense ratios, as described in the most recent prospectus, are disclosed in the following “Fund expense ratios” table. Delaware Investments has agreed to reimburse certain expenses and/or waive certain fees in order to prevent total fund operating expenses (excluding certain fees and expenses) from exceeding 0.60% of the Fund’s average daily net assets from Dec. 29, 2011, through Dec. 28, 2012. Please see the most recent prospectus and any applicable supplement(s) for additional information on these fee waivers and/or reimbursements.
| Fund expense ratios | Class A | Class B | Class C | Institutional Class | |||
| Total annual operating expenses | 0.98% | 1.68% | 1.68% | 0.68% | |||
| (without fee waivers) | |||||||
| Net expenses | 0.75% | 1.60% | 1.60% | 0.60% | |||
| (including fee waivers, if any) | |||||||
| Type of waiver | Contractual | Contractual | Contractual | Contractual |
9
Performance summaries
Delaware Tax-Free USA Intermediate Fund
Performance of a $10,000 investment1
Average annual total returns from Aug. 31, 2002, through Aug. 31, 2012
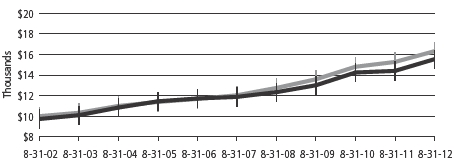
| For period beginning Aug. 31, 2002, through Aug. 31, 2012 | Starting value | Ending value | |||||
| Barclays 3–15 Year Blend Municipal Bond Index | $10,000 | $16,321 | |||||
| Delaware Tax-Free USA | |||||||
| Intermediate Fund — Class A shares | $9,725 | $15,544 | |||||
1 The “Performance of a $10,000 investment” graph assumes $10,000 invested in Class A shares of the Fund on Aug. 31, 2002, and includes the effect of a 2.75% front-end sales charge and the reinvestment of all distributions. The graph does not reflect the deduction of taxes the shareholders would pay on Fund distributions or redemptions of Fund shares. Expense limitations were in effect for some or all of the periods shown. Performance would have been lower had expense limitations not been in effect. Current expenses are listed in the “Fund expense ratios” table on page 9. Please note additional details on pages 8 through 10.
The chart also assumes $10,000 invested in the Barclays 3–15 Year Blend Municipal Bond Index as of Aug. 31, 2002. The Barclays 3–15 Year Blend Municipal Bond Index measures the total return performance of investment grade, U.S. tax-exempt bonds with maturities from 2 to 17 years.
Index performance returns do not reflect any management fees, transaction costs, or expenses. Indices are unmanaged and one cannot invest directly in an index. Past performance is not a guarantee of future results.
Performance of other Fund classes will vary due to different charges and expenses.
| Nasdaq symbols | CUSIPs | |||||
| Class A | DMUSX | 245909304 | ||||
| Class B | DUIBX | 245909601 | ||||
| Class C | DUICX | 245909882 | ||||
| Institutional Class | DUSIX | 24610H203 | ||||
10
| Delaware National High-Yield Municipal Bond Fund | August 31, 2012 |
The performance data quoted represent past performance; past performance does not guarantee future results. Investment return and principal value will fluctuate so your shares, when redeemed, may be worth more or less than their original cost. Please obtain the performance data current for the most recent month end by calling 800 523-1918 or visiting our website at delawareinvestments.com/performance. Current performance may be lower or higher than the performance data quoted.
| Fund performance1,2 | Average annual total returns through August 31, 2012 | ||||||||
| 1 year | 5 years | 10 years | Lifetime | ||||||
| Class A (Est. Sept. 22, 1986) | |||||||||
| Excluding sales charge | +17.28% | +6.83% | +6.01% | n/a | |||||
| Including sales charge | +12.04% | +5.86% | +5.52% | n/a | |||||
| Class B (Est. Dec. 18, 1996) | |||||||||
| Excluding sales charge | +16.39% | +6.03% | +5.35% | n/a | |||||
| Including sales charge | +12.39% | +5.79% | +5.35% | n/a | |||||
| Class C (Est. May 26, 1997) | |||||||||
| Excluding sales charge | +16.47% | +6.04% | +5.21% | n/a | |||||
| Including sales charge | +15.47% | +6.04% | +5.21% | n/a | |||||
| Institutional Class (Est. Dec. 31, 2008) | |||||||||
| Excluding sales charge | +17.57% | n/a | n/a | +16.37 | % | ||||
| Including sales charge | +17.57% | n/a | n/a | +16.37 | % | ||||
1 Returns reflect the reinvestment of all distributions and are presented both with and without the applicable sales charges described below. Returns do not reflect the deduction of taxes the shareholder would pay on Fund distributions or redemptions of Fund shares.
Expense limitations were in effect for certain classes during some or all of the periods shown in the “Fund performance” chart. The current expenses for each class are listed on the “Fund expense ratios” table on page 12. Performance would have been lower had expense limitations not been in effect.
Class A shares are sold with a maximum front-end sales charge of 4.50%, and have an annual distribution and service fee of 0.25% of average daily net assets. Performance for Class A shares, excluding sales charges, assumes that no front-end sales charge applied.
Class B shares may be purchased only through dividend reinvestment and certain permitted exchanges as described in the prospectus. Please see the prospectus for additional information on Class B shares. Class B shares have a contingent deferred sales charge that declines from 4.00% to zero depending on the period of time the shares are held. They are also subject to an annual distribution and service fee of 1.00% of average daily net assets. Class B shares will automatically convert to Class A shares on a quarterly basis approximately eight years after purchase. Ten-year and lifetime performance figures for Class B shares reflect conversion to Class A shares after approximately eight years.
11
Performance summaries
Delaware National High-Yield Municipal Bond Fund
Class C shares are sold with a contingent deferred sales charge of 1.00% if redeemed during the first 12 months. They are also subject to an annual distribution and service fee of 1.00% of average daily net assets.
Performance for Class B and C shares, excluding sales charges, assumes either that contingent deferred sales charges did not apply or that the investment was not redeemed.
Institutional Class shares are available without sales or asset-based distribution charges only to certain eligible institutional accounts.
The “Fund performance” table and the “Performance of a $10,000 investment” graph do not reflect the deduction of taxes the shareholder would pay on Fund distributions or redemptions of Fund shares.
Fixed income securities and bond funds can lose value, and investors can lose principal, as interest rates rise. They also may be affected by economic conditions that hinder an issuer’s ability to make interest and principal payments on its debt.
The Fund may also be subject to prepayment risk, the risk that the principal of a fixed income security that is held by the Fund may be prepaid prior to maturity, potentially forcing the Fund to reinvest that money at a lower interest rate.
High yielding, noninvestment grade bonds (junk bonds) involve higher risk than investment grade bonds. The high yield secondary market is particularly susceptible to liquidity problems when institutional investors, such as mutual funds and certain other financial institutions, temporarily stop buying bonds for regulatory, financial, or other reasons. In addition, a less liquid secondary market makes it more difficult for the Fund to obtain precise valuations of the high yield securities in its portfolio.
Substantially all dividend income derived from tax-free funds is exempt from federal income tax. Some income may be subject to the federal alternative minimum tax (AMT) that applies to certain investors. Capital gains, if any, are taxable.
Bond ratings are determined by a nationally recognized statistical rating organization.
2 The Fund’s expense ratios, as described in the most recent prospectus, are disclosed in the following “Fund expense ratios” table. Delaware Investments has agreed to reimburse certain expenses and/or waive certain fees in order to prevent total fund operating expenses (excluding certain fees and expenses) from exceeding 0.60% of the Fund’s average daily net assets from Dec. 29, 2011, through Dec. 28, 2012. Please see the most recent prospectus and any applicable supplement(s) for additional information on these fee waivers and/or reimbursements.
| Fund expense ratios | Class A | Class B | Class C | Institutional Class | |||
| Total annual operating expenses | 1.01% | 1.76% | 1.76% | 0.76% | |||
| (without fee waivers) | |||||||
| Net expenses | 0.85% | 1.60% | 1.60% | 0.60% | |||
| (including fee waivers, if any) | |||||||
| Type of waiver | Contractual | Contractual | Contractual | Contractual |
12
Performance of a $10,000 investment1
Average annual total returns from Aug. 31, 2002, through Aug. 31, 2012

| For period beginning Aug. 31, 2002, through Aug. 31, 2012 | Starting value | Ending value | |||||
| Delaware National High-Yield | |||||||
| Municipal Bond Fund — Class A shares | $9,550 | $17,101 | |||||
| Barclays Municipal Bond Index | $10,000 | $16,596 | |||||
1 The “Performance of a $10,000 investment” graph assumes $10,000 invested in Class A shares of the Fund on Aug. 31, 2002, and includes the effect of a 4.50% front-end sales charge and the reinvestment of all distributions. The graph does not reflect the deduction of taxes the shareholders would pay on Fund distributions or redemptions of Fund shares. Expense limitations were in effect for some or all of the periods shown. Performance would have been lower had expense limitations not been in effect. Current expenses are listed in the “Fund expense ratios” table on page 12. Please note additional details on pages 11 through 13.
The chart also assumes $10,000 invested in the Barclays Municipal Bond Index as of Aug. 31, 2002. The Barclays Municipal Bond Index measures the total return performance of the long-term, investment grade tax-exempt bond market.
Index performance returns do not reflect any management fees, transaction costs, or expenses. Indices are unmanaged and one cannot invest directly in an index. Past performance is not a guarantee of future results.
Performance of other Fund classes will vary due to different charges and expenses.
| Nasdaq symbols | CUSIPs | ||||||
| Class A | CXHYX | 928928241 | |||||
| Class B | DVNYX | 928928233 | |||||
| Class C | DVHCX | 928928225 | |||||
| Institutional Class | DVHIX | 24610H302 | |||||
13
Disclosure of Fund expenses
For the six-month period from March 1, 2012 to August 31, 2012 (Unaudited)
As a shareholder of a Fund, you incur two types of costs: (1) transaction costs, including sales charges (loads) on purchase payments, reinvested dividends, or other distributions; redemption fees; and exchange fees; and (2) ongoing costs, including management fees; distribution and/or service (12b-1) fees; and other Fund expenses. These following examples are intended to help you understand your ongoing costs (in dollars) of investing in a Fund and to compare these costs with the ongoing costs of investing in other mutual funds.
The examples are based on an investment of $1,000 invested at the beginning of the period and held for the entire six-month period from March 1, 2012 to August 31, 2012.
Actual expenses
The first section of the tables shown, “Actual Fund return,” provides information about actual account values and actual expenses. You may use the information in this section of the table, together with the amount you invested, to estimate the expenses that you paid over the period. Simply divide your account value by $1,000 (for example, an $8,600 account value divided by $1,000 = 8.6), then multiply the result by the number in the first section under the heading entitled “Expenses Paid During Period” to estimate the expenses you paid on your account during this period.
Hypothetical example for comparison purposes
The second section of the tables shown, “Hypothetical 5% return,” provides information about hypothetical account values and hypothetical expenses based on the Funds’ actual expense ratios and an assumed rate of return of 5% per year before expenses, which is not the Funds’ actual return. The hypothetical account values and expenses may not be used to estimate the actual ending account balance or expenses you paid for the period. You may use this information to compare the ongoing costs of investing in a Fund and other funds. To do so, compare this 5% hypothetical example with the 5% hypothetical examples that appear in the shareholder reports of the other funds.
Please note that the expenses shown in the tables are meant to highlight your ongoing costs only and do not reflect any transactional costs, such as sales charges (loads), redemption fees, or exchange fees. Therefore, the second section of each table is useful in comparing ongoing costs only, and will not help you determine the relative total costs of owning different funds. In addition, if these transactional costs were included, your costs would have been higher. The Funds’ expenses shown in the tables reflect fee waivers in effect. The expenses shown in each table assume reinvestment of all dividends and distributions.
14
Delaware Tax-Free USA Fund
Expense analysis of an investment of $1,000
| Beginning | Ending | Expenses | ||||||||
| Account Value | Account Value | Annualized | Paid During Period | |||||||
| 3/1/12 | 8/31/12 | Expense Ratio | 3/1/12 to 8/31/12* | |||||||
| Actual Fund return | ||||||||||
| Class A | $1,000.00 | $1,049.70 | 0.80% | $4.12 | ||||||
| Class B | 1,000.00 | 1,045.70 | 1.56% | 8.02 | ||||||
| Class C | 1,000.00 | 1,045.70 | 1.56% | 8.02 | ||||||
| Institutional Class | 1,000.00 | 1,051.60 | 0.56% | 2.89 | ||||||
| Hypothetical 5% return (5% return before expenses) | ||||||||||
| Class A | $1,000.00 | $1,021.11 | 0.80% | $4.06 | ||||||
| Class B | 1,000.00 | 1,017.29 | 1.56% | 7.91 | ||||||
| Class C | 1,000.00 | 1,017.29 | 1.56% | 7.91 | ||||||
| Institutional Class | 1,000.00 | 1,022.32 | 0.56% | 2.85 | ||||||
Delaware Tax-Free USA Intermediate Fund
Expense analysis of an investment of $1,000
| Beginning | Ending | Expenses | ||||||||
| Account Value | Account Value | Annualized | Paid During Period | |||||||
| 3/1/12 | 8/31/12 | Expense Ratio | 3/1/12 to 8/31/12* | |||||||
| Actual Fund return | ||||||||||
| Class A | $1,000.00 | $1,024.90 | 0.75% | $3.82 | ||||||
| Class B | 1,000.00 | 1,019.80 | 1.60% | 8.12 | ||||||
| Class C | 1,000.00 | 1,019.70 | 1.60% | 8.12 | ||||||
| Institutional Class | 1,000.00 | 1,025.50 | 0.60% | 3.05 | ||||||
| Hypothetical 5% return (5% return before expenses) | ||||||||||
| Class A | $1,000.00 | $1,021.37 | 0.75% | $3.81 | ||||||
| Class B | 1,000.00 | 1,017.09 | 1.60% | 8.11 | ||||||
| Class C | 1,000.00 | 1,017.09 | 1.60% | 8.11 | ||||||
| Institutional Class | 1,000.00 | 1,022.12 | 0.60% | 3.05 | ||||||
15
Disclosure of Fund expenses
Delaware National High-Yield Municipal Bond Fund
Expense analysis of an investment of $1,000
| Beginning | Ending | Expenses | |||||||||||
| Account Value | Account Value | Annualized | Paid During Period | ||||||||||
| 3/1/12 | 8/31/12 | Expense Ratio | 3/1/12 to 8/31/12* | ||||||||||
| Actual Fund return | |||||||||||||
| Class A | $1,000.00 | $1,075.50 | 0.85% | $4.43 | |||||||||
| Class B | 1,000.00 | 1,071.40 | 1.60% | 8.33 | |||||||||
| Class C | 1,000.00 | 1,072.30 | 1.60% | 8.33 | |||||||||
| Institutional Class | 1,000.00 | 1,076.40 | 0.60% | 3.13 | |||||||||
| Hypothetical 5% return (5% return before expenses) | |||||||||||||
| Class A | $1,000.00 | $1,020.86 | 0.85% | $4.32 | |||||||||
| Class B | 1,000.00 | 1,017.09 | 1.60% | 8.11 | |||||||||
| Class C | 1,000.00 | 1,017.09 | 1.60% | 8.11 | |||||||||
| Institutional Class | 1,000.00 | 1,022.12 | 0.60% | 3.05 | |||||||||
*“Expenses Paid During Period” are equal to Funds’ annualized expense ratio, multiplied by the average account value over the period, multiplied by 184/366 (to reflect the one-half year period).
16
| Security type/sector allocations | |
| Delaware Tax-Free USA Fund | As of August 31, 2012 (Unaudited) |
Sector designations may be different than the sector designations presented in other Fund materials.
| Security type/sector | Percentage of net assets | ||
| Municipal Bonds | 99.16 | % | |
| Corporate Revenue Bonds | 14.41 | % | |
| Education Revenue Bonds | 11.86 | % | |
| Electric Revenue Bonds | 3.62 | % | |
| Healthcare Revenue Bonds | 11.15 | % | |
| Housing Revenue Bonds | 0.88 | % | |
| Lease Revenue Bonds | 10.72 | % | |
| Local General Obligation Bonds | 3.07 | % | |
| Pre-Refunded/Escrowed to Maturity Bonds | 6.09 | % | |
| Special Tax Revenue Bonds | 17.14 | % | |
| State General Obligation Bonds | 7.32 | % | |
| Transportation Revenue Bonds | 9.31 | % | |
| Water & Sewer Revenue Bonds | 3.59 | % | |
| Short-Term Investments | 0.19 | % | |
| Total Value of Securities | 99.35 | % | |
| Receivables and Other Assets Net of Liabilities | 0.65 | % | |
| Total Net Assets | 100.00 | % | |
17
| Delaware Tax-Free USA Intermediate Fund | As of August 31, 2012 (Unaudited) |
Sector designations may be different than the sector designations presented in other Fund materials.
| Security type/sector | Percentage of net assets | |
| Municipal Bonds | 99.02 | % |
| Corporate Revenue Bonds | 11.52 | % |
| Education Revenue Bonds | 7.16 | % |
| Electric Revenue Bonds | 2.83 | % |
| Healthcare Revenue Bonds | 8.71 | % |
| Housing Revenue Bonds | 0.54 | % |
| Lease Revenue Bonds | 4.80 | % |
| Local General Obligation Bonds | 7.73 | % |
| Pre-Refunded/Escrowed to Maturity Bonds | 4.85 | % |
| Resource Recovery Revenue Bond | 0.09 | % |
| Special Tax Revenue Bonds | 13.93 | % |
| State General Obligation Bonds | 16.78 | % |
| Transportation Revenue Bonds | 14.75 | % |
| Water & Sewer Revenue Bonds | 5.33 | % |
| Short-Term Investments | 0.34 | % |
| Total Value of Securities | 99.36 | % |
| Receivables and Other Assets Net of Liabilities | 0.64 | % |
| Total Net Assets | 100.00 | % |
18
| Delaware National High-Yield Municipal Bond Fund | As of August 31, 2012 (Unaudited) |
Sector designations may be different than the sector designations presented in other Fund materials.
| Security type/sector | Percentage of net assets | |
| Municipal Bonds | 97.06 | % |
| Corporate Revenue Bonds | 21.62 | % |
| Education Revenue Bonds | 17.61 | % |
| Electric Revenue Bonds | 1.63 | % |
| Healthcare Revenue Bonds | 23.62 | % |
| Housing Revenue Bonds | 1.14 | % |
| Lease Revenue Bonds | 9.95 | % |
| Pre-Refunded Bond | 0.25 | % |
| Resource Recovery Revenue Bond | 0.25 | % |
| Special Tax Revenue Bonds | 8.65 | % |
| State General Obligation Bonds | 5.28 | % |
| Transportation Revenue Bonds | 6.61 | % |
| Water & Sewer Revenue Bond | 0.45 | % |
| Short-Term Investments | 2.12 | % |
| Total Value of Securities | 99.18 | % |
| Receivables and Other Assets Net of Liabilities | 0.82 | % |
| Total Net Assets | 100.00 | % |
19
| Delaware Tax-Free USA Fund | August 31, 2012 |
| Principal amount | Value | |||||||
| Municipal Bonds – 99.16% | ||||||||
| Corporate Revenue Bonds – 14.41% | ||||||||
| Buckeye, Ohio Tobacco Settlement Financing Authority | ||||||||
| Asset-Backed Series A-2 | ||||||||
| 5.875% 6/1/47 | $ | 11,000,000 | $ | 8,933,759 | ||||
| 6.50% 6/1/47 | 6,000,000 | 5,340,660 | ||||||
| Chautauqua County, New York Industrial Development | ||||||||
| Agency (NRG Dunkirk Power Project) 5.875% 4/1/42 | 2,000,000 | 2,252,060 | ||||||
| Golden State, California Tobacco Securitization Corporate | ||||||||
| Settlement Revenue Asset-Backed Senior Notes Series A-1 | ||||||||
| 5.125% 6/1/47 | 1,000,000 | 771,240 | ||||||
| 5.75% 6/1/47 | 12,180,000 | 10,372,852 | ||||||
| Harris County, Texas Industrial Development Corporation | ||||||||
| Solid Waste Disposal Revenue | ||||||||
| (Deer Park Refining Project) 5.00% 2/1/23 | 2,955,000 | 3,290,718 | ||||||
| Illinois Railsplitter Tobacco Settlement Authority | ||||||||
| 6.00% 6/1/28 | 6,000,000 | 7,045,200 | ||||||
| 6.25% 6/1/24 | 6,810,000 | 7,668,401 | ||||||
| Indiana State Finance Authority Environmental Revenue | ||||||||
| (U.S. Steel Corp. Project) 6.00% 12/1/26 | 2,500,000 | 2,608,025 | ||||||
| Indianapolis, Indiana Airport Authority Revenue Special | ||||||||
| Facilities (Federal Express Corp. Project) | ||||||||
| 5.10% 1/15/17 (AMT) | 2,750,000 | 3,122,790 | ||||||
| Series 1998 5.50% 5/1/29 (AMT) | 2,000,000 | 2,001,520 | ||||||
| Maryland Economic Development Corporation Revenue | ||||||||
| (CNX Marine Terminals Inc.) 5.75% 9/1/25 | 3,375,000 | 3,665,250 | ||||||
| M-S-R Energy Authority, California Gas Revenue Series A | ||||||||
| 6.125% 11/1/29 | 1,915,000 | 2,279,482 | ||||||
| 6.50% 11/1/39 | 3,915,000 | 5,031,323 | ||||||
| New Jersey Economic Development Authority Special | ||||||||
| Facilities Revenue (Continental Airlines, Inc. Project) | ||||||||
| 4.875% 9/15/19 (AMT) | 2,000,000 | 2,035,360 | ||||||
| • | New York City, New York Industrial Development Agency | |||||||
| Special Facilities Revenue (American Airlines - JFK | ||||||||
| International Airport) 7.75% 8/1/31 (AMT) | 2,000,000 | 2,103,320 | ||||||
| New York State Liberty Development Corporation Revenue | ||||||||
| (Second Priority - Bank of America Tower) | ||||||||
| Class 3 6.375% 7/15/49 | 1,000,000 | 1,149,250 | ||||||
| Ohio State Air Quality Development Authority Revenue | ||||||||
| Environmental Improvement | ||||||||
| (AK Steel Holding) Series A 6.75% 6/1/24 (AMT) | 1,500,000 | 1,553,745 | ||||||
| (First Energy Generation) Series A 5.70% 8/1/20 | 4,750,000 | 5,538,405 | ||||||
20
| Principal amount | Value | |||||||
| Municipal Bonds (continued) | ||||||||
| Corporate Revenue Bonds (continued) | ||||||||
| Pennsylvania Economic Development Financing Authority | ||||||||
| Exempt Facilities Revenue (Allegheny Energy Supply Co.) | ||||||||
| 7.00% 7/15/39 | $ | 6,340,000 | $ | 7,591,770 | ||||
| Rockport, Indiana Revenue (AK Steel Holding) | ||||||||
| 7.00% 6/1/28 (AMT) | 1,790,000 | 1,872,680 | ||||||
| Tobacco Settlement Financing Corporation, New Jersey | ||||||||
| Series 1A 5.00% 6/1/41 | 3,205,000 | 2,672,938 | ||||||
| Valdez, Alaska Marine (BP Pipelines Project) | ||||||||
| Series B 5.00% 1/1/21 | 3,455,000 | 4,131,144 | ||||||
| Series C 5.00% 1/1/21 | 1,880,000 | 2,247,916 | ||||||
| 95,279,808 | ||||||||
| Education Revenue Bonds – 11.86% | ||||||||
| Bowling Green, Ohio Student Housing Revenue CFP I | ||||||||
| (State University Project) 6.00% 6/1/45 | 5,390,000 | 5,796,783 | ||||||
| California Statewide Communities Development Authority | ||||||||
| School Facility Revenue (Aspire Public Schools) | ||||||||
| 6.125% 7/1/46 | 5,160,000 | 5,338,381 | ||||||
| Connecticut State Health & Educational Facilities Authority | ||||||||
| Revenue (Yale University) Series A-1 5.00% 7/1/25 | 3,000,000 | 3,643,170 | ||||||
| Delaware County, Pennsylvania Industrial Development | ||||||||
| Authority Charter School Revenue (Chester Community | ||||||||
| Charter School) Series A 6.125% 8/15/40 | 1,910,000 | 1,695,431 | ||||||
| Gainesville, Georgia Redevelopment Authority Educational | ||||||||
| Facilities Revenue (Riverside Military Academy Project) | ||||||||
| 5.125% 3/1/37 | 2,850,000 | 2,606,981 | ||||||
| Marietta, Georgia Development Authority Revenue | ||||||||
| (Life University Income Project) 7.00% 6/15/39 | 4,200,000 | 4,402,356 | ||||||
| Massachusetts Development Finance Agency | ||||||||
| (Harvard University) Series B-2 5.25% 2/1/34 | 5,000,000 | 6,065,200 | ||||||
| Massachusetts State Health & Educational Facilities | ||||||||
| Authority Revenue (Harvard University) Series A | ||||||||
| 5.00% 12/15/29 | 5,295,000 | 6,366,866 | ||||||
| 5.50% 11/15/36 | 4,515,000 | 5,485,364 | ||||||
| Missouri State Health & Educational Facilities Authority | ||||||||
| Revenue (Washington University) | ||||||||
| Series A 5.375% 3/15/39 | 5,000,000 | 5,820,400 | ||||||
| New Jersey Economic Development Authority Revenue | ||||||||
| (Provident Group - Montclair) 5.875% 6/1/42 | 4,285,000 | 4,755,279 | ||||||
21
Statements of net assets
Delaware Tax-Free USA Fund
| Principal amount | Value | |||||||
| Municipal Bonds (continued) | ||||||||
| Education Revenue Bonds (continued) | ||||||||
| New Jersey State Educational Facilities Authority Revenue | ||||||||
| (University of Medicine & Dentistry) | ||||||||
| Series B 7.50% 12/1/32 | $ | 1,435,000 | $ | 1,801,370 | ||||
| New York City Trust for Cultural Resources (Whitney | ||||||||
| Museum of American Art) 5.00% 7/1/31 | 1,500,000 | 1,693,140 | ||||||
| North Texas Education Finance Corporation | ||||||||
| (Uplift Education) Series A 5.125% 12/1/42 | 3,000,000 | 3,180,510 | ||||||
| Pennsylvania State Higher Educational Facilities Authority | ||||||||
| Student Housing Revenue (University Properties Inc. - | ||||||||
| East Stroudsburg University of Pennsylvania) | ||||||||
| 5.00% 7/1/31 | 6,000,000 | 6,337,740 | ||||||
| Private Colleges & Universities Authority, Georgia Revenue | ||||||||
| (Mercer University) Series A 5.00% 10/1/32 | 1,360,000 | 1,460,545 | ||||||
| Provo, Utah Charter School Revenue (Freedom Academy | ||||||||
| Foundation Project) 5.50% 6/15/37 | 1,665,000 | 1,597,484 | ||||||
| San Juan, Texas Higher Education Finance Authority | ||||||||
| Education Revenue (Idea Public Schools) | ||||||||
| Series A 6.70% 8/15/40 | 1,500,000 | 1,740,345 | ||||||
| St. Louis, Missouri Industrial Development Authority | ||||||||
| Revenue (Confluence Academy Project) Series A | ||||||||
| 5.25% 6/15/25 | 1,150,000 | 1,102,344 | ||||||
| 5.35% 6/15/32 | 2,300,000 | 2,155,767 | ||||||
| University of California Revenue Limited Project | ||||||||
| Series G 5.00% 5/15/42 | 4,655,000 | 5,359,581 | ||||||
| 78,405,037 | ||||||||
| Electric Revenue Bonds – 3.62% | ||||||||
| California State Department of Water Resources | ||||||||
| Series L 5.00% 5/1/20 | 5,000,000 | 6,245,600 | ||||||
| Long Island, New York Power Authority Series A | ||||||||
| 5.00% 9/1/37 | 2,440,000 | 2,741,096 | ||||||
| 5.00% 9/1/42 | 3,000,000 | 3,343,440 | ||||||
| Puerto Rico Electric Power Authority Revenue | ||||||||
| Series A 5.00% 7/1/42 | 4,620,000 | 4,729,679 | ||||||
| Series PP 5.00% 7/1/25 (NATL-RE) (FGIC) | 1,000,000 | 1,049,740 | ||||||
| Series WW 5.50% 7/1/38 | 2,100,000 | 2,245,971 | ||||||
| Series XX 5.75% 7/1/36 | 3,245,000 | 3,558,305 | ||||||
| 23,913,831 | ||||||||
22
| Principal amount | Value | |||||||
| Municipal Bonds (continued) | ||||||||
| Healthcare Revenue Bonds – 11.15% | ||||||||
| Alachua County, Florida Health Facilities Authority | ||||||||
| Refunding (Oak Hammock University) | ||||||||
| Series A 8.00% 10/1/42 | $ | 1,000,000 | $ | 1,187,540 | ||||
| Brevard County, Florida Health Facilities Authority Health | ||||||||
| Care Facilities Revenue (Heath First Inc. Project) | ||||||||
| 7.00% 4/1/39 | 1,610,000 | 1,995,885 | ||||||
| Butler County, Pennsylvania Hospital Authority Revenue | ||||||||
| (Butler Health System Project) 7.125% 7/1/29 | 2,500,000 | 2,993,475 | ||||||
| California Statewide Communities Development Authority | ||||||||
| Revenue (Kaiser Permanente) Series A 5.00% 4/1/42 | 5,375,000 | 5,873,047 | ||||||
| Cape Girardeau County, Missouri Industrial Development | ||||||||
| Authority Health Care Facilities Revenue Unrefunded | ||||||||
| Balance (St. Francis Medical Center) Series A | ||||||||
| 5.50% 6/1/32 | 1,000,000 | 1,015,920 | ||||||
| Cleveland - Cuyahoga County, Ohio Port Authority | ||||||||
| Revenue Senior Housing (St. Clarence - Geac) | ||||||||
| Series A 6.25% 5/1/38 | 1,500,000 | 1,501,710 | ||||||
| Colorado Health Facilities Authority Revenue | ||||||||
| (Evangelical Lutheran) Series A 5.25% 6/1/34 | 4,275,000 | 4,373,282 | ||||||
| Fairfax County, Virginia Industrial Development | ||||||||
| Authority Revenue (Inova Health Services) | ||||||||
| Series A 5.50% 5/15/35 | 2,500,000 | 2,856,575 | ||||||
| Illinois Finance Authority Revenue (Silver Cross & | ||||||||
| Medical Centers) 7.00% 8/15/44 | 3,000,000 | 3,593,040 | ||||||
| Illinois Health Facilities Authority Revenue (Elmhurst | ||||||||
| Memorial Healthcare Project) 5.625% 1/1/28 | 2,000,000 | 2,025,680 | ||||||
| Koyukuk, Alaska Revenue (Tanana Chiefs Conference | ||||||||
| Health Care Facility Project) 7.75% 10/1/41 | 3,000,000 | 3,291,870 | ||||||
| Louisiana Public Facilities Authority Revenue | ||||||||
| (Ochsner Clinic Foundation Project) 6.50% 5/15/37 | 2,190,000 | 2,621,956 | ||||||
| Maricopa County, Arizona Industrial Development Authority | ||||||||
| Health Facilities Revenue (Catholic Healthcare West) | ||||||||
| Series A 6.00% 7/1/39 | 3,690,000 | 4,237,707 | ||||||
| Martin County, Florida Health Facilities Authority Revenue | ||||||||
| (Martin Memorial Medical Center) 5.50% 11/15/42 | 2,500,000 | 2,728,900 | ||||||
| Michigan State Hospital Finance Authority Revenue | ||||||||
| (Ascension Health Credit Group) | ||||||||
| Series B 5.25% 11/15/26 | 3,500,000 | 3,583,545 | ||||||
23
Statements of net assets
Delaware Tax-Free USA Fund
| Principal amount | Value | |||||||
| Municipal Bonds (continued) | ||||||||
| Healthcare Revenue Bonds (continued) | ||||||||
| Montgomery County, Pennsylvania Industrial Development | ||||||||
| Authority Revenue (Whitemarsh Continuing Care) | ||||||||
| 6.00% 2/1/21 | $ | 3,075,000 | $ | 3,148,247 | ||||
| New York State Dormitory Authority Revenue | ||||||||
| Non State Supported Debt | ||||||||
| (North Shore LI Jewish Health System) | ||||||||
| Series A 5.50% 5/1/37 | 3,000,000 | 3,415,980 | ||||||
| (Orange Regional Medical Center) | ||||||||
| 6.25% 12/1/37 | 2,250,000 | 2,449,485 | ||||||
| 6.50% 12/1/21 | 2,745,000 | 3,153,676 | ||||||
| North Carolina Medical Care Commission | ||||||||
| Health Care Facilities Revenue | ||||||||
| (First Mortgage - Galloway Ridge Project) | ||||||||
| Series A 5.875% 1/1/31 | 1,555,000 | 1,679,633 | ||||||
| (First Mortgage - Presbyterian Homes) 5.40% 10/1/27 | 3,260,000 | 3,346,194 | ||||||
| Ohio State Higher Educational Facility Community Revenue | ||||||||
| (Cleveland Clinic Health System Obligation Group) | ||||||||
| Series A 5.25% 1/1/33 | 2,000,000 | 2,211,360 | ||||||
| ^ | Oregon Health & Science University Revenue (Capital | |||||||
| Appreciation Insured) Series A 5.75% 7/1/21 (NATL-RE) | 2,000,000 | 1,507,640 | ||||||
| Philadelphia, Pennsylvania Hospitals & Higher Education | ||||||||
| Facilities Authority Hospital Revenue (Temple University | ||||||||
| Health System) Series A 5.50% 7/1/30 | 2,700,000 | 2,815,938 | ||||||
| Rochester, Minnesota Health Care Facilities Revenue | ||||||||
| (Mayo Clinic) 4.00% 11/15/41 | 1,310,000 | 1,371,701 | ||||||
| Tempe, Arizona Industrial Development Authority Revenue | ||||||||
| (Friendship Village) Series A 6.25% 12/1/46 | 1,000,000 | 1,081,190 | ||||||
| West Virginia Hospital Finance Authority Revenue | ||||||||
| (Highland Hospital Obligation Group) 9.125% 10/1/41 | 3,000,000 | 3,701,520 | ||||||
| 73,762,696 | ||||||||
| Housing Revenue Bonds – 0.88% | ||||||||
| California Municipal Finance Authority Mobile Home Park | ||||||||
| Revenue (Caritas Projects) Series A 6.40% 8/15/45 | 4,735,000 | 5,184,446 | ||||||
| Oregon Health, Housing, Educational, & Cultural Facilities | ||||||||
| Authority Revenue (Pier Park Project) Series A | ||||||||
| 6.05% 4/1/18 (GNMA) (AMT) | 650,000 | 651,723 | ||||||
| 5,836,169 | ||||||||
24
| Principal amount | Value | |||||||
| Municipal Bonds (continued) | ||||||||
| Lease Revenue Bonds – 10.72% | ||||||||
| California Statewide Communities Development Authority | ||||||||
| Revenue (Inland Regional Center Project) 5.25% 12/1/27 | $ | 1,000,000 | $ | 1,030,880 | ||||
| Capital Area, Texas Cultural Education Facilities Finance | ||||||||
| Corporation Revenue (Roman Catholic Diocese) | ||||||||
| Series B 6.125% 4/1/45 | 2,045,000 | 2,246,780 | ||||||
| Capital Trust Agency Florida Revenue | ||||||||
| (Fort Lauderdale/Cargo Acquisition Project) | ||||||||
| 5.75% 1/1/32 (AMT) | 4,750,000 | 4,789,710 | ||||||
| (Orlando/Cargo Acquisition Project) 6.75% 1/1/32 (AMT) | 2,395,000 | 2,459,378 | ||||||
| Grapevine, Texas Industrial Development Corporate Revenue | ||||||||
| (Air Cargo) 6.50% 1/1/24 (AMT) | 850,000 | 861,475 | ||||||
| Houston, Texas Industrial Development Corporate Revenue | ||||||||
| (Air Cargo) 6.375% 1/1/23 (AMT) | 1,855,000 | 1,879,894 | ||||||
| Hudson, New York Yards Infrastructure Corporation | ||||||||
| Revenue Series A 5.75% 2/15/47 | 10,250,000 | 12,044,058 | ||||||
| Missouri State Development Finance Board Infrastructure | ||||||||
| Facilities Revenue | ||||||||
| (Branson Landing Project) Series A | ||||||||
| 5.25% 12/1/19 | 1,435,000 | 1,500,092 | ||||||
| 5.625% 12/1/28 | 2,365,000 | 2,446,805 | ||||||
| New Jersey Economic Development Authority | ||||||||
| (School Facilities Construction) | ||||||||
| Series EE 5.00% 9/1/18 | 3,500,000 | 4,205,285 | ||||||
| Series GG 5.75% 9/1/23 | 1,000,000 | 1,244,710 | ||||||
| New York City, New York Industrial Development Agency | ||||||||
| Revenue (Queens Baseball Stadium) | ||||||||
| 5.00% 1/1/46 (AMBAC) | 1,000,000 | 1,015,100 | ||||||
| New York City, New York Industrial Development Agency | ||||||||
| Trips Series A 5.00% 7/1/28 (AMT) | 1,685,000 | 1,784,921 | ||||||
| New York State Liberty Development Corporation Revenue | ||||||||
| (World Trade Center Project) 5.75% 11/15/51 | 16,490,000 | 19,551,531 | ||||||
| Class 1 5.00% 9/15/40 | 2,140,000 | 2,438,423 | ||||||
| Class 2 5.00% 9/15/43 | 3,860,000 | 4,229,286 | ||||||
| Puerto Rico Public Buildings Authority Revenue | ||||||||
| (Government Facilities) | ||||||||
| Series F 5.25% 7/1/25 | 930,000 | 1,013,988 | ||||||
| Series U 5.25% 7/1/42 | 4,100,000 | 4,170,602 | ||||||
25
Statements of net assets
Delaware Tax-Free USA Fund
| Principal amount | Value | |||||||
| Municipal Bonds (continued) | ||||||||
| Lease Revenue Bonds (continued) | ||||||||
| ^ | St. Louis, Missouri Industrial Development Authority | |||||||
| Leasehold Revenue (Convention Center Hotel) | ||||||||
| 5.80% 7/15/20 (AMBAC) | $ | 3,035,000 | $ | 1,976,787 | ||||
| 70,889,705 | ||||||||
| Local General Obligation Bonds – 3.07% | ||||||||
| Georgetown, Texas Independent School District | ||||||||
| (School Building) | ||||||||
| 5.00% 8/15/24 (PSF) | 1,430,000 | 1,738,208 | ||||||
| 5.00% 8/15/26 (PSF) | 1,000,000 | 1,201,380 | ||||||
| New York City, New York | ||||||||
| Series A 5.00% 8/1/19 | 2,690,000 | 3,307,732 | ||||||
| Series I-1 5.375% 4/1/36 | 5,000,000 | 5,786,950 | ||||||
| Subseries D-1 5.00% 10/1/36 | 6,500,000 | 7,424,040 | ||||||
| Wake County, North Carolina Refunding | ||||||||
| Series C 5.00% 3/1/22 | 635,000 | 819,531 | ||||||
| 20,277,841 | ||||||||
| §Pre-Refunded/Escrowed to Maturity Bonds – 6.09% | ||||||||
| Boerne, Texas Independent School District Building | ||||||||
| 5.25% 2/1/27-13 (PSF) | 4,000,000 | 4,084,520 | ||||||
| Cape Girardeau County, Missouri Industrial Development | ||||||||
| Authority Health Care Facilities Revenue (Southeast | ||||||||
| Missouri Hospital) 5.25% 6/1/16 (NATL-RE) | 310,000 | 341,961 | ||||||
| Delaware Transportation Authority Revenue 5.00% 7/1/22-15 | 4,345,000 | 4,920,060 | ||||||
| ^ | Greene County, Missouri Single Family Mortgage Revenue | |||||||
| Municipal Multiplier (Private Mortgage Insurance) | ||||||||
| 11.75% 3/1/16 | 1,225,000 | 1,188,422 | ||||||
| Michigan State Hospital Finance Authority Revenue | ||||||||
| (Trinity Health Credit) Series C 5.375% 12/1/30-12 | 4,120,000 | 4,173,395 | ||||||
| New Jersey State Economic Development Authority | ||||||||
| Revenue (Cigarette Tax) 5.75% 6/15/34-14 | 1,935,000 | 2,123,334 | ||||||
| Oklahoma State Turnpike Authority Revenue (First Senior) | ||||||||
| 6.00% 1/1/22 | 13,535,000 | 18,559,056 | ||||||
| Powell, Ohio 5.50% 12/1/32-12 (NATL-RE) (FGIC) | 2,000,000 | 2,026,620 | ||||||
| Virgin Islands Public Finance Authority Revenue | ||||||||
| Series A 7.30% 10/1/18 | 1,825,000 | 2,210,075 | ||||||
| Wisconsin Housing & Economic Developing Authority | ||||||||
| Revenue 6.10% 6/1/21-17 (FHA) | 550,000 | 647,895 | ||||||
| 40,275,338 | ||||||||
26
| Principal amount | Value | |||||||
| Municipal Bonds (continued) | ||||||||
| Special Tax Revenue Bonds – 17.14% | ||||||||
| Brooklyn Arena Local Development Corporation, New York | ||||||||
| Pilot Revenue (Barclays Center Project) | ||||||||
| 6.25% 7/15/40 | $ | 1,500,000 | $ | 1,744,755 | ||||
| 6.50% 7/15/30 | 8,230,000 | 9,863,079 | ||||||
| California State Economic Recovery Series A 5.25% 7/1/21 | 3,130,000 | 3,811,213 | ||||||
| California Statewide Communities Development Authority | ||||||||
| Revenue (Inland Regional Center Project) | ||||||||
| 5.375% 12/1/37 | 3,220,000 | 3,280,826 | ||||||
| Denver, Colorado Convention Center Hotel Authority | ||||||||
| Revenue Senior 5.00% 12/1/35 (SGI) | 1,305,000 | 1,338,434 | ||||||
| Florida Enterprise Community Development District | ||||||||
| Special Assessment 6.10% 5/1/16 (NATL-RE) | 490,000 | 492,127 | ||||||
| Guam Government Business Privilege Tax Revenue | ||||||||
| Series B-1 5.00% 1/1/42 | 2,500,000 | 2,757,525 | ||||||
| Henderson, Nevada Local Improvement Districts #T-18 | ||||||||
| 5.30% 9/1/35 | 2,305,000 | 1,279,529 | ||||||
| Hollywood, Florida Community Redevelopment Agency | ||||||||
| Revenue (Beach CRA) 5.625% 3/1/24 | 1,200,000 | 1,243,224 | ||||||
| Jacksonville, Florida Excise Taxes Revenue Series B | ||||||||
| 5.00% 10/1/26 (AMBAC) | 1,000,000 | 1,003,310 | ||||||
| Lammersville School District Community Facilities | ||||||||
| District #2002 (Mountain House) 5.125% 9/1/35 | 4,125,000 | 4,133,126 | ||||||
| Missouri State Environmental Improvement & Energy Water | ||||||||
| Pollution Control Revenue (State Revolving Fund Project) | ||||||||
| Series A 6.05% 7/1/16 (AGM) | 670,000 | 673,062 | ||||||
| Missouri State Highways & Transportation Commission | ||||||||
| State Road Revenue Series B 5.00% 5/1/24 | 9,000,000 | 10,301,939 | ||||||
| Mosaic, Virginia District Community Development Authority | ||||||||
| Revenue Series A 6.875% 3/1/36 | 3,980,000 | 4,450,715 | ||||||
| New Jersey Economic Development Authority Revenue | ||||||||
| 5.00% 6/15/25 | 3,000,000 | 3,382,560 | ||||||
| 5.00% 6/15/26 | 2,000,000 | 2,244,440 | ||||||
| New Jersey Transportation Trust Fund Authority Revenue | ||||||||
| Series B 5.50% 6/15/31 | 10,000,000 | 11,905,599 | ||||||
| New York City, New York Industrial Development Agency | ||||||||
| (Yankee Stadium) 7.00% 3/1/49 (ASSURED GTY) | 1,000,000 | 1,227,800 | ||||||
| New York City, New York Transitional Finance Authority | ||||||||
| Future Tax Secured | ||||||||
| Fiscal 2011 Series D 5.00% 2/1/26 | 3,000,000 | 3,597,240 | ||||||
27
Statements of net assets
Delaware Tax-Free USA Fund
| Principal amount | Value | |||||||
| Municipal Bonds (continued) | ||||||||
| Special Tax Revenue Bonds (continued) | ||||||||
| New York City, New York Transitional Finance Authority | ||||||||
| Future Tax Secured (continued) | ||||||||
| Series C 5.25% 11/1/25 | $ | 6,000,000 | $ | 7,312,320 | ||||
| Series D 5.00% 2/1/31 | 4,875,000 | 4,953,731 | ||||||
| New York Sales Tax Asset Receivables | ||||||||
| Series A 5.25% 10/15/27 (AMBAC) | 1,000,000 | 1,093,250 | ||||||
| New York State Dormitory Authority State Personal Income | ||||||||
| Tax Revenue Series B 5.25% 3/15/38 | 6,000,000 | 7,022,340 | ||||||
| Puerto Rico Sales Tax Financing Corporation Tax Revenue | ||||||||
| ^ | (Convertible Capital Appreciation Bonds) | |||||||
| Series A 5.75% 8/1/37 | 5,000,000 | 5,583,150 | ||||||
| Series A 6.75% 8/1/32 | 3,890,000 | 4,028,484 | ||||||
| Series C 5.00% 8/1/40 | 6,000,000 | 6,504,600 | ||||||
| Series C 6.00% 8/1/39 | 2,250,000 | 2,566,620 | ||||||
| San Mateo, California Special Tax Revenue (Community | ||||||||
| Facilities District #2008-1-Bay Meadows) 6.00% 9/1/42 | 1,000,000 | 1,088,620 | ||||||
| Tampa, Florida Sports Authority Revenue Sales Tax | ||||||||
| (Tampa Bay Arena Project) 5.75% 10/1/20 (NATL-RE) | 1,000,000 | 1,111,350 | ||||||
| ^ | Wyandotte County, Kansas City, Kansas Unified | |||||||
| Government Special Obligation Revenue (Capital | ||||||||
| Appreciation - Sales Tax Subordinate Lien) 6.07% 6/1/21 | 4,970,000 | 3,372,543 | ||||||
| 113,367,511 | ||||||||
| State General Obligation Bonds – 7.32% | ||||||||
| California State 5.25% 11/1/40 | 3,795,000 | 4,299,014 | ||||||
| California State Various Purposes | ||||||||
| 5.00% 9/1/41 | 6,250,000 | 6,864,625 | ||||||
| 6.00% 4/1/38 | 4,060,000 | 4,789,257 | ||||||
| 6.50% 4/1/33 | 2,570,000 | 3,207,180 | ||||||
| New Jersey Economic Development Authority Revenue | ||||||||
| 5.00% 6/15/28 | 2,695,000 | 3,007,351 | ||||||
| 5.00% 6/15/29 | 2,050,000 | 2,273,307 | ||||||
| North Carolina State Public Improvement | ||||||||
| Series A 5.00% 5/1/20 | 10,585,000 | 13,394,152 | ||||||
| North Carolina State Refunding Series C 5.00% 5/1/22 | 2,950,000 | 3,817,094 | ||||||
| Puerto Rico Commonwealth Public Improvement | ||||||||
| Refunding Series A 5.00% 7/1/41 | 1,800,000 | 1,793,070 | ||||||
| Series A 5.25% 7/1/23 | 500,000 | 524,610 | ||||||
| (Un-Refunded Balance) Series A 5.125% 7/1/31 | 4,415,000 | 4,415,088 | ||||||
| 48,384,748 | ||||||||
28
| Principal amount | Value | |||||||
| Municipal Bonds (continued) | ||||||||
| Transportation Revenue Bonds – 9.31% | ||||||||
| Central Texas Regional Mobility Authority Revenue | ||||||||
| Senior Lien 6.00% 1/1/41 | $ | 5,160,000 | $ | 6,016,199 | ||||
| Maryland Economic Development Corporation Revenue | ||||||||
| (Transportation Facilities Project) Series A 5.75% 6/1/35 | 5,075,000 | 5,550,020 | ||||||
| New York State Thruway Authority General Revenue | ||||||||
| Series H 5.00% 1/1/19 (NATL-RE) | 6,240,000 | 7,399,268 | ||||||
| North Texas Tollway Authority Revenue (First Tier) | ||||||||
| Series A 6.00% 1/1/24 | 3,345,000 | 3,998,914 | ||||||
| • | Series E-3 5.75% 1/1/38 | 2,000,000 | 2,303,880 | |||||
| Phoenix, Arizona Civic Improvement Corporation Airport | ||||||||
| Revenue Junior Lien Series A 5.00% 7/1/26 | 1,800,000 | 2,076,732 | ||||||
| Port Authority of New York & New Jersey Special Project | ||||||||
| (JFK International Air Terminal) | ||||||||
| 6.00% 12/1/42 | 4,735,000 | 5,502,922 | ||||||
| 6.50% 12/1/28 | 5,500,000 | 6,028,935 | ||||||
| St. Louis, Missouri Airport Revenue (Lambert-St. Louis | ||||||||
| International) Series A-1 6.625% 7/1/34 | 5,995,000 | 7,094,483 | ||||||
| Texas Private Activity Bond Surface Transportation | ||||||||
| Corporate Senior Lien | ||||||||
| (LBJ Infrastructure) | ||||||||
| 7.00% 6/30/40 | 5,715,000 | 6,991,331 | ||||||
| 7.50% 6/30/33 | 1,560,000 | 1,984,195 | ||||||
| (Mobility Partners) 6.875% 12/31/39 | 5,500,000 | 6,616,170 | ||||||
| 61,563,049 | ||||||||
| Water & Sewer Revenue Bonds – 3.59% | ||||||||
| Atlanta, Georgia Water & Wastewater Revenue | ||||||||
| Series A 6.25% 11/1/39 | 5,500,000 | 6,617,215 | ||||||
| New York City, New York Municipal Water Finance | ||||||||
| Authority Water & Sewer System Revenue | ||||||||
| Fiscal 2009 Series A 5.75% 6/15/40 | 4,000,000 | 4,825,920 | ||||||
| Fiscal 2012 Series BB 5.25% 6/15/44 | 5,395,000 | 6,317,599 | ||||||
| San Francisco, California City & County Public Utilities | ||||||||
| Commission Water Revenue Series F 5.00% 11/1/27 | 5,000,000 | 5,973,900 | ||||||
| 23,734,634 | ||||||||
| Total Municipal Bonds (cost $586,656,802) | 655,690,367 | |||||||
29
Statements of net assets
Delaware Tax-Free USA Fund
| Principal amount | Value | ||||||||
| Short-Term Investments – 0.19% | |||||||||
| ¤Variable Rate Demand Notes – 0.19% | |||||||||
| California State (Kindergarten) Series B1 | |||||||||
| 0.17% 5/1/34 (LOC – Citibank) | $ | 550,000 | $ | 550,000 | |||||
| Colorado State Educational & Cultural Facilities Authority | |||||||||
| Revenue (National Jewish Federation Bond Program) | |||||||||
| Series D-7 0.19% 2/1/35 (LOC – Wells Fargo Bank) | 200,000 | 200,000 | |||||||
| Idaho State University Foundation Income Revenue | |||||||||
| (L.E. & Thelma Stephens Project) | |||||||||
| 0.17% 5/1/21 (LOC – Wells Fargo Bank) | 500,000 | 500,000 | |||||||
| Total Short-Term Investments (cost $1,250,000) | 1,250,000 | ||||||||
| Total Value of Securities – 99.35% | |||||||||
| (cost $587,906,802) | 656,940,367 | ||||||||
| Receivables and Other Assets | |||||||||
| Net of Liabilities – 0.65% | 4,328,903 | ||||||||
| Net Assets Applicable to 53,909,244 | |||||||||
| Shares Outstanding – 100.00% | $ | 661,269,270 | |||||||
| Net Asset Value – Delaware Tax-Free USA Fund | |||||||||
| Class A ($604,414,902 / 49,284,812 Shares) | $12.26 | ||||||||
| Net Asset Value – Delaware Tax-Free USA Fund | |||||||||
| Class B ($1,827,534 / 149,101 Shares) | $12.26 | ||||||||
| Net Asset Value – Delaware Tax-Free USA Fund | |||||||||
| Class C ($36,840,177 / 3,003,328 Shares) | $12.27 | ||||||||
| Net Asset Value – Delaware Tax-Free USA Fund | |||||||||
| Institutional Class ($18,186,657 / 1,472,003 Shares) | $12.36 | ||||||||
| Components of Net Assets at August 31, 2012: | |||||||||
| Shares of beneficial interest (unlimited authorization – no par) | $ | 589,080,107 | |||||||
| Undistributed net investment income | 128,895 | ||||||||
| Accumulated net realized gain on investments | 3,026,703 | ||||||||
| Net unrealized appreciation of investments | 69,033,565 | ||||||||
| Total net assets | $ | 661,269,270 | |||||||
30
| § | Pre-refunded bonds. Municipals bonds that are generally backed or secured by U.S. Treasury bonds. For pre-refunded bonds, the stated maturity is followed by the year in which the bond is pre-refunded. See Note 8 in “Notes to financial statements.” |
| • | Variable rate security. The rate shown is the rate as of August 31, 2012. Interest rates reset periodically. |
| ^ | Zero coupon security. The rate shown is the yield at the time of purchase. |
| ¤ | Tax-exempt obligations that contain a floating or variable interest rate adjustment formula and an unconditional right of demand to receive payment of the unpaid principal balance plus accrued interest upon a short notice period (generally up to 30 days) prior to specified dates either from the issuer or by drawing on a bank letter of credit, a guarantee or insurance issued with respect to such instrument. The rate shown is the rate as of August 31, 2012. |
Summary of abbreviations:
AGM — Insured by Assured Guaranty Municipal Corporation
AMBAC — Insured by AMBAC Assurance Corporation
AMT — Subject to Alternative Minimum Tax
ASSURED GTY — Insured by Assured Guaranty Corporation
FGIC — Insured by Financial Guaranty Insurance Company
FHA — Federal Housing Administration
GNMA — Government National Mortgage Association collateral
LOC — Letter of Credit
NATL-RE — Insured by National Public Finance Guarantee Corporation
PSF — Insured by the Permanent School Fund
SGI — Insured by Syncora Guarantee Inc.
| Net Asset Value and Offering Price Per Share – | ||
| Delaware Tax-Free USA Fund | ||
| Net asset value Class A (A) | $ | 12.26 |
| Sales charge (4.50% of offering price) (B) | 0.58 | |
| Offering price | $ | 12.84 |
| (A) | Net asset value per share, as illustrated, is the amount which would be paid upon redemption or repurchase of shares. |
| (B) | See the current prospectus for purchases of $100,000 or more. |
See accompanying notes, which are an integral part of the financial statements.
31
| Statements of net assets | |
| Delaware Tax Free USA Intermediate Fund | August 31, 2012 |
| Principal amount | Value | ||||||
| Municipal Bonds – 99.02% | |||||||
| Corporate Revenue Bonds – 11.52% | |||||||
| Alabama 21st Century Authority Revenue Series A | |||||||
| 5.00% 6/1/19 | $ | 365,000 | $ | 435,357 | |||
| 5.00% 6/1/20 | 1,905,000 | 2,289,258 | |||||
| 5.00% 6/1/21 | 2,735,000 | 3,307,764 | |||||
| Allegheny County, Pennsylvania Industrial Development | |||||||
| Authority Revenue (Environmental Improvement - | |||||||
| U.S. Steel Corp. Project) 6.50% 5/1/17 | 2,305,000 | 2,564,520 | |||||
| • | Chesapeake, Virginia Economic Development Authority | ||||||
| Pollution Control Revenue (Electric & Power Co. Project) | |||||||
| Series A 3.60% 2/1/32 | 1,150,000 | 1,163,593 | |||||
| Chesterfield County, Virginia Economic Development | |||||||
| Authority Pollution Control Revenue (Virginia Electric & | |||||||
| Power) Series A 5.00% 5/1/23 | 1,460,000 | 1,708,404 | |||||
| Harris County, Texas Industrial Development | |||||||
| Corporation Solid Waste Disposal Revenue | |||||||
| (Deer Park Refining Project) 5.00% 2/1/23 | 2,750,000 | 3,062,428 | |||||
| Illinois Railsplitter Tobacco Settlement Authority | |||||||
| 5.25% 6/1/20 | 7,160,000 | 8,397,605 | |||||
| 6.25% 6/1/24 | 7,500,000 | 8,445,374 | |||||
| Indianapolis, Indiana Airport Authority Revenue | |||||||
| Special Facilities (Federal Express Corp. Project) | |||||||
| 5.10% 1/15/17 (AMT) | 750,000 | 851,670 | |||||
| Iowa Finance Authority Pollution Control Facilities Revenue | |||||||
| (Interstate Power) 5.00% 7/1/14 (FGIC) | 2,000,000 | 2,144,180 | |||||
| • | Maricopa County, Arizona Corporation Pollution Control | ||||||
| Revenue (Public Service - Palo Verde Project) Series B | |||||||
| 5.20% 6/1/43 | 6,000,000 | 6,769,260 | |||||
| Maryland Economic Development Corporation Pollution | |||||||
| Control Revenue | |||||||
| (CNX Marine Terminals Inc.) 5.75% 9/1/25 | 2,050,000 | 2,226,300 | |||||
| (Potomac Electric Project) 6.20% 9/1/22 | 1,780,000 | 2,165,477 | |||||
| Michigan State Strategic Fund Limited Obligation Revenue | |||||||
| (Dow Chemical Project) Series B-2 6.25% 6/1/14 | 4,500,000 | 4,909,995 | |||||
| • | Mobile, Alabama Industrial Development Board Pollution | ||||||
| Control Revenue (Alabama Power Co.) Series B | |||||||
| 4.875% 6/1/34 | 1,625,000 | 1,662,424 | |||||
| New Jersey Economic Development Authority Special | |||||||
| Facilities Revenue (Continental Airlines, Inc. Project) | |||||||
| 4.875% 9/15/19 (AMT) | 4,000,000 | 4,070,720 | |||||
32
| Principal amount | Value | ||||||
| Municipal Bonds (continued) | |||||||
| Corporate Revenue Bonds (continued) | |||||||
| Ohio State Air Quality Development Authority Revenue | |||||||
| Environmental Improvement (First Energy) | |||||||
| Series A 5.70% 2/1/14 | $ | 2,225,000 | $ | 2,353,783 | |||
| Series A 5.70% 8/1/20 | 4,320,000 | 5,037,034 | |||||
| Series C 5.625% 6/1/18 | 2,370,000 | 2,754,485 | |||||
| • | Pennsylvania Economic Development Financing Authority | ||||||
| Exempt Facilities Revenue (Shipping Port) Series A | |||||||
| 3.375% 12/1/40 | 5,000,000 | 5,168,100 | |||||
| Salt Verde, Arizona Financial Corporation Senior Gas | |||||||
| Revenue 5.25% 12/1/24 | 3,050,000 | 3,358,599 | |||||
| Tobacco Securitization Authority, Minnesota Tobacco | |||||||
| Settlement Revenue Series B | |||||||
| 5.00% 3/1/21 | 3,415,000 | 4,028,471 | |||||
| 5.00% 3/1/22 | 2,935,000 | 3,448,919 | |||||
| 5.25% 3/1/31 | 2,480,000 | 2,803,590 | |||||
| Tobacco Settlement Financing Corporation, New Jersey | |||||||
| Series 1A 5.00% 6/1/41 | 9,050,000 | 7,547,610 | |||||
| Valdez, Alaska Marine (BP Pipelines Project) Series B | |||||||
| 5.00% 1/1/21 | 6,675,000 | 7,981,297 | |||||
| 100,656,217 | |||||||
| Education Revenue Bonds – 7.16% | |||||||
| Boise, Idaho State University Revenue (General Project) | |||||||
| Series A 4.00% 4/1/19 | 1,000,000 | 1,157,710 | |||||
| California Municipal Finance Authority Educational Revenue | |||||||
| (American Heritage Education Foundation Project) | |||||||
| Series A 5.25% 6/1/26 | 1,000,000 | 975,070 | |||||
| California Statewide Communities Development Authority | |||||||
| Student Housing Revenue (Irvine, LLC - UCI East | |||||||
| Campus) 6.00% 5/15/23 | 3,150,000 | 3,514,235 | |||||
| Chattanooga, Tennessee Health Educational & Housing | |||||||
| Facilities Board Revenue (CDFI Phase I, LLC Project) | |||||||
| Series B 5.50% 10/1/20 | 885,000 | 926,515 | |||||
| Clifton, Texas Higher Education Finance Corporation | |||||||
| Revenue (Uplift Education) Series A 6.00% 12/1/30 | 1,100,000 | 1,264,054 | |||||
| Connecticut State Health & Educational Facilities Authority | |||||||
| Revenue (Yale University) Series A-1 5.00% 7/1/25 | 5,000,000 | 6,071,950 | |||||
33
Statements of net assets
Delaware Tax Free USA Intermediate Fund
| Principal amount | Value | ||||||
| Municipal Bonds (continued) | |||||||
| Education Revenue Bonds (continued) | |||||||
| Delaware County, Pennsylvania Industrial Development | |||||||
| Authority Revenue (Chester Community Charter School) | |||||||
| Series A 5.25% 8/15/30 | $ | 1,335,000 | $ | 1,116,167 | |||
| Grand Traverse, Michigan Public School Academy Revenue | |||||||
| 5.00% 11/1/36 | 1,000,000 | 869,750 | |||||
| Marietta, Georgia Development Authority Revenue | |||||||
| (Life University Income Project) 6.25% 6/15/20 | 990,000 | 1,028,768 | |||||
| Massachusetts State Development Finance | |||||||
| Agency Revenue (Harvard University) Series B-1 | |||||||
| 5.25% 10/15/29 | 1,670,000 | 2,067,226 | |||||
| Massachusetts State Health & Educational Facilities | |||||||
| Authority Revenue (Massachusetts Institution Technology) | |||||||
| Series M 5.25% 7/1/20 | 3,000,000 | 3,877,200 | |||||
| Metropolitan Government Nashville & Davidson County, | |||||||
| Tennessee Health & Educational Facilities Revenue | |||||||
| (Belmont University Project) | |||||||
| 5.00% 11/1/27 | 660,000 | 721,750 | |||||
| 5.00% 11/1/28 | 550,000 | 600,435 | |||||
| 5.00% 11/1/30 | 600,000 | 652,116 | |||||
| Nassau County, New York Industrial Development Agency | |||||||
| Civic Facility Revenue (New York Institute of Technology | |||||||
| Project) Series A 4.75% 3/1/26 | 1,760,000 | 1,930,667 | |||||
| New York City Trust for Cultural Resources | |||||||
| (Whitney Museum of American Art) | |||||||
| 5.00% 7/1/21 | 3,025,000 | 3,661,490 | |||||
| 5.00% 7/1/31 | 1,000,000 | 1,128,760 | |||||
| New York State Dormitory Authority | |||||||
| (Non State Supported Debt - Rockefeller University) | |||||||
| Series A 5.00% 7/1/27 | 1,055,000 | 1,279,747 | |||||
| (Non State Supported Debt - St. Joseph’s College) | |||||||
| 5.25% 7/1/25 | 1,000,000 | 1,081,540 | |||||
| North Carolina Capital Facilities Finance Agency | |||||||
| (High Point University) 5.00% 5/1/32 | 1,830,000 | 1,962,126 | |||||
| Ohio State Higher Educational Facility Revenue | |||||||
| (John Carroll University) 5.50% 11/15/18 | 335,000 | 349,050 | |||||
| Pennsylvania State Higher Educational Facilities Authority | |||||||
| Revenue (Drexel University) Series A 5.25% 5/1/25 | 5,290,000 | 6,237,333 | |||||
34
| Principal amount | Value | ||||||
| Municipal Bonds (continued) | |||||||
| Education Revenue Bonds (continued) | |||||||
| Private Colleges & Universities Authority, Georgia Revenue | |||||||
| (Mercer University Project) | |||||||
| Series A 5.25% 10/1/27 | $ | 2,020,000 | $ | 2,239,877 | |||
| Series C 5.25% 10/1/23 | 600,000 | 677,118 | |||||
| Series C 5.25% 10/1/27 | 2,100,000 | 2,349,291 | |||||
| Troy, New York Capital Resource Corporation Revenue | |||||||
| (Rensselaer Polytechnic) Series B 5.00% 9/1/18 | 2,500,000 | 2,997,425 | |||||
| University of California Series A 5.125% 5/15/20 (AMBAC) | 175,000 | 180,854 | |||||
| University of Minnesota Series A 5.00% 12/1/17 | 5,040,000 | 6,124,961 | |||||
| University of North Carolina at Chapel Hill 5.00% 12/1/31 | 3,490,000 | 4,031,648 | |||||
| University of Oklahoma Research Facilities Revenue | |||||||
| 5.00% 3/1/23 (AMBAC) | 1,065,000 | 1,078,227 | |||||
| University of Virginia General Revenue Series B | |||||||
| 5.00% 6/1/20 | 205,000 | 211,681 | |||||
| 5.00% 6/1/21 | 205,000 | 211,681 | |||||
| 62,576,422 | |||||||
| Electric Revenue Bonds – 2.83% | |||||||
| California State Department Water Resources Power | |||||||
| Supply Revenue | |||||||
| Series L 5.00% 5/1/19 | 6,000,000 | 7,401,120 | |||||
| Series N 5.00% 5/1/21 | 3,580,000 | 4,532,173 | |||||
| Metropolitan Government Nashville & Davidson County, | |||||||
| Tennessee Electric Revenue Series B 5.50% 5/15/14 | 1,000,000 | 1,088,090 | |||||
| Rochester, Minnesota Electric Utilities Revenue Series C | |||||||
| 5.00% 12/1/18 (NATL-RE) | 2,000,000 | 2,309,000 | |||||
| Salt River, Arizona Project Agricultural Improvement & | |||||||
| Power District Series A 5.00% 12/1/28 | 7,735,000 | 9,412,025 | |||||
| 24,742,408 | |||||||
| Healthcare Revenue Bonds – 8.71% | |||||||
| Allegheny County, Pennsylvania Municipal Development | |||||||
| Authority Revenue (University of Pittsburgh Medical | |||||||
| Center) Series A 5.00% 9/1/14 | 4,000,000 | 4,341,080 | |||||
| Berks County, Pennsylvania Hospital Authority Revenue | |||||||
| (Reading Hospital & Medical Center Project) | |||||||
| Series A-3 5.25% 11/1/24 | 4,405,000 | 5,068,789 | |||||
| Butler County, Pennsylvania Hospital Authority Revenue | |||||||
| (Butler Health System Project) 7.125% 7/1/29 | 2,250,000 | 2,694,128 | |||||
35
Statements of net assets
Delaware Tax Free USA Intermediate Fund
| Principal amount | Value | ||||||
| Municipal Bonds (continued) | |||||||
| Healthcare Revenue Bonds (continued) | |||||||
| California Health Facilities Financing Authority Revenue | |||||||
| (Scripps Health) Series A 5.00% 11/15/32 | $ | 4,250,000 | $ | 4,785,203 | |||
| California Statewide Communities Development Authority | |||||||
| Revenue (Kaiser Permanente) Series A 5.00% 4/1/19 | 5,325,000 | 6,323,809 | |||||
| Cleveland-Cuyahoga County, Ohio Port Authority Revenue | |||||||
| (Saint Clarence - Geac) Series A 6.125% 5/1/26 | 715,000 | 715,822 | |||||
| Dauphin County, Pennsylvania General Authority Health | |||||||
| System Revenue (Pinnacle Health System Project) | |||||||
| Series A 6.00% 6/1/29 | 3,400,000 | 3,870,730 | |||||
| Laramie County, Wyoming Hospital Revenue | |||||||
| (Cheyenne Regional Medical Center Project) | |||||||
| 5.00% 5/1/23 | 1,000,000 | 1,146,260 | |||||
| 5.00% 5/1/25 | 1,175,000 | 1,337,644 | |||||
| • | Maryland State Health & Higher Education Facilities | ||||||
| Authority Revenue (John Hopkins Health Systems) | |||||||
| 5.00% 5/15/46 | 790,000 | 815,778 | |||||
| Minneapolis, Minnesota Health Care System Revenue | |||||||
| (Fairview Health) Series A 6.375% 11/15/23 | 3,710,000 | 4,463,093 | |||||
| Minneapolis, Minnesota Revenue (National Marrow Donor | |||||||
| Program Project) | |||||||
| 5.00% 8/1/16 | 4,720,000 | 5,154,429 | |||||
| 5.00% 8/1/18 | 2,500,000 | 2,771,725 | |||||
| New York State Dormitory Authority Revenue | |||||||
| Non State Supported Debt | |||||||
| (Memorial Sloan-Kettering Cancer Center) Series 1 | |||||||
| 4.00% 7/1/21 | 1,600,000 | 1,846,688 | |||||
| 5.00% 7/1/21 | 570,000 | 708,339 | |||||
| 5.00% 7/1/24 | 2,595,000 | 3,157,311 | |||||
| (North Shore LI Jewish) Series A 5.00% 5/1/23 | 4,000,000 | 4,655,800 | |||||
| (Orange Regional Medical Center) 6.50% 12/1/21 | 2,000,000 | 2,297,760 | |||||
| North Carolina Medical Care Commission Health Care | |||||||
| Facilities Revenue (First Mortgage - Presbyterian | |||||||
| Homes) 5.40% 10/1/27 | 780,000 | 800,623 | |||||
| Ohio State Higher Educational Facilities Commission | |||||||
| Revenue (Cleveland Clinic Health System Obligation | |||||||
| Group) Series A | |||||||
| 5.00% 1/1/17 | 2,000,000 | 2,336,100 | |||||
| 5.00% 1/1/18 | 1,000,000 | 1,186,910 | |||||
36
| Principal amount | Value | ||||||
| Municipal Bonds (continued) | |||||||
| Healthcare Revenue Bonds (continued) | |||||||
| Pennsylvania Economic Development Financing Authority | |||||||
| Health System Revenue (Albert Einstein Healthcare) | |||||||
| Series A 6.25% 10/15/23 | $ | 670,000 | $ | 785,046 | |||
| • | Rochester, Minnesota Health Care Facilities Revenue | ||||||
| (Mayo Clinic) | |||||||
| Series A 4.00% 11/15/30 | 3,800,000 | 4,391,090 | |||||
| Series C 4.50% 11/15/38 | 2,540,000 | 3,085,211 | |||||
| St. Louis Park, Minnesota Health Care Facilities Revenue | |||||||
| (Nicollet Health Services) Series C 5.50% 7/1/18 | 4,240,000 | 4,990,522 | |||||
| St. Mary Hospital Authority, Pennsylvania Health | |||||||
| System Revenue (Catholic Health East) Series A | |||||||
| 5.25% 11/15/16 | 1,200,000 | 1,294,332 | |||||
| St. Paul, Minnesota Housing & Redevelopment Authority | |||||||
| Hospital Revenue (Health East Project) 6.00% 11/15/25 | 1,000,000 | 1,061,400 | |||||
| 76,085,622 | |||||||
| Housing Revenue Bonds – 0.54% | |||||||
| Puerto Rico Housing Finance Authority Subordinate | |||||||
| (Capital Fund Modernization) 5.50% 12/1/16 | 4,120,000 | 4,715,999 | |||||
| 4,715,999 | |||||||
| Lease Revenue Bonds – 4.80% | |||||||
| California Statewide Communities Development | |||||||
| Authority Revenue (Inland Regional Center Project) | |||||||
| 5.25% 12/1/27 | 3,645,000 | 3,757,558 | |||||
| Capital Trust Agency Florida Revenue (Fort Lauderdale/ | |||||||
| Cargo Acquisition Project) 5.75% 1/1/32 (AMT) | 1,750,000 | 1,764,630 | |||||
| Golden State, California Tobacco Securitization Corporation | |||||||
| Settlement Revenue Refunding Asset-Backed Series A | |||||||
| 5.00% 6/1/18 | 1,170,000 | 1,170,807 | |||||
| 5.00% 6/1/21 (AMBAC) | 1,000,000 | 1,001,270 | |||||
| Idaho Building Authority Revenue (Health & Welfare | |||||||
| Project) Series A 5.00% 9/1/24 | 2,800,000 | 3,455,704 | |||||
| Los Angeles County, California (Disney Concert Hall Parking) | |||||||
| 5.00% 3/1/22 | 375,000 | 447,506 | |||||
| 5.00% 9/1/22 | 1,100,000 | 1,317,019 | |||||
| 5.00% 3/1/23 | 2,395,000 | 2,848,421 | |||||
| New Jersey Economic Development Authority (School | |||||||
| Facilities Construction) Series EE 5.00% 9/1/18 | 6,875,000 | 8,260,382 | |||||
37
Statements of net assets
Delaware Tax Free USA Intermediate Fund
| Principal amount | Value | ||||||
| Municipal Bonds (continued) | |||||||
| Lease Revenue Bonds (continued) | |||||||
| New York City, New York Industrial Development Agency | |||||||
| Trips Series A 5.00% 7/1/22 (AMT) | $ | 735,000 | $ | 794,234 | |||
| New York State Dormitory Authority Revenue (Third | |||||||
| General Resolution - State University Educational | |||||||
| Facilities) Series A 5.00% 5/15/23 | 2,170,000 | 2,689,541 | |||||
| New York State Municipal Bond Bank Agency Special | |||||||
| School Purpose Revenue Series C 5.25% 6/1/22 | 1,000,000 | 1,035,540 | |||||
| Public Finance Authority, Wisconsin Airport Facilities Revenue | |||||||
| (Senior Obligation Group) 5.00% 7/1/22 (AMT) | 3,925,000 | 4,205,010 | |||||
| Tobacco Settlement Financing New York Revenue | |||||||
| (Asset-Backed) Series B 5.00% 6/1/18 | 1,000,000 | 1,203,530 | |||||
| Virginia Commonwealth Transportation Board | |||||||
| Transportation Revenue (U.S. Route 58 Corridor | |||||||
| Development) Series B 4.75% 5/15/21 | 7,460,000 | 7,952,285 | |||||
| 41,903,437 | |||||||
| Local General Obligation Bonds – 7.73% | |||||||
| Chicago, Illinois Board of Education Refunding Dedicated | |||||||
| Revenue Series B 5.00% 12/1/23 (AMBAC) | 3,500,000 | 3,924,025 | |||||
| Chicago, Illinois Modern Schools Across Chicago Series J | |||||||
| 5.00% 12/1/23 (AMBAC) | 2,865,000 | 3,210,318 | |||||
| Conroe, Texas Independent School District | |||||||
| 5.00% 2/15/25 (PSF) | 3,865,000 | 4,626,212 | |||||
| Dallas, Texas 5.125% 2/15/15 | 3,000,000 | 3,345,630 | |||||
| Fairfax County, Virginia Refunding & Public | |||||||
| Improvement Series A | |||||||
| 5.00% 4/1/17 | 4,000,000 | 4,795,080 | |||||
| 5.00% 4/1/20 | 10,000,000 | 11,965,500 | |||||
| 5.25% 4/1/14 | 3,500,000 | 3,777,235 | |||||
| Henrico County, Virginia Refunding Public Improvement | |||||||
| 5.00% 7/15/19 | 4,000,000 | 5,014,720 | |||||
| Houston, Texas Refunding & Public Improvement Series A | |||||||
| 5.00% 3/1/15 | 3,480,000 | 3,872,440 | |||||
| 5.25% 3/1/28 | 5,000,000 | 5,906,650 | |||||
| Los Angeles, California Unified School District | |||||||
| (Election 2004) Series G 5.00% 7/1/13 (AMBAC) | 2,000,000 | 2,079,800 | |||||
38
| Principal amount | Value | ||||||
| Municipal Bonds (continued) | |||||||
| Local General Obligation Bonds (continued) | |||||||
| New York City, New York | |||||||
| Series A-1 5.00% 8/1/19 | $ | 3,500,000 | $ | 4,134,410 | |||
| Series G 5.25% 8/1/15 | 1,000,000 | 1,070,440 | |||||
| Series I 5.00% 8/1/21 | 1,000,000 | 1,086,490 | |||||
| Series J 5.50% 6/1/23 | 15,000 | 15,544 | |||||
| Subseries D-1 5.00% 10/1/30 | 4,000,000 | 4,717,200 | |||||
| Wake County, North Carolina Refunding Series C | |||||||
| 5.00% 3/1/22 | 3,085,000 | 3,981,501 | |||||
| 67,523,195 | |||||||
| §Pre-Refunded/Escrowed to Maturity Bonds – 4.85% | |||||||
| Benton & Linn Counties, Oregon School District #509J | |||||||
| 5.00% 6/1/21-13 (AGM) | 1,000,000 | 1,035,760 | |||||
| California State 5.25% 11/1/17-13 | 785,000 | 830,671 | |||||
| California State Economic Recovery Series A 5.25% 7/1/14 | 225,000 | 245,630 | |||||
| Casa Grande, Arizona Tax Revenue 5.00% 4/1/22-14 (AMBAC) | 1,600,000 | 1,716,976 | |||||
| Cuyahoga County, Ohio Revenue (Cleveland Clinic Health) | |||||||
| Series A | |||||||
| Pre-Refunded 6.00% 1/1/21-13 | 510,000 | 534,592 | |||||
| Unrefunded 6.00% 1/1/21-13 | 490,000 | 513,628 | |||||
| Duluth, Minnesota Economic Development Authority | |||||||
| Health Care Facilities Revenue (Benedictine Health | |||||||
| System - St. Mary’s Hospital) | |||||||
| 5.25% 2/15/28-14 | 1,000,000 | 1,071,270 | |||||
| 5.50% 2/15/23-14 | 1,000,000 | 1,074,900 | |||||
| Hampton, Virginia Convention Center Revenue | |||||||
| 5.25% 1/15/23-13 (AMBAC) | 1,000,000 | 1,018,990 | |||||
| Lancaster County, Pennsylvania Hospital Authority Revenue | |||||||
| (Lancaster General Hospital Project) 5.75% 3/15/21-13 | 1,000,000 | 1,054,410 | |||||
| Lansing, Michigan Community College (College Building & | |||||||
| Site) 5.00% 5/1/21-13 (NATLE-RE) | 1,325,000 | 1,367,480 | |||||
| Los Angeles, California Unified School District (Election | |||||||
| 1997) Series F 5.00% 7/1/21-13 (FGIC) | 2,880,000 | 2,995,401 | |||||
| Lunenburg County, Virginia Series B | |||||||
| 5.25% 2/1/29-13 (NATL-RE) | 715,000 | 737,344 | |||||
| Miami-Dade County, Florida Educational Facilities Authority | |||||||
| Revenue (University of Miami) | |||||||
| Series A 5.00% 4/1/34-14 (AMBAC) | 2,500,000 | 2,683,374 | |||||
39
Statements of net assets
Delaware Tax Free USA Intermediate Fund
| Principal amount | Value | ||||||
| Municipal Bonds (continued) | |||||||
| §Pre-Refunded/Escrowed to Maturity Bonds (continued) | |||||||
| Michigan State Higher Education Facilities Authority | |||||||
| Revenue Limited Obligation (Kalamazoo College | |||||||
| Project) 5.50% 12/1/19-12 | $ | 500,000 | $ | 506,665 | |||
| Michigan State Hospital Finance Authority Revenue | |||||||
| (Oakwood Obligation Group) 5.50% 11/1/14-13 | 2,230,000 | 2,364,893 | |||||
| Middlesex County, New Jersey Improvement Authority | |||||||
| Revenue (County-Guaranteed Open Space Trust | |||||||
| Foundation) 5.25% 9/15/20-13 | 1,000,000 | 1,052,460 | |||||
| Minneapolis, Minnesota Health Care System Revenue | |||||||
| (Allina Health Systems) Series A 5.75% 11/15/32-12 | 750,000 | 758,573 | |||||
| Minnesota State 5.00% 6/1/14 | 755,000 | 817,069 | |||||
| New Jersey Economic Development Authority Revenue | |||||||
| (Continental Airlines, Inc. Project) 6.625% 9/15/12 (AMT) | 4,000,000 | 4,006,600 | |||||
| New Jersey State Educational Facilities Authority | |||||||
| Revenue (Georgian Court College Project) Series C | |||||||
| 6.50% 7/1/33-13 | 500,000 | 525,845 | |||||
| New York City, New York Municipal Water Finance | |||||||
| Authority Series B 5.00% 6/15/21-14 (AMBAC) | 905,000 | 1,002,125 | |||||
| New York City, New York Series J 5.50% 6/1/23-13 | 985,000 | 1,024,420 | |||||
| New York State Dormitory Authority (Brooklyn Law School) | |||||||
| Series A 5.50% 7/1/18-13 (RADIAN) | 1,000,000 | 1,043,110 | |||||
| North Texas Health Facilities Development Corporation | |||||||
| Hospital Revenue (United Regional Health Care System, | |||||||
| Inc. Project) 6.00% 9/1/23-13 | 1,000,000 | 1,056,440 | |||||
| • | Ohio State Higher Educational Facility Revenue Adjustable | ||||||
| Medium Term (Kenyon College Project) 4.70% 7/1/37-13 | 1,000,000 | 1,035,860 | |||||
| Ohio State University General Receipts (Ohio State | |||||||
| University) Series B | |||||||
| (Pre-refunded) 5.25% 6/1/21-13 | 820,000 | 851,152 | |||||
| (Refunded) 5.25% 6/1/21-13 | 180,000 | 186,815 | |||||
| Puerto Rico Commonwealth Highway & Transportation | |||||||
| Authority Revenue Series J 5.50% 7/1/21-14 | 1,000,000 | 1,093,160 | |||||
| Puerto Rico Commonwealth Public Improvement Series A | |||||||
| 5.25% 7/1/22-13 | 3,470,000 | 3,616,572 | |||||
| Puerto Rico Public Buildings Authority Revenue (Guaranteed | |||||||
| Government Facilities) Series I 5.50% 7/1/23-14 | 2,000,000 | 2,186,320 | |||||
| Puerto Rico Sales Tax Financing Corporation Sales Tax | |||||||
| Revenue Series A 6.125% 8/1/29-14 | 70,000 | 75,852 | |||||
40
| Principal amount | Value | ||||||
| Municipal Bonds (continued) | |||||||
| §Pre-Refunded/Escrowed to Maturity Bonds (continued) | |||||||
| University of California Revenue | |||||||
| General 2012 Series A 5.125% 5/15/20-13 (AMBAC) | $ | 35,000 | $ | 36,217 | |||
| Series A 5.125% 5/15/20-13 (AMBAC) | 40,000 | 41,368 | |||||
| University of Virginia Revenue Series B | |||||||
| 5.00% 6/1/20-13 | 1,045,000 | 1,082,181 | |||||
| 5.00% 6/1/21-13 | 1,045,000 | 1,082,181 | |||||
| 42,326,304 | |||||||
| Resource Recovery Revenue Bond – 0.09% | |||||||
| Pennsylvania Economic Development Financing Authority | |||||||
| Resource Recovery Revenue (Subordinate Colver | |||||||
| Project) Series G 5.125% 12/1/15 (AMT) | 800,000 | 814,496 | |||||
| 814,496 | |||||||
| Special Tax Revenue Bonds – 13.93% | |||||||
| Baltimore, Maryland Convention Center Hotel Revenue | |||||||
| Subordinated Series B 5.00% 9/1/16 | 1,000,000 | 1,010,820 | |||||
| Brooklyn Arena Local Development Corporation New York | |||||||
| Pilot Revenue (Barclays Center Project) 6.50% 7/15/30 | 5,500,000 | 6,591,365 | |||||
| California State Economic Recovery Series A | |||||||
| 5.25% 7/1/14 | 775,000 | 844,556 | |||||
| 5.25% 7/1/21 | 2,740,000 | 3,336,334 | |||||
| Columbia County, Georgia Sales Tax 5.00% 4/1/16 | 1,265,000 | 1,465,680 | |||||
| Dallas, Texas Convention Center Hotel Development | |||||||
| Revenue Series A | |||||||
| 5.00% 1/1/24 | 3,420,000 | 3,840,044 | |||||
| 5.25% 1/1/23 | 5,375,000 | 6,145,936 | |||||
| Guam Government Limited Obligation Revenue | |||||||
| (Section 30) Series A | |||||||
| 5.375% 12/1/24 | 1,750,000 | 1,943,620 | |||||
| 5.625% 12/1/29 | 1,125,000 | 1,264,961 | |||||
| Louisiana State Citizens Property Insurance | |||||||
| Corporation Assessment Revenue | |||||||
| Series C-2 6.75% 6/1/26 (ASSURED GTY) | 6,350,000 | 7,644,448 | |||||
| Massachusetts State School Building Authority Senior | |||||||
| Series B 5.00% 10/15/27 | 4,705,000 | 5,717,657 | |||||
| @ | Modesto, California Special Tax Community Facilities | ||||||
| District #04-1 (Village 2) 5.15% 9/1/36 | 1,500,000 | 1,501,605 | |||||
41
Statements of net assets
Delaware Tax Free USA Intermediate Fund
| Principal amount | Value | ||||||
| Municipal Bonds (continued) | |||||||
| Special Tax Revenue Bonds (continued) | |||||||
| New Jersey State Economic Development Authority Revenue | |||||||
| 5.00% 6/15/20 | $ | 210,000 | $ | 243,012 | |||
| 5.00% 6/15/21 | 5,425,000 | 6,287,521 | |||||
| 5.00% 6/15/22 | 1,750,000 | 2,032,660 | |||||
| 5.00% 6/15/23 | 1,250,000 | 1,437,975 | |||||
| 5.00% 6/15/26 | 4,100,000 | 4,601,102 | |||||
| New Jersey State Transportation Trust Fund Authority | |||||||
| Series B 5.50% 6/15/31 | 10,910,000 | 12,989,009 | |||||
| New York City, New York Transitional Finance Authority | |||||||
| Future Tax Secured Subseries A-1 5.00% 11/1/20 | 2,860,000 | 3,587,412 | |||||
| New York State Local Government Assistance Corporation | |||||||
| Refunding Subordinate Lien Series A | |||||||
| 5.00% 4/1/17 | 8,615,000 | 10,293,718 | |||||
| 5.00% 4/1/20 | 3,360,000 | 4,208,131 | |||||
| New York State Urban Development Corporation | |||||||
| (Service Contract) Series A-1 5.00% 1/1/18 | 5,785,000 | 6,935,521 | |||||
| Puerto Rico Sales Tax Financing Corporation Sales Tax Revenue | |||||||
| Series A 6.125% 8/1/29 | 2,430,000 | 2,589,821 | |||||
| Series C 5.00% 8/1/22 | 2,090,000 | 2,537,469 | |||||
| Series C 6.50% 8/1/35 | 6,500,000 | 7,850,440 | |||||
| Richmond Heights, Missouri Tax Increment & Transaction | |||||||
| Sales Tax Revenue Refunding & Improvement (Francis | |||||||
| Place Redevelopment Project) 5.625% 11/1/25 | 1,000,000 | 1,000,310 | |||||
| @ | St. Joseph, Missouri Industrial Development Authority Tax | ||||||
| Increment Revenue (Shoppes at North Village Project) | |||||||
| Series A 5.10% 11/1/19 | 250,000 | 251,428 | |||||
| Series B 5.375% 11/1/23 | 1,000,000 | 1,005,910 | |||||
| Virgin Islands Public Finance Authority Revenue (Senior | |||||||
| Lien Matching Fund Loan) Series A 5.25% 10/1/22 | 1,785,000 | 1,885,692 | |||||
| Washington State Motor Vehicle Fuel Tax Series B | |||||||
| 5.00% 7/1/16 | 4,250,000 | 4,967,273 | |||||
| Wyandotte County, Kansas City, Kansas Unified | |||||||
| Government Special Obligation Revenue | |||||||
| ^(Capital Appreciation - Sales Tax Subordinate Lien) | |||||||
| 6.70% 6/1/21 | 4,970,000 | 3,372,543 | |||||
| (Sales Tax-2nd Lien-Area B) 5.00% 12/1/20 | 555,000 | 588,572 | |||||
| Wyoming State Loan & Investment Board Facilities | |||||||
| Revenue 5.00% 10/1/24 | 1,550,000 | 1,684,060 | |||||
| 121,656,605 | |||||||
42
| Principal amount | Value | ||||||
| Municipal Bonds (continued) | |||||||
| State General Obligation Bonds – 16.78% | |||||||
| California State 5.25% 11/1/17 | $ | 215,000 | $ | 226,872 | |||
| California State Refunding | |||||||
| 5.00% 2/1/20 | 4,250,000 | 5,146,878 | |||||
| 5.00% 2/1/31 | 1,390,000 | 1,576,886 | |||||
| California State Various Purpose | |||||||
| 5.00% 10/1/18 | 5,000,000 | 6,041,900 | |||||
| 5.25% 9/1/28 | 7,750,000 | 9,073,080 | |||||
| Connecticut State Economic Recovery Series A 5.00% 1/1/16 | 7,700,000 | 8,817,732 | |||||
| Connecticut State Series C 5.00% 11/1/24 | 2,000,000 | 2,393,200 | |||||
| Georgia State | |||||||
| Series A 5.00% 7/1/22 | 7,380,000 | 9,572,745 | |||||
| Series B 5.00% 7/1/17 | 4,810,000 | 5,806,488 | |||||
| Illinois State Refunding Series B 5.00% 1/1/13 | 2,000,000 | 2,030,780 | |||||
| Maryland State & Local Facilities | |||||||
| Loan Capital Improvement | |||||||
| First Series 5.00% 3/15/19 | 3,675,000 | 4,399,600 | |||||
| Second Series 5.00% 8/1/17 | 1,500,000 | 1,755,675 | |||||
| Series B 5.00% 3/1/18 | 1,930,000 | 2,362,281 | |||||
| Massachusetts State Consolidated Loan Series C | |||||||
| 5.50% 11/1/15 | 4,090,000 | 4,736,997 | |||||
| Minnesota State 5.00% 6/1/14 | 145,000 | 156,934 | |||||
| Minnesota State Various Purpose Series A | |||||||
| 5.00% 8/1/19 | 7,020,000 | 8,797,604 | |||||
| 5.00% 8/1/20 | 3,495,000 | 4,433,827 | |||||
| Mississippi State Series A 5.00% 10/1/17 | 4,860,000 | 5,869,373 | |||||
| New Jersey Economic Development Authority Revenue | |||||||
| 5.00% 6/15/28 | 2,050,000 | 2,287,595 | |||||
| 5.00% 6/15/29 | 1,200,000 | 1,330,716 | |||||
| New York State Series A 5.00% 2/15/28 | 5,000,000 | 6,017,050 | |||||
| North Carolina State Public Improvement Series A | |||||||
| 5.00% 3/1/15 | 1,200,000 | 1,339,020 | |||||
| North Carolina State Refunding | |||||||
| Series A 5.00% 3/1/16 | 3,000,000 | 3,473,700 | |||||
| Series A 5.00% 3/1/17 | 3,000,000 | 3,585,780 | |||||
| Series B 5.00% 4/1/15 | 4,000,000 | 4,478,440 | |||||
| Ohio State Series D 5.00% 9/15/14 | 3,500,000 | 3,829,140 | |||||
| Oregon State Series L 5.00% 5/1/26 | 8,000,000 | 9,802,319 | |||||
| Pennsylvania State Second Series 5.00% 7/1/20 | 2,300,000 | 2,877,369 | |||||
43
Statements of net assets
Delaware Tax Free USA Intermediate Fund
| Principal amount | Value | ||||||
| Municipal Bonds (continued) | |||||||
| State General Obligation Bonds (continued) | |||||||
| Puerto Rico Commonwealth Government Development | |||||||
| Bank 4.75% 12/1/15 (NATL-RE) | $ | 4,765,000 | $ | 4,856,202 | |||
| Puerto Rico Commonwealth Public Improvement Series A | |||||||
| 5.00% 7/1/16 (ASSURED GTY) | 2,110,000 | 2,357,714 | |||||
| 5.25% 7/1/23 | 1,125,000 | 1,180,373 | |||||
| 5.50% 7/1/39 | 5,000,000 | 5,209,700 | |||||
| Virginia State | |||||||
| Series B 5.00% 6/1/23 | 2,000,000 | 2,381,160 | |||||
| Series D 5.00% 6/1/19 | 5,715,000 | 7,147,122 | |||||
| Washington State Various Purpose Series A 5.00% 7/1/16 | 1,000,000 | 1,168,770 | |||||
| 146,521,022 | |||||||
| Transportation Revenue Bonds – 14.75% | |||||||
| Broward County, Florida Airport System Revenue Series O | |||||||
| 5.375% 10/1/29 | 2,000,000 | 2,301,720 | |||||
| Charlotte, North Carolina Airport Revenue | |||||||
| (Charlotte Douglas) Series A 5.00% 7/1/15 | 750,000 | 838,740 | |||||
| Chicago, Illinois O’Hare International Airport Revenue | |||||||
| General-Airport-Third Lien | |||||||
| Series A 5.00% 1/1/25 (AGM) | 3,725,000 | 4,123,389 | |||||
| Series A-2 5.75% 1/1/20 (AGM) (AMT) | 1,000,000 | 1,048,860 | |||||
| Series C 5.25% 1/1/28 | 2,150,000 | 2,451,796 | |||||
| Cleveland, Ohio Airport System Revenue Series A | |||||||
| 5.00% 1/1/28 | 1,750,000 | 1,964,060 | |||||
| Dallas-Fort Worth, Texas International Airport | |||||||
| Revenue Series A | |||||||
| 5.00% 11/1/22 | 680,000 | 772,874 | |||||
| 5.00% 11/1/23 | 750,000 | 852,435 | |||||
| 5.00% 11/1/24 | 400,000 | 454,632 | |||||
| Delaware Transportation Authority Series A 5.00% 7/1/17 | 5,475,000 | 6,578,870 | |||||
| Harris County, Texas Metropolitan Transit Authority Sales & | |||||||
| Use Tax Revenue Series A 5.00% 11/1/31 | 3,250,000 | 3,831,620 | |||||
| Houston, Texas Airports Commission Revenue Series B | |||||||
| 5.00% 7/1/25 | 1,000,000 | 1,176,640 | |||||
| 5.00% 7/1/26 | 3,000,000 | 3,510,660 | |||||
| Idaho Housing & Finance Association Grant Revenue | |||||||
| (Antic Federal Highway Transportation) Series A | |||||||
| 5.25% 7/15/21 (ASSURED GTY) | 2,760,000 | 3,263,810 | |||||
| Maryland State Economic Development Revenue | |||||||
| (Transportation Facilities Project) Series A 5.375% 6/1/25 | 2,535,000 | 2,726,494 | |||||
44
| Principal amount | Value | ||||||
| Municipal Bonds (continued) | |||||||
| Transportation Revenue Bonds (continued) | |||||||
| Memphis-Shelby County, Tennessee Airport Authority | |||||||
| Revenue Series D 5.00% 7/1/24 | $ | 4,110,000 | $ | 4,804,343 | |||
| Metropolitan, New York Transportation Authority Revenue | |||||||
| Series 2008C 6.50% 11/15/28 | 2,860,000 | 3,670,038 | |||||
| Series A 5.00% 11/15/18 | 2,500,000 | 3,008,850 | |||||
| Series C 5.00% 11/15/32 | 4,500,000 | 5,198,175 | |||||
| Metropolitan, Washington D.C. Airport Authority Systems | |||||||
| Revenue Series A 5.50% 10/1/19 (FGIC) (NATL-RE) (AMT) | 1,000,000 | 1,036,180 | |||||
| Minneapolis - St. Paul, Minnesota Metropolitan Airports | |||||||
| Commission Series A 5.00% 1/1/22 (AMBAC) | 5,000,000 | 5,625,050 | |||||
| Missouri State Highways & Transportation Commission | |||||||
| State Road Revenue Second Lien 5.25% 5/1/23 | 1,940,000 | 2,297,736 | |||||
| North Texas Tollway Authority Revenue (First Tier) | |||||||
| Series A 6.00% 1/1/20 | 3,925,000 | 4,705,447 | |||||
| •Series E-3 5.75% 1/1/38 | 3,750,000 | 4,319,775 | |||||
| (Special Projects System) Series A 5.00% 9/1/17 | 1,000,000 | 1,192,720 | |||||
| Pennsylvania State Turnpike Commission Revenue Series A | |||||||
| 5.25% 12/1/20 (AMBAC) | 1,230,000 | 1,341,733 | |||||
| Phoenix, Arizona Civic Improvement Revenue (Junior Lien) | |||||||
| Series A 5.00% 7/1/26 | 7,500,000 | 8,653,050 | |||||
| Port Authority of New York & New Jersey Special Project | |||||||
| (JFK International Air Terminal) 6.50% 12/1/28 | 8,300,000 | 9,098,210 | |||||
| Sacramento County, California Airport System Revenue | |||||||
| 5.00% 7/1/24 | 1,425,000 | 1,663,175 | |||||
| (PFC/Grant) Series D 5.50% 7/1/28 | 2,020,000 | 2,291,205 | |||||
| San Francisco, California City & County Airports Commission | |||||||
| Series B 5.00% 5/1/15 | 4,000,000 | 4,473,040 | |||||
| Series D 5.00% 5/1/25 | 2,000,000 | 2,374,000 | |||||
| St. Louis, Missouri Airport Revenue (Lambert-St. Louis | |||||||
| International) Series A-1 6.125% 7/1/24 | 3,780,000 | 4,426,531 | |||||
| Texas Private Activity Bond Surface Transportation | |||||||
| Corporate Senior Lien Revenue | |||||||
| (LBJ Infrastructure) 7.50% 6/30/33 | 3,625,000 | 4,610,710 | |||||
| (Mobility Partners) 7.50% 12/31/31 | 3,765,000 | 4,720,293 | |||||
| Texas State Transportation Commission Highway Fund | |||||||
| Revenue (First Tier) 5.00% 4/1/18 | 1,700,000 | 2,000,458 | |||||
45
Statements of net assets
Delaware Tax Free USA Intermediate Fund
| Principal amount | Value | ||||||
| Municipal Bonds (continued) | |||||||
| Transportation Revenue Bonds (continued) | |||||||
| Triborough, New York Bridge & Tunnel Authority Revenue | |||||||
| Series A 5.00% 11/15/17 | $ | 1,720,000 | $ | 2,074,905 | |||
| Series A 5.00% 1/1/23 | 4,000,000 | 4,984,160 | |||||
| •Series B-3 5.00% 11/15/38 | 1,800,000 | 2,043,864 | |||||
| Virginia Commonwealth Transportation Board | |||||||
| (Capital Projects) Series A-1 5.00% 5/15/16 | 2,000,000 | 2,322,400 | |||||
| 128,832,648 | |||||||
| Water & Sewer Revenue Bonds – 5.33% | |||||||
| Arizona Water Infrastructure Finance Authority Revenue | |||||||
| (Water Quality) Series A | |||||||
| 5.00% 10/1/20 | 1,500,000 | 1,893,285 | |||||
| 5.00% 10/1/21 | 2,430,000 | 2,901,639 | |||||
| Atlanta, Georgia Water & Wastewater Revenue | |||||||
| Series A 6.00% 11/1/25 | 2,925,000 | 3,649,786 | |||||
| Series B 5.50% 11/1/23 (AGM) | 3,000,000 | 3,545,400 | |||||
| King County, Washington Sewer Revenue Refunding | |||||||
| Series B 5.00% 1/1/14 (NATL-RE) | 3,500,000 | 3,718,470 | |||||
| Massachusetts State Water Pollution Abatement Trust | |||||||
| 5.00% 8/1/16 | 2,170,000 | 2,544,108 | |||||
| New York City, New York Municipal Water Finance | |||||||
| Authority Water & Sewer System | |||||||
| Series B 5.00% 6/15/21 (AMBAC) | 1,180,000 | 1,301,800 | |||||
| New York State Environmental Facilities Corporation | |||||||
| Revenue (State Clean Water & Drinking Water | |||||||
| Revolving Foundation) | |||||||
| Series A 5.00% 6/15/22 | 1,405,000 | 1,673,299 | |||||
| Series D 5.00% 9/15/23 | 3,360,000 | 3,975,082 | |||||
| Series K 5.50% 6/15/15 | 3,500,000 | 4,004,945 | |||||
| Portland, Oregon Sewer System Revenue (First Lien) | |||||||
| Series A 5.00% 6/15/18 | 4,000,000 | 4,885,600 | |||||
| San Francisco, California City & County Public | |||||||
| Utilities Commission | |||||||
| Series A 5.00% 11/1/27 | 7,430,000 | 8,907,380 | |||||
| Series D 5.00% 11/1/16 | 3,000,000 | 3,542,070 | |||||
| 46,542,864 | |||||||
| Total Municipal Bonds (cost $795,409,262) | 864,897,239 | ||||||
46
| Principal amount | Value | |||||||
| Short-Term Investments – 0.34% | ||||||||
| ¤Variable Rate Demand Notes – 0.34% | ||||||||
| California State Infrastructure & Economic Development | ||||||||
| Bank Revenue (Los Angeles Museum) Series A | ||||||||
| 0.15% 9/1/37 (LOC – Wells Fargo Bank) | $ | 495,000 | $ | 495,000 | ||||
| Montgomery County, Pennsylvania Series A | ||||||||
| 0.18% 8/15/24 (SPA – PNC Bank) | 2,500,000 | 2,500,000 | ||||||
| Total Short-Term Investments (cost $2,995,000) | 2,995,000 | |||||||
| Total Value of Securities – 99.36% | ||||||||
| (cost $798,404,262) | 867,892,239 | |||||||
| Receivables and Other Assets | ||||||||
| Net of Liabilities – 0.64% | 5,633,072 | |||||||
| Net Assets Applicable to 70,148,586 | ||||||||
| Shares Outstanding – 100.00% | $ | 873,525,311 | ||||||
| Net Asset Value – Delaware Tax-Free USA Intermediate Fund | ||||||||
| Class A ($464,539,829 / 37,440,595 Shares) | $ 12.41 | |||||||
| Net Asset Value – Delaware Tax-Free USA Intermediate Fund | ||||||||
| Class B ($65,316 / 5,270 Shares) | $ 12.39 | |||||||
| Net Asset Value – Delaware Tax-Free USA Intermediate Fund | ||||||||
| Class C ($75,886,724 / 6,119,523 Shares) | $ 12.40 | |||||||
| Net Asset Value – Delaware Tax-Free USA Intermediate Fund | ||||||||
| Institutional Class ($333,033,442 / 26,583,198 Shares) | $ 12.53 | |||||||
| Components of Net Assets at August 31, 2012: | ||||||||
| Shares of beneficial interest (unlimited authorization – no par) | $ | 811,637,025 | ||||||
| Undistributed net investment income | 16,235 | |||||||
| Accumulated net realized loss on investments | (7,615,926 | ) | ||||||
| Net unrealized appreciation of investments | 69,487,977 | |||||||
| Total net assets | $ | 873,525,311 | ||||||
47
Statements of net assets
Delaware Tax Free USA Intermediate Fund
| • | Variable rate security. The rate shown is the rate as of August 31, 2012. Interest rates reset periodically. |
| § | Pre-Refunded bonds. Municipal bonds that are generally backed or secured by U.S. Treasury bonds. For pre-refunded bonds, the stated maturity is followed by the year in which the bond is pre-refunded. See Note 8 in “Notes to financial statements.” |
| @ | Illiquid security. At August 31, 2012, the aggregate value of illiquid securities was $2,758,943, which represented 0.32% of the Fund’s net assets. See Note 8 in “Notes to financial statements.” |
| ^ | Zero coupon security. The rate shown is the yield at the time of purchase. |
| ¤ | Tax-exempt obligations that contain a floating or variable interest rate adjustment formula and an unconditional right of demand to receive payment of the unpaid principal balance plus accrued interest upon a short notice period (generally up to 30 days) prior to specified dates either from the issuer or by drawing on a bank letter of credit, a guarantee or insurance issued with respect to such instrument. The rate shown is the rate as of August 31, 2012. |
Summary of abbreviations:
AGM — Insured by Assured Guaranty Municipal Corporation
AMBAC — Insured by AMBAC Assurance Corporation
AMT — Subject to Alternative Minimum Tax
ASSURED GTY — Insured by Assured Guaranty Corporation
CDFI — Community Development Financial Institutions
FGIC — Insured by Financial Guaranty Insurance Company
LOC — Letter of Credit
NATL-RE — Insured by National Public Finance Guarantee Corporation
PSF — Guaranteed by Permanent School Fund
RADIAN — Insured by Radian Asset Assurance
SPA — Stand-by Purchase Agreement
| Net Asset Value and Offering Price Per Share – | ||
| Delaware Tax-Free USA Intermediate Fund | ||
| Net asset value Class A (A) | $ | 12.41 |
| Sales charge (2.75% of offering price) (B) | 0.35 | |
| Offering price | $ | 12.76 |
| (A) | Net asset value per share, as illustrated, is the amount which would be paid upon redemption or repurchase of shares. |
| (B) | See the current prospectus for purchases of $100,000 or more. |
See accompanying notes, which are an integral part of the financial statements.
48
| Delaware National High-Yield Municipal Bond Fund | August 31, 2012 |
| Principal amount | Value | ||||||
| Municipal Bonds – 97.06% | |||||||
| Corporate Revenue Bonds – 21.62% | |||||||
| Allegheny County, Pennsylvania Industrial Development | |||||||
| Authority Revenue (Environmental Improvement - | |||||||
| U.S. Steel Corp. Project) | |||||||
| 5.75% 8/1/42 (AMT) | $ | 2,000,000 | $ | 1,983,240 | |||
| 6.875% 5/1/30 | 300,000 | 327,915 | |||||
| Buckeye, Ohio Tobacco Settlement Financing Authority | |||||||
| Asset-Backed Series A-2 | |||||||
| 5.875% 6/1/47 | 3,500,000 | 2,842,560 | |||||
| 6.50% 6/1/47 | 8,405,000 | 7,481,375 | |||||
| Butler County, Pennsylvania Industrial Development | |||||||
| Authority Refunding Revenue (AK Steel Holding) | |||||||
| Series A 6.25% 6/1/20 (AMT) | 1,275,000 | 1,315,086 | |||||
| California State Enterprise Development Authority Revenue | |||||||
| (Sunpower Corp. - Recovery Zone Facility) 8.50% 4/1/31 | 1,000,000 | 1,159,900 | |||||
| Capital Trust Agency, Florida Revenue (Million Air One) | |||||||
| 7.75% 1/1/41 (AMT) | 1,700,000 | 1,898,560 | |||||
| Cass County, Texas Industrial Development Corporation | |||||||
| Environmental Improvement Revenue (International | |||||||
| Paper Co. Project) Series A 6.00% 9/1/25 (AMT) | 1,000,000 | 1,003,400 | |||||
| Cloquet, Minnesota Pollution Control Revenue (Potlatch | |||||||
| Corp. Project) 5.90% 10/1/26 | 1,605,000 | 1,609,462 | |||||
| Columbus County, North Carolina Industrial Facilities & | |||||||
| Pollution Control Financing (International Paper Co. | |||||||
| Project) Series A 5.70% 5/1/34 | 1,000,000 | 1,110,540 | |||||
| De Soto Parish, Louisiana Environmental Improvement | |||||||
| Revenue (International Paper Co. Project) | |||||||
| Series A 6.35% 2/1/25 (AMT) | 1,650,000 | 1,664,322 | |||||
| Delaware State Economic Development Authority Revenue | |||||||
| Exempt Facilities (Indian River Power) 5.375% 10/1/45 | 1,600,000 | 1,747,152 | |||||
| Golden State, California Tobacco Securitization Corporate | |||||||
| Settlement Revenue Refunding | |||||||
| 5.00% 6/1/45 (AMBAC) | 1,000,000 | 1,020,900 | |||||
| Asset-Backed Senior Notes Series A-1 5.75% 6/1/47 | 10,510,000 | 8,950,630 | |||||
| Houston, Texas Airport System Revenue | |||||||
| (Continental Airlines) Series A 6.625% 7/15/38 (AMT) | 2,000,000 | 2,233,480 | |||||
| Illinois Railsplitter Tobacco Settlement Authority | |||||||
| 6.00% 6/1/28 | 1,455,000 | 1,708,461 | |||||
| Indiana State Finance Authority Environmental Revenue | |||||||
| (U.S. Steel Corp. Project) 6.00% 12/1/26 | 935,000 | 975,401 | |||||
49
Statements of net assets
Delaware National High-Yield Municipal Bond Fund
| Principal amount | Value | ||||||
| Municipal Bonds (continued) | |||||||
| Corporate Revenue Bonds (continued) | |||||||
| Iowa State Finance Authority Midwestern Disaster Area | |||||||
| Revenue (Alcoa Inc. Project) 4.75% 8/1/42 | $ | 3,000,000 | $ | 3,017,820 | |||
| Louisiana Local Government Environmental Facilities & | |||||||
| Community Development Authority Revenue | |||||||
| (Westlake Chemical Corp.) Series A-1 6.50% 11/1/35 | 3,000,000 | 3,495,210 | |||||
| Love Field Airport Modernization Corporation, Texas Special | |||||||
| Facilities Revenue (Southwest Airlines Co. Project) | |||||||
| 5.25% 11/1/40 | 2,000,000 | 2,156,700 | |||||
| Maryland Economic Development Corporation Facilities | |||||||
| Revenue (CNX Marine Terminals Inc.) 5.75% 9/1/25 | 1,530,000 | 1,661,580 | |||||
| Michigan Tobacco Settlement Financing Authority Revenue | |||||||
| Asset-Backed Series A 6.00% 6/1/48 | 555,000 | 461,544 | |||||
| Mississippi Business Finance Corporation Pollution Control | |||||||
| Revenue (System Energy Resources, Inc. Project) | |||||||
| 5.90% 5/1/22 | 1,900,000 | 1,905,472 | |||||
| M-S-R Energy Authority, California Gas Revenue | |||||||
| Series B 6.125% 11/1/29 | 1,500,000 | 1,785,495 | |||||
| Series C 6.50% 11/1/39 | 2,185,000 | 2,808,031 | |||||
| New Jersey Economic Development Authority Special Facility | |||||||
| Revenue (Continental Airlines Inc. Project) | |||||||
| 5.25% 9/15/29 (AMT) | 4,000,000 | 4,086,280 | |||||
| 5.75% 9/15/27 (AMT) | 2,000,000 | 2,006,000 | |||||
| New York City, New York Industrial Development Agency | |||||||
| Special Facilities Revenue | |||||||
| (American Airlines - JFK International Airport) | |||||||
| 7.50% 8/1/16 (AMT) | 200,000 | 210,320 | |||||
| •7.75% 8/1/31 (AMT) | 1,000,000 | 1,051,660 | |||||
| (JetBlue Airways Corp. Project) 5.125% 5/15/30 (AMT) | 1,000,000 | 971,040 | |||||
| New York Liberty Development Corporation Revenue | |||||||
| (Goldman Sachs Headquarters) 5.25% 10/1/35 | 2,000,000 | 2,332,840 | |||||
| (Second Priority - Bank of America Tower) | |||||||
| Class 2 5.625% 7/15/47 | 1,000,000 | 1,122,830 | |||||
| Class 3 6.375% 7/15/49 | 2,500,000 | 2,873,125 | |||||
| Ohio County, Kentucky Pollution Control Revenue | |||||||
| (Big Rivers Electric Corp. Project) | |||||||
| Series A 6.00% 7/15/31 | 1,250,000 | 1,443,350 | |||||
| Ohio State Air Quality Development Authority Revenue | |||||||
| (AK Steel Holding) 6.75% 6/1/24 (AMT) | 1,000,000 | 1,035,830 | |||||
50
| Principal amount | Value | ||||||
| Municipal Bonds (continued) | |||||||
| Corporate Revenue Bonds (continued) | |||||||
| Pennsylvania Economic Development Financing Authority | |||||||
| Exempt Facilities Revenue (Allegheny Energy Supply Co.) | |||||||
| 7.00% 7/15/39 | $ | 1,175,000 | $ | 1,406,992 | |||
| Phenix City, Alabama Industrial Development Board | |||||||
| Environmental Improvement Revenue (Mead Westvaco | |||||||
| Corp. Project) Series A 6.35% 5/15/35 (AMT) | 500,000 | 504,750 | |||||
| Rockport, Indiana Revenue (AK Steel Holding) | |||||||
| 7.00% 6/1/28 (AMT) | 1,210,000 | 1,265,890 | |||||
| • | St. Charles Parish, Louisiana Revenue | ||||||
| (Valero Energy Corp. Project) 4.00% 12/1/40 | 1,635,000 | 1,760,078 | |||||
| St. John Baptist Parish, Louisiana Revenue | |||||||
| (Marathon Oil Corp.) Series A 5.125% 6/1/37 | 1,900,000 | 2,015,729 | |||||
| Sweetwater County, Wyoming Solid Waste Disposal | |||||||
| Revenue (FMC Corp. Project) 5.60% 12/1/35 (AMT) | 1,000,000 | 1,063,610 | |||||
| Tobacco Securitization Authority, Minnesota Tobacco | |||||||
| Settlement Revenue Series B 5.25% 3/1/31 | 4,000,000 | 4,521,920 | |||||
| Tobacco Settlement Financing Corporation, New Jersey | |||||||
| Series 1A 5.00% 6/1/41 | 5,500,000 | 4,586,945 | |||||
| Toledo, Lucas County, Ohio Port Authority Development | |||||||
| Revenue (Toledo Express Airport Project) | |||||||
| Series C 6.375% 11/15/32 (AMT) | 1,000,000 | 1,018,810 | |||||
| TSASC, New York Revenue (Asset-Backed) | |||||||
| Series 1 5.125% 6/1/42 | 340,000 | 250,498 | |||||
| 91,852,733 | |||||||
| Education Revenue Bonds – 17.61% | |||||||
| Allegheny County, Pennsylvania Higher Education Building | |||||||
| Authority Revenue (Carnegie Mellon University) | |||||||
| Series A 5.00% 3/1/24 | 1,000,000 | 1,233,850 | |||||
| Arlington, Texas Higher Education Finance | |||||||
| (Arlington Classic Academy) 7.65% 8/15/40 | 1,000,000 | 1,121,600 | |||||
| Bowling Green, Ohio Student Housing Revenue CFP I | |||||||
| (State University Project) 6.00% 6/1/45 | 1,250,000 | 1,344,338 | |||||
| California Municipal Finance Authority Revenue | |||||||
| (Azusa Pacific University Project) Series B 7.75% 4/1/31 | 1,000,000 | 1,177,340 | |||||
| (Santa Rosa Academy Project) Series A 6.00% 7/1/42 | 1,250,000 | 1,266,550 | |||||
| (Southwestern Law School) 6.50% 11/1/41 | 1,500,000 | 1,758,525 | |||||
51
Statements of net assets
Delaware National High-Yield Municipal Bond Fund
| Principal amount | Value | ||||||
| Municipal Bonds (continued) | |||||||
| Education Revenue Bonds (continued) | |||||||
| California Statewide Communities Development Authority | |||||||
| Charter School Revenue (Green Dot Public Schools) | |||||||
| Series A 7.25% 8/1/41 | $ | 915,000 | $ | 1,009,977 | |||
| California Statewide Communities Development Authority | |||||||
| Revenue (California Baptist University Project) | |||||||
| 7.50% 11/1/41 | 1,000,000 | 1,207,330 | |||||
| Series A 5.50% 11/1/38 | 1,000,000 | 1,039,500 | |||||
| California Statewide Communities Development Authority | |||||||
| School Facility Revenue (Aspire Public Schools Project) | |||||||
| 6.00% 7/1/40 | 1,000,000 | 1,030,660 | |||||
| Chattanooga, Tennessee Health Educational & Housing | |||||||
| Facilities Board Revenue (CDFI Phase I, LLC Project) | |||||||
| Series A 5.125% 10/1/35 | 1,000,000 | 1,014,610 | |||||
| Subordinate Series B 6.00% 10/1/35 | 1,500,000 | 1,547,475 | |||||
| Clifton, Texas Higher Education Finance | |||||||
| Corporation Revenue | |||||||
| (Idea Public Schools) 5.75% 8/15/41 | 1,000,000 | 1,099,010 | |||||
| (Uplift Education) Series A 6.25% 12/1/45 | 1,000,000 | 1,169,730 | |||||
| Delaware County, Pennsylvania Industrial Development | |||||||
| Authority Revenue Charter School Revenue | |||||||
| (Chester Community Charter School) | |||||||
| Series A 6.125% 8/15/40 | 805,000 | 714,566 | |||||
| Gainesville, Georgia Redevelopment Authority Educational | |||||||
| Facilities Revenue (Riverside Military Academy Project) | |||||||
| 5.125% 3/1/37 | 2,000,000 | 1,829,460 | |||||
| Idaho Housing & Financing Association Nonprofit Facilities | |||||||
| Revenue (North Star Charter School Project) | |||||||
| Series A 9.50% 7/1/39 | 1,000,000 | 1,111,440 | |||||
| Illinois Finance Authority Charter School Revenue | |||||||
| (Uno Charter School) Series A 7.125% 10/1/41 | 1,000,000 | 1,126,560 | |||||
| Illinois Finance Authority Revenue (Lake Forest College) | |||||||
| Series A 6.00% 10/1/48 | 1,000,000 | 1,035,900 | |||||
| Illinois Finance Authority Student Housing Revenue | |||||||
| (Dekalb II - Northern Illinois University Project) | |||||||
| 6.875% 10/1/43 | 1,000,000 | 1,183,630 | |||||
| Indiana State Finance Authority Revenue Educational | |||||||
| Facilities (Drexel Foundation - Thea Bowman Academy | |||||||
| Charter School) Series A 7.00% 10/1/39 | 1,000,000 | 1,093,700 | |||||
52
| Principal amount | Value | ||||||
| Municipal Bonds (continued) | |||||||
| Education Revenue Bonds (continued) | |||||||
| Iowa Higher Education Loan Authority Revenue | |||||||
| (Private College Facilities) | |||||||
| 5.00% 10/1/38 | $ | 2,000,000 | $ | 2,057,280 | |||
| 6.00% 9/1/39 | 2,145,000 | 2,377,860 | |||||
| Louisiana Public Facilities Authority Revenue | |||||||
| (Lake Charles Charter Academy Foundation) | |||||||
| 8.00% 12/15/41 | 1,500,000 | 1,591,485 | |||||
| Marietta, Georgia Development Authority Revenue | |||||||
| (Life University Income Project) 7.00% 6/15/39 | 1,345,000 | 1,409,802 | |||||
| Maryland State Economic Development Corporation | |||||||
| Student Housing Revenue (University of Maryland | |||||||
| College Park Projects) 5.75% 6/1/33 | 1,130,000 | 1,239,418 | |||||
| Maryland State Health & Higher Educational | |||||||
| Facilities Authority Revenue | |||||||
| (Patterson Park Public Charter School) | |||||||
| Series A 6.125% 7/1/45 | 1,000,000 | 1,057,840 | |||||
| @(Washington Christian Academy Project) | |||||||
| Series A 5.50% 7/1/38 | 1,170,000 | 467,977 | |||||
| Massachusetts Health & Educational Facilities Authority | |||||||
| Revenue (Springfield College) 5.625% 10/15/40 | 1,000,000 | 1,082,090 | |||||
| Massachusetts State Development Finance Agency | |||||||
| Revenue (Harvard University) Series B-1 5.00% 10/15/20 | 1,510,000 | 1,924,223 | |||||
| Michigan Finance Authority Limited Obligation Revenue | |||||||
| (Public School Academy) | |||||||
| (Old Redford) Series A 6.50% 12/1/40 | 900,000 | 934,767 | |||||
| (University Learning) 7.50% 11/1/40 | 1,000,000 | 1,153,010 | |||||
| (Voyageur) 8.00% 7/15/41 | 1,250,000 | 1,314,575 | |||||
| Michigan Public Educational Facilities Authority Revenue | |||||||
| (Limited-Obligation-Landmark Academy) 7.00% 12/1/39 | 950,000 | 1,022,077 | |||||
| Minnesota Higher Education Facilities Authority Revenue | |||||||
| (Bethel University) Series 6-R 5.50% 5/1/37 | 1,000,000 | 1,045,030 | |||||
| New Castle County, Delaware Revenue | |||||||
| (Newark Charter School Inc. Project) 5.00% 9/1/36 | 500,000 | 495,860 | |||||
| New Jersey Economic Development Authority Revenue | |||||||
| (Provident Group - Montclair) 5.875% 6/1/42 | 1,500,000 | 1,664,625 | |||||
53
Statements of net assets
Delaware National High-Yield Municipal Bond Fund
| Principal amount | Value | ||||||||
| Municipal Bonds (continued) | |||||||||
| Education Revenue Bonds (continued) | |||||||||
| New Jersey State Educational Facilities Authority Revenue | |||||||||
| (Rider University) Series A 5.00% 7/1/37 | $ | 800,000 | $ | 869,232 | |||||
| (University of Medicine & Dentistry) Series B | |||||||||
| 7.50% 12/1/32 | 1,000,000 | 1,255,310 | |||||||
| New Jersey State Higher Education Student Assistance | |||||||||
| Authority Student Loan Revenue Series 1B | |||||||||
| 5.75% 12/1/39 (AMT) | 1,250,000 | 1,288,050 | |||||||
| North Carolina Capital Facilities Finance Agency | |||||||||
| (High Point University) 5.00% 5/1/32 | 1,500,000 | 1,608,300 | |||||||
| North Texas Education Finance Revenue (Uplift Education) | |||||||||
| Series A 5.25% 12/1/47 | 2,100,000 | 2,229,864 | |||||||
| Oregon State Facilities Authority Revenue | |||||||||
| (College Housing Northwest Project) Series A | |||||||||
| 5.45% 10/1/32 | 1,000,000 | 1,003,280 | |||||||
| #(Concordia University Project) Series A 144A | |||||||||
| 6.125% 9/1/30 | 1,000,000 | 1,085,780 | |||||||
| 6.375% 9/1/40 | 500,000 | 547,635 | |||||||
| Pennsylvania State Higher Educational Facilities | |||||||||
| Authority Revenue | |||||||||
| (Edinboro University Foundation) 5.80% 7/1/30 | 1,300,000 | 1,454,102 | |||||||
| (Edinboro University Student Housing) 6.00% 7/1/42 | 1,000,000 | 1,098,710 | |||||||
| •(Foundation Indiana University) Series A | |||||||||
| 0.959% 7/1/39 (SGI) | 2,400,000 | 1,495,776 | |||||||
| Philadelphia, Pennsylvania Authority for Industrial | |||||||||
| Development Revenue | |||||||||
| (Discovery Charter School Project) | |||||||||
| 5.875% 4/1/32 | 450,000 | 486,072 | |||||||
| 6.25% 4/1/37 | 500,000 | 549,900 | |||||||
| (First Philadelphia Charter Project) Series A | |||||||||
| 5.75% 8/15/32 | 745,000 | 755,214 | |||||||
| (Global Leadership Academy Project) 6.375% 11/15/40 | 1,000,000 | 1,079,310 | |||||||
| (New Foundation Charter School Project) | |||||||||
| 6.625% 12/15/41 | 1,000,000 | 1,090,020 | |||||||
| Philadelphia, Pennsylvania Redevelopment Authority | |||||||||
| Revenue (Beech Student Housing Complex Project) | |||||||||
| Series A 5.50% 7/1/35 (ACA) | 1,500,000 | 1,434,180 | |||||||
| Phoenix, Arizona Industrial Development Authority Revenue | |||||||||
| (Rowan University Project) 5.00% 6/1/42 | 2,000,000 | 2,157,520 | |||||||
54
| Principal amount | Value | ||||||
| Municipal Bonds (continued) | |||||||
| Education Revenue Bonds (continued) | |||||||
| Private Colleges & Universities Authority, Georgia Revenue | |||||||
| (Mercer University) Series A 5.00% 10/1/32 | $ | 1,005,000 | $ | 1,079,300 | |||
| Provo, Utah Charter School Revenue (Freedom Academy | |||||||
| Foundation Project) 5.50% 6/15/37 | 910,000 | 873,100 | |||||
| San Juan, Texas Higher Education Finance Authority | |||||||
| Education Revenue (Idea Public Schools) | |||||||
| Series A 6.70% 8/15/40 | 2,000,000 | 2,320,459 | |||||
| Utah State Charter School Finance Authority Revenue | |||||||
| (North Davis Preparatory) 6.375% 7/15/40 | 1,290,000 | 1,393,290 | |||||
| Wyoming Community Development Authority Student | |||||||
| Housing Revenue (CHF-Wyoming LLC) | |||||||
| 6.50% 7/1/43 | 1,000,000 | 1,104,470 | |||||
| Yonkers, New York Economic Development Corporation | |||||||
| Education Revenue (Charter School Educational | |||||||
| Excellence) 6.25% 10/15/40 | 595,000 | 622,287 | |||||
| 74,834,831 | |||||||
| Electric Revenue Bonds – 1.63% | |||||||
| Indiana Finance Authority Revenue (Ohio Valley Electric | |||||||
| Corp. Project) Series A 5.00% 6/1/39 | 4,000,000 | 4,169,000 | |||||
| Long Island, New York Power Authority Series A | |||||||
| 5.00% 9/1/42 | 2,000,000 | 2,228,960 | |||||
| Puerto Rico Electric Power Authority Revenue | |||||||
| Series A 5.00% 7/1/42 | 500,000 | 511,870 | |||||
| 6,909,830 | |||||||
| Healthcare Revenue Bonds – 23.62% | |||||||
| Abag, California Finance Authority for Nonprofit | |||||||
| Corporations Refunding (Episcopal Senior Communities) | |||||||
| 6.125% 7/1/41 | 1,650,000 | 1,872,503 | |||||
| Alachua County, Florida Health Facilities Authority | |||||||
| (Oak Hammock University) | |||||||
| Series A 8.00% 10/1/42 | 1,000,000 | 1,187,540 | |||||
| Series A 8.00% 10/1/46 | 1,500,000 | 1,768,560 | |||||
| Apple Valley, Minnesota Economic Development Authority | |||||||
| Health Care Revenue (Augustana Home St. Paul Project) | |||||||
| Series A 6.00% 1/1/40 | 1,000,000 | 1,030,580 | |||||
| Bexar County, Texas Health Facilities Development | |||||||
| Corporation Revenue (Army Retirement | |||||||
| Residence Project) 5.875% 7/1/30 | 1,000,000 | 1,113,940 | |||||
55
Statements of net assets
Delaware National High-Yield Municipal Bond Fund
| Principal amount | Value | ||||||
| Municipal Bonds (continued) | |||||||
| Healthcare Revenue Bonds (continued) | |||||||
| Brevard County, Florida Health Facilities Authority | |||||||
| Health Care Facilities Revenue (Health First Inc. Project) | |||||||
| 7.00% 4/1/39 | $ | 1,000,000 | $ | 1,239,680 | |||
| Butler County, Pennsylvania Hospital Authority Revenue | |||||||
| (Butler Health System Project) 7.125% 7/1/29 | 900,000 | 1,077,651 | |||||
| California Municipal Finance Authority Revenue | |||||||
| (Eisenhower Medical Center) Series A 5.75% 7/1/40 | 1,000,000 | 1,076,560 | |||||
| California Statewide Communities Development | |||||||
| Authority Revenue | |||||||
| (BE Group) 7.25% 11/15/41 | 500,000 | 570,400 | |||||
| (Kaiser Permanente) Series A 5.00% 4/1/42 | 1,625,000 | 1,775,573 | |||||
| Cleveland - Cuyahoga County, Ohio Port Authority | |||||||
| Revenue Senior Housing (St. Clarence - Geac) | |||||||
| Series A 6.25% 5/1/38 | 1,000,000 | 1,001,140 | |||||
| Colorado Health Facilities Authority Revenue | |||||||
| (Christian Living Community Project) | |||||||
| Series A 5.75% 1/1/37 | 1,990,000 | 2,051,252 | |||||
| Cumberland County, Pennsylvania Municipal Authority | |||||||
| Revenue (Diakon Lutheran Ministries Project) | |||||||
| 5.00% 1/1/36 | 1,000,000 | 1,026,160 | |||||
| 6.375% 1/1/39 | 1,000,000 | 1,109,810 | |||||
| Dauphin County, Pennsylvania General Authority Health | |||||||
| System Revenue (Pinnacle Health System Project) | |||||||
| 5.00% 6/1/42 | 2,305,000 | 2,463,515 | |||||
| East Rochester, New York Housing Authority Revenue | |||||||
| Refunding (Senior Living - Woodland Village Project) | |||||||
| 5.50% 8/1/33 | 1,200,000 | 1,195,512 | |||||
| Hawaii Pacific Health Special Purpose Revenue | |||||||
| Series A 5.50% 7/1/40 | 1,250,000 | 1,362,225 | |||||
| Hawaii State Department of Budget & Finance Special | |||||||
| Purpose Senior Living Revenue | |||||||
| (15 Craigside Project) Series A 9.00% 11/15/44 | 1,000,000 | 1,206,430 | |||||
| (Kahala Nui) 5.25% 11/15/37 | 1,000,000 | 1,051,150 | |||||
| Illinois Finance Authority Revenue | |||||||
| (Admiral at Lake Project) 8.00% 5/15/46 | 1,500,000 | 1,765,770 | |||||
| (Provena Health) Series A 7.75% 8/15/34 | 1,000,000 | 1,305,330 | |||||
| (Silver Cross & Medical Centers) 7.00% 8/15/44 | 1,000,000 | 1,197,680 | |||||
56
| Principal amount | Value | ||||||
| Municipal Bonds (continued) | |||||||
| Healthcare Revenue Bonds (continued) | |||||||
| Illinois Health Facilities Authority Revenue (Elmhurst | |||||||
| Memorial Healthcare Project) 5.625% 1/1/28 | $ | 1,000,000 | $ | 1,012,840 | |||
| Indiana Finance Authority Hospital Revenue | |||||||
| (King’s Daughters Hospital & Health) 5.50% 8/15/45 | 1,000,000 | 1,044,470 | |||||
| Indiana Finance Authority Revenue (Marquette Project) | |||||||
| 5.00% 3/1/39 | 1,400,000 | 1,430,268 | |||||
| Kentucky Economic Development Finance Authority Hospital | |||||||
| Revenue (Owensboro Medical Health System) | |||||||
| Series A 6.50% 3/1/45 | 1,000,000 | 1,191,920 | |||||
| Kentwood, Michigan Economic Development Corporation | |||||||
| Revenue (Limited Obligation - Holland Home) | |||||||
| 5.625% 11/15/41 | 1,250,000 | 1,290,463 | |||||
| Koyukuk, Alaska Revenue (Tanana Chiefs Conference | |||||||
| Health Care Facility Project) 7.75% 10/1/41 | 1,750,000 | 1,920,258 | |||||
| Lancaster County, Pennsylvania Hospital Authority Revenue | |||||||
| (Brethren Village Project) Series A 6.375% 7/1/30 | 725,000 | 780,861 | |||||
| Lebanon County, Pennsylvania Health Facilities Authority | |||||||
| Center Revenue (Pleasant View Retirement) | |||||||
| Series A 5.30% 12/15/26 | 1,000,000 | 1,014,880 | |||||
| Louisiana Public Facilities Authority Revenue | |||||||
| (Ochsner Clinic Foundation Project) 6.50% 5/15/37 | 1,705,000 | 2,041,294 | |||||
| Lucas County, Ohio Health Care Facilities Revenue | |||||||
| (Sunset Retirement Communities) 5.50% 8/15/30 | 1,000,000 | 1,091,110 | |||||
| Lucas County, Ohio Refunding & Improvement | |||||||
| (Luthern Homes) Series A 7.00% 11/1/45 | 3,000,000 | 3,376,559 | |||||
| Maine Health & Higher Educational Facilities Authority | |||||||
| Revenue (Maine General Medical Center) 6.75% 7/1/41 | 1,700,000 | 1,990,343 | |||||
| Martin County, Florida Health Facilities Authority Revenue | |||||||
| (Martin Memorial Medical Center) 5.50% 11/15/42 | 1,000,000 | 1,091,560 | |||||
| Maryland State Health & Higher Educational Facilities | |||||||
| Authority Revenue (Doctors Community Hospital) | |||||||
| 5.75% 7/1/38 | 1,500,000 | 1,626,135 | |||||
| Missouri State Health & Educational Facilities Authority | |||||||
| (Lutheran Senior Services) 6.00% 2/1/41 | 1,000,000 | 1,122,330 | |||||
| Montgomery County, Pennsylvania Industrial Development | |||||||
| Authority Revenue (Meeting - Whitemarsh Continuing | |||||||
| Care) 6.25% 2/1/35 | 2,500,000 | 2,542,300 | |||||
57
Statements of net assets
Delaware National High-Yield Municipal Bond Fund
| Principal amount | Value | |||||
| Municipal Bonds (continued) | ||||||
| Healthcare Revenue Bonds (continued) | ||||||
| New Hampshire Health & Education Facilities Authority | ||||||
| (Rivermeade) Series A 6.875% 7/1/41 | $ | 1,380,000 | $ | 1,556,516 | ||
| New Jersey Health Care Facilities Financing | ||||||
| Authority Revenue | ||||||
| (St. Josephs Healthcare System) 6.625% 7/1/38 | 860,000 | 995,484 | ||||
| (St. Peters University Hospital) 6.25% 7/1/35 | 2,700,000 | 3,088,719 | ||||
| (Trinitas Hospital Obligation Group) Series A | ||||||
| 5.25% 7/1/30 | 1,240,000 | 1,302,161 | ||||
| New York State Dormitory Authority Revenue Non State | ||||||
| Supported Debt (Orange Regional Medical Center) | ||||||
| 6.25% 12/1/37 | 2,500,000 | 2,721,650 | ||||
| North Carolina Medical Care Commission Health Care | ||||||
| Facilities Revenue | ||||||
| (First Mortgage - Galloway Ridge Project) 6.00% 1/1/39 | 1,520,000 | 1,639,305 | ||||
| (First Mortgage - Presbyterian Homes) 5.60% 10/1/36 | 1,000,000 | 1,022,980 | ||||
| Pennsylvania Economic Development Financing Authority | ||||||
| Health System Revenue (Albert Einstein Healthcare) | ||||||
| Series A 6.25% 10/15/23 | 1,100,000 | 1,288,881 | ||||
| Philadelphia, Pennsylvania Hospitals & Higher Education | ||||||
| Facilities Authority Hospital Revenue | ||||||
| (Temple University Health System) Series A | ||||||
| 5.50% 7/1/30 | 2,000,000 | 2,085,880 | ||||
| 5.625% 7/1/42 | 1,000,000 | 1,051,980 | ||||
| Salem, Oregon Hospital Facility Authority Revenue | ||||||
| (Capital Manor Inc.) | ||||||
| 6.00% 5/15/42 | 1,250,000 | 1,343,100 | ||||
| 6.00% 5/15/47 | 1,500,000 | 1,611,720 | ||||
| San Buenaventura, California Revenue (Community | ||||||
| Memorial Health Systems) 7.50% 12/1/41 | 2,475,000 | 3,006,383 | ||||
| South Carolina Jobs - Economic Development Authority | ||||||
| Hospital Revenue (Palmetto Health) 5.75% 8/1/39 | 915,000 | 1,020,536 | ||||
| Southeastern Ohio Port Authority Revenue | ||||||
| (Memorial Health System) 6.00% 12/1/42 | 3,000,000 | 3,181,200 | ||||
| St. Johns County, Florida Industrial Development Authority | ||||||
| Revenue (Presbyterian Retirement) | ||||||
| Series A 5.875% 8/1/40 | 1,000,000 | 1,099,420 | ||||
| St. Louis Park, Minnesota Health Care Facilities Revenue | ||||||
| (Park Nicollet Health Services) 5.75% 7/1/39 | 500,000 | 562,165 | ||||
58
| Principal amount | Value | |||||
| Municipal Bonds (continued) | ||||||
| Healthcare Revenue Bonds (continued) | ||||||
| St. Paul, Minnesota Housing & Redevelopment Authority | ||||||
| Hospital Revenue (Health East Project) 6.00% 11/15/30 | $ | 2,000,000 | $ | 2,113,540 | ||
| Suffolk County, New York Economic Development | ||||||
| Corporation Revenue (Peconic Landing Southland) | ||||||
| 6.00% 12/1/40 | 575,000 | 638,239 | ||||
| Tempe, Arizona Industrial Development Authority | ||||||
| Revenue Refunding (Friendship Village) | ||||||
| Series A 6.25% 12/1/46 | 500,000 | 540,595 | ||||
| Travis County, Texas Health Facilities Development | ||||||
| Corporation Revenue (Westminister Manor Project) | ||||||
| 7.125% 11/1/40 | 1,000,000 | 1,175,420 | ||||
| Vermont Economic Development Authority Revenue | ||||||
| (Wake Robin Corp. Project) 5.40% 5/1/33 | 1,100,000 | 1,150,842 | ||||
| Washington State Health Care Facilities Authority Revenue | ||||||
| (Kadlec Regional Medical Center) 5.00% 12/1/42 | 3,000,000 | 3,058,770 | ||||
| (Multicare Health System) | ||||||
| Series B 6.00% 8/15/39 (ASSURED GTY) | 1,250,000 | 1,463,200 | ||||
| Wayzata, Minnesota Senior Housing Revenue | ||||||
| (Folkestone Senior Living Community) Series A | ||||||
| 5.50% 11/1/32 | 270,000 | 278,613 | ||||
| 5.75% 11/1/39 | 600,000 | 625,716 | ||||
| 6.00% 5/1/47 | 920,000 | 968,778 | ||||
| West Virginia Hospital Finance Authority Revenue | ||||||
| (Highland Hospital Obligation Group) 9.125% 10/1/41 | 3,000,000 | 3,701,519 | ||||
| Winchester, Virginia Industrial Development Authority | ||||||
| Residential Care Facility Revenue (Westminster- | ||||||
| Canterbury Project) Series A 5.30% 1/1/35 | 1,000,000 | 1,021,130 | ||||
| Yavapai County, Arizona Industrial Development Authority | ||||||
| Hospital Revenue (Yavapai Medical Center) | ||||||
| Series A 6.00% 8/1/33 | 1,000,000 | 1,041,440 | ||||
| 100,372,434 | ||||||
| Housing Revenue Bonds – 1.14% | ||||||
| California Municipal Finance Authority Mobile Home Park | ||||||
| Revenue (Senior - Caritas Projects) Series A | ||||||
| 5.50% 8/15/47 | 1,500,000 | 1,578,660 | ||||
| 6.40% 8/15/45 | 1,820,000 | 1,992,754 | ||||
| Independent Cities, California Finance Authority Revenue | ||||||
| (Sahar Mobile Home Park) Series A 5.00% 6/15/47 | 1,250,000 | 1,265,838 | ||||
| 4,837,252 | ||||||
59
Statements of net assets
Delaware National High-Yield Municipal Bond Fund
| Principal amount | Value | |||||
| Municipal Bonds (continued) | ||||||
| Lease Revenue Bonds – 9.95% | ||||||
| California Municipal Finance Authority Revenue | ||||||
| (Goodwill Industry Sacramento Valley and Northern | ||||||
| Nevada Project) Series A | ||||||
| 6.625% 1/1/32 | $ | 500,000 | $ | 515,405 | ||
| 6.875% 1/1/42 | 1,500,000 | 1,545,705 | ||||
| Capital Area Cultural Education Facilities Finance | ||||||
| Corporation Texas Revenue (Roman Catholic Diocese) | ||||||
| Series B 6.125% 4/1/45 | 1,000,000 | 1,098,670 | ||||
| Capital Trust Agency Florida Revenue | ||||||
| (Air Cargo - Aero Miami) Series A 5.35% 7/1/29 | 980,000 | 997,483 | ||||
| (Fort Lauderdale/Cargo Acquisition Project) | ||||||
| 5.75% 1/1/32 (AMT) | 550,000 | 554,598 | ||||
| District of Columbia Revenue (Center of Strategic & | ||||||
| International Studies) 6.625% 3/1/41 | 2,235,000 | 2,440,352 | ||||
| Houston, Texas Industrial Development Corporate Revenue | ||||||
| (Air Cargo) 6.375% 1/1/23 (AMT) | 1,500,000 | 1,520,130 | ||||
| Hudson, New York Yards Infrastructure Corporation Revenue | ||||||
| Series A 5.75% 2/15/47 | 2,500,000 | 2,937,575 | ||||
| Missouri State Development Finance Board Infrastructure | ||||||
| Facilities Revenue (Branson Landing Project) | ||||||
| Series A 5.50% 12/1/24 | 720,000 | 747,367 | ||||
| New Jersey Economic Development Authority Revenue | ||||||
| (UMM Energy Partners) Series A | ||||||
| 4.75% 6/15/32 (AMT) | 1,000,000 | 999,930 | ||||
| 5.00% 6/15/37 (AMT) | 560,000 | 565,835 | ||||
| 5.125% 6/15/43 (AMT) | 500,000 | 508,625 | ||||
| New York City, New York Industrial Development | ||||||
| Agency Revenue (Airis JFK I, LLC Project) | ||||||
| Series A 5.50% 7/1/28 (AMT) | 905,000 | 907,615 | ||||
| (Pilot - Queens Baseball Stadium) 5.00% 1/1/46 (AMBAC) | 1,000,000 | 1,015,100 | ||||
| New York State Liberty Development Corporation Liberty | ||||||
| Revenue (World Trade Center Project) | ||||||
| 5.75% 11/15/51 | 7,485,000 | 8,874,666 | ||||
| Class 1 5.00% 9/15/40 | 1,120,000 | 1,276,184 | ||||
| Class 2 5.00% 9/15/43 | 2,015,000 | 2,207,775 | ||||
| Class 3 5.00% 3/15/44 | 1,400,000 | 1,508,360 | ||||
| Oklahoma City, Oklahoma Industrial & Cultural Facilities | ||||||
| Subordinated (Air Cargo - Obligated Group) | ||||||
| 6.75% 1/1/23 (AMT) | 1,160,000 | 1,161,334 | ||||
60
| Principal amount | Value | |||||
| Municipal Bonds (continued) | ||||||
| Lease Revenue Bonds (continued) | ||||||
| Onondaga County, New York Industrial Development | ||||||
| Authority Revenue Subordinated (Air Cargo Project) | ||||||
| 7.25% 1/1/32 (AMT) | $ | 650,000 | $ | 659,087 | ||
| Public Finance Authority, Wisconsin Airport Facilities | ||||||
| Revenue (Senior Obligation Group) | ||||||
| 5.00% 7/1/42 (AMT) | 2,000,000 | 2,010,680 | ||||
| Puerto Rico Public Buildings Authority Revenue | ||||||
| (Government Facilities) Series U 5.25% 7/1/42 | 5,000,000 | 5,086,100 | ||||
| Puerto Rico Public Finance Corporation Revenue | ||||||
| (Commonwealth Appropriation) Series B | ||||||
| 5.50% 8/1/31 | 1,880,000 | 1,994,774 | ||||
| Wise County, Texas (Parker County Junior College District) | ||||||
| 8.00% 8/15/34 | 1,000,000 | 1,125,900 | ||||
| 42,259,250 | ||||||
| §Pre-Refunded Bond – 0.25% | ||||||
| New Jersey State Economic Development Authority Revenue | ||||||
| (Cigarette Tax) 5.75% 6/15/34-14 | 965,000 | 1,058,923 | ||||
| 1,058,923 | ||||||
| Resource Recovery Revenue Bond – 0.25% | ||||||
| Mission Economic Development, Dallas, Texas Clean Energy | ||||||
| Revenue (McCommas) 6.875% 12/1/24 (AMT) | 1,000,000 | 1,074,050 | ||||
| 1,074,050 | ||||||
| Special Tax Revenue Bonds – 8.65% | ||||||
| Anne Arundel County, Maryland Special Obligation | ||||||
| Revenue (National Business Park - North Project) | ||||||
| 6.10% 7/1/40 | 1,725,000 | 1,869,469 | ||||
| Baltimore, Maryland Convention Center Hotel Revenue | ||||||
| Subordinated Series B 5.875% 9/1/39 | 1,000,000 | 1,024,100 | ||||
| Bonita Canyon, California Public Facilities Financing | ||||||
| Authority (Community Facilities District #98-1) | ||||||
| 5.00% 9/1/28 | 700,000 | 723,702 | ||||
| Brooklyn Arena Local Development Corporation, | ||||||
| New York Pilot Revenue (Barclays Center Project) | ||||||
| 6.25% 7/15/40 | 4,000,000 | 4,652,680 | ||||
| 6.50% 7/15/30 | 1,175,000 | 1,408,155 | ||||
| California Statewide Communities Development Authority | ||||||
| Revenue (Inland Regional Center Project) | ||||||
| 5.375% 12/1/37 | 3,000,000 | 3,056,670 | ||||
61
Statements of net assets
Delaware National High-Yield Municipal Bond Fund
| Principal amount | Value | |||||
| Municipal Bonds (continued) | ||||||
| Special Tax Revenue Bonds (continued) | ||||||
| Dutchess County, New York Local Development Corporation | ||||||
| Revenue (Anderson Center Services Inc. Project) | ||||||
| 6.00% 10/1/30 | $ | 2,000,000 | $ | 2,114,540 | ||
| @ | Farms New Kent, Virginia Community Development | |||||
| Authority Special Assessment Series C 5.80% 3/1/36 | 1,000,000 | 600,490 | ||||
| Henderson, Nevada Local Improvement Districts #T-18 | ||||||
| 5.30% 9/1/35 | 650,000 | 360,822 | ||||
| Lancaster, California Redevelopment Agency Tax Allocation | ||||||
| Revenue (Combined Redevelopment Project Areas) | ||||||
| 6.875% 8/1/39 | 500,000 | 569,380 | ||||
| Mosaic, Virginia District Community Development Authority | ||||||
| Revenue Series A 6.875% 3/1/36 | 1,500,000 | 1,677,405 | ||||
| Nampa Development Corporation, Idaho Revenue | ||||||
| 5.90% 3/1/30 | 2,000,000 | 2,158,740 | ||||
| New York City, New York Industrial Development Agency | ||||||
| (Pilot - Queens Baseball Stadium) 5.00% 1/1/22 (AMBAC) | 1,000,000 | 1,032,140 | ||||
| (Yankee Stadium) 7.00% 3/1/49 (ASSURED GTY) | 1,000,000 | 1,227,800 | ||||
| (YMCA of Greater New York Project) 5.00% 8/1/36 | 3,000,000 | 3,144,810 | ||||
| Norco, California Redevelopment Agency Tax Allocation | ||||||
| (Area #1 Project) 6.00% 3/1/36 | 1,000,000 | 1,100,270 | ||||
| Puerto Rico Sales Tax Financing Corporation Tax Revenue | ||||||
| Ω(Capital Appreciation) Series A 6.75% 8/1/32 | 730,000 | 755,988 | ||||
| Series A 5.75% 8/1/37 | 800,000 | 893,304 | ||||
| Series C 5.00% 8/1/40 | 1,250,000 | 1,355,125 | ||||
| Richmond Heights, Missouri Tax Increment & Transaction | ||||||
| Sales Tax Revenue Refunding & Improvement | ||||||
| (Francis Place Redevelopment Project) 5.625% 11/1/25 | 1,200,000 | 1,200,372 | ||||
| Roseville Westpark, California Community Facilities | ||||||
| District #1 (Special Tax Public Facilities) 5.25% 9/1/37 | 600,000 | 601,284 | ||||
| San Mateo, California Special Tax Revenue (Community | ||||||
| Facilities District #2008-1-Bay Meadows) 6.00% 9/1/42 | 705,000 | 767,477 | ||||
| @ | St. Joseph, Missouri Industrial Development | |||||
| Authority Tax Increment Revenue | ||||||
| (Shoppes at North Village Project) Series A | ||||||
| 5.375% 11/1/24 | 1,000,000 | 1,004,280 | ||||
| 5.50% 11/1/27 | 500,000 | 501,375 | ||||
| St. Louis, Missouri Industrial Development Authority Tax | ||||||
| Increment Revenue Improvement (Grand Center | ||||||
| Redevelopment Project) 6.375% 12/1/25 | 1,200,000 | 1,285,644 | ||||
62
| Principal amount | Value | |||||
| Municipal Bonds (continued) | ||||||
| Special Tax Revenue Bonds (continued) | ||||||
| Winter Garden Village at Fowler Groves Community | ||||||
| Development District, Florida Special Assessment | ||||||
| Revenue 5.65% 5/1/37 | $ | 925,000 | $ | 962,740 | ||
| ^ | Wyandotte County, Kansas City, Kansas Unified Government | |||||
| Special Obligation Revenue (Capital Appreciation - Sales | ||||||
| Tax Subordinate Lien) 6.07% 6/1/21 | 1,040,000 | 705,723 | ||||
| 36,754,485 | ||||||
| State General Obligation Bonds – 5.28% | ||||||
| Pennsylvania Commonwealth First Series 5.00% 6/1/22 | 3,000,000 | 3,813,660 | ||||
| Puerto Rico Commonwealth Public Improvement Series A | ||||||
| 5.00% 7/1/41 | 5,900,000 | 5,877,285 | ||||
| 5.50% 7/1/39 | 2,000,000 | 2,083,880 | ||||
| 5.75% 7/1/41 | 2,000,000 | 2,139,060 | ||||
| State of Connecticut Series C 5.00% 6/1/22 | 3,000,000 | 3,810,000 | ||||
| State of Georgia Series A 5.00% 7/1/26 | 1,750,000 | 2,211,143 | ||||
| State of New York Series A 5.25% 2/15/24 | 2,000,000 | 2,522,660 | ||||
| 22,457,688 | ||||||
| Transportation Revenue Bonds – 6.61% | ||||||
| Central Texas Regional Mobility Authority Revenue | ||||||
| Senior Lien 6.00% 1/1/41 | 1,890,000 | 2,203,608 | ||||
| Subordinate Lien 6.75% 1/1/41 | 1,000,000 | 1,152,590 | ||||
| Delaware Transportation Authority Revenue Senior | ||||||
| 5.00% 7/1/22 | 2,000,000 | 2,559,860 | ||||
| Houston, Texas Airport System Revenue Refunding | ||||||
| Subordinate Lien Series A 5.00% 7/1/25 (AMT) | 1,000,000 | 1,135,450 | ||||
| Maryland Economic Development Corporation Revenue | ||||||
| (Transportation Facilities Project) | ||||||
| Series A 5.75% 6/1/35 | 1,000,000 | 1,093,600 | ||||
| Port Authority of New York & New Jersey Special Project | ||||||
| (JFK International Air Terminal) 6.00% 12/1/42 | 1,970,000 | 2,289,495 | ||||
| Regional Transportation District, Colorado Private Activity | ||||||
| Revenue (Denver Transit Partners) 6.00% 1/15/41 | 1,000,000 | 1,157,630 | ||||
| Sacramento County, California Airport System Revenue | ||||||
| (PFC/Grant) Series C 6.00% 7/1/41 | 1,000,000 | 1,149,880 | ||||
| St. Louis, Missouri Airport Revenue (Lambert-St. Louis | ||||||
| International) Series A-1 6.625% 7/1/34 | 1,090,000 | 1,289,906 | ||||
63
Statements of net assets
Delaware National High-Yield Municipal Bond Fund
| Principal amount | Value | |||||
| Municipal Bonds (continued) | ||||||
| Transportation Revenue Bonds (continued) | ||||||
| Texas Private Activity Bond Surface Transportation | ||||||
| Corporate Senior Lien | ||||||
| (LBJ Infrastructure) | ||||||
| 7.00% 6/30/40 | $ | 7,000,000 | $ | 8,563,309 | ||
| 7.50% 6/30/33 | 500,000 | 635,960 | ||||
| (Mobility Partners) 6.875% 12/31/39 | 4,055,000 | 4,877,922 | ||||
| 28,109,210 | ||||||
| Water & Sewer Revenue Bond – 0.45% | ||||||
| Puerto Rico Commonwealth Aqueduct & Sewer Authority | ||||||
| Revenue Senior Lien Series A 6.00% 7/1/47 | 1,730,000 | 1,894,627 | ||||
| 1,894,627 | ||||||
| Total Municipal Bonds (cost $380,281,213) | 412,415,313 | |||||
| Short-Term Investments – 2.12% | ||||||
| ¤Variable Rate Demand Notes – 2.12% | ||||||
| Colorado State Educational & Cultural Facilities Authority | ||||||
| Revenue (National Jewish Federation Bond Program) | ||||||
| Series D-5 0.19% 10/1/38 | ||||||
| (LOC – JPMorgan Chase Bank) | 2,000,000 | 2,000,000 | ||||
| Minneapolis & St. Paul, Minnesota Housing & | ||||||
| Redevelopment Authority Health Care Revenue | ||||||
| (Allina Health System) Series B-1 0.18% 11/15/35 | ||||||
| (LOC – JPMorgan Chase Bank) | 2,500,000 | 2,500,000 | ||||
| Mississippi State Business Commission Gulf Opportunity | ||||||
| Revenue (Chevron USA) Series D 0.17% 11/1/35 | 1,500,000 | 1,500,000 | ||||
| Montgomery County, Pennsylvania | ||||||
| Series A 0.18% 8/15/24 (SPA – PNC Bank) | 2,000,000 | 2,000,000 | ||||
| St. Paul, Minnesota Port Authority Revenue | ||||||
| (Minnesota Public Radio Project) | ||||||
| Series 7 0.20% 5/1/25 (LOC – JPMorgan Chase Bank) | 1,000,000 | 1,000,000 | ||||
| Total Short-Term Investments (cost $9,000,000) | 9,000,000 | |||||
| Total Value of Securities – 99.18% | ||||||
| (cost $389,281,213) | 421,415,313 | |||||
| Receivables and Other Assets | ||||||
| Net of Liabilities – 0.82% | 3,483,583 | |||||
| Net Assets Applicable to 39,389,182 | ||||||
| Shares Outstanding – 100.00% | $ | 424,898,896 | ||||
64
| Net Asset Value – Delaware National High-Yield Municipal Bond Fund | ||||
| Class A ($228,828,847 / 21,285,500 Shares) | $10.75 | |||
| Net Asset Value – Delaware National High-Yield Municipal Bond Fund | ||||
| Class B ($775,574 / 72,012 Shares) | $10.77 | |||
| Net Asset Value – Delaware National High-Yield Municipal Bond Fund | ||||
| Class C ($69,633,683 / 6,450,421 Shares) | $10.80 | |||
| Net Asset Value – Delaware National High-Yield Municipal Bond Fund | ||||
| Institutional Class ($125,660,792 / 11,581,249 Shares) | $10.85 | |||
| Components of Net Assets at August 31, 2012: | ||||
| Shares of beneficial interest (unlimited authorization - no par) | $ | 396,208,945 | ||
| Undistributed net investment income | 26,897 | |||
| Accumulated net realized loss on investments | (3,471,046 | ) | ||
| Net unrealized appreciation of investments | 32,134,100 | |||
| Total net assets | $ | 424,898,896 | ||
| • | Variable rate security. The rate shown is the rate as of August 31, 2012. Interest rates reset periodically. |
| @ | Illiquid security. At August 31, 2012, the aggregate value of illiquid securities was $2,574,122, which represented 0.61% of the Fund’s net assets. See Note 8 in “Notes to financial statements.” |
| # | Security exempt from registration under Rule 144A of the Securities Act of 1933, as amended. At August 31, 2012, the aggregate value of Rule 144A securities was $1,633,415, which represented 0.38% of the Fund’s net assets. See Note 8 in “Notes to financial statements.” |
| § | Pre-refunded bonds. Municipal bonds that are generally backed or secured by U.S. Treasury bonds. For pre-refunded bonds, the stated maturity is followed by the year in which the bond is pre-refunded. See Note 8 in “Notes to financial statements.” |
| Ω | Step coupon bond. Indicates security that has a zero coupon that remains in effect until a predetermined date at which time the stated interest rate becomes effective. |
| ^ | Zero coupon security. The rate shown is the yield at the time of purchase. |
| ¤ | Tax-exempt obligations that contain a floating or variable interest rate adjustment formula and an unconditional right of demand to receive payment of the unpaid principal balance plus accrued interest upon a short notice period (generally up to 30 days) prior to specified dates either from the issuer or by drawing on a bank letter of credit, a guarantee or insurance issued with respect to such instrument. The rate shown is the rate as of August 31, 2012. |
65
Statements of net assets
Delaware National High-Yield Municipal Bond Fund
AMBAC — Insured by the AMBAC Assurance Corporation
AMT — Subject to Alternative Minimum Tax
ASSURED GTY — Insured by the Assured Guaranty Corporation
CDFI — Community Development Financial Institutions
LOC — Letter of Credit
SGI — Insured by Syncora Guarantee Inc.
SPA — Stand-by Purchase Agreement
| Net Asset Value and Offering Price Per Share – | ||
| Delaware National High Yield Municipal Bond Fund | ||
| Net asset value Class A (A) | $ | 10.75 |
| Sales charge (4.50% of offering price) (B) | 0.51 | |
| Offering price | $ | 11.26 |
| (A) | Net asset value per share, as illustrated, is the amount which would be paid upon redemption or repurchase of shares. |
| (B) | See the current prospectus for purchases of $100,000 or more. |
See accompanying notes, which are an integral part of the financial statements.
66
| Statements of operations | |||
| Year Ended August 31, 2012 | |||
| Delaware | Delaware | Delaware | |||||||||
| Tax-Free | Tax-Free USA | National High-Yield | |||||||||
| USA Fund | Intermediate Fund | Municipal Bond Fund | |||||||||
| Investment Income: | |||||||||||
| Interest | $ | 31,509,256 | $ | 31,303,026 | $ | 16,974,225 | |||||
| Expenses: | |||||||||||
| Management fees | 3,456,436 | 4,114,753 | 1,644,908 | ||||||||
| Distribution expenses – Class A | 1,449,286 | 1,374,991 | 418,943 | ||||||||
| Distribution expenses – Class B | 21,360 | 1,435 | 7,604 | ||||||||
| Distribution expenses – Class C | 333,253 | 680,855 | 525,617 | ||||||||
| Dividend disbursing and transfer | |||||||||||
| agent fees and expenses | 453,767 | 807,713 | 243,344 | ||||||||
| Accounting and administration expenses | 251,259 | 329,056 | 117,099 | ||||||||
| Registration fees | 65,809 | 76,762 | 86,080 | ||||||||
| Legal fees | 58,577 | 83,027 | 24,564 | ||||||||
| Reports and statements to shareholders | 48,224 | 66,830 | 26,483 | ||||||||
| Trustees’ fees | 30,999 | 40,420 | 14,030 | ||||||||
| Audit and tax | 28,912 | 36,874 | 20,720 | ||||||||
| Pricing fees | 16,162 | 24,505 | 19,700 | ||||||||
| Custodian fees | 12,839 | 16,300 | 5,984 | ||||||||
| Insurance fees | 11,032 | 13,967 | 4,332 | ||||||||
| Due and services | 9,792 | 10,320 | 6,871 | ||||||||
| Consulting fees | 5,764 | 7,511 | 2,833 | ||||||||
| Trustees’ expenses | 1,886 | 2,405 | 751 | ||||||||
| 6,255,357 | 7,687,724 | 3,169,863 | |||||||||
| Less expenses absorbed or waived | (858,522 | ) | (589,689 | ) | (426,689 | ) | |||||
| Less waived distribution expenses – Class A | — | (687,496 | ) | — | |||||||
| Less expenses paid indirectly | (337 | ) | (411 | ) | (116 | ) | |||||
| Total operating expenses | 5,396,498 | 6,410,128 | 2,743,058 | ||||||||
| Net Investment Income | 26,112,758 | 24,892,898 | 14,231,167 | ||||||||
| Net Realized and Unrealized Gain: | |||||||||||
| Net realized gain on investments | 12,593,089 | 8,549,846 | 119,419 | ||||||||
| Net change in unrealized appreciation | |||||||||||
| (depreciation) of investments | 39,892,342 | 29,502,702 | 32,901,643 | ||||||||
| Net Realized and Unrealized Gain | 52,485,431 | 38,052,548 | 33,021,062 | ||||||||
| Net Increase in Net Assets | |||||||||||
| Resulting from Operations | $ | 78,598,189 | $ | 62,945,446 | $ | 47,252,229 | |||||
See accompanying notes, which are an integral part of the financial statements.
67
Statements of changes in net assets
Delaware Tax-Free USA Fund
| Year Ended | ||||||||
| 8/31/12 | 8/31/11 | |||||||
| Increase (Decrease) in Net Assets from Operations: | ||||||||
| Net investment income | $ | 26,112,758 | $ | 27,971,525 | ||||
| Net realized gain (loss) | 12,593,089 | (2,115,254 | ) | |||||
| Net change in unrealized appreciation (depreciation) | 39,892,342 | (14,131,063 | ) | |||||
| Net increase in net assets resulting from operations | 78,598,189 | 11,725,208 | ||||||
| Dividends and Distributions to Shareholders from: | ||||||||
| Net investment income: | ||||||||
| Class A | (24,318,829 | ) | (26,383,867 | ) | ||||
| Class B | (71,571 | ) | (137,957 | ) | ||||
| Class C | (1,113,082 | ) | (1,092,256 | ) | ||||
| Institutional Class | (547,276 | ) | (357,445 | ) | ||||
| (26,050,758 | ) | (27,971,525 | ) | |||||
| Capital Share Transactions: | ||||||||
| Proceeds from shares sold: | ||||||||
| Class A | 24,908,312 | 136,032,754 | ||||||
| Class B | 29,617 | 120,830 | ||||||
| Class C | 6,942,209 | 6,817,145 | ||||||
| Institutional Class | 13,146,308 | 9,076,630 | ||||||
| Net asset value of shares issued upon reinvestment | ||||||||
| of dividends and distributions: | ||||||||
| Class A | 13,911,049 | 13,699,555 | ||||||
| Class B | 48,104 | 77,774 | ||||||
| Class C | 837,082 | 798,168 | ||||||
| Institutional Class | 353,695 | 213,566 | ||||||
| 60,176,376 | 166,836,422 | |||||||
68
| Year Ended | ||||||||
| 8/31/12 | 8/31/11 | |||||||
| Capital Share Transactions (continued): | ||||||||
| Cost of shares redeemed: | ||||||||
| Class A | $ | (72,229,853 | ) | $ | (127,465,062 | ) | ||
| Class B | (1,107,287 | ) | (2,707,795 | ) | ||||
| Class C | (4,210,929 | ) | (6,487,428 | ) | ||||
| Institutional Class | (5,557,588 | ) | (7,518,826 | ) | ||||
| (83,105,657 | ) | (144,179,111 | ) | |||||
| Increase (decrease) in net assets derived from | ||||||||
| capital share transactions | (22,929,281 | ) | 22,657,311 | |||||
| Net Increase in Net Assets | 29,618,150 | 6,410,994 | ||||||
| Net Assets: | ||||||||
| Beginning of year | 631,651,120 | 625,240,126 | ||||||
| End of year | $ | 661,269,270 | $ | 631,651,120 | ||||
| Undistributed net investment income | $ | 128,895 | $ | 66,895 | ||||
See accompanying notes, which are an integral part of the financial statements.
69
Statements of changes in net assets
Delaware Tax-Free USA Intermediate Fund
| Year Ended | ||||||||||
| 8/31/12 | 8/31/11 | |||||||||
| Increase (Decrease) in Net Assets from Operations: | ||||||||||
| Net investment income | $ | 24,892,898 | $ | 24,117,514 | ||||||
| Net realized gain (loss) | 8,549,846 | (10,466,464 | ) | |||||||
| Net change in unrealized appreciation (depreciation) | 29,502,702 | (6,086,618 | ) | |||||||
| Net increase in net assets resulting from operations | 62,945,446 | 7,564,432 | ||||||||
| Dividends and Distributions to Shareholders from: | ||||||||||
| Net investment income: | ||||||||||
| Class A | (13,653,725 | ) | (14,784,211 | ) | ||||||
| Class B | (3,093 | ) | (8,235 | ) | ||||||
| Class C | (1,448,064 | ) | (1,515,940 | ) | ||||||
| Institutional Class | (9,787,989 | ) | (7,809,145 | ) | ||||||
| (24,892,871 | ) | (24,117,531 | ) | |||||||
| Capital Share Transactions: | ||||||||||
| Proceeds from shares sold: | ||||||||||
| Class A | 110,940,228 | 140,084,853 | ||||||||
| Class B | 2,352 | 20,903 | ||||||||
| Class C | 21,316,081 | 14,263,200 | ||||||||
| Institutional Class | 121,081,688 | 174,138,184 | ||||||||
| Net asset value of shares issued upon reinvestment | ||||||||||
| of dividends and distributions: | ||||||||||
| Class A | 10,732,723 | 10,808,489 | ||||||||
| Class B | 2,048 | 4,659 | ||||||||
| Class C | 1,183,202 | 1,166,302 | ||||||||
| Institutional Class | 5,274,687 | 3,678,088 | ||||||||
| 270,533,009 | 344,164,678 | |||||||||
70
| Year Ended | ||||||||||
| 8/31/12 | 8/31/11 | |||||||||
| Capital Share Transactions (continued): | ||||||||||
| Cost of shares redeemed: | ||||||||||
| Class A | $ | (122,640,858 | ) | $ | (175,715,728 | ) | ||||
| Class B | (194,373 | ) | (273,313 | ) | ||||||
| Class C | (10,083,689 | ) | (18,651,985 | ) | ||||||
| Institutional Class | (88,824,807 | ) | (85,170,855 | ) | ||||||
| (221,743,727 | ) | (279,811,881 | ) | |||||||
| Increase in net assets derived from | ||||||||||
| capital share transactions | 48,789,282 | 64,352,797 | ||||||||
| Net Increase in Net Assets | 86,841,857 | 47,799,698 | ||||||||
| Net Assets: | ||||||||||
| Beginning of year | 786,683,454 | 738,883,756 | ||||||||
| End of year | $ | 873,525,311 | $ | 786,683,454 | ||||||
| Undistributed net investment income | $ | 16,235 | $ | 16,208 | ||||||
See accompanying notes, which are an integral part of the financial statements.
71
Statements of changes in net assets
Delaware National High-Yield Municipal Bond Fund
| Year Ended | |||||||||
| 8/31/12 | 8/31/11 | ||||||||
| Increase (Decrease) in Net Assets from Operations: | |||||||||
| Net investment income | $ | 14,231,167 | $ | 10,417,217 | |||||
| Net realized gain (loss) | 119,419 | (2,617,378 | ) | ||||||
| Net change in unrealized appreciation (depreciation) | 32,901,643 | (7,570,920 | ) | ||||||
| Net increase in net assets resulting from operations | 47,252,229 | 228,919 | |||||||
| Dividends and Distributions to Shareholders from: | |||||||||
| Net investment income: | |||||||||
| Class A | (8,090,016 | ) | (6,771,903 | ) | |||||
| Class B | (31,314 | ) | (38,072 | ) | |||||
| Class C | (2,143,223 | ) | (1,767,391 | ) | |||||
| Institutional Class | (3,879,322 | ) | (1,748,678 | ) | |||||
| (14,143,875 | ) | (10,326,044 | ) | ||||||
| Capital Share Transactions: | |||||||||
| Proceeds from shares sold: | |||||||||
| Class A | 98,235,878 | 69,006,067 | |||||||
| Class B | 24,627 | 721 | |||||||
| Class C | 28,063,476 | 20,108,287 | |||||||
| Institutional Class | 94,846,876 | 52,126,539 | |||||||
| Net asset value of shares issued upon reinvestment | |||||||||
| of dividends and distributions: | |||||||||
| Class A | 6,404,305 | 4,714,720 | |||||||
| Class B | 19,983 | 21,607 | |||||||
| Class C | 1,761,167 | 1,323,516 | |||||||
| Institutional Class | 1,594,690 | 873,530 | |||||||
| 230,951,002 | 148,174,987 | ||||||||
72
| Year Ended | |||||||||
| 8/31/12 | 8/31/11 | ||||||||
| Capital Share Transactions (continued): | |||||||||
| Cost of shares redeemed: | |||||||||
| Class A | $ | (35,115,726 | ) | $ | (65,639,157 | ) | |||
| Class B | (121,264 | ) | (317,507 | ) | |||||
| Class C | (10,532,464 | ) | (11,190,907 | ) | |||||
| Institutional Class | (23,649,060 | ) | (24,642,477 | ) | |||||
| (69,418,514 | ) | (101,790,048 | ) | ||||||
| Increase in net assets derived from | |||||||||
| capital share transactions | 161,532,488 | 46,384,939 | |||||||
| Net Increase in Net Assets | 194,640,842 | 36,287,814 | |||||||
| Net Assets: | |||||||||
| Beginning of year | 230,258,054 | 193,970,240 | |||||||
| End of year | $ | 424,898,896 | $ | 230,258,054 | |||||
| Undistributed (distributions in excess of) | |||||||||
| net investment income | $ | 26,897 | $ | (4,103 | ) | ||||
See accompanying notes, which are an integral part of the financial statements.
73
Financial highlights
Delaware Tax-Free USA Fund Class A
Selected data for each share of the Fund outstanding throughout each period were as follows:
| Net asset value, beginning of period | |
| Income (loss) from investment operations: | |
| Net investment income | |
| Net realized and unrealized gain (loss) | |
| Total from investment operations | |
| Less dividends and distributions from: | |
| Net investment income | |
| Total dividends and distributions | |
| Net asset value, end of period | |
| Total return1 | |
| Ratios and supplemental data: | |
| Net assets, end of period (000 omitted) | |
| Ratio of expenses to average net assets | |
| Ratio of expenses to average net assets prior to fees waived | |
| Ratio of net investment income to average net assets | |
| Ratio of net investment income to average net assets prior to fees waived | |
| Portfolio turnover |
1 Total investment return is based on the change in net asset value of a share during the period and assumes reinvestment of dividends and distributions at net asset value and does not reflect the impact of a sales charge. Total investment return during all of the periods shown reflects waivers by the manager and/or distributor. Performance would have been lower had the waivers not been in effect. |
See accompanying notes, which are an integral part of the financial statements.
74
| Year Ended | ||||||||||||||||
| 8/31/12 | 8/31/11 | 8/31/10 | 8/31/09 | 8/31/08 | ||||||||||||
| $11.300 | $11.630 | $10.890 | $10.970 | $11.230 | ||||||||||||
| 0.484 | 0.503 | 0.522 | 0.479 | 0.462 | ||||||||||||
| 0.959 | (0.330 | ) | 0.740 | (0.081 | ) | (0.260 | ) | |||||||||
| 1.443 | 0.173 | 1.262 | 0.398 | 0.202 | ||||||||||||
| (0.483 | ) | (0.503 | ) | (0.522 | ) | (0.478 | ) | (0.462 | ) | |||||||
| (0.483 | ) | (0.503 | ) | (0.522 | ) | (0.478 | ) | (0.462 | ) | |||||||
| $12.260 | $11.300 | $11.630 | $10.890 | $10.970 | ||||||||||||
| 13.01% | 1.65% | 11.85% | 3.91% | 1.82% | ||||||||||||
| $604,415 | $589,175 | $581,931 | $536,420 | $510,822 | ||||||||||||
| 0.80% | 0.80% | 0.80% | 0.84% | 0.85% | ||||||||||||
| 0.93% | 0.94% | 0.95% | 0.97% | 0.94% | ||||||||||||
| 4.11% | 4.52% | 4.64% | 4.60% | 4.13% | ||||||||||||
| 3.98% | 4.38% | 4.49% | 4.47% | 4.04% | ||||||||||||
| 52% | 49% | 32% | 66% | 28% | ||||||||||||
75
Financial highlights
Delaware Tax-Free USA Fund Class B
Selected data for each share of the Fund outstanding throughout each period were as follows:
| Net asset value, beginning of period | |
| Income (loss) from investment operations: | |
| Net investment income | |
| Net realized and unrealized gain (loss) | |
| Total from investment operations | |
| Less dividends and distributions from: | |
| Net investment income | |
| Total dividends and distributions | |
| Net asset value, end of period | |
| Total return1 | |
| Ratios and supplemental data: | |
| Net assets, end of period (000 omitted) | |
| Ratio of expenses to average net assets | |
| Ratio of expenses to average net assets prior to fees waived | |
| Ratio of net investment income to average net assets | |
| Ratio of net investment income to average net assets prior to fees waived | |
| Portfolio turnover |
1 Total investment return is based on the change in net asset value of a share during the period and assumes reinvestment of dividends and distributions at net asset value and does not reflect the impact of a sales charge. Total investment return during all of the periods shown reflects a waiver by the manager. Performance would have been lower had the waiver not been in effect. |
See accompanying notes, which are an integral part of the financial statements.
76
| Year Ended | ||||||||||||||||
| 8/31/12 | 8/31/11 | 8/31/10 | 8/31/09 | 8/31/08 | ||||||||||||
| $11.290 | $11.620 | $10.880 | $10.960 | $11.230 | ||||||||||||
| 0.395 | 0.418 | 0.437 | 0.399 | 0.378 | ||||||||||||
| 0.969 | (0.330 | ) | 0.740 | (0.080 | ) | (0.270 | ) | |||||||||
| 1.364 | 0.088 | 1.177 | 0.319 | 0.108 | ||||||||||||
| (0.394 | ) | (0.418 | ) | (0.437 | ) | (0.399 | ) | (0.378 | ) | |||||||
| (0.394 | ) | (0.418 | ) | (0.437 | ) | (0.399 | ) | (0.378 | ) | |||||||
| $12.260 | $11.290 | $11.620 | $10.880 | $10.960 | ||||||||||||
| 12.27% | 0.89% | 11.01% | 3.13% | 0.96% | ||||||||||||
| $1,827 | $2,682 | $5,373 | $8,168 | $11,812 | ||||||||||||
| 1.56% | 1.56% | 1.56% | 1.60% | 1.61% | ||||||||||||
| 1.69% | 1.70% | 1.71% | 1.73% | 1.70% | ||||||||||||
| 3.35% | 3.76% | 3.88% | 3.84% | 3.37% | ||||||||||||
| 3.22% | 3.62% | 3.73% | 3.71% | 3.28% | ||||||||||||
| 52% | 49% | 32% | 66% | 28% | ||||||||||||
77
Financial highlights
Delaware Tax-Free USA Fund Class C
Selected data for each share of the Fund outstanding throughout each period were as follows:
| Net asset value, beginning of period |
| Income (loss) from investment operations: |
| Net investment income |
| Net realized and unrealized gain (loss) |
| Total from investment operations |
| Less dividends and distributions from: |
| Net investment income |
| Total dividends and distributions |
| Net asset value, end of period |
| Total return1 |
| Ratios and supplemental data: |
| Net assets, end of period (000 omitted) |
| Ratio of expenses to average net assets |
| Ratio of expenses to average net assets |
| prior to fees waived |
| Ratio of net investment income to average net assets |
| Ratio of net investment income to average net assets |
| prior to fees waived |
| Portfolio turnover |
1 Total investment return is based on the change in net asset value of a share during the period and assumes reinvestment of dividends and distributions at net asset value and does not reflect the impact of a sales charge. Total investment return during all of the periods shown reflects a waiver by the manager. Performance would have been lower had the waiver not been in effect.
See accompanying notes, which are an integral part of the financial statements.
78
| Year Ended | ||||||||||||||||
| 8/31/12 | 8/31/11 | 8/31/10 | 8/31/09 | 8/31/08 | ||||||||||||
| $11.300 | $11.630 | $10.890 | $10.970 | $11.230 | ||||||||||||
| 0.395 | 0.419 | 0.437 | 0.399 | 0.377 | ||||||||||||
| 0.969 | (0.330 | ) | 0.740 | (0.080 | ) | (0.260 | ) | |||||||||
| 1.364 | 0.089 | 1.177 | 0.319 | 0.117 | ||||||||||||
| (0.394 | ) | (0.419 | ) | (0.437 | ) | (0.399 | ) | (0.377 | ) | |||||||
| (0.394 | ) | (0.419 | ) | (0.437 | ) | (0.399 | ) | (0.377 | ) | |||||||
| $12.270 | $11.300 | $11.630 | $10.890 | $10.970 | ||||||||||||
| 12.26% | 0.88% | 11.00% | 3.13% | 0.96% | ||||||||||||
| $36,840 | $30,552 | $30,302 | $20,542 | $16,641 | ||||||||||||
| 1.56% | 1.56% | 1.56% | 1.60% | 1.61% | ||||||||||||
| 1.69% | 1.70% | 1.71% | 1.73% | 1.70% | ||||||||||||
| 3.35% | 3.76% | 3.88% | 3.84% | 3.37% | ||||||||||||
| 3.22% | 3.62% | 3.73% | 3.71% | 3.28% | ||||||||||||
| 52% | 49% | 32% | 66% | 28% | ||||||||||||
79
Financial highlights
Delaware Tax-Free USA Fund Institutional Class
Selected data for each share of the Fund outstanding throughout each period were as follows:
| Net asset value, beginning of period |
| Income (loss) from investment operations: |
| Net investment income |
| Net realized and unrealized gain (loss) |
| Total from investment operations |
| Less dividends and distributions from: |
| Net investment income |
| Total dividends and distributions |
| Net asset value, end of period |
| Total return2 |
| Ratios and supplemental data: |
| Net assets, end of period (000 omitted) |
| Ratio of expenses to average net assets |
| Ratio of expenses to average net assets |
| prior to fees waived |
| Ratio of net investment income to average net assets |
| Ratio of net investment income to average net assets |
| prior to fees waived |
| Portfolio turnover |
1 Date of commencement of operations; ratios have been annualized and total return has not been annualized. |
2 Total investment return is based on the change in net asset value of a share during the period and assumes reinvestment of dividends and distributions at net asset value. Total investment return during all of the periods shown reflects a waiver by the manager. Performance would have been lower had the waiver not been in effect. |
3 Portfolio turnover is representative of the Fund for the entire annual period. |
See accompanying notes, which are an integral part of the financial statements.
80
| 12/31/081 | |||||||||||||
| Year Ended | to | ||||||||||||
| 8/31/12 | 8/31/11 | 8/31/10 | 8/31/09 | ||||||||||
| $11.380 | $11.720 | $10.890 | $10.020 | ||||||||||
| 0.517 | 0.534 | 0.549 | 0.322 | ||||||||||
| 0.979 | (0.340 | ) | 0.830 | 0.870 | |||||||||
| 1.496 | 0.194 | 1.379 | 1.192 | ||||||||||
| (0.516 | ) | (0.534 | ) | (0.549 | ) | (0.322 | ) | ||||||
| (0.516 | ) | (0.534 | ) | (0.549 | ) | (0.322 | ) | ||||||
| $12.360 | $11.380 | $11.720 | $10.890 | ||||||||||
| 13.41% | 1.83% | 12.84% | 12.15% | ||||||||||
| $18,187 | $9,242 | $7,634 | $1 | ||||||||||
| 0.56% | 0.56% | 0.56% | 0.60% | ||||||||||
| 0.69% | 0.70% | 0.71% | 0.73% | ||||||||||
| 4.35% | 4.76% | 4.88% | 4.84% | ||||||||||
| 4.22% | 4.62% | 4.73% | 4.71% | ||||||||||
| 52% | 49% | 32% | 66% | 3 | |||||||||
81
Financial highlights
Delaware Tax-Free USA Intermediate Fund Class A
Selected data for each share of the Fund outstanding throughout each period were as follows:
| Net asset value, beginning of period |
| Income (loss) from investment operations: |
| Net investment income |
| Net realized and unrealized gain (loss) |
| Total from investment operations |
| Less dividends and distributions from: |
| Net investment income |
| Total dividends and distributions |
| Net asset value, end of period |
| Total return1 |
| Ratios and supplemental data: |
| Net assets, end of period (000 omitted) |
| Ratio of expenses to average net assets |
| Ratio of expenses to average net assets |
| prior to fees waived |
| Ratio of net investment income to average net assets |
| Ratio of net investment income to average net assets |
| prior to fees waived |
| Portfolio turnover |
1 Total investment return is based on the change in net asset value of a share during the period and assumes reinvestment of dividends and distributions at net asset value and does not reflect the impact of a sales charge. Total investment return during all of the periods shown reflects waivers by the manager and distributor. Performance would have been lower had the waivers not been in effect.
See accompanying notes, which are an integral part of the financial statements.
82
| Year Ended | ||||||||||||||||
| 8/31/12 | 8/31/11 | 8/31/10 | 8/31/09 | 8/31/08 | ||||||||||||
| $11.850 | $12.110 | $11.460 | $11.250 | $11.210 | ||||||||||||
| 0.362 | 0.381 | 0.423 | 0.388 | 0.383 | ||||||||||||
| 0.560 | (0.260 | ) | 0.650 | 0.210 | 0.041 | |||||||||||
| 0.922 | 0.121 | 1.073 | 0.598 | 0.424 | ||||||||||||
| (0.362 | ) | (0.381 | ) | (0.423 | ) | (0.388 | ) | (0.384 | ) | |||||||
| (0.362 | ) | (0.381 | ) | (0.423 | ) | (0.388 | ) | (0.384 | ) | |||||||
| $12.410 | $11.850 | $12.110 | $11.460 | $11.250 | ||||||||||||
| 7.89% | 1.10% | 9.53% | 5.49% | 3.83% | ||||||||||||
| $464,540 | $444,780 | $481,004 | $459,782 | $407,729 | ||||||||||||
| 0.75% | 0.75% | 0.75% | 0.75% | 0.75% | ||||||||||||
| 0.97% | 0.98% | 1.00% | 1.03% | 1.03% | ||||||||||||
| 2.98% | 3.27% | 3.59% | 3.51% | 3.38% | ||||||||||||
| 2.76% | 3.04% | 3.34% | 3.23% | 3.10% | ||||||||||||
| 39% | 43% | 27% | 47% | 28% | ||||||||||||
83
Financial highlights
Delaware Tax-Free USA Intermediate Fund Class B
Selected data for each share of the Fund outstanding throughout each period were as follows:
| Net asset value, beginning of period |
| Income (loss) from investment operations: |
| Net investment income |
| Net realized and unrealized gain (loss) |
| Total from investment operations |
| Less dividends and distributions from: |
| Net investment income |
| Total dividends and distributions |
| Net asset value, end of period |
| Total return1 |
| Ratios and supplemental data: |
| Net assets, end of period (000 omitted) |
| Ratio of expenses to average net assets |
| Ratio of expenses to average net assets |
| prior to fees waived |
| Ratio of net investment income to average net assets |
| Ratio of net investment income to average net assets |
| prior to fees waived |
| Portfolio turnover |
1 Total investment return is based on the change in net asset value of a share during the period and assumes reinvestment of dividends and distributions at net asset value and does not reflect the impact of a sales charge. Total investment return during all of the periods shown reflects a waiver by the manager. Performance would have been lower had the waiver not been in effect.
See accompanying notes, which are an integral part of the financial statements.
84
| Year Ended | ||||||||||||||||
| 8/31/12 | 8/31/11 | 8/31/10 | 8/31/09 | 8/31/08 | ||||||||||||
| $11.840 | $12.100 | $11.450 | $11.240 | $11.200 | ||||||||||||
| 0.259 | 0.282 | 0.324 | 0.294 | 0.287 | ||||||||||||
| 0.550 | (0.260 | ) | 0.650 | 0.210 | 0.041 | |||||||||||
| 0.809 | 0.022 | 0.974 | 0.504 | 0.328 | ||||||||||||
| (0.259 | ) | (0.282 | ) | (0.324 | ) | (0.294 | ) | (0.288 | ) | |||||||
| (0.259 | ) | (0.282 | ) | (0.324 | ) | (0.294 | ) | (0.288 | ) | |||||||
| $12.390 | $11.840 | $12.100 | $11.450 | $11.240 | ||||||||||||
| 6.90% | 0.25% | 8.62% | 4.61% | 2.95% | ||||||||||||
| $65 | $249 | $511 | $861 | $1,272 | ||||||||||||
| 1.60% | 1.60% | 1.60% | 1.60% | 1.60% | ||||||||||||
| 1.67% | 1.68% | 1.70% | 1.73% | 1.73% | ||||||||||||
| 2.13% | 2.42% | 2.74% | 2.66% | 2.53% | ||||||||||||
| 2.06% | 2.34% | 2.64% | 2.53% | 2.40% | ||||||||||||
| 39% | 43% | 27% | 47% | 28% | ||||||||||||
85
Financial highlights
Delaware Tax-Free USA Intermediate Fund Class C
Selected data for each share of the Fund outstanding throughout each period were as follows:
| Net asset value, beginning of period |
| Income (loss) from investment operations: |
| Net investment income |
| Net realized and unrealized gain (loss) |
| Total from investment operations |
| Less dividends and distributions from: |
| Net investment income |
| Total dividends and distributions |
| Net asset value, end of period |
| Total return1 |
| Ratios and supplemental data: |
| Net assets, end of period (000 omitted) |
| Ratio of expenses to average net assets |
| Ratio of expenses to average net assets |
| prior to fees waived |
| Ratio of net investment income to average net assets |
| Ratio of net investment income to average net assets |
| prior to fees waived |
| Portfolio turnover |
1 Total investment return is based on the change in net asset value of a share during the period and assumes reinvestment of dividends and distributions at net asset value and does not reflect the impact of a sales charge. Total investment return during all of the periods shown reflects a waiver by the manager. Performance would have been lower had the waiver not been in effect.
See accompanying notes, which are an integral part of the financial statements.
86
| Year Ended | ||||||||||||||||
| 8/31/12 | 8/31/11 | 8/31/10 | 8/31/09 | 8/31/08 | ||||||||||||
| $11.850 | $12.110 | $11.450 | $11.240 | $11.200 | ||||||||||||
| 0.258 | 0.282 | 0.323 | 0.294 | 0.287 | ||||||||||||
| 0.550 | (0.260 | ) | 0.660 | 0.210 | 0.041 | |||||||||||
| 0.808 | 0.022 | 0.983 | 0.504 | 0.328 | ||||||||||||
| (0.258 | ) | (0.282 | ) | (0.323 | ) | (0.294 | ) | (0.288 | ) | |||||||
| (0.258 | ) | (0.282 | ) | (0.323 | ) | (0.294 | ) | (0.288 | ) | |||||||
| $12.400 | $11.850 | $12.110 | $11.450 | $11.240 | ||||||||||||
| 6.89% | 0.25% | 8.70% | 4.60% | 2.95% | ||||||||||||
| $75,887 | $60,398 | $65,343 | $40,232 | $24,880 | ||||||||||||
| 1.60% | 1.60% | 1.60% | 1.60% | 1.60% | ||||||||||||
| 1.67% | 1.68% | 1.70% | 1.73% | 1.73% | ||||||||||||
| 2.13% | 2.42% | 2.74% | 2.66% | 2.53% | ||||||||||||
| 2.06% | 2.34% | 2.64% | 2.53% | 2.40% | ||||||||||||
| 39% | 43% | 27% | 47% | 28% | ||||||||||||
87
Financial highlights
Delaware Tax-Free USA Intermediate Fund Institutional Class
Selected data for each share of the Fund outstanding throughout each period were as follows:
| Net asset value, beginning of period |
| Income (loss) from investment operations: |
| Net investment income |
| Net realized and unrealized gain (loss) |
| Total from investment operations |
| Less dividends and distributions from: |
| Net investment income |
| Total dividends and distributions |
| Net asset value, end of period |
| Total return2 |
| Ratios and supplemental data: |
| Net assets, end of period (000 omitted) |
| Ratio of expenses to average net assets |
| Ratio of expenses to average net assets |
| prior to fees waived |
| Ratio of net investment income to average net assets |
| Ratio of net investment income to average net assets |
| prior to fees waived |
| Portfolio turnover |
See accompanying notes, which are an integral part of the financial statements.
88
| 12/31/081 | ||||||||||||||
| Year Ended | to | |||||||||||||
| 8/31/12 | 8/31/11 | 8/31/10 | 8/31/09 | |||||||||||
| $11.970 | $12.230 | $11.460 | $10.800 | |||||||||||
| 0.384 | 0.402 | 0.424 | 0.269 | |||||||||||
| 0.560 | (0.260 | ) | 0.770 | 0.660 | ||||||||||
| 0.944 | 0.142 | 1.194 | 0.929 | |||||||||||
| (0.384 | ) | (0.402 | ) | (0.424 | ) | (0.269 | ) | |||||||
| (0.384 | ) | (0.402 | ) | (0.424 | ) | (0.269 | ) | |||||||
| $12.530 | $11.970 | $12.230 | $11.460 | |||||||||||
| 8.00% | 1.28% | 10.62% | 8.68% | |||||||||||
| $333,033 | $281,256 | $192,026 | $1 | |||||||||||
| 0.60% | 0.60% | 0.60% | 0.60% | |||||||||||
| 0.67% | 0.68% | 0.70% | 0.73% | |||||||||||
| 3.13% | 3.42% | 3.74% | 3.65% | |||||||||||
| 3.06% | 3.34% | 3.64% | 3.52% | |||||||||||
| 39% | 43% | 27% | 47% | 3 | ||||||||||
89
Financial highlights
Delaware National High-Yield Municipal Bond Fund Class A
Selected data for each share of the Fund outstanding throughout each period were as follows:
| Net asset value, beginning of period |
| Income (loss) from investment operations: |
| Net investment income |
| Net realized and unrealized gain (loss) |
| Total from investment operations |
| Less dividends and distributions from: |
| Net investment income |
| Total dividends and distributions |
| Net asset value, end of period |
| Total return1 |
| Ratios and supplemental data: |
| Net assets, end of period (000 omitted) |
| Ratio of expenses to average net assets |
| Ratio of expenses to average net assets |
| prior to fees waived |
| Ratio of net investment income to average net assets |
| Ratio of net investment income to average net assets |
| prior to fees waived |
| Portfolio turnover |
See accompanying notes, which are an integral part of the financial statements.
90
| Year Ended | ||||||||||||||||
| 8/31/12 | 8/31/11 | 8/31/10 | 8/31/09 | 8/31/08 | ||||||||||||
| $9.620 | $10.090 | $8.920 | $9.510 | $10.030 | ||||||||||||
| 0.496 | 0.479 | 0.513 | 0.505 | 0.484 | ||||||||||||
| 1.127 | (0.474 | ) | 1.169 | (0.595 | ) | (0.520 | ) | |||||||||
| 1.623 | 0.005 | 1.682 | (0.090 | ) | (0.036 | ) | ||||||||||
| (0.493 | ) | (0.475 | ) | (0.512 | ) | (0.500 | ) | (0.484 | ) | |||||||
| (0.493 | ) | (0.475 | ) | (0.512 | ) | (0.500 | ) | (0.484 | ) | |||||||
| $10.750 | $9.620 | $10.090 | $8.920 | $9.510 | ||||||||||||
| 17.28% | 0.23% | 19.29% | (0.38% | ) | (0.37% | ) | ||||||||||
| $228,829 | $140,629 | $139,628 | $68,812 | $67,762 | ||||||||||||
| 0.85% | 0.85% | 0.85% | 0.90% | 0.90% | ||||||||||||
| 0.99% | 1.01% | 1.04% | 1.08% | 1.04% | ||||||||||||
| 4.83% | 5.03% | 5.24% | 6.06% | 4.94% | ||||||||||||
| 4.69% | 4.87% | 5.05% | 5.88% | 4.80% | ||||||||||||
| 34% | 57% | 37% | 67% | 24% | ||||||||||||
91
Financial highlights
Delaware National High-Yield Municipal Bond Fund Class B
Selected data for each share of the Fund outstanding throughout each period were as follows:
| Net asset value, beginning of period |
| Income (loss) from investment operations: |
| Net investment income |
| Net realized and unrealized gain (loss) |
| Total from investment operations |
| Less dividends and distributions from: |
| Net investment income |
| Total dividends and distributions |
| Net asset value, end of period |
| Total return1 |
| Ratios and supplemental data: |
| Net assets, end of period (000 omitted) |
| Ratio of expenses to average net assets |
| Ratio of expenses to average net assets |
| prior to fees waived |
| Ratio of net investment income to average net assets |
| Ratio of net investment income to average net assets |
| prior to fees waived |
| Portfolio turnover |
See accompanying notes, which are an integral part of the financial statements.
92
| Year Ended | ||||||||||||||||
| 8/31/12 | 8/31/11 | 8/31/10 | 8/31/09 | 8/31/08 | ||||||||||||
| $9.640 | $10.110 | $8.940 | $9.530 | $10.050 | ||||||||||||
| 0.421 | 0.408 | 0.442 | 0.440 | 0.410 | ||||||||||||
| 1.127 | (0.474 | ) | 1.169 | (0.592 | ) | (0.520 | ) | |||||||||
| 1.548 | (0.066 | ) | 1.611 | (0.152 | ) | (0.110 | ) | |||||||||
| (0.418 | ) | (0.404 | ) | (0.441 | ) | (0.438 | ) | (0.410 | ) | |||||||
| (0.418 | ) | (0.404 | ) | (0.441 | ) | (0.438 | ) | (0.410 | ) | |||||||
| $10.770 | $9.640 | $10.110 | $8.940 | $9.530 | ||||||||||||
| 16.39% | (0.51% | ) | 18.37% | (1.11% | ) | (1.12% | ) | |||||||||
| $775 | $768 | $1,118 | $1,448 | $3,135 | ||||||||||||
| 1.60% | 1.60% | 1.60% | 1.65% | 1.65% | ||||||||||||
| 1.74% | 1.76% | 1.79% | 1.83% | 1.79% | ||||||||||||
| 4.08% | 4.28% | 4.49% | 5.31% | 4.19% | ||||||||||||
| 3.94% | 4.12% | 4.30% | 5.13% | 4.05% | ||||||||||||
| 34% | 57% | 37% | 67% | 24% | ||||||||||||
93
Financial highlights
Delaware National High-Yield Municipal Bond Fund Class C
Selected data for each share of the Fund outstanding throughout each period were as follows:
| Net asset value, beginning of period |
| Income (loss) from investment operations: |
| Net investment income |
| Net realized and unrealized gain (loss) |
| Total from investment operations |
| Less dividends and distributions from: |
| Net investment income |
| Total dividends and distributions |
| Net asset value, end of period |
| Total return1 |
| Ratios and supplemental data: |
| Net assets, end of period (000 omitted) |
| Ratio of expenses to average net assets |
| Ratio of expenses to average net assets |
| prior to fees waived |
| Ratio of net investment income to average net assets |
| Ratio of net investment income to average net assets |
| prior to fees waived |
| Portfolio turnover |
See accompanying notes, which are an integral part of the financial statements.
94
| Year Ended | ||||||||||||||||
| 8/31/12 | 8/31/11 | 8/31/10 | 8/31/09 | 8/31/08 | ||||||||||||
| $9.660 | $10.130 | $8.960 | $9.550 | $10.070 | ||||||||||||
| 0.422 | 0.409 | 0.442 | 0.441 | 0.410 | ||||||||||||
| 1.137 | (0.474 | ) | 1.169 | (0.592 | ) | (0.520 | ) | |||||||||
| 1.559 | (0.065 | ) | 1.611 | (0.151 | ) | (0.110 | ) | |||||||||
| (0.419 | ) | (0.405 | ) | (0.441 | ) | (0.439 | ) | (0.410 | ) | |||||||
| (0.419 | ) | (0.405 | ) | (0.441 | ) | (0.439 | ) | (0.410 | ) | |||||||
| $10.800 | $9.660 | $10.130 | $8.960 | $9.550 | ||||||||||||
| 16.47% | (0.51% | ) | 18.33% | (1.11% | ) | (1.12% | ) | |||||||||
| $69,634 | $44,497 | $36,384 | $7,770 | $6,998 | ||||||||||||
| 1.60% | 1.60% | 1.60% | 1.65% | 1.65% | ||||||||||||
| 1.74% | 1.76% | 1.79% | 1.83% | 1.79% | ||||||||||||
| 4.08% | 4.28% | 4.49% | 5.31% | 4.19% | ||||||||||||
| 3.94% | 4.12% | 4.30% | 5.13% | 4.05% | ||||||||||||
| 34% | 57% | 37% | 67% | 24% | ||||||||||||
95
Financial highlights
Delaware National High-Yield Municipal Bond Fund Institutional Class
Selected data for each share of the Fund outstanding throughout each period were as follows:
| Net asset value, beginning of period |
| Income (loss) from investment operations: |
| Net investment income |
| Net realized and unrealized gain (loss) |
| Total from investment operations |
| Less dividends and distributions from: |
| Net investment income |
| Total dividends and distributions |
| Net asset value, end of period |
| Total return2 |
| Ratios and supplemental data: |
| Net assets, end of period (000 omitted) |
| Ratio of expenses to average net assets |
| Ratio of expenses to average net assets |
| prior to fees waived |
| Ratio of net investment income to average net assets |
| Ratio of net investment income to average net assets |
| prior to fees waived |
| Portfolio turnover |
See accompanying notes, which are an integral part of the financial statements.
96
| 12/31/081 | ||||||||||||||
| Year Ended | to | |||||||||||||
| 8/31/12 | 8/31/11 | 8/31/10 | 8/31/09 | |||||||||||
| $9.710 | $10.190 | $8.930 | $7.590 | |||||||||||
| 0.527 | 0.506 | 0.534 | 0.342 | |||||||||||
| 1.137 | (0.484 | ) | 1.259 | 1.338 | ||||||||||
| 1.664 | 0.022 | 1.793 | 1.680 | |||||||||||
| (0.524 | ) | (0.502 | ) | (0.533 | ) | (0.340 | ) | |||||||
| (0.524 | ) | (0.502 | ) | (0.533 | ) | (0.340 | ) | |||||||
| $10.850 | $9.710 | $10.190 | $8.930 | |||||||||||
| 17.57% | 0.41% | 20.55% | 22.55% | |||||||||||
| $125,661 | $44,364 | $16,840 | $1 | |||||||||||
| 0.60% | 0.60% | 0.60% | 0.65% | |||||||||||
| 0.74% | 0.76% | 0.79% | 0.85% | |||||||||||
| 5.08% | 5.28% | 5.49% | 6.41% | |||||||||||
| 4.94% | 5.12% | 5.30% | 6.21% | |||||||||||
| 34% | 57% | 37% | 67% | 3 | ||||||||||
97
| Notes to financial statements | |
| Delaware Investments® National Tax-Free Funds | August 31, 2012 |
Delaware Group® Tax-Free Fund is organized as a Delaware statutory trust and offers two series: Delaware Tax-Free USA Fund and Delaware Tax-Free USA Intermediate Fund. Voyageur Mutual Funds is organized as a Delaware statutory trust and offers five series: Delaware Tax-Free California Fund, Delaware Tax-Free Idaho Fund, Delaware Minnesota High-Yield Municipal Bond Fund, Delaware National High-Yield Municipal Bond Fund and Delaware Tax-Free New York Fund. Delaware Group Tax-Free Fund and Voyageur Mutual Funds are individually referred to as a Trust and collectively as the Trusts. These financial statements and the related notes pertain to Delaware Tax-Free USA Fund, Delaware Tax-Free USA Intermediate Fund and Delaware National High-Yield Municipal Bond Fund (each referred to as a Fund or, collectively, as the Funds). The above Trusts are open-end investment companies. The Funds are considered diversified under the Investment Company Act of 1940, as amended. The Funds offer Class A, Class B, Class C and Institutional Class shares. Class A shares are sold with a maximum front-end sales charge of 4.50% for Delaware Tax-Free USA Fund and Delaware National High-Yield Municipal Bond Fund, and 2.75% for Delaware Tax-Free USA Intermediate Fund. Class A share purchases of $1,000,000 or more will incur a contingent deferred sales charge (CDSC) of 1% if redeemed during the first year and 0.50% during the second year for Delaware Tax-Free USA Fund and Delaware National High-Yield Municipal Bond Fund; and of 0.75% for Delaware Tax-Free USA Intermediate Fund if redeemed within the first year, provided that Delaware Distributors, L.P. (DDLP) paid a financial advisor a commission on the purchase of those shares. Class B shares may be purchased only through dividend reinvestment and certain permitted exchanges. Prior to June 1, 2007, Class B shares of the Delaware Tax-Free USA Fund and Delaware National High-Yield Municipal Bond Fund were sold with a CDSC that declined from 4% to zero depending upon the period of time the shares were held. Class B shares of the Delaware Tax-Free USA Fund and Delaware National High-Yield Municipal Bond Fund will automatically convert to Class A shares on a quarterly basis approximately eight years after purchase. Class B shares of Delaware Tax-Free USA Intermediate Fund were sold with a CDSC that declines from 2% to zero depending upon the period of time the shares were held. Class B shares of the Tax-Free USA Intermediate Fund will automatically convert to Class A shares on a quarterly basis approximately five years after purchase. Class C shares are sold with a CDSC of 1%, if redeemed during the first twelve months. Institutional Class shares are not subject to a sales charge and are offered for sale exclusively to certain eligible investors.
The investment objective of the Delaware Tax-Free USA Fund and Delaware Tax-Free USA Intermediate Fund is to seek as high a level of current interest income exempt from federal income tax as is available from municipal obligations and as is consistent with prudent investment management and preservation of capital.
The investment objective of Delaware National Municipal Bond Fund is to seek a high level of current income exempt from federal income tax primarily through investment in medium- and lower-grade municipal obligations.
98
1. Significant Accounting Policies
The following accounting policies are in accordance with U.S. generally accepted accounting principles (U.S. GAAP) and are consistently followed by the Funds.
Security Valuation — Debt securities are valued based upon valuations provided by an independent pricing service or broker and reviewed by management. To the extent current market prices are not available, the pricing service may take into account developments related to the specific security, as well as transactions in comparable securities. Valuations for fixed income securities utilize matrix systems, which reflect such factors as security prices, yields, maturities, and ratings, and are supplemented by dealer and exchange quotations. Generally, other securities and assets for which market quotations are not readily available are valued at fair value as determined in good faith under the direction of each Fund’s Board of Trustees (Board). In determining whether market quotations are readily available or fair valuation will be used, various factors will be taken into consideration, such as market closures or suspension of trading in a security.
Federal Income Taxes — No provision for federal income taxes has been made as each Fund intends to continue to qualify for federal income tax purposes as a regulated investment company under Subchapter M of the Internal Revenue Code of 1986, as amended, and make the requisite distributions to shareholders. The Funds evaluate tax positions taken or expected to be taken in the course of preparing the Funds’ tax returns to determine whether the tax positions are “more-likely-than-not” of being sustained by the applicable tax authority. Tax positions not deemed to meet the more-likely-than-not threshold are recorded as a tax benefit or expense in the current year. Management has analyzed each Fund’s tax positions taken on federal income tax returns for all open tax years (August 31, 2009–August 31, 2012), and has concluded that no provision for federal income tax is required in each Fund’s financial statements.
Class Accounting — Investment income and common expenses are allocated to the various classes of each Fund on the basis of “settled shares” of each class in relation to the net assets of each Fund. Realized and unrealized gain (loss) on investments are allocated to the various classes of each Fund on the basis of daily net assets of each class. Distribution expenses relating to a specific class are charged directly to that class.
Use of Estimates — The preparation of financial statements in conformity with U.S. GAAP requires management to make estimates and assumptions that affect the fair value of investments, the reported amounts of assets and liabilities and disclosure of contingent assets and liabilities at the date of the financial statements and the reported amounts of revenues and expenses during the reporting period. Actual results could differ from those estimates and the differences could be material.
99
Notes to financial statements
Delaware Investments® National Tax-Free Funds
1. Significant Accounting Policies (continued)
Other — Expenses directly attributable to the Funds are charged directly to the Funds. Other expenses common to various funds within the Delaware Investments® Family of Funds are generally allocated amongst such funds on the basis of average net assets. Management fees and some other expenses are paid monthly. Security transactions are recorded on the date the securities are purchased or sold (trade date) for financial reporting purposes. Costs used in calculating realized gains and losses on the sale of investment securities are those of the specific securities sold. Interest income is recorded on the accrual basis. Discounts and premiums are amortized to interest income over the lives of the respective securities using the effective interest method. Each Fund declares dividends daily from net investment income and pays the dividends monthly and declares and pays distributions from net realized gain on investments, if any, annually. The Funds may distribute income dividends and capital gains more frequently, if necessary for tax purposes. Dividends and distributions, if any, are recorded on the ex-dividend date.
The Funds may receive earnings credits from their custodian when positive cash balances are maintained, which are used to offset custody fees. There were no earnings credits for the year ended August 31, 2012.
The Funds may receive earnings credits from their transfer agent when positive cash balances are maintained, which are used to offset transfer agent fees. The expense paid under this arrangement is included in dividend disbursing and transfer agent fees and expenses on the statements of operations with the corresponding expense offset shown as “expense paid indirectly.” For the year ended August 31, 2012, the Funds earned the following under this agreement:
| Delaware Tax-Free | Delaware Tax-Free | Delaware National High-Yield | |||
| USA Fund | USA Intermediate Fund | Municipal Bond Fund | |||
| $337 | $411 | $116 |
2. Investment Management, Administration Agreements and Other Transactions with Affiliates
In accordance with the terms of its respective investment management agreement, each Fund pays Delaware Management Company (DMC), a series of Delaware Management Business Trust and the investment manager, an annual fee, which is calculated based on each Fund’s average daily net assets as follows:
| Delaware Tax-Free | Delaware Tax-Free | Delaware National High-Yield | |||
| USA Fund | USA Intermediate Fund | Municipal Bond Fund | |||
| On the first $500 million | 0.550% | 0.500% | 0.550% | ||
| On the next $500 million | 0.500% | 0.475% | 0.500% | ||
| On the next $1.5 billion | 0.450% | 0.450% | 0.450% | ||
| In excess of $2.5 billion | 0.425% | 0.425% | 0.425% |
100
DMC has contractually agreed to waive that portion, if any, of its management fee and/or pay/reimburse each Fund to the extent necessary to ensure that total annual operating expenses (excluding any 12b-1 plan expenses, taxes, interest, inverse floater program expenses, short sale and dividend interest expenses, brokerage fees, certain insurance costs, and nonroutine expenses or costs including, but not limited to, those relating to reorganizations, litigation, conducting shareholder meetings, and liquidations), do not exceed 0.56%, 0.60%, and 0.60% of average daily net assets of Delaware Tax-Free USA Fund, Delaware Tax-Free USA Intermediate Fund, and Delaware National High Yield Municipal Bond Fund, respectively, through December 28, 2012. For purposes of these waivers and reimbursements, nonroutine expenses may also include such additional costs and expenses, as may be agreed upon from time to time by each Fund’s Board and DMC. These expense waivers and reimbursement applies only to expenses paid directly by the Funds and may only be terminated by agreement of DMC and the Funds.
Delaware Service Company, Inc. (DSC), an affiliate of DMC, provides fund accounting and financial administration oversight services to the Funds. For these services, each Fund pays DSC fees based on the aggregate daily net assets of the Delaware Investments® Family of Funds at the following annual rate: 0.0050% of the first $30 billion; 0.0045% of the next $10 billion; 0.0040% of the next $10 billion; and 0.0025% of aggregate average daily net assets in excess of $50 billion. The fees payable to DSC under the service agreement described above are allocated among all Funds in the Delaware Investments Family of Funds on a relative net asset value basis. For the year ended August 31, 2012, each Fund was charged for these services as follows:
| Delaware Tax-Free | Delaware Tax-Free | Delaware National High-Yield | |||
| USA Fund | USA Intermediate Fund | Municipal Bond Fund | |||
| $31,549 | $41,315 | $14,699 |
DSC also provides dividend disbursing and transfer agency services. Each Fund pays DSC a monthly asset-based fee for these services.
Pursuant to a distribution agreement and distribution plan, each Fund pays DDLP, the distributor and an affiliate of DMC, an annual distribution and service fee of 0.30% of the average daily net assets of the Class A shares for Delaware Tax-Free USA Intermediate Fund, 0.25% of the average daily net assets of the Class A shares for the Delaware Tax-Free USA Fund and Delaware National High-Yield Municipal Bond Fund and 1.00% of the average daily net assets of the Class B and C for all the Funds. The Board for Delaware Tax-Free USA Fund has adopted a formula for calculating 12b-1 plan fees for the Fund’s Class A shares that went into effect on June 1, 1992. The Fund’s Class A shares are currently subject to a blended 12b-1 fee equal to the sum of: (i) 0.10% of average daily net assets representing shares acquired prior to June 1, 1992, and (ii) 0.25% of average daily net assets representing shares acquired on or after June 1, 1992. All Class A shares currently bear 12b-1 fees at the same rate, the blended rate, currently 0.24% of average daily net assets, based on the formula described above. This method of calculating Class A 12b-1 fees may be discontinued at the sole discretion of the Board. Institutional Class shares pay no distribution and service expenses. DDLP has contracted to waive distribution and service fees through December 28, 2012 in order to prevent distribution and service fees of Class A shares of 0.15% of average daily net assets for the Delaware Tax-Free USA Intermediate Fund.
101
Notes to financial statements
Delaware Investments® National Tax-Free Funds
2. Investment Management, Administration Agreements and Other Transactions with Affiliates (continued)
At August 31, 2012, each Fund had liabilities payable to affiliates as follows:
| Delaware Tax-Free | Delaware Tax-Free | Delaware National High-Yield | |||||||||
| USA Fund | USA Intermediate Fund | Municipal Bond Fund | |||||||||
| Investment management fees | |||||||||||
| payable to DMC | $ | 260,952 | $ | 296,798 | $ | 135,721 | |||||
| Dividend disbursing, transfer | |||||||||||
| agent and fund accounting | |||||||||||
| oversight fees and other | |||||||||||
| expenses payable to DSC | 15,386 | 20,499 | 9,583 | ||||||||
| Distribution fees payable | |||||||||||
| to DDLP | 157,201 | 123,492 | 104,311 | ||||||||
| Other expenses payable to | |||||||||||
| DMC and affiliates* | 16,677 | 25,860 | 7,806 | ||||||||
*DMC, as part of its administrative services, pays operating expenses on behalf of each Fund and is reimbursed on a periodic basis. Expenses include items such as printing of shareholder reports, fees for audit, legal and tax services, registration fees and trustees’ fees.
As provided in the investment management agreement, each Fund bears the cost of certain legal and tax services, including internal legal and tax services provided to each Fund by DMC and/or its affiliates’ employees. For the year ended August 31, 2012, each Fund was charged for internal legal and tax services provided by DMC and/or its affiliates’ employees as follows:
| Delaware Tax-Free | Delaware Tax-Free | Delaware National High-Yield | |||
| USA Fund | USA Intermediate Fund | Municipal Bond Fund | |||
| $17,839 | $23,294 | $8,076 |
For the year ended August 31, 2012, DDLP earned commissions on sales of Class A shares for each Fund as follows:
| Delaware Tax-Free | Delaware Tax-Free | Delaware National High-Yield | |||
| USA Fund | USA Intermediate Fund | Municipal Bond Fund | |||
| $49,400 | $24,638 | $114,724 |
102
For the year ended August 31, 2012, DDLP received gross CDSC commissions on redemption of each Fund’s Class A, Class B and Class C shares, respectively. These commissions were entirely used to offset up-front commissions previously paid by DDLP to broker/dealer on sales of those shares. The amounts received were as follows:
| Delaware Tax-Free | Delaware Tax-Free | Delaware National High-Yield | ||||||||||||
| USA Fund | USA Intermediate Fund | Municipal Bond Fund | ||||||||||||
| Class A | $ | 1,502 | $ | 42 | $ | 3,886 | ||||||||
| Class B | 8 | — | 256 | |||||||||||
| Class C | 808 | 893 | 1,486 | |||||||||||
Trustees’ fees include expenses accrued by the Funds for each Trustee’s retainer and meeting fees. Certain officers of DMC, DSC and DDLP are officers and/or Trustees of the Trust. These officers and Trustees are paid no compensation by the Funds.
3. Investments
For the year ended August 31, 2012, the Fund made purchases and sales of investment securities other than short-term investments as follows:
| Delaware Tax-Free | Delaware Tax-Free | Delaware National High-Yield | |||||||||
| USA Fund | USA Intermediate Fund | Municipal Bond Fund | |||||||||
| Purchases | $329,023,926 | $388,387,914 | $252,395,179 | ||||||||
| Sales | 349,249,568 | 326,634,141 | 99,419,965 | ||||||||
At August 31, 2012, the cost of investments and unrealized appreciation (depreciation) for federal income tax purposes for each Fund were as follows:
| Delaware Tax-Free | Delaware Tax-Free | Delaware National High-Yield | ||||||||||||||||
| USA Fund | USA Intermediate Fund | Municipal Bond Fund | ||||||||||||||||
| Cost of investments | $ | 588,095,457 | $ | 798,404,262 | $ | 389,096,901 | ||||||||||||
| Aggregate unrealized | ||||||||||||||||||
| appreciation | $ | 70,742,152 | $ | 69,819,502 | $ | 33,883,725 | ||||||||||||
| Aggregate unrealized | ||||||||||||||||||
| depreciation | (1,897,242 | ) | (331,525 | ) | (1,565,313 | ) | ||||||||||||
| Net unrealized appreciation | $ | 68,844,910 | $ | 69,487,977 | $ | 32,318,412 | ||||||||||||
U.S. GAAP defines fair value as the price that the Funds would receive to sell an asset or pay to transfer a liability in an orderly transaction between market participants at the measurement date under current market conditions. A three level hierarchy for fair value measurements has been established based upon the transparency of inputs to the valuation of an asset or liability. Inputs may be observable or unobservable and refer broadly to the assumptions that market participants would use in pricing the asset or liability. Observable inputs reflect the assumptions market participants would use in pricing the asset or liability based on market data obtained from sources independent of the reporting entity. Unobservable inputs reflect the reporting entity’s own
103
Notes to financial statements
Delaware Investments® National Tax-Free Funds
3. Investments (continued)
assumptions about the assumptions that market participants would use in pricing the asset or liability developed based on the best information available under the circumstances. Each Fund’s investment in its entirety is assigned a level based upon the observability of the inputs which are significant to the overall valuation. The three level hierarchy of inputs is summarized below.
| Level 1 – | inputs are quoted prices in active markets for identical investments (e.g., equity securities, open-end investment companies, futures contracts, exchange-traded options contracts) |
| Level 2 – | other observable inputs (including, but not limited to: quoted prices for similar assets or liabilities in markets that are active, quoted prices for identical or similar assets or liabilities in markets that are not active, inputs other than quoted prices that are observable for the assets or liabilities (such as interest rates, yield curves, volatilities, prepayment speeds, loss severities, credit risks and default rates) or other market-corroborated inputs) (e.g., debt securities, government securities, swap contracts, foreign currency exchange contracts, foreign securities utilizing international fair value pricing, broker-quoted securities, fair valued securities) |
| Level 3 – | inputs are significant unobservable inputs (including the Funds’ own assumptions used to determine the fair value of investments) (e.g., broker-quoted securities, fair valued securities) |
Level 3 investments are valued using significant unobservable inputs, including related or comparable assets or liabilities, book values and other relevant information for the investment to determine the fair value of the investment. The Fund may also use an income-based valuation approach in which the anticipated future cash flows of the investment are discounted to calculate fair value. Discounts may also be applied due to the nature or duration of any restrictions on the disposition of the investments. Valuations may also be based upon current market prices of securities that are comparable in coupon, rating, maturity and industry. The derived value of a Level 3 investment may not represent the value which is received upon disposition and this could impact the results of operations.
The following table summarizes the valuation of each Fund’s investments by fair value hierarchy levels as of August 31, 2012:
| Delaware Tax-Free | Delaware Tax-Free | Delaware National High-Yield | |||||||||||||
| USA Fund | USA Intermediate Fund | Municipal Bond Fund | |||||||||||||
| Level 2 | Level 2 | Level 2 | |||||||||||||
| Municipal Bonds | $ | 655,690,367 | $ | 864,897,239 | $ | 412,415,313 | |||||||||
| Short-Term investments | 1,250,000 | 2,995,000 | 9,000,000 | ||||||||||||
| Total | $ | 656,940,367 | $ | 867,892,239 | $ | 421,415,313 | |||||||||
104
During the year ended August 31, 2012, there were no transfers between Level 1 investments, Level 2 investments or Level 3 investments that had a material impact to the Funds. Each Fund’s policy is to recognize transfers between levels at the beginning of the reporting period.
4. Dividend and Distribution Information
Income and long-term capital gain distributions are determined in accordance with federal income tax regulations, which may differ from U.S. GAAP. Additionally, distributions from net short-term gains on sales of investment securities are treated as ordinary income for federal income tax purposes. The tax character of dividends and distributions paid during the years ended August 31, 2012 and 2011 was as follows:
| Delaware Tax-Free | Delaware Tax-Free | Delaware National High-Yield | ||||||||||||
| USA Fund | USA Intermediate Fund | Municipal Bond Fund | ||||||||||||
| Year ended 8/31/12 | ||||||||||||||
| Tax-exempt income | $ | 25,997,997 | $ | 24,880,939 | $ | 14,095,674 | ||||||||
| Ordinary income | 52,761 | 11,932 | 48,201 | |||||||||||
| Total | $ | 26,050,758 | $ | 24,892,871 | $ | 14,143,875 | ||||||||
| Year ended 8/31/11 | ||||||||||||||
| Tax-exempt income | $ | 27,613,447 | $ | 24,114,589 | $ | 10,263,369 | ||||||||
| Ordinary income | 358,078 | 2,942 | 62,675 | |||||||||||
| Total | $ | 27,971,525 | $ | 24,117,531 | $ | 10,326,044 | ||||||||
5. Components of Net Assets on a Tax Basis
As of August 31, 2012, the components of net assets on a tax basis were as follows:
| Delaware Tax-Free | Delaware Tax-Free | Delaware National High-Yield | ||||||||||||
| USA Fund | USA Intermediate Fund | Municipal Bond Fund | ||||||||||||
| Shares of beneficial interest | $ | 589,080,107 | $ | 811,637,025 | $ | 396,208,945 | ||||||||
| Undistributed tax-exempt | ||||||||||||||
| income | 767,431 | 648,621 | 461,447 | |||||||||||
| Undistributed long-term | ||||||||||||||
| capital gains | 3,215,358 | — | — | |||||||||||
| Qualified late year | ||||||||||||||
| losses deferred | — | — | (39,718 | ) | ||||||||||
| Distributions payable | (638,536 | ) | (632,386 | ) | (434,550 | ) | ||||||||
| Capital loss carryforward | — | (7,615,926 | ) | (3,615,640 | ) | |||||||||
| Unrealized appreciation | 68,844,910 | 69,487,977 | 32,318,412 | |||||||||||
| Net assets | $ | 661,269,270 | $ | 873,525,311 | $ | 424,898,896 | ||||||||
The differences between book basis and tax basis components of net assets are primarily attributable to tax treatment of distributions payable, and tax-treatment of market discount and premium on debt instruments.
105
Notes to financial statements
Delaware Investments® National Tax-Free Funds
5. Components of Net Assets on a Tax Basis (continued)
Qualified late year losses represent losses realized on investment transactions from November 1, 2011 through August 31, 2012 that, in accordance with federal income tax regulations, each Fund has elected to defer and treat as having arisen in the following fiscal year.
For financial reporting purposes, capital accounts are adjusted to reflect the tax character of permanent book/tax differences. Reclassifications are primarily due to tax treatment of market discount and premium on debt instruments and expired capital loss carryforwards. Results of operations and net assets were not affected by these reclassifications. For the year ended August 31, 2012, Delaware National High-Yield Municipal Bond Fund recorded the following reclassifications:
| Accumulated net realized loss | $ | 1,037,034 | |
| Undistributed net investment income | (56,292 | ) | |
| Paid-in capital | (980,742 | ) |
For federal income tax purposes, capital loss carryforwards may be carried forward and applied against future capital gains. For the year ended August 31, 2012, $980,742 of capital loss carryforwards expired for Delaware National High-Yield Municipal Bond Fund. For the year ended August 31, 2012, Delaware Tax-Free USA Fund utilized $3,756,823 capital loss carryforwards.
Capital loss carryforwards remaining at August 31, 2012 will expire as follows:
| Delaware Tax-Free | Delaware National High-Yield | ||||||||||
| Year of Expiration | USA Intermediate Fund | Municipal Bond Fund | |||||||||
| 2015 | $ | — | $ | 355,701 | |||||||
| 2017 | 5,428,954 | 374,735 | |||||||||
| Total | $ | 5,428,954 | $ | 730,436 | |||||||
On December 22, 2010, the Regulated Investment Company Modernization Act of 2010 (Act) was enacted, which changed various technical rules governing the tax treatment of regulated investment companies. The changes are generally effective for taxable years beginning after the date of enactment. Under the Act, the Funds are permitted to carry forward capital losses incurred in taxable years beginning after the date of enactment for an unlimited period. However, any losses incurred during those future taxable years will be required to be utilized prior to the losses incurred in pre-enactment taxable years, which carry an expiration date. As a result of this ordering rule, pre-enactment capital loss carryforwards may be more likely to expire unused. Additionally, post-enactment capital loss carryforwards will retain their character as either short-term or long-term capital losses rather than being considered all short-term as permitted under previous regulation.
106
Losses incurred that will be carried forward under the Act are as follows:
| Loss Carryforward Character | |||||
| Short-term | Long-term | ||||
| Delaware Tax-Free USA Intermediate Fund | $ | 2,186,972 | $ | — | |
| Delaware National High-Yield Municipal Bond Fund | 1,201,136 | 1,684,068 | |||
6. Capital Shares
Transactions in capital shares were as follows:
| Delaware Tax-Free | Delaware Tax-Free | Delaware National High-Yield | ||||||||||||||||
| USA Fund | USA Intermediate Fund | Municipal Bond Fund | ||||||||||||||||
| Year Ended | Year Ended | Year Ended | ||||||||||||||||
| 8/31/12 | 8/31/11 | 8/31/12 | 8/31/11 | 8/31/12 | 8/31/11 | |||||||||||||
| Shares sold: | ||||||||||||||||||
| Class A | 2,104,528 | 12,484,657 | 9,140,856 | 12,048,279 | 9,508,392 | 7,142,758 | ||||||||||||
| Class B | 2,456 | 10,773 | 191 | 1,840 | 2,294 | 78 | ||||||||||||
| Class C | 585,541 | 611,323 | 1,755,047 | 1,214,750 | 2,707,511 | 2,060,169 | ||||||||||||
| Institutional Class | 1,099,549 | 812,097 | 9,890,039 | 14,735,456 | 9,184,149 | 5,438,319 | ||||||||||||
| Shares issued upon reinvestment of dividends and distributions: | ||||||||||||||||||
| Class A | 1,178,162 | 1,230,916 | 883,131 | 927,646 | 626,870 | 496,359 | ||||||||||||
| Class B | 4,091 | 6,978 | 170 | 399 | 1,959 | 2,268 | ||||||||||||
| Class C | 70,840 | 71,693 | 97,422 | 100,157 | 171,868 | 139,022 | ||||||||||||
| Institutional Class | 29,539 | 19,047 | 429,900 | 312,696 | 154,112 | 91,520 | ||||||||||||
| 5,074,706 | 15,247,484 | 22,196,756 | 29,341,223 | 22,357,155 | 15,370,493 | |||||||||||||
| Shares redeemed: | ||||||||||||||||||
| Class A | (6,149,790 | ) | (11,598,972 | ) | (10,105,267 | ) | (15,161,183 | ) | (3,469,808 | ) | (6,856,305 | ) | ||||||
| Class B | (94,985 | ) | (242,438 | ) | (16,124 | ) | (23,446 | ) | (11,969 | ) | (33,245 | ) | ||||||
| Class C | (356,850 | ) | (584,014 | ) | (830,827 | ) | (1,613,958 | ) | (1,035,620 | ) | (1,183,041 | ) | ||||||
| Institutional Class | (469,114 | ) | (670,596 | ) | (7,234,869 | ) | (7,248,874 | ) | (2,326,733 | ) | (2,613,360 | ) | ||||||
| (7,070,739 | ) | (13,096,020 | ) | (18,187,087 | ) | (24,047,461 | ) | (6,844,130 | ) | (10,685,951 | ) | |||||||
| Net increase (decrease) | (1,996,033 | ) | 2,151,464 | 4,009,669 | 5,293,762 | 15,513,025 | 4,684,542 | |||||||||||
107
Notes to financial statements
Delaware Investments® National Tax-Free Funds
6. Capital Shares (continued)
For the years ended August 31, 2012 and 2011, the following shares and values were converted from Class B to Class A shares. The respective amounts are included in Class B redemptions and Class A subscriptions in the tables above and the statements of changes in net assets.
| Year Ended | Year Ended | |||||||||||||
| 8/31/12 | 8/31/11 | |||||||||||||
| Class B | Class A | Class B | Class A | |||||||||||
| Shares | Shares | Value | Shares | Shares | Value | |||||||||
| Delaware Tax-Free | ||||||||||||||
| USA Fund | 43,994 | 44,077 | $ | 511,259 | 118,554 | 118,448 | $ | 1,326,828 | ||||||
| Delaware Tax-Free | ||||||||||||||
| USA Intermediate Fund | 5,885 | 5,877 | 71,118 | 6,359 | 6,353 | 73,094 | ||||||||
| Delaware National High-Yield | ||||||||||||||
| Municipal Bond Fund | 3,567 | 3,578 | 35,790 | 12,827 | 12,848 | 121,021 | ||||||||
7. Line of Credit
Each Fund, along with certain other funds in the Delaware Investments® Family of Funds (Participants), was a participant in a $100,000,000 revolving line of credit to be used for temporary or emergency purposes as an additional source of liquidity to fund redemptions of investor shares. Under the agreement, the Participants were charged an annual commitment fee, which was allocated across the Participants on the basis of each Participant’s allocation of the entire facility. The Participants were permitted to borrow up to a maximum of one third of their net assets under the agreement. The line of credit under the agreement expired on November 15, 2011.
On November 15, 2011, the Funds, along with the other Participants, entered into an amendment to the agreement for a $125,000,000 revolving line of credit. The agreement is to be used as described above and operates in substantially the same manner as the original agreement. The agreement expires on November 13, 2012. The Funds had no amounts outstanding as of August 31, 2012 or at any time during the year then ended.
8. Credit and Market Risk
The Funds concentrate their investments in securities issued by municipalities. The value of these investments may be adversely affected by new legislation within the states, regional or local economic conditions, and differing levels of supply and demand for municipal bonds. Many municipalities insure repayment for their obligations. Although bond insurance reduces the risk of loss due to default by an issuer, such bonds remain subject to the risk that value may fluctuate for other reasons and there is no assurance that the insurance company will meet its obligations. A real or perceived decline in creditworthiness of a bond insurer can have an adverse impact on the value of insured bonds held in the Funds. At August 31, 2012, 3.01% of Delaware Tax-Free USA Fund’s net assets, 6.39% of Delaware Tax-Free USA Intermediate Fund’s net assets, and 2.04% of Delaware National High-Yield Municipal Bond Fund’s net assets were insured by bond insurers. These securities have been identified in the statements of net assets.
108
As of August 31, 2012, Delaware Tax-Free USA Fund invested in municipal bonds issued by the states of California and New York which constituted approximately 12.93% and 22.20%, respectively, of the Fund’s portfolio. As of August 31, 2012, Delaware Tax-Free USA Intermediate Fund invested in municipal bonds issued by the states of California and New York which constituted approximately 10.99% and 14.11%, respectively, of the Fund’s portfolio. As of August 31, 2012, Delaware National High-Yield Municipal Bond Fund invested in municipal bonds issued by the states of California and New York, which constituted approximately 11.15% and 12.71%, respectively, of the Fund’s portfolio. These investments could make each Fund more sensitive to economic conditions in those states than other more geographically diversified national municipal income funds.
Each Fund may invest a portion of its assets in high yield fixed income securities, which are securities rated lower than BBB- by Standard & Poor’s (S&P) and Baa3 by Moody’s Investor Services, Inc. (Moody’s), or similarly rated by another nationally recognized statistical rating organization. Investments in these higher yielding securities are generally accompanied by a greater degree of credit risk than higher rated securities. Additionally, lower rated securities may be more susceptible to adverse economic and competitive industry conditions than investment grade securities.
The Funds may invest in advanced refunded bonds, escrow secured bonds or defeased bonds. Under current federal tax laws and regulations, state and local government borrowers are permitted to refinance outstanding bonds by issuing new bonds. The issuer refinances the outstanding debt to either reduce interest costs or to remove or alter restrictive covenants imposed by the bonds being refinanced. A refunding transaction where the municipal securities are being refunded within 90 days from the issuance of the refunding issue is known as a “current refunding”. “Advance refunded bonds” are bonds in which the refunded bond issue remains outstanding for more than 90 days following the issuance of the refunding issue. In an advance refunding, the issuer will use the proceeds of a new bond issue to purchase high grade interest bearing debt securities which are then deposited in an irrevocable escrow account held by an escrow agent to secure all future payments of principal and interest and bond premium of the advance refunded bond. Bonds are “escrowed to maturity” when the proceeds of the refunding issue are deposited in an escrow account for investment sufficient to pay all of the principal and interest on the original interest payment and maturity dates.
Bonds are considered “pre-refunded” when the refunding issue’s proceeds are escrowed only until a permitted call date or dates on the refunded issue with the refunded issue being redeemed at the time, including any required premium. Bonds become “defeased” when the rights and interests of the bondholders and of their lien on the pledged revenues or other security under the terms of the bond contract are substituted with an alternative source of revenues (the escrow securities) sufficient to meet payments of principal and interest to maturity or to the first call dates. Escrowed secured bonds will often receive a rating of AAA from Moody’s, S&P, and/or Fitch Ratings due to the strong credit quality of the escrow securities and the irrevocable nature of the escrow deposit agreement.
109
Notes to financial statements
Delaware Investments® National Tax-Free Funds
8. Credit and Market Risk (continued)
Each Fund may invest up to 15% of its net assets in illiquid securities, which may include securities with contractual restrictions on resale, securities exempt from registration under Rule 144A of the Securities Act of 1933, as amended, and other securities which may not be readily marketable. The relative illiquidity of these securities may impair each Fund from disposing of them in a timely manner and at a fair price when it is necessary or desirable to do so. While maintaining oversight, each Fund’s Board has delegated to DMC the day-to-day functions of determining whether individual securities are liquid for purposes of each Fund’s limitation on investments in illiquid securities. Securities eligible for resale pursuant to Rule 144A, which are determined to be liquid, are not subject to each Fund’s 15% limit on investments in illiquid securities. Rule 144A and illiquid securities have been identified on the statements of net assets.
9. Contractual Obligations
The Funds enter into contracts in the normal course of business that contain a variety of indemnifications. The Funds’ maximum exposure under these arrangements is unknown. However, the Funds have not had prior claims or losses pursuant to these contracts. Management has reviewed each Fund’s existing contracts and expects the risk of loss to be remote.
10. Subsequent Events
Management has determined that no material events or transactions occurred subsequent to August 31, 2012 that would require recognition or disclosure in the Funds’ financial statements.
110
Report of independent
registered public accounting firm
To the Board of Trustees of Delaware Group® Tax-Free Fund and Voyageur Mutual Funds and the Shareholders of Delaware Tax-Free USA Fund, Delaware Tax-Free USA Intermediate Fund and Delaware National High-Yield Municipal Bond Fund:
In our opinion, the accompanying statements of net assets and the related statements of operations and of changes in net assets and the financial highlights present fairly, in all material respects, the financial position of Delaware Tax-Free USA Fund and Delaware Tax-Free USA Intermediate Fund (constituting Delaware Group Tax-Free Fund) and Delaware National High-Yield Municipal Bond Fund (one of the series constituting Voyageur Mutual Funds) (hereafter collectively referred to as the “Funds”) at August 31, 2012, the results of each of their operations for the year then ended, the changes in each of their net assets for each of the two years in the period then ended and the financial highlights for each of the three years in the period then ended, in conformity with accounting principles generally accepted in the United States of America. These financial statements and financial highlights (hereafter referred to as “financial statements”) are the responsibility of the Funds’ management; our responsibility is to express an opinion on these financial statements based on our audits. We conducted our audits of these financial statements in accordance with the standards of the Public Company Accounting Oversight Board (United States). Those standards require that we plan and perform the audit to obtain reasonable assurance about whether the financial statements are free of material misstatement. An audit includes examining, on a test basis, evidence supporting the amounts and disclosures in the financial statements, assessing the accounting principles used and significant estimates made by management, and evaluating the overall financial statement presentation. We believe that our audits, which included confirmation of securities at August 31, 2012 by correspondence with the custodian and broker, provide a reasonable basis for our opinion. The financial highlights for each of the two years in the period ended August 31, 2009 were audited by other independent accountants whose report dated October 19, 2009 expressed an unqualified opinion on those statements.
PricewaterhouseCoopers LLP
Philadelphia, Pennsylvania
October 18, 2012
111
Other Fund information
(Unaudited)
Delaware Investments® National Tax-Free Funds
Board Consideration of Delaware National High-Yield Municipal Bond Fund, Delaware Tax-Free USA Fund and Delaware Tax-Free USA Intermediate Fund Investment Advisory Agreements
At a meeting held on August 21-23, 2012 (the “Annual Meeting”), the Board of Trustees (the “Board”), including a majority of disinterested or independent Trustees, approved the renewal of the Investment Advisory Agreements for each of the Delaware National High-Yield Municipal Bond Fund, Delaware Tax-Free USA Fund and Delaware Tax-Free USA Intermediate Fund (each, a “Fund” and together, the “Funds”). In making its decision, the Board considered information furnished at regular quarterly Board meetings, including reports detailing Fund performance, investment strategies and expenses, as well as information prepared specifically in connection with the renewal of the investment advisory and sub-advisory contracts. Information furnished specifically in connection with the renewal of the Investment Advisory Agreements with Delaware Management Company (“DMC”) included materials provided by DMC and its affiliates (“Delaware Investments”) concerning, among other things, the nature, extent and quality of services provided to the Funds, the costs of such services to the Funds, economies of scale and the financial condition and profitability of Delaware Investments. In addition, in connection with the Annual Meeting, reports were provided in May 2012 and included independent historical and comparative reports provided by Lipper, Inc., an independent statistical compilation organization (“Lipper”). The Lipper reports compared each Fund’s investment performance and expenses with those of other comparable mutual funds. The Independent Trustees reviewed and discussed the Lipper reports with independent legal counsel to the Independent Trustees. The Board requested and received information regarding DMC’s policy with respect to advisory fee levels and its breakpoint philosophy; the structure of portfolio manager compensation; the investment manager’s profitability; comparative client fee information; and any constraints or limitations on the availability of securities in certain investment styles, which had in the past year inhibited, or which were likely in the future to inhibit, DMC’s ability to invest fully in accordance with Fund policies.
In considering information relating to the approval of each Fund’s advisory agreement, the Independent Trustees received assistance and advice from and met separately with independent legal counsel to the Independent Trustees. Although the Board gave attention to all information furnished, the following discussion identifies, under separate headings, the primary factors taken into account by the Board during its contract renewal considerations.
Nature, Extent and Quality of Service. The Board considered the services provided by Delaware Investments to the Funds and their shareholders. In reviewing the nature, extent and quality of services, the Board considered reports furnished to it throughout the year, which covered matters such as the relative performance of the Funds, compliance of portfolio managers with the investment policies, strategies and restrictions for the Funds, compliance by DMC and Delaware Distributors, L.P. (together, “Management”) personnel with the Code of Ethics adopted throughout the Delaware Investments Family of Funds complex and adherence to fair value
112
pricing procedures as established by the Board. The Board was pleased with the current staffing of the Funds’ investment advisor and the emphasis placed on research in the investment process. The Board recognized DMC’s receipt of several industry awards, including being named best fund family for 2011 by Barron’s and best mixed asset small company by Lipper for the second year in a row. The Board gave favorable consideration to DMC’s efforts to control expenditures while maintaining service levels committed to fund matters. The Board noted that in July 2011 Management implemented measures to reduce overall costs and improve transfer agent and shareholder servicing functions through outsourcing. The Board noted the benefits provided to Fund shareholders through each shareholder’s ability to exchange an investment in one Delaware Investments fund for the same class of shares in another Delaware Investments fund without a sales charge, to reinvest Fund dividends into additional shares of the same Fund or into additional shares of other Delaware Investments funds and the privilege to combine holdings in other Delaware Investments funds to obtain a reduced sales charge. The Board was satisfied with the nature, extent and quality of the overall services provided by Delaware Investments.
Investment Performance. The Board placed significant emphasis on the investment performance of the Funds in view of the importance of investment performance to shareholders. Although the Board gave appropriate consideration to performance reports and discussions with portfolio managers at Investment Committee meetings throughout the year, the Board gave particular weight to the Lipper reports furnished for the Annual Meeting. The Lipper reports prepared for each Fund showed the investment performance of its Class A shares in comparison to a group of similar funds as selected by Lipper (the “Performance Universe”). A fund with the best performance ranked first, and a fund with the poorest performance ranked last. The highest/best performing 25% of funds in the Performance Universe make up the first quartile; the next 25%, the second quartile; the next 25%, the third quartile; and the poorest/worst performing 25% of funds in the Performance Universe make up the fourth quartile. Comparative annualized performance for each Fund was shown for the past one-, three-, five- and ten-year periods, as applicable, ended March 31, 2012. The Board’s objective is that each Fund’s performance for the periods considered be at or above the median of its Performance Universe. The following paragraphs summarize the performance results for the Funds and the Board’s view of such performance.
Delaware National High-Yield Municipal Bond Fund — The Performance Universe for the Fund consisted of the Fund and all retail and institutional high yield municipal debt funds as selected by Lipper. The Lipper report comparison showed that the Fund’s total return for the one-, three-, five- and ten-year periods was in the first quartile of its Performance Universe. The Board was satisfied with performance.
Delaware Tax-Free USA Fund — The Performance Universe for the Fund consisted of the Fund and all retail and institutional general municipal debt funds as selected by Lipper. The Lipper report comparison showed that the Fund’s total return for the one-, three- and five-year periods was in the second quartile of its Performance Universe. The report further showed that the Fund’s total return for the ten-year period was in the first quartile. The Board was satisfied with performance.
113
Other Fund information
(Unaudited)
Delaware Investments® National Tax-Free Funds
Board Consideration of Delaware National High-Yield Municipal Bond Fund, Delaware Tax-Free USA Fund and Delaware Tax-Free USA Intermediate Fund Investment Advisory Agreements (continued)
Delaware Tax-Free USA Intermediate Fund — The Performance Universe for the Fund consisted of the Fund and all retail and institutional intermediate municipal debt funds as selected by Lipper. The Lipper report comparison showed that the Fund’s total return for the one- and three-year periods was in the second quartile of its Performance Universe. The report further showed that the Fund’s total return for the five- and ten-year periods was in the third and first quartiles, respectively. The Board was satisfied with performance.
Comparative Expenses. The Board considered expense comparison data for the Delaware Investments Family of Funds. Management provided the Board with information on pricing levels and fee structures for each Fund as of its most recently completed fiscal year. The Board also focused on the comparative analysis of effective management fees and total expense ratios of each Fund versus effective management fees and expense ratios of a group of similar funds as selected by Lipper (the “Expense Group”). In reviewing comparative costs, each Fund’s contractual management fee and the actual management fee incurred by the Fund were compared with the contractual management fees (assuming all funds in the Expense Group were similar in size to the Fund) and actual management fees (as reported by each fund) within the Expense Group, taking into account any applicable breakpoints and fee waivers. Each Fund’s total expenses were also compared with those of its Expense Group. The Lipper total expenses, for comparative consistency, were shown by Lipper for Class A shares and comparative total expenses including 12b-1 and non 12b-1 service fees. The Board considered fees paid to Delaware Investments for non-management services. The Board’s objective is to limit each Fund’s total expense ratio to be competitive with that of the Expense Group. The following paragraphs summarize the expense results for the Funds and the Board’s view of such expenses.
Delaware National High-Yield Municipal Bond Fund — The expense comparisons for the Fund showed that its actual management fee and total expenses were in the quartile with the lowest expenses of its Expense Group. The Board was satisfied with the management fee and total expenses of the Fund in comparison to those of its Expense Group as shown in the Lipper report.
Delaware Tax-Free USA Fund — The expense comparisons for the Fund showed that its actual management fee was in the quartile with the lowest expenses of its Expense Group and its total expenses were in the quartile with the second lowest expenses of its Expense Group. The Board was satisfied with the management fee and total expenses of the Fund in comparison to those of its Expense Group as shown in the Lipper report.
Delaware Tax-Free USA Intermediate Fund — The expense comparisons for the Fund showed that its actual management fee and total expenses were in the quartile with the second lowest expenses of its Expense Group. The Board was satisfied with the management fee and total expenses of the Fund in comparison to those of its Expense Group as shown in the Lipper report.
114
Management Profitability. The Board considered the level of profits realized by Delaware Investments in connection with the operation of the Funds. In this respect, the Board reviewed the Investment Management Profitability Analysis that addressed the overall profitability of Delaware Investments’ business in providing management and other services to each of the individual funds and the Delaware Investments Family of Funds as a whole. Specific attention was given to the methodology followed in allocating costs for the purpose of determining profitability. Management stated that the level of profits of Delaware Investments, to a certain extent, reflects recent operational cost savings and efficiencies initiated by Delaware Investments. The Board considered Delaware Investments’ efforts to improve services provided to fund shareholders and to meet additional regulatory and compliance requirements resulting from recent industry-wide Securities and Exchange Commission initiatives. The Board also considered the extent to which Delaware Investments might derive ancillary benefits from fund operations, including the potential for procuring additional business as a result of the prestige and visibility associated with its role as service provider to the Delaware Investments Family of Funds and the benefits from allocation of fund brokerage to improve trading efficiencies. The Board found that the management fees were reasonable in light of the services rendered and the level of profitability of Delaware Investments.
Economies of Scale. The Trustees considered whether economies of scale are realized by Delaware Investments as each Fund’s assets increase and the extent to which any economies of scale are reflected in the level of management fees charged. The Trustees reviewed the standardized advisory fee pricing and structure, approved by the Board and shareholders, which includes breakpoints. Breakpoints in the advisory fee occur when the advisory fee rate is reduced on assets in excess of specified levels. Breakpoints result in a lower advisory fee than would otherwise be the case on all assets when the asset levels specified are exceeded. The Board noted that the fee under each Fund’s management contract fell within the standard structure. Although the Delaware National High-Yield Municipal Bond Fund has not reached a size at which it can take advantage of breakpoints, the Board recognized that the Fund’s fee was structured so that when the Fund grows, economies of scale may be shared. The Board also noted that the Delaware Tax-Free USA Fund’s and the Delaware Tax-Free USA Intermediate Fund’s assets exceeded the first breakpoint level. The Board believed that, given the extent to which economics of scale might be realized by the advisor and its affiliates, the schedule of fees under the Investment Advisory Agreements provide a sharing of benefits with the Funds and their shareholders.
115
Other Fund information
(Unaudited)
Delaware Investments® National Tax-Free Funds
Tax Information
The information set forth below is for each Fund’s fiscal year as required by federal laws. Shareholders, however, must report distributions on a calendar year basis for income tax purposes, which may include distributions for portions of two fiscal years of a fund. Accordingly, the information needed by shareholders for income tax purposes will be sent to them in January of each year. Please consult your tax advisor for proper treatment of this information. All designations are based on financial information available as of the date of this annual report and, accordingly are subject to change. For any and all items requiring designation, it is the intention of the Funds to designate the maximum amount permitted under the Internal Revenue Code and the regulations thereunder.
For the fiscal year ended August 31, 2012, each Fund designates distributions paid during the year as follows:
| (A) | (B) | |||||
| Ordinary Income | Tax-Exempt | Total | ||||
| Distributions | Distributions | Distributions | ||||
| (Tax Basis)* | (Tax Basis) | (Tax Basis) | ||||
| Delaware Tax-Free USA Fund | 0.20% | 99.80% | 100.00% | |||
| Delaware Tax-Free USA Intermediate Fund | 0.05% | 99.95% | 100.00% | |||
| Delaware National High-Yield Municipal Bond Fund | 0.34% | 99.66% | 100.00% |
(A) and (B) are based on a percentage of each Fund’s total distributions.
For the fiscal year ended August 31, 2012, certain interest income paid by the Funds, determined to be Qualified Interest Income may be subject to relief from U.S. withholding for foreign shareholders, as provided by the American Jobs Creation Act of 2004. For the fiscal year ended August 31, 2012, the Funds have designated maximum Qualified Interest Income distributions as follows:
| Delaware Tax-Free | Delaware National High-Yield | ||
| USA Fund | Municipal Bond Fund | ||
| 100% | 100% |
116
Board of trustees/directors and officers addendum
Delaware Investments® Family of Funds
A mutual fund is governed by a Board of Trustees/Directors (“Trustees”), which has oversight responsibility for the management of a fund’s business affairs. Trustees establish procedures and oversee and review the performance of the investment manager, the distributor, and others who perform services for the fund. The independent fund trustees, in particular, are advocates
| Name, Address, | Position(s) | Length of | ||
| and Birth Date | Held with Fund(s) | Time Served | ||
| Interested Trustees | ||||
| Patrick P. Coyne1 | Chairman, President, | Chairman and Trustee | ||
| 2005 Market Street | Chief Executive Officer, | since August 16, 2006 | ||
| Philadelphia, PA 19103 | and Trustee | |||
| April 1963 | President and | |||
| Chief Executive Officer | ||||
| since August 1, 2006 | ||||
1 Patrick P. Coyne is considered to be an “Interested Trustee” because he is an executive officer of the Fund’s(s’) investment advisor.
118
for shareholder interests. Each trustee has served in that capacity since he or she was elected to or appointed to the Board of Trustees, and will continue to serve until his or her retirement or the election of a new trustee in his or her place. The following is a list of the Trustees and Officers with certain background and related information.
| Number of Portfolios in | ||||
| Principal Occupation(s) | Fund Complex Overseen | Other Directorships | ||
| During Past 5 Years | by Trustee or Officer | Held by Trustee or Officer | ||
| Patrick P. Coyne has served in | 71 | Director and Audit | ||
| various executive capacities | Committee Member | |||
| at different times at | Kaydon Corp. | |||
| Delaware Investments.2 | ||||
| Board of Governors Member | ||||
| Investment Company | ||||
| Institute (ICI) | ||||
2 Delaware Investments is the marketing name for Delaware Management Holdings, Inc. and its subsidiaries, including the Fund’s(s’) investment advisor, principal underwriter, and its transfer agent.
119
Board of trustees/directors and officers addendum
Delaware Investments® Family of Funds
| Name, Address, | Position(s) | Length of | ||
| and Birth Date | Held with Fund(s) | Time Served | ||
| Independent Trustees | ||||
| Thomas L. Bennett | Trustee | Since March 2005 | ||
| 2005 Market Street | ||||
| Philadelphia, PA 19103 | ||||
| October 1947 | ||||
| John A. Fry | Trustee | Since January 2001 | ||
| 2005 Market Street | ||||
| Philadelphia, PA 19103 | ||||
| May 1960 | ||||
| Anthony D. Knerr | Trustee | Since April 1990 | ||
| 2005 Market Street | ||||
| Philadelphia, PA 19103 | ||||
| December 1938 | ||||
| Lucinda S. Landreth | Trustee | Since March 2005 | ||
| 2005 Market Street | ||||
| Philadelphia, PA 19103 | ||||
| June 1947 | ||||
120
| Number of Portfolios in | ||||
| Principal Occupation(s) | Fund Complex Overseen | Other Directorships | ||
| During Past 5 Years | by Trustee or Officer | Held by Trustee or Officer | ||
| Private Investor | 71 | Director | ||
| (March 2004–Present) | Bryn Mawr Bank Corp. (BMTC) | |||
| (2007–2011) | ||||
| President | 71 | Board of Governors Member — | ||
| Drexel University | NASDAQ OMX PHLX LLC | |||
| (August 2010–Present) | ||||
| Director and Audit | ||||
| President | Committee Member | |||
| Franklin & Marshall College | Community Health Systems | |||
| (July 2002–July 2010) | ||||
| Director — Ecore | ||||
| International | ||||
| (2009–2010) | ||||
| Director — Allied | ||||
| Barton Securities Holdings | ||||
| (2005–2008) | ||||
| Managing Director | 71 | None | ||
| Anthony Knerr & Associates | ||||
| (Strategic Consulting) | ||||
| (1990–Present) | ||||
| Private Investor | 71 | None | ||
| (2004–Present) | ||||
121
Board of trustees/directors and officers addendum
Delaware Investments® Family of Funds
| Name, Address, | Position(s) | Length of | ||
| and Birth Date | Held with Fund(s) | Time Served | ||
| Independent Trustees (continued) | ||||
| Frances A. Sevilla-Sacasa | Trustee | Since September 2011 | ||
| 2005 Market Street | ||||
| Philadelphia, PA 19103 | ||||
| January 1956 | ||||
122
| Number of Portfolios in | ||||
| Principal Occupation(s) | Fund Complex Overseen | Other Directorships | ||
| During Past 5 Years | by Trustee or Officer | Held by Trustee or Officer | ||
| Chief Executive Officer — | 71 | Trust Manager — Camden | ||
| Banco Itaú Europa | Property Trust | |||
| International | (since August 2011) | |||
| (since April 2012) | ||||
| Executive Advisor to Dean | ||||
| (August 2011–March 2012) | ||||
| and Interim Dean | ||||
| (January 2011–July 2011) — | ||||
| University of Miami School of | ||||
| Business Administration | ||||
| President — U.S. Trust, | ||||
| Bank of America Private | ||||
| Wealth Management | ||||
| (Private Banking) | ||||
| (July 2007–December 2008) | ||||
123
Board of trustees/directors and officers addendum
Delaware Investments® Family of Funds
| Name, Address, | Position(s) | Length of | ||
| and Birth Date | Held with Fund(s) | Time Served | ||
| Independent Trustees (continued) | ||||
| Janet L. Yeomans | Trustee | Since April 1999 | ||
| 2005 Market Street | ||||
| Philadelphia, PA 19103 | ||||
| July 1948 | ||||
| J. Richard Zecher | Trustee | Since March 2005 | ||
| 2005 Market Street | ||||
| Philadelphia, PA 19103 | ||||
| July 1940 | ||||
124
| Number of Portfolios in | ||||
| Principal Occupation(s) | Fund Complex Overseen | Other Directorships | ||
| During Past 5 Years | by Trustee or Officer | Held by Trustee or Officer | ||
| Vice President and Treasurer | 71 | Director, Audit | ||
| (January 2006–July 2012) | Committee Member and | |||
| Vice President — Mergers & Acquisitions | Investment Committee | |||
| (January 2003–January 2006), and | Member | |||
| Vice President and Treasurer | Okabena Company | |||
| (July 1995–January 2003) | ||||
| 3M Corporation | Chair — 3M | |||
| Investment Management | ||||
| Company | ||||
| (January 2005–July 2012) | ||||
| Founder | 71 | Director and Compensation | ||
| Investor Analytics | Committee Member | |||
| (Risk Management) | Investor Analytics | |||
| (May 1999–Present) | ||||
| Director | ||||
| Founder | Oxigene, Inc. | |||
| P/E Investments | (2003–2008) | |||
| (Hedge Fund) | ||||
| (September 1996–Present) | ||||
125
Board of trustees/directors and officers addendum
Delaware Investments® Family of Funds
| Name, Address, | Position(s) | Length of | ||
| and Birth Date | Held with Fund(s) | Time Served | ||
| Officers | ||||
| David F. Connor | Vice President, | Vice President since | ||
| 2005 Market Street | Deputy General | September 2000 | ||
| Philadelphia, PA 19103 | Counsel, and Secretary | and Secretary since | ||
| December 1963 | October 2005 | |||
| Daniel V. Geatens | Vice President | Treasurer | ||
| 2005 Market Street | and Treasurer | since October 2007 | ||
| Philadelphia, PA 19103 | ||||
| October 1972 | ||||
| David P. O’Connor | Executive Vice President, | Executive Vice President | ||
| 2005 Market Street | General Counsel | since February 2012; | ||
| Philadelphia, PA 19103 | and Chief Legal Officer | Senior Vice President | ||
| February 1966 | October 2005– | |||
| February 2012; | ||||
| General Counsel and | ||||
| Chief Legal Officer | ||||
| since October 2005 | ||||
| Richard Salus | Senior Vice President | Chief Financial Officer | ||
| 2005 Market Street | and Chief Financial Officer | since November 2006 | ||
| Philadelphia, PA 19103 | ||||
| October 1963 | ||||
The Statement of Additional Information for the Fund(s) includes additional information about the Trustees and Officers and is available, without charge, upon request by calling 800 523-1918.
126
| Number of Portfolios in | ||||
| Principal Occupation(s) | Fund Complex Overseen | Other Directorships | ||
| During Past 5 Years | by Trustee or Officer | Held by Trustee or Officer | ||
| David F. Connor has served as | 71 | None3 | ||
| Vice President and Deputy | ||||
| General Counsel of | ||||
| Delaware Investments | ||||
| since 2000. | ||||
| Daniel V. Geatens has served | 71 | None3 | ||
| in various capacities at | ||||
| different times at | ||||
| Delaware Investments. | ||||
| David P. O’Connor has served in | 71 | None3 | ||
| various executive and legal | ||||
| capacities at different times | ||||
| at Delaware Investments. | ||||
| Richard Salus has served in | 71 | None3 | ||
| various executive capacities | ||||
| at different times at | ||||
| Delaware Investments. | ||||
3 David F. Connor, Daniel V. Geatens, David P. O’Connor, and Richard Salus serve in similar capacities for the six portfolios of the Optimum Fund Trust, which have the same investment advisor, principal underwriter, and transfer agent as the registrant.
127
| Board of trustees | |||
Patrick P. Coyne Chairman, President, and Chief Executive Officer Delaware Investments® Family of Funds Philadelphia, PA Thomas L. Bennett | John A. Fry President Drexel University Philadelphia, PA Anthony D. Knerr | Lucinda S. Landreth Former Chief Investment Officer Assurant, Inc. Philadelphia, PA Frances A. | Janet L. Yeomans Former Vice President and Treasurer 3M Corporation St. Paul, MN J. Richard Zecher |
| Affiliated officers | |||
David F. Connor Vice President, Deputy General Counsel, and Secretary Delaware Investments Family of Funds Philadelphia, PA | Daniel V. Geatens Vice President and Treasurer Delaware Investments Family of Funds Philadelphia, PA | David P. O’Connor Executive Vice President, General Counsel, and Chief Legal Officer Delaware Investments Family of Funds Philadelphia, PA | Richard Salus Senior Vice President and Chief Financial Officer Delaware Investments Family of Funds Philadelphia, PA |
| This annual report is for the information of Delaware Tax-Free USA Fund, Delaware Tax-Free USA Intermediate Fund, and Delaware National High-Yield Municipal Bond Fund shareholders, but it may be used with prospective investors when preceded or accompanied by the Delaware Investments Fund fact sheet for the most recently completed calendar quarter. These documents are available at delawareinvestments.com. |
Delaware Investments is the marketing name of Delaware Management Holdings, Inc. and its subsidiaries. Each Fund files its complete schedule of portfolio holdings with the Securities and Exchange Commission (SEC) for the first and third quarters of each fiscal year on Form N-Q. Each Fund’s Forms N-Q, as well as a description of the policies and procedures that each Fund uses to determine how to vote proxies (if any) relating to portfolio securities are available without charge (i) upon request, by calling 800 523-1918; and (ii) on the SEC’s website at sec.gov. In addition, a description of the policies and procedures that each Fund uses to determine how to vote proxies (if any) relating to portfolio securities and each Fund’s Schedule of Investments are available without charge on the Funds’ website at delawareinvestments.com. Each Fund’s Forms N-Q may be reviewed and copied at the SEC’s Public Reference Room in Washington, D.C.; information on the operation of the Public Reference Room may be obtained by calling 800 SEC-0330. Information (if any) regarding how each Fund voted proxies relating to portfolio securities during the most recently disclosed 12-month period ended June 30 is available without charge (i) through the Funds’ website at delawareinvestments.com; and (ii) on the SEC’s website at sec.gov. |
128
Annual report Delaware Tax-Free Arizona Fund Delaware Tax-Free California Fund Delaware Tax-Free Colorado Fund Delaware Tax-Free Idaho Fund Delaware Tax-Free New York Fund August 31, 2012 Fixed income mutual funds |
Carefully consider the Funds’ investment objectives, risk factors, charges, and expenses before investing. This and other information can be found in the Funds’ prospectuses and, if available, their summary prospectuses, which may be obtained by visiting delawareinvestments.com or calling 800 523-1918. Investors should read the prospectus and, if available, the summary prospectus carefully before investing. |
You can obtain shareholder reports and prospectuses online instead of in the mail. Visit delawareinvestments.com/edelivery. |
Experience Delaware Investments
Delaware Investments is committed to the pursuit of consistently superior asset management and unparalleled client service. We believe in our investment processes, which seek to deliver consistent results, and in convenient services that help add value for our clients.
If you are interested in learning more about creating an investment plan, contact your financial advisor.
You can learn more about Delaware Investments or obtain a prospectus for Delaware Tax-Free Arizona Fund, Delaware Tax-Free California Fund, Delaware Tax-Free Colorado Fund, Delaware Tax-Free Idaho Fund, and Delaware Tax-Free New York Fund at delawareinvestments.com.
Manage your investments online
- 24-hour access to your account information
- Obtain share prices
- Check your account balance and recent transactions
- Request statements or literature
- Make purchases and redemptions
Delaware Management Holdings, Inc. and its subsidiaries (collectively known by the marketing name of Delaware Investments) are wholly owned subsidiaries of Macquarie Group Limited, a global provider of banking, financial, advisory, investment and funds management services.
Investments in Delaware Tax-Free Arizona Fund, Delaware Tax-Free California Fund, Delaware Tax-Free Colorado Fund, Delaware Tax-Free Idaho Fund, and Delaware Tax-Free New York Fund are not and will not be deposits with or liabilities of Macquarie Bank Limited ABN 46 008 583 542 and its holding companies, including their subsidiaries or related companies (Macquarie Group), and are subject to investment risk, including possible delays in repayment and loss of income and capital invested. No Macquarie Group company guarantees or will guarantee the performance of the Funds, the repayment of capital from the Funds, or any particular rate of return.
| Table of contents | ||
| Portfolio management review | 1 | |
| Performance summaries | 7 | |
| Disclosure of Fund expenses | 22 | |
| Security type/sector allocations | 25 | |
| Statements of net assets | 30 | |
| Statements of operations | 72 | |
| Statements of changes in net assets | 74 | |
| Financial highlights | 84 | |
| Notes to financial statements | 114 | |
| Report of independent registered | ||
| public accounting firm | 128 | |
| Other Fund information | 129 | |
| Board of trustees/directors and | ||
| officers addendum | 136 | |
| About the organization | 146 |
Unless otherwise noted, views expressed herein are current as of Aug. 31, 2012, and subject to change.
Funds are not FDIC insured and are not guaranteed. It is possible to lose the principal amount invested.
Mutual fund advisory services provided by Delaware Management Company, a series of Delaware Management Business Trust, which is a registered investment advisor. Delaware Investments, a member of Macquarie Group, refers to Delaware Management Holdings, Inc. and its subsidiaries, including the Funds’ distributor, Delaware Distributors, L.P. Macquarie Group refers to Macquarie Group Limited and its subsidiaries and affiliates worldwide.
© 2012 Delaware Management Holdings, Inc.
All third-party marks cited are the property of their respective owners.
| Portfolio management review | |
| Delaware Investments® state tax-free funds | September 11, 2012 |
| Performance preview (for the year ended August 31, 2012) | |||||
| Delaware Tax-Free Arizona Fund (Class A shares) | 1-year return | +10.15 | % | ||
| Barclays Municipal Bond Index (benchmark) | 1-year return | +8.78 | % | ||
| Lipper Arizona Municipal Debt Funds Average | 1-year return | +10.68 | % |
| Delaware Tax-Free California Fund (Class A shares) | 1-year return | +13.90 | % | ||
| Barclays Municipal Bond Index (benchmark) | 1-year return | +8.78 | % | ||
| Lipper California Municipal Debt Funds Average | 1-year return | +12.44 | % |
| Delaware Tax-Free Colorado Fund (Class A shares) | 1-year return | +11.23 | % | ||
| Barclays Municipal Bond Index (benchmark) | 1-year return | +8.78 | % | ||
| Lipper Colorado Municipal Debt Funds Average | 1-year return | +10.01 | % |
1
Portfolio management review
Delaware Investments® state tax-free funds
| Delaware Tax-Free Idaho Fund (Class A shares) | 1-year return | +8.21 | % | ||
| Barclays Municipal Bond Index (benchmark) | 1-year return | +8.78 | % | ||
| Lipper Other States Municipal Debt Funds Average | 1-year return | +9.03 | % |
| Delaware Tax-Free New York Fund (Class A shares) | 1-year return | +12.18 | % | ||
| Barclays Municipal Bond Index (benchmark) | 1-year return | +8.78 | % | ||
| Lipper New York Municipal Debt Funds Average | 1-year return | +10.06 | % |
Economic backdrop
As the Funds’ fiscal year got under way in September 2011, signs were mounting that the U.S. economy was gradually improving. While this situation was interpreted positively for economically sensitive asset classes, it was also expected to lead to higher interest rates — a negative situation for most types of bonds.
By the second half of the Funds’ fiscal year, however, it became clear that the economy’s momentum was stalling:
- U.S. gross domestic product (GDP) — a measure of the goods and services produced by the nation — grew at an annualized rate of just 2.0% in the first quarter of 2012, down from 4.1% in the previous three-month period. In the second quarter of 2012, the rate of GDP growth slowed further, to an estimated 1.7%.
- Job creation remained persistently sluggish, as the unemployment rate fluctuated within a historically high range of 8.1% to 8.3% between January and August 2012.
(Data: U.S. Commerce Department; U.S. Labor Department)
Although individual localities around the country continued to experience fiscal struggles, we did not view this as an indication of deeply rooted risk in the municipal bond market as a whole. Instead, we saw isolated cases of municipalities dealing with specific challenges unique to their circumstances (such as underfunded pension plans or weak revenue streams).
2
Outside the United States, elevated debt levels in several European countries — most notably Greece, Spain, and Italy — continued to foster the region’s economic volatility. European policy makers hoped to avoid the worst-case scenario of a breakup of the shared euro currency, which would likely result in a massive disruption to the global economy. As the Funds’ fiscal year progressed, it appeared that a tentative framework for resolution was in place, but financial markets remained highly sensitive to the uncertainty of a successful ending to this fiscal crisis.
Economic conditions within each state, briefly noted
Arizona’s diverse economy is slowly recovering from the global financial crisis of 2008-2009 that has shaken economies for the past several years. Weakness remains likely in the short term, due largely to the damaging effects of a protracted housing bubble. Other notable developments:
- July’s nonfarm employment reading of 2.39 million was up 2.4% from July 2011, higher than the nation’s 1.4% gain. Unemployment figures have begun to improve, with a July 2012 unemployment rate of 8.3% (compared to a rate of 9.4% one year earlier).
- State revenues totaled $9.8 billion for fiscal 2011, an 18% increase from the year before. This was mostly accounted for by sales taxes and income taxes. Through the first 11 months of fiscal 2012, revenues are coming in 0.8% higher than expected and 6% higher than fiscal 2011.
(Data: U.S. Labor Department; Moody’s Investors Service)
California enjoys a large, diverse, and wealthy economy that accounts for 13% of U.S. gross domestic product. It shares much of the economic unsteadiness that has been felt nationwide. While the state’s unemployment rate has improved somewhat (from 12% in July 2011 to 10.7% in July 2012), it remains well above the national rate.
The governor signed a $91.3 billion 2013 General Fund budget that closed a $15.7 billion budget gap through revenue increases and expenditure cuts. In total, the budget reduces expenditures by $8.1 billion. The majority of the spending cuts are focused on health and human services, education, and the court system. If temporary taxes (which will be put to a popular vote in November 2012) are not approved, an additional $5.95 billion in cuts will be triggered. These cuts would be effective January 1, 2013.
(Data: U.S. Labor Department; California State Controller monthly financial reports; Moody’s Investors Service)
Colorado maintains a diverse economy, with a variety of strengths in the broad service sector. Generally speaking, Colorado remains a wealthy state, with per-capita income equal to 105% of the national average. The state’s nonfarm employment reading for July 2012 came in at 2.3 million, up by 1.6% from July 2011. Total revenues for fiscal 2012 are estimated to increase by 7.8% over fiscal 2011. For fiscal 2013, the state’s budget of $7.4 billion represents a 5.8% increase over fiscal 2012.
(Data: U.S. Labor Department; Colorado Office of State Planning and Budgeting; Moody’s Investors Service)
3
Portfolio management review
Delaware Investments® state tax-free funds
In Idaho, July 2012 nonfarm employment came in at 619,000, up 1.3% from July 2011. Idaho’s economy continued to grow more diversified; however, it still has an above-average dependence on the natural resource sector.
Idaho’s governor signed a $2.7 billion 2013 General Fund budget in April 2012, representing a 6.8% increase over fiscal 2012. The budget includes $36 million in tax relief that reduces the top corporate and individual tax rates from 7.6% and 7.8%, respectively, to 7.4% each.
(Data: U.S. Labor Department; Idaho Division of Financial Management; www.sco.idaho.gov)
New York continued to exhibit a mature, broad-based, and wealthy economy that typically attracts a highly educated and global workforce. July 2012 readings for nonfarm employment came in at 8.84 million, up 1.3% from July 2011. Other notable circumstances:
- The state’s unemployment rate in July 2012 was 9.1%, higher than the national rate and above the state’s July 2011 rate of 8%.
- Revenues for the state’s 2012 fiscal year totaled $56.9 billion, 4.6% higher than fiscal 2011 but $314 million lower than projections.
- The state ended fiscal 2012 with a General Fund balance of $1.79 billion, an increase over fiscal 2011.
- Lawmakers signed off on a $132.6 billion budget that cuts spending by $135 million and includes no new taxes.
The budget closes what was once a $3.5 billion deficit, a process made easier when lawmakers in December approved a tax increase on joint earners earning at least $2 million annually.
(Data: U.S. Labor Department; New York State Division of the Budget; Moody’s Investors Service; New York State Comptroller)
Municipal bond market conditions
The Funds’ fiscal year coincided with a beneficial environment for many municipal bond investors. Amid the sluggish U.S. economic backdrop and potential fallout from the European debt situation, yields on U.S. Treasury debt stayed dramatically low. Investors therefore looked elsewhere for sources of competitive yield, and municipal bonds benefited from this attention.
Another factor helping to lift municipal bond prices was a favorable relationship between supply and demand. The relatively limited supply of tax-exempt bonds, paired with extremely strong demand from some investors, provided support for the asset class. Several factors fueled the demand side of the equation. First, there were heavy flows back into investors’ hands through bond redemptions. Second, new inflows into municipal bond mutual funds remained high, as did demand from institutional investors. Institutional investors don’t often purchase municipal securities and don’t traditionally drive the market, but in this case they likely saw certain municipal bonds offering unusually attractive values relative to comparable opportunities among taxable bonds.
Another factor underlying the demand for municipal securities was investors’ search for higher yield in a low interest rate environment. Accordingly, bonds that exhibited higher yields, including those with longer maturities and lower credit ratings, generally outperformed their
4
counterparts. In fact, the best-performing maturity range of the municipal bond market (as measured by the Barclays Municipal Bond Index) was 22 years and longer, which gained 14.52%, compared with an advance of just 0.89% for bonds with maturities of less than two years. Similarly, BBB-rated bonds were up 15.40% for the same time period, compared with a gain of just 6.07% for the AAA segment within that index.
Maintaining a consistent strategy
Across the Funds, we maintained a consistent management approach, emphasizing bottom-up security selection. We made investment decisions based on our research on individual bonds, instead of reacting to macroeconomic trends or trying to predict interest rate movements.
The Funds’ portfolios regularly emphasize A-rated and BBB-rated bonds and also maintain some allocation to bonds rated below investment grade. Simultaneously, they tend to underweight AAA-rated and AA-rated securities, as these higher-quality bonds generally offer fewer prospects to uncover hidden value.
Our comfort level with the Funds’ elevated weighting in relatively credit-sensitive securities stems from the thoroughness of our credit research process and our confidence in its ability to identify tax-exempt securities that offer a positive risk-versus-reward tradeoff.
The Funds entered the fiscal year well positioned in our view, given the income being generated by certain holdings acquired in a higher interest rate environment during 2009 and 2010. We did not make major changes to the Funds’ portfolio holdings during the fiscal year. The majority of activity focused on investing new cash that came into the Funds. We invested opportunistically, taking advantage of individual securities that we believed fit into each portfolio’s respective structure.
One noteworthy source of bond supply during the Funds’ fiscal year was Puerto Rico, and in late 2011 we added a number of Puerto Rican bonds that we believed were priced attractively. With a large amount of Puerto Rican issuance coming to market in a relatively short time period, we followed our rigorous research process in identifying what we believed to be meaningful additions to each Fund’s portfolio.
Notable sectors and securities
As mentioned earlier, bonds with longer maturity dates and relatively lower credit ratings generally performed better, a phenomenon reflected in breakdowns of market performance by maturity and by credit rating.
The outperformance of lower-rated bonds proved favorable for our style of investing. The strongest individual contributors to each of the Funds’ total-return results were notable for being representative of the trend in which long-dated, lower-credit-quality issues enjoyed a performance advantage.
The two strongest-performing individual contributors in Delaware Tax-Free Arizona Fund included healthcare bonds for the John C. Lincoln Hospital in Glendale, maturing in 2042 and rated BBB by Standard & Poor’s (S&P). Outperformers also included education bonds for Tucson Country Day School in Pima County, maturing in 2037 and rated BBB- by S&P. Among the Fund’s weakest contributors were AA-rated civic improvement bonds for a Phoenix light-rail transit project
5
Portfolio management review
Delaware Investments® state tax-free funds
and AAA-rated Arizona State Transportation Board highway revenue bonds. Both bonds struggled as their higher quality ratings made them less desirable to increasingly risk-tolerant investors. These securities contributed relatively weakly to the Fund’s overall return but nevertheless recorded positive gains.
Within Delaware Tax-Free California Fund, lower-rated, longer-dated securities once again provided the biggest support to Fund returns. The strongest contributors included nonrated Modesto County special tax bonds maturing in 2036 and Golden State tobacco securitization bonds maturing in 2047. To highlight the importance of maturity date on bond performance during the fiscal year, we note that the Fund’s positions in other Golden State tobacco securitization bonds, which were scheduled to mature in 2013, achieved very modest returns.
Within Delaware Tax-Free Colorado Fund, the strongest performers included Denver Health & Hospital Authority healthcare bonds, which were rated BBB by S&P and scheduled to mature in 2036. In addition, Denver Convention Center Hotel Authority revenue bonds, rated BBB- by S&P and maturing in 2035, made a significant contribution to performance. In contrast, notably weaker performers included two school district bonds, both of which carried near-term maturity dates that may have limited their attractiveness to many investors.
Within Delaware Tax-Free Idaho Fund, the strongest contributors included Virgin Islands Public Finance Authority revenue bonds (rated BBB by S&P and maturing in 2029), as well as nonrated developmental district bonds maturing in 2034. In both cases, relatively low ratings and long maturity dates helped performance. On the other hand, the Fund’s weakest-performing bonds included revenue bonds for Idaho State University (rated AA+ by S&P and maturing in 2020), and Bannock County school district bonds (rated Aaa by Moody’s Investors Service (Moody’s) and maturing in 2015). We believe both issues were held back by their high credit quality and near-term maturity dates.
Finally, the strongest-performing bonds within Delaware Tax-Free New York Fund included nonrated bonds issued by the East Rochester Housing Authority for Woodland Village (a continuing care retirement community), and industrial development bonds for Brighter Choice Charter School in Albany (rated BBB- by Fitch and maturing in 2037). Relatively weaker performers, meanwhile, included Battery Park City municipal lease bonds (with a 2014 call date and AAA rating by S&P) and Puerto Rico highway general obligation bonds (with a 2016 call date and Aaa rating by Moody’s). These securities appeared to be out of favor in the marketplace, given their high credit ratings and short maturity dates.
6
| Performance summaries | |
| Delaware Tax-Free Arizona Fund | August 31, 2012 |
The performance data quoted represent past performance; past performance does not guarantee future results. Investment return and principal value will fluctuate so your shares, when redeemed, may be worth more or less than their original cost. Please obtain the performance data current for the most recent month end by calling 800 523-1918 or visiting our website at delawareinvestments.com/performance. Current performance may be lower or higher than the performance data quoted.
| Fund performance1,2 | Average annual total returns through Aug. 31, 2012 | ||||||||||
| 1 year | 5 years | 10 years | |||||||||
| Class A (Est. April 1, 1991) | |||||||||||
| Excluding sales charge | +10.15 | % | +5.81 | % | +4.78 | % | |||||
| Including sales charge | +5.23 | % | +4.84 | % | +4.30 | % | |||||
| Class B (Est. March 10, 1995) | |||||||||||
| Excluding sales charge | +9.42 | % | +5.04 | % | +4.15 | % | |||||
| Including sales charge | +5.42 | % | +4.79 | % | +4.15 | % | |||||
| Class C (Est. May 26, 1994) | |||||||||||
| Excluding sales charge | +9.31 | % | +5.03 | % | +4.00 | % | |||||
| Including sales charge | +8.31 | % | +5.03 | % | +4.00 | % | |||||
1 Returns reflect the reinvestment of all distributions and are presented both with and without the applicable sales charges described below. Returns do not reflect the deduction of taxes the shareholder would pay on Fund distributions or redemptions of Fund shares.
Expense limitations were in effect for certain classes during some or all of the periods shown in the “Fund performance” chart. The current expenses for each class are listed on the “Fund expense ratios” table on page 8. Performance would have been lower had expense limitations not been in effect.
Class A shares are sold with a maximum front-end sales charge of 4.50%, and have an annual distribution and service fee of 0.25% of average daily net assets. Performance for Class A shares, excluding sales charges, assumes that no front-end sales charge applied.
Class B shares may be purchased only through dividend reinvestment and certain permitted exchanges as described in the prospectus. Please see the prospectus for additional information on Class B shares. Class B shares have a contingent deferred sales charge that declines from 4.00% to zero depending on the period of time the shares are held. They are also subject to an annual distribution and service fee of 1.00% of average daily net assets. Class B shares will automatically convert to Class A shares on a quarterly basis approximately eight years after purchase. Ten-year performance figures for Class B shares reflect conversion to Class A shares after approximately eight years.
Class C shares are sold with a contingent deferred sales charge of 1.00% if redeemed during the first 12 months. They are also subject to an annual distribution and service fee of 1.00% of average daily net assets.
7
Performance summaries
Delaware Tax-Free Arizona Fund
Performance for Class B and C shares, excluding sales charges, assumes either that contingent deferred sales charges did not apply or that the investment was not redeemed.
The “Fund performance” table and the “Performance of a $10,000 investment” graph do not reflect the deduction of taxes the shareholder would pay on Fund distributions or redemptions of Fund shares.
Fixed income securities and bond funds can lose value, and investors can lose principal, as interest rates rise. They also may be affected by economic conditions that hinder an issuer’s ability to make interest and principal payments on its debt.
The Fund may also be subject to prepayment risk, the risk that the principal of a fixed income security that is held by the Fund may be prepaid prior to maturity, potentially forcing the Fund to reinvest that money at a lower interest rate.
Funds that invest primarily in one state may be more susceptible to the economic, regulatory, and other factors of that state than funds that invest more broadly.
Substantially all dividend income derived from tax-free funds is exempt from federal income tax. Some income may be subject to the federal alternative minimum tax (AMT) that applies to certain investors. Capital gains, if any, are taxable.
Bond ratings are determined by a nationally recognized statistical rating organization.
2 The Fund’s expense ratios, as described in the most recent prospectus, are disclosed in the following “Fund expense ratios” table. Delaware Investments has agreed to reimburse certain expenses and/or waive certain fees in order to prevent total fund operating expenses (excluding certain fees and expenses) from exceeding 0.59% of the Fund’s average daily net assets from Dec. 29, 2011, through Dec. 28, 2012. Please see the most recent prospectus and any applicable supplement(s) for additional information on these fee waivers and/ or reimbursements.
| Fund expense ratios | Class A | Class B | Class C | |||
| Total annual operating expenses | 0.93% | 1.68% | 1.68% | |||
| (without fee waivers) | ||||||
| Net expenses | 0.84% | 1.59% | 1.59% | |||
| (including fee waivers, if any) | ||||||
| Type of waiver | Contractual | Contractual | Contractual |
8
Performance of a $10,000 investment1
Average annual total returns from Aug. 31, 2002, through Aug. 31, 2012

| For period beginning Aug. 31, 2002, through Aug. 31, 2012 | Starting value | Ending value | ||
| Barclays Municipal Bond Index | $10,000 | $16,596 | ||
| Delaware Tax-Free Arizona Fund — Class A shares | $9,550 | $15,239 | ||
1 The “Performance of a $10,000 investment” graph assumes $10,000 invested in Class A shares of the Fund on Aug. 31, 2002, and includes the effect of a 4.50% front-end sales charge and the reinvestment of all distributions. The graph does not reflect the deduction of taxes the shareholders would pay on Fund distributions or redemptions of Fund shares. Expense limitations were in effect for some or all of the periods shown. Performance would have been lower had expense limitations not been in effect. Current expenses are listed in the “Fund expense ratios” table on page 8. Please note additional details on pages 7 through 9.
The chart also assumes $10,000 invested in the Barclays Municipal Bond Index as of Aug. 31, 2002. The Barclays Municipal Bond Index measures the total return performance of the long-term, investment grade tax-exempt bond market.
Index performance returns do not reflect any management fees, transaction costs, or expenses. Indices are unmanaged and one cannot invest directly in an index. Past performance is not a guarantee of future results.
Performance of other Fund classes will vary due to different charges and expenses.
| Nasdaq symbols | CUSIPs | ||||||
| Class A | VAZIX | 928916204 | |||||
| Class B | DVABX | 928928639 | |||||
| Class C | DVACX | 928916501 | |||||
9
| Performance summaries | |
| Delaware Tax-Free California Fund | August 31, 2012 |
The performance data quoted represent past performance; past performance does not guarantee future results. Investment return and principal value will fluctuate so your shares, when redeemed, may be worth more or less than their original cost. Please obtain the performance data current for the most recent month end by calling 800 523-1918 or visiting our website at delawareinvestments.com/performance. Current performance may be lower or higher than the performance data quoted.
| Fund performance1,2 | Average annual total returns through Aug. 31, 2012 | ||||||
| 1 year | 5 years | 10 years | |||||
| Class A (Est. March 2, 1995) | |||||||
| Excluding sales charge | +13.90% | +6.56% | +5.48% | ||||
| Including sales charge | +8.73% | +5.58% | +5.00% | ||||
| Class B (Est. Aug. 23, 1995) | |||||||
| Excluding sales charge | +13.10% | +5.75% | +4.84% | ||||
| Including sales charge | +9.10% | +5.51% | +4.84% | ||||
| Class C (Est. April 9, 1996) | |||||||
| Excluding sales charge | +13.13% | +5.76% | +4.70% | ||||
| Including sales charge | +12.13% | +5.76% | +4.70% | ||||
1 Returns reflect the reinvestment of all distributions and are presented both with and without the applicable sales charges described below. Returns do not reflect the deduction of taxes the shareholder would pay on Fund distributions or redemptions of Fund shares.
Expense limitations were in effect for certain classes during some or all of the periods shown in the “Fund performance” chart. The current expenses for each class are listed on the “Fund expense ratios” table on page 11. Performance would have been lower had expense limitations not been in effect.
Class A shares are sold with a maximum front-end sales charge of 4.50%, and have an annual distribution and service fee of 0.25% of average daily net assets. Performance for Class A shares, excluding sales charges, assumes that no front-end sales charge applied.
Class B shares may be purchased only through dividend reinvestment and certain permitted exchanges as described in the prospectus. Please see the prospectus for additional information on Class B shares. Class B shares have a contingent deferred sales charge that declines from 4.00% to zero depending on the period of time the shares are held. They are also subject to an annual distribution and service fee of 1.00% of average daily net assets. Class B shares will automatically convert to Class A shares on a quarterly basis approximately eight years after purchase. Ten-year performance figures for Class B shares reflect conversion to Class A shares after approximately eight years.
Class C shares are sold with a contingent deferred sales charge of 1.00% if redeemed during the first 12 months. They are also subject to an annual distribution and service fee of 1.00% of average daily net assets.
10
Performance for Class B and C shares, excluding sales charges, assumes either that contingent deferred sales charges did not apply or that the investment was not redeemed.
The “Fund performance” table and the “Performance of a $10,000 investment” graph do not reflect the deduction of taxes the shareholder would pay on Fund distributions or redemptions of Fund shares.
Fixed income securities and bond funds can lose value, and investors can lose principal, as interest rates rise. They also may be affected by economic conditions that hinder an issuer’s ability to make interest and principal payments on its debt.
The Fund may also be subject to prepayment risk, the risk that the principal of a fixed income security that is held by the Fund may be prepaid prior to maturity, potentially forcing the Fund to reinvest that money at a lower interest rate.
Funds that invest primarily in one state may be more susceptible to the economic, regulatory, and other factors of that state than funds that invest more broadly.
Substantially all dividend income derived from tax-free funds is exempt from federal income tax. Some income may be subject to the federal alternative minimum tax (AMT) that applies to certain investors. Capital gains, if any, are taxable.
Bond ratings are determined by a nationally recognized statistical rating organization.
2 The Fund’s expense ratios, as described in the most recent prospectus, are disclosed in the following “Fund expense ratios” table. Delaware Investments has agreed to reimburse certain expenses and/or waive certain fees in order to prevent total fund operating expenses (excluding certain fees and expenses) from exceeding 0.57% of the Fund’s average daily net assets from Dec. 29, 2011, through Dec. 28, 2012. Please see the most recent prospectus and any applicable supplement(s) for additional information on these fee waivers and/ or reimbursements.
| Fund expense ratios | Class A | Class B | Class C | |||
| Total annual operating expenses | 0.98% | 1.73% | 1.73% | |||
| (without fee waivers) | ||||||
| Net expenses | 0.82% | 1.57% | 1.57% | |||
| (including fee waivers, if any) | ||||||
| Type of waiver | Contractual | Contractual | Contractual |
11
Performance summaries
Delaware Tax-Free California Fund
Performance of a $10,000 investment1
Average annual total returns from Aug. 31, 2002, through Aug. 31, 2012

| For period beginning Aug. 31, 2002, through Aug. 31, 2012 | Starting value | Ending value | ||
| Barclays Municipal Bond Index | $10,000 | $16,596 | ||
| Delaware Tax-Free California Fund — Class A shares | $9,550 | $16,282 | ||
1 The “Performance of a $10,000 investment” graph assumes $10,000 invested in Class A shares of the Fund on Aug. 31, 2002, and includes the effect of a 4.50% front-end sales charge and the reinvestment of all distributions. The graph does not reflect the deduction of taxes the shareholders would pay on Fund distributions or redemptions of Fund shares. Expense limitations were in effect for some or all of the periods shown. Performance would have been lower had expense limitations not been in effect. Current expenses are listed in the “Fund expense ratios” table on page 11. Please note additional details on pages 10 through 12.
The chart also assumes $10,000 invested in the Barclays Municipal Bond Index as of Aug. 31, 2002. The Barclays Municipal Bond Index measures the total return performance of the long-term, investment grade tax-exempt bond market.
Index performance returns do not reflect any management fees, transaction costs, or expenses. Indices are unmanaged and one cannot invest directly in an index. Past performance is not a guarantee of future results.
Performance of other Fund classes will vary due to different charges and expenses.
| Nasdaq symbols | CUSIPs | ||||||
| Class A | DVTAX | 928928829 | |||||
| Class B | DVTFX | 928928811 | |||||
| Class C | DVFTX | 928928795 | |||||
12
| Delaware Tax-Free Colorado Fund | August 31, 2012 |
The performance data quoted represent past performance; past performance does not guarantee future results. Investment return and principal value will fluctuate so your shares, when redeemed, may be worth more or less than their original cost. Please obtain the performance data current for the most recent month end by calling 800 523-1918 or visiting our website at delawareinvestments.com/performance. Current performance may be lower or higher than the performance data quoted.
| Fund performance1,2 | Average annual total returns through Aug. 31, 2012 | ||||||
| 1 year | 5 years | 10 years | |||||
| Class A (Est. April 23, 1987) | |||||||
| Excluding sales charge | +11.23% | +5.95% | +4.93% | ||||
| Including sales charge | +6.25% | +4.97% | +4.45% | ||||
| Class B (Est. March 22, 1995) | |||||||
| Excluding sales charge | +10.41% | +5.18% | +4.30% | ||||
| Including sales charge | +6.41% | +4.93% | +4.30% | ||||
| Class C (Est. May 6, 1994) | |||||||
| Excluding sales charge | +10.39% | +5.17% | +4.15% | ||||
| Including sales charge | +9.39% | +5.17% | +4.15% | ||||
1 Returns reflect the reinvestment of all distributions and are presented both with and without the applicable sales charges described below. Returns do not reflect the deduction of taxes the shareholder would pay on Fund distributions or redemptions of Fund shares.
Expense limitations were in effect for certain classes during some or all of the periods shown in the “Fund performance” chart. The current expenses for each class are listed on the “Fund expense ratios” table on page 14. Performance would have been lower had expense limitations not been in effect.
Class A shares are sold with a maximum front-end sales charge of 4.50%, and have an annual distribution and service fee of 0.25% of average daily net assets. Performance for Class A shares, excluding sales charges, assumes that no front-end sales charge applied.
Class B shares may be purchased only through dividend reinvestment and certain permitted exchanges as described in the prospectus. Please see the prospectus for additional information on Class B shares. Class B shares have a contingent deferred sales charge that declines from 4.00% to zero depending on the period of time the shares are held. They are also subject to an annual distribution and service fee of 1.00% of average daily net assets. Class B shares will automatically convert to Class A shares on a quarterly basis approximately eight years after purchase. Ten-year performance figures for Class B shares reflect conversion to Class A shares after approximately eight years.
Class C shares are sold with a contingent deferred sales charge of 1.00% if redeemed during the first 12 months. They are also subject to an annual distribution and service fee of 1.00% of average daily net assets.
13
Performance summaries
Delaware Tax-Free Colorado Fund
Performance for Class B and C shares, excluding sales charges, assumes either that contingent deferred sales charges did not apply or that the investment was not redeemed.
The “Fund performance” table and the “Performance of a $10,000 investment” graph do not reflect the deduction of taxes the shareholder would pay on Fund distributions or redemptions of Fund shares.
Fixed income securities and bond funds can lose value, and investors can lose principal, as interest rates rise. They also may be affected by economic conditions that hinder an issuer’s ability to make interest and principal payments on its debt.
The Fund may also be subject to prepayment risk, the risk that the principal of a fixed income security that is held by the Fund may be prepaid prior to maturity, potentially forcing the Fund to reinvest that money at a lower interest rate.
Funds that invest primarily in one state may be more susceptible to the economic, regulatory, and other factors of that state than funds that invest more broadly.
Substantially all dividend income derived from tax-free funds is exempt from federal income tax. Some income may be subject to the federal alternative minimum tax (AMT) that applies to certain investors. Capital gains, if any, are taxable.
Bond ratings are determined by a nationally recognized statistical rating organization.
2 The Fund’s expense ratios, as described in the most recent prospectus, are disclosed in the following “Fund expense ratios” table. Delaware Investments has agreed to reimburse certain expenses and/or waive certain fees in order to prevent total fund operating expenses (excluding certain fees and expenses) from exceeding 0.59% of the Fund’s average daily net assets from Dec. 29, 2011, through Dec. 28, 2012. Please see the most recent prospectus and any applicable supplement(s) for additional information on these fee waivers and/or reimbursements.
| Fund expense ratios | Class A | Class B | Class C | |||
| Total annual operating expenses | 0.95% | 1.70% | 1.70% | |||
| (without fee waivers) | ||||||
| Net expenses | 0.84% | 1.59% | 1.59% | |||
| (including fee waivers, if any) | ||||||
| Type of waiver | Contractual | Contractual | Contractual |
14
Performance of a $10,000 investment1
Average annual total returns from Aug. 31, 2002, through Aug. 31, 2012

| For period beginning Aug. 31, 2002, through Aug. 31, 2012 | Starting value | Ending value | ||
| Barclays Municipal Bond Index | $10,000 | $16,596 | ||
| Delaware Tax-Free Colorado Fund — Class A shares | $9,550 | $15,461 | ||
1 The “Performance of a $10,000 investment” graph assumes $10,000 invested in Class A shares of the Fund on Aug. 31, 2002, and includes the effect of a 4.50% front-end sales charge and the reinvestment of all distributions. The graph does not reflect the deduction of taxes the shareholders would pay on Fund distributions or redemptions of Fund shares. Expense limitations were in effect for some or all of the periods shown. Performance would have been lower had expense limitations not been in effect. Current expenses are listed in the “Fund expense ratios” table on page 14. Please note additional details on pages 13 through 15.
The chart also assumes $10,000 invested in the Barclays Municipal Bond Index as of Aug. 31, 2002. The Barclays Municipal Bond Index measures the total return performance of the long-term, investment grade tax-exempt bond market.
Index performance returns do not reflect any management fees, transaction costs, or expenses. Indices are unmanaged and one cannot invest directly in an index. Past performance is not a guarantee of future results.
Performance of other Fund classes will vary due to different charges and expenses.
| Nasdaq symbols | CUSIPs | ||||||
| Class A | VCTFX | 928920107 | |||||
| Class B | DVBTX | 928928787 | |||||
| Class C | DVCTX | 92907R101 | |||||
15
| Performance summaries | |
| Delaware Tax-Free Idaho Fund | August 31, 2012 |
The performance data quoted represent past performance; past performance does not guarantee future results. Investment return and principal value will fluctuate so your shares, when redeemed, may be worth more or less than their original cost. Please obtain the performance data current for the most recent month end by calling 800 523-1918 or visiting our website at delawareinvestments.com/performance. Current performance may be lower or higher than the performance data quoted.
| Fund performance1,2 | Average annual total returns through Aug. 31, 2012 | ||||||
| 1 year | 5 years | 10 years | |||||
| Class A (Est. Jan. 4, 1995) | |||||||
| Excluding sales charge | +8.21% | +5.60% | +4.82% | ||||
| Including sales charge | +3.36% | +4.64% | +4.34% | ||||
| Class B (Est. March 16, 1995) | |||||||
| Excluding sales charge | +7.41% | +4.83% | +4.19% | ||||
| Including sales charge | +3.41% | +4.58% | +4.19% | ||||
| Class C (Est. Jan. 11, 1995) | |||||||
| Excluding sales charge | +7.41% | +4.82% | +4.04% | ||||
| Including sales charge | +6.41% | +4.82% | +4.04% | ||||
1 Returns reflect the reinvestment of all distributions and are presented both with and without the applicable sales charges described below. Returns do not reflect the deduction of taxes the shareholder would pay on Fund distributions or redemptions of Fund shares.
Expense limitations were in effect for certain classes during some or all of the periods shown in the “Fund performance” chart. The current expenses for each class are listed on the “Fund expense ratios” table on page 17. Performance would have been lower had expense limitations not been in effect.
Class A shares are sold with a maximum front-end sales charge of 4.50%, and have an annual distribution and service fee of 0.25% of average daily net assets. Performance for Class A shares, excluding sales charges, assumes that no front-end sales charge applied.
Class B shares may be purchased only through dividend reinvestment and certain permitted exchanges as described in the prospectus. Please see the prospectus for additional information on Class B shares. Class B shares have a contingent deferred sales charge that declines from 4.00% to zero depending on the period of time the shares are held. They are also subject to an annual distribution and service fee of 1.00% of average daily net assets. Class B shares will automatically convert to Class A shares on a quarterly basis approximately eight years after purchase. Ten-year performance figures for Class B shares reflect conversion to Class A shares after approximately eight years.
Class C shares are sold with a contingent deferred sales charge of 1.00% if redeemed during the first 12 months. They are also subject to an annual distribution and service fee of 1.00% of average daily net assets.
16
Performance for Class B and C shares, excluding sales charges, assumes either that contingent deferred sales charges did not apply or that the investment was not redeemed.
The “Fund performance” table and the “Performance of a $10,000 investment” graph do not reflect the deduction of taxes the shareholder would pay on Fund distributions or redemptions of Fund shares.
Fixed income securities and bond funds can lose value, and investors can lose principal, as interest rates rise. They also may be affected by economic conditions that hinder an issuer’s ability to make interest and principal payments on its debt.
The Fund may also be subject to prepayment risk, the risk that the principal of a fixed income security that is held by the Fund may be prepaid prior to maturity, potentially forcing the Fund to reinvest that money at a lower interest rate.
Funds that invest primarily in one state may be more susceptible to the economic, regulatory, and other factors of that state than funds that invest more broadly.
Substantially all dividend income derived from tax-free funds is exempt from federal income tax. Some income may be subject to the federal alternative minimum tax (AMT) that applies to certain investors. Capital gains, if any, are taxable.
Bond ratings are determined by a nationally recognized statistical rating organization.
2 The Fund’s expense ratios, as described in the most recent prospectus, are disclosed in the following “Fund expense ratios” table. Delaware Investments has agreed to reimburse certain expenses and/or waive certain fees in order to prevent total fund operating expenses (excluding certain fees and expenses) from exceeding 0.63% of the Fund’s average daily net assets from Dec. 29, 2011, through Dec. 28, 2012. Please see the most recent prospectus and any applicable supplement(s) for additional information on these fee waivers and/or reimbursements.
| Fund expense ratios | Class A | Class B | Class C | |||
| Total annual operating expenses | 0.96% | 1.71% | 1.71% | |||
| (without fee waivers) | ||||||
| Net expenses | 0.88% | 1.63% | 1.63% | |||
| (including fee waivers, if any) | ||||||
| Type of waiver | Contractual | Contractual | Contractual |
17
Performance summaries
Delaware Tax-Free Idaho Fund
Performance of a $10,000 investment1
Average annual total returns from Aug. 31, 2002, through Aug. 31, 2012
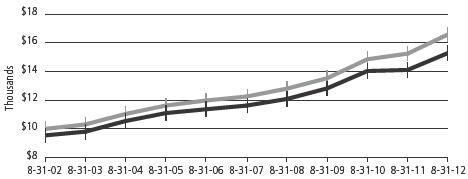
| For period beginning Aug. 31, 2002, through Aug. 31, 2012 | Starting value | Ending value | ||
| Barclays Municipal Bond Index | $10,000 | $16,596 | ||
| Delaware Tax-Free Idaho Fund — Class A shares | $9,550 | $15,295 | ||
1 The “Performance of a $10,000 investment” graph assumes $10,000 invested in Class A shares of the Fund on Aug. 31, 2002, and includes the effect of a 4.50% front-end sales charge and the reinvestment of all distributions. The graph does not reflect the deduction of taxes the shareholders would pay on Fund distributions or redemptions of Fund shares. Expense limitations were in effect for some or all of the periods shown. Performance would have been lower had expense limitations not been in effect. Current expenses are listed in the “Fund expense ratios” table on page 17. Please note additional details on pages 16 through 18.
The chart also assumes $10,000 invested in the Barclays Municipal Bond Index as of Aug. 31, 2002. The Barclays Municipal Bond Index measures the total return performance of the long-term, investment grade tax-exempt bond market.
Index performance returns do not reflect any management fees, transaction costs, or expenses. Indices are unmanaged and one cannot invest directly in an index. Past performance is not a guarantee of future results.
Performance of other Fund classes will vary due to different charges and expenses.
| Nasdaq symbols | CUSIPs | ||||||
| Class A | VIDAX | 928928704 | |||||
| Class B | DVTIX | 928928746 | |||||
| Class C | DVICX | 928928803 | |||||
18
| Delaware Tax-Free New York Fund | August 31, 2012 |
The performance data quoted represent past performance; past performance does not guarantee future results. Investment return and principal value will fluctuate so your shares, when redeemed, may be worth more or less than their original cost. Please obtain the performance data current for the most recent month end by calling 800 523-1918 or visiting our website at delawareinvestments.com/performance. Current performance may be lower or higher than the performance data quoted.
| Fund performance1,2 | Average annual total returns through Aug. 31, 2012 | ||||||
| 1 year | 5 years | 10 years | |||||
| Class A (Est. Nov. 6, 1987) | |||||||
| Excluding sales charge | +12.18% | +6.62% | +5.50% | ||||
| Including sales charge | +7.12% | +5.63% | +5.01% | ||||
| Class B (Est. Nov. 14, 1994) | |||||||
| Excluding sales charge | +11.36% | +5.83% | +4.86% | ||||
| Including sales charge | +7.36% | +5.59% | +4.86% | ||||
| Class C (Est. April 26, 1995) | |||||||
| Excluding sales charge | +11.26% | +5.81% | +4.72% | ||||
| Including sales charge | +10.26% | +5.81% | +4.72% | ||||
1 Returns reflect the reinvestment of all distributions and are presented both with and without the applicable sales charges described below. Returns do not reflect the deduction of taxes the shareholder would pay on Fund distributions or redemptions of Fund shares.
Expense limitations were in effect for certain classes during some or all of the periods shown in the “Fund performance” chart. The current expenses for each class are listed on the “Fund expense ratios” table on page 20. Performance would have been lower had expense limitations not been in effect.
Class A shares are sold with a maximum front-end sales charge of 4.50%, and have an annual distribution and service fee of 0.25% of average daily net assets. Performance for Class A shares, excluding sales charges, assumes that no front-end sales charge applied.
Class B shares may be purchased only through dividend reinvestment and certain permitted exchanges as described in the prospectus. Please see the prospectus for additional information on Class B shares. Class B shares have a contingent deferred sales charge that declines from 4.00% to zero depending on the period of time the shares are held. They are also subject to an annual distribution and service fee of 1.00% of average daily net assets. Class B shares will automatically convert to Class A shares on a quarterly basis approximately eight years after purchase. Ten-year performance figures for Class B shares reflect conversion to Class A shares after approximately eight years.
Class C shares are sold with a contingent deferred sales charge of 1.00% if redeemed during the first 12 months. They are also subject to an annual distribution and service fee of 1.00% of average daily net assets.
19
Performance summaries
Delaware Tax-Free New York Fund
Performance for Class B and C shares, excluding sales charges, assumes either that contingent deferred sales charges did not apply or that the investment was not redeemed.
The “Fund performance” table and the “Performance of a $10,000 investment” graph do not reflect the deduction of taxes the shareholder would pay on Fund distributions or redemptions of Fund shares.
Fixed income securities and bond funds can lose value, and investors can lose principal, as interest rates rise. They also may be affected by economic conditions that hinder an issuer’s ability to make interest and principal payments on its debt.
The Fund may also be subject to prepayment risk, the risk that the principal of a fixed income security that is held by the Fund may be prepaid prior to maturity, potentially forcing the Fund to reinvest that money at a lower interest rate.
Funds that invest primarily in one state may be more susceptible to the economic, regulatory, and other factors of that state than funds that invest more broadly.
Substantially all dividend income derived from tax-free funds is exempt from federal income tax. Some income may be subject to the federal alternative minimum tax (AMT) that applies to certain investors. Capital gains, if any, are taxable.
Bond ratings are determined by a nationally recognized statistical rating organization.
2 The Fund’s expense ratios, as described in the most recent prospectus, are disclosed in the following “Fund expense ratios” table. Delaware Investments has agreed to reimburse certain expenses and/or waive certain fees in order to prevent total fund operating expenses (excluding certain fees and expenses) from exceeding 0.55% of the Fund’s average daily net assets from Dec. 29, 2011, through Dec. 28, 2012. Please see the most recent prospectus and any applicable supplement(s) for additional information on these fee waivers and/or reimbursements.
| Fund expense ratios | Class A | Class B | Class C | |||
| Total annual operating expenses | 1.05% | 1.80% | 1.80% | |||
| (without fee waivers) | ||||||
| Net expenses | 0.80% | 1.55% | 1.55% | |||
| (including fee waivers, if any) | ||||||
| Type of waiver | Contractual | Contractual | Contractual |
20
Performance of a $10,000 investment1
Average annual total returns from Aug. 31, 2002, through Aug. 31, 2012

| For period beginning Aug. 31, 2002, through Aug. 31, 2012 | Starting value | Ending value | ||
| Barclays Municipal Bond Index | $10,000 | $16,596 | ||
| Delaware Tax-Free New York Fund — Class A shares | $9,550 | $16,311 | ||
1 The “Performance of a $10,000 investment” graph assumes $10,000 invested in Class A shares of the Fund on Aug. 31, 2002, and includes the effect of a 4.50% front-end sales charge and the reinvestment of all distributions. The graph does not reflect the deduction of taxes the shareholders would pay on Fund distributions or redemptions of Fund shares. Expense limitations were in effect for some or all of the periods shown. Performance would have been lower had expense limitations not been in effect. Current expenses are listed in the “Fund expense ratios” table on page 20. Please note additional details on pages 19 through 21.
The chart also assumes $10,000 invested in the Barclays Municipal Bond Index as of Aug. 31, 2002. The Barclays Municipal Bond Index measures the total return performance of the long-term, investment grade tax-exempt bond market.
Index performance returns do not reflect any management fees, transaction costs, or expenses. Indices are unmanaged and one cannot invest directly in an index. Past performance is not a guarantee of future results.
Performance of other Fund classes will vary due to different charges and expenses.
| Nasdaq symbols | CUSIPs | ||||||
| Class A | FTNYX | 928928274 | |||||
| Class B | DVTNX | 928928266 | |||||
| Class C | DVFNX | 928928258 | |||||
21
Disclosure of Fund expenses
For the six-month period from March 1, 2012 to August 31, 2012 (Unaudited)
As a shareholder of a Fund, you incur two types of costs: (1) transaction costs, including sales charges (loads) on purchase payments, reinvested dividends, or other distributions; redemption fees; and exchange fees; and (2) ongoing costs, including management fees; distribution and/or service (12b-1) fees; and other Fund expenses. These following examples are intended to help you understand your ongoing costs (in dollars) of investing in a Fund and to compare these costs with the ongoing costs of investing in other mutual funds.
The examples are based on an investment of $1,000 invested at the beginning of the period and held for the entire six-month period from March 1, 2012 to August 31, 2012.
Actual expenses
The first section of the tables shown, “Actual Fund return,” provides information about actual account values and actual expenses. You may use the information in this section of the table, together with the amount you invested, to estimate the expenses that you paid over the period. Simply divide your account value by $1,000 (for example, an $8,600 account value divided by $1,000 = 8.6), then multiply the result by the number in the first section under the heading entitled “Expenses Paid During Period” to estimate the expenses you paid on your account during this period.
Hypothetical example for comparison purposes
The second section of the tables shown, “Hypothetical 5% return,” provides information about hypothetical account values and hypothetical expenses based on the Funds’ actual expense ratios and an assumed rate of return of 5% per year before expenses, which is not the Funds’ actual return. The hypothetical account values and expenses may not be used to estimate the actual ending account balance or expenses you paid for the period. You may use this information to compare the ongoing costs of investing in each Fund and other funds. To do so, compare this 5% hypothetical example with the 5% hypothetical examples that appear in the shareholder reports of the other funds.
Please note that the expenses shown in the tables are meant to highlight your ongoing costs only and do not reflect any transactional costs, such as sales charges (loads), redemption fees, or exchange fees. Therefore, the second section of each table is useful in comparing ongoing costs only, and will not help you determine the relative total costs of owning different funds. In addition, if these transactional costs were included, your costs would have been higher. The Funds’ expenses shown in the tables reflect fee waivers in effect. The expenses shown in each table assume reinvestment of all dividends and distributions.
22
Delaware Tax-Free Arizona Fund
Expense analysis of an investment of $1,000
| Beginning | Ending | Expenses | ||||||||||||||||||
| Account Value | Account Value | Annualized | Paid During Period | |||||||||||||||||
| 3/1/12 | 8/31/12 | Expense Ratio | 3/1/12 to 8/31/12* | |||||||||||||||||
| Actual Fund return | ||||||||||||||||||||
| Class A | $ | 1,000.00 | $ | 1,037.10 | 0.84 | % | $ | 4.30 | ||||||||||||
| Class B | 1,000.00 | 1,034.10 | 1.59 | % | 8.13 | |||||||||||||||
| Class C | 1,000.00 | 1,033.10 | 1.59 | % | 8.13 | |||||||||||||||
| Hypothetical 5% return (5% return before expenses) | ||||||||||||||||||||
| Class A | $ | 1,000.00 | $ | 1,020.91 | 0.84 | % | $ | 4.27 | ||||||||||||
| Class B | 1,000.00 | 1,017.14 | 1.59 | % | 8.06 | |||||||||||||||
| Class C | 1,000.00 | 1,017.14 | 1.59 | % | 8.06 | |||||||||||||||
Delaware Tax-Free California Fund
Expense analysis of an investment of $1,000
| Beginning | Ending | Expenses | ||||||||||||||||||
| Account Value | Account Value | Annualized | Paid During Period | |||||||||||||||||
| 3/1/12 | 8/31/12 | Expense Ratio | 3/1/12 to 8/31/12* | |||||||||||||||||
| Actual Fund return | ||||||||||||||||||||
| Class A | $ | 1,000.00 | $ | 1,050.30 | 0.82 | % | $ | 4.23 | ||||||||||||
| Class B | 1,000.00 | 1,047.10 | 1.57 | % | 8.08 | |||||||||||||||
| Class C | 1,000.00 | 1,047.20 | 1.57 | % | 8.08 | |||||||||||||||
| Hypothetical 5% return (5% return before expenses) | ||||||||||||||||||||
| Class A | $ | 1,000.00 | $ | 1,021.01 | 0.82 | % | $ | 4.17 | ||||||||||||
| Class B | 1,000.00 | 1,017.24 | 1.57 | % | 7.96 | |||||||||||||||
| Class C | 1,000.00 | 1,017.24 | 1.57 | % | 7.96 | |||||||||||||||
Delaware Tax-Free Colorado Fund
Expense analysis of an investment of $1,000
| Beginning | Ending | Expenses | ||||||||||||||||||
| Account Value | Account Value | Annualized | Paid During Period | |||||||||||||||||
| 3/1/12 | 8/31/12 | Expense Ratio | 3/1/12 to 8/31/12* | |||||||||||||||||
| Actual Fund return | ||||||||||||||||||||
| Class A | $ | 1,000.00 | $ | 1,033.30 | 0.84 | % | $ | 4.29 | ||||||||||||
| Class B | 1,000.00 | 1,029.50 | 1.59 | % | 8.11 | |||||||||||||||
| Class C | 1,000.00 | 1,028.50 | 1.59 | % | 8.11 | |||||||||||||||
| Hypothetical 5% return (5% return before expenses) | ||||||||||||||||||||
| Class A | $ | 1,000.00 | $ | 1,020.91 | 0.84 | % | $ | 4.27 | ||||||||||||
| Class B | 1,000.00 | 1,017.14 | 1.59 | % | 8.06 | |||||||||||||||
| Class C | 1,000.00 | 1,017.14 | 1.59 | % | 8.06 | |||||||||||||||
23
Disclosure of Fund expenses
Delaware Tax-Free Idaho Fund
Expense analysis of an investment of $1,000
| Beginning | Ending | Expenses | ||||||||||||||||||
| Account Value | Account Value | Annualized | Paid During Period | |||||||||||||||||
| 3/1/12 | 8/31/12 | Expense Ratio | 3/1/12 to 8/31/12* | |||||||||||||||||
| Actual Fund return | ||||||||||||||||||||
| Class A | $ | 1,000.00 | $ | 1,027.60 | 0.88 | % | $ | 4.49 | ||||||||||||
| Class B | 1,000.00 | 1,024.60 | 1.63 | % | 8.30 | |||||||||||||||
| Class C | 1,000.00 | 1,023.80 | 1.63 | % | 8.29 | |||||||||||||||
| Hypothetical 5% return (5% return before expenses) | ||||||||||||||||||||
| Class A | $ | 1,000.00 | $ | 1,020.71 | 0.88 | % | $ | 4.47 | ||||||||||||
| Class B | 1,000.00 | 1,016.94 | 1.63 | % | 8.26 | |||||||||||||||
| Class C | 1,000.00 | 1,016.94 | 1.63 | % | 8.26 | |||||||||||||||
Delaware Tax-Free New York Fund
Expense analysis of an investment of $1,000
| Beginning | Ending | Expenses | ||||||||||||||||||
| Account Value | Account Value | Annualized | Paid During Period | |||||||||||||||||
| 3/1/12 | 8/31/12 | Expense Ratio | 3/1/12 to 8/31/12* | |||||||||||||||||
| Actual Fund return | ||||||||||||||||||||
| Class A | $ | 1,000.00 | $ | 1,044.60 | 0.80 | % | $ | 4.11 | ||||||||||||
| Class B | 1,000.00 | 1,040.70 | 1.55 | % | 7.95 | |||||||||||||||
| Class C | 1,000.00 | 1,039.80 | 1.55 | % | 7.95 | |||||||||||||||
| Hypothetical 5% return (5% return before expenses) | ||||||||||||||||||||
| Class A | $ | 1,000.00 | $ | 1,021.11 | 0.80 | % | $ | 4.06 | ||||||||||||
| Class B | 1,000.00 | 1,017.34 | 1.55 | % | 7.86 | |||||||||||||||
| Class C | 1,000.00 | 1,017.34 | 1.55 | % | 7.86 | |||||||||||||||
*“Expenses Paid During Period” are equal to the relevant Fund’s annualized expense ratio, multiplied by the average account value over the period, multiplied by 184/366 (to reflect the one-half year period).
24
| Security type/sector allocations | |
| Delaware Tax-Free Arizona Fund | As of August 31, 2012 (Unaudited) |
Sector designations may be different than the sector designations presented in other Fund materials.
| Security type/sector | Percentage of net assets | |
| Municipal Bonds | 100.64 | % |
| Corporate Revenue Bonds | 12.95 | % |
| Education Revenue Bonds | 15.09 | % |
| Electric Revenue Bonds | 7.28 | % |
| Healthcare Revenue Bonds | 18.96 | % |
| Lease Revenue Bonds | 12.39 | % |
| Local General Obligation Bonds | 3.43 | % |
| Pre-Refunded Bond | 0.00 | % |
| Special Tax Revenue Bonds | 20.27 | % |
| State & Territory General Obligation Bonds | 2.59 | % |
| Transportation Revenue Bonds | 6.07 | % |
| Water & Sewer Revenue Bonds | 1.61 | % |
| Total Value of Securities | 100.64 | % |
| Liabilities Net of Receivables and Other Assets | (0.64 | %) |
| Total Net Assets | 100.00 | % |
25
| Security type/sector allocations | |
| Delaware Tax-Free California Fund | As of August 31, 2012 (Unaudited) |
Sector designations may be different than the sector designations presented in other Fund materials.
| Security type/sector | Percentage of net assets | ||
| Municipal Bonds | 98.35 | % | |
| Corporate Revenue Bonds | 7.75 | % | |
| Education Revenue Bonds | 7.78 | % | |
| Electric Revenue Bonds | 4.92 | % | |
| Healthcare Revenue Bonds | 18.56 | % | |
| Housing Revenue Bonds | 3.50 | % | |
| Lease Revenue Bonds | 5.80 | % | |
| Local General Obligation Bonds | 7.37 | % | |
| Pre-Refunded Bonds | 3.10 | % | |
| Resource Recovery Revenue Bond | 0.95 | % | |
| Special Tax Revenue Bonds | 15.36 | % | |
| State & Territory General Obligation Bonds | 11.81 | % | |
| Transportation Revenue Bonds | 6.46 | % | |
| Water & Sewer Revenue Bonds | 4.99 | % | |
| Short-Term Investment | 0.85 | % | |
| Total Value of Securities | 99.20 | % | |
| Receivables and Other Assets Net of Liabilities | 0.80 | % | |
| Total Net Assets | 100.00 | % | |
26
| Delaware Tax-Free Colorado Fund | As of August 31, 2012 (Unaudited) |
Sector designations may be different than the sector designations presented in other Fund materials.
| Security type/sector | Percentage of net assets | ||
| Municipal Bonds | 99.84 | % | |
| Corporate Revenue Bond | 1.26 | % | |
| Education Revenue Bonds | 6.19 | % | |
| Electric Revenue Bonds | 6.53 | % | |
| Healthcare Revenue Bonds | 28.77 | % | |
| Housing Revenue Bonds | 2.74 | % | |
| Lease Revenue Bonds | 3.89 | % | |
| Local General Obligation Bonds | 12.90 | % | |
| Pre-Refunded Bonds | 8.19 | % | |
| Special Tax Revenue Bonds | 15.90 | % | |
| State & Territory General Obligation Bonds | 5.01 | % | |
| Transportation Revenue Bonds | 7.88 | % | |
| Water & Sewer Revenue Bonds | 0.58 | % | |
| Short-Term Investments | 0.28 | % | |
| Total Value of Securities | 100.12 | % | |
| Liabilities Net of Receivables and Other Assets | (0.12 | %) | |
| Total Net Assets | 100.00 | % | |
27
| Security type/sector allocations | |
| Delaware Tax-Free Idaho Fund | As of August 31, 2012 (Unaudited) |
Sector designations may be different than the sector designations presented in other Fund materials.
| Security type/sector | Percentage of net assets | ||
| Municipal Bonds | 98.07 | % | |
| Corporate Revenue Bonds | 5.93 | % | |
| Education Revenue Bonds | 8.39 | % | |
| Electric Revenue Bonds | 4.89 | % | |
| Healthcare Revenue Bonds | 7.95 | % | |
| Housing Revenue Bonds | 2.87 | % | |
| Lease Revenue Bonds | 2.66 | % | |
| Local General Obligation Bonds | 21.58 | % | |
| Pre-Refunded Bonds | 8.88 | % | |
| Special Tax Revenue Bonds | 22.74 | % | |
| State & Territory General Obligation Bonds | 3.43 | % | |
| Transportation Revenue Bonds | 6.69 | % | |
| Water & Sewer Revenue Bonds | 2.06 | % | |
| Short-Term Investments | 1.04 | % | |
| Total Value of Securities | 99.11 | % | |
| Receivables and Other Assets Net of Liabilities | 0.89 | % | |
| Total Net Assets | 100.00 | % | |
28
| Delaware Tax-Free New York Fund | As of August 31, 2012 (Unaudited) |
Sector designations may be different than the sector designations presented in other Fund materials.
| Security type/sector | Percentage of net assets | ||
| Municipal Bonds | 98.31 | % | |
| Corporate Revenue Bonds | 9.48 | % | |
| Education Revenue Bonds | 16.99 | % | |
| Electric Revenue Bonds | 3.50 | % | |
| Healthcare Revenue Bonds | 15.41 | % | |
| Housing Revenue Bonds | 1.04 | % | |
| Lease Revenue Bonds | 14.15 | % | |
| Local General Obligation Bonds | 4.88 | % | |
| Pre-Refunded Bonds | 2.15 | % | |
| Special Tax Revenue Bonds | 12.91 | % | |
| State & Territory General Obligation Bonds | 5.55 | % | |
| Transportation Revenue Bonds | 9.15 | % | |
| Water & Sewer Revenue Bonds | 3.10 | % | |
| Short-Term Investments | 2.02 | % | |
| Total Value of Securities | 100.33 | % | |
| Liabilities Net of Receivables and Other Assets | (0.33 | %) | |
| Total Net Assets | 100.00 | % | |
29
| Statements of net assets | |
| Delaware Tax-Free Arizona Fund | August 31, 2012 |
| Principal amount | Value | ||||||
| Municipal Bonds – 100.64% | |||||||
| Corporate Revenue Bonds – 12.95% | |||||||
| Maricopa County Pollution Control (Palo Verde Project) | |||||||
| Series A 5.05% 5/1/29 (AMBAC) | $2,000,000 | $ | 2,004,680 | ||||
| •Series B 5.20% 6/1/43 | 1,500,000 | 1,692,315 | |||||
| • | Navajo County Pollution Control Revenue | ||||||
| (Arizona Public Services-Cholla) | |||||||
| Series D 5.75% 6/1/34 | 1,500,000 | 1,695,810 | |||||
| Pima County Industrial Development Authority Pollution | |||||||
| Control Revenue (Tucson Electric Power San Juan) | |||||||
| 5.75% 9/1/29 | 750,000 | 801,218 | |||||
| Series A 4.95% 10/1/20 | 1,450,000 | 1,610,892 | |||||
| Series A 5.25% 10/1/40 | 3,400,000 | 3,682,403 | |||||
| Salt Verde Financial Senior Gas Revenue 5.00% 12/1/37 | 2,250,000 | 2,404,283 | |||||
| 13,891,601 | |||||||
| Education Revenue Bonds – 15.09% | |||||||
| Arizona Health Facilities Authority | |||||||
| Healthcare Education Revenue (Kirksville College) | |||||||
| 5.125% 1/1/30 | 1,500,000 | 1,638,630 | |||||
| Arizona State University Certificates of Participation | |||||||
| (Research Infrastructure Project) | |||||||
| 5.00% 9/1/30 (AMBAC) | 2,000,000 | 2,131,080 | |||||
| Arizona State University Energy Management Revenue | |||||||
| (Arizona State University Tempe | |||||||
| Campus II Project) 4.50% 7/1/24 | 1,000,000 | 1,106,670 | |||||
| Arizona State University Series C 5.50% 7/1/25 | 330,000 | 403,570 | |||||
| Glendale Industrial Development Authority Revenue | |||||||
| (Midwestern University) 5.125% 5/15/40 | 1,305,000 | 1,391,208 | |||||
| Northern Arizona University | |||||||
| 5.00% 6/1/36 | 475,000 | 527,331 | |||||
| 5.00% 6/1/41 | 1,240,000 | 1,366,802 | |||||
| Phoenix Industrial Development Authority | |||||||
| (Great Hearts Academic Project) | |||||||
| 6.30% 7/1/42 | 500,000 | 534,715 | |||||
| 6.40% 7/1/47 | 500,000 | 535,005 | |||||
| (Rowan University Project) 5.00% 6/1/42 | 2,000,000 | 2,157,521 | |||||
| Pima County Industrial Development Authority | |||||||
| Educational Revenue (Tucson Country Day | |||||||
| School Project) 5.00% 6/1/37 | 1,500,000 | 1,368,900 | |||||
30
| Principal amount | Value | ||||||
| Municipal Bonds (continued) | |||||||
| Education Revenue Bonds (continued) | |||||||
| South Campus Group Student Housing Revenue | |||||||
| (Arizona State University-South Campus | |||||||
| Project) 5.625% 9/1/35 (NATL-RE) | $2,000,000 | $ | 2,027,140 | ||||
| Tucson Industrial Development Authority Lease Revenue | |||||||
| (University of Arizona-Marshall Foundation) | |||||||
| Series A 5.00% 7/15/27 (AMBAC) | 1,000,000 | 1,001,540 | |||||
| 16,190,112 | |||||||
| Electric Revenue Bonds – 7.28% | |||||||
| Maricopa County Pollution Control Revenue | |||||||
| Refunding (El Paso Electric Palo Verde Project) | |||||||
| Series A 4.50% 8/1/42 | 2,500,000 | 2,557,175 | |||||
| Mesa Utilities System Revenue 5.00% 7/1/18 | |||||||
| (NATL-RE) (FGIC) | 1,500,000 | 1,809,375 | |||||
| Pinal County Electric District #3 Refunding 5.25% 7/1/41 | 2,000,000 | 2,238,060 | |||||
| Salt River Project Agricultural Improvement & | |||||||
| Power District Electric Revenue System | |||||||
| Series A 5.00% 12/1/30 | 1,000,000 | 1,203,910 | |||||
| 7,808,520 | |||||||
| Healthcare Revenue Bonds – 18.96% | |||||||
| Arizona State Health Facilities Authority Hospital System | |||||||
| Revenue (Phoenix Children’s Hospital) | |||||||
| Series A 5.00% 2/1/42 | 1,600,000 | 1,684,016 | |||||
| Glendale Industrial Development Authority Hospital | |||||||
| Revenue (John C. Lincoln Health) 5.00% 12/1/42 | 2,205,000 | 2,272,010 | |||||
| Maricopa County Industrial Development Authority Health | |||||||
| Facilities Revenue (Catholic Healthcare West) Series A | |||||||
| 5.25% 7/1/32 | 1,250,000 | 1,354,238 | |||||
| 5.50% 7/1/26 | 1,000,000 | 1,046,780 | |||||
| 6.00% 7/1/39 | 2,500,000 | 2,871,075 | |||||
| Puerto Rico Industrial Tourist Educational Medical & | |||||||
| Environmental Control Facilities Financing Authority | |||||||
| (Auxilio Mutuo) Series A 6.00% 7/1/33 | 1,615,000 | 1,841,019 | |||||
| Scottsdale Industrial Development Authority | |||||||
| Hospital Revenue (Scottsdale Healthcare) | |||||||
| Series A 5.25% 9/1/30 | 1,250,000 | 1,266,575 | |||||
| Tempe Industrial Development Authority Revenue | |||||||
| (Friendship Village) Series A 6.25% 12/1/42 | 1,200,000 | 1,297,428 | |||||
31
Statements of net assets
Delaware Tax-Free Arizona Fund
| Principal amount | Value | ||||||
| Municipal Bonds (continued) | |||||||
| Healthcare Revenue Bonds (continued) | |||||||
| University of Arizona Medical Center Hospital Revenue | |||||||
| 6.00% 7/1/39 | $1,500,000 | $ | 1,733,985 | ||||
| 6.50% 7/1/39 | 2,500,000 | 2,900,274 | |||||
| Yavapai County Industrial Development Authority | |||||||
| Revenue (Yavapai Regional Medical Center) | |||||||
| Series A 5.25% 8/1/21 (RADIAN) | 2,000,000 | 2,075,220 | |||||
| 20,342,620 | |||||||
| Lease Revenue Bonds – 12.39% | |||||||
| Arizona Game & Fish Department & Community | |||||||
| Beneficial Interest Certificates | |||||||
| (Administration Building Project) 5.00% 7/1/32 | 1,000,000 | 1,054,610 | |||||
| Arizona State Certificates of Participation Department | |||||||
| Administration Series A 5.25% 10/1/25 (AGM) | 1,500,000 | 1,748,745 | |||||
| Arizona State Sports & Tourism Authority Senior Revenue | |||||||
| (Multipurpose Stadium Facility) Series A 5.00% 7/1/36 | 1,000,000 | 1,104,130 | |||||
| Marana Municipal Property Facilities Revenue | |||||||
| 5.00% 7/1/28 (AMBAC) | 575,000 | 585,396 | |||||
| Maricopa County Industrial Development Authority | |||||||
| Correctional Contract Revenue (Phoenix West Prison) | |||||||
| Series B 5.375% 7/1/22 (ACA) | 1,000,000 | 1,002,670 | |||||
| Phoenix Industrial Development Authority Lease Revenue | |||||||
| (Capitol Mall II, LLC Project) 5.00% 9/15/28 (AMBAC) | 2,000,000 | 2,002,060 | |||||
| Pima County Industrial Development Authority Lease | |||||||
| Revenue Metro Police Facility (Nevada Project) Series A | |||||||
| 5.25% 7/1/31 | 1,500,000 | 1,633,980 | |||||
| 5.375% 7/1/39 | 1,500,000 | 1,646,130 | |||||
| 6.00% 7/1/41 | 1,000,000 | 1,148,430 | |||||
| Pinal County Certificates of Participation 5.00% 12/1/29 | 1,300,000 | 1,362,036 | |||||
| 13,288,187 | |||||||
| Local General Obligation Bonds – 3.43% | |||||||
| Coconino & Yavapai Counties Joint Unified School | |||||||
| District #9 (Sedona Oak Creek Project of 2007) | |||||||
| Series B 5.375% 7/1/28 | 1,350,000 | 1,557,077 | |||||
| DC Ranch Community Facilities 5.00% 7/15/27 (AMBAC) | 1,000,000 | 1,014,670 | |||||
| • | Gila County Unified School District #10 | ||||||
| (Payson School Improvement Project of 2006) | |||||||
| Series A 5.25% 7/1/27 (AMBAC) | 1,000,000 | 1,111,670 | |||||
| 3,683,417 | |||||||
32
| Principal amount | Value | ||||||
| Municipal Bonds (continued) | |||||||
| §Pre-Refunded Bond – 0.00% | |||||||
| Puerto Rico Public Buildings Authority Revenue | |||||||
| (Guaranteed Government Facilities) Series I | |||||||
| 5.25% 7/1/33-14 | $ | 5,000 | $ | 5,443 | |||
| 5,443 | |||||||
| Special Tax Revenue Bonds – 20.27% | |||||||
| Arizona Transportation Board | |||||||
| (Maricopa County Regional Area Road) 5.00% 7/1/25 | 1,000,000 | 1,182,980 | |||||
| Series A 5.00% 7/1/29 | 1,115,000 | 1,287,647 | |||||
| Flagstaff Aspen Place Sawmill Improvement District | |||||||
| Revenue 5.00% 1/1/32 | 875,000 | 876,181 | |||||
| Gilbert Public Facilities Municipal Property Revenue | |||||||
| 5.00% 7/1/25 | 1,250,000 | 1,425,325 | |||||
| Guam Government Business Privilege Tax Revenue Series A | |||||||
| 5.125% 1/1/42 | 545,000 | 606,476 | |||||
| 5.25% 1/1/36 | 705,000 | 796,185 | |||||
| Marana Tangerine Farm Road Improvement District | |||||||
| Revenue 4.60% 1/1/26 | 818,000 | 847,219 | |||||
| Phoenix Civic Improvement Excise Tax Revenue | |||||||
| (Solid Waste Improvements) | |||||||
| Series A 5.00% 7/1/19 (NATL-RE) | 1,000,000 | 1,120,040 | |||||
| Phoenix Civic Improvement Transition Excise Tax | |||||||
| Revenue (Light Rail Project) | |||||||
| 5.00% 7/1/20 (AMBAC) | 1,570,000 | 1,697,405 | |||||
| Puerto Rico Commonwealth Infrastructure Financing | |||||||
| Authority Special Tax Revenue Series C | |||||||
| 5.50% 7/1/25 (AMBAC) | 455,000 | 507,202 | |||||
| Puerto Rico Sales Tax Financing Corporation Revenue | |||||||
| First Subordinate | |||||||
| Ω(Convertible Capital Appreciation Bonds) Series A | |||||||
| 6.75% 8/1/32 | 960,000 | 994,176 | |||||
| Series A 5.00% 8/1/26 | 1,100,000 | 1,223,332 | |||||
| Series A 5.00% 8/1/46 | 1,500,000 | 1,618,994 | |||||
| ^Series A 5.03% 8/1/44 (NATL-RE) | 3,885,000 | 667,987 | |||||
| ^Series A 5.04% 8/1/45 (NATL-RE) | 3,980,000 | 641,616 | |||||
| Series A 5.375% 8/1/39 | 850,000 | 909,976 | |||||
| Series A 5.50% 8/1/42 | 1,000,000 | 1,081,080 | |||||
| Series A 5.75% 8/1/37 | 580,000 | 647,645 | |||||
| Series A 6.50% 8/1/44 | 1,250,000 | 1,492,538 | |||||
| Series A-1 5.00% 8/1/43 | 1,060,000 | 1,114,039 | |||||
33
Statements of net assets
Delaware Tax-Free Arizona Fund
| Principal amount | Value | |||||||
| Municipal Bonds (continued) | ||||||||
| Special Tax Revenue Bonds (continued) | ||||||||
| Queen Creek Improvement District #1 5.00% 1/1/32 | $ | 1,000,000 | $ | 1,005,660 | ||||
| 21,743,703 | ||||||||
| State & Territory General Obligation Bonds – 2.59% | ||||||||
| Puerto Rico Commonwealth Public Improvement | ||||||||
| Series A 5.75% 7/1/41 | 2,000,000 | 2,139,060 | ||||||
| Series E 5.375% 7/1/30 | 600,000 | 640,362 | ||||||
| 2,779,422 | ||||||||
| Transportation Revenue Bonds – 6.07% | ||||||||
| Arizona State Transportation Board Highway Revenue | ||||||||
| Subordinated Series A 5.00% 7/1/23 | 1,000,000 | 1,075,610 | ||||||
| Phoenix Civic Improvement Airport Revenue | ||||||||
| (Junior Lien) Series A 5.25% 7/1/33 | 1,250,000 | 1,430,438 | ||||||
| (Senior Lien) Series B | ||||||||
| 5.25% 7/1/27 (NATL-RE) (FGIC) (AMT) | 1,000,000 | 1,001,500 | ||||||
| 5.25% 7/1/32 (NATL-RE) (FGIC) (AMT) | 3,000,000 | 3,003,930 | ||||||
| 6,511,478 | ||||||||
| Water & Sewer Revenue Bonds – 1.61% | ||||||||
| Phoenix Civic Improvement Wastewater Corporation | ||||||||
| Systems Revenue (Junior Lien) | ||||||||
| 5.00% 7/1/19 (NATL-RE) | 1,000,000 | 1,173,380 | ||||||
| Puerto Rico Commonwealth Aqueduct & Sewer Authority | ||||||||
| (Senior Lien) Series A | ||||||||
| 5.25% 7/1/42 | 220,000 | 221,412 | ||||||
| 6.00% 7/1/47 | 305,000 | 334,024 | ||||||
| 1,728,816 | ||||||||
| Total Municipal Bonds (cost $99,564,815) | 107,973,319 | |||||||
| Total Value of Securities – 100.64% | ||||||||
| (cost $99,564,815) | 107,973,319 | |||||||
| Liabilities Net of Receivables and | ||||||||
| Other Assets – (0.64%) | (687,929 | ) | ||||||
| Net Assets Applicable to 8,929,906 | ||||||||
| Shares Outstanding – 100.00% | $ | 107,285,390 | ||||||
34
| Net Asset Value – Delaware Tax-Free Arizona Fund | |||
| Class A ($99,952,950 / 8,321,078 Shares) | $12.01 | ||
| Net Asset Value – Delaware Tax-Free Arizona Fund | |||
| Class B ($224,654 / 18,688 Shares) | $12.02 | ||
| Net Asset Value – Delaware Tax-Free Arizona Fund | |||
| Class C ($7,107,786 / 590,140 Shares) | $12.04 | ||
| Components of Net Assets at August 31, 2012: | |||
| Shares of beneficial interest (unlimited authorization – no par) | $ | 98,005,801 | |
| Undistributed net investment income | 25,309 | ||
| Accumulated net realized gain on investments | 845,776 | ||
| Net unrealized appreciation of investments | 8,408,504 | ||
| Total net assets | $ | 107,285,390 | |
| • | Variable rate security. The rate shown is the rate as of August 31, 2012. Interest rates reset periodically. |
| § | Pre-refunded bonds. Municipal bonds that are generally backed or secured by U.S. Treasury bonds. For pre-refunded bonds, the stated maturity is followed by the year in which the bond is pre-refunded. See Note 8 in “Notes to financial statements.” |
| Ω | Step coupon bond. Indicates security that has a zero coupon that remains in effect until a predetermined date at which time the stated interest rate becomes effective. |
| ^ | Zero coupon security. The rate shown is the yield at the time of purchase. |
35
Statements of net assets
Delaware Tax-Free Arizona Fund
| Net Asset Value and Offering Price Per Share – | |||
| Delaware Tax-Free Arizona Fund | |||
| Net asset value Class A (A) | $ | 12.01 | |
| Sales charge (4.50% of offering price) (B) | 0.57 | ||
| Offering price | $ | 12.58 |
| (A) | Net asset value per share, as illustrated, is the amount which would be paid upon redemption or repurchase of shares. |
| (B) | See the current prospectus for purchases of $100,000 or more. |
Summary of abbreviations:
ACA — Insured by American Capital Access
AGM — Insured by Assured Guaranty Municipal Corporation
AMBAC — Insured by AMBAC Assurance Corporation
AMT — Subject to Alternative Minimum Tax
FGIC — Insured by Financial Guaranty Insurance Company
NATL-RE — Insured by National Public Finance Guarantee Corporation
RADIAN — Insured by Radian Asset Assurance
See accompanying notes, which are an integral part of the financial statements.
36
| Delaware Tax-Free California Fund | August 31, 2012 |
| Principal amount | Value | ||||||
| Municipal Bonds – 98.35% | |||||||
| Corporate Revenue Bonds – 7.75% | |||||||
| • | California Pollution Control Financing Authority | ||||||
| Environmental Improvement Revenue | |||||||
| (BP West Coast Products, LLC) 2.60% 12/1/46 | $ | 500,000 | $ | 519,245 | |||
| Chula Vista Industrial Development Revenue | |||||||
| (San Diego Gas & Electric) Series D 5.875% 1/1/34 | 1,000,000 | 1,175,440 | |||||
| Golden State Tobacco Securitization Corporate | |||||||
| Settlement Revenue | |||||||
| 5.00% 6/1/45 (AMBAC) (TCRS) | 950,000 | 969,855 | |||||
| (Asset-Backed Senior Notes) Series A-1 | |||||||
| 5.125% 6/1/47 | 2,000,000 | 1,542,480 | |||||
| 5.75% 6/1/47 | 3,500,000 | 2,980,705 | |||||
| M-S-R Energy Authority Gas Revenue | |||||||
| Series A 6.50% 11/1/39 | 1,000,000 | 1,285,140 | |||||
| Series C 6.50% 11/1/39 | 500,000 | 642,570 | |||||
| 9,115,435 | |||||||
| Education Revenue Bonds – 7.78% | |||||||
| California Educational Facilities Authority Revenue | |||||||
| (Chapman University) 5.00% 4/1/31 | 500,000 | 560,490 | |||||
| (University of Southern California) | |||||||
| Series A 5.00% 10/1/23 | 1,000,000 | 1,290,330 | |||||
| (Woodbury University) 5.00% 1/1/36 | 1,000,000 | 1,002,330 | |||||
| California Municipal Finance Authority Educational Revenue | |||||||
| (American Heritage Education Foundation Project) | |||||||
| Series A 5.25% 6/1/36 | 1,000,000 | 929,470 | |||||
| California Municipal Finance Authority Revenue | |||||||
| (Southwestern Law School) 6.50% 11/1/41 | 1,140,000 | 1,336,479 | |||||
| California Statewide Communities Development Authority | |||||||
| Charter School Revenue | |||||||
| (Green Dot Public Schools) Series A 7.25% 8/1/41 | 800,000 | 883,040 | |||||
| California Statewide Communities Development | |||||||
| Authority Revenue | |||||||
| (California Baptist University Project) | |||||||
| Series A 5.50% 11/1/38 | 1,000,000 | 1,039,500 | |||||
| (Irvine Campus) 5.375% 5/15/38 | 1,000,000 | 1,069,070 | |||||
| California Statewide Communities Development Authority | |||||||
| School Facility Revenue (Aspire Public Schools Project) | |||||||
| 6.00% 7/1/40 | 1,000,000 | 1,030,660 | |||||
| 9,141,369 | |||||||
37
Statements of net assets
Delaware Tax-Free California Fund
| Principal amount | Value | ||||||
| Municipal Bonds (continued) | |||||||
| Electric Revenue Bonds – 4.92% | |||||||
| Anaheim Public Financing Authority Electric System District | |||||||
| Facilities Series A 5.00% 10/1/25 | $ | 800,000 | $ | 953,080 | |||
| Imperial Irrigation District Electric System Revenue | |||||||
| Series A 5.25% 11/1/24 | 500,000 | 594,560 | |||||
| Series B 5.00% 11/1/36 | 250,000 | 276,708 | |||||
| Series C 5.25% 11/1/31 | 1,175,000 | 1,367,500 | |||||
| Puerto Rico Electric Power Authority Revenue | |||||||
| Series A 5.00% 7/1/42 | 500,000 | 511,870 | |||||
| Southern California Public Power Authority Revenue | |||||||
| (Transmission Project) Series A 5.00% 7/1/22 | 1,000,000 | 1,162,580 | |||||
| Turlock Irrigation District Revenue Series A 5.00% 1/1/30 | 830,000 | 919,781 | |||||
| 5,786,079 | |||||||
| Healthcare Revenue Bonds – 18.56% | |||||||
| Abag Finance Authority for Nonprofit | |||||||
| Corporations Refunding | |||||||
| (Episcopal Senior Communities) | |||||||
| 6.125% 7/1/41 | 850,000 | 964,623 | |||||
| (Sharp Health Care) | |||||||
| 6.25% 8/1/39 | 1,000,000 | 1,190,260 | |||||
| Series A 5.00% 8/1/26 | 300,000 | 341,115 | |||||
| Series A 5.00% 8/1/27 | 300,000 | 339,402 | |||||
| Series A 5.00% 8/1/28 | 250,000 | 281,243 | |||||
| California Health Facilities Financing Authority Revenue | |||||||
| (Catholic Health Care West) | |||||||
| Series A 6.00% 7/1/39 | 855,000 | 1,009,764 | |||||
| Series E 5.625% 7/1/25 | 1,000,000 | 1,151,710 | |||||
| Series G 5.25% 7/1/23 | 1,000,000 | 1,062,760 | |||||
| (Children’s Hospital of Los Angeles) | |||||||
| Series A 5.00% 11/15/34 | 1,000,000 | 1,069,640 | |||||
| (Lucile Packard Children’s Hospital) | |||||||
| Series A 5.00% 8/15/51 | 630,000 | 683,733 | |||||
| (Scripps Health Care) | |||||||
| Series A 5.00% 11/15/32 | 1,000,000 | 1,125,930 | |||||
| Series A 5.00% 11/15/40 | 850,000 | 935,153 | |||||
| (St. Joseph Health System) Series A 5.75% 7/1/39 | 1,000,000 | 1,154,360 | |||||
| (Stanford Hospital) Series A-2 5.25% 11/15/40 | 600,000 | 684,780 | |||||
| (Sutter Health Care) Series D 5.25% 8/15/31 | 1,000,000 | 1,148,020 | |||||
| (The Episcopal Home) Series A 5.30% 2/1/32 | |||||||
| (RADIAN) (IBC) | 475,000 | 475,432 | |||||
38
| Principal amount | Value | ||||||
| Municipal Bonds (continued) | |||||||
| Healthcare Revenue Bonds (continued) | |||||||
| California Statewide Communities Development | |||||||
| Authority Revenue | |||||||
| (Kaiser Permanente) | |||||||
| Series A 5.00% 4/1/19 | $ | 1,000,000 | $ | 1,187,570 | |||
| Series A 5.00% 4/1/42 | 2,085,000 | 2,278,195 | |||||
| Series B 5.25% 3/1/45 | 1,000,000 | 1,062,770 | |||||
| (Southern California Senior Living) 7.25% 11/15/41 | 500,000 | 570,400 | |||||
| (Trinity Health) 5.00% 12/1/41 | 1,000,000 | 1,116,350 | |||||
| (Valleycare Health Systems) Series A 5.125% 7/15/31 | 1,000,000 | 1,029,580 | |||||
| San Buenaventura Community Memorial Health Systems | |||||||
| 7.50%12/1/41 | 785,000 | 953,540 | |||||
| 21,816,330 | |||||||
| Housing Revenue Bonds – 3.50% | |||||||
| California Municipal Finance Authority Mobile Home Park | |||||||
| Revenue (Caritas Projects) Series A 6.40% 8/15/45 | 995,000 | 1,089,445 | |||||
| • | California Statewide Communities Development | ||||||
| Multifamily Housing Authority Revenue | |||||||
| (Silver Ridge Apartments) | |||||||
| Series H 5.80% 8/1/33 (FNMA) (AMT) | 1,000,000 | 1,011,630 | |||||
| Independent Cities Finance Authority Mobile Home Park | |||||||
| Revenue (Sahar Mobile Home Park) | |||||||
| Series A 5.00% 6/15/47 | 1,000,000 | 1,012,670 | |||||
| Santa Clara County Multifamily Housing Authority Revenue | |||||||
| (Rivertown Apartments Project) | |||||||
| Series A 5.85% 8/1/31 (AMT) | 1,000,000 | 1,003,870 | |||||
| 4,117,615 | |||||||
| Lease Revenue Bonds – 5.80% | |||||||
| California State Public Works Board Lease Revenue | |||||||
| (California State Prisons Los Angeles) | |||||||
| Series C 5.00% 10/1/26 | 1,000,000 | 1,133,720 | |||||
| (General Services) Series A 6.25% 4/1/34 | 1,000,000 | 1,189,200 | |||||
| Elsinore Valley Municipal Water District Certificates of | |||||||
| Participation Series A 5.00% 7/1/24 (BHAC) | 1,000,000 | 1,166,890 | |||||
| Franklin-McKinley School District Certificates of | |||||||
| Participation (Financing Project) | |||||||
| Series B 5.00% 9/1/27 (AMBAC) | 1,060,000 | 1,068,968 | |||||
| San Diego Public Facilities Financing Authority Lease | |||||||
| Revenue (Master Project) Series A 5.25% 3/1/40 | 1,000,000 | 1,078,820 | |||||
39
Statements of net assets
Delaware Tax-Free California Fund
| Principal amount | Value | ||||||
| Municipal Bonds (continued) | |||||||
| Lease Revenue Bonds (continued) | |||||||
| San Mateo Joint Powers Financing Authority Lease | |||||||
| Revenue (Capital Projects) Series A 5.25% 7/15/26 | $ | 1,000,000 | $ | 1,175,900 | |||
| 6,813,498 | |||||||
| Local General Obligation Bonds – 7.37% | |||||||
| ^ | Anaheim School District Election 2002 | ||||||
| 4.58% 8/1/25 (NATL-RE) | 1,000,000 | 556,730 | |||||
| Bonita Unified School District Election 2008 | |||||||
| Series B 5.25% 8/1/28 | 800,000 | 963,144 | |||||
| Central Unified School District Election 2008 | |||||||
| Series A 5.625% 8/1/33 (ASSURED GTY) | 1,000,000 | 1,154,400 | |||||
| Fairfield-Suisun Unified School District Election 2002 | |||||||
| 5.50% 8/1/28 (NATL-RE) | 500,000 | 537,820 | |||||
| Grossmont Union High School District Election 2004 | |||||||
| 5.00% 8/1/33 | 1,000,000 | 1,107,380 | |||||
| Long Beach Unified School District Refinancing | |||||||
| 5.00% 8/1/29 | 1,000,000 | 1,181,250 | |||||
| Pittsburg Unified School District Financing Authority | |||||||
| Revenue (Pittsburg Unified School District Building | |||||||
| Program) 5.50% 9/1/46 (AGM) | 800,000 | 905,648 | |||||
| Santa Barbara Community College District Election 2008 | |||||||
| Series A 5.25% 8/1/33 | 1,000,000 | 1,170,620 | |||||
| Sierra Joint Community College District #2 | |||||||
| (Western Nevada) Series A 5.25% 8/1/21 (BHAC) (FGIC) | 1,000,000 | 1,090,450 | |||||
| 8,667,442 | |||||||
| §Pre-Refunded Bonds – 3.10% | |||||||
| California Department of Water Resources | |||||||
| (Central Valley Project) Series X | |||||||
| 5.00% 12/1/29-12 (NATL-RE) (FGIC) | 5,000 | 5,060 | |||||
| California State Department of Water Resources | |||||||
| Un-Refunded 2010 (Central Valley Project) Series X | |||||||
| 5.00% 12/1/29-12 (NATL-RE) (FGIC) | 740,000 | 747,881 | |||||
| California Statewide Communities Development Authority | |||||||
| Revenue (Viewpoint School Project) | |||||||
| 5.75% 10/1/33-14 (ACA) | 1,000,000 | 1,110,660 | |||||
| Commerce Joint Powers Financing Authority Revenue | |||||||
| (Redevelopment Projects) Series A | |||||||
| 5.00% 8/1/28-13 (RADIAN) | 60,000 | 62,632 | |||||
40
| Principal amount | Value | ||||||
| Municipal Bonds (continued) | |||||||
| §Pre-Refunded Bonds (continued) | |||||||
| Golden State Tobacco Securitization Corporation | |||||||
| Settlement Revenue (Asset-Backed Senior Notes) | |||||||
| Series B 5.625% 6/1/33-13 | $ | 1,000,000 | $ | 1,040,670 | |||
| Grossmont Union High School District Election 2004 | |||||||
| 5.00% 8/1/23-15 (NATL-RE) | 500,000 | 568,000 | |||||
| Port Oakland Revenue Series L 5.375% 11/1/27-12 | |||||||
| (NATL-RE) (FGIC) (AMT) | 110,000 | 110,938 | |||||
| 3,645,841 | |||||||
| Resource Recovery Revenue Bond – 0.95% | |||||||
| South Bayside Waste Management Authority Revenue | |||||||
| (Shoreway Environmental Center) | |||||||
| Series A 6.00% 9/1/36 | 1,000,000 | 1,113,640 | |||||
| 1,113,640 | |||||||
| Special Tax Revenue Bonds – 15.36% | |||||||
| Bonita Canyon Public Facilities Financing Authority Revenue | |||||||
| (Community Facilities District #98-1) 5.00% 9/1/28 | 800,000 | 827,088 | |||||
| California Statewide Communities Development Authority | |||||||
| Revenue (Inland Regional Center Project) | |||||||
| 5.375% 12/1/37 | 1,350,000 | 1,375,502 | |||||
| Commerce Joint Powers Financing Authority Revenue | |||||||
| Un-Refunded Balance (Redevelopment Projects) | |||||||
| Series A 5.00% 8/1/28 (RADIAN) | 940,000 | 943,234 | |||||
| Fremont Community Facilities District #1 | |||||||
| (Special Tax Pacific Commons) 5.375% 9/1/36 | 1,000,000 | 1,003,980 | |||||
| Glendale Redevelopment Agency Tax Allocation Revenue | |||||||
| (Central Glendale Redevelopment Project) | |||||||
| 5.50% 12/1/24 | 1,000,000 | 1,053,790 | |||||
| Lammersville School District Community Facilities | |||||||
| District #2002 (Mountain House) 5.125% 9/1/35 | 500,000 | 500,985 | |||||
| Lancaster Redevelopment Agency Tax Allocation Revenue | |||||||
| (Combined Redevelopment Project Areas) | |||||||
| 6.875% 8/1/39 | 500,000 | 569,380 | |||||
| @ | Modesto Special Tax Community Facilities | ||||||
| District #4-1 (Village 2) 5.15% 9/1/36 | 1,000,000 | 1,001,070 | |||||
| Poway Redevelopment Agency Tax Allocation Revenue | |||||||
| 5.75% 6/15/33 (NATL-RE) | 270,000 | 270,894 | |||||
41
Statements of net assets
Delaware Tax-Free California Fund
| Principal amount | Value | ||||||
| Municipal Bonds (continued) | |||||||
| Special Tax Revenue Bonds (continued) | |||||||
| Puerto Rico Sales Tax Financing Corporation Revenue | |||||||
| First Subordinate Series A | |||||||
| 5.25% 8/1/27 | $ | 1,000,000 | $ | 1,135,230 | |||
| 5.50% 8/1/37 | 835,000 | 904,363 | |||||
| Ω(Convertible Capital Appreciation) 6.75% 8/1/32 | 660,000 | 683,496 | |||||
| Rancho Santa Fe Community Services District Financing | |||||||
| Authority Revenue Superior Lien Series A 5.75% 9/1/30 | 800,000 | 879,552 | |||||
| Riverside County Redevelopment Agency Tax Allocation | |||||||
| Housing Series A 6.00% 10/1/39 | 1,000,000 | 1,091,110 | |||||
| Roseville Westpark Special Tax Public Community Facilities | |||||||
| District #1 5.25% 9/1/37 | 500,000 | 501,070 | |||||
| San Bernardino County Special Tax Community Facilities | |||||||
| District #2002-1 5.90% 9/1/33 | 2,000,000 | 2,041,479 | |||||
| San Diego Redevelopment Agency Tax Allocation Revenue | |||||||
| (Naval Training Center) Series A 5.75% 9/1/40 | 1,000,000 | 1,073,140 | |||||
| San Mateo Special Tax Revenue | |||||||
| (Community Facilities District #200) 6.00% 9/1/42 | 800,000 | 870,896 | |||||
| Virgin Islands Public Finance Authority Revenue | |||||||
| (Senior Lien-Matching Fund Loan Note) | |||||||
| Series A 5.00% 10/1/29 | 715,000 | 781,238 | |||||
| Yucaipa Special Tax Refunding Community Facilities | |||||||
| District #98-1 (Chapman Heights) 5.375% 9/1/30 | 500,000 | 543,655 | |||||
| 18,051,152 | |||||||
| State & Territory General Obligation Bonds – 11.81% | |||||||
| California State Various Purposes | |||||||
| 5.00% 9/1/41 | 750,000 | 823,755 | |||||
| 5.00% 10/1/41 | 225,000 | 247,293 | |||||
| 5.00% 4/1/42 | 1,000,000 | 1,101,940 | |||||
| 5.25% 3/1/30 | 1,000,000 | 1,151,200 | |||||
| 5.25% 4/1/35 | 2,000,000 | 2,283,700 | |||||
| 5.25% 11/1/40 | 1,000,000 | 1,132,810 | |||||
| 6.00% 3/1/33 | 1,000,000 | 1,231,470 | |||||
| 6.00% 4/1/38 | 515,000 | 607,504 | |||||
| Puerto Rico Commonwealth Public Improvement Series A | |||||||
| 5.00% 7/1/41 | 2,900,000 | 2,888,835 | |||||
| 5.50% 7/1/39 | 1,500,000 | 1,562,910 | |||||
| 5.75% 7/1/41 | 800,000 | 855,624 | |||||
| 13,887,041 | |||||||
42
| Principal amount | Value | ||||||
| Municipal Bonds (continued) | |||||||
| Transportation Revenue Bonds – 6.46% | |||||||
| Bay Area Toll Authority Bridge Revenue | |||||||
| (San Francisco Bay Area) Series F-1 5.25% 4/1/27 | $ | 800,000 | $ | 965,264 | |||
| Los Angeles Department of Airports Subordinate | |||||||
| (Los Angeles International) Series B 5.00% 5/15/33 | 1,690,000 | 1,898,056 | |||||
| Port Oakland Revenue Un-Refunded Series L 5.375% | |||||||
| 11/1/27 (NATL-RE) (FGIC) (AMT) | 890,000 | 894,503 | |||||
| San Diego Redevelopment Agency (Centre City | |||||||
| Redevelopment Project) Series A 6.40% 9/1/25 | 1,000,000 | 1,001,190 | |||||
| San Francisco Municipal Transportation Agency Revenue | |||||||
| Series B 5.00% 3/1/37 | 2,500,000 | 2,830,025 | |||||
| 7,589,038 | |||||||
| Water & Sewer Revenue Bonds – 4.99% | |||||||
| California State Department of Water Resources Systems | |||||||
| Revenue (Central Valley Project) | |||||||
| Series AG 5.00% 12/1/28 | 815,000 | 968,628 | |||||
| San Diego Public Facilities Financing Authority Water | |||||||
| Revenue Subordinate Series A 5.00% 8/1/29 | 1,000,000 | 1,194,590 | |||||
| San Francisco City & County Public Utilities Commission | |||||||
| Water & Sewer Improvement Subordinate Series A | |||||||
| 5.00% 11/1/32 | 1,015,000 | 1,191,255 | |||||
| 5.00% 11/1/41 | 1,380,000 | 1,574,165 | |||||
| San Francisco City & County Public Utilities Commission | |||||||
| Water Revenue Series B 5.00% 11/1/26 | 800,000 | 941,768 | |||||
| 5,870,406 | |||||||
| Total Municipal Bonds (cost $106,603,032) | 115,614,886 | ||||||
| Short-Term Investment – 0.85% | |||||||
| ¤Variable Rate Demand Note – 0.85% | |||||||
| California State Health Facilities Financing Authority | |||||||
| Revenue (Adventist Health System) Series A | |||||||
| 0.15% 9/1/2025 (LOC-Wells Fargo Bank, N.A.) | 1,000,000 | 1,000,000 | |||||
| Total Short-Term Investment (cost $1,000,000) | 1,000,000 | ||||||
43
Statements of net assets
Delaware Tax-Free California Fund
| Total Value of Securities – 99.20% | ||||
| (cost $107,603,032) | $ | 116,614,886 | ||
| Receivables and Other Assets | ||||
| Net of Liabilities – 0.80% | 941,038 | |||
| Net Assets Applicable to 9,625,858 | ||||
| Shares Outstanding – 100.00% | $ | 117,555,924 | ||
| Net Asset Value – Delaware Tax-Free California Fund | ||||
| Class A ($97,820,923 / 8,012,316 Shares) | $12.21 | |||
| Net Asset Value – Delaware Tax-Free California Fund | ||||
| Class B ($905,199 / 73,836 Shares) | $12.26 | |||
| Net Asset Value – Delaware Tax-Free California Fund | ||||
| Class C ($18,829,802 / 1,539,706 Shares) | $12.23 | |||
| Components of Net Assets at August 31, 2012: | ||||
| Shares of beneficial interest (unlimited authorization – no par) | $ | 108,881,968 | ||
| Undistributed net investment income | 18,763 | |||
| Accumulated net realized loss on investments | (356,661 | ) | ||
| Net unrealized appreciation of investments | 9,011,854 | |||
| Total net assets | $ | 117,555,924 | ||
| • | Variable rate security. The rate shown is the rate as of August 31, 2012. Interest rates reset periodically. |
| ^ | Zero coupon security. The rate shown is the yield at the time of purchase. |
| § | Pre-refunded bonds. Municipal bonds that are generally backed or secured by U.S. Treasury bonds. For pre-refunded bonds, the stated maturity is followed by the year in which the bond is pre-refunded. See Note 8 in “Notes to financial statements.” |
| @ | Illiquid security. At August 31 2012, the aggregate value of illiquid securities was $1,001,070, which represented 0.85% of the Fund’s net assets. See Note 8 in “Notes to financial statements.” |
| Ω | Step coupon bond. Indicates security that has a zero coupon that remains in effect until a predetermined date at which time the stated interest rate becomes effective. |
| ¤ | Tax-exempt obligations that contain a floating or variable interest rate adjustment formula and an unconditional right of demand to receive payment of the unpaid principal balance plus accrued interest upon a short notice period (generally up to 30 days) prior to specified dates either from the issuer or by drawing on a bank letter of credit, a guarantee or insurance issued with respect to such instrument. The rate shown is the rate as of August 31, 2012. |
44
| Net Asset Value and Offering Price Per Share – | |||
| Delaware Tax-Free California Fund | |||
| Net asset value Class A (A) | $ | 12.21 | |
| Sales charge (4.50% of offering price) (B) | 0.58 | ||
| Offering price | $ | 12.79 |
| (A) | Net asset value per share, as illustrated, is the amount which would be paid upon redemption or repurchase of shares. | |
| (B) | See the current prospectus for purchases of $100,000 or more. |
Summary of abbreviations:
ACA — Insured by American Capital Access
AGM — Insured by Assured Guaranty Municipal Corporation
AMBAC — Insured by AMBAC Assurance Corporation
AMT — Subject to Alternative Minimum Tax
ASSURED GTY — Insured by Assured Guaranty Corporation
BHAC — Insured by Berkshire Hathaway Assurance Company
FGIC — Insured by Financial Guaranty Insurance Company
FNMA — Federal National Mortgage Association collateral
IBC — Insured Bond Certificate
LOC — Letter of Credit
NATL-RE — Insured by National Public Finance Guarantee Corporation
RADIAN — Insured by Radian Asset Assurance
TCRS — Temporary Custodial Receipts
See accompanying notes, which are an integral part of the financial statements.
45
| Statements of net assets | ||
| Delaware Tax-Free Colorado Fund | August 31, 2012 |
| Principal amount | Value | ||||||
| Municipal Bonds – 99.84% | |||||||
| Corporate Revenue Bond – 1.26% | |||||||
| Public Authority Energy Natural Gas Revenue | |||||||
| Series 2008 6.50% 11/15/38 | $ | 2,500,000 | $ | 3,087,825 | |||
| 3,087,825 | |||||||
| Education Revenue Bonds – 6.19% | |||||||
| Boulder County Development Revenue | |||||||
| (University Corporation for Atmospheric Research) | |||||||
| 5.00% 9/1/35 (AMBAC) | 1,000,000 | 1,016,740 | |||||
| Colorado Educational & Cultural Facilities | |||||||
| Authority Revenue | |||||||
| (Charter School Project) | |||||||
| 5.00% 7/15/37 | 1,150,000 | 1,203,303 | |||||
| 5.50% 5/1/36 (SGI) | 2,280,000 | 2,322,476 | |||||
| (Johnson & Wales University Project) | |||||||
| Series A 5.00% 4/1/28 (SGI) | 1,000,000 | 1,003,920 | |||||
| (Liberty Common Charter School Project) | |||||||
| 5.125% 12/1/33 (SGI) | 2,740,000 | 2,767,208 | |||||
| (Pinnacle Charter School Project) 5.00% 6/1/33 (SGI) | 2,170,000 | 2,182,456 | |||||
| (Woodrow Wilson Charter School Project) | |||||||
| 5.25% 12/1/34 (SGI) | 1,960,000 | 2,017,271 | |||||
| Colorado School Mines Auxiliary Facilities | |||||||
| 5.00% 12/1/37 (AMBAC) | 425,000 | 426,539 | |||||
| University of Colorado Enterprise System Revenue | |||||||
| Series A 5.00% 6/1/30 (AMBAC) | 2,000,000 | 2,229,020 | |||||
| 15,168,933 | |||||||
| Electric Revenue Bonds – 6.53% | |||||||
| Colorado Springs Utilities System Improvement Revenue | |||||||
| Series C 5.50% 11/15/48 | 3,250,000 | 3,682,380 | |||||
| Platte River Power Authority Revenue Series HH | |||||||
| 5.00% 6/1/27 | 2,795,000 | 3,253,017 | |||||
| 5.00% 6/1/29 | 2,355,000 | 2,720,873 | |||||
| Puerto Rico Electric Power Authority Revenue | |||||||
| Series WW 5.00% 7/1/28 | 2,400,000 | 2,512,824 | |||||
| Series ZZ 5.25% 7/1/26 | 3,500,000 | 3,834,669 | |||||
| 16,003,763 | |||||||
46
| Principal amount | Value | |||||||
| Municipal Bonds (continued) | ||||||||
| Healthcare Revenue Bonds – 28.77% | ||||||||
| Aspen Valley Hospital District Revenue | ||||||||
| 5.00% 10/15/30 | $ | 1,250,000 | $ | 1,372,263 | ||||
| 5.00% 10/15/33 | 600,000 | 654,996 | ||||||
| Aurora Hospital Revenue | ||||||||
| (Children’s Hospital Association Project) | ||||||||
| Series A 5.00% 12/1/40 | 1,900,000 | 2,084,452 | ||||||
| Series D 5.00% 12/1/23 (AGM) | 2,775,000 | 3,103,448 | ||||||
| Colorado Health Facilities Authority Revenue | ||||||||
| • | (Adventist Health/Sunbelt) 5.125% 11/15/24 | 1,375,000 | 1,512,129 | |||||
| (Boulder Community Hospital Project) | ||||||||
| 5.00% 10/1/42 | 2,000,000 | 2,170,600 | ||||||
| (Catholic Health Initiatives) | ||||||||
| Series A 4.75% 9/1/40 | 1,000,000 | 1,053,340 | ||||||
| Series A 5.00% 7/1/39 | 1,540,000 | 1,656,455 | ||||||
| Series A 5.00% 2/1/41 | 2,250,000 | 2,455,560 | ||||||
| Series A 5.25% 2/1/33 | 1,000,000 | 1,152,980 | ||||||
| Series C-1 5.10% 10/1/41 (AGM) | 2,000,000 | 2,138,040 | ||||||
| Series D 6.25% 10/1/33 | 2,000,000 | 2,370,520 | ||||||
| (Christian Living Community Project) | ||||||||
| 6.375% 1/1/41 | 1,000,000 | 1,103,980 | ||||||
| Series A 5.75% 1/1/37 | 1,500,000 | 1,546,170 | ||||||
| (Covenant Retirement Communities) Series A | ||||||||
| 5.00% 12/1/33 | 4,000,000 | 4,174,199 | ||||||
| 5.50% 12/1/33 (RADIAN) | 5,000,000 | 5,044,399 | ||||||
| (Evangelical Lutheran) | ||||||||
| 5.00% 6/1/35 | 2,000,000 | 2,074,180 | ||||||
| 5.00% 12/1/42 | 2,500,000 | 2,647,200 | ||||||
| Series A 5.25% 6/1/34 | 2,750,000 | 2,813,223 | ||||||
| (National Jewish Health Project) 5.00% 1/1/27 | 550,000 | 585,184 | ||||||
| (Parkview Medical Center) 5.00% 9/1/25 | 1,000,000 | 1,034,640 | ||||||
| (Sisters Leavenworth) | ||||||||
| Series A 5.00% 1/1/40 | 1,000,000 | 1,085,790 | ||||||
| Series B 5.25% 1/1/25 | 2,500,000 | 2,886,400 | ||||||
| (Total Long-Term Care) Series A | ||||||||
| 6.00% 11/15/30 | 2,365,000 | 2,656,865 | ||||||
| 6.25% 11/15/40 | 750,000 | 840,525 | ||||||
| (Valley View Hospital Association) 5.50% 5/15/28 | 1,000,000 | 1,069,200 | ||||||
47
Statements of net assets
Delaware Tax-Free Colorado Fund
| Principal amount | Value | ||||||
| Municipal Bonds (continued) | |||||||
| Healthcare Revenue Bonds (continued) | |||||||
| Colorado Springs Hospital Revenue 6.25% 12/15/33 | $ | 2,500,000 | $ | 2,838,050 | |||
| Delta County Memorial Hospital District Enterprise | |||||||
| Revenue 5.35% 9/1/17 | 4,000,000 | 4,085,239 | |||||
| Denver Health & Hospital Authority Health Care Revenue | |||||||
| (Recovery Zone Facilities) 5.625% 12/1/40 | 2,500,000 | 2,716,075 | |||||
| Series A 4.75% 12/1/36 | 1,500,000 | 1,519,770 | |||||
| Puerto Rico Industrial Tourist Educational Medical & | |||||||
| Environmental Control Facilities Financing Authority | |||||||
| Auxilio Mutuo Series A 6.00% 7/1/33 | 2,120,000 | 2,416,694 | |||||
| University of Colorado Hospital Authority Revenue Series A | |||||||
| 5.00% 11/15/37 | 2,690,000 | 2,847,661 | |||||
| 6.00% 11/15/29 | 2,460,000 | 2,854,486 | |||||
| 70,564,713 | |||||||
| Housing Revenue Bonds – 2.74% | |||||||
| Colorado Housing & Finance Authority | |||||||
| (Multifamily Housing Insured Mortgage) | |||||||
| Series C3 6.15% 10/1/41 | 1,590,000 | 1,592,798 | |||||
| (Single Family Mortgage) Series A 5.50% 11/1/29 | |||||||
| (FHA) (VA) (HUD) | 1,195,000 | 1,240,159 | |||||
| (Single Family Program) Series AA | |||||||
| 4.50% 5/1/23 (FHLMC) | 720,000 | 809,460 | |||||
| 4.50% 11/1/23 (FHLMC) | 740,000 | 831,945 | |||||
| Puerto Rico Housing Finance Authority | |||||||
| Subordinate (Capital Fund Modernization) | |||||||
| 5.125% 12/1/27 | 2,040,000 | 2,254,302 | |||||
| 6,728,664 | |||||||
| Lease Revenue Bonds – 3.89% | |||||||
| Aurora Certificates of Participation Refunding | |||||||
| Series A 5.00% 12/1/30 | 2,370,000 | 2,677,508 | |||||
| Colorado Building Excellent Schools Today Certificates of | |||||||
| Participation Series G 5.00% 3/15/32 | 2,000,000 | 2,282,340 | |||||
| Pueblo County Certificates of Participation | |||||||
| (County Judicial Complex Project) | |||||||
| 5.00% 9/15/42 (AGM) | 2,500,000 | 2,820,750 | |||||
| Regional Transportation District Certificates of | |||||||
| Participation Series A 5.375% 6/1/31 | 1,540,000 | 1,760,836 | |||||
| 9,541,434 | |||||||
48
| Principal amount | Value | ||||||
| Municipal Bonds (continued) | |||||||
| Local General Obligation Bonds – 12.90% | |||||||
| Arapahoe County Water & Wastewater Public | |||||||
| Improvement District | |||||||
| Series A 5.125% 12/1/32 (NATL-RE) | $ | 2,555,000 | $ | 2,569,947 | |||
| Denver City & County | |||||||
| (Better Denver & Zoo) Series A 5.00% 8/1/25 | 3,215,000 | 3,841,506 | |||||
| (Justice System Facilities & Zoo) 5.00% 8/1/19 | 1,020,000 | 1,143,002 | |||||
| Denver City & County School Refunding District #1 | |||||||
| 4.00% 12/1/28 | 2,500,000 | 2,771,925 | |||||
| Denver International Business Center Metropolitan | |||||||
| District #1 5.00% 12/1/30 | 350,000 | 367,213 | |||||
| Douglas County School District #1 | |||||||
| (Douglas & Elbert Counties) 5.00% 12/15/22 | 1,175,000 | 1,471,077 | |||||
| Garfield County School District #2 | |||||||
| 5.00% 12/1/25 (AGM) | 2,280,000 | 2,615,935 | |||||
| Grand County School District #2 (East Grand) | |||||||
| 5.25% 12/1/25 (AGM) | 2,485,000 | 2,846,418 | |||||
| Gunnison Watershed School District #1J | |||||||
| Series 2009 5.25% 12/1/33 | 1,400,000 | 1,617,490 | |||||
| Ignacio School District #11JT | |||||||
| 5.00% 12/1/28 | 1,420,000 | 1,697,894 | |||||
| 5.00% 12/1/31 | 835,000 | 983,380 | |||||
| Jefferson County School District #1 5.25% 12/15/24 | 2,500,000 | 3,290,825 | |||||
| @ | North Range Metropolitan | ||||||
| District #1 4.50% 12/15/31 (ACA) | 1,500,000 | 1,305,975 | |||||
| District #2 5.50% 12/15/37 | 1,200,000 | 1,169,508 | |||||
| Rangely Hospital District 6.00% 11/1/26 | 2,250,000 | 2,665,418 | |||||
| Weld County School District #4 5.00% 12/1/19 (AGM) | 1,085,000 | 1,279,909 | |||||
| 31,637,422 | |||||||
| §Pre-Refunded Bonds – 8.19% | |||||||
| Adams & Arapahoe Counties Joint School | |||||||
| District #28J (Aurora) 6.00% 12/1/28-18 | 2,500,000 | 3,249,300 | |||||
| Colorado Health Facilities Authority Revenue | |||||||
| (Adventist Health) 5.125% 11/15/24-16 | 75,000 | 89,531 | |||||
| (Evangelical Lutheran) Series A 6.125% 6/1/38-14 | 5,250,000 | 5,776,786 | |||||
| Denver West Metropolitan District | |||||||
| 5.00% 12/1/33-13 (RADIAN) | 1,400,000 | 1,413,580 | |||||
49
Statements of net assets
Delaware Tax-Free Colorado Fund
| Principal amount | Value | ||||||
| Municipal Bonds (continued) | |||||||
| §Pre-Refunded Bonds (continued) | |||||||
| Douglas County School District #1 | |||||||
| (Douglas & Elbert Counties) | |||||||
| Series B 5.00% 12/15/24-16 | $ | 2,355,000 | $ | 2,794,278 | |||
| El Paso County Certificates of Participation | |||||||
| (Detention Facilities Project) | |||||||
| Series B 5.00% 12/1/27-12 (AMBAC) | 1,500,000 | 1,517,880 | |||||
| Fremont County School District #1 (Canon City) | |||||||
| 5.00% 12/1/24-13 (NATL-RE) | 1,000,000 | 1,059,790 | |||||
| Garfield Pitkin & Eagle Counties School District #1 | |||||||
| (Roaring Fork) | |||||||
| Series A 5.00% 12/15/27-14 (AGM) | 1,500,000 | 1,660,245 | |||||
| La Plata County School District #9 (Durango) | |||||||
| 5.125% 11/1/24-13 (NATL-RE) | 1,000,000 | 1,057,340 | |||||
| Puerto Rico Commonwealth Public Improvement | |||||||
| Series A 5.25% 7/1/21-13 | 1,250,000 | 1,302,800 | |||||
| Puerto Rico Public Buildings Authority Revenue | |||||||
| (Guaranteed Government Facilities) | |||||||
| Series I 5.25% 7/1/33-14 | 25,000 | 27,215 | |||||
| Sand Creek Metropolitan District | |||||||
| 5.00% 12/1/31-13 (SGI) | 135,000 | 142,808 | |||||
| 20,091,553 | |||||||
| Special Tax Revenue Bonds – 15.90% | |||||||
| Aspen Sales Tax Revenue (Parks & Open Spaces) | |||||||
| Series B 5.25% 11/1/23 (AGM) | 2,040,000 | 2,298,101 | |||||
| @ | Baptist Road Rural Transportation Authority Sales & | ||||||
| Use Tax Revenue 5.00% 12/1/26 | 1,575,000 | 1,224,437 | |||||
| Denver City & County Justice System Facilities | |||||||
| 5.00% 8/1/21 | 1,500,000 | 1,733,265 | |||||
| Denver Convention Center Hotel Authority Revenue | |||||||
| 5.00% 12/1/35 (SGI) | 3,495,000 | 3,584,541 | |||||
| Denver International Business Center Metropolitan | |||||||
| District #1 5.375% 12/1/35 | 1,750,000 | 1,837,815 | |||||
| Guam Government Business Privilege Tax Revenue | |||||||
| Series A | |||||||
| 5.125% 1/1/42 | 1,250,000 | 1,391,000 | |||||
| 5.25% 1/1/36 | 1,675,000 | 1,891,645 | |||||
50
| Principal amount | Value | ||||||
| Municipal Bonds (continued) | |||||||
| Special Tax Revenue Bonds (continued) | |||||||
| Park Meadows Business Improvement District Shared | |||||||
| Sales Tax Revenue | |||||||
| 5.30% 12/1/27 | $ | 950,000 | $ | 1,008,359 | |||
| 5.35% 12/1/31 | 720,000 | 757,217 | |||||
| Puerto Rico Sales Tax Financing Corporation Revenue | |||||||
| First Subordinate | |||||||
| Ω(Convertible Capital Appreciation) Series A | |||||||
| 6.75% 8/1/32 | 1,345,000 | 1,392,882 | |||||
| Series A 5.25% 8/1/27 | 1,100,000 | 1,248,753 | |||||
| Series A 5.50% 8/1/42 | 1,500,000 | 1,621,620 | |||||
| Series A 5.75% 8/1/37 | 2,620,000 | 2,925,571 | |||||
| Series A-1 5.00% 8/1/43 | 1,770,000 | 1,860,235 | |||||
| Series C 5.00% 8/1/40 | 2,500,000 | 2,710,250 | |||||
| Series C 5.00% 8/1/46 | 5,500,000 | 5,936,314 | |||||
| Series C 5.50% 8/1/40 | 1,000,000 | 1,087,100 | |||||
| Regional Transportation District Sales Tax Revenue | |||||||
| (FasTracks Project) Series A | |||||||
| 5.00% 11/1/28 (AMBAC) | 2,500,000 | 2,870,975 | |||||
| 5.25% 11/1/18 | 1,000,000 | 1,243,790 | |||||
| Sand Creek Metropolitan District 5.00% 12/1/31 (SGI) | 365,000 | 367,675 | |||||
| 38,991,545 | |||||||
| State & Territory General Obligation Bonds – 5.01% | |||||||
| Puerto Rico Commonwealth Public Improvement | |||||||
| Series A 5.00% 7/1/41 | 5,500,000 | 5,478,824 | |||||
| Series A 5.50% 7/1/19 (NATL-RE) (IBC) | 1,220,000 | 1,367,169 | |||||
| Series A 5.75% 7/1/41 | 3,850,000 | 4,117,691 | |||||
| Series E 5.375% 7/1/30 | 1,250,000 | 1,334,088 | |||||
| 12,297,772 | |||||||
| Transportation Revenue Bonds – 7.88% | |||||||
| Denver City & County Airport System Revenue | |||||||
| Series A 5.00% 11/15/25 (NATL-RE) (FGIC) | 2,000,000 | 2,265,780 | |||||
| Series A 5.25% 11/15/36 | 2,500,000 | 2,812,800 | |||||
| Series B 5.00% 11/15/33 (SGI) | 2,000,000 | 2,084,140 | |||||
| E-470 Public Highway Authority Series C | |||||||
| 5.25% 9/1/25 | 690,000 | 751,514 | |||||
| 5.375% 9/1/26 | 2,000,000 | 2,180,980 | |||||
| Puerto Rico Commonwealth Highway & Transportation | |||||||
| Authority Revenue Series K 5.00% 7/1/30 | 4,700,000 | 4,768,431 | |||||
51
Statements of net assets
Delaware Tax-Free Colorado Fund
| Principal amount | Value | |||||||
| Municipal Bonds (continued) | ||||||||
| Transportation Revenue Bonds (continued) | ||||||||
| Regional Transportation District Revenue | ||||||||
| (Denver Transit Partners) | ||||||||
| 6.00% 1/15/34 | $ | 1,450,000 | $ | 1,689,352 | ||||
| 6.00% 1/15/41 | 2,400,000 | 2,778,312 | ||||||
| 19,331,309 | ||||||||
| Water & Sewer Revenue Bonds – 0.58% | ||||||||
| Eagle River Water & Sanitation District Enterprise Revenue | ||||||||
| 5.00% 12/1/29 (ASSURED GTY) | 250,000 | 290,390 | ||||||
| Pueblo Board Waterworks Revenue | ||||||||
| 5.00% 11/1/21 (AGM) | 1,000,000 | 1,127,100 | ||||||
| 1,417,490 | ||||||||
| Total Municipal Bonds (cost $226,052,599) | 244,862,423 | |||||||
| Number of shares | ||||||||
| Short-Term Investments – 0.28% | ||||||||
| Money Market Mutual Fund – 0.16% | ||||||||
| Dreyfus Cash Management Fund | 376,500 | 376,500 | ||||||
| 376,500 | ||||||||
| Principal amount | ||||||||
| ¤Variable Rate Demand Note – 0.12% | ||||||||
| Colorado Educational & Cultural Facilities Authority | ||||||||
| (National Jewish Federation Bond Program) | ||||||||
| Series D-7 0.19% 2/1/35 | ||||||||
| (LOC-JPMorgan Chase Bank N.A.) | $ | 300,000 | 300,000 | |||||
| 300,000 | ||||||||
| Total Short-Term Investments (cost $676,500) | 676,500 | |||||||
| Total Value of Securities – 100.12% | ||||||||
| (cost $226,729,099) | 245,538,923 | |||||||
| Liabilities Net of Receivables and | ||||||||
| Other Assets – (0.12%) | (296,449 | ) | ||||||
| Net Assets Applicable to 21,065,629 | ||||||||
| Shares Outstanding – 100.00% | $ | 245,242,474 | ||||||
52
| Net Asset Value – Delaware Tax-Free Colorado Fund | |||||
| Class A ($230,787,672 / 19,827,117 Shares) | $11.64 | ||||
| Net Asset Value – Delaware Tax-Free Colorado Fund | |||||
| Class B ($173,092 / 14,857 Shares) | $11.65 | ||||
| Net Asset Value – Delaware Tax-Free Colorado Fund | |||||
| Class C ($14,281,710 / 1,223,655 Shares) | $11.67 | ||||
| Components of Net Assets at August 31, 2012: | |||||
| Shares of beneficial interest (unlimited authorization – no par) | $ | 227,706,481 | |||
| Undistributed net investment income | 352,562 | ||||
| Accumulated net realized loss on investments | (1,626,393 | ) | |||
| Net unrealized appreciation of investments | 18,809,824 | ||||
| Total net assets | $ | 245,242,474 | |||
| • | Variable rate security. The rate shown is the rate as of August 31, 2012. Interest rates reset periodically. |
| @ | Illiquid security. At August 31, 2012, the aggregate value of illiquid securities was $3,699,920, which represented 1.51% of the Fund’s net assets. See Note 8 in “Notes to financial statements.” |
| § | Pre-refunded bonds. Municipal bonds that are generally backed or secured by U.S. Treasury bonds. For pre-refunded bonds, the stated maturity is followed by the year in which the bond is pre-refunded. See Note 8 in “Notes to financial statements.” |
| Ω | Step coupon bond. Indicates security that has a zero coupon that remains in effect until a predetermined date at which time the stated interest rate becomes effective. |
| ¤ | Tax-exempt obligations that contain a floating or variable interest rate adjustment formula and an unconditional right of demand to receive payment of the unpaid principal balance plus accrued interest upon a short notice period (generally up to 30 days) prior to specified dates either from the issuer or by drawing on a bank letter of credit, a guarantee or insurance issued with respect to such instrument. The rate shown is the rate as of August 31, 2012. |
53
Statements of net assets
Delaware Tax-Free Colorado Fund
| Net Asset Value and Offering Price Per Share – | |||
| Delaware Tax-Free Colorado Fund | |||
| Net asset value Class A (A) | $ | 11.64 | |
| Sales charge (4.50% of offering price) (B) | 0.55 | ||
| Offering price | $ | 12.19 |
| (A) | Net asset value per share, as illustrated, is the amount which would be paid upon redemption or repurchase of shares. | |
| (B) | See the current prospectus for purchases of $100,000 or more. |
Summary of abbreviations:
ACA — Insured by American Capital Access
AGM — Insured by Assured Guaranty Municipal Corporation
AMBAC — Insured by AMBAC Assurance Corporation
ASSURED GTY — Insured by Assured Guaranty Corporation
FGIC — Insured by Financial Guaranty Insurance Company
FHA — Federal Housing Administration
FHLMC — Federal Home Loan Mortgage Corporation collateral
HUD — Housing and Urban Development Section 8
IBC — Insured Bond Certificate
LOC — Letter of Credit
NATL-RE — Insured by National Public Finance Guarantee Corporation
RADIAN — Insured by Radian Asset Assurance
SGI — Insured by Syncora Guarantee Inc.
VA — Veterans Administration collateral
See accompanying notes, which are an integral part of the financial statements.
54
| Delaware Tax-Free Idaho Fund | August 31, 2012 |
| Principal amount | Value | ||||||
| Municipal Bonds – 98.07% | |||||||
| Corporate Revenue Bonds – 5.93% | |||||||
| Nez Perce County Pollution Control Revenue | |||||||
| (Potlatch Project) 6.00% 10/1/24 | $ | 5,035,000 | $ | 5,034,647 | |||
| Power County Industrial Development Revenue | |||||||
| (FMC Project) 6.45% 8/1/32 (AMT) | 2,000,000 | 2,003,420 | |||||
| Power County Pollution Control Revenue | |||||||
| (FMC Project) 5.625% 10/1/14 | 2,475,000 | 2,477,228 | |||||
| 9,515,295 | |||||||
| Education Revenue Bonds – 8.39% | |||||||
| Boise State University | |||||||
| (General Project) Series A | |||||||
| 4.00% 4/1/37 | 1,250,000 | 1,303,075 | |||||
| 5.00% 4/1/42 | 1,350,000 | 1,543,765 | |||||
| (General Refunding) Series A | |||||||
| 4.25% 4/1/32 (NATL-RE) | 750,000 | 789,293 | |||||
| 5.00% 4/1/39 | 1,000,000 | 1,111,390 | |||||
| Idaho Housing & Financing Association Nonprofit | |||||||
| Facilities Revenue (North Star Charter School Project) | |||||||
| Series A 9.50% 7/1/39 | 1,000,000 | 1,111,440 | |||||
| Idaho State University Revenue 5.00% 4/1/20 (AGM) | 1,130,000 | 1,158,657 | |||||
| University of Idaho (General Refunding) | |||||||
| •Series 2011 5.25% 4/1/41 | 1,970,000 | 2,327,692 | |||||
| Series A 5.00% 4/1/21 (AMBAC) | 1,150,000 | 1,266,553 | |||||
| •Series B 4.50% 4/1/41 (AGM) | 1,000,000 | 1,135,280 | |||||
| Series B 5.00% 4/1/28 | 1,000,000 | 1,145,310 | |||||
| Series B 5.00% 4/1/32 | 500,000 | 563,930 | |||||
| 13,456,385 | |||||||
| Electric Revenue Bonds – 4.89% | |||||||
| Boise-Kuna Idaho Irrigation District Revenue | |||||||
| (Arrowrock Hydroelectric Project) 6.30% 6/1/31 | 1,000,000 | 1,144,350 | |||||
| Puerto Rico Electric Power Authority Revenue | |||||||
| Series A 5.00% 7/1/42 | 1,000,000 | 1,023,740 | |||||
| Series TT 5.00% 7/1/32 | 3,170,000 | 3,270,616 | |||||
| Series TT 5.00% 7/1/37 | 210,000 | 214,183 | |||||
| Series ZZ 5.25% 7/1/26 | 2,000,000 | 2,191,240 | |||||
| 7,844,129 | |||||||
55
Statements of net assets
Delaware Tax-Free Idaho Fund
| Principal amount | Value | ||||||
| Municipal Bonds (continued) | |||||||
| Healthcare Revenue Bonds – 7.95% | |||||||
| Idaho Health Facilities Authority Revenue | |||||||
| (St. Luke’s Health System Project) Series A | |||||||
| 4.50% 3/1/47 | $ | 1,500,000 | $ | 1,537,560 | |||
| 5.00% 3/1/47 | 1,500,000 | 1,615,380 | |||||
| 6.50% 11/1/23 | 250,000 | 296,485 | |||||
| 6.75% 11/1/37 | 1,250,000 | 1,483,025 | |||||
| (St. Luke’s Regional Medical Center Project) | |||||||
| 5.00% 7/1/35 (AGM) | 2,500,000 | 2,764,799 | |||||
| (Trinity Health Center Group) | |||||||
| Series B 6.125% 12/1/28 | 1,000,000 | 1,194,760 | |||||
| Series D 4.50% 12/1/37 | 1,205,000 | 1,296,460 | |||||
| Puerto Rico Industrial Tourist Educational Medical & | |||||||
| Environmental Control Facilities Financing Authority | |||||||
| (Auxilio Mutuo) Series A 6.00% 7/1/33 | 2,245,000 | 2,559,188 | |||||
| 12,747,657 | |||||||
| Housing Revenue Bonds – 2.87% | |||||||
| Idaho Housing & Finance Association Single Family | |||||||
| Mortgage Revenue | |||||||
| Series A 6.05% 7/1/13 (AMBAC) (FHA) (VA) (AMT) | 5,000 | 5,014 | |||||
| Series A 6.10% 7/1/16 (FHA) (VA) (AMT) | 5,000 | 5,013 | |||||
| Series A Class II 4.375% 7/1/32 | 1,000,000 | 1,066,870 | |||||
| Series B 6.45% 7/1/15 (AMT) | 5,000 | 5,015 | |||||
| Series B Class I 5.00% 7/1/37 (AMT) | 435,000 | 444,331 | |||||
| Series B Class I 5.50% 7/1/38 | 10,000 | 10,042 | |||||
| Series C Class II 4.95% 7/1/31 | 1,000,000 | 1,089,050 | |||||
| Series G-2 6.15% 7/1/15 (FHA) (VA) (AMT) | 15,000 | 15,043 | |||||
| Series I-1 Class I 5.45% 1/1/39 (AMT) | 825,000 | 854,304 | |||||
| Puerto Rico Housing Finance Authority Subordinated- | |||||||
| Capital Fund Modernization 5.125% 12/1/27 | 1,000,000 | 1,105,050 | |||||
| 4,599,732 | |||||||
| Lease Revenue Bonds – 2.66% | |||||||
| Idaho Housing & Finance Association Revenue | |||||||
| (TDF Facilities PJ-Recovery Zone) Series A | |||||||
| 6.50% 2/1/26 | 1,370,000 | 1,535,688 | |||||
| 7.00% 2/1/36 | 1,500,000 | 1,672,335 | |||||
| Puerto Rico Public Buildings Authority Revenue | |||||||
| (Government Facilities) Series U 5.25% 7/1/42 | 1,035,000 | 1,052,823 | |||||
| 4,260,846 | |||||||
56
| Principal amount | Value | ||||||
| Municipal Bonds (continued) | |||||||
| Local General Obligation Bonds – 21.58% | |||||||
| Ada & Canyon Counties Joint School District #2 Meridian | |||||||
| (School Board Guaranteed Program) | |||||||
| 4.50% 7/30/22 | $ | 1,500,000 | $ | 1,786,950 | |||
| 4.75% 2/15/20 | 1,000,000 | 1,092,780 | |||||
| 5.50% 7/30/16 | 1,305,000 | 1,547,365 | |||||
| Bannock County School District #25 Pocatello/Chubbuck | |||||||
| (School Board Guaranteed Program) | |||||||
| 5.00% 8/15/15 | 1,040,000 | 1,133,163 | |||||
| 5.00% 8/15/16 | 1,100,000 | 1,194,963 | |||||
| Boise City Independent School District | |||||||
| 5.00% 8/1/24 (AGM) | 1,500,000 | 1,733,820 | |||||
| Bonneville Joint School District #93 | |||||||
| (School Board Guaranteed program) | |||||||
| 5.00% 9/15/30 | 1,515,000 | 1,857,708 | |||||
| 5.00% 9/15/31 | 870,000 | 1,060,739 | |||||
| Canyon County School District #131 Nampa | |||||||
| (School Board Guaranteed Program) | |||||||
| Series B 5.00% 8/15/23 | 1,295,000 | 1,630,755 | |||||
| Canyon County School District #132 Caldwell | |||||||
| 5.00% 7/30/15 (NATL-RE) (FGIC) | 2,000,000 | 2,232,760 | |||||
| Series A 5.00% 9/15/22 (AGM) | 1,725,000 | 2,024,788 | |||||
| Series A 5.00% 9/15/23 (AGM) | 1,810,000 | 2,124,560 | |||||
| Idaho Board Bank Authority Revenue | |||||||
| Series A 5.00% 9/15/28 | 1,250,000 | 1,445,175 | |||||
| Series A 5.00% 9/15/31 | 1,025,000 | 1,231,148 | |||||
| Series A 5.00% 9/15/33 | 1,125,000 | 1,335,578 | |||||
| Series A 5.25% 9/15/26 | 2,000,000 | 2,366,660 | |||||
| Series C 4.00% 9/15/29 | 1,320,000 | 1,459,181 | |||||
| Lemhi County 5.20% 8/1/27 (AGM) | 2,145,000 | 2,180,221 | |||||
| Nampa City Series B 5.00% 8/1/21 (NATL-RE) (FGIC) | 2,475,000 | 2,756,728 | |||||
| Twin Falls County School District #413 Filer | |||||||
| (School Board Guaranteed Program) 5.25% 9/15/25 | 2,000,000 | 2,398,840 | |||||
| 34,593,882 | |||||||
| §Pre-Refunded Bonds – 8.88% | |||||||
| Ada & Canyon Counties Joint School District #3 Kuna | |||||||
| (School Board Guaranteed Program) 4.75% 8/15/22-14 | 600,000 | 651,996 | |||||
| Boise State University Revenue | |||||||
| (General Refunding) Series A | |||||||
| 5.00% 4/1/18-14 (NATL-RE) (FGIC) | 1,500,000 | 1,611,270 | |||||
57
Statements of net assets
Delaware Tax-Free Idaho Fund
| Principal amount | Value | ||||||
| Municipal Bonds (continued) | |||||||
| §Pre-Refunded Bonds (continued) | |||||||
| Boise State University Revenue | |||||||
| (Student Union & Housing System) | |||||||
| 5.00% 4/1/17-13 (AMBAC) | $ | 500,000 | $ | 513,970 | |||
| Idaho State Building Authority Revenue Series A | |||||||
| 5.00% 9/1/33-13 (SGI) | 1,000,000 | 1,047,800 | |||||
| 5.00% 9/1/43-13 (SGI) | 5,750,000 | 6,024,849 | |||||
| Idaho State University Revenue | |||||||
| 5.00% 4/1/23-13 (AGM) | 2,115,000 | 2,174,093 | |||||
| Moscow Sewer Revenue 5.00% 11/1/22-12 (AGM) | 2,175,000 | 2,191,661 | |||||
| Puerto Rico Sales Tax Financing Revenue First | |||||||
| Subordinate Series A 5.50% 8/1/28-19 | 15,000 | 19,443 | |||||
| 14,235,082 | |||||||
| Special Tax Revenue Bonds – 22.74% | |||||||
| Coeur d’Alene Local Improvement District #6 | |||||||
| 6.10% 7/1/14 | 45,000 | 45,597 | |||||
| Guam Government Business Privilege Tax Revenue Series A | |||||||
| 5.125% 1/1/42 | 545,000 | 606,476 | |||||
| 5.25% 1/1/36 | 705,000 | 796,185 | |||||
| Idaho Board Bank Authority Revenue Series B | |||||||
| 5.00% 9/15/30 (NATL-RE) | 725,000 | 822,252 | |||||
| Idaho Water Resource Board | |||||||
| (Ground Water Rights Mitigation) | |||||||
| Series A 5.00% 9/1/32 | 3,565,000 | 3,897,970 | |||||
| Ketchum Urban Renewal Agency 5.50% 10/15/34 | 1,500,000 | 1,614,240 | |||||
| Nampa Development Revenue 5.90% 3/1/30 | 3,000,000 | 3,238,110 | |||||
| Puerto Rico Sales Tax Financing Revenue First Subordinate | |||||||
| ^(Capital Appreciation) Series A | |||||||
| 5.03% 8/1/44 (NATL-RE) | 5,125,000 | 881,193 | |||||
| 5.04% 8/1/45 (NATL-RE) | 5,280,000 | 851,189 | |||||
| Ω(Convertible Capital Appreciation) Series A 6.75% 8/1/32 | 735,000 | 761,166 | |||||
| Series A 5.00% 8/1/26 | 1,300,000 | 1,445,756 | |||||
| Series A 5.25% 8/1/27 | 3,000,000 | 3,405,689 | |||||
| Series A 5.50% 8/1/42 | 3,500,000 | 3,783,779 | |||||
| Series A-1 5.00% 8/1/43 | 1,060,000 | 1,114,039 | |||||
| Series B 5.75% 8/1/37 | 2,660,000 | 2,970,236 | |||||
| Series C 5.00% 8/1/40 | 2,500,000 | 2,710,250 | |||||
| Series C 5.50% 8/1/40 | 1,960,000 | 2,130,716 | |||||
| (Un-Refunded) Series A 5.50% 8/1/28 | 1,385,000 | 1,589,080 | |||||
58
| Principal amount | Value | ||||||
| Municipal Bonds (continued) | |||||||
| Special Tax Revenue Bonds (continued) | |||||||
| Virgin Islands Public Finance Authority Revenue | |||||||
| (Senior Lien-Matching Fund Loan Note) Series A | |||||||
| 5.00% 10/1/29 | $ | 2,220,000 | $ | 2,425,661 | |||
| 5.25% 10/1/20 | 500,000 | 532,620 | |||||
| 5.25% 10/1/24 | 800,000 | 843,288 | |||||
| 36,465,492 | |||||||
| State & Territory General Obligation Bonds – 3.43% | |||||||
| Puerto Rico Commonwealth Public Improvement | |||||||
| Series A 5.00% 7/1/41 | 750,000 | 747,113 | |||||
| Series A 5.75% 7/1/41 | 3,850,000 | 4,117,690 | |||||
| Series E 5.375% 7/1/30 | 600,000 | 640,362 | |||||
| 5,505,165 | |||||||
| Transportation Revenue Bonds – 6.69% | |||||||
| Boise Airport Revenue (Air Terminal Facilities Project) | |||||||
| 5.75% 9/1/19 (AGM) (AMT) | 1,000,000 | 1,215,540 | |||||
| 5.75% 9/1/20 (AGM) (AMT) | 1,000,000 | 1,226,040 | |||||
| Idaho Housing & Finance Association Grant Revenue | |||||||
| (Anticipated Federal Highway Trust) | |||||||
| 5.00% 7/15/24 (NATL-RE) | 2,000,000 | 2,254,140 | |||||
| Series A 5.25% 7/15/20 (ASSURED GTY) | 2,750,000 | 3,281,466 | |||||
| Series A 5.25% 7/15/25 (ASSURED GTY) | 1,500,000 | 1,779,210 | |||||
| Puerto Rico Highway & Transportation Authority Revenue | |||||||
| Series K 5.00% 7/1/30 | 890,000 | 902,958 | |||||
| Un-Refunded Series W 5.50% 7/1/15 | 55,000 | 60,125 | |||||
| 10,719,479 | |||||||
| Water & Sewer Revenue Bonds – 2.06% | |||||||
| Idaho Board Bank Authority Revenue | |||||||
| Series C 5.375% 9/15/38 | 1,000,000 | 1,133,530 | |||||
| Puerto Rico Commonwealth Aqueduct & | |||||||
| Sewer Authority Revenue Senior Lien Series A | |||||||
| 5.125% 7/1/37 | 1,500,000 | 1,504,486 | |||||
| 5.25% 7/1/42 | 265,000 | 266,701 | |||||
| 6.00% 7/1/47 | 365,000 | 399,733 | |||||
| 3,304,450 | |||||||
| Total Municipal Bonds (cost $145,107,302) | 157,247,594 | ||||||
59
Statements of net assets
Delaware Tax-Free Idaho Fund
| Number of shares | Value | ||||||
| Short-Term Investments – 1.04% | |||||||
| Money Market Mutual Fund – 0.78% | |||||||
| Dreyfus Cash Management Fund | 1,249,307 | $ | 1,249,307 | ||||
| 1,249,307 | |||||||
| Principal amount | |||||||
| ¤Variable Rate Demand Note – 0.26% | |||||||
| Idaho State University Foundation Revenue | |||||||
| (L.E. & Thelma Stephens Project) | |||||||
| 0.17% 5/1/21 (LOC-Wells Fargo Bank, N.A.) | $420,000 | 420,000 | |||||
| 420,000 | |||||||
| Total Short-Term Investments (cost $1,669,307) | 1,669,307 | ||||||
| Total Value of Securities – 99.11% | |||||||
| (cost $146,776,609) | 158,916,901 | ||||||
| Receivables and Other Assets | |||||||
| Net of Liabilities – 0.89% | 1,428,313 | ||||||
| Net Assets Applicable to 13,099,210 | |||||||
| Shares Outstanding – 100.00% | $ | 160,345,214 | |||||
| Net Asset Value – Delaware Tax-Free Idaho Fund | |||||||
| Class A ($119,025,624 / 9,721,698 Shares) | $12.24 | ||||||
| Net Asset Value – Delaware Tax-Free Idaho Fund | |||||||
| Class B ($581,681 / 47,596 Shares) | $12.22 | ||||||
| Net Asset Value – Delaware Tax-Free Idaho Fund | |||||||
| Class C ($40,737,909 / 3,329,916 Shares) | $12.23 | ||||||
| Components of Net Assets at August 31, 2012: | |||||||
| Shares of beneficial interest (unlimited authorization – no par) | $ | 149,358,034 | |||||
| Distributions in excess of net investment income | (16,644 | ) | |||||
| Accumulated net realized loss on investments | (1,136,468 | ) | |||||
| Net unrealized appreciation of investments | 12,140,292 | ||||||
| Total net assets | $ | 160,345,214 | |||||
60
| • | Variable rate security. The rate shown is the rate as of August 31, 2012. Interest rates reset periodically. |
| § | Pre-refunded bonds. Municipal bonds that are generally backed or secured by U.S. Treasury bonds. For pre-refunded bonds, the stated maturity is followed by the year in which the bond is pre-refunded. See Note 8 in “Notes to financial statements.” |
| ^ | Zero coupon security. The rate shown is the yield at the time of purchase. |
| Ω | Step coupon bond. Indicates security that has a zero coupon that remains in effect until a predetermined date at which time the stated interest rate becomes effective. |
| ¤ | Tax-exempt obligations that contain a floating or variable interest rate adjustment formula and an unconditional right of demand to receive payment of the unpaid principal balance plus accrued interest upon a short notice period (generally up to 30 days) prior to specified dates either from the issuer or by drawing on a bank letter of credit, a guarantee or insurance issued with respect to such instrument. The rate shown is the rate as of August 31, 2012. |
| Net Asset Value and Offering Price Per Share – | |||
| Delaware Tax-Free Idaho Fund | |||
| Net asset value Class A (A) | $ | 12.24 | |
| Sales charge (4.50% of offering price) (B) | 0.58 | ||
| Offering price | $ | 12.82 |
| (A) | Net asset value per share, as illustrated, is the amount which would be paid upon redemption or repurchase of shares. |
| (B) | See the current prospectus for purchases of $100,000 or more. |
Summary of abbreviations:
AGM — Insured by Assured Guaranty Municipal Corporation
AMBAC — Insured by AMBAC Assurance Corporation
AMT — Subject to Alternative Minimum Tax
ASSURED GTY — Insured by Assured Guaranty Corporation
FGIC — Insured by Financial Guaranty Insurance Company
FHA — Federal Housing Administration
LOC — Letter of Credit
NATL-RE — Insured by National Public Finance Guarantee Corporation
SGI — Insured by Syncora Guarantee Inc.
VA — Veterans Administration collateral
See accompanying notes, which are an integral part of the financial statements.
61
| Statements of net assets | |
| Delaware Tax-Free New York Fund | August 31, 2012 |
| Principal amount | Value | ||||||
| Municipal Bonds – 98.31% | |||||||
| Corporate Revenue Bonds – 9.48% | |||||||
| Chautauqua County Industrial Development Agency | |||||||
| Exempt Facilities Revenue (NRG Dunkirk Power Project) | |||||||
| 5.875% 4/1/42 | $ | 1,000,000 | $ | 1,126,030 | |||
| Jefferson County Industrial Development Agency | |||||||
| Solid Waste Disposal (International Paper) | |||||||
| Series A 5.20% 12/1/20 (AMT) | 350,000 | 364,322 | |||||
| Nassau County Tobacco Settlement Revenue | |||||||
| (Asset-Backed) Series A-3 5.125% 6/1/46 | 600,000 | 421,110 | |||||
| • | New York City Industrial Development | ||||||
| Agency Special Facilities Revenue | |||||||
| (American Airlines-JFK International Airport) | |||||||
| 7.75% 8/1/31 (AMT) | 250,000 | 262,915 | |||||
| New York Liberty Development Revenue | |||||||
| (Goldman Sachs Headquarters) 5.25% 10/1/35 | 625,000 | 729,013 | |||||
| (Second Priority-Bank of America Tower) | |||||||
| 5.625% 7/15/47 | 500,000 | 561,415 | |||||
| 6.375% 7/15/49 | 1,265,000 | 1,453,800 | |||||
| Suffolk County Industrial Development Agency Revenue | |||||||
| (Keyspan-Port Jefferson Energy Center) | |||||||
| 5.25% 6/1/27 (AMT) | 250,000 | 257,083 | |||||
| Suffolk Tobacco Asset Securitization Series B 5.25% 6/1/37 | 700,000 | 747,572 | |||||
| TSASC Revenue (Asset-Backed) Series 1 | |||||||
| 5.00% 6/1/34 | 500,000 | 381,405 | |||||
| 5.125% 6/1/42 | 1,000,000 | 736,760 | |||||
| 7,041,425 | |||||||
| Education Revenue Bonds – 16.99% | |||||||
| Albany Industrial Development Agency Civic Facilities | |||||||
| Revenue (Brighter Choice Charter School) | |||||||
| Series A 5.00% 4/1/37 | 250,000 | 241,080 | |||||
| Buffalo & Erie County Industrial Land Development | |||||||
| (Buffalo State College Foundation Housing) 6.00% 10/1/31 | 525,000 | 642,279 | |||||
| Hempstead Town Local Development Revenue | |||||||
| (Molloy College Project) 5.75% 7/1/23 | 400,000 | 473,320 | |||||
| Madison County Capital Resource Revenue | |||||||
| (Colgate University Project) Series A 5.00% 7/1/28 | 400,000 | 467,472 | |||||
| Monroe County Industrial Development Revenue | |||||||
| (Nazareth College Rochester Project) | |||||||
| 5.25% 10/1/31 | 500,000 | 561,980 | |||||
| 5.50% 10/1/41 | 500,000 | 555,630 | |||||
62
| Principal amount | Value | ||||||
| Municipal Bonds (continued) | |||||||
| Education Revenue Bonds (continued) | |||||||
| New York City Trust for Cultural Resources | |||||||
| (Whitney Museum of American Art) 5.00% 7/1/31 | $ | 500,000 | $ | 564,380 | |||
| New York State Dormitory Authority Revenue | |||||||
| (Brooklyn Law School) 5.75% 7/1/33 | 340,000 | 391,357 | |||||
| (Cornell University) Series A | |||||||
| 4.75% 7/1/29 | 100,000 | 114,625 | |||||
| 5.00% 7/1/34 | 170,000 | 195,422 | |||||
| (Manhattan Marymount) 5.00% 7/1/24 | 350,000 | 380,870 | |||||
| (Mt. Sinai School of Medicine) 5.125% 7/1/39 | 500,000 | 552,015 | |||||
| (New York University) Series A 5.25% 7/1/34 | 500,000 | 598,630 | |||||
| (Rockefeller University) Series A 5.00% 7/1/27 | 250,000 | 303,258 | |||||
| (Skidmore College) Series A 5.00% 7/1/21 | 325,000 | 394,485 | |||||
| (St. Joseph’s College) 5.25% 7/1/25 | 500,000 | 540,770 | |||||
| (Teachers College) 5.50% 3/1/39 | 250,000 | 282,330 | |||||
| (University of Rochester) | |||||||
| Series A 5.125% 7/1/39 | 250,000 | 281,033 | |||||
| Series A-2 4.375% 7/1/20 | 225,000 | 244,485 | |||||
| (Yeshiva University) Series A 5.00% 11/1/40 | 1,000,000 | 1,112,979 | |||||
| Onondaga Civic Development Revenue | |||||||
| (Le Moyne College Project) 5.20% 7/1/29 | 500,000 | 545,070 | |||||
| Onondaga County Trust for Cultural Research Revenue | |||||||
| (Syracuse University Project) Series B 5.00% 12/1/19 | 350,000 | 427,553 | |||||
| St. Lawrence County Industrial Development Agency Civic | |||||||
| Facility Revenue (St. Lawrence University) | |||||||
| Series A 5.00% 10/1/16 | 500,000 | 574,515 | |||||
| Suffolk County Industrial Development Agency Civic Facility | |||||||
| Revenue (New York Institute of Technology Project) | |||||||
| 5.00% 3/1/26 | 600,000 | 620,622 | |||||
| Troy Industrial Development Authority Civic Facility Revenue | |||||||
| (Rensselaer Polytechnic) Series E 5.20% 4/1/37 | 500,000 | 557,170 | |||||
| Yonkers Economic Development Education Revenue | |||||||
| (Charter School Educational Excellence) | |||||||
| Series A 6.25% 10/15/40 | 600,000 | 627,516 | |||||
| Yonkers Industrial Development Agency Civic Facility | |||||||
| Revenue (Sarah Lawrence College Project) | |||||||
| Series A 6.00% 6/1/29 | 325,000 | 372,925 | |||||
| 12,623,771 | |||||||
63
Statements of net assets
Delaware Tax-Free New York Fund
| Principal amount | Value | ||||||
| Municipal Bonds (continued) | |||||||
| Electric Revenue Bonds – 3.50% | |||||||
| Long Island Power Authority Electric System Revenue | |||||||
| Series A 5.00% 9/1/37 | $ | 500,000 | $ | 561,700 | |||
| Series A 5.75% 4/1/39 | 350,000 | 418,856 | |||||
| Series B 5.75% 4/1/33 | 250,000 | 297,445 | |||||
| New York Power Authority Series A 5.00% 11/15/38 | 500,000 | 579,239 | |||||
| Puerto Rico Electric Power Authority Revenue | |||||||
| Series WW 5.00% 7/1/28 | 190,000 | 198,932 | |||||
| Series ZZ 5.25% 7/1/26 | 500,000 | 547,810 | |||||
| 2,603,982 | |||||||
| Healthcare Revenue Bonds – 15.41% | |||||||
| Albany Industrial Development Agency Civic Facility | |||||||
| Revenue (St. Peter’s Hospital Project) | |||||||
| Series A 5.25% 11/15/32 | 800,000 | 861,912 | |||||
| East Rochester Housing Authority Revenue | |||||||
| (Senior Living-Woodland Village Project) 5.50% 8/1/33 | 500,000 | 498,130 | |||||
| Monroe County Industrial Development Insured Mortgage | |||||||
| Revenue (University Hospital of Rochester Project) | |||||||
| 5.50% 8/15/40 (FHA) | 585,000 | 675,774 | |||||
| New York City Health & Hospital Revenue (Health System) | |||||||
| Series A 5.00% 2/15/30 | 500,000 | 565,110 | |||||
| New York Dormitory Authority Revenue | |||||||
| (Catholic Health Long Island Obligation Group) | |||||||
| 5.00% 7/1/27 | 400,000 | 409,760 | |||||
| (Chapel Oaks) 5.45% 7/1/26 (LOC-Allied Irish Bank) | 450,000 | 451,058 | |||||
| (Winthrop South Nassau Hospital) Series B 5.50% 7/1/23 | 500,000 | 508,200 | |||||
| New York Dormitory Authority Revenue | |||||||
| Non-State Supported Debt | |||||||
| (Memorial Sloan-Kettering) | |||||||
| 5.00% 7/1/41 | 180,000 | 206,347 | |||||
| Series 1 4.375% 7/1/34 | 600,000 | 652,182 | |||||
| Series 1 5.00% 7/1/23 | 600,000 | 737,052 | |||||
| Series 1 5.00% 7/1/35 | 225,000 | 248,661 | |||||
| Series B 5.00% 5/1/39 | 500,000 | 548,350 | |||||
| Subordinate Series A2 5.00% 7/1/26 | 500,000 | 566,860 | |||||
| (Mt. Sinai Hospital) Series A 5.00% 7/1/26 | 600,000 | 674,946 | |||||
| (North Shore Long Island Jewish Group) Series A | |||||||
| 5.00% 5/1/41 | 500,000 | 549,155 | |||||
| 5.50% 5/1/37 | 500,000 | 569,330 | |||||
64
| Principal amount | Value | ||||||
| Municipal Bonds (continued) | |||||||
| Healthcare Revenue Bonds (continued) | |||||||
| New York Dormitory Authority Revenue | |||||||
| Non-State Supported Debt | |||||||
| (Orange Regional Medical Center) | |||||||
| 6.125% 12/1/29 | $ | 540,000 | $ | 593,465 | |||
| 6.25% 12/1/37 | 250,000 | 272,165 | |||||
| Suffolk County Economic Development Revenue | |||||||
| (Catholic Health Services) 5.00% 7/1/28 | 1,000,000 | 1,138,750 | |||||
| (Peconic Landing Southland) 6.00% 12/1/40 | 650,000 | 721,487 | |||||
| 11,448,694 | |||||||
| Housing Revenue Bonds – 1.04% | |||||||
| New York City Housing Development Multifamily Housing | |||||||
| Revenue Series G-1 4.875% 11/1/39 (AMT) | 250,000 | 257,483 | |||||
| New York Mortgage Agency Revenue 44th Series | |||||||
| 4.35% 10/1/24 (AMT) | 485,000 | 514,560 | |||||
| 772,043 | |||||||
| Lease Revenue Bonds – 14.15% | |||||||
| Battery Park City Authority Revenue | |||||||
| Series A 5.00% 11/1/26 | 250,000 | 262,543 | |||||
| Erie County Industrial Development Agency School Facility | |||||||
| Revenue (Buffalo City School District) | |||||||
| Series A 5.25% 5/1/25 | 500,000 | 580,670 | |||||
| Hudson Yards Infrastructure Revenue Series A | |||||||
| 5.00% 2/15/47 | 500,000 | 529,730 | |||||
| 5.25% 2/15/47 | 600,000 | 676,500 | |||||
| 5.75% 2/15/47 | 1,000,000 | 1,175,030 | |||||
| New York City Industrial Development Agency | |||||||
| Special Airport Facility Revenue | |||||||
| (Airis JFK I Project) Series A 5.50% 7/1/28 (AMT) | 500,000 | 501,445 | |||||
| (Senior Trips) Series A 5.00% 7/1/28 (AMT) | 1,500,000 | 1,588,949 | |||||
| New York Liberty Development (World Trade Center Project) | |||||||
| 5.00% 11/15/31 | 500,000 | 574,475 | |||||
| 5.00% 3/15/44 | 600,000 | 646,440 | |||||
| 5.75% 11/15/51 | 1,055,000 | 1,250,871 | |||||
| Onondaga County Industrial Development Agency Revenue | |||||||
| (Air Cargo) 7.25% 1/1/32 (AMT) | 500,000 | 506,990 | |||||
| Puerto Rico Public Finance (Commonwealth Appropriation) | |||||||
| Series B 5.50% 8/1/31 | 870,000 | 923,114 | |||||
65
Statements of net assets
Delaware Tax-Free New York Fund
| Principal amount | Value | ||||||
| Municipal Bonds (continued) | |||||||
| Lease Revenue Bonds (continued) | |||||||
| Tobacco Settlement Financing Authority Revenue | |||||||
| (Asset-Backed) Series B-1C | |||||||
| 5.50% 6/1/20 | $ | 200,000 | $ | 207,636 | |||
| 5.50% 6/1/21 | 500,000 | 519,090 | |||||
| United Nations Development Revenue | |||||||
| Series A 5.00% 7/1/26 | 500,000 | 568,465 | |||||
| 10,511,948 | |||||||
| Local General Obligation Bonds – 4.88% | |||||||
| New York City | |||||||
| Series C-1 5.00% 10/1/19 | 500,000 | 588,285 | |||||
| Series D 5.00% 11/1/34 | 125,000 | 134,401 | |||||
| Series D-1 5.00% 10/1/36 | 1,000,000 | 1,142,160 | |||||
| Series I-1 5.375% 4/1/36 | 500,000 | 578,695 | |||||
| New York State Dormitory Authority | |||||||
| Revenue Non-State Supported Debt | |||||||
| (School Districts-Financing Program) Series A | |||||||
| 5.00% 10/1/23 | 500,000 | 600,685 | |||||
| 5.00% 10/1/25 (AGM) | 500,000 | 581,230 | |||||
| 3,625,456 | |||||||
| §Pre-Refunded Bonds – 2.15% | |||||||
| New York State Dormitory Authority Revenue | |||||||
| (Columbia University) Series A 5.00% 7/1/23-13 | 500,000 | 520,035 | |||||
| Puerto Rico Commonwealth Highway & Transportation | |||||||
| Authority Revenue Series Y 5.50% 7/1/36-16 | 475,000 | 568,566 | |||||
| Schenectady Metroplex Development Authority Revenue | |||||||
| Series A 5.375% 12/15/21-12 | 500,000 | 507,455 | |||||
| 1,596,056 | |||||||
| Special Tax Revenue Bonds – 12.91% | |||||||
| Brooklyn Arena Local Development Revenue | |||||||
| (Barclays Center Project) | |||||||
| 6.25% 7/15/40 | 500,000 | 581,585 | |||||
| 6.375% 7/15/43 | 500,000 | 584,530 | |||||
| 6.50% 7/15/30 | 500,000 | 599,215 | |||||
| Guam Government Business Privilege Tax Revenue Series A | |||||||
| 5.125% 1/1/42 | 185,000 | 205,868 | |||||
| 5.25% 1/1/36 | 240,000 | 271,042 | |||||
| Metropolitan Transportation Authority Revenue | |||||||
| Series B 5.00% 11/15/34 | 500,000 | 565,555 | |||||
66
| Principal amount | Value | ||||||
| Municipal Bonds (continued) | |||||||
| Special Tax Revenue Bonds (continued) | |||||||
| New York City Industrial Development Agency | |||||||
| (YMCA of Greater New York Project) 5.00% 8/1/36 | $ | 1,000,000 | $ | 1,048,270 | |||
| New York City Transitional Finance Authority Revenue | |||||||
| (Building Aid) Series S-1A 5.25% 7/15/37 | 1,000,000 | 1,159,310 | |||||
| (Future Tax Secured) | |||||||
| Fiscal 2011 5.00% 2/1/26 | 250,000 | 299,770 | |||||
| Fiscal 2011 5.25% 2/1/29 | 500,000 | 602,300 | |||||
| Series B 5.00% 11/1/18 | 500,000 | 593,425 | |||||
| Series C 5.25% 11/1/25 | 500,000 | 609,360 | |||||
| New York City Trust for Cultural Resources Revenue | |||||||
| (Museum Modern Art) Series A1 5.00% 4/1/31 | 250,000 | 288,910 | |||||
| New York Dormitory Authority State Personal Income Tax | |||||||
| Revenue Series C 5.00% 3/15/34 | 500,000 | 578,295 | |||||
| New York Dormitory Authority State Supported Debt | |||||||
| Revenue (Consolidated Services Contract) | |||||||
| 5.00% 7/1/17 (AGM) | 500,000 | 592,700 | |||||
| New York Sales Tax Asset Receivables | |||||||
| Series A 5.25% 10/15/27 (AMBAC) | 500,000 | 546,625 | |||||
| Ω | Puerto Rico Sales Tax Financing Revenue First Subordinate | ||||||
| (Convertible Capital Appreciation) Series A 6.75% 8/1/32 | 185,000 | 191,586 | |||||
| Virgin Islands Public Finance Authority Revenue | |||||||
| (Matching Fund Loan Note-Senior Lien) | |||||||
| Series A 5.00% 10/1/29 | 250,000 | 273,160 | |||||
| 9,591,506 | |||||||
| State & Territory General Obligation Bonds – 5.55% | |||||||
| New York City Series E 5.00% 8/1/28 | 125,000 | 146,680 | |||||
| New York State Series A 5.00% 3/1/38 | 500,000 | 573,185 | |||||
| Puerto Rico Commonwealth Government Development | |||||||
| Bank Refunding Remarketed | |||||||
| 4.75% 12/1/15 (NATL-RE) | 230,000 | 234,402 | |||||
| Puerto Rico Commonwealth Public Improvement Series A | |||||||
| 5.00% 7/1/41 | 1,000,000 | 996,150 | |||||
| 5.50% 7/1/19 (NATL-RE) (IBC) | 520,000 | 582,728 | |||||
| 5.50% 7/1/39 | 500,000 | 520,970 | |||||
| 5.75% 7/1/41 | 1,000,000 | 1,069,530 | |||||
| 4,123,645 | |||||||
67
Statements of net assets
Delaware Tax-Free New York Fund
| Principal amount | Value | ||||||
| Municipal Bonds (continued) | |||||||
| Transportation Revenue Bonds – 9.15% | |||||||
| Metropolitan Transportation Authority Revenue | |||||||
| Series 2008C 6.50% 11/15/28 | $ | 200,000 | $ | 256,646 | |||
| Series A 5.00% 11/15/41 | 500,000 | 556,275 | |||||
| Series C 5.00% 11/15/32 | 500,000 | 577,575 | |||||
| Series C 5.00% 11/15/41 | 200,000 | 224,544 | |||||
| Series D 5.00% 11/15/32 | 500,000 | 577,575 | |||||
| Series D 5.25% 11/15/27 | 500,000 | 585,830 | |||||
| Series E 4.00% 11/15/38 | 535,000 | 542,554 | |||||
| Series F 5.00% 11/15/15 | 150,000 | 170,378 | |||||
| New York State Thruway Authority General Revenue Series I | |||||||
| 5.00% 1/1/32 | 700,000 | 807,968 | |||||
| 5.00% 1/1/42 | 500,000 | 562,435 | |||||
| Port Authority New York & New Jersey | |||||||
| (Consolidated-One Hundred Fifty-Third) 5.00% 7/15/35 | 250,000 | 278,510 | |||||
| (JFK International Air Terminal) | |||||||
| 6.00% 12/1/42 | 700,000 | 813,525 | |||||
| 6.50% 12/1/28 | 550,000 | 602,894 | |||||
| Triborough Bridge & Tunnel Authority Revenue | |||||||
| Series C 5.00% 11/15/24 | 200,000 | 240,144 | |||||
| 6,796,853 | |||||||
| Water & Sewer Revenue Bonds – 3.10% | |||||||
| New York City Municipal Water Finance Authority | |||||||
| Water & Sewer System Revenue | |||||||
| (Second General Resolution) | |||||||
| Series A 5.75% 6/15/40 | 200,000 | 241,296 | |||||
| Series BB 5.25% 6/15/44 | 500,000 | 585,505 | |||||
| Series FF 5.50% 6/15/40 | 250,000 | 294,078 | |||||
| Series HH 5.00% 6/15/32 | 500,000 | 584,095 | |||||
| New York State Environmental Facilities Revenue | |||||||
| Clean Water & Drinking Revolving Funds 5.00% 6/15/30 | 500,000 | 600,465 | |||||
| 2,305,439 | |||||||
| Total Municipal Bonds (cost $66,742,050) | 73,040,818 | ||||||
68
| Principal amount | Value | ||||||||
| Short-Term Investments – 2.02% | |||||||||
| ¤Variable Rate Demand Notes – 2.02% | |||||||||
| City of New York Various Subordinate Series A-7 | |||||||||
| 0.16% 8/1/20 (LOC-JPMorgan Chase Bank, N.A.) | $ | 500,000 | $ | 500,000 | |||||
| New York City Adjusted Series C | |||||||||
| 0.16% 10/1/23 (LOC-JPMorgan Chase Bank, N.A.) | 500,000 | 500,000 | |||||||
| New York City Industrial Development Agency Civic Facility | |||||||||
| Revenue (American Civil Project) | |||||||||
| 0.16% 6/1/35 (LOC-JPMorgan Chase Bank, N.A.) | 500,000 | 500,000 | |||||||
| Total Short-Term Investments (cost $1,500,000) | 1,500,000 | ||||||||
| Total Value of Securities – 100.33% | |||||||||
| (cost $68,242,050) | 74,540,818 | ||||||||
| Liabilities Net of Receivables | |||||||||
| and Other Assets – (0.33%) | (242,867 | ) | |||||||
| Net Assets Applicable to 6,370,019 | |||||||||
| Shares Outstanding – 100.00% | $ | 74,297,951 | |||||||
| Net Asset Value – Delaware Tax-Free New York Fund | |||||||||
| Class A ($53,456,479 / 4,580,046 Shares) | $11.67 | ||||||||
| Net Asset Value – Delaware Tax-Free New York Fund | |||||||||
| Class B ($317,614 / 27,270 Shares) | $11.65 | ||||||||
| Net Asset Value – Delaware Tax-Free New York Fund | |||||||||
| Class C ($20,523,858 / 1,762,703 Shares) | $11.64 | ||||||||
| Components of Net Assets at August 31, 2012: | |||||||||
| Shares of beneficial interest (unlimited authorization – no par) | $ | 67,851,237 | |||||||
| Undistributed net investment income | 7,099 | ||||||||
| Accumulated net realized gain on investments | 140,847 | ||||||||
| Net unrealized appreciation of investments | 6,298,768 | ||||||||
| Total net assets | $ | 74,297,951 | |||||||
69
Statements of net assets
Delaware Tax-Free New York Fund
•Variable rate security. The rate shown is the rate as of August 31, 2012. Interest rates reset periodically. §Pre-refunded bonds. Municipal bonds that are generally backed or secured by U.S. Treasury bonds. For pre-refunded bonds, the stated maturity is followed by the year in which the bond is pre-refunded. See Note 8 in “Notes to financial statements.” ΩStep coupon bond. Indicates security that has a zero coupon that remains in effect until a predetermined date at which time the stated interest rate becomes effective. ¤Tax-exempt obligations that contain a floating or variable interest rate adjustment formula and an unconditional right of demand to receive payment of the unpaid principal balance plus accrued interest upon a short notice period (generally up to 30 days) prior to specified dates either from the issuer or by drawing on a bank letter of credit, a guarantee or insurance issued with respect to such instrument. The rate shown is the rate as of August 31, 2012. |
| Net Asset Value and Offering Price Per Share – | |||
| Delaware Tax-Free New York Fund | |||
| Net asset value Class A (A) | $ | 11.67 | |
| Sales charge (4.50% of offering price) (B) | 0.55 | ||
| Offering price | $ | 12.22 |
| (A) | Net asset value per share, as illustrated, is the amount which would be paid upon redemption or repurchase of shares. |
| (B) | See the current prospectus for purchases of $100,000 or more. |
Summary of abbreviations:
AGM — Insured by Assured Guaranty Municipal Corporation
AMBAC — Insured by AMBAC Assurance Corporation
AMT — Subject to Alternative Minimum Tax
FHA — Federal Housing Administration
IBC — Insured Bond Certificate
LOC — Letter of Credit
NATL-RE — Insured by National Public Finance Guarantee Corporation
See accompanying notes, which are an integral part of the financial statements.
70
| Statements of operations | |
| Year Ended August 31, 2012 |
| Delaware Tax-Free | Delaware Tax-Free | Delaware Tax-Free | ||||||||||||||||
| Arizona Fund | California Fund | Colorado Fund | ||||||||||||||||
| Investment Income: | ||||||||||||||||||
| Interest | $ | 5,037,632 | $ | 4,712,205 | $ | 11,307,123 | ||||||||||||
| Expenses: | ||||||||||||||||||
| Management fees | 527,114 | 526,572 | 1,307,764 | |||||||||||||||
| Distribution expenses – Class A | 245,223 | 194,314 | 559,912 | |||||||||||||||
| Distribution expenses – Class B | 5,040 | 9,485 | 3,132 | |||||||||||||||
| Distribution expenses – Class C | 68,467 | 167,318 | 134,732 | |||||||||||||||
| Dividend disbursing and transfer agent | ||||||||||||||||||
| fees and expenses | 52,026 | 63,602 | 117,387 | |||||||||||||||
| Accounting and administration expenses | 41,305 | 37,498 | 93,158 | |||||||||||||||
| Audit and tax | 12,983 | 13,052 | 16,033 | |||||||||||||||
| Reports and statements to shareholders | 12,411 | 10,837 | 21,783 | |||||||||||||||
| Registration fees | 12,146 | 11,324 | 7,785 | |||||||||||||||
| Legal fees | 10,284 | 8,915 | 23,372 | |||||||||||||||
| Pricing fees | 7,908 | 9,965 | 10,853 | |||||||||||||||
| Trustees’ fees | 5,095 | 4,581 | 11,476 | |||||||||||||||
| Insurance fees | 2,392 | 1,565 | 4,725 | |||||||||||||||
| Custodian fees | 2,181 | 2,565 | 5,280 | |||||||||||||||
| Dues and services | 1,978 | 1,362 | 1,214 | |||||||||||||||
| Consulting fees | 927 | 906 | 2,122 | |||||||||||||||
| �� Trustees’ expenses | 314 | 262 | 698 | |||||||||||||||
| 1,007,794 | 1,064,123 | 2,321,426 | ||||||||||||||||
| Less fees waived | (66,858 | ) | (148,126 | ) | (220,336 | ) | ||||||||||||
| Less expense paid indirectly | (42 | ) | (30 | ) | (92 | ) | ||||||||||||
| Total operating expenses | 940,894 | 915,967 | 2,100,998 | |||||||||||||||
| Net Investment Income | 4,096,738 | 3,796,238 | 9,206,125 | |||||||||||||||
| Net Realized and Unrealized Gain: | ||||||||||||||||||
| Net realized gain on investments | 1,052,973 | 845,787 | 2,424,292 | |||||||||||||||
| Net change in unrealized appreciation | ||||||||||||||||||
| (depreciation) of investments | 5,070,394 | 7,598,268 | 13,431,285 | |||||||||||||||
| Net Realized and Unrealized Gain | 6,123,367 | 8,444,055 | 15,855,577 | |||||||||||||||
| Net Increase in Net Assets | ||||||||||||||||||
| Resulting from Operations | $ | 10,220,105 | $ | 12,240,293 | $ | 25,061,702 | ||||||||||||
See accompanying notes, which are an integral part of the financial statements.
72
| Delaware Tax-Free | Delaware Tax-Free | |||||||||||
| Idaho Fund | New York Fund | |||||||||||
| Investment Income: | ||||||||||||
| Interest | $ | 6,688,128 | $ | 2,869,196 | ||||||||
| Expenses: | ||||||||||||
| Management fees | 811,685 | 345,491 | ||||||||||
| Distribution expenses – Class A | 273,081 | 112,089 | ||||||||||
| Distribution expenses – Class B | 6,319 | 4,602 | ||||||||||
| Distribution expenses – Class C | 375,835 | 173,367 | ||||||||||
| Dividend disbursing and transfer agent | ||||||||||||
| fees and expenses | 75,387 | 50,422 | ||||||||||
| Accounting and administration expenses | 57,813 | 24,603 | ||||||||||
| Reports and statements to shareholders | 14,759 | 8,493 | ||||||||||
| Audit and tax | 14,503 | 12,509 | ||||||||||
| Legal fees | 13,581 | 5,826 | ||||||||||
| Registration fees | 9,739 | 13,980 | ||||||||||
| Pricing fees | 9,667 | 11,619 | ||||||||||
| Trustees’ fees | 7,087 | 2,982 | ||||||||||
| Custodian fees | 3,400 | 1,448 | ||||||||||
| Insurance fees | 2,536 | 1,013 | ||||||||||
| Dues and services | 1,440 | 1,325 | ||||||||||
| Consulting fees | 1,310 | 575 | ||||||||||
| Trustees’ expenses | 421 | 168 | ||||||||||
| 1,678,563 | 770,512 | |||||||||||
| Less fees waived | (93,710 | ) | (135,258 | ) | ||||||||
| Less expense paid indirectly | (56 | ) | (20 | ) | ||||||||
| Total operating expenses | 1,584,797 | 635,234 | ||||||||||
| Net Investment Income | 5,103,331 | 2,233,962 | ||||||||||
| Net Realized and Unrealized Gain (Loss): | ||||||||||||
| Net realized gain (loss) on investments | (134,746 | ) | 621,955 | |||||||||
| Net change in unrealized appreciation | ||||||||||||
| (depreciation) of investments | 6,365,479 | 4,168,664 | ||||||||||
| Net Realized and Unrealized Gain | 6,230,733 | 4,790,619 | ||||||||||
| Net Increase in Net Assets | ||||||||||||
| Resulting from Operations | $ | 11,334,064 | $ | 7,024,581 | ||||||||
See accompanying notes, which are an integral part of the financial statements.
73
Statements of changes in net assets
Delaware Tax-Free Arizona Fund
| Year Ended | ||||||||
| 8/31/12 | 8/31/11 | |||||||
| Increase (Decrease) in Net Assets from Operations: | ||||||||
| Net investment income | $ | 4,096,738 | $ | 4,224,609 | ||||
| Net realized gain | 1,052,973 | 26,324 | ||||||
| Net change in unrealized appreciation (depreciation) | 5,070,394 | (4,245,010 | ) | |||||
| Net increase in net assets resulting from operations | 10,220,105 | 5,923 | ||||||
| Dividends and Distributions to Shareholders from: | ||||||||
| Net investment income: | ||||||||
| Class A | (3,838,812 | ) | (3,935,696 | ) | ||||
| Class B | (15,982 | ) | (48,023 | ) | ||||
| Class C | (216,639 | ) | (229,913 | ) | ||||
| Net realized gain: | ||||||||
| Class A | (25,133 | ) | (250,507 | ) | ||||
| Class B | (172 | ) | (5,139 | ) | ||||
| Class C | (1,765 | ) | (18,335 | ) | ||||
| (4,098,503 | ) | (4,487,613 | ) | |||||
| Capital Share Transactions: | ||||||||
| Proceeds from shares sold: | ||||||||
| Class A | 5,094,394 | 9,590,092 | ||||||
| Class B | — | 468 | ||||||
| Class C | 840,858 | 802,573 | ||||||
| Net asset value of shares issued upon reinvestment | ||||||||
| of dividends and distributions: | ||||||||
| Class A | 2,768,726 | 2,229,671 | ||||||
| Class B | 14,153 | 31,965 | ||||||
| Class C | 177,549 | 152,719 | ||||||
| 8,895,680 | 12,807,488 | |||||||
74
| Year Ended | ||||||||
| 8/31/12 | 8/31/11 | |||||||
| Capital Share Transactions (continued): | ||||||||
| Cost of shares redeemed: | ||||||||
| Class A | $ | (9,093,206 | ) | $ | (20,506,737 | ) | ||
| Class B | (574,575 | ) | (2,067,231 | ) | ||||
| Class C | (1,109,478 | ) | (1,832,935 | ) | ||||
| (10,777,259 | ) | (24,406,903 | ) | |||||
| Decrease in net assets derived from | ||||||||
| capital share transactions | (1,881,579 | ) | (11,599,415 | ) | ||||
| Net Increase (Decrease) in Net Assets | 4,240,023 | (16,081,105 | ) | |||||
| Net Assets: | ||||||||
| Beginning of year | 103,045,367 | 119,126,472 | ||||||
| End of year | $ | 107,285,390 | $ | 103,045,367 | ||||
| Undistributed net investment income | $ | 25,309 | $ | 25,309 | ||||
See accompanying notes, which are an integral part of the financial statements.
75
Statements of changes in net assets
Delaware Tax-Free California Fund
| Year Ended | ||||||||
| 8/31/12 | 8/31/11 | |||||||
| Increase (Decrease) in Net Assets from Operations: | ||||||||
| Net investment income | $ | 3,796,238 | $ | 3,588,094 | ||||
| Net realized gain (loss) | 845,787 | (718,355 | ) | |||||
| Net change in unrealized appreciation (depreciation) | 7,598,268 | (2,957,481 | ) | |||||
| Net increase (decrease) in net assets | ||||||||
| resulting from operations | 12,240,293 | (87,742 | ) | |||||
| Dividends and Distributions to Shareholders from: | ||||||||
| Net investment income: | ||||||||
| Class A | (3,189,609 | ) | (2,970,212 | ) | ||||
| Class B | (32,159 | ) | (71,308 | ) | ||||
| Class C | (563,689 | ) | (536,304 | ) | ||||
| (3,785,457 | ) | (3,577,824 | ) | |||||
| Capital Share Transactions: | ||||||||
| Proceeds from shares sold: | ||||||||
| Class A | 34,582,426 | 13,966,047 | ||||||
| Class B | 30,390 | 446 | ||||||
| Class C | 4,936,706 | 3,882,265 | ||||||
| Net asset value of shares issued upon reinvestment | ||||||||
| of dividends and distributions: | ||||||||
| Class A | 2,265,497 | 1,792,877 | ||||||
| Class B | 22,982 | 53,523 | ||||||
| Class C | 454,958 | 389,108 | ||||||
| 42,292,959 | 20,084,266 | |||||||
76
| Year Ended | ||||||||
| 8/31/12 | 8/31/11 | |||||||
| Capital Share Transactions (continued): | ||||||||
| Cost of shares redeemed: | ||||||||
| Class A | $ | (12,958,552 | ) | $ | (18,652,984 | ) | ||
| Class B | (539,530 | ) | (1,868,698 | ) | ||||
| Class C | (2,910,386 | ) | (4,362,004 | ) | ||||
| (16,408,468 | ) | (24,883,686 | ) | |||||
| Increase (decrease) in net assets derived from | ||||||||
| capital share transactions | 25,884,491 | (4,799,420 | ) | |||||
| Net Increase (Decrease) in Net Assets | 34,339,327 | (8,464,986 | ) | |||||
| Net Assets: | ||||||||
| Beginning of year | 83,216,597 | 91,681,583 | ||||||
| End of year | $ | 117,555,924 | $ | 83,216,597 | ||||
| Undistributed net investment income | $ | 18,763 | $ | 18,763 | ||||
See accompanying notes, which are an integral part of the financial statements.
77
Statements of changes in net assets
Delaware Tax-Free Colorado Fund
| Year Ended | ||||||||
| 8/31/12 | 8/31/11 | |||||||
| Increase (Decrease) in Net Assets from Operations: | ||||||||
| Net investment income | $ | 9,206,125 | $ | 9,935,304 | ||||
| Net realized gain (loss) | 2,424,292 | (1,090,497 | ) | |||||
| Net change in unrealized appreciation (depreciation) | 13,431,285 | (8,167,863 | ) | |||||
| Net increase in net assets resulting from operations | 25,061,702 | 676,944 | ||||||
| Dividends and Distributions to Shareholders from: | ||||||||
| Net investment income: | ||||||||
| Class A | (8,749,124 | ) | (9,065,106 | ) | ||||
| Class B | (10,110 | ) | (32,264 | ) | ||||
| Class C | (425,246 | ) | (473,556 | ) | ||||
| (9,184,480 | ) | (9,570,926 | ) | |||||
| Capital Share Transactions: | ||||||||
| Proceeds from shares sold: | ||||||||
| Class A | 10,143,467 | 9,661,260 | ||||||
| Class B | 12 | 304 | ||||||
| Class C | 1,744,888 | 1,768,344 | ||||||
| Net asset value of shares issued upon reinvestment | ||||||||
| of dividends and distributions: | ||||||||
| Class A | 6,567,239 | 5,999,728 | ||||||
| Class B | 5,937 | 21,271 | ||||||
| Class C | 360,117 | 348,473 | ||||||
| 18,821,660 | 17,799,380 | |||||||
78
| Year Ended | ||||||||
| 8/31/12 | 8/31/11 | |||||||
| Capital Share Transactions (continued): | ||||||||
| Cost of shares redeemed: | ||||||||
| Class A | $ | (17,038,942 | ) | $ | (28,796,246 | ) | ||
| Class B | (463,156 | ) | (776,210 | ) | ||||
| Class C | (1,967,053 | ) | (3,449,371 | ) | ||||
| (19,469,151 | ) | (33,021,827 | ) | |||||
| Decrease in net assets derived from | ||||||||
| capital share transactions | (647,491 | ) | (15,222,447 | ) | ||||
| Net Increase (Decrease) in Net Assets | 15,229,731 | (24,116,429 | ) | |||||
| Net Assets: | ||||||||
| Beginning of year | 230,012,743 | 254,129,172 | ||||||
| End of year | $ | 245,242,474 | $ | 230,012,743 | ||||
| Undistributed net investment income | $ | 352,562 | $ | 352,563 | ||||
See accompanying notes, which are an integral part of the financial statements.
79
Statements of changes in net assets
Delaware Tax-Free Idaho Fund
| Year Ended | ||||||||
| 8/31/12 | 8/31/11 | |||||||
| Increase (Decrease) in Net Assets from Operations: | ||||||||
| Net investment income | $ | 5,103,331 | $ | 4,747,970 | ||||
| Net realized loss | (134,746 | ) | (974,509 | ) | ||||
| Net change in unrealized appreciation (depreciation) | 6,365,479 | (3,975,375 | ) | |||||
| Net increase (decrease) in net assets | ||||||||
| resulting from operations | 11,334,064 | (201,914 | ) | |||||
| Dividends and Distributions to Shareholders from: | ||||||||
| Net investment income: | ||||||||
| Class A | (3,979,888 | ) | (3,594,235 | ) | ||||
| Class B | (18,318 | ) | (47,733 | ) | ||||
| Class C | (1,087,724 | ) | (1,085,338 | ) | ||||
| Net realized gain: | ||||||||
| Class A | — | (58,688 | ) | |||||
| Class B | — | (1,213 | ) | |||||
| Class C | — | (22,123 | ) | |||||
| (5,085,930 | ) | (4,809,330 | ) | |||||
| Capital Share Transactions: | ||||||||
| Proceeds from shares sold: | ||||||||
| Class A | 27,230,993 | 22,046,186 | ||||||
| Class B | 133 | — | ||||||
| Class C | 9,308,402 | 9,226,467 | ||||||
| Net asset value of shares issued upon reinvestment | ||||||||
| of dividends and distributions: | ||||||||
| Class A | 2,829,553 | 2,621,700 | ||||||
| Class B | 16,152 | 38,486 | ||||||
| Class C | 937,685 | 841,625 | ||||||
| 40,322,918 | 34,774,464 | |||||||
80
| Year Ended | ||||||||
| 8/31/12 | 8/31/11 | |||||||
| Capital Share Transactions (continued): | ||||||||
| Cost of shares redeemed: | ||||||||
| Class A | $ | (14,499,061 | ) | $ | (26,491,952 | ) | ||
| Class B | (374,954 | ) | (1,483,183 | ) | ||||
| Class C | (6,882,006 | ) | (8,585,502 | ) | ||||
| (21,756,021 | ) | (36,560,637 | ) | |||||
| Increase (decrease) in net assets derived from | ||||||||
| capital share transactions | 18,566,897 | (1,786,173 | ) | |||||
| Net Increase (Decrease) in Net Assets | 24,815,031 | (6,797,417 | ) | |||||
| Net Assets: | ||||||||
| Beginning of year | 135,530,183 | 142,327,600 | ||||||
| End of year | $ | 160,345,214 | $ | 135,530,183 | ||||
| Distributions in excess of net investment income | $ | (16,644 | ) | $ | (16,644 | ) | ||
See accompanying notes, which are an integral part of the financial statements.
81
Statements of changes in net assets
Delaware Tax-Free New York Fund
| Year Ended | ||||||||
| 8/31/12 | 8/31/11 | |||||||
| Increase (Decrease) in Net Assets from Operations: | ||||||||
| Net investment income | $ | 2,233,962 | $ | 1,848,243 | ||||
| Net realized gain (loss) | 621,955 | (461,636 | ) | |||||
| Net change in unrealized appreciation (depreciation) | 4,168,664 | (1,450,553 | ) | |||||
| Net increase (decrease) in net assets | ||||||||
| resulting from operations | 7,024,581 | (63,946 | ) | |||||
| Dividends and Distributions to Shareholders from: | ||||||||
| Net investment income: | ||||||||
| Class A | (1,681,430 | ) | (1,400,126 | ) | ||||
| Class B | (13,909 | ) | (17,505 | ) | ||||
| Class C | (520,282 | ) | (425,309 | ) | ||||
| (2,215,621 | ) | (1,842,940 | ) | |||||
| Capital Share Transactions: | ||||||||
| Proceeds from shares sold: | ||||||||
| Class A | 18,938,318 | 10,714,054 | ||||||
| Class B | 37,194 | — | ||||||
| Class C | 6,044,733 | 3,902,137 | ||||||
| Net asset value of shares issued upon reinvestment | ||||||||
| of dividends and distributions: | ||||||||
| Class A | 1,394,783 | 1,022,817 | ||||||
| Class B | 10,269 | 12,841 | ||||||
| Class C | 397,016 | 315,491 | ||||||
| 26,822,313 | 15,967,340 | |||||||
82
| Year Ended | ||||||||
| 8/31/12 | 8/31/11 | |||||||
| Capital Share Transactions (continued): | ||||||||
| Cost of shares redeemed: | ||||||||
| Class A | $ | (7,361,248 | ) | $ | (10,992,437 | ) | ||
| Class B | (240,795 | ) | (243,301 | ) | ||||
| Class C | (1,493,916 | ) | (2,976,393 | ) | ||||
| (9,095,959 | ) | (14,212,131 | ) | |||||
| Increase in net assets derived from | ||||||||
| capital share transactions | 17,726,354 | 1,755,209 | ||||||
| Net Increase (Decrease) in Net Assets | 22,535,314 | (151,677 | ) | |||||
| Net Assets: | ||||||||
| Beginning of year | 51,762,637 | 51,914,314 | ||||||
| End of year | $ | 74,297,951 | $ | 51,762,637 | ||||
| Undistributed (distributions in excess of) | ||||||||
| net investment income | $ | 7,099 | $ | (657 | ) | |||
See accompanying notes, which are an integral part of the financial statements.
83
Financial highlights
Delaware Tax-Free Arizona Fund Class A
Selected data for each share of the Fund outstanding throughout each period were as follows:
| Net asset value, beginning of period |
| Income (loss) from investment operations: |
| Net investment income |
| Net realized and unrealized gain (loss) |
| Total from investment operations |
| Less dividends and distributions from: |
| Net investment income |
| Net realized gain |
| Total dividends and distributions |
| Net asset value, end of period |
| Total return1 |
| Ratios and supplemental data: |
| Net assets, end of period (000 omitted) |
| Ratio of expenses to average net assets |
| Ratio of expenses to average net assets |
| prior to fees waived |
| Ratio of net investment income to average net assets |
| Ratio of net investment income to average net assets |
| prior to fees waived |
| Portfolio turnover |
See accompanying notes, which are an integral part of the financial statements.
84
| Year Ended | ||||||||||||||||
| 8/31/12 | 8/31/11 | 8/31/10 | 8/31/09 | 8/31/08 | ||||||||||||
| $11.340 | $11.760 | $11.090 | $10.930 | $11.070 | ||||||||||||
| 0.460 | 0.445 | 0.447 | 0.431 | 0.444 | ||||||||||||
| 0.670 | (0.394 | ) | 0.668 | 0.158 | (0.140 | ) | ||||||||||
| 1.130 | 0.051 | 1.115 | 0.589 | 0.304 | ||||||||||||
| (0.457 | ) | (0.444 | ) | (0.445 | ) | (0.429 | ) | (0.444 | ) | |||||||
| (0.003 | ) | (0.027 | ) | — | — | — | ||||||||||
| (0.460 | ) | (0.471 | ) | (0.445 | ) | (0.429 | ) | (0.444 | ) | |||||||
| $12.010 | $11.340 | $11.760 | $11.090 | $10.930 | ||||||||||||
| 10.15% | 0.57% | 10.27% | 5.64% | 2.78% | ||||||||||||
| $99,953 | $95,487 | $108,214 | $113,689 | $122,027 | ||||||||||||
| 0.84% | 0.87% | 0.86% | 0.75% | 0.75% | ||||||||||||
| 0.90% | 0.93% | 0.92% | 0.91% | 0.91% | ||||||||||||
| 3.94% | 3.98% | 3.94% | 4.07% | 4.02% | ||||||||||||
| 3.88% | 3.92% | 3.88% | 3.91% | 3.86% | ||||||||||||
| 34% | 32% | 15% | 27% | 29% | ||||||||||||
85
Financial highlights
Delaware Tax-Free Arizona Fund Class B
Selected data for each share of the Fund outstanding throughout each period were as follows:
| Net asset value, beginning of period |
| Income (loss) from investment operations: |
| Net investment income |
| Net realized and unrealized gain (loss) |
| Total from investment operations |
| Less dividends and distributions from: |
| Net investment income |
| Net realized gain |
| Total dividends and distributions |
| Net asset value, end of period |
| Total return1 |
| Ratios and supplemental data: |
| Net assets, end of period (000 omitted) |
| Ratio of expenses to average net assets |
| Ratio of expenses to average net assets |
| prior to fees waived |
| Ratio of net investment income to average net assets |
| Ratio of net investment income to average net assets |
| prior to fees waived |
| Portfolio turnover |
1 Total investment return is based on the change in net asset value of a share during the period and assumes reinvestment of dividends and distributions at net asset value and does not reflect the impact of a sales charge. Total investment return during all of the periods shown reflects a waiver by the manager. Performance would have been lower had the waiver not been in effect.
See accompanying notes, which are an integral part of the financial statements.
86
| Year Ended | ||||||||||||||||
| 8/31/12 | 8/31/11 | 8/31/10 | 8/31/09 | 8/31/08 | ||||||||||||
| $11.340 | $11.760 | $11.100 | $10.940 | $11.070 | ||||||||||||
| 0.373 | 0.361 | 0.362 | 0.352 | 0.361 | ||||||||||||
| 0.680 | (0.394 | ) | 0.658 | 0.158 | (0.130 | ) | ||||||||||
| 1.053 | (0.033 | ) | 1.020 | 0.510 | 0.231 | |||||||||||
| (0.370 | ) | (0.360 | ) | (0.360 | ) | (0.350 | ) | (0.361 | ) | |||||||
| (0.003 | ) | (0.027 | ) | — | — | — | ||||||||||
| (0.373 | ) | (0.387 | ) | (0.360 | ) | (0.350 | ) | (0.361 | ) | |||||||
| $12.020 | $11.340 | $11.760 | $11.100 | $10.940 | ||||||||||||
| 9.42% | (0.18% | ) | 9.35% | 4.85% | 2.10% | |||||||||||
| $224 | $757 | $2,917 | $6,509 | $9,620 | ||||||||||||
| 1.59% | 1.62% | 1.61% | 1.50% | 1.50% | ||||||||||||
| 1.65% | 1.68% | 1.67% | 1.66% | 1.66% | ||||||||||||
| 3.19% | 3.23% | 3.19% | 3.32% | 3.27% | ||||||||||||
| 3.13% | 3.17% | 3.13% | 3.16% | 3.11% | ||||||||||||
| 34% | 32% | 15% | 27% | 29% | ||||||||||||
87
Financial highlights
Delaware Tax-Free Arizona Fund Class C
Selected data for each share of the Fund outstanding throughout each period were as follows:
| Net asset value, beginning of period |
| Income (loss) from investment operations: |
| Net investment income |
| Net realized and unrealized gain (loss) |
| Total from investment operations |
| Less dividends and distributions from: |
| Net investment income |
| Net realized gain |
| Total dividends and distributions |
| Net asset value, end of period |
| Total return1 |
| Ratios and supplemental data: |
| Net assets, end of period (000 omitted) |
| Ratio of expenses to average net assets |
| Ratio of expenses to average net assets |
| prior to fees waived |
| Ratio of net investment income to average net assets |
| Ratio of net investment income to average net assets |
| prior to fees waived |
| Portfolio turnover |
1 Total investment return is based on the change in net asset value of a share during the period and assumes reinvestment of dividends and distributions at net asset value and does not reflect the impact of a sales charge. Total investment return during all of the periods shown reflects a waiver by the manager. Performance would have been lower had the waiver not been in effect.
See accompanying notes, which are an integral part of the financial statements.
88
| Year Ended | ||||||||||||||||
| 8/31/12 | 8/31/11 | 8/31/10 | 8/31/09 | 8/31/08 | ||||||||||||
| $11.370 | $11.790 | $11.120 | $10.960 | $11.090 | ||||||||||||
| 0.373 | 0.362 | 0.363 | 0.352 | 0.361 | ||||||||||||
| 0.670 | (0.394 | ) | 0.668 | 0.158 | (0.130 | ) | ||||||||||
| 1.043 | (0.032 | ) | 1.031 | 0.510 | 0.231 | |||||||||||
| (0.370 | ) | (0.361 | ) | (0.361 | ) | (0.350 | ) | (0.361 | ) | |||||||
| (0.003 | ) | (0.027 | ) | — | — | — | ||||||||||
| (0.373 | ) | (0.388 | ) | (0.361 | ) | (0.350 | ) | (0.361 | ) | |||||||
| $12.040 | $11.370 | $11.790 | $11.120 | $10.960 | ||||||||||||
| 9.31% | (0.17% | ) | 9.43% | 4.84% | 2.09% | |||||||||||
| $7,108 | $6,801 | $7,995 | $7,257 | $8,806 | ||||||||||||
| 1.59% | 1.62% | 1.61% | 1.50% | 1.50% | ||||||||||||
| 1.65% | 1.68% | 1.67% | 1.66% | 1.66% | ||||||||||||
| 3.19% | 3.23% | 3.19% | 3.32% | 3.27% | ||||||||||||
| 3.13% | 3.17% | 3.13% | 3.16% | 3.11% | ||||||||||||
| 34% | 32% | 15% | 27% | 29% | ||||||||||||
89
Financial highlights
Delaware Tax-Free California Fund Class A
Selected data for each share of the Fund outstanding throughout each period were as follows:
| Net asset value, beginning of period |
| Income (loss) from investment operations: |
| Net investment income |
| Net realized and unrealized gain (loss) |
| Total from investment operations |
| Less dividends and distributions from: |
| Net investment income |
| Total dividends and distributions |
| Net asset value, end of period |
| Total return1 |
| Ratios and supplemental data: |
| Net assets, end of period (000 omitted) |
| Ratio of expenses to average net assets |
| Ratio of expenses to average net assets |
| prior to fees waived |
| Ratio of net investment income to average net assets |
| Ratio of net investment income to average net assets |
| prior to fees waived |
| Portfolio turnover |
1 Total investment return is based on the change in net asset value of a share during the period and assumes reinvestment of dividends and distributions at net asset value and does not reflect the impact of a sales charge. Total investment return during all of the periods shown reflects a waiver by the manager. Performance would have been lower had the waiver not been in effect.
See accompanying notes, which are an integral part of the financial statements.
90
| Year Ended | ||||||||||||||||
| 8/31/12 | 8/31/11 | 8/31/10 | 8/31/09 | 8/31/08 | ||||||||||||
| $11.170 | $11.570 | $10.620 | $10.800 | $11.010 | ||||||||||||
| 0.484 | 0.476 | 0.497 | 0.448 | 0.449 | ||||||||||||
| 1.039 | (0.401 | ) | 0.950 | (0.182 | ) | (0.210 | ) | |||||||||
| 1.523 | 0.075 | 1.447 | 0.266 | 0.239 | ||||||||||||
| (0.483 | ) | (0.475 | ) | (0.497 | ) | (0.446 | ) | (0.449 | ) | |||||||
| (0.483 | ) | (0.475 | ) | (0.497 | ) | (0.446 | ) | (0.449 | ) | |||||||
| $12.210 | $11.170 | $11.570 | $10.620 | $10.800 | ||||||||||||
| 13.90% | 0.83% | 13.92% | 2.74% | 2.21% | ||||||||||||
| $97,821 | $67,047 | $72,902 | $61,132 | $67,174 | ||||||||||||
| 0.82% | 0.82% | 0.82% | 0.88% | 0.88% | ||||||||||||
| 0.97% | 0.98% | 0.98% | 0.97% | 0.97% | ||||||||||||
| 4.10% | 4.36% | 4.48% | 4.42% | 4.11% | ||||||||||||
| 3.95% | 4.20% | 4.32% | 4.33% | 4.02% | ||||||||||||
| 32% | 44% | 35% | 59% | 34% | ||||||||||||
91
Financial highlights
Delaware Tax-Free California Fund Class B
Selected data for each share of the Fund outstanding throughout each period were as follows:
| Net asset value, beginning of period |
| Income (loss) from investment operations: |
| Net investment income |
| Net realized and unrealized gain (loss) |
| Total from investment operations |
| Less dividends and distributions from: |
| Net investment income |
| Total dividends and distributions |
| Net asset value, end of period |
| Total return1 |
| Ratios and supplemental data: |
| Net assets, end of period (000 omitted) |
| Ratio of expenses to average net assets |
| Ratio of expenses to average net assets |
| prior to fees waived |
| Ratio of net investment income to average net assets |
| Ratio of net investment income to average net assets |
| prior to fees waived |
| Portfolio turnover |
1 Total investment return is based on the change in net asset value of a share during the period and assumes reinvestment of dividends and distributions at net asset value and does not reflect the impact of a sales charge. Total investment return during all of the periods shown reflects a waiver by the manager. Performance would have been lower had the waiver not been in effect.
See accompanying notes, which are an integral part of the financial statements.
92
| Year Ended | ||||||||||||||||
| 8/31/12 | 8/31/11 | 8/31/10 | 8/31/09 | 8/31/08 | ||||||||||||
| $11.210 | $11.610 | $10.670 | $10.840 | $11.060 | ||||||||||||
| 0.398 | 0.395 | 0.416 | 0.373 | 0.367 | ||||||||||||
| 1.049 | (0.401 | ) | 0.940 | (0.172 | ) | (0.220 | ) | |||||||||
| 1.447 | (0.006 | ) | 1.356 | 0.201 | 0.147 | |||||||||||
| (0.397 | ) | (0.394 | ) | (0.416 | ) | (0.371 | ) | (0.367 | ) | |||||||
| (0.397 | ) | (0.394 | ) | (0.416 | ) | (0.371 | ) | (0.367 | ) | |||||||
| $12.260 | $11.210 | $11.610 | $10.670 | $10.840 | ||||||||||||
| 13.10% | 0.09% | 12.93% | 2.07% | 1.34% | ||||||||||||
| $905 | $1,307 | $3,254 | $4,938 | $6,589 | ||||||||||||
| 1.57% | 1.57% | 1.57% | 1.63% | 1.63% | ||||||||||||
| 1.72% | 1.73% | 1.73% | 1.72% | 1.72% | ||||||||||||
| 3.35% | 3.61% | 3.73% | 3.67% | 3.36% | ||||||||||||
| 3.20% | 3.45% | 3.57% | 3.58% | 3.27% | ||||||||||||
| 32% | 44% | 35% | 59% | 34% | ||||||||||||
93
Financial highlights
Delaware Tax-Free California Fund Class C
Selected data for each share of the Fund outstanding throughout each period were as follows:
| Net asset value, beginning of period |
| Income (loss) from investment operations: |
| Net investment income |
| Net realized and unrealized gain (loss) |
| Total from investment operations |
| Less dividends and distributions from: |
| Net investment income |
| Total dividends and distributions |
| Net asset value, end of period |
| Total return1 |
| Ratios and supplemental data: |
| Net assets, end of period (000 omitted) |
| Ratio of expenses to average net assets |
| Ratio of expenses to average net assets |
| prior to fees waived |
| Ratio of net investment income to average net assets |
| Ratio of net investment income to average net assets |
| prior to fees waived |
| Portfolio turnover |
1 Total investment return is based on the change in net asset value of a share during the period and assumes reinvestment of dividends and distributions at net asset value and does not reflect the impact of a sales charge. Total investment return during all of the periods shown reflects a waiver by the manager. Performance would have been lower had the waiver not been in effect.
See accompanying notes, which are an integral part of the financial statements.
94
| Year Ended | ||||||||||||||||
| 8/31/12 | 8/31/11 | 8/31/10 | 8/31/09 | 8/31/08 | ||||||||||||
| $11.180 | $11.590 | $10.640 | $10.810 | $11.030 | ||||||||||||
| 0.397 | 0.394 | 0.415 | 0.373 | 0.367 | ||||||||||||
| 1.049 | (0.411 | ) | 0.950 | (0.172 | ) | (0.220 | ) | |||||||||
| 1.446 | (0.017 | ) | 1.365 | 0.201 | 0.147 | |||||||||||
| (0.396 | ) | (0.393 | ) | (0.415 | ) | (0.371 | ) | (0.367 | ) | |||||||
| (0.396 | ) | (0.393 | ) | (0.415 | ) | (0.371 | ) | (0.367 | ) | |||||||
| $12.230 | $11.180 | $11.590 | $10.640 | $10.810 | ||||||||||||
| 13.13% | (0.01% | ) | 13.06% | 2.07% | 1.35% | |||||||||||
| $18,830 | $14,863 | $15,526 | $13,530 | $14,991 | ||||||||||||
| 1.57% | 1.57% | 1.57% | 1.63% | 1.63% | ||||||||||||
| 1.72% | 1.73% | 1.73% | 1.72% | 1.72% | ||||||||||||
| 3.35% | 3.61% | 3.73% | 3.67% | 3.36% | ||||||||||||
| 3.20% | 3.45% | 3.57% | 3.58% | 3.27% | ||||||||||||
| 32% | 44% | 35% | 59% | 34% | ||||||||||||
95
Financial highlights
Delaware Tax-Free Colorado Fund Class A
Selected data for each share of the Fund outstanding throughout each period were as follows:
| Net asset value, beginning of period |
| Income (loss) from investment operations: |
| Net investment income |
| Net realized and unrealized gain (loss) |
| Total from investment operations |
| Less dividends and distributions from: |
| Net investment income |
| Total dividends and distributions |
| Net asset value, end of period |
| Total return1 |
| Ratios and supplemental data: |
| Net assets, end of period (000 omitted) |
| Ratio of expenses to average net assets |
| Ratio of expenses to average net assets |
| prior to fees waived |
| Ratio of net investment income to average net assets |
| Ratio of net investment income to average net assets |
| prior to fees waived |
| Portfolio turnover |
1 Total investment return is based on the change in net asset value of a share during the period and assumes reinvestment of dividends and distributions at net asset value and does not reflect the impact of a sales charge. Total investment return during all of the periods shown reflects a waiver by the manager. Performance would have been lower had the waiver not been in effect. |
See accompanying notes, which are an integral part of the financial statements.
96
| Year Ended | ||||||||||||||||
| 8/31/12 | 8/31/11 | 8/31/10 | 8/31/09 | 8/31/08 | ||||||||||||
| $10.880 | $11.260 | $10.600 | $10.640 | $10.730 | ||||||||||||
| 0.444 | 0.460 | 0.455 | 0.452 | 0.448 | ||||||||||||
| 0.758 | (0.397 | ) | 0.661 | (0.041 | ) | (0.089 | ) | |||||||||
| 1.202 | 0.063 | 1.116 | 0.411 | 0.359 | ||||||||||||
| (0.442 | ) | (0.443 | ) | (0.456 | ) | (0.451 | ) | (0.449 | ) | |||||||
| (0.442 | ) | (0.443 | ) | (0.456 | ) | (0.451 | ) | (0.449 | ) | |||||||
| $11.640 | $10.880 | $11.260 | $10.600 | $10.640 | ||||||||||||
| 11.23% | 0.71% | 10.74% | 4.11% | 3.38% | ||||||||||||
| $230,787 | $216,151 | $237,545 | $226,393 | $234,630 | ||||||||||||
| 0.84% | 0.88% | 0.93% | 0.90% | 0.93% | ||||||||||||
| 0.93% | 0.95% | 0.95% | 0.95% | 0.95% | ||||||||||||
| 3.91% | 4.30% | 4.16% | 4.43% | 4.16% | ||||||||||||
| 3.82% | 4.23% | 4.14% | 4.38% | 4.14% | ||||||||||||
| 24% | 26% | 17% | 27% | 15% | ||||||||||||
97
Financial highlights
Delaware Tax-Free Colorado Fund Class B
Selected data for each share of the Fund outstanding throughout each period were as follows:
| Net asset value, beginning of period |
| Income (loss) from investment operations: |
| Net investment income |
| Net realized and unrealized gain (loss) |
| Total from investment operations |
| Less dividends and distributions from: |
| Net investment income |
| Total dividends and distributions |
| Net asset value, end of period |
| Total return1 |
| Ratios and supplemental data: |
| Net assets, end of period (000 omitted) |
| Ratio of expenses to average net assets |
| Ratio of expenses to average net assets |
| prior to fees waived |
| Ratio of net investment income to average net assets |
| Ratio of net investment income to average net assets |
| prior to fees waived |
| Portfolio turnover |
1 Total investment return is based on the change in net asset value of a share during the period and assumes reinvestment of dividends and distributions at net asset value and does not reflect the impact of a sales charge. Total investment return during all of the periods shown reflects a waiver by the manager. Performance would have been lower had the waiver not been in effect. |
See accompanying notes, which are an integral part of the financial statements.
98
| Year Ended | ||||||||||||||||
| 8/31/12 | 8/31/11 | 8/31/10 | 8/31/09 | 8/31/08 | ||||||||||||
| $10.890 | $11.270 | $10.610 | $10.640 | $10.730 | ||||||||||||
| 0.360 | 0.380 | 0.373 | 0.375 | 0.367 | ||||||||||||
| 0.758 | (0.397 | ) | 0.661 | (0.031 | ) | (0.089 | ) | |||||||||
| 1.118 | (0.017 | ) | 1.034 | 0.344 | 0.278 | |||||||||||
| (0.358 | ) | (0.363 | ) | (0.374 | ) | (0.374 | ) | (0.368 | ) | |||||||
| (0.358 | ) | (0.363 | ) | (0.374 | ) | (0.374 | ) | (0.368 | ) | |||||||
| $11.650 | $10.890 | $11.270 | $10.610 | $10.640 | ||||||||||||
| 10.41% | (0.04% | ) | 9.91% | 3.43% | 2.60% | |||||||||||
| $173 | $609 | $1,429 | $2,693 | $3,961 | ||||||||||||
| 1.59% | 1.63% | 1.68% | 1.65% | 1.68% | ||||||||||||
| 1.68% | 1.70% | 1.70% | 1.70% | 1.70% | ||||||||||||
| 3.16% | 3.55% | 3.41% | 3.68% | 3.41% | ||||||||||||
| 3.07% | 3.48% | 3.39% | 3.63% | 3.39% | ||||||||||||
| 24% | 26% | 17% | 27% | 15% | ||||||||||||
99
Financial highlights
Delaware Tax-Free Colorado Fund Class C
Selected data for each share of the Fund outstanding throughout each period were as follows:
| Net asset value, beginning of period |
| Income (loss) from investment operations: |
| Net investment income |
| Net realized and unrealized gain (loss) |
| Total from investment operations |
| Less dividends and distributions from: |
| Net investment income |
| Total dividends and distributions |
| Net asset value, end of period |
| Total return1 |
| Ratios and supplemental data: |
| Net assets, end of period (000 omitted) |
| Ratio of expenses to average net assets |
| Ratio of expenses to average net assets |
| prior to fees waived |
| Ratio of net investment income to average net assets |
| Ratio of net investment income to average net assets |
| prior to fees waived |
| Portfolio turnover |
1 Total investment return is based on the change in net asset value of a share during the period and assumes reinvestment of dividends and distributions at net asset value and does not reflect the impact of a sales charge. Total investment return during all of the periods shown reflects a waiver by the manager. Performance would have been lower had the waiver not been in effect. |
See accompanying notes, which are an integral part of the financial statements.
100
| Year Ended | ||||||||||||||||
| 8/31/12 | 8/31/11 | 8/31/10 | 8/31/09 | 8/31/08 | ||||||||||||
| $10.910 | $11.290 | $10.630 | $10.660 | $10.750 | ||||||||||||
| 0.360 | 0.381 | 0.374 | 0.375 | 0.367 | ||||||||||||
| 0.758 | (0.397 | ) | 0.661 | (0.031 | ) | (0.089 | ) | |||||||||
| 1.118 | (0.016 | ) | 1.035 | 0.344 | 0.278 | |||||||||||
| (0.358 | ) | (0.364 | ) | (0.375 | ) | (0.374 | ) | (0.368 | ) | |||||||
| (0.358 | ) | (0.364 | ) | (0.375 | ) | (0.374 | ) | (0.368 | ) | |||||||
| $11.670 | $10.910 | $11.290 | $10.630 | $10.660 | ||||||||||||
| 10.39% | (0.03%) | 9.90% | 3.43% | 2.60% | ||||||||||||
| $14,282 | $13,253 | $15,155 | $11,542 | $9,836 | ||||||||||||
| 1.59% | 1.63% | 1.68% | 1.65% | 1.68% | ||||||||||||
| 1.68% | 1.70% | 1.70% | 1.70% | 1.70% | ||||||||||||
| 3.16% | 3.55% | 3.41% | 3.68% | 3.41% | ||||||||||||
| 3.07% | 3.48% | 3.39% | 3.63% | 3.39% | ||||||||||||
| 24% | 26% | 17% | 27% | 15% | ||||||||||||
101
Financial highlights
Delaware Tax-Free Idaho Fund Class A
Selected data for each share of the Fund outstanding throughout each period were as follows:
| Net asset value, beginning of period |
| Income (loss) from investment operations: |
| Net investment income |
| Net realized and unrealized gain (loss) |
| Total from investment operations |
| Less dividends and distributions from: |
| Net investment income |
| Net realized gain |
| Total dividends and distributions |
| Net asset value, end of period |
| Total return1 |
| Ratios and supplemental data: |
| Net assets, end of period (000 omitted) |
| Ratio of expenses to average net assets |
| Ratio of expenses to average net assets |
| prior to fees waived |
| Ratio of net investment income to average net assets |
| Ratio of net investment income to average net assets |
| prior to fees waived |
| Portfolio turnover |
1 Total investment return is based on the change in net asset value of a share during the period and assumes reinvestment of dividends and distributions at net asset value and does not reflect the impact of a sales charge. Total investment return during all of the periods shown reflects a waiver by the manager. Performance would have been lower had the waiver not been in effect. |
See accompanying notes, which are an integral part of the financial statements.
102
| Year Ended | ||||||||||||||||
| 8/31/12 | 8/31/11 | 8/31/10 | 8/31/09 | 8/31/08 | ||||||||||||
| $11.730 | $12.120 | $11.490 | $11.260 | $11.260 | ||||||||||||
| 0.438 | 0.438 | 0.431 | 0.436 | 0.437 | ||||||||||||
| 0.509 | (0.385 | ) | 0.633 | 0.228 | — | |||||||||||
| 0.947 | 0.053 | 1.064 | 0.664 | 0.437 | ||||||||||||
| (0.437 | ) | (0.436 | ) | (0.434 | ) | (0.434 | ) | (0.437 | ) | |||||||
| — | (0.007 | ) | — | — | — | |||||||||||
| (0.437 | ) | (0.443 | ) | (0.434 | ) | (0.434 | ) | (0.437 | ) | |||||||
| $12.240 | $11.730 | $12.120 | $11.490 | $11.260 | ||||||||||||
| 8.21% | 0.56% | 9.44% | 6.12% | 3.93% | ||||||||||||
| $119,025 | $98,821 | $104,287 | $86,445 | $72,237 | ||||||||||||
| 0.88% | 0.90% | 0.94% | 0.88% | 0.85% | ||||||||||||
| 0.94% | 0.96% | 0.96% | 0.96% | 0.96% | ||||||||||||
| 3.65% | 3.78% | 3.66% | 3.94% | 3.87% | ||||||||||||
| 3.59% | 3.72% | 3.64% | 3.86% | 3.76% | ||||||||||||
| 17% | 32% | 7% | 10% | 11% | ||||||||||||
103
Financial highlights
Delaware Tax-Free Idaho Fund Class B
Selected data for each share of the Fund outstanding throughout each period were as follows:
| Net asset value, beginning of period |
| Income (loss) from investment operations: |
| Net investment income |
| Net realized and unrealized gain (loss) |
| Total from investment operations |
| Less dividends and distributions from: |
| Net investment income |
| Net realized gain |
| Total dividends and distributions |
| Net asset value, end of period |
| Total return1 |
| Ratios and supplemental data: |
| Net assets, end of period (000 omitted) |
| Ratio of expenses to average net assets |
| Ratio of expenses to average net assets |
| prior to fees waived |
| Ratio of net investment income to average net assets |
| Ratio of net investment income to average net assets |
| prior to fees waived |
| Portfolio turnover |
1 Total investment return is based on the change in net asset value of a share during the period and assumes reinvestment of dividends and distributions at net asset value and does not reflect the impact of a sales charge. Total investment return during all of the periods shown reflects a waiver by the manager. Performance would have been lower had the waiver not been in effect. |
See accompanying notes, which are an integral part of the financial statements.
104
| Year Ended | ||||||||||||||||
| 8/31/12 | 8/31/11 | 8/31/10 | 8/31/09 | 8/31/08 | ||||||||||||
| $11.710 | $12.100 | $11.470 | $11.240 | $11.240 | ||||||||||||
| 0.348 | 0.350 | 0.343 | 0.353 | 0.353 | ||||||||||||
| 0.509 | (0.385 | ) | 0.633 | 0.228 | — | |||||||||||
| 0.857 | (0.035 | ) | 0.976 | 0.581 | 0.353 | |||||||||||
| (0.347 | ) | (0.348 | ) | (0.346 | ) | (0.351 | ) | (0.353 | ) | |||||||
| — | (0.007 | ) | — | — | — | |||||||||||
| (0.347 | ) | (0.355 | ) | (0.346 | ) | (0.351 | ) | (0.353 | ) | |||||||
| $12.220 | $11.710 | $12.100 | $11.470 | $11.240 | ||||||||||||
| 7.41% | (0.19% | ) | 8.64% | 5.34% | 3.17% | |||||||||||
| $582 | $912 | $2,450 | $3,359 | $5,123 | ||||||||||||
| 1.63% | 1.65% | 1.69% | 1.63% | 1.60% | ||||||||||||
| 1.69% | 1.71% | 1.71% | 1.71% | 1.71% | ||||||||||||
| 2.90% | 3.03% | 2.91% | 3.19% | 3.12% | ||||||||||||
| 2.84% | 2.97% | 2.89% | 3.11% | 3.01% | ||||||||||||
| 17% | 32% | 7% | 10% | 11% | ||||||||||||
105
Financial highlights
Delaware Tax-Free Idaho Fund Class C
Selected data for each share of the Fund outstanding throughout each period were as follows:
| Net asset value, beginning of period |
| Income (loss) from investment operations: |
| Net investment income |
| Net realized and unrealized gain (loss) |
| Total from investment operations |
| Less dividends and distributions from: |
| Net investment income |
| Net realized gain |
| Total dividends and distributions |
| Net asset value, end of period |
| Total return1 |
| Ratios and supplemental data: |
| Net assets, end of period (000 omitted) |
| Ratio of expenses to average net assets |
| Ratio of expenses to average net assets |
| prior to fees waived |
| Ratio of net investment income to average net assets |
| Ratio of net investment income to average net assets |
| prior to fees waived |
| Portfolio turnover |
1 Total investment return is based on the change in net asset value of a share during the period and assumes reinvestment of dividends and distributions at net asset value and does not reflect the impact of a sales charge. Total investment return during all of the periods shown reflects a waiver by the manager. Performance would have been lower had the waiver not been in effect. |
See accompanying notes, which are an integral part of the financial statements.
106
| Year Ended | ||||||||||||||||
| 8/31/12 | 8/31/11 | 8/31/10 | 8/31/09 | 8/31/08 | ||||||||||||
| $11.720 | $12.110 | $11.480 | $11.250 | $11.250 | ||||||||||||
| 0.348 | 0.351 | 0.342 | 0.353 | 0.352 | ||||||||||||
| 0.509 | (0.385 | ) | 0.633 | 0.228 | — | |||||||||||
| 0.857 | (0.034 | ) | 0.975 | 0.581 | 0.352 | |||||||||||
| (0.347 | ) | (0.349 | ) | (0.345 | ) | (0.351 | ) | (0.352 | ) | |||||||
| — | (0.007 | ) | — | — | — | |||||||||||
| (0.347 | ) | (0.356 | ) | (0.345 | ) | (0.351 | ) | (0.352 | ) | |||||||
| $12.230 | $11.720 | $12.110 | $11.480 | $11.250 | ||||||||||||
| 7.41% | (0.20% | ) | 8.63% | 5.34% | 3.16% | |||||||||||
| $40,738 | $35,797 | $35,591 | $19,176 | $11,490 | ||||||||||||
| 1.63% | 1.65% | 1.69% | 1.63% | 1.60% | ||||||||||||
| 1.69% | 1.71% | 1.71% | 1.71% | 1.71% | ||||||||||||
| 2.90% | 3.03% | 2.91% | 3.19% | 3.12% | ||||||||||||
| 2.84% | 2.97% | 2.89% | 3.11% | 3.01% | ||||||||||||
| 17% | 32% | 7% | 10% | 11% | ||||||||||||
107
Financial highlights
Delaware Tax-Free New York Fund Class A
Selected data for each share of the Fund outstanding throughout each period were as follows:
| Net asset value, beginning of period |
| Income (loss) from investment operations: |
| Net investment income |
| Net realized and unrealized gain (loss) |
| Total from investment operations |
| Less dividends and distributions from: |
| Net investment income |
| Total dividends and distributions |
| Net asset value, end of period |
| Total return1 |
| Ratios and supplemental data: |
| Net assets, end of period (000 omitted) |
| Ratio of expenses to average net assets |
| Ratio of expenses to average net assets |
| prior to fees waived |
| Ratio of net investment income to average net assets |
| Ratio of net investment income to average net assets |
| prior to fees waived |
| Portfolio turnover |
1 Total investment return is based on the change in net asset value of a share during the period and assumes reinvestment of dividends and distributions at net asset value and does not reflect the impact of a sales charge. Total investment return during all of the periods shown reflects a waiver by the manager. Performance would have been lower had the waiver not been in effect. |
See accompanying notes, which are an integral part of the financial statements.
108
| Year Ended | ||||||||||||||||
| 8/31/12 | 8/31/11 | 8/31/10 | 8/31/09 | 8/31/08 | ||||||||||||
| $10.800 | $11.150 | $10.450 | $10.300 | $10.300 | ||||||||||||
| 0.426 | 0.406 | 0.429 | 0.409 | 0.411 | ||||||||||||
| 0.867 | (0.351 | ) | 0.700 | 0.148 | — | |||||||||||
| 1.293 | 0.055 | 1.129 | 0.557 | 0.411 | ||||||||||||
| (0.423 | ) | (0.405 | ) | (0.429 | ) | (0.407 | ) | (0.411 | ) | |||||||
| (0.423 | ) | (0.405 | ) | (0.429 | ) | (0.407 | ) | (0.411 | ) | |||||||
| $11.670 | $10.800 | $11.150 | $10.450 | $10.300 | ||||||||||||
| 12.18% | 0.63% | 11.02% | 5.65% | 4.04% | ||||||||||||
| $53,456 | $37,051 | $37,716 | $22,780 | $15,340 | ||||||||||||
| 0.80% | 0.80% | 0.80% | 0.85% | 0.85% | ||||||||||||
| 1.01% | 1.05% | 1.07% | 1.10% | 1.09% | ||||||||||||
| 3.77% | 3.82% | 3.94% | 4.10% | 3.97% | ||||||||||||
| 3.56% | 3.57% | 3.67% | 3.85% | 3.73% | ||||||||||||
| 28% | 54% | 15% | 36% | 28% | ||||||||||||
109
Financial highlights
Delaware Tax-Free New York Fund Class B
Selected data for each share of the Fund outstanding throughout each period were as follows:
| Net asset value, beginning of period |
| Income (loss) from investment operations: |
| Net investment income |
| Net realized and unrealized gain (loss) |
| Total from investment operations |
| Less dividends and distributions from: |
| Net investment income |
| Total dividends and distributions |
| Net asset value, end of period |
| Total return1 |
| Ratios and supplemental data: |
| Net assets, end of period (000 omitted) |
| Ratio of expenses to average net assets |
| Ratio of expenses to average net assets |
| prior to fees waived |
| Ratio of net investment income to average net assets |
| Ratio of net investment income to average net assets |
| prior to fees waived |
| Portfolio turnover |
1 Total investment return is based on the change in net asset value of a share during the period and assumes reinvestment of dividends and distributions at net asset value and does not reflect the impact of a sales charge. Total investment return during all of the periods shown reflects a waiver by the manager. Performance would have been lower had the waiver not been in effect. |
See accompanying notes, which are an integral part of the financial statements.
110
| Year Ended | ||||||||||||||||
| 8/31/12 | 8/31/11 | 8/31/10 | 8/31/09 | 8/31/08 | ||||||||||||
| $10.780 | $11.120 | $10.420 | $10.270 | $10.280 | ||||||||||||
| 0.341 | 0.326 | 0.347 | 0.334 | 0.333 | ||||||||||||
| 0.867 | (0.341 | ) | 0.700 | 0.148 | (0.010 | ) | ||||||||||
| 1.208 | (0.015 | ) | 1.047 | 0.482 | 0.323 | |||||||||||
| (0.338 | ) | (0.325 | ) | (0.347 | ) | (0.332 | ) | (0.333 | ) | |||||||
| (0.338 | ) | (0.325 | ) | (0.347 | ) | (0.332 | ) | (0.333 | ) | |||||||
| $11.650 | $10.780 | $11.120 | $10.420 | $10.270 | ||||||||||||
| 11.36% | (0.04% | ) | 10.21% | 4.88% | 3.17% | |||||||||||
| $318 | $477 | $736 | $1,018 | $1,549 | ||||||||||||
| 1.55% | 1.55% | 1.55% | 1.60% | 1.60% | ||||||||||||
| 1.76% | 1.80% | 1.82% | 1.85% | 1.84% | ||||||||||||
| 3.02% | 3.07% | 3.19% | 3.35% | 3.22% | ||||||||||||
| 2.81% | 2.82% | 2.92% | 3.10% | 2.98% | ||||||||||||
| 28% | 54% | 15% | 36% | 28% | ||||||||||||
111
Financial highlights
Delaware Tax-Free New York Fund Class C
Selected data for each share of the Fund outstanding throughout each period were as follows:
| Net asset value, beginning of period |
| Income (loss) from investment operations: |
| Net investment income |
| Net realized and unrealized gain (loss) |
| Total from investment operations |
| Less dividends and distributions from: |
| Net investment income |
| Total dividends and distributions |
| Net asset value, end of period |
| Total return1 |
| Ratios and supplemental data: |
| Net assets, end of period (000 omitted) |
| Ratio of expenses to average net assets |
| Ratio of expenses to average net assets |
| prior to fees waived |
| Ratio of net investment income to average net assets |
| Ratio of net investment income to average net assets |
| prior to fees waived |
| Portfolio turnover |
1 Total investment return is based on the change in net asset value of a share during the period and assumes reinvestment of dividends and distributions at net asset value and does not reflect the impact of a sales charge. Total investment return during all of the periods shown reflects a waiver by the manager. Performance would have been lower had the waiver not been in effect. |
See accompanying notes, which are an integral part of the financial statements.
112
| Year Ended | ||||||||||||||||
| 8/31/12 | 8/31/11 | 8/31/10 | 8/31/09 | 8/31/08 | ||||||||||||
| $10.780 | $11.120 | $10.420 | $10.270 | $10.280 | ||||||||||||
| 0.340 | 0.326 | 0.346 | 0.333 | 0.333 | ||||||||||||
| 0.857 | (0.341 | ) | 0.700 | 0.148 | (0.010 | ) | ||||||||||
| 1.197 | (0.015 | ) | 1.046 | 0.481 | 0.323 | |||||||||||
| (0.337 | ) | (0.325 | ) | (0.346 | ) | (0.331 | ) | (0.333 | ) | |||||||
| (0.337 | ) | (0.325 | ) | (0.346 | ) | (0.331 | ) | (0.333 | ) | |||||||
| $11.640 | $10.780 | $11.120 | $10.420 | $10.270 | ||||||||||||
| 11.26% | (0.04% | ) | 10.20% | 4.88% | 3.17% | |||||||||||
| $20,524 | $14,235 | $13,462 | $5,651 | $2,049 | ||||||||||||
| 1.55% | 1.55% | 1.55% | 1.60% | 1.60% | ||||||||||||
| 1.76% | 1.80% | 1.82% | 1.85% | 1.84% | ||||||||||||
| 3.02% | 3.07% | 3.19% | 3.35% | 3.22% | ||||||||||||
| 2.81% | 2.82% | 2.92% | 3.10% | 2.98% | ||||||||||||
| 28% | 54% | 15% | 36% | 28% | ||||||||||||
113
| Notes to financial statements | |
| Delaware Investments® state tax-free funds | August 31, 2012 |
Voyageur Mutual Funds is organized as a Delaware statutory trust and offers five series: Delaware Minnesota High-Yield Municipal Bond Fund, Delaware National High-Yield Municipal Bond Fund, Delaware Tax-Free California Fund, Delaware Tax-Free Idaho Fund, and Delaware Tax-Free New York Fund. Voyageur Mutual Funds II is organized as a Delaware statutory trust and offers one series: Delaware Tax-Free Colorado Fund. Voyageur Insured Funds is organized as a Delaware statutory trust and offers one series: Delaware Tax-Free Arizona Fund. Voyageur Mutual Funds, Voyageur Mutual Funds II, and Voyageur Insured Funds are each individually referred to as a Trust and collectively as the Trusts. These financial statements and related notes pertain to Delaware Tax-Free Arizona Fund, Delaware Tax-Free California Fund, Delaware Tax-Free Colorado Fund, Delaware Tax-Free Idaho Fund, and Delaware Tax-Free New York Fund (each, a Fund or, collectively, the Funds). The above Trusts are open-end investment companies. The Funds are considered diversified under the Investment Company Act of 1940, as amended, and offer Class A, Class B, and Class C shares. Class A shares are sold with a maximum front-end sales charge of 4.50%. Class A share purchases of $1,000,000 or more will incur a contingent deferred sales charge (CDSC) of 1% if redeemed during the first year and 0.50% during the second year, provided that Delaware Distributors, L.P. (DDLP) paid a financial advisor a commission on the purchase of those shares. Class B shares may be purchased only through dividend reinvestment and certain permitted exchanges. Prior to June 1, 2007, Class B shares were sold with a CDSC that declined from 4% to zero depending upon the period of time the shares were held. Class B shares will automatically convert to Class A shares on a quarterly basis approximately eight years after purchase. Class C shares are sold with a CDSC of 1%, if redeemed during the first twelve months.
The investment objective of each Fund is to seek as high a level of current income exempt from federal income tax and from personal income tax in its respective state, as is consistent with preservation of capital.
1. Significant Accounting Policies
The following accounting policies are in accordance with U.S. generally accepted accounting principles (U.S. GAAP) and are consistently followed by the Funds.
Security Valuation — Debt securities are valued based upon valuations provided by an independent pricing service or broker and reviewed by management. To the extent current market prices are not available, the pricing service may take into account developments related to the specific security, as well as transactions in comparable securities. Valuations for fixed income securities utilize matrix systems, which reflect such factors as security prices, yields, maturities, and ratings, and are supplemented by dealer and exchange quotations. Open-end investment companies are valued at their published net asset value. Generally, other securities and assets for which market quotations are not readily available are valued at fair value as determined in good faith under the direction of each Fund’s Board of Trustees (each, a Board or, collectively, the Boards). In determining whether market quotations are readily available or fair valuation will be used, various factors will be taken into consideration, such as market closures or suspension of trading in a security.
114
Federal Income Taxes — No provision for federal income taxes has been made as each Fund intends to continue to qualify for federal income tax purposes as a regulated investment company under Subchapter M of the Internal Revenue Code of 1986, as amended, and make the requisite distributions to shareholders. The Funds evaluate tax positions taken or expected to be taken in the course of preparing the Funds’ tax returns to determine whether the tax positions are “more likely-than-not” of being sustained by the applicable tax authority. Tax positions not deemed to meet the more-likely-than-not threshold are recorded as a tax benefit or expense in the current year. Management has analyzed the Funds’ tax positions taken on federal income tax returns for all open tax years (August 31, 2009–August 31, 2012), and has concluded that no provision for federal income tax is required in the Funds’ financial statements.
Class Accounting — Investment income and common expenses are allocated to the various classes of each Fund on the basis of “settled shares” of each class in relation to the net assets of each Fund. Realized and unrealized gain (loss) on investments are allocated to the various classes of each Fund on the basis of daily net assets of each class. Distribution expenses relating to a specific class are charged directly to that class.
Use of Estimates — The preparation of financial statements in conformity with U.S. GAAP requires management to make estimates and assumptions that affect the fair value of investments, the reported amounts of assets and liabilities and disclosure of contingent assets and liabilities at the date of the financial statements and the reported amounts of revenues and expenses during the reporting period. Actual results could differ from those estimates and the differences could be material.
Other — Expenses directly attributable to the Funds are charged directly to the Funds. Other expenses common to various funds within the Delaware Investments® Family of Funds are generally allocated amongst such funds on the basis of average net assets. Management fees and some other expenses are paid monthly. Security transactions are recorded on the date the securities are purchased or sold (trade date) for financial reporting purposes. Costs used in calculating realized gains and losses on the sale of investment securities are those of the specific securities sold. Interest income is recorded on the accrual basis. Discounts and premiums are amortized to interest income over the lives of the respective securities using the effective interest method. The Funds declare dividends daily from net investment income and pay the dividends monthly and declare and pay distributions from net realized gain on investments, if any, annually. The Funds may distribute income dividends and capital gains more frequently, if necessary for tax purposes. Dividends and distributions, if any, are recorded on the ex-dividend date.
The Funds may receive earnings credits from their custodian when positive cash balances are maintained, which are used to offset custody fees. There were no earnings credits for the year ended August 31, 2012.
115
Notes to financial statements
Delaware Investments® state tax-free funds
1. Significant Accounting Policies (continued)
The Funds receive earnings credits from their transfer agent when positive cash balances are maintained, which are used to offset transfer agent fees. The expense paid under this arrangement is included in dividend disbursing and transfer agent fees and expenses on the statements of operations with the corresponding expense offset shown as “expense paid indirectly.” For the year ended August 31, 2012, the Funds earned the following amounts under this agreement:
| Delaware | Delaware | Delaware | Delaware | Delaware | ||||||
| Tax-Free | Tax-Free | Tax-Free | Tax-Free | Tax-Free | ||||||
| Arizona Fund | California Fund | Colorado Fund | Idaho Fund | New York Fund | ||||||
| $42 | $30 | $92 | $56 | $20 |
2. Investment Management, Administration Agreements and Other Transactions with Affiliates
In accordance with the terms of its respective investment management agreement, each Fund pays Delaware Management Company (DMC), a series of Delaware Management Business Trust and the investment manager, an annual fee, which is calculated based on each Fund’s average daily net assets as follows:
| Delaware | Delaware | Delaware | Delaware | Delaware | ||||||
| Tax-Free | Tax-Free | Tax-Free | Tax-Free | Tax-Free | ||||||
| Arizona Fund | California Fund | Colorado Fund | Idaho Fund | New York Fund | ||||||
| On the first $500 million | 0.500% | 0.550% | 0.550% | 0.550% | 0.550% | |||||
| On the next $500 million | 0.475% | 0.500% | 0.500% | 0.500% | 0.500% | |||||
| On the next $1.5 billion | 0.450% | 0.450% | 0.450% | 0.450% | 0.450% | |||||
| In excess of $2.5 billion | 0.425% | 0.425% | 0.425% | 0.425% | 0.425% |
DMC has contractually agreed to waive that portion, if any, of its management fee and reimburse the Funds to the extent necessary to prevent total annual fund operating expenses (excluding any 12b-1 plan expenses, taxes, interest, inverse floater program expenses, short sale and dividend interest expenses, brokerage fees, certain insurance costs, and nonroutine expenses or costs, including, but not limited to, those relating to reorganizations, litigation, conducting shareholder meetings, and liquidations) from exceeding the following percentages of each Fund’s average daily net assets through December 28, 2012. These waivers and reimbursements may only be terminated by agreement of DMC and the Funds.
| Delaware | Delaware | Delaware | Delaware | Delaware | ||||||
| Tax-Free | Tax-Free | Tax-Free | Tax-Free | Tax-Free | ||||||
| Arizona Fund | California Fund | Colorado Fund | Idaho Fund | New York Fund | ||||||
| Operating expense | ||||||||||
| limitation as a percentage | ||||||||||
| of average daily net assets | ||||||||||
| (per annum) | 0.59% | 0.57% | 0.59% | 0.63% | 0.55% |
116
Delaware Service Company, Inc. (DSC), an affiliate of DMC, provides fund accounting and financial administration oversight services to the Funds. For these services, the Funds pay DSC fees based on the aggregate daily net assets of the Delaware Investments® Family of Funds at the following annual rate: 0.0050% of the first $30 billion; 0.0045% of the next $10 billion; 0.0040% of the next $10 billion; and 0.0025% of aggregate average daily net assets in excess of $50 billion. The fees payable to DSC under the service agreement described above are allocated among all Funds in the Delaware Investments Family of Funds on a relative net asset value basis. For the year ended August 31, 2012, each Fund was charged for these services as follows:
| Delaware | Delaware | Delaware | Delaware | Delaware | ||||||
| Tax-Free | Tax-Free | Tax-Free | Tax-Free | Tax-Free | ||||||
| Arizona Fund | California Fund | Colorado Fund | Idaho Fund | New York Fund | ||||||
| $5,186 | $4,708 | $11,697 | $7,259 | $3,089 |
DSC also provides dividend disbursing and transfer agency services. The Funds pay DSC a monthly asset-based fee for these services.
Pursuant to a distribution agreement and distribution plan, each Fund pays DDLP, the distributor and an affiliate of DMC, an annual distribution and service fee of 0.25% of the average daily net assets of the Class A shares and 1.00% of the average daily net assets of the Class B and Class C shares.
At August 31, 2012, each Fund had liabilities payable to affiliates as follows:
| Delaware | Delaware | Delaware | Delaware | Delaware | |||||||||||||||||||||
| Tax-Free | Tax-Free | Tax-Free | Tax-Free | Tax-Free | |||||||||||||||||||||
| Arizona Fund | California Fund | Colorado Fund | Idaho Fund | New York Fund | |||||||||||||||||||||
| Investment management | |||||||||||||||||||||||||
| fees payable to DMC | $ | 46,493 | $ | 34,716 | $ | 102,953 | $ | 70,872 | $ | 24,246 | |||||||||||||||
| Dividend disbursing, | |||||||||||||||||||||||||
| transfer agent and fund | |||||||||||||||||||||||||
| accounting oversight | |||||||||||||||||||||||||
| fees and other expenses | |||||||||||||||||||||||||
| payable to DSC | 2,496 | 2,714 | 5,723 | 3,705 | 1,702 | ||||||||||||||||||||
| Distribution fees | |||||||||||||||||||||||||
| payable to DDLP | 27,224 | 36,873 | 60,947 | 59,308 | 28,361 | ||||||||||||||||||||
| Other expenses payable to | |||||||||||||||||||||||||
| DMC and affiliates* | 1,653 | 1,949 | 4,129 | 2,356 | 1,370 | ||||||||||||||||||||
*DMC, as part of its administrative services, pays operating expenses on behalf of each Fund and is reimbursed on a periodic basis. Expenses include items such as printing of shareholder reports, fees for audit, legal and tax services, registration fees and trustees’ fees.
117
Notes to financial statements
Delaware Investments® state tax-free funds
| 2. | Investment Management, Administration Agreements and Other Transactions with Affiliates (continued) |
As provided in the investment management agreement, each Fund bears the cost of certain legal and tax services, including internal legal and tax services provided to each Fund by DMC and/or its affiliates’ employees. For the year ended August 31, 2012, each Fund was charged for internal legal and tax services provided by DMC and/or its affiliates’ employees as follows:
| Delaware | Delaware | Delaware | Delaware | Delaware | ||||||
| Tax-Free | Tax-Free | Tax-Free | Tax-Free | Tax-Free | ||||||
| Arizona Fund | California Fund | Colorado Fund | Idaho Fund | New York Fund | ||||||
| $2,924 | $2,609 | $6,590 | $4,074 | $1,721 |
For the year ended August 31, 2012, DDLP earned commissions on sales of Class A shares for each Fund as follows:
| Delaware | Delaware | Delaware | Delaware | Delaware | ||||||
| Tax-Free | Tax-Free | Tax-Free | Tax-Free | Tax-Free | ||||||
| Arizona Fund | California Fund | Colorado Fund | Idaho Fund | New York Fund | ||||||
| $8,117 | $11,226 | $22,464 | $55,839 | $26,059 |
For the year ended August 31, 2012, DDLP received gross CDSC commissions on redemptions of each Fund’s Class A, Class B and Class C shares, and these commissions were entirely used to offset up-front commissions previously paid by DDLP to broker/dealers on sales of those shares. The amounts received were as follows:
| Delaware | Delaware | Delaware | Delaware | Delaware | |||||||||||||||||||||
| Tax-Free | Tax-Free | Tax-Free | Tax-Free | Tax-Free | |||||||||||||||||||||
| Arizona Fund | California Fund | Colorado Fund | Idaho Fund | New York Fund | |||||||||||||||||||||
| Class A | $ | 0 | $ | 2,717 | $ | 0 | $ | 31 | $ | 0 | |||||||||||||||
| Class B | 53 | 26 | 0 | 0 | 0 | ||||||||||||||||||||
| Class C | 0 | 25 | 0 | 3,304 | 240 | ||||||||||||||||||||
Trustees’ fees include expenses accrued by the Funds for each Trustee’s retainer and meeting fees. Certain officers of DMC, DSC and DDLP are officers and/or Trustees of the Trusts. These officers and Trustees are paid no compensation by the Funds.
118
3. Investments
For the year ended August 31, 2012, the Funds made purchases and sales of investment securities other than short-term investments as follows:
| Delaware | Delaware | Delaware | Delaware | Delaware | |||||||||||
| Tax-Free | Tax-Free | Tax-Free | Tax-Free | Tax-Free | |||||||||||
| Arizona Fund | California Fund | Colorado Fund | Idaho Fund | New York Fund | |||||||||||
| Purchases | $ | 36,253,950 | $ | 56,058,490 | $ | 57,102,138 | $ | 41,707,441 | $ | 34,884,546 | |||||
| Sales | 35,771,298 | 30,709,115 | 55,608,165 | 24,117,863 | 17,251,986 | ||||||||||
At August 31, 2012, the cost of investments and unrealized appreciation (depreciation) for federal income tax purposes for each Fund were as follows:
| Delaware | Delaware | Delaware | Delaware | Delaware | |||||||||||||||
| Tax-Free | Tax-Free | Tax-Free | Tax-Free | Tax-Free | |||||||||||||||
| Arizona Fund | California Fund | Colorado Fund | Idaho Fund | New York Fund | |||||||||||||||
| Cost of | |||||||||||||||||||
| investments | $ | 99,481,065 | $ | 107,589,705 | $ | 226,684,169 | $ | 146,750,941 | $ | 68,218,269 | |||||||||
| Aggregate | |||||||||||||||||||
| unrealized | |||||||||||||||||||
| appreciation | $ | 8,508,341 | $ | 9,100,551 | $ | 19,386,384 | $ | 12,165,960 | $ | 6,333,856 | |||||||||
| Aggregate | |||||||||||||||||||
| unrealized | |||||||||||||||||||
| (depreciation) | (16,087 | ) | (75,370 | ) | (531,630 | ) | — | (11,307 | ) | ||||||||||
| Net unrealized | |||||||||||||||||||
| appreciation | $ | 8,492,254 | $ | 9,025,181 | $ | 18,854,754 | $ | 12,165,960 | $ | 6,322,549 | |||||||||
U.S. GAAP defines fair value as the price that the Funds would receive to sell an asset or pay to transfer a liability in an orderly transaction between market participants at the measurement date under current market conditions. A three level hierarchy for fair value measurements has been established based upon the transparency of inputs to the valuation of an asset or liability. Inputs may be observable or unobservable and refer broadly to the assumptions that market participants would use in pricing the asset or liability. Observable inputs reflect the assumptions market participants would use in pricing the asset or liability based on market data obtained from sources independent of the reporting entity. Unobservable inputs reflect the reporting entity’s own assumptions about the assumptions that market participants would use in pricing the asset or liability developed based on the best information available under the circumstances. Each Fund’s investment in its entirety is assigned a level based upon the observability of the inputs which are significant to the overall valuation. The three level hierarchy of inputs is summarized below.
| Level 1 – | inputs are quoted prices in active markets for identical investments (e.g., equity securities, open-end investment companies, futures contracts, exchange-traded options contracts) |
119
Notes to financial statements
Delaware Investments® state tax-free funds
3. Investments (continued)
| Level 2 – | other observable inputs (including, but not limited to: quoted prices for similar assets or liabilities in markets that are active, quoted prices for identical or similar assets or liabilities in markets that are not active, inputs other than quoted prices that are observable for the assets or liabilities (such as interest rates, yield curves, volatilities, prepayment speeds, loss severities, credit risks and default rates) or other market-corroborated inputs) (e.g., debt securities, government securities, swap contracts, foreign currency exchange contracts, foreign securities utilizing international fair value pricing, broker-quoted securities, fair valued securities) |
| Level 3 – | inputs are significant unobservable inputs (including the Funds’ own assumptions used to determine the fair value of investments) (e.g., broker-quoted securities, fair valued securities) |
Level 3 investments are valued using significant unobservable inputs, including related or comparable assets or liabilities, book values, and other relevant information for the investment to determine the fair value of the investment. The Funds may also use an income-based valuation approach in which the anticipated future cash flows of the investment are discounted to calculate fair value. Discounts may also be applied due to the nature or duration of any restrictions on the disposition of the investments. Valuations may also be based upon current market prices of securities that are comparable in coupon, rating, maturity and industry. The derived value of a Level 3 investment may not represent the value which is received upon disposition and this could impact the results of operations.
The following tables summarize the valuation of each Fund’s investments by fair value hierarchy levels as of August 31, 2012:
| Delaware Tax-Free Arizona Fund | |||||||||
| Level 2 | |||||||||
| Municipal Bonds | $ | 107,973,319 | |||||||
| Delaware Tax-Free California Fund | |||||||||
| Level 2 | |||||||||
| Municipal Bonds | $ | 115,614,886 | |||||||
| Short-Term Investment | 1,000,000 | ||||||||
| Total | $ | 116,614,886 | |||||||
| Delaware Tax-Free Colorado Fund | |||||||||
| Level 1 | Level 2 | Total | |||||||
| Municipal Bonds | $ | — | $ | 244,862,423 | $ | 244,862,423 | |||
| Short-Term Investments | 376,500 | 300,000 | 676,500 | ||||||
| Total | $ | 376,500 | $ | 245,162,423 | $ | 245,538,923 | |||
120
| Delaware Tax-Free Idaho Fund | |||||||||
| Level 1 | Level 2 | Total | |||||||
| Municipal Bonds | $ | — | $ | 157,247,594 | $ | 157,247,594 | |||
| Short-Term Investments | 1,249,307 | 420,000 | 1,669,307 | ||||||
| Total | $ | 1,249,307 | $ | 157,667,594 | $ | 158,916,901 | |||
| Delaware Tax-Free New York Fund | |||||||||
| Level 2 | |||||||||
| Municipal Bonds | $ | 73,040,818 | |||||||
| Short-Term Investments | 1,500,000 | ||||||||
| Total | $ | 74,540,818 | |||||||
During the year ended August 31, 2012, there were no transfers between Level 1 investments, Level 2 investments or Level 3 investments that had a material impact to the Funds. Each Fund’s policy is to recognize transfers between levels at the beginning of the reporting period.
4. Dividend and Distribution Information
Income and long-term capital gain distributions are determined in accordance with federal income tax regulations, which may differ from U.S. GAAP. Additionally, distributions from net short-term gains on sales of investment securities are treated as ordinary income for federal income tax purposes. The tax character of dividends and distributions paid during the years ended August 31, 2012 and 2011 was as follows:
| Delaware | Delaware | Delaware | Delaware | Delaware | |||||||||||||||||||
| Tax-Free | Tax-Free | Tax-Free | Tax-Free | Tax-Free | |||||||||||||||||||
| Arizona Fund | California Fund | Colorado Fund | Idaho Fund | New York Fund | |||||||||||||||||||
| Year Ended 8/31/12 | |||||||||||||||||||||||
| Tax-exempt income | $ | 4,071,429 | $ | 3,785,457 | $ | 9,184,480 | $ | 5,085,903 | $ | 2,214,770 | |||||||||||||
| Ordinary income | 4 | — | — | 27 | 851 | ||||||||||||||||||
| Long-term capital gains | 27,070 | — | — | — | — | ||||||||||||||||||
| Total | $ | 4,098,503 | $ | 3,785,457 | $ | 9,184,480 | $ | 5,085,930 | $ | 2,215,621 | |||||||||||||
| Year Ended 8/31/11 | |||||||||||||||||||||||
| Tax-exempt income | $ | 4,112,014 | $ | 3,499,954 | $ | 9,447,544 | $ | 4,647,399 | $ | 1,826,536 | |||||||||||||
| Ordinary income | 101,505 | 77,870 | 123,382 | 137,722 | 16,404 | ||||||||||||||||||
| Long-term capital gains | 273,094 | — | — | 24,209 | — | ||||||||||||||||||
| Total | $ | 4,486,613 | $ | 3,577,824 | $ | 9,570,926 | $ | 4,809,330 | $ | 1,842,940 | |||||||||||||
121
Notes to financial statements
Delaware Investments® state tax-free funds
5. Components of Net Assets on a Tax Basis
As of August 31, 2012, the components of net assets on a tax basis were as follows:
| Delaware | Delaware | Delaware | Delaware | Delaware | ||||||||||||||||
| Tax-Free | Tax-Free | Tax-Free | Tax-Free | Tax-Free | ||||||||||||||||
| Arizona Fund | California Fund | Colorado Fund | Idaho Fund | New York Fund | ||||||||||||||||
| Shares of beneficial | ||||||||||||||||||||
| interest | $ | 98,005,801 | $ | 108,881,968 | $ | 227,706,481 | $ | 149,358,034 | $ | 67,851,237 | ||||||||||
| Undistributed tax- | ||||||||||||||||||||
| exempt income | 125,060 | 123,583 | 568,497 | 115,520 | 67,040 | |||||||||||||||
| Undistributed | ||||||||||||||||||||
| long-term | ||||||||||||||||||||
| capital gains | 762,026 | — | — | — | 117,066 | |||||||||||||||
| Distributions | ||||||||||||||||||||
| payable | (99,751 | ) | (104,820 | ) | (215,935 | ) | (132,164 | ) | (59,941 | ) | ||||||||||
| Qualified late year | ||||||||||||||||||||
| long-term capital | ||||||||||||||||||||
| losses deferred | — | — | — | (298,353 | ) | — | ||||||||||||||
| Capital loss | ||||||||||||||||||||
| carryforwards | — | (369,988 | ) | (1,671,323 | ) | (863,783 | ) | — | ||||||||||||
| Unrealized | ||||||||||||||||||||
| appreciation | ||||||||||||||||||||
| of investments | 8,492,254 | 9,025,181 | 18,854,754 | 12,165,960 | 6,322,549 | |||||||||||||||
| Net assets | $ | 107,285,390 | $ | 117,555,924 | $ | 245,242,474 | $ | 160,345,214 | $ | 74,297,951 | ||||||||||
The differences between book basis and tax basis components of net assets are primarily attributable to tax deferral of losses of wash sales, tax treatment of market discount and premium on debt instruments and distributions payable.
Qualified late year losses represent losses realized on investment transactions from November 1, 2011 through August 31, 2012 that, in accordance with federal income tax regulation, Delaware Tax-Free Idaho Fund has elected to defer and treat as having arisen in the following fiscal year.
122
For financial reporting purposes, capital accounts are adjusted to reflect the tax character of permanent book/tax differences. Reclassifications are primarily due to tax treatment of market discount and premium on debt instruments. Results of operations and net assets were not affected by these reclassifications. For the year ended August 31, 2012, the Funds recorded the following reclassifications:
| Delaware | Delaware | Delaware | Delaware | Delaware | ||||||||||||||||||||||||||
| Tax-Free | Tax-Free | Tax-Free | Tax-Free | Tax-Free | ||||||||||||||||||||||||||
| Arizona Fund | California Fund | Colorado Fund | Idaho Fund | New York Fund | ||||||||||||||||||||||||||
| Undistributed | ||||||||||||||||||||||||||||||
| (distributions in excess of) | ||||||||||||||||||||||||||||||
| net investment income | $ | (25,305 | ) | $ | (10,781 | ) | $ | (21,646 | ) | $ | (17,401 | ) | $ | (10,585 | ) | |||||||||||||||
| Accumulated net realized | ||||||||||||||||||||||||||||||
| gain (loss) | 25,305 | 10,781 | 21,646 | 17,401 | 10,585 | |||||||||||||||||||||||||
For federal income tax purposes, capital loss carryforwards may be carried forward and applied against future capital gains. In 2012, the Funds utilized capital loss carryforwards as follows:
| Delaware | Delaware | Delaware | ||||
| Tax-Free | Tax-Free | Tax-Free | ||||
| California Fund | Colorado Fund | New York Fund | ||||
| $139,322 | $1,141,379 | $28,006 |
Capital loss carryforwards remaining at August 31, 2012 will expire as follows:
| Delaware | Delaware | Delaware | Delaware | Delaware | |||||||||||||||||||
| Year of | Tax-Free | Tax-Free | Tax-Free | Tax-Free | Tax-Free | ||||||||||||||||||
| Expiration | Arizona Fund | California Fund | Colorado Fund | Idaho Fund | New York Fund | ||||||||||||||||||
| 2014 | $— | $ | — | $ | 1,627,145 | $— | $— | ||||||||||||||||
| 2016 | — | — | 44,178 | — | — | ||||||||||||||||||
| 2019 | — | 369,988 | — | — | — | ||||||||||||||||||
| Total | $— | $ | 369,988 | $ | 1,671,323 | $— | $— | ||||||||||||||||
On December 22, 2010, the Regulated Investment Company Modernization Act of 2010 (Act) was enacted, which changed various technical rules governing the tax treatment of regulated investment companies. The changes are generally effective for taxable years beginning after the date of enactment. Under the Act, the Funds are permitted to carry forward capital losses incurred in taxable years beginning after the date of enactment for an unlimited period. However, any losses incurred during those future taxable years will be required to be utilized prior to the losses incurred in pre-enactment taxable years, which carry an expiration date. As a result of this ordering rule, pre-enactment capital loss carryforwards may be more likely to expire unused. Additionally, post-enactment capital loss carryforwards will retain their character as either short-term or long-term capital losses rather than being considered all short-term as permitted under previous regulation.
Losses incurred that will be carried forward under the Act are as follows:
| Loss carryforward character | ||||
| Short-term | Long-term | |||
| Delaware Tax-Free Idaho Fund | $863,783 | $— | ||
123
Notes to financial statements
Delaware Investments® state tax-free funds
6. Capital Shares
Transactions in capital shares were as follows:
| Delaware Tax-Free | Delaware Tax-Free | Delaware Tax-Free | ||||||||||||||||
| Arizona Fund | California Fund | Colorado Fund | ||||||||||||||||
| Year Ended | Year Ended | Year Ended | ||||||||||||||||
| 8/31/12 | 8/31/11 | 8/31/12 | 8/31/11 | 8/31/12 | 8/31/11 | |||||||||||||
| Shares sold: | ||||||||||||||||||
| Class A | 439,537 | 866,329 | 2,916,355 | 1,260,131 | 895,891 | 905,561 | ||||||||||||
| Class B | — | 40 | 2,492 | 41 | — | 27 | ||||||||||||
| Class C | 71,479 | 71,073 | 415,741 | 355,660 | 151,986 | 162,405 | ||||||||||||
| Shares issued upon reinvestment of dividends and distributions: | ||||||||||||||||||
| Class A | 236,927 | 199,470 | 192,283 | 164,198 | 580,278 | 560,364 | ||||||||||||
| Class B | 1,218 | 2,852 | 1,958 | 4,880 | 529 | 1,985 | ||||||||||||
| Class C | 15,162 | 13,627 | 38,704 | 35,603 | 31,740 | 32,471 | ||||||||||||
| 764,323 | 1,153,391 | 3,567,533 | 1,820,513 | 1,660,424 | 1,662,813 | |||||||||||||
| Shares redeemed: | ||||||||||||||||||
| Class A | (779,149 | ) | (1,847,336 | ) | (1,100,987 | ) | (1,722,598 | ) | (1,507,938 | ) | (2,700,759 | ) | ||||||
| Class B | (49,279 | ) | (184,115 | ) | (47,147 | ) | (168,581 | ) | (41,596 | ) | (72,932 | ) | ||||||
| Class C | (94,840 | ) | (164,691 | ) | (243,641 | ) | (402,444 | ) | (174,363 | ) | (322,740 | ) | ||||||
| (923,268 | ) | (2,196,142 | ) | (1,391,775 | ) | (2,293,623 | ) | (1,723,897 | ) | (3,096,431 | ) | |||||||
| Net increase | ||||||||||||||||||
| (decrease) | (158,945 | ) | (1,042,751 | ) | 2,175,758 | (473,110 | ) | (63,473 | ) | (1,433,618 | ) | |||||||
| Delaware Tax-Free | Delaware Tax-Free | |||||||||||
| Idaho Fund | New York Fund | |||||||||||
| Year Ended | Year Ended | |||||||||||
| 8/31/12 | 8/31/11 | 8/31/12 | 8/31/11 | |||||||||
| Shares sold: | ||||||||||||
| Class A | 2,264,249 | 1,900,076 | 1,677,664 | 1,003,049 | ||||||||
| Class B | 11 | — | 3,300 | — | ||||||||
| Class C | 773,648 | 788,345 | 538,503 | 364,898 | ||||||||
| Shares issued upon reinvestment of dividends and distributions: | ||||||||||||
| Class A | 235,429 | 226,583 | 123,671 | 96,410 | ||||||||
| Class B | 1,347 | 3,332 | 917 | 1,212 | ||||||||
| Class C | 78,088 | 72,898 | 35,307 | 29,809 | ||||||||
| 3,352,772 | 2,991,234 | 2,379,362 | 1,495,378 | |||||||||
| Shares redeemed: | ||||||||||||
| Class A | (1,203,335 | ) | (2,303,200 | ) | (651,615 | ) | (1,052,715 | ) | ||||
| Class B | (31,696 | ) | (127,823 | ) | (21,163 | ) | (23,226 | ) | ||||
| Class C | (576,195 | ) | (744,786 | ) | (132,201 | ) | (284,284 | ) | ||||
| (1,811,226 | ) | (3,175,809 | ) | (804,979 | ) | (1,360,225 | ) | |||||
| Net increase (decrease) | 1,541,546 | (184,575 | ) | 1,574,383 | 135,153 | |||||||
124
For the years ended August 31, 2012 and 2011, the following shares and values were converted from Class B to Class A shares. The amounts are included in Class B redemptions and Class A subscriptions in the tables above and the statements of changes in net assets.
| Year Ended | Year Ended | |||||||||||||
| 8/31/12 | 8/31/11 | |||||||||||||
| Class B | Class A | Class B | Class A | |||||||||||
| Shares | Shares | Value | Shares | Shares | Value | |||||||||
| Delaware Tax-Free | ||||||||||||||
| Arizona Fund | 9,844 | 9,861 | $ | 115,358 | 114,565 | 114,667 | $ | 1,289,672 | ||||||
| Delaware Tax-Free | ||||||||||||||
| California Fund | 25,311 | 25,461 | 290,956 | 111,060 | 111,540 | 1,237,217 | ||||||||
| Delaware Tax-Free | ||||||||||||||
| Colorado Fund | 19,768 | 19,816 | 221,534 | 53,647 | 53,698 | 571,670 | ||||||||
| Delaware Tax-Free | ||||||||||||||
| Idaho Fund | 11,453 | 11,457 | 135,471 | 92,109 | 91,931 | 1,068,723 | ||||||||
| Delaware Tax-Free | ||||||||||||||
| New York Fund | 1,349 | 1,349 | 14,846 | 12,407 | 12,373 | 130,210 | ||||||||
7. Line of Credit
Each Fund, along with certain other funds in the Delaware Investments® Family of Funds (Participants), was a participant in a $100,000,000 revolving line of credit to be used for temporary or emergency purposes as an additional source of liquidity to fund redemptions of investor shares. Under the agreement, the Participants were charged an annual commitment fee, which was allocated across the Participants on the basis of each Participant’s allocation of the entire facility. The Participants were permitted to borrow up to a maximum of one third of their net assets under the agreement. The line of credit under the agreement expired on November 15, 2011.
On November 15, 2011, the Funds, along with the other Participants, entered into an amendment to the agreement for a $125,000,000 revolving line of credit. The agreement is to be used as described above and operates in substantially the same manner as the original agreement. The agreement expires on November 13, 2012. The Funds had no amounts outstanding as of August 31, 2012 or at any time during the year then ended.
8. Credit and Market Risk
The Funds concentrate their investments in securities issued by municipalities. The values of these investments may be adversely affected by new legislation within the states, regional or local economic conditions, as applicable, and differing levels of supply and demand for municipal bonds. Many municipalities insure repayment for their obligations. Although bond insurance reduces the risk of loss due to default by an issuer, such bonds remain subject to the risk that value may fluctuate for other reasons and there is no assurance that the insurance company will meet its obligations. A real or perceived decline in creditworthiness of a bond insurer can have an adverse
125
Notes to financial statements
Delaware Investments® state tax-free funds
8. Credit and Market Risk (continued)
impact on the value of insured bonds held in each Fund. At August 31, 2012, the percentages of each Fund’s net assets insured by bond insurers are listed below and these securities have been identified in the statements of net assets.
| Delaware | Delaware | Delaware | Delaware | Delaware | ||||||
| Tax-Free | Tax-Free | Tax-Free | Tax-Free | Tax-Free | ||||||
| Arizona Fund | California Fund | Colorado Fund | Idaho Fund | New York Fund | ||||||
| 26.40% | 8.54% | 23.17% | 20.27% | 4.33% |
The Funds may invest in advance refunded bonds, escrow secured bonds or defeased bonds. Under current federal tax laws and regulations, state and local government borrowers are permitted to refinance outstanding bonds by issuing new bonds. The issuer refinances the outstanding debt to either reduce interest costs or to remove or alter restrictive covenants imposed by the bonds being refinanced. A refunding transaction where the municipal securities are being refunded within 90 days from the issuance of the refunding issue is known as a “current refunding.” Advance refunded bonds are bonds in which the refunded bond issue remains outstanding for more than 90 days following the issuance of the refunding issue. In an advance refunding, the issuer will use the proceeds of a new bond issue to purchase high grade interest bearing debt securities, which are then deposited in an irrevocable escrow account held by an escrow agent to secure all future payments of principal and interest and bond premium of the advance refunded bond. Bonds are “escrowed to maturity” when the proceeds of the refunding issue are deposited in an escrow account for investment sufficient to pay all of the principal and interest on the original interest payment and maturity dates.
Bonds are considered “pre-refunded” when the refunding issue’s proceeds are escrowed only until a permitted call date or dates on the refunded issue with the refunded issue being redeemed at the time, including any required premium. Bonds become “defeased” when the rights and interests of the bondholders and of their lien on the pledged revenues or other security under the terms of the bond contract and are substituted with an alternative source of revenues (the escrow securities) sufficient to meet payments of principal and interest to maturity or to the first call dates. Escrowed secured bonds will often receive a rating of AAA from Moody’s Investors Service, Standard & Poor’s, and/or Fitch Ratings due to the strong credit quality of the escrow securities and the irrevocable nature of the escrow deposit agreement.
Each Fund may invest up to 15% of its net assets in illiquid securities, which may include securities with contractual restrictions on resale, securities exempt from registration under Rule 144A of the Securities Act of 1933, as amended, and other securities which may not be readily marketable. The relative illiquidity of these securities may impair each Fund from disposing of them in a timely manner and at a fair price when it is necessary or desirable to do so. While maintaining oversight, each Fund’s Board has delegated to DMC the day-to-day functions of determining whether individual securities are liquid for purposes of each Fund’s limitation on investments in illiquid
126
securities. Securities eligible for resale pursuant to Rule 144A, which are determined to be liquid, are not subject to the Funds’ 15% limit on investments in illiquid securities. As of August 31, 2012, there were no Rule 144A securities. Illiquid securities have been identified on the statements of net assets.
9. Contractual Obligations
The Funds enter into contracts in the normal course of business that contain a variety of indemnifications. The Funds’ maximum exposure under these arrangements is unknown. However, the Funds have not had prior claims or losses pursuant to these contracts. Management has reviewed each Fund’s existing contracts and expects the risk of loss to be remote.
10. Subsequent Events
Management has determined that no material events or transactions occurred subsequent to August 31, 2012 that would require recognition or disclosure in the Funds’ financial statements.
127
Report of independent
registered public accounting firm
To the Board of Trustees of Voyageur Insured Funds, Voyageur Mutual Funds and Voyageur Mutual Funds II and the Shareholders of Delaware Tax-Free Arizona Fund, Delaware Tax-Free California Fund, Delaware Tax-Free Idaho Fund, Delaware Tax-Free New York Fund and Delaware Tax-Free Colorado Fund:
In our opinion, the accompanying statements of net assets and the related statements of operations and of changes in net assets and the financial highlights present fairly, in all material respects, the financial position of Delaware Tax-Free Arizona Fund (constituting Voyageur Insured Funds), Delaware Tax-Free California Fund, Delaware Tax-Free Idaho Fund and Delaware Tax-Free New York Fund (three of the series constituting Voyageur Mutual Funds) and Delaware Tax-Free Colorado Fund (constituting Voyageur Mutual Funds II) (hereafter collectively referred to as the “Funds”) at August 31, 2012, the results of each of their operations for the year then ended, the changes in each of their net assets for each of the two years in the period then ended and the financial highlights for each of the three years in the period then ended, in conformity with accounting principles generally accepted in the United States of America. These financial statements and financial highlights (hereafter referred to as “financial statements”) are the responsibility of the Funds’ management; our responsibility is to express an opinion on these financial statements based on our audits. We conducted our audits of these financial statements in accordance with the standards of the Public Company Accounting Oversight Board (United States). Those standards require that we plan and perform the audit to obtain reasonable assurance about whether the financial statements are free of material misstatement. An audit includes examining, on a test basis, evidence supporting the amounts and disclosures in the financial statements, assessing the accounting principles used and significant estimates made by management, and evaluating the overall financial statement presentation. We believe that our audits, which included confirmation of securities at August 31, 2012 by correspondence with the custodian, provide a reasonable basis for our opinion. The financial highlights for each of the two years in the period ended August 31, 2009 were audited by other independent accountants whose report dated October 19, 2009 expressed an unqualified opinion on those statements.
PricewaterhouseCoopers LLP
Philadelphia, Pennsylvania
October 18, 2012
128
Other Fund information
(Unaudited)
Delaware Investments® state tax-free funds
Board Consideration of Delaware Tax-Free Arizona Fund, Delaware Tax-Free California Fund, Delaware Tax-Free Colorado Fund, Delaware Tax-Free Idaho Fund and Delaware Tax-Free New York Fund Investment Advisory Agreements
At a meeting held on August 21–23, 2012 (the “Annual Meeting”), the Board of Trustees (the “Board”), including a majority of disinterested or independent Trustees, approved the renewal of the Investment Advisory Agreements for each of the Delaware Tax-Free Arizona Fund, Delaware Tax-Free California Fund, Delaware Tax-Free Colorado Fund, Delaware Tax-Free Idaho Fund and Delaware Tax-Free New York Fund (each, a “Fund” and together, the “Funds”). In making its decision, the Board considered information furnished at regular quarterly Board meetings, including reports detailing Fund performance, investment strategies and expenses, as well as information prepared specifically in connection with the renewal of the investment advisory and sub-advisory contracts. Information furnished specifically in connection with the renewal of the Investment Advisory Agreements with Delaware Management Company (“DMC”) included materials provided by DMC and its affiliates (“Delaware Investments”) concerning, among other things, the nature, extent and quality of services provided to the Funds, the costs of such services to the Funds, economies of scale and the financial condition and profitability of Delaware Investments. In addition, in connection with the Annual Meeting, reports were provided in May 2012 and included independent historical and comparative reports provided by Lipper, Inc., an independent statistical compilation organization (“Lipper”). The Lipper reports compared each Fund’s investment performance and expenses with those of other comparable mutual funds. The Independent Trustees reviewed and discussed the Lipper reports with independent legal counsel to the Independent Trustees. The Board requested and received information regarding DMC’s policy with respect to advisory fee levels and its breakpoint philosophy; the structure of portfolio manager compensation; the investment manager’s profitability; comparative client fee information; and any constraints or limitations on the availability of securities in certain investment styles, which had in the past year inhibited, or which were likely in the future to inhibit, DMC’s ability to invest fully in accordance with Fund policies.
In considering information relating to the approval of each Fund’s advisory agreement, the Independent Trustees received assistance and advice from and met separately with independent legal counsel to the Independent Trustees. Although the Board gave attention to all information furnished, the following discussion identifies, under separate headings, the primary factors taken into account by the Board during its contract renewal considerations.
Nature, Extent and Quality of Service. The Board considered the services provided by Delaware Investments to the Funds and their shareholders. In reviewing the nature, extent and quality of services, the Board considered reports furnished to it throughout the year, which covered matters such as the relative performance of the Funds, compliance of portfolio managers with the investment policies, strategies and restrictions for the Funds, compliance by DMC and Delaware Distributors, L.P. (together, “Management”) personnel with the Code of Ethics adopted throughout the Delaware Investments Family of Funds complex and adherence to fair value pricing procedures as established by the Board. The Board was pleased with the current staffing of
129
Other Fund information
(Unaudited)
Delaware Investments® state tax-free funds
Board Consideration of Delaware Tax-Free Arizona Fund, Delaware Tax-Free California Fund, Delaware Tax-Free Colorado Fund, Delaware Tax-Free Idaho Fund and Delaware Tax-Free New York Fund Investment Advisory Agreements (continued)
the Funds’ investment advisor and the emphasis placed on research in the investment process. The Board recognized DMC’s receipt of several industry awards, including being named best fund family for 2011 by Barron’s and best mixed asset small company by Lipper for the second year in a row. The Board gave favorable consideration to DMC’s efforts to control expenditures while maintaining service levels committed to fund matters. The Board noted that in July 2011 Management implemented measures to reduce overall costs and improve transfer agent and shareholder servicing functions through outsourcing. The Board noted the benefits provided to Fund shareholders through each shareholder’s ability to exchange an investment in one Delaware Investments fund for the same class of shares in another Delaware Investments fund without a sales charge, to reinvest Fund dividends into additional shares of the same Fund or into additional shares of other Delaware Investments funds and the privilege to combine holdings in other Delaware Investments funds to obtain a reduced sales charge. The Board was satisfied with the nature, extent and quality of the overall services provided by Delaware Investments.
Investment Performance. The Board placed significant emphasis on the investment performance of the Funds in view of the importance of investment performance to shareholders. Although the Board gave appropriate consideration to performance reports and discussions with portfolio managers at Investment Committee meetings throughout the year, the Board gave particular weight to the Lipper reports furnished for the Annual Meeting. The Lipper reports prepared for each Fund showed the investment performance of its Class A shares in comparison to a group of similar funds as selected by Lipper (the “Performance Universe”). A fund with the best performance ranked first, and a fund with the poorest performance ranked last. The highest/best performing 25% of funds in the Performance Universe make up the first quartile; the next 25%, the second quartile; the next 25%, the third quartile; and the poorest/ worst performing 25% of funds in the Performance Universe make up the fourth quartile. Comparative annualized performance for each Fund was shown for the past one-, three-, five- and ten-year periods, as applicable, ended March 31, 2012. The Board’s objective is that each Fund’s performance for the periods considered be at or above the median of its Performance Universe. The following paragraphs summarize the performance results for the Funds and the Board’s view of such performance.
Delaware Tax-Free Arizona Fund — The Performance Universe for the Fund consisted of the Fund and all retail and institutional Arizona municipal debt funds as selected by Lipper. The Lipper report comparison showed that the Fund’s total return for the one-year period was in the third quartile of its Performance Universe. The report further showed that the Fund’s total return for the three- and five-year periods was in the second quartile and the Fund’s total return for the ten-year period was in the first quartile. The Fund’s performance results were mixed but tended toward median, which was acceptable.
130
Delaware Tax-Free California Fund — The Performance Universe for the Fund consisted of the Fund and all retail and institutional California municipal debt funds as selected by Lipper. The Lipper report comparison showed that the Fund’s total return for the one-year period was in the second quartile of its Performance Universe. The report further showed that the Fund’s total return for the three-, five- and ten-year periods was in the first quartile. The Board was satisfied with performance.
Delaware Tax-Free Colorado Fund — The Performance Universe for the Fund consisted of the Fund and all retail and institutional Colorado municipal debt funds as selected by Lipper. The Lipper report comparison showed that the Fund’s total return for the one-, five- and ten-year periods was in the first quartile of its Performance Universe. The report further showed that the Fund’s total return for the three-year period was in the second quartile. The Board was satisfied with performance.
Delaware Tax-Free Idaho Fund — The Performance Universe for the Fund consisted of the Fund and all retail and institutional other state municipal debt funds as selected by Lipper. The Lipper report comparison showed that the Fund’s total return for the one- and three-year periods was in the third quartile of its Performance Universe. The report further showed that the Fund’s total return for the five- and ten-year periods was in the first quartile. The Board determined that the Fund’s performance results were mixed. In evaluating the Fund’s performance, the Board considered the numerous investment and performance reports delivered by Management personnel to the Board’s Investments Committee. The Board was satisfied that Management was taking effective action to improve Fund performance and meet the Board’s performance objective.
Delaware Tax-Free New York Fund — The Performance Universe for the Fund consisted of the Fund and all retail and institutional New York municipal debt funds as selected by Lipper. The Lipper report comparison showed that the Fund’s total return for the one-, five- and ten-year periods was in the first quartile of its Performance Universe. The report further showed that the Fund’s total return for the three-year period was in the second quartile. The Board was satisfied with performance.
Comparative Expenses. The Board considered expense comparison data for the Delaware Investments Family of Funds. Management provided the Board with information on pricing levels and fee structures for each Fund as of its most recently completed fiscal year. The Board also focused on the comparative analysis of effective management fees and total expense ratios of each Fund versus effective management fees and expense ratios of a group of similar funds as selected by Lipper (the “Expense Group”). In reviewing comparative costs, each Fund’s contractual management fee and the actual management fee incurred by the Fund were compared with the contractual management fees (assuming all funds in the Expense Group were similar in size to the Fund) and actual management fees (as reported by each fund) within the Expense Group, taking into account any applicable breakpoints and fee waivers. Each Fund’s total expenses were also compared with those of its Expense Group. The Lipper total expenses, for comparative consistency, were shown by Lipper for Class A shares and comparative total expenses including 12b-1 and non
131
Other Fund information
(Unaudited)
Delaware Investments® state tax-free funds
Board Consideration of Delaware Tax-Free Arizona Fund, Delaware Tax-Free California Fund, Delaware Tax-Free Colorado Fund, Delaware Tax-Free Idaho Fund and Delaware Tax-Free New York Fund Investment Advisory Agreements (continued)
12b-1 service fees. The Board considered fees paid to Delaware Investments for non-management services. The Board’s objective is to limit each Fund’s total expense ratio to be competitive with that of the Expense Group. The following paragraphs summarize the expense results for the Funds and the Board’s view of such expenses.
Delaware Tax-Free Arizona Fund — The expense comparisons for the Fund showed that its actual management fee was in the quartile with the second lowest expenses of its Expense Group and its total expenses were in the quartile with the second highest expenses of its Expense Group. The Board gave favorable consideration to the Fund’s management fee, but noted that the Fund’s total expenses were not in line with the Board’s objective. In evaluating the total expenses, the Board considered fee waivers in place through December 2012 and various initiatives implemented by Management, such as the outsourcing of certain transfer agency services, creating an opportunity for a reduction in expenses. The Board was satisfied with Management’s efforts to improve the Fund’s total expense ratio and bring it in line with the Board’s objective.
Delaware Tax-Free California Fund — The expense comparisons for the Fund showed that its actual management fee was in the quartile with the lowest expenses of its Expense Group and its total expenses were in the quartile with the second lowest expenses of its Expense Group. The Board was satisfied with the management fee and total expenses of the Fund in comparison to those of its Expense Group as shown in the Lipper report.
Delaware Tax-Free Colorado Fund — The expense comparisons for the Fund showed that its actual management fee was in the quartile with the second highest expenses of its Expense Group and its total expenses were in the quartile with the highest expenses of its Expense Group. The Board noted that the Fund’s total expenses were not in line with the Board’s objective. In evaluating the total expenses, the Board considered fee waivers in place through December 2012 and various initiatives implemented by Management, such as the outsourcing of certain transfer agency services, creating an opportunity for a reduction in expenses. Consequently, the Board was satisfied with Management’s efforts to improve the Fund’s total expense ratio and bring it in line with the Board’s objective.
Delaware Tax-Free Idaho Fund — The expense comparisons for the Fund showed that its actual management fee and total expenses were in the quartile with the highest expenses of its Expense Group. The Board noted that the Fund’s total expenses were not in line with the Board’s objective. In evaluating the total expenses, the Board considered waivers in place through December 2012 and various initiatives implemented by Management, such as the outsourcing of certain transfer agency services, creating an opportunity for a reduction in expenses. The Board was satisfied with Management’s efforts to improve the Fund’s total expense ratio and bring it in line with the Board’s objective.
132
Delaware Tax-Free New York Fund — The expense comparisons for the Fund showed that its actual management fee was in the quartile with the lowest expenses of its Expense Group and its total expenses were in the quartile with the second lowest expenses of its Expense Group. The Board was satisfied with the management fee and total expenses of the Fund in comparison to those of its Expense Group as shown in the Lipper report.
Management Profitability. The Board considered the level of profits realized by Delaware Investments in connection with the operation of the Funds. In this respect, the Board reviewed the Investment Management Profitability Analysis that addressed the overall profitability of Delaware Investments’ business in providing management and other services to each of the individual funds and the Delaware Investments Family of Funds as a whole. Specific attention was given to the methodology followed in allocating costs for the purpose of determining profitability. Management stated that the level of profits of Delaware Investments, to a certain extent, reflects recent operational cost savings and efficiencies initiated by Delaware Investments. The Board considered Delaware Investments’ efforts to improve services provided to fund shareholders and to meet additional regulatory and compliance requirements resulting from recent industry-wide Securities and Exchange Commission initiatives. The Board also considered the extent to which Delaware Investments might derive ancillary benefits from fund operations, including the potential for procuring additional business as a result of the prestige and visibility associated with its role as service provider to the Delaware Investments Family of Funds and the benefits from allocation of fund brokerage to improve trading efficiencies. The Board found that the management fees were reasonable in light of the services rendered and the level of profitability of Delaware Investments.
Economies of Scale. The Trustees considered whether economies of scale are realized by Delaware Investments as each Fund’s assets increase and the extent to which any economies of scale are reflected in the level of management fees charged. The Trustees reviewed the standardized advisory fee pricing and structure, approved by the Board and shareholders, which includes breakpoints. Breakpoints in the advisory fee occur when the advisory fee rate is reduced on assets in excess of specified levels. Breakpoints result in a lower advisory fee than would otherwise be the case on all assets when the asset levels specified are exceeded. The Board noted that the fee under each Fund’s management contract fell within the standard structure. Although the Funds have not reached a size at which they can take advantage of breakpoints, the Board recognized that each Fund’s fee was structured so that when the Fund grows, economies of scale may be shared.
133
Other Fund information
(Unaudited)
Delaware Investments® state tax-free funds
Tax Information
The information set forth below is for the Funds’ fiscal year as required by federal income tax laws. Shareholders, however, must report distributions on a calendar year basis for income tax purposes, which may include distributions for portions of two fiscal years of a fund. Accordingly, the information needed by shareholders for income tax purposes will be sent to them in January of each year. Please consult your tax advisor for proper treatment of this information.
All designations are based on financial information available as of the date of this annual report and, accordingly are subject to change. For any and all items requiring designation, it is the intention of each Fund to designate the maximum amount permitted under the Internal Revenue Code and the regulations thereunder.
For the fiscal year ended August 31, 2012, each Fund designates distributions paid during the year as follows:
| (A) | (B) | (C) | ||||||||||||||||
| Long-Term | Ordinary | Tax-Exempt | ||||||||||||||||
| Capital Gains | Income | Income | Total | |||||||||||||||
| Distributions | Distributions | Distributions | Distributions | |||||||||||||||
| (Tax Basis) | (Tax Basis) | (Tax Basis) | (Tax Basis) | |||||||||||||||
| Delaware Tax-Free Arizona Fund | 0.66% | — | 99.34 | % | 100.00 | % | ||||||||||||
| Delaware Tax-Free California Fund | — | — | 100.00 | % | 100.00 | % | ||||||||||||
| Delaware Tax-Free Colorado Fund | — | — | 100.00 | % | 100.00 | % | ||||||||||||
| Delaware Tax-Free Idaho Fund | — | — | 100.00 | % | 100.00 | % | ||||||||||||
| Delaware Tax-Free New York Fund | — | 0.04% | 99.96 | % | 100.00 | % | ||||||||||||
(A), (B) and (C) are based on a percentage of each Fund’s total distributions.
134
Board of trustees/directors and officers addendum
Delaware Investments® Family of Funds
A mutual fund is governed by a Board of Trustees/Directors (“Trustees”), which has oversight responsibility for the management of a fund’s business affairs. Trustees establish procedures and oversee and review the performance of the investment manager, the distributor, and others who perform services for the fund. The independent fund trustees, in particular, are advocates
| Name, Address, | Position(s) | Length of | ||
| and Birth Date | Held with Fund(s) | Time Served | ||
| Interested Trustees | ||||
| Patrick P. Coyne1 | Chairman, President, | Chairman and Trustee | ||
| 2005 Market Street | Chief Executive Officer, | since August 16, 2006 | ||
| Philadelphia, PA 19103 | and Trustee | |||
| April 1963 | President and | |||
| Chief Executive Officer | ||||
| since August 1, 2006 | ||||
136
for shareholder interests. Each trustee has served in that capacity since he or she was elected to or appointed to the Board of Trustees, and will continue to serve until his or her retirement or the election of a new trustee in his or her place. The following is a list of the Trustees and Officers with certain background and related information.
| Number of Portfolios in | ||||
| Principal Occupation(s) | Fund Complex Overseen | Other Directorships | ||
| During Past 5 Years | by Trustee or Officer | Held by Trustee or Officer | ||
| Patrick P. Coyne has served in | 71 | Director and Audit | ||
| various executive capacities | Committee Member | |||
| at different times at | Kaydon Corp. | |||
| Delaware Investments.2 | ||||
| Board of Governors Member | ||||
| Investment Company | ||||
| Institute (ICI) | ||||
2 Delaware Investments is the marketing name for Delaware Management Holdings, Inc. and its subsidiaries, including the Fund’s(s’) investment advisor, principal underwriter, and its transfer agent.
137
Board of trustees/directors and officers addendum
Delaware Investments® Family of Funds
| Name, Address, | Position(s) | Length of | ||
| and Birth Date | Held with Fund(s) | Time Served | ||
| Independent Trustees | ||||
| Thomas L. Bennett | Trustee | Since March 2005 | ||
| 2005 Market Street | ||||
| Philadelphia, PA 19103 | ||||
| October 1947 | ||||
| John A. Fry | Trustee | Since January 2001 | ||
| 2005 Market Street | ||||
| Philadelphia, PA 19103 | ||||
| May 1960 | ||||
| Anthony D. Knerr | Trustee | Since April 1990 | ||
| 2005 Market Street | ||||
| Philadelphia, PA 19103 | ||||
| December 1938 | ||||
| Lucinda S. Landreth | Trustee | Since March 2005 | ||
| 2005 Market Street | ||||
| Philadelphia, PA 19103 | ||||
| June 1947 | ||||
138
| Number of Portfolios in | ||||
| Principal Occupation(s) | Fund Complex Overseen | Other Directorships | ||
| During Past 5 Years | by Trustee or Officer | Held by Trustee or Officer | ||
| Private Investor | 71 | Director | ||
| (March 2004–Present) | Bryn Mawr Bank Corp. (BMTC) | |||
| (2007–2011) | ||||
| President | 71 | Board of Governors Member — | ||
| Drexel University | NASDAQ OMX PHLX LLC | |||
| (August 2010–Present) | ||||
| Director and Audit | ||||
| President | Committee Member | |||
| Franklin & Marshall College | Community Health Systems | |||
| (July 2002–July 2010) | ||||
| Director — Ecore | ||||
| International | ||||
| (2009–2010) | ||||
| Director — Allied | ||||
| Barton Securities Holdings | ||||
| (2005–2008) | ||||
| Managing Director | 71 | None | ||
| Anthony Knerr & Associates | ||||
| (Strategic Consulting) | ||||
| (1990–Present) | ||||
| Private Investor | 71 | None | ||
| (2004–Present) | ||||
139
Board of trustees/directors and officers addendum
Delaware Investments® Family of Funds
| Name, Address, | Position(s) | Length of | ||
| and Birth Date | Held with Fund(s) | Time Served | ||
| Independent Trustees (continued) | ||||
| Frances A. Sevilla-Sacasa | Trustee | Since September 2011 | ||
| 2005 Market Street | ||||
| Philadelphia, PA 19103 | ||||
| January 1956 | ||||
140
| Number of Portfolios in | ||||
| Principal Occupation(s) | Fund Complex Overseen | Other Directorships | ||
| During Past 5 Years | by Trustee or Officer | Held by Trustee or Officer | ||
| Chief Executive Officer — | 71 | Trust Manager — Camden | ||
| Banco Itaú Europa | Property Trust | |||
| International | (since August 2011) | |||
| (since April 2012) | ||||
| Executive Advisor to Dean | ||||
| (August 2011–March 2012) | ||||
| and Interim Dean | ||||
| (January 2011–July 2011) — | ||||
| University of Miami School of | ||||
| Business Administration | ||||
| President — U.S. Trust, | ||||
| Bank of America Private | ||||
| Wealth Management | ||||
| (Private Banking) | ||||
| (July 2007–December 2008) | ||||
141
Board of trustees/directors and officers addendum
Delaware Investments® Family of Funds
| Name, Address, | Position(s) | Length of | ||
| and Birth Date | Held with Fund(s) | Time Served | ||
| Independent Trustees (continued) | ||||
| Janet L. Yeomans | Trustee | Since April 1999 | ||
| 2005 Market Street | ||||
| Philadelphia, PA 19103 | ||||
| July 1948 | ||||
| J. Richard Zecher | Trustee | Since March 2005 | ||
| 2005 Market Street | ||||
| Philadelphia, PA 19103 | ||||
| July 1940 | ||||
142
| Number of Portfolios in | ||||
| Principal Occupation(s) | Fund Complex Overseen | Other Directorships | ||
| During Past 5 Years | by Trustee or Officer | Held by Trustee or Officer | ||
| Vice President and Treasurer | 71 | Director, Audit | ||
| (January 2006–July 2012) | Committee Member and | |||
| Vice President — Mergers & Acquisitions | Investment Committee | |||
| (January 2003–January 2006), and | Member | |||
| Vice President and Treasurer | Okabena Company | |||
| (July 1995–January 2003) | ||||
| 3M Corporation | Chair — 3M | |||
| Investment Management | ||||
| Company | ||||
| (January 2005–July 2012) | ||||
| Founder | 71 | Director and Compensation | ||
| Investor Analytics | Committee Member | |||
| (Risk Management) | Investor Analytics | |||
| (May 1999–Present) | ||||
| Director | ||||
| Founder | Oxigene, Inc. | |||
| P/E Investments | (2003–2008) | |||
| (Hedge Fund) | ||||
| (September 1996–Present) | ||||
143
Board of trustees/directors and officers addendum
Delaware Investments® Family of Funds
| Name, Address, | Position(s) | Length of | ||
| and Birth Date | Held with Fund(s) | Time Served | ||
| Officers | ||||
| David F. Connor | Vice President, | Vice President since | ||
| 2005 Market Street | Deputy General | September 2000 | ||
| Philadelphia, PA 19103 | Counsel, and Secretary | and Secretary since | ||
| December 1963 | October 2005 | |||
| Daniel V. Geatens | Vice President | Treasurer | ||
| 2005 Market Street | and Treasurer | since October 2007 | ||
| Philadelphia, PA 19103 | ||||
| October 1972 | ||||
| David P. O’Connor | Executive Vice President, | Executive Vice President | ||
| 2005 Market Street | General Counsel | since February 2012; | ||
| Philadelphia, PA 19103 | and Chief Legal Officer | Senior Vice President | ||
| February 1966 | October 2005– | |||
| February 2012; | ||||
| General Counsel and | ||||
| Chief Legal Officer | ||||
| since October 2005 | ||||
| Richard Salus | Senior Vice President | Chief Financial Officer | ||
| 2005 Market Street | and Chief Financial Officer | since November 2006 | ||
| Philadelphia, PA 19103 | ||||
| October 1963 | ||||
The Statement of Additional Information for the Fund(s) includes additional information about the Trustees and Officers and is available, without charge, upon request by calling 800 523-1918.
144
| Number of Portfolios in | ||||
| Principal Occupation(s) | Fund Complex Overseen | Other Directorships | ||
| During Past 5 Years | by Trustee or Officer | Held by Trustee or Officer | ||
| David F. Connor has served as | 71 | None3 | ||
| Vice President and Deputy | ||||
| General Counsel of | ||||
| Delaware Investments | ||||
| since 2000. | ||||
| Daniel V. Geatens has served | 71 | None3 | ||
| in various capacities at | ||||
| different times at | ||||
| Delaware Investments. | ||||
| David P. O’Connor has served in | 71 | None3 | ||
| various executive and legal | ||||
| capacities at different times | ||||
| at Delaware Investments. | ||||
| Richard Salus has served in | 71 | None3 | ||
| various executive capacities | ||||
| at different times at | ||||
| Delaware Investments. | ||||
3 David F. Connor, Daniel V. Geatens, David P. O’Connor, and Richard Salus serve in similar capacities for the six portfolios of the Optimum Fund Trust, which have the same investment advisor, principal underwriter, and transfer agent as the registrant.
145
| Board of trustees | |||
Patrick P. Coyne Chairman, President, and Chief Executive Officer Delaware Investments® Family of Funds Philadelphia, PA Thomas L. Bennett | John A. Fry President Drexel University Philadelphia, PA Anthony D. Knerr | Lucinda S. Landreth Former Chief Investment Officer Assurant, Inc. Philadelphia, PA Frances A. | Janet L. Yeomans Former Vice President and Treasurer 3M Corporation St. Paul, MN J. Richard Zecher |
| Affiliated officers | |||
David F. Connor Vice President, Deputy General Counsel, and Secretary Delaware Investments Family of Funds Philadelphia, PA | Daniel V. Geatens Vice President and Treasurer Delaware Investments Family of Funds Philadelphia, PA | David P. O’Connor Executive Vice President, General Counsel, and Chief Legal Officer Delaware Investments Family of Funds Philadelphia, PA | Richard Salus Senior Vice President and Chief Financial Officer Delaware Investments Family of Funds Philadelphia, PA |
| This annual report is for the information of Delaware Tax-Free Arizona Fund, Delaware Tax-Free California Fund, Delaware Tax-Free Colorado Fund, Delaware Tax-Free Idaho Fund, and Delaware Tax-Free New York Fund shareholders, but it may be used with prospective investors when preceded or accompanied by the Delaware Investments Fund fact sheet for the most recently completed calendar quarter. These documents are available at delawareinvestments.com. |
Delaware Investments is the marketing name of Delaware Management Holdings, Inc. and its subsidiaries. Each Fund files its complete schedule of portfolio holdings with the Securities and Exchange Commission (SEC) for the first and third quarters of each fiscal year on Form N-Q. Each Fund’s Forms N-Q, as well as a description of the policies and procedures that each Fund uses to determine how to vote proxies (if any) relating to portfolio securities are available without charge (i) upon request, by calling 800 523-1918; and (ii) on the SEC’s website at sec.gov. In addition, a description of the policies and procedures that each Fund uses to determine how to vote proxies (if any) relating to portfolio securities and each Fund’s Schedule of Investments are available without charge on the Funds’ website at delawareinvestments.com. Each Fund’s Forms N-Q may be reviewed and copied at the SEC’s Public Reference Room in Washington, D.C.; information on the operation of the Public Reference Room may be obtained by calling 800 SEC-0330. Information (if any) regarding how each Fund voted proxies relating to portfolio securities during the most recently disclosed 12-month period ended June 30 is available without charge (i) through the Funds’ website at delawareinvestments.com; and (ii) on the SEC’s website at sec.gov. |
146
Item 2. Code of Ethics
The registrant has adopted a code of ethics that applies to the registrant’s principal executive officer, principal financial officer, principal accounting officer or controller, or persons performing similar functions, regardless of whether these individuals are employed by the registrant or a third party. A copy of the registrant’s Code of Business Ethics has been posted on the Delaware Investments Internet Web site at www.delawareinvestments.com. Any amendments to the Code of Business Ethics, and information on any waiver from its provisions granted by the registrant, will also be posted on this Web site within five business days of such amendment or waiver and will remain on the Web site for at least 12 months.
Item 3. Audit Committee Financial Expert
The registrant’s Board of Trustees/Directors has determined that certain members of the registrant’s Audit Committee are audit committee financial experts, as defined below. For purposes of this item, an “audit committee financial expert” is a person who has the following attributes:
a. An understanding of generally accepted accounting principles and financial statements;
b. The ability to assess the general application of such principles in connection with the accounting for estimates, accruals, and reserves;
c. Experience preparing, auditing, analyzing, or evaluating financial statements that present a breadth and level of complexity of accounting issues that are generally comparable to the breadth and complexity of issues that can reasonably be expected to be raised by the registrant’s financial statements, or experience actively supervising one or more persons engaged in such activities;
d. An understanding of internal controls and procedures for financial reporting; and
e. An understanding of audit committee functions.
An “audit committee financial expert” shall have acquired such attributes through:
a. Education and experience as a principal financial officer, principal accounting officer, controller, public accountant, or auditor or experience in one or more positions that involve the performance of similar functions;
b. Experience actively supervising a principal financial officer, principal accounting officer, controller, public accountant, auditor, or person performing similar functions;
c. Experience overseeing or assessing the performance of companies or public accountants with respect to the preparation, auditing, or evaluation of financial statements; or
d. Other relevant experience.
The registrant’s Board of Trustees/Directors has also determined that each member of the registrant’s Audit Committee is independent. In order to be “independent” for purposes of this item, the Audit Committee member may not: (i) other than in his or her capacity as a member of the Board of Trustees/Directors or any committee thereof, accept directly or indirectly any consulting, advisory or other compensatory fee from the issuer; or (ii) be an “interested person” of the registrant as defined in Section 2(a)(19) of the Investment Company Act of 1940.
The names of the audit committee financial experts on the registrant’s Audit Committee are set forth below:
Thomas L. Bennett1
John A. Fry
Frances A. Sevilla-Sacasa
Janet L. Yeomans
Item 4. Principal Accountant Fees and Services
(a) Audit fees.
The aggregate fees billed for services provided to the registrant by its independent auditors for the audit of the registrant’s annual financial statements and for services normally provided by the independent auditors in connection with statutory and regulatory filings or engagements were $69,600 for the fiscal year ended August 31, 2012.
____________________
1 The instructions to Form N-CSR require disclosure on the relevant experience of persons who qualify as audit committee financial experts based on “other relevant experience.” The Board of Trustees/Directors has determined that Mr. Bennett qualifies as an audit committee financial expert by virtue of: his education and Chartered Financial Analyst designation; his experience as a credit analyst, portfolio manager and the manager of other credit analysts and portfolio managers; and his prior service on the audit committees of public companies.
The aggregate fees billed for services provided to the registrant by its independent auditors for the audit of the registrant’s annual financial statements and for services normally provided by the independent auditors in connection with statutory and regulatory filings or engagements were $65,600 for the fiscal year ended August 31, 2011.
(b) Audit-related fees.
The aggregate fees billed by the registrant’s independent auditors for services relating to the performance of the audit of the registrant’s financial statements and not reported under paragraph (a) of this Item were $0 for the fiscal year ended August 31, 2012.
The aggregate fees billed by the registrant’s independent auditors for services relating to the performance of the audit of the financial statements of the registrant’s investment adviser and other service providers under common control with the adviser and that relate directly to the operations or financial reporting of the registrant were $565,000 for the registrant’s fiscal year ended August 31, 2012. The percentage of these fees relating to services approved by the registrant’s Audit Committee pursuant to the de minimis exception from the pre-approval requirement in Rule 2-01(c)(7)(i)(C) of Regulation S-X was 0%. These audit-related services were as follows: year end audit procedures; group reporting and subsidiary statutory audits.
The aggregate fees billed by the registrant’s independent auditors for services relating to the performance of the audit of the registrant’s financial statements and not reported under paragraph (a) of this Item were $0 for the fiscal year ended August 31, 2011.
The aggregate fees billed by the registrant’s independent auditors for services relating to the performance of the audit of the financial statements of the registrant’s investment adviser and other service providers under common control with the adviser and that relate directly to the operations or financial reporting of the registrant were $593,000 for the registrant’s fiscal year ended August 31, 2011. The percentage of these fees relating to services approved by the registrant’s Audit Committee pursuant to the de minimis exception from the pre-approval requirement in Rule 2-01(c)(7)(i)(C) of Regulation S-X was 0%. These audit-related services were as follows: year end audit procedures; reporting up and subsidiary statutory audits.
(c) Tax fees.
The aggregate fees billed by the registrant’s independent auditors for tax-related services provided to the registrant were $13,150 for the fiscal year ended August 31, 2012. The percentage of these fees relating to services approved by the registrant’s Audit Committee pursuant to the de minimis exception from the pre-approval requirement in Rule 2-01(c)(7)(i)(C) of Regulation S-X was 0%. These tax-related services were as follows: review of income tax returns and review of annual excise distribution calculations.
The aggregate fees billed by the registrant’s independent auditors for tax-related services provided to the registrant’s investment adviser and other service providers under common control with the adviser and that relate directly to the operations or financial reporting of the registrant were $0 for the registrant’s fiscal year ended August 31, 2012.
The aggregate fees billed by the registrant’s independent auditors for tax-related services provided to the registrant were $0 for the fiscal year ended August 31, 2011.
The aggregate fees billed by the registrant’s independent auditors for tax-related services provided to the registrant’s investment adviser and other service providers under common control with the adviser and that relate directly to the operations or financial reporting of the registrant were $10,000 for the registrant’s fiscal year ended August 31, 2011. The percentage of these fees relating to services approved by the registrant’s Audit Committee pursuant to the de minimis exception from the pre-approval requirement in Rule 2-01(c)(7)(i)(C) of Regulation S-X was 0%. These tax-related services were as follows: state and local tax review.
(d) All other fees.
The aggregate fees billed for all services provided by the independent auditors to the registrant other than those set forth in paragraphs (a), (b) and (c) of this Item were $0 for the fiscal year ended August 31, 2012.
The aggregate fees billed for all services other than those set forth in paragraphs (b) and (c) of this Item provided by the registrant’s independent auditors to the registrant’s adviser and other service providers under common control with the adviser and that relate directly to the operations or financial reporting of the registrant were $0 for the registrant’s fiscal year ended August 31, 2012. The percentage of these fees relating to services approved by the registrant’s Audit Committee pursuant to the de minimis exception from the pre-approval requirement in Rule 2-01(c)(7)(i)(C) of Regulation S-X was 0%.
The aggregate fees billed for all services provided by the independent auditors to the registrant other than those set forth in paragraphs (a), (b) and (c) of this Item were $0 for the fiscal year ended August 31, 2011.
The aggregate fees billed for all services other than those set forth in paragraphs (b) and (c) of this Item provided by the registrant’s independent auditors to the registrant’s adviser and other service providers under common control with the adviser and that relate directly to the operations or financial reporting of the registrant were $25,000 for the registrant’s fiscal year ended August 31, 2011. The percentage of these fees relating to services approved by the registrant’s Audit Committee pursuant to the de minimis exception from the pre-approval requirement in Rule 2-01(c)(7)(i)(C) of Regulation S-X was 0%. These other services were as follows: attest examination of management's assertion to the controls in place at the transfer agent to be in compliance with Rule 17ad-13(a)(3) of the Securities Exchange Act of 1934.
(e) The registrant’s Audit Committee has established pre-approval policies and procedures as permitted by Rule 2-01(c)(7)(i)(B) of Regulation S-X (the “Pre-Approval Policy”) with respect to services provided by the registrant’s independent auditors. Pursuant to the Pre-Approval Policy, the Audit Committee has pre-approved the services set forth in the table below with respect to the registrant up to the specified fee limits. Certain fee limits are based on aggregate fees to the registrant and other registrants within the Delaware Investments Family of Funds.
Service | Range of Fees |
| Audit Services | |
| Statutory audits or financial audits for new Funds | up to $25,000 per Fund |
| Services associated with SEC registration statements (e.g., Form N-1A, Form N-14, etc.), periodic reports and other documents filed with the SEC or other documents issued in connection with securities offerings (e.g., comfort letters for closed-end Fund offerings, consents), and assistance in responding to SEC comment letters | up to $10,000 per Fund |
Consultations by Fund management as to the accounting or disclosure treatment of transactions or events and/or the actual or potential impact of final or proposed rules, standards or interpretations by the SEC, FASB, or other regulatory or standard-setting bodies (Note: Under SEC rules, some consultations may be considered “audit-related services” rather than “audit services”) | up to $25,000 in the aggregate |
Audit-Related Services | |
Consultations by Fund management as to the accounting or disclosure treatment of transactions or events and/or the actual or potential impact of final or proposed rules, standards or interpretations by the SEC, FASB, or other regulatory or standard-setting bodies (Note: Under SEC rules, some consultations may be considered “audit services” rather than “audit-related services”) | up to $25,000 in the aggregate |
Tax Services | |
U.S. federal, state and local and international tax planning and advice (e.g., consulting on statutory, regulatory or administrative developments, evaluation of Funds’ tax compliance function, etc.) | up to $25,000 in the aggregate |
U.S. federal, state and local tax compliance (e.g., excise distribution reviews, etc.) | up to $5,000 per Fund |
Review of federal, state, local and international income, franchise and other tax returns | up to $5,000 per Fund |
Under the Pre-Approval Policy, the Audit Committee has also pre-approved the services set forth in the table below with respect to the registrant’s investment adviser and other entities controlling, controlled by or under common control with the investment adviser that provide ongoing services to the registrant (the “Control Affiliates”) up to the specified fee limit. This fee limit is based on aggregate fees to the investment adviser and its Control Affiliates.
| Service | Range of Fees |
| Non-Audit Services | |
Services associated with periodic reports and other documents filed with the SEC and assistance in responding to SEC comment letters | up to $10,000 in the aggregate |
The Pre-Approval Policy requires the registrant’s independent auditors to report to the Audit Committee at each of its regular meetings regarding all services initiated since the last such report was rendered, including those services authorized by the Pre-Approval Policy.
(f) Not applicable.
(g) The aggregate non-audit fees billed by the registrant’s independent auditors for services rendered to the registrant and to its investment adviser and other service providers under common control with the adviser were $10,092,966 and $0 for the registrant’s fiscal years ended August 31, 2012 and August 31, 2011, respectively.
(h) In connection with its selection of the independent auditors, the registrant’s Audit Committee has considered the independent auditors’ provision of non-audit services to the registrant’s investment adviser and other service providers under common control with the adviser that were not required to be pre-approved pursuant to Rule 2-01(c)(7)(ii) of Regulation S-X. The Audit Committee has determined that the independent auditors’ provision of these services is compatible with maintaining the auditors’ independence.
Item 5. Audit Committee of Listed Registrants
Not applicable.
Item 6. Investments
(a) Included as part of report to shareholders filed under Item 1 of this Form N-CSR.
(b) Divestment of securities in accordance with Section 13(c) of the Investment Company Act of 1940.
Not applicable.
Item 7. Disclosure of Proxy Voting Policies and Procedures for Closed-End Management Investment Companies
Not applicable.
Item 8. Portfolio Managers of Closed-End Management Investment Companies
Not applicable.
Item 9. Purchases of Equity Securities by Closed-End Management Investment Company and Affiliated Purchasers
Not applicable.
Item 10. Submission of Matters to a Vote of Security Holders
Not applicable.
Item 11. Controls and Procedures
The registrant’s principal executive officer and principal financial officer have evaluated the registrant’s disclosure controls and procedures within 90 days of the filing of this report and have concluded that they are effective in providing reasonable assurance that the information required to be disclosed by the registrant in its reports or statements filed under the Securities Exchange Act of 1934 is recorded, processed, summarized and reported within the time periods specified in the rules and forms of the Securities and Exchange Commission.
There were no significant changes in the registrant’s internal control over financial reporting that occurred during the second fiscal quarter of the period covered by the report to stockholders included herein (i.e., the registrant’s fourth fiscal quarter) that have materially affected, or are reasonably likely to materially affect, the registrant’s internal control over financial reporting.
Item 12. Exhibits
| (a) | (1) Code of Ethics | |
Not applicable. | ||
(2) Certifications of Principal Executive Officer and Principal Financial Officer pursuant to Rule 30a-2 under the Investment Company Act of 1940 are attached hereto as Exhibit 99.CERT. | ||
(3) Written solicitations to purchase securities pursuant to Rule 23c-1 under the Securities Exchange Act of 1934. | ||
Not applicable. | ||
| (b) | Certifications pursuant to Section 906 of the Sarbanes-Oxley Act of 2002 are furnished herewith as Exhibit 99.906CERT. |
SIGNATURES
Pursuant to the requirements of the Securities Exchange Act of 1934 and the Investment Company Act of 1940, the registrant has duly caused this report to be signed on its behalf, by the undersigned, thereunto duly authorized.
Name of Registrant: VOYAGEUR MUTUAL FUNDS
| /s/ PATRICK P. COYNE | |
| By: | Patrick P. Coyne |
| Title: | Chief Executive Officer |
| Date: | November 2, 2012 |
Pursuant to the requirements of the Securities Exchange Act of 1934 and the Investment Company Act of 1940, this report has been signed below by the following persons on behalf of the registrant and in the capacities and on the dates indicated.
| /s/ PATRICK P. COYNE | |
| By: | Patrick P. Coyne |
| Title: | Chief Executive Officer |
| Date: | November 2, 2012 |
| /s/ RICHARD SALUS | |
| By: | Richard Salus |
| Title: | Chief Financial Officer |
| Date: | November 2, 2012 |