UNITED STATES SECURITIES AND EXCHANGE COMMISSION
Washington, D.C. 20549
FORM N-CSR
CERTIFIED SHAREHOLDER REPORT OF REGISTERED MANAGEMENT
INVESTMENT COMPANIES
| Investment Company Act file number: | 811-07742 |
| Exact name of registrant as specified in charter: | Voyageur Mutual Funds |
| Address of principal executive offices: | 2005 Market Street |
| Philadelphia, PA 19103 | |
| Name and address of agent for service: | David F. Connor, Esq. |
| 2005 Market Street | |
| Philadelphia, PA 19103 | |
| Registrant’s telephone number, including area code: | (800) 523-1918 |
| Date of fiscal year end: | August 31 |
| Date of reporting period: | August 31, 2015 |
Item 1. Reports to Stockholders
Table of Contents

Annual report
Fixed income mutual funds
Delaware Tax-Free Minnesota Fund
Delaware Tax-Free Minnesota Intermediate Fund
Delaware Minnesota High-Yield Municipal Bond Fund
August 31, 2015
Carefully consider the Funds’ investment objectives, risk factors, charges, and expenses before investing. This and other information can be found in the Funds’ prospectus and their summary prospectuses, which may be obtained by visiting delawareinvestments.com or calling 800 523-1918. Investors should read the prospectus and the summary prospectus carefully before investing.
You can obtain shareholder reports and prospectuses online instead of in the mail.
Visit delawareinvestments.com/edelivery.
Table of Contents
Experience Delaware Investments
Delaware Investments is committed to the pursuit of consistently superior asset management and unparalleled client service. We believe in our investment processes, which seek to deliver consistent results, and in convenient services that help add value for our clients.
If you are interested in learning more about creating an investment plan, contact your financial advisor.
You can learn more about Delaware Investments or obtain a prospectus for Delaware Tax-Free Minnesota Fund, Delaware Tax-Free Minnesota Intermediate Fund, and Delaware Minnesota High-Yield Municipal Bond Fund at delawareinvestments.com.
Manage your investments online
| ● | 24-hour access to your account information |
| ● | Obtain share prices |
| ● | Check your account balance and recent transactions |
| ● | Request statements or literature |
| ● | Make purchases and redemptions |
Delaware Management Holdings, Inc. and its subsidiaries (collectively known by the marketing name of Delaware Investments) are wholly owned subsidiaries of Macquarie Group Limited, a global provider of banking, financial, advisory, investment and funds management services.
Neither Delaware Investments nor its affiliates noted in this document are authorized deposit-taking institutions for the purposes of the Banking Act 1959 (Commonwealth of Australia). The obligations of these entities do not represent deposits or other liabilities of Macquarie Bank Limited (MBL). MBL does not guarantee or otherwise provide assurance in respect of the obligations of these entities, unless noted otherwise.
| 1 | ||||
| 6 | ||||
| 15 | ||||
| 18 | ||||
| 21 | ||||
| 51 | ||||
| 53 | ||||
| 54 | ||||
| 60 | ||||
| 77 | ||||
| 92 | ||||
| 93 | ||||
| 106 | ||||
| 114 |
Unless otherwise noted, views expressed herein are current as of Aug. 31, 2015, and subject to change for events occurring after such date.
Funds are not FDIC insured and are not guaranteed. It is possible to lose the principal amount invested.
Mutual fund advisory services provided by Delaware Management Company, a series of Delaware Management Business Trust, which is a registered investment advisor. Delaware Investments, a member of Macquarie Group, refers to Delaware Management Holdings, Inc. and its subsidiaries, including the Fund’s distributor, Delaware Distributors, L.P. Macquarie Group refers to Macquarie Group Limited and its subsidiaries and affiliates worldwide.
© 2015 Delaware Management Holdings, Inc.
All third-party marks cited are the property of their respective owners.
Table of Contents
| Portfolio management review | ||
| Delaware Investments® Minnesota Municipal Bond Funds | September 8, 2015 |
| Performance preview (for the year ended August 31, 2015) | ||||||||
Delaware Tax-Free Minnesota Fund (Class A shares) | 1-year return | +3.02% | ||||||
Barclays Municipal Bond Index (benchmark) | 1-year return | +2.52% | ||||||
Lipper Minnesota Municipal Debt Funds Average | 1-year return | +2.47% | ||||||
Past performance does not guarantee future results.
For complete, annualized performance for Delaware Tax-Free Minnesota Fund, please see the table on page 6.
The performance of Class A shares excludes the applicable sales charge and reflects the reinvestment of all distributions. The Lipper Minnesota Municipal Debt Funds Average compares funds that limit assets to those securities that are exempt from taxation in Minnesota (double tax-exempt) or a city in Minnesota (triple tax-exempt).
Please see page 8 for a description of the index. Index performance returns do not reflect any management fees, transaction costs, or expenses. Indices are unmanaged and one cannot invest directly in an index.
Delaware Tax-Free Minnesota Intermediate Fund (Class A shares) | 1-year return | +2.12% | ||||||
Barclays 3–15 Year Blend Municipal Bond Index (benchmark) | 1-year return | +2.02% | ||||||
Lipper Other States Intermediate Municipal Debt Funds Average | 1-year return | +1.31% |
Past performance does not guarantee future results.
For complete, annualized performance for Delaware Tax-Free Minnesota Intermediate Fund, please see the table on page 9.
The performance of Class A shares excludes the applicable sales charge and reflects the reinvestment of all distributions. The Lipper Other States Intermediate Municipal Debt Funds Average compares funds that invest in municipal debt issues with dollar-weighted average maturities of 5 to 10 years and are exempt from taxation on a specified city or state basis.
Please see page 11 for a description of the index. Index performance returns do not reflect any management fees, transaction costs, or expenses. Indices are unmanaged and one cannot invest directly in an index.
Delaware Minnesota High-Yield Municipal Bond Fund (Class A shares) | 1-year return | +3.20% | ||||||
Barclays Municipal Bond Index (benchmark) | 1-year return | +2.52% | ||||||
Lipper Minnesota Municipal Debt Funds Average | 1-year return | +2.47% |
Past performance does not guarantee future results.
For complete, annualized performance for Delaware Minnesota High-Yield Municipal Bond Fund, please see the table on page 12.
The performance of Class A shares excludes the applicable sales charge and reflects the reinvestment of all distributions. The Lipper Minnesota Municipal Debt Funds Average compares funds that limit assets to those securities that are exempt from taxation in Minnesota (double tax-exempt) or a city in Minnesota (triple tax-exempt).
Please see page 14 for a description of the index. Index performance returns do not reflect any management fees, transaction costs, or expenses. Indices are unmanaged and one cannot invest directly in an index.
1
Table of Contents
Portfolio management review
Delaware Investments® Minnesota Municipal Bond Funds
Economic backdrop
The U.S. economy continued to grow steadily throughout the Funds’ fiscal year ended Aug. 31, 2015. The economy benefited from increased business investment and consumer spending, made possible in part by a sharp drop in the price of oil. A steadily improving job market also lifted consumer optimism. As of August 2015, the national jobless rate was 5.1%, down a full percentage point from a year earlier and the lowest level since early 2008. (Source: U.S. Labor Department.)
In the third quarter of 2014, U.S. gross domestic product (GDP) – a measure of national economic output – grew by a rapid 4.3% annual pace. This was followed by a 2.1% expansion in the fourth quarter of 2014. In the first quarter of 2015, the economy significantly slowed, as bad winter weather and shipping disruptions at West Coast ports depressed economic activity. These trends reversed in the second quarter of 2015, with continued strength in consumer spending helping to grow the economy by an estimated 3.7% in April–June. (Source: U.S. Commerce Department.)
With the U.S. economy strengthening and inflation well contained, the U.S. Federal Reserve finally ended its quantitative-easing economic stimulus plan in October 2014.
The Fed maintained its target short-term rate at essentially zero – where it has been since 2008 – for the duration of the Funds’ fiscal year. However, as the period ended, investors widely anticipated a rate increase even as emerging concerns about the global economy added uncertainty to the central bank’s timetable.
Municipal bond market conditions
Municipal bonds produced positive returns overall for the Funds’ fiscal year. Over the entire period, bonds with longer maturity dates outperformed their shorter-maturity counterparts, while lower-
rated bonds offering higher yields fared better than higher-rated, lower yielding issues.
Municipal bond returns, by maturity and credit quality, for the 12 months ended Aug. 31, 2015, were as follows:
Maturity | ||||
5 years | 1.18 | % | ||
10 years | 2.47 | % | ||
22+ years | 4.02 | % | ||
Credit quality | ||||
AAA | 1.85 | % | ||
AA | 2.40 | % | ||
A | 2.75 | % | ||
BBB | 3.92 | % | ||
Source: Barclays
One exception to this trend came from bonds with credit ratings below BBB – also known as below-investment-grade, or high yield, bonds – which had flat returns, as measured by the Barclays High-Yield Municipal Bond Index, which tracks the total return performance of the long-term, non-investment-grade tax-exempt bond market. Nearly all of this relative underperformance, however, was caused by the weakness of bonds affiliated with Puerto Rico, which make up approximately 24% of the index. (Bonds issued by U.S. territories are exempt from federal, state, and local income taxes for residents of all 50 states.) Puerto Rico’s longstanding credit problems worsened during the Funds’ fiscal year, as the commonwealth filed for bankruptcy protection in July 2015. If Puerto Rico bonds were removed from the index, high yield returns would have kept with the credit trend by posting gains of 6.75%. The Funds held no Puerto Rico bonds during the fiscal year.
Toward the end of the Funds’ fiscal year, the market environment shifted for municipal bond investors. Uncertainty grew about the global economy – especially with respect to China and other emerging markets – causing increased
2
Table of Contents
market volatility, as investors became more risk averse. Accordingly, shorter-dated, higher-rated tax-exempt bonds returned to favor, while longer-maturity, lower-quality issues found themselves at a disadvantage as the period ended.
Demand for municipal bonds was robust as the fiscal year began, but tailed off as the period progressed. Toward the end of the period, however, municipal bond fund outflows grew as investors began to anticipate an increase in the Fed’s target short-term interest rate. Meanwhile, the supply of new long-term municipal debt remained constrained. Despite considerable issuance, much of the new supply consisted of debt refinancing, as issuers took advantage of still-low borrowing costs to lower their long-term interest expenses.
Sticking to our strategy
For all three Funds discussed in this report, we maintained the consistent management approach we follow in all types of market conditions, relying on a bottom-up investment strategy. We evaluate securities one at a time, working with our credit analysts to determine through careful research which bonds we believe offer our shareholders the most favorable risk-reward trade-off and income potential.
Applying this approach, we continued to favor bonds with lower-investment-grade or below-investment-grade credit ratings, the segment in which we believe our credit research capabilities may prove most beneficial. Accordingly, Delaware Tax-Free Minnesota Fund and Delaware Tax-Free Minnesota Intermediate Fund maintained sizeable allocations to bonds with credit ratings of A and BBB – the two lowest tiers of the investment-grade bond universe – as well as to below-investment-grade bonds. By prospectus, up to 20% of the net assets of Delaware Tax-Free Minnesota Fund and Delaware Tax-Free Minnesota Intermediate Fund can be held in this latter category. To the extent that we were able to
find what we viewed as attractive opportunities within the Minnesota municipal marketplace, we used a portion of this allotment, as we identified various lower-rated bonds that we believed appeared poised to benefit from credit improvement.
Meanwhile, reflecting its different mandate, Delaware Minnesota High-Yield Municipal Bond Fund has substantial flexibility to invest in bonds with below-investment-grade credit ratings. At fiscal year end, 33.42% of the portfolio was invested in bonds with credit ratings of BB or lower, up from the 29.77% at the start of the period.
Throughout the period, we maintained a roughly neutral duration (interest rate) stance in all three Funds relative to their benchmarks. This approach reflected our belief in our disciplined credit selection process, rather than any attempt to anticipate the direction of interest rates. The Funds purchased new bonds across various sectors during the fiscal year, including the charter school and healthcare sectors – two areas where we have substantial credit research experience. When appropriate, we tended to favor longer-dated bonds for what we identified as their increased performance potential.
One management challenge we regularly face, particularly in states with limited issuance, is finding sufficient supply of lower-rated bonds that we believe offer good long-term value for our shareholders. When these opportunities are scarce, we will sometimes purchase higher-quality in-state bonds to keep the Funds fully invested until higher yielding opportunities that we deem attractive become available. During this fiscal year, we employed this strategy in all three Funds, purchasing bonds that we believed could continue to provide shareholders with regular, tax-exempt income, as we searched for notable long-term value opportunities.
3
Table of Contents
Portfolio management review
Delaware Investments® Minnesota Municipal Bond Funds
Within the Funds
In keeping with the performance trends mentioned earlier, bonds with lower credit ratings and longer maturity dates tended to outperform higher-quality, shorter-dated issues for the fiscal year. The Funds’ strongest-performing holdings generally conformed to those trends.
Note: Any specific bonds mentioned herein were among those held for the entire fiscal year.
All three Funds benefited from holding St. Louis Park, Minn., Health Care Facilities bonds for Nicollet Health Services. These bonds, rated A by Standard & Poor’s, generated a strong return due in part to their relatively long maturity dates and lower-investment-grade credit rating. In addition, the bonds were advance refunded during the period, resulting in a nice price boost as the securities became backed by escrowed U.S. government securities.
The same factors also helped the performance of bonds issued by the Washington County Housing and Redevelopment Authority for the Birchwood and Woodbury senior housing projects. Delaware Tax-Free Minnesota Fund and Delaware Minnesota High-Yield Municipal Bond Fund owned these securities. As with the Nicollet Health Services bonds, these nonrated senior housing issues rose in price after the holdings were advance refunded.
Delaware Tax-Free Minnesota Intermediate Fund was helped by another healthcare-related bond issue – continuing care retirement community bonds for the Homestead at Anoka senior housing project. These nonrated bonds carried a maturity date of 2034 – relatively long for an intermediate fund – and saw their prices rise along with the entire healthcare sector, which was the strongest-performing group in the municipal marketplace over the past year.
In a generally strong year for municipal bonds, most of the Funds’ weakest performers turned in flat to modestly negative returns. As discussed,
bonds of very high credit quality failed to keep pace with the results of the overall municipal bond market. Metropolitan Council Environmental Services wastewater treatment bonds, for example, were only modest gainers, reflecting the securities’ 2016 maturity date and AAA credit rating. These bonds were the weakest-performing holding in all three Funds’ portfolios.
Similarly, various bonds that had been advance refunded previously produced only very modest gains, because of their short maturities and high credit quality. These included bonds issued by the Sartell Independent School District No. 748 (Delaware Tax-Free Minnesota Fund); healthcare bonds for North Country Health Services in Bemidji (Delaware Minnesota High-Yield Municipal Bond Fund); and University of Minnesota refunding bonds (Delaware Tax-Free Minnesota Intermediate Fund). All of these highly rated securities were to mature in 2016, which limited their performance potential.
Minnesota economic backdrop
In our view, Minnesota has a fundamentally sound economy and is not dependent on any one sector. Employment is diverse, with a mix of manufacturing, services, and trade similar to the nation. Other relevant notes:
| ● | In July 2015, nonfarm employment of 2.9 million was up 1.45% from a year earlier. |
| ● | The state’s unemployment rate of 4.0% in July 2015 was well below national levels of 5.3%. |
| ● | Personal income per capita is consistently above the national average. For the past five years, the state’s per capita personal income has been 105–108% of the national average. |
| ● | Minnesota operates on a biennial basis. Minnesota fiscal 2015 revenues totaled $19.9 billion, or 2.0% above the previous year. However, expenditures were 5.3% higher than the previous fiscal year. This left a budgetary |
4
Table of Contents
fund balance of $46.9 million, compared to a $656 million balance at the end of fiscal 2014. |
| ● | The state passed its $42.8 billion biennial General Fund budget for fiscal years 2016 and 2017. This biennial budget is an 8.8% increase over the previous biennial budget. Roughly 49% is allocated toward education and 28% for health services. |
(Data: bls.gov, Minnesota Management & Budget, Moody’s Investors Service)
5
Table of Contents
| Performance summaries | ||
| Delaware Tax-Free Minnesota Fund | August 31, 2015 |
The performance data quoted represent past performance; past performance does not guarantee future results. Investment return and principal value will fluctuate so your shares, when redeemed, may be worth more or less than their original cost. Please obtain the performance data current for the most recent month end by calling 800 523-1918 or visiting our website at delawareinvestments.com/performance. Current performance may be lower or higher than the performance data quoted.
| Fund and benchmark performance1, 2 | Average annual total returns through August 31, 2015 | |||||||
| 1 year | 5 years | 10 years | Lifetime | |||||
Class A (Est. Feb. 27, 1984) | ||||||||
Excluding sales charge | +3.02% | +4.01% | +4.17% | n/a | ||||
Including sales charge | -1.65% | +3.06% | +3.69% | n/a | ||||
Class C (Est. May 4, 1994) | ||||||||
Excluding sales charge | +2.25% | +3.22% | +3.40% | n/a | ||||
Including sales charge | +1.26% | +3.22% | +3.40% | n/a | ||||
Institutional Class (Est. Dec. 31, 2013) | ||||||||
Excluding sales charge | +3.27% | n/a | n/a | +6.62% | ||||
Including sales charge | +3.27% | n/a | n/a | +6.62% | ||||
Barclays Municipal Bond Index* | +2.52% | +3.96% | +4.49% | +5.99% | ||||
*The benchmark lifetime return is for Institutional Class share comparison only and is calculated using the last business day in the month of the Fund’s Institutional Class inception date.
1 Returns reflect the reinvestment of all distributions and are presented both with and without the applicable sales charges described below. Returns do not reflect the deduction of taxes the shareholder would pay on Fund distributions or redemptions of Fund shares.
Expense limitations were in effect for certain classes during some or all of the periods shown in the “Fund and benchmark performance” table. Expenses for each class are listed on the “Fund expense ratios” table on page 7. Performance would have been lower had expense limitations not been in effect.
Class A shares are sold with a maximum front-end sales charge of 4.50%, and have an annual distribution and service fee of 0.25% of average daily net assets. Performance for Class A shares, excluding sales charges, assumes that no front-end sales charge applied.
Class C shares are sold with a contingent deferred sales charge of 1.00% if redeemed during the first 12 months. They are also subject to an annual distribution and service fee of 1.00% of average daily net assets. Performance for Class C shares, excluding sales charges, assumes either that contingent deferred sales charges did not apply or that the investment was not redeemed.
Institutional Class shares are available without sales or asset-based distribution charges only to certain eligible institutional accounts.
Fixed income securities and bond funds can lose value, and investors can lose principal, as interest rates rise. They also may be affected by economic conditions that hinder an issuer’s ability to make interest and principal payments on its debt.
The Fund may also be subject to prepayment risk, the risk that the principal of a fixed income security that is held by the Fund may be prepaid
6
Table of Contents
prior to maturity, potentially forcing the Fund to reinvest that money at a lower interest rate.
Funds that invest primarily in one state may be more susceptible to the economic, regulatory, and other factors of that state than funds that invest more broadly.
Substantially all dividend income derived from tax-free funds is exempt from federal income tax. Some income may be subject to the federal alternative minimum tax (AMT) that applies to certain investors. Capital gains, if any, are taxable.
Bond ratings are determined by a nationally recognized statistical rating organization.
Duration number will change as market conditions change. Therefore, duration should not be solely relied upon to indicate a municipal bond fund’s potential volatility.
Per Standard & Poor’s credit rating agency, bonds rated AA and A are more susceptible to the adverse effects of changes in circumstances and economic conditions than those in the higher-rated AAA category, but the obligor’s capacity to meet its financial commitment on the obligation is still strong. Bonds rated BBB exhibit adequate protection parameters, although adverse economic conditions or changing circumstances are more likely to lead to a weakened capacity of the obligor to meet its financial commitments. Bonds rated BB, B, and CCC are regarded as having significant speculative characteristics, with BB indicating the least degree of speculation of the three.
2 The Fund’s expense ratios, as described in the most recent prospectus, are disclosed in the following “Fund expense ratios” table. Delaware Management Company has agreed to reimburse certain expenses and/or waive certain fees in order to prevent total annual fund operating expenses (excluding any 12b-1 fees, taxes, interest, inverse floater program expenses, short sale and dividend interest expenses, brokerage fees, certain insurance costs, acquired fund fees and expenses, and nonroutine expenses or costs, including, but not limited to, those relating to reorganizations, litigation, conducting shareholder meetings, and liquidations (collectively, nonroutine expenses)) from exceeding 0.60% (or 0.65%) of the Fund’s average daily net assets during the period from Sept. 1, 2014, through Aug. 31, 2015.** Please see the most recent prospectus and any applicable supplement(s) for additional information on these fee waivers and/or reimbursements.
| Fund expense ratios | Class A | Class C | Institutional Class | |||
Total annual operating expenses | 0.95% | 1.70% | 0.70% | |||
(without fee waivers) | ||||||
Net expenses | 0.85% | 1.60% | 0.60% | |||
(including fee waivers, if any) | ||||||
Type of waiver | Contractual | Contractual | Contractual | |||
**The contractual waiver for the period Dec. 29, 2014 through Dec. 29, 2015 is 0.60%. Prior to Dec. 29, 2014, the
contractual waiver was 0.65%.
7
Table of Contents
Performance summaries
Delaware Tax-Free Minnesota Fund
Performance of a $10,000 investment1
Average annual total returns from Aug. 31, 2005, through Aug. 31, 2015
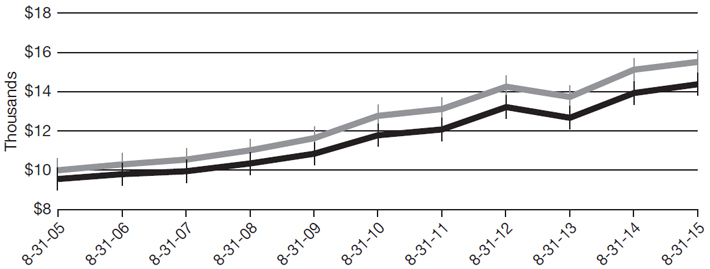
| For period beginning Aug. 31, 2005, through Aug. 31, 2015 | Starting value | Ending value | ||||||
 Barclays Municipal Bond Index Barclays Municipal Bond Index | $10,000 | $15,513 | ||||||
 Delaware Tax-Free Minnesota Fund — Class A shares Delaware Tax-Free Minnesota Fund — Class A shares | $9,550 | $14,371 | ||||||
1 The “Performance of a $10,000 investment” graph assumes $10,000 invested in Class A shares of the Fund on Aug. 31, 2005, and includes the effect of a 4.50% front-end sales charge and the reinvestment of all distributions. The graph does not reflect the deduction of taxes the shareholders would pay on Fund distributions or redemptions of Fund shares. Expense limitations were in effect for some or all of the periods shown. Performance would have been lower had expense limitations not been in effect. Expenses are listed in the “Fund expense ratios” table on page 7. Please note additional details on pages 6 through 8.
The graph also assumes $10,000 invested in the Barclays Municipal Bond Index as of Aug. 31, 2005. The Barclays Municipal Bond Index measures the total return performance of the long-term, investment grade tax-exempt bond market.
Index performance returns do not reflect any management fees, transaction costs, or expenses. Indices are unmanaged and one cannot invest directly in an index. Past performance is not a guarantee of future results.
Performance of other Fund classes will vary due to different charges and expenses.
| Nasdaq symbols | CUSIPs | |||||
Class A | DEFFX | 928918101 | ||||
Class C | DMOCX | 928918408 | ||||
Institutional Class
| DMNIX
| 928918705
|
8
Table of Contents
| Performance summaries | ||
| Delaware Tax-Free Minnesota Intermediate Fund | August 31, 2015 |
The performance data quoted represent past performance; past performance does not guarantee future results. Investment return and principal value will fluctuate so your shares, when redeemed, may be worth more or less than their original cost. Please obtain the performance data current for the most recent month end by calling 800 523-1918 or visiting our website at delawareinvestments.com/performance. Current performance may be lower or higher than the performance data quoted.
| Fund and benchmark performance1, 2 | Average annual total returns through August 31, 2015 | |||||||||||||||||||
| 1 year | 5 years | 10 years | Lifetime | |||||||||||||||||
Class A (Est. Oct. 27, 1985) | ||||||||||||||||||||
Excluding sales charge | +2.12% | +3.06% | +3.72% | n/a | ||||||||||||||||
Including sales charge | -0.69% | +2.49% | +3.44% | n/a | ||||||||||||||||
Class C (Est. May 4, 1994) | ||||||||||||||||||||
Excluding sales charge | +1.16% | +2.18% | +2.84% | n/a | ||||||||||||||||
Including sales charge | +0.17% | +2.18% | +2.84% | n/a | ||||||||||||||||
Institutional Class (Est. Dec. 31, 2013) | ||||||||||||||||||||
Excluding sales charge | +2.18% | n/a | n/a | +4.82% | ||||||||||||||||
Including sales charge | +2.18% | n/a | n/a | +4.82% | ||||||||||||||||
Barclays 3–15 Year Blend Municipal | ||||||||||||||||||||
Bond Index* | +2.02% | +3.52% | +4.46% | +4.75% | ||||||||||||||||
*The benchmark lifetime return is for Institutional Class share comparison only and is calculated using the last business day in the month of the Fund’s Institutional Class inception date.
1 Returns reflect the reinvestment of all distributions and are presented both with and without the applicable sales charges described below. Returns do not reflect the deduction of taxes the shareholder would pay on Fund distributions or redemptions of Fund shares.
Expense limitations were in effect for certain classes during some or all of the periods shown in the “Fund and benchmark performance” table. Expenses for each class are listed on the “Fund expense ratios” table on page 10. Performance would have been lower had expense limitations not been in effect.
Class A shares are sold with a maximum front-end sales charge of 2.75%, and have an annual distribution and service fee of 0.25% of average daily net assets. This fee has been contractually
limited to 0.15% of average daily net assets from Sept. 1, 2014, through Aug. 31, 2015.** Performance for Class A shares, excluding sales charges, assumes that no front-end sales charge applied.
Class C shares are sold with a contingent deferred sales charge of 1.00% if redeemed during the first 12 months. They are also subject to an annual distribution and service fee of 1.00% of average daily net assets. Performance for Class C shares, excluding sales charges, assumes either that contingent deferred sales charges did not apply or that the investment was not redeemed.
Institutional Class shares are available without sales or asset-based distribution charges only to certain eligible institutional accounts.
**The contractual waiver period is from
| Dec. | 27, 2013 through Dec. 29, 2015. |
9
Table of Contents
Performance summaries
Delaware Tax-Free Minnesota Intermediate Fund
Fixed income securities and bond funds can lose value, and investors can lose principal, as interest rates rise. They also may be affected by economic conditions that hinder an issuer’s ability to make interest and principal payments on its debt.
The Fund may also be subject to prepayment risk, the risk that the principal of a fixed income security that is held by the Fund may be prepaid prior to maturity, potentially forcing the Fund to reinvest that money at a lower interest rate.
Funds that invest primarily in one state may be more susceptible to the economic, regulatory, and other factors of that state than funds that invest more broadly.
Substantially all dividend income derived from tax-free funds is exempt from federal income tax. Some income may be subject to the federal alternative minimum tax (AMT) that applies to certain investors. Capital gains, if any, are taxable.
Bond ratings are determined by a nationally recognized statistical rating organization.
Duration number will change as market conditions change. Therefore, duration should not be solely relied upon to indicate a municipal bond fund’s potential volatility.
Per Standard & Poor’s credit rating agency, bonds rated AA and A are more susceptible to the adverse effects of changes in circumstances and economic conditions than those in the higher-rated AAA category, but the obligor’s capacity to meet its financial commitment on the obligation is still strong. Bonds rated BBB exhibit adequate protection parameters, although adverse economic conditions or changing circumstances are more likely to lead to a weakened capacity of the obligor to meet its financial commitments. Bonds rated BB, B, and CCC are regarded as having significant speculative characteristics, with BB indicating the least degree of speculation of the three.
2 The Fund’s expense ratios, as described in the most recent prospectus, are disclosed in the following “Fund expense ratios” table. Delaware Management Company has agreed to reimburse certain expenses and/or waive certain fees in order to prevent total annual fund operating expenses (excluding any 12b-1 fees, taxes, interest, inverse floater program expenses, short sale and dividend interest expenses, brokerage fees, certain insurance costs, acquired fund fees and expenses, and nonroutine expenses or costs, including, but not limited to, those relating to reorganizations, litigation, conducting shareholder meetings, and liquidations (collectively, nonroutine expenses)) from exceeding 0.69% of the Fund’s average daily net assets during the period from Sept. 1, 2014, through Aug. 31, 2015.*** Please see the most recent prospectus and any applicable supplement(s) for additional information on these fee waivers and/or reimbursements.
| Fund expense ratios | Class A | Class C | Institutional Class | |||
Total annual operating expenses | 0.98% | 1.73% | 0.73% | |||
(without fee waivers) | ||||||
Net expenses | 0.84% | 1.69% | 0.69% | |||
(including fee waivers, if any) | ||||||
Type of waiver | Contractual | Contractual | Contractual | |||
***The contractual waiver period is from Dec. 27, 2013 through Dec. 29, 2015.
10
Table of Contents
Performance of a $10,000 investment1
Average annual total returns from Aug. 31, 2005, through Aug. 31, 2015
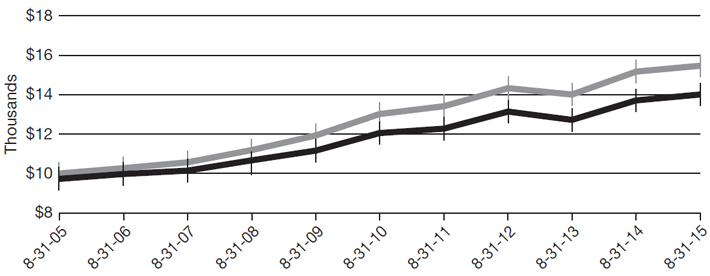
| For period beginning Aug. 31, 2005, through Aug. 31, 2015 | Starting value | Ending value | ||||||
| Barclays 3–15 Year Blend Municipal Bond Index | $10,000 | $15,467 | ||||||
| Delaware Tax-Free Minnesota Intermediate Fund — Class A shares | $9,725 | $14,019 | ||||||
1 The “Performance of a $10,000 investment” graph assumes $10,000 invested in Class A shares of the Fund on Aug. 31, 2005 and includes the effect of a 2.75% front-end sales charge and the reinvestment of all distributions. The graph does not reflect the deduction of taxes the shareholders would pay on Fund distributions or redemptions of Fund shares. Expense limitations were in effect for some or all of the periods shown. Performance would have been lower had expense limitations not been in effect. Expenses are listed in the “Fund expense ratios” table on page 10. Please note additional details on pages 9 through 11.
The graph also assumes $10,000 invested in the Barclays 3–15 Year Blend Municipal Bond Index as of Aug. 31, 2005. The Barclays 3–15 Year Blend Municipal Bond Index measures the total return performance of investment grade, U.S. tax-exempt bonds with maturities from 2 to 17 years.
Index performance returns do not reflect any management fees, transaction costs, or expenses. Indices are unmanaged and one cannot invest directly in an index. Past performance is not a guarantee of future results.
Performance of other Fund classes will vary due to different charges and expenses.
| Nasdaq symbols | CUSIPs | |||||
Class A | DXCCX | 928930106 | ||||
Class C | DVSCX | 928930205 | ||||
Institutional Class
| DMIIX
| 92910U109
|
11
Table of Contents
| Performance summaries | ||||
| Delaware Minnesota High-Yield Municipal Bond Fund | August 31, 2015 |
The performance data quoted represent past performance; past performance does not guarantee future results. Investment return and principal value will fluctuate so your shares, when redeemed, may be worth more or less than their original cost. Please obtain the performance data current for the most recent month end by calling 800 523-1918 or visiting our website at delawareinvestments.com/performance. Current performance may be lower or higher than the performance data quoted.
| Fund and benchmark performance1, 2 | Average annual total returns through August 31, 2015 | |||||||
| 1 year | 5 years | 10 years | Lifetime | |||||
Class A (Est. June 4, 1996) | ||||||||
Excluding sales charge | +3.20% | +4.14% | +4.30% | n/a | ||||
Including sales charge | -1.42% | +3.19% | +3.82% | n/a | ||||
Class C (Est. June 7, 1996) | ||||||||
Excluding sales charge | +2.53% | +3.38% | +3.53% | n/a | ||||
Including sales charge | +1.53% | +3.38% | +3.53% | n/a | ||||
Institutional Class (Est. Dec. 31, 2013) | ||||||||
Excluding sales charge | +3.46% | n/a | n/a | +7.01% | ||||
Including sales charge | +3.46% | n/a | n/a | +7.01% | ||||
Barclays Municipal Bond Index* | +2.52% | +3.96% | +4.49% | +5.99% | ||||
*The benchmark lifetime return is for Institutional Class share comparison only and is calculated using the last business day in the month of the Fund’s Institutional Class inception date.
1 Returns reflect the reinvestment of all distributions and are presented both with and without the applicable sales charges described below. Returns do not reflect the deduction of taxes the shareholder would pay on Fund distributions or redemptions of Fund shares.
Expense limitations were in effect for certain classes during some or all of the periods shown in the “Fund and benchmark performance” table. Expenses for each class are listed on the “Fund expense ratios” table on page 13. Performance would have been lower had expense limitations not been in effect.
Class A shares are sold with a maximum front-end sales charge of 4.50%, and have an annual distribution and service fee of 0.25% of average daily net assets. Performance for Class A shares, excluding sales charges, assumes that no front-end sales charge applied.
Class C shares are sold with a contingent deferred sales charge of 1.00% if redeemed during the first 12 months. They are also subject to an annual distribution and service fee of 1.00% of average daily net assets. Performance for Class C shares, excluding sales charges, assumes either that contingent deferred sales charges did not apply or that the investment was not redeemed.
Institutional Class shares are available without sales or asset-based distribution charges only to certain eligible institutional accounts.
Fixed income securities and bond funds can lose value, and investors can lose principal, as interest rates rise. They also may be affected by economic conditions that hinder an issuer’s ability to make interest and principal payments on its debt.
The Fund may also be subject to prepayment risk, the risk that the principal of a fixed income security that is held by the Fund may be prepaid
12
Table of Contents
prior to maturity, potentially forcing the Fund to reinvest that money at a lower interest rate.
Funds that invest primarily in one state may be more susceptible to the economic, regulatory, and other factors of that state than funds that invest more broadly.
High yielding, noninvestment grade bonds (junk bonds) involve higher risk than investment grade bonds. The high yield secondary market is particularly susceptible to liquidity problems when institutional investors, such as mutual funds and certain other financial institutions, temporarily stop buying bonds for regulatory, financial, or other reasons. In addition, a less liquid secondary market makes it more difficult for the Fund to obtain precise valuations of the high yield securities in its portfolio.
Substantially all dividend income derived from tax-free funds is exempt from federal income tax. Some income may be subject to the federal alternative minimum tax (AMT) that applies to certain investors. Capital gains, if any, are taxable.
Bond ratings are determined by a nationally recognized statistical rating organization.
Duration number will change as market conditions change. Therefore, duration should not be solely relied upon to indicate a municipal bond fund’s potential volatility.
Per Standard & Poor’s credit rating agency, bonds rated AA and A are more susceptible to the adverse effects of changes in circumstances and economic conditions than those in the higher-rated AAA category, but the obligor’s capacity to meet its financial commitment on the obligation is still strong. Bonds rated BBB exhibit adequate protection parameters, although adverse economic conditions or changing circumstances are more likely to lead to a weakened capacity of the obligor to meet its financial commitments. Bonds rated BB, B, and CCC are regarded as having significant speculative characteristics, with BB indicating the least degree of speculation of the three.
2 The Fund’s expense ratios, as described in the most recent prospectus, are disclosed in the following “Fund expense ratios” table. Delaware Management Company has agreed to reimburse certain expenses and/or waive certain fees in order to prevent total annual fund operating expenses (excluding any 12b-1 fees, taxes, interest, inverse floater program expenses, short sale and dividend interest expenses, brokerage fees, certain insurance costs, acquired fund fees and expenses, and nonroutine expenses or costs, including, but not limited to, those relating to reorganizations, litigation, conducting shareholder meetings, and liquidations (collectively, nonroutine expenses)) from exceeding 0.64% of the Fund’s average daily net assets during the period from Sept. 1, 2014, through Aug. 31, 2015.** Please see the most recent prospectus and any applicable supplement(s) for additional information on these fee waivers and/or reimbursements.
| Fund expense ratios | Class A | Class C | Institutional Class | |||||||
Total annual operating expenses | 0.99% | 1.74% | 0.74% | |||||||
(without fee waivers) | ||||||||||
Net expenses | 0.89% | 1.64% | 0.64% | |||||||
(including fee waivers, if any) | ||||||||||
Type of waiver | Contractual | Contractual | Contractual |
**The contractual waiver period is from Dec. 27, 2013 through Dec. 29, 2015.
13
Table of Contents
Performance summaries
Delaware Minnesota High-Yield Municipal Bond Fund
Performance of a $10,000 investment1
Average annual total returns from Aug. 31, 2005, through Aug. 31, 2015
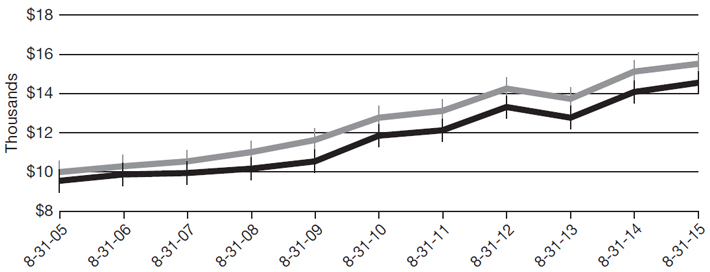
| For period beginning Aug. 31, 2005, through Aug. 31, 2015 | Starting value | Ending value | ||||||
| Barclays Municipal Bond Index | $10,000 | $15,513 | ||||||
| Delaware Minnesota High-Yield Municipal Bond Fund — Class A shares | $9,550 | $14,546 | ||||||
1 The “Performance of a $10,000 investment” graph assumes $10,000 invested in Class A shares of the Fund on Aug. 31, 2005, and includes the effect of a 4.50% front-end sales charge and the reinvestment of all distributions. The graph does not reflect the deduction of taxes the shareholders would pay on Fund distributions or redemptions of Fund shares. Expense limitations were in effect for some or all of the periods shown. Performance would have been lower had expense limitations not been in effect. Expenses are listed in the “Fund expense ratios” table on page 13. Please note additional details on pages 12 through 14.
The graph also assumes $10,000 invested in the Barclays Municipal Bond Index as of Aug. 31, 2005. The Barclays Municipal Bond Index measures the total return performance of the long-term, investment grade tax-exempt bond market.
Index performance returns do not reflect any management fees, transaction costs, or expenses. Indices are unmanaged and one cannot invest directly in an index. Past performance is not a guarantee of future results.
Performance of other Fund classes will vary due to different charges and expenses.
| Nasdaq symbols | CUSIPs | |||||
Class A | DVMHX | 928928316 | ||||
Class C | DVMMX | 928928282 | ||||
Institutional Class | DMHIX
| 928928175
|
14
Table of Contents
For the six-month period from March 1, 2015 to August 31, 2015 (Unaudited)
As a shareholder of a Fund, you incur two types of costs: (1) transaction costs, including sales charges (loads) on purchase payments, reinvested dividends, or other distributions; redemption fees; and exchange fees; and (2) ongoing costs, including management fees; distribution and/or service (12b-1) fees; and other Fund expenses. These following examples are intended to help you understand your ongoing costs (in dollars) of investing in a Fund and to compare these costs with the ongoing costs of investing in other mutual funds.
The examples are based on an investment of $1,000 invested at the beginning of the period and held for the entire six-month period from March 1, 2015 to Aug. 31, 2015.
Actual expenses
The first section of the tables shown, “Actual Fund return,” provides information about actual account values and actual expenses. You may use the information in this section of the table, together with the amount you invested, to estimate the expenses that you paid over the period. Simply divide your account value by $1,000 (for example, an $8,600 account value divided by $1,000 = 8.6), then multiply the result by the number in the first section under the heading entitled “Expenses Paid During Period” to estimate the expenses you paid on your account during this period.
Hypothetical example for comparison purposes
The second section of the tables shown, “Hypothetical 5% return,” provides information about hypothetical account values and hypothetical expenses based on the Funds’ actual expense ratios and an assumed rate of return of 5% per year before expenses, which is not the Funds’ actual return. The hypothetical account values and expenses may not be used to estimate the actual ending account balance or expenses you paid for the period. You may use this information to compare the ongoing costs of investing in the Funds and other funds. To do so, compare this 5% hypothetical example with the 5% hypothetical examples that appear in the shareholder reports of the other funds.
Please note that the expenses shown in the tables are meant to highlight your ongoing costs only and do not reflect any transactional costs, such as sales charges (loads), redemption fees, or exchange fees. Therefore, the second section of each table is useful in comparing ongoing costs only, and will not help you determine the relative total costs of owning different funds. In addition, if these transactional costs were included, your costs would have been higher. The Funds’ expenses shown in the tables reflect fee waivers in effect. The expenses shown in each table assume reinvestment of all dividends and distributions.
15
Table of Contents
Disclosure of Fund expenses
For the six-month period from March 1, 2015 to August 31, 2015 (Unaudited)
Delaware Tax-Free Minnesota Fund
Expense analysis of an investment of $1,000
Beginning Account Value 3/1/15 | Ending Account Value | Annualized Expense Ratio | Expenses Paid During Period 3/1/15 to 8/31/15* | |||||||||||||||||
Actual Fund return† | ||||||||||||||||||||
Class A | $ | 1,000.00 | $ | 1,006.90 | 0.85% | $ | 4.30 | |||||||||||||
Class C | 1,000.00 | 1,003.10 | 1.60% | 8.08 | ||||||||||||||||
Institutional Class | 1,000.00 | 1,008.20 | 0.60% | 3.04 | ||||||||||||||||
Hypothetical 5% return (5% return before expenses) | ||||||||||||||||||||
Class A | $ | 1,000.00 | $ | 1,020.92 | 0.85% | $ | 4.33 | |||||||||||||
Class C | 1,000.00 | 1,017.14 | 1.60% | 8.13 | ||||||||||||||||
Institutional Class | 1,000.00 | 1,022.18 | 0.60% | 3.06 | ||||||||||||||||
Delaware Tax-Free Minnesota Intermediate Fund Expense analysis of an investment of $1,000 |
| |||||||||||||||||||
Beginning Account Value 3/1/15 | Ending Account Value 8/31/15 | Annualized Expense Ratio | Expenses Paid During Period 3/1/15 to 8/31/15* | |||||||||||||||||
Actual Fund return† | ||||||||||||||||||||
Class A | $ | 1,000.00 | $ | 1,004.40 | 0.85% | $ | 4.29 | |||||||||||||
Class C | 1,000.00 | 999.30 | 1.70% | 8.57 | ||||||||||||||||
Institutional Class | 1,000.00 | 1,004.30 | 0.70% | 3.54 | ||||||||||||||||
Hypothetical 5% return (5% return before expenses) | ||||||||||||||||||||
Class A | $ | 1,000.00 | $ | 1,020.92 | 0.85% | $ | 4.33 | |||||||||||||
Class C | 1,000.00 | 1,016.64 | 1.70% | 8.64 | ||||||||||||||||
Institutional Class | 1,000.00 | 1,021.68 | 0.70% | 3.57 | ||||||||||||||||
16
Table of Contents
Delaware Minnesota High-Yield Municipal Bond Fund
Expense analysis of an investment of $1,000
| Beginning Account Value 3/1/15 | Ending Account Value 8/31/15 | Annualized Expense Ratio | Expenses Paid During Period 3/1/15 to 8/31/15* | |||||||||||||||||
Actual Fund return† | ||||||||||||||||||||
Class A | $ | 1,000.00 | $ | 1,007.60 | 0.92 | % | $ | 4.66 | ||||||||||||
Class C | 1,000.00 | 1,004.80 | 1.67 | % | 8.44 | |||||||||||||||
Institutional Class | 1,000.00 | 1,009.80 | 0.67 | % | 3.39 | |||||||||||||||
Hypothetical 5% return (5% return before expenses) | ||||||||||||||||||||
Class A | $ | 1,000.00 | $ | 1,020.57 | 0.92 | % | $ | 4.69 | ||||||||||||
Class C | 1,000.00 | 1,016.79 | 1.67 | % | 8.49 | |||||||||||||||
Institutional Class | 1,000.00 | 1,021.83 | 0.67 | % | 3.41 | |||||||||||||||
| * | “Expenses Paid During Period” are equal to the relevant Fund’s annualized expense ratio, multiplied by the average account value over the period, multiplied by 184/365 (to reflect the one-half year period). |
†Because actual returns reflect only the most recent six-month period, the returns shown may differ significantly from fiscal year returns.
17
Table of Contents
| Security type / sector / territory allocations | ||
| Delaware Tax-Free Minnesota Fund | As of August 31, 2015 (Unaudited) | |
Sector designations may be different than the sector designations presented in other fund materials.
| Security type / sector | Percentage of net assets | |||||
Municipal Bonds* | 98.95% | |||||
Corporate-Backed Revenue Bonds | 3.81% | |||||
Education Revenue Bonds | 10.37% | |||||
Electric Revenue Bonds | 5.04% | |||||
Healthcare Revenue Bonds | 33.51% | |||||
Housing Revenue Bonds | 4.99% | |||||
Lease Revenue Bonds | 2.34% | |||||
Local General Obligation Bonds | 5.12% | |||||
Pre-Refunded/Escrowed to Maturity Bonds | 18.92% | |||||
Special Tax Revenue Bonds | 3.33% | |||||
State General Obligation Bonds | 5.54% | |||||
Transportation Revenue Bonds | 3.59% | |||||
Water & Sewer Revenue Bonds | 2.39% | |||||
Short-Term Investments | 0.50% | |||||
Total Value of Securities | 99.45% | |||||
Receivables and Other Assets Net of Liabilities | 0.55% | |||||
Total Net Assets | 100.00% | |||||
* As of the date of this report, Delaware Tax-Free Minnesota Fund held bonds issued by or on behalf of territories and the states of the United States as follows:
| State / territory | (as a percentage of net assets) | |||||||
Minnesota | 99.04% | |||||||
U.S. Virgin Islands | 0.41% | |||||||
Total | 99.45% | |||||||
18
Table of Contents
| Security type / sector allocations | ||
| Delaware Tax-Free Minnesota Intermediate Fund | As of August 31, 2015 (Unaudited) | |
Sector designations may be different than the sector designations presented in other fund materials.
| Security type / sector | Percentage of net assets | |||||||
Municipal Bonds | 99.68 | % | ||||||
Corporate-Backed Revenue Bonds | 3.40 | % | ||||||
Education Revenue Bonds | 15.51 | % | ||||||
Electric Revenue Bonds | 8.15 | % | ||||||
Healthcare Revenue Bonds | 33.49 | % | ||||||
Housing Revenue Bonds | 0.56 | % | ||||||
Lease Revenue Bonds | 5.47 | % | ||||||
Local General Obligation Bonds | 9.33 | % | ||||||
Pre-Refunded/Escrowed to Maturity Bonds | 9.85 | % | ||||||
Special Tax Revenue Bonds | 3.23 | % | ||||||
State General Obligation Bonds | 4.12 | % | ||||||
Transportation Revenue Bonds | 5.17 | % | ||||||
Water & Sewer Revenue Bond | 1.40 | % | ||||||
Short-Term Investments | 0.80 | % | ||||||
Total Value of Securities | 100.48 | % | ||||||
Liabilities Net of Receivables and Other Assets | (0.48 | %) | ||||||
Total Net Assets | 100.00 | % | ||||||
19
Table of Contents
| Security type / sector allocations | ||
| Delaware Minnesota High-Yield Municipal Bond Fund | As of August 31, 2015 (Unaudited) |
Sector designations may be different than the sector designations presented in other fund materials.
| Security type / sector | Percentage of net assets | ||||
Municipal Bonds | 99.66% | ||||
Corporate-Backed Revenue Bonds | 3.78% | ||||
Education Revenue Bonds | 16.00% | ||||
Electric Revenue Bonds | 6.62% | ||||
Healthcare Revenue Bonds | 37.02% | ||||
Housing Revenue Bonds | 4.65% | ||||
Lease Revenue Bonds | 2.23% | ||||
Local General Obligation Bonds | 8.26% | ||||
Pre-Refunded Bonds | 10.84% | ||||
Special Tax Revenue Bonds | 6.14% | ||||
State General Obligation Bonds | 2.02% | ||||
Transportation Revenue Bonds | 2.10% | ||||
Short-Term Investments | 1.23% | ||||
Total Value of Securities | 100.89% | ||||
Liabilities Net of Receivables and Other Assets | (0.89%) | ||||
Total Net Assets | 100.00% | ||||
20
Table of Contents
| Schedules of investments | ||
| Delaware Tax-Free Minnesota Fund | August 31, 2015 |
| Principal amount° | Value (U.S. $) | |||||||
| ||||||||
Municipal Bonds – 98.95% | ||||||||
| ||||||||
Corporate-Backed Revenue Bonds – 3.81% | ||||||||
Cloquet Pollution Control Revenue | ||||||||
(Potlatch Project) 5.90% 10/1/26 | 7,000,000 | $ | 7,006,720 | |||||
Laurentian Energy Authority I Cogeneration Revenue | ||||||||
Series A 5.00% 12/1/21 | 8,000,000 | 7,948,560 | ||||||
St. Paul Port Authority Solid Waste Disposal Revenue | ||||||||
(Gerdau St. Paul Steel Mill Project) Series 7 4.50% 10/1/37 (AMT) | 6,530,000 | 6,262,205 | ||||||
|
| |||||||
| 21,217,485 | ||||||||
|
| |||||||
Education Revenue Bonds – 10.37% | ||||||||
Brooklyn Park Charter School Lease | ||||||||
(Prairie Seeds Academy Project) | ||||||||
Series A 5.00% 3/1/34 | 2,260,000 | 2,266,780 | ||||||
Series A 5.00% 3/1/39 | 385,000 | 378,728 | ||||||
Cologne Charter School Lease Revenue | ||||||||
(Cologne Academy Project) | ||||||||
Series A 5.00% 7/1/34 | 250,000 | 261,303 | ||||||
Series A 5.00% 7/1/45 | 1,390,000 | 1,429,240 | ||||||
Duluth Housing & Redevelopment Authority Revenue | ||||||||
(Public School Academy) Series A 5.875% 11/1/40 | 3,500,000 | 3,713,395 | ||||||
Forest Lake Charter School Revenue Fund | ||||||||
(Forest Lake International Language Academy) | ||||||||
Series A 5.50% 8/1/36 | 580,000 | 632,043 | ||||||
Series A 5.75% 8/1/44 | 1,190,000 | 1,297,933 | ||||||
Hugo Charter School Lease Revenue | ||||||||
(Noble Academy Project) | ||||||||
Series A 5.00% 7/1/34 | 580,000 | 614,951 | ||||||
Series A 5.00% 7/1/44 | 1,770,000 | 1,852,677 | ||||||
Minneapolis Student Housing Revenue | ||||||||
(Riverton Community Housing Project) | ||||||||
5.25% 8/1/39 | 470,000 | 476,326 | ||||||
5.50% 8/1/49 | 2,260,000 | 2,305,403 | ||||||
Minnesota Colleges & Universities Revenue Fund | ||||||||
Series A 5.00% 10/1/28 | 8,900,000 | 9,848,295 | ||||||
Minnesota Higher Education Facilities Authority Revenue | ||||||||
(Bethel University) Series 6-R 5.50% 5/1/37 | 2,500,000 | 2,560,950 | ||||||
(Carleton College) | ||||||||
Series 6-T 5.00% 1/1/28 | 1,000,000 | 1,082,580 | ||||||
Series 7-D 5.00% 3/1/30 | 1,500,000 | 1,663,395 | ||||||
(St. Catherine University) | ||||||||
Series 7-Q 5.00% 10/1/21 | 1,300,000 | 1,471,158 | ||||||
Series 7-Q 5.00% 10/1/23 | 350,000 | 395,675 | ||||||
Series 7-Q 5.00% 10/1/24 | 475,000 | 533,192 | ||||||
21
Table of Contents
Schedules of investments
Delaware Tax-Free Minnesota Fund
| Principal amount° | Value (U.S. $) | |||||||
| ||||||||
Municipal Bonds (continued) | ||||||||
| ||||||||
Education Revenue Bonds (continued) | ||||||||
Minnesota Higher Education Facilities Authority Revenue | ||||||||
(St. Catherine University) Series 7-Q 5.00% 10/1/27 | 200,000 | $ | 218,770 | |||||
(St. Olaf College) | ||||||||
Series 8-G 5.00% 12/1/31 | 670,000 | 774,017 | ||||||
Series 8-G 5.00% 12/1/32 | 670,000 | 770,855 | ||||||
(St. Scholastica College) Series 7-J 6.30% 12/1/40 | 1,800,000 | 1,992,816 | ||||||
(University of St. Thomas) | ||||||||
Series 6-X 5.25% 4/1/39 | 5,000,000 | 5,281,550 | ||||||
Series 7-A 5.00% 10/1/39 | 2,000,000 | 2,222,900 | ||||||
Series 7-U 5.00% 4/1/23 | 550,000 | 647,669 | ||||||
Otsego Charter School Lease Revenue | ||||||||
(Kaleidoscope Charter School) | ||||||||
Series A 5.00% 9/1/34 | 765,000 | 786,779 | ||||||
Series A 5.00% 9/1/44 | 1,500,000 | 1,518,435 | ||||||
Rice County Educational Facilities Revenue | ||||||||
(Shattuck-St. Mary’s School) Series A 144A | ||||||||
5.00% 8/1/22 # | 2,855,000 | 2,952,641 | ||||||
St. Paul Housing & Redevelopment Authority Charter School Lease Revenue | ||||||||
(Academia Cesar Chavez School Project) Series A 5.25% 7/1/50 | 2,000,000 | 1,867,080 | ||||||
(Twin Cities Academy Project) Series A 5.30% 7/1/45 | 1,440,000 | 1,442,290 | ||||||
University of Minnesota | ||||||||
Series A 5.25% 12/1/28 | 1,000,000 | 1,171,690 | ||||||
Series A 5.25% 12/1/29 | 1,850,000 | 2,155,601 | ||||||
Series D 5.00% 12/1/27 | 1,000,000 | 1,157,250 | ||||||
|
| |||||||
| 57,744,367 | ||||||||
|
| |||||||
Electric Revenue Bonds – 5.04% | ||||||||
Chaska Electric Revenue | ||||||||
(Generating Facilities) Series A 5.00% 10/1/30 | 3,000,000 | 3,010,140 | ||||||
Hutchinson Utilities Commission Revenue | ||||||||
Series A 4.00% 12/1/21 | 700,000 | 770,455 | ||||||
Minnesota Municipal Power Agency Electric Revenue | ||||||||
5.00% 10/1/29 | 395,000 | 457,055 | ||||||
5.00% 10/1/30 | 500,000 | 575,120 | ||||||
5.00% 10/1/33 | 1,205,000 | 1,371,712 | ||||||
Series A 5.00% 10/1/30 | 1,060,000 | 1,219,254 | ||||||
Series A 5.00% 10/1/34 | 750,000 | 850,605 | ||||||
Series A 5.00% 10/1/35 | 415,000 | 470,319 | ||||||
Unrefunded Balance 5.00% 10/1/35 | 1,290,000 | 1,294,360 | ||||||
22
Table of Contents
| Principal amount° | Value (U.S. $) | |||||||
| ||||||||
Municipal Bonds (continued) | ||||||||
| ||||||||
Electric Revenue Bonds (continued) | ||||||||
Northern Municipal Power Agency Electric System Revenue | ||||||||
Series A 5.00% 1/1/25 | 125,000 | $ | 145,634 | |||||
Series A 5.00% 1/1/26 | 425,000 | 490,539 | ||||||
Series A 5.00% 1/1/31 | 520,000 | 582,171 | ||||||
Rochester Electric Utility Revenue | ||||||||
Series B 5.00% 12/1/27 | 295,000 | 345,681 | ||||||
Series B 5.00% 12/1/28 | 275,000 | 320,491 | ||||||
Series B 5.00% 12/1/31 | 1,365,000 | 1,572,848 | ||||||
Series B 5.00% 12/1/33 | 300,000 | 343,314 | ||||||
Southern Minnesota Municipal Power Agency Revenue | ||||||||
Capital Appreciation Series A | ||||||||
6.70% 1/1/25 (NATL-RE)^ | 5,000,000 | 3,802,500 | ||||||
Western Minnesota Municipal Power Agency Revenue | ||||||||
Series A 5.00% 1/1/33 | 1,000,000 | 1,142,500 | ||||||
Series A 5.00% 1/1/34 | 4,000,000 | 4,554,200 | ||||||
Series A 5.00% 1/1/40 | 1,250,000 | 1,404,637 | ||||||
Series A 5.00% 1/1/46 | 3,000,000 | 3,350,250 | ||||||
|
| |||||||
| 28,073,785 | ||||||||
|
| |||||||
Healthcare Revenue Bonds – 33.51% | ||||||||
Aitkin Health Care Facilities Revenue | ||||||||
(Riverwood Health Care Center) 5.60% 2/1/32 | 2,100,000 | 2,111,529 | ||||||
Alexandria Senior Housing Revenue | ||||||||
(Knute Nelson Senior Living) | ||||||||
6.00% 7/1/35 | 1,500,000 | 1,566,645 | ||||||
6.20% 7/1/45 | 2,000,000 | 2,099,860 | ||||||
Anoka Health Care Facilities Revenue | ||||||||
(Homestead Anoka Project) | ||||||||
Series A 7.00% 11/1/40 | 1,000,000 | 1,072,500 | ||||||
Series A 7.00% 11/1/46 | 1,220,000 | 1,306,083 | ||||||
Anoka Healthcare & Housing Facilities Revenue | ||||||||
(Homestead Anoka Project) | ||||||||
5.125% 11/1/49 | 1,100,000 | 1,109,768 | ||||||
5.375% 11/1/34 | 320,000 | 333,072 | ||||||
Anoka Housing Facilities Revenue | ||||||||
(Senior Homestead Anoka Project) Series B 6.875% 11/1/34 | 2,015,000 | 2,165,460 | ||||||
Apple Valley Economic Development Authority Health Care Revenue | ||||||||
(Augustana Home St. Paul Project) Series A 6.00% 1/1/40 | 2,700,000 | 2,708,856 | ||||||
23
Table of Contents
Schedules of investments
Delaware Tax-Free Minnesota Fund
| Principal amount° | Value (U.S. $) | |||||||
| ||||||||
Municipal Bonds (continued) | ||||||||
| ||||||||
Healthcare Revenue Bonds (continued) | ||||||||
Breckenridge Catholic Health Initiatives | ||||||||
Series A 5.00% 5/1/30 | 2,500,000 | $ | 2,508,975 | |||||
Center City Health Care Facilities Revenue | ||||||||
(Hazelden Betty Ford Foundation Project) | ||||||||
5.00% 11/1/26 | 500,000 | 582,575 | ||||||
5.00% 11/1/44 | 500,000 | 547,470 | ||||||
Deephaven Housing & Healthcare Revenue | ||||||||
(St. Therese Senior Living Project) | ||||||||
Series A 5.00% 4/1/38 | 730,000 | 737,775 | ||||||
Series A 5.00% 4/1/40 | 705,000 | 711,613 | ||||||
Series A 5.00% 4/1/48 | 315,000 | 315,860 | ||||||
Duluth Economic Development Authority | ||||||||
(St. Luke’s Hospital Authority Obligation Group) | ||||||||
5.75% 6/15/32 | 1,850,000 | 2,037,812 | ||||||
6.00% 6/15/39 | 3,570,000 | 3,950,348 | ||||||
Fergus Falls Health Care Facilities Revenue | ||||||||
(Lake Region Health Care) | ||||||||
5.15% 8/1/35 | 1,250,000 | 1,276,463 | ||||||
5.40% 8/1/40 | 1,000,000 | 1,026,850 | ||||||
Glencoe Health Care Facilities Revenue | ||||||||
(Glencoe Regional Health Services Project) | ||||||||
4.00% 4/1/24 | 500,000 | 520,700 | ||||||
4.00% 4/1/25 | 660,000 | 686,638 | ||||||
4.00% 4/1/31 | 60,000 | 61,059 | ||||||
Hayward Health Care Facilities Revenue | ||||||||
(American Baptist Homes Midwest Obligated Group) | ||||||||
5.375% 8/1/34 | 660,000 | 681,556 | ||||||
5.75% 2/1/44 | 500,000 | 517,775 | ||||||
(St. John’s Lutheran Home of Albert Lea) 5.375% 10/1/44 | 1,570,000 | 1,576,359 | ||||||
Maple Grove Health Care Facilities Revenue | ||||||||
(North Memorial Health Care) | ||||||||
5.00% 9/1/31 | 1,000,000 | 1,112,700 | ||||||
5.00% 9/1/32 | 1,000,000 | 1,110,930 | ||||||
Maple Grove Health Care System Revenue | ||||||||
(Maple Grove Hospital) | ||||||||
5.25% 5/1/28 | 4,500,000 | 4,721,760 | ||||||
5.25% 5/1/37 | 2,950,000 | 3,079,063 | ||||||
Minneapolis Health Care System Revenue | ||||||||
(Fairview Health Services) | ||||||||
Series A 5.00% 11/15/33 | 500,000 | 562,730 | ||||||
24
Table of Contents
| Principal amount° | Value (U.S. $) | |||||||
| ||||||||
Municipal Bonds (continued) | ||||||||
| ||||||||
Healthcare Revenue Bonds (continued) | ||||||||
Minneapolis Health Care System Revenue | ||||||||
(Fairview Health Services) | ||||||||
Series A 5.00% 11/15/34 | 500,000 | $ | 559,545 | |||||
Series A 5.00% 11/15/44 | 1,000,000 | 1,101,120 | ||||||
Series A 6.625% 11/15/28 | 3,000,000 | 3,498,120 | ||||||
Series B 6.50% 11/15/38 (ASSURED GTY) | 1,140,000 | 1,300,626 | ||||||
Series D 5.00% 11/15/30 (AMBAC) | 2,500,000 | 2,512,550 | ||||||
Series D 5.00% 11/15/34 (AMBAC) | 4,750,000 | 4,772,135 | ||||||
(Jones-Harrison Residence Project) 5.60% 10/1/30 | 1,050,000 | 1,052,058 | ||||||
Minneapolis National Marrow Donor Program Revenue | ||||||||
4.875% 8/1/25 | 6,430,000 | 6,630,487 | ||||||
Minneapolis Senior Housing & Healthcare Revenue | ||||||||
(Ecumen Mill City Quarter) | ||||||||
5.00% 11/1/35 | 500,000 | 500,595 | ||||||
5.25% 11/1/45 | 1,950,000 | 1,963,923 | ||||||
5.375% 11/1/50 | 455,000 | 455,814 | ||||||
Minneapolis – St. Paul Housing & Redevelopment Authority Health Care Revenue | ||||||||
(Children’s Hospital) Series A 5.25% 8/15/35 | 2,085,000 | 2,334,137 | ||||||
Minnesota Agricultural & Economic Development Board Revenue | ||||||||
(Benedictine Health Systems) 5.75% 2/1/29 | 1,895,000 | 1,896,971 | ||||||
(Essentia Remarketing) | ||||||||
Series C-1 5.00% 2/15/30 (ASSURED GTY) | 5,725,000 | 6,307,061 | ||||||
Series C-1 5.25% 2/15/23 (ASSURED GTY) | 5,000,000 | 5,698,850 | ||||||
Series C-1 5.50% 2/15/25 (ASSURED GTY) | 5,120,000 | 5,821,338 | ||||||
(Health Care System) Unrefunded Balance | ||||||||
Series A 5.75% 11/15/26 (NATL-RE) | 180,000 | 180,084 | ||||||
Series A 6.375% 11/15/29 | 15,000 | 15,067 | ||||||
Northfield Hospital & Skilled Nursing Revenue | ||||||||
5.375% 11/1/26 | 3,785,000 | 3,940,866 | ||||||
Red Wing Senior Housing | ||||||||
(Deer Crest Project) | ||||||||
Series A 5.00% 11/1/27 | 430,000 | 456,269 | ||||||
Series A 5.00% 11/1/32 | 330,000 | 346,044 | ||||||
Series A 5.00% 11/1/42 | 1,250,000 | 1,298,937 | ||||||
Rochester Health Care & Housing Revenue | ||||||||
(Samaritan Bethany) Series A 7.375% 12/1/41 | 5,220,000 | 5,812,313 | ||||||
(The Homestead at Rochester Project) Series A 6.875% 12/1/48 | 2,980,000 | 3,345,139 | ||||||
25
Table of Contents
Schedules of investments
Delaware Tax-Free Minnesota Fund
| Principal amount° | Value (U.S. $) | |||||||
| ||||||||
Municipal Bonds (continued) | ||||||||
| ||||||||
Healthcare Revenue Bonds (continued) | ||||||||
Rochester Health Care Facilities Revenue | ||||||||
(Mayo Clinic) | ||||||||
4.00% 11/15/41 | 4,515,000 | $ | 4,637,808 | |||||
Series D Remarketing 5.00% 11/15/38 | 6,405,000 | 7,193,135 | ||||||
(Olmsted Medical Center Project) | ||||||||
5.00% 7/1/24 | 295,000 | 344,082 | ||||||
5.00% 7/1/33 | 650,000 | 720,259 | ||||||
5.875% 7/1/30 | 1,850,000 | 2,138,008 | ||||||
Sartell Health Care Facilities Revenue | ||||||||
(Country Manor Campus Project) | ||||||||
Series A 5.25% 9/1/27 | 1,280,000 | 1,357,594 | ||||||
Series A 5.30% 9/1/37 | 1,200,000 | 1,251,456 | ||||||
Series A 6.375% 9/1/42 | 2,435,000 | 2,487,523 | ||||||
Sauk Rapids Health Care Housing Facilities Revenue | ||||||||
(Good Shepherd Lutheran Home) 5.125% 1/1/39 | 1,350,000 | 1,362,299 | ||||||
Shakopee Health Care Facilities Revenue | ||||||||
(St. Francis Regional Medical Center) | ||||||||
4.00% 9/1/31 | 915,000 | 941,855 | ||||||
5.00% 9/1/24 | 575,000 | 680,121 | ||||||
5.00% 9/1/25 | 750,000 | 880,350 | ||||||
5.00% 9/1/26 | 575,000 | 669,139 | ||||||
5.00% 9/1/27 | 405,000 | 468,646 | ||||||
5.00% 9/1/28 | 425,000 | 486,497 | ||||||
5.00% 9/1/29 | 425,000 | 484,237 | ||||||
5.00% 9/1/34 | 730,000 | 810,643 | ||||||
Sherburne County Health Care Facilities Revenue | ||||||||
(Guardian Angels Health Services) 5.55% 10/1/36 | 1,500,000 | 1,501,410 | ||||||
St. Cloud Health Care Revenue | ||||||||
(Centracare Health System Project) | ||||||||
5.375% 5/1/31 (ASSURED GTY) | 1,000,000 | 1,094,950 | ||||||
5.50% 5/1/39 (ASSURED GTY) | 6,000,000 | 6,551,820 | ||||||
Series A 5.125% 5/1/30 | 9,350,000 | 10,315,949 | ||||||
St. Paul Housing & Redevelopment Authority Health Care Facilities Revenue | ||||||||
(Allina Health System) | ||||||||
Series A 5.00% 11/15/18 (NATL-RE) | 4,720,000 | 5,155,420 | ||||||
Series A-1 5.25% 11/15/29 | 5,605,000 | 6,307,755 | ||||||
(Health Partners Obligation Group Project) 5.00% 7/1/33 | 1,260,000 | 1,419,957 | ||||||
26
Table of Contents
| Principal amount° | Value (U.S. $) | |||||||
| ||||||||
Municipal Bonds (continued) | ||||||||
| ||||||||
Healthcare Revenue Bonds (continued) | ||||||||
St. Paul Housing & Redevelopment Authority Hospital Facility | ||||||||
(Healtheast Care System Project) | ||||||||
Series A 5.00% 11/15/29 | 910,000 | $ | 989,962 | |||||
Series A 5.00% 11/15/30 | 670,000 | 726,528 | ||||||
St. Paul Housing & Redevelopment Authority Housing & Health Care Facilities Revenue | ||||||||
(Senior Carondelet Village Project) Series A 6.00% 8/1/42 | 3,075,000 | 3,205,749 | ||||||
(Senior Episcopal Homes Project) 5.125% 5/1/48 | 3,100,000 | 3,184,134 | ||||||
St. Paul Housing & Redevelopment Authority Multifamily Housing Revenue | ||||||||
(Marian Center Project) | ||||||||
Series A 5.30% 11/1/30 | 500,000 | 500,615 | ||||||
Series A 5.375% 5/1/43 | 500,000 | 500,430 | ||||||
Washington County Housing & Redevelopment Authority Healthcare & Housing Revenue | ||||||||
(Birchwood & Woodbury Projects) Series A 5.625% 6/1/37 | 1,500,000 | 1,574,955 | ||||||
Wayzata Senior Housing Revenue | ||||||||
(Folkestone Senior Living Community) | ||||||||
Series A 5.50% 11/1/32 | 1,050,000 | 1,137,077 | ||||||
Series A 5.75% 11/1/39 | 2,365,000 | 2,547,720 | ||||||
Series A 6.00% 5/1/47 | 3,685,000 | 3,994,466 | ||||||
Winona Health Care Facilities Revenue | ||||||||
(Winona Health Obligation) | ||||||||
4.50% 7/1/25 | 850,000 | 895,390 | ||||||
4.65% 7/1/26 | 540,000 | 570,159 | ||||||
Woodbury Housing & Redevelopment Authority Revenue | ||||||||
(St. Therese of Woodbury) | ||||||||
5.00% 12/1/34 | 500,000 | 505,870 | ||||||
5.125% 12/1/44 | 1,605,000 | 1,621,660 | ||||||
5.25% 12/1/49 | 750,000 | 763,980 | ||||||
|
| |||||||
| 186,580,441 | ||||||||
|
| |||||||
Housing Revenue Bonds – 4.99% | ||||||||
Minneapolis Multifamily Housing Revenue | ||||||||
(Seward Towers Project) 5.00% 5/20/36 (GNMA) | 7,625,000 | 7,650,010 | ||||||
Minnesota Housing Finance Agency | ||||||||
(Residential Housing) | ||||||||
Series D 4.80% 7/1/38 (AMT)● | 1,840,000 | 1,849,366 | ||||||
Series I 4.85% 7/1/38 (AMT) | 1,420,000 | 1,426,546 | ||||||
Series I 5.15% 7/1/38 (AMT) | 3,975,000 | 3,987,402 | ||||||
27
Table of Contents
Schedules of investments
Delaware Tax-Free Minnesota Fund
| Principal amount° | Value (U.S. $) | |||||||
| ||||||||
Municipal Bonds (continued) | ||||||||
| ||||||||
Housing Revenue Bonds (continued) | ||||||||
Minnesota Housing Finance Agency | ||||||||
(Residential Housing) | ||||||||
Series L 5.10% 7/1/38 (AMT) | 7,140,000 | $ | 7,328,567 | |||||
Series M 4.875% 7/1/37 (AMT) | 2,070,000 | 2,075,775 | ||||||
Minnesota Housing Finance Agency Homeownership Finance (Non-Agency Mortgage-Backed Securities Program) | ||||||||
Series D 4.70% 1/1/31 (GNMA) (FNMA) (FHLMC) | 2,025,000 | 2,159,825 | ||||||
Northwest Multi-County Housing & Redevelopment Authority | ||||||||
(Pooled Housing Program) 5.50% 7/1/45 | 1,330,000 | 1,305,980 | ||||||
|
| |||||||
| 27,783,471 | ||||||||
|
| |||||||
Lease Revenue Bonds – 2.34% | ||||||||
Minnesota General Fund Revenue Appropriations | ||||||||
Series A 5.00% 6/1/38 | 1,250,000 | 1,411,525 | ||||||
Series A 5.00% 6/1/43 | 3,835,000 | 4,274,644 | ||||||
Series B 5.00% 3/1/28 | 2,500,000 | 2,888,800 | ||||||
University of Minnesota Special Purpose Revenue | ||||||||
(State Supported Biomed Science Research) 5.00% 8/1/35 | 3,960,000 | 4,471,830 | ||||||
|
| |||||||
| 13,046,799 | ||||||||
|
| |||||||
Local General Obligation Bonds – 5.12% | ||||||||
Anoka County Capital Improvement | ||||||||
Series A 5.00% 2/1/22 | 500,000 | 558,900 | ||||||
Brainerd Independent School District No. 181 | ||||||||
(School Building) Series A 4.00% 2/1/23 | 5,990,000 | 6,488,368 | ||||||
Farmington Independent School District No 192 | ||||||||
Series A 5.00% 2/1/25 | 3,775,000 | 4,519,657 | ||||||
New Brighton Tax Increment | ||||||||
Series A 5.00% 2/1/27 (NATL-RE) | 1,000,000 | 1,058,130 | ||||||
Sartell - St. Stephen Independent School District No. 748 Capital Appreciation | ||||||||
Series B 6.10% 2/1/16 (NATL-RE)^ | 1,750,000 | 1,746,325 | ||||||
South Washington County Independent School District No. 833 | ||||||||
(School Building) | ||||||||
Series A 4.75% 2/1/25 | 2,500,000 | 2,712,725 | ||||||
Series A 4.75% 2/1/26 | 3,600,000 | 3,897,324 | ||||||
Series A 4.75% 2/1/27 | 2,300,000 | 2,480,228 | ||||||
St. Paul Independent School District No. 625 | ||||||||
(School Building) Series B 5.00% 2/1/23 | 1,660,000 | 2,001,728 | ||||||
28
Table of Contents
| Principal amount° | Value (U.S. $) | |||||||
| ||||||||
Municipal Bonds (continued) | ||||||||
| ||||||||
Local General Obligation Bonds (continued) | ||||||||
Staples United Hospital District Health Care Facilities | ||||||||
(Todd Morrison ETC Hospital-Lakewood) | ||||||||
5.00% 12/1/21 | 2,000,000 | $ | 2,007,580 | |||||
5.125% 12/1/24 | 1,000,000 | 1,003,620 | ||||||
|
| |||||||
| 28,474,585 | ||||||||
|
| |||||||
Pre-Refunded / Escrowed to Maturity Bonds – 18.92% | ||||||||
Dakota-Washington Counties Housing & Redevelopment Authority Single Family Residential Mortgage Revenue | ||||||||
(City of Anoka) 8.45% 9/1/19 (GNMA) (AMT) | 9,000,000 | 11,247,660 | ||||||
(City of Bloomington) | ||||||||
8.15% 9/1/16 (NATL-RE) (IBC) (GNMA) (AMT) | 405,000 | 435,841 | ||||||
Series B 8.375% 9/1/21 (GNMA) (AMT) | 14,115,000 | 19,012,199 | ||||||
Metropolitan Council Waste Water Treatment | ||||||||
Series C 5.00% 3/1/28-16§ | 5,000,000 | 5,117,400 | ||||||
Minneapolis Health Care System Revenue | ||||||||
(Fairview Health Services) Series A 6.375% 11/15/23-18§ | 180,000 | 208,480 | ||||||
Minnesota | ||||||||
Series A 5.00% 10/1/24-21§ | 70,000 | 83,530 | ||||||
Series A 5.00% 10/1/27-21§ | 80,000 | 95,463 | ||||||
(Various Purposes) Series A 4.00% 8/1/27-22§ | 45,000 | 50,978 | ||||||
Southern Minnesota Municipal Power Agency Revenue | ||||||||
Series A 5.75% 1/1/18-17§ | 2,170,000 | 2,230,500 | ||||||
Series A 5.75% 1/1/18-17 (AMBAC) (TCRS)§ | 365,000 | 375,176 | ||||||
Series A 5.75% 1/1/18-17 (NATL-RE) (IBC)§ | 575,000 | 591,031 | ||||||
St. Louis Park Health Care Facilities Revenue | ||||||||
(Park Nicollet Health Services) | ||||||||
5.75% 7/1/39-19§ | 17,550,000 | 20,572,285 | ||||||
Series C 5.50% 7/1/23-18§ | 3,000,000 | 3,388,320 | ||||||
Series C 5.625% 7/1/26-18§ | 1,925,000 | 2,180,890 | ||||||
Series C 5.75% 7/1/30-18§ | 5,035,000 | 5,721,875 | ||||||
St. Paul Housing & Redevelopment Authority Health Care Facilities Revenue | ||||||||
(Health Partners Obligation Group Project) 5.25% 5/15/36-16§ | 7,900,000 | 8,358,832 | ||||||
St. Paul Housing & Redevelopment Authority Hospital Revenue | ||||||||
(Health East Project) 6.00% 11/15/35-15§ | 10,340,000 | 10,457,876 | ||||||
University of Minnesota | ||||||||
Series A 5.50% 7/1/21 | 12,500,000 | 14,753,750 | ||||||
29
Table of Contents
Schedules of investments
Delaware Tax-Free Minnesota Fund
| Principal amount° | Value (U.S. $) | |||||||
| ||||||||
Municipal Bonds (continued) | ||||||||
| ||||||||
Pre-Refunded / Escrowed to Maturity Bonds (continued) | ||||||||
Western Minnesota Municipal Power Agency Revenue | ||||||||
Series A 9.75% 1/1/16 (NATL-RE) | 445,000 | $ | 459,231 | |||||
|
| |||||||
| 105,341,317 | ||||||||
|
| |||||||
Special Tax Revenue Bonds – 3.33% | ||||||||
Hennepin County Sales Tax Revenue | ||||||||
(Second Lien-Ballpark Project) | ||||||||
Series B 5.00% 12/15/19 | 2,100,000 | 2,300,235 | ||||||
Series B 5.00% 12/15/20 | 1,000,000 | 1,095,240 | ||||||
Series B 5.00% 12/15/24 | 1,150,000 | 1,258,054 | ||||||
Minneapolis Development Revenue | ||||||||
(Limited Tax Supported Common Bond Fund) Series 2-A 6.00% 12/1/40 | 3,000,000 | 3,540,270 | ||||||
Minnesota 911 Revenue | ||||||||
(Public Safety Radio Communication System Project) | ||||||||
5.00% 6/1/24 | 2,925,000 | 3,321,718 | ||||||
5.00% 6/1/25 | 2,000,000 | 2,268,120 | ||||||
St. Paul Sales Tax Revenue | ||||||||
Series G 5.00% 11/1/30 | 655,000 | 749,117 | ||||||
Series G 5.00% 11/1/31 | 1,500,000 | 1,707,855 | ||||||
Virgin Islands Public Finance Authority | ||||||||
(Matching Fund Senior Lien) 5.00% 10/1/29 (AGM) | 2,000,000 | 2,282,360 | ||||||
|
| |||||||
| 18,522,969 | ||||||||
|
| |||||||
State General Obligation Bonds – 5.54% | ||||||||
Minnesota | ||||||||
Series A Unrefunded 5.00% 10/1/24 | 4,555,000 | 5,376,130 | ||||||
Series A Unrefunded 5.00% 10/1/27 | 5,200,000 | 6,107,972 | ||||||
(State Trunk Highway) Series B 5.00% 10/1/29 | 5,000,000 | 5,856,650 | ||||||
(Various Purposes) | ||||||||
Series A 5.00% 8/1/30 | 4,200,000 | 4,997,538 | ||||||
Series A 5.00% 8/1/32 | 2,755,000 | 3,249,330 | ||||||
Series A Unrefunded 4.00% 8/1/27 | 955,000 | 1,041,341 | ||||||
Series F 5.00% 10/1/22 | 3,500,000 | 4,216,485 | ||||||
|
| |||||||
| 30,845,446 | ||||||||
|
| |||||||
Transportation Revenue Bonds – 3.59% | ||||||||
Minneapolis-St. Paul Metropolitan Airports Commission Revenue | ||||||||
Senior Series A 5.00% 1/1/28 | 1,250,000 | 1,414,325 | ||||||
Subordinate | ||||||||
Series A 5.00% 1/1/35 | 1,000,000 | 1,120,610 | ||||||
Series B 5.00% 1/1/26 | 575,000 | 661,244 | ||||||
Series B 5.00% 1/1/27 | 1,160,000 | 1,324,476 | ||||||
30
Table of Contents
| Principal amount° | Value (U.S. $) | |||||||
| ||||||||
Municipal Bonds (continued) | ||||||||
| ||||||||
Transportation Revenue Bonds (continued) | ||||||||
Minneapolis-St. Paul Metropolitan Airports Commission Revenue | ||||||||
Subordinate | ||||||||
Series B 5.00% 1/1/28 | 2,750,000 | $ | 3,117,565 | |||||
Series B 5.00% 1/1/29 | 120,000 | 135,220 | ||||||
Series B 5.00% 1/1/30 | 1,675,000 | 1,881,243 | ||||||
Series B 5.00% 1/1/31 | 1,750,000 | 1,962,240 | ||||||
St. Paul Housing & Redevelopment Authority Parking Revenue | ||||||||
(Parking Facilities Project) | ||||||||
Series A 5.00% 8/1/30 | 1,870,000 | 2,071,025 | ||||||
Series A 5.00% 8/1/35 | 1,145,000 | 1,171,816 | ||||||
(Smith Avenue Project) Series B 5.00% 8/1/35 | 1,500,000 | 1,661,250 | ||||||
St. Paul Port Authority Revenue | ||||||||
(Amherst H. Wilder Foundation) Series 3 5.00% 12/1/36 | 3,200,000 | 3,484,256 | ||||||
|
| |||||||
| 20,005,270 | ||||||||
|
| |||||||
Water & Sewer Revenue Bonds – 2.39% | ||||||||
Metropolitan Council Waste Water Treatment Revenue | ||||||||
Series B 4.00% 9/1/27 | 2,400,000 | 2,628,240 | ||||||
Series B 5.00% 9/1/22 | 2,125,000 | 2,557,416 | ||||||
Series B 5.00% 9/1/25 | 2,000,000 | 2,385,780 | ||||||
Series E 5.00% 9/1/22 | 2,745,000 | 3,303,580 | ||||||
Series E 5.00% 9/1/23 | 2,000,000 | 2,395,880 | ||||||
|
| |||||||
| 13,270,896 | ||||||||
|
| |||||||
Total Municipal Bonds (cost $516,487,514) | 550,906,831 | |||||||
|
| |||||||
| Number of shares | ||||||||
| ||||||||
Short-Term Investments – 0.50% | ||||||||
| ||||||||
Money Market Mutual Fund – 0.03% | ||||||||
Federated Minnesota Municipal Cash Trust | 195,527 | 195,527 | ||||||
|
| |||||||
| 195,527 | ||||||||
|
| |||||||
| Principal amount° | ||||||||
Variable Rate Demand Note – 0.47%¤ | ||||||||
Minneapolis-St. Paul Housing & Redevelopment Authority | ||||||||
Health Care Revenue (Allina Health System) Series B-2 | ||||||||
0.01% 11/15/35 (LOC – JPMorgan Chase Bank N.A.) | 2,600,000 | 2,600,000 | ||||||
|
| |||||||
| 2,600,000 | ||||||||
|
| |||||||
Total Short-Term Investments (cost $2,795,527) | 2,795,527 | |||||||
|
| |||||||
Total Value of Securities – 99.45% | ||||||||
(cost $519,283,041) | $ | 553,702,358 | ||||||
|
| |||||||
31
Table of Contents
Schedules of investments
Delaware Tax-Free Minnesota Fund
| # | Security exempt from registration under Rule 144A of the Securities Act of 1933, as amended. At Aug. 31, 2015, the aggregate value of Rule 144A securities was $2,952,641, which represents 0.53% of the Fund’s net assets. See Note 8 in “Notes to financial statements.” |
| ¤ | Tax-exempt obligations that contain a floating or variable interest rate adjustment formula and an unconditional right of demand to receive payment of the unpaid principal balance plus accrued interest upon a short notice period (generally up to 30 days) prior to specified dates either from the issuer or by drawing on a bank letter of credit, a guarantee, or insurance issued with respect to such instrument. The rate shown is the rate as of Aug. 31, 2015. |
| ° | Principal amount shown is stated in U.S. dollars unless noted that the security is denominated in another currency. |
| • | Variable rate security. The rate shown is the rate as of Aug. 31, 2015. Interest rates reset periodically. |
| ^ | Zero coupon security. The rate shown is the yield at the time of purchase. |
| § | Pre-refunded bonds. Municipal bonds that are generally backed or secured by U.S. Treasury bonds. For pre-refunded bonds, the stated maturity is followed by the year in which the bond is pre-refunded. See Note 8 in “Notes to financial statements.” |
Summary of abbreviations:
AGM – Insured by Assured Guaranty Municipal Corporation
AMBAC – Insured by AMBAC Assurance Corporation
AMT – Subject to Alternative Minimum Tax
ASSURED GTY – Insured by Assured Guaranty Corporation
FHLMC – Federal Home Loan Mortgage Corporation collateral
FNMA – Federal National Mortgage Association collateral
GNMA – Government National Mortgage Association collateral
IBC – Insured Bond Certificate
LOC – Letter of Credit
N.A. – North America
NATL-RE – Insured by National Public Finance Guarantee Corporation
TCRS – Temporary Custodial Receipts
See accompanying notes, which are an integral part of the financial statements.
32
Table of Contents
| Schedules of investments | ||
| Delaware Tax-Free Minnesota Intermediate Fund | August 31, 2015 |
| Principal amount° | Value (U.S. $) | |||||||
| ||||||||
Municipal Bonds – 99.68% | ||||||||
| ||||||||
Corporate-Backed Revenue Bonds – 3.40% | ||||||||
Cloquet Pollution Control Revenue | ||||||||
(Potlatch Project) 5.90% 10/1/26 | 1,695,000 | $ | 1,696,627 | |||||
Laurentian Energy Authority Cogeneration Revenue | ||||||||
Series A 5.00% 12/1/21 | 750,000 | 745,177 | ||||||
St. Paul Port Authority Solid Waste Disposal Revenue | ||||||||
(Gerdau St. Paul Steel Mill Project) Series 7 4.50% 10/1/37 (AMT) | 1,025,000 | 982,965 | ||||||
|
| |||||||
| 3,424,769 | ||||||||
|
| |||||||
Education Revenue Bonds – 15.51% | ||||||||
Brooklyn Park Charter School Lease | ||||||||
(Prairie Seeds Academy Project) Series A 5.00% 3/1/34 | 485,000 | 486,455 | ||||||
Cologne Charter School Lease Revenue | ||||||||
(Cologne Academy Project) Series A 5.00% 7/1/29 | 305,000 | 323,843 | ||||||
Forest Lake Charter School Revenue Fund | ||||||||
(Forest Lake International Language Academy) Series A 5.50% 8/1/36 | 420,000 | 457,687 | ||||||
Hugo Charter School Lease Revenue | ||||||||
(Noble Academy Project) Series A 5.00% 7/1/29 | 530,000 | 571,276 | ||||||
Minneapolis Student Housing Revenue | ||||||||
(Riverton Community Housing Project) 5.25% 8/1/39 | 525,000 | 532,067 | ||||||
Minnesota Colleges & Universities Revenue Fund | ||||||||
Series A 5.00% 10/1/28 | 1,000,000 | 1,106,550 | ||||||
Minnesota Higher Education Facilities Authority Revenue | ||||||||
(Carleton College) Series 6-T 4.75% 1/1/23 | 1,000,000 | 1,083,600 | ||||||
(Hamline University) Series 7-E 5.00% 10/1/29 | 250,000 | 268,885 | ||||||
(Macalester College) Series 6-P 4.25% 3/1/27 | 750,000 | 766,793 | ||||||
(St. Catherine University) Series 7-Q 5.00% 10/1/22 | 425,000 | 484,249 | ||||||
(St. Johns University) | ||||||||
Series 6-U 4.40% 10/1/21 | 325,000 | 353,749 | ||||||
Series 6-U 4.50% 10/1/23 | 265,000 | 289,004 | ||||||
(St. Olaf College) | ||||||||
Series 8-G 5.00% 12/1/31 | 125,000 | 144,406 | ||||||
Series 8-G 5.00% 12/1/32 | 125,000 | 143,816 | ||||||
(St. Scholastica College) Series H 5.125% 12/1/30 | 1,000,000 | 1,071,360 | ||||||
(University of St. Thomas) | ||||||||
Series 6-X 5.00% 4/1/24 | 1,000,000 | 1,064,910 | ||||||
Series 7-U 4.00% 4/1/26 | 1,400,000 | 1,517,054 | ||||||
Otsego Charter School Lease Revenue | ||||||||
(Kaleidoscope Charter School) Series A 4.15% 9/1/24 | 600,000 | 610,974 | ||||||
Rice County Educational Facilities Revenue | ||||||||
(Shattuck-St. Mary’s School) Series A 144A 5.00% 8/1/22 # | 525,000 | 542,955 | ||||||
33
Table of Contents
Schedules of investments
Delaware Tax-Free Minnesota Intermediate Fund
| Principal amount° | Value (U.S. $) | |||||||
| ||||||||
Municipal Bonds (continued) | ||||||||
| ||||||||
Education Revenue Bonds (continued) | ||||||||
St. Paul Housing & Redevelopment Authority Charter School Lease Revenue | ||||||||
(Academia Cesar Chavez School Project) Series A 5.25% 7/1/50 | 370,000 | $ | 345,410 | |||||
(Twin Cities Academy Project) Series A 5.30% 7/1/45 | 260,000 | 260,413 | ||||||
University of Minnesota | ||||||||
Series A 5.00% 12/1/23 | 1,000,000 | 1,168,550 | ||||||
Series A 5.25% 12/1/28 | 750,000 | 878,767 | ||||||
Series D 5.00% 12/1/26 | 1,000,000 | 1,162,370 | ||||||
|
| |||||||
| 15,635,143 | ||||||||
|
| |||||||
Electric Revenue Bonds – 8.15% | ||||||||
Central Minnesota Municipal Power Agency | ||||||||
(Brookings Twin Cities Transmission Project) | ||||||||
Series E 5.00% 1/1/21 | 1,095,000 | 1,254,399 | ||||||
Series E 5.00% 1/1/23 | 1,000,000 | 1,141,160 | ||||||
Chaska Electric Revenue | ||||||||
(Generating Facilities) Series A 5.25% 10/1/25 | 1,100,000 | 1,104,620 | ||||||
Minnesota Municipal Power Agency Electric Revenue | ||||||||
Series A 5.00% 10/1/29 | 500,000 | 578,550 | ||||||
Series A 5.00% 10/1/30 | 240,000 | 276,058 | ||||||
Northern Municipal Power Agency Electric System Revenue | ||||||||
Series A 5.00% 1/1/17 (ASSURED GTY) | 1,000,000 | 1,059,030 | ||||||
Series A 5.00% 1/1/25 | 200,000 | 233,014 | ||||||
Western Minnesota Municipal Power Agency Revenue | ||||||||
Series A 5.00% 1/1/33 | 2,250,000 | 2,570,625 | ||||||
|
| |||||||
| 8,217,456 | ||||||||
|
| |||||||
Healthcare Revenue Bonds – 33.49% | ||||||||
Anoka Healthcare & Housing Facilities Revenue | ||||||||
(Homestead Anoka Project) 5.375% 11/1/34 | 270,000 | 281,029 | ||||||
Anoka Housing Facilities Revenue | ||||||||
(Senior Homestead Anoka Project) Series B 6.875% 11/1/34 | 750,000 | 806,003 | ||||||
Center City Health Care Facilities Revenue | ||||||||
(Hazelden Betty Ford Foundation Project) | ||||||||
5.00% 11/1/24 | 1,175,000 | 1,391,870 | ||||||
5.00% 11/1/25 | 250,000 | 293,887 | ||||||
Deephaven Housing & Healthcare Revenue | ||||||||
(St. Therese Senior Living Project) | ||||||||
Series A 5.00% 4/1/38 | 135,000 | 136,438 | ||||||
Series A 5.00% 4/1/40 | 125,000 | 126,173 | ||||||
34
Table of Contents
| Principal amount° | Value (U.S. $) | |||||||
| ||||||||
Municipal Bonds (continued) | ||||||||
| ||||||||
Healthcare Revenue Bonds (continued) | ||||||||
Duluth Economic Development Authority | ||||||||
(St. Luke’s Hospital Authority Obligation Group) 5.75% 6/15/32 | 750,000 | $ | 826,140 | |||||
Fergus Falls Health Care Facilities Revenue | ||||||||
(Lake Region Health Care) 4.75% 8/1/25 | 500,000 | 510,925 | ||||||
Glencoe Health Care Facilities Revenue | ||||||||
(Glencoe Regional Health Services Project) 4.00% 4/1/26 | 270,000 | 278,918 | ||||||
Hayward Health Care Facilities Revenue | ||||||||
(American Baptist Homes Midwest Obligated Group) 4.25% 8/1/24 | 770,000 | 787,487 | ||||||
(St. John’s Lutheran Home of Albert Lea) 5.375% 10/1/44 | 300,000 | 301,215 | ||||||
Maple Grove Health Care Facilities Revenue | ||||||||
(North Memorial Health Care) 5.00% 9/1/31 | 320,000 | 356,064 | ||||||
Minneapolis Health Care System Revenue | ||||||||
(Fairview Health Services) | ||||||||
Series A 5.00% 11/15/33 | 500,000 | 562,730 | ||||||
Series A 5.00% 11/15/34 | 500,000 | 559,545 | ||||||
Series A 6.625% 11/15/28 | 1,500,000 | 1,749,060 | ||||||
Series B 6.50% 11/15/38 (ASSURED GTY) | 1,730,000 | 1,973,757 | ||||||
Minneapolis National Marrow Donor Program Revenue 5.00% 8/1/17 | 1,205,000 | 1,270,709 | ||||||
Minneapolis Senior Housing & Healthcare Revenue | ||||||||
(Ecumen Mill City Quarter) 5.00% 11/1/35 | 530,000 | 530,631 | ||||||
Minneapolis-St. Paul Housing & Redevelopment Authority Health Care Revenue | ||||||||
(Children’s Hospital) Series A 5.25% 8/15/25 | 1,000,000 | 1,139,610 | ||||||
Minnesota Agricultural & Economic Development Board Revenue | ||||||||
(Essentia Remarketing) Series C-1 5.50% 2/15/25 (ASSURED GTY) | 2,500,000 | 2,842,450 | ||||||
Moorhead Economic Development Authority Multifamily Housing Revenue | ||||||||
(Eventide Lutheran Home Project) 4.70% 6/1/18 | 475,000 | 475,679 | ||||||
Rochester Health Care & Housing Revenue | ||||||||
(Samaritan Bethany) Series A 6.875% 12/1/29 | 950,000 | 1,051,593 | ||||||
Rochester Health Care Facilities Revenue | ||||||||
(Mayo Clinic) | ||||||||
Series A 4.00% 11/15/30 ● | 500,000 | 545,790 | ||||||
Series C 4.50% 11/15/38 ● | 1,000,000 | 1,150,170 | ||||||
(Olmsted Medical Center Project) 5.125% 7/1/20 | 1,000,000 | 1,123,870 | ||||||
35
Table of Contents
Schedules of investments
Delaware Tax-Free Minnesota Intermediate Fund
| Principal amount° | Value (U.S. $) | |||||||
| ||||||||
Municipal Bonds (continued) | ||||||||
| ||||||||
Healthcare Revenue Bonds (continued) | ||||||||
Sartell Health Care Facilities Revenue | ||||||||
(Country Manor Campus Project) | ||||||||
Series A 5.00% 9/1/21 | 1,050,000 | $ | 1,136,940 | |||||
Series A 6.125% 9/1/30 | 845,000 | 862,973 | ||||||
Sauk Rapids Health Care Housing Facilities Revenue | ||||||||
(Good Shepherd Lutheran Home) 5.125% 1/1/39 | 575,000 | 580,238 | ||||||
St. Cloud Health Care Revenue | ||||||||
(Centracare Health System Project) | ||||||||
Series A 5.00% 5/1/16 | 500,000 | 515,095 | ||||||
Series A 5.125% 5/1/30 | 3,320,000 | 3,662,989 | ||||||
St. Paul Housing & Redevelopment Authority Health Care Facilities Revenue | ||||||||
(Allina Health System) Series A-2 5.25% 11/15/28 | 2,000,000 | 2,245,240 | ||||||
(Gillette Children’s Specialty Project) 5.00% 2/1/27 | 1,000,000 | 1,082,730 | ||||||
(Health Partners Obligation Group Project) 5.00% 7/1/33 | 200,000 | 225,390 | ||||||
St. Paul Housing & Redevelopment Authority Hospital Facility | ||||||||
(Healtheast Care System Project) | ||||||||
Series A 5.00% 11/15/29 | 165,000 | 179,498 | ||||||
Series A 5.00% 11/15/30 | 120,000 | 130,124 | ||||||
St. Paul Housing & Redevelopment Authority Housing & Health Care Facilities Revenue | ||||||||
(Senior Carondelet Village Project) Series A 6.25% 8/1/30 | 1,000,000 | 1,047,100 | ||||||
(Senior Episcopal Homes Project) 5.00% 5/1/33 | 500,000 | 516,030 | ||||||
Woodbury Housing & Redevelopment Authority Revenue | ||||||||
(St. Therese of Woodbury) 5.00% 12/1/34 | 500,000 | 505,870 | ||||||
|
| |||||||
| 33,761,960 | ||||||||
|
| |||||||
Housing Revenue Bonds – 0.56% | ||||||||
Minnesota Housing Finance Agency | ||||||||
(Residential Housing) Series I 5.10% 7/1/20 (AMT) | 330,000 | 330,680 | ||||||
Northwest Multi-County Housing & Redevelopment Authority | ||||||||
(Pooled Housing Program) 5.50% 7/1/45 | 235,000 | 230,756 | ||||||
|
| |||||||
| 561,436 | ||||||||
|
| |||||||
Lease Revenue Bonds – 5.47% | ||||||||
Minnesota General Fund Revenue Appropriations | ||||||||
Series A 5.00% 6/1/38 | 1,100,000 | 1,242,142 | ||||||
Series A 5.00% 6/1/43 | 715,000 | 796,968 | ||||||
Series B 5.00% 3/1/21 | 250,000 | 293,803 | ||||||
Series B 5.00% 3/1/27 | 1,000,000 | 1,167,640 | ||||||
36
Table of Contents
| Principal amount° | Value (U.S. $) | |||||||
| ||||||||
Municipal Bonds (continued) | ||||||||
| ||||||||
Lease Revenue Bonds (continued) | ||||||||
St. Paul Housing & Redevelopment Authority | ||||||||
(Minnesota Public Radio) 5.00% 12/1/25 | 1,000,000 | $ | 1,132,460 | |||||
Virginia Housing & Redevelopment Authority Health Care Facility Lease Revenue | ||||||||
5.25% 10/1/25 | 880,000 | 881,531 | ||||||
|
| |||||||
| 5,514,544 | ||||||||
|
| |||||||
Local General Obligation Bonds – 9.33% | ||||||||
Anoka County Capital Improvement | ||||||||
Series C 5.00% 2/1/27 | 500,000 | 543,760 | ||||||
Anoka-Hennepin Independent School District No. 11 | ||||||||
(School Building) Series A 5.00% 2/1/17 | 1,000,000 | 1,063,460 | ||||||
Hennepin County | ||||||||
Series B 4.00% 12/1/20 | 500,000 | 565,455 | ||||||
Mankato Independent School District No. 77 | ||||||||
(School Building) 4.125% 2/1/22 | 1,000,000 | 1,073,710 | ||||||
Metropolitan Council Waste Water Treatment | ||||||||
Series C 5.00% 3/1/16 | 560,000 | 573,597 | ||||||
Minneapolis Various Purposes | ||||||||
4.00% 12/1/23 | 1,500,000 | 1,565,715 | ||||||
Robbinsdale Independent School District No. 281 | ||||||||
(School Building) Series A 5.00% 2/1/20 | 1,850,000 | 2,125,039 | ||||||
South Washington County Independent School District No. 833 (School Building) | ||||||||
Series A 4.00% 2/1/22 | 750,000 | 787,260 | ||||||
White Bear Lake Independent School District No. 624 | ||||||||
(Alternative Facilities) Series B 4.75% 2/1/22 | 1,000,000 | 1,102,140 | ||||||
|
| |||||||
| 9,400,136 | ||||||||
|
| |||||||
Pre-Refunded / Escrowed to Maturity Bonds – 9.85% | ||||||||
Duluth Independent School District No. 709 | ||||||||
Series A 4.25% 2/1/20-18 (AGM)§ | 1,710,000 | 1,849,895 | ||||||
Metropolitan Council Waste Water Treatment | ||||||||
Series C 5.00% 3/1/28-16§ | 1,000,000 | 1,023,480 | ||||||
St. Louis Park Health Care Facilities Revenue | ||||||||
(Park Nicollet Health Services) | ||||||||
5.50% 7/1/29-19§ | 1,000,000 | 1,162,860 | ||||||
Series C 5.625% 7/1/26-18§ | 2,500,000 | 2,832,325 | ||||||
University of Minnesota | ||||||||
Series A 5.75% 7/1/16 | 1,000,000 | 1,045,620 | ||||||
Series A 5.75% 7/1/18 | 400,000 | 454,812 | ||||||
University of Minnesota Special Purpose Revenue | ||||||||
(State Supported Stadium Debt) 5.00% 8/1/18-16§ | 1,500,000 | 1,564,650 | ||||||
|
| |||||||
| 9,933,642 | ||||||||
|
| |||||||
37
Table of Contents
Schedules of investments
Delaware Tax-Free Minnesota Intermediate Fund
| Principal amount° | Value (U.S. $) | |||||||
| ||||||||
Municipal Bonds (continued) | ||||||||
| ||||||||
Special Tax Revenue Bonds – 3.23% | ||||||||
Minneapolis Tax Increment Revenue | ||||||||
(Ivy Tower Project) 5.50% 2/1/22 @ | 415,000 | $ | 412,344 | |||||
Minnesota 911 Revenue | ||||||||
(Public Safety Radio Communication System Project) | ||||||||
4.25% 6/1/18 (ASSURED GTY) | 1,170,000 | 1,275,651 | ||||||
4.50% 6/1/25 (ASSURED GTY) | 1,000,000 | 1,102,310 | ||||||
St. Paul Sales Tax Revenue | ||||||||
Series G 5.00% 11/1/28 | 400,000 | 462,580 | ||||||
|
| |||||||
| 3,252,885 | ||||||||
|
| |||||||
State General Obligation Bonds – 4.12% | ||||||||
Minnesota | ||||||||
(State Trunk Highway) Series B 5.00% 10/1/22 | 400,000 | 481,748 | ||||||
(Various Purposes) | ||||||||
Series A 5.00% 12/1/21 | 1,000,000 | 1,146,230 | ||||||
Series A 5.00% 8/1/32 | 1,120,000 | 1,320,962 | ||||||
Series F 5.00% 10/1/22 | 1,000,000 | 1,204,710 | ||||||
|
| |||||||
| 4,153,650 | ||||||||
|
| |||||||
Transportation Revenue Bonds – 5.17% | ||||||||
Minneapolis-St. Paul Metropolitan Airports Commission Revenue | ||||||||
Senior Series A 5.00% 1/1/22 (AMBAC) | 1,260,000 | 1,332,979 | ||||||
Subordinate | ||||||||
Series B 5.00% 1/1/22 (AMT) | 1,000,000 | 1,113,360 | ||||||
Series B 5.00% 1/1/26 | 710,000 | 816,493 | ||||||
Series B 5.00% 1/1/31 | 750,000 | 840,960 | ||||||
Series D 5.00% 1/1/22 (AMT) | 1,000,000 | 1,109,850 | ||||||
|
| |||||||
| 5,213,642 | ||||||||
|
| |||||||
Water & Sewer Revenue Bond – 1.40% | ||||||||
St. Paul Sewer Revenue | ||||||||
Series D 5.00% 12/1/20 | 1,275,000 | 1,411,489 | ||||||
|
| |||||||
| 1,411,489 | ||||||||
|
| |||||||
Total Municipal Bonds (cost $95,444,987) | 100,480,752 | |||||||
|
| |||||||
38
Table of Contents
| Number of shares | Value (U.S. $) | |||||||
| ||||||||
Short-Term Investments – 0.80% | ||||||||
| ||||||||
Money Market Mutual Fund – 0.18% | ||||||||
Federated Minnesota Municipal Cash Trust | 181,256 | $ | 181,256 | |||||
|
| |||||||
| 181,256 | ||||||||
|
| |||||||
| Principal amount° | ||||||||
Variable Rate Demand Notes – 0.62%¤ | ||||||||
Minneapolis-St. Paul Housing & Redevelopment Authority | ||||||||
Health Care Facilities (Children’s Health Care) | ||||||||
0.01% 8/15/25 (AGM) (SPA – U.S. Bank N.A.) | 275,000 | 275,000 | ||||||
Minneapolis-St. Paul Housing & Redevelopment Authority | ||||||||
Health Care Revenue (Allina Health System) Series B-1 | ||||||||
0.01% 11/15/35 (LOC – JPMorgan Chase Bank N.A.) | 350,000 | 350,000 | ||||||
|
| |||||||
| 625,000 | ||||||||
|
| |||||||
Total Short-Term Investments (cost $806,256) | 806,256 | |||||||
|
| |||||||
Total Value of Securities – 100.48% | ||||||||
(cost $96,251,243) | $ | 101,287,008 | ||||||
|
| |||||||
| # | Security exempt from registration under Rule 144A of the Securities Act of 1933, as amended. At Aug. 31, 2015, the aggregate value of Rule 144A securities was $542,955, which represents 0.54% of the Fund’s net assets. See Note 8 in “Notes to financial statements.” |
| @ | Illiquid security. At Aug. 31, 2015, the aggregate value of illiquid securities was $412,344, which represents 0.41% of the Fund’s net assets. See Note 8 in “Notes to financial statements.” |
| ¤ | Tax-exempt obligations that contain a floating or variable interest rate adjustment formula and an unconditional right of demand to receive payment of the unpaid principal balance plus accrued interest upon a short notice period (generally up to 30 days) prior to specified dates either from the issuer or by drawing on a bank letter of credit, a guarantee, or insurance issued with respect to such instrument. The rate shown is the rate as of Aug. 31, 2015. |
| ° | Principal amount shown is stated in U.S. dollars unless noted that the security is denominated in another currency. |
| ● | Variable rate security. The rate shown is the rate as of Aug. 31, 2015. Interest rates reset periodically. |
| § | Pre-refunded bonds. Municipal bonds that are generally backed or secured by U.S. Treasury bonds. For pre-refunded bonds, the stated maturity is followed by the year in which the bond is pre-refunded. See Note 8 in “Notes to financial statements.” |
39
Table of Contents
Schedules of investments
Delaware Tax-Free Minnesota Intermediate Fund
Summary of abbreviations:
AGM – Insured by Assured Guaranty Municipal Corporation
AMBAC – Insured by AMBAC Assurance Corporation
AMT – Subject to Alternative Minimum Tax
ASSURED GTY – Insured by Assured Guaranty Corporation
LOC – Letter of Credit
N.A. – North America
SPA – Stand-by Purchase Agreement
See accompanying notes, which are an integral part of the financial statements.
40
Table of Contents
| Schedules of investments | ||
| Delaware Minnesota High-Yield Municipal Bond Fund | August 31, 2015 |
| Principal amount° | Value (U.S. $) | |||||||
| ||||||||
Municipal Bonds – 99.66% | ||||||||
| ||||||||
Corporate-Backed Revenue Bonds – 3.78% | ||||||||
Cloquet Pollution Control Revenue | ||||||||
(Potlatch Project) 5.90% 10/1/26 | 2,700,000 | $ | 2,702,592 | |||||
Laurentian Energy Authority I Cogeneration Revenue | ||||||||
Series A 5.00% 12/1/21 | 1,750,000 | 1,738,747 | ||||||
St. Paul Port Authority Solid Waste Disposal Revenue | ||||||||
(Gerdau St. Paul Steel Mill Project) Series 7 4.50% 10/1/37 (AMT) | 2,055,000 | 1,970,724 | ||||||
|
| |||||||
| 6,412,063 | ||||||||
|
| |||||||
Education Revenue Bonds – 16.00% | ||||||||
Baytown Township Lease Revenue | ||||||||
(St. Croix Preparatory Academy) Series A 7.00% 8/1/38 | 500,000 | 518,675 | ||||||
Brooklyn Park Charter School Lease | ||||||||
(Prairie Seeds Academy Project) Series A 5.00% 3/1/39 | 1,270,000 | 1,249,312 | ||||||
Cologne Charter School Lease Revenue | ||||||||
(Cologne Academy Project) | ||||||||
Series A 5.00% 7/1/34 | 250,000 | 261,303 | ||||||
Series A 5.00% 7/1/45 | 230,000 | 236,493 | ||||||
Deephaven Charter School Lease Revenue | ||||||||
(Eagle Ridge Academy Project) Series A 5.50% 7/1/43 | 500,000 | 532,210 | ||||||
Duluth Housing & Redevelopment Authority Revenue | ||||||||
(Public School Academy) Series A 5.875% 11/1/40 | 1,000,000 | 1,060,970 | ||||||
Forest Lake Charter School Revenue Fund | ||||||||
(Forest Lake International Language Academy) Series A 5.75% 8/1/44 | 455,000 | 496,269 | ||||||
Hugo Charter School Lease Revenue | ||||||||
(Noble Academy Project) | ||||||||
Series A 5.00% 7/1/34 | 165,000 | 174,943 | ||||||
Series A 5.00% 7/1/44 | 495,000 | 518,121 | ||||||
Minneapolis Student Housing Revenue | ||||||||
(Riverton Community Housing Project) 5.25% 8/1/39 | 800,000 | 810,768 | ||||||
Minnesota Higher Education Facilities Authority Revenue | ||||||||
(Bethel University) Series 6-R 5.50% 5/1/37 | 1,500,000 | 1,536,570 | ||||||
(Carleton College) Series 7-D 5.00% 3/1/40 | 1,055,000 | 1,164,625 | ||||||
(Macalester College) Series 6-P 4.25% 3/1/32 | 1,000,000 | 1,013,790 | ||||||
(Minneapolis College of Art & Design) | ||||||||
4.00% 5/1/24 | 250,000 | 264,077 | ||||||
4.00% 5/1/25 | 200,000 | 208,448 | ||||||
4.00% 5/1/26 | 100,000 | 103,243 | ||||||
(St. Catherine University) | ||||||||
Series 7-Q 5.00% 10/1/25 | 325,000 | 362,515 | ||||||
Series 7-Q 5.00% 10/1/26 | 280,000 | 308,725 | ||||||
(St. John’s University) Series 6-U 4.75% 10/1/33 | 825,000 | 893,079 | ||||||
41
Table of Contents
Schedules of investments
Delaware Minnesota High-Yield Municipal Bond Fund
| Principal amount° | Value (U.S. $) | |||||||
| ||||||||
Municipal Bonds (continued) | ||||||||
| ||||||||
Education Revenue Bonds (continued) | ||||||||
Minnesota Higher Education Facilities Authority Revenue | ||||||||
(St. Olaf College) | ||||||||
Series 6-O 4.50% 10/1/32 | 75,000 | $ | 77,299 | |||||
Series 6-O 5.00% 10/1/22 | 340,000 | 357,054 | ||||||
Series 8-G 5.00% 12/1/31 | 205,000 | 236,826 | ||||||
Series 8-G 5.00% 12/1/32 | 205,000 | 235,859 | ||||||
(St. Scholastica College) Series H 5.125% 12/1/40 | 750,000 | 804,443 | ||||||
(University of St. Thomas) | ||||||||
Series 6-I 5.00% 4/1/23 | 1,500,000 | 1,540,530 | ||||||
Series 7-A 5.00% 10/1/39 | 1,000,000 | 1,111,450 | ||||||
Otsego Charter School Lease Revenue | ||||||||
(Kaleidoscope Charter School) Series A 5.00% 9/1/44 | 1,475,000 | 1,493,128 | ||||||
Rice County Educational Facilities Revenue | ||||||||
(Shattuck-St. Mary’s School) Series A 144A 5.00% 8/1/22 # | 870,000 | 899,754 | ||||||
St. Paul Housing & Redevelopment Authority Charter School Lease Revenue | ||||||||
(Academia Cesar Chavez School Project) Series A 5.25% 7/1/50 | 1,750,000 | 1,633,695 | ||||||
(Nova Classical Academy) Series A 6.625% 9/1/42 | 1,500,000 | 1,693,920 | ||||||
(Twin Cities Academy Project) Series A 5.375% 7/1/50 | 1,500,000 | 1,505,565 | ||||||
St. Paul Housing & Redevelopment Authority Lease Revenue | ||||||||
(St. Paul Conservatory for Performing Artists) Series A 4.625% 3/1/43 | 975,000 | 965,260 | ||||||
University of Minnesota | ||||||||
Series A 5.125% 4/1/34 | 1,000,000 | 1,120,610 | ||||||
Series A 5.25% 12/1/28 | 1,500,000 | 1,757,535 | ||||||
|
| |||||||
| 27,147,064 | ||||||||
|
| |||||||
Electric Revenue Bonds – 6.62% | ||||||||
Central Minnesota Municipal Power Agency | ||||||||
(Brookings Twin Cities Transmission Project) 5.00% 1/1/42 | 1,500,000 | 1,633,860 | ||||||
Chaska Electric Revenue | ||||||||
(Generating Facilities) Series A 5.25% 10/1/25 | 1,000,000 | 1,004,200 | ||||||
Hutchinson Utilities Commission Revenue | ||||||||
Series A 5.00% 12/1/22 | 490,000 | 573,726 | ||||||
Series A 5.00% 12/1/26 | 360,000 | 412,834 | ||||||
Minnesota Municipal Power Agency Electric Revenue | ||||||||
5.00% 10/1/27 | 165,000 | 193,246 | ||||||
Series A 5.00% 10/1/28 | 500,000 | 581,680 | ||||||
42
Table of Contents
| Principal amount° | Value (U.S. $) | |||||||
| ||||||||
Municipal Bonds (continued) | ||||||||
| ||||||||
Electric Revenue Bonds (continued) | ||||||||
Northern Municipal Power Agency Electric System Revenue | ||||||||
Series A 5.00% 1/1/18 (ASSURED GTY) | 1,000,000 | $ | 1,094,200 | |||||
Series A 5.00% 1/1/24 | 335,000 | 393,977 | ||||||
Western Minnesota Municipal Power Agency Revenue | ||||||||
Series A 5.00% 1/1/30 | 500,000 | 578,015 | ||||||
Series A 5.00% 1/1/33 | 1,750,000 | 1,999,375 | ||||||
Series A 5.00% 1/1/34 | 450,000 | 512,347 | ||||||
Series A 5.00% 1/1/40 | 2,000,000 | 2,247,420 | ||||||
|
| |||||||
| 11,224,880 | ||||||||
|
| |||||||
Healthcare Revenue Bonds – 37.02% | ||||||||
Aitkin Health Care Facilities Revenue | ||||||||
(Riverwood Health Care Center) 5.50% 2/1/24 | 700,000 | 705,194 | ||||||
Anoka Health Care Facilities Revenue | ||||||||
(Homestead Anoka Project) Series A 7.00% 11/1/46 | 1,650,000 | 1,766,424 | ||||||
Anoka Healthcare & Housing Facilities Revenue | ||||||||
(Homestead Anoka Project) 5.125% 11/1/49 | 400,000 | 403,552 | ||||||
Anoka Housing & Redevelopment Authority Revenue | ||||||||
(Fridley Medical Center Project) Series A 6.875% 5/1/40 | 1,000,000 | 1,073,230 | ||||||
Apple Valley Economic Development Authority Health Care Revenue | ||||||||
(Augustana Home St. Paul Project) Series A 5.80% 1/1/30 | 1,000,000 | 1,003,390 | ||||||
Breckenridge Catholic Health Initiatives | ||||||||
Series A 5.00% 5/1/30 | 2,000,000 | 2,007,180 | ||||||
Cloquet Housing Facilities | ||||||||
(HADC Cloquet Project) Series A 5.00% 8/1/48 | 850,000 | 847,323 | ||||||
Deephaven Housing & Healthcare Revenue | ||||||||
(St. Therese Senior Living Project) | ||||||||
Series A 5.00% 4/1/38 | 200,000 | 202,130 | ||||||
Series A 5.00% 4/1/40 | 190,000 | 191,782 | ||||||
Series A 5.00% 4/1/48 | 185,000 | 185,505 | ||||||
Duluth Economic Development Authority | ||||||||
(St. Luke’s Hospital Authority Obligation Group) | ||||||||
5.75% 6/15/32 | 750,000 | 826,140 | ||||||
6.00% 6/15/39 | 1,000,000 | 1,106,540 | ||||||
Glencoe Health Care Facilities Revenue | ||||||||
(Glencoe Regional Health Services Project) 4.00% 4/1/31 | 185,000 | 188,265 | ||||||
Hayward Health Care Facilities Revenue | ||||||||
(American Baptist Homes Midwest Obligated Group) 5.375% 8/1/34 | 750,000 | 774,495 | ||||||
43
Table of Contents
Schedules of investments
Delaware Minnesota High-Yield Municipal Bond Fund
| Principal amount° | Value (U.S. $) | |||||||
| ||||||||
Municipal Bonds (continued) | ||||||||
| ||||||||
Healthcare Revenue Bonds (continued) | ||||||||
Hayward Health Care Facilities Revenue | ||||||||
(St. John’s Lutheran Home of Albert Lea) 5.375% 10/1/44 | 450,000 | $ | 451,823 | |||||
Mahtomedi Senior Housing Revenue | ||||||||
(St. Andrew’s Village Project) 5.75% 12/1/40 | 1,000,000 | 1,011,390 | ||||||
Maple Grove Health Care Facilities Revenue | ||||||||
(North Memorial Health Care) 5.00% 9/1/30 | 610,000 | 683,639 | ||||||
Maple Grove Health Care System Revenue | ||||||||
(Maple Grove Hospital) | ||||||||
5.25% 5/1/28 | 2,200,000 | 2,308,416 | ||||||
5.25% 5/1/37 | 1,000,000 | 1,043,750 | ||||||
Minneapolis Health Care System Revenue | ||||||||
(Fairview Health Services) | ||||||||
Series A 5.00% 11/15/33 | 500,000 | 562,730 | ||||||
Series A 5.00% 11/15/34 | 500,000 | 559,545 | ||||||
Series A 5.00% 11/15/44 | 1,000,000 | 1,101,120 | ||||||
Series B 6.50% 11/15/38 (ASSURED GTY) | 250,000 | 285,225 | ||||||
Series D 5.00% 11/15/34 (AMBAC) | 3,000,000 | 3,013,980 | ||||||
Minneapolis Senior Housing & Healthcare Revenue | ||||||||
(Ecumen Mill City Quarter) 5.375% 11/1/50 | 1,700,000 | 1,703,043 | ||||||
Minnesota Agricultural & Economic Development Board Revenue | ||||||||
(Benedictine Health Systems) 5.75% 2/1/29 | 1,000,000 | 1,001,040 | ||||||
Moorhead Economic Development Authority Multifamily Housing Revenue | ||||||||
(Eventide Lutheran Home Project) Series A 5.15% 6/1/29 | 550,000 | 550,330 | ||||||
Northfield Hospital & Skilled Nursing Revenue | ||||||||
5.375% 11/1/31 | 1,000,000 | 1,037,520 | ||||||
Oak Park Heights Housing Revenue | ||||||||
(Oakgreen Commons Project) 7.00% 8/1/45 | 1,500,000 | 1,641,555 | ||||||
Oakdale Senior Housing | ||||||||
(Oak Meadows Project) 5.00% 4/1/34 | 500,000 | 514,940 | ||||||
Rochester Health Care & Housing Revenue | ||||||||
(Samaritan Bethany) | ||||||||
Series A 6.875% 12/1/29 | 1,000,000 | 1,106,940 | ||||||
Series A 7.375% 12/1/41 | 375,000 | 417,551 | ||||||
(The Homestead at Rochester Project) | ||||||||
Series A 5.25% 12/1/23 | 175,000 | 188,193 | ||||||
Series A 6.875% 12/1/48 | 800,000 | 898,024 | ||||||
Rochester Health Care Facilities Revenue | ||||||||
(Mayo Clinic) 4.00% 11/15/41 | 1,790,000 | 1,838,688 | ||||||
44
Table of Contents
| Principal amount° | Value (U.S. $) | |||||||
| ||||||||
Municipal Bonds (continued) | ||||||||
| ||||||||
Healthcare Revenue Bonds (continued) | ||||||||
Rochester Health Care Facilities Revenue | ||||||||
(Olmsted Medical Center Project) | ||||||||
5.00% 7/1/22 | 350,000 | $ | 404,883 | |||||
5.00% 7/1/27 | 245,000 | 280,537 | ||||||
5.00% 7/1/28 | 225,000 | 256,199 | ||||||
Sartell Health Care Facilities Revenue | ||||||||
(Country Manor Campus Project) | ||||||||
Series A 5.25% 9/1/22 | 1,080,000 | 1,184,501 | ||||||
Series A 6.25% 9/1/36 | 925,000 | 944,906 | ||||||
Sauk Rapids Health Care Housing Facilities Revenue | ||||||||
(Good Shepherd Lutheran Home) 5.125% 1/1/39 | 825,000 | 832,516 | ||||||
Shakopee Health Care Facilities Revenue | ||||||||
(St. Francis Regional Medical Center) | ||||||||
4.00% 9/1/31 | 130,000 | 133,815 | ||||||
5.00% 9/1/34 | 105,000 | 116,599 | ||||||
St. Cloud Health Care Revenue | ||||||||
(Centracare Health System Project) | ||||||||
5.50% 5/1/39 (ASSURED GTY) | 1,500,000 | 1,637,955 | ||||||
Series A 5.125% 5/1/30 | 3,125,000 | 3,447,844 | ||||||
Series B 5.00% 5/1/23 | 2,000,000 | 2,362,920 | ||||||
St. Paul Housing & Redevelopment Authority Health Care Facilities Revenue | ||||||||
(Allina Health System) Series A 5.00% 11/15/18 (NATL-RE) | 1,650,000 | 1,802,213 | ||||||
(Health Partners Obligation Group Project) | ||||||||
5.00% 7/1/32 | 400,000 | 452,204 | ||||||
5.00% 7/1/33 | 1,540,000 | 1,735,503 | ||||||
St. Paul Housing & Redevelopment Authority Hospital Facility | ||||||||
(Healtheast Care System Project) | ||||||||
Series A 5.00% 11/15/29 | 275,000 | 299,164 | ||||||
Series A 5.00% 11/15/30 | 205,000 | 222,296 | ||||||
St. Paul Housing & Redevelopment Authority Housing & Health Care Facilities Revenue | ||||||||
(Senior Carondelet Village Project) Series A 6.00% 8/1/42 | 770,000 | 802,740 | ||||||
(Senior Episcopal Homes Project) | ||||||||
5.125% 5/1/48 | 1,700,000 | 1,746,138 | ||||||
Series A 5.15% 11/1/42 | 775,000 | 792,174 | ||||||
St. Paul Housing & Redevelopment Authority Multifamily Housing Revenue | ||||||||
(Marian Center Project) Series A 5.375% 5/1/43 | 1,000,000 | 1,000,860 | ||||||
45
Table of Contents
Schedules of investments
Delaware Minnesota High-Yield Municipal Bond Fund
| Principal amount° | Value (U.S. $) | |||||||
| ||||||||
Municipal Bonds (continued) | ||||||||
| ||||||||
Healthcare Revenue Bonds (continued) | ||||||||
Twin Valley Congregate Housing Revenue | ||||||||
(Living Options Project) 5.95% 11/1/28 @ | 1,825,000 | $ | 1,825,456 | |||||
Victoria Health Care Facilities Revenue | ||||||||
(Augustana Emerald Care Project) 5.00% 8/1/39 | 1,500,000 | 1,547,175 | ||||||
Washington County Housing & Redevelopment Authority Healthcare & Housing Revenue | ||||||||
(Birchwood & Woodbury Projects) Series A 5.625% 6/1/37 | 1,000,000 | 1,049,970 | ||||||
Wayzata Senior Housing Revenue | ||||||||
(Folkestone Senior Living Community) | ||||||||
Series A 5.50% 11/1/32 | 260,000 | 281,562 | ||||||
Series A 5.75% 11/1/39 | 590,000 | 635,583 | ||||||
Series A 6.00% 5/1/47 | 920,000 | 997,262 | ||||||
Winona Health Care Facilities Revenue | ||||||||
(Winona Health Obligation Group) 5.15% 7/1/31 | 1,500,000 | 1,537,845 | ||||||
Woodbury Housing & Redevelopment Authority Revenue | ||||||||
(St. Therese of Woodbury) 5.25% 12/1/49 | 1,250,000 | 1,273,300 | ||||||
|
| |||||||
| 62,804,712 | ||||||||
|
| |||||||
Housing Revenue Bonds – 4.65% | ||||||||
Minneapolis Multifamily Housing Revenue | ||||||||
(Olson Townhomes Project) 6.00% 12/1/19 (AMT) | 800,000 | 800,560 | ||||||
Minneapolis-St. Paul Housing Finance Board Mortgage-Backed Securities Program | ||||||||
(City Living Project) Series A-2 5.00% 12/1/38 (GNMA) (FNMA) (AMT) | 80,031 | 80,119 | ||||||
Minnesota Housing Finance Agency (Residential Housing) | ||||||||
Series G 5.00% 7/1/36 (AMT) | 635,000 | 636,187 | ||||||
Series I 4.85% 7/1/38 (AMT) | 800,000 | 803,688 | ||||||
Series L 5.10% 7/1/38 (AMT) | 1,085,000 | 1,113,655 | ||||||
Series M 4.875% 7/1/37 (AMT) | 1,700,000 | 1,704,743 | ||||||
Northwest Multi-County Housing & Redevelopment Authority | ||||||||
(Pooled Housing Program) 5.50% 7/1/45 | 1,275,000 | 1,251,973 | ||||||
St. Paul Housing & Redevelopment Authority Multifamily Housing Revenue | ||||||||
(Selby Grotto Housing Project) 5.50% 9/20/44 (GNMA) (FHA) (AMT) | 750,000 | 750,720 | ||||||
Stillwater Multifamily Housing Revenue | ||||||||
(Orleans Homes Project) 5.50% 2/1/42 (AMT) | 750,000 | 751,583 | ||||||
|
| |||||||
| 7,893,228 | ||||||||
|
| |||||||
46
Table of Contents
| Principal amount° | Value (U.S. $) | |||||||
| ||||||||
Municipal Bonds (continued) | ||||||||
| ||||||||
Lease Revenue Bonds – 2.23% | ||||||||
Minnesota General Fund Revenue Appropriations | ||||||||
Series A 5.00% 6/1/38 | 1,750,000 | $ | 1,976,135 | |||||
Series A 5.00% 6/1/43 | 1,000,000 | 1,114,640 | ||||||
Series B 4.00% 3/1/26 | 375,000 | 405,480 | ||||||
Series B 5.00% 3/1/21 | 250,000 | 293,803 | ||||||
|
| |||||||
| 3,790,058 | ||||||||
|
| |||||||
Local General Obligation Bonds – 8.26% | ||||||||
Foley Independent School District No. 51 | ||||||||
(School Building) Series A 5.00% 2/1/21 | 1,105,000 | 1,127,222 | ||||||
Hennepin County | ||||||||
Series B 5.00% 12/1/23 | 1,300,000 | 1,593,813 | ||||||
Mahtomedi Independent School District No 832 | ||||||||
(School Building) | ||||||||
Series A 5.00% 2/1/28 | 1,000,000 | 1,196,980 | ||||||
Series A 5.00% 2/1/29 | 1,000,000 | 1,186,440 | ||||||
Series A 5.00% 2/1/30 | 445,000 | 526,342 | ||||||
Series A 5.00% 2/1/31 | 1,000,000 | 1,176,450 | ||||||
Minneapolis Various Purposes | ||||||||
4.00% 12/1/23 | 1,500,000 | 1,565,715 | ||||||
South Washington County Independent School District No. 833 | ||||||||
(School Building) Series A 4.75% 2/1/27 | 1,500,000 | 1,617,540 | ||||||
Staples United Hospital District Health Care Facilities | ||||||||
(Todd Morrison ETC Hospital-Lakewood) | ||||||||
5.00% 12/1/21 | 610,000 | 612,312 | ||||||
5.125% 12/1/24 | 205,000 | 205,742 | ||||||
5.25% 12/1/26 | 1,540,000 | 1,545,436 | ||||||
White Bear Lake Independent School District No. 624 | ||||||||
(Alternative Facilities) Series B 4.75% 2/1/22 | 1,500,000 | 1,653,210 | ||||||
|
| |||||||
| 14,007,202 | ||||||||
|
| |||||||
Pre-Refunded Bonds – 10.84% | ||||||||
Bemidji Health Care Facilities First Mortgage Revenue | ||||||||
(North Country Health Services) 5.00% 9/1/20-16§ | 1,150,000 | 1,203,349 | ||||||
Chaska Independent School District No.112 | ||||||||
(School Building) Series A 4.50% 2/1/28-17 (NATL-RE)§ | 1,000,000 | 1,049,320 | ||||||
Metropolitan Council Waste Water Treatment | ||||||||
Series C 5.00% 3/1/28-16§ | 1,000,000 | 1,023,480 | ||||||
Minneapolis Health Care System Revenue | ||||||||
(Fairview Health Services) Series A 6.625% 11/15/28-18§ | 2,000,000 | 2,332,080 | ||||||
Minnesota | ||||||||
Series A 5.00% 10/1/24-21§ | 15,000 | 17,899 | ||||||
47
Table of Contents
Schedules of investments
Delaware Minnesota High-Yield Municipal Bond Fund
| Principal amount° | Value (U.S. $) | |||||||
| ||||||||
Municipal Bonds (continued) | ||||||||
| ||||||||
Pre-Refunded Bonds (continued) | ||||||||
Minnesota Higher Education Facilities Authority Revenue | ||||||||
(St. Olaf College) | ||||||||
Series 6-O 4.50% 10/1/32-16§ | 925,000 | $ | 966,412 | |||||
Series 6-O 5.00% 10/1/22-16§ | 660,000 | 693,112 | ||||||
Owatonna Senior Housing Revenue | ||||||||
(Senior Living Project) | ||||||||
Series A 5.80% 10/1/29-16§ | 400,000 | 412,848 | ||||||
Series A 6.00% 4/1/41-16§ | 1,250,000 | 1,291,600 | ||||||
St. Louis Park Health Care Facilities Revenue | ||||||||
(Park Nicollet Health Services) | ||||||||
5.75% 7/1/39-19§ | 4,005,000 | 4,694,701 | ||||||
Series C 5.50% 7/1/23-18§ | 1,000,000 | 1,129,440 | ||||||
St. Paul Housing & Redevelopment Authority Health Care Facilities Revenue | ||||||||
(Health Partners Obligation Group Project) 5.25% 5/15/36-16§ | 750,000 | 793,560 | ||||||
University of Minnesota Special Purpose Revenue | ||||||||
(State Supported Stadium Debt) 5.00% 8/1/29-16§ | 2,660,000 | 2,774,646 | ||||||
|
| |||||||
| 18,382,447 | ||||||||
|
| |||||||
Special Tax Revenue Bonds – 6.14% | ||||||||
Hennepin County Sales Tax Revenue | ||||||||
(First Lien-Ballpark Project) Series B 5.00% 12/15/24 | 1,000,000 | 1,093,960 | ||||||
(Second Lien-Ballpark Project) | ||||||||
Series B 5.00% 12/15/20 | 1,500,000 | 1,642,860 | ||||||
Series B 5.00% 12/15/24 | 1,000,000 | 1,093,960 | ||||||
Minneapolis Development Revenue | ||||||||
(Limited Tax Supported Common Bond Fund) Series 2-A 5.00% 6/1/28 (AMT) | 1,170,000 | 1,199,882 | ||||||
Minneapolis Tax Increment Revenue | ||||||||
4.00% 3/1/27 | 200,000 | 199,452 | ||||||
4.00% 3/1/30 | 260,000 | 253,430 | ||||||
(Ivy Tower Project) 5.70% 2/1/29 @ | 765,000 | 749,937 | ||||||
(Village of St. Anthony Falls Project) | ||||||||
4.00% 3/1/24 | 700,000 | 702,590 | ||||||
4.00% 3/1/27 | 650,000 | 644,085 | ||||||
Minnesota 911 Revenue | ||||||||
(Public Safety Radio Communication System Project) 5.00% 6/1/24 (ASSURED GTY) | 1,000,000 | 1,100,460 | ||||||
St. Paul Port Authority | ||||||||
(Limited Tax Brownfields Redevelopment Tax) Series 2 5.00% 3/1/37 | 1,000,000 | 1,050,740 | ||||||
48
Table of Contents
| Principal amount° | Value (U.S. $) | |||||||
| ||||||||
Municipal Bonds (continued) | ||||||||
| ||||||||
Special Tax Revenue Bonds (continued) | ||||||||
St. Paul Sales Tax Revenue | ||||||||
Series G 5.00% 11/1/28 | 600,000 | $ | 693,870 | |||||
|
| |||||||
| 10,425,226 | ||||||||
|
| |||||||
State General Obligation Bonds – 2.02% | ||||||||
Minnesota | ||||||||
Series A Unrefunded 5.00% 10/1/24 | 985,000 | 1,162,566 | ||||||
Minnesota Various Purposes | ||||||||
Series A 5.00% 8/1/32 | 1,915,000 | 2,258,608 | ||||||
|
| |||||||
| 3,421,174 | ||||||||
|
| |||||||
Transportation Revenue Bonds – 2.10% | ||||||||
Minneapolis – St. Paul Metropolitan Airports Commission Revenue | ||||||||
5.00% 1/1/22 | 1,000,000 | 1,155,950 | ||||||
Subordinate Series B 5.00% 1/1/29 | 2,130,000 | 2,400,148 | ||||||
|
| |||||||
| 3,556,098 | ||||||||
|
| |||||||
Total Municipal Bonds (cost $162,440,900) | 169,064,152 | |||||||
|
| |||||||
| Number of shares | ||||||||
| ||||||||
Short-Term Investments – 1.23% | ||||||||
| ||||||||
Money Market Mutual Fund – 0.05% | ||||||||
Federated Minnesota Municipal Cash Trust | 86,135 | 86,135 | ||||||
|
| |||||||
| 86,135 | ||||||||
|
| |||||||
| Principal amount° | ||||||||
Variable Rate Demand Note – 1.18%¤ | ||||||||
Minneapolis-St. Paul Housing & Redevelopment Authority Health Care Revenue (Allina Health System) Series B-1 | ||||||||
0.01% 11/15/35 (LOC – JPMorgan Chase Bank N.A.) | 2,000,000 | 2,000,000 | ||||||
|
| |||||||
| 2,000,000 | ||||||||
|
| |||||||
Total Short-Term Investments (cost $2,086,135) | 2,086,135 | |||||||
|
| |||||||
Total Value of Securities – 100.89% | $ | 171,150,287 | ||||||
|
| |||||||
| # | Security exempt from registration under Rule 144A of the Securities Act of 1933, as amended. At Aug. 31, 2015, the aggregate value of Rule 144A securities was $899,754, which represents 0.53% of the Fund’s net assets. See Note 8 in “Notes to financial statements.” |
| @ | Illiquid security. At Aug. 31, 2015, the aggregate value of illiquid securities was $2,575,393, which represents 1.52% of the Fund’s net assets. See Note 8 in “Notes to financial statements.” |
| ¤ | Tax-exempt obligations that contain a floating or variable interest rate adjustment formula and an unconditional right of demand to receive payment of the unpaid principal balance plus accrued interest upon a short notice period (generally up to 30 days) prior to specified dates either from the |
49
Table of Contents
Schedules of investments
Delaware Minnesota High-Yield Municipal Bond Fund
issuer or by drawing on a bank letter of credit, a guarantee, or insurance issued with respect to such instrument. The rate shown is the rate as of Aug. 31, 2015. |
| ° | Principal amount shown is stated in U.S. dollars unless noted that the security is denominated in another currency. |
| § | Pre-refunded bonds. Municipal bonds that are generally backed or secured by U.S. Treasury bonds. For pre-refunded bonds, the stated maturity is followed by the year in which the bond is pre-refunded. See Note 8 in “Notes to financial statements.” |
Summary of abbreviations:
AMBAC – Insured by AMBAC Assurance Corporation
AMT – Subject to Alternative Minimum Tax
ASSURED GTY – Insured by Assured Guaranty Corporation
FHA – Federal Housing Administration
FNMA – Federal National Mortgage Association collateral
GNMA – Government National Mortgage Association collateral
LOC – Letter of Credit
N.A. – North America
NATL-RE – Insured by National Public Finance Guarantee Corporation
See accompanying notes, which are an integral part of the financial statements.
50
Table of Contents
Statements of assets and liabilities
August 31, 2015
Delaware Tax-Free Fund | Delaware Tax-Free Minnesota Intermediate Fund | Delaware Minnesota High-Yield Municipal Bond Fund | ||||||||||
Assets: | ||||||||||||
Investments, at value1 | $ | 550,906,831 | $ | 100,480,752 | $ | 169,064,152 | ||||||
Short-term investments, at value2 | 2,795,527 | 806,256 | 2,086,135 | |||||||||
Cash | 44,598 | 38,256 | 21,982 | |||||||||
Interest receivable | 7,358,797 | 1,116,861 | 2,158,443 | |||||||||
Receivable for fund shares sold | 360,733 | 12,798 | 253,630 | |||||||||
Receivable for securities sold | 65,544 | — | 25,203 | |||||||||
|
|
|
|
|
| |||||||
Total assets | 561,532,030 | 102,454,923 | 173,609,545 | |||||||||
|
|
|
|
|
| |||||||
Liabilities: | ||||||||||||
Payable for securities purchased | 3,512,765 | 1,345,741 | 3,458,758 | |||||||||
Distributions payable | 524,742 | 76,489 | 138,230 | |||||||||
Payable for fund shares redeemed | 210,673 | 94,581 | 175,252 | |||||||||
Investment management fees payable | 212,479 | 42,777 | 65,586 | |||||||||
Other accrued expenses | 154,901 | 65,165 | 77,627 | |||||||||
Distribution fees payable to affiliates | 140,478 | 20,778 | 53,540 | |||||||||
Other affiliates payable | 21,013 | 3,561 | 6,640 | |||||||||
Trustees’ fees and expenses payable | 2,961 | 535 | 900 | |||||||||
|
|
|
|
|
| |||||||
Total liabilities | 4,780,012 | 1,649,627 | 3,976,533 | |||||||||
|
|
|
|
|
| |||||||
Total Net Assets | $ | 556,752,018 | $ | 100,805,296 | $ | 169,633,012 | ||||||
|
|
|
|
|
| |||||||
Net Assets Consist of: | ||||||||||||
Paid-in capital | $ | 525,270,285 | $ | 95,916,709 | $ | 167,832,301 | ||||||
Distributions in excess of net investment income | (226,841 | ) | (1,319 | ) | (2,683 | ) | ||||||
Accumulated net realized loss on investments | (2,710,743 | ) | (145,859 | ) | (4,819,858 | ) | ||||||
Net unrealized appreciation of investments | 34,419,317 | 5,035,765 | 6,623,252 | |||||||||
|
|
|
|
|
| |||||||
Total Net Assets | $ | 556,752,018 | $ | 100,805,296 | $ | 169,633,012 | ||||||
|
|
|
|
|
| |||||||
51
Table of Contents
Statements of assets and liabilities
Delaware Tax-Free Fund | Delaware Tax-Free Intermediate Fund | Delaware High-Yield Bond Fund | ||||||||||
Net Asset Value | ||||||||||||
Class A: | ||||||||||||
Net assets | $ | 479,274,520 | $ | 84,662,962 | $ | 122,617,820 | ||||||
Shares of beneficial interest outstanding, unlimited authorization, no par | 38,046,483 | 7,546,023 | 11,307,300 | |||||||||
Net asset value per share | $ | 12.60 | $ | 11.22 | $ | 10.84 | ||||||
Sales charge | 4.50 | % | 2.75 | % | 4.50 | % | ||||||
Offering price per share, equal to net asset value per share/(1 – sales charge) | $ | 13.19 | $ | 11.54 | $ | 11.35 | ||||||
Class C: | ||||||||||||
Net assets | $ | 45,393,199 | $ | 11,739,738 | $ | 32,173,885 | ||||||
Shares of beneficial interest outstanding, unlimited authorization, no par | 3,591,950 | 1,044,166 | 2,961,125 | |||||||||
Net asset value per share | $ | 12.64 | $ | 11.24 | $ | 10.87 | ||||||
Institutional Class: | ||||||||||||
Net assets | $ | 32,084,299 | $ | 4,402,596 | $ | 14,841,307 | ||||||
Shares of beneficial interest outstanding, unlimited authorization, no par | 2,547,598 | 392,248 | 1,369,071 | |||||||||
Net asset value per share | $ | 12.59 | $ | 11.22 | $ | 10.84 | ||||||
| ||||||||||||
1Investments, at cost |
$ |
516,487,514 |
|
$ |
95,444,987 |
|
$ |
162,440,900 |
| |||
2Short-term investments, at cost | 2,795,527 | 806,256 | 2,086,135 | |||||||||
See accompanying notes, which are an integral part of the financial statements.
52
Table of Contents
Year ended August 31, 2015
Delaware Tax-Free Fund | Delaware Tax-Free Intermediate | Delaware Minnesota High-Yield Municipal Bond Fund | ||||||||||
Investment Income: | ||||||||||||
Interest | $ | 24,593,228 | $ | 3,982,471 | $ | 7,390,896 | ||||||
|
|
|
|
|
| |||||||
Expenses: | ||||||||||||
Management fees | 3,056,264 | 519,273 | 919,019 | |||||||||
Distribution expenses — Class A | 1,229,221 | 221,626 | 305,938 | |||||||||
Distribution expenses — Class B | 340 | — | 386 | |||||||||
Distribution expenses — Class C | 433,649 | 121,893 | 325,046 | |||||||||
Dividend disbursing and transfer agent fees and expenses | 390,259 | 80,968 | 131,162 | |||||||||
Accounting and administration expenses | 179,622 | 33,242 | 53,457 | |||||||||
Reports and statements to shareholders | 101,323 | 31,947 | 48,586 | |||||||||
Legal fees | 79,630 | 13,958 | 20,111 | |||||||||
Audit and tax fees | 41,890 | 41,890 | 41,895 | |||||||||
Registration fees | 39,266 | 19,392 | 13,815 | |||||||||
Trustees’ fees and expenses | 26,197 | 4,832 | 7,765 | |||||||||
Custodian fees | 25,551 | 4,610 | 8,067 | |||||||||
Other | 38,690 | 15,139 | 20,114 | |||||||||
|
|
|
|
|
| |||||||
| 5,641,902 | 1,108,770 | 1,895,361 | ||||||||||
Less expenses waived | (476,893 | ) | (35,425 | ) | (165,858 | ) | ||||||
Less waived distribution expenses — Class A | — | (88,650 | ) | — | ||||||||
Less waived distribution expenses — Class B | (262 | ) | — | (298 | ) | |||||||
Less expense paid indirectly | (139 | ) | (24 | ) | (39 | ) | ||||||
|
|
|
|
|
| |||||||
Total operating expenses | 5,164,608 | 984,671 | 1,729,166 | |||||||||
|
|
|
|
|
| |||||||
Net Investment Income | 19,428,620 | 2,997,800 | 5,661,730 | |||||||||
|
|
|
|
|
| |||||||
Net Realized and Unrealized Gain (Loss): | ||||||||||||
Net realized gain on investments | 1,450,306 | 194,821 | 496,529 | |||||||||
Net change in unrealized appreciation (depreciation) of investments | (4,486,338 | ) | (1,134,514 | ) | (1,123,236 | ) | ||||||
|
|
|
|
|
| |||||||
Net Realized and Unrealized Loss | (3,036,032 | ) | (939,693 | ) | (626,707 | ) | ||||||
|
|
|
|
|
| |||||||
Net Increase in Net Assets Resulting from Operations | $ | 16,392,588 | $ | 2,058,107 | $ | 5,035,023 | ||||||
|
|
|
|
|
| |||||||
See accompanying notes, which are an integral part of the financial statements.
53
Table of Contents
Statements of changes in net assets
Delaware Tax-Free Minnesota Fund
| Year ended | ||||||||
| 8/31/15 | 8/31/14 | |||||||
Increase (Decrease) in Net Assets from Operations: | ||||||||
Net investment income | $ | 19,428,620 | $ | 20,112,380 | ||||
Net realized gain (loss) | 1,450,306 | (4,216,461 | ) | |||||
Net change in unrealized appreciation (depreciation) | (4,486,338 | ) | 37,898,163 | |||||
|
|
|
| |||||
Net increase in net assets resulting from operations | 16,392,588 | 53,794,082 | ||||||
|
|
|
| |||||
Dividends and Distributions to Shareholders from: | ||||||||
Net investment income: | ||||||||
Class A | (17,349,446 | ) | (18,743,216 | ) | ||||
Class B | (1,251 | ) | (26,624 | ) | ||||
Class C | (1,204,147 | ) | (1,173,105 | ) | ||||
Institutional Class | (991,348 | ) | (120,985 | ) | ||||
Net realized gain: | ||||||||
Class A | — | (1,519,482 | ) | |||||
Class B | — | (2,735 | ) | |||||
Class C | — | (120,598 | ) | |||||
|
|
|
| |||||
| (19,546,192 | ) | (21,706,745 | ) | |||||
|
|
|
| |||||
Capital Share Transactions: | ||||||||
Proceeds from shares sold: | ||||||||
Class A | 22,802,354 | 23,900,452 | ||||||
Class C | 7,051,722 | 4,208,245 | ||||||
Institutional Class | 16,608,226 | 17,420,134 | ||||||
Net asset value of shares issued upon reinvestment of dividends and distributions: | ||||||||
Class A | 14,050,860 | 16,665,158 | ||||||
Class B | 934 | 23,343 | ||||||
Class C | 1,069,001 | 1,158,509 | ||||||
Institutional Class | 916,011 | 102,271 | ||||||
|
|
|
| |||||
| 62,499,108 | 63,478,112 | |||||||
|
|
|
| |||||
54
Table of Contents
| Year ended | ||||||||
| 8/31/15 | 8/31/14 | |||||||
Capital Share Transactions (continued): | ||||||||
Cost of shares redeemed: | ||||||||
Class A | $ | (57,938,666 | ) | $ | (107,570,429 | ) | ||
Class B | (457,631 | ) | (752,262 | ) | ||||
Class C | (4,073,143 | ) | (9,063,484 | ) | ||||
Institutional Class | (2,798,163 | ) | (166,057 | ) | ||||
|
|
|
| |||||
| (65,267,603 | ) | (117,552,232 | ) | |||||
|
|
|
| |||||
Decrease in net assets derived from capital share transactions | (2,768,495 | ) | (54,074,120 | ) | ||||
|
|
|
| |||||
Net Decrease in Net Assets | (5,922,099 | ) | (21,986,783 | ) | ||||
Net Assets: | ||||||||
Beginning of year | 562,674,117 | 584,660,900 | ||||||
|
|
|
| |||||
End of year | $ | 556,752,018 | $ | 562,674,117 | ||||
|
|
|
| |||||
Distributions in excess of net investment income | $ | (226,841 | ) | $ | (215,430 | ) | ||
|
|
|
| |||||
See accompanying notes, which are an integral part of the financial statements.
55
Table of Contents
Statements of changes in net assets
Delaware Tax-Free Minnesota Intermediate Fund
| Year ended | ||||||||
| 8/31/15 | 8/31/14 | |||||||
Increase (Decrease) in Net Assets from Operations: | ||||||||
Net investment income | $ | 2,997,800 | $ | 3,069,712 | ||||
Net realized gain (loss) | 194,821 | (340,570 | ) | |||||
Net change in unrealized appreciation (depreciation) | (1,134,514 | ) | 4,951,173 | |||||
|
|
|
| |||||
Net increase in net assets resulting from operations | 2,058,107 | 7,680,315 | ||||||
|
|
|
| |||||
Dividends and Distributions to Shareholders from: | ||||||||
Net investment income: | ||||||||
Class A | (2,642,880 | ) | (2,754,465 | ) | ||||
Class C | (259,970 | ) | (303,742 | ) | ||||
Institutional Class | (95,494 | ) | (11,542 | ) | ||||
Net realized gain: | ||||||||
Class A | — | (78,152 | ) | |||||
Class C | — | (12,741 | ) | |||||
|
|
|
| |||||
| (2,998,344 | ) | (3,160,642 | ) | |||||
|
|
|
| |||||
Capital Share Transactions: | ||||||||
Proceeds from shares sold: | ||||||||
Class A | 9,934,059 | 13,175,028 | ||||||
Class C | 1,531,754 | 1,244,117 | ||||||
Institutional Class | 2,451,746 | 2,551,083 | ||||||
Net asset value of shares issued upon reinvestment of dividends and distributions: | ||||||||
Class A | 2,330,887 | 2,527,475 | ||||||
Class C | 237,953 | 294,351 | ||||||
Institutional Class | 90,218 | 9,474 | ||||||
|
|
|
| |||||
| 16,576,617 | 19,801,528 | |||||||
|
|
|
| |||||
56
Table of Contents
| Year ended | ||||||||
| 8/31/15 | 8/31/14 | |||||||
Capital Share Transactions (continued): | ||||||||
Cost of shares redeemed: | ||||||||
Class A | $ | (17,357,339 | ) | $ | (19,151,079 | ) | ||
Class C | (2,572,600 | ) | (4,017,165 | ) | ||||
Institutional Class | (499,641 | ) | (202,713 | ) | ||||
|
|
|
| |||||
| (20,429,580 | ) | (23,370,957 | ) | |||||
|
|
|
| |||||
Decrease in net assets derived from capital share transactions | (3,852,963 | ) | (3,569,429 | ) | ||||
|
|
|
| |||||
Net Increase (Decrease) in Net Assets | (4,793,200 | ) | 950,244 | |||||
Net Assets: | ||||||||
Beginning of year | 105,598,496 | 104,648,252 | ||||||
|
|
|
| |||||
End of year | $ | 100,805,296 | $ | 105,598,496 | ||||
|
|
|
| |||||
Distributions in excess of net investment income | $ | (1,319 | ) | $ | (785 | ) | ||
|
|
|
| |||||
See accompanying notes, which are an integral part of the financial statements.
57
Table of Contents
Statements of changes in net assets
Delaware Minnesota High-Yield Municipal Bond Fund
| Year ended | ||||||||
| 8/31/15 | 8/31/14 | |||||||
Increase (Decrease) in Net Assets from Operations: | ||||||||
Net investment income | $ | 5,661,730 | $ | 5,632,781 | ||||
Net realized gain (loss) | 496,529 | (2,149,197 | ) | |||||
Net change in unrealized appreciation (depreciation) | (1,123,236 | ) | 11,247,335 | |||||
|
|
|
| |||||
Net increase in net assets resulting from operations | 5,035,023 | 14,730,919 | ||||||
|
|
|
| |||||
Dividends and Distributions to Shareholders from: | ||||||||
Net investment income: | ||||||||
Class A | (4,315,518 | ) | (4,582,286 | ) | ||||
Class B | (1,495 | ) | (31,645 | ) | ||||
Class C | (902,931 | ) | (969,612 | ) | ||||
Institutional Class | (456,934 | ) | (27,089 | ) | ||||
|
|
|
| |||||
| (5,676,878 | ) | (5,610,632 | ) | |||||
|
|
|
| |||||
Capital Share Transactions: | ||||||||
Proceeds from shares sold: | ||||||||
Class A | 19,760,433 | 18,470,038 | ||||||
Class C | 4,311,495 | 3,069,486 | ||||||
Institutional Class | 9,317,694 | 6,561,505 | ||||||
Net asset value of shares issued upon reinvestment of dividends and distributions: | ||||||||
Class A | 3,408,058 | 3,678,088 | ||||||
Class B | 1,375 | 28,590 | ||||||
Class C | 795,384 | 869,107 | ||||||
Institutional Class | 440,872 | 21,519 | ||||||
|
|
|
| |||||
| �� 38,035,311 | 32,698,333 | |||||||
|
|
|
| |||||
58
Table of Contents
| Year ended | ||||||||
| 8/31/15 | 8/31/14 | |||||||
Capital Share Transactions (continued): | ||||||||
Cost of shares redeemed: | ||||||||
Class A | $ | (19,120,109 | ) | $ | (31,473,375 | ) | ||
Class B | (525,869 | ) | (886,465 | ) | ||||
Class C | (5,095,771 | ) | (6,688,975 | ) | ||||
Institutional Class | (1,335,715 | ) | (154,969 | ) | ||||
|
|
|
| |||||
| (26,077,464 | ) | (39,203,784 | ) | |||||
|
|
|
| |||||
Increase (decrease) in net assets derived from capital share transactions | 11,957,847 | (6,505,451 | ) | |||||
|
|
|
| |||||
Net Increase in Net Assets | 11,315,992 | 2,614,836 | ||||||
Net Assets: | ||||||||
Beginning of year | 158,317,020 | 155,702,184 | ||||||
|
|
|
| |||||
End of year | $ | 169,633,012 | $ | 158,317,020 | ||||
|
|
|
| |||||
Distributions in excess of net investment income | $ | (2,683 | ) | $ | — | |||
|
|
|
| |||||
See accompanying notes, which are an integral part of the financial statements.
59
Table of Contents
Delaware Tax-Free Minnesota Fund Class A
Selected data for each share of the Fund outstanding throughout each period were as follows:
Net asset value, beginning of period |
Income (loss) from investment operations: |
Net investment income1 |
Net realized and unrealized gain (loss) |
Total from investment operations |
Less dividends and distributions from: |
Net investment income |
Net realized gain |
Total dividends and distributions |
Net asset value, end of period |
Total return2 |
Ratios and supplemental data: |
Net assets, end of period (000 omitted) |
Ratio of expenses to average net assets |
Ratio of expenses to average net assets prior to fees waived |
Ratio of net investment income to average net assets |
Ratio of net investment income to average net assets prior to fees waived |
Portfolio turnover |
| 1 | The average shares outstanding have been applied for per share information. |
| 2 | Total investment return is based on the change in net asset value of a share during the period and assumes reinvestment of dividends and distributions at net asset value and does not reflect the impact of a sales charge. Total investment return during all of the periods shown reflects a waiver by the manager. Performance would have been lower had the waiver not been in effect. |
See accompanying notes, which are an integral part of the financial statements.
60
Table of Contents
| Year ended | ||||||||||||||||||||
|
| |||||||||||||||||||
| 8/31/15 | 8/31/14 | 8/31/13 | 8/31/12 | 8/31/11 | ||||||||||||||||
| ||||||||||||||||||||
| $ | 12.670 | $ | 11.970 | $ | 13.030 | $ | 12.480 | $ | 12.730 | |||||||||||
| 0.444 | 0.445 | 0.445 | 0.487 | 0.492 | ||||||||||||||||
| (0.067 | ) | 0.734 | (0.973 | ) | 0.660 | (0.198 | ) | |||||||||||||
|
|
|
|
|
|
|
|
|
| |||||||||||
| 0.377 | 1.179 | (0.528 | ) | 1.147 | 0.294 | |||||||||||||||
|
|
|
|
|
|
|
|
|
| |||||||||||
| (0.447 | ) | (0.444 | ) | (0.445 | ) | (0.488 | ) | (0.492 | ) | |||||||||||
| — | (0.035 | ) | (0.087 | ) | (0.109 | ) | (0.052 | ) | ||||||||||||
|
|
|
|
|
|
|
|
|
| |||||||||||
| (0.447 | ) | (0.479 | ) | (0.532 | ) | (0.597 | ) | (0.544 | ) | |||||||||||
|
|
|
|
|
|
|
|
|
| |||||||||||
| $ | 12.600 | $ | 12.670 | $ | 11.970 | $ | 13.030 | $ | 12.480 | |||||||||||
|
|
|
|
|
|
|
|
|
| |||||||||||
| 3.02% | 10.03% | (4.24% | ) | 9.41% | 2.50% | |||||||||||||||
| $ | 479,275 | $ | 503,072 | $ | 540,533 | $ | 577,061 | $ | 538,170 | |||||||||||
| 0.87% | 0.90% | 0.90% | 0.90% | 0.91% | ||||||||||||||||
| 0.96% | 0.95% | 0.95% | 0.92% | 0.93% | ||||||||||||||||
| 3.51% | 3.61% | 3.47% | 3.81% | 4.02% | ||||||||||||||||
| 3.42% | 3.56% | 3.42% | 3.79% | 4.00% | ||||||||||||||||
|
| 11%
|
|
| 10%
|
|
| 16%
|
|
| 16%
|
|
| 12%
|
| ||||||
| ||||||||||||||||||||
61
Table of Contents
Financial highlights
Delaware Tax-Free Minnesota Fund Class C
Selected data for each share of the Fund outstanding throughout each period were as follows:
Net asset value, beginning of period |
Income (loss) from investment operations: |
Net investment income1 |
Net realized and unrealized gain (loss) |
Total from investment operations |
Less dividends and distributions from: |
Net investment income |
Net realized gain |
Total dividends and distributions |
Net asset value, end of period |
Total return2 |
Ratios and supplemental data: |
Net assets, end of period (000 omitted) |
Ratio of expenses to average net assets |
Ratio of expenses to average net assets prior to fees waived |
Ratio of net investment income to average net assets |
Ratio of net investment income to average net assets prior to fees waived |
Portfolio turnover |
| 1 | The average shares outstanding have been applied for per share information. |
| 2 | Total investment return is based on the change in net asset value of a share during the period and assumes reinvestment of dividends and distributions at net asset value and does not reflect the impact of a sales charge. Total investment return during all of the periods shown reflects a waiver by the manager. Performance would have been lower had the waiver not been in effect. |
See accompanying notes, which are an integral part of the financial statements.
62
Table of Contents
| Year ended | ||||||||||||||||||||
|
| |||||||||||||||||||
| 8/31/15 | 8/31/14 | 8/31/13 | 8/31/12 | 8/31/11 | ||||||||||||||||
| ||||||||||||||||||||
| $ | 12.710 | $ | 12.010 | $ | 13.070 | $ | 12.520 | $ | 12.780 | |||||||||||
| 0.350 | 0.354 | 0.350 | 0.392 | 0.401 | ||||||||||||||||
| (0.067 | ) | 0.734 | (0.973 | ) | 0.660 | (0.207 | ) | |||||||||||||
|
|
|
|
|
|
|
|
|
| |||||||||||
| 0.283 | 1.088 | (0.623 | ) | 1.052 | 0.194 | |||||||||||||||
|
|
|
|
|
|
|
|
|
| |||||||||||
| (0.353 | ) | (0.353 | ) | (0.350 | ) | (0.393 | ) | (0.402 | ) | |||||||||||
| — | (0.035 | ) | (0.087 | ) | (0.109 | ) | (0.052 | ) | ||||||||||||
|
|
|
|
|
|
|
|
|
| |||||||||||
| (0.353 | ) | (0.388 | ) | (0.437 | ) | (0.502 | ) | (0.454 | ) | |||||||||||
|
|
|
|
|
|
|
|
|
| |||||||||||
| $ | 12.640 | $ | 12.710 | $ | 12.010 | $ | 13.070 | $ | 12.520 | |||||||||||
|
|
|
|
|
|
|
|
|
| |||||||||||
| 2.25% | 9.19% | (4.93% | ) | 8.58% | 1.66% | |||||||||||||||
| $ | 45,393 | $ | 41,612 | $ | 42,985 | $ | 41,368 | $ | 34,425 | |||||||||||
| 1.62% | 1.65% | 1.65% | 1.65% | 1.66% | ||||||||||||||||
| 1.71% | 1.70% | 1.70% | 1.67% | 1.68% | ||||||||||||||||
| 2.76% | 2.86% | 2.72% | 3.06% | 3.27% | ||||||||||||||||
| 2.67% | 2.81% | 2.67% | 3.04% | 3.25% | ||||||||||||||||
|
| 11%
|
|
| 10%
|
|
| 16%
|
|
| 16%
|
|
| 12%
|
| ||||||
| ||||||||||||||||||||
63
Table of Contents
Financial highlights
Delaware Tax-Free Minnesota Fund Institutional Class
Selected data for each share of the Fund outstanding throughout each period were as follows:
| Year ended 8/31/15 | 12/31/131 to 8/31/14 | |||||||
Net asset value, beginning of period | $ | 12.660 | $ | 12.070 | ||||
Income (loss) from investment operations: | ||||||||
Net investment income2 | 0.476 | 0.336 | ||||||
Net realized and unrealized gain (loss) | (0.067 | ) | 0.589 | |||||
|
|
|
| |||||
Total from investment operations | 0.409 | 0.925 | ||||||
|
|
|
| |||||
Less dividends and distributions from: | ||||||||
Net investment income | (0.479 | ) | (0.335 | ) | ||||
|
|
|
| |||||
Total dividends and distributions | (0.479 | ) | (0.335 | ) | ||||
|
|
|
| |||||
Net asset value, end of period | $ | 12.590 | $ | 12.660 | ||||
|
|
|
| |||||
Total return3 | 3.27% | 7.74% | ||||||
Ratios and supplemental data: | ||||||||
Net assets, end of period (000 omitted) | $ | 32,084 | $ | 17,533 | ||||
Ratio of expenses to average net assets | 0.62% | 0.65% | ||||||
Ratio of expenses to average net assets prior to fees waived | 0.71% | 0.70% | ||||||
Ratio of net investment income to average net assets | 3.76% | 3.84% | ||||||
Ratio of net investment income to average net assets prior to fees waived | 3.67% | 3.79% | ||||||
Portfolio turnover
|
| 11%
|
|
| 10%
| 4
| ||
| 1 | Date of commencement of operations; ratios have been annualized and total return has not been annualized. |
| 2 | The average shares outstanding have been applied for per share information. |
| 3 | Total investment return is based on the change in net asset value of a share during the period and assumes reinvestment of dividends and distributions at net asset value. Total investment return during all of the periods shown reflects a waiver by the manager. Performance would have been lower had the waiver not been in effect. |
| 4 | Portfolio turnover is representative of the Fund for the entire year. |
See accompanying notes, which are an integral part of the financial statements.
64
Table of Contents
This page intentionally left blank.
Table of Contents
Financial highlights
Delaware Tax-Free Minnesota Intermediate Fund Class A
Selected data for each share of the Fund outstanding throughout each period were as follows:
Net asset value, beginning of period |
Income (loss) from investment operations: |
Net investment income1 |
Net realized and unrealized gain (loss) |
Total from investment operations |
Less dividends and distributions from: |
Net investment income |
Net realized gain |
Total dividends and distributions |
Net asset value, end of period |
Total return2 |
Ratios and supplemental data: |
Net assets, end of period (000 omitted) |
Ratio of expenses to average net assets |
Ratio of expenses to average net assets prior to fees waived |
Ratio of net investment income to average net assets |
Ratio of net investment income to average net assets prior to fees waived |
Portfolio turnover
|
|
| 1 | The average shares outstanding have been applied for per share information. |
| 2 | Total investment return is based on the change in net asset value of a share during the period and assumes reinvestment of dividends and distributions at net asset value and does not reflect the impact of a sales charge. Total investment return during all of the periods shown reflects waivers by the manager and/or distributor. Performance would have been lower had the waivers not been in effect. |
See accompanying notes, which are an integral part of the financial statements.
66
Table of Contents
| Year ended | ||||||||||||||||||||
|
| |||||||||||||||||||
| 8/31/15 | 8/31/14 | 8/31/13 | 8/31/12 | 8/31/11 | ||||||||||||||||
| ||||||||||||||||||||
| $ | 11.320 | $ | 10.840 | $ | 11.530 | $ | 11.130 | $ | 11.290 | |||||||||||
| 0.337 | 0.342 | 0.330 | 0.355 | 0.375 | ||||||||||||||||
| (0.100 | ) | 0.490 | (0.675 | ) | 0.400 | (0.160 | ) | |||||||||||||
|
|
|
|
|
|
|
|
|
| |||||||||||
| 0.237 | 0.832 | (0.345 | ) | 0.755 | 0.215 | |||||||||||||||
|
|
|
|
|
|
|
|
|
| |||||||||||
| (0.337 | ) | (0.342 | ) | (0.330 | ) | (0.355 | ) | (0.375 | ) | |||||||||||
| — | (0.010 | ) | (0.015 | ) | — | — | ||||||||||||||
|
|
|
|
|
|
|
|
|
| |||||||||||
| (0.337 | ) | (0.352 | ) | (0.345 | ) | (0.355 | ) | (0.375 | ) | |||||||||||
|
|
|
|
|
|
|
|
|
| |||||||||||
| $ | 11.220 | $ | 11.320 | $ | 10.840 | $ | 11.530 | $ | 11.130 | |||||||||||
|
|
|
|
|
|
|
|
|
| |||||||||||
| 2.12% | 7.79% | (3.09% | ) | 6.88% | 2.02% | |||||||||||||||
| $ | 84,663 | $ | 90,571 | $ | 90,110 | $ | 97,032 | $ | 87,924 | |||||||||||
| 0.85% | 0.84% | 0.84% | 0.84% | 0.84% | ||||||||||||||||
| 0.98% | 0.98% | 0.97% | 0.94% | 0.95% | ||||||||||||||||
| 2.98% | 3.08% | 2.89% | 3.12% | 3.43% | ||||||||||||||||
| 2.85% | 2.94% | 2.76% | 3.02% | 3.32% | ||||||||||||||||
|
| 14%
|
|
| 14%
|
|
| 17%
|
|
| 21%
|
|
| 24%
|
| ||||||
| ||||||||||||||||||||
67
Table of Contents
Financial highlights
Delaware Tax-Free Minnesota Intermediate Fund Class C
Selected data for each share of the Fund outstanding throughout each period were as follows:
Net asset value, beginning of period |
Income (loss) from investment operations: |
Net investment income1 |
Net realized and unrealized gain (loss) |
Total from investment operations |
Less dividends and distributions from: |
Net investment income |
Net realized gain |
Total dividends and distributions |
Net asset value, end of period |
Total return2 |
Ratios and supplemental data: |
Net assets, end of period (000 omitted) |
Ratio of expenses to average net assets |
Ratio of expenses to average net assets prior to fees waived |
Ratio of net investment income to average net assets |
Ratio of net investment income to average net assets prior to fees waived |
Portfolio turnover
|
|
| 1 | The average shares outstanding have been applied for per share information. |
| 2 | Total investment return is based on the change in net asset value of a share during the period and assumes reinvestment of dividends and distributions at net asset value and does not reflect the impact of a sales charge. Total investment return during some of the periods shown reflects a waiver by the manager. Performance would have been lower had the waiver not been in effect. |
See accompanying notes, which are an integral part of the financial statements.
68
Table of Contents
| Year ended | ||||||||||||||||||||
|
| |||||||||||||||||||
| 8/31/15 | 8/31/14 | 8/31/13 | 8/31/12 | 8/31/11 | ||||||||||||||||
| ||||||||||||||||||||
| $ | 11.350 | $ | 10.860 | $ | 11.560 | $ | 11.160 | $ | 11.320 | |||||||||||
| 0.241 | 0.249 | 0.233 | 0.259 | 0.283 | ||||||||||||||||
| (0.110 | ) | 0.500 | (0.685 | ) | 0.400 | (0.160 | ) | |||||||||||||
|
|
|
|
|
|
|
|
|
| |||||||||||
| 0.131 | 0.749 | (0.452 | ) | 0.659 | 0.123 | |||||||||||||||
|
|
|
|
|
|
|
|
|
| |||||||||||
| (0.241 | ) | (0.249 | ) | (0.233 | ) | (0.259 | ) | (0.283 | ) | |||||||||||
| — | (0.010 | ) | (0.015 | ) | — | — | ||||||||||||||
|
|
|
|
|
|
|
|
|
| |||||||||||
| (0.241 | ) | (0.259 | ) | (0.248 | ) | (0.259 | ) | (0.283 | ) | |||||||||||
|
|
|
|
|
|
|
|
|
| |||||||||||
| $ | 11.240 | $ | 11.350 | $ | 10.860 | $ | 11.560 | $ | 11.160 | |||||||||||
|
|
|
|
|
|
|
|
|
| |||||||||||
| 1.16% | 6.96% | (3.99% | ) | 5.96% | 1.16% | |||||||||||||||
| $ | 11,740 | $ | 12,651 | $ | 14,538 | $ | 16,210 | $ | 13,949 | |||||||||||
| 1.70% | 1.69% | 1.69% | 1.69% | 1.69% | ||||||||||||||||
| 1.73% | 1.73% | 1.72% | 1.69% | 1.70% | ||||||||||||||||
| 2.13% | 2.23% | 2.04% | 2.27% | 2.58% | ||||||||||||||||
| 2.10% | 2.19% | 2.01% | 2.27% | 2.57% | ||||||||||||||||
|
| 14%
|
|
| 14%
|
|
| 17%
|
|
| 21%
|
|
| 24%
|
| ||||||
| ||||||||||||||||||||
69
Table of Contents
Financial highlights
Delaware Tax-Free Minnesota Intermediate Fund Institutional Class
Selected data for each share of the Fund outstanding throughout each period were as follows:
| Year ended 8/31/15 | 12/31/131 to 8/31/14 | |||||||
| ||||||||
Net asset value, beginning of period | $ | 11.330 | $ | 10.950 | ||||
Income (loss) from investment operations: | ||||||||
Net investment income2 | 0.354 | 0.255 | ||||||
Net realized and unrealized gain (loss) | (0.110 | ) | 0.380 | |||||
|
|
|
| |||||
Total from investment operations | 0.244 | 0.635 | ||||||
|
|
|
| |||||
Less dividends and distributions from: | ||||||||
Net investment income | (0.354 | ) | (0.255 | ) | ||||
|
|
|
| |||||
Total dividends and distributions | (0.354 | ) | (0.255 | ) | ||||
|
|
|
| |||||
Net asset value, end of period | $ | 11.220 | $ | 11.330 | ||||
|
|
|
| |||||
Total return3 | 2.18% | 5.85% | ||||||
Ratios and supplemental data: | ||||||||
Net assets, end of period (000 omitted) | $ | 4,402 | $ | 2,376 | ||||
Ratio of expenses to average net assets | 0.70% | 0.69% | ||||||
Ratio of expenses to average net assets prior to fees waived | 0.73% | 0.73% | ||||||
Ratio of net investment income to average net assets | 3.13% | 3.21% | ||||||
Ratio of net investment income to average net assets prior to fees waived | 3.10% | 3.17% | ||||||
Portfolio turnover | 14% | 14% | 4 | |||||
| ||||||||
| 1 | Date of commencement of operations; ratios have been annualized and total return has not been annualized. |
| 2 | The average shares outstanding have been applied for per share information. |
| 3 | Total investment return is based on the change in net asset value of a share during the period and assumes reinvestment of dividends and distributions at net asset value. Total investment return during all of the periods shown reflects a waiver by the manager. Performance would have been lower had the waiver not been in effect. |
| 4 | Portfolio turnover is representative of the Fund for the entire year. |
See accompanying notes, which are an integral part of the financial statements.
70
Table of Contents
This page intentionally left blank.
Table of Contents
Financial highlights
Delaware Minnesota High-Yield Municipal Bond Fund Class A
Selected data for each share of the Fund outstanding throughout each period were as follows:
|
Net asset value, beginning of period |
Income (loss) from investment operations: |
Net investment income1 |
Net realized and unrealized gain (loss) |
Total from investment operations |
Less dividends and distributions from: |
Net investment income |
Total dividends and distributions |
Net asset value, end of period |
Total return2 |
Ratios and supplemental data: |
Net assets, end of period (000 omitted) |
Ratio of expenses to average net assets |
Ratio of expenses to average net assets prior to fees waived |
Ratio of net investment income to average net assets |
Ratio of net investment income to average net assets prior to fees waived |
Portfolio turnover |
|
| 1 | The average shares outstanding have been applied for per share information. |
| 2 | Total investment return is based on the change in net asset value of a share during the period and assumes reinvestment of dividends and distributions at net asset value and does not reflect the impact of a sales charge. Total investment return during all of the periods shown reflects a waiver by the manager. Performance would have been lower had the waiver not been in effect. |
See accompanying notes, which are an integral part of the financial statements.
72
Table of Contents
| Year ended | ||||||||||||||||||||||||||||
|
| |||||||||||||||||||||||||||
| 8/31/15 | 8/31/14 | 8/31/13 | 8/31/12 | 8/31/11 | ||||||||||||||||||||||||
| ||||||||||||||||||||||||||||
| $ | 10.880 | $ | 10.250 | $ | 11.080 | $ | 10.490 | $ | 10.710 | |||||||||||||||||||
| 0.383 | 0.404 | 0.399 | 0.420 | 0.430 | ||||||||||||||||||||||||
| (0.039 | ) | 0.628 | (0.831 | ) | 0.596 | (0.222 | ) | |||||||||||||||||||||
|
|
|
|
|
|
|
|
|
| |||||||||||||||||||
| 0.344 | 1.032 | (0.432 | ) | 1.016 | 0.208 | |||||||||||||||||||||||
|
|
|
|
|
|
|
|
|
| |||||||||||||||||||
| (0.384 | ) | (0.402 | ) | (0.398 | ) | (0.426 | ) | (0.428 | ) | |||||||||||||||||||
|
|
|
|
|
|
|
|
|
| |||||||||||||||||||
| (0.384 | ) | (0.402 | ) | (0.398 | ) | (0.426 | ) | (0.428 | ) | |||||||||||||||||||
|
|
|
|
|
|
|
|
|
| |||||||||||||||||||
| $ | 10.840 | $ | 10.880 | $ | 10.250 | $ | 11.080 | $ | 10.490 | |||||||||||||||||||
|
|
|
|
|
|
|
|
|
| |||||||||||||||||||
| 3.20% | 10.25% | (4.06% | ) | 9.86% | 2.12% | |||||||||||||||||||||||
| $ | 122,618 | $ | 119,044 | $ | 121,232 | $ | 124,717 | $ | 108,830 | |||||||||||||||||||
| 0.91% | 0.89% | 0.89% | 0.89% | 0.91% | ||||||||||||||||||||||||
| 1.01% | 0.99% | 0.99% | 0.97% | 0.98% | ||||||||||||||||||||||||
| 3.52% | 3.82% | 3.64% | 3.89% | 4.20% | ||||||||||||||||||||||||
| 3.42% | 3.72% | 3.54% | 3.81% | 4.13% | ||||||||||||||||||||||||
| 16% | 15% | 14% | 13% | 5% | ||||||||||||||||||||||||
| ||||||||||||||||||||||||||||
73
Table of Contents
Financial highlights
Delaware Minnesota High-Yield Municipal Bond Fund Class C
Selected data for each share of the Fund outstanding throughout each period were as follows:
|
Net asset value, beginning of period |
Income (loss) from investment operations: |
Net investment income1 |
Net realized and unrealized gain (loss) |
Total from investment operations |
Less dividends and distributions from: |
Net investment income |
Total dividends and distributions |
Net asset value, end of period |
Total return2 |
Ratios and supplemental data: |
Net assets, end of period (000 omitted) |
Ratio of expenses to average net assets |
Ratio of expenses to average net assets prior to fees waived |
Ratio of net investment income to average net assets |
Ratio of net investment income to average net assets prior to fees waived |
Portfolio turnover |
|
| 1 | The average shares outstanding have been applied for per share information. |
| 2 | Total investment return is based on the change in net asset value of a share during the period and assumes reinvestment of dividends and distributions at net asset value and does not reflect the impact of a sales charge. Total investment return during all of the periods shown reflects a waiver by the manager. Performance would have been lower had the waiver not been in effect. |
See accompanying notes, which are an integral part of the financial statements.
74
Table of Contents
| Year ended | ||||||||||||||||||||||||||||
|
| |||||||||||||||||||||||||||
| 8/31/15 | 8/31/14 | 8/31/13 | 8/31/12 | 8/31/11 | ||||||||||||||||||||||||
| ||||||||||||||||||||||||||||
| $ | 10.900 | $ | 10.270 | $ | 11.100 | $ | 10.510 | $ | 10.730 | |||||||||||||||||||
| 0.302 | 0.326 | 0.318 | 0.340 | 0.354 | ||||||||||||||||||||||||
| (0.029 | ) | 0.628 | (0.832 | ) | 0.596 | (0.222 | ) | |||||||||||||||||||||
|
|
|
|
|
|
|
|
|
| |||||||||||||||||||
| 0.273 | 0.954 | (0.514 | ) | 0.936 | 0.132 | |||||||||||||||||||||||
|
|
|
|
|
|
|
|
|
| |||||||||||||||||||
| (0.303 | ) | (0.324 | ) | (0.316 | ) | (0.346 | ) | (0.352 | ) | |||||||||||||||||||
|
|
|
|
|
|
|
|
|
| |||||||||||||||||||
| (0.303 | ) | (0.324 | ) | (0.316 | ) | (0.346 | ) | (0.352 | ) | |||||||||||||||||||
|
|
|
|
|
|
|
|
|
| |||||||||||||||||||
| $ | 10.870 | $ | 10.900 | $ | 10.270 | $ | 11.100 | $ | 10.510 | |||||||||||||||||||
|
|
|
|
|
|
|
|
|
| |||||||||||||||||||
| 2.53% | 9.41% | (4.77% | ) | 9.03% | 1.36% | |||||||||||||||||||||||
| $ | 32,174 | $ | 32,279 | $ | 33,140 | $ | 33,432 | $ | 26,718 | |||||||||||||||||||
| 1.66% | 1.64% | 1.64% | 1.64% | 1.66% | ||||||||||||||||||||||||
| 1.76% | 1.74% | 1.74% | 1.72% | 1.73% | ||||||||||||||||||||||||
| 2.77% | 3.07% | 2.89% | 3.14% | 3.45% | ||||||||||||||||||||||||
| 2.67% | 2.97% | 2.79% | 3.06% | 3.38% | ||||||||||||||||||||||||
| 16% | 15% | 14% | 13% | 5% | ||||||||||||||||||||||||
| ||||||||||||||||||||||||||||
75
Table of Contents
Financial highlights
Delaware Minnesota High-Yield Municipal Bond Fund Institutional Class
Selected data for each share of the Fund outstanding throughout each period were as follows:
| Year ended 8/31/15 | 12/31/131 to 8/31/14 | |||||||
| ||||||||
Net asset value, beginning of period | $ | 10.880 | $ | 10.350 | ||||
Income (loss) from investment operations: | ||||||||
Net investment income2 | 0.410 | 0.312 | ||||||
Net realized and unrealized gain (loss) | (0.039 | ) | 0.528 | |||||
|
|
|
| |||||
Total from investment operations | 0.371 | 0.840 | ||||||
|
|
|
| |||||
Less dividends and distributions from: | ||||||||
Net investment income | (0.411 | ) | (0.310 | ) | ||||
|
|
|
| |||||
Total dividends and distributions | (0.411 | ) | (0.310 | ) | ||||
|
|
|
| |||||
Net asset value, end of period | $ | 10.840 | $ | 10.880 | ||||
|
|
|
| |||||
Total return3 | 3.46% | 8.21% | ||||||
Ratios and supplemental data: | ||||||||
Net assets, end of period (000 omitted) | $ | 14,841 | $ | 6,470 | ||||
Ratio of expenses to average net assets | 0.66% | 0.64% | ||||||
Ratio of expenses to average net assets prior to fees waived | 0.76% | 0.74% | ||||||
Ratio of net investment income to average net assets | 3.77% | 4.04% | ||||||
Ratio of net investment income to average net assets prior to fees waived | 3.67% | 3.94% | ||||||
Portfolio turnover | 16% | 15% | 4 | |||||
| ||||||||
| 1 | Date of commencement of operations; ratios have been annualized and total return has not been annualized. |
| 2 | The average shares outstanding have been applied for per share information. |
| 3 | Total investment return is based on the change in net asset value of a share during the period and assumes reinvestment of dividends and distributions at net asset value. Total investment return during all of the periods shown reflects a waiver by the manager. Performance would have been lower had the waiver not been in effect. |
| 4 | Portfolio turnover is representative of the Fund for the entire year. |
See accompanying notes, which are an integral part of the financial statements.
76
Table of Contents
| Notes to financial statements | ||
| Delaware Investments® Minnesota Municipal Bond Funds | August 31, 2015 |
Voyageur Mutual Funds is organized as a Delaware statutory trust and offers five series: Delaware Minnesota High-Yield Municipal Bond Fund, Delaware National High-Yield Municipal Bond Fund, Delaware Tax-Free California Fund, Delaware Tax-Free Idaho Fund, and Delaware Tax-Free New York Fund. Voyageur Tax-Free Funds is organized as a Delaware statutory trust and offers Delaware Tax-Free Minnesota Fund. Voyageur Intermediate Tax-Free Funds is organized as a Delaware statutory trust and offers Delaware Tax-Free Minnesota Intermediate Fund. Voyageur Mutual Funds, Voyageur Tax-Free Funds, and Voyageur Intermediate Tax-Free Funds are individually referred to as a Trust and collectively as the Trusts. These financial statements and the related notes pertain to Delaware Tax-Free Minnesota Fund, Delaware Tax-Free Minnesota Intermediate Fund, and Delaware Minnesota High-Yield Municipal Bond Fund (each referred to as a Fund, or collectively, as the Funds). The above Trusts are open-end investment companies. The Funds are considered diversified under the Investment Company Act of 1940, as amended, and offer Class A, Class C, and Institutional Class shares. Class A shares are sold with a maximum front-end sales charge of 4.50% for Delaware Tax-Free Minnesota Fund and Delaware Minnesota High-Yield Municipal Bond Fund, and 2.75% for Delaware Tax-Free Minnesota Intermediate Fund. Class A share purchases of $1,000,000 or more will incur a contingent deferred sales charge (CDSC) of 1.00% if redeemed during the first year, and 0.50% during the second year for Delaware Tax-Free Minnesota Fund and Delaware Minnesota High-Yield Municipal Bond Fund, and 0.75% for Delaware Tax-Free Minnesota Intermediate Fund, if redeemed within the first year, provided that Delaware Distributors, L.P. (DDLP) paid a financial advisor a commission on the purchase of those shares. On May 30, 2013, Delaware Tax-Free Minnesota Intermediate Fund’s Class B shares were eliminated. For Delaware Tax-Free Minnesota Fund and Delaware Minnesota High-Yield Municipal Bond Fund, between June 1, 2007 and Sept. 25, 2014, Class B shares could be purchased only through dividend reinvestment and certain permitted exchanges. Effective Sept. 25, 2014, all remaining shares of Class B were converted to Class A shares. Class B shares automatically converted to Class A shares on a quarterly basis approximately eight years after purchase for Delaware Tax-Free Minnesota Fund and Delaware Minnesota High-Yield Municipal Bond Fund. Class C shares are sold with a CDSC of 1.00%, if redeemed during the first 12 months. Institutional Class shares are not subject to a sales charge and are offered for sale exclusively to certain eligible investors.
The investment objective of Delaware Tax-Free Minnesota Fund is to seek as high a level of current income exempt from federal income tax and from Minnesota state personal income taxes as is consistent with preservation of capital.
The investment objective of Delaware Tax-Free Minnesota Intermediate Fund is to seek to provide investors with preservation of capital and, secondarily, current income exempt from federal income tax and Minnesota state personal income taxes, by maintaining a dollar-weighted average effective portfolio maturity of 10 years or less.
The investment objective of Delaware Minnesota High-Yield Municipal Bond Fund is to seek a high level of current income exempt from federal income tax and from Minnesota state personal income taxes, primarily through investment in medium- and lower-grade municipal obligations.
1. Significant Accounting Policies
The following accounting policies are in accordance with U.S. generally accepted accounting principles (U.S. GAAP) and are consistently followed by the Funds.
77
Table of Contents
Notes to financial statements
Delaware Investments® Minnesota Municipal Bond Funds
1. Significant Accounting Policies (continued)
Security Valuation – Debt securities are valued based upon valuations provided by an independent pricing service or broker and reviewed by management. To the extent current market prices are not available, the pricing service may take into account developments related to the specific security, as well as transactions in comparable securities. Valuations for fixed income securities utilize matrix systems, which reflect such factors as security prices, yields, maturities, and ratings, and are supplemented by dealer and exchange quotations. Open-end investment companies are valued at their published net asset value. Generally, other securities and assets for which market quotations are not readily available are valued at fair value as determined in good faith under the direction of each Fund’s Board of Trustees (each, a Board or, collectively the Boards). In determining whether market quotations are readily available or fair valuation will be used, various factors will be taken into consideration, such as market closures or suspension of trading in a security.
Federal Income Taxes – No provision for federal income taxes has been made as each Fund intends to continue to qualify for federal income tax purposes as a regulated investment company under Subchapter M of the Internal Revenue Code of 1986, as amended, and make the requisite distributions to shareholders. Each Fund evaluates tax positions taken or expected to be taken in the course of preparing each Fund’s tax returns to determine whether the tax positions are “more-likely-than-not” of being sustained by the applicable tax authority. Tax positions not deemed to meet the “more-likely-than-not” threshold are recorded as a tax benefit or expense in the current year. Management has analyzed each Fund’s tax positions taken for all open federal income tax years (Aug. 31, 2012–Aug. 31, 2015) and has concluded that no provision for federal income tax is required in each Fund’s financial statements.
Class Accounting – Investment income and common expenses are allocated to the various classes of each Fund on the basis of “settled shares” of each class in relation to the net assets of each Fund. Realized and unrealized gain (loss) on investments are allocated to the various classes of each Fund on the basis of daily net assets of each class. Distribution expenses relating to a specific class are charged directly to that class.
Use of Estimates – Each Fund is an investment company, whose financial statements are prepared in conformity with U.S. GAAP. Therefore, each Fund follows the accounting and reporting guidelines for investment companies. The preparation of financial statements in conformity with U.S. GAAP requires management to make estimates and assumptions that affect the fair value of investments, the reported amounts of assets and liabilities and disclosure of contingent assets and liabilities at the date of the financial statements, and the reported amounts of revenues and expenses during the reporting period. Actual results could differ from those estimates and the differences could be material.
Other – Expenses directly attributable to a Fund are charged directly to that Fund. Other expenses common to various funds within the Delaware Investments Family of Funds are generally allocated among such funds on the basis of average net assets. Management fees and some other expenses are paid monthly. Security transactions are recorded on the date the securities are purchased or sold (trade date) for financial reporting purposes. Costs used in calculating realized gains and losses on the sale of investment securities are those of the specific securities sold. Interest income is recorded on the accrual
78
Table of Contents
basis. Discounts and premiums on debt securities are accreted or amortized to interest income, respectively, over the lives of the respective securities using the effective interest method. Each Fund declares dividends daily from net investment income and pays the dividends monthly and declares and pays distributions from net realized gain on investments, if any, annually. Each Fund may distribute more frequently, if necessary for tax purposes. Dividends and distributions, if any, are recorded on the ex-dividend date.
Each Fund may receive earnings credits from its custodian when positive cash balances are maintained, which may be used to offset custody fees. There were no earnings credits for the year ended Aug. 31, 2015.
Each Fund receives earnings credits from its transfer agent when positive cash balances are maintained, which may be used to offset transfer agent fees. If the amount earned is greater than one dollar, the expense paid under this arrangement is included on the “Statements of operations” under “Dividend disbursing and transfer agent fees and expenses” with the corresponding expense offset shown under “Less expense paid indirectly.” For the year ended Aug. 31, 2015, each Fund earned the following amounts under this agreement:
| Delaware Tax-Free Minnesota Fund | Delaware Tax-Free Minnesota Intermediate Fund | Delaware Minnesota High-Yield Municipal Bond Fund | ||||
| $139 | $24 | $39 |
2. Investment Management, Administration Agreements, and Other Transactions with Affiliates
In accordance with the terms of its respective investment management agreement, each Fund pays Delaware Management Company (DMC), a series of Delaware Management Business Trust and the investment manager, an annual fee, which is calculated based on each Fund’s average daily net assets as follows:
| Delaware Tax-Free Minnesota Fund | Delaware Tax-Free Minnesota Intermediate Fund | Delaware Minnesota High-Yield Municipal Bond Fund | ||||
On the first $500 million | 0.550% | 0.500% | 0.550% | |||
On the next $500 million | 0.500% | 0.475% | 0.500% | |||
On the next $1.5 billion | 0.450% | 0.450% | 0.450% | |||
In excess of $2.5 billion | 0.425% | 0.425% | 0.425% |
DMC has contractually agreed to waive that portion, if any, of its management fee and/or pay/reimburse each Fund to the extent necessary to ensure that total annual fund operating expenses (excluding any 12b-1 fees, taxes, interest, acquired fund fees and expenses, inverse floater program expenses, short sale and dividend interest expenses, brokerage fees, certain insurance costs, and nonroutine expenses or costs, including, but not limited to, those relating to reorganizations, litigation, conducting shareholder
79
Table of Contents
Notes to financial statements
Delaware Investments® Minnesota Municipal Bond Funds
2. Investment Management, Administration Agreements, and Other Transactions with Affiliates (continued)
meetings, and liquidations (collectively, nonroutine expenses)), do not exceed the following percentage of each Fund’s average daily net assets from Sept. 1, 2014 through Aug. 31, 2015.* For purposes of these waivers and reimbursements, nonroutine expenses may also include such additional costs and expenses, as may be agreed upon from time to time by each Fund’s Board and DMC. These expense waivers and reimbursements apply only to expenses paid directly by each Fund and may only be terminated by agreement of DMC and each Fund.
| Delaware Tax-Free Minnesota Fund | Delaware Tax-Free Minnesota Intermediate Fund | Delaware Minnesota High-Yield Municipal Bond Fund | ||||
Operating expense limitation as a percentage of average daily net assets (per annum) | 0.60% | 0.69% | 0.64% |
Effective Nov. 1, 2014, Delaware Investments Fund Services Company (DIFSC), an affiliate of DMC, provides fund accounting and financial administration oversight services to each Fund. Prior to this time, Delaware Service Company, Inc. (DSC), an affiliate of DMC, provided fund accounting and financial administration oversight services to each Fund under a substantially identical agreement with an identical fee schedule. For these services, DIFSC’s fees are calculated based on the aggregate daily net assets of the Delaware Investments Family of Funds at the following annual rate: 0.0050% of the first $30 billion; 0.0045% of the next $10 billion; 0.0040% of the next $10 billion; and 0.0025% of aggregate average daily net assets in excess of $50 billion. The fees payable to DIFSC under the service agreement described above are allocated among all funds in the Delaware Investments Family of Funds on a relative net asset value basis. These amounts are included on the “Statements of operations” under “Accounting and administration expenses.” For the year ended Aug. 31, 2015, each Fund was charged for these services as follows:
| Delaware Tax-Free Minnesota Fund | Delaware Tax-Free Minnesota Intermediate Fund | Delaware Minnesota High-Yield Municipal Bond Fund | ||||
| $26,562 | $4,915 | $7,907 |
Effective Nov. 1, 2014, DIFSC also became the transfer agent and dividend disbursing agent of the Funds. Prior to this time, DSC was the transfer agent and dividend disbursing agent of each Fund under a substantially identical agreement with an identical fee schedule. For these services, DIFSC’s fees are calculated based on the aggregate daily net assets of the retail funds within the Delaware Investments Family of Funds at the following annual rate: 0.025% of the first $20 billion, 0.020% of the next $5 billion; 0.015% of the next $5 billion; and 0.013% of average daily net assets in excess of $30 billion. The fees
*The contractual waiver period is from Dec. 27, 2013 through Dec. 29, 2015. Prior to Dec. 29, 2014, Delaware Tax-Free Minnesota Fund’s contractual waiver was 0.65%.
80
Table of Contents
payable to DIFSC under the service agreement described above are allocated among all retail funds in the Delaware Investments® Family of Funds on a relative net asset value basis. These amounts are included on the “Statements of operations” under “Dividend disbursing and transfer agent fees and expenses.”
For the year ended Aug. 31, 2015, the amounts charged for each Fund was as follows:
| Delaware Tax-Free Minnesota Fund | Delaware Tax-Free Minnesota Intermediate Fund | Delaware Minnesota High-Yield Municipal Bond Fund | ||||
| $116,656 | $21,589 | $34,720 |
Pursuant to a sub-transfer agency agreement between DIFSC and BNY Mellon Investment Servicing (US) Inc. (BNYMIS), BNYMIS provides certain sub-transfer agency services to each Fund. Sub-transfer agency fees are passed on to and paid by each Fund.
Pursuant to a distribution agreement and distribution plan, each Fund pays DDLP, the distributor and an affiliate of DMC, an annual distribution and service fee of 0.25% of the average daily net assets of the Class A shares and 1.00% of the average daily net assets of the Class C shares. Delaware Tax-Free Minnesota Fund and Delaware Minnesota High-Yield Municipal Bond Fund’s Class B shares were subject to a 12b-1 fee of 1.00% of the average daily net assets, which was contractually waived to 0.25% of average daily net assets from Sept. 1, 2014 through Sept. 25, 2014. DDLP has contracted to waive Delaware Tax-Free Minnesota Intermediate Fund’s Class A shares to 0.15% of average daily net assets from Sept. 1, 2014 through Aug. 31, 2015.* Institutional Class shares pay no distribution and service fees.
As provided in the investment management agreement, each Fund bears a portion of the cost of certain resources shared with DMC, including the cost of internal personnel of DMC and/or its affiliates that provide legal, tax, and regulatory reporting services to each Fund. These amounts are included on the “Statements of operations” under “Legal fees.” For the year ended Aug. 31, 2015, each Fund was charged for internal legal, tax, and regulatory reporting services provided by DMC and/or its affiliates’ employees as follows:
| Delaware Tax-Free Minnesota Fund | Delaware Tax-Free Minnesota Intermediate Fund | Delaware Minnesota High-Yield Municipal Bond Fund | ||||
| $14,630 | $2,718 | $4,328 |
For the year ended Aug. 31, 2015, DDLP earned commissions on sales of each Fund’s Class A shares as follows:
| Delaware Tax-Free Minnesota Fund | Delaware Tax-Free Minnesota Intermediate Fund | Delaware Minnesota High-Yield Municipal Bond Fund | ||||
| $47,409 | $8,071 | $13,417 |
*The contractual waiver period is from Dec. 27, 2013 through Dec. 29, 2015.
81
Table of Contents
Notes to financial statements
Delaware Investments® Minnesota Municipal Bond Funds
2. Investment Management, Administration Agreements, and Other Transactions with Affiliates (continued)
For the year ended Aug. 31, 2015, DDLP received gross CDSC commissions on redemption of each Fund’s Class A and Class C shares. These commissions were entirely used to offset upfront commissions previously paid by DDLP to broker/dealers on sales of those shares. The amounts received were as follows:
Delaware | Delaware Tax-Free | Delaware Minnesota | ||||||||
Class A | $1,242 | $7,547 | $2,060 | |||||||
Class C | 1,945 | 1,213 | 3,864 |
Trustees’ fees include expenses accrued by each Fund for each Trustee’s retainer and meeting fees. Certain officers of DMC, DIFSC, and DDLP are officers and/or Trustees of the Trusts. These officers and Trustees are paid no compensation by the Funds.
3. Investments
For the year ended Aug. 31, 2015, each Fund made purchases and sales of investment securities other than short-term investments as follows:
| Delaware Tax-Free Minnesota Fund | Delaware Tax-Free | Delaware Minnesota | ||||||||
Purchases | $59,707,266 | $14,009,158 | $39,199,810 | |||||||
Sales | 64,020,423 | 16,549,177 | 26,988,248 |
At Aug. 31, 2015, the cost and unrealized appreciation (depreciation) of investments for federal income tax purposes for each Fund were as follows:
Delaware | Delaware Tax-Free Minnesota Intermediate Fund | Delaware Minnesota High-Yield Municipal Bond Fund | ||||||||||
Cost of investments | $ | 519,231,390 | $96,251,328 | $164,407,776 | ||||||||
|
|
|
| |||||||||
Aggregate unrealized appreciation of investments | $ | 35,302,977 | $ 5,123,953 | $ 7,173,047 | ||||||||
Aggregate unrealized depreciation of investments | (832,009 | ) | (88,273) | (430,536) | ||||||||
|
|
|
| |||||||||
Net unrealized appreciation of investments | $ | 34,470,968 | $ 5,035,680 | $ 6,742,511 | ||||||||
|
|
|
| |||||||||
U.S. GAAP defines fair value as the price that each Fund would receive to sell an asset or pay to transfer a liability in an orderly transaction between market participants at the measurement date under current market conditions. A three-level hierarchy for fair value measurements has been established based upon the transparency of inputs to the valuation of an asset or liability. Inputs may be observable or unobservable and refer broadly to the assumptions that market participants would use in pricing the
82
Table of Contents
asset or liability. Observable inputs reflect the assumptions market participants would use in pricing the asset or liability based on market data obtained from sources independent of the reporting entity. Unobservable inputs reflect the reporting entity’s own assumptions about the assumptions that market participants would use in pricing the asset or liability based on the best information available under the circumstances. Each Fund’s investment in its entirety is assigned a level based upon the observability of the inputs which are significant to the overall valuation. The three-level hierarchy of inputs is summarized below.
| Level 1 – | Inputs are quoted prices in active markets for identical investments. (Examples: equity securities, open-end investment companies, futures contracts, exchange-traded options contracts) | |
| Level 2 – | Other observable inputs, including, but not limited to: quoted prices for identical or similar assets or liabilities in markets that are active, quoted prices for identical or similar assets or liabilities in markets that are not active, inputs other than quoted prices that are observable for the assets or liabilities (such as interest rates, yield curves, volatilities, prepayment speeds, loss severities, credit risks and default rates), or other market-corroborated inputs. (Examples: debt securities, government securities, swap contracts, foreign currency exchange contracts, foreign securities utilizing international fair value pricing, broker-quoted securities, fair valued securities) | |
| Level 3 – | Significant unobservable inputs, including each Fund’s own assumptions used to determine the fair value of investments. (Examples: broker-quoted securities, fair valued securities) | |
Level 3 investments are valued using significant unobservable inputs. Each Fund may also use an income-based valuation approach in which the anticipated future cash flows of the investment are discounted to calculate fair value. Discounts may also be applied due to the nature or duration of any restrictions on the disposition of the investments. Valuations may also be based upon current market prices of securities that are comparable in coupon, rating, maturity, and industry. The derived value of a Level 3 investment may not represent the value which is received upon disposition and this could impact the results of operations.
83
Table of Contents
Notes to financial statements
Delaware Investments® Minnesota Municipal Bond Funds
3. Investments (continued)
The following tables summarize the valuation of each Fund’s investments by fair value hierarchy levels as of Aug. 31, 2015:
Delaware Tax-Free Minnesota Fund | ||||||||||||
Securities | Level 1 | Level 2 | Total | |||||||||
Municipal Bonds | $ | — | $ | 550,906,831 | $ | 550,906,831 | ||||||
Short-Term Investments1 | 195,527 | 2,600,000 | 2,795,527 | |||||||||
|
|
|
|
|
| |||||||
Total Value of Securities | $ | 195,527 | $ | 553,506,831 | $ | 553,702,358 | ||||||
|
|
|
|
|
| |||||||
Delaware Tax-Free Minnesota Intermediate Fund | ||||||||||||
Securities | Level 1 | Level 2 | Total | |||||||||
Municipal Bonds | $ | — | $ | 100,480,752 | $ | 100,480,752 | ||||||
Short-Term Investments1 | 181,256 | 625,000 | 806,256 | |||||||||
|
|
|
|
|
| |||||||
Total Value of Securities | $ | 181,256 | $ | 101,105,752 | $ | 101,287,008 | ||||||
|
|
|
|
|
| |||||||
Delaware Minnesota High-Yield Municipal Bond Fund | ||||||||||||||
Securities | Level 1 | Level 2 | Total | |||||||||||
Municipal Bonds | $ | — | $ | 169,064,152 | $ | 169,064,152 | ||||||||
Short-Term Investments1 | 86,135 | 2,000,000 | 2,086,135 | |||||||||||
|
|
|
|
|
| |||||||||
Total Value of Securities | $ | 86,135 | $ | 171,064,152 | $ | 171,150,287 | ||||||||
|
|
|
|
|
| |||||||||
| 1 | Security type is valued across multiple levels. Level 1 investments represent exchange-traded investments while Level 2 investments represent matrix-priced investments. The amounts attributed to Level 1 investments and Level 2 investments represent the following percentages of the total market value of this security type for each Fund: |
| Delaware Tax-Free Minnesota Fund | Delaware Tax-Free Minnesota Intermediate Fund | Delaware Minnesota High-Yield Municipal Bond Fund | |||||||||||||
Short-Term Investments | |||||||||||||||
Level 1 | 6.99 | % | 22.48 | % | 4.13 | % | |||||||||
Level 2 | 93.01 | % | 77.52 | % | 95.87 | % | |||||||||
Total | 100.00 | % | 100.00 | % | 100.00 | % | |||||||||
During the year ended Aug. 31, 2015, there were no transfers between Level 1 investments, Level 2 investments, or Level 3 investments that had a significant impact to the Funds. Each Fund’s policy is to recognize transfers between levels at the beginning of the reporting period.
A reconciliation of Level 3 investments is presented when each Fund has a significant amount of Level 3 investments at the beginning, interim, or end of the period in relation to net assets. At Aug. 31, 2015, there were no Level 3 investments.
84
Table of Contents
4. Dividend and Distribution Information
Income and long-term capital gain distributions are determined in accordance with federal income tax regulations, which may differ from U.S. GAAP. Additionally, distributions from net short-term gains on sales of investment securities are treated as ordinary income for federal income tax purposes. The tax character of dividends and distributions paid during the years ended Aug. 31, 2015 and 2014 was as follows:
| Delaware Tax-Free Minnesota Fund | Delaware Tax-Free Minnesota Intermediate Fund | Delaware Minnesota High-Yield Municipal Bond Fund | |||||||||||||
Year ended 8/31/15 | |||||||||||||||
Ordinary income | $ | 128,074 | $ | — | $ | 27,212 | |||||||||
Tax-exempt income | 19,418,118 | 2,998,344 | 5,649,666 | ||||||||||||
|
|
|
|
|
| ||||||||||
Total | $ | 19,546,192 | $ | 2,998,344 | $ | 5,676,878 | |||||||||
|
|
|
|
|
| ||||||||||
Year ended 8/31/14 | |||||||||||||||
Ordinary income | $ | 2,809 | $ | — | $ | — | |||||||||
Tax-exempt income | 20,097,468 | 3,073,055 | 5,610,632 | ||||||||||||
Long-term capital gains | 1,606,468 | 87,587 | — | ||||||||||||
|
|
|
|
|
| ||||||||||
Total | $ | 21,706,745 | $ | 3,160,642 | $ | 5,610,632 | |||||||||
|
|
|
|
|
| ||||||||||
5. Components of Net Assets on a Tax Basis
As of Aug. 31, 2015, the components of net assets on a tax basis were as follows:
| Delaware Tax-Free Minnesota Fund | Delaware Tax-Free Minnesota Intermediate Fund | Delaware Minnesota High-Yield Municipal Bond Fund | |||||||||||||
Shares of beneficial interest | $ | 525,270,285 | $ | 95,916,709 | $ | 167,832,301 | |||||||||
Undistributed tax-exempt income | 297,901 | 75,170 | 135,547 | ||||||||||||
Capital loss carryforwards | (2,762,394 | ) | (145,774 | ) | (4,939,117 | ) | |||||||||
Distributions payable | (524,742 | ) | (76,489 | ) | (138,230 | ) | |||||||||
Unrealized appreciation of investments | 34,470,968 | 5,035,680 | 6,742,511 | ||||||||||||
|
|
|
|
|
| ||||||||||
Net assets | $ | 556,752,018 | $ | 100,805,296 | $ | 169,633,012 | |||||||||
|
|
|
|
|
| ||||||||||
The differences between book basis and tax basis components of net assets are primarily attributable to tax treatment of market discount and premium on debt instruments.
For financial reporting purposes, capital accounts are adjusted to reflect the tax character of permanent book/tax differences. Reclassifications are primarily due to tax treatment of market discount and premium on certain debt instruments. Results of operations and net assets were not affected by these reclassifications. For the year ended Aug. 31, 2015, each Fund recorded the following reclassifications:
85
Table of Contents
Notes to financial statements
Delaware Investments® Minnesota Municipal Bond Funds
5. Components of Net Assets on a Tax Basis (continued)
| Delaware Tax-Free Minnesota Fund | Delaware Tax-Free Minnesota Intermediate Fund | Delaware Minnesota High-Yield Municipal Bond Fund | |||||||||||||
Distributions in excess of net investment income | $ | 106,161 | $ | 10 | $ | 12,465 | |||||||||
Accumulated net realized loss | (106,161 | ) | (10 | ) | (12,465 | ) | |||||||||
For federal income tax purposes, capital loss carryforwards may be carried forward and applied against future capital gains.
Capital loss carryforwards remaining at Aug. 31, 2015 will expire as follows:
Year of expiration | Delaware Tax-Free Minnesota Fund | Delaware Tax-Free Minnesota Intermediate Fund | Delaware Minnesota High-Yield Municipal Bond Fund | ||||||||||||
2017 | $ | — | $ | — | $ | 83,961 | |||||||||
2018 | — | — | 2,974,512 | ||||||||||||
|
|
|
|
|
| ||||||||||
Total | $ | — | $ | — | $ | 3,058,473 | |||||||||
|
|
|
|
|
| ||||||||||
On Dec. 22, 2010, the Regulated Investment Company Modernization Act of 2010 (Act) was enacted, which changed various technical rules governing the tax treatment of regulated investment companies. The changes are generally effective for taxable years beginning after the date of enactment. Under the Act, the Funds are permitted to carry forward capital losses incurred in taxable years beginning after the date of enactment for an unlimited period. However, any losses incurred during those future taxable years will be required to be utilized prior to the losses incurred in pre-enactment taxable years, which carry an expiration date. As a result of this ordering rule, pre-enactment capital loss carryforwards may be more likely to expire unused. Additionally, post-enactment capital loss carryforwards will retain their character as either short-term or long-term capital losses rather than being considered all short-term as permitted under previous regulation.
Losses incurred that will be carried forward under the Act are as follows:
| Loss carryforward character | ||||||||||
Short-term | Long-term | |||||||||
Delaware Tax-Free Minnesota Fund | $ | 2,138,010 | $ | 624,384 | ||||||
Delaware Tax-Free Minnesota Intermediate Fund | 145,774 | — | ||||||||
Delaware Minnesota High-Yield Municipal Bond Fund | 743,481 | 1,137,163 | ||||||||
86
Table of Contents
In 2015, the Funds utilized capital loss carryforwards as follows:
| Delaware Tax-Free Minnesota Fund | Delaware Tax-Free Minnesota Intermediate Fund | Delaware Minnesota High-Yield Municipal Bond Fund | |||||||||||||
Capital loss carryforwards utilized | $ | 1,452,993 | $ | 194,821 | $ | 498,660 | |||||||||
6. Capital Shares
Transactions in capital shares were as follows:
| Delaware Tax-Free Minnesota Fund | Delaware Tax-Free Minnesota Intermediate Fund | Delaware Minnesota High-Yield Municipal Bond Fund | ||||||||||||||||||||||
Year ended |
Year ended |
Year ended | ||||||||||||||||||||||
| 8/31/15 | 8/31/14 | 8/31/15 | 8/31/14 | 8/31/15 | 8/31/14 | |||||||||||||||||||
Shares sold: | ||||||||||||||||||||||||
Class A | 1,798,126 | 1,943,462 | 875,739 | 1,190,344 | 1,810,912 | 1,749,743 | ||||||||||||||||||
Class C | 554,042 | 338,752 | 135,340 | 112,022 | 394,131 | 288,536 | ||||||||||||||||||
Institutional Class | 1,311,449 | 1,389,451 | 218,794 | 227,004 | 856,436 | 607,167 | ||||||||||||||||||
Shares issued upon reinvestment of dividends and distributions: |
| |||||||||||||||||||||||
Class A | 1,109,147 | 1,352,756 | 206,393 | 227,528 | 312,703 | 347,473 | ||||||||||||||||||
Class B | 74 | 1,901 | — | — | 126 | 2,708 | ||||||||||||||||||
Class C | 84,130 | 93,759 | 21,032 | 26,463 | 72,841 | 81,961 | ||||||||||||||||||
Institutional Class | 72,360 | 8,142 | 7,994 | 840 | 40,477 | 1,989 | ||||||||||||||||||
|
|
|
|
|
|
|
|
|
|
|
| |||||||||||||
| 4,929,328 | 5,128,223 | 1,465,292 | 1,784,201 | 3,487,626 | 3,079,577 | |||||||||||||||||||
|
|
|
|
|
|
|
|
|
|
|
| |||||||||||||
Shares redeemed: | ||||||||||||||||||||||||
Class A | (4,572,539 | ) | (8,748,013 | ) | (1,535,695 | ) | (1,730,738 | ) | (1,755,989 | ) | (2,982,941 | ) | ||||||||||||
Class B | (36,119 | ) | (61,275 | ) | — | — | (48,250 | ) | (84,153 | ) | ||||||||||||||
Class C | (320,507 | ) | (738,325 | ) | (227,258 | ) | (361,678 | ) | (466,331 | ) | (636,359 | ) | ||||||||||||
Institutional Class | (220,610 | ) | (13,194 | ) | (44,335 | ) | (18,049 | ) | (122,603 | ) | (14,395 | ) | ||||||||||||
|
|
|
|
|
|
|
|
|
|
|
| |||||||||||||
| (5,149,775 | ) | (9,560,807 | ) | (1,807,288 | ) | (2,110,465 | ) | (2,393,173 | ) | (3,717,848 | ) | |||||||||||||
|
|
|
|
|
|
|
|
|
|
|
| |||||||||||||
Net increase (decrease) | (220,447 | ) | (4,432,584 | ) | (341,996 | ) | (326,264 | ) | 1,094,453 | (638,271 | ) | |||||||||||||
|
|
|
|
|
|
|
|
|
|
|
| |||||||||||||
87
Table of Contents
Notes to financial statements
Delaware Investments® Minnesota Municipal Bond Funds
6. Capital Shares (continued)
For the years ended Aug. 31, 2015 and 2014, the following shares and values were converted from Class B to Class A. The amounts are included in Class B redemptions, and Class A subscriptions in the tables on the previous page and the “Statements of changes in net assets.”
| Class B Shares | Year ended 8/31/15 Class A Shares | Value | Class B Shares | Year ended 8/31/14 Class A Shares | Value | |||||||||||||||||||
Delaware Tax-Free Minnesota Fund | 28,929 | 28,957 | $ | 366,598 | 30,058 | 31,113 | $ | 371,303 | ||||||||||||||||
Delaware Minnesota High-Yield Municipal Bond Fund | 23,383 | 23,431 | 254,934 | 23,300 | 23,364 | 245,373 | ||||||||||||||||||
Certain shareholders may exchange shares of one class of shares for another class in the same Fund. These exchange transactions are included as subscriptions and redemptions in the tables on the previous page, and the “Statements of changes in net assets.” For the years ended Aug. 31, 2015 and 2014, the Funds had the following exchange transactions:
| Year ended | ||||||||||||||||||||||||
| 8/31/15 | ||||||||||||||||||||||||
| Exchange Redemptions | Exchange Subscriptions | |||||||||||||||||||||||
| Class A Shares | Class C Shares | Value | Class A Shares | Institutional Class Shares | Value | |||||||||||||||||||
Delaware Tax-Free Minnesota Fund | 2,080 | 2,255 | $55,257 | — | 4,348 | $55,257 | ||||||||||||||||||
Delaware Tax-Free Minnesota Intermediate Fund | — | 1,832 | 20,911 | 1,838 | — | 20,911 | ||||||||||||||||||
Delaware Minnesota High-Yield Municipal Bond Fund | 3,147 | — | 34,186 | — | 3,154 | 34,186 | ||||||||||||||||||
| Year ended | ||||||||||||||||
| 8/31/14 | ||||||||||||||||
| Exchange Redemptions | Exchange Subscriptions | |||||||||||||||
| Class A Shares | Value | Institutional Class Shares | Value | |||||||||||||
Delaware Tax-Free Minnesota Fund | 20,896 | $ 262,760 | 20,971 | $ 262,760 | ||||||||||||
Delaware Tax-Free Minnesota Intermediate Fund | 112,227 | 1,262,654 | 112,447 | 1,262,654 | ||||||||||||
88
Table of Contents
7. Line of Credit
Each Fund, along with certain other funds in the Delaware Investments® Family of Funds (Participants), was a participant in a $225,000,000 revolving line of credit intended to be used for temporary or emergency purposes as an additional source of liquidity to fund redemptions of investor shares. Under the agreement, the Participants were charged an annual commitment fee of 0.08%, which was allocated across the Participants on the basis of each Participant’s allocation of the entire facility. The Participants were permitted to borrow up to a maximum of one third of their net assets under the agreement. Each Participant was individually, and not jointly, liable for its particular advances, if any, under the line of credit. The line of credit under the agreement expired on Nov. 10, 2014.
On Nov. 10, 2014, each Fund, along with the other Participants, entered into an amendment to the agreement for a $275,000,000 revolving line of credit. The line of credit is to be used as described above and operates in substantially the same manner as the original agreement. The line of credit available under the agreement expires on Nov. 9, 2015.
The Funds had no amounts outstanding as of Aug. 31, 2015, or at any time during the year then ended.
8. Geographic, Credit, and Market Risks
The Funds concentrate their investments in securities issued by municipalities, mainly in Minnesota, and may be subject to geographic concentration risk. In addition, the Funds have the flexibility to invest in issuers in U.S. territories and possessions such as the Commonwealth of Puerto Rico, the U.S. Virgin Islands, and Guam whose bonds are also free of federal and individual state income taxes.
The value of the Funds’ investments may be adversely affected by new legislation within the state or, U.S. territories, regional or local economic conditions, and differing levels of supply and demand for municipal bonds. Many municipalities insure repayment for their obligations. Although bond insurance reduces the risk of loss due to default by an issuer, such bonds remain subject to the risk that value may fluctuate for other reasons, and there is no certainty that the insurance company will meet its obligations. A real or perceived decline in creditworthiness of a bond insurer can have an adverse impact on the value of insured bonds held in each Fund. At Aug. 31, 2015, the percentages of each Fund’s net assets insured by bond insurers are listed below, and these securities have been identified in the “Schedules of investments.”
Delaware | Delaware Tax-Free | Delaware Minnesota High-Yield Municipal Bond Fund | ||
8.67% | 9.78% | 5.89% |
Each Fund invests a portion of its assets in high yield fixed income securities, which are securities rated lower than BBB- by Standard & Poor’s Financial Services LLC (S&P) and lower than Baa3 by Moody’s Investors Service Inc. (Moody’s), or similarly rated by another nationally recognized statistical rating organization. Investments in these higher yielding securities are generally accompanied by a greater degree of credit risk than higher rated securities. Additionally, lower rated securities may be more susceptible to adverse economic and competitive industry conditions than investment grade securities.
89
Table of Contents
Notes to financial statements
Delaware Investments® Minnesota Municipal Bond Funds
8. Geographic, Credit, and Market Risks (continued)
Each Fund invests in certain obligations that may have liquidity protection designed to ensure that the receipt of payments due on the underlying security is timely. Such protection may be provided through guarantees, insurance policies, or letters of credit obtained by the issuer or sponsor through third parties, through various means of structuring the transaction or through a combination of such approaches. Each Fund will not pay any additional fees for such credit support, although the existence of credit support may increase the price of a security.
Each Fund may invest in advance refunded bonds, escrow secured bonds, or defeased bonds. Under current federal tax laws and regulations, state and local government borrowers are permitted to refinance outstanding bonds by issuing new bonds. The issuer refinances the outstanding debt to either reduce interest costs or to remove or alter restrictive covenants imposed by the bonds being refinanced. A refunding transaction where the municipal securities are being refunded within 90 days from the issuance of the refunding issue is known as a “current refunding.” Advance refunded bonds are bonds in which the refunded bond issue remains outstanding for more than 90 days following the issuance of the refunding issue. In an advance refunding, the issuer will use the proceeds of a new bond issue to purchase high grade interest bearing debt securities, which are then deposited in an irrevocable escrow account held by an escrow agent to secure all future payments of principal and interest and bond premium of the advance refunded bond. Bonds are “escrowed to maturity” when the proceeds of the refunding issue are deposited in an escrow account for investment sufficient to pay all of the principal and interest on the original interest payment and maturity dates.
Bonds are considered “pre-refunded” when the refunding issue’s proceeds are escrowed only until a permitted call date or dates on the refunded issue with the refunded issue being redeemed at the time, including any required premium. Bonds become “defeased” when the rights and interests of the bondholders and of their lien on the pledged revenues or other security under the terms of the bond contract are substituted with an alternative source of revenues (the escrow securities) sufficient to meet payments of principal and interest to maturity or to the first call dates. Escrowed secured bonds will often receive a rating of AAA from Moody’s, S&P, and/or Fitch Ratings due to the strong credit quality of the escrow securities and the irrevocable nature of the escrow deposit agreement.
Each Fund may invest up to 15% of its net assets in illiquid securities, which may include securities with contractual restrictions on resale, securities exempt from registration under Rule 144A of the Securities Act of 1933, as amended, and other securities which may not be readily marketable. The relative illiquidity of these securities may impair each Fund from disposing of them in a timely manner and at a fair price when it is necessary or desirable to do so. While maintaining oversight, the Boards have delegated to DMC, the day-to-day functions of determining whether individual securities are liquid for purposes of each Fund’s limitation on investments in illiquid securities. Securities eligible for resale pursuant to Rule 144A, which are determined to be liquid, are not subject to each Fund’s 15% limit on investments in illiquid securities. Rule 144A and illiquid securities have been identified on the “Schedules of investments.”
9. Contractual Obligations
Each Fund enters into contracts in the normal course of business that contain a variety of indemnifications. Each Fund’s maximum exposure under these arrangements is unknown. However,
90
Table of Contents
each Fund has not had prior claims or losses pursuant to these contracts. Management has reviewed each Fund’s existing contracts and expects the risk of loss to be remote.
10. Recent Accounting Pronouncements
In June 2014, the Financial Accounting Standards Board (FASB) issued guidance to improve the financial reporting of reverse repurchase agreements and other similar transactions. The guidance includes expanded disclosure requirements for entities that enter into reverse repurchase agreements and similar transactions accounted for as secured borrowings. The guidance is effective for financial statements with fiscal years beginning on or after Dec. 15, 2014 and interim periods within those fiscal years. Management has determined that this pronouncement has no impact to each Fund’s financial statements.
In May 2015, the FASB issued Accounting Standards Update (“ASU”) No. 2015-07 regarding “Disclosures for Investments in Certain Entities That Calculate Net Asset Value per Share.” The amendments in this update are effective for the Funds for fiscal years beginning after Dec. 15, 2015, and interim periods within those fiscal years. ASU No. 2015-07 will eliminate the requirement to categorize investments in the fair value hierarchy if their fair value is measured at net asset value (“NAV”) per share (or its equivalent) using the practical expedient in the FASB’s fair value measurement guidance. At this time, management is evaluating the implications of ASU No. 2015-07 and its impact on the financial statement disclosures has not yet been determined.
11. Subsequent Events
Management has determined that no material events or transactions occurred subsequent to Aug. 31, 2015, that would require recognition or disclosure in the Funds’ financial statements.
91
Table of Contents
Report of independent registered
public accounting firm
To the Board of Trustees of Voyageur Tax-Free Funds, Voyageur Intermediate Tax-Free Funds and Voyageur Mutual Funds and the Shareholders of Delaware Tax-Free Minnesota Fund, Delaware Tax-Free Minnesota Intermediate Fund and Delaware Minnesota High-Yield Municipal Bond Fund:
In our opinion, the accompanying statements of assets and liabilities, including the schedules of investments, and the related statements of operations and of changes in net assets and the financial highlights present fairly, in all material respects, the financial position of Delaware Tax-Free Minnesota Fund (constituting Voyageur Tax-Free Funds), Delaware Tax-Free Minnesota Intermediate Fund (constituting Voyageur Intermediate Tax-Free Funds) and Delaware Minnesota High-Yield Municipal Bond Fund (one of the series constituting Voyageur Mutual Funds) (hereafter collectively referred to as the “Funds”) at August 31, 2015, the results of each of their operations for the year then ended, the changes in each of their net assets for each of the two years in the period then ended and the financial highlights for each of the periods indicated, in conformity with accounting principles generally accepted in the United States of America. These financial statements and financial highlights (hereafter referred to as “financial statements”) are the responsibility of the Funds’ management. Our responsibility is to express an opinion on these financial statements based on our audits. We conducted our audits of these financial statements in accordance with the standards of the Public Company Accounting Oversight Board (United States). Those standards require that we plan and perform the audit to obtain reasonable assurance about whether the financial statements are free of material misstatement. An audit includes examining, on a test basis, evidence supporting the amounts and disclosures in the financial statements, assessing the accounting principles used and significant estimates made by management, and evaluating the overall financial statement presentation. We believe that our audits, which included confirmation of securities at August 31, 2015 by correspondence with the custodian and brokers and the application of alternative auditing procedures where confirmations of securities purchased had not been received, provide a reasonable basis for our opinion.
PricewaterhouseCoopers LLP
Philadelphia, Pennsylvania
October 22, 2015
92
Table of Contents
Other Fund information (Unaudited)
Delaware Investments® Minnesota Municipal Bond Funds
Tax Information
The information set forth below is for each Fund’s fiscal year as required by federal income tax laws. Shareholders, however, must report distributions on a calendar year basis for income tax purposes, which may include distributions for portions of two fiscal years of the Funds. Accordingly, the information needed by shareholders for income tax purposes will be sent to them in January of each year. Please consult your tax advisor for proper treatment of this information.
All disclosures are based on financial information available as of the date of this annual report and, accordingly are subject to change. For any and all items requiring reporting, it is the intention of the Funds to report the maximum amount permitted under the Internal Revenue Code and the regulations thereunder.
For the fiscal year ended Aug. 31, 2015, each Fund reports distributions paid during the year as follows:
| (A) Ordinary Income Distributions (Tax Basis) | (B)
Tax-Exempt | Total Distributions (Tax Basis) | |||||||||||||
Delaware Tax-Free Minnesota Fund | 0.66 | % | 99.34 | % | 100.00 | % | |||||||||
Delaware Tax-Free Minnesota Intermediate Fund | — | 100.00 | % | 100.00 | % | ||||||||||
Delaware Minnesota High-Yield Municipal Bond Fund | 0.48 | % | 99.52 | % | 100.00 | % | |||||||||
(A) and (B) are based on a percentage of each Fund’s total distributions.
Proxy Results
At Joint Special Meetings of Shareholders of Voyageur Tax Free Funds, on behalf of Delaware Tax-Free Minnesota Fund, held on March 31, 2015, at Joint Special Meetings of Shareholders of Voyageur Intermediate Tax Free Funds, on behalf of Delaware Tax-Free Minnesota Intermediate Fund, held on March 31, 2015 and reconvened to April 21, 2015 and May 12, 2015 for the proposals listed in items (ii) and (iii) below for Delaware Tax-Free Minnesota Intermediate Fund, and at Joint Special Meetings of Shareholders of Voyageur Mutual Funds, on behalf of Delaware Minnesota High-Yield Municipal Bond Fund, Delaware National High-Yield Municipal Bond Fund, Delaware Tax-Free California Fund, Delaware Tax-Free Idaho Fund, and Delaware Tax-Free New York Fund, held on March 31, 2015 and reconvened to April 21, 2015, May 12, 2015, and June 2, 2015 for the proposals listed in items (ii) and (iii) below for Delaware Minnesota High-Yield Municipal Bond Fund (Delaware Tax-Free Minnesota Fund, Delaware Tax-Free Minnesota Intermediate Fund, and Delaware Minnesota High-Yield Municipal Bond Fund, each a “Fund” and together the “Funds,” and Voyageur Tax Free Funds, Voyageur Intermediate Tax Free Funds, and Voyageur Mutual Funds, each a “Trust” and together the “Trusts”), the shareholders of the Trusts/the Funds voted to: (i) elect a Board of Trustees for the Trust; (ii) approve the implementation of a
93
Table of Contents
Other Fund information (Unaudited)
Delaware Investment® Minnesota Municipal Bond Funds
Proxy Results (continued)
new “manager of managers” order for the Funds; (iii) revise the fundamental investment restriction relating to lending for the Funds; and (iv)(a) revise provisions of each Trust’s Agreement and Declaration of Trust related to documenting the transfer of shares, (iv)(b) revise provisions of each Trust’s Agreement and Declaration of Trust related to shareholder disclosure of certain information upon board demand, and (iv)(c) revise provisions of each Trust’s By-Laws so that Delaware law will apply to matters related to proxies. At the meeting, the following people were elected to serve as Independent Trustees: Thomas L. Bennett, Ann D. Borowiec, Joseph W. Chow, John A. Fry, Lucinda S. Landreth, Frances A. Sevilla-Sacasa, Thomas K. Whitford, Janet L. Yeomans, and J. Richard Zecher. In addition, Patrick P. Coyne was elected to serve as an Interested Trustee.
The following proposals were submitted for a vote of the shareholders:
1. To elect a Board of Trustees for each Trust.
A quorum of shares outstanding of the Funds of each Trust was present, and the votes passed with a plurality of these Shares.
Voyageur Tax Free Funds
Shares Voted For | % of Outstanding Shares | % of Shares Voted | Shares Withheld | % of Outstanding Shares | % of Shares Voted | |||||||||||||||
Thomas L. Bennett | 28,192,113.751 | 63.443% | 97.063% | 853,178.228 | 1.920% | 2.937% | ||||||||||||||
Ann D. Borowiec | 28,127,307.797 | 63.297% | 96.839% | 917,984.182 | 2.066% | 3.161% | ||||||||||||||
Joseph W. Chow | 28,215,515.587 | 63.495% | 97.143% | 829,776.392 | 1.867% | 2.857% | ||||||||||||||
Patrick P. Coyne | 28,186,300.611 | 63.430% | 97.043% | 858,991.368 | 1.933% | 2.957% | ||||||||||||||
John A. Fry | 28,218,865.814 | 63.503% | 97.155% | 826,426.165 | 1.860% | 2.845% | ||||||||||||||
Lucinda S. Landreth | 28,199,951.384 | 63.460% | 97.090% | 845,340.595 | 1.902% | 2.910% | ||||||||||||||
Frances A. Sevilla-Sacasa | 28,184,930.875 | 63.427% | 97.038% | 860,361.104 | 1.936% | 2.962% | ||||||||||||||
Thomas K. Whitford | 28,216,177.787 | 63.497% | 97.145% | 829,114.192 | 1.866% | 2.855% | ||||||||||||||
Janet L. Yeomans | 28,209,140.298 | 63.481% | 97.121% | 836,151.681 | 1.882% | 2.879% | ||||||||||||||
J. Richard Zecher | 28,167,948.428 | 63.388% | 96.979% | 877,343.551 | 1.974% | 3.021% | ||||||||||||||
94
Table of Contents
Voyageur Intermediate Tax Free Funds
Shares Voted For | % of Outstanding Shares | % of Shares Voted | Shares Withheld | % of Outstanding Shares | % of Shares Voted | |||||||||||||||
Thomas L. Bennett | 5,414,400.958 | 59.626% | 99.242% | 41,349.806 | 0.455% | 0.758% | ||||||||||||||
Ann D. Borowiec | 5,402,723.958 | 59.498% | 99.028% | 53,026.806 | 0.584% | 0.972% | ||||||||||||||
Joseph W. Chow | 5,413,849.958 | 59.620% | 99.232% | 41,900.806 | 0.461% | 0.768% | ||||||||||||||
Patrick P. Coyne | 5,414,400.958 | 59.626% | 99.242% | 41,349.806 | 0.455% | 0.758% | ||||||||||||||
John A. Fry | 5,411,577.958 | 59.595% | 99.190% | 44,172.806 | 0.486% | 0.810% | ||||||||||||||
Lucinda S. Landreth | 5,402,723.958 | 59.498% | 99.028% | 53,026.806 | 0.584% | 0.972% | ||||||||||||||
Frances A. Sevilla-Sacasa | 5,413,566.958 | 59.617% | 99.227% | 42,183.806 | 0.465% | 0.773% | ||||||||||||||
Thomas K. Whitford | 5,414,400.958 | 59.626% | 99.242% | 41,349.806 | 0.455% | 0.758% | ||||||||||||||
Janet L. Yeomans | 5,410,129.958 | 59.579% | 99.164% | 45,620.806 | 0.502% | 0.836% | ||||||||||||||
J. Richard Zecher | 5,413,005.958 | 59.611% | 99.217% | 42,744.806 | 0.471% | 0.783% | ||||||||||||||
Voyageur Mutual Funds
Shares Voted For | % of Outstanding Shares | % of Shares Voted | Shares Withheld | % of Outstanding Shares | % of Shares Voted | |||||||||||||||
Thomas L. Bennett | 77,276,795.607 | 65.123% | 98.335% | 1,308,193.317 | 1.102% | 1.665% | ||||||||||||||
Ann D. Borowiec | 77,397,915.799 | 65.225% | 98.489% | 1,187,073.125 | 1.000% | 1.511% | ||||||||||||||
Joseph W. Chow | 77,285,371.301 | 65.130% | 98.346% | 1,299,617.623 | 1.095% | 1.654% | ||||||||||||||
Patrick P. Coyne | 77,395,165.343 | 65.222% | 98.486% | 1,189,823.581 | 1.003% | 1.514% | ||||||||||||||
John A. Fry | 77,394,790.343 | 65.222% | 98.485% | 1,190,198.581 | 1.003% | 1.515% | ||||||||||||||
Lucinda S. Landreth | 77,370,351.799 | 65.202% | 98.454% | 1,214,637.125 | 1.024% | 1.546% | ||||||||||||||
Frances A. Sevilla-Sacasa | 77,375,937.301 | 65.206% | 98.461% | 1,209,051.623 | 1.019% | 1.539% | ||||||||||||||
Thomas K. Whitford | 77,381,528.607 | 65.211% | 98.469% | 1,203,460.317 | 1.014% | 1.531% | ||||||||||||||
Janet L. Yeomans | 77,362,190.845 | 65.195% | 98.444% | 1,222,798.079 | 1.030% | 1.556% | ||||||||||||||
J. Richard Zecher | 77,388,843.343 | 65.217% | 98.478% | 1,196,145.581 | 1.008% | 1.522% | ||||||||||||||
95
Table of Contents
Other Fund information (Unaudited)
Delaware Investments® Minnesota Municipal Bond Funds
Proxy Results (continued)
2. To approve the implementation of a new “manager of managers” order.
A quorum of the shares outstanding of the Funds was present, and the votes passed with the required majority of those shares. The results were as follows:
Delaware Tax-Free Minnesota Fund
Shares voted for | 19,862,714.671 | |||
Percentage of outstanding shares | 44.699 | % | ||
Percentage of shares voted | 68.385 | % | ||
Shares voted against | 731,641.413 | |||
Percentage of outstanding shares | 1.646 | % | ||
Percentage of shares voted | 2.519 | % | ||
Shares abstained | 1,126,924.995 | |||
Percentage of outstanding shares | 2.536 | % | ||
Percentage of shares voted | 3.880 | % | ||
Broker non-votes | 7,324,010.900 |
Delaware Tax-Free Minnesota Intermediate Fund
Shares voted for | 4,347,572.247 | |||
Percentage of outstanding shares | 47.878 | % | ||
Percentage of shares voted | 71.664 | % | ||
Shares voted against | 80,301.439 | |||
Percentage of outstanding shares | 0.884 | % | ||
Percentage of shares voted | 1.324 | % | ||
Shares abstained | 174,650.941 | |||
Percentage of outstanding shares | 1.923 | % | ||
Percentage of shares voted | 2.879 | % | ||
Broker non-votes | 1,464,085.000 |
Delaware Minnesota High-Yield Municipal Bond Fund
Shares voted for | 7,493,151.634 | |||
Percentage of outstanding shares | 48.847 | % | ||
Percentage of shares voted | 70.248 | % | ||
Shares voted against | 349,802.640 | |||
Percentage of outstanding shares | 2.280 | % | ||
Percentage of shares voted | 3.279 | % | ||
Shares abstained | 307,369.815 | |||
Percentage of outstanding shares | 2.004 | % | ||
Percentage of shares voted | 2.882 | % | ||
Broker non-votes | 2,516,382.000 |
96
Table of Contents
3. To revise the fundamental investment restriction relating to lending.
A quorum of the shares outstanding of the Funds was present, and the votes passed with the required majority of those shares. The results were as follows:
Delaware Tax-Free Minnesota Fund
Shares voted for | 19,615,881.219 | |||
Percentage of outstanding shares | 44.143 | % | ||
Percentage of shares voted | 67.535 | % | ||
Shares voted against | 809,881.878 | |||
Percentage of outstanding shares | 1.823 | % | ||
Percentage of shares voted | 2.788 | % | ||
Shares abstained | 1,295,516.982 | |||
Percentage of outstanding shares | 2.915 | % | ||
Percentage of shares voted | 4.460 | % | ||
Broker non-votes | 7,324,011.900 |
Delaware Tax-Free Minnesota Intermediate Fund
Shares voted for | 4,276,093.793 | |||
Percentage of outstanding shares | 47.091 | % | ||
Percentage of shares voted | 70.486 | % | ||
Shares voted against | 113,674.877 | |||
Percentage of outstanding shares | 1.252 | % | ||
Percentage of shares voted | 1.874 | % | ||
Shares abstained | 212,756.957 | |||
Percentage of outstanding shares | 2.343 | % | ||
Percentage of shares voted | 3.507 | % | ||
Broker non-votes | 1,464,084.000 |
Delaware Minnesota High-Yield Municipal Bond Fund
Shares voted for | 7,470,543.121 | |||
Percentage of outstanding shares | 48.700 | % | ||
Percentage of shares voted | 70.036 | % | ||
Shares voted against | 360,118.559 | |||
Percentage of outstanding shares | 2.348 | % | ||
Percentage of shares voted | 3.376 | % | ||
Shares abstained | 319,663.409 | |||
Percentage of outstanding shares | 2.084 | % | ||
Percentage of shares voted | 2.997 | % | ||
Broker non-votes | 2,516,381.000 |
97
Table of Contents
Other Fund information (Unaudited)
Delaware Investments® Minnesota Municipal Bond Funds
Proxy Results (continued)
4. (a) To revise provisions of each Trust’s Agreement and Declaration of Trust related to documenting the transfer of shares.
A quorum of the shares outstanding of each Trust was present, and the votes passed with a majority of those shares. The results were as follows:
Voyageur Tax Free Funds
Shares voted for | 19,878,549.162 | |||
Percentage of outstanding shares | 44.734 | % | ||
Percentage of shares voted | 68.440 | % | ||
Shares voted against | 527,817.727 | |||
Percentage of outstanding shares | 1.188 | % | ||
Percentage of shares voted | 1.817 | % | ||
Shares abstained | 1,314,914.190 | |||
Percentage of outstanding shares | 2.959 | % | ||
Percentage of shares voted | 4.527 | % | ||
Broker non-votes | 7,324,010.900 |
Voyageur Intermediate Tax Free Funds
Shares voted for | 3,203,440.214 | |||
Percentage of outstanding shares | 35.278 | % | ||
Percentage of shares voted | 58.717 | % | ||
Shares voted against | 60,955.137 | |||
Percentage of outstanding shares | 0.671 | % | ||
Percentage of shares voted | 1.117 | % | ||
Shares abstained | 109,748.413 | |||
Percentage of outstanding shares | 1.209 | % | ||
Percentage of shares voted | 2.012 | % | ||
Broker non-votes | 2,081,607.000 |
Voyageur Mutual Funds
Shares voted for | 53,350,588.915 | |||
Percentage of outstanding shares | 44.960 | % | ||
Percentage of shares voted | 67.889 | % | ||
Shares voted against | 1,291,148.802 | |||
Percentage of outstanding shares | 1.088 | % | ||
Percentage of shares voted | 1.643 | % | ||
Shares abstained | 1,136,878.207 | |||
Percentage of outstanding shares | 0.958 | % | ||
Percentage of shares voted | 1.447 | % | ||
Broker non-votes | 22,806,373.000 |
98
Table of Contents
4. (b) To revise provisions of each Trust’s Agreement and Declaration of Trust related to shareholder disclosure of certain information upon board demand.
A quorum of the shares outstanding of each Trust was present, and the votes passed with a majority of those shares. The results were as follows:
Voyageur Tax Free Funds
Shares voted for | 19,528,956.635 | |||
Percentage of outstanding shares | 43.947 | % | ||
Percentage of shares voted | 67.236 | % | ||
Shares voted against | 775,935.255 | |||
Percentage of outstanding shares | 1.746 | % | ||
Percentage of shares voted | 2.671 | % | ||
Shares abstained | 1,416,386.189 | |||
Percentage of outstanding shares | 3.187 | % | ||
Percentage of shares voted | 4.876 | % | ||
Broker non-votes | 7,324,013.900 |
Voyageur Intermediate Tax Free Funds
Shares voted for | 3,182,422.012 | |||
Percentage of outstanding shares | 35.046 | % | ||
Percentage of shares voted | 58.332 | % | ||
Shares voted against | 73,552.978 | |||
Percentage of outstanding shares | 0.810 | % | ||
Percentage of shares voted | 1.348 | % | ||
Shares abstained | 118,168.774 | |||
Percentage of outstanding shares | 1.301 | % | ||
Percentage of shares voted | 2.166 | % | ||
Broker non-votes | 2,081,607.000 |
Voyageur Mutual Funds
Shares voted for | 53,435,861.658 | |||
Percentage of outstanding shares | 45.031 | % | ||
Percentage of shares voted | 67.998 | % | ||
Shares voted against | 1,312,655.329 | |||
Percentage of outstanding shares | 1.106 | % | ||
Percentage of shares voted | 1.670 | % | ||
Shares abstained | 1,030,092.937 | |||
Percentage of outstanding shares | 0.868 | % | ||
Percentage of shares voted | 1.311 | % | ||
Broker non-votes | 22,806,379.000 |
99
Table of Contents
Other Fund information (Unaudited)
Delaware Investments® Minnesota Municipal Bond Funds
Proxy Results (continued)
4. (c) To revise provisions of each Trust’s By-Laws so that Delaware law will apply to matters related to proxies.
A quorum of the shares outstanding of each Trust was present, and the votes passed with a majority of those shares. The results were as follows:
Voyageur Tax Free Funds
Shares voted for | 19,812,831.380 | |||
Percentage of outstanding shares | 44.586 | % | ||
Percentage of shares voted | 68.214 | % | ||
Shares voted against | 604,738.501 | |||
Percentage of outstanding shares | 1.361 | % | ||
Percentage of shares voted | 2.082 | % | ||
Shares abstained | 1,303,711.198 | |||
Percentage of outstanding shares | 2.934 | % | ||
Percentage of shares voted | 4.489 | % | ||
Broker non-votes | 7,324,010.900 |
Voyageur Intermediate Tax Free Fund
Shares voted for | 3,222,543.580 | |||
Percentage of outstanding shares | 35.488 | % | ||
Percentage of shares voted | 59.067 | % | ||
Shares voted against | 65,725.764 | |||
Percentage of outstanding shares | 0.724 | % | ||
Percentage of shares voted | 1.205 | % | ||
Shares abstained | 85,875.420 | |||
Percentage of outstanding shares | 0.946 | % | ||
Percentage of shares voted | 1.574 | % | ||
Broker non-votes | 2,081,606.000 |
Voyageur Mutual Funds
Shares voted for | 54,268,750.116 | |||
Percentage of outstanding shares | 45.733 | % | ||
Percentage of shares voted | 69.057 | % | ||
Shares voted against | 486,387.431 | |||
Percentage of outstanding shares | 0.410 | % | ||
Percentage of shares voted | 0.619 | % | ||
Shares abstained | 1,023,482.377 | |||
Percentage of outstanding shares | 0.863 | % | ||
Percentage of shares voted | 1.302 | % | ||
Broker non-votes | 22,806,369.000 |
100
Table of Contents
Board Consideration of Delaware Minnesota High-Yield Municipal Bond Fund, Delaware Tax-Free Minnesota Fund, and Delaware Tax-Free Minnesota Intermediate Fund Investment Management Agreements
At a meeting held on Aug. 18-20, 2015 (the “Annual Meeting”), the Boards of Trustees (collectively referred to here as the “Board”), including a majority of disinterested or independent Trustees, approved the renewal of the Investment Advisory Agreements for Delaware Minnesota High-Yield Municipal Bond Fund, Delaware Tax-Free Minnesota Fund, and Delaware Tax-Free Minnesota Intermediate Fund (each, a “Fund” and together, the “Funds”). In making its decision, the Board considered information furnished at regular quarterly Board meetings, including reports detailing Fund performance, investment strategies and expenses, as well as information prepared specifically in connection with the renewal of the investment advisory and sub-advisory contracts. Information furnished specifically in connection with the renewal of the Investment Management Agreements with Delaware Management Company (“DMC”) included materials provided by DMC and its affiliates (“Delaware Investments”) concerning, among other things, the nature, extent, and quality of services provided to the Funds; the costs of such services to the Funds; economies of scale; and the investment manager’s financial condition and profitability. In addition, in connection with the Annual Meeting, reports were provided to the Trustees in May 2015 and included reports provided by Lipper, Inc., an independent statistical compilation organization (“Lipper”). The Lipper reports compared each Fund’s investment performance and expenses with those of other comparable mutual funds. The Independent Trustees reviewed and discussed the Lipper reports with independent legal counsel to the Independent Trustees. In addition to the information noted above, the Board also requested and received information regarding DMC’s policy with respect to advisory fee levels and its breakpoint philosophy; the structure of portfolio manager compensation; comparative client fee information; and any constraints or limitations on the availability of securities for certain investment styles, which had in the past year inhibited, or which were likely in the future to inhibit, the investment manager’s ability to invest fully in accordance with Fund policies.
In considering information relating to the approval of each Fund’s advisory agreement, the Independent Trustees received assistance and advice from and met separately with independent legal counsel to the Independent Trustees. They also engaged a consultant to assist them in analyzing portions of the data presented and received. The Independent Trustees reviewed and discussed with such consultant two reports prepared by the consultant with respect to such data. Although the Board gave attention to all information furnished, the following discussion identifies, under separate headings, the primary factors taken into account by the Board during its contract renewal considerations.
Nature, Extent, and Quality of Service. The Board considered the services provided by DMC to each Fund and its shareholders. In reviewing the nature, extent, and quality of services, the Board considered reports furnished to it throughout the year, which covered matters such as the relative performance of the Funds; compliance of portfolio managers with the investment policies, strategies, and restrictions for the Funds; compliance by DMC and Delaware Distributors, L.P. (together, “Management”) personnel with the Code of Ethics adopted throughout the Delaware Investments® Family of Funds complex; and adherence to fair value pricing procedures as established by the Board. The Board was pleased with the current staffing of the Funds’ investment advisor and the emphasis placed on research in the investment process. The Board recognized DMC’s receipt of several industry distinctions during the past several years. The Board gave favorable consideration to DMC’s efforts to control expenditures while
101
Table of Contents
Other Fund information (Unaudited)
Delaware Investment® Minnesota Municipal Bond Funds
Board Consideration of Delaware Minnesota High-Yield Municipal Bond Fund, Delaware Tax-Free Minnesota Fund, and Delaware Tax-Free Minnesota Intermediate Fund Investment Management Agreements (continued)
maintaining service levels committed to fund matters. The Board noted that, in the third and fourth quarters of 2013, Management reduced the maximum 12b-1 fee for certain funds, and in November 2013 Management negotiated a substantial reduction in fees for fund accounting services provided to the Funds. The Board noted the benefits provided to Fund shareholders through each shareholder’s ability to exchange an investment in one Delaware Investments fund for the same class of shares in another Delaware Investments fund without a sales charge, to reinvest Fund dividends into additional shares of the Fund or into additional shares of other Delaware Investments funds, and the privilege to combine holdings in other Delaware Investments funds to obtain a reduced sales charge. The Board was satisfied with the nature, extent and quality of the overall services provided by DMC.
Investment Performance. The Board placed significant emphasis on the investment performance of the Funds in view of the importance of investment performance to shareholders. Although the Board gave appropriate consideration to performance reports and discussions with portfolio managers at Investment Committee meetings throughout the year, the Board gave particular weight to the Lipper reports furnished for the Annual Meeting. The Lipper reports prepared for each Fund showed the investment performance of its Class A shares in comparison to a group of similar funds as selected by Lipper (the “Performance Universe”). A fund with the best performance ranked first, and a fund with the poorest performance ranked last. The highest/best performing 25% of funds in the Performance Universe make up the first quartile; the next 25%, the second quartile; the next 25%, the third quartile; and the poorest/ worst performing 25% of funds in the Performance Universe make up the fourth quartile. Comparative annualized performance for each Fund was shown for the past 1-, 3-, 5-, and 10-year periods, to the extent applicable, ended March 31, 2015. The Board’s objective is that each Fund’s performance for the periods considered be at or above the median of its Performance Universe.
Delaware Tax-Free Minnesota Fund – The Performance Universe for the Fund consisted of the Fund and all retail and institutional Minnesota municipal debt funds as selected by Lipper. The Lipper report comparison showed that the Fund’s total return for the 1-, 3-, and 5-year periods was in the second quartile of its Performance Universe. The report further showed that the Fund’s total return for the 10-year period was in the first quartile of its Performance Universe. The Board was satisfied with performance.
Delaware Tax-Free Minnesota Intermediate Fund – The Performance Universe for the Fund consisted of the Fund and all retail and institutional “other states” intermediate municipal debt funds as selected by Lipper. The Lipper report comparison showed that the Fund’s total return for the 1-, 3-, 5-, and 10-year periods was in the first quartile of its Performance Universe. The Board was satisfied with performance.
Delaware Minnesota High-Yield Municipal Bond Fund – Lipper currently classifies the Fund as a Minnesota municipal debt fund. However, Management believes that it would be more appropriate to include the Fund in the high yield municipal debt funds category, which would provide a comparison to a representative peer group based on credit quality instead of a peer group based on state of issuance. Accordingly, the Lipper report prepared for the Fund compares the Fund’s performance to two separate Performance Universes – one consisting of the Fund and all retail and institutional Minnesota municipal
102
Table of Contents
debt funds and the other consisting of the Fund and all retail and institutional high yield municipal debt funds. When compared to other Minnesota municipal debt funds, the Lipper report comparison showed that the Fund’s total return for the 1- and 3-year periods was in the second quartile of its Performance Universe. The report further showed that the Fund’s total return for the 5- and 10-year periods was in the first quartile of its Performance Universe. When compared to other high yield municipal debt funds, the Lipper report comparison showed that the Fund’s total return for the 1-, 3-, and 5-year periods was in the fourth quartile of the Performance Universe and the Fund’s total return for the 10-year period was in the second quartile of its Performance Universe. The Board observed that, when compared to other high yield municipal debt funds, the Fund’s performance results were not in line with the Board’s objective. In evaluating the Fund’s performance, the Board considered the numerous investment and performance reports delivered by Management personnel to the Board’s Investments Committee. The Board was satisfied that Management was taking action to improve Fund performance and to meet the Board’s performance objective.
Comparative Expenses. The Board considered expense comparison data for the Delaware Investments® Family of Funds. Management provided the Board with information on pricing levels and fee structures for each Fund as of its most recently completed fiscal year. The Board also focused on the comparative analysis of effective management fees and total expense ratios of each Fund versus effective management fees and expense ratios of a group of similar funds as selected by Lipper (the “Expense Group”). In reviewing comparative costs, each Fund’s contractual management fee and the actual management fee incurred by the Fund were compared with the contractual management fees (assuming all funds in the Expense Group were similar in size to the Fund) and actual management fees (as reported by each fund) within the Expense Group, taking into account any applicable breakpoints and fee waivers. Each Fund’s total expenses were also compared with those of its Expense Group. The Lipper total expenses, for comparative consistency, were shown by Lipper for Class A shares and comparative total expenses including 12b-1 and non 12b-1 service fees. The Board considered fees paid to DMC for non-management services. The Board’s objective is to limit each Fund’s total expense ratio to be competitive with that of the Expense Group.
Delaware Tax-Free Minnesota Fund – The expense comparisons for the Fund showed that its actual management fee was in the quartile with the second highest expenses of its Expense Group and its total expenses were in the quartile with the highest expenses of its Expense Group. The Board noted that the Fund’s total expenses were not in line with the Board’s objective. In evaluating the total expenses, the Board considered waivers in place through Dec. 29, 2015 and various initiatives implemented by Management, such as the negotiation of lower fees for fund accounting services, which had created an opportunity for a further reduction in expenses. The Board was satisfied with Management’s efforts to improve the Fund’s total expense ratio and to bring it in line with the Board’s objective.
Delaware Tax-Free Minnesota Intermediate Fund – The expense comparisons for the Fund showed that its actual management fee and total expenses were in the quartile with the second highest expenses of its Expense Group. The Board noted that the Fund’s total expenses were not in line with the Board’s objective. In evaluating the total expenses, the Board considered waivers in place through Dec. 29, 2015 and various initiatives implemented by Management, such as the outsourcing of certain transfer agency services and a negotiation of lower fees for fund accounting services, which had created an opportunity
103
Table of Contents
Other Fund information (Unaudited)
Delaware Investment® Minnesota Municipal Bond Funds
Board Consideration of Delaware Minnesota High-Yield Municipal Bond Fund, Delaware Tax-Free Minnesota Fund, and Delaware Tax-Free Minnesota Intermediate Fund Investment Management Agreements (continued)
for a further reduction in expenses. The Board was satisfied with Management’s efforts to improve the Fund’s total expense ratio and to bring it in line with the Board’s objective.
Delaware Minnesota High-Yield Municipal Bond Fund – When compared to other Minnesota municipal debt funds, the expense comparisons for the Fund showed that its actual management fee was in the quartile with the second highest expenses in its Expense Group and its total expenses were in the quartile with the highest expenses of the Expense Group. When compared to other high yield municipal debt funds, the expense comparisons for the Fund showed that its actual management fee was in the quartile with the lowest expenses of its Expense Group and its total expenses were in the quartile with the second lowest expenses of the Expense. The Board noted that, when compared to other Minnesota municipal debt funds, the Fund’s total expenses were not in line with the Board’s objective. In evaluating the total expenses, the Board considered fee waivers in place through Dec. 29, 2015 and various initiatives implemented by Management, such as the negotiation of lower fees for fund accounting services, which had created an opportunity for a further reduction in expenses. The Board was satisfied with Management’s efforts to improve the Fund’s total expense ratio and to bring it in line with the Board’s objective.
Management Profitability. The Board considered the level of profits realized by DMC in connection with the operation of the Funds. In this respect, the Board reviewed the Investment Management Profitability Analysis that addressed the overall profitability of DMC’s business in providing management and other services to each of the individual funds and the Delaware Investments Family of Funds as a whole. Specific attention was given to the methodology followed in allocating costs for the purpose of determining profitability. Management stated that the level of profits of DMC, to a certain extent, reflects recent operational cost savings and efficiencies initiated by DMC. The Board considered DMC’s efforts to improve services provided to fund shareholders and to meet additional regulatory and compliance requirements resulting from recent industry-wide Securities and Exchange Commission initiatives. The Board also considered the extent to which DMC might derive ancillary benefits from fund operations, including the potential for procuring additional business as a result of the prestige and visibility associated with its role as service provider to the Delaware Investments Family of Funds and the benefits from allocation of fund brokerage to improve trading efficiencies. The Board found that the management fees were reasonable in light of the services rendered and the level of profitability of DMC.
Economies of Scale. The Trustees considered whether economies of scale are realized by DMC as each Fund’s assets increase and the extent to which any economies of scale are reflected in the level of management fees charged. The Trustees reviewed the standardized advisory fee pricing and structure, approved by the Board and shareholders, which includes breakpoints. Breakpoints in the advisory fee occur when the advisory fee rate is reduced on assets in excess of specified levels. Breakpoints result in a lower advisory fee, than would otherwise be the case in the absence of breakpoints, when the asset levels specified in the breakpoints are exceeded. The Board noted that the fee under each Fund’s management contract fell within the standard structure. The Board also noted that Delaware Tax-Free Minnesota Fund’s assets exceeded the first breakpoint level. The Board believed that, given the extent to which economies of scale might be realized by the advisor and its affiliates, the schedule of fees under
104
Table of Contents
the Investment Management Agreement provides a sharing of benefits with Delaware Tax-Free Minnesota Fund and its shareholders. Although Delaware Tax-Free Minnesota Intermediate Fund and Delaware Minnesota High-Yield Municipal Bond Fund have not reached a size at which they can take advantage of breakpoints, the Board recognized that each Fund’s fee was structured so that when the Fund grows, economies of scale may be shared.
105
Table of Contents
Board of trustees / directors and officers addendum
Delaware Investments® Family of Funds
A mutual fund is governed by a Board of Trustees/Directors (“Trustees”), which has oversight responsibility for the management of a fund’s business affairs. Trustees establish procedures and oversee and review the performance of the investment manager, the distributor, and others who perform services for the fund. The independent fund trustees, in particular, are advocates
Name, Address, and Birth Date | Position(s) Held with Fund(s) | Length of Time Served | ||
Interested Trustee
| ||||
Shawn K. Lytle1 2005 Market Street Philadelphia, PA 19103 February 1970 | President, Chief Executive Officer, and Trustee | Trustee since September 1, 2015
President and Chief Executive Officer since August 20, 2015
| ||
Independent Trustees
| ||||
Thomas L. Bennett 2005 Market Street Philadelphia, PA 19103 October 1947 | Chairman and Trustee | Trustee since March 2005
Chairman since March 1, 2015
| ||
Ann D. Borowiec 2005 Market Street Philadelphia, PA 19103 November 1958
| Trustee | Since March 31, 2015 | ||
Joseph W. Chow 2005 Market Street Philadelphia, PA 19103 January 1953
| Trustee | Since January 2013 |
| 1 | Shawn K. Lytle is considered to bean “Interested Trustee“ because he is an executive officer of the Fund’s(s’) investment advisor. |
106
Table of Contents
for shareholder interests. Each trustee has served in that capacity since he or she was elected to or appointed to the Board of Trustees, and will continue to serve until his or her retirement or the election of a new trustee in his or her place. The following is a list of the Trustees and Officers with certain background and related information.
Principal Occupation(s) During the Past Five Years | Number of Portfolios in Fund Complex Overseen by Trustee or Officer | Other Directorships Held by Trustee or Officer | ||
| ||||
Shawn K. Lytle has served as President of Delaware Investments2 since June 2015 and was the Regional Head of Americas for UBS Global Asset Management from 2010 through 2015. |
64 |
Trustee — UBS Relationship Funds, SMA Relationship Trust, and UBS Funds (May 2010–April 2015) | ||
| ||||
Private Investor (March 2004–Present) |
64 |
Director — Bryn Mawr Bank Corp. (BMTC) (2007–2011)
| ||
Chief Executive Officer Private Wealth Management (2011–2013) and Market Manager, New Jersey Private Bank (2005–2011) – J.P. Morgan Chase & Co.
| 64 | None | ||
Executive Vice President (Emerging Economies Strategies, Risks, and Corporate Administration) State Street Corporation (July 2004–March 2011)
| 64 | Director and Audit Committee Member — Hercules Technology Growth Capital, Inc. (2004–2014) |
| 2 | Delaware Investments is the marketing name for Delaware Management Holdings, Inc. and its subsidiaries, including the Fund’s(s’) investment advisor, principal underwriter, and its transfer agent. |
107
Table of Contents
Board of trustees / directors and officers addendum
Delaware Investments® Family of Funds
Name, Address, and Birth Date | Position(s) Held with Fund(s) | Length of Time Served | ||
Independent Trustees (continued)
| ||||
John A. Fry 2005 Market Street Philadelphia, PA 19103 May 1960
|
Trustee |
Since January 2001 | ||
Lucinda S. Landreth 2005 Market Street Philadelphia, PA 19103 June 1947
| Trustee | Since March 2005 | ||
Frances A. Sevilla-Sacasa 2005 Market Street Philadelphia, PA 19103 January 1956
| Trustee | Since September 2011 |
108
Table of Contents
Principal Occupation(s) During the Past Five Years | Number of Portfolios in Fund Complex Overseen by Trustee or Officer | Other Directorships Held by Trustee or Officer | ||
| ||||
President — Drexel University (August 2010–Present)
President — Franklin & Marshall College (July 2002–July 2010) |
64 |
Director — Hershey Trust Company
Director, Audit Committee, and Governance Committee Member — Community Health Systems
Director — Drexel Morgan & Co.
| ||
Private Investor (2004–Present)
| 64 | None | ||
Chief Executive Officer — Banco Itaú International (April 2012–Present)
Executive Advisor to Dean (August 2011–March 2012) and Interim Dean (January 2011–July 2011) — University of Miami School of Business Administration
President — U.S. Trust, Bank of America Private Wealth Management (Private Banking) (July 2007–December 2008)
| 64 | Trust Manager and Audit Committee Member — Camden Property Trust |
109
Table of Contents
Board of trustees / directors and officers addendum
Delaware Investments® Family of Funds
Name, Address, and Birth Date | Position(s) Held with Fund(s) | Length of Time Served | ||
Independent Trustees (continued)
| ||||
Thomas K. Whitford 2005 Market Street Philadelphia, PA 19103 March 1956
|
Trustee |
Since January 2013 | ||
Janet L. Yeomans 2005 Market Street Philadelphia, PA 19103 July 1948
| Trustee | Since April 1999 |
110
Table of Contents
Principal Occupation(s) During the Past Five Years | Number of Portfolios in Fund Complex Overseen by Trustee or Officer | Other Directorships Held by Trustee or Officer | ||
| ||||
Vice Chairman (2010–April 2013), Chief Administrative Officer (2008–2010), and Executive Vice President and Chief Administrative Officer (2007–2009) — PNC Financial Services Group
|
64 |
Director — HSBC Finance Corporation and HSBC North America Holdings Inc.
Director — HSBC Bank | ||
Vice President and Treasurer (January 2006–July 2012) Vice President — Mergers & Acquisitions (January 2003–January 2006), and Vice President and Treasurer (July 1995–January 2003) 3M Corporation | 64 | Director, Audit and Compliance Committee Chair, Investment Committee Member, and Governance Committee Member — Okabena Company
Chair — 3M Investment Management Company (2005–2012)
|
111
Table of Contents
Board of trustees / directors and officers addendum
Delaware Investments® Family of Funds
Name, Address, and Birth Date | Position(s) Held with Fund(s) | Length of Time Served | ||
Officers
| ||||
David F. Connor 2005 Market Street Philadelphia, PA 19103 December 1963 |
Senior Vice President, General Counsel, and Secretary |
Senior Vice President since May 2013; General Counsel since May 2015; Secretary since October 2005
| ||
Daniel V. Geatens 2005 Market Street Philadelphia, PA 19103 October 1972
| Vice President and Treasurer | Treasurer since October 2007 | ||
Richard Salus 2005 Market Street Philadelphia, PA 19103 October 1963
| Senior Vice President and Chief Financial Officer | Chief Financial Officer since November 2006 |
The Statement of Additional Information for the Fund(s) includes additional information about the Trustees and Officers and is available, without charge, upon request by calling 800 523-1918.
112
Table of Contents
Principal Occupation(s) During the Past Five Years | Number of Portfolios in Fund Complex Overseen by Trustee or Officer | Other Directorships Held by Trustee or Officer | ||
| ||||
David F. Connor has served as Senior Vice President of the Fund(s) and the investment advisor since 2013, General Counsel of the Fund(s) and the investment advisor since 2015, and Secretary of the Fund(s) and the investment advisor since 2005.
|
64 |
None3 | ||
Daniel V. Geatens has served as Vice President and Treasurer of the Fund(s) since 2007 and Vice President and Director of Financial Administration of the investment advisor since 2010.
| 64 | None3 | ||
Richard Salus has served as Senior Vice President and Chief Financial Officer of the Fund(s) and the investment advisor since 2006.
| 64 | None3 |
| 3 | David F. Connor, Daniel V. Geatens, and Richard Salus serve in similar capacities for the six portfolios of the Optimum Fund Trust, which have the same investment advisor, principal underwriter, and transfer agent as the registrant. |
113
Table of Contents
| Board of trustees | ||||||
Shawn K. Lytle President and Chief Executive Officer Delaware Investments® Family of Funds Philadelphia, PA
Thomas L. Bennett Chairman of the Board Delaware Investments Family of Funds Private Investor Rosemont, PA |
Ann D. Borowiec Former Chief Executive Officer Private Wealth Management J.P. Morgan Chase & Co. New York, NY
Joseph W. Chow Former Executive Vice President State Street Corporation Brookline, MA |
John A. Fry President Drexel University Philadelphia, PA
Lucinda S. Landreth Former Chief Investment Officer Assurant, Inc. New York, NY |
Frances A. Sevilla-Sacasa Chief Executive Officer Banco Itaú International Miami, FL
Thomas K. Whitford Former Vice Chairman PNC Financial Services Group Pittsburgh, PA
Janet L. Yeomans Former Vice President and Treasurer 3M Corporation St. Paul, MN | |||
Affiliated officers | ||||||
David F. Connor Senior Vice President, General Counsel, and Secretary Delaware Investments Family of Funds Philadelphia, PA |
Daniel V. Geatens Vice President and Treasurer Delaware Investments Family of Funds Philadelphia, PA |
Richard Salus Senior Vice President and Chief Financial Officer Delaware Investments Family of Funds Philadelphia, PA |
This annual report is for the information of Delaware Tax-Free Minnesota Fund, Delaware Tax-Free Minnesota Intermediate Fund, and Delaware Minnesota High-Yield Municipal Bond Fund shareholders, but it may be used with prospective investors when preceded or accompanied by the Delaware Investments Fund fact sheet for the most recently completed calendar quarter. These documents are available at delawareinvestments.com.
Delaware Investments is the marketing name of Delaware Management Holdings, Inc. and its subsidiaries.
Each Fund files its complete schedule of portfolio holdings with the Securities and Exchange Commission (SEC) for the first and third quarters of each fiscal year on Form N-Q. Each Fund’s Forms N-Q, as well as a description of the policies and procedures that each Fund uses to determine how to vote proxies (if any) relating to portfolio securities are available without charge (i) upon request, by calling 800 523-1918; and (ii) on the SEC’s website at sec.gov. In addition, a description of the policies and procedures that the Funds use to determine how to vote proxies (if any) relating to portfolio securities and the Schedules of Investments included in the Funds’ most recent Forms N-Q are available without charge on the Funds’ website at delawareinvestments.com. Each Fund’s Forms N-Q may be reviewed and copied at the SEC’s Public Reference Room in Washington, D.C.; information on the operation of the Public Reference Room may be obtained by calling 800 SEC-0330.
Information (if any) regarding how the Funds voted proxies relating to portfolio securities during the most recently disclosed 12-month period ended June 30 is available without charge (i) through the Funds’ website at delawareinvestments.com; and (ii) on the SEC’s website at sec.gov.
114
Table of Contents

Annual report
Fixed income mutual funds
Delaware Tax-Free USA Fund
Delaware Tax-Free USA Intermediate Fund
Delaware National High-Yield Municipal Bond Fund
August 31, 2015
Carefully consider the Funds’ investment objectives, risk factors, charges, and expenses before investing. This and other information can be found in the Funds’ prospectus and their summary prospectuses, which may be obtained by visiting delawareinvestments.com or calling 800 523-1918. Investors should read the prospectus and the summary prospectus carefully before investing.
You can obtain shareholder reports and prospectuses online instead of in the mail.
Visit delawareinvestments.com/edelivery.
Table of Contents
Experience Delaware Investments
Delaware Investments is committed to the pursuit of consistently superior asset management and unparalleled client service. We believe in our investment processes, which seek to deliver consistent results, and in convenient services that help add value for our clients.
If you are interested in learning more about creating an investment plan, contact your financial advisor.
You can learn more about Delaware Investments or obtain a prospectus for Delaware Tax-Free USA Fund, Delaware Tax-Free USA Intermediate Fund, and Delaware National High-Yield Municipal Bond Fund at delawareinvestments.com.
Manage your investments online
| ● | 24-hour access to your account information |
| ● | Obtain share prices |
| ● | Check your account balance and recent transactions |
| ● | Request statements or literature |
| ● | Make purchases and redemptions |
Delaware Management Holdings, Inc. and its subsidiaries (collectively known by the marketing name of Delaware Investments) are wholly owned subsidiaries of Macquarie Group Limited, a global provider of banking, financial, advisory, investment and funds management services.
Neither Delaware Investments nor its affiliates noted in this document are authorized deposit-taking institutions for the purposes of the Banking Act 1959 (Commonwealth of Australia). The obligations of these entities do not represent deposits or other liabilities of Macquarie Bank Limited (MBL). MBL does not guarantee or otherwise provide assurance in respect of the obligations of these entities, unless noted otherwise.
| 1 | ||||
| 5 | ||||
| 15 | ||||
| 18 | ||||
| 24 | ||||
| 72 | ||||
| 74 | ||||
| 76 | ||||
| 82 | ||||
| 100 | ||||
| 114 | ||||
| 115 | ||||
| 126 | ||||
| 134 |
Unless otherwise noted, views expressed herein are current as of Aug. 31, 2015, and subject to change for events occurring after such date.
Funds are not FDIC insured and are not guaranteed. It is possible to lose the principal amount invested.
Mutual fund advisory services provided by Delaware Management Company, a series of Delaware Management Business Trust, which is a registered investment advisor. Delaware Investments, a member of Macquarie Group, refers to Delaware Management Holdings, Inc. and its subsidiaries, including the Funds’ distributor, Delaware Distributors, L.P. Macquarie Group refers to Macquarie Group Limited and its subsidiaries and affiliates worldwide.
© 2015 Delaware Management Holdings, Inc.
All third-party marks cited are the property of their respective owners.
Table of Contents
| Delaware Investments® National Tax-Free Funds | September 8, 2015 |
| Performance preview (for the year ended August 31, 2015) | ||||||||
| ||||||||
Delaware Tax-Free USA Fund (Class A shares) | 1-year return | +3.09% | ||||||
| ||||||||
Barclays Municipal Bond Index (benchmark) | 1-year return | +2.52% | ||||||
| ||||||||
Lipper General & Insured Municipal Debt Funds Average | 1-year return | +2.28% | ||||||
| ||||||||
Past performance does not guarantee future results.
For complete, annualized performance for Delaware Tax-Free USA Fund, please see the table on page 5.
The performance of Class A shares excludes the applicable sales charge and reflects the reinvestment of all distributions. The Lipper General & Insured Municipal Debt Funds Average compares funds that either invest primarily in municipal debt issues in the top four credit ratings or invest primarily in municipal debt issues insured as to timely payment.
Please see page 8 for a description of the index. Index performance returns do not reflect any management fees, transaction costs, or expenses. Indices are unmanaged and one cannot invest directly in an index.
| ||||||||
Delaware Tax-Free USA Intermediate Fund (Class A shares) | 1-year return | +1.46% | ||||||
| ||||||||
Barclays 3–15 Year Blend Municipal Bond Index (benchmark) | 1-year return | +2.02% | ||||||
| ||||||||
Lipper Intermediate Municipal Debt Funds Average | 1-year return | +0.74% | ||||||
| ||||||||
Past performance does not guarantee future results.
For complete, annualized performance for Delaware Tax-Free USA Intermediate Fund, please see the table on page 9. The performance of Class A shares excludes the applicable sales charge and reflects the reinvestment of all distributions. The Lipper Intermediate Municipal Debt Funds Average compares funds that invest in municipal debt issues with dollar-weighted average maturities of 5 to 10 years.
Please see page 11 for a description of the Index. Index performance returns do not reflect any management fees, transaction costs, or expenses. Indices are unmanaged and one cannot invest directly in an index.
| ||||||||
Delaware National High-Yield Municipal Bond Fund (Class A shares) | 1-year return | +4.83% | ||||||
| ||||||||
Barclays Municipal Bond Index (benchmark) | 1-year return | +2.52% | ||||||
| ||||||||
Lipper High Yield Municipal Debt Funds Average | 1-year return | +3.88% | ||||||
| ||||||||
Past performance does not guarantee future results.
For complete, annualized performance for Delaware National High-Yield Municipal Bond Fund, please see the table on page 12.
The performance of Class A shares excludes the applicable sales charge and reflects the reinvestment of all distributions. The Lipper High Yield Municipal Debt Funds Average compares funds that invest at least 50% of assets in lower-rated municipal debt issues.
Please see page 14 for a description of the index. Index performance returns do not reflect any management fees, transaction costs, or expenses. Indices are unmanaged and one cannot invest directly in an index.
1
Table of Contents
Portfolio management review
Delaware Investments® National Tax-Free Funds
Economic backdrop
The U.S. economy continued to grow steadily throughout the Funds’ fiscal year ended Aug. 31, 2015. The economy benefited from increased business investment and consumer spending, made possible in part by a sharp drop in the price of oil. A steadily improving job market also lifted consumer optimism. As of August 2015, the national jobless rate was 5.1%, down a full percentage point from a year earlier and the lowest level since early 2008. (Source: U.S. Labor Department.)
In the third quarter of 2014, U.S. gross domestic product (GDP) – a measure of national economic output – grew by a rapid 4.3% annual pace. This was followed by a 2.1% expansion in the fourth quarter of 2014. In the first quarter of 2015, the economy significantly slowed, as bad winter weather and shipping disruptions at West Coast ports depressed economic activity. These trends reversed in the second quarter of 2015, with continued strength in consumer spending helping to grow the economy by an estimated 3.7% in April–June. (Source: U.S. Commerce Department.)
With the U.S. economy strengthening and inflation well contained, the U.S. Federal Reserve finally ended its quantitative-easing economic stimulus plan in October 2014. The Fed maintained its target short-term rate at essentially zero – where it has been since 2008 – for the duration of the Funds’ fiscal year. However, as the period ended, investors widely anticipated a rate increase even as emerging concerns about the global economy added uncertainty to the central bank’s timetable.
Municipal bond market conditions
Municipal bonds produced positive returns overall for the Funds’ fiscal year. Over the entire period, bonds with longer maturity dates outperformed their shorter-maturity counterparts, while lower-
rated bonds offering higher yields fared better than higher-rated, lower yielding issues.
Municipal bond returns, by maturity and credit quality, for the 12 months ended Aug. 31, 2015, were as follows:
| Maturity | ||||
5 years | 1.18% | |||
10 years | 2.47% | |||
22+ years | 4.02% | |||
Credit quality | ||||
AAA | 1.85% | |||
AA | 2.40% | |||
A | 2.75% | |||
BBB | 3.92% | |||
Source: Barclays
One exception to this trend came from bonds with credit ratings below BBB – also known as below-investment-grade, or high yield, bonds – which had flat returns, as measured by the Barclays High-Yield Municipal Bond Index, which tracks the total return performance of the long-term, non-investment-grade tax-exempt bond market. Nearly all of this relative underperformance, however, was caused by the weakness of bonds affiliated with Puerto Rico, which make up approximately 24% of the index. (Bonds issued by U.S. territories are exempt from federal, state, and local income taxes for residents of all 50 states.) Puerto Rico’s longstanding credit problems worsened during the Funds’ fiscal year, as the commonwealth filed for bankruptcy protection in July 2015. If Puerto Rico bonds were removed from the index, high yield returns would have kept with the credit trend by posting gains of 6.75%.
Of the Funds profiled in this report, only Delaware National High-Yield Municipal Bond Fund had any exposure to Puerto Rican bonds. In that Fund’s portfolio, we held a small position in debt for Hospital Auxilio Mutuo, whose credit quality we concluded was relatively insulated from Puerto
2
Table of Contents
Rico’s financial difficulties. In fact, these bonds declined only modestly during the 12-month period, far outperforming the average Puerto Rico bond for the same time frame.
Toward the end of the Funds’ fiscal year, the market environment shifted for municipal bond investors. Uncertainty grew about the global economy – especially with respect to China and other emerging markets – causing increased market volatility, as investors became more risk averse. Accordingly, shorter-dated, higher-rated tax-exempt bonds returned to favor, while longer-maturity, lower-quality issues found themselves at a relative disadvantage as the period ended.
Demand for municipal bonds was robust as the fiscal year began, but tailed off as the period progressed. Toward the end of the period, however, municipal bond fund outflows grew as investors began to anticipate an increase in the Fed’s target short-term interest rate. Meanwhile, the supply of new long-term municipal debt remained constrained. Despite considerable issuance, much of the new supply consisted of debt refinancing, as issuers took advantage of still-low borrowing costs to lower their long-term interest expenses.
Sticking to our strategy
For all three Funds discussed in this report, we maintained the consistent management approach we follow in all types of market conditions, relying on a bottom-up investment strategy. We evaluate securities one at a time, working with our credit analysts to determine through careful research which bonds we believe offer our shareholders the most favorable risk-reward trade-off and income potential.
Applying this approach, we continued to favor bonds with lower-investment-grade or below-investment-grade credit ratings, the segment in which we believe our credit research capabilities may prove most beneficial. Delaware Tax-Free USA Fund and Delaware Tax-Free USA
Intermediate Fund maintained sizeable allocations to bonds with credit ratings of A and BBB – the two lowest tiers of the investment grade bond universe – as well as to below-investment-grade bonds. By prospectus, up to 20% of the net assets of Delaware Tax-Free USA Fund and Delaware Tax-Free USA Intermediate Fund can be held in this latter category. We used a substantial portion of this allotment, as we identified various lower-rated bonds that we believed appeared poised to benefit from credit improvement.
Meanwhile, reflecting its different mandate, Delaware National High-Yield Municipal Bond Fund has substantial flexibility to invest in bonds with below-investment-grade credit ratings. At fiscal year end, 51.44% of its portfolio was invested in bonds with credit ratings of BB or lower, up from the 43.66% at the start of the period.
Throughout the period, we maintained a roughly neutral duration (interest rate) stance in all three Funds relative to their benchmarks. This approach reflected our belief in our disciplined credit selection process, rather than any attempt to anticipate the direction of interest rates. The Funds purchased new bonds across various sectors during the fiscal year, including the charter school and healthcare sectors – two areas where we have substantial credit research experience. When appropriate, we tended to favor longer-dated bonds for what we identified as their increased performance potential.
Within the Funds
In keeping with the performance trends mentioned earlier, bonds with lower credit ratings and longer maturity dates tended to outperform higher-quality, shorter-dated issues for the fiscal year. The Funds’ strongest-performing holdings generally conformed to those trends.
All three Funds benefited from holding Southwestern Illinois Development Authority bonds for Memorial Hospital. These bonds, rated
3
Table of Contents
Portfolio management review
Delaware Investments® National Tax-Free Funds
BB+ by Standard & Poor’s and maturing in 2043, generated a strong return due to their relatively long maturity dates and below-investment-grade credit rating. The issuer’s plans to affiliate with a higher-rated hospital also attracted investors.
A strong-performing position in Louisiana Public Facilities Authority bonds for the Southwest Louisiana Charter Academy in Lake Charles helped Delaware Tax-Free USA Fund. These nonrated bonds, which offered a yield exceeding 8% and were due to mature in 2043, rose 16% for the period.
Holdings in New Jersey Economic Development Authority revenue bonds for Continental Airlines lifted the results of Delaware Tax-Free USA Intermediate Fund. These corporate-backed bonds, rated B+ and maturing in 2030, benefited from both the strong backdrop for lower-rated issues as well as the airline industry’s continued recovery.
Besides benefiting from the Illinois hospital bonds mentioned earlier, Delaware National High-Yield Municipal Bond Fund saw strong results from Illinois Finance Authority revenue bonds for the Admiral at the Lake Project, a senior housing facility in Chicago. The price of these nonrated bonds, due to mature in 2046, rose 16%.
In what was a generally strong year for municipal bonds, most of the Funds’ weakest performers
turned in flat to modestly negative returns. Relative to their respective benchmarks, both Delaware Tax-Free USA Fund and Delaware Tax-Free USA Intermediate Fund were hampered by positions in New Jersey Transportation Trust Fund bonds. New Jersey–backed debt struggled during the period, as the state’s credit rating was downgraded multiple times in response to its burdensome pension obligations and worsening financial situation.
Maryland Economic Development Corporation bonds for the CNX Marine Terminals, a coal shipment terminal facility in Baltimore, also detracted. These bonds, which all three Funds held, returned -2%, as weak commodity prices weighed on the issuer.
Of final note, Delaware National High-Yield Municipal Bond Fund was hurt by Lake County, Fla., industrial development revenue bonds for the Cranes View Lodge continuing care retirement community project. Despite this issue’s lower credit rating and longer maturity date – two generally positive factors during the period – the bonds struggled with a -3% return, due to construction delays that pushed back the opening of a new facility. The Fund continued to own the bonds at the end of its fiscal year, however, as we still saw the potential for good long-term value in the securities.
4
Table of Contents
| Delaware Tax-Free USA Fund | August 31, 2015 |
The performance data quoted represent past performance; past performance does not guarantee future results. Investment return and principal value will fluctuate so your shares, when redeemed, may be worth more or less than their original cost. Please obtain the performance data current for the most recent month end by calling 800 523-1918 or visiting our website at delawareinvestments.com/performance. Current performance may be lower or higher than the performance data quoted.
Fund and benchmark performance1, 2
| Average annual total returns through August 31, 2015
| |||||||
| 1 year | 5 years | 10 years | Lifetime | |||||
Class A (Est. Jan. 11, 1984) | ||||||||
Excluding sales charge | +3.09% | +4.54% | +4.34% | n/a | ||||
Including sales charge | -1.55% | +3.58% | +3.87% | n/a | ||||
Class C (Est. Nov. 29, 1995) | ||||||||
Excluding sales charge | +2.23% | +3.76% | +3.55% | n/a | ||||
Including sales charge | +1.24% | +3.76% | +3.55% | n/a | ||||
Institutional Class (Est. Dec. 31, 2008) | ||||||||
Excluding sales charge | +3.26% | +4.77% | n/a | +7.28% | ||||
Including sales charge | +3.26% | +4.77% | n/a | +7.28% | ||||
Barclays Municipal Bond Index* | +2.52% | +3.96% | +4.49% | +5.92% | ||||
*The benchmark lifetime return is for Institutional Class share comparison only and is calculated using the last business day in the month of the Fund’s Institutional Class inception date.
1 Returns reflect the reinvestment of all distributions and are presented both with and without the applicable sales charges described below. Returns do not reflect the deduction of taxes the shareholder would pay on Fund distributions or redemptions of Fund shares.
Expense limitations were in effect for certain classes during some or all of the periods shown in the “Fund and benchmark performance” table. Expenses for each class are listed on the “Fund expense ratios” table on page 7. Performance would have been lower had expense limitations not been in effect.
Class A shares are sold with a maximum front-end sales charge of 4.50%, and have an annual distribution and service fee of 0.25% of average daily net assets. The Board has adopted a formula for calculating 12b-1 plan fees for the Fund’s Class A shares. The Fund’s Class A shares are currently subject to a blended 12b-1 fee equal to the sum of: (i) 0.10% of average daily net
assets representing shares acquired prior to June 1, 1992, and (ii) 0.25% of average daily net assets representing shares acquired on or after June 1, 1992. All Class A shares currently bear 12b-1 fees at the same rate, the blended rate, currently 0.24% of average daily net assets, based on the formula described above. This method of calculating Class A 12b-1 fees may be discontinued at the sole discretion of the Board. Performance for Class A shares, excluding sales charges, assumes that no front-end sales charge applied.
Class C shares are sold with a contingent deferred sales charge of 1.00% if redeemed during the first 12 months. They are also subject to an annual distribution and service fee of 1.00% of average daily net assets. Performance for Class C shares, excluding sales charges, assumes either that contingent deferred sales charges did not apply or that the investment was not redeemed.
5
Table of Contents
Performance summaries
Delaware Tax-Free USA Fund
Institutional Class shares are available without sales or asset-based distribution charges only to certain eligible institutional accounts.
Fixed income securities and bond funds can lose value, and investors can lose principal, as interest rates rise. They also may be affected by economic conditions that hinder an issuer’s ability to make interest and principal payments on its debt.
The Fund may also be subject to prepayment risk, the risk that the principal of a fixed income security that is held by the Fund may be prepaid prior to maturity, potentially forcing the Fund to reinvest that money at a lower interest rate.
High yielding, noninvestment grade bonds (junk bonds) involve higher risk than investment grade bonds. The high yield secondary market is particularly susceptible to liquidity problems when institutional investors, such as mutual funds and certain other financial institutions, temporarily stop buying bonds for regulatory, financial, or other reasons. In addition, a less liquid secondary market makes it more difficult for the Fund to obtain precise valuations of the high yield securities in its portfolio.
Substantially all dividend income derived from tax-free funds is exempt from federal income tax. Some income may be subject to the federal alternative minimum tax (AMT) that applies to certain investors. Capital gains, if any, are taxable.
Bond ratings are determined by a nationally recognized statistical rating organization.
Duration number will change as market conditions change. Therefore, duration should not be solely relied upon to indicate a municipal bond fund’s potential volatility.
Per Standard & Poor’s credit rating agency, bonds rated AA and A are more susceptible to the adverse effects of changes in circumstances and economic conditions than those in the higher-rated AAA category, but the obligor’s capacity to meet its financial commitment on the obligation is
still strong. Bonds rated BBB exhibit adequate protection parameters, although adverse economic conditions or changing circumstances are more likely to lead to a weakened capacity of the obligor to meet its financial commitments. Bonds rated BB, B, and CCC are regarded as having significant speculative characteristics, with BB indicating the least degree of speculation of the three.
6
Table of Contents
2 The Fund’s investment manager, Delaware Management Company (Manager), has contractually agreed to waive all or a portion of its investment advisory fees and/or pay/reimburse expenses (excluding any 12b-1 fees, acquired fund fees and expenses, taxes, interest, short sale and dividend interest expenses, brokerage fees, certain insurance costs, and nonroutine expenses or costs, including, but not limited to, those relating to reorganizations, litigation, conducting shareholder meetings, and liquidations) in order to prevent total annual fund operating expenses from exceeding 0.56% of the Fund’s average daily net assets from Sept. 1, 2014 through Aug. 31, 2015.* Please see the most recent prospectus and any applicable supplement(s) for additional information on these fee waivers and/or reimbursements.
| Fund expense ratios | Class A | Class C | Institutional Class | |||
| ||||||
Total annual operating expenses | 0.96% | 1.72% | 0.72% | |||
(without fee waivers) | ||||||
Net expenses | 0.80% | 1.56% | 0.56% | |||
(including fee waivers, if any) | ||||||
Type of waiver | Contractual | Contractual | Contractual | |||
| ||||||
*The contractual waiver period is from Dec. 27, 2013, through Dec. 29, 2015.
7
Table of Contents
Performance summaries
Delaware Tax-Free USA Fund
Performance of a $10,000 investment1
Average annual total returns from Aug. 31, 2005, through Aug. 31, 2015
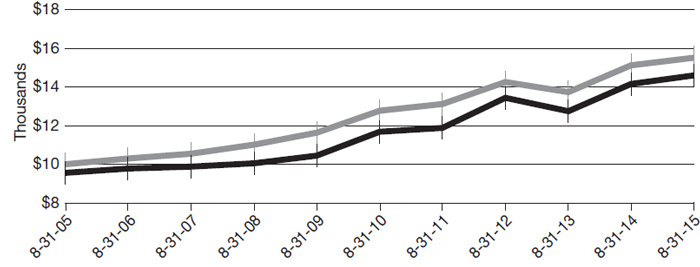
| For period beginning Aug. 31, 2005, through Aug. 31, 2015 | Starting value | Ending value | ||||||
 Barclays Municipal Bond Index Barclays Municipal Bond Index | $10,000 | $15,513 | ||||||
 Delaware Tax-Free USA Fund — Class A shares Delaware Tax-Free USA Fund — Class A shares | $9,550 | $14,612 | ||||||
1 The “Performance of a $10,000 investment” graph assumes $10,000 invested in Class A shares of the Fund on Aug. 31, 2005, and includes the effect of a 4.50% front-end sales charge and the reinvestment of all distributions. The graph does not reflect the deduction of taxes the shareholders would pay on Fund distributions or redemptions of Fund shares. Expense limitations were in effect for some or all of the periods shown. Performance would have been lower had expense limitations not been in effect. Expenses are listed in the “Fund expense ratios” table on page 7. Please note additional details on pages 5 through 8.
The graph also assumes $10,000 invested in the Barclays Municipal Bond Index as of Aug. 31, 2005. The Barclays Municipal Bond Index measures the total return performance of the long-term, investment grade tax-exempt bond market.
Index performance returns do not reflect any management fees, transaction costs, or expenses. Indices are unmanaged and one cannot invest directly in an index. Past performance is not a guarantee of future results.
Performance of other Fund classes will vary due to different charges and expenses.
| ||||||
| Nasdaq symbols | CUSIPs | |||||
Class A | DMTFX | 245909106 | ||||
Class C | DUSCX | 245909700 | ||||
Institutional Class | DTFIX | 24610H104 | ||||
| ||||||
8
Table of Contents
| Performance summaries | ||
| Delaware Tax-Free USA Intermediate Fund | August 31, 2015 |
The performance data quoted represent past performance; past performance does not guarantee future results. Investment return and principal value will fluctuate so your shares, when redeemed, may be worth more or less than their original cost. Please obtain the performance data current for the most recent month end by calling 800 523-1918 or visiting our website at delawareinvestments.com/performance. Current performance may be lower or higher than the performance data quoted.
Fund and benchmark performance1, 2
| Average annual total returns through August 31, 2015
| |||||||
| 1 year | 5 years | 10 years | Lifetime | |||||
Class A (Est. Jan. 7, 1993) | ||||||||
Excluding sales charge | +1.46% | +2.87% | +3.67% | n/a | ||||
Including sales charge | -1.37% | +2.30% | +3.38% | n/a | ||||
Class C (Est. Nov. 29, 1995) | ||||||||
Excluding sales charge | +0.60% | +1.98% | +2.79% | n/a | ||||
Including sales charge | -0.39% | +1.98% | +2.79% | n/a | ||||
Institutional Class (Est. Dec. 31, 2008) | ||||||||
Excluding sales charge | +1.62% | +3.03% | n/a | +5.12% | ||||
Including sales charge | +1.62% | +3.03% | n/a | +5.12% | ||||
Barclays 3–15 Year Blend | ||||||||
Municipal Bond Index* | +2.02% | +3.52% | +4.46% | +5.05% | ||||
*The benchmark lifetime return is for Institutional Class share comparison only and is calculated using the last business day in the month of the Fund’s Institutional Class inception date.
1 Returns reflect the reinvestment of all distributions and are presented both with and without the applicable sales charges described below. Returns do not reflect the deduction of taxes the shareholder would pay on Fund distributions or redemptions of Fund shares.
Expense limitations were in effect for certain classes during some or all of the periods shown in the “Fund and benchmark performance” table. Expenses for each class are listed on the “Fund expense ratios” table on page 10. Performance would have been lower had expense limitations not been in effect.
Class A shares are sold with a maximum front-end sales charge of 2.75%, and have an annual distribution and service fee of 0.25% of average daily net assets. This fee was contractually limited to 0.15% of average daily net assets from Sept. 1, 2014 through Aug. 31, 2015.* Performance for Class A shares, excluding
sales charges, assumes that no front-end sales charge applied.
Class C shares are sold with a contingent deferred sales charge of 1.00% if redeemed during the first 12 months. They are also subject to an annual distribution and service fee of 1.00% of average daily net assets. Performance for Class C shares, excluding sales charges, assumes either that contingent deferred sales charges did not apply or that the investment was not redeemed.
Institutional Class shares are available without sales or asset-based distribution charges only to certain eligible institutional accounts.
Fixed income securities and bond funds can lose value, and investors can lose principal, as interest rates rise. They also may be affected by economic conditions that hinder an issuer’s ability to make interest and principal payments on its debt.
9
Table of Contents
Performance summaries
Delaware Tax-Free USA Intermediate Fund
The Fund may also be subject to prepayment risk, the risk that the principal of a fixed income security that is held by the Fund may be prepaid prior to maturity, potentially forcing the Fund to reinvest that money at a lower interest rate.
High yielding, noninvestment grade bonds (junk bonds) involve higher risk than investment grade bonds. The high yield secondary market is particularly susceptible to liquidity problems when institutional investors, such as mutual funds and certain other financial institutions, temporarily stop buying bonds for regulatory, financial, or other reasons. In addition, a less liquid secondary market makes it more difficult for the Fund to obtain precise valuations of the high yield securities in its portfolio.
Substantially all dividend income derived from tax-free funds is exempt from federal income tax. Some income may be subject to the federal alternative minimum tax (AMT) that applies to certain investors. Capital gains, if any, are taxable.
Duration number will change as market conditions change. Therefore, duration should not be solely
relied upon to indicate a municipal bond fund’s potential volatility.
Per Standard & Poor’s credit rating agency, bonds rated AA and A are more susceptible to the adverse effects of changes in circumstances and economic conditions than those in the higher-rated AAA category, but the obligor’s capacity to meet its financial commitment on the obligation is still strong. Bonds rated BBB exhibit adequate protection parameters, although adverse economic conditions or changing circumstances are more likely to lead to a weakened capacity of the obligor to meet its financial commitments. Bonds rated BB, B, and CCC are regarded as having significant speculative characteristics, with BB indicating the least degree of speculation of the three.
*The contractual waiver period is from Dec. 27, 2013, through Dec. 29, 2015.
2 The Fund’s investment manager, Delaware Management Company (Manager), has contractually agreed to waive all or a portion of its investment advisory fees and/or pay/reimburse expenses (excluding any 12b-1 fees, acquired fund fees and expenses, taxes, interest, short sale and dividend interest expenses, brokerage fees, certain insurance costs, and nonroutine expenses or costs, including, but not limited to, those relating to reorganizations, litigation, conducting shareholder meetings, and liquidations) in order to prevent total annual fund operating expenses from exceeding 0.60% of the Fund’s average daily net assets from Sept. 1, 2014 through Aug. 31, 2015.* Please see the most recent prospectus and any applicable supplement(s) for additional information on these fee waivers and/or reimbursements.
| Fund expense ratios | Class A | Class C | Institutional Class | |||
| ||||||
Total annual operating expenses | 0.93% | 1.68% | 0.68% | |||
(without fee waivers) | ||||||
Net expenses | 0.75% | 1.60% | 0.60% | |||
(including fee waivers, if any) | ||||||
Type of waiver | Contractual | Contractual | Contractual | |||
| ||||||
*The contractual waiver period is from Dec. 27, 2013, through Dec. 29, 2015.
10
Table of Contents
Performance of a $10,000 investment1
Average annual total returns from Aug. 31, 2005, through Aug. 31, 2015
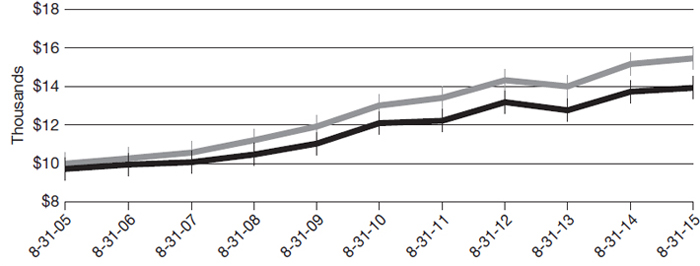
| For period beginning Aug. 31, 2005, through Aug. 31, 2015 | Starting value | Ending value | ||||||
| Barclays 3–15 Year Blend Municipal Bond Index | $10,000 | $15,467 | ||||||
| Delaware Tax-Free USA Intermediate Fund — Class A shares | $9,725 | $13,942 | ||||||
1 The “Performance of a $10,000 investment” graph assumes $10,000 invested in Class A shares of the Fund on Aug. 31, 2005, and includes the effect of a 2.75% front-end sales charge and the reinvestment of all distributions. The graph does not reflect the deduction of taxes the shareholders would pay on Fund distributions or redemptions of Fund shares. Expense limitations were in effect for some or all of the periods shown. Performance would have been lower had expense limitations not been in effect. Expenses are listed in the “Fund expense ratios” table on page 10. Please note additional details on pages 9 through 11.
The graph also assumes $10,000 invested in the Barclays 3–15 Year Blend Municipal Bond Index as of Aug. 31, 2005. The Barclays 3–15 Year Blend Municipal Bond Index measures the total return performance of investment grade, U.S. tax-exempt bonds with maturities from 2 to 17 years.
Index performance returns do not reflect any management fees, transaction costs, or expenses. Indices are unmanaged and one cannot invest directly in an index. Past performance is not a guarantee of future results.
Performance of other Fund classes will vary due to different charges and expenses.
| ||||||
| Nasdaq symbols | CUSIPs | |||||
Class A | DMUSX | 245909304 | ||||
Class C | DUICX | 245909882 | ||||
Institutional Class
| DUSIX
| 24610H203
| ||||
| ||||||
11
Table of Contents
| Performance summaries | ||
| Delaware National High-Yield Municipal Bond Fund | August 31, 2015 |
The performance data quoted represent past performance; past performance does not guarantee future results. Investment return and principal value will fluctuate so your shares, when redeemed, may be worth more or less than their original cost. Please obtain the performance data current for the most recent month end by calling 800 523-1918 or visiting our website at delawareinvestments.com/performance. Current performance may be lower or higher than the performance data quoted.
| Fund and benchmark performance1, 2 | Average annual total returns through August 31, 2015 | |||||||
1 year | 5 years | 10 years | Lifetime | |||||
| ||||||||
Class A (Est. Sept. 22, 1986) | ||||||||
Excluding sales charge | +4.83% | +5.87% | +5.26% | n/a | ||||
Including sales charge | +0.13% | +4.89% | +4.78% | n/a | ||||
| ||||||||
Class C (Est. May 26, 1997) | ||||||||
Excluding sales charge | +4.04% | +5.10% | +4.48% | n/a | ||||
Including sales charge | +3.04% | +5.10% | +4.48% | n/a | ||||
| ||||||||
Institutional Class (Est. Dec. 31, 2008) | ||||||||
Excluding sales charge | +5.08% | +6.12% | n/a | +10.86% | ||||
Including sales charge | +5.08% | +6.12% | n/a | +10.86% | ||||
| ||||||||
Barclays Municipal Bond Index* | +2.52% | +3.96% | +4.49% | +5.92% | ||||
| ||||||||
*The benchmark lifetime return is for Institutional Class share comparison only and is calculated using the last business day in the month of the Fund’s Institutional Class inception date.
1 Returns reflect the reinvestment of all distributions and are presented both with and without the applicable sales charges described below. Returns do not reflect the deduction of taxes the shareholder would pay on Fund distributions or redemptions of Fund shares.
Expense limitations were in effect for certain classes during some or all of the periods shown in the “Fund and benchmark performance” table. Expenses for each class are listed on the “Fund expense ratios” table on page 13. Performance would have been lower had expense limitations not been in effect.
Class A shares are sold with a maximum front-end sales charge of 4.50%, and have an annual distribution and service fee of 0.25% of average daily net assets. Performance for Class A shares, excluding sales charges, assumes that no front-end sales charge applied.
Class C shares are sold with a contingent deferred sales charge of 1.00% if redeemed during the first 12 months. They are also subject to an annual distribution and service fee of 1.00% of average daily net assets. Performance for Class C shares, excluding sales charges, assumes either that contingent deferred sales charges did not apply or that the investment was not redeemed.
Institutional Class shares are available without sales or asset-based distribution charges only to certain eligible institutional accounts.
Fixed income securities and bond funds can lose value, and investors can lose principal, as interest rates rise. They also may be affected by economic conditions that hinder an issuer’s ability to make interest and principal payments on its debt.
12
Table of Contents
The Fund may also be subject to prepayment risk, the risk that the principal of a fixed income security that is held by the Fund may be prepaid prior to maturity, potentially forcing the Fund to reinvest that money at a lower interest rate.
High yielding, noninvestment grade bonds (junk bonds) involve higher risk than investment grade bonds. The high yield secondary market is particularly susceptible to liquidity problems when institutional investors, such as mutual funds and certain other financial institutions, temporarily stop buying bonds for regulatory, financial, or other reasons. In addition, a less liquid secondary market makes it more difficult for the Fund to obtain precise valuations of the high yield securities in its portfolio.
Substantially all dividend income derived from tax-free funds is exempt from federal income tax. Some income may be subject to the federal alternative minimum tax (AMT) that applies to certain investors. Capital gains, if any, are taxable.
Duration number will change as market conditions change. Therefore, duration should not be solely relied upon to indicate a municipal bond fund’s potential volatility.
Per Standard & Poor’s credit rating agency, bonds rated AA and A are more susceptible to the adverse effects of changes in circumstances and economic conditions than those in the higher-rated AAA category, but the obligor’s capacity to meet its financial commitment on the obligation is still strong. Bonds rated BBB exhibit adequate protection parameters, although adverse economic conditions or changing circumstances are more likely to lead to a weakened capacity of the obligor to meet its financial commitments. Bonds rated BB, B, and CCC are regarded as having significant speculative characteristics, with BB indicating the least degree of speculation of the three.
2 The Fund’s investment manager, Delaware Management Company (Manager), has contractually agreed to waive all or a portion of its investment advisory fees and/or pay/reimburse expenses (excluding any 12b-1 fees, acquired fund fees and expenses, taxes, interest, short sale and dividend interest expenses, brokerage fees, certain insurance costs, and nonroutine expenses or costs, including, but not limited to, those relating to reorganizations, litigation, conducting shareholder meetings, and liquidations) in order to prevent total annual fund operating expenses from exceeding 0.60% of the Fund’s average daily net assets from Sept. 1, 2014 through Aug. 31, 2015.* Please see the most recent prospectus and any applicable supplement(s) for additional information on these fee waivers and/or reimbursements.
| Fund expense ratios | Class A | Class C | Institutional Class | |||
| ||||||
Total annual operating expenses | 0.99% | 1.74% | 0.74% | |||
(without fee waivers) | ||||||
Net expenses | 0.85% | 1.60% | 0.60% | |||
(including fee waivers, if any) | ||||||
Type of waiver | Contractual | Contractual | Contractual | |||
| ||||||
*The contractual waiver period is from Dec. 27, 2013, through Dec. 29, 2015.
13
Table of Contents
Performance summaries
Delaware National High-Yield Municipal Bond Fund
Performance of a $10,000 investment1
Average annual total returns from Aug. 31, 2005, through Aug. 31, 2015
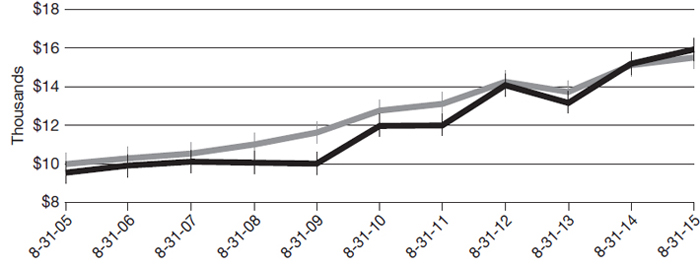
| For period beginning Aug. 31, 2005, through Aug. 31, 2015 | Starting value | Ending value | ||||||
| Delaware National High-Yield Municipal Bond Fund — Class A shares | $9,550 | $15,948 | ||||||
| Barclays Municipal Bond Index | $10,000 | $15,513 | ||||||
1 The “Performance of a $10,000 investment” graph assumes $10,000 invested in Class A shares of the Fund on Aug. 31, 2005, and includes the effect of a 4.50% front-end sales charge and the reinvestment of all distributions. The graph does not reflect the deduction of taxes the shareholders would pay on Fund distributions or redemptions of Fund shares. Expense limitations were in effect for some or all of the periods shown. Performance would have been lower had expense limitations not been in effect. Expenses are listed in the “Fund expense ratios” table on page 13. Please note additional details on pages 12 through 14.
The graph also assumes $10,000 invested in the Barclays Municipal Bond Index as of Aug. 31, 2005. The Barclays Municipal Bond Index measures the total return performance of the long-term, investment grade tax-exempt bond market.
Index performance returns do not reflect any management fees, transaction costs, or expenses. Indices are unmanaged and one cannot invest directly in an index. Past performance is not a guarantee of future results.
Performance of other Fund classes will vary due to different charges and expenses.
| ||||||
Nasdaq symbols |
CUSIPs | |||||
Class A | CXHYX | 928928241 | ||||
Class C | DVHCX | 928928225 | ||||
Institutional Class
| DVHIX
| 24610H302
| ||||
| ||||||
14
Table of Contents
For the six-month period from March 1, 2015 to August 31, 2015 (Unaudited)
As a shareholder of a Fund, you incur two types of costs: (1) transaction costs, including sales charges (loads) on purchase payments, reinvested dividends, or other distributions; redemption fees; and exchange fees; and (2) ongoing costs, including management fees; distribution and/or service (12b-1) fees; and other Fund expenses. These following examples are intended to help you understand your ongoing costs (in dollars) of investing in a Fund and to compare these costs with the ongoing costs of investing in other mutual funds.
The examples are based on an investment of $1,000 invested at the beginning of the period and held for the entire six-month period from March 1, 2015 to Aug. 31, 2015.
Actual expenses
The first section of the tables shown, “Actual Fund return,” provides information about actual account values and actual expenses. You may use the information in this section of the table, together with the amount you invested, to estimate the expenses that you paid over the period. Simply divide your account value by $1,000 (for example, an $8,600 account value divided by $1,000 = 8.6), then multiply the result by the number in the first section under the heading entitled “Expenses Paid During Period” to estimate the expenses you paid on your account during this period.
Hypothetical example for comparison purposes
The second section of the tables shown, “Hypothetical 5% return,” provides information about hypothetical account values and hypothetical expenses based on the Funds’ actual expense ratios and an assumed rate of return of 5% per year before expenses, which is not the Funds’ actual return. The hypothetical account values and expenses may not be used to estimate the actual ending account balance or expenses you paid for the period. You may use this information to compare the ongoing costs of investing in the Funds and other funds. To do so, compare this 5% hypothetical example with the 5% hypothetical examples that appear in the shareholder reports of the other funds.
Please note that the expenses shown in the tables are meant to highlight your ongoing costs only and do not reflect any transactional costs, such as sales charges (loads), redemption fees, or exchange fees. Therefore, the second section of each table is useful in comparing ongoing costs only, and will not help you determine the relative total costs of owning different funds. In addition, if these transactional costs were included, your costs would have been higher. The Funds’ expenses shown in the tables reflect fee waivers in effect. The expenses shown in each table assume reinvestment of all dividends and distributions.
15
Table of Contents
Disclosure of Fund expenses
For the six-month period from March 1, 2015 to August 31, 2015 (Unaudited)
Delaware Tax-Free USA Fund
Expense analysis of an investment of $1,000
Beginning
Account Value
3/1/15 | Ending
Account Value
8/31/15 | Annualized
Expense Ratio | Expenses
Paid During Period
3/1/15 to 8/31/15* | ||||||||
Actual Fund return† | |||||||||||
Class A | $1,000.00 | $1,000.70 | 0.81% | $4.08 | |||||||
Class C | 1,000.00 | 996.90 | 1.57% | 7.90 | |||||||
Institutional Class | 1,000.00 | 1,001.20 | 0.57% | 2.88 | |||||||
Hypothetical 5% return (5% return before expenses) | |||||||||||
Class A | $1,000.00 | $1,021.12 | 0.81% | $4.13 | |||||||
Class C | 1,000.00 | 1,017.29 | 1.57% | 7.98 | |||||||
Institutional Class | 1,000.00 | 1,022.33 | 0.57% | 2.91 | |||||||
Delaware Tax-Free USA Intermediate Fund
Expense analysis of an investment of $1,000
Beginning
Account Value
3/1/15 | Ending
Account Value
8/31/15 | Annualized
Expense Ratio | Expenses
Paid During Period
3/1/15 to 8/31/15* | ||||||||
Actual Fund return† | |||||||||||
Class A | $1,000.00 | $998.30 | 0.76% | $3.83 | |||||||
Class C | 1,000.00 | 994.10 | 1.61% | 8.09 | |||||||
Institutional Class | 1,000.00 | 999.30 | 0.61% | 3.07 | |||||||
Hypothetical 5% return (5% return before expenses) | |||||||||||
Class A | $1,000.00 | $1,021.37 | 0.76% | $3.87 | |||||||
Class C | 1,000.00 | 1,017.09 | 1.61% | 8.19 | |||||||
Institutional Class | 1,000.00 | 1,022.13 | 0.61% | 3.11 | |||||||
16
Table of Contents
Delaware National High-Yield Municipal Bond Fund
Expense analysis of an investment of $1,000
| Beginning Account Value 3/1/15 | Ending Account Value 8/31/15 | Annualized Expense Ratio | Expenses Paid During Period 3/1/15 to 8/31/15* | |||||
| ||||||||
Actual Fund return† | ||||||||
Class A | $1,000.00 | $1,004.50 | 0.84% | $4.24 | ||||
Class C | 1,000.00 | 1,001.70 | 1.59% | 8.02 | ||||
Institutional Class | 1,000.00 | 1,005.90 | 0.59% | 2.98 | ||||
| ||||||||
Hypothetical 5% return (5% return before expenses) | ||||||||
Class A | $1,000.00 | $1,020.97 | 0.84% | $4.28 | ||||
Class C | 1,000.00 | 1,017.19 | 1.59% | 8.08 | ||||
Institutional Class | 1,000.00 | 1,022.23 | 0.59% | 3.01 | ||||
| ||||||||
| * | “Expenses Paid During Period” are equal to the relevant Fund’s annualized expense ratio, multiplied by the average account value over the period, multiplied by 184/365 (to reflect the one-half year period). |
| † | Because actual returns reflect only the most recent six-month period, the returns shown may differ significantly from fiscal year returns. |
17
Table of Contents
| Security type / sector / state / territory allocations | ||
| Delaware Tax-Free USA Fund | As of August 31, 2015 (Unaudited) | |
Sector designations may be different than the sector designations presented in other fund materials.
| Security type / sector | Percentage of net assets | ||||
Municipal Bonds* | 97.28% | ||||
Corporate Revenue Bonds | 13.68% | ||||
Education Revenue Bonds | 11.15% | ||||
Electric Revenue Bonds | 5.13% | ||||
Healthcare Revenue Bonds | 8.56% | ||||
Housing Revenue Bonds | 1.19% | ||||
Lease Revenue Bonds | 2.36% | ||||
Local General Obligation Bonds | 7.58% | ||||
Pre-Refunded/Escrowed to Maturity Bonds | 11.52% | ||||
Special Tax Revenue Bonds | 12.31% | ||||
State General Obligation Bonds | 6.82% | ||||
Transportation Revenue Bonds | 12.02% | ||||
Water & Sewer Revenue Bonds | 4.96% | ||||
Short-Term Investments | 1.41% | ||||
Total Value of Securities | 98.69% | ||||
Receivables and Other Assets Net of Liabilities | 1.31% | ||||
Total Net Assets | 100.00% | ||||
* As of the date of this report, Delaware Tax-Free USA Fund held bonds issued by or on behalf of territories and the states of the U.S. as follows:
| State / territory | Percentage of net assets | ||||
Alabama | 1.18% | ||||
Alaska | 0.61% | ||||
Arizona | 2.23% | ||||
California | 13.61% | ||||
Colorado | 1.03% | ||||
Connecticut | 1.25% | ||||
Florida | 1.62% | ||||
Georgia | 2.42% | ||||
Hawaii | 0.51% | ||||
Illinois | 4.12% | ||||
Indiana | 1.27% | ||||
Kansas | 0.17% | ||||
Louisiana | 1.70% | ||||
Maryland | 2.08% | ||||
Massachusetts | 2.94% | ||||
Minnesota | 0.60% | ||||
Mississippi | 1.14% | ||||
Missouri | 4.15% | ||||
Nevada | 0.69% | ||||
18
Table of Contents
| State / territory | Percentage of net assets | ||||
New Jersey | 6.59% | ||||
New Mexico | 0.08% | ||||
New York | 19.13% | ||||
North Carolina | 3.37% | ||||
North Dakota | 0.30% | ||||
Ohio | 3.03% | ||||
Oklahoma | 2.99% | ||||
Oregon | 0.30% | ||||
Pennsylvania | 2.63% | ||||
Texas | 12.11% | ||||
U.S. Virgin Islands | 0.22% | ||||
Utah | 0.28% | ||||
Virginia | 3.12% | ||||
Washington | 0.18% | ||||
West Virginia | 0.57% | ||||
Wisconsin | 0.47% | ||||
Total | 98.69% | ||||
19
Table of Contents
| Security type / sector / state / territory allocations | ||
| Delaware Tax-Free USA Intermediate Fund | As of August 31, 2015 (Unaudited) | |
Sector designations may be different than the sector designations presented in other fund materials.
| Security type / sector | Percentage of net assets | ||||
Municipal Bonds* | 98.31% | ||||
Corporate Revenue Bonds | 14.25% | ||||
Education Revenue Bonds | 7.98% | ||||
Electric Revenue Bonds | 3.20% | ||||
Healthcare Revenue Bonds | 9.45% | ||||
Housing Revenue Bond | 0.28% | ||||
Lease Revenue Bonds | 3.48% | ||||
Local General Obligation Bonds | 5.23% | ||||
Pre-Refunded/Escrowed to Maturity Bonds | 8.82% | ||||
Resource Recovery Revenue Bonds | 0.21% | ||||
Special Tax Revenue Bonds | 13.08% | ||||
State General Obligation Bonds | 14.11% | ||||
Transportation Revenue Bonds | 14.65% | ||||
Water & Sewer Revenue Bonds | 3.57% | ||||
Short-Term Investments | 0.86% | ||||
Total Value of Securities | 99.17% | ||||
Receivables and Other Assets Net of Liabilities | 0.83% | ||||
Total Net Assets | 100.00% | ||||
* As of the date of this report, Delaware Tax-Free USA Intermediate Fund held bonds issued by or on behalf of territories and the states of the U.S. as follows:
| State / territory | Percentage of net assets | ||||
Alabama | 0.21% | ||||
Arizona | 4.93% | ||||
California | 16.30% | ||||
Connecticut | 1.10% | ||||
Florida | 1.08% | ||||
Georgia | 3.66% | ||||
Guam | 0.45% | ||||
Idaho | 1.03% | ||||
Illinois | 4.00% | ||||
Indiana | 0.11% | ||||
Kansas | 0.14% | ||||
Louisiana | 3.51% | ||||
Maryland | 1.82% | ||||
Massachusetts | 1.10% | ||||
Minnesota | 6.96% | ||||
Mississippi | 0.89% | ||||
Missouri | 1.18% | ||||
Nevada | 0.18% | ||||
20
Table of Contents
| State / territory | Percentage of net assets | ||||
New Jersey | 4.54% | ||||
New York | 16.38% | ||||
North Carolina | 0.65% | ||||
North Dakota | 0.28% | ||||
Ohio | 1.21% | ||||
Oklahoma | 0.53% | ||||
Oregon | 2.24% | ||||
Pennsylvania | 5.31% | ||||
Tennessee | 0.66% | ||||
Texas | 10.92% | ||||
Virginia | 5.47% | ||||
Washington | 1.50% | ||||
Wisconsin | 0.83% | ||||
Total | 99.17% | ||||
21
Table of Contents
| Security type / sector / state / territory allocations | ||
| Delaware National High-Yield Municipal Bond Fund | As of August 31, 2015 (Unaudited) | |
Sector designations may be different than the sector designations presented in other fund materials.
| Security type / sector | Percentage of net assets | ||||
Municipal Bonds* | 97.94% | ||||
Corporate Revenue Bonds | 21.70% | ||||
Education Revenue Bonds | 16.35% | ||||
Electric Revenue Bonds | 0.42% | ||||
Healthcare Revenue Bonds | 23.04% | ||||
Housing Revenue Bonds | 1.20% | ||||
Lease Revenue Bonds | 5.70% | ||||
Local General Obligation Bonds | 3.63% | ||||
Pre-Refunded Bonds | 4.70% | ||||
Resource Recovery Revenue Bonds | 0.84% | ||||
Special Tax Revenue Bonds | 7.88% | ||||
State General Obligation Bonds | 2.99% | ||||
Transportation Revenue Bonds | 6.56% | ||||
Water & Sewer Revenue Bonds | 2.93% | ||||
Short-Term Investments | 0.96% | ||||
Total Value of Securities | 98.90% | ||||
Receivables and Other Assets Net of Liabilities | 1.10% | ||||
Total Net Assets | 100.00% | ||||
* As of the date of this report, Delaware National High-Yield Municipal Bond Fund held bonds issued by or on behalf of territories and the states of the U.S. as follows:
| State / territory | Percentage of net assets | ||||
Alabama | 3.47% | ||||
Alaska | 0.21% | ||||
Arizona | 4.18% | ||||
California | 13.51% | ||||
Colorado | 1.61% | ||||
Connecticut | 0.11% | ||||
District of Columbia | 0.77% | ||||
Florida | 4.87% | ||||
Georgia | 0.90% | ||||
Hawaii | 1.58% | ||||
Idaho | 0.96% | ||||
Illinois | 4.77% | ||||
Indiana | 1.00% | ||||
Iowa | 0.26% | ||||
Kansas | 0.66% | ||||
Kentucky | 1.36% | ||||
Louisiana | 3.13% | ||||
Maine | 0.20% | ||||
22
Table of Contents
| State / territory | Percentage of net assets | ||||
Maryland | 3.79% | ||||
Massachusetts | 1.10% | ||||
Michigan | 1.29% | ||||
Minnesota | 3.45% | ||||
Mississippi | 0.21% | ||||
Missouri | 1.06% | ||||
Nevada | 0.89% | ||||
New Hampshire | 0.16% | ||||
New Jersey | 5.07% | ||||
New Mexico | 0.05% | ||||
New York | 10.83% | ||||
North Carolina | 0.55% | ||||
North Dakota | 0.27% | ||||
Ohio | 4.14% | ||||
Oklahoma | 0.56% | ||||
Oregon | 0.59% | ||||
Pennsylvania | 7.76% | ||||
Puerto Rico | 0.07% | ||||
South Carolina | 0.10% | ||||
Tennessee | 0.26% | ||||
Texas | 7.00% | ||||
Utah | 0.23% | ||||
Vermont | 0.12% | ||||
Virginia | 1.81% | ||||
Washington | 0.98% | ||||
West Virginia | 1.19% | ||||
Wisconsin | 1.60% | ||||
Wyoming | 0.22% | ||||
Total | 98.90% | ||||
23
Table of Contents
| Schedules of investments | ||
| Delaware Tax-Free USA Fund | August 31, 2015 |
| Principal amount° | Value (U.S. $) | |||||||
| ||||||||
Municipal Bonds – 97.28% | ||||||||
| ||||||||
Corporate Revenue Bonds – 13.68% | ||||||||
Buckeye, Ohio Tobacco Settlement Financing Authority | ||||||||
(Asset-Backed Senior Turbo) Series A-2 5.875% 6/1/47 | 5,225,000 | $ | 4,213,127 | |||||
Gaston County, North Carolina Industrial Facilities & Pollution Control Financing Authority | ||||||||
(Exempt Facilities National Gypsum Co. Project) 5.75% 8/1/35 (AMT) | 1,810,000 | 1,812,733 | ||||||
Golden State, California Tobacco Securitization Corporate Settlement Revenue | ||||||||
(Asset-Backed Enhanced) Series A 5.00% 6/1/45 | 10,000,000 | 10,995,200 | ||||||
(Asset-Backed Senior Notes) Series A-1 5.75% 6/1/47 | 8,025,000 | 6,897,247 | ||||||
Harris County, Texas Industrial Development Corporation Solid Waste Disposal Revenue | ||||||||
(Deer Park Refining Project) 5.00% 2/1/23 | 2,955,000 | 3,235,991 | ||||||
Houston, Texas Airport System Revenue | ||||||||
(United Airlines) 5.00% 7/1/29 (AMT) | 1,600,000 | 1,693,200 | ||||||
Illinois Railsplitter Tobacco Settlement Authority | ||||||||
6.00% 6/1/28 | 6,000,000 | 7,057,920 | ||||||
6.25% 6/1/24 | 6,810,000 | 7,105,622 | ||||||
Indianapolis, Indiana Airport Authority Revenue Special Facilities | ||||||||
(Federal Express Corp. Project) 5.10% 1/15/17 (AMT) | 2,750,000 | 2,906,805 | ||||||
Louisiana Public Facilities Authority | ||||||||
(LA Pellets Inc. Project) 144A 7.75% 7/1/39 (AMT)# | 1,500,000 | 1,497,330 | ||||||
Maryland Economic Development Corporation Revenue | ||||||||
(CNX Marine Terminals) 5.75% 9/1/25 | 3,375,000 | 3,441,386 | ||||||
M-S-R Energy Authority, California Gas Revenue | ||||||||
Series A 6.125% 11/1/29 | 1,915,000 | 2,365,829 | ||||||
New Jersey Economic Development Authority Special Facilities Revenue | ||||||||
(Continental Airlines, Inc. Project) | ||||||||
4.875% 9/15/19 (AMT) | 1,515,000 | 1,584,372 | ||||||
Series B 5.625% 11/15/30 (AMT) | 1,365,000 | 1,532,472 | ||||||
New York City, New York Industrial Development Agency Special Facilities Revenue | ||||||||
(American Airlines - JFK International Airport) 7.75% 8/1/31 (AMT)● | 2,000,000 | 2,122,940 | ||||||
New York State Liberty Development Corporation Revenue | ||||||||
(Second Priority - Bank of America Tower) Class 3 6.375% 7/15/49 | 1,000,000 | 1,132,250 | ||||||
Ohio State Air Quality Development Authority Revenue | ||||||||
(First Energy Generation) Series A 5.70% 8/1/20 | 4,750,000 | 5,183,580 | ||||||
Parish of St. John the Baptist, Louisiana | ||||||||
(Marathon Oil) Series A 5.125% 6/1/37 | 1,875,000 | 1,936,856 | ||||||
24
Table of Contents
| Principal amount° | Value (U.S. $) | |||||||
| ||||||||
Municipal Bonds (continued) | ||||||||
| ||||||||
Corporate Revenue Bonds (continued) | ||||||||
Pennsylvania Economic Development Financing Authority | ||||||||
(PPL Energy Supply) Series A 6.40% 12/1/38 | 1,580,000 | $ | 1,601,646 | |||||
Selma, Alabama Industrial Development Board | ||||||||
(Zilkha Biomass Selma LLC Project) 144A 7.50% 5/1/25 (AMT)# | 1,520,000 | 1,516,975 | ||||||
Shoals, Indiana | ||||||||
(National Gypsum Co. Project) 7.25% 11/1/43 (AMT) | 1,940,000 | 2,158,716 | ||||||
Tobacco Settlement Financing Corporation, New Jersey Revenue | ||||||||
Series 1A 5.00% 6/1/41 | 4,765,000 | 3,632,741 | ||||||
Valparaiso, Indiana | ||||||||
(Pratt Paper, LLC Project) 7.00% 1/1/44 (AMT) | 1,780,000 | 2,161,472 | ||||||
|
| |||||||
| 77,786,410 | ||||||||
|
| |||||||
Education Revenue Bonds – 11.15% | ||||||||
Bowling Green, Ohio Student Housing Revenue CFP I | ||||||||
(State University Project) 6.00% 6/1/45 | 5,295,000 | 5,639,016 | ||||||
California Statewide Communities Development Authority School Facility Revenue | ||||||||
(Aspire Public Schools) 6.125% 7/1/46 | 5,145,000 | 5,466,563 | ||||||
Connecticut State Health & Educational Facilities Authority Revenue | ||||||||
(Yale University) Series A-1 5.00% 7/1/25 | 3,000,000 | 3,341,640 | ||||||
Gainesville, Georgia Redevelopment Authority Educational Facilities Revenue | ||||||||
(Riverside Military Academy Project) 5.125% 3/1/37 | 2,850,000 | 2,688,775 | ||||||
Henderson, Nevada Public Improvement Trust | ||||||||
(Touro College & University System) 5.50% 1/1/39 | 805,000 | 857,261 | ||||||
Louisiana Public Facilities Authority Revenue | ||||||||
(Southwest Louisiana Charter Academy Foundation Project) Series A 8.375% 12/15/43 | 1,875,000 | 2,190,956 | ||||||
Marietta, Georgia Development Authority Revenue | ||||||||
(Life University Income Project) 7.00% 6/15/39 | 4,200,000 | 4,402,062 | ||||||
Massachusetts State Development Finance Agency Revenue | ||||||||
(Harvard University) Series B-2 5.25% 2/1/34 | 5,000,000 | 5,849,050 | ||||||
Massachusetts State Health & Educational Facilities Authority Revenue | ||||||||
(Harvard University) | ||||||||
Series A 5.00% 12/15/29 | 5,000,000 | 5,734,150 | ||||||
Series A 5.50% 11/15/36 | 4,515,000 | 5,147,597 | ||||||
Missouri State Health & Educational Facilities Authority Revenue | ||||||||
(Washington University) Series A 5.375% 3/15/39 | 5,000,000 | 5,468,250 | ||||||
25
Table of Contents
Schedules of investments
Delaware Tax-Free USA Fund
| Principal amount° | Value (U.S. $) | |||||||
| ||||||||
Municipal Bonds (continued) | ||||||||
| ||||||||
Education Revenue Bonds (continued) | ||||||||
New Jersey Economic Development Authority Revenue | ||||||||
(Provident Group - Montclair) 5.875% 6/1/42 | 4,225,000 | $ | 4,680,835 | |||||
Pennsylvania State Higher Educational Facilities Authority Student Housing Revenue | ||||||||
(University Properties Inc. - East Stroudsburg University of Pennsylvania) 5.00% 7/1/31 | 6,000,000 | 6,291,840 | ||||||
Provo, Utah Charter School Revenue | ||||||||
(Freedom Academy Foundation Project) 5.50% 6/15/37 | 1,565,000 | 1,576,237 | ||||||
San Juan, Texas Higher Education Finance Authority Education Revenue | ||||||||
(Idea Public Schools) Series A 6.70% 8/15/40 | 1,500,000 | 1,748,130 | ||||||
University of California | ||||||||
Series AO 5.00% 5/15/40 | 2,000,000 | 2,291,040 | ||||||
|
| |||||||
| 63,373,402 | ||||||||
|
| |||||||
Electric Revenue Bonds – 5.13% | ||||||||
California State Department of Water Resources | ||||||||
Series L 5.00% 5/1/17 | 910,000 | 978,459 | ||||||
Series L 5.00% 5/1/20 | 5,000,000 | 5,859,800 | ||||||
City Public Service Board of San Antonio, Texas | ||||||||
5.00% 2/1/22 | 5,040,000 | 5,983,992 | ||||||
5.25% 2/1/24 | 7,000,000 | 8,605,870 | ||||||
Long Island, New York Power Authority | ||||||||
Series A 5.00% 9/1/44 | 1,430,000 | 1,573,501 | ||||||
Salt River Project Agricultural Improvement & Power District Electric Systems Revenue | ||||||||
Series A 5.00% 12/1/35 | 4,610,000 | 5,367,239 | ||||||
Southern Minnesota Municipal Power Agency | ||||||||
Series A 5.25% 1/1/17 (AMBAC) | 750,000 | 796,860 | ||||||
|
| |||||||
| 29,165,721 | ||||||||
|
| |||||||
Healthcare Revenue Bonds – 8.56% | ||||||||
Alachua County, Florida Health Facilities Authority | ||||||||
(Oak Hammock University) Series A 8.00% 10/1/42 | 1,000,000 | 1,238,620 | ||||||
Colorado Health Facilities Authority Revenue | ||||||||
(American Baptist) 8.00% 8/1/43 | 2,040,000 | 2,405,405 | ||||||
(Mental Health Center Denver Project) Series A 5.75% 2/1/44 | 1,875,000 | 2,093,981 | ||||||
Fairfax County, Virginia Industrial Development Authority Revenue | ||||||||
(Inova Health Services) Series A 5.50% 5/15/35 | 2,500,000 | 2,824,325 | ||||||
Koyukuk, Alaska Revenue | ||||||||
(Tanana Chiefs Conference Health Care Facility Project) 7.75% 10/1/41 | 3,000,000 | 3,447,450 | ||||||
26
Table of Contents
| Principal amount° | Value (U.S. $) | |||||||
| ||||||||
Municipal Bonds (continued) | ||||||||
| ||||||||
Healthcare Revenue Bonds (continued) | ||||||||
Louisiana Public Facilities Authority Revenue | ||||||||
(Ochsner Clinic Foundation Project) 6.50% 5/15/37 | 2,190,000 | $ | 2,543,575 | |||||
Maricopa County, Arizona Industrial Development Authority Health Facilities Revenue | ||||||||
(Catholic Healthcare West) Series A 6.00% 7/1/39 | 3,690,000 | 4,175,051 | ||||||
Moon, Pennsylvania Industrial Development Authority | ||||||||
(Baptist Homes Society Obligation) 6.125% 7/1/50 | 2,250,000 | 2,255,040 | ||||||
New York State Dormitory Authority Revenue Non State Supported Debt | ||||||||
(Orange Regional Medical Center) | ||||||||
6.25% 12/1/37 | 2,250,000 | 2,463,367 | ||||||
6.50% 12/1/21 | 2,745,000 | 3,097,925 | ||||||
North Carolina Medical Care Commission Health Care Facilities Revenue | ||||||||
(First Mortgage - Galloway Ridge Project) Series A 5.875% 1/1/31 | 1,555,000 | 1,654,738 | ||||||
(First Mortgage - Presbyterian Homes) 5.40% 10/1/27 | 3,260,000 | 3,343,391 | ||||||
Ohio State Higher Educational Facility Community Revenue | ||||||||
(Cleveland Clinic Health System Obligation Group) Series A 5.25% 1/1/33 | 2,000,000 | 2,166,500 | ||||||
Orange County, New York Funding Corporation Assisted Living Residence Revenue | ||||||||
6.50% 1/1/46 | 3,000,000 | 2,987,820 | ||||||
Oregon Health & Science University Revenue | ||||||||
(Capital Appreciation Insured) Series A 5.75% 7/1/21 (NATL-RE)^ | 2,000,000 | 1,728,200 | ||||||
Palm Beach County, Florida Health Facilities Authority | ||||||||
(Sinai Residences Boca Raton Project) | ||||||||
7.25% 6/1/34 | 120,000 | 137,312 | ||||||
Series A 7.50% 6/1/49 | 610,000 | 706,661 | ||||||
Rochester, Minnesota | ||||||||
(The Homestead at Rochester) Series A 6.875% 12/1/48 | 2,350,000 | 2,637,945 | ||||||
Southwestern Illinois Development Authority Revenue | ||||||||
(Memorial Group Inc.) 7.125% 11/1/43 | 2,000,000 | 2,428,520 | ||||||
Tempe, Arizona Industrial Development Authority Revenue | ||||||||
(Friendship Village) Series A 6.25% 12/1/46 | 1,000,000 | 1,081,200 | ||||||
West Virginia Hospital Finance Authority Revenue | ||||||||
(Highland Hospital Obligation Group) 9.125% 10/1/41 | 2,900,000 | 3,221,291 | ||||||
|
| |||||||
| 48,638,317 | ||||||||
|
| |||||||
27
Table of Contents
Schedules of investments
Delaware Tax-Free USA Fund
| Principal amount° | Value (U.S. $) | |||||||
| ||||||||
Municipal Bonds (continued) | ||||||||
| ||||||||
Housing Revenue Bonds – 1.19% | ||||||||
California Municipal Finance Authority Mobile Home Park Revenue | ||||||||
(Caritas Projects) Series A 6.40% 8/15/45 | 4,605,000 | $ | 5,062,553 | |||||
Williston, North Dakota | ||||||||
(Eagle Crest Apartments, LLC Project) 7.75% 9/1/38 | 1,620,000 | 1,693,467 | ||||||
|
| |||||||
| 6,756,020 | ||||||||
|
| |||||||
Lease Revenue Bonds – 2.36% | ||||||||
New Jersey Economic Development Authority | ||||||||
(School Facilities Construction) | ||||||||
Series EE 5.00% 9/1/18 | 2,890,000 | 3,073,688 | ||||||
Series GG 5.75% 9/1/23 | 1,000,000 | 1,088,200 | ||||||
New York Liberty Development Revenue | ||||||||
(Class 2-3 World Trade Center Project) 144A 5.375% 11/15/40 # | 4,155,000 | 4,382,985 | ||||||
Public Finance Authority, Wisconsin Airport Facilities Revenue | ||||||||
(AFCO Investors II Portfolio) 5.75% 10/1/31 (AMT) | 2,245,000 | 2,261,097 | ||||||
St. Louis, Missouri Industrial Development Authority Leasehold Revenue | ||||||||
(Convention Center Hotel) 5.80% 7/15/20 (AMBAC)^ | 3,035,000 | 2,630,161 | ||||||
|
| |||||||
| 13,436,131 | ||||||||
|
| |||||||
Local General Obligation Bonds – 7.58% | ||||||||
Chicago, Illinois | ||||||||
Series A 5.50% 1/1/39 | 2,900,000 | 2,657,763 | ||||||
Fairfax County, Virginia | ||||||||
(Public Improvement) Series A 5.00% 10/1/19 | 9,000,000 | 10,384,020 | ||||||
Georgetown, Texas Independent School District | ||||||||
(School Building) | ||||||||
5.00% 8/15/24 (PSF) | 1,430,000 | 1,640,467 | ||||||
5.00% 8/15/26 (PSF) | 1,000,000 | 1,144,120 | ||||||
Honolulu, Hawaii | ||||||||
Series A 5.00% 10/1/39 | 2,500,000 | 2,892,150 | ||||||
Los Angeles, California Community College District | ||||||||
Series C 5.00% 8/1/25 | 2,500,000 | 3,107,375 | ||||||
New York City, New York | ||||||||
Series A 5.00% 8/1/19 | 2,690,000 | 3,066,788 | ||||||
Series I-1 5.375% 4/1/36 | 5,000,000 | 5,653,850 | ||||||
Series J 5.00% 8/1/17 | 3,000,000 | 3,252,540 | ||||||
Subseries D-1 5.00% 10/1/36 | 6,500,000 | 7,417,540 | ||||||
28
Table of Contents
| Principal amount° | Value (U.S. $) | |||||||
| ||||||||
Municipal Bonds (continued) | ||||||||
| ||||||||
Local General Obligation Bonds (continued) | ||||||||
Prince George’s County, Maryland | ||||||||
(Consolidated Public Improvement) Series C 5.00% 8/1/17 | 1,700,000 | $ | 1,843,684 | |||||
|
| |||||||
| 43,060,297 | ||||||||
|
| |||||||
Pre-Refunded/Escrowed to Maturity Bonds – 11.52% | ||||||||
Atlanta, Georgia Water & Wastewater Revenue | ||||||||
Series A 6.25% 11/1/39-19§ | 5,500,000 | 6,648,180 | ||||||
Brevard County, Florida Health Facilities Authority Revenue | ||||||||
(Health First Inc. Project) 7.00% 4/1/39-19§ | 4,065,000 | 4,907,796 | ||||||
Butler County, Pennsylvania Hospital Authority Revenue | ||||||||
(Butler Health System Project) 7.125% 7/1/29-19§ | 2,500,000 | 3,058,025 | ||||||
California State Economic Recovery | ||||||||
Series A 5.25% 7/1/21-19§ | 1,990,000 | 2,310,111 | ||||||
(Unrefunded) Series A 5.25% 7/1/21-19§ | 1,140,000 | 1,323,380 | ||||||
Cape Girardeau County, Missouri Industrial Development Authority Health Care Facilities Revenue | ||||||||
(Southeast Missouri Hospital) 5.25% 6/1/16 (NATL-RE) | 85,000 | 87,861 | ||||||
Greene County, Missouri Single Family Mortgage Revenue Municipal Multiplier | ||||||||
(Private Mortgage Insurance) 11.75% 3/1/16 ^ | 1,225,000 | 1,223,457 | ||||||
Illinois Finance Authority Revenue | ||||||||
(Silver Cross & Medical Centers) 7.00% 8/15/44-19§ | 3,000,000 | 3,682,650 | ||||||
Maryland State & Local Facilities Loan Capital Improvement | ||||||||
Second Series 5.00% 8/1/17-16§ | 935,000 | 975,457 | ||||||
Missouri State Highways & Transportation Commission State Road Revenue | ||||||||
Series B 5.00% 5/1/24-16§ | 7,000,000 | 7,222,880 | ||||||
New Jersey Educational Facilities Authority Revenue | ||||||||
(University of Medicine & Dentistry) Series B 7.50% 12/1/32-19§ | 1,435,000 | 1,768,968 | ||||||
New York Dormitory Authority Revenue Non State Supported Debt | ||||||||
(North Shore Long Island Jewish Health System) Series A 5.50% 5/1/37-19§ | 3,000,000 | 3,467,430 | ||||||
North Texas Tollway Authority Revenue | ||||||||
(First Tier) 6.00% 1/1/24-18§ | 2,930,000 | 3,281,834 | ||||||
(Second Tier) Series F 5.75% 1/1/38-18§ | 6,130,000 | 6,830,720 | ||||||
Oklahoma State Turnpike Authority Revenue | ||||||||
(First Senior) 6.00% 1/1/22 | 13,535,000 | 17,010,517 | ||||||
Virgin Islands Public Finance Authority Revenue | ||||||||
Series A 7.30% 10/1/18 | 1,155,000 | 1,272,048 | ||||||
29
Table of Contents
Schedules of investments
Delaware Tax-Free USA Fund
| Principal amount° | Value (U.S. $) | |||||||
| ||||||||
Municipal Bonds (continued) | ||||||||
| ||||||||
Pre-Refunded/Escrowed to Maturity Bonds (continued) | ||||||||
Wisconsin Housing & Economic Developing Authority Revenue | ||||||||
6.10% 6/1/21-17 (FHA)§ | 390,000 | $ | 424,308 | |||||
|
| |||||||
| 65,495,622 | ||||||||
|
| |||||||
Special Tax Revenue Bonds – 12.31% | ||||||||
Brooklyn Arena Local Development, New York Pilot Revenue | ||||||||
(Barclays Center Project) 6.50% 7/15/30 | 8,230,000 | 9,572,148 | ||||||
Denver, Colorado Convention Center Hotel Authority Revenue Senior | ||||||||
5.00% 12/1/35 (SGI) | 1,305,000 | 1,330,434 | ||||||
Henderson, Nevada Local Improvement Districts No. T-18 | ||||||||
5.30% 9/1/35 | 1,645,000 | 1,247,601 | ||||||
Hollywood, Florida Community Redevelopment Agency Revenue | ||||||||
(Beach CRA) 5.625% 3/1/24 | 1,105,000 | 1,107,995 | ||||||
Missouri State Environmental Improvement & Energy Water Pollution Control Revenue | ||||||||
(State Revolving Fund Project) Series A 6.05% 7/1/16 (AGM) | 20,000 | 20,099 | ||||||
Mosaic, Virginia District Community Development Authority Revenue | ||||||||
Series A 6.875% 3/1/36 | 3,980,000 | 4,533,300 | ||||||
Nevada State | ||||||||
5.00% 6/1/17 | 1,700,000 | 1,830,883 | ||||||
New Jersey Economic Development Authority Revenue | ||||||||
5.00% 6/15/25 | 3,000,000 | 3,228,210 | ||||||
5.00% 6/15/28 | 2,695,000 | 2,849,343 | ||||||
New Jersey Transportation Trust Fund Authority | ||||||||
Series B 5.00% 6/15/21 | 3,235,000 | 3,433,176 | ||||||
Series B 5.50% 6/15/31 | 5,000,000 | 5,239,000 | ||||||
New Mexico Finance Authority | ||||||||
(Senior Lien) 4.00% 6/15/16 | 440,000 | 453,235 | ||||||
New York City, New York Industrial Development Agency | ||||||||
(Yankee Stadium) 7.00% 3/1/49 (ASSURED GTY) | 1,000,000 | 1,179,120 | ||||||
New York City, New York Transitional Finance Authority Future Tax Secured Fiscal 2011 | ||||||||
Series A-1 5.00% 11/1/42 | 10,000,000 | 11,226,900 | ||||||
Series C 5.25% 11/1/25 | 6,000,000 | 7,099,020 | ||||||
Series D 5.00% 2/1/26 | 3,000,000 | 3,454,620 | ||||||
New York State Dormitory Authority | ||||||||
(Education) Series B 5.25% 3/15/38 | 6,000,000 | 6,728,520 | ||||||
30
Table of Contents
| Principal amount° | Value (U.S. $) | |||||||
| ||||||||
Municipal Bonds (continued) | ||||||||
| ||||||||
Special Tax Revenue Bonds (continued) | ||||||||
New York State Dormitory Authority | ||||||||
(Unrefunded - General Purpose) Series E 5.00% 2/15/17 | 1,000,000 | $ | 1,064,460 | |||||
Tampa, Florida Sports Authority Revenue Sales Tax | ||||||||
(Tampa Bay Arena Project) 5.75% 10/1/20 (NATL-RE) | 1,000,000 | 1,101,620 | ||||||
Texas Public Finance Authority | ||||||||
(Assessment - Unemployment Compensation) 5.00% 1/1/17 | 2,180,000 | 2,311,999 | ||||||
Wyandotte County, Kansas City, Kansas Unified Government Special Obligation Revenue | ||||||||
(Capital Appreciation - Sales Tax Subordinate Lien) 6.07% 6/1/21 ^ | 1,295,000 | 947,772 | ||||||
|
| |||||||
| 69,959,455 | ||||||||
|
| |||||||
State General Obligation Bonds – 6.82% | ||||||||
California State | ||||||||
5.00% 2/1/17 | 630,000 | 669,715 | ||||||
5.25% 11/1/40 | 3,795,000 | 4,423,831 | ||||||
Various Purposes | ||||||||
5.00% 9/1/22 | 2,180,000 | 2,608,871 | ||||||
5.00% 11/1/43 | 3,000,000 | 3,376,080 | ||||||
5.00% 10/1/44 | 2,420,000 | 2,718,338 | ||||||
6.00% 4/1/38 | 4,060,000 | 4,732,133 | ||||||
6.50% 4/1/33 | 2,570,000 | 3,045,321 | ||||||
Connecticut State | ||||||||
Series B 5.00% 6/15/35 | 2,475,000 | 2,815,535 | ||||||
Series E 5.00% 12/15/17 | 900,000 | 954,360 | ||||||
North Carolina State Public Improvement | ||||||||
Series A 5.00% 5/1/20 | 10,585,000 | 12,361,481 | ||||||
Washington State | ||||||||
(Various Purposes) Series R-2010A 5.00% 1/1/17 | 990,000 | 1,049,806 | ||||||
|
| |||||||
| 38,755,471 | ||||||||
|
| |||||||
Transportation Revenue Bonds – 12.02% | ||||||||
Bay Area, California Toll Authority | ||||||||
Series S-6 5.00% 10/1/54 | 3,000,000 | 3,263,610 | ||||||
Central Texas Regional Mobility Authority Revenue | ||||||||
Senior Lien 6.00% 1/1/41 | 5,160,000 | 5,902,421 | ||||||
Maryland Economic Development Corporation Revenue | ||||||||
(Transportation Facilities Project) Series A 5.75% 6/1/35 | 5,075,000 | 5,551,137 | ||||||
New Jersey Transportation Trust Fund Authority | ||||||||
(Transportation Program) Series AA 5.00% 6/15/24 | 5,000,000 | 5,321,650 | ||||||
North Texas Tollway Authority Revenue | ||||||||
Series A 5.00% 1/1/34 | 5,000,000 | 5,512,950 | ||||||
31
Table of Contents
Schedules of investments
Delaware Tax-Free USA Fund
| Principal amount° | Value (U.S. $) | |||||||
| ||||||||
Municipal Bonds (continued) | ||||||||
| ||||||||
Transportation Revenue Bonds (continued) | ||||||||
North Texas Tollway Authority Revenue | ||||||||
(Unrefunded - First Tier) Series A 6.00% 1/1/24 | 415,000 | $ | 456,043 | |||||
Pennsylvania Economic Development Financing Authority | ||||||||
(PA Bridges Finco LP) 4.125% 12/31/38 (AMT) | 1,835,000 | 1,748,627 | ||||||
Phoenix, Arizona Civic Improvement Corporation Airport Revenue Junior Lien | ||||||||
Series A 5.00% 7/1/26 | 1,800,000 | 2,048,472 | ||||||
Port Authority of New York & New Jersey Special Project | ||||||||
(JFK International Air Terminal) | ||||||||
6.00% 12/1/42 | 4,735,000 | 5,516,275 | ||||||
6.50% 12/1/28 | 5,500,000 | 5,576,340 | ||||||
St. Louis, Missouri Airport Revenue | ||||||||
(Lambert-St. Louis International) Series A-1 6.625% 7/1/34 | 5,995,000 | 6,936,215 | ||||||
Texas Private Activity Bond Surface Transportation Corporate Senior Lien | ||||||||
(LBJ Infrastructure) | ||||||||
7.00% 6/30/40 | 5,715,000 | 6,812,680 | ||||||
7.50% 6/30/33 | 1,560,000 | 1,901,827 | ||||||
(NTE Mobility Partners) | ||||||||
6.75% 6/30/43 (AMT) | 2,490,000 | 3,026,197 | ||||||
6.875% 12/31/39 | 5,500,000 | 6,443,910 | ||||||
7.00% 12/31/38 (AMT) | 1,830,000 | 2,277,472 | ||||||
|
| |||||||
| 68,295,826 | ||||||||
|
| |||||||
Water & Sewer Revenue Bonds – 4.96% | ||||||||
Jefferson County, Alabama Sewer Revenue | ||||||||
(Sub Lien Warrants) Series D 6.50% 10/1/53 | 4,500,000 | 5,200,560 | ||||||
Metropolitan Water Reclamation District of Greater Chicago, Illinois | ||||||||
(Capital Improvement) Series C 5.00% 12/1/16 | 440,000 | 465,300 | ||||||
New York City, New York Municipal Water Finance Authority Water & Sewer System Revenue | ||||||||
(Fiscal 2009) Series A 5.75% 6/15/40 | 4,000,000 | 4,484,840 | ||||||
(Second Generation Fiscal 2013) Series CC 5.00% 6/15/47 | 1,975,000 | 2,195,963 | ||||||
(Second Generation Resolution Fiscal 2014) Series BB 5.00% 6/15/46 | 5,000,000 | 5,570,300 | ||||||
(Second Generation) Series BB 5.00% 6/15/47 | 4,000,000 | 4,422,160 | ||||||
San Francisco, California City & County Public Utilities Commission Water Revenue | ||||||||
Series F 5.00% 11/1/27 | 5,000,000 | 5,848,600 | ||||||
|
| |||||||
| 28,187,723 | ||||||||
|
| |||||||
Total Municipal Bonds (cost $506,008,513) | 552,910,395 | |||||||
|
| |||||||
32
Table of Contents
| Principal amount° | Value (U.S. $) | |||||||
| ||||||||
Short-Term Investments – 1.41% | ||||||||
| ||||||||
Variable Rate Demand Notes – 1.41%¤ | ||||||||
East Baton Rouge Parish, Louisiana Pollution Control Revenue (Exxon Project) | ||||||||
0.01% 11/1/19 | 1,500,000 | $ | 1,500,000 | |||||
Mississippi Business Finance (Chevron USA) | ||||||||
Series G 0.01% 11/1/35 | 4,300,000 | 4,300,000 | ||||||
Series I 0.01% 11/1/35 | 2,195,000 | 2,195,000 | ||||||
|
| |||||||
Total Short-Term Investments (cost $7,995,000) | 7,995,000 | |||||||
|
| |||||||
Total Value of Securities – 98.69% | $560,905,395 | |||||||
|
| |||||||
| # | Security exempt from registration under Rule 144A of the Securities Act of 1933, as amended. At Aug. 31, 2015, the aggregate value of Rule 144A securities was $7,397,290, which represents 1.30% of the Fund’s net assets. See Note 8 in “Notes to financial statements.” |
| ¤ | Tax-exempt obligations that contain a floating or variable interest rate adjustment formula and an unconditional right of demand to receive payment of the unpaid principal balance plus accrued interest upon a short notice period (generally up to 30 days) prior to specified dates either from the issuer or by drawing on a bank letter of credit, a guarantee, or insurance issued with respect to such instrument. The rate shown is the rate as of Aug. 31, 2015. |
| ° | Principal amount shown is stated in U.S. dollars unless noted that the security is denominated in another currency. |
| ● | Variable rate security. The rate shown is the rate as of Aug. 31, 2015. Interest rates reset periodically. |
| ^ | Zero coupon security. The rate shown is the yield at the time of purchase. |
| § | Pre-refunded bonds. Municipal bonds that are generally backed or secured by U.S. Treasury bonds. For pre-refunded bonds, the stated maturity is followed by the year in which the bond is pre-refunded. See Note 8 in “Notes to financial statements.” |
33
Table of Contents
Schedules of investments
Delaware Tax-Free USA Fund
Summary of abbreviations:
AGM – Insured by Assured Guaranty Municipal Corporation
AMBAC – Insured by AMBAC Assurance Corporation
AMT – Subject to Alternative Minimum Tax
ASSURED GTY – Insured by Assured Guaranty Corporation
FHA – Federal Housing Administration
NATL-RE – Insured by National Public Finance Guarantee Corporation
PSF – Guaranteed by Permanent School Fund
SGI – Insured by Syncora Guarantee Inc.
See accompanying notes, which are an integral part of the financial statements.
34
Table of Contents
Schedules of investments
| Delaware Tax-Free USA Intermediate Fund | August 31, 2015 |
| Principal amount° | Value (U.S. $) | |||||||
| ||||||||
Municipal Bonds – 98.31% | ||||||||
| ||||||||
Corporate Revenue Bonds – 14.25% | ||||||||
Allegheny County, Pennsylvania Industrial Development Authority Revenue | ||||||||
(Environmental Improvement - U.S. Steel Corp. Project) 6.50% 5/1/17 | 2,305,000 | $ | 2,421,218 | |||||
Build NYC Resource, New York | ||||||||
(Pratt Paper Inc. Project) 144A 4.50% 1/1/25 (AMT)# | 1,200,000 | 1,278,060 | ||||||
Chesterfield County, Virginia Economic Development Authority Pollution Control Revenue | ||||||||
(Virginia Electric & Power) Series A 5.00% 5/1/23 | 1,460,000 | 1,645,902 | ||||||
Gloucester County, New Jersey Pollution Control Financing Authority | ||||||||
(Keystone Urban Renewal) Series A 5.00% 12/1/24 (AMT) | 1,000,000 | 1,121,130 | ||||||
Golden State, California Tobacco Securitization Corporate Settlement Revenue | ||||||||
(Asset-Backed) | ||||||||
Series A 5.00% 6/1/33 | 1,735,000 | 1,962,111 | ||||||
Series A 5.00% 6/1/34 | 2,890,000 | 3,265,729 | ||||||
Series A 5.00% 6/1/35 | 8,645,000 | 9,654,909 | ||||||
(Asset-Backed Senior Notes) Series A-1 4.50% 6/1/27 | 9,200,000 | 8,780,940 | ||||||
Harris County, Texas Industrial Development Corporation Solid Waste Disposal Revenue | ||||||||
(Deer Park Refining Project) 5.00% 2/1/23 | 2,750,000 | 3,011,497 | ||||||
Houston, Texas Airport System Revenue | ||||||||
(United Airlines Inc. Terminal E Project) 4.75% 7/1/24 (AMT) | 1,500,000 | 1,614,645 | ||||||
Illinois Railsplitter Tobacco Settlement Authority | ||||||||
5.25% 6/1/20 | 7,160,000 | 8,184,811 | ||||||
6.25% 6/1/24 | 7,500,000 | 7,825,575 | ||||||
Indianapolis, Indiana Airport Authority Revenue Special Facilities | ||||||||
(Federal Express Corp. Project) 5.10% 1/15/17 (AMT) | 750,000 | 792,765 | ||||||
Louisiana Public Facilities Authority | ||||||||
(LA Pellets Inc. Project) 144A 7.00% 7/1/24 (AMT)# | 1,905,000 | 1,910,829 | ||||||
Maricopa County, Arizona Corporation Pollution Control Revenue | ||||||||
(Public Service - Palo Verde Project) Series B 5.20% 6/1/43 ● | 6,000,000 | 6,655,740 | ||||||
Maryland Economic Development Corporation Pollution Control Revenue | ||||||||
(CNX Marine Terminals) 5.75% 9/1/25 | 3,825,000 | 3,900,238 | ||||||
(Potomac Electric Project) 6.20% 9/1/22 | 1,780,000 | 2,064,106 | ||||||
35
Table of Contents
Schedules of investments
Delaware Tax-Free USA Intermediate Fund
| Principal amount° | Value (U.S. $) | |||||||
| ||||||||
Municipal Bonds (continued) | ||||||||
| ||||||||
Corporate Revenue Bonds (continued) | ||||||||
New Jersey Economic Development Authority Special Facilities Revenue | ||||||||
(Continental Airlines, Inc. Project) | ||||||||
4.875% 9/15/19 (AMT) | 3,025,000 | $ | 3,163,515 | |||||
Series B 5.625% 11/15/30 (AMT) | 1,890,000 | 2,121,884 | ||||||
Nez Perce County, Idaho | ||||||||
(Potlatch Project) 6.00% 10/1/24 | 850,000 | 850,825 | ||||||
Ohio State Air Quality Development Authority Revenue Environmental Improvement | ||||||||
(First Energy Generation) Series A 5.70% 8/1/20 | 2,570,000 | 2,804,590 | ||||||
(Pollution Control-First Energy) Series C 5.625% 6/1/18 | 2,370,000 | 2,540,047 | ||||||
Pennsylvania Economic Development Financing Authority | ||||||||
(PPL Energy Supply) Series B 5.00% 12/1/38 ● | 2,755,000 | 2,778,142 | ||||||
Salt Verde, Arizona Financial Corporation Senior Gas Revenue | ||||||||
5.25% 12/1/24 | 3,050,000 | 3,552,640 | ||||||
Selma, Alabama Industrial Development Board | ||||||||
(Zilkha Biomass Selma LLC Project) 144A 7.50% 5/1/25 (AMT)# | 1,450,000 | 1,447,115 | ||||||
Texas Municipal Gas Acquisition & Supply Corp I | ||||||||
(Senior Lien) Series D 6.25% 12/15/26 | 5,800,000 | 6,946,544 | ||||||
Tobacco Settlement Financing Corporation, New Jersey Revenue | ||||||||
Series 1A 4.50% 6/1/23 | 1,710,000 | 1,711,112 | ||||||
Tulsa, Oklahoma Airports Improvement Trust | ||||||||
(American Airlines) 5.00% 6/1/35 (AMT)● | 3,450,000 | 3,747,287 | ||||||
Wisconsin Public Finance Authority Exempt Facilities Revenue | ||||||||
(National Gypsum) 5.25% 4/1/30 (AMT) | 2,905,000 | 2,989,739 | ||||||
|
| |||||||
| 100,743,645 | ||||||||
|
| |||||||
Education Revenue Bonds – 7.98% | ||||||||
Build NYC Resource, New York | ||||||||
5.25% 11/1/29 | 1,800,000 | 1,930,068 | ||||||
5.25% 11/1/34 | 4,680,000 | 4,927,478 | ||||||
California Municipal Finance Authority | ||||||||
(Touro College & University System) Series A 5.25% 1/1/34 | 370,000 | 401,346 | ||||||
California Municipal Finance Authority Educational Revenue | ||||||||
(American Heritage Education Foundation Project) Series A 5.25% 6/1/26 | 1,000,000 | 1,008,050 | ||||||
36
Table of Contents
| Principal amount° | Value (U.S. $) | |||||||
| ||||||||
Municipal Bonds (continued) | ||||||||
| ||||||||
Education Revenue Bonds (continued) | ||||||||
California Statewide Communities Development Authority Revenue | ||||||||
(California Baptist University) Series A 6.125% 11/1/33 | 2,215,000 | $ | 2,398,734 | |||||
California Statewide Communities Development Authority Student Housing Revenue | ||||||||
(Irvine, LLC - UCI East Campus) 6.00% 5/15/23 | 3,150,000 | 3,491,555 | ||||||
Clifton, Texas Higher Education Finance Corporation Revenue | ||||||||
(Uplift Education) Series A 6.00% 12/1/30 | 1,100,000 | 1,251,932 | ||||||
Connecticut State Health & Educational Facilities Authority Revenue | ||||||||
(Yale University) Series A-1 5.00% 7/1/25 | 5,000,000 | 5,569,400 | ||||||
Henderson, Nevada Public Improvement Trust | ||||||||
(Touro College & University System) 5.50% 1/1/34 | 1,190,000 | 1,280,678 | ||||||
Marietta, Georgia Development Authority Revenue | ||||||||
(Life University Income Project) 6.25% 6/15/20 | 775,000 | 820,345 | ||||||
Massachusetts State Development Finance Agency Revenue | ||||||||
(Harvard University) Series B-1 5.25% 10/15/29 | 1,670,000 | 1,956,188 | ||||||
Massachusetts State Health & Educational Facilities Authority Revenue | ||||||||
(Massachusetts Institute of Technology) Series M 5.25% 7/1/20 | 3,000,000 | 3,551,040 | ||||||
New York City Trust for Cultural Resources | ||||||||
(Whitney Museum of American Art) 5.00% 7/1/21 | 3,025,000 | 3,487,734 | ||||||
New York State Dormitory Authority | ||||||||
(Non State Supported Debt - Rockefeller University) Series A 5.00% 7/1/27 | 1,055,000 | 1,195,621 | ||||||
(Touro College & University System) Series A 5.25% 1/1/34 | 1,360,000 | 1,475,899 | ||||||
Pennsylvania State Higher Educational Facilities Authority Revenue | ||||||||
(Drexel University) Series A 5.25% 5/1/25 | 5,290,000 | 6,035,097 | ||||||
Private Colleges & Universities Authority, Georgia Revenue | ||||||||
(Mercer University Project) | ||||||||
Series A 5.25% 10/1/27 | 2,020,000 | 2,268,278 | ||||||
Series C 5.25% 10/1/27 | 2,100,000 | 2,349,333 | ||||||
Troy, New York Capital Resource Corporation Revenue | ||||||||
(Rensselaer Polytechnic) Series B 5.00% 9/1/18 | 2,500,000 | 2,777,000 | ||||||
University of North Carolina, North Carolina at Chapel Hill | ||||||||
5.00% 12/1/31 | 3,490,000 | 3,793,037 | ||||||
37
Table of Contents
Schedules of investments
Delaware Tax-Free USA Intermediate Fund
| Principal amount° | Value (U.S. $) | |||||||
| ||||||||
Municipal Bonds (continued) | ||||||||
| ||||||||
Education Revenue Bonds (continued) | ||||||||
University of Texas Permanent University Fund | ||||||||
Series B 5.00% 7/1/27 | 3,715,000 | $ | 4,463,275 | |||||
|
| |||||||
| 56,432,088 | ||||||||
|
| |||||||
Electric Revenue Bonds – 3.20% | ||||||||
California State Department Water Resources Power Supply Revenue | ||||||||
Series L 5.00% 5/1/19 | 6,000,000 | 6,865,020 | ||||||
Series N 5.00% 5/1/21 | 3,580,000 | 4,274,090 | ||||||
Long Island, New York Power Authority | ||||||||
Series A 5.00% 9/1/34 | 2,325,000 | 2,599,885 | ||||||
Rochester, Minnesota Electric Utilities Revenue | ||||||||
Series C 5.00% 12/1/18 (NATL-RE) | 2,000,000 | 2,117,700 | ||||||
Salt River, Arizona Project Agricultural Improvement & Power District Electric Systems Revenue | ||||||||
Series A 5.00% 12/1/35 | 5,840,000 | 6,799,278 | ||||||
|
| |||||||
| 22,655,973 | ||||||||
|
| |||||||
Healthcare Revenue Bonds – 9.45% | ||||||||
Arizona Health Facilities Authority | ||||||||
(Scottsdale Lincoln Hospital Project) 5.00% 12/1/30 | 5,800,000 | 6,553,072 | ||||||
Berks County, Pennsylvania Hospital Authority Revenue | ||||||||
(Reading Hospital & Medical Center Project) Series A-3 5.25% 11/1/24 | 4,405,000 | 4,988,354 | ||||||
California Statewide Communities Development Authority Revenue | ||||||||
(Kaiser Permanente) Series A 5.00% 4/1/19 | 5,325,000 | 6,063,791 | ||||||
Capital Trust Agency, Florida | ||||||||
(Tuscan Gardens Senior Living Center) 7.00% 4/1/35 | 1,630,000 | 1,635,167 | ||||||
Dauphin County, Pennsylvania General Authority Health System Revenue | ||||||||
(Pinnacle Health System Project) Series A 6.00% 6/1/29 | 3,400,000 | 3,901,364 | ||||||
Illinois Finance Authority Revenue | ||||||||
(Rush University Medical Center) | ||||||||
Series A 5.00% 11/15/32 | 2,900,000 | 3,233,703 | ||||||
Series A 5.00% 11/15/33 | 1,450,000 | 1,604,323 | ||||||
Minneapolis, Minnesota Health Care System Revenue | ||||||||
(Fairview Health Services) Series A 6.375% 11/15/23 | 3,710,000 | 4,296,996 | ||||||
Minneapolis, Minnesota Revenue | ||||||||
(National Marrow Donor Program Project) | ||||||||
5.00% 8/1/16 | 4,720,000 | 4,862,166 | ||||||
5.00% 8/1/18 | 2,500,000 | 2,671,300 | ||||||
38
Table of Contents
| Principal amount° | Value (U.S. $) | |||||||
| ||||||||
Municipal Bonds (continued) | ||||||||
| ||||||||
Healthcare Revenue Bonds (continued) | ||||||||
Montgomery County, Pennsylvania Industrial Development Authority Revenue | ||||||||
(Whitemarsh Continuing Care) 5.00% 1/1/30 | 870,000 | $ | 875,098 | |||||
Moon, Pennsylvania Industrial Development Authority | ||||||||
(Baptist Homes Society Obligation) 5.625% 7/1/30 | 2,440,000 | 2,433,705 | ||||||
New York State Dormitory Authority Revenue | ||||||||
(North Shore Long Island Jewish Health System) Series A 5.00% 5/1/23 | 4,000,000 | 4,544,480 | ||||||
New York State Dormitory Authority Revenue Non State Supported Debt | ||||||||
(Orange Regional Medical Center) 6.50% 12/1/21 | 2,000,000 | 2,257,140 | ||||||
North Carolina Medical Care Commission Health Care Facilities Revenue | ||||||||
(First Mortgage - Presbyterian Homes) 5.40% 10/1/27 | 780,000 | 799,952 | ||||||
Ohio State Higher Educational Facilities Commission Revenue | ||||||||
(Cleveland Clinic Health System Obligation Group) | ||||||||
Series A 5.00% 1/1/17 | 2,000,000 | 2,117,780 | ||||||
Series A 5.00% 1/1/18 | 1,000,000 | 1,094,690 | ||||||
Palm Beach County, Florida Health Facilities Authority Revenue | ||||||||
(Sinai Residences Boca Raton Project-Entrance Fee) | ||||||||
Series B 6.25% 6/1/23 | 950,000 | 1,053,749 | ||||||
Series C 6.00% 6/1/21 | 1,000,000 | 1,090,390 | ||||||
Rochester, Minnesota Health Care Facilities Revenue | ||||||||
(Mayo Clinic) | ||||||||
Series A 4.00% 11/15/30 ● | 3,800,000 | 4,148,004 | ||||||
Series C 4.50% 11/15/38 ● | 2,540,000 | 2,921,432 | ||||||
Southwestern Illinois Development Authority | ||||||||
(Memorial Group) 7.125% 11/1/30 | 2,190,000 | 2,693,525 | ||||||
Washington State Housing Finance Commission | ||||||||
(Heron’s Key) | ||||||||
Series A 144A 6.50% 7/1/30 # | 455,000 | 467,249 | ||||||
Series A 144A 6.75% 7/1/35 # | 465,000 | 479,080 | ||||||
|
| |||||||
| 66,786,510 | ||||||||
|
| |||||||
Housing Revenue Bond – 0.28% | ||||||||
Williston, North Dakota | ||||||||
(Eagle Crest Apartments, LLC Project) 6.25% 9/1/23 | 1,880,000 | 1,974,000 | ||||||
|
| |||||||
| 1,974,000 | ||||||||
|
| |||||||
Lease Revenue Bonds – 3.48% | ||||||||
California Statewide Communities Development Authority Revenue | ||||||||
(Lancer Plaza Project) 5.125% 11/1/23 | 785,000 | 812,475 | ||||||
39
Table of Contents
Schedules of investments
Delaware Tax-Free USA Intermediate Fund
| Principal amount° | Value (U.S. $) | |||||||
| ||||||||
Municipal Bonds (continued) | ||||||||
| ||||||||
Lease Revenue Bonds (continued) | ||||||||
Idaho Building Authority Revenue | ||||||||
(Health & Welfare Project) Series A 5.00% 9/1/24 | 2,800,000 | $ | 3,304,392 | |||||
Los Angeles County, California | ||||||||
(Disney Concert Hall Parking) 5.00% 3/1/23 | 2,395,000 | 2,857,594 | ||||||
Minnesota State General Fund Revenue | ||||||||
Series A 5.00% 6/1/27 | 3,265,000 | 3,804,019 | ||||||
New Jersey Economic Development Authority | ||||||||
(School Facilities Construction) Series EE 5.00% 9/1/18 | 2,485,000 | 2,642,947 | ||||||
New York Liberty Development Revenue | ||||||||
(World Trade Center Project) | ||||||||
Class 2-3 144A 5.15% 11/15/34 # | 4,665,000 | 4,869,700 | ||||||
Class 3-3 144A 7.25% 11/15/44 # | 2,880,000 | 3,419,856 | ||||||
Public Finance Authority, Wisconsin Airport Facilities Revenue | ||||||||
(AFCO Investors II Portfolio) 5.00% 10/1/23 (AMT) | 2,870,000 | 2,863,284 | ||||||
|
| |||||||
| 24,574,267 | ||||||||
|
| |||||||
Local General Obligation Bonds – 5.23% | ||||||||
Chesterfield County, Virginia | ||||||||
Series B 5.00% 1/1/22 (State Aid Withholding) | 4,070,000 | 4,865,034 | ||||||
Chicago, Illinois | ||||||||
Series 2002B 5.50% 1/1/37 | 1,435,000 | 1,320,071 | ||||||
Series 2005D 5.50% 1/1/37 | 1,150,000 | 1,057,897 | ||||||
Conroe, Texas Independent School District | ||||||||
5.00% 2/15/25 (PSF) | 3,865,000 | 4,442,779 | ||||||
Fort Worth, Texas Independent School District | ||||||||
(School Building) 5.00% 2/15/27 (PSF) | 2,000,000 | 2,362,860 | ||||||
Henrico County, Virginia Refunding Public Improvement | ||||||||
5.00% 7/15/19 | 4,000,000 | 4,588,880 | ||||||
Houston, Texas Refunding & Public Improvement | ||||||||
Series A 5.25% 3/1/28 | 5,000,000 | 5,524,000 | ||||||
New York City, New York | ||||||||
Series A-1 5.00% 8/1/19 | 3,500,000 | 3,783,815 | ||||||
Series E 5.00% 8/1/23 | 3,685,000 | 4,386,882 | ||||||
Subseries D-1 5.00% 10/1/30 | 4,000,000 | 4,642,040 | ||||||
|
| |||||||
| 36,974,258 | ||||||||
|
| |||||||
Pre-Refunded/Escrowed to Maturity Bonds – 8.82% | ||||||||
Arizona Water Infrastructure Finance Authority Revenue | ||||||||
(Water Quality) Series A 5.00% 10/1/21-18§ | 2,430,000 | 2,730,664 | ||||||
Atlanta, Georgia Water & Wastewater Revenue | ||||||||
Series A 6.00% 11/1/25-19§ | 2,925,000 | 3,505,934 | ||||||
Bay Area, California Toll Bridge Authority Revenue | ||||||||
(San Francisco Bay Area) Series F1 5.00% 4/1/34-18§ | 1,665,000 | 1,845,702 | ||||||
40
Table of Contents
| Principal amount° | Value (U.S. $) | |||||||
| ||||||||
Municipal Bonds (continued) | ||||||||
| ||||||||
Pre-Refunded/Escrowed to Maturity Bonds (continued) | ||||||||
Butler County, Pennsylvania Hospital Authority Revenue | ||||||||
(Butler Health System Project) 7.125% 7/1/29-19§ | 2,250,000 | $ | 2,752,223 | |||||
California State Economic Recovery | ||||||||
Series A 5.25% 7/1/21-19§ | 1,740,000 | 2,019,896 | ||||||
(Unrefunded) Series A 5.25% 7/1/21-19§ | 1,000,000 | 1,160,860 | ||||||
California Statewide Communities Development Authority Revenue | ||||||||
(California Statewide Inland Regulatory Control Project) 5.25% 12/1/27-17§ | 3,605,000 | 3,973,467 | ||||||
Fairfax County, Virginia Public Improvement Revenue | ||||||||
Series A 5.00% 4/1/20-18 (State Aid Withholding)§ | 10,000,000 | 11,075,800 | ||||||
Idaho Housing & Finance Association Grant Revenue | ||||||||
(Antic Federal Highway Transportation) Series A 5.25% 7/15/21-18 (ASSURED GTY)§ | 2,760,000 | 3,099,342 | ||||||
Maryland State & Local Facilities Loan Capital Improvement | ||||||||
First Series 5.00% 3/15/19-17§ | 3,675,000 | 3,925,157 | ||||||
Massachusetts State Clean Water Trust | ||||||||
(Water Pollution Abatement Trust) 5.00% 8/1/16 | 2,170,000 | 2,264,373 | ||||||
Missouri State Highways & Transportation Commission State Road Revenue | ||||||||
(Second Lien) 5.25% 5/1/23-17§ | 1,940,000 | 2,091,456 | ||||||
New York State Environmental Facilities Corporation Revenue | ||||||||
(Revolving Funds Pooled Financing) Series D 5.00% 9/15/23-17§ | 3,360,000 | 3,657,360 | ||||||
North Texas Tollway Authority Revenue | ||||||||
(First Tier) | ||||||||
6.00% 1/1/20-18§ | 3,440,000 | 3,853,075 | ||||||
Series E-3 5.75% 1/1/38-16●§ | 3,750,000 | 3,816,037 | ||||||
Pennsylvania Economic Development Financing Authority Health System Revenue | ||||||||
(Albert Einstein Healthcare) Series A 6.25% 10/15/23-19§ | 670,000 | 780,155 | ||||||
St. Louis Park, Minnesota Health Care Facilities Revenue | ||||||||
(Nicollet Health Services) Series C 5.50% 7/1/18 | 4,240,000 | 4,786,282 | ||||||
St. Paul, Minnesota Housing & Redevelopment Authority Hospital Revenue | ||||||||
(Healtheast Project) 6.00% 11/15/25-15§ | 1,000,000 | 1,011,400 | ||||||
Texas Transportation Commission State Highway Fund Revenue | ||||||||
(First Tier) 5.00% 4/1/18-17§ | 1,700,000 | 1,818,966 | ||||||
41
Table of Contents
Schedules of investments
Delaware Tax-Free USA Intermediate Fund
| Principal amount° | Value (U.S. $) | |||||||
| ||||||||
Municipal Bonds (continued) | ||||||||
| ||||||||
Pre-Refunded/Escrowed to Maturity Bonds (continued) | ||||||||
Virginia State | ||||||||
Series B 5.00% 6/1/23-18§ | 2,000,000 | $ | 2,226,940 | |||||
|
| |||||||
| 62,395,089 | ||||||||
|
| |||||||
Resource Recovery Revenue Bonds – 0.21% | ||||||||
Jefferson County, New York Industrial Development Agency Solid Waste Disposal Revenue | ||||||||
(Green Bond) | ||||||||
4.75% 1/1/20 (AMT) | 555,000 | 536,263 | ||||||
5.25% 1/1/24 (AMT) | 510,000 | 487,897 | ||||||
Pennsylvania Economic Development Financing Authority Resource Recovery Revenue | ||||||||
(Subordinate Colver Project) Series G 5.125% 12/1/15 (AMT) | 450,000 | 452,201 | ||||||
|
| |||||||
| 1,476,361 | ||||||||
|
| |||||||
Special Tax Revenue Bonds – 13.08% | ||||||||
Atlanta, Georgia Development Authority | ||||||||
(Senior Lien) Series A-1 5.25% 7/1/40 | 1,870,000 | 2,145,227 | ||||||
Baltimore, Maryland Convention Center Hotel Revenue Subordinated | ||||||||
Series B 5.00% 9/1/16 | 200,000 | 201,980 | ||||||
Brooklyn Arena Local Development, New York Pilot Revenue | ||||||||
(Barclays Center Project) 6.50% 7/15/30 | 5,500,000 | 6,396,940 | ||||||
Celebration Pointe, Florida Community Development District | ||||||||
4.75% 5/1/24 | 725,000 | 726,689 | ||||||
5.00% 5/1/34 | 880,000 | 882,640 | ||||||
Dallas, Texas Convention Center Hotel Development Revenue | ||||||||
Series A 5.00% 1/1/24 | 3,420,000 | 3,749,175 | ||||||
Series A 5.25% 1/1/23 | 5,375,000 | 5,935,451 | ||||||
Ernest N Morail-New Orleans, Louisiana Exhibition Hall Authority Special Tax Revenue | ||||||||
5.00% 7/15/26 | 2,330,000 | 2,659,579 | ||||||
Guam Government Limited Obligation Revenue | ||||||||
(Section 30) | ||||||||
Series A 5.375% 12/1/24 | 1,750,000 | 1,935,027 | ||||||
Series A 5.625% 12/1/29 | 1,125,000 | 1,242,900 | ||||||
Harris County-Houston, Texas Sports Authority | ||||||||
(Senior Lien) Series A 5.00% 11/15/30 | 1,805,000 | 2,037,628 | ||||||
Louisiana State Citizens Property Insurance Corporation Assessment Revenue | ||||||||
Series C-2 6.75% 6/1/26 (ASSURED GTY) | 6,350,000 | 7,277,925 | ||||||
42
Table of Contents
| Principal amount° | Value (U.S. $) | |||||||
| ||||||||
Municipal Bonds (continued) | ||||||||
| ||||||||
Special Tax Revenue Bonds (continued) | ||||||||
New Jersey State Economic Development Authority Revenue | ||||||||
5.00% 6/15/22 | 1,750,000 | $ 1,934,135 | ||||||
5.00% 6/15/23 | 1,250,000 | 1,363,087 | ||||||
(School Facilities Construction) Series AA 5.50% 12/15/29 | 4,580,000 | 4,799,336 | ||||||
New Jersey State Transportation Trust Fund Authority | ||||||||
Series B 5.50% 6/15/31 | 7,310,000 | 7,659,418 | ||||||
New York City, New York Transitional Finance Authority Future Tax Secured | ||||||||
5.00% 11/1/23 | 2,865,000 | 3,463,097 | ||||||
Subseries A-1 5.00% 11/1/20 | 2,860,000 | 3,361,987 | ||||||
Subseries C 5.00% 11/1/27 | 4,150,000 | 4,896,461 | ||||||
Subseries E-1 5.00% 2/1/26 | 4,020,000 | 4,712,566 | ||||||
New York State Local Government Assistance Corporation Subordinate Lien | ||||||||
Series A 5.00% 4/1/20 | 3,360,000 | 3,917,525 | ||||||
New York State Urban Development Corporation | ||||||||
(Service Contract) Series A-1 5.00% 1/1/18 | 5,785,000 | 6,345,509 | ||||||
Oregon State Lottery | ||||||||
Series C 5.00% 4/1/24 | 3,550,000 | 4,317,368 | ||||||
Richmond Heights, Missouri Tax Increment & Transaction Sales Tax Revenue Refunding & Improvement | ||||||||
(Francis Place Redevelopment Project) 5.625% 11/1/25 | 1,000,000 | 1,002,080 | ||||||
St. Joseph, Missouri Industrial Development Authority Tax Increment Revenue | ||||||||
(Shoppes at North Village Project) Series B 5.375% 11/1/23 @ | 880,000 | 881,021 | ||||||
Virginia Commonwealth Transportation Board | ||||||||
(Gans-Garvee) 5.00% 3/15/24 | 6,500,000 | 7,719,140 | ||||||
Wyandotte County, Kansas City, Kansas Unified Government Special Obligation Revenue | ||||||||
(Capital Appreciation - Sales Tax Subordinate Lien ) 6.07% 6/1/21 ^ | 1,305,000 | 955,090 | ||||||
|
| |||||||
| 92,518,981 | ||||||||
|
| |||||||
State General Obligation Bonds – 14.11% | ||||||||
California State | ||||||||
5.00% 2/1/20 | 4,250,000 | 4,910,365 | ||||||
(Various Purposes) | ||||||||
5.00% 10/1/18 | 5,000,000 | 5,616,250 | ||||||
5.00% 11/1/19 | 5,245,000 | 6,048,639 | ||||||
5.00% 10/1/24 | 2,935,000 | 3,579,849 | ||||||
5.25% 9/1/28 | 7,750,000 | 9,048,125 | ||||||
43
Table of Contents
Schedules of investments
Delaware Tax-Free USA Intermediate Fund
| Principal amount° | Value (U.S. $) | |||||||
| ||||||||
Municipal Bonds (continued) | ||||||||
| ||||||||
State General Obligation Bonds (continued) | ||||||||
Connecticut State | ||||||||
Series C 5.00% 11/1/24 | 2,000,000 | $ 2,233,960 | ||||||
Georgia State | ||||||||
Series A-1 5.00% 2/1/24 | 5,000,000 | 6,157,950 | ||||||
Series B 5.00% 7/1/17 | 4,810,000 | 5,200,813 | ||||||
Minnesota State | ||||||||
(Various Purpose) | ||||||||
Series A 5.00% 8/1/19 | 2,020,000 | 2,317,667 | ||||||
Series F 5.00% 10/1/22 | 8,000,000 | 9,637,680 | ||||||
Mississippi State | ||||||||
Series A 5.00% 10/1/17 | 4,860,000 | 5,298,275 | ||||||
New Jersey State | ||||||||
Series Q 5.00% 8/15/19 | 5,000,000 | 5,585,450 | ||||||
New York State | ||||||||
Series A 5.00% 2/15/28 | 5,000,000 | 5,794,400 | ||||||
Oregon State | ||||||||
Series L 5.00% 5/1/26 | 6,000,000 | 7,074,720 | ||||||
Texas State | ||||||||
(Transportation Commission Highway) 5.00% 4/1/29 | 4,300,000 | 5,045,921 | ||||||
Virginia State | ||||||||
Series D 5.00% 6/1/19 | 5,715,000 | 6,534,131 | ||||||
Washington State | ||||||||
(Motor Vehicle Fuel Tax) Series B 5.00% 7/1/16 | 4,250,000 | 4,421,573 | ||||||
(Various Purposes) | ||||||||
Series A 5.00% 7/1/16 | 1,000,000 | 1,040,370 | ||||||
Series 2015-A-1 5.00% 8/1/30 | 3,595,000 | 4,205,898 | ||||||
|
| |||||||
| 99,752,036 | ||||||||
|
| |||||||
Transportation Revenue Bonds – 14.65% | ||||||||
Broward County, Florida Airport System Revenue | ||||||||
Series O 5.375% 10/1/29 | 2,000,000 | 2,278,120 | ||||||
Central Texas Turnpike System | ||||||||
Series C 5.00% 8/15/33 | 1,750,000 | 1,929,060 | ||||||
Chicago, Illinois O’Hare International Airport Revenue General-Airport-Third Lien | ||||||||
Series C 5.25% 1/1/28 | 2,150,000 | 2,391,316 | ||||||
Dallas-Fort Worth, Texas International Airport Revenue | ||||||||
Series A 5.00% 11/1/22 | 680,000 | 717,842 | ||||||
Houston, Texas Airports Commission Revenue Series B | ||||||||
5.00% 7/1/25 | 1,000,000 | 1,143,070 | ||||||
5.00% 7/1/26 | 3,000,000 | 3,418,680 | ||||||
Louisiana State Highway Improvement Revenue | ||||||||
Series A 5.00% 6/15/29 | 5,195,000 | 6,044,590 | ||||||
44
Table of Contents
| Principal amount° | Value (U.S. $) | |||||
| ||||||
Municipal Bonds (continued) | ||||||
| ||||||
Transportation Revenue Bonds (continued) | ||||||
Maryland State Economic Development Corporation Revenue | ||||||
(Transportation Facilities Project) Series A 5.375% 6/1/25 | 2,535,000 | $ 2,750,450 | ||||
Memphis-Shelby County, Tennessee Airport Authority Revenue | ||||||
Series D 5.00% 7/1/24 | 4,110,000 | 4,682,359 | ||||
Metropolitan, New York Transportation Authority Revenue | ||||||
Series 2008C 6.50% 11/15/28 | 2,860,000 | 3,354,980 | ||||
Series A 5.00% 11/15/18 | 2,500,000 | 2,808,775 | ||||
Minneapolis - St. Paul, Minnesota Metropolitan Airports Commission | ||||||
Senior Series A 5.00% 1/1/22 (AMBAC) | 5,000,000 | 5,289,600 | ||||
New Orleans, Louisiana Aviation Board | ||||||
Series B 5.00% 1/1/32 (AMT) | 2,900,000 | 3,233,906 | ||||
Series B 5.00% 1/1/33 (AMT) | 2,900,000 | 3,224,133 | ||||
New York State Thruway Authority Revenue | ||||||
Series J 5.00% 1/1/27 | 5,705,000 | 6,671,142 | ||||
North Texas Tollway Authority Revenue | ||||||
(First Tier) 6.00% 1/1/20 | 485,000 | 537,569 | ||||
Pennsylvania Economic Development Financing Authority | ||||||
(PA Bridges Finco LP) 5.00% 12/31/34 (AMT) | 5,690,000 | 6,082,610 | ||||
Pennsylvania State Turnpike Commission Revenue | ||||||
Subordinate Series A-1 5.00% 12/1/29 | 3,590,000 | 4,079,066 | ||||
Phoenix, Arizona Civic Improvement Corporation Airport Revenue | ||||||
(Junior Lien) Series A 5.00% 7/1/26 | 7,500,000 | 8,535,300 | ||||
Port Authority of New York & New Jersey Special Project | ||||||
(JFK International Air Terminal) 6.50% 12/1/28 | 8,300,000 | 8,415,204 | ||||
Sacramento County, California Airport System Revenue | ||||||
5.00% 7/1/24 | 1,425,000 | 1,628,419 | ||||
(PFC/Grant) Series D 5.50% 7/1/28 | 2,020,000 | 2,251,128 | ||||
San Francisco, California City & County Airports Commission | ||||||
Series D 5.00% 5/1/25 | 2,000,000 | 2,335,880 | ||||
St. Louis, Missouri Airport Revenue | ||||||
(Lambert-St. Louis International) Series A-1 6.125% 7/1/24 | 3,780,000 | 4,341,632 | ||||
Texas Private Activity Bond Surface Transportation Corporate Senior Lien Revenue | ||||||
(LBJ Infrastructure) 7.50% 6/30/33 | 3,625,000 | 4,419,310 | ||||
(NTE Mobility Partners) 7.00% 12/31/38 (AMT) | 3,750,000 | 4,666,950 | ||||
45
Table of Contents
Schedules of investments
Delaware Tax-Free USA Intermediate Fund
| Principal amount° | Value (U.S. $) | |||||
| ||||||
Municipal Bonds (continued) | ||||||
| ||||||
Transportation Revenue Bonds (continued) | ||||||
Texas Private Activity Bond Surface Transportation Corporate Senior Lien Revenue | ||||||
(NTE Mobility Partners) 7.50% 12/31/31 | 3,765,000 | $ 4,504,295 | ||||
Triborough, New York Bridge & Tunnel Authority Revenue | ||||||
Series A 5.00% 11/15/17 | 1,720,000 | 1,883,658 | ||||
| ||||||
| 103,619,044 | ||||||
| ||||||
Water & Sewer Revenue Bonds – 3.57% | ||||||
Atlanta, Georgia Water & Wastewater Revenue | ||||||
Series B 5.50% 11/1/23 (AGM) | 3,000,000 | 3,422,220 | ||||
California State Department of Water Resources Center Valley Project | ||||||
Series AS 5.00% 12/1/29 | 2,695,000 | 3,228,529 | ||||
New York State Environmental Facilities Corporation Revenue | ||||||
(State Clean Water & Drinking Water Revolving Foundation) Series A 5.00% 6/15/22 | 1,405,000 | 1,567,460 | ||||
Portland, Oregon Sewer System Revenue (First Lien) | ||||||
Series A 5.00% 6/15/18 | 4,000,000 | 4,447,960 | ||||
Sacramento, California Water Revenue | ||||||
5.00% 9/1/26 | 3,160,000 | 3,715,402 | ||||
San Francisco, California City & County Public Utilities Commission Water Revenue | ||||||
Sub Series A 5.00% 11/1/27 | 7,430,000 | 8,847,421 | ||||
| ||||||
| 25,228,992 | ||||||
| ||||||
Total Municipal Bonds (cost $655,331,446) | 695,131,244 | |||||
| ||||||
| ||||||
Short-Term Investments – 0.86% | ||||||
| ||||||
Variable Rate Demand Notes – 0.86%¤ | ||||||
California Infrastructure & Economic Development Bank Revenue (Los Angeles Museum) Series A | ||||||
0.01% 9/1/37 (LOC - Wells Fargo Bank N.A.) | 3,225,000 | 3,225,000 | ||||
East Baton Rouge Parish, Louisiana Pollution Control Revenue (Exxon Project) | ||||||
0.01% 11/1/19 | 500,000 | 500,000 | ||||
Minneapolis-St. Paul, Minnesota Housing & Redevelopment Authority Health Care Revenue (Allina Health System) Series B-1 | ||||||
0.01% 11/15/35 (LOC - JPMorgan Chase Bank N.A.) | 1,350,000 | 1,350,000 | ||||
46
Table of Contents
| Principal amount° | Value (U.S. $) | |||||||
| ||||||||
Short-Term Investments (continued) | ||||||||
| ||||||||
Variable Rate Demand Notes¤ (continued) | ||||||||
Mississippi Business Finance (Chevron USA) Series G 0.01% 11/1/35 | 1,000,000 | $ | 1,000,000 | |||||
|
| |||||||
Total Short-Term Investments (cost $6,075,000) | 6,075,000 | |||||||
|
| |||||||
Total Value of Securities – 99.17% | $701,206,244 | |||||||
|
| |||||||
| # | Security exempt from registration under Rule 144A of the Securities Act of 1933, as amended. At Aug. 31, 2015, the aggregate value of Rule 144A securities was $13,871,889, which represents 1.96% of the Fund’s net assets. See Note 8 in “Notes to financial statements.” |
| @ | Illiquid security. At Aug. 31, 2015, the aggregate value of illiquid securities was $881,021, which represents 0.12% of the Fund’s net assets. See Note 8 in “Notes to financial statements.” |
| ¤ | Tax-exempt obligations that contain a floating or variable interest rate adjustment formula and an unconditional right of demand to receive payment of the unpaid principal balance plus accrued interest upon a short notice period (generally up to 30 days) prior to specified dates either from the issuer or by drawing on a bank letter of credit, a guarantee, or insurance issued with respect to such instrument. The rate shown is the rate as of Aug. 31, 2015. |
| ° | Principal amount shown is stated in U.S. dollars unless noted that the security is denominated in another currency. |
| ● | Variable rate security. The rate shown is the rate as of Aug. 31, 2015. Interest rates reset periodically. |
| ^ | Zero coupon security. The rate shown is the yield at the time of purchase. |
| § | Pre-refunded bonds. Municipal bonds that are generally backed or secured by U.S. Treasury bonds. For pre-refunded bonds, the stated maturity is followed by the year in which the bond is pre-refunded. See Note 8 in “Notes to financial statements.” |
Summary of abbreviations:
AGM – Insured by Assured Guaranty Municipal Corporation
AMBAC – Insured by AMBAC Assurance Corporation
AMT – Subject to Alternative Minimum Tax
ASSURED GTY – Insured by Assured Guaranty Corporation
LOC – Letter of Credit
N.A. – North America
NATL-RE – Insured by National Public Finance Guarantee Corporation
PSF – Guaranteed by Permanent School Fund
See accompanying notes, which are an integral part of the financial statements.
47
Table of Contents
| Schedules of investments | ||
| Delaware National High-Yield Municipal Bond Fund | August 31, 2015 |
| Principal amount° | Value (U.S. $) | |||||||
| ||||||||
Municipal Bonds – 97.94% | ||||||||
| ||||||||
Corporate Revenue Bonds – 21.70% | ||||||||
Allegheny County, Pennsylvania Industrial Development Authority Revenue | ||||||||
(Environmental Improvement - U.S. Steel Corp. Project) | ||||||||
5.75% 8/1/42 (AMT) | 6,520,000 | $ | 6,655,942 | |||||
6.875% 5/1/30 | 300,000 | 333,021 | ||||||
Buckeye, Ohio Tobacco Settlement Financing Authority | ||||||||
(Asset-Backed Senior Turbo) | ||||||||
Series A-2 5.875% 6/1/47 | 23,340,000 | 18,819,976 | ||||||
Series A-2 6.50% 6/1/47 | 8,405,000 | 7,346,894 | ||||||
Build NYC Resource, New York | ||||||||
(Pratt Paper Inc. Project) 144A 5.00% 1/1/35 (AMT)# | 2,950,000 | 3,137,531 | ||||||
California Pollution Control Financing Authority Revenue | ||||||||
(Poseidon Resources) 144A 5.00% 7/1/37 (AMT)# | 5,000,000 | 5,322,250 | ||||||
California State Enterprise Development Authority Revenue | ||||||||
(Sunpower Corp.- Recovery Zone Facility) 8.50% 4/1/31 | 1,000,000 | 1,145,260 | ||||||
Cloquet, Minnesota Pollution Control Revenue | ||||||||
(Potlatch Corp. Project) 5.90% 10/1/26 | 3,605,000 | 3,608,461 | ||||||
Columbus County, North Carolina Industrial Facilities & Pollution Control Financing | ||||||||
(International Paper Co. Project) Series A 5.70% 5/1/34 | 1,000,000 | 1,135,600 | ||||||
Gaston County, North Carolina Industrial Facilities & Pollution Control Financing Authority | ||||||||
Exempt Facilities (National Gypsum Co. Project) 5.75% 8/1/35 (AMT) | 1,510,000 | 1,512,280 | ||||||
Gloucester County, New Jersey Pollution Control Financing Authority | ||||||||
(Keystone Urban Renewal) Series A 5.00% 12/1/24 (AMT) | 1,430,000 | 1,603,216 | ||||||
Golden State, California Tobacco Securitization Corporate Settlement Revenue | ||||||||
(Asset-Backed Enhanced) Series A 5.00% 6/1/45 | 2,205,000 | 2,424,442 | ||||||
(Asset-Backed Senior Notes) | ||||||||
Series A-1 5.125% 6/1/47 | 5,000,000 | 3,920,550 | ||||||
Series A-1 5.75% 6/1/47 | 10,735,000 | 9,226,410 | ||||||
Houston, Texas Airport System Revenue | ||||||||
Series B-1 5.00% 7/15/35 (AMT) | 5,000,000 | 5,197,250 | ||||||
(Special Facilities Continental Airlines) Series A 6.625% 7/15/38 (AMT) | 2,000,000 | 2,312,980 | ||||||
(United Airlines Inc.) 5.00% 7/1/29 (AMT) | 1,150,000 | 1,216,987 | ||||||
Illinois Railsplitter Tobacco Settlement Authority | ||||||||
5.50% 6/1/23 | 2,010,000 | 2,318,515 | ||||||
6.00% 6/1/28 | 1,455,000 | 1,711,546 | ||||||
6.25% 6/1/24 | 2,635,000 | 2,749,385 | ||||||
48
Table of Contents
| Principal amount° | Value (U.S. $) | |||||||
| ||||||||
Municipal Bonds (continued) | ||||||||
| ||||||||
Corporate Revenue Bonds (continued) | ||||||||
Louisiana Local Government Environmental Facilities & Community Development Authority Revenue | ||||||||
(Westlake Chemical Corp.) Series A-1 6.50% 11/1/35 | 3,000,000 | $ | 3,572,490 | |||||
Louisiana Public Facilities Authority | ||||||||
(LA Pellets Inc. Project) | ||||||||
144A 7.75% 7/1/39 (AMT)# | 4,000,000 | 3,992,880 | ||||||
Series A 8.375% 7/1/39 (AMT) | 3,500,000 | 3,609,060 | ||||||
Maryland Economic Development Corporation Facilities Revenue | ||||||||
(CNX Marine Terminals Inc.) 5.75% 9/1/25 | 5,875,000 | 5,990,561 | ||||||
Michigan Tobacco Settlement Financing Authority Revenue Asset-Backed | ||||||||
Series A 6.00% 6/1/48 | 555,000 | 465,534 | ||||||
M-S-R Energy Authority, California Gas Revenue | ||||||||
Series A 6.50% 11/1/39 | 2,500,000 | 3,285,175 | ||||||
New Jersey Economic Development Authority Special Facility Revenue | ||||||||
(Continental Airlines Inc. Project) | ||||||||
5.25% 9/15/29 (AMT) | 4,000,000 | 4,356,520 | ||||||
Series B 5.625% 11/15/30 (AMT) | 1,270,000 | 1,425,816 | ||||||
New York City, New York Industrial Development Agency Special Facilities Revenue | ||||||||
(American Airlines - JFK International Airport) 7.75% 8/1/31 (AMT)● | 1,000,000 | 1,061,470 | ||||||
New York Liberty Development Corporation Revenue | ||||||||
(Goldman Sachs Headquarters) 5.25% 10/1/35 | 10,000,000 | 11,729,300 | ||||||
(Second Priority - Bank of America Tower) Class 3 6.375% 7/15/49 | 2,000,000 | 2,264,500 | ||||||
Nez Perce County, Idaho | ||||||||
(Potlatch Project) 6.00% 10/1/24 | 1,285,000 | 1,286,246 | ||||||
Ohio State Water Development Authority | ||||||||
(First Energy Nuclear Generation) Series B 4.00% 12/1/33 ● | 5,000,000 | 5,166,250 | ||||||
Parish of St. John the Baptist, Louisiana | ||||||||
(Marathon Oil) Series A 5.125% 6/1/37 | 3,700,000 | 3,822,063 | ||||||
Pennsylvania Economic Development Financing Authority | ||||||||
(National Gypson) 5.50% 11/1/44 (AMT) | 4,500,000 | 4,631,805 | ||||||
(PPL Energy Supply) Series A 6.40% 12/1/38 | 6,055,000 | 6,137,953 | ||||||
Pima County, Arizona Industrial Development Authority Pollution Control Revenue | ||||||||
(Tucson Electric Power) Series A 5.25% 10/1/40 | 500,000 | 549,445 | ||||||
49
Table of Contents
Schedules of investments
Delaware National High-Yield Municipal Bond Fund
| Principal amount° | Value (U.S. $) | |||||||
| ||||||||
Municipal Bonds (continued) | ||||||||
| ||||||||
Corporate Revenue Bonds (continued) | ||||||||
Port of Seattle, Washington Industrial Development Corporation Special Facilities Revenue | ||||||||
(Delta Airlines) 5.00% 4/1/30 (AMT) | 2,000,000 | $ | 2,088,400 | |||||
Salt Verde, Arizona Financial Senior Gas Revenue | ||||||||
5.00% 12/1/37 | 13,015,000 | 14,134,420 | ||||||
5.25% 12/1/27 | 2,235,000 | 2,592,756 | ||||||
5.25% 12/1/28 | 1,050,000 | 1,216,793 | ||||||
5.50% 12/1/29 | 765,000 | 908,897 | ||||||
Selma Industrial Development Board | ||||||||
(Zilkha Biomass Selma Project) 144A 7.50% 5/1/25 (AMT)# | 5,705,000 | 5,693,647 | ||||||
Shoals, Indiana | ||||||||
(National Gypsum Co. Project) 7.25% 11/1/43 (AMT) | 1,625,000 | 1,808,203 | ||||||
Sweetwater County, Wyoming Solid Waste Disposal Revenue | ||||||||
(FMC Corp. Project) 5.60% 12/1/35 (AMT) | 1,000,000 | 1,010,160 | ||||||
Texas Municipal Gas Acquisition & Supply Corp I | ||||||||
(Senior Lien) Series D 6.25% 12/15/26 | 4,460,000 | 5,341,653 | ||||||
Tobacco Settlement Financing Authority Revenue, New York | ||||||||
(Revenue Asset Backed) Series B 5.00% 6/1/21 | 3,860,000 | 3,998,613 | ||||||
Tobacco Settlement Financing Corporation, Louisiana | ||||||||
Asset-Backed Note Series A 5.25% 5/15/35 | 2,540,000 | 2,821,686 | ||||||
Tobacco Settlement Financing Corporation, New Jersey | ||||||||
Series 1A 5.00% 6/1/41 | 18,430,000 | 14,050,663 | ||||||
TSASC, New York Revenue (Asset-Backed) | ||||||||
Series 1 5.125% 6/1/42 | 485,000 | 423,143 | ||||||
Tulsa, Oklahoma Municipal Airport Trust Revenue | ||||||||
Series A 5.50% 6/1/35 (AMT) | 2,000,000 | 2,139,480 | ||||||
(American Airlines) 5.00% 6/1/35 (AMT)● | 3,000,000 | 3,258,510 | ||||||
Valparaiso, Indiana | ||||||||
(Pratt Paper LLC Project) 7.00% 1/1/44 (AMT) | 2,865,000 | 3,478,998 | ||||||
|
| |||||||
| 210,011,586 | ||||||||
|
| |||||||
Education Revenue Bonds – 16.35% | ||||||||
Arlington, Texas Higher Education Finance | ||||||||
(Arlington Classic Academy) 7.65% 8/15/40 | 1,000,000 | 1,117,480 | ||||||
Bowling Green, Ohio Student Housing Revenue CFP I | ||||||||
(State University Project) 6.00% 6/1/45 | 1,215,000 | 1,293,938 | ||||||
Buffalo & Erie County, New York Industrial Land Development Corporation Revenue | ||||||||
(Medaille College Project) 5.25% 4/1/35 | 1,615,000 | 1,616,825 | ||||||
50
Table of Contents
| Principal amount° | Value (U.S. $) | |||||||
| ||||||||
Municipal Bonds (continued) | ||||||||
| ||||||||
Education Revenue Bonds (continued) | ||||||||
Build NYC Resource, New York | ||||||||
5.00% 11/1/39 | 1,000,000 | $ | 1,020,020 | |||||
5.50% 11/1/44 | 2,500,000 | 2,630,750 | ||||||
Burbank, Illinois | ||||||||
(Intercultural Montessori Language) 144A 6.25% 9/1/45 # | 4,000,000 | 4,000,000 | ||||||
California Municipal Finance Authority Revenue | ||||||||
(California Baptist University) Series A 144A 5.50% 11/1/45 # | 4,000,000 | 4,021,320 | ||||||
(Julian Charter School Project) Series A 144A 5.625% 3/1/45 # | 7,500,000 | 7,441,275 | ||||||
(Partnership Uplift Community Project) Series A 5.25% 8/1/42 | 1,700,000 | 1,771,842 | ||||||
(Santa Rosa Academy Project) Series A 6.00% 7/1/42 | 1,250,000 | 1,307,487 | ||||||
(Southwestern Law School) 6.50% 11/1/41 | 1,500,000 | 1,783,725 | ||||||
California School Finance Authority | ||||||||
(Alliance College-Ready Public Schools) | ||||||||
144A 5.00% 7/1/35 # | 1,000,000 | 1,036,100 | ||||||
144A 5.00% 7/1/45 # | 3,000,000 | 3,072,390 | ||||||
(New Designs Charter School) Series A 5.50% 6/1/42 | 2,750,000 | 2,805,633 | ||||||
(View Park Elementary & Middle Schools) | ||||||||
5.875% 10/1/44 | 1,000,000 | 1,025,400 | ||||||
6.00% 10/1/49 | 720,000 | 741,960 | ||||||
California State University | ||||||||
(Systemwide) Series A 5.00% 11/1/17 | 4,570,000 | 5,004,881 | ||||||
California Statewide Communities Development Authority Charter School Revenue | ||||||||
(Green Dot Public Schools) Series A 7.25% 8/1/41 | 1,915,000 | 2,220,270 | ||||||
California Statewide Communities Development Authority Revenue | ||||||||
(Aspire Public Schools Project) 6.00% 7/1/40 | 995,000 | 1,054,939 | ||||||
(California Baptist University Project) | ||||||||
7.50% 11/1/41 | 1,000,000 | 1,171,050 | ||||||
Series A 5.50% 11/1/38 | 2,000,000 | 2,015,360 | ||||||
Capital Trust Agency, Florida | ||||||||
(River City Education Services Inc. Project) | ||||||||
5.375% 2/1/35 | 870,000 | 868,921 | ||||||
5.625% 2/1/45 | 1,500,000 | 1,498,845 | ||||||
Chattanooga, Tennessee Health Educational & Housing Facilities Board Revenue | ||||||||
(CDFI Phase I, LLC Project) | ||||||||
Series A 5.125% 10/1/35 | 1,000,000 | 1,000,770 | ||||||
Subordinate Series B 6.00% 10/1/35 | 1,500,000 | 1,501,710 | ||||||
51
Table of Contents
Schedules of investments
Delaware National High-Yield Municipal Bond Fund
| Principal amount° | Value (U.S. $) | |||||||
| ||||||||
Municipal Bonds (continued) | ||||||||
| ||||||||
Education Revenue Bonds (continued) | ||||||||
Clifton, Texas Higher Education Finance Corporation Revenue | ||||||||
(Idea Public Schools) 5.75% 8/15/41 | 1,000,000 | $ | 1,116,700 | |||||
(Uplift Education) Series A 6.25% 12/1/45 | 1,000,000 | 1,147,530 | ||||||
Colorado Educational & Cultural Facilities Authority Revenue | ||||||||
(Charter School - Community Leadership Academy) 7.45% 8/1/48 | 2,000,000 | 2,330,320 | ||||||
(Skyview Charter School) 144A 5.375% 7/1/44 # | 500,000 | 525,425 | ||||||
District of Columbia | ||||||||
(KIPP Charter School) 6.00% 7/1/48 | 1,450,000 | 1,648,143 | ||||||
(Provident Group - Howard Properties) 5.00% 10/1/35 | 2,500,000 | 2,459,450 | ||||||
East Hempfield Township, Pennsylvania Industrial Development Authority | ||||||||
(Student Services Income - Student Housing Project) 5.00% 7/1/30 | 1,000,000 | 1,054,690 | ||||||
Gainesville, Georgia Redevelopment Authority Educational Facilities Revenue | ||||||||
(Riverside Military Academy Project) | ||||||||
5.125% 3/1/27 | 2,800,000 | 2,791,572 | ||||||
5.125% 3/1/37 | 2,000,000 | 1,886,860 | ||||||
Hawaii State Department of Budget & Finance | ||||||||
(Hawaii University) Series A 6.875% 7/1/43 | 2,000,000 | 2,253,880 | ||||||
Henderson, Nevada Public Improvement Trust | ||||||||
(Touro College & University System) 5.50% 1/1/44 | 2,000,000 | 2,120,900 | ||||||
Idaho Housing & Finance Association | ||||||||
Series A 5.00% 6/1/50 | 1,000,000 | 977,350 | ||||||
(North Star Charter School) | ||||||||
Series A 6.75% 7/1/48 | 529,150 | 504,989 | ||||||
Series B 144A 5.00% 7/1/49 #^ | 2,888,155 | 227,644 | ||||||
Illinois Finance Authority Charter School Revenue | ||||||||
(Uno Charter School) Series A 7.125% 10/1/41 | 1,000,000 | 1,124,810 | ||||||
Illinois Finance Authority Revenue | ||||||||
(Lake Forest College) Series A 6.00% 10/1/48 | 1,000,000 | 1,088,730 | ||||||
(Rogers Park Montessori) | ||||||||
6.00% 2/1/34 | 675,000 | 699,300 | ||||||
6.125% 2/1/45 | 1,800,000 | 1,845,648 | ||||||
Illinois Finance Authority Student Housing Revenue | ||||||||
(Dekalb II - Northern Illinois University Project) 6.875% 10/1/43 | 1,000,000 | 1,156,280 | ||||||
52
Table of Contents
| Principal amount° | Value (U.S. $) | |||||||
| ||||||||
Municipal Bonds (continued) | ||||||||
| ||||||||
Education Revenue Bonds (continued) | ||||||||
Indiana State Finance Authority Revenue Educational Facilities | ||||||||
(Drexel Foundation - Thea Bowman Academy Charter School) Series A 7.00% 10/1/39 | 1,000,000 | $ | 970,530 | |||||
Kanawha, West Virginia | ||||||||
(West Virginia University Foundation Project) 6.75% 7/1/45 | 2,500,000 | 2,788,200 | ||||||
Louisiana Public Facilities Authority Revenue | ||||||||
(Lake Charles Charter Academy Foundation Project) 8.00% 12/15/41 | 1,500,000 | 1,711,440 | ||||||
(Southwest Louisiana Charter Academy Foundation Project) Series A 8.375% 12/15/43 | 2,500,000 | 2,921,275 | ||||||
Marietta, Georgia Development Authority Revenue | ||||||||
(Life University Income Project) 7.00% 6/15/39 | 2,845,000 | 2,981,873 | ||||||
Maryland State Economic Development Corporation Student Housing Revenue | ||||||||
(University of Maryland College Park Projects) 5.75% 6/1/33 | 1,130,000 | 1,224,649 | ||||||
Maryland State Health & Higher Educational Facilities Authority Revenue | ||||||||
(Patterson Park Public Charter School) Series A 6.125% 7/1/45 | 1,000,000 | 1,045,460 | ||||||
Massachusetts State Development Finance Agency Revenue | ||||||||
(Harvard University) Series B-1 5.00% 10/15/20 | 1,510,000 | 1,778,599 | ||||||
Massachusetts State Health & Educational Facilities Authority Revenue | ||||||||
(Springfield College) 5.625% 10/15/40 | 1,000,000 | 1,068,190 | ||||||
Miami-Dade County, Florida Industrial Development Authority | ||||||||
(Youth Co-Op Charter School) | ||||||||
Series A 144A 5.75% 9/15/35 # | 1,000,000 | 984,780 | ||||||
Series A 144A 6.00% 9/15/45 # | 1,000,000 | 997,210 | ||||||
Michigan Finance Authority Limited Obligation Revenue | ||||||||
(Higher Education Thomas M Cooley) 144A 6.75% 7/1/44 # | 3,500,000 | 3,700,935 | ||||||
(Public School Academy) (Old Redford) Series A 6.50% 12/1/40 | 900,000 | 921,123 | ||||||
(Public School Academy) (University Learning) 7.50% 11/1/40 | 1,000,000 | 1,084,540 | ||||||
(Public School Academy) (Voyageur) 8.00% 7/15/41 | 1,250,000 | 1,137,837 | ||||||
Michigan Public Educational Facilities Authority Revenue | ||||||||
(Limited-Obligation-Landmark Academy) 7.00% 12/1/39 | 950,000 | 999,543 | ||||||
53
Table of Contents
Schedules of investments
Delaware National High-Yield Municipal Bond Fund
| Principal amount° | Value (U.S. $) | |||||||
| ||||||||
Municipal Bonds (continued) | ||||||||
| ||||||||
Education Revenue Bonds (continued) | ||||||||
Minnesota Higher Education Facilities Authority Revenue | ||||||||
(Bethel University) Series 6-R 5.50% 5/1/37 | 1,000,000 | $ | 1,024,380 | |||||
Nevada State Department of Business & Industry | ||||||||
(Somerset Academy) | ||||||||
Series A 144A 5.00% 12/15/35 # | 1,595,000 | 1,574,855 | ||||||
Series A 144A 5.125% 12/15/45 # | 2,515,000 | 2,488,089 | ||||||
New Jersey Economic Development Authority Revenue | ||||||||
(Provident Group - Montclair) 5.875% 6/1/42 | 1,500,000 | 1,661,835 | ||||||
New Jersey State Higher Education Student Assistance Authority Student Loan Revenue | ||||||||
Series 1B 5.75% 12/1/39 (AMT) | 1,250,000 | 1,348,463 | ||||||
New York State Dormitory Authority | ||||||||
(Touro College & University System) Series A 5.50% 1/1/44 | 2,875,000 | 3,088,986 | ||||||
North Texas Education Finance Revenue | ||||||||
(Uplift Education) Series A 5.25% 12/1/47 | 2,100,000 | 2,210,607 | ||||||
Oregon State Facilities Authority Revenue | ||||||||
(Concordia University Project) | ||||||||
Series A 144A 6.125% 9/1/30 # | 900,000 | 956,358 | ||||||
Series A 144A 6.375% 9/1/40 # | 500,000 | 537,970 | ||||||
Pennsylvania State Higher Educational Facilities Authority Revenue | ||||||||
(Edinboro University Foundation) 5.80% 7/1/30 | 1,300,000 | 1,396,798 | ||||||
(Edinboro University) 6.00% 7/1/42 | 1,000,000 | 1,048,130 | ||||||
(Foundation Indiana University) Series A 0.84% 7/1/39 | ||||||||
(SGI)● | 2,400,000 | 1,888,320 | ||||||
Philadelphia, Pennsylvania Authority for Industrial Development Revenue | ||||||||
(1st Philadelphia Preparatory) 7.25% 6/15/43 | 1,230,000 | 1,388,350 | ||||||
(Discovery Charter School Project) | ||||||||
5.875% 4/1/32 | 450,000 | 473,251 | ||||||
6.25% 4/1/37 | 200,000 | 213,752 | ||||||
(Global Leadership Academy Project) 6.375% 11/15/40 | 1,000,000 | 1,067,200 | ||||||
(Green Woods Charter School) Series A 5.75% 6/15/42 | 1,600,000 | 1,650,576 | ||||||
(New Foundation Charter School Project) 6.625% 12/15/41 | 1,000,000 | 1,098,950 | ||||||
(Tacony Academy Charter School Project) 7.00% 6/15/43 | 1,540,000 | 1,731,253 | ||||||
Phoenix, Arizona Industrial Development Authority Revenue | ||||||||
(Basis School) 144A 5.00% 7/1/45 # | 2,000,000 | 1,987,580 | ||||||
54
Table of Contents
| Principal amount° | Value (U.S. $) | |||||||
| ||||||||
Municipal Bonds (continued) | ||||||||
| ||||||||
Education Revenue Bonds (continued) | ||||||||
Phoenix, Arizona Industrial Development Authority Revenue | ||||||||
(Choice Academies Project) | ||||||||
5.375% 9/1/32 | 1,000,000 | $ | 1,039,570 | |||||
5.625% 9/1/42 | 600,000 | 629,502 | ||||||
(Eagle College Preparatory Project) Series A 5.00% 7/1/43 | 450,000 | 432,333 | ||||||
(Legacy Traditional Schools Project) Series A 144A 6.75% 7/1/44 # | 1,500,000 | 1,678,080 | ||||||
(Rowan University Project) 5.00% 6/1/42 | 2,000,000 | 2,136,680 | ||||||
Pima County, Arizona Industrial Development Authority Revenue | ||||||||
(Edkey Charter Schools Project) 6.00% 7/1/43 | 2,000,000 | 1,939,260 | ||||||
Private Colleges & Universities Authority, Georgia Revenue | ||||||||
(Mercer University) Series A 5.00% 10/1/32 | 1,005,000 | 1,092,666 | ||||||
Provo, Utah Charter School Revenue | ||||||||
(Freedom Academy Foundation Project) 5.50% 6/15/37 | 805,000 | 810,780 | ||||||
San Juan, Texas Higher Education Finance Authority Education Revenue | ||||||||
(Idea Public Schools) Series A 6.70% 8/15/40 | 2,000,000 | 2,330,840 | ||||||
St. Paul Housing & Redevelopment Authority Charter School Lease Revenue | ||||||||
(Academia Cesar Chavez School Project) Series A 5.25% 7/1/50 | 2,560,000 | 2,389,862 | ||||||
Utah State Charter School Finance Authority Revenue | ||||||||
(North Davis Preparatory) 6.375% 7/15/40 | 1,290,000 | 1,394,980 | ||||||
Wisconsin Public Finance Authority Revenue | ||||||||
(Pine Lake Preparatory) 144A 5.50% 3/1/45 # | 3,460,000 | 3,465,086 | ||||||
(Roseman University Health Sciences Project) 5.75% 4/1/42 | 2,000,000 | 1,997,720 | ||||||
Wyoming Community Development Authority Student Housing Revenue | ||||||||
(CHF-Wyoming LLC) 6.50% 7/1/43 | 1,000,000 | 1,131,770 | ||||||
Yonkers, New York Economic Development Corporation Education Revenue | ||||||||
(Charter School Educational Excellence) 6.25% 10/15/40 | 595,000 | 629,302 | ||||||
|
| |||||||
| 158,233,430 | ||||||||
|
| |||||||
Electric Revenue Bonds – 0.42% | ||||||||
California State Department of Water Resources | ||||||||
Series L 5.00% 5/1/17 | 1,045,000 | 1,123,615 | ||||||
Long Island, New York Power Authority | ||||||||
Series A 5.00% 9/1/44 | 1,960,000 | 2,156,686 | ||||||
55
Table of Contents
Schedules of investments
Delaware National High-Yield Municipal Bond Fund
| Principal amount° | Value (U.S. $) | |||||||
| ||||||||
Municipal Bonds (continued) | ||||||||
| ||||||||
Electric Revenue Bonds (continued) | ||||||||
Southern Minnesota Municipal Power Agency | ||||||||
Series A 5.25% 1/1/17 (AMBAC) | 750,000 | $ | 796,860 | |||||
|
| |||||||
| 4,077,161 | ||||||||
|
| |||||||
Healthcare Revenue Bonds – 23.04% | ||||||||
Abag, California Finance Authority for Nonprofit Corporations | ||||||||
(Episcopal Senior Communities) 6.125% 7/1/41 | 1,650,000 | 1,865,045 | ||||||
Alachua County, Florida Health Facilities Authority | ||||||||
(Oak Hammock University) | ||||||||
Series A 8.00% 10/1/42 | 1,000,000 | 1,238,620 | ||||||
Series A 8.00% 10/1/46 | 1,500,000 | 1,854,615 | ||||||
Apple Valley, Minnesota Economic Development Authority Health Care Revenue | ||||||||
(Augustana Home St. Paul Project) Series A 6.00% 1/1/40 | 1,000,000 | 1,003,280 | ||||||
Arizona Health Facilities Authority | ||||||||
(Phoenix Children’s Hospital) 5.00% 2/1/19 | 2,545,000 | 2,836,326 | ||||||
(Scottsdale Lincoln Hospital Project) 5.00% 12/1/42 | 940,000 | 1,023,021 | ||||||
Bexar County, Texas Health Facilities Development Corporation Revenue | ||||||||
(Army Retirement Residence Project) 5.875% 7/1/30 | 1,000,000 | 1,106,820 | ||||||
California Municipal Finance Authority Revenue | ||||||||
(Eisenhower Medical Center) Series A 5.75% 7/1/40 | 1,000,000 | 1,092,460 | ||||||
California Statewide Communities Development Authority Revenue | ||||||||
(BE Group) 144A 7.25% 11/15/41 # | 500,000 | 582,375 | ||||||
(Loma Linda University Medical Center) 5.50% 12/1/54 | 8,000,000 | 8,453,520 | ||||||
Camden County, New Jersey Improvement Authority Revenue | ||||||||
(Cooper Health System Obligation Group) 5.75% 2/15/42 | 2,500,000 | 2,818,200 | ||||||
Capital Trust Agency, Florida | ||||||||
(Faulk Senior Services) | ||||||||
6.00% 12/1/24 | 455,000 | 412,785 | ||||||
6.50% 12/1/34 | 500,000 | 454,890 | ||||||
6.75% 12/1/44 | 1,000,000 | 910,900 | ||||||
6.75% 12/1/49 | 1,500,000 | 1,366,920 | ||||||
(Tuscan Gardens Senior Living Center) Series A 7.00% 4/1/49 | 5,000,000 | 4,963,100 | ||||||
Chesterfield County, Virginia Economic Development Authority Revenue | ||||||||
(1st Mortgage - Brandermill Woods Project) 5.125% 1/1/43 | 1,030,000 | 1,055,235 | ||||||
56
Table of Contents
| Principal amount° | Value (U.S. $) | |||||||
| ||||||||
Municipal Bonds (continued) | ||||||||
| ||||||||
Healthcare Revenue Bonds (continued) | ||||||||
Colorado Health Facilities Authority Revenue | ||||||||
(American Baptist) 8.00% 8/1/43 | 2,500,000 | $ | 2,947,800 | |||||
(Christian Living Community Project) Series A 5.75% 1/1/37 | 1,990,000 | 2,018,994 | ||||||
(Mental Health Center Denver Project) Series A 5.75% 2/1/44 | 500,000 | 558,395 | ||||||
(School Health Systems) Series A 5.00% 1/1/44 | 1,000,000 | 1,106,040 | ||||||
Cumberland County, Pennsylvania Municipal Authority Revenue | ||||||||
(Asbury Pennsylvania Obligation Group) 5.25% 1/1/41 | 1,600,000 | 1,659,584 | ||||||
(Diakon Lutheran Ministries Series) 6.375% 1/1/39 | 100,000 | 114,769 | ||||||
Decatur, Texas Hospital Authority | ||||||||
(Wise Regional Health Systems) | ||||||||
Series A 5.00% 9/1/34 | 1,000,000 | 1,053,310 | ||||||
Series A 5.25% 9/1/29 | 500,000 | 542,130 | ||||||
Series A 5.25% 9/1/44 | 2,000,000 | 2,096,720 | ||||||
Duluth, Minnesota Economic Development Authority Revenue | ||||||||
(St. Luke’s Hospital Authority Obligation Group) 5.75% 6/15/32 | 3,750,000 | 4,130,700 | ||||||
East Rochester, New York Housing Authority Revenue | ||||||||
(Senior Living - Woodland Village Project) 5.50% 8/1/33 | 1,200,000 | 1,217,016 | ||||||
Florida Development Finance | ||||||||
(Tuscan Isle Obligated Group) Series A 144A 7.00% 6/1/45 # | 2,000,000 | 2,040,720 | ||||||
(UF Health - Jacksonville Project) Series A 6.00% 2/1/33 | 2,375,000 | 2,656,390 | ||||||
Hanover County, Virginia Economic Development Authority Residential Care Revenue | ||||||||
(Covenant Woods) Series A 5.00% 7/1/42 | 1,735,000 | 1,779,277 | ||||||
Hawaii Pacific Health Special Purpose Revenue | ||||||||
Series A 5.50% 7/1/40 | 1,250,000 | 1,390,763 | ||||||
Hawaii State Department of Budget & Finance Special Purpose Senior Living Revenue | ||||||||
(15 Craigside Project) Series A 9.00% 11/15/44 | 1,000,000 | 1,254,840 | ||||||
(Hawaii Pacific Health Obligation) Series A 5.50% 7/1/43 | 2,990,000 | 3,428,454 | ||||||
(Kahala Nui) 5.25% 11/15/37 | 1,000,000 | 1,077,200 | ||||||
Hospital Facilities Authority of Multnomah County, Oregon | ||||||||
(Mirabella at South Waterfront) 5.50% 10/1/49 | 2,400,000 | 2,617,032 | ||||||
Illinois Finance Authority Revenue | ||||||||
(Admiral at Lake Project) | ||||||||
Series A 7.625% 5/15/25 | 1,750,000 | 1,966,020 | ||||||
57
Table of Contents
Schedules of investments
Delaware National High-Yield Municipal Bond Fund
| Principal amount° | Value (U.S. $) | |||||||
| ||||||||
Municipal Bonds (continued) | ||||||||
| ||||||||
Healthcare Revenue Bonds (continued) | ||||||||
Illinois Finance Authority Revenue | ||||||||
(Admiral at Lake Project) | ||||||||
Series A 7.75% 5/15/30 | 500,000 | $ | 565,685 | |||||
Series A 8.00% 5/15/40 | 2,205,000 | 2,507,747 | ||||||
Series A 8.00% 5/15/46 | 1,500,000 | 1,703,865 | ||||||
(Lutheran Home & Services) 5.75% 5/15/46 | 1,685,000 | 1,780,068 | ||||||
(Provena Health) Series A 7.75% 8/15/34 | 1,000,000 | 1,214,220 | ||||||
Indiana Finance Authority Revenue | ||||||||
(King’s Daughters Hospital & Health) | ||||||||
5.50% 8/15/40 | 1,000,000 | 1,079,160 | ||||||
5.50% 8/15/45 | 1,000,000 | 1,077,280 | ||||||
(Marquette Project) 5.00% 3/1/39 | 1,250,000 | 1,295,213 | ||||||
Iowa Finance Authority | ||||||||
(Sunrise Retirement Community) 5.75% 9/1/43 | 2,500,000 | 2,559,950 | ||||||
Kentucky Economic Development Finance Authority Hospital Revenue | ||||||||
(Owensboro Medical Health System) | ||||||||
Series A 5.00% 6/1/17 | 2,525,000 | 2,697,836 | ||||||
Series A 6.50% 3/1/45 | 4,965,000 | 5,677,875 | ||||||
Kentwood, Michigan Economic Development Corporation Revenue | ||||||||
(Limited Obligation - Holland Home) 5.625% 11/15/41 | 1,250,000 | 1,316,300 | ||||||
Koyukuk, Alaska Revenue | ||||||||
(Tanana Chiefs Conference Health Care Facility Project) 7.75% 10/1/41 | 1,750,000 | 2,011,013 | ||||||
Lake County, Florida Individual Development Revenue | ||||||||
(Cranes View Lodge Project) Series A 7.125% 11/1/42 | 3,000,000 | 2,704,290 | ||||||
Lakeland, Florida | ||||||||
(Lakeland Regional Health) 5.00% 11/15/45 | 5,000,000 | 5,363,650 | ||||||
Lancaster County, Pennsylvania Hospital Authority Revenue | ||||||||
(Brethren Village Project) Series A 6.375% 7/1/30 | 725,000 | 753,014 | ||||||
Louisiana Public Facilities Authority Revenue | ||||||||
(Ochsner Clinic Foundation Project) 6.50% 5/15/37 | 1,705,000 | 1,980,272 | ||||||
Lucas County, Ohio Health Care Facilities Revenue | ||||||||
(Sunset Retirement Communities) 5.50% 8/15/30 | 1,000,000 | 1,082,900 | ||||||
Lucas County, Ohio Improvement | ||||||||
(Lutheran Homes) Series A 7.00% 11/1/45 | 3,865,000 | 4,245,973 | ||||||
Maine Health & Higher Educational Facilities Authority Revenue | ||||||||
(Maine General Medical Center) 6.75% 7/1/41 | 1,700,000 | 1,928,684 | ||||||
Martin County, Florida Health Facilities Authority Revenue | ||||||||
(Martin Memorial Medical Center) 5.50% 11/15/42 | 1,000,000 | 1,095,160 | ||||||
58
Table of Contents
| Principal amount° | Value (U.S. $) | |||||||
| ||||||||
Municipal Bonds (continued) | ||||||||
| ||||||||
Healthcare Revenue Bonds (continued) | ||||||||
Maryland State Health & Higher Educational Facilities Authority Revenue | ||||||||
(Doctors Community Hospital) 5.75% 7/1/38 | 1,730,000 | $ | 1,828,644 | |||||
Michigan State Strategic Fund Limited Revenue | ||||||||
(Evangelical Homes) 5.50% 6/1/47 | 2,750,000 | 2,867,865 | ||||||
Missouri State Health & Educational Facilities Authority Revenue | ||||||||
(Lutheran Senior Services) 6.00% 2/1/41 | 1,000,000 | 1,094,210 | ||||||
Montgomery County, Pennsylvania Industrial Development Authority Revenue | ||||||||
(Whitemarsh Continuing Care) | ||||||||
5.25% 1/1/40 | 1,550,000 | 1,532,051 | ||||||
5.375% 1/1/50 | 6,250,000 | 6,237,313 | ||||||
Moon, Pennsylvania Industrial Development Authority | ||||||||
(Baptist Homes Society Obligation) 6.125% 7/1/50 | 8,500,000 | 8,519,040 | ||||||
New Hampshire Health & Education Facilities Authority | ||||||||
(Rivermeade) Series A 6.875% 7/1/41 | 1,380,000 | 1,558,282 | ||||||
New Jersey Economic Development Authority | ||||||||
(Lions Gate Project) 5.25% 1/1/44 | 2,000,000 | 2,043,840 | ||||||
New Jersey Health Care Facilities Financing Authority Revenue | ||||||||
(Barnabas Health Services) Series A 4.00% 7/1/26 | 980,000 | 1,028,676 | ||||||
(St. Joseph’s Healthcare System) 6.625% 7/1/38 | 860,000 | 957,911 | ||||||
(St. Peters University Hospital) 6.25% 7/1/35 | 2,700,000 | 2,909,736 | ||||||
(Trinitas Hospital Obligation Group) Series A 5.25% 7/1/30 | 1,240,000 | 1,298,181 | ||||||
New York State Dormitory Authority | ||||||||
(Orange Regional Medical Center) | ||||||||
144A 5.00% 12/1/40 # | 1,100,000 | 1,147,366 | ||||||
144A 5.00% 12/1/45 # | 800,000 | 828,680 | ||||||
New York State Dormitory Authority Revenue Non State Supported Debt | ||||||||
(Orange Regional Medical Center) 6.25% 12/1/37 | 5,000,000 | 5,474,150 | ||||||
North Carolina Medical Care Commission Health Care Facilities Revenue | ||||||||
(First Mortgage - Galloway Ridge Project) 6.00% 1/1/39 | 1,520,000 | 1,626,643 | ||||||
(First Mortgage - Presbyterian Homes) 5.60% 10/1/36 | 1,000,000 | 1,021,090 | ||||||
Northampton County, Pennsylvania Industrial Development Authority Revenue | ||||||||
(Morningstar Senior Living) 5.00% 7/1/36 | 2,000,000 | 2,055,780 | ||||||
Onondaga, New York Civic Development Revenue | ||||||||
(St. Joseph’s Hospital Health Center Project) | ||||||||
4.50% 7/1/32 | 1,000,000 | 1,008,730 | ||||||
59
Table of Contents
Schedules of investments
Delaware National High-Yield Municipal Bond Fund
| Principal amount° | Value (U.S. $) | |||||||
| ||||||||
Municipal Bonds (continued) | ||||||||
| ||||||||
Healthcare Revenue Bonds (continued) | ||||||||
Onondaga, New York Civic Development Revenue | ||||||||
(St. Joseph’s Hospital Health Center Project) | ||||||||
5.00% 7/1/16 | 1,000,000 | $ | 1,023,550 | |||||
5.00% 7/1/17 | 1,945,000 | 2,032,253 | ||||||
5.125% 7/1/31 | 1,000,000 | 1,048,980 | ||||||
Orange County, New York Funding Corporation Assisted Living Residence Revenue | ||||||||
6.50% 1/1/46 | 4,000,000 | 3,983,760 | ||||||
Palm Beach County, Florida Health Facilities Authority | ||||||||
(Sinai Residences Boca Raton Project) | ||||||||
7.25% 6/1/34 | 285,000 | 326,117 | ||||||
Series A 7.50% 6/1/49 | 2,920,000 | 3,382,703 | ||||||
Puerto Rico Industrial Tourist Educational Medical & Environmental Control Facilities Financing Authority | ||||||||
(Auxilio Mutuo) Series A 6.00% 7/1/33 | 655,000 | 646,826 | ||||||
Rochester, Minnesota | ||||||||
(The Homestead at Rochester) Series A 6.875% 12/1/48 | 2,500,000 | 2,806,325 | ||||||
Salem, Oregon Hospital Facility Authority Revenue | ||||||||
(Capital Manor Inc.) 6.00% 5/15/47 | 1,500,000 | 1,646,160 | ||||||
San Buenaventura, California Revenue | ||||||||
7.50% 12/1/41 | 4,475,000 | 5,445,046 | ||||||
South Carolina Jobs - Economic Development Authority Hospital Revenue | ||||||||
(Palmetto Health) 5.75% 8/1/39 | 915,000 | 988,841 | ||||||
Southeastern Ohio Port Authority | ||||||||
(Memorial Health Systems) | ||||||||
5.00% 12/1/43 | 805,000 | 812,060 | ||||||
5.50% 12/1/43 | 1,250,000 | 1,309,887 | ||||||
Southwestern Illinois Development Authority Revenue | ||||||||
(Memorial Group) | ||||||||
7.125% 11/1/30 | 1,420,000 | 1,746,486 | ||||||
7.125% 11/1/43 | 2,500,000 | 3,035,650 | ||||||
St. Johns County, Florida Industrial Development Authority Revenue | ||||||||
(Presbyterian Retirement) Series A 5.875% 8/1/40 | 1,000,000 | 1,105,680 | ||||||
Suffolk County, New York Economic Development Corporation Revenue | ||||||||
(Peconic Landing Southland) 6.00% 12/1/40 | 575,000 | 627,083 | ||||||
Tarrant County, Texas Cultural Education Facilities Finance | ||||||||
(Buckingham Senior Living Community) 5.50% 11/15/45 | 3,000,000 | 3,018,360 | ||||||
Tempe, Arizona Industrial Development Authority Revenue | ||||||||
(Friendship Village) Series A 6.25% 12/1/46 | 500,000 | 540,600 | ||||||
60
Table of Contents
| Principal amount° | Value (U.S. $) | |||||||
| ||||||||
Municipal Bonds (continued) | ||||||||
| ||||||||
Healthcare Revenue Bonds (continued) | ||||||||
Travis County, Texas Health Facilities Development Corporation Revenue | ||||||||
(Westminster Manor Project) 7.125% 11/1/40 | 1,000,000 | $ | 1,150,330 | |||||
Vermont Economic Development Authority Revenue | ||||||||
(Wake Robin Corp. Project) 5.40% 5/1/33 | 1,100,000 | 1,150,215 | ||||||
Washington State Housing Finance Commission | ||||||||
(Heron’s Key) | ||||||||
Series A 144A 6.75% 7/1/35 # | 820,000 | 844,830 | ||||||
Series A 144A 7.00% 7/1/45 # | 1,750,000 | 1,802,377 | ||||||
Series A 144A 7.00% 7/1/50 # | 2,000,000 | 2,030,940 | ||||||
Wayzata, Minnesota Senior Housing Revenue | ||||||||
(Folkestone Senior Living Community) | ||||||||
Series A 5.50% 11/1/32 | 270,000 | 292,391 | ||||||
Series A 5.75% 11/1/39 | 600,000 | 646,356 | ||||||
Series A 6.00% 5/1/47 | 920,000 | 997,262 | ||||||
West Virginia Hospital Finance Authority Revenue | ||||||||
(Highland Hospital Obligation Group) 9.125% 10/1/41 | 7,900,000 | 8,775,241 | ||||||
Westminster, Maryland | ||||||||
(Lutheran Village Millers Grant) | ||||||||
6.00% 7/1/34 | 800,000 | 851,800 | ||||||
Series A 5.00% 7/1/24 | 1,700,000 | 1,757,528 | ||||||
Series A 6.125% 7/1/39 | 750,000 | 799,943 | ||||||
Series A 6.25% 7/1/44 | 2,500,000 | 2,680,150 | ||||||
Wichita, Kansas | ||||||||
(Presbyterian Manors) | ||||||||
Series IV-A 5.625% 5/15/44 | 1,645,000 | 1,687,490 | ||||||
Series IV-A 5.625% 5/15/49 | 1,450,000 | 1,486,540 | ||||||
Wisconsin Public Finance Authority | ||||||||
(Rose Villa Project) Series A 5.75% 11/15/44 | 2,000,000 | 2,117,740 | ||||||
|
| |||||||
| 222,970,109 | ||||||||
|
| |||||||
Housing Revenue Bonds – 1.20% | ||||||||
California Municipal Finance Authority Mobile Home Park Revenue | ||||||||
(Caritas Affordable Housing) Senior Series A 5.25% 8/15/39 | 1,200,000 | 1,303,476 | ||||||
(Caritas Projects) | ||||||||
Senior Series A 5.50% 8/15/47 | 1,500,000 | 1,649,325 | ||||||
Senior Series A 6.40% 8/15/45 | 1,780,000 | 1,956,861 | ||||||
Independent Cities Finance Authority, California | ||||||||
Series A 5.25% 5/15/44 | 750,000 | 809,715 | ||||||
Series A 5.25% 5/15/49 | 3,000,000 | 3,214,530 | ||||||
61
Table of Contents
Schedules of investments
Delaware National High-Yield Municipal Bond Fund
| Principal amount° | Value (U.S. $) | |||||||
| ||||||||
Municipal Bonds (continued) | ||||||||
| ||||||||
Housing Revenue Bonds (continued) | ||||||||
Williston, North Dakota | ||||||||
(Eagle Crest Apartments LLC Project) 7.75% 9/1/38 | 2,515,000 | $ | 2,629,055 | |||||
|
| |||||||
| 11,562,962 | ||||||||
|
| |||||||
Lease Revenue Bonds – 5.70% | ||||||||
California Municipal Finance Authority Revenue | ||||||||
(Goodwill Industry Sacramento Valley) 5.25% 1/1/45 | 1,295,000 | 1,292,785 | ||||||
(Goodwill Industry Sacramento Valley and Northern Nevada Project) | ||||||||
Series A 6.625% 1/1/32 | 500,000 | 539,940 | ||||||
Series A 6.875% 1/1/42 | 1,500,000 | 1,631,430 | ||||||
California Statewide Communities Development Authority Revenue | ||||||||
(Lancer Plaza Project) 5.875% 11/1/43 | 1,875,000 | 1,901,513 | ||||||
Capital Trust Agency, Florida Revenue | ||||||||
(Air Cargo - Aero Miami) Series A 5.35% 7/1/29 | 885,000 | 968,916 | ||||||
District of Columbia Revenue | ||||||||
(Center of Strategic & International Studies) 6.625% 3/1/41 | 2,235,000 | 2,445,939 | ||||||
Industrial Development Authority of Phoenix, Arizona | ||||||||
5.125% 2/1/34 | 1,000,000 | 983,570 | ||||||
5.375% 2/1/41 | 4,000,000 | 3,988,800 | ||||||
New Jersey Economic Development Authority Special Facility Revenue | ||||||||
Series WW 5.25% 6/15/30 | 5,000,000 | 5,185,600 | ||||||
New York Liberty Development Revenue | ||||||||
(Class 1-3 World Trade Center Project) 144A 5.00% 11/15/44 # | 5,000,000 | 5,025,300 | ||||||
(Class 2-3 World Trade Center Project) 144A 5.375% 11/15/40 # | 2,410,000 | 2,542,237 | ||||||
(Class 3-3 World Trade Center Project) 144A 7.25% 11/15/44 # | 9,600,000 | 11,399,520 | ||||||
Public Finance Authority, Wisconsin Airport Facilities Revenue | ||||||||
(AFCO Investors II Portfolio) 5.75% 10/1/31 (AMT) | 3,775,000 | 3,802,067 | ||||||
(Senior Obligation Group) 5.00% 7/1/42 (AMT) | 4,000,000 | 4,126,960 | ||||||
Virginia Public Building Authority | ||||||||
Series B 5.00% 8/1/20 | 6,970,000 | 8,136,987 | ||||||
Wise County, Texas | ||||||||
(Parker County Junior College District) 8.00% 8/15/34 | 1,000,000 | 1,201,990 | ||||||
|
| |||||||
| 55,173,554 | ||||||||
|
| |||||||
Local General Obligation Bonds – 3.63% | ||||||||
Arlington County, Virginia | ||||||||
Series D 5.00% 8/1/17 | 1,375,000 | 1,491,215 | ||||||
62
Table of Contents
| Principal amount° | Value (U.S. $) | |||||||
| ||||||||
Municipal Bonds (continued) | ||||||||
| ||||||||
Local General Obligation Bonds (continued) | ||||||||
Chicago, Illinois | ||||||||
Series 2005D 5.50% 1/1/40 | 3,000,000 | $ | 2,741,190 | |||||
Series 2007E 5.50% 1/1/42 | 2,150,000 | 1,955,683 | ||||||
Series 2007F 5.50% 1/1/42 | 1,250,000 | 1,137,025 | ||||||
Series A 5.50% 1/1/33 | 2,000,000 | 1,876,580 | ||||||
Series A 5.50% 1/1/34 | 2,500,000 | 2,327,775 | ||||||
Hennepin County, Minnesota | ||||||||
Series B 5.00% 12/1/17 | 5,700,000 | 6,252,843 | ||||||
New York City, New York | ||||||||
Series E 5.00% 8/1/20 | 3,615,000 | 4,202,871 | ||||||
Series J 5.00% 8/1/17 | 3,625,000 | 3,930,153 | ||||||
Plano, Texas Independent School District | ||||||||
(School Building) Series A 5.00% 2/15/17 | 560,000 | 596,378 | ||||||
Prince George’s County, Maryland | ||||||||
(Consolidated Public Improvement) | ||||||||
Series B 5.00% 9/15/20 | 3,190,000 | 3,751,185 | ||||||
Series C 5.00% 8/1/17 | 1,775,000 | 1,925,023 | ||||||
Ramsey County, Minnesota Capital Improvement Plan | ||||||||
Series A 5.00% 2/1/20 | 2,530,000 | 2,936,875 | ||||||
|
| |||||||
| 35,124,796 | ||||||||
|
| |||||||
Pre-Refunded Bonds – 4.70% | ||||||||
Brevard County, Florida Health Facilities Authority Revenue | ||||||||
(Health First Inc. Project) 7.00% 4/1/39-19§ | 3,500,000 | 4,225,655 | ||||||
Butler County, Pennsylvania Hospital Authority Revenue | ||||||||
(Butler Health System Project) 7.125% 7/1/29-19§ | 900,000 | 1,100,889 | ||||||
California Municipal Finance Authority Revenue | ||||||||
(Azusa Pacific University Project) Series B 7.75% 4/1/31-21§ | 1,000,000 | 1,282,250 | ||||||
California Statewide Communities Development Authority Revenue | ||||||||
(Inland Regional Center Project) 5.375% 12/1/37-17§ | 6,220,000 | 6,873,038 | ||||||
Commonwealth of Massachusetts | ||||||||
Series E 5.00% 11/1/23-16 (AMBAC)§ | 7,390,000 | 7,791,277 | ||||||
Cumberland County, Pennsylvania Municipal Authority Revenue | ||||||||
(Diakon Lutheran Ministries Project) | ||||||||
5.00% 1/1/36-17§ | 1,000,000 | 1,057,030 | ||||||
6.375% 1/1/39-19§ | 900,000 | 1,055,754 | ||||||
Illinois Finance Authority Revenue | ||||||||
(Silver Cross & Medical Centers) 7.00% 8/15/44-19§ | 3,570,000 | 4,382,353 | ||||||
63
Table of Contents
Schedules of investments
Delaware National High-Yield Municipal Bond Fund
| Principal amount° | Value (U.S. $) | |||||||
| ||||||||
Municipal Bonds (continued) | ||||||||
| ||||||||
Pre-Refunded Bonds (continued) | ||||||||
Lancaster Redevelopment Agency, California | ||||||||
(Redevelopment Project) 6.875% 8/1/39-19§ | 285,000 | $ | 348,430 | |||||
Maryland State & Local Facilities Loan Capital Improvement | ||||||||
Second Series 5.00% 8/1/17-16§ | 1,070,000 | 1,116,299 | ||||||
New Jersey State Educational Facilities Authority Revenue | ||||||||
(University of Medicine & Dentistry) Series B 7.50% 12/1/32-19§ | 1,000,000 | 1,232,730 | ||||||
North Texas Tollway Authority Revenue | ||||||||
(Toll 2nd Tier) Series F 5.75% 1/1/38-18§ | 7,000,000 | 7,800,170 | ||||||
Pennsylvania Economic Development Financing Authority Health System Revenue | ||||||||
(Albert Einstein Healthcare) Series A 6.25% 10/15/23-19§ | 1,100,000 | 1,280,851 | ||||||
St. Louis Park, Minnesota Health Care Facilities Revenue | ||||||||
(Nicollet Health Services) 5.75% 7/1/39-19§ | 500,000 | 586,105 | ||||||
St. Paul, Minnesota Housing & Redevelopment Authority Hospital Revenue | ||||||||
(Healtheast Project) 6.00% 11/15/30-15§ | 2,000,000 | 2,022,800 | ||||||
University of Arizona Medical Center Hospital Revenue | ||||||||
6.00% 7/1/39-21§ | 1,500,000 | 1,858,650 | ||||||
Washington State Health Care Facilities Authority Revenue | ||||||||
(Multicare Health System) Series B 6.00% 8/15/39-19 (ASSURED GTY)§ | 1,250,000 | 1,482,450 | ||||||
|
| |||||||
| 45,496,731 | ||||||||
|
| |||||||
Resource Recovery Revenue Bonds – 0.84% | ||||||||
Essex County, New Jersey Improvement Authority | ||||||||
144A 5.25% 7/1/45 (AMT)# | 2,500,000 | 2,509,850 | ||||||
Jefferson County Industrial Development Agency | ||||||||
(Green Bond) | ||||||||
4.75% 1/1/20 (AMT) | 545,000 | 526,601 | ||||||
5.25% 1/1/24 (AMT) | 500,000 | 478,330 | ||||||
Mission Economic Development Corporation, Texas Revenue | ||||||||
(Dallas Clean Energy McCommas) 6.875% 12/1/24 (AMT) | 1,000,000 | 1,043,460 | ||||||
Orange County, Florida Industrial Development Authority | ||||||||
(Vitag Florida LLC Project) 144A 8.00% 7/1/36 (AMT)# | 3,500,000 | 3,531,535 | ||||||
|
| |||||||
| 8,089,776 | ||||||||
|
| |||||||
Special Tax Revenue Bonds – 7.88% | ||||||||
Allentown, Pennsylvania Neighborhood Improvement Zone Development Authority Revenue | ||||||||
Series A 5.00% 5/1/42 | 1,475,000 | 1,533,779 | ||||||
64
Table of Contents
| Principal amount° | Value (U.S. $) | |||||||
| ||||||||
Municipal Bonds (continued) | ||||||||
| ||||||||
Special Tax Revenue Bonds (continued) | ||||||||
Anne Arundel County, Maryland Special Obligation Revenue | ||||||||
(National Business Park - North Project) 6.10% 7/1/40 | 1,725,000 | $ | 1,828,000 | |||||
Baltimore, Maryland Convention Center Hotel Revenue Subordinated | ||||||||
Series B 5.875% 9/1/39 | 1,000,000 | 1,024,330 | ||||||
Brooklyn Arena Local Development, New York Pilot Revenue | ||||||||
(Barclays Center Project) | ||||||||
6.25% 7/15/40 | 5,500,000 | 6,315,815 | ||||||
6.50% 7/15/30 | 1,175,000 | 1,366,619 | ||||||
Celebration Pointe, Florida Community Development District | ||||||||
5.125% 5/1/45 | 2,000,000 | 2,009,300 | ||||||
Cherry Hill, Virginia Community Development Authority | ||||||||
(Potomac Shores Project) | ||||||||
144A 5.15% 3/1/35 # | 1,000,000 | 1,017,860 | ||||||
144A 5.40% 3/1/45 # | 2,000,000 | 2,035,460 | ||||||
Dutchess County, New York Local Development Corporation Revenue | ||||||||
(Anderson Center Services Inc. Project) 6.00% 10/1/30 | 2,000,000 | 2,080,520 | ||||||
Farms New Kent, Virginia Community Development Authority Special Assessment | ||||||||
Series C 5.80% 3/1/36 @‡ | 1,000,000 | 250,080 | ||||||
Fountain Urban Renewal Authority, Colorado | ||||||||
(Improvement - South Academy Highland) Series A 5.50% 11/1/44 | 5,000,000 | 4,965,800 | ||||||
Henderson, Nevada Local Improvement Districts No. T-18 | ||||||||
5.30% 9/1/35 | 465,000 | 352,665 | ||||||
Howard County, Maryland | ||||||||
(Annapolis Junction Town Center Project) | ||||||||
5.80% 2/15/34 | 725,000 | 768,921 | ||||||
6.10% 2/15/44 | 1,420,000 | 1,514,970 | ||||||
Juban Crossing Economic Development District, Louisiana | ||||||||
(General Infrastructure Projects) 144A 7.00% 9/15/44 # | 3,575,000 | 3,617,543 | ||||||
(Road Projects) Series A 144A 7.00% 9/15/44 # | 2,205,000 | 2,231,239 | ||||||
Lancaster Redevelopment Agency, California | ||||||||
(Redevelopment Project) 6.875% 8/1/39 | 215,000 | 247,467 | ||||||
Midtown Miami, Florida Community Development District | ||||||||
(Parking Garage Project) Series A 5.00% 5/1/37 | 1,240,000 | 1,300,822 | ||||||
Mosaic District, Virginia Community Development Authority Revenue | ||||||||
Series A 6.875% 3/1/36 | 1,500,000 | 1,708,530 | ||||||
65
Table of Contents
Schedules of investments
Delaware National High-Yield Municipal Bond Fund
| Principal amount° | Value (U.S. $) | |||||||
| ||||||||
Municipal Bonds (continued) | ||||||||
| ||||||||
Special Tax Revenue Bonds (continued) | ||||||||
Nampa Development Corporation, Idaho Revenue | ||||||||
144A 5.00% 9/1/31 # | 2,940,000 | $ | 3,185,460 | |||||
5.90% 3/1/30 | 2,000,000 | 2,157,640 | ||||||
Nevada State | ||||||||
5.00% 6/1/17 | 1,955,000 | 2,105,515 | ||||||
New Jersey Transportation Trust Fund Authority | ||||||||
(Transportation Program) Series AA 5.00% 6/15/44 | 2,000,000 | 1,981,760 | ||||||
(Transportation Systems) Series B 5.50% 12/15/16 (NATL-RE) | 2,500,000 | 2,635,025 | ||||||
New Mexico Finance Authority | ||||||||
(Senior Lien) 4.00% 6/15/16 | 500,000 | 515,040 | ||||||
New York City, New York Industrial Development Agency | ||||||||
(Pilot - Queens Baseball Stadium) 5.00% 1/1/22 (AMBAC) | 1,000,000 | 1,039,650 | ||||||
(Yankee Stadium) 7.00% 3/1/49 (ASSURED GTY) | 1,000,000 | 1,179,120 | ||||||
New York City, New York Industrial Development Agency Civic Facility Revenue | ||||||||
(YMCA of Greater New York Project) 5.00% 8/1/36 | 1,870,000 | 1,922,173 | ||||||
New York City, New York Transitional Finance Authority Future Tax Secured Revenue | ||||||||
(Sub - Future Tax Secured - Fiscal) Series A-1 5.00% 11/1/19 | 1,525,000 | 1,760,109 | ||||||
New York State Dormitory Authority | ||||||||
(Unrefunded - General Purpose) Series E 5.00% 2/15/17 | 1,000,000 | 1,064,460 | ||||||
Norco, California Redevelopment Agency Tax Allocation | ||||||||
(Area #1 Project) 6.00% 3/1/36 | 1,000,000 | 1,172,670 | ||||||
Northampton County, Pennsylvania Industrial Development Authority | ||||||||
(Route 33 Project) 7.00% 7/1/32 | 2,770,000 | 3,005,145 | ||||||
Overland Park, Kansas Special Obligation Revenue | ||||||||
(Prairiefire-Lionsgate Project) 6.00% 12/15/32 | 3,000,000 | 2,983,740 | ||||||
Regional Transportation, Colorado District Revenue | ||||||||
(Denver Transit Partners) 6.00% 1/15/41 | 1,000,000 | 1,129,200 | ||||||
Richmond Heights, Missouri Tax Increment & Transaction Sales Tax Revenue Improvement | ||||||||
(Francis Place Redevelopment Project) 5.625% 11/1/25 | 1,200,000 | 1,202,496 | ||||||
Roseville Westpark, California Community Facilities District No. 1 | ||||||||
(Public Facilities) 5.25% 9/1/37 | 600,000 | 606,000 | ||||||
66
Table of Contents
| Principal amount° | Value (U.S. $) | |||||||
| ||||||||
Municipal Bonds (continued) | ||||||||
| ||||||||
Special Tax Revenue Bonds (continued) | ||||||||
St. Joseph, Missouri Industrial Development Authority Tax Increment Revenue | ||||||||
(Shoppes at North Village Project) | ||||||||
Series A 5.375% 11/1/24 @ | 1,000,000 | $ | 1,000,190 | |||||
Series A 5.50% 11/1/27 @ | 500,000 | 500,120 | ||||||
St. Louis County, Missouri Industrial Development Authority | ||||||||
(Manchester Ballas Community) | ||||||||
Series A 144A 5.00% 9/1/38 # | 1,000,000 | 992,570 | ||||||
Series A 144A 5.25% 9/1/45 # | 3,000,000 | 2,970,030 | ||||||
St. Louis, Missouri Industrial Development Authority Tax Increment Revenue Improvement | ||||||||
(Grand Center Redevelopment Project) 6.375% 12/1/25 | 1,200,000 | 1,257,852 | ||||||
Texas Public Finance Authority | ||||||||
(Assessment - Unemployment Compensation) 5.00% 1/1/17 | 2,510,000 | 2,661,981 | ||||||
Winter Garden Village at Fowler Groves Community Development District, Florida Special Assessment Revenue | ||||||||
5.65% 5/1/37 | 875,000 | 882,569 | ||||||
Wyandotte County, Kansas City, Kansas Unified Government Special Obligation Revenue | ||||||||
(Capital Appreciation - Sales Tax Subordinate Lien) 6.07% 6/1/21 ^ | 270,000 | 197,605 | ||||||
|
| |||||||
| 76,277,840 | ||||||||
|
| |||||||
State General Obligation Bonds – 2.99% | ||||||||
California State | ||||||||
5.00% 2/1/17 | 725,000 | 770,704 | ||||||
Various Purpose 5.00% 10/1/44 | 2,965,000 | 3,330,525 | ||||||
Commonwealth of Pennsylvania | ||||||||
First Series 5.00% 11/15/16 | 6,905,000 | 7,287,468 | ||||||
Connecticut State | ||||||||
Series E 5.00% 12/15/17 | 1,040,000 | 1,102,816 | ||||||
Hawaii State | ||||||||
Series EH 5.00% 8/1/20 | 5,000,000 | 5,850,100 | ||||||
Maryland State & Local Facilities Loan | ||||||||
(1st Series) Series A 5.00% 8/1/20 | 6,000,000 | 7,038,060 | ||||||
New York State | ||||||||
Series A 5.25% 2/15/24 | 2,000,000 | 2,358,440 | ||||||
Washington State | ||||||||
(Various Purposes) Series R-2010A 5.00% 1/1/17 | 1,140,000 | 1,208,867 | ||||||
|
| |||||||
| 28,946,980 | ||||||||
|
| |||||||
67
Table of Contents
Schedules of investments
Delaware National High-Yield Municipal Bond Fund
| Principal amount° | Value (U.S. $) | |||||||
| ||||||||
Municipal Bonds (continued) | ||||||||
| ||||||||
Transportation Revenue Bonds – 6.56% | ||||||||
Central Texas Regional Mobility Authority Revenue | ||||||||
Senior Lien 6.00% 1/1/41 | 1,890,000 | $ | 2,161,933 | |||||
Subordinate Lien 6.75% 1/1/41 | 1,000,000 | 1,200,420 | ||||||
Foothill-Eastern Transportation Corridor Agency, California | ||||||||
Series A 5.75% 1/15/46 | 5,000,000 | 5,766,950 | ||||||
Series A 6.00% 1/15/49 | 7,690,000 | 9,007,451 | ||||||
Houston, Texas Airport System Revenue Subordinate Lien | ||||||||
Series A 5.00% 7/1/25 (AMT) | 1,000,000 | 1,125,360 | ||||||
Kentucky Public Transportation Infrastructure Authority | ||||||||
(1st Tier - Downtown Crossing) | ||||||||
Series A 5.75% 7/1/49 | 3,000,000 | 3,361,140 | ||||||
Series A 6.00% 7/1/53 | 1,290,000 | 1,468,304 | ||||||
Long Beach, California Marina Revenue | ||||||||
5.00% 5/15/40 | 1,000,000 | 1,075,560 | ||||||
Maryland State Economic Development Revenue | ||||||||
(Transportation Facilities Project) Series A 5.75% 6/1/35 | 1,400,000 | 1,531,348 | ||||||
Metropolitan Washington D.C. Airports Authority | ||||||||
Series B 5.00% 10/1/16 (AMT) | 900,000 | 943,992 | ||||||
New York State Thruway Authority Revenue | ||||||||
Series A 5.00% 5/1/19 | 2,765,000 | 3,126,413 | ||||||
Pennsylvania Economic Development Financing Authority | ||||||||
(PA Bridges Finco LP) 5.00% 12/31/38 | 3,030,000 | 3,214,679 | ||||||
Pennsylvania Turnpike Commission | ||||||||
Series B 5.25% 12/1/39 | 3,460,000 | 3,882,431 | ||||||
Port Authority of New York & New Jersey Special Project | ||||||||
(JFK International Air Terminal) 6.00% 12/1/42 | 1,970,000 | 2,295,050 | ||||||
Riverside County, California Transportation Senior Lien | ||||||||
Series A 5.75% 6/1/48 | 1,000,000 | 1,131,060 | ||||||
Sacramento County, California Airport System Revenue | ||||||||
(PFC/Grant) Series C 6.00% 7/1/41 | 1,000,000 | 1,121,540 | ||||||
San Francisco, California City & County Airports Commission | ||||||||
Series A 5.50% 5/1/27 (AMT) | 1,915,000 | 2,111,192 | ||||||
St. Louis, Missouri Airport Revenue | ||||||||
(Lambert-St. Louis International) Series A-1 6.625% 7/1/34 | 1,090,000 | 1,261,130 | ||||||
Texas Private Activity Bond Surface Transportation Corporate Senior Lien | ||||||||
(LBJ Infrastructure) | ||||||||
7.00% 6/30/40 | 7,000,000 | 8,344,490 | ||||||
7.50% 6/30/33 | 500,000 | 609,560 | ||||||
68
Table of Contents
| Principal amount° | Value (U.S. $) | |||||||
| ||||||||
Municipal Bonds (continued) | ||||||||
| ||||||||
Transportation Revenue Bonds (continued) | ||||||||
Texas Private Activity Bond Surface Transportation Corporate Senior Lien | ||||||||
(NTE Mobility) | ||||||||
6.75% 6/30/43 (AMT) | 1,905,000 | $ | 2,315,223 | |||||
6.875% 12/31/39 | 4,055,000 | 4,750,919 | ||||||
7.00% 12/31/38 (AMT) | 1,335,000 | 1,661,434 | ||||||
|
| |||||||
| 63,467,579 | ||||||||
|
| |||||||
Water & Sewer Revenue Bonds – 2.93% | ||||||||
Jefferson County, Alabama Sewer Revenue | ||||||||
(Senior Lien - Warrants) Series A 5.50% 10/1/53 (AGM) | 2,500,000 | 2,758,275 | ||||||
(Sub Lien-Warrants) | ||||||||
Series D 6.50% 10/1/53 | 16,500,000 | 19,068,720 | ||||||
Series D 7.00% 10/1/51 | 5,000,000 | 6,021,100 | ||||||
Metropolitan Water Reclamation District of Greater Chicago, Illinois | ||||||||
(Capital Improvement) Series C 5.00% 12/1/16 | 500,000 | 528,750 | ||||||
|
| |||||||
| 28,376,845 | ||||||||
|
| |||||||
Total Municipal Bonds (cost $902,858,788) | 947,809,349 | |||||||
|
| |||||||
| ||||||||
Short-Term Investments – 0.96% | ||||||||
| ||||||||
Variable Rate Demand Notes – 0.96%¤ | ||||||||
California Pollution Control Financing Authority (Pacific Gas & Electric) Series C | ||||||||
0.01% 11/1/26 (LOC - JPMorgan Chase Bank N.A.) | 1,200,000 | 1,200,000 | ||||||
Harris County, Texas Cultural Education Facilities Finance (Texas Medical Center) Series A | ||||||||
0.01% 9/1/31 (LOC - JPMorgan Chase Bank N.A.) | 1,275,000 | 1,275,000 | ||||||
Idaho State University Foundation Income Revenue (L.E. & Thelma Stephens Project) | ||||||||
0.05% 5/1/21 (LOC - Wells Fargo Bank N.A.) | 920,000 | 920,000 | ||||||
Minneapolis-St. Paul, Minnesota Housing & Redevelopment Authority Health Care Revenue (Allina Health System) Series B-2 | ||||||||
0.01% 11/15/35 (LOC - JPMorgan Chase Bank N.A.) | 3,900,000 | 3,900,000 | ||||||
Mississippi Business Finance (Chevron USA) Series G | ||||||||
0.01% 11/1/35 | 2,000,000 | 2,000,000 | ||||||
|
| |||||||
Total Short-Term Investments (cost $9,295,000) | 9,295,000 | |||||||
|
| |||||||
Total Value of Securities – 98.90% | $957,104,349 | |||||||
|
| |||||||
69
Table of Contents
Schedules of investments
Delaware National High-Yield Municipal Bond Fund
| # | Security exempt from registration under Rule 144A of the Securities Act of 1933, as amended. At Aug. 31, 2015, the aggregate value of Rule 144A securities was $107,177,297, which represents 11.07% of the Fund’s net assets. See Note 8 in “Notes to financial statements.” |
| @ | Illiquid security. At Aug. 31, 2015, the aggregate value of illiquid securities was $1,750,390, which represents 0.18% of the Fund’s net assets. See Note 8 in “Notes to financial statements.” |
| ¤ | Tax-exempt obligations that contain a floating or variable interest rate adjustment formula and an unconditional right of demand to receive payment of the unpaid principal balance plus accrued interest upon a short notice period (generally up to 30 days) prior to specified dates either from the issuer or by drawing on a bank letter of credit, a guarantee, or insurance issued with respect to such instrument. The rate shown is the rate as of Aug. 31, 2015. |
| ° | Principal amount shown is stated in U.S. dollars unless noted that the security is denominated in another currency. |
| ‡ | Non-income-producing security. Security is currently in default. |
| ● | Variable rate security. The rate shown is the rate as of Aug. 31, 2015. Interest rates reset periodically. |
| ^ | Zero coupon security. The rate shown is the yield at the time of purchase. |
| § | Pre-refunded bonds. Municipal bonds that are generally backed or secured by U.S. Treasury bonds. For pre-refunded bonds, the stated maturity is followed by the year in which the bond is pre-refunded. See Note 8 in “Notes to financial statements.” |
Summary of abbreviations:
AGM – Insured by Assured Guaranty Municipal Corporation
AMBAC – Insured by the AMBAC Assurance Corporation
AMT – Subject to Alternative Minimum Tax
ASSURED GTY – Insured by the Assured Guaranty Corporation
CDFI – Community Development Financial Institutions
LOC – Letter of Credit
N.A. – North America
NATL-RE – Insured by National Public Finance Guarantee Corporation
SGI – Insured by Syncora Guarantee Inc.
See accompanying notes, which are an integral part of the financial statements.
70
Table of Contents
This page intentionally left blank.
Table of Contents
Statements of assets and liabilities
August 31, 2015
Delaware Tax-Free USA Fund | Delaware Tax-Free USA | Delaware National High-Yield Municipal Bond Fund | |||||||||||||
Assets: | |||||||||||||||
Investments, at value1 | $ | 552,910,395 | $ | 695,131,244 | $ | 947,809,349 | |||||||||
Short-term investments, at value2 | 7,995,000 | 6,075,000 | 9,295,000 | ||||||||||||
Cash | 3,232,218 | 2,112,496 | 1,300,637 | ||||||||||||
Interest receivable | 7,167,764 | 8,702,200 | 12,696,080 | ||||||||||||
Receivable for fund shares sold | 100,016 | 468,994 | 2,734,782 | ||||||||||||
Receivable for securities sold | 10,000 | 300,000 | 2,608,604 | ||||||||||||
|
|
|
|
|
| ||||||||||
Total assets | 571,415,393 | 712,789,934 | 976,444,452 | ||||||||||||
|
|
|
|
|
| ||||||||||
Liabilities: | |||||||||||||||
Payable for securities purchased | 1,580,000 | 2,755,000 | 6,075,000 | ||||||||||||
Distributions payable | 565,665 | 585,202 | 1,031,569 | ||||||||||||
Payable for fund shares redeemed | 377,356 | 1,751,915 | 792,737 | ||||||||||||
Investment management fees payable | 177,464 | 287,969 | 298,823 | ||||||||||||
Other accrued expenses | 161,869 | 183,133 | 250,403 | ||||||||||||
Distribution fees payable | 131,745 | 69,117 | 125,284 | ||||||||||||
Other affiliates payable | 39,932 | 49,549 | 124,272 | ||||||||||||
Trustees’ fees and expenses payable | 3,041 | 4,045 | 5,130 | ||||||||||||
|
|
|
|
|
| ||||||||||
Total liabilities | 3,037,072 | 5,685,930 | 8,703,218 | ||||||||||||
|
|
|
|
|
| ||||||||||
Total Net Assets | $ | 568,378,321 | $ | 707,104,004 | $ | 967,741,234 | |||||||||
|
|
|
|
|
| ||||||||||
Net Assets Consist of: | |||||||||||||||
Paid-in capital | $ | 524,354,830 | $ | 674,509,027 | $ | 938,312,898 | |||||||||
Undistributed net investment income | 58,161 | 34,165 | 16,640 | ||||||||||||
Accumulated net realized loss on investments | (2,936,552 | ) | (7,238,986 | ) | (15,538,865 | ) | |||||||||
Net unrealized appreciation of investments | 46,901,882 | 39,799,798 | 44,950,561 | ||||||||||||
|
|
|
|
|
| ||||||||||
Total Net Assets | $ | 568,378,321 | $ | 707,104,004 | $ | 967,741,234 | |||||||||
|
|
|
|
|
| ||||||||||
72
Table of Contents
Delaware Tax-Free | Delaware Tax-Free USA Intermediate Fund | Delaware National High-Yield Municipal Bond Fund | |||||||||||||
Net Asset Value | |||||||||||||||
Class A: | |||||||||||||||
Net assets | $ | 504,204,493 | $ | 184,513,744 | $ | 227,089,829 | |||||||||
Shares of beneficial interest outstanding, unlimited authorization, no par | 42,632,279 | 15,323,852 | 21,116,450 | ||||||||||||
Net asset value per share | $ | 11.83 | $ | 12.04 | $ | 10.75 | |||||||||
Sales charge | 4.50 | % | 2.75 | % | 4.50 | % | |||||||||
Offering price per share, equal to net asset value per share / (1 – sales charge) | $ | 12.39 | $ | 12.38 | $ | 11.26 | |||||||||
Class C: | |||||||||||||||
Net assets | $ | 30,850,960 | $ | 48,327,909 | $ | 91,196,315 | |||||||||
Shares of beneficial interest outstanding, unlimited authorization, no par | 2,608,041 | 4,015,627 | 8,445,529 | ||||||||||||
Net asset value per share | $ | 11.83 | $ | 12.03 | $ | 10.80 | |||||||||
Institutional Class: | |||||||||||||||
Net assets | $ | 33,322,868 | $ | 474,262,351 | $ | 649,455,090 | |||||||||
Shares of beneficial interest outstanding, unlimited authorization, no par | 2,796,878 | 39,007,814 | 59,837,155 | ||||||||||||
Net asset value per share | $ | 11.91 | $ | 12.16 | $ | 10.85 | |||||||||
| |||||||||||||||
1Investments, at cost | $ | 506,008,513 | $ | 655,331,446 | $ | 902,858,788 | |||||||||
2Short-term investments, at cost | 7,995,000 | 6,075,000 | 9,295,000 | ||||||||||||
See accompanying notes, which are an integral part of the financial statements.
73
Table of Contents
Year ended August 31, 2015
| Delaware Tax-Free USA Fund | Delaware Tax-Free USA Intermediate Fund | Delaware National High-Yield Municipal Bond Fund | |||||||||||||
Investment Income: | |||||||||||||||
Interest | $ | 25,452,144 | $ | 27,286,183 | $ | 40,074,066 | |||||||||
|
|
|
|
|
| ||||||||||
Expenses: | |||||||||||||||
Management fees | 3,113,096 | 3,715,624 | 4,553,384 | ||||||||||||
Distribution expenses – Class A | 1,256,736 | 596,105 | 555,540 | ||||||||||||
Distribution expenses – Class B | 182 | 4 | 166 | ||||||||||||
Distribution expenses – Class C | 304,050 | 519,988 | 841,376 | ||||||||||||
Dividend disbursing and transfer agent fees and expenses | 481,686 | 719,507 | 851,161 | ||||||||||||
Accounting and administration expenses | 183,157 | 241,857 | 274,893 | ||||||||||||
Registration fees | 76,947 | 74,668 | 115,489 | ||||||||||||
Reports and statements to shareholders | 72,549 | 110,484 | 113,085 | ||||||||||||
Legal fees | 61,314 | 84,793 | 92,631 | ||||||||||||
Audit and tax fees | 42,384 | 42,384 | 42,384 | ||||||||||||
Trustees’ fees and expenses | 26,562 | 35,132 | 39,599 | ||||||||||||
Custodian fees | 24,437 | 32,547 | 37,561 | ||||||||||||
Other | 37,082 | 46,092 | 55,065 | ||||||||||||
|
|
|
|
|
| ||||||||||
| 5,680,182 | 6,219,185 | 7,572,334 | |||||||||||||
Less expenses waived | (871,429 | ) | (514,007 | ) | (971,915 | ) | |||||||||
Less waived distribution expenses – Class A | — | (238,442 | ) | — | |||||||||||
Less waived distribution expenses – Class B | (140 | ) | (3 | ) | (128 | ) | |||||||||
Less expense paid indirectly | (133 | ) | (91 | ) | (77 | ) | |||||||||
|
|
|
|
|
| ||||||||||
Total operating expenses | 4,808,480 | 5,466,642 | 6,600,214 | ||||||||||||
|
|
|
|
|
| ||||||||||
Net Investment Income | 20,643,664 | 21,819,541 | 33,473,852 | ||||||||||||
|
|
|
|
|
| ||||||||||
74
Table of Contents
| Delaware Tax-Free USA Fund | Delaware Tax-Free USA Intermediate Fund | Delaware National High-Yield Municipal Bond Fund | |||||||||||||
Net Realized and Unrealized Gain (Loss): | |||||||||||||||
Net realized gain (loss) on investments | $ | (200,295 | ) | $ | 2,050,022 | $ | (831,845 | ) | |||||||
Net change in unrealized appreciation (depreciation) of investments | (4,364,863 | ) | (12,796,169 | ) | 4,993,478 | ||||||||||
|
|
|
|
|
| ||||||||||
Net Realized and Unrealized Gain (Loss) | (4,565,158 | ) | (10,746,147 | ) | 4,161,633 | ||||||||||
|
|
|
|
|
| ||||||||||
Net Increase in Net Assets Resulting from Operations | $ | 16,078,506 | $ | 11,073,394 | $ | 37,635,485 | |||||||||
|
|
|
|
|
| ||||||||||
See accompanying notes, which are an integral part of the financial statements.
75
Table of Contents
Statements of changes in net assets
Delaware Tax-Free USA Fund
| Year ended | ||||||||
| 8/31/15 | 8/31/14 | |||||||
Increase (Decrease) in Net Assets from Operations: | ||||||||
Net investment income | $ | 20,643,664 | $ | 21,368,058 | ||||
Net realized loss | (200,295 | ) | (2,078,960 | ) | ||||
Net change in unrealized appreciation (depreciation) | (4,364,863 | ) | 39,021,512 | |||||
|
|
|
| |||||
Net increase in net assets resulting from operations | 16,078,506 | 58,310,610 | ||||||
|
|
|
| |||||
Dividends and Distributions to Shareholders from: | ||||||||
Net investment income: | ||||||||
Class A | (18,666,036 | ) | (19,670,359 | ) | ||||
Class B | (686 | ) | (24,129 | ) | ||||
Class C | (875,173 | ) | (946,445 | ) | ||||
Institutional Class | (1,110,504 | ) | (727,125 | ) | ||||
|
|
|
| |||||
| (20,652,399 | ) | (21,368,058 | ) | |||||
|
|
|
| |||||
Capital Share Transactions: | ||||||||
Proceeds from shares sold: | ||||||||
Class A | 74,645,028 | 20,390,965 | ||||||
Class B | — | 8,214 | ||||||
Class C | 4,235,410 | 2,172,013 | ||||||
Institutional Class | 17,428,772 | 14,168,723 | ||||||
Net asset value of shares issued upon reinvestment of dividends and distributions: | ||||||||
Class A | 15,764,865 | 16,447,982 | ||||||
Class B | 616 | 16,822 | ||||||
Class C | 710,330 | 770,892 | ||||||
Institutional Class | 849,477 | 517,623 | ||||||
|
|
|
| |||||
| 113,634,498 | 54,493,234 | |||||||
|
|
|
| |||||
76
Table of Contents
| Year ended | ||||||||
| 8/31/15 | 8/31/14 | |||||||
Capital Share Transactions (continued): | ||||||||
Cost of shares redeemed: | ||||||||
Class A | $ | (82,684,570 | ) | $ | (90,011,611 | ) | ||
Class B | (244,344 | ) | (837,632 | ) | ||||
Class C | (3,404,801 | ) | (8,946,607 | ) | ||||
Institutional Class | (9,294,550 | ) | (8,213,483 | ) | ||||
|
|
|
| |||||
| (95,628,265 | ) | (108,009,333 | ) | |||||
|
|
|
| |||||
Increase (Decrease) in net assets derived from capital share transactions | 18,006,233 | (53,516,099 | ) | |||||
|
|
|
| |||||
Net Increase (Decrease) in Net Assets | 13,432,340 | (16,573,547 | ) | |||||
Net Assets: | ||||||||
Beginning of year | 554,945,981 | 571,519,528 | ||||||
|
|
|
| |||||
End of year | $ | 568,378,321 | $ | 554,945,981 | ||||
|
|
|
| |||||
Undistributed net investment income | $ | 58,161 | $ | 66,896 | ||||
|
|
|
| |||||
See accompanying notes, which are an integral part of the financial statements.
77
Table of Contents
Statements of changes in net assets
Delaware Tax-Free USA Intermediate Fund
| Year ended | ||||||||
| 8/31/15 | 8/31/14 | |||||||
Increase (Decrease) in Net Assets from Operations: | ||||||||
Net investment income | $ | 21,819,541 | $ | 21,689,186 | ||||
Net realized gain (loss) | 2,050,022 | (3,776,207 | ) | |||||
Net change in unrealized appreciation (depreciation) | (12,796,169 | ) | 36,532,805 | |||||
|
|
|
| |||||
Net increase in net assets resulting from operations | 11,073,394 | 54,445,784 | ||||||
|
|
|
| |||||
Dividends and Distributions to Shareholders from: | ||||||||
Net investment income: | ||||||||
Class A | (6,795,570 | ) | (9,932,951 | ) | ||||
Class B | (11 | ) | (259 | ) | ||||
Class C | (1,036,994 | ) | (1,190,747 | ) | ||||
Institutional Class | (13,969,050 | ) | (10,565,229 | ) | ||||
|
|
|
| |||||
| (21,801,625 | ) | (21,689,186 | ) | |||||
|
|
|
| |||||
Capital Share Transactions: | ||||||||
Proceeds from shares sold: | ||||||||
Class A | 49,925,867 | 70,392,418 | ||||||
Class B | — | 7,726 | ||||||
Class C | 6,388,052 | 6,506,210 | ||||||
Institutional Class | 170,360,519 | 241,643,570 | ||||||
Net asset value of shares issued upon reinvestment of dividends and distributions: | ||||||||
Class A | 5,089,103 | 8,569,342 | ||||||
Class B | 11 | 259 | ||||||
Class C | 936,512 | 1,081,404 | ||||||
Institutional Class | 8,398,439 | 5,135,092 | ||||||
|
|
|
| |||||
| 241,098,503 | 333,336,021 | |||||||
|
|
|
| |||||
78
Table of Contents
| Year ended | ||||||||
| 8/31/15 | 8/31/14 | |||||||
Capital Share Transactions (continued): | ||||||||
Cost of shares redeemed: | ||||||||
Class A | $ | (117,178,823 | ) | $ | (236,109,093 | ) | ||
Class B | (5,017 | ) | (40,423 | ) | ||||
Class C | (12,510,417 | ) | (20,809,359 | ) | ||||
Institutional Class | (132,111,146 | ) | (186,671,884 | ) | ||||
|
|
|
| |||||
| (261,805,403 | ) | (443,630,759 | ) | |||||
|
|
|
| |||||
Decrease in net assets derived from capital share transactions | (20,706,900 | ) | (110,294,738 | ) | ||||
|
|
|
| |||||
Net Decrease in Net Assets | (31,435,131 | ) | (77,538,140 | ) | ||||
Net Assets: | ||||||||
Beginning of year | 738,539,135 | 816,077,275 | ||||||
|
|
|
| |||||
End of year | $ | 707,104,004 | $ | 738,539,135 | ||||
|
|
|
| |||||
Undistributed net investment income | $ | 34,165 | $ | 16,249 | ||||
|
|
|
| |||||
See accompanying notes, which are an integral part of the financial statements.
79
Table of Contents
Statements of changes in net assets
Delaware National High-Yield Municipal Bond Fund
| Year ended | ||||||||
| 8/31/15 | 8/31/14 | |||||||
Increase (Decrease) in Net Assets from Operations: | ||||||||
Net investment income | $ | 33,473,852 | $ | 23,727,456 | ||||
Net realized loss | (831,845 | ) | (5,590,268 | ) | ||||
Net change in unrealized appreciation (depreciation) | 4,993,478 | 59,226,679 | ||||||
|
|
|
| |||||
Net increase in net assets resulting from operations | 37,635,485 | 77,363,867 | ||||||
|
|
|
| |||||
Dividends and Distributions to Shareholders from: | ||||||||
Net investment income: | ||||||||
Class A | (8,419,400 | ) | (8,727,453 | ) | ||||
Class B | (680 | ) | (14,380 | ) | ||||
Class C | (2,552,313 | ) | (2,413,354 | ) | ||||
Institutional Class | (22,286,610 | ) | (12,475,591 | ) | ||||
|
|
|
| |||||
| (33,259,003 | ) | (23,630,778 | ) | |||||
|
|
|
| |||||
Capital Share Transactions: | ||||||||
Proceeds from shares sold: | ||||||||
Class A | 91,360,167 | 81,125,605 | ||||||
Class B | — | 29 | ||||||
Class C | 30,401,468 | 19,149,673 | ||||||
Institutional Class | 355,524,456 | 287,934,787 | ||||||
Net asset value of shares issued upon reinvestment of dividends and distributions: | ||||||||
Class A | 6,651,908 | 7,380,542 | ||||||
Class B | 678 | 12,400 | ||||||
Class C | 2,157,658 | 2,089,705 | ||||||
Institutional Class | 19,296,801 | 9,808,355 | ||||||
|
|
|
| |||||
| 505,393,136 | 407,501,096 | |||||||
|
|
|
| |||||
80
Table of Contents
| Year ended | ||||||||
| 8/31/15 | 8/31/14 | |||||||
Capital Share Transactions (continued): | ||||||||
Cost of shares redeemed: | ||||||||
Class A | $ | (77,543,924 | ) | $ | (104,346,592 | ) | ||
Class B | (223,935 | ) | (370,127 | ) | ||||
Class C | (13,377,278 | ) | (26,210,505 | ) | ||||
Institutional Class | (111,991,145 | ) | (105,787,600 | ) | ||||
|
|
|
| |||||
| (203,136,282 | ) | (236,714,824 | ) | |||||
|
|
|
| |||||
Increase in net assets derived from capital share transactions | 302,256,854 | 170,786,272 | ||||||
|
|
|
| |||||
Net Increase in Net Assets | 306,633,336 | 224,519,361 | ||||||
Net Assets: | ||||||||
Beginning of year | 661,107,898 | 436,588,537 | ||||||
|
|
|
| |||||
End of year | $ | 967,741,234 | $ | 661,107,898 | ||||
|
|
|
| |||||
Undistributed (distributions in excess of) net investment income | $ | 16,640 | $ | (4,103 | ) | |||
|
|
|
| |||||
See accompanying notes, which are an integral part of the financial statements.
81
Table of Contents
Delaware Tax-Free USA Fund Class A
Selected data for each share of the Fund outstanding throughout each period were as follows:
|
Net asset value, beginning of period |
Income (loss) from investment operations: |
Net investment income1 |
Net realized and unrealized gain (loss) |
Total from investment operations |
Less dividends and distributions from: |
Net investment income |
Net realized gain |
Total dividends and distributions |
Net asset value, end of period |
Total return2 |
Ratios and supplemental data: |
Net assets, end of period (000 omitted) |
Ratio of expenses to average net assets |
Ratio of expenses to average net assets prior to fees waived |
Ratio of net investment income to average net assets |
Ratio of net investment income to average net assets prior to fees waived |
Portfolio turnover
|
|
| 1 | The average shares outstanding have been applied for per share information. |
| 2 | Total investment return is based on the change in net asset value of a share during the period and assumes reinvestment of dividends and distributions at net asset value and does not reflect the impact of a sales charge. Total investment return during all of the periods shown reflects waivers by the manager and/or distributor. Performance would have been lower had the waivers not been in effect. |
See accompanying notes, which are an integral part of the financial statements.
82
Table of Contents
| Year ended | ||||||||||||||||||||
|
| |||||||||||||||||||
| 8/31/15 | 8/31/14 | 8/31/13 | 8/31/12 | 8/31/11 | ||||||||||||||||
| ||||||||||||||||||||
| $ | 11.900 | $ | 11.140 | $ | 12.260 | $ | 11.300 | $ | 11.630 | |||||||||||
| 0.434 | 0.445 | 0.456 | 0.484 | 0.503 | ||||||||||||||||
| (0.070 | ) | 0.760 | (1.039 | ) | 0.959 | (0.330 | ) | |||||||||||||
|
|
|
|
|
|
|
|
|
| |||||||||||
| 0.364 | 1.205 | (0.583 | ) | 1.443 | 0.173 | |||||||||||||||
|
|
|
|
|
|
|
|
|
| |||||||||||
| (0.434 | ) | (0.445 | ) | (0.457 | ) | (0.483 | ) | (0.503 | ) | |||||||||||
| — | — | (0.080 | ) | — | — | |||||||||||||||
|
|
|
|
|
|
|
|
|
| |||||||||||
| (0.434 | ) | (0.445 | ) | (0.537 | ) | (0.483 | ) | (0.503 | ) | |||||||||||
| $ | 11.830 | $ | 11.900 | $ | 11.140 | $ | 12.260 | $ | 11.300 | |||||||||||
|
|
|
|
|
|
|
|
|
| |||||||||||
| 3.09% | 11.02% | (5.02% | ) | 13.01% | 1.65% | |||||||||||||||
| $ | 504,204 | $ | 500,590 | $ | 519,986 | $ | 604,415 | $ | 589,175 | |||||||||||
| 0.81% | 0.80% | 0.80% | 0.80% | 0.80% | ||||||||||||||||
| 0.96% | 0.97% | 0.99% | 0.93% | 0.94% | ||||||||||||||||
| 3.63% | 3.88% | 3.76% | 4.11% | 4.52% | ||||||||||||||||
| 3.48% | 3.71% | 3.57% | 3.98% | 4.38% | ||||||||||||||||
|
| 16%
|
|
| 34%
|
|
| 40%
|
|
| 52%
|
|
| 49%
|
| ||||||
| ||||||||||||||||||||
83
Table of Contents
Financial highlights
Delaware Tax-Free USA Fund Class C
Selected data for each share of the Fund outstanding throughout each period were as follows:
|
Net asset value, beginning of period |
Income (loss) from investment operations: |
Net investment income1 |
Net realized and unrealized gain (loss) |
Total from investment operations |
Less dividends and distributions from: |
Net investment income |
Net realized gain |
Total dividends and distributions |
Net asset value, end of period |
Total return2 |
Ratios and supplemental data: |
Net assets, end of period (000 omitted) |
Ratio of expenses to average net assets |
Ratio of expenses to average net assets prior to fees waived |
Ratio of net investment income to average net assets |
Ratio of net investment income to average net assets prior to fees waived |
Portfolio turnover |
| 1 | The average shares outstanding have been applied for per share information. |
| 2 | Total investment return is based on the change in net asset value of a share during the period and assumes reinvestment of dividends and distributions at net asset value and does not reflect the impact of a sales charge. Total investment return during all of the periods shown reflects a waiver by the manager. Performance would have been lower had the waiver not been in effect. |
See accompanying notes, which are an integral part of the financial statements.
84
Table of Contents
| Year Ended | ||||||||||||||||||||
|
| |||||||||||||||||||
| 8/31/15 | 8/31/14 | 8/31/13 | 8/31/12 | 8/31/11 | ||||||||||||||||
| ||||||||||||||||||||
| $ | 11.910 | $ | 11.140 | $ | 12.270 | $ | 11.300 | $ | 11.630 | |||||||||||
| 0.344 | 0.359 | 0.364 | 0.395 | 0.419 | ||||||||||||||||
| (0.080 | ) | 0.770 | (1.048 | ) | 0.969 | (0.330 | ) | |||||||||||||
|
|
|
|
|
|
|
|
|
| |||||||||||
| 0.264 | 1.129 | (0.684 | ) | 1.364 | 0.089 | |||||||||||||||
|
|
|
|
|
|
|
|
|
| |||||||||||
| (0.344 | ) | (0.359 | ) | (0.366 | ) | (0.394 | ) | (0.419 | ) | |||||||||||
| — | — | (0.080 | ) | — | — | |||||||||||||||
|
|
|
|
|
|
|
|
|
| |||||||||||
| (0.344 | ) | (0.359 | ) | (0.446 | ) | (0.394 | ) | (0.419 | ) | |||||||||||
|
|
|
|
|
|
|
|
|
| |||||||||||
| $ | 11.830 | $ | 11.910 | $ | 11.140 | $ | 12.270 | $ | 11.300 | |||||||||||
|
|
|
|
|
|
|
|
|
| |||||||||||
| 2.23% | 10.28% | (5.82% | ) | 12.26% | 0.88% | |||||||||||||||
| $ | 30,851 | $ | 29,524 | $ | 33,509 | $ | 36,840 | $ | 30,552 | |||||||||||
| 1.57% | 1.56% | 1.56% | 1.56% | 1.56% | ||||||||||||||||
| 1.72% | 1.72% | 1.70% | 1.69% | 1.70% | ||||||||||||||||
| 2.88% | 3.12% | 3.00% | 3.35% | 3.76% | ||||||||||||||||
| 2.73% | 2.96% | 2.86% | 3.22% | 3.62% | ||||||||||||||||
| 16% | 34% | 40% | 52% | 49% | ||||||||||||||||
| ||||||||||||||||||||
85
Table of Contents
Financial highlights
Delaware Tax-Free USA Fund Institutional Class
Selected data for each share of the Fund outstanding throughout each period were as follows:
|
Net asset value, beginning of period |
Income (loss) from investment operations: |
Net investment income1 |
Net realized and unrealized gain (loss) |
Total from investment operations |
Less dividends and distributions from: |
Net investment income |
Net realized gain |
Total dividends and distributions |
Net asset value, end of period |
Total return2 |
Ratios and supplemental data: |
Net assets, end of period (000 omitted) |
Ratio of expenses to average net assets |
Ratio of expenses to average net assets prior to fees waived |
Ratio of net investment income to average net assets |
Ratio of net investment income to average net assets prior to fees waived |
Portfolio turnover |
| 1 | The average shares outstanding have been applied for per share information. |
| 2 | Total investment return is based on the change in net asset value of a share during the period and assumes reinvestment of dividends and distributions at net asset value. Total investment return during all of the periods shown reflects a waiver by the manager. Performance would have been lower had the waiver not been in effect. |
See accompanying notes, which are an integral part of the financial statements.
86
Table of Contents
| Year ended | ||||||||||||||||||||
|
| |||||||||||||||||||
| 8/31/15 | 8/31/14 | 8/31/13 | 8/31/12 | 8/31/11 | ||||||||||||||||
| ||||||||||||||||||||
| $ | 11.990 | $ | 11.220 | $ | 12.360 | $ | 11.380 | $ | 11.720 | |||||||||||
| 0.466 | 0.477 | 0.490 | 0.517 | 0.534 | ||||||||||||||||
| (0.080 | ) | 0.770 | (1.060 | ) | 0.979 | (0.340 | ) | |||||||||||||
|
|
|
|
|
|
|
|
|
| |||||||||||
| 0.386 | 1.247 | (0.570 | ) | 1.496 | 0.194 | |||||||||||||||
|
|
|
|
|
|
|
|
|
| |||||||||||
| (0.466 | ) | (0.477 | ) | (0.490 | ) | (0.516 | ) | (0.534 | ) | |||||||||||
| — | — | (0.080 | ) | — | — | |||||||||||||||
|
|
|
|
|
|
|
|
|
| |||||||||||
| (0.466 | ) | (0.477 | ) | (0.570 | ) | (0.516 | ) | (0.534 | ) | |||||||||||
|
|
|
|
|
|
|
|
|
| |||||||||||
| $ | 11.910 | $ | 11.990 | $ | 11.220 | $ | 12.360 | $ | 11.380 | |||||||||||
|
|
|
|
|
|
|
|
|
| |||||||||||
| 3.26% | 11.33% | (4.89% | ) | 13.41% | 1.83% | |||||||||||||||
| $ | 33,323 | $ | 24,588 | $ | 17,008 | $ | 18,187 | $ | 9,242 | |||||||||||
| 0.57% | 0.56% | 0.56% | 0.56% | 0.56% | ||||||||||||||||
| 0.72% | 0.72% | 0.70% | 0.69% | 0.70% | ||||||||||||||||
| 3.88% | 4.12% | 4.00% | 4.35% | 4.76% | ||||||||||||||||
| 3.73% | 3.96% | 3.86% | 4.22% | 4.62% | ||||||||||||||||
| 16% | 34% | 40% | 52% | 49% | ||||||||||||||||
| ||||||||||||||||||||
87
Table of Contents
Financial highlights
Delaware Tax-Free USA Intermediate Fund Class A
Selected data for each share of the Fund outstanding throughout each period were as follows:
|
Net asset value, beginning of period |
Income (loss) from investment operations: |
Net investment income1 |
Net realized and unrealized gain (loss) |
Total from investment operations |
Less dividends and distributions from: |
Net investment income |
Total dividends and distributions |
Net asset value, end of period |
Total return2 |
Ratios and supplemental data: |
Net assets, end of period (000 omitted) |
Ratio of expenses to average net assets |
Ratio of expenses to average net assets prior to fees waived |
Ratio of net investment income to average net assets |
Ratio of net investment income to average net assets prior to fees waived |
Portfolio turnover |
| 1 | The average shares outstanding have been applied for per share information. |
| 2 | Total investment return is based on the change in net asset value of a share during the period and assumes reinvestment of dividends and distributions at net asset value and does not reflect the impact of a sales charge. Total investment return during all of the periods shown reflects waivers by the manager and distributor. Performance would have been lower had the waivers not been in effect. |
See accompanying notes, which are an integral part of the financial statements.
88
Table of Contents
| Year ended | ||||||||||||||||||||
|
| |||||||||||||||||||
| 8/31/15 | 8/31/14 | 8/31/13 | 8/31/12 | 8/31/11 | ||||||||||||||||
| ||||||||||||||||||||
| $ | 12.210 | $ | 11.690 | $ | 12.410 | $ | 11.850 | $ | 12.110 | |||||||||||
| 0.346 | 0.342 | 0.344 | 0.362 | 0.381 | ||||||||||||||||
| (0.170 | ) | 0.520 | (0.720 | ) | 0.560 | (0.260 | ) | |||||||||||||
|
|
|
|
|
|
|
|
|
| |||||||||||
| 0.176 | 0.862 | (0.376 | ) | 0.922 | 0.121 | |||||||||||||||
|
|
|
|
|
|
|
|
|
| |||||||||||
| (0.346 | ) | (0.342 | ) | (0.344 | ) | (0.362 | ) | (0.381 | ) | |||||||||||
|
|
|
|
|
|
|
|
|
| |||||||||||
| (0.346 | ) | (0.342 | ) | (0.344 | ) | (0.362 | ) | (0.381 | ) | |||||||||||
|
|
|
|
|
|
|
|
|
| |||||||||||
| $ | 12.040 | $ | 12.210 | $ | 11.690 | $ | 12.410 | $ | 11.850 | |||||||||||
|
|
|
|
|
|
|
|
|
| |||||||||||
| 1.46% | 7.47% | (3.13% | ) | 7.89% | 1.10% | |||||||||||||||
| $ | 184,514 | $ | 249,848 | $ | 391,923 | $ | 464,540 | $ | 444,780 | |||||||||||
| 0.76% | 0.75% | 0.75% | 0.75% | 0.75% | ||||||||||||||||
| 0.93% | 0.93% | 0.97% | 0.97% | 0.98% | ||||||||||||||||
| 2.85% | 2.86% | 2.79% | 2.98% | 3.27% | ||||||||||||||||
| 2.68% | 2.68% | 2.57% | 2.76% | 3.04% | ||||||||||||||||
| 19% | 34% | 23% | 39% | 43% | ||||||||||||||||
| ||||||||||||||||||||
89
Table of Contents
Financial highlights
Delaware Tax-Free USA Intermediate Fund Class C
Selected data for each share of the Fund outstanding throughout each period were as follows:
|
Net asset value, beginning of period |
Income (loss) from investment operations: |
Net investment income1 |
Net realized and unrealized gain (loss) |
Total from investment operations |
Less dividends and distributions from: |
Net investment income |
Total dividends and distributions |
Net asset value, end of period |
Total return2 |
Ratios and supplemental data: |
Net assets, end of period (000 omitted) |
Ratio of expenses to average net assets |
Ratio of expenses to average net assets prior to fees waived |
Ratio of net investment income to average net assets |
Ratio of net investment income to average net assets prior to fees waived |
Portfolio turnover |
| 1 | The average shares outstanding have been applied for per share information. |
| 2 | Total investment return is based on the change in net asset value of a share during the period and assumes reinvestment of dividends and distributions at net asset value and does not reflect the impact of a sales charge. Total investment return during all of the periods shown reflects a waiver by the manager. Performance would have been lower had the waiver not been in effect. |
See accompanying notes, which are an integral part of the financial statements.
90
Table of Contents
| Year ended | ||||||||||||||||||||
|
| |||||||||||||||||||
| 8/31/15 | 8/31/14 | 8/31/13 | 8/31/12 | 8/31/11 | ||||||||||||||||
| ||||||||||||||||||||
| $ | 12.200 | $ | 11.690 | $ | 12.400 | $ | 11.850 | $ | 12.110 | |||||||||||
| 0.243 | 0.240 | 0.239 | 0.258 | 0.282 | ||||||||||||||||
| (0.170 | ) | 0.510 | (0.710 | ) | 0.550 | (0.260 | ) | |||||||||||||
|
|
|
|
|
|
|
|
|
| |||||||||||
| 0.073 | 0.750 | (0.471 | ) | 0.808 | 0.022 | |||||||||||||||
|
|
|
|
|
|
|
|
|
| |||||||||||
| (0.243 | ) | (0.240 | ) | (0.239 | ) | (0.258 | ) | (0.282 | ) | |||||||||||
|
|
|
|
|
|
|
|
|
| |||||||||||
| (0.243 | ) | (0.240 | ) | (0.239 | ) | (0.258 | ) | (0.282 | ) | |||||||||||
| $ | 12.030 | $ | 12.200 | $ | 11.690 | $ | 12.400 | $ | 11.850 | |||||||||||
|
|
|
|
|
|
|
|
|
| |||||||||||
| 0.60% | 6.48% | (3.87% | ) | 6.89% | 0.25% | |||||||||||||||
| $ | 48,328 | $ | 54,231 | $ | 64,904 | $ | 75,887 | $ | 60,398 | |||||||||||
| 1.61% | 1.60% | 1.60% | 1.60% | 1.60% | ||||||||||||||||
| 1.68% | 1.68% | 1.67% | 1.67% | 1.68% | ||||||||||||||||
| 2.00% | 2.01% | 1.94% | 2.13% | 2.42% | ||||||||||||||||
| 1.93% | 1.93% | 1.87% | 2.06% | 2.34% | ||||||||||||||||
| 19% | 34% | 23% | 39% | 43% | ||||||||||||||||
| ||||||||||||||||||||
91
Table of Contents
Financial highlights
Delaware Tax-Free USA Intermediate Fund Institutional Class
Selected data for each share of the Fund outstanding throughout each period were as follows:
|
Net asset value, beginning of period |
Income (loss) from investment operations: |
Net investment income1 |
Net realized and unrealized gain (loss) |
Total from investment operations |
Less dividends and distributions from: |
Net investment income |
Total dividends and distributions |
Net asset value, end of period |
Total return2 |
Ratios and supplemental data: |
Net assets, end of period (000 omitted) |
Ratio of expenses to average net assets |
Ratio of expenses to average net assets prior to fees waived |
Ratio of net investment income to average net assets |
Ratio of net investment income to average net assets prior to fees waived |
Portfolio turnover |
| 1 | The average shares outstanding have been applied for per share information. |
| 2 | Total investment return is based on the change in net asset value of a share during the period and assumes reinvestment of dividends and distributions at net asset value. Total investment return during all of the periods shown reflects a waiver by the manager. Performance would have been lower had the waiver not been in effect. |
See accompanying notes, which are an integral part of the financial statements.
92
Table of Contents
| Year ended | ||||||||||||||||||||
|
| |||||||||||||||||||
| 8/31/15 | 8/31/14 | 8/31/13 | 8/31/12 | 8/31/11 | ||||||||||||||||
| ||||||||||||||||||||
| $ | 12.330 | $ | 11.810 | $ | 12.530 | $ | 11.970 | $ | 12.230 | |||||||||||
| 0.368 | 0.363 | 0.366 | 0.384 | 0.402 | ||||||||||||||||
| (0.170 | ) | 0.520 | (0.720 | ) | 0.560 | (0.260 | ) | |||||||||||||
|
|
|
|
|
|
|
|
|
| |||||||||||
| 0.198 | 0.883 | (0.354 | ) | 0.944 | 0.142 | |||||||||||||||
|
|
|
|
|
|
|
|
|
| |||||||||||
| (0.368 | ) | (0.363 | ) | (0.366 | ) | (0.384 | ) | (0.402 | ) | |||||||||||
|
|
|
|
|
|
|
|
|
| |||||||||||
| (0.368 | ) | (0.363 | ) | (0.366 | ) | (0.384 | ) | (0.402 | ) | |||||||||||
|
|
|
|
|
|
|
|
|
| |||||||||||
| $ | 12.160 | $ | 12.330 | $ | 11.810 | $ | 12.530 | $ | 11.970 | |||||||||||
|
|
|
|
|
|
|
|
|
| |||||||||||
| 1.62% | 7.58% | (2.92% | ) | 8.00% | 1.28% | |||||||||||||||
| $ | 474,262 | $ | 434,455 | $ | 359,213 | $ | 333,033 | $ | 281,256 | |||||||||||
| 0.61% | 0.60% | 0.60% | 0.60% | 0.60% | ||||||||||||||||
| 0.68% | 0.68% | 0.67% | 0.67% | 0.68% | ||||||||||||||||
| 3.00% | 3.01% | 2.94% | 3.13% | 3.42% | ||||||||||||||||
| 2.93% | 2.93% | 2.87% | 3.06% | 3.34% | ||||||||||||||||
| 19% | 34% | 23% | 39% | 43% | ||||||||||||||||
| ||||||||||||||||||||
93
Table of Contents
Financial highlights
Delaware National High-Yield Municipal Bond Fund Class A
Selected data for each share of the Fund outstanding throughout each period were as follows:
|
Net asset value, beginning of period |
Income (loss) from investment operations: |
Net investment income1 |
Net realized and unrealized gain (loss) |
Total from investment operations |
Less dividends and distributions from: |
Net investment income |
Total dividends and distributions |
Net asset value, end of period |
Total return2 |
Ratios and supplemental data: |
Net assets, end of period (000 omitted) |
Ratio of expenses to average net assets |
Ratio of expenses to average net assets prior to fees waived |
Ratio of net investment income to average net assets |
Ratio of net investment income to average net assets prior to fees waived |
Portfolio turnover |
| 1 | The average shares outstanding have been applied for per share information. |
| 2 | Total investment return is based on the change in net asset value of a share during the period and assumes reinvestment of dividends and distributions at net asset value and does not reflect the impact of a sales charge. Total investment return during all of the periods shown reflects waivers by the manager. Performance would have been lower had the waivers not been in effect. |
See accompanying notes, which are an integral part of the financial statements.
94
Table of Contents
| Year ended | ||||||||||||||||||||
|
| |||||||||||||||||||
| 8/31/15 | 8/31/14 | 8/31/13 | 8/31/12 | 8/31/11 | ||||||||||||||||
| ||||||||||||||||||||
| $ | 10.650 | $ | 9.640 | $ | 10.750 | $ | 9.620 | $ | 10.090 | |||||||||||
| 0.413 | 0.447 | 0.449 | 0.496 | 0.479 | ||||||||||||||||
| 0.097 | 1.008 | (1.110 | ) | 1.127 | (0.474 | ) | ||||||||||||||
|
|
|
|
|
|
|
|
| �� | |||||||||||
| 0.510 | 1.455 | (0.661 | ) | 1.623 | 0.005 | |||||||||||||||
|
|
|
|
|
|
|
|
|
| |||||||||||
| (0.410 | ) | (0.445 | ) | (0.449 | ) | (0.493 | ) | (0.475 | ) | |||||||||||
|
|
|
|
|
|
|
|
|
| |||||||||||
| (0.410 | ) | (0.445 | ) | (0.449 | ) | (0.493 | ) | (0.475 | ) | |||||||||||
|
|
|
|
|
|
|
|
|
| |||||||||||
| $ | 10.750 | $ | 10.650 | $ | 9.640 | $ | 10.750 | $ | 9.620 | |||||||||||
|
|
|
|
|
|
|
|
|
| |||||||||||
| 4.83% | 15.42% | (6.47% | ) | 17.28% | 0.23% | |||||||||||||||
| $ | 227,090 | $ | 204,936 | $ | 200,988 | $ | 228,829 | $ | 140,629 | |||||||||||
| 0.85% | 0.85% | 0.85% | 0.85% | 0.85% | ||||||||||||||||
| 0.97% | 0.99% | 0.99% | 0.99% | 1.01% | ||||||||||||||||
| 3.80% | 4.38% | 4.18% | 4.83% | 5.03% | ||||||||||||||||
| 3.68% | 4.24% | 4.04% | 4.69% | 4.87% | ||||||||||||||||
| 10% | 31% | 46% | 34% | 57% | ||||||||||||||||
95
Table of Contents
Financial highlights
Delaware National High-Yield Municipal Bond Fund Class C
Selected data for each share of the Fund outstanding throughout each period were as follows:
|
Net asset value, beginning of period |
Income (loss) from investment operations: |
Net investment income1 |
Net realized and unrealized gain (loss) |
Total from investment operations |
Less dividends and distributions from: |
Net investment income |
Total dividends and distributions |
Net asset value, end of period |
Total return2 |
Ratios and supplemental data: |
Net assets, end of period (000 omitted) |
Ratio of expenses to average net assets |
Ratio of expenses to average net assets prior to fees waived |
Ratio of net investment income to average net assets |
Ratio of net investment income to average net assets prior to fees waived |
Portfolio turnover |
|
|
| 1 | The average shares outstanding have been applied for per share information. |
| 2 | Total investment return is based on the change in net asset value of a share during the period and assumes reinvestment of dividends and distributions at net asset value and does not reflect the impact of a sales charge. Total investment return during all of the periods shown reflects a waiver by the manager. Performance would have been lower had the waiver not been in effect. |
See accompanying notes, which are an integral part of the financial statements.
96
Table of Contents
| Year ended | ||||||||||||||||||||
|
| |||||||||||||||||||
| 8/31/15 | 8/31/14 | 8/31/13 | 8/31/12 | 8/31/11 | ||||||||||||||||
| ||||||||||||||||||||
| $10.700 | $ | 9.680 | $ | 10.800 | $ | 9.660 | $ | 10.130 | ||||||||||||
| 0.333 | 0.373 | 0.370 | 0.422 | 0.409 | ||||||||||||||||
| 0.097 | 1.018 | (1.120 | ) | 1.137 | (0.474 | ) | ||||||||||||||
|
|
|
|
|
|
|
| |||||||||||||
| 0.430 | 1.391 | (0.750 | ) | 1.559 | (0.065 | ) | ||||||||||||||
|
|
|
|
|
|
|
| |||||||||||||
| (0.330 | ) | (0.371 | ) | (0.370 | ) | (0.419 | ) | (0.405 | ) | |||||||||||
|
|
|
|
|
|
|
| |||||||||||||
| (0.330 | ) | (0.371 | ) | (0.370 | ) | (0.419 | ) | (0.405 | ) | |||||||||||
|
|
|
|
|
|
|
| |||||||||||||
| $10.800 | $ | 10.700 | $ | 9.680 | $ | 10.800 | $ | 9.660 | ||||||||||||
|
|
|
|
|
|
|
| |||||||||||||
| 4.04% | 14.63% | (7.21% | ) | 16.47% | (0.51% | ) | ||||||||||||||
| $91,196 | $ | 71,424 | $ | 69,889 | $ | 69,634 | $ | 44,497 | ||||||||||||
| 1.60% | 1.60% | 1.60% | 1.60% | 1.60% | ||||||||||||||||
| 1.72% | 1.74% | 1.74% | 1.74% | 1.76% | ||||||||||||||||
| 3.05% | 3.63% | 3.43% | 4.08% | 4.28% | ||||||||||||||||
| 2.93% | 3.49% | 3.29% | 3.94% | 4.12% | ||||||||||||||||
| 10% | 31% | 46% | 34% | 57% | ||||||||||||||||
| ||||||||||||||||||||
97
Table of Contents
Financial highlights
Delaware National High-Yield Municipal Bond Fund Institutional Class
Selected data for each share of the Fund outstanding throughout each period were as follows:
|
Net asset value, beginning of period |
Income (loss) from investment operations: |
Net investment income1 |
Net realized and unrealized gain (loss) |
Total from investment operations |
Less dividends and distributions from: |
Net investment income |
Total dividends and distributions |
Net asset value, end of period |
Total return2 |
Ratios and supplemental data: |
Net assets, end of period (000 omitted) |
Ratio of expenses to average net assets |
Ratio of expenses to average net assets prior to fees waived |
Ratio of net investment income to average net assets |
Ratio of net investment income to average net assets prior to fees waived |
Portfolio turnover |
|
|
| 1 | The average shares outstanding have been applied for per share information. |
| 2 | Total investment return is based on the change in net asset value of a share during the period and assumes reinvestment of dividends and distributions at net asset value. Total investment return during all of the periods shown reflects a waiver by the manager. Performance would have been lower had the waiver not been in effect. |
See accompanying notes, which are an integral part of the financial statements.
98
Table of Contents
| Year ended | ||||||||||||||||||||
|
| |||||||||||||||||||
| 8/31/15 | 8/31/14 | 8/31/13 | 8/31/12 | 8/31/11 | ||||||||||||||||
| ||||||||||||||||||||
| $ 10.750 | $ | 9.730 | $ | 10.850 | $ | 9.710 | $ | 10.190 | ||||||||||||
| 0.443 | 0.476 | 0.480 | 0.527 | 0.506 | ||||||||||||||||
| 0.097 | 1.018 | (1.120 | ) | 1.137 | (0.484 | ) | ||||||||||||||
|
|
|
|
|
|
|
| |||||||||||||
| 0.540 | 1.494 | (0.640 | ) | 1.664 | 0.022 | |||||||||||||||
|
|
|
|
|
|
|
| |||||||||||||
| (0.440 | ) | (0.474 | ) | (0.480 | ) | (0.524 | ) | (0.502 | ) | |||||||||||
|
|
|
|
|
|
|
| |||||||||||||
| (0.440 | ) | (0.474 | ) | (0.480 | ) | (0.524 | ) | (0.502 | ) | |||||||||||
|
|
|
|
|
|
|
| |||||||||||||
| $ 10.850 | $ | 10.750 | $ | 9.730 | $ | 10.850 | $ | 9.710 | ||||||||||||
|
|
|
|
|
|
|
| |||||||||||||
| 5.08% | 15.71% | (6.23% | ) | 17.57% | 0.41% | |||||||||||||||
| $649,455 | $ | 384,525 | $ | 165,162 | $ | 125,661 | $ | 44,364 | ||||||||||||
| 0.60% | 0.60% | 0.60% | 0.60% | 0.60% | ||||||||||||||||
| 0.72% | 0.74% | 0.74% | 0.74% | 0.76% | ||||||||||||||||
| 4.05% | 4.63% | 4.43% | 5.08% | 5.28% | ||||||||||||||||
| 3.93% | 4.49% | 4.29% | 4.94% | 5.12% | ||||||||||||||||
| 10% | 31% | 46% | 34% | 57% | ||||||||||||||||
| ||||||||||||||||||||
99
Table of Contents
| Delaware Investments® National Tax-Free Funds | August 31, 2015 |
Delaware Group® Tax-Free Fund is organized as a Delaware statutory trust and offers two series: Delaware Tax-Free USA Fund and Delaware Tax-Free USA Intermediate Fund. Voyageur Mutual Funds is organized as a Delaware statutory trust and offers five series: Delaware Tax-Free California Fund, Delaware Tax-Free Idaho Fund, Delaware Minnesota High-Yield Municipal Bond Fund, Delaware National High-Yield Municipal Bond Fund, and Delaware Tax-Free New York Fund. Delaware Group Tax-Free Fund and Voyageur Mutual Funds are individually referred to as a Trust and collectively as the Trusts. These financial statements and the related notes pertain to Delaware Tax-Free USA Fund, Delaware Tax-Free USA Intermediate Fund, and Delaware National High-Yield Municipal Bond Fund (each referred to as a Fund, or collectively, as the Funds). The above Trusts are open-end investment companies. The Funds are considered diversified under the Investment Company Act of 1940, as amended and offer Class A, Class C, and Institutional Class shares. Class A shares are sold with a maximum front-end sales charge of 4.50% for Delaware Tax-Free USA Fund and Delaware National High-Yield Municipal Bond Fund, and 2.75% for Delaware Tax-Free USA Intermediate Fund. Class A share purchases of $1,000,000 or more will incur a contingent deferred sales charge (CDSC) of 1.00% if redeemed during the first year and 0.50% during the second year for Delaware Tax-Free USA Fund and Delaware National High-Yield Municipal Bond Fund, and 0.75% for Delaware Tax-Free USA Intermediate Fund if redeemed within the first year, provided that Delaware Distributors, L.P. (DDLP) paid a financial advisor a commission on the purchase of those shares. Effective Sept. 25, 2014, all remaining shares of Class B were converted to Class A shares. Between June 1, 2007 and Sept. 25, 2014, Class B shares could be purchased only through dividend reinvestment and certain permitted exchanges. Class B shares of Delaware Tax-Free USA Fund and Delaware National High-Yield Municipal Bond Fund automatically converted to Class A shares on a quarterly basis approximately eight years after purchase. Class B shares of Delaware Tax-Free USA Intermediate Fund automatically converted to Class A shares on a quarterly basis approximately five years after purchase. Class C shares are sold with a CDSC of 1.00%, if redeemed during the first 12 months. Institutional Class shares are not subject to a sales charge and are offered for sale exclusively to certain eligible investors.
The investment objective of Delaware Tax-Free USA Fund and Delaware Tax-Free USA Intermediate Fund is to seek as high a level of current interest income exempt from federal income taxes as is available from municipal obligations and as is consistent with prudent investment management and preservation of capital.
The investment objective of Delaware National High-Yield Municipal Bond Fund is to seek a high level of current income exempt from federal income tax primarily through investment in medium- and lower-grade municipal obligations.
1. Significant Accounting Policies
The following accounting policies are in accordance with U.S. generally accepted accounting principles (U.S. GAAP) and are consistently followed by the Funds.
Security Valuation – Debt securities are valued based upon valuations provided by an independent pricing service or broker and reviewed by management. To the extent current market prices are not available, the pricing service may take into account developments related to the specific security, as well as transactions in comparable securities. Valuations for fixed income securities utilize matrix systems, which reflect such factors as security prices, yields, maturities, and ratings, and are supplemented by
100
Table of Contents
dealer and exchange quotations. Generally, other securities and assets for which market quotations are not readily available are valued at fair value as determined in good faith under the direction of each Fund’s Board of Trustees (each, a Board or, collectively, the Boards). In determining whether market quotations are readily available or fair valuation will be used, various factors will be taken into consideration, such as market closures or suspension of trading in a security.
Federal Income Taxes – No provision for federal income taxes has been made as each Fund intends to continue to qualify for federal income tax purposes as a regulated investment company under Subchapter M of the Internal Revenue Code of 1986, as amended, and make the requisite distributions to shareholders. Each Fund evaluates tax positions taken or expected to be taken in the course of preparing each Fund’s tax returns to determine whether the tax positions are “more-likely-than-not” of being sustained by the applicable tax authority. Tax positions not deemed to meet the “more-likely-than-not” threshold are recorded as a tax benefit or expense in the current year. Management has analyzed each Fund’s tax positions taken for all open federal income tax years (Aug. 31, 2012–Aug. 31, 2015), and has concluded that no provision for federal income tax is required in each Fund’s financial statements.
Class Accounting – Investment income and common expenses are allocated to the various classes of each Fund on the basis of “settled shares” of each class in relation to the net assets of each Fund. Realized and unrealized gain (loss) on investments are allocated to the various classes of each Fund on the basis of daily net assets of each class. Distribution expenses relating to a specific class are charged directly to that class.
Use of Estimates – Each Fund is an investment company, whose financial statements are prepared in conformity with U.S. GAAP. Therefore, each Fund follows the accounting and reporting guidelines for investment companies. The preparation of financial statements in conformity with U.S. GAAP requires management to make estimates and assumptions that affect the fair value of investments, the reported amounts of assets and liabilities and disclosure of contingent assets and liabilities at the date of the financial statements, and the reported amounts of revenues and expenses during the reporting period. Actual results could differ from those estimates and the differences could be material.
Other – Expenses directly attributable to a Fund are charged directly to that Fund. Other expenses common to various funds within the Delaware Investments® Family of Funds are generally allocated among such funds on the basis of average net assets. Management fees and some other expenses are paid monthly. Security transactions are recorded on the date the securities are purchased or sold (trade date) for financial reporting purposes. Costs used in calculating realized gains and losses on the sale of investment securities are those of the specific securities sold. Interest income is recorded on the accrual basis. Discounts and premiums on debt securities are accreted or amortized to interest income, respectively, over the lives of the respective securities using the effective interest method. Each Fund declares dividends daily from net investment income and pays the dividends monthly and declares and pays distributions from net realized gain on investments, if any, annually. Each Fund may distribute more frequently, if necessary for tax purposes. Dividends and distributions, if any, are recorded on the ex-dividend date.
101
Table of Contents
Notes to financial statements
Delaware Investments® National Tax-Free Funds
1. Significant Accounting Policies (continued)
Each Fund may receive earnings credits from its custodian when positive cash balances are maintained, which may be used to offset custody fees. There were no such earnings credits for the year ended Aug. 31, 2015.
Each Fund receives earnings credits from its transfer agent when positive cash balances are maintained, which may be used to offset transfer agent fees. If the amount earned is greater than one dollar, the expense paid under this arrangement is included on the “Statements of operations” under “Dividend disbursing and transfer agent fees and expenses” with the corresponding expense offset shown under “Less expense paid indirectly.” For the year ended Aug. 31, 2015, each Fund earned the following amounts under this agreement:
| Delaware Tax-Free USA Fund | Delaware Tax-Free USA Intermediate Fund | Delaware National High-Yield Municipal Bond Fund | ||||
| $133 | $91 | $77 |
2. Investment Management, Administration Agreements, and Other Transactions with Affiliates
In accordance with the terms of its respective investment management agreement, each Fund pays Delaware Management Company (DMC), a series of Delaware Management Business Trust and the investment manager, an annual fee which is calculated based on each Fund’s average daily net assets as follows:
| Delaware Tax-Free USA Fund | Delaware Tax-Free | Delaware National | ||||
On the first $500 million | 0.550% | 0.500% | 0.550% | |||
On the next $500 million | 0.500% | 0.475% | 0.500% | |||
On the next $1.5 billion | 0.450% | 0.450% | 0.450% | |||
In excess of $2.5 billion | 0.425% | 0.425% | 0.425% |
DMC has contractually agreed to waive that portion, if any, of its management fee and/or pay/reimburse each Fund to the extent necessary to ensure that total annual operating expenses (excluding any 12b-1 fees, taxes, interest, inverse floater program expenses, acquired fund fees and expenses, short sale and dividend interest expenses, brokerage fees, certain insurance costs, and nonroutine expenses or costs including, but not limited to, those relating to reorganizations, litigation, conducting shareholder meetings, and liquidations) do not exceed 0.56%, 0.60%, and 0.60% of average daily net assets of Delaware Tax-Free USA Fund, Delaware Tax-Free USA Intermediate Fund, and Delaware National High-Yield Municipal Bond Fund, respectively, from Sept. 1, 2014 through Aug. 31, 2015.1 For purposes of these waivers and reimbursements, nonroutine expenses may also include such additional costs and expenses, as may be agreed upon from time to time by the Boards and DMC. These expense waivers and reimbursements apply only to expenses paid directly by each Fund and may only be terminated by agreement of DMC and each Fund.
Effective Nov. 1, 2014, Delaware Investments Fund Services Company (DIFSC), an affiliate of DMC, provides fund accounting and financial administration oversight services to each Fund. Prior to this time, Delaware Service Company, Inc. (DSC), an affiliate of DMC, provided fund accounting and financial
102
Table of Contents
administration oversight services to each Fund under a substantially identical agreement with an identical fee schedule. For these services, DIFSC’s fees are calculated based on the aggregate daily net assets of the Delaware Investments® Family of Funds at the following annual rate: 0.0050% of the first $30 billion; 0.0045% of the next $10 billion; 0.0040% of the next $10 billion; and 0.0025% of aggregate average daily net assets in excess of $50 billion. The fees payable to DIFSC under the service agreement described above are allocated among all retail funds in the Delaware Investments Family of Funds on a relative net asset value basis. These amounts are included on the “Statements of operations” under “Accounting and Administration expenses.” For the year ended Aug. 31, 2015, each Fund was charged for these services as follows:
| Delaware Tax-Free USA Fund | Delaware Tax-Free USA Intermediate Fund | Delaware National High-Yield Municipal Bond Fund | ||||
| $27,096 | $35,773 | $40,711 | ||||
Effective Nov. 1, 2014, DIFSC also became the transfer agent and dividend disbursing agent of each Fund. Prior to this time, DSC was the transfer agent and dividend disbursing agent of each Fund under a substantially identical agreement with an identical fee schedule. For these services, DIFSC’s fees are calculated based on the aggregate daily net assets of the retail funds within the Delaware Investments Family of Funds at the following annual rate: 0.025% of the first $20 billion; 0.020% of the next $5 billion; 0.015% of the next $5 billion; and 0.013% on average daily net assets in excess of $30 billion. The fees payable to DIFSC under the service agreement described above are allocated among all retail Funds in the Delaware Investments Family of Funds on a relative net asset value basis. These amounts are included on the “Statements of operations” under “Dividend disbursing and transfer agent fees and expenses.” For the year ended Aug. 31, 2015, each Fund was charged for these services as follows:
| ||||||
| Delaware Tax-Free USA Fund | Delaware Tax-Free USA Intermediate Fund | Delaware National High-Yield Municipal Bond Fund | ||||
| $118,964 | $157,082 | $178,580 | ||||
Pursuant to a sub-transfer agency agreement between DIFSC and BNY Mellon Investment Servicing (US) Inc. (BNYMIS), BNYMIS provides certain sub-transfer agency services to each Fund. Sub-transfer agency fees are passed on to and paid by each Fund.
Pursuant to a distribution agreement and distribution plan, Delaware National High-Yield Municipal Bond Fund pays DDLP, the distributor and an affiliate of DMC, an annual distribution and service fee of 0.25% of the average daily net assets of the Class A shares. Each Fund pays 1.00% of the average daily net assets of the Class C shares for all the Funds. The Board for Delaware Tax-Free USA Fund has adopted a formula for calculating 12b-1 plan fees for the Fund’s Class A shares that went into effect on June 1, 1992. The Fund’s Class A shares are currently subject to a blended 12b-1 fee equal to the sum of: (1) 0.10% of average daily net assets representing shares acquired prior to June 1, 1992, and (2) 0.25% of average daily net assets representing shares acquired on or after June 1, 1992. All of the Fund’s Class A shareholders bear 12b-1 fees at the same rate, the blended rate, currently 0.24% of average daily net assets, based on the formula described above. This method of calculating Class A 12b-1 fees may be discontinued at the sole discretion of the Board. The Class A shares and Class B shares of Delaware Tax-Free USA Intermediate Fund were subject to a 12b-1 fee of 0.25% and 1.00%, respectively of average daily net assets, which were contractually waived to 0.15% of average daily net assets from Sept. 1, 2014 through Aug. 31, 2015.2 The Class B shares of Delaware Tax-Free USA
103
Table of Contents
Notes to financial statements
Delaware Investments® National Tax-Free Funds
2. Investment Management, Administration Agreements, and Other Transactions with Affiliates (continued)
Fund3 and National High-Yield Municipal Bond Fund4 were subject to a 12b-1 fee of 1.00% of average daily net assets which were contractually waived to 0.25% of average daily net assets from Sept. 1, 2014 through Sept. 25, 2014. Institutional Class shares pay no distribution and service expenses.
As provided in the investment management agreement, each Fund bears a portion of the cost of certain resources shared with DMC, including the cost of internal personnel of DMC and/or its affiliates that provide legal, tax, and regulatory reporting services to each Fund. These amounts are included on the “Statements of operations” under “Legal fees.” For the year ended Aug. 31, 2015, each Fund was charged for internal legal, tax, and regulatory reporting services provided by DMC and/or its affiliates’ employees as follows:
| Delaware Tax-Free USA Fund | Delaware Tax-Free USA Intermediate Fund | Delaware National High-Yield Municipal Bond Fund | ||||
| $14,891 | $19,666 | $21,947 | ||||
For the year ended Aug. 31, 2015, DDLP earned commissions on sales of Class A shares for each Fund as follows:
| ||||||
| Delaware Tax-Free USA Fund | Delaware Tax-Free USA Intermediate Fund | Delaware National High-Yield Municipal Bond Fund | ||||
| $25,308 | $9,137 | $72,460 | ||||
For the year ended Aug. 31, 2015, DDLP received gross CDSC commissions on redemptions of Delaware Tax-Free USA Fund and Delaware National High-Yield Municipal Bond Fund’s Class A and Class C shares. These commissions were entirely used to offset upfront commissions previously paid by DDLP to broker/dealers on sales of those shares. The amounts received were as follows:
| ||||||
| Delaware Tax-Free USA Fund | Delaware Tax-Free | Delaware National High-Yield Municipal Bond Fund | ||||
Class A | $ — | $ — | $16,204 | |||
Class C | 1,385 | 8,356 | 21,002 | |||
Trustees’ fees include expenses accrued by the Funds for each Trustee’s retainer and meeting fees. Certain officers of DMC, DIFSC, and DDLP are officers and/or Trustees of the Trusts. These officers and Trustees are paid no compensation by the Funds.
1The contractual waiver period is from Dec. 27, 2013, through Dec. 29, 2015.
2The contractual waiver period is from Dec. 27, 2013, through Dec. 29, 2015 for the Class A shares and March 1, 2013, through Sept. 25, 2014 for the Class B shares.
3The contractual waiver period was from May 1, 2013, through Sept. 25, 2014.
4The contractual waiver period was from Aug. 1, 2013, through Sept. 25, 2014.
104
Table of Contents
3. Investments
For the year ended Aug. 31, 2015, each Fund made purchases and sales of investment securities other than short-term investments as follows:
Delaware Tax-Free USA Fund | Delaware Tax-Free USA Intermediate Fund | Delaware National High-Yield Municipal Bond Fund | ||||
Purchases | $107,278,164 | $139,591,967 | $391,062,032 | |||
Sales | 90,288,667 | 150,779,677 | 80,330,970 |
At Aug. 31, 2015, the cost and unrealized appreciation (depreciation) of investments for federal income tax purposes for each Fund were as follows:
Delaware Tax-Free USA Fund | Delaware Tax-Free USA Intermediate Fund | Delaware National High-Yield Municipal Bond Fund | ||||
Cost of Investments | $514,192,168 | $661,741,340 | $911,686,868 | |||
Aggregate unrealized appreciation of investments | $ 48,562,773 | $ 41,269,179 | $ 49,498,431 | |||
Aggregate unrealized depreciation of investments | (1,849,546) | (1,804,275) | (4,080,950) | |||
Net unrealized appreciation of investments | $ 46,713,227 | $ 39,464,904 | $ 45,417,481 |
U.S. GAAP defines fair value as the price that each Fund would receive to sell an asset or pay to transfer a liability in an orderly transaction between market participants at the measurement date under current market conditions. A three-level hierarchy for fair value measurements has been established based upon the transparency of inputs to the valuation of an asset or liability. Inputs may be observable or unobservable and refer broadly to the assumptions that market participants would use in pricing the asset or liability. Observable inputs reflect the assumptions market participants would use in pricing the asset or liability based on market data obtained from sources independent of the reporting entity. Unobservable inputs reflect the reporting entity’s own assumptions about the assumptions that market participants would use in pricing the asset or liability based on the best information available under the circumstances. Each Fund’s investment in its entirety is assigned a level based upon the observability of the inputs which are significant to the overall valuation. The three-level hierarchy of inputs is summarized below.
| Level 1 – | Inputs are quoted prices in active markets for identical investments. (Examples: equity securities, open-end investment companies, futures contracts, exchange-traded options contracts) | |
| Level 2 – | Other observable inputs, including, but not limited to: quoted prices for similar assets or liabilities in markets that are active, quoted prices for identical or similar assets or liabilities in markets that are not active, inputs other than quoted prices that are observable for the assets or liabilities (such as interest rates, yield curves, volatilities, prepayment speeds, loss severities, credit risks, and default rates) or other market-corroborated inputs. (Examples: debt securities, government securities, swap contracts, foreign currency exchange contracts, | |
105
Table of Contents
Notes to financial statements
Delaware Investments® National Tax-Free Funds
3. Investments (continued)
| foreign securities utilizing international fair value pricing, broker-quoted securities, fair valued securities) | ||
| Level 3 – | Significant unobservable inputs, including each Fund’s own assumptions used to determine the fair value of investments. (Examples: broker-quoted securities, fair valued securities) | |
Level 3 investments are valued using significant unobservable inputs. Each Fund may also use an income-based valuation approach in which the anticipated future cash flows of the investment are discounted to calculate fair value. Discounts may also be applied due to the nature or duration of any restrictions on the disposition of the investments. Valuations may also be based upon current market prices of securities that are comparable in coupon, rating, maturity, and industry. The derived value of a Level 3 investment may not represent the value which is received upon disposition and this could impact the results of operations.
The following tables summarize the valuation of each Fund’s investments by fair value hierarchy levels as of Aug. 31, 2015:
Delaware Tax-Free USA Fund | |||||
Securities | Level 2 | ||||
Municipal Bonds | $552,910,395 | ||||
Short-Term Investments | 7,995,000 | ||||
Total Value of Securities | $560,905,395 | ||||
Delaware Tax-Free USA Intermediate Fund | |||||
Securities | Level 2 | ||||
Municipal Bonds | $695,131,244 | ||||
Short-Term Investments | 6,075,000 | ||||
Total Value of Securities | $701,206,244 | ||||
Delaware National High-Yield Municipal Bond Fund | |||||
Securities | Level 2 | ||||
Municipal Bonds | $947,809,349 | ||||
Short-Term Investments | 9,295,000 | ||||
Total Value of Securities | $957,104,349 | ||||
During the year ended Aug. 31, 2015, there were no transfers between Level 1 investments, Level 2 investments, or Level 3 investments that had a significant impact to each Fund. Each Fund’s policy is to recognize transfers between levels at the beginning of the reporting period.
A reconciliation of Level 3 investments is presented when a Fund has a significant amount of Level 3 investments at the beginning, interim, or end of the period in relation to net assets. At Aug. 31, 2015, there were no Level 3 investments.
106
Table of Contents
4. Dividend and Distribution Information
Income and long-term capital gain distributions are determined in accordance with federal income tax regulations, which may differ from U.S. GAAP. Additionally, distributions from net short-term gains on sales of investment securities are treated as ordinary income for federal income tax purposes. The tax character of dividends and distributions paid during the years ended Aug. 31, 2015 and 2014 was as follows:
| Delaware Tax-Free USA Fund | Delaware Tax-Free | Delaware National | |||||||||||||
Year ended 8/31/15 | |||||||||||||||
Tax-exempt income | $ | 20,604,908 | $ | 21,800,008 | $ | 33,237,798 | |||||||||
Ordinary income | 47,491 | 1,617 | 21,205 | ||||||||||||
|
|
|
|
|
| ||||||||||
Total | $ | 20,652,399 | $ | 21,801,625 | $ | 33,259,003 | |||||||||
|
|
|
|
|
| ||||||||||
Year ended 8/31/14 | |||||||||||||||
Tax-exempt income | $ | 21,320,935 | $ | 21,681,177 | $ | 23,619,057 | |||||||||
Ordinary income | 47,123 | 8,009 | 11,721 | ||||||||||||
|
|
|
|
|
| ||||||||||
Total | $ | 21,368,058 | $ | 21,689,186 | $ | 23,630,778 | |||||||||
|
|
|
|
|
| ||||||||||
5. Components of Net Assets on a Tax Basis
As of Aug. 31, 2015, the components of net assets on a tax basis were as follows:
| Delaware Tax-Free USA Fund | Delaware Tax-Free | Delaware National | |||||||||||||
Shares of beneficial interest | $ | 524,354,830 | $ | 674,509,027 | $ | 938,312,898 | |||||||||
Undistributed tax-exempt income | 623,826 | 619,367 | 1,048,209 | ||||||||||||
Distributions payable | (565,665 | ) | (585,202 | ) | (1,031,569 | ) | |||||||||
Capital loss carryforwards | (2,747,897 | ) | (6,904,092 | ) | (16,005,785 | ) | |||||||||
Unrealized appreciation of investments | 46,713,227 | 39,464,904 | 45,417,481 | ||||||||||||
|
|
|
|
|
| ||||||||||
Net assets | $ | 568,378,321 | $ | 707,104,004 | $ | 967,741,234 | |||||||||
|
|
|
|
|
| ||||||||||
The differences between book basis and tax basis components of net assets are primarily attributable to tax deferral of losses on wash sales and tax treatment of market discount and premium on debt instruments.
107
Table of Contents
Notes to financial statements
Delaware Investments® National Tax-Free Funds
5. Components of Net Assets on a Tax Basis (continued)
For financial reporting purposes, capital accounts are adjusted to reflect the tax character of permanent book/tax differences. Reclassifications are primarily due to tax treatment of expiring capital loss carryforwards and tax treatment of market discount and premium on certain debt instruments. Results of operations and net assets were not affected by these reclassifications. For the year ended Aug. 31, 2015, the Delaware National High-Yield Municipal Bond Fund recorded the following reclassifications:
Delaware National | |||||
Undistributed net investment income | $ | (194,106 | ) | ||
Accumulated net realized loss | 549,807 | ||||
Paid-in capital | (355,701 | ) | |||
For federal income tax purposes, capital loss carryforwards may be carried forward and applied against future capital gains. In 2015, $2,050,022 capital loss carryforwards was utilized for the Delaware Tax-Free USA Intermediate Fund and $355,701 capital loss carryforwards expired for the Delaware National High-Yield Municipal Bond Fund.
Capital loss carryforwards remaining at Aug. 31, 2015 will expire as follows:
Delaware Tax-Free | Delaware National High-Yield Municipal Bond Fund | ||||||||||||||
2017 | $5,428,954 | $374,735 | |||||||||||||
On Dec. 22, 2010, the Regulated Investment Company Modernization Act of 2010 (Act) was enacted, which changed various technical rules governing the tax treatment of regulated investment companies. The changes were generally effective for taxable years beginning after the date of enactment. Under the Act, the Funds are permitted to carry forward capital losses incurred in taxable years beginning after the date of enactment for an unlimited period. However, any losses incurred during those future taxable years will be required to be utilized prior to the losses incurred in pre-enactment taxable years, which carry an expiration date. As a result of this ordering rule, pre-enactment capital loss carryforwards may be more likely to expire unused. Additionally, post-enactment capital loss carryforwards will retain their character as either short-term or long-term capital losses rather than being considered all short-term as permitted under previous regulation.
Losses incurred that will be carried forward under the Act are as follows:
| Delaware Tax-Free USA Fund | Delaware Tax-Free | Delaware National High-Yield Municipal Bond Fund | |||||||||||||
Loss carryforward character: | |||||||||||||||
Short-term | $ 642,595 | $1,475,138 | $10,312,954 | ||||||||||||
Long-term | 2,105,302 | — | 5,318,096 | ||||||||||||
108
Table of Contents
6. Capital Shares
Transactions in capital shares were as follows:
| Delaware Tax-Free USA Fund | Delaware Tax-Free USA Intermediate Fund | Delaware National High-Yield Municipal Bond Fund | ||||||||||||||||||||||
Year ended |
Year ended |
Year ended | ||||||||||||||||||||||
| 8/31/15 | 8/31/14 | 8/31/15 | 8/31/14 | 8/31/15 | 8/31/14 | |||||||||||||||||||
Shares sold: | ||||||||||||||||||||||||
Class A | 6,206,129 | 1,789,524 | 4,103,827 | 5,895,384 | 8,439,793 | 7,971,429 | ||||||||||||||||||
Class B | — | 696 | — | 654 | — | 3 | ||||||||||||||||||
Class C | 354,520 | 189,460 | 524,181 | 545,377 | 2,799,793 | 1,870,701 | ||||||||||||||||||
Institutional Class | 1,448,572 | 1,205,280 | 13,835,733 | 19,954,492 | 32,549,643 | 28,345,725 | ||||||||||||||||||
Shares issued upon reinvestment of dividends and distributions: |
| |||||||||||||||||||||||
Class A | 1,321,485 | 1,427,570 | 418,517 | 717,349 | 615,419 | 728,826 | ||||||||||||||||||
Class B | 52 | 1,471 | 1 | 22 | 64 | 1,234 | ||||||||||||||||||
Class C | 59,534 | 66,935 | 77,051 | 90,506 | 198,834 | 205,676 | ||||||||||||||||||
Institutional Class | 70,685 | 44,454 | 684,213 | 424,564 | 1,768,432 | 952,319 | ||||||||||||||||||
|
|
|
|
|
|
|
|
|
|
|
| |||||||||||||
| 9,460,977 | 4,725,390 | 19,643,523 | 27,628,348 | 46,371,978 | 40,075,913 | |||||||||||||||||||
|
|
|
|
|
|
|
|
|
|
|
| |||||||||||||
Shares redeemed: | ||||||||||||||||||||||||
Class A | (6,951,366 | ) | (7,850,023 | ) | (9,663,549 | ) | (19,666,413 | ) | (7,179,403 | ) | (10,308,379 | ) | ||||||||||||
Class B | (20,585 | ) | (72,964 | ) | (413 | ) | (3,463 | ) | (20,948 | ) | (37,265 | ) | ||||||||||||
Class C | (285,827 | ) | (784,663 | ) | (1,030,063 | ) | (1,745,318 | ) | (1,231,191 | ) | (2,618,070 | ) | ||||||||||||
Institutional Class | (772,866 | ) | (715,016 | ) | (10,756,662 | ) | (15,560,640 | ) | (10,249,783 | ) | (10,503,939 | ) | ||||||||||||
|
|
|
|
|
|
|
|
|
|
|
| |||||||||||||
| (8,030,644 | ) | (9,422,666 | ) | (21,450,687 | ) | (36,975,834 | ) | (18,681,325 | ) | (23,467,653 | ) | |||||||||||||
|
|
|
|
|
|
|
|
|
|
|
| |||||||||||||
Net increase (decrease) | 1,430,333 | (4,697,276 | ) | (1,807,164 | ) | (9,347,486 | ) | 27,690,653 | 16,608,260 | |||||||||||||||
|
|
|
|
|
|
|
|
|
|
|
| |||||||||||||
109
Table of Contents
Notes to financial statements
Delaware Investments® National Tax-Free Funds
6. Capital Shares (continued)
For the year ended Aug. 31, 2015 and 2014, the following shares and values were converted from Class B to Class A. The respective amounts are included in Class B redemptions and Class A subscriptions in the tables on the previous page and the “Statements of changes in net assets.”
| Class B Shares | Year ended 8/31/15 Class A Shares | Value | Class B Shares | Year ended 8/31/14 Class A Shares | Value | |||||||||||||||||||
Delaware Tax-Free USA Fund | 2,096 | 2,095 | $24,893 | 20,225 | 20,230 | $230,817 | ||||||||||||||||||
Delaware Tax-Free USA Intermediate Fund | — | — | — | 33 | 33 | 385 | ||||||||||||||||||
Delaware National High-Yield Municipal Bond Fund | 3,664 | 3,672 | 39,175 | 12,965 | 13,002 | 130,078 | ||||||||||||||||||
Certain shareholders may exchange shares of one class for another class in the same Fund. For the years ended Aug. 31, 2015 and 2014, Delaware Tax-Free USA Fund and Delaware National High-Yield Municipal Bond Fund had the following exchange transactions. These exchange transactions are included as subscriptions and redemptions in the tables on the previous page and the “Statements of changes in net assets.”
Year ended 8/31/15 | ||||||||||||||||
| Exchange Redemptions | Exchange Subscriptions | |||||||||||||||
| Class A Shares | Class C Shares | Institutional Class Shares | Value | |||||||||||||
Delaware Tax-Free USA Intermediate Fund | 1,776 | 603 | 2,358 | $28,610 | ||||||||||||
Delaware National High-Yield Municipal Bond Fund | 1,758 | 5,032 | 6,750 | 73,457 | ||||||||||||
Year ended 8/31/14 | ||||||||||||
| Exchange Redemptions | Exchange Subscriptions | |||||||||||
| Class A Shares | Class Shares | Value | ||||||||||
Delaware Tax-Free USA Intermediate Fund | 2,372,246 | 2,349,034 | $28,798,947 | |||||||||
Delaware National High-Yield Municipal Bond Fund | 783 | 779 | 8,059 | |||||||||
110
Table of Contents
7. Line of Credit
Each Fund, along with certain other funds in the Delaware Investments® Family of Funds (Participants), was a participant in a $225,000,000 revolving line of credit to be used for temporary or emergency purposes as an additional source of liquidity to fund redemptions of investor shares. Under the agreement, the Participants were charged an annual commitment fee of 0.08%, which was allocated across the Participants on the basis of each Participant’s allocation of the entire facility. The Participants were permitted to borrow up to a maximum of one third of their net assets under the agreement. Each Participant was individually, and not jointly, liable for its particular advances, if any, under the line of credit. The line of credit under the agreement expired on Nov. 10, 2014.
On Nov. 10, 2014, each Fund, along with the other Participants, entered into an amendment to the agreement for a $275,000,000 revolving line of credit to be used as described above and operates in substantially the same manner as the original agreement. The line of credit available under the agreement expires on Nov. 9, 2015.
The Funds had no amounts outstanding as of Aug. 31, 2015 or at any time during the year then ended.
8. Geographic, Credit, and Market Risks
The Funds concentrate their investments in securities issued by municipalities, and may be subject to geographic concentration risk. In addition, the Funds have the flexibility to invest in issuers in U.S. territories and possessions such as the Commonwealth of Puerto Rico, the U.S. Virgin Islands, and Guam, whose bonds are also free of federal and individual state income taxes. The value of the Funds’ investments may be adversely affected by new legislation within the U.S. states or territories, regional or local economic conditions, and differing levels of supply and demand for municipal bonds. Many municipalities insure repayment for their obligations. Although bond insurance reduces the risk of loss due to default by an issuer, such bonds remain subject to the risk that value may fluctuate for other reasons and there is no certainty that the insurance company will meet its obligations. A real or perceived decline in creditworthiness of a bond insurer can have an adverse impact on the value of insured bonds held in each Fund. At Aug. 31, 2015, 1.55%, 3.47%, and 1.06% of Delaware Tax-Free USA Fund’s, Delaware Tax-Free USA Intermediate Fund’s, and Delaware National High-Yield Municipal Bond Fund’s net assets, respectively, were insured by bond insurers. These securities have been identified on the “Schedules of investments.”
As of Aug. 31, 2015, Delaware Tax-Free USA Fund invested in municipal bonds issued by the states of California, New York, and Texas which constituted approximately 13.61%, 19.13%, and 12.11%, respectively, of the Fund’s net assets. As of Aug. 31, 2015, Delaware Tax-Free USA Intermediate Fund invested in municipal bonds issued by the states of California, New York, and Texas, which constituted approximately 16.30%, 16.38%, and 10.92%, respectively, of the Fund’s net assets. As of Aug. 31, 2015, Delaware National High-Yield Municipal Bond Fund invested in municipal bonds issued by the states of California and New York which constituted approximately 13.51% and 10.83%, respectively, of the Fund’s net assets. These investments could make each Fund more sensitive to economic conditions in those states than other more geographically diversified national municipal income funds.
111
Table of Contents
Notes to financial statements
Delaware Investments® National Tax-Free Funds
8. Geographic, Credit, and Market Risks (continued)
Each Fund invests a portion of its assets in high yield fixed income securities, which are securities rated lower than BBB- by Standard & Poor’s Financial Services LLC (S&P) and lower than Baa3 by Moody’s Investors Service, Inc. (Moody’s), or similarly rated by another nationally recognized statistical rating organization. Investments in these higher yielding securities are generally accompanied by a greater degree of credit risk than higher rated securities. Additionally, lower rated securities may be more susceptible to adverse economic and competitive industry conditions than investment grade securities.
Each Fund invests in certain obligations that may have liquidity protection designed to ensure that the receipt of payments due on the underlying security is timely. Such protection may be provided through guarantees, insurance policies, or letters of credit obtained by the issuer or sponsor through third parties, through various means of structuring the transaction or through a combination of such approaches. Each Fund will not pay any additional fees for such credit support, although the existence of credit support may increase the price of a security.
The Funds may invest in advance refunded bonds, escrow secured bonds, or defeased bonds. Under current federal tax laws and regulations, state and local government borrowers are permitted to refinance outstanding bonds by issuing new bonds. The issuer refinances the outstanding debt to either reduce interest costs or to remove or alter restrictive covenants imposed by the bonds being refinanced. A refunding transaction where the municipal securities are being refunded within 90 days from the issuance of the refunding issue is known as a “current refunding.” “Advance refunded bonds” are bonds in which the refunded bond issue remains outstanding for more than 90 days following the issuance of the refunding issue. In an advance refunding, the issuer will use the proceeds of a new bond issue to purchase high grade interest bearing debt securities, which are then deposited in an irrevocable escrow account held by an escrow agent to secure all future payments of principal and interest and bond premium of the advance refunded bond. Bonds are “escrowed to maturity” when the proceeds of the refunding issue are deposited in an escrow account for investment sufficient to pay all of the principal and interest on the original interest payment and maturity dates.
Bonds are considered “pre-refunded” when the refunding issue’s proceeds are escrowed only until a permitted call date or dates on the refunded issue with the refunded issue being redeemed at the time, including any required premium. Bonds become “defeased” when the rights and interests of the bondholders and of their lien on the pledged revenues or other security under the terms of the bond contract are substituted with an alternative source of revenues (the escrow securities) sufficient to meet payments of principal and interest to maturity or to the first call dates. Escrowed secured bonds will often receive a rating of AAA from Moody’s, S&P, and/or Fitch Ratings due to the strong credit quality of the escrow securities and the irrevocable nature of the escrow deposit agreement.
Each Fund may invest up to 15% of its net assets in illiquid securities, which may include securities with contractual restrictions on resale, securities exempt from registration under Rule 144A of the Securities Act of 1933, as amended, and other securities which may not be readily marketable. The relative illiquidity of these securities may impair each Fund from disposing of them in a timely manner and at a fair price when it is necessary or desirable to do so. While maintaining oversight, the Boards have delegated to DMC, the day-to-day functions of determining whether individual securities are liquid for purposes of each Fund’s limitation on investments in illiquid securities. Securities eligible for resale
112
Table of Contents
pursuant to Rule 144A, which are determined to be liquid, are not subject to the Funds’ 15% limit on investments in illiquid securities. Rule 144A and illiquid securities held by each Fund have been identified on the “Schedules of investments.”
9. Contractual Obligations
The Funds enter into contracts in the normal course of business that contain a variety of indemnifications. The Funds’ maximum exposure under these arrangements is unknown. However, the Funds have not had prior claims or losses pursuant to these contracts. Management has reviewed the Funds’ existing contracts and expects the risk of loss to be remote.
10. Recent Accounting Pronouncements
In June 2014, the Financial Accounting Standards Board (FASB) issued guidance to improve the financial reporting of reverse repurchase agreements and other similar transactions. The guidance includes expanded disclosure requirements for entities that enter into reverse repurchase agreements and similar transactions accounted for as secured borrowings. The guidance is effective for financial statements with fiscal years beginning on or after Dec. 15, 2014 and interim periods within those fiscal years. Management has determined that this pronouncement has no impact to each Fund’s financial statements.
In May 2015, the FASB issued Accounting Standards Update (ASU) No. 2015-07 regarding “Disclosures for Investments in Certain Entities That Calculate Net Asset Value per Share”. The amendments in this update are effective for the Funds for fiscal years beginning after Dec. 15, 2015, and interim periods within those fiscal years. ASU 2015-07 will eliminate the requirement to categorize investments in the fair value hierarchy if their fair value is measured at net asset value (NAV) per share (or its equivalent) using the practical expedient in the FASB’s fair value measurement guidance. At this time, management is evaluating the implications of ASU No. 2015-07 and its impact on the financial statement disclosures has not yet been determined.
11. Subsequent Events
Management has determined that no material events or transactions occurred subsequent to Aug. 31, 2015 that would require recognition or disclosure in the Funds’ financial statements.
113
Table of Contents
Report of independent registered
public accounting firm
To the Board of Trustees of Delaware Group® Tax-Free Fund and Voyageur Mutual Funds and the Shareholders of Delaware Tax-Free USA Fund, Delaware Tax-Free USA Intermediate Fund and Delaware National High-Yield Municipal Bond Fund:
In our opinion, the accompanying statements of assets and liabilities, including the schedules of investments, and the related statements of operations and of changes in net assets and the financial highlights present fairly, in all material respects, the financial position of Delaware Tax-Free USA Fund and Delaware Tax-Free USA Intermediate Fund (constituting Delaware Group® Tax-Free Fund) and Delaware National High-Yield Municipal Bond Fund (one of the series constituting Voyageur Mutual Funds) (hereafter collectively referred to as the “Funds”) at August 31, 2015, the results of each of their operations for the year then ended, the changes in each of their net assets for each of the two years in the period then ended and the financial highlights for each of the five years in the period then ended, in conformity with accounting principles generally accepted in the United States of America. These financial statements and financial highlights (hereafter referred to as “financial statements”) are the responsibility of the Funds’ management. Our responsibility is to express an opinion on these financial statements based on our audits. We conducted our audits of these financial statements in accordance with the standards of the Public Company Accounting Oversight Board (United States). Those standards require that we plan and perform the audit to obtain reasonable assurance about whether the financial statements are free of material misstatement. An audit includes examining, on a test basis, evidence supporting the amounts and disclosures in the financial statements, assessing the accounting principles used and significant estimates made by management, and evaluating the overall financial statement presentation. We believe that our audits, which included confirmation of securities at August 31, 2015 by correspondence with the custodian and brokers, provide a reasonable basis for our opinion.
PricewaterhouseCoopers LLP
Philadelphia, Pennsylvania
October 22, 2015
114
Table of Contents
Other Fund information (Unaudited)
Delaware Investments® National Tax-Free Funds
Tax Information
The information set forth below is for each Fund’s fiscal year as required by federal income tax laws. Shareholders, however, must report distributions on a calendar year basis for income tax purposes, which may include distributions for portions of two fiscal years of a fund. Accordingly, the information needed by shareholders for income tax purposes will be sent to them in January of each year. Please consult your tax advisor for proper treatment of this information.
All disclosures are based on financial information available as of the date of this annual report and, accordingly are subject to change. For any and all items requiring reporting, it is the intention of each Fund to report the maximum amount permitted under the Internal Revenue Code and the regulations thereunder.
For the fiscal year ended Aug. 31, 2015, each Fund reports distributions paid during the year as follows:
| (A) Ordinary Income Distributions (Tax Basis)* | (B) Tax-Exempt Distributions (Tax Basis) | Total Distributions (Tax Basis) | ||||||||||
Delaware Tax-Free USA Fund | 0.23% | 99.77% | 100.00% | |||||||||
Delaware Tax-Free USA Intermediate Fund | 0.01% | 99.99% | 100.00% | |||||||||
Delaware National High-Yield Municipal Bond Fund | 0.06% | 99.94% | 100.00% | |||||||||
(A) and (B) are based on a percentage of each Fund’s total distributions.
For the fiscal year ended Aug. 31, 2015, certain interest income paid by the Funds, have been determined to be Qualified Interest Income and may be subject to relief from U.S. withholding for foreign shareholders, as provided by the American Jobs Creation Act of 2004, and as extended by the Tax Relief, Unemployment Insurance Reauthorization and Jobs Creation Act of 2010, and as extended by the American Taxpayer Relief Act of 2012. For the fiscal year ended Aug. 31, 2015, the Funds have reported maximum distributions of Qualified Interest Income as follows:
Delaware Tax-Free USA Fund | $ | 47,491 | ||
Delaware National High-Yield Municipal Bond Fund | 21,205 |
115
Table of Contents
Other Fund information (Unaudited)
Delaware Investments® National Tax-Free Funds
Proxy Results
At Joint Special Meetings of Shareholders of Delaware Group® Tax-Free Fund, on behalf of Delaware Tax-Free USA Fund and Delaware Tax-Free USA Intermediate Fund, held on March 31, 2015, and at Joint Special Meetings of Shareholders of Voyageur Mutual Funds on behalf of Delaware Minnesota High-Yield Municipal Bond Fund, Delaware National High-Yield Municipal Bond Fund, Delaware Tax-Free California Fund, Delaware Tax-Free Idaho Fund, and Delaware Tax-Free New York Fund, held on March 31, 2015 and reconvened to April 21, 2015, May 12, 2015, and June 2, 2015 for the proposals listed in items (ii) and (iii) below for Delaware Minnesota High-Yield Municipal Bond Fund (Delaware Tax-Free USA Fund, Delaware Tax-Free USA Intermediate Fund, and Delaware National High-Yield Municipal Bond Fund, each a “Fund” and together the “Funds,” and Delaware Group Tax-Free Fund and Voyageur Mutual Funds, each a “Trust” and together the “Trusts”), the shareholders of each Trust/each Fund voted to: (i) elect a Board of Trustees for each Trust; (ii) approve the implementation of a new “manager of managers” order for the Funds; (iii) revise the fundamental investment restriction relating to lending for the Funds; and (iv)(a) revise provisions of each Trust’s Agreement and Declaration of Trust related to documenting the transfer of shares, (iv)(b) revise provisions of each Trust’s Agreement and Declaration of Trust related to shareholder disclosure of certain information upon board demand, and (iv)(c) revise provisions of each Trust’s By-Laws so that Delaware law will apply to matters related to proxies. At the meeting, the following people were elected to serve as Independent Trustees: Thomas L. Bennett, Ann D. Borowiec, Joseph W. Chow, John A. Fry, Lucinda S. Landreth, Frances A. Sevilla-Sacasa, Thomas K. Whitford, Janet L. Yeomans, and J. Richard Zecher. In addition, Patrick P. Coyne was elected to serve as an Interested Trustee.
The following proposals were submitted for a vote of the shareholders:
1. To elect a Board of Trustees for each Trust.
A quorum of shares outstanding of the Funds of each Trust was present, and the votes passed with a plurality of these Shares.
Delaware Group Tax-Free Fund
Shares Voted For | % of Outstanding Shares | % of Shares Voted | Shares Withheld | % of Outstanding Shares | % of Shares Voted | |||||||||||||||||||
Thomas L. Bennett | 66,978,124.700 | 61.814% | 98.538 | % | 993,583.127 | 0.917% | 1.462 | % | ||||||||||||||||
Ann D. Borowiec | 66,988,238.238 | 61.823% | 98.553 | % | 983,469.589 | 0.908% | 1.447 | % | ||||||||||||||||
Joseph W. Chow | 66,993,995.601 | 61.829% | 98.562 | % | 977,712.226 | 0.902% | 1.438 | % | ||||||||||||||||
Patrick P. Coyne | 66,967,885.587 | 61.805% | 98.523 | % | 1,003,822.240 | 0.926% | 1.477 | % | ||||||||||||||||
John A. Fry | 67,005,857.300 | 61.840% | 98.579 | % | 965,850.527 | 0.891% | 1.421 | % | ||||||||||||||||
Lucinda S. Landreth | 66,958,398.403 | 61.796% | 98.509 | % | 1,013,309.424 | 0.935% | 1.491 | % | ||||||||||||||||
Frances A. Sevilla-Sacasa | 66,998,752.221 | 61.833% | 98.569 | % | 972,955.606 | 0.898% | 1.431 | % | ||||||||||||||||
Thomas K. Whitford | 67,007,171.909 | 61.841% | 98.581 | % | 964,535.918 | 0.890% | 1.419 | % | ||||||||||||||||
Janet L. Yeomans | 66,998,923.984 | 61.833% | 98.569 | % | 972,783.843 | 0.898% | 1.431 | % | ||||||||||||||||
J. Richard Zecher | 66,839,037.989 | 61.686% | 98.334 | % | 1,132,669.838 | 1.045% | 1.666 | % | ||||||||||||||||
116
Table of Contents
Voyageur Mutual Funds
Shares Voted For | % of Outstanding Shares | % of Shares Voted | Shares Withheld | % of Outstanding Shares | % of Shares Voted | |||||||||||||||||||
Thomas L. Bennett | 77,276,795.607 | 65.123% | 98.335 | % | 1,308,193.317 | 1.102% | 1.665 | % | ||||||||||||||||
Ann D. Borowiec | 77,397,915.799 | 65.225% | 98.489 | % | 1,187,073.125 | 1.000% | 1.511 | % | ||||||||||||||||
Joseph W. Chow | 77,285,371.301 | 65.130% | 98.346 | % | 1,299,617.623 | 1.095% | 1.654 | % | ||||||||||||||||
Patrick P. Coyne | 77,395,165.343 | 65.222% | 98.486 | % | 1,189,823.581 | 1.003% | 1.514 | % | ||||||||||||||||
John A. Fry | 77,394,790.343 | 65.222% | 98.485 | % | 1,190,198.581 | 1.003% | 1.515 | % | ||||||||||||||||
Lucinda S. Landreth | 77,370,351.799 | 65.202% | 98.454 | % | 1,214,637.125 | 1.024% | 1.546 | % | ||||||||||||||||
Frances A. Sevilla-Sacasa | 77,375,937.301 | 65.206% | 98.461 | % | 1,209,051.623 | 1.019% | 1.539 | % | ||||||||||||||||
Thomas K. Whitford | 77,381,528.607 | 65.211% | 98.469 | % | 1,203,460.317 | 1.014% | 1.531 | % | ||||||||||||||||
Janet L. Yeomans | 77,362,190.845 | 65.195% | 98.444 | % | 1,222,798.079 | 1.030% | 1.556 | % | ||||||||||||||||
J. Richard Zecher | 77,388,843.343 | 65.217% | 98.478 | % | 1,196,145.581 | 1.008% | 1.522 | % | ||||||||||||||||
2. To approve the implementation of a new “manager of managers” order.
A quorum of the shares outstanding of each Fund was present, and the votes passed with the required majority of those shares. The results were as follows:
Delaware Tax-Free USA Fund
Shares voted for | 22,047,241.250 | |||
Percentage of outstanding shares | 47.426 | % | ||
Percentage of shares voted | 75.425 | % | ||
Shares voted against | 815,221.535 | |||
Percentage of outstanding shares | 1.754 | % | ||
Percentage of shares voted | 2.789 | % | ||
Shares abstained | 849,430.098 | |||
Percentage of outstanding shares | 1.827 | % | ||
Percentage of shares voted | 2.906 | % | ||
Broker non-votes | 5,518,809.900 |
117
Table of Contents
Other Fund information (Unaudited)
Delaware Investments® National Tax-Free Funds
Proxy Results (continued)
Delaware Tax-Free USA Intermediate Fund
Shares voted for | 28,369,805.953 | |||
Percentage of outstanding shares | 45.856 | % | ||
Percentage of shares voted | 73.229 | % | ||
Shares voted against | 320,394.064 | |||
Percentage of outstanding shares | 0.518 | % | ||
Percentage of shares voted | 0.827 | % | ||
Shares abstained | 461,187.027 | |||
Percentage of outstanding shares | 0.745 | % | ||
Percentage of shares voted | 1.190 | % | ||
Broker non-votes | 9,589,618.000 |
Delaware National High-Yield Municipal Bond Fund
Shares voted for | 39,246,189.802 | |||
Percentage of outstanding shares | 49.576 | % | ||
Percentage of shares voted | 69.433 | % | ||
Shares voted against | 820,119.825 | |||
Percentage of outstanding shares | 1.036 | % | ||
Percentage of shares voted | 1.451 | % | ||
Shares abstained | 495,641.534 | |||
Percentage of outstanding shares | 0.626 | % | ||
Percentage of shares voted | 0.877 | % | ||
Broker non-votes | 15,961,488.000 |
3. To revise the fundamental investment restriction relating to lending.
A quorum of the shares outstanding of each Fund was present, and the votes passed with the required majority of those shares. The results were as follows:
Delaware Tax-Free USA Fund
Shares voted for | 21,834,498.229 | |||
Percentage of outstanding shares | 46.969 | % | ||
Percentage of shares voted | 74.697 | % | ||
Shares voted against | 980,998.874 | |||
Percentage of outstanding shares | 2.110 | % | ||
Percentage of shares voted | 3.356 | % | ||
Shares abstained | 896,393.780 | |||
Percentage of outstanding shares | 1.928 | % | ||
Percentage of shares voted | 3.067 | % | ||
Broker non-votes | 5,518,811.900 |
118
Table of Contents
Delaware Tax-Free USA Intermediate Fund
Shares voted for | 28,295,849.770 | |||
Percentage of outstanding shares | 45.737 | % | ||
Percentage of shares voted | 73.039 | % | ||
Shares voted against | 394,359.913 | |||
Percentage of outstanding shares | 0.637 | % | ||
Percentage of shares voted | 1.018 | % | ||
Shares abstained | 461,175.361 | |||
Percentage of outstanding shares | 0.745 | % | ||
Percentage of shares voted | 1.190 | % | ||
Broker non-votes | 9,589,620.000 |
Delaware National High-Yield Municipal Bond Fund
Shares voted for | 39,239,573.984 | |||
Percentage of outstanding shares | 49.567 | % | ||
Percentage of shares voted | 69.422 | % | ||
Shares voted against | 843,759.270 | |||
Percentage of outstanding shares | 1.066 | % | ||
Percentage of shares voted | 1.493 | % | ||
Shares abstained | 478,613.907 | |||
Percentage of outstanding shares | 0.605 | % | ||
Percentage of shares voted | 0.847 | % | ||
Broker non-votes | 15,961,492.000 |
4. (a) To revise provisions of each Trust’s Agreement and Declaration of Trust related to documenting the transfer of shares.
A quorum of the shares outstanding of each Trust was present, and the votes passed with a majority of those shares. The results were as follows:
Delaware Group® Tax-Free Fund
Shares voted for | 50,456,139.231 | |||
Percentage of outstanding shares | 46.566 | % | ||
Percentage of shares voted | 74.231 | % | ||
Shares voted against | 1,006,109.546 | |||
Percentage of outstanding shares | 0.929 | % | ||
Percentage of shares voted | 1.480 | % | ||
Shares abstained | 1,401,034.150 | |||
Percentage of outstanding shares | 1.293 | % | ||
Percentage of shares voted | 2.061 | % | ||
Broker non-votes | 15,108,424.900 |
119
Table of Contents
Other Fund information (Unaudited)
Delaware Investments® National Tax-Free Funds
Proxy Results (continued)
Voyageur Mutual Funds
Shares voted for | 53,350,588.915 | |||
Percentage of outstanding shares | 44.960 | % | ||
Percentage of shares voted | 67.889 | % | ||
Shares voted against | 1,291,148.802 | |||
Percentage of outstanding shares | 1.088 | % | ||
Percentage of shares voted | 1.643 | % | ||
Shares abstained | 1,136,878.207 | |||
Percentage of outstanding shares | 0.958 | % | ||
Percentage of shares voted | 1.447 | % | ||
Broker non-votes | 22,806,373.000 |
4. (b) To revise provisions of each Trust’s Agreement and Declaration of Trust related to shareholder disclosure of certain information upon board demand.
A quorum of the shares outstanding of each Trust was present, and the votes passed with a majority of those shares. The results were as follows:
Delaware Group Tax-Free Fund
Shares voted for | 50,367,471.364 | |||
Percentage of outstanding shares | 46.484 | % | ||
Percentage of shares voted | 74.101 | % | ||
Shares voted against | 994,649.483 | |||
Percentage of outstanding shares | 0.918 | % | ||
Percentage of shares voted | 1.463 | % | ||
Shares abstained | 1,501,157.080 | |||
Percentage of outstanding shares | 1.385 | % | ||
Percentage of shares voted | 2.209 | % | ||
Broker non-votes | 15,108,429.900 |
Voyageur Mutual Funds
Shares voted for | 53,435,861.658 | |||
Percentage of outstanding shares | 45.031 | % | ||
Percentage of shares voted | 67.998 | % | ||
Shares voted against | 1,312,655.329 | |||
Percentage of outstanding shares | 1.106 | % | ||
Percentage of shares voted | 1.670 | % | ||
Shares abstained | 1,030,092.937 | |||
Percentage of outstanding shares | 0.868 | % | ||
Percentage of shares voted | 1.311 | % | ||
Broker non-votes | 22,806,379.000 |
120
Table of Contents
4. (c) To revise provisions of each Trust’s By-Laws so that Delaware law will apply to matters related to proxies.
A quorum of the shares outstanding of each Trust was present, and the votes passed with a majority of those shares. The results were as follows:
Delaware Group® Tax-Free Fund
Shares voted for | 50,734,411.134 | |||
Percentage of outstanding shares | 46.823 | % | ||
Percentage of shares voted | 74.640 | % | ||
Shares voted against | 702,650.318 | |||
Percentage of outstanding shares | 0.648 | % | ||
Percentage of shares voted | 1.034 | % | ||
Shares abstained | 1,426,224.475 | |||
Percentage of outstanding shares | 1.316 | % | ||
Percentage of shares voted | 2.098 | % | ||
Broker non-votes | 15,108,421.900 |
Voyageur Mutual Funds
Shares voted for | 54,268,750.116 | |||
Percentage of outstanding shares | 45.733 | % | ||
Percentage of shares voted | 69.057 | % | ||
Shares voted against | 486,387.431 | |||
Percentage of outstanding shares | 0.410 | % | ||
Percentage of shares voted | 0.619 | % | ||
Shares abstained | 1,023,482.377 | |||
Percentage of outstanding shares | 0.863 | % | ||
Percentage of shares voted | 1.302 | % | ||
Broker non-votes | 22,806,369.000 |
121
Table of Contents
Other Fund information (Unaudited)
Delaware Investments® National Tax-Free Funds
Board Consideration of Delaware National High-Yield Municipal Bond Fund, Delaware Tax-Free USA Fund, and Delaware Tax-Free USA Intermediate Fund Investment Management Agreements
At a meeting held on Aug. 18-20, 2015 (the “Annual Meeting”), the Boards of Trustees (collectively referred to here as the “Board”), including a majority of disinterested or independent Trustees, approved the renewal of the Investment Advisory Agreements for Delaware National High-Yield Municipal Bond Fund, Delaware Tax-Free USA Fund, and Delaware Tax-Free USA Intermediate Fund (each, a “Fund” and together, the “Funds”). In making its decision, the Board considered information furnished at regular quarterly Board meetings, including reports detailing Fund performance, investment strategies and expenses, as well as information prepared specifically in connection with the renewal of the investment advisory and sub-advisory contracts. Information furnished specifically in connection with the renewal of the Investment Management Agreements with Delaware Management Company (“DMC”) included materials provided by DMC and its affiliates (“Delaware Investments”) concerning, among other things, the nature, extent, and quality of services provided to the Funds; the costs of such services to the Funds; economies of scale; and the investment manager’s financial condition and profitability. In addition, in connection with the Annual Meeting, reports were provided to the Trustees in May 2015 and included reports provided by Lipper, Inc., an independent statistical compilation organization (“Lipper”). The Lipper reports compared each Fund’s investment performance and expenses with those of other comparable mutual funds. The Independent Trustees reviewed and discussed the Lipper reports with independent legal counsel to the Independent Trustees. In addition to the information noted above, the Board also requested and received information regarding DMC’s policy with respect to advisory fee levels and its breakpoint philosophy; the structure of portfolio manager compensation; comparative client fee information; and any constraints or limitations on the availability of securities for certain investment styles, which had in the past year inhibited, or which were likely in the future to inhibit, the investment manager’s ability to invest fully in accordance with Fund policies.
In considering information relating to the approval of each Fund’s advisory agreement, the Independent Trustees received assistance and advice from and met separately with independent legal counsel to the Independent Trustees. They also engaged a consultant to assist them in analyzing portions of the data presented and received. The Independent Trustees reviewed and discussed with the consultant two reports prepared by the consultant with respect to such data. Although the Board gave attention to all information furnished, the following discussion identifies, under separate headings, the primary factors taken into account by the Board during its contract renewal considerations.
Nature, Extent, and Quality of Service. The Board considered the services provided by DMC to each Fund and its shareholders. In reviewing the nature, extent, and quality of services, the Board considered reports furnished to it throughout the year, which covered matters such as the relative performance of the Funds; compliance of portfolio managers with the investment policies, strategies, and restrictions for the Funds; compliance by DMC and Delaware Distributors, L.P. (together, “Management”) personnel with the Code of Ethics adopted throughout the Delaware Investments® Family of Funds complex; and adherence to fair value pricing procedures as established by the Board. The Board was pleased with the current staffing of the Funds’ investment advisor and the emphasis placed on research in the investment process. The Board recognized DMC’s receipt of several industry distinctions during the past several years. The Board gave favorable consideration to DMC’s efforts to control expenditures while maintaining service levels committed to fund matters. The Board noted that, in the third and fourth
122
Table of Contents
quarters of 2013, Management reduced the maximum 12b-1 fee for certain funds, and in November 2013 Management negotiated a substantial reduction in fees for fund accounting services provided to the Funds. The Board noted the benefits provided to Fund shareholders through each shareholder’s ability to exchange an investment in one Delaware Investments® fund for the same class of shares in another Delaware Investments fund without a sales charge, to reinvest Fund dividends into additional shares of the Fund or into additional shares of other Delaware Investments funds, and the privilege to combine holdings in other Delaware Investments funds to obtain a reduced sales charge. The Board was satisfied with the nature, extent, and quality of the overall services provided by DMC.
Investment Performance. The Board placed significant emphasis on the investment performance of the Funds in view of the importance of investment performance to shareholders. Although the Board gave appropriate consideration to performance reports and discussions with portfolio managers at Investment Committee meetings throughout the year, the Board gave particular weight to the Lipper reports furnished for the Annual Meeting. The Lipper reports prepared for each Fund showed the investment performance of its Class A shares in comparison to a group of similar funds as selected by Lipper (the “Performance Universe”). A fund with the best performance ranked first, and a fund with the poorest performance ranked last. The highest/best performing 25% of funds in the Performance Universe make up the first quartile; the next 25%, the second quartile; the next 25%, the third quartile; and the poorest/ worst performing 25% of funds in the Performance Universe make up the fourth quartile. Comparative annualized performance for each Fund was shown for the past 1-, 3-, 5-, and 10-year periods, to the extent applicable, ended March 31, 2015. The Board’s objective is that each Fund’s performance for the periods considered be at or above the median of its Performance Universe.
Delaware National High-Yield Municipal Bond Fund – The Performance Universe for the Fund consisted of the Fund and all retail and institutional high yield municipal debt funds as selected by Lipper. The Lipper report comparison showed that the Fund’s total return for the 1-, 3-, 5-, and 10-year periods was in the first quartile of its Performance Universe. The Board was satisfied with performance.
Delaware Tax-Free USA Fund – The Performance Universe for the Fund consisted of the Fund and all retail and institutional general and insured municipal debt funds as selected by Lipper. The Lipper report comparison showed that the Fund’s total return for the 1- and 3-year periods was in the second quartile of its Performance Universe. The report further showed that the Fund’s total return for the 5- and 10-year periods was in the first quartile of its Performance Universe. The Board was satisfied with performance.
Delaware Tax-Free USA Intermediate Fund – The Performance Universe for the Fund consisted of the Fund and all retail and institutional intermediate municipal debt funds as selected by Lipper. The Lipper report comparison showed that the Fund’s total return for the 1-, 3-, 5-, and 10-year periods was in the second quartile of its Performance Universe. The Board was satisfied with performance.
Comparative Expenses. The Board considered expense comparison data for the Delaware Investments® Family of Funds. Management provided the Board with information on pricing levels and fee structures for each Fund as of its most recently completed fiscal year. The Board also focused on the comparative analysis of effective management fees and total expense ratios of each Fund versus effective management fees and expense ratios of a group of similar funds as selected by Lipper (the “Expense Group”). In reviewing comparative costs, each Fund’s contractual management fee and the actual management fee incurred by the Fund were compared with the contractual management fees
123
Table of Contents
Other Fund information (Unaudited)
Delaware Investments® National Tax-Free Funds
Board Consideration of Delaware National High-Yield Municipal Bond Fund, Delaware Tax-Free USA Fund, and Delaware Tax-Free USA Intermediate Fund Investment Management Agreements (continued)
(assuming all funds in the Expense Group were similar in size to the Fund) and actual management fees (as reported by each fund) within the Expense Group, taking into account any applicable breakpoints and fee waivers. Each Fund’s total expenses were also compared with those of its Expense Group. The Lipper total expenses, for comparative consistency, were shown by Lipper for Class A shares and comparative total expenses including 12b-1 and non 12b-1 service fees. The Board considered fees paid to DMC for non-management services. The Board’s objective is to limit each Fund’s total expense ratio to be competitive with that of the Expense Group.
Delaware National High-Yield Municipal Bond Fund – The expense comparisons for the Fund showed that its actual management fee was in the quartile with the lowest expenses of its Expense Group and its total expenses were in the quartile with the second lowest expenses of its Expense Group. The Board was satisfied with the management fee and total expenses of the Fund in comparison to those of its Expense Group as shown in the Lipper report.
Delaware Tax-Free USA Fund – The expense comparisons for the Fund showed that its actual management fee was in the quartile with the lowest expenses of its Expense Group and its total expenses were in the quartile with the second lowest expenses of its Expense Group. The Board was satisfied with the management fee and total expenses of the Fund in comparison to those of its Expense Group as shown in the Lipper report.
Delaware Tax-Free USA Intermediate Fund – The expense comparisons for the Fund showed that its actual management fee was in the quartile with the second highest expenses of its Expense Group and its total expenses were in the quartile with the lowest expenses of its Expense Group. The Board was satisfied with the total expenses of the Fund in comparison to those of its Expense Group as shown in the Lipper report.
Management Profitability. The Board considered the level of profits realized by DMC in connection with the operation of the Funds. In this respect, the Board reviewed the Investment Management Profitability Analysis that addressed the overall profitability of DMC’s business in providing management and other services to each of the individual funds and the Delaware Investments® Family of Funds as a whole. Specific attention was given to the methodology followed in allocating costs for the purpose of determining profitability. Management stated that the level of profits of DMC, to a certain extent, reflects recent operational cost savings and efficiencies initiated by DMC. The Board considered DMC’s efforts to improve services provided to fund shareholders and to meet additional regulatory and compliance requirements resulting from recent industry-wide Securities and Exchange Commission initiatives. The Board also considered the extent to which DMC might derive ancillary benefits from fund operations, including the potential for procuring additional business as a result of the prestige and visibility associated with its role as service provider to the Delaware Investments Family of Funds and the benefits from allocation of fund brokerage to improve trading efficiencies. The Board found that the management fees were reasonable in light of the services rendered and the level of profitability of DMC.
124
Table of Contents
Economies of Scale. The Trustees considered whether economies of scale are realized by DMC as each Fund’s assets increase and the extent to which any economies of scale are reflected in the level of management fees charged. The Trustees reviewed the standardized advisory fee pricing and structure, approved by the Board and shareholders, which includes breakpoints, and which applies to most funds in the Delaware Investments® Family of Funds complex. Breakpoints in the advisory fee occur when the advisory fee rate is reduced on assets in excess of specified levels. Breakpoints result in a lower advisory fee, than would otherwise be the case in the absence of breakpoints, when the asset levels specified in the breakpoints are exceeded. The Board noted that the fee under each Fund’s management contract fell within the standard structure. The Board also noted that each Fund’s assets exceeded the first breakpoint level. The Board believed that, given the extent to which economies of scale might be realized by the advisor and its affiliates, the schedule of fees under each Fund’s Investment Management Agreement provides a sharing of benefits with the Fund and its shareholders.
125
Table of Contents
Board of trustees / directors and officers addendum
Delaware Investments® Family of Funds
A mutual fund is governed by a Board of Trustees/Directors (“Trustees”), which has oversight responsibility for the management of a fund’s business affairs. Trustees establish procedures and oversee and review the performance of the investment manager, the distributor, and others who perform services for the fund. The independent fund trustees, in particular, are advocates
Name, Address, and Birth Date | Position(s) Held with Fund(s) | Length of Time Served | ||||
Interested Trustee
| ||||||
| Shawn K. Lytle1 | President, | Trustee since | ||||
| 2005 Market Street | Chief Executive Officer, | September 1, 2015 | ||||
| Philadelphia, PA 19103 | and Trustee | |||||
| February 1970 | President and | |||||
| Chief Executive Officer | ||||||
since August 20, 2015
| ||||||
Independent Trustees
| ||||||
| Thomas L. Bennett | Chairman and Trustee | Trustee since | ||||
| 2005 Market Street | March 2005 | |||||
| Philadelphia, PA 19103 | ||||||
| October 1947 | Chairman since | |||||
March 1, 2015
| ||||||
| Ann D. Borowiec | Trustee | Since March 31, 2015 | ||||
| 2005 Market Street | ||||||
| Philadelphia, PA 19103 | ||||||
November 1958
| ||||||
| Joseph W. Chow | Trustee | Since January 2013 | ||||
| 2005 Market Street | ||||||
| Philadelphia, PA 19103 | ||||||
January 1953
|
| 1 | Shawn K. Lytle is considered to be an “Interested Trustee” because he is an executive officer of the Fund’s(s’) investment advisor. |
126
Table of Contents
for shareholder interests. Each trustee has served in that capacity since he or she was elected to or appointed to the Board of Trustees, and will continue to serve until his or her retirement or the election of a new trustee in his or her place. The following is a list of the Trustees and Officers with certain background and related information.
| Principal Occupation(s) During the Past Five Years | Number of Portfolios in Fund Complex Overseen by Trustee or Officer | Other Directorships Held by Trustee or Officer | ||
| Shawn K. Lytle has served as | 64 | Trustee — UBS | ||
| President of | Relationship Funds, | |||
| Delaware Investments2 | SMA Relationship | |||
| since June 2015 and was the | Trust, and UBS Funds | |||
| Regional Head of Americas for | (May 2010–April 2015) | |||
| UBS Global Asset | ||||
| Management from | ||||
| 2010 through 2015. | ||||
| Private Investor | 64 | Director — | ||
| (March 2004–Present) | Bryn Mawr Bank Corp. (BMTC) | |||
(2007–2011)
| ||||
| Chief Executive Officer | 64 | None | ||
| Private Wealth Management | ||||
| (2011–2013) and | ||||
| Market Manager, | ||||
| New Jersey Private | ||||
| Bank (2005–2011) – | ||||
J.P. Morgan Chase & Co.
| ||||
| Executive Vice President | 64 | Director and Audit Committee | ||
| (Emerging Economies | Member — Hercules | |||
| Strategies, Risks, and | Technology Growth | |||
| Corporate Administration) | Capital, Inc. | |||
| State Street Corporation | (2004–2014) | |||
(July 2004–March 2011)
| ||||
| 2 | Delaware Investments is the marketing name for Delaware Management Holdings, Inc. and its subsidiaries, including the Fund’s(s’) investment advisor, principal underwriter, and its transfer agent. |
127
Table of Contents
Board of trustees / directors and officers addendum
Delaware Investments® Family of Funds
| Name, Address, and Birth Date | Position(s) Held with Fund(s) | Length of Time Served | ||||
Independent Trustees (continued)
| ||||||
| John A. Fry | Trustee | Since January 2001 | ||||
| 2005 Market Street | ||||||
| Philadelphia, PA 19103 | ||||||
May 1960
| ||||||
| Lucinda S. Landreth | Trustee | Since March 2005 | ||||
| 2005 Market Street | ||||||
| Philadelphia, PA 19103 | ||||||
June 1947
| ||||||
| Frances A. Sevilla-Sacasa | Trustee | Since September 2011 | ||||
| 2005 Market Street | ||||||
| Philadelphia, PA 19103 | ||||||
January 1956
|
128
Table of Contents
| Principal Occupation(s) During the Past Five Years | Number of Portfolios in Fund Complex Overseen by Trustee or Officer | Other Directorships Held by Trustee or Officer | ||
| President — | 64 | Director — Hershey Trust | ||
| Drexel University | Company | |||
| (August 2010–Present) | ||||
| Director, Audit Committee, | ||||
| President — | and Governance Committee | |||
| Franklin & Marshall College | Member — Community | |||
| (July 2002–July 2010) | Health Systems | |||
Director — Drexel | ||||
| Morgan & Co.
| ||||
| Private Investor | 64 | None | ||
(2004–Present)
| ||||
| Chief Executive Officer — | 64 | Trust Manager and | ||
| Banco Itaú | Audit Committee | |||
| International | Member — Camden | |||
| (April 2012–Present) | Property Trust | |||
Executive Advisor to Dean | ||||
(August 2011–March 2012) and Interim Dean | ||||
| (January 2011–July 2011) — | ||||
| University of Miami School of | ||||
| Business Administration | ||||
President — U.S. Trust, | ||||
| Bank of America Private | ||||
| Wealth Management | ||||
| (Private Banking) | ||||
(July 2007–December 2008)
| ||||
129
Table of Contents
Board of trustees / directors and officers addendum
Delaware Investments® Family of Funds
| Name, Address, and Birth Date | Position(s) Held with Fund(s) | Length of Time Served | ||||
Independent Trustees (continued)
| ||||||
| Thomas K. Whitford | Trustee | Since January 2013 | ||||
| 2005 Market Street | ||||||
| Philadelphia, PA 19103 | ||||||
March 1956
| ||||||
| Janet L. Yeomans | Trustee | Since April 1999 | ||||
| 2005 Market Street | ||||||
| Philadelphia, PA 19103 | ||||||
July 1948
|
130
Table of Contents
| Principal Occupation(s) During the Past Five Years | Number of Portfolios in Fund Complex Overseen by Trustee or Officer | Other Directorships Held by Trustee or Officer | ||
| Vice Chairman | 64 | Director — HSBC Finance | ||
| (2010–April 2013), | Corporation and HSBC | |||
| Chief Administrative | North America Holdings Inc. | |||
Officer (2008–2010), and Executive Vice |
Director — | |||
| President and Chief | HSBC Bank | |||
| Administrative Officer | ||||
| (2007–2009) — | ||||
| PNC Financial | ||||
Services Group
| ||||
| Vice President and Treasurer | 64 | Director, Audit and | ||
| (January 2006–July 2012) | Compliance Committee Chair, | |||
| Vice President — | Investment Committee | |||
| Mergers & Acquisitions | Member, and Governance | |||
| (January 2003–January 2006), | Committee Member — | |||
| and Vice President | Okabena Company | |||
| and Treasurer | ||||
| (July 1995–January 2003) | Chair — 3M | |||
| 3M Corporation | Investment Management | |||
| Company | ||||
(2005–2012)
| ||||
131
Table of Contents
Board of trustees / directors and officers addendum
Delaware Investments® Family of Funds
| Name, Address, and Birth Date | Position(s) Held with Fund(s) | Length of Time Served | ||||
Officers
| ||||||
| David F. Connor | Senior Vice President, | Senior Vice President | ||||
| 2005 Market Street | General Counsel, | since May 2013; | ||||
| Philadelphia, PA 19103 | and Secretary | General Counsel | ||||
| December 1963 | since May 2015; | |||||
| Secretary since | ||||||
October 2005
| ||||||
| Daniel V. Geatens | Vice President | Treasurer since October 2007 | ||||
| 2005 Market Street | and Treasurer | |||||
| Philadelphia, PA 19103 | ||||||
October 1972
| ||||||
| Richard Salus | Senior Vice President | Chief Financial Officer | ||||
| 2005 Market Street | and Chief Financial Officer | since November 2006 | ||||
| Philadelphia, PA 19103 | ||||||
October 1963
|
The Statement of Additional Information for the Fund(s) includes additional information about the Trustees and Officers and is available, without charge, upon request by calling 800 523-1918.
132
Table of Contents
| Principal Occupation(s) During the Past Five Years | Number of Portfolios in Fund Complex Overseen by Trustee or Officer | Other Directorships Held by Trustee or Officer | ||||
| David F. Connor has served as | 64 | None3 | ||||
Senior Vice President of the Fund(s) and the investment advisor since 2013, General Counsel of the Fund(s) and the investment advisor since 2015, and Secretary of the Fund(s) and the investment advisor since 2005.
| ||||||
| Daniel V. Geatens has served | 64 | None3 | ||||
| as Vice President and | ||||||
Treasurer of the Fund(s) since 2007 and Vice President and Director of Financial | ||||||
Administration of the investment advisor since 2010.
| ||||||
| Richard Salus has served as | 64 | None3 | ||||
Senior Vice President and Chief Financial Officer of the Fund(s) and the investment advisor since 2006.
| ||||||
| 3 | David F. Connor, Daniel V. Geatens, and Richard Salus serve in similar capacities for the six portfolios of the Optimum Fund Trust, which have the same investment advisor, principal underwriter, and transfer agent as the registrant. |
133
Table of Contents
| Board of trustees | ||||||
| Shawn K. Lytle | Ann D. Borowiec | John A. Fry | Frances A. | |||
| President and | Former Chief Executive | President | Sevilla-Sacasa | |||
| Chief Executive Officer | Officer | Drexel University | Chief Executive Officer | |||
| Delaware Investments® | Private Wealth Management | Philadelphia, PA | Banco Itaú | |||
Family of Funds Philadelphia, PA | J.P. Morgan Chase & Co. New York, NY |
Lucinda S. Landreth Former Chief Investment | International Miami, FL | |||
| Thomas L. Bennett | Joseph W. Chow | Officer | Thomas K. Whitford | |||
| Chairman of the Board | Former Executive Vice | Assurant, Inc. | Former Vice Chairman | |||
| Delaware Investments | President | New York, NY | PNC Financial Services Group | |||
| Family of Funds | State Street Corporation | Pittsburgh, PA | ||||
Private Investor Rosemont, PA | Brookline, MA |
Janet L. Yeomans Former Vice President and | ||||
| Treasurer | ||||||
| 3M Corporation | ||||||
| St. Paul, MN | ||||||
Affiliated officers | ||||||
David F. Connor |
Daniel V. Geatens |
Richard Salus | ||||
| Senior Vice President, | Vice President and | Senior Vice President and | ||||
| General Counsel, | Treasurer | Chief Financial Officer | ||||
| and Secretary | Delaware Investments | Delaware Investments | ||||
| Delaware Investments | Family of Funds | Family of Funds | ||||
| Family of Funds | Philadelphia, PA | Philadelphia, PA | ||||
| Philadelphia, PA | ||||||
This annual report is for the information of Delaware Tax-Free USA Fund, Delaware Tax-Free USA Intermediate Fund, and Delaware National High-Yield Municipal Bond Fund shareholders, but it may be used with prospective investors when preceded or accompanied by the Delaware Investments Fund fact sheet for the most recently completed calendar quarter. These documents are available at delawareinvestments.com.
Delaware Investments is the marketing name of Delaware Management Holdings, Inc. and its subsidiaries.
Each Fund files its complete schedule of portfolio holdings with the Securities and Exchange Commission (SEC) for the first and third quarters of each fiscal year on Form N-Q. Each Fund’s Forms N-Q, as well as a description of the policies and procedures that each Fund uses to determine how to vote proxies (if any) relating to portfolio securities are available without charge (i) upon request, by calling 800 523-1918; and (ii) on the SEC’s website at sec.gov. In addition, a description of the policies and procedures that the Funds use to determine how to vote proxies (if any) relating to portfolio securities and the Schedules of Investments included in the Funds’ most recent Forms N-Q are available without charge on the Funds’ website at delawareinvestments.com. Each Fund’s Forms N-Q may be reviewed and copied at the SEC’s Public Reference Room in Washington, D.C.; information on the operation of the Public Reference Room may be obtained by calling 800 SEC-0330.
Information (if any) regarding how the Funds voted proxies relating to portfolio securities during the most recently disclosed 12-month period ended June 30 is available without charge (i) through the Funds’ website at delawareinvestments.com; and (ii) on the SEC’s website at sec.gov.
134
Table of Contents

Annual report
Fixed income mutual funds
Delaware Tax-Free Arizona Fund
Delaware Tax-Free California Fund
Delaware Tax-Free Colorado Fund
Delaware Tax-Free Idaho Fund
Delaware Tax-Free New York Fund
Delaware Tax-Free Pennsylvania Fund
August 31, 2015
Carefully consider the Funds’ investment objectives, risk factors, charges, and expenses before investing. This and other information can be found in the Funds’ prospectus and their summary prospectuses, which may be obtained by visiting delawareinvestments.com or calling 800 523-1918. Investors should read the prospectus and the summary prospectus carefully before investing.
You can obtain shareholder reports and prospectuses online instead of in the mail.
Visit delawareinvestments.com/edelivery.
Table of Contents
Experience Delaware Investments
Delaware Investments is committed to the pursuit of consistently superior asset management and unparalleled client service. We believe in our investment processes, which seek to deliver consistent results, and in convenient services that help add value for our clients.
If you are interested in learning more about creating an investment plan, contact your financial advisor.
You can learn more about Delaware Investments or obtain a prospectus for Delaware Tax-Free Arizona Fund, Delaware Tax-Free California Fund, Delaware Tax-Free Colorado Fund, Delaware Tax-Free Idaho Fund, Delaware Tax-Free New York Fund, and Delaware Tax-Free Pennsylvania Fund at delawareinvestments.com.
Manage your investments online
| ● | 24-hour access to your account information |
| ● | Obtain share prices |
| ● | Check your account balance and recent transactions |
| ● | Request statements or literature |
| ● | Make purchases and redemptions |
Delaware Management Holdings, Inc. and its subsidiaries (collectively known by the marketing name of Delaware Investments) are wholly owned subsidiaries of Macquarie Group Limited, a global provider of banking, financial, advisory, investment and funds management services.
Neither Delaware Investments nor its affiliates noted in this document are authorized deposit-taking institutions for the purpose of the Banking Act 1959 (Commonwealth of Australia). The obligations of these entities do not represent deposits or other liabilities of Macquarie Bank Limited (MBL). MBL does not guarantee or otherwise provide assurance in respect of the obligations of these entities, unless noted otherwise.
| ||||
| 1 | ||||
| 9 | ||||
| 27 | ||||
| 31 | ||||
| 37 | ||||
| 82 | ||||
| 86 | ||||
| 88 | ||||
| 100 | ||||
| 135 | ||||
| 151 | ||||
| 152 | ||||
| 170 | ||||
| 178 |
Unless otherwise noted, views expressed herein are current as of Aug. 31, 2015, and subject to change for events occurring after such date.
Funds are not FDIC insured and are not guaranteed. It is possible to lose the principal amount invested.
Mutual fund advisory services provided by Delaware Management Company, a series of Delaware Management Business Trust, which is a registered investment advisor. Delaware Investments, a member of Macquarie Group, refers to Delaware Management Holdings, Inc. and its subsidiaries, including the Fund’s distributor, Delaware Distributors, L.P. Macquarie Group refers to Macquarie Group Limited and its subsidiaries and affiliates worldwide.
© 2015 Delaware Management Holdings, Inc.
All third-party marks cited are the property of their respective owners.
Table of Contents
Delaware Investments® state tax-free funds | September 8, 2015 |
| Performance preview (for the year ended August 31, 2015) | ||||||||
Delaware Tax-Free Arizona Fund (Class A shares) | 1-year return | +3.24% | ||||||
Barclays Municipal Bond Index (benchmark) | 1-year return | +2.52% | ||||||
Lipper Other States Municipal Debt Funds Average | 1-year return | +2.13% | ||||||
Past performance does not guarantee future results.
For complete, annualized performance for Delaware Tax-Free Arizona Fund, please see the table on page 9.
The performance of Class A shares excludes the applicable sales charge and reflects the reinvestment of all distributions. The Lipper Other States Municipal Debt Funds Average compares funds that limit assets to those securities that are exempt from taxation on a specified city or state basis.
Please see page 11 for a description of the index. Index performance returns do not reflect any management fees, transaction costs, or expenses. Indices are unmanaged and one cannot invest directly in an index.
Delaware Tax-Free California Fund (Class A shares) | 1-year return | +3.73% | ||||||
Barclays Municipal Bond Index (benchmark) | 1-year return | +2.52% | ||||||
Lipper California Municipal Debt Funds Average | 1-year return | +3.06% |
Past performance does not guarantee future results.
For complete, annualized performance for Delaware Tax-Free California Fund, please see the table on page 12.
The performance of Class A shares excludes the applicable sales charge and reflects the reinvestment of all distributions. The Lipper California Municipal Debt Funds Average compares funds that limit assets to those securities that are exempt from taxation in California (double tax-exempt) or a city in California (triple tax-exempt).
Please see page 14 for a description of the index. Index performance returns do not reflect any management fees, transaction costs, or expenses. Indices are unmanaged and one cannot invest directly in an index.
Delaware Tax-Free Colorado Fund (Class A shares) | 1-year return | +2.87% | ||||||
Barclays Municipal Bond Index (benchmark) | 1-year return | +2.52% | ||||||
Lipper Other States Municipal Debt Funds Average | 1-year return | +2.13% |
Past performance does not guarantee future results.
For complete, annualized performance for Delaware Tax-Free Colorado Fund, please see the table on page 15.
The performance of Class A shares excludes the applicable sales charge and reflects the reinvestment of all distributions. The Lipper Other States Municipal Debt Funds Average compares funds that limit assets to those securities that are exempt from taxation on a specified city or state basis.
Please see page 17 for a description of the index. Index performance returns do not reflect any management fees, transaction costs, or expenses. Indices are unmanaged and one cannot invest directly in an index.
1
Table of Contents
Portfolio management review
Delaware Investments® state tax-free funds
Delaware Tax-Free Idaho Fund (Class A shares) | 1-year return | +2.76% | ||||||
Barclays Municipal Bond Index (benchmark) | 1-year return | +2.52% | ||||||
Lipper Other States Municipal Debt Funds Average | 1-year return | +2.13% |
Past performance does not guarantee future results.
For complete, annualized performance for Delaware Tax-Free Idaho Fund, please see the table on page 18.
The performance of Class A shares excludes the applicable sales charge and reflects the reinvestment of all distributions. The Lipper Other States Municipal Debt Funds Average compares funds that limit assets to those securities that are exempt from taxation on a specified city or state basis.
Please see page 20 for a description of the index. Index performance returns do not reflect any management fees, transaction costs, or expenses. Indices are unmanaged and one cannot invest directly in an index.
Delaware Tax-Free New York Fund (Class A shares) | 1-year return | +3.41% | ||||||
Barclays Municipal Bond Index (benchmark) | 1-year return | +2.52% | ||||||
Lipper New York Municipal Debt Funds Average | 1-year return | +2.60% |
Past performance does not guarantee future results.
For complete, annualized performance for Delaware Tax-Free New York Fund, please see the table on page 21.
The performance of Class A shares excludes the applicable sales charge and reflects the reinvestment of all distributions. The Lipper New York Municipal Debt Funds Average compares funds that limit assets to those securities that are exempt from taxation in New York (double tax-exempt) or a city in New York (triple tax-exempt).
Please see page 23 for a description of the index. Index performance returns do not reflect any management fees, transaction costs, or expenses. Indices are unmanaged and one cannot invest directly in an index.
Delaware Tax-Free Pennsylvania Fund (Class A shares) | 1-year return | +3.45% | ||||||
Barclays Municipal Bond Index (benchmark) | 1-year return | +2.52% | ||||||
Lipper Pennsylvania Municipal Debt Funds Average | 1-year return | +2.92% |
Past performance does not guarantee future results.
For complete, annualized performance for Delaware Tax-Free Pennsylvania Fund, please see the table on page 24.
The performance of Class A shares excludes the applicable sales charge and reflects the reinvestment of all distributions. The Lipper Pennsylvania Municipal Debt Funds Average compares funds that limit assets to those securities that are exempt from taxation in Pennsylvania (double tax-exempt) or a city in Pennsylvania (triple tax-exempt).
Please see page 26 for a description of the index. Index performance returns do not reflect any management fees, transaction costs, or expenses. Indices are unmanaged and one cannot invest directly in an index.
2
Table of Contents
Economic backdrop
The U.S. economy continued to grow steadily throughout the Funds’ fiscal year ended Aug. 31, 2015. The economy benefited from increased business investment and consumer spending, made possible in part by a sharp drop in the price of oil. A steadily improving job market also lifted consumer optimism. As of August 2015, the national jobless rate was 5.1%, down a full percentage point from a year earlier and the lowest level since early 2008. (Source: U.S. Labor Department.)
In the third quarter of 2014, U.S. gross domestic product (GDP) – a measure of national economic output – grew by a rapid 4.3% annual pace. This was followed by a 2.1% expansion in the fourth quarter of 2014. In the first quarter of 2015, the economy significantly slowed, as bad winter weather and shipping disruptions at West Coast ports depressed economic activity. These trends reversed in the second quarter of 2015, with continued strength in consumer spending helping to grow the economy by an estimated 3.7% in April–June. (Source: U.S. Commerce Department.)
With the U.S. economy strengthening and inflation well contained, the U.S. Federal Reserve finally ended its quantitative-easing economic stimulus plan in October 2014. The Fed maintained its target short-term rate at essentially zero – where it has been since 2008 – for the duration of the Funds’ fiscal year. However, as the period ended, investors widely anticipated a rate increase even as emerging concerns about the global economy added uncertainty to the central bank’s timetable.
Municipal bond market conditions
Municipal bonds produced positive returns overall for the Funds’ fiscal year. Over the entire period, bonds with longer maturity dates outperformed their shorter-maturity counterparts, while lower-
rated bonds offering higher yields fared better than higher-rated, lower yielding issues.
Municipal bond returns, by maturity and credit quality, for the 12 months ended Aug. 31, 2015, were as follows:
Maturity | ||||
5 years | 1.18% | |||
10 years | 2.47% | |||
22+ years | 4.02% | |||
Credit quality | ||||
AAA | 1.85% | |||
AA | 2.40% | |||
A | 2.75% | |||
BBB | 3.92% | |||
Source: Barclays
One exception to this trend came from bonds with credit ratings below BBB – also known as below-investment-grade, or high yield, bonds – which had flat returns, as measured by the Barclays High-Yield Municipal Bond Index, which tracks the total return performance of the long-term, non-investment-grade tax-exempt bond market. Nearly all of this relative underperformance, however, was caused by the weakness of bonds affiliated with Puerto Rico, which make up approximately 24% of the index. (Bonds issued by U.S. territories are exempt from federal, state, and local income taxes for residents of all 50 states.) Puerto Rico’s longstanding credit problems worsened during the Funds’ fiscal year, as the commonwealth filed for bankruptcy protection in July 2015. If Puerto Rico bonds were removed from the index, high yield returns would have kept with the credit trend by posting gains of 6.75%.
Of the Funds profiled in this report, only Delaware Tax-Free Arizona Fund, Delaware Tax-Free Colorado Fund, and Delaware Tax-Free Idaho Fund had any exposure to long-dated Puerto Rican bonds. In these Funds’ portfolios, we held a position in debt for Hospital Auxilio Mutuo, whose credit quality we concluded was relatively
3
Table of Contents
Portfolio management review
Delaware Investments® state tax-free funds
insulated from Puerto Rico’s financial difficulties. In fact, these bonds declined only modestly during the 12-month period, far outperforming the average Puerto Rico bond for the same time frame.
Toward the end of the Funds’ fiscal year, the market environment shifted for municipal bond investors. Uncertainty grew about the global economy – especially with respect to China and other emerging markets – causing increased market volatility, as investors became more risk averse. Accordingly, shorter-dated, higher-rated tax-exempt bonds returned to favor, while longer-maturity, lower-quality issues found themselves at a relative performance disadvantage as the period ended.
Demand for municipal bonds was robust as the fiscal year began, but tailed off as the period progressed. Toward the end of the period, however, municipal bond fund outflows grew as investors began to anticipate an increase in the Fed’s target short-term interest rate. Meanwhile, the supply of new long-term municipal debt remained constrained. Despite considerable issuance, much of the new supply consisted of debt refinancing, as issuers took advantage of still-low borrowing costs to lower their long-term interest expenses.
Economic backdrop in the states
Arizona’s diverse state economy is still slowly recovering from the global financial crisis. The rise in population overly exposed the real estate market and the construction industry. July 2015 nonfarm employment of 2.6 million was up 2.1% from a year earlier. While the economy improved during the fiscal year, the unemployment rate remained elevated at 6.1% as of July 2015, well above the national rate of 5.3%. Arizona’s personal income per capita is below the national level. Fiscal 2015 General Fund revenues totaled $9.5 billion, a 5.4% increase over 2014 and 3.7% above budget estimates. Most of the revenue
gains were from individual income capital gains and corporate tax collections. The state ended fiscal 2015 with a fund balance of $325 million, well above the expected $132 million shortfall. This creates a larger beginning balance for fiscal 2016 and would result in a $278 million expected ending fund balance for fiscal 2016. The state passed a $9.1 billion 2016 General Fund budget on time. This represented a 1.1% decline in overall spending from the prior year’s $9.2 billion budget. The budget assumes 3.9% overall revenue growth for the fiscal year. The state’s public universities will see a 13% reduction in state support in this budget, but K–12 funding will increase by $160 million for non-classroom spending. (Source: bls.gov, Moody’s Investors Service, Arizona Joint Legislative Budget Committee.)
California enjoys a large, diverse, and wealthy economy that mirrors that of the nation. The gross state product is $2.3 trillion, 13% of U.S. GDP. July 2015 nonfarm employment of 16.1 million was up 3.1% from a year earlier. The state’s unemployment rate fell from 7.4% in July 2014 to 6.2% in July 2015, but remains well above the national rate of 5.3%. Per capita economic measures remain strong, with GDP and personal income 9% above the nation overall. Revenues for fiscal 2015 came in 6.4% above budget and 12.5% above the prior year. Governor Jerry Brown passed a $115 billion General Fund budget for fiscal 2016. It is designed to achieve a structurally balanced budget without the use of on-year revenues or payment deferrals. The budget uses revenue growth to pay down past budgetary borrowing, invest in education and infrastructure, and build reserves. The budget calls for a 3.3% increase in revenues over 2015 and a 0.8% increase in expenditures. Total resources available would equal $117.5 million and expenditures are projected to total $115.4 billion, leaving a fund balance of $2.09 billion, with $1.1 billion reserved for the Special Fund for Economic Uncertainties. A transfer of $1.9 billion in the Rainy Day Fund
4
Table of Contents
would bring the total to $3.46 billion, equal to 2.9% of resources. Through the first month of fiscal 2016, General Fund revenues were 0.2% below estimates, but 6.2% above the prior year. (Source: bls.gov, California State Controller Monthly Reports, Moody’s.)
Colorado’s economy is diverse, with below-average employment concentration in manufacturing and a variety of service sector strengths. July 2015 nonfarm employment of 2.5 million was up 2.7% from a year earlier. Colorado’s unemployment rate in July 2015 was 4.3%, much lower than the national rate of 5.3%. Colorado is a wealthy state, with per capita income equal to 110% of the U.S. average. Preliminary revenues for fiscal 2015 show 9.3% growth over fiscal 2014 and a 0.5% increase over the March forecast. General Fund revenue is expected to grow more moderately at 4.5% in fiscal 2016 in part due to a contraction in the oil and gas industry. The state passed a $9.5 billion General Fund fiscal year 2016 budget, a 5.4% increase over the prior year. General Fund revenues are anticipated to grow 6.9% in fiscal year 2016. The 2016 budget increases funding for education by $281 million. It also set aside money for road construction and transit, with roughly $145 million going toward transportation. (Source: bls.gov, Colorado Office of State Planning and Budgeting, Moody’s, colorado.gov.)
Idaho’s economy has expanded and diversified in recent years, benefiting from population growth. However, it remains quite dependent on the natural resource sector. July 2015 nonfarm employment of 683,900 was up 3.3% from a year earlier. The unemployment rate in July 2015 fell to 4.1% from 4.8% a year earlier, well below the national rate of 5.3%. Idaho’s General Fund fiscal 2015 revenues totaled $3.06 billion, topping $3 billion for the first time. Total revenues came in 3.1% above budget and 8.6% above the prior year. The state passed its $3.07 billion 2016 General Fund budget on time. The budget grew
4.6% over fiscal 2015. The 2016 General Fund budget increases education and healthcare spending by 7.0% and 1.9%, respectively. (Source: bls.gov, Idaho Division of Management, State Controller’s website.)
New York has a mature, broad-based, and wealthy economy that attracts a highly educated and global workforce. July 2015 nonfarm employment of 9.3 million rose 1.9% from a year earlier. The unemployment rate in July 2015 was 5.4%, slightly above the national rate of 5.3%. In fiscal 2015, General Fund revenues totaled $52 billion, a 13% increase over 2014 and 11.8% higher than original budget estimates. The state ended fiscal 2015 with a General Fund balance of $7.3 billion, an increase of $5.1 billion over fiscal 2014. The state passed a $143 billion fiscal year 2016 budget, an annual increase of 0.3%. This marks the sixth straight year that budget spending increased by less than 2%. Total revenues are anticipated to grow 5% in the 2016 budget. The two biggest portions of the budget, school aid ($23.4 billion) and Medicaid ($17.4 billion) are expected to increase 8.1% and 3.7%, respectively. State operating revenues through the first four months of fiscal 2016 were 5% higher than budget and 1.9% above the prior year due to higher personal income taxes. (Source: bls.gov, New York Division of Budget, Moody’s, Office of the New York State Comptroller.)
Pennsylvania has a diverse, broad, and relatively stable economy, with wealth levels 3% above the national average, supported by its large health and higher education sectors. July 2015 nonfarm employment of 5.9 million rose 1.1% from a year earlier. The monthly unemployment rate was 5.4% in July 2015. Pennsylvania’s General Fund tax collections totaled $28.6 billion in fiscal 2015, 1.4% above the estimates and 6.9% above fiscal 2014. Personal and sales taxes came in 0.6% and 0.2% above budget, respectively, but corporate tax revenues were 4.9% above estimates. Pennsylvania still does not have a 2016 budget
5
Table of Contents
Portfolio management review
Delaware Investments® state tax-free funds
enacted. Democratic Governor Tom Wolf and the Republican-controlled General Assembly are at odds over the use of tax increases. Wolf rejected a $30.2 billion plan because it didn’t include new taxes needed to increase funding for education and human services. (Source: Moody’s, bls.gov, Pennsylvania Revenue Department, Pennsylvania Office of the Budget.)
Sticking to our strategy
For all six Funds discussed in this report, we maintained the consistent management approach we follow in all types of market conditions, relying on a bottom-up investment strategy. We evaluate securities one at a time, working with our credit analysts to determine through careful research which bonds we believe offer our shareholders the most favorable risk-reward trade-off and income potential.
Applying this approach, we continued to favor bonds with lower-investment-grade or below-investment-grade credit ratings, the segment in which we believe our credit research capabilities may prove most beneficial. Accordingly, all six Funds maintained sizeable allocations to bonds with credit ratings of A and BBB – the two lowest tiers of the investment grade bond universe – as well as to below-investment-grade bonds. By prospectus, up to 20% of the net assets of the Funds can be held in this latter category.
Opportunities varied widely by state, depending on the supply of municipal bonds available when we had proceeds available to invest. To the extent that we were able to find what we viewed as attractive opportunities in each state, we used a portion of the below-investment-grade allotment. The Funds owned lower-rated bonds that we thought appeared poised to benefit from credit improvement, and that we believed may enable us to improve the Funds’ income characteristics.
Throughout the period, we maintained a roughly neutral duration (interest rate) stance in all six Funds relative to their benchmarks. This approach
reflected our belief in our disciplined credit selection process, rather than any attempt to anticipate the direction of interest rates. The Funds purchased new bonds across various sectors during the fiscal year, including the charter school and healthcare sectors – two areas where we have substantial credit research experience. When appropriate, we tended to favor longer-dated bonds for what we identified as their increased performance potential.
One management challenge we regularly face, particularly in states with limited issuance, is finding sufficient supply of lower-rated bonds that we believe offer good long-term value for our Funds’ shareholders. When these opportunities are scarce, we will sometimes purchase higher-quality in-state bonds to keep the Funds fully invested until higher yielding opportunities that we deem attractive become available. During this fiscal year, we employed this strategy most often in Delaware Tax-Free Idaho Fund, purchasing bonds that we believed could continue to provide shareholders with regular, tax-exempt income, as we searched for compelling long-term value opportunities. To a lesser degree, we employed this strategy in Delaware Tax-Free Arizona Fund and Delaware Tax-Free Colorado Fund.
Within the Funds
In keeping with the performance trends mentioned earlier, bonds with lower credit ratings and longer maturity dates tended to outperform higher-quality, shorter-dated issues for the fiscal year. The Funds’ strongest-performing holdings generally conformed to those trends.
● Delaware Tax-Free Arizona Fund benefited from a position in Phoenix Industrial Development Authority charter school bonds for the Eagle College Prep Project. These bonds, rated BB+ by Standard & Poor’s, returned 13% helped by their 2043 maturity date and below-investment-grade credit rating. A position in Glendale Industrial Development Authority hospital bonds for John C.
6
Table of Contents
Lincoln Health Foundation further helped the Fund. These bonds were advance refunded, which would typically result in a price increase as the securities become backed by very short-dated, high-quality U.S. government bonds. On the negative side, Salt Verde Financial Corporation senior gas revenue bonds were relative laggards, declining 0.5%. Increasing risk aversion among municipal bond investors hampered these issues, along with many other corporate-backed bonds in the second half of the period.
● The strongest-performing securities in Delaware Tax-Free California Fund were Golden State tobacco securitization bonds. The market’s tobacco sector enjoyed a strong year, as the group gained 9.31% overall for the 12 months ended Aug. 31, 2015, as measured by the sector’s return within the Barclays High-Yield Municipal Bond Index. These particular California bonds, which returned 12%, benefited from their below-investment-grade credit rating and 2047 maturity date. In addition, dedicated-tax bonds for Inland Regional Center performed well. Toward the end of the fiscal year, these bonds were due to be refunded and priced to a very short call date, causing their prices to rise. Although no bonds in the Fund produced a negative return, various securities gained only slightly. Keeping with national trends, the weakest absolute performers were bonds with higher credit ratings, short maturity dates, or both. For example, the Fund’s holdings in California general obligation bonds produced very slight returns, due in part to the securities’ near-term maturity date. Similarly, we had a position in tax-allocation bonds for Lancaster Redevelopment Agency (returning 1%), which had been advance refunded and therefore had short maturity dates and high credit quality.
● In Delaware Tax-Free Colorado Fund, the strongest performers were Baptist Road Rural Transportation Authority sales and use tax revenue bonds, which returned 10%, and were redeemed during the fiscal year. Bonds for
Littleton Preparatory Charter School also performed well; these securities’ below-investment-grade credit rating and relatively long maturity date proved beneficial. In contrast, the Fund’s holdings in high-quality, relatively short-maturity revenue refunding bonds issued by the Pueblo Board of Water Works produced a small gain (0.3%), well short of the benchmark’s return.
● The strongest-performing bonds in Delaware Tax-Free Idaho Fund were issued for North Star Charter School. These nonrated bonds, maturing in 2048, came out of a June 2014 agreement that enabled the issuer to restructure its debt. As the issuer’s credit quality improved throughout the fiscal year, the bonds gained 16%. Idaho Health Facilities Authority bonds for St. Luke’s Regional Medical Center also performed well, reflecting the securities’ lower-investment-grade credit rating and the hospital sector’s overall strength during the 12-month period. Other than the Puerto Rico hospital bonds mentioned earlier, no securities in Delaware Tax-Free Idaho Fund produced negative returns. The Fund’s position in bonds issued by Ada and Canyon Counties Joint School District gained only 0.5%, however, owing to their short maturity date of 2016 and A+ credit rating.
● As with Delaware Tax-Free California Fund, Delaware Tax-Free New York Fund benefited from its holdings in state tobacco bonds. The Fund’s investment in New York tobacco securitization debt returned 17% for the fiscal year. Another strong-performing holding was Dormitory Authority of the State of New York bonds issued for the Icahn School of Medicine at Mount Sinai. These lower-investment-grade bonds gained about 13%, benefiting from their advance refunding late in the period. However, the Fund’s holding in bonds issued for Brighter Choice Charter Schools in Albany was a particularly weak performer, declining 12%. As the issuer experienced management troubles, the price of the bonds fell. Metropolitan Transportation Authority bonds fared considerably better, but
7
Table of Contents
Portfolio management review
Delaware Investments® state tax-free funds
they were still one of the weaker performers. Their results were hurt by their relatively high credit quality and late-2015 maturity date.
● The two strongest-performing bonds in Delaware Tax-Free Pennsylvania Fund were advance refunded and saw their prices rise accordingly; South Fork Municipal Authority bonds for the Conemaugh Health System and Montgomery County Industrial Development Authority bonds for the New Regional Medical Center gained 14% and 11%, respectively. Meanwhile, no holdings in the Fund lost ground, but the Fund’s exposure to Pennsylvania general obligation bonds produced a very minor gain, due to the securities’ AA credit rating and 2018 maturity date. Similarly, the Fund gained only 0.8% from advance refunded Puerto Rico Highway and Transportation Authority bonds. Despite this issue’s affiliation with the financially troubled U.S. territory, the securities’ near-term maturity date and backing by U.S. government securities enabled them to produce a slightly positive return for the fiscal year.
8
Table of Contents
| Performance summaries | ||
| Delaware Tax-Free Arizona Fund | August 31, 2015 |
The performance data quoted represent past performance; past performance does not guarantee future results. Investment return and principal value will fluctuate so your shares, when redeemed, may be worth more or less than their original cost. Please obtain the performance data current for the most recent month end by calling 800 523-1918 or visiting our website at delawareinvestments.com/performance. Current performance may be lower or higher than the performance data quoted.
| Fund and benchmark performance1,2 | Average annual total returns through August 31, 2015 | |||||||
| 1 year | 5 years | 10 years | Lifetime | |||||
Class A (Est. April 1, 1991) | ||||||||
Excluding sales charge | +3.24% | +3.57% | +4.02% | n/a | ||||
Including sales charge | -1.41% | +2.62% | +3.55% | n/a | ||||
Class C (Est. May 26, 1994) | ||||||||
Excluding sales charge | +2.47% | +2.79% | +3.25% | n/a | ||||
Including sales charge | +1.47% | +2.79% | +3.25% | n/a | ||||
Institutional Class (Est. Dec. 31, 2013) | ||||||||
Excluding sales charge | +3.49% | n/a | n/a | +7.73% | ||||
Including sales charge | +3.49% | n/a | n/a | +7.73% | ||||
Barclays Municipal Bond Index* | +2.52% | +3.96% | +4.49% | +5.99% | ||||
*The benchmark lifetime return is for Institutional Class share comparison only and is calculated using the last business day in the month of the Fund’s Institutional Class inception date.
1 Returns reflect the reinvestment of all distributions and are presented both with and without the applicable sales charges described below. Returns do not reflect the deduction of taxes the shareholder would pay on Fund distributions or redemptions of Fund shares.
Expense limitations were in effect for certain classes during some or all of the periods shown in the “Fund and benchmark performance” table. Expenses for each class are listed on the “Fund expense ratios” table on page 10. Performance would have been lower had expense limitations not been in effect.
Class A shares are sold with a maximum front-end sales charge of 4.50%, and have an annual distribution and service fee of 0.25% of average daily net assets. Performance for Class A shares, excluding sales charges, assumes that no front-end sales charge applied.
Class C shares are sold with a contingent deferred sales charge of 1.00% if redeemed during the first 12 months. They are also subject to an annual distribution and service fee of 1.00% of average daily net assets. Performance for Class C shares, excluding sales charges, assumes either that contingent deferred sales charges did not apply or that the investment was not redeemed.
Institutional Class shares are available without sales or asset-based distribution charges only to certain eligible institutional accounts.
Fixed income securities and bond funds can lose value, and investors can lose principal, as interest rates rise. They also may be affected by economic conditions that hinder an issuer’s ability to make interest and principal payments on its debt.
9
Table of Contents
Performance summaries
Delaware Tax-Free Arizona Fund
The Fund may also be subject to prepayment risk, the risk that the principal of a fixed income security that is held by the Fund may be prepaid prior to maturity, potentially forcing the Fund to reinvest that money at a lower interest rate.
Funds that invest primarily in one state may be more susceptible to the economic, regulatory, and other factors of that state than funds that invest more broadly.
Substantially all dividend income derived from tax-free funds is exempt from federal income tax. Some income may be subject to the federal alternative minimum tax (AMT) that applies to certain investors. Capital gains, if any, are taxable.
Bond ratings are determined by a nationally recognized statistical rating organization.
Duration number will change as market conditions change. Therefore, duration should not be solely
relied upon to indicate a municipal bond fund’s potential volatility.
Per Standard & Poor’s credit rating agency, bonds rated AA and A are more susceptible to the adverse effects of changes in circumstances and economic conditions than those in the higher-rated AAA category, but the obligor’s capacity to meet its financial commitment on the obligation is still strong. Bonds rated BBB exhibit adequate protection parameters, although adverse economic conditions or changing circumstances are more likely to lead to a weakened capacity of the obligor to meet its financial commitments. Bonds rated BB, B, and CCC are regarded as having significant speculative characteristics, with BB indicating the least degree of speculation of the three.
2 The Fund’s expense ratios, as described in the most recent prospectus, are disclosed in the following “Fund expense ratios” table. Delaware Management Company has agreed to reimburse certain expenses and/or waive certain fees in order to prevent total annual fund operating expenses (excluding any 12b-1 fees, taxes, interest, short sale and dividend interest expenses, brokerage fees, certain insurance costs, acquired fund fees and expenses, and nonroutine expenses or costs, including, but not limited to, those relating to reorganizations, litigation, conducting shareholder meetings, and liquidations (collectively, nonroutine expenses)) from exceeding 0.59% of the Fund’s average daily net assets during the period from Sept. 1, 2014 through Aug. 31, 2015.* Please see the most recent prospectus and any applicable supplement(s) for additional information on these fee waivers and/or reimbursements.
| Fund expense ratios | Class A | Class C | Institutional Class | |||||||
Total annual operating expenses | 0.96% | 1.71% | 0.71% | |||||||
(without fee waivers) | ||||||||||
Net expenses | 0.84% | 1.59% | 0.59% | |||||||
(including fee waivers, if any) | ||||||||||
Type of waiver | Contractual | Contractual | Contractual |
| * | The contractual waiver period is from Dec. 27, 2013, through Dec. 29, 2015. |
10
Table of Contents
Performance of a $10,000 investment1
Average annual total returns from Aug. 31, 2005, through Aug. 31, 2015
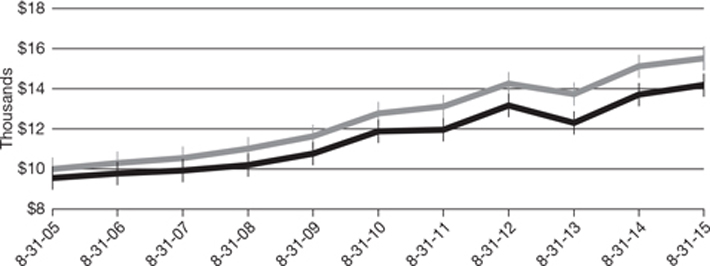
| For period beginning Aug. 31, 2005, through Aug. 31, 2015 | Starting value | Ending value | ||||||
| $10,000 | $15,513 | ||||||
| $9,550 | $14,168 | ||||||
 Barclays Municipal Bond Index
 Delaware Tax-Free Arizona Fund — Class A shares
1 The “Performance of a $10,000 investment” graph assumes $10,000 invested in Class A shares of the Fund on Aug. 31, 2005, and includes the effect of a 4.50% front-end sales charge and the reinvestment of all distributions. The graph does not reflect the deduction of taxes the shareholders would pay on Fund distributions or redemptions of Fund shares. Expense limitations were in effect for some or all of the periods shown. Performance would have been lower had expense limitations not been in effect. Expenses are listed in the “Fund expense ratios” table on page 10. Please note additional details on pages 9 through 11.
The graph also assumes $10,000 invested in the Barclays Municipal Bond Index as of Aug. 31, 2005. The Barclays Municipal Bond Index measures the total return performance of the long-term, investment grade tax-exempt bond market.
Index performance returns do not reflect any management fees, transaction costs, or expenses. Indices are unmanaged and one cannot invest directly in an index. Past performance is not a guarantee of future results.
Performance of other Fund classes will vary due to different charges and expenses.
Nasdaq symbols | CUSIPs | |||||
Class A | VAZIX | 928916204 | ||||
Class C | DVACX | 928916501 | ||||
Institutional Class | DAZIX
| 928916873 |
11
Table of Contents
| Performance summaries | ||
| Delaware Tax-Free California Fund | August 31, 2015 |
The performance data quoted represent past performance; past performance does not guarantee future results. Investment return and principal value will fluctuate so your shares, when redeemed, may be worth more or less than their original cost. Please obtain the performance data current for the most recent month end by calling 800 523-1918 or visiting our website at delawareinvestments.com/performance. Current performance may be lower or higher than the performance data quoted.
| Fund and benchmark performance1,2 | Average annual total returns through August 31, 2015 | |||||||
| 1 year | 5 years | 10 years | Lifetime | |||||
Class A (Est. March 2, 1995) | ||||||||
Excluding sales charge | +3.73% | +4.86% | +4.64% | n/a | ||||
Including sales charge | -0.95% | +3.89% | +4.16% | n/a | ||||
Class C (Est. April 9, 1996) | ||||||||
Excluding sales charge | +2.95% | +4.07% | +3.86% | n/a | ||||
Including sales charge | +1.95% | +4.07% | +3.86% | n/a | ||||
Institutional Class (Est. Dec. 31, 2013) | ||||||||
Excluding sales charge | +3.98% | n/a | n/a | +8.46% | ||||
Including sales charge | +3.98% | n/a | n/a | +8.46% | ||||
Barclays Municipal Bond Index* | +2.52% | +3.96% | +4.49% | +5.99% | ||||
*The benchmark lifetime return is for Institutional Class share comparison only and is calculated using the last business day in the month of the Fund’s Institutional Class inception date.
1 Returns reflect the reinvestment of all distributions and are presented both with and without the applicable sales charges described below. Returns do not reflect the deduction of taxes the shareholder would pay on Fund distributions or redemptions of Fund shares.
Expense limitations were in effect for certain classes during some or all of the periods shown in the “Fund and benchmark performance” table. Expenses for each class are listed on the “Fund expense ratios” table on page 13. Performance would have been lower had expense limitations not been in effect.
Class A shares are sold with a maximum front-end sales charge of 4.50%, and have an annual distribution and service fee of 0.25% of average daily net assets. Performance for Class A shares, excluding sales charges, assumes that no front-end sales charge applied.
Class C shares are sold with a contingent deferred sales charge of 1.00% if redeemed during the first 12 months. They are also subject to an annual distribution and service fee of 1.00% of average daily net assets. Performance for Class C shares, excluding sales charges, assumes either that contingent deferred sales charges did not apply or that the investment was not redeemed.
Institutional Class shares are available without sales or asset-based distribution charges only to certain eligible institutional accounts.
Fixed income securities and bond funds can lose value, and investors can lose principal, as interest rates rise. They also may be affected by economic conditions that hinder an issuer’s ability to make interest and principal payments on its debt.
12
Table of Contents
The Fund may also be subject to prepayment risk, the risk that the principal of a fixed income security that is held by the Fund may be prepaid prior to maturity, potentially forcing the Fund to reinvest that money at a lower interest rate.
Funds that invest primarily in one state may be more susceptible to the economic, regulatory, and other factors of that state than funds that invest more broadly.
Substantially all dividend income derived from tax-free funds is exempt from federal income tax. Some income may be subject to the federal alternative minimum tax (AMT) that applies to certain investors. Capital gains, if any, are taxable.
Bond ratings are determined by a nationally recognized statistical rating organization.
Duration number will change as market conditions change. Therefore, duration should not be solely
relied upon to indicate a municipal bond fund’s potential volatility.
Per Standard & Poor’s credit rating agency, bonds rated AA and A are more susceptible to the adverse effects of changes in circumstances and economic conditions than those in the higher-rated AAA category, but the obligor’s capacity to meet its financial commitment on the obligation is still strong. Bonds rated BBB exhibit adequate protection parameters, although adverse economic conditions or changing circumstances are more likely to lead to a weakened capacity of the obligor to meet its financial commitments. Bonds rated BB, B, and CCC are regarded as having significant speculative characteristics, with BB indicating the least degree of speculation of the three.
2 The Fund’s expense ratios, as described in the most recent prospectus, are disclosed in the following “Fund expense ratios” table. Delaware Management Company has agreed to reimburse certain expenses and/or waive certain fees in order to prevent total annual fund operating expenses (excluding any 12b-1 fees, taxes, interest, short sale and dividend interest expenses, brokerage fees, certain insurance costs, acquired fund fees and expenses, and nonroutine expenses or costs, including, but not limited to, those relating to reorganizations, litigation, conducting shareholder meetings, and liquidations (collectively, nonroutine expenses)) from exceeding 0.57% of the Fund’s average daily net assets during the period from Sept. 1, 2014 through Aug. 31, 2015.* Please see the most recent prospectus and any applicable supplement(s) for additional information on these fee waivers and/or reimbursements.
| Fund expense ratios | Class A | Class C | Institutional Class | |||||||
Total annual operating expenses | 1.00% | 1.75% | 0.75% | |||||||
(without fee waivers) | ||||||||||
Net expenses | 0.82% | 1.57% | 0.57% | |||||||
(including fee waivers, if any) | ||||||||||
Type of waiver | Contractual | Contractual | Contractual |
*The contractual waiver period is from Dec. 27, 2013, through Dec. 29, 2015.
13
Table of Contents
Performance summaries
Delaware Tax-Free California Fund
Performance of a $10,000 investment1
Average annual total returns from Aug. 31, 2005, through Aug. 31, 2015
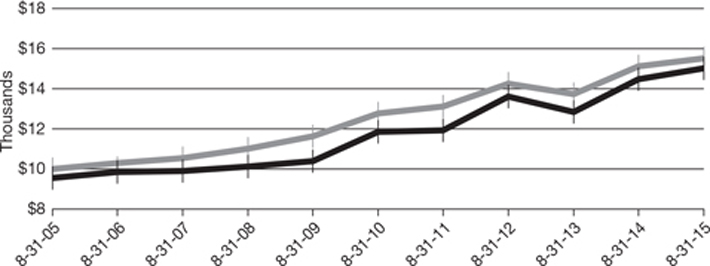
| For period beginning Aug. 31, 2005, through Aug. 31, 2015 | Starting value | Ending value | ||||||
| $10,000 | $15,513 | ||||||
| $9,550 | $15,029 | ||||||
 Barclays Municipal Bond Index
 Delaware Tax-Free California Fund — Class A shares
1 The “Performance of a $10,000 investment” graph assumes $10,000 invested in Class A shares of the Fund on Aug. 31, 2005, and includes the effect of a 4.50% front-end sales charge and the reinvestment of all distributions. The graph does not reflect the deduction of taxes the shareholders would pay on Fund distributions or redemptions of Fund shares. Expense limitations were in effect for some or all of the periods shown. Performance would have been lower had expense limitations not been in effect. Expenses are listed in the “Fund expense ratios” table on page 13. Please note additional details on pages 12 through 14.
The graph also assumes $10,000 invested in the Barclays Municipal Bond Index as of Aug. 31, 2005. The Barclays Municipal Bond Index measures the total return performance of the long-term, investment grade tax-exempt bond market.
Index performance returns do not reflect any management fees, transaction costs, or expenses. Indices are unmanaged and one cannot invest directly in an index. Past performance is not a guarantee of future results.
Performance of other Fund classes will vary due to different charges and expenses.
Nasdaq symbols | CUSIPs | |||||
Class A | DVTAX | 928928829 | ||||
Class C | DVFTX | 928928795 | ||||
Institutional Class | DCTIX
| 928928167 |
14
Table of Contents
| Performance summaries | ||
| Delaware Tax-Free Colorado Fund | August 31, 2015 |
The performance data quoted represent past performance; past performance does not guarantee future results. Investment return and principal value will fluctuate so your shares, when redeemed, may be worth more or less than their original cost. Please obtain the performance data current for the most recent month end by calling 800 523-1918 or visiting our website at delawareinvestments.com/performance. Current performance may be lower or higher than the performance data quoted.
| Fund and benchmark performance1,2 | Average annual total returns through August 31, 2015 | |||||||
| 1 year | 5 years | 10 years | Lifetime | |||||
Class A (Est. April 23, 1987) | ||||||||
Excluding sales charge | +2.87% | +3.81% | +4.14% | n/a | ||||
Including sales charge | -1.73% | +2.85% | +3.66% | n/a | ||||
Class C (Est. May 6, 1994) | ||||||||
Excluding sales charge | +2.10% | +3.03% | +3.37% | n/a | ||||
Including sales charge | +1.11% | +3.03% | +3.37% | n/a | ||||
Institutional Class (Est. Dec. 31, 2013) | ||||||||
Excluding sales charge | +3.13% | n/a | n/a | +7.80% | ||||
Including sales charge | +3.13% | n/a | n/a | +7.80% | ||||
Barclays Municipal Bond Index* | +2.52% | +3.96% | +4.49% | +5.99% | ||||
*The benchmark lifetime return is for Institutional Class share comparison only and is calculated using the last business day in the month of the Fund’s Institutional Class inception date.
1 Returns reflect the reinvestment of all distributions and are presented both with and without the applicable sales charges described below. Returns do not reflect the deduction of taxes the shareholder would pay on Fund distributions or redemptions of Fund shares.
Expense limitations were in effect for certain classes during some or all of the periods shown in the “Fund and benchmark performance” table. Expenses for each class are listed on the “Fund expense ratios” table on page 16. Performance would have been lower had expense limitations not been in effect.
Class A shares are sold with a maximum front-end sales charge of 4.50%, and have an annual distribution and service fee of 0.25% of average daily net assets. Performance for Class A shares, excluding sales charges, assumes that no front-end sales charge applied.
Class C shares are sold with a contingent deferred sales charge of 1.00% if redeemed during the first 12 months. They are also subject to an annual distribution and service fee of 1.00% of average daily net assets. Performance for Class C shares, excluding sales charges, assumes either that contingent deferred sales charges did not apply or that the investment was not redeemed.
Institutional Class shares are available without sales or asset-based distribution charges only to certain eligible institutional accounts.
Fixed income securities and bond funds can lose value, and investors can lose principal, as interest rates rise. They also may be affected by economic conditions that hinder an issuer’s ability to make interest and principal payments on its debt.
15
Table of Contents
Performance summaries
Delaware Tax-Free Colorado Fund
The Fund may also be subject to prepayment risk, the risk that the principal of a fixed income security that is held by the Fund may be prepaid prior to maturity, potentially forcing the Fund to reinvest that money at a lower interest rate.
Funds that invest primarily in one state may be more susceptible to the economic, regulatory, and other factors of that state than funds that invest more broadly.
Substantially all dividend income derived from tax-free funds is exempt from federal income tax. Some income may be subject to the federal alternative minimum tax (AMT) that applies to certain investors. Capital gains, if any, are taxable.
Bond ratings are determined by a nationally recognized statistical rating organization.
Duration number will change as market conditions change. Therefore, duration should not be solely
relied upon to indicate a municipal bond fund’s potential volatility.
Per Standard & Poor’s credit rating agency, bonds rated AA and A are more susceptible to the adverse effects of changes in circumstances and economic conditions than those in the higher-rated AAA category, but the obligor’s capacity to meet its financial commitment on the obligation is still strong. Bonds rated BBB exhibit adequate protection parameters, although adverse economic conditions or changing circumstances are more likely to lead to a weakened capacity of the obligor to meet its financial commitments. Bonds rated BB, B, and CCC are regarded as having significant speculative characteristics, with BB indicating the least degree of speculation of the three.
2 The Fund’s expense ratios, as described in the most recent prospectus, are disclosed in the following “Fund expense ratios” table. Delaware Management Company has agreed to reimburse certain expenses and/or waive certain fees in order to prevent total annual fund operating expenses (excluding any 12b-1 fees, taxes, interest, short sale and dividend interest expenses, brokerage fees, certain insurance costs, acquired fund fees and expenses, and nonroutine expenses or costs, including, but not limited to, those relating to reorganizations, litigation, conducting shareholder meetings, and liquidations (collectively, nonroutine expenses)) from exceeding 0.59% of the Fund’s average daily net assets during the period from Sept. 1, 2014 through Aug. 31, 2015.* Please see the most recent prospectus and any applicable supplement(s) for additional information on these fee waivers and/or reimbursements.
| Fund expense ratios | Class A | Class C | Institutional Class | |||||||
Total annual operating expenses | 0.97% | 1.72% | 0.72% | |||||||
(without fee waivers) | ||||||||||
Net expenses | 0.84% | 1.59% | 0.59% | |||||||
(including fee waivers, if any) | ||||||||||
Type of waiver | Contractual | Contractual | Contractual |
*The contractual waiver period is from Dec. 27, 2013, through Dec. 29, 2015.
16
Table of Contents
Performance of a $10,000 investment1
Average annual total returns from Aug. 31, 2005, through Aug. 31, 2015
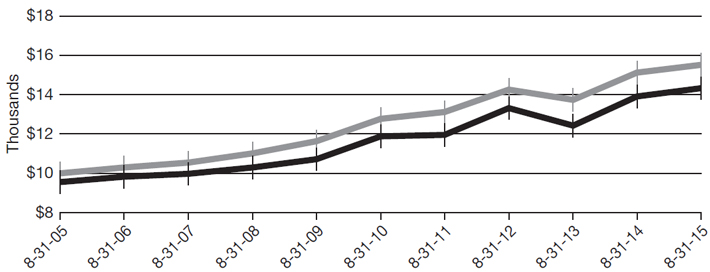
| For period beginning Aug. 31, 2005, through Aug. 31, 2015 | Starting value | Ending value | ||||||
| $10,000 | $15,513 | ||||||
| $9,550 | $14,326 | ||||||
 Barclays Municipal Bond Index
 Delaware Tax-Free Colorado Fund — Class A shares
1 The “Performance of a $10,000 investment” graph assumes $10,000 invested in Class A shares of the Fund on Aug. 31, 2005, and includes the effect of a 4.50% front-end sales charge and the reinvestment of all distributions. The graph does not reflect the deduction of taxes the shareholders would pay on Fund distributions or redemptions of Fund shares. Expense limitations were in effect for some or all of the periods shown. Performance would have been lower had expense limitations not been in effect. Expenses are listed in the “Fund expense ratios” table on page 16. Please note additional details on pages 15 through 17.
The graph also assumes $10,000 invested in the Barclays Municipal Bond Index as of Aug. 31, 2005. The Barclays Municipal Bond Index measures the total return performance of the long-term, investment grade tax-exempt bond market.
Index performance returns do not reflect any management fees, transaction costs, or expenses. Indices are unmanaged and one cannot invest directly in an index. Past performance is not a guarantee of future results.
Performance of other Fund classes will vary due to different charges and expenses.
Nasdaq symbols | CUSIPs | |||||
Class A | VCTFX | 928920107 | ||||
Class C | DVCTX | 92907R101 | ||||
Institutional Class
| DCOIX | 92907R200 |
17
Table of Contents
| Performance summaries | ||
| Delaware Tax-Free Idaho Fund | August 31, 2015 |
The performance data quoted represent past performance; past performance does not guarantee future results. Investment return and principal value will fluctuate so your shares, when redeemed, may be worth more or less than their original cost. Please obtain the performance data current for the most recent month end by calling 800 523-1918 or visiting our website at delawareinvestments.com/performance. Current performance may be lower or higher than the performance data quoted.
| Fund and benchmark performance1, 2 | Average annual total returns through August 31, 2015 | |||||||
| 1 year | 5 years | 10 years | Lifetime | |||||
Class A (Est. Jan. 4, 1995) | ||||||||
Excluding sales charge | +2.76% | +2.48% | +3.63% | n/a | ||||
Including sales charge | -1.83% | +1.54% | +3.16% | n/a | ||||
Class C (Est. Jan. 11, 1995) | ||||||||
Excluding sales charge | +1.99% | +1.72% | +2.85% | n/a | ||||
Including sales charge | +0.99% | +1.72% | +2.85% | n/a | ||||
Institutional Class (Est. Dec. 31, 2013) | ||||||||
Excluding sales charge | +2.92% | n/a | n/a | +6.15% | ||||
Including sales charge | +2.92% | n/a | n/a | +6.15% | ||||
Barclays Municipal Bond Index* | +2.52% | +3.96% | +4.49% | +5.99% | ||||
*The benchmark lifetime return is for Institutional Class share comparison only and is calculated using the last business day in the month of the Fund’s Institutional Class inception date.
1 Returns reflect the reinvestment of all distributions and are presented both with and without the applicable sales charges described below. Returns do not reflect the deduction of taxes the shareholder would pay on Fund distributions or redemptions of Fund shares.
Expense limitations were in effect for certain classes during some or all of the periods shown in the “Fund and benchmark performance” table. Expenses for each class are listed on the “Fund expense ratios” table on page 19. Performance would have been lower had expense limitations not been in effect.
Class A shares are sold with a maximum front-end sales charge of 4.50%, and have an annual distribution and service fee of 0.25% of average daily net assets. Performance for Class A shares, excluding sales charges, assumes that no front-end sales charge applied.
Class C shares are sold with a contingent deferred sales charge of 1.00% if redeemed during the first 12 months. They are also subject to an annual distribution and service fee of 1.00% of average daily net assets. Performance for Class C shares, excluding sales charges, assumes either that contingent deferred sales charges did not apply or that the investment was not redeemed.
Institutional Class shares are available without sales or asset-based distribution charges only to certain eligible institutional accounts.
Fixed income securities and bond funds can lose value, and investors can lose principal, as interest rates rise. They also may be affected by economic conditions that hinder an issuer’s ability to make interest and principal payments on its debt.
18
Table of Contents
The Fund may also be subject to prepayment risk, the risk that the principal of a fixed income security that is held by the Fund may be prepaid prior to maturity, potentially forcing the Fund to reinvest that money at a lower interest rate.
Funds that invest primarily in one state may be more susceptible to the economic, regulatory, and other factors of that state than funds that invest more broadly.
Substantially all dividend income derived from tax-free funds is exempt from federal income tax. Some income may be subject to the federal alternative minimum tax (AMT) that applies to certain investors. Capital gains, if any, are taxable.
Bond ratings are determined by a nationally recognized statistical rating organization.
Duration number will change as market conditions change. Therefore, duration should not be solely
relied upon to indicate a municipal bond fund’s potential volatility.
Per Standard & Poor’s credit rating agency, bonds rated AA and A are more susceptible to the adverse effects of changes in circumstances and economic conditions than those in the higher-rated AAA category, but the obligor’s capacity to meet its financial commitment on the obligation is still strong. Bonds rated BBB exhibit adequate protection parameters, although adverse economic conditions or changing circumstances are more likely to lead to a weakened capacity of the obligor to meet its financial commitments. Bonds rated BB, B, and CCC are regarded as having significant speculative characteristics, with BB indicating the least degree of speculation of the three.
2 The Fund’s expense ratios, as described in the most recent prospectus, are disclosed in the following “Fund expense ratios” table. Delaware Management Company has agreed to reimburse certain expenses and/or waive certain fees in order to prevent total annual fund operating expenses (excluding any 12b-1 fees, taxes, interest, short sale and dividend interest expenses, brokerage fees, certain insurance costs, acquired fund fees and expenses, and nonroutine expenses or costs, including, but not limited to, those relating to reorganizations, litigation, conducting shareholder meetings, and liquidations (collectively, nonroutine expenses)) from exceeding 0.61% (or 0.63%) of the Fund’s average daily net assets during the period from Sept. 1, 2014 through Aug. 31, 2015.* Please see the most recent prospectus and any applicable supplement(s) for additional information on these fee waivers and/or reimbursements.
| Fund expense ratios | Class A | Class C | Institutional Class | ||||||||||||||||
Total annual operating expenses (without fee waivers) | 0.99% | 1.74% | 0.74% | ||||||||||||||||
Net expenses (including fee waivers, if any) | 0.86% | 1.61% | 0.61% | ||||||||||||||||
Type of waiver | Contractual | Contractual | Contractual | ||||||||||||||||
*The contractual waiver for the period Dec. 29, 2014 through Dec. 29, 2015 is 0.61%. Prior to Dec. 29, 2014, the contractual waiver was 0.63%.
19
Table of Contents
Performance summaries
Delaware Tax-Free Idaho Fund
Performance of a $10,000 investment1
Average annual total returns from Aug. 31, 2005, through Aug. 31, 2015
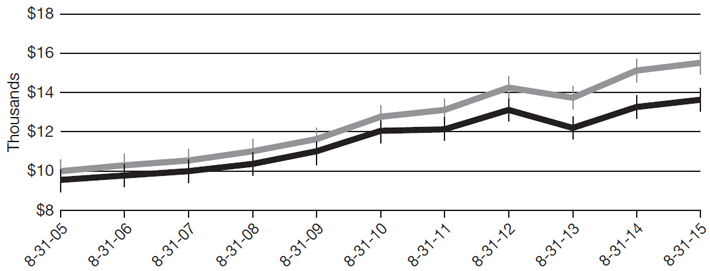
| For period beginning Aug. 31, 2005, through Aug. 31, 2015 | Starting value | Ending value | ||||||
| $10,000 | $15,513 | ||||||
| $9,550 | $13,644 | ||||||
 Barclays Municipal Bond Index
 Delaware Tax-Free Idaho Fund — Class A shares
1 The “Performance of a $10,000 investment” graph assumes $10,000 invested in Class A shares of the Fund on Aug. 31, 2005, and includes the effect of a 4.50% front-end sales charge and the reinvestment of all distributions. The graph does not reflect the deduction of taxes the shareholders would pay on Fund distributions or redemptions of Fund shares. Expense limitations were in effect for some or all of the periods shown. Performance would have been lower had expense limitations not been in effect. Expenses are listed in the “Fund expense ratios” table on page 19. Please note additional details on pages 18 through 20.
The graph also assumes $10,000 invested in the Barclays Municipal Bond Index as of Aug. 31, 2005. The Barclays Municipal Bond Index measures the total return performance of the long-term, investment grade tax-exempt bond market.
Index performance returns do not reflect any management fees, transaction costs, or expenses. Indices are unmanaged and one cannot invest directly in an index. Past performance is not a guarantee of future results.
Performance of other Fund classes will vary due to different charges and expenses.
Nasdaq symbols | CUSIPs | |||||
Class A | VIDAX | 928928704 | ||||
Class C | DVICX | 928928803 | ||||
Institutional Class
| DTIDX | 928928159 |
20
Table of Contents
| Performance summaries | ||
| Delaware Tax-Free New York Fund | August 31, 2015 |
The performance data quoted represent past performance; past performance does not guarantee future results. Investment return and principal value will fluctuate so your shares, when redeemed, may be worth more or less than their original cost. Please obtain the performance data current for the most recent month end by calling 800 523-1918 or visiting our website at delawareinvestments.com/performance. Current performance may be lower or higher than the performance data quoted.
| Fund and benchmark performance1,2 | Average annual total returns through August 31, 2015 | |||||||
| 1 year | 5 years | 10 years | Lifetime | |||||
Class A (Est. Nov. 6, 1987) | ||||||||
Excluding sales charge | +3.41% | +4.16% | +4.59% | n/a | ||||
Including sales charge | -1.25% | +3.19% | +4.11% | n/a | ||||
Class C (Est. April 26, 1995) | ||||||||
Excluding sales charge | +2.55% | +3.38% | +3.81% | n/a | ||||
Including sales charge | +1.55% | +3.38% | +3.81% | n/a | ||||
Institutional Class (Est. Dec. 31, 2013) | ||||||||
Excluding sales charge | +3.58% | n/a | n/a | +7.97% | ||||
Including sales charge | +3.58% | n/a | n/a | +7.97% | ||||
Barclays Municipal Bond Index* | +2.52% | +3.96% | +4.49% | +5.99% | ||||
*The benchmark lifetime return is for Institutional Class share comparison only and is calculated using the last business day in the month of the Fund’s Institutional Class inception date.
1 Returns reflect the reinvestment of all distributions and are presented both with and without the applicable sales charges described below. Returns do not reflect the deduction of taxes the shareholder would pay on Fund distributions or redemptions of Fund shares.
Expense limitations were in effect for certain classes during some or all of the periods shown in the “Fund and benchmark performance” table. Expenses for each class are listed on the “Fund expense ratios” table on page 22. Performance would have been lower had expense limitations not been in effect.
Class A shares are sold with a maximum front-end sales charge of 4.50%, and have an annual distribution and service fee of 0.25% of average daily net assets. Performance for Class A shares, excluding sales charges, assumes that no front-end sales charge applied.
Class C shares are sold with a contingent deferred sales charge of 1.00% if redeemed during the first 12 months. They are also subject to an annual distribution and service fee of 1.00% of average daily net assets. Performance for Class C shares, excluding sales charges, assumes either that contingent deferred sales charges did not apply or that the investment was not redeemed.
Institutional Class shares are available without sales or asset-based distribution charges only to certain eligible institutional accounts.
Fixed income securities and bond funds can lose value, and investors can lose principal, as interest rates rise. They also may be affected by economic conditions that hinder an issuer’s ability to make interest and principal payments on its debt.
21
Table of Contents
Performance summaries
Delaware Tax-Free New York Fund
The Fund may also be subject to prepayment risk, the risk that the principal of a fixed income security that is held by the Fund may be prepaid prior to maturity, potentially forcing the Fund to reinvest that money at a lower interest rate.
Funds that invest primarily in one state may be more susceptible to the economic, regulatory, and other factors of that state than funds that invest more broadly.
Substantially all dividend income derived from tax-free funds is exempt from federal income tax. Some income may be subject to the federal alternative minimum tax (AMT) that applies to certain investors. Capital gains, if any, are taxable.
Bond ratings are determined by a nationally recognized statistical rating organization.
Duration number will change as market conditions change. Therefore, duration should not be solely
relied upon to indicate a municipal bond fund’s potential volatility.
Per Standard & Poor’s credit rating agency, bonds rated AA and A are more susceptible to the adverse effects of changes in circumstances and economic conditions than those in the higher-rated AAA category, but the obligor’s capacity to meet its financial commitment on the obligation is still strong. Bonds rated BBB exhibit adequate protection parameters, although adverse economic conditions or changing circumstances are more likely to lead to a weakened capacity of the obligor to meet its financial commitments. Bonds rated BB, B, and CCC are regarded as having significant speculative characteristics, with BB indicating the least degree of speculation of the three.
2 The Fund’s expense ratios, as described in the most recent prospectus, are disclosed in the following “Fund expense ratios” table. Delaware Management Company has agreed to reimburse certain expenses and/or waive certain fees in order to prevent total annual fund operating expenses (excluding any 12b-1 fees, taxes, interest, short sale and dividend interest expenses, brokerage fees, certain insurance costs, acquired fund fees and expenses, and nonroutine expenses or costs, including, but not limited to, those relating to reorganizations, litigation, conducting shareholder meetings, and liquidations (collectively, nonroutine expenses)) from exceeding 0.55% of the Fund’s average daily net assets during the period from Sept. 1, 2014 through Aug. 31, 2015.* Please see the most recent prospectus and any applicable supplement(s) for additional information on these fee waivers and/or reimbursements.
| Fund expense ratios | Class A | Class C | Institutional Class | ||||||||||||||||
Total annual operating expenses (without fee waivers) | 1.06% | 1.81% | 0.81% | ||||||||||||||||
Net expenses (including fee waivers, if any) | 0.80% | 1.55% | 0.55% | ||||||||||||||||
Type of waiver | Contractual | Contractual | Contractual | ||||||||||||||||
*The contractual waiver period is from Dec. 27, 2013, through Dec. 29, 2015.
22
Table of Contents
Performance of a $10,000 investment1
Average annual total returns from Aug. 31, 2005, through Aug. 31, 2015
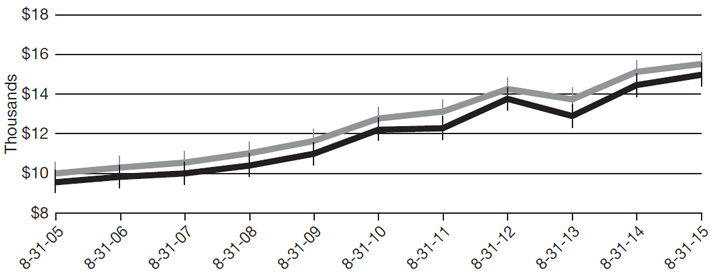
| For period beginning Aug. 31, 2005, through Aug. 31, 2015 | Starting value | Ending value | ||||||
| $10,000 | $15,513 | ||||||
| $9,550 | $14,963 | ||||||
 Barclays Municipal Bond Index
 Delaware Tax-Free New York Fund — Class A shares
1 The “Performance of a $10,000 investment” graph assumes $10,000 invested in Class A shares of the Fund on Aug. 31, 2005, and includes the effect of a 4.50% front-end sales charge and the reinvestment of all distributions. The graph does not reflect the deduction of taxes the shareholders would pay on Fund distributions or redemptions of Fund shares. Expense limitations were in effect for some or all of the periods shown. Performance would have been lower had expense limitations not been in effect. Expenses are listed in the “Fund expense ratios” table on page 22. Please note additional details on pages 21 through 23.
The graph also assumes $10,000 invested in the Barclays Municipal Bond Index as of Aug. 31, 2005. The Barclays Municipal Bond Index measures the total return performance of the long-term, investment grade tax-exempt bond market.
Index performance returns do not reflect any management fees, transaction costs, or expenses. Indices are unmanaged and one cannot invest directly in an index. Past performance is not a guarantee of future results.
Performance of other Fund classes will vary due to different charges and expenses.
Nasdaq symbols | CUSIPs | |||||
Class A | FTNYX | 928928274 | ||||
Class C | DVFNX | 928928258 | ||||
Institutional Class
| DTNIX | 928928142 |
23
Table of Contents
| Performance summaries | ||
| Delaware Tax-Free Pennsylvania Fund | August 31, 2015 |
The performance data quoted represent past performance; past performance does not guarantee future results. Investment return and principal value will fluctuate so your shares, when redeemed, may be worth more or less than their original cost. Please obtain the performance data current for the most recent month end by calling 800 523-1918 or visiting our website at delawareinvestments.com/performance. Current performance may be lower or higher than the performance data quoted.
| Fund and benchmark performance1,2 | Average annual total returns through August 31, 2015 | |||||||
| 1 year | 5 years | 10 years | Lifetime | |||||
Class A (Est. March 23, 1977) | ||||||||
Excluding sales charge | +3.45% | +4.08% | +4.31% | n/a | ||||
Including sales charge | -1.15% | +3.13% | +3.83% | n/a | ||||
Class C (Est. Nov. 29, 1995) | ||||||||
Excluding sales charge | +2.67% | +3.29% | +3.51% | n/a | ||||
Including sales charge | +1.67% | +3.29% | +3.51% | n/a | ||||
Institutional Class (Est. Dec. 31, 2013) | ||||||||
Excluding sales charge | +3.57% | n/a | n/a | +7.81% | ||||
Including sales charge | +3.57% | n/a | n/a | +7.81% | ||||
Barclays Municipal Bond Index* | +2.52% | +3.96% | +4.49% | +5.99% | ||||
*The benchmark lifetime return is for Institutional Class share comparison only and is calculated using the last business day in the month of the Fund’s Institutional Class inception date.
1 Returns reflect the reinvestment of all distributions and are presented both with and without the applicable sales charges described below. Returns do not reflect the deduction of taxes the shareholder would pay on Fund distributions or redemptions of Fund shares.
Expense limitations were in effect for certain classes during some or all of the periods shown in the “Fund and benchmark performance” table. Expenses for each class are listed on the “Fund expense ratios” table on page 25. Performance would have been lower had expense limitations not been in effect.
Class A shares are sold with a maximum front-end sales charge of 4.50%, and have an annual distribution and service fee of 0.25% of average daily net assets. The Board has adopted a formula for calculating 12b-1 plan fees for the Fund’s Class A shares. The Fund’s Class A shares are currently subject to a blended 12b-1 fee equal to the sum of: (i) 0.10% of average daily net assets
representing shares acquired prior to June 1, 1992, and (ii) 0.25% of average daily net assets representing shares acquired on or after June 1, 1992. All Class A shares currently bear 12b-1 fees at the same rate, the blended rate, currently 0.24% of average daily net assets, based on the formula described above. This method of calculating Class A 12b-1 fees may be discontinued at the sole discretion of the Board. Performance for Class A shares, excluding sales charges, assumes that no front-end sales charge applied.
Class C shares are sold with a contingent deferred sales charge of 1.00% if redeemed during the first 12 months. They are also subject to an annual distribution and service fee of 1.00% of average daily net assets. Performance for Class C shares, excluding sales charges, assumes either that contingent deferred sales charges did not apply or that the investment was not redeemed.
24
Table of Contents
Institutional Class shares are available without sales or asset-based distribution charges only to certain eligible institutional accounts.
Fixed income securities and bond funds can lose value, and investors can lose principal, as interest rates rise. They also may be affected by economic conditions that hinder an issuer’s ability to make interest and principal payments on its debt.
The Fund may also be subject to prepayment risk, the risk that the principal of a fixed income security that is held by the Fund may be prepaid prior to maturity, potentially forcing the Fund to reinvest that money at a lower interest rate.
Funds that invest primarily in one state may be more susceptible to the economic, regulatory, and other factors of that state than funds that invest more broadly.
Substantially all dividend income derived from tax-free funds is exempt from federal income tax. Some income may be subject to the federal alternative minimum tax (AMT) that applies to certain investors. Capital gains, if any, are taxable.
Bond ratings are determined by a nationally recognized statistical rating organization.
Duration number will change as market conditions change. Therefore, duration should not be solely relied upon to indicate a municipal bond fund’s potential volatility.
Per Standard & Poor’s credit rating agency, bonds rated AA and A are more susceptible to the adverse effects of changes in circumstances and economic conditions than those in the higher-rated AAA category, but the obligor’s capacity to meet its financial commitment on the obligation is still strong. Bonds rated BBB exhibit adequate protection parameters, although adverse economic conditions or changing circumstances are more likely to lead to a weakened capacity of the obligor to meet its financial commitments. Bonds rated BB, B, and CCC are regarded as having significant speculative characteristics, with BB indicating the least degree of speculation of the three.
2 The Fund’s expense ratios, as described in the most recent prospectus, are disclosed in the following “Fund expense ratios” table. Delaware Management Company has agreed to reimburse certain expenses and/or waive certain fees in order to prevent total annual fund operating expenses (excluding any 12b-1 fees, taxes, interest, short sale and dividend interest expenses, brokerage fees, certain insurance costs, acquired fund fees and expenses, and nonroutine expenses or costs, including, but not limited to, those relating to reorganizations, litigation, conducting shareholder meetings, and liquidations (collectively, nonroutine expenses)) from exceeding 0.64% of the Fund’s average daily net assets during the period from Sept. 1, 2014 through Aug. 31, 2015.* Please see the most recent prospectus and any applicable supplement(s) for additional information on these fee waivers and/or reimbursements.
| Fund expense ratios | Class A | Class C | Institutional Class | ||||||||||||||||
Total annual operating expenses (without fee waivers) | 0.95% | 1.71% | 0.71% | ||||||||||||||||
Net expenses (including fee waivers, if any) | 0.88% | 1.64% | 0.64% | ||||||||||||||||
Type of waiver | Contractual | Contractual | Contractual | ||||||||||||||||
*The contractual waiver period is from June 28, 2012, through Dec. 29, 2015.
25
Table of Contents
Performance summaries
Delaware Tax-Free Pennsylvania Fund
Performance of a $10,000 investment1
Average annual total returns from Aug. 31, 2005, through Aug. 31, 2015
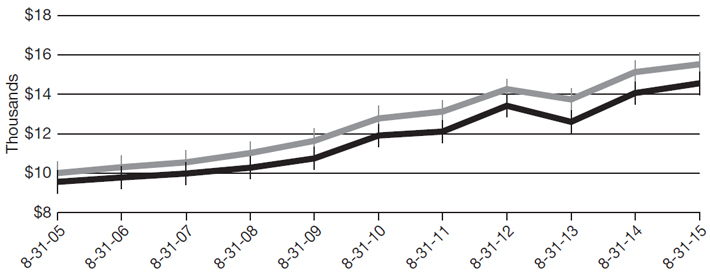
| For period beginning Aug. 31, 2005, through Aug. 31, 2015 | Starting value | Ending value | ||||||
| $10,000 | $15,513 | ||||||
| $9,550 | $14,556 | ||||||
 Barclays Municipal Bond Index
 Delaware Tax-Free Pennsylvania Fund — Class A shares
1The “Performance of a $10,000 investment” graph assumes $10,000 invested in Class A shares of the Fund on Aug. 31, 2005, and includes the effect of a 4.50% front-end sales charge and the reinvestment of all distributions. The graph does not reflect the deduction of taxes the shareholders would pay on Fund distributions or redemptions of Fund shares. Expense limitations were in effect for some or all of the periods shown. Performance would have been lower had expense limitations not been in effect. Expenses are listed in the “Fund expense ratios” table on page 25. Please note additional details on pages 24 through 26.
The graph also assumes $10,000 invested in the Barclays Municipal Bond Index as of Aug. 31, 2005. The Barclays Municipal Bond Index measures the total return performance of the long-term, investment grade tax-exempt bond market.
Index performance returns do not reflect any management fees, transaction costs, or expenses. Indices are unmanaged and one cannot invest directly in an index. Past performance is not a guarantee of future results.
Performance of other Fund classes will vary due to different charges and expenses.
Nasdaq symbols | CUSIPs | |||||
Class A | DELIX | 233216100 | ||||
Class C | DPTCX | 233216308 | ||||
Institutional Class
| DTPIX | 24609H701 |
26
Table of Contents
For the six-month period from March 1, 2015 to August 31, 2015 (Unaudited)
As a shareholder of a Fund, you incur two types of costs: (1) transaction costs, including sales charges (loads) on purchase payments, reinvested dividends, or other distributions; redemption fees; and exchange fees; and (2) ongoing costs, including management fees; distribution and/or service (12b-1) fees; and other Fund expenses. These following examples are intended to help you understand your ongoing costs (in dollars) of investing in a Fund and to compare these costs with the ongoing costs of investing in other mutual funds.
The examples are based on an investment of $1,000 invested at the beginning of the period and held for the entire six-month period from March 1, 2015 to Aug. 31, 2015.
Actual expenses
The first section of the tables shown, “Actual Fund return,” provides information about actual account values and actual expenses. You may use the information in this section of the table, together with the amount you invested, to estimate the expenses that you paid over the period. Simply divide your account value by $1,000 (for example, an $8,600 account value divided by $1,000 = 8.6), then multiply the result by the number in the first section under the heading entitled “Expenses Paid During Period” to estimate the expenses you paid on your account during this period.
Hypothetical example for comparison purposes
The second section of the tables shown, “Hypothetical 5% return,” provides information about hypothetical account values and hypothetical expenses based on the Funds’ actual expense ratios and an assumed rate of return of 5% per year before expenses, which is not the Funds’ actual return. The hypothetical account values and expenses may not be used to estimate the actual ending account balance or expenses you paid for the period. You may use this information to compare the ongoing costs of investing in each Fund and other funds. To do so, compare this 5% hypothetical example with the 5% hypothetical examples that appear in the shareholder reports of the other funds.
Please note that the expenses shown in the tables are meant to highlight your ongoing costs only and do not reflect any transactional costs, such as sales charges (loads), redemption fees, or exchange fees. Therefore, the second section of each table is useful in comparing ongoing costs only, and will not help you determine the relative total costs of owning different funds. In addition, if these transactional costs were included, your costs would have been higher. The Funds’ expenses shown in the tables reflect fee waivers in effect. The expenses shown in each table assume reinvestment of all dividends and distributions.
27
Table of Contents
Disclosure of Fund expenses
For the six-month period from March 1, 2015 to August 31, 2015 (Unaudited)
Delaware Tax-Free Arizona Fund
Expense analysis of an investment of $1,000
| Beginning Account Value 3/1/15 | Ending Account Value 8/31/15 | Annualized Expense Ratio | Expenses Paid During Period 3/1/15 to 8/31/15* | |||||||||||||||||
Actual Fund return† | ||||||||||||||||||||
Class A | $ | 1,000.00 | $ | 1,003.40 | 0.85 | % | $ | 4.29 | ||||||||||||
Class C | 1,000.00 | 998.80 | 1.60 | % | 8.06 | |||||||||||||||
Institutional Class | 1,000.00 | 1,004.70 | 0.60 | % | 3.03 | |||||||||||||||
Hypothetical 5% return (5% return before expenses) | ||||||||||||||||||||
Class A | $ | 1,000.00 | $ | 1,020.92 | 0.85 | % | $ | 4.33 | ||||||||||||
Class C | 1,000.00 | 1,017.14 | 1.60 | % | 8.13 | |||||||||||||||
Institutional Class | 1,000.00 | 1,022.18 | 0.60 | % | 3.06 | |||||||||||||||
Delaware Tax-Free California Fund
Expense analysis of an investment of $1,000
| Beginning Account Value 3/1/15 | Ending Account Value 8/31/15 | Annualized Expense Ratio | Expenses Paid During Period 3/1/15 to 8/31/15* | |||||||||||||||||
Actual Fund return† | ||||||||||||||||||||
Class A | $ | 1,000.00 | $ | 1,007.60 | 0.83 | % | $ | 4.20 | ||||||||||||
Class C | 1,000.00 | 1,003.80 | 1.58 | % | 7.98 | |||||||||||||||
Institutional Class | 1,000.00 | 1,008.80 | 0.58 | % | 2.94 | |||||||||||||||
Hypothetical 5% return (5% return before expenses) | ||||||||||||||||||||
Class A | $ | 1,000.00 | $ | 1,021.02 | 0.83 | % | $ | 4.23 | ||||||||||||
Class C | 1,000.00 | 1,017.24 | 1.58 | % | 8.03 | |||||||||||||||
Institutional Class | 1,000.00 | 1,022.28 | 0.58 | % | 2.96 | |||||||||||||||
28
Table of Contents
Delaware Tax-Free Colorado Fund
Expense analysis of an investment of $1,000
| Beginning Account Value 3/1/15 | Ending Account Value 8/31/15 | Annualized Expense Ratio | Expenses Paid During Period 3/1/15 to 8/31/15* | |||||||||||||||||
Actual Fund return† | ||||||||||||||||||||
Class A | $ | 1,000.00 | $ | 1,003.10 | 0.85 | % | $ | 4.29 | ||||||||||||
Class C | 1,000.00 | 999.40 | 1.60 | % | 8.06 | |||||||||||||||
Institutional Class | 1,000.00 | 1,004.30 | 0.60 | % | 3.03 | |||||||||||||||
Hypothetical 5% return (5% return before expenses) | ||||||||||||||||||||
Class A | $ | 1,000.00 | $ | 1,020.92 | 0.85 | % | $ | 4.33 | ||||||||||||
Class C | 1,000.00 | 1,017.14 | 1.60 | % | 8.13 | |||||||||||||||
Institutional Class | 1,000.00 | 1,022.18 | 0.60 | % | 3.06 | |||||||||||||||
Delaware Tax-Free Idaho Fund
Expense analysis of an investment of $1,000
| Beginning Account Value 3/1/15 | Ending Account Value 8/31/15 | Annualized Expense Ratio | Expenses Paid During Period 3/1/15 to 8/31/15* | |||||||||||||||||
Actual Fund return† | ||||||||||||||||||||
Class A | $ | 1,000.00 | $ | 1,004.70 | 0.88 | % | $ | 4.45 | ||||||||||||
Class C | 1,000.00 | 1,000.90 | 1.63 | % | 8.22 | |||||||||||||||
Institutional Class | 1,000.00 | 1,006.00 | 0.63 | % | 3.19 | |||||||||||||||
Hypothetical 5% return (5% return before expenses) | ||||||||||||||||||||
Class A | $ | 1,000.00 | $ | 1,020.77 | 0.88 | % | $ | 4.48 | ||||||||||||
Class C | 1,000.00 | 1,016.99 | 1.63 | % | 8.29 | |||||||||||||||
Institutional Class | 1,000.00 | 1,022.03 | 0.63 | % | 3.21 | |||||||||||||||
29
Table of Contents
Disclosure of Fund expenses
For the six-month period from March 1, 2015 to August 31, 2015 (Unaudited)
Delaware Tax-Free New York Fund
Expense analysis of an investment of $1,000
| Beginning Account Value 3/1/15 | Ending Account Value 8/31/15 | Annualized Expense Ratio | Expenses Paid During Period 3/1/15 to 8/31/15* | |||||||||||||||||
Actual Fund return† | ||||||||||||||||||||
Class A | $ | 1,000.00 | $ | 1,003.20 | 0.85 | % | $ | 4.29 | ||||||||||||
Class C | 1,000.00 | 999.40 | 1.60 | % | 8.06 | |||||||||||||||
Institutional Class | 1,000.00 | 1,004.50 | 0.60 | % | 3.03 | |||||||||||||||
Hypothetical 5% return (5% return before expenses) | ||||||||||||||||||||
Class A | $ | 1,000.00 | $ | 1,020.92 | 0.85 | % | $ | 4.33 | ||||||||||||
Class C | 1,000.00 | 1,017.14 | 1.60 | % | 8.13 | |||||||||||||||
Institutional Class | 1,000.00 | 1,022.18 | 0.60 | % | 3.06 | |||||||||||||||
Delaware Tax-Free Pennsylvania Fund
Expense analysis of an investment of $1,000
| Beginning Account Value 3/1/15 | Ending Account Value 8/31/15 | Annualized Expense Ratio | Expenses Paid During Period 3/1/15 to 8/31/15* | |||||||||||||||||
Actual Fund return† | ||||||||||||||||||||
Class A | $ | 1,000.00 | $ | 1,005.80 | 0.89 | % | $ | 4.50 | ||||||||||||
Class C | 1,000.00 | 1,002.00 | 1.65 | % | 8.33 | |||||||||||||||
Institutional Class | 1,000.00 | 1,007.00 | 0.65 | % | 3.29 | |||||||||||||||
Hypothetical 5% return (5% return before expenses) | ||||||||||||||||||||
Class A | $ | 1,000.00 | $ | 1,020.72 | 0.89 | % | $ | 4.53 | ||||||||||||
Class C | 1,000.00 | 1,016.89 | 1.65 | % | 8.39 | |||||||||||||||
Institutional Class | 1,000.00 | 1,021.93 | 0.65 | % | 3.31 | |||||||||||||||
* “Expenses Paid During Period” are equal to the relevant Fund’s annualized expense ratio, multiplied by the average account value over the period, multiplied by 184/365 (to reflect the one-half year period).
| † | Because actual returns reflect only the most recent six-month period, the returns shown may differ significantly from fiscal year returns. |
30
Table of Contents
| Security type / sector / state / territory allocations | ||
| Delaware Tax-Free Arizona Fund | As of August 31, 2015 (Unaudited) | |
Sector designations may be different than the sector designations presented in other fund materials.
| Security type / sector | Percentage of net assets | ||||||
Municipal Bonds* | 97.17 | % | |||||
Corporate Revenue Bonds | 7.69 | % | |||||
Education Revenue Bonds | 21.96 | % | |||||
Electric Revenue Bonds | 9.12 | % | |||||
Healthcare Revenue Bonds | 15.92 | % | |||||
Lease Revenue Bonds | 5.62 | % | |||||
Local General Obligation Bonds | 1.08 | % | |||||
Pre-Refunded Bonds | 14.90 | % | |||||
Special Tax Revenue Bonds | 8.55 | % | |||||
Transportation Revenue Bonds | 6.03 | % | |||||
Water & Sewer Revenue Bonds | 6.30 | % | |||||
Short-Term Investment | 0.18 | % | |||||
Total Value of Securities | 97.35 | % | |||||
Receivables and Other Assets Net of Liabilities | 2.65 | % | |||||
Total Net Assets | 100.00 | % | |||||
* As of the date of this report, Delaware Tax-Free Arizona Fund held bonds issued by or on behalf of territories and the states of the United States as follows:
| State / territory | Percentage of net assets | ||||||
Arizona | 93.85 | % | |||||
Guam | 1.61 | % | |||||
Puerto Rico | 1.89 | % | |||||
Total | 97.35 | % | |||||
31
Table of Contents
| Security type / sector / state / territory allocations | ||
| Delaware Tax-Free California Fund | As of August 31, 2015 (Unaudited) | |
Sector designations may be different than the sector designations presented in other fund materials.
| Security type / sector | Percentage of net assets | ||||||
Municipal Bonds* | 97.80 | % | |||||
Corporate Revenue Bonds | 4.62 | % | |||||
Education Revenue Bonds | 15.48 | % | |||||
Electric Revenue Bonds | 5.99 | % | |||||
Healthcare Revenue Bonds | 16.53 | % | |||||
Housing Revenue Bonds | 5.71 | % | |||||
Lease Revenue Bonds | 11.30 | % | |||||
Local General Obligation Bonds | 6.78 | % | |||||
Pre-Refunded/Escrowed to Maturity Bonds | 3.19 | % | |||||
Resource Recovery Revenue Bond | 1.33 | % | |||||
Special Tax Revenue Bonds | 9.01 | % | |||||
State General Obligation Bonds | 7.38 | % | |||||
Transportation Revenue Bonds | 6.14 | % | |||||
Water & Sewer Revenue Bonds | 4.34 | % | |||||
Short-Term Investments | 2.04 | % | |||||
Total Value of Securities | 99.84 | % | |||||
Receivables and Other Assets Net of Liabilities | 0.16 | % | |||||
Total Net Assets | 100.00 | % | |||||
* As of the date of this report, Delaware Tax-Free California Fund held bonds issued by or on behalf of territories and the states of the United States as follows:
| State / territory | Percentage of net assets | ||||||
California | 99.44 | % | |||||
U.S. Virgin Islands | 0.40 | % | |||||
Total | 99.84 | % | |||||
32
Table of Contents
| Security type / sector / state / territory allocations | ||
| Delaware Tax-Free Colorado Fund | As of August 31, 2015 (Unaudited) | |
Sector designations may be different than the sector designations presented in other fund materials.
| Security type / sector | Percentage of net assets | ||||||
Municipal Bonds* | 96.66 | % | |||||
Corporate Revenue Bond | 2.07 | % | |||||
Education Revenue Bonds | 10.49 | % | |||||
Electric Revenue Bonds | 4.93 | % | |||||
Healthcare Revenue Bonds | 33.41 | % | |||||
Housing Revenue Bonds | 0.48 | % | |||||
Lease Revenue Bonds | 3.45 | % | |||||
Local General Obligation Bonds | 9.34 | % | |||||
Pre-Refunded Bonds | 6.85 | % | |||||
Special Tax Revenue Bonds | 13.75 | % | |||||
Transportation Revenue Bonds | 11.22 | % | |||||
Water & Sewer Revenue Bonds | 0.67 | % | |||||
Short-Term Investments | 1.81 | % | |||||
Total Value of Securities | 98.47 | % | |||||
Receivables and Other Assets Net of Liabilities | 1.53 | % | |||||
Total Net Assets | 100.00 | % | |||||
* As of the date of this report, Delaware Tax-Free Colorado Fund held bonds issued by or on behalf of territories and the states of the United States as follows:
| State / territory | Percentage of net assets | ||||||
Colorado | 94.14 | % | |||||
Guam | 1.66 | % | |||||
Puerto Rico | 1.09 | % | |||||
U.S. Virgin Islands | 0.60 | % | |||||
Total | 97.49 | % | |||||
33
Table of Contents
| Security type / sector / state / territory allocations | ||
| Delaware Tax-Free Idaho Fund | As of August 31, 2015 (Unaudited) | |
Sector designations may be different than the sector designations presented in other fund materials.
| Security type / sector | Percentage of net assets | ||||||
Municipal Bonds* | 98.95 | % | |||||
Corporate Revenue Bonds | 5.42 | % | |||||
Education Revenue Bonds | 11.93 | % | |||||
Electric Revenue Bond | 2.10 | % | |||||
Healthcare Revenue Bonds | 11.81 | % | |||||
Housing Revenue Bonds | 2.36 | % | |||||
Lease Revenue Bonds | 6.94 | % | |||||
Local General Obligation Bonds | 27.30 | % | |||||
Pre-Refunded Bonds | 8.57 | % | |||||
Special Tax Revenue Bonds | 14.25 | % | |||||
Transportation Revenue Bonds | 7.20 | % | |||||
Water & Sewer Revenue Bonds | 1.07 | % | |||||
Total Value of Securities | 98.95 | % | |||||
Receivables and Other Assets Net of Liabilities | 1.05 | % | |||||
Total Net Assets | 100.00 | % | |||||
* As of the date of this report, Delaware Tax-Free Idaho Fund held bonds issued by or on behalf of territories and the states of the United States as follows:
| State / territory | Percentage of net assets | ||||||
Guam | 2.73 | % | |||||
Idaho | 92.18 | % | |||||
Puerto Rico | 2.10 | % | |||||
U.S. Virgin Islands | 1.94 | % | |||||
Total | 98.95 | % | |||||
34
Table of Contents
Security type / sector / state / territory allocations
| Delaware Tax-Free New York Fund | As of August 31, 2015 (Unaudited) |
Sector designations may be different than the sector designations presented in other fund materials.
| Security type / sector | Percentage of net assets | ||||
Municipal Bonds* | 97.61% | ||||
Corporate Revenue Bonds | 8.00% | ||||
Education Revenue Bonds | 23.69% | ||||
Electric Revenue Bonds | 2.50% | ||||
Healthcare Revenue Bonds | 17.85% | ||||
Housing Revenue Bond | 0.44% | ||||
Lease Revenue Bonds | 9.23% | ||||
Local General Obligation Bonds | 6.29% | ||||
Pre-Refunded Bonds | 4.05% | ||||
Resource Recovery Revenue Bond | 0.43% | ||||
Special Tax Revenue Bonds | 14.14% | ||||
State General Obligation Bonds | 0.83% | ||||
Transportation Revenue Bonds | 8.15% | ||||
Water & Sewer Revenue Bonds | 2.01% | ||||
Short-Term Investment | 1.46% | ||||
Total Value of Securities | 99.07% | ||||
Receivables and Other Assets Net of Liabilities | 0.93% | ||||
Total Net Assets | 100.00% | ||||
* As of the date of this report, Delaware Tax-Free New York Fund held bonds issued by or on behalf of territories and the states of the United States as follows: |
| State / territory | Percentage of net assets | ||||
Guam | 0.32% | ||||
New York | 98.02% | ||||
Puerto Rico | 0.60% | ||||
U.S. Virgin Islands | 0.13% | ||||
Total | 99.07% | ||||
35
Table of Contents
Security type / sector / state / territory allocations
| Delaware Tax-Free Pennsylvania Fund | As of August 31, 2015 (Unaudited) |
Sector designations may be different than the sector designations presented in other fund materials.
| Security type / sector | Percentage of net assets | ||||
Municipal Bonds | 98.74% | ||||
Corporate Revenue Bonds | 5.59% | ||||
Education Revenue Bonds | 22.29% | ||||
Electric Revenue Bonds | 0.64% | ||||
Healthcare Revenue Bonds | 23.84% | ||||
Housing Revenue Bonds | 1.75% | ||||
Lease Revenue Bonds | 3.63% | ||||
Local General Obligation Bonds | 6.89% | ||||
Pre-Refunded/Escrowed to Maturity Bonds | 13.80% | ||||
Resource Recovery Revenue Bonds | 1.08% | ||||
Special Tax Revenue Bonds | 3.24% | ||||
State General Obligation Bonds | 2.46% | ||||
Transportation Revenue Bonds | 10.45% | ||||
Water & Sewer Revenue Bonds | 3.08% | ||||
Total Value of Securities | 98.74% | ||||
Receivables and Other Assets Net of Liabilities | 1.26% | ||||
Total Net Assets | 100.00% | ||||
* As of the date of this report, Delaware Tax-Free Pennsylvania Fund held bonds issued by or on behalf of territories and the states of the United States as follows: |
| State / territory | Percentage of net assets | ||||
Guam | 0.71% | ||||
Pennsylvania | 97.15% | ||||
Puerto Rico | 0.88% | ||||
Total | 98.74% | ||||
36
Table of Contents
| Delaware Tax-Free Arizona Fund | August 31, 2015 |
| Principal amount° | Value (U.S. $) | |||||||
| ||||||||
Municipal Bonds – 97.17% | ||||||||
| ||||||||
Corporate Revenue Bonds – 7.69% | ||||||||
Maricopa County Pollution Control | ||||||||
(Public Service - Palo Verde Project) Series B 5.20% 6/1/43 ● | 1,500,000 | $ | 1,663,935 | |||||
Navajo County Pollution Control Revenue | ||||||||
(Arizona Public Services-Cholla) Series D 5.75% 6/1/34 ● | 1,500,000 | 1,556,445 | ||||||
Pima County Industrial Development Authority Pollution Control Revenue | ||||||||
(Tucson Electric Power) Series A 5.25% 10/1/40 | 2,000,000 | 2,197,780 | ||||||
Salt Verde Financial Senior Gas Revenue | ||||||||
5.00% 12/1/37 | 1,000,000 | 1,086,010 | ||||||
|
| |||||||
| 6,504,170 | ||||||||
|
| |||||||
Education Revenue Bonds – 21.96% | ||||||||
Arizona Health Facilities Authority Healthcare Education Revenue | ||||||||
(Kirksville College) 5.125% 1/1/30 | 1,500,000 | 1,658,040 | ||||||
Arizona State University | ||||||||
Series C 5.50% 7/1/25 | 330,000 | 380,077 | ||||||
Arizona State University Energy Management Revenue | ||||||||
(Arizona State University Tempe Campus II Project) 4.50% 7/1/24 | 1,000,000 | 1,065,860 | ||||||
Glendale Industrial Development Authority Revenue | ||||||||
(Midwestern University) | ||||||||
5.00% 5/15/31 | 645,000 | 709,629 | ||||||
5.125% 5/15/40 | 1,305,000 | 1,449,881 | ||||||
Northern Arizona University | ||||||||
5.00% 6/1/36 | 475,000 | 516,434 | ||||||
5.00% 6/1/41 | 1,240,000 | 1,341,420 | ||||||
Phoenix Industrial Development Authority | ||||||||
(Basis School Projects) 144A 5.00% 7/1/35 # | 1,000,000 | 1,012,340 | ||||||
(Choice Academies Project) 5.625% 9/1/42 | 1,250,000 | 1,311,463 | ||||||
(Eagle College Preparatory Project) Series A 5.00% 7/1/43 | 500,000 | 480,370 | ||||||
(Great Hearts Academic Project) | ||||||||
6.30% 7/1/42 | 500,000 | 529,285 | ||||||
6.40% 7/1/47 | 500,000 | 530,825 | ||||||
(Legacy Traditional Schools Project) Series A 144A 6.75% 7/1/44 # | 500,000 | 559,360 | ||||||
(Rowan University Project) 5.00% 6/1/42 | 2,000,000 | 2,136,680 | ||||||
Pima County Industrial Development Authority Education Revenue | ||||||||
(Edkey Charter School Project) 6.00% 7/1/48 | 1,000,000 | 954,430 | ||||||
(Tucson Country Day School Project) 5.00% 6/1/37 | 750,000 | 667,823 | ||||||
37
Table of Contents
Schedules of investments
Delaware Tax-Free Arizona Fund
| Principal amount° | Value (U.S. $) | |||||||
| ||||||||
Municipal Bonds (continued) | ||||||||
| ||||||||
Education Revenue Bonds (continued) | ||||||||
Tucson Industrial Development Authority Lease Revenue | ||||||||
(University of Arizona-Marshall Foundation) Series A 5.00% 7/15/27 (AMBAC) | 980,000 | $ | 980,931 | |||||
University of Arizona Board of Rights | ||||||||
Series A 5.00% 6/1/25 | 1,000,000 | 1,170,110 | ||||||
Series A 5.00% 6/1/38 | 1,000,000 | 1,118,270 | ||||||
|
| |||||||
| 18,573,228 | ||||||||
|
| |||||||
Electric Revenue Bonds – 9.12% | ||||||||
Maricopa County Pollution Control | ||||||||
(Southern California Education Co.) Series A 5.00% 6/1/35 | 2,400,000 | 2,686,584 | ||||||
Mesa Utilities System Revenue | ||||||||
5.00% 7/1/18 (NATL-RE) | 1,500,000 | 1,670,310 | ||||||
Pinal County Electric District No. 3 | ||||||||
5.25% 7/1/41 | 2,000,000 | 2,191,980 | ||||||
Salt River Project Agricultural Improvement & Power District Electric System Revenue | ||||||||
Series A 5.00% 12/1/30 | 1,000,000 | 1,161,870 | ||||||
|
| |||||||
| 7,710,744 | ||||||||
|
| |||||||
Healthcare Revenue Bonds – 15.92% | ||||||||
Arizona Health Facilities Authority Hospital System Revenue | ||||||||
(Banner Health) | ||||||||
Series A 5.00% 1/1/43 | 1,500,000 | 1,630,305 | ||||||
Series A 5.00% 1/1/44 | 1,000,000 | 1,100,730 | ||||||
(Phoenix Children’s Hospital) Series A 5.00% 2/1/34 | 995,000 | 1,057,446 | ||||||
(Scottsdale Lincoln Hospital Project) 5.00% 12/1/42 | 1,000,000 | 1,088,320 | ||||||
Maricopa County Industrial Development Authority Health Facilities Revenue | ||||||||
(Catholic Healthcare West) Series A 6.00% 7/1/39 | 2,500,000 | 2,828,625 | ||||||
Puerto Rico Industrial Tourist Educational Medical & Environmental Control Facilities Financing Authority | ||||||||
(Auxilio Mutuo) Series A 6.00% 7/1/33 | 1,615,000 | 1,594,845 | ||||||
Tempe Industrial Development Authority Revenue | ||||||||
(Friendship Village) Series A 6.25% 12/1/42 | 1,200,000 | 1,299,624 | ||||||
Yavapai County Industrial Development Authority Hospital Facility | ||||||||
(Yavapai Regional Medical Center) Series A 5.25% 8/1/33 | 2,000,000 | 2,197,320 | ||||||
Yuma Industrial Development Authority Hospital Revenue | ||||||||
(Yuma Regional Medical Center) Series A 5.00% 8/1/32 | 295,000 | 326,845 | ||||||
38
Table of Contents
| Principal amount° | Value (U.S. $) | |||||||
| ||||||||
Municipal Bonds (continued) | ||||||||
| ||||||||
Healthcare Revenue Bonds (continued) | ||||||||
Yuma Industrial Development Authority Hospital Revenue | ||||||||
(Yuma Regional Medical Center) Series A 5.25% 8/1/32 | 300,000 | $ | 338,802 | |||||
|
| |||||||
| 13,462,862 | ||||||||
|
| |||||||
Lease Revenue Bonds – 5.62% | ||||||||
Arizona Game & Fish Department & Community Beneficial Interest Certificates | ||||||||
(Administration Building Project) 5.00% 7/1/32 | 1,000,000 | 1,012,830 | ||||||
Arizona State Certificates of Participation Department Administration | ||||||||
Series A 5.25% 10/1/25 (AGM) | 1,500,000 | 1,680,270 | ||||||
Arizona State Sports & Tourism Authority | ||||||||
(Multipurpose Stadium Facility) Senior Series A 5.00% 7/1/36 | 1,000,000 | 1,056,160 | ||||||
Maricopa County Industrial Development Authority Correctional Contract Revenue | ||||||||
(Phoenix West Prison) Series B 5.375% 7/1/22 (ACA) | 1,000,000 | 1,005,920 | ||||||
|
| |||||||
| 4,755,180 | ||||||||
|
| |||||||
Local General Obligation Bond – 1.08% | ||||||||
City of Chandler | ||||||||
5.00% 7/1/23 | 750,000 | 913,290 | ||||||
|
| |||||||
| 913,290 | ||||||||
|
| |||||||
Pre-Refunded Bonds – 14.90% | ||||||||
Arizona Department of Transportation State Highway Fund Revenue | ||||||||
Series A 5.00% 7/1/29-18 § | 1,115,000 | 1,241,764 | ||||||
Series B 5.00% 7/1/32-18 § | 1,000,000 | 1,113,690 | ||||||
Arizona Transportation Board | ||||||||
(Maricopa County Regional Area Road) 5.00% 7/1/25-19 § | 1,000,000 | 1,145,380 | ||||||
Coconino & Yavapai Counties Joint Unified School District No. 9 | ||||||||
(Sedona Oak Creek Project of 2007) Series B 5.375% 7/1/28-19 § | 1,350,000 | 1,566,311 | ||||||
Gila County Unified School District No. 10 | ||||||||
(Payson School Improvement Project of 2006) Series A 5.25% 7/1/27-17 (AMBAC) § | 1,000,000 | 1,084,740 | ||||||
Glendale Industrial Development Authority Hospital Revenue | ||||||||
(John C. Lincoln Health) 5.00% 12/1/42-17 § | 2,205,000 | 2,414,960 | ||||||
Phoenix Civic Improvement Excise Tax Revenue | ||||||||
(Solid Waste Improvements) Series A 5.00% 7/1/19-16 (NATL-RE) § | 1,000,000 | 1,039,390 | ||||||
39
Table of Contents
Schedules of investments
Delaware Tax-Free Arizona Fund
| Principal amount° | Value (U.S. $) | |||||||
| ||||||||
Municipal Bonds (continued) | ||||||||
| ||||||||
Pre-Refunded Bonds (continued) | ||||||||
University of Arizona Medical Center Hospital Revenue | ||||||||
6.50% 7/1/39-19 § | 2,500,000 | $ | 2,994,400 | |||||
|
| |||||||
| 12,600,635 | ||||||||
|
| |||||||
Special Tax Revenue Bonds – 8.55% | ||||||||
Arizona Department of Transportation State Highway Fund Revenue | ||||||||
Subordinated Series A 5.00% 7/1/38 | 750,000 | 852,847 | ||||||
Flagstaff Aspen Place Sawmill Improvement District Revenue | ||||||||
5.00% 1/1/32 | 195,000 | 195,236 | ||||||
Gilbert Public Facilities Municipal Property Revenue | ||||||||
5.00% 7/1/25 | 1,250,000 | 1,398,188 | ||||||
Glendale Municipal Property Excise Tax Revenue | ||||||||
(Senior Lien) Series B 5.00% 7/1/33 | 570,000 | 634,991 | ||||||
Guam Government Business Privilege Tax Revenue | ||||||||
Series A 5.125% 1/1/42 | 545,000 | 587,826 | ||||||
Series A 5.25% 1/1/36 | 705,000 | 773,244 | ||||||
Marana Tangerine Farm Road Improvement District Revenue | ||||||||
4.60% 1/1/26 | 665,000 | 671,377 | ||||||
Mesa Excise Tax Revenue | ||||||||
5.00% 7/1/32 | 1,000,000 | 1,108,360 | ||||||
Queen Creek Improvement District No. 1 | ||||||||
5.00% 1/1/32 | 1,000,000 | 1,010,350 | ||||||
|
| |||||||
| 7,232,419 | ||||||||
|
| |||||||
Transportation Revenue Bonds – 6.03% | ||||||||
City of Glendale Transportation Excise Tax Revenue | ||||||||
5.00% 7/1/30 (AGM) | 1,000,000 | 1,141,720 | ||||||
Phoenix Civic Improvement Airport Revenue | ||||||||
(Junior Lien) Series A 5.25% 7/1/33 | 1,250,000 | 1,398,300 | ||||||
(Senior Lien) 5.00% 7/1/32 (AMT) | 1,750,000 | 1,935,990 | ||||||
Regional Public Transportation Authority | ||||||||
(Maricopa County Public Transportation) 5.25% 7/1/24 | 500,000 | 620,450 | ||||||
|
| |||||||
| 5,096,460 | ||||||||
|
| |||||||
Water & Sewer Revenue Bonds – 6.30% | ||||||||
Arizona Water Infrastructure Finance Authority | ||||||||
(Water Quality Revenue) Series A 5.00% 10/1/26 | 1,000,000 | 1,209,000 | ||||||
Phoenix Civic Improvement Wastewater Systems Revenue | ||||||||
(Junior Lien) | ||||||||
4.00% 7/1/17 | 1,750,000 | 1,858,973 | ||||||
5.00% 7/1/19 (NATL-RE) | 1,000,000 | 1,080,350 | ||||||
40
Table of Contents
| Principal amount° | Value (U.S. $) | |||||||
| ||||||||
Municipal Bonds (continued) | ||||||||
| ||||||||
Water & Sewer Revenue Bonds (continued) | ||||||||
Phoenix Civic Improvement Wastewater Systems Revenue | ||||||||
(Junior Lien) | ||||||||
Series B 5.00% 7/1/21 | 1,000,000 | $ | 1,184,060 | |||||
|
| |||||||
| 5,332,383 | ||||||||
|
| |||||||
Total Municipal Bonds (cost $77,158,649) | 82,181,371 | |||||||
|
| |||||||
| ||||||||
Short-Term Investment – 0.18% | ||||||||
| ||||||||
Variable Rate Demand Note – 0.18%¤ | ||||||||
Phoenix Industrial Development Authority (Southwest Human Development Project) | ||||||||
0.12% 4/1/28 (LOC - Wells Fargo Bank N.A.) | 150,000 | 150,000 | ||||||
|
| |||||||
Total Short-Term Investment (cost $150,000) | 150,000 | |||||||
|
| |||||||
Total Value of Securities – 97.35% | ||||||||
(cost $77,308,649) | $ | 82,331,371 | ||||||
|
| |||||||
| # | Security exempt from registration under Rule 144A of the Securities Act of 1933, as amended. At Aug. 31, 2015, the aggregate value of Rule 144A securities was $1,571,700, which represents 1.86% of the Fund’s net assets. See Note 8 in “Notes to financial statements.” |
| ¤ | Tax-exempt obligations that contain a floating or variable interest rate adjustment formula and an unconditional right of demand to receive payment of the unpaid principal balance plus accrued interest upon a short notice period (generally up to 30 days) prior to specified dates either from the issuer or by drawing on a bank letter of credit, a guarantee, or insurance issued with respect to such instrument. The rate shown is the rate as of Aug. 31, 2015. |
| ° | Principal amount shown is stated in U.S. dollars unless noted that the security is denominated in another currency. |
| ● | Variable rate security. The rate shown is the rate as of Aug. 31, 2015. Interest rates reset periodically. |
| § | Pre-refunded bonds. Municipal bonds that are generally backed or secured by U.S. Treasury bonds. For pre-refunded bonds, the stated maturity is followed by the year in which the bond is pre-refunded. See Note 8 in “Notes to financial statements.” |
41
Table of Contents
Schedules of investments
Delaware Tax-Free Arizona Fund
Summary of abbreviations:
ACA – Insured by American Capital Access
AGM – Insured by Assured Guaranty Municipal Corporation
AMBAC – Insured by AMBAC Assurance Corporation
AMT – Subject to Alternative Minimum Tax
LOC – Letter of Credit
N.A. – North America
NATL-RE – Insured by National Public Finance Guarantee Corporation
See accompanying notes, which are an integral part of the financial statements.
42
Table of Contents
Schedules of investments
| Delaware Tax-Free California Fund | August 31, 2015 |
| Principal amount° | Value (U.S. $) | |||||||
| ||||||||
Municipal Bonds – 97.80% | ||||||||
| ||||||||
Corporate Revenue Bonds – 4.62% | ||||||||
Chula Vista Industrial Development Revenue | ||||||||
(San Diego Gas & Electric) Series D 5.875% 1/1/34 | 1,000,000 | $ | 1,147,820 | |||||
Golden State Tobacco Securitization Settlement Revenue | ||||||||
(Asset-Backed Senior Notes) Series A-1 5.75% 6/1/47 | 2,005,000 | 1,723,237 | ||||||
(Enhanced Asset-Backed) Series A 5.00% 6/1/29 | 1,000,000 | 1,138,080 | ||||||
|
| |||||||
| 4,009,137 | ||||||||
|
| |||||||
Education Revenue Bonds – 15.48% | ||||||||
California Municipal Finance Authority | ||||||||
(American Heritage Education Foundation Project) Series A 5.25% 6/1/36 | 1,000,000 | 1,004,150 | ||||||
(Bowles Hall Foundation) Series A 5.00% 6/1/35 | 210,000 | 229,108 | ||||||
(California Baptist University) Series A 144A 5.375% 11/1/40 # | 1,000,000 | 1,003,030 | ||||||
(Julian Charter School Project) Series A 144A 5.625% 3/1/45 # | 500,000 | 496,085 | ||||||
(Southwestern Law School) 6.50% 11/1/41 | 1,140,000 | 1,355,631 | ||||||
(Touro College & University System) Series A 5.25% 1/1/40 | 920,000 | 983,857 | ||||||
California School Finance Authority | ||||||||
(KIPP Louisiana Projects) | ||||||||
5.00% 7/1/35 | 750,000 | 797,265 | ||||||
Series A 5.125% 7/1/44 | 1,000,000 | 1,056,540 | ||||||
(Partnerships to Uplift Communities Valley Project) Series A 6.75% 8/1/44 | 1,000,000 | 1,139,980 | ||||||
(View Park Elementary & Middle Schools) Series A 5.625% 10/1/34 | 575,000 | 586,230 | ||||||
California Statewide Communities Development Authority Charter School Revenue | ||||||||
(Green Dot Public Schools) Series A 7.25% 8/1/41 | 800,000 | 927,528 | ||||||
California Statewide Communities Development Authority Revenue | ||||||||
(Aspire Public Schools Project) 6.00% 7/1/40 | 1,000,000 | 1,060,240 | ||||||
(California Baptist University) Series A 6.125% 11/1/33 | 750,000 | 812,213 | ||||||
(University of California East Irvine Campus Apartments) 5.375% 5/15/38 | 1,000,000 | 1,104,050 | ||||||
Mt. San Antonio Community College District Convertible Capital Appreciation Election 2008 | ||||||||
5.875% 8/1/28 W | 1,000,000 | 868,800 | ||||||
|
| |||||||
| 13,424,707 | ||||||||
|
| |||||||
Electric Revenue Bonds – 5.99% | ||||||||
Anaheim Public Financing Authority Electric System District Facilities | ||||||||
Series A 5.00% 10/1/25 | 800,000 | 932,864 | ||||||
43
Table of Contents
Schedules of investments
Delaware Tax-Free California Fund
| Principal amount° | Value (U.S. $) | |||||||
| ||||||||
Municipal Bonds (continued) | ||||||||
| ||||||||
Electric Revenue Bonds (continued) | ||||||||
Imperial Irrigation District Electric System Revenue | ||||||||
Series A 5.25% 11/1/24 | 500,000 | $ | 577,460 | |||||
Series B 5.00% 11/1/36 | 250,000 | 282,715 | ||||||
Series C 5.25% 11/1/31 | 1,175,000 | 1,353,717 | ||||||
Southern California Public Power Authority Revenue | ||||||||
(Southern Transmission Project) Subordinate Series A 5.00% 7/1/22 | 1,000,000 | 1,116,730 | ||||||
Turlock Irrigation District Revenue | ||||||||
Series A 5.00% 1/1/30 | 830,000 | 932,472 | ||||||
|
| |||||||
| 5,195,958 | ||||||||
|
| |||||||
Healthcare Revenue Bonds – 16.53% | ||||||||
Abag Finance Authority for Nonprofit Corporations | ||||||||
(Episcopal Senior Communities) 6.125% 7/1/41 | 850,000 | 960,781 | ||||||
(Sharp Health Care) | ||||||||
6.25% 8/1/39 | 1,000,000 | 1,168,370 | ||||||
Series A 5.00% 8/1/26 | 300,000 | 340,017 | ||||||
Series A 5.00% 8/1/27 | 300,000 | 338,700 | ||||||
Series A 5.00% 8/1/28 | 250,000 | 281,155 | ||||||
California Health Facilities Financing Authority Revenue | ||||||||
(Catholic Health Care West) | ||||||||
Series A 6.00% 7/1/39 | 855,000 | 977,504 | ||||||
Series E 5.625% 7/1/25 | 1,000,000 | 1,140,960 | ||||||
(Children’s Hospital Los Angeles) Series A 5.00% 11/15/34 | 1,000,000 | 1,056,560 | ||||||
(St. Joseph Health System) Series A 5.75% 7/1/39 | 1,000,000 | 1,144,450 | ||||||
(Sutter Health) Series D 5.25% 8/15/31 | 1,000,000 | 1,169,370 | ||||||
California Statewide Communities Development Authority Revenue | ||||||||
(BE.Group) 144A 7.25% 11/15/41 # | 500,000 | 582,375 | ||||||
(Covenant Retirement Communities) Series C 5.625% 12/1/36 | 1,000,000 | 1,083,550 | ||||||
(Episcopal Communities & Services) | ||||||||
5.00% 5/15/27 | 500,000 | 556,870 | ||||||
5.00% 5/15/32 | 600,000 | 646,470 | ||||||
(Kaiser Permanente) Series A 5.00% 4/1/19 | 1,000,000 | 1,138,740 | ||||||
City of La Verne | ||||||||
(Brethren Hillcrest Homes) 5.00% 5/15/36 | 750,000 | 793,763 | ||||||
San Buenaventura Community Memorial Health Systems | ||||||||
7.50% 12/1/41 | 785,000 | 955,164 | ||||||
|
| |||||||
| 14,334,799 | ||||||||
|
| |||||||
44
Table of Contents
| Principal amount° | Value (U.S. $) | |||||||
| ||||||||
Municipal Bonds (continued) | ||||||||
| ||||||||
Housing Revenue Bonds – 5.71% | ||||||||
California Municipal Finance Authority Mobile Home Park Revenue | ||||||||
(Caritas Projects) | ||||||||
Series A 5.50% 8/15/47 | 750,000 | $ | 824,663 | |||||
Series A 6.40% 8/15/45 | 965,000 | 1,060,882 | ||||||
California Statewide Communities Development Multifamily Housing Authority Revenue | ||||||||
(Silver Ridge Apartments) Series H 5.80% 8/1/33 (FNMA) (AMT) ● | 985,000 | 987,512 | ||||||
Independent Cities Finance Authority | ||||||||
Series A 5.25% 5/15/44 | 1,000,000 | 1,079,620 | ||||||
Santa Clara County Multifamily Housing Authority Revenue | ||||||||
(Rivertown Apartments Project) Series A 5.85% 8/1/31 (AMT) | 1,000,000 | 1,000,700 | ||||||
|
| |||||||
| 4,953,377 | ||||||||
|
| |||||||
Lease Revenue Bonds – 11.30% | ||||||||
Abag Finance Authority for Nonprofit Corporations | ||||||||
(Jackson Laboratory) 5.00% 7/1/37 | 1,000,000 | 1,106,420 | ||||||
California Infrastructure & Economic Development Bank | ||||||||
(Infrastructure State Revolving Fund) Series A 5.00% 10/1/29 | 1,000,000 | 1,195,970 | ||||||
California Municipal Finance Authority | ||||||||
(Goodwill Industry of Sacramento Valley & Northern Nevada Project) 5.00% 1/1/35 | 635,000 | 637,025 | ||||||
California State Public Works Board Lease Revenue | ||||||||
(California State Prisons Los Angeles) Series C 5.00% 10/1/26 | 1,000,000 | 1,178,230 | ||||||
(General Services Buildings 8 & 9) Series A 6.25% 4/1/34 | 1,000,000 | 1,170,650 | ||||||
Elsinore Valley Municipal Water District | ||||||||
Series A 5.00% 7/1/24 (BHAC) | 1,000,000 | 1,106,760 | ||||||
San Diego Public Facilities Financing Authority Lease Revenue | ||||||||
(Master Project) Series A 5.25% 3/1/40 | 1,000,000 | 1,126,050 | ||||||
San Jose Financing Authority Lease Revenue | ||||||||
(Civic Center Project) Series A 5.00% 6/1/33 | 1,000,000 | 1,138,080 | ||||||
San Mateo Joint Powers Financing Authority Lease Revenue | ||||||||
(Capital Projects) Series A 5.25% 7/15/26 | 1,000,000 | 1,140,950 | ||||||
|
| |||||||
| 9,800,135 | ||||||||
|
| |||||||
45
Table of Contents
Schedules of investments
Delaware Tax-Free California Fund
| Principal amount° | Value (U.S. $) | |||||||
| ||||||||
Municipal Bonds (continued) | ||||||||
| ||||||||
Local General Obligation Bonds – 6.78% | ||||||||
Anaheim School District Capital Appreciation Election 2002 | ||||||||
4.58% 8/1/25 (NATL-RE) ^ | 1,000,000 | $ | 690,980 | |||||
Bonita Unified School District Election 2008 | ||||||||
Series B 5.25% 8/1/28 | 800,000 | 924,888 | ||||||
Central Unified School District Election 2008 | ||||||||
Series A 5.625% 8/1/33 (ASSURED GTY) | 1,000,000 | 1,137,580 | ||||||
Grossmont Union High School District Election 2004 | ||||||||
5.00% 8/1/33 | 1,000,000 | 1,087,660 | ||||||
Pittsburg Unified School District Financing Authority Revenue | ||||||||
(Pittsburg Unified School District Bond Program) 5.50% 9/1/46 (AGM) | 800,000 | 922,928 | ||||||
Santa Barbara Community College District Election 2008 | ||||||||
Series A 5.25% 8/1/33 | 1,000,000 | 1,114,330 | ||||||
|
| |||||||
| 5,878,366 | ||||||||
|
| |||||||
Pre-Refunded/Escrowed to Maturity Bonds – 3.19% | ||||||||
Bay Area Toll Authority Bridge Revenue | ||||||||
(San Francisco Bay Area) Series F-1 5.25% 4/1/27-19 § | 800,000 | 921,064 | ||||||
California Statewide Communities Development Authority Revenue | ||||||||
(Inland Regional Center Project) 5.375% 12/1/37-17 § | 1,350,000 | 1,491,737 | ||||||
Lancaster Redevelopment Agency | ||||||||
(Combined Redevelopment Project Areas) 6.875% 8/1/39-19 § | 285,000 | 348,429 | ||||||
|
| |||||||
| 2,761,230 | ||||||||
|
| |||||||
Resource Recovery Revenue Bond – 1.33% | ||||||||
South Bayside Waste Management Authority Revenue | ||||||||
(Shoreway Environmental Center) Series A 6.00% 9/1/36 | 1,000,000 | 1,150,540 | ||||||
|
| |||||||
| 1,150,540 | ||||||||
|
| |||||||
Special Tax Revenue Bonds – 9.01% | ||||||||
Commerce Joint Powers Financing Authority Revenue | ||||||||
Unrefunded (Redevelopment Project) Series A 5.00% 8/1/28 (ASSURED GTY) | 940,000 | 941,203 | ||||||
Fremont Community Facilities District No. 1 | ||||||||
(Special Tax Pacific Commons) 5.375% 9/1/36 | 1,000,000 | 1,000,000 | ||||||
Glendale Redevelopment Agency Tax Allocation Revenue | ||||||||
(Central Glendale Redevelopment Project) 5.50% 12/1/24 | 1,000,000 | 1,039,420 | ||||||
Lancaster Redevelopment Agency | ||||||||
Unrefunded (Combined Redevelopment Project Areas) 6.875% 8/1/39 | 215,000 | 247,467 | ||||||
46
Table of Contents
| Principal amount° | Value (U.S. $) | |||||||
| ||||||||
Municipal Bonds (continued) | ||||||||
| ||||||||
Special Tax Revenue Bonds (continued) | ||||||||
Rancho Santa Fe Community Services District Financing Authority Revenue Superior Lien | ||||||||
Series A 5.75% 9/1/30 | 800,000 | $ | 906,368 | |||||
Riverside County Redevelopment Agency Tax Allocation Housing | ||||||||
Series A 6.00% 10/1/39 | 1,000,000 | 1,153,300 | ||||||
Roseville Westpark Community Facilities District No. 1 | ||||||||
(Public Facilities) 5.25% 9/1/37 | 500,000 | 505,000 | ||||||
San Diego Redevelopment Agency Tax Allocation Revenue | ||||||||
(Naval Training Center) Series A 5.75% 9/1/40 | 1,000,000 | 1,114,520 | ||||||
Virgin Islands Public Finance Authority Revenue | ||||||||
(Senior Lien-Matching Fund Loan Note) Series A 5.00% 10/1/29 | 325,000 | 351,761 | ||||||
Yucaipa Special Tax Community Facilities District No. 98-1 | ||||||||
(Chapman Heights) 5.375% 9/1/30 | 500,000 | 556,920 | ||||||
|
| |||||||
| 7,815,959 | ||||||||
|
| |||||||
State General Obligation Bonds – 7.38% | ||||||||
California State | ||||||||
5.25% 11/1/40 | 1,000,000 | 1,165,700 | ||||||
Various Purposes | ||||||||
5.25% 3/1/30 | 1,000,000 | 1,158,340 | ||||||
5.25% 4/1/35 | 1,000,000 | 1,145,050 | ||||||
5.50% 4/1/18 | 1,000,000 | 1,118,840 | ||||||
6.00% 3/1/33 | 1,000,000 | 1,205,760 | ||||||
6.00% 4/1/38 | 515,000 | 600,258 | ||||||
|
| |||||||
| 6,393,948 | ||||||||
|
| |||||||
Transportation Revenue Bonds – 6.14% | ||||||||
Long Beach Marina System Revenue | ||||||||
5.00% 5/15/45 | 1,000,000 | 1,070,580 | ||||||
Los Angeles Department of Airports Subordinate | ||||||||
(Los Angeles International Airport) Series B 5.00% 5/15/33 | 1,000,000 | 1,136,450 | ||||||
Riverside County Transportation Commission Senior Lien | ||||||||
Series A 5.75% 6/1/44 | 500,000 | 565,965 | ||||||
San Diego Redevelopment Agency | ||||||||
(Centre City Redevelopment Project) Series A 6.40% 9/1/25 | 870,000 | 874,150 | ||||||
San Francisco Municipal Transportation Agency Revenue | ||||||||
Series B 5.00% 3/1/37 | 1,500,000 | 1,675,980 | ||||||
|
| |||||||
| 5,323,125 | ||||||||
|
| |||||||
47
Table of Contents
Schedules of investments
Delaware Tax-Free California Fund
| Principal amount° | Value (U.S. $) | |||||||
| ||||||||
Municipal Bonds (continued) | ||||||||
| ||||||||
Water & Sewer Revenue Bonds – 4.34% | ||||||||
California State Department of Water Resources | ||||||||
Unrefunded (Center Valley Project) Series AG 5.00% 12/1/28 | 75,000 | $ | 86,537 | |||||
San Diego Public Facilities Financing Authority Water Revenue | ||||||||
Subordinate Series A 5.00% 8/1/29 | 1,000,000 | 1,155,180 | ||||||
San Francisco City & County Public Utilities Commission Water Revenue | ||||||||
Series B 5.00% 11/1/26 | 800,000 | 914,440 | ||||||
(Water & Sewer Improvement) Subordinate Series A 5.00% 11/1/32 | 1,015,000 | 1,191,316 | ||||||
Semitropic Improvement District | ||||||||
(Second Lien) Series A 5.00% 12/1/22 (AGM) | 355,000 | 419,042 | ||||||
|
| |||||||
| 3,766,515 | ||||||||
|
| |||||||
Total Municipal Bonds (cost $77,412,049) | 84,807,796 | |||||||
|
| |||||||
| Number of shares | ||||||||
| ||||||||
Short-Term Investments – 2.04% | ||||||||
| ||||||||
Money Market Instrument – 0.88% | ||||||||
California Municipal Cash Trust | 765,396 | 765,396 | ||||||
|
| |||||||
| 765,396 | ||||||||
|
| |||||||
| Principal amount° | ||||||||
Variable Rate Demand Note – 1.16%¤ | ||||||||
California Infrastructure & Economic Development Bank Revenue (Los Angeles Museum) | ||||||||
0.01% 9/1/37 (LOC - Wells Fargo Bank N.A.) | 1,000,000 | 1,000,000 | ||||||
|
| |||||||
| 1,000,000 | ||||||||
|
| |||||||
Total Short-Term Investments (cost $1,765,396) | 1,765,396 | |||||||
|
| |||||||
Total Value of Securities – 99.84% | ||||||||
(cost $79,177,445) | $ | 86,573,192 | ||||||
|
| |||||||
| # | Security exempt from registration under Rule 144A of the Securities Act of 1933, as amended. At Aug. 31, 2015, the aggregate value of Rule 144A securities was $2,081,490, which represents 2.40% of the Fund’s net assets. See Note 8 in “Notes to financial statements.” |
| ¤ | Tax-exempt obligations that contain a floating or variable interest rate adjustment formula and an unconditional right of demand to receive payment of the unpaid principal balance plus accrued interest upon a short notice period (generally up to 30 days) prior to specified dates either from the issuer or by drawing on a bank letter of credit, a guarantee, or insurance issued with respect to such instrument. The rate shown is the rate as of Aug. 31, 2015. |
48
Table of Contents
| ° | Principal amount shown is stated in U.S. dollars unless noted that the security is denominated in another currency. |
| ● | Variable rate security. The rate shown is the rate as of Aug. 31, 2015. Interest rates reset periodically. |
| W | Step coupon bond. Indicates security that has a zero coupon that remains in effect until a predetermined date at which time the stated interest rate becomes effective. |
| ^ | Zero coupon security. The rate shown is the yield at the time of purchase. |
| § | Pre-refunded bonds. Municipal bonds that are generally backed or secured by U.S. Treasury bonds. For pre-refunded bonds, the stated maturity is followed by the year in which the bond is pre-refunded. See Note 8 in “Notes to financial statements.” |
Summary of abbreviations:
AGM – Insured by Assured Guaranty Municipal Corporation
AMT – Subject to Alternative Minimum Tax
ASSURED GTY – Insured by Assured Guaranty Corporation
BHAC – Insured by Berkshire Hathaway Assurance Company
FNMA – Federal National Mortgage Association Collateral
LOC – Letter of Credit
N.A. – North America
NATL-RE – Insured by National Public Finance Guarantee Corporation
See accompanying notes, which are an integral part of the financial statements.
49
Table of Contents
Schedules of investments
| Delaware Tax-Free Colorado Fund | August 31, 2015 |
| Principal amount° | Value (U.S. $) | |||||||
| ||||||||
Municipal Bonds – 96.66% | ||||||||
| ||||||||
Corporate Revenue Bond – 2.07% | ||||||||
Public Authority Energy Natural Gas Revenue | ||||||||
Series 2008 6.50% 11/15/38 | 3,000,000 | $ | 3,957,420 | |||||
|
| |||||||
| 3,957,420 | ||||||||
|
| |||||||
Education Revenue Bonds – 10.49% | ||||||||
Colorado Educational & Cultural Facilities Authority Revenue | ||||||||
144A 5.00% 7/1/36 # | 500,000 | 499,325 | ||||||
5.00% 11/1/44 | 890,000 | 901,045 | ||||||
144A 5.25% 7/1/46 # | 1,350,000 | 1,351,309 | ||||||
(Academy Charter School Project) | ||||||||
5.50% 5/1/36 (SGI) | 2,280,000 | 2,288,025 | ||||||
7.45% 8/1/48 | 1,000,000 | 1,165,160 | ||||||
(Atlas Preparatory Charter School) 144A 5.25% 4/1/45 # | 1,300,000 | �� | 1,245,400 | |||||
(Charter School Project) 5.00% 7/15/37 | 1,150,000 | 1,222,001 | ||||||
(Johnson & Wales University) Series A 5.25% 4/1/37 | 1,790,000 | 1,998,267 | ||||||
(Liberty Common Charter School Project) Series A 5.00% 1/15/39 | 1,000,000 | 1,071,240 | ||||||
(Littleton Preparatory Charter School Project) | ||||||||
5.00% 12/1/33 | 450,000 | 456,525 | ||||||
5.00% 12/1/42 | 540,000 | 539,158 | ||||||
(Pinnacle Charter School Project) 5.00% 6/1/26 | 700,000 | 788,753 | ||||||
(Skyview Charter School) | ||||||||
144A 5.375% 7/1/44 # | 860,000 | 903,731 | ||||||
144A 5.50% 7/1/49 # | 870,000 | 912,491 | ||||||
(University Lab Charter School) 144A 5.00% 12/15/45 # | 500,000 | 493,050 | ||||||
(Woodrow Wilson Charter School Project) 5.25% 12/1/34 (SGI) | 1,960,000 | 1,967,840 | ||||||
University of Colorado | ||||||||
Series A 5.00% 6/1/33 | 2,000,000 | 2,280,620 | ||||||
|
| |||||||
| 20,083,940 | ||||||||
|
| |||||||
Electric Revenue Bonds – 4.93% | ||||||||
Colorado Springs Utilities System Improvement Revenue | ||||||||
Series C 5.50% 11/15/48 | 3,250,000 | 3,621,377 | ||||||
Platte River Power Authority Revenue | ||||||||
Series HH 5.00% 6/1/27 | 2,795,000 | 3,149,993 | ||||||
Series HH 5.00% 6/1/29 | 2,355,000 | 2,658,866 | ||||||
|
| |||||||
| 9,430,236 | ||||||||
|
| |||||||
Healthcare Revenue Bonds – 33.41% | ||||||||
Aurora Hospital Revenue | ||||||||
(Children’s Hospital Association Project) Series D 5.00% 12/1/23 (AGM) | 2,775,000 | 3,037,182 | ||||||
50
Table of Contents
| Principal amount° | Value (U.S. $) | |||||||
| ||||||||
Municipal Bonds (continued) | ||||||||
| ||||||||
Healthcare Revenue Bonds (continued) | ||||||||
Colorado Health Facilities Authority Revenue | ||||||||
(Adventist Health/Sunbelt) 5.125% 11/15/24 ● | 1,375,000 | $ | 1,450,845 | |||||
(American Baptist) | ||||||||
7.625% 8/1/33 | 150,000 | 174,977 | ||||||
8.00% 8/1/43 | 1,000,000 | 1,179,120 | ||||||
(Catholic Health Initiatives) | ||||||||
Series A 5.00% 7/1/39 | 1,540,000 | 1,654,160 | ||||||
Series A 5.00% 2/1/41 | 2,250,000 | 2,424,937 | ||||||
Series A 5.25% 2/1/33 | 1,000,000 | 1,097,270 | ||||||
Series A 5.25% 1/1/45 | 3,000,000 | 3,264,960 | ||||||
Series C-1 5.10% 10/1/41 (AGM) | 2,000,000 | 2,112,880 | ||||||
Series D 6.25% 10/1/33 | 2,000,000 | 2,262,520 | ||||||
(Christian Living Community Project) | ||||||||
5.25% 1/1/37 | 1,500,000 | 1,537,215 | ||||||
6.375% 1/1/41 | 1,000,000 | 1,079,680 | ||||||
Series A 5.75% 1/1/37 | 1,500,000 | 1,521,855 | ||||||
(Covenant Retirement Communities) | ||||||||
Series A 5.00% 12/1/33 | 4,000,000 | 4,196,680 | ||||||
Series A 5.00% 12/1/35 | 1,000,000 | 1,064,640 | ||||||
(Craig Hospital Project) 5.00% 12/1/32 | 3,500,000 | 3,862,880 | ||||||
(Evangelical Lutheran) | ||||||||
5.00% 6/1/35 | 2,000,000 | 2,029,960 | ||||||
5.00% 12/1/42 | 2,500,000 | 2,611,100 | ||||||
5.00% 6/1/45 | 2,750,000 | 2,907,437 | ||||||
5.625% 6/1/43 | 1,150,000 | 1,260,952 | ||||||
(Mental Health Center Denver Project) Series A 5.75% 2/1/44 | 2,000,000 | 2,233,580 | ||||||
(National Jewish Health Project) 5.00% 1/1/27 | 300,000 | 310,257 | ||||||
(Parkview Medical Center) 5.00% 9/1/25 | 1,000,000 | 1,000,000 | ||||||
(SCL Health Systems) Series A 5.00% 1/1/44 | 3,050,000 | 3,373,422 | ||||||
(Sisters of Charity of Leavenworth Health System) | ||||||||
Series A 5.00% 1/1/40 | 1,155,000 | 1,262,415 | ||||||
Series B 5.25% 1/1/25 | 2,500,000 | 2,832,250 | ||||||
(Total Long-Term Care) | ||||||||
Series A 6.00% 11/15/30 | 2,365,000 | 2,624,393 | ||||||
Series A 6.25% 11/15/40 | 750,000 | 824,287 | ||||||
(Valley View Hospital Association) 5.50% 5/15/28 | 1,000,000 | 1,091,420 | ||||||
Denver Health & Hospital Authority Health Care Revenue | ||||||||
(Recovery Zone Facilities) 5.625% 12/1/40 | 2,500,000 | 2,734,425 | ||||||
Puerto Rico Industrial Tourist Educational Medical & Environmental Control Facilities Financing Authority | ||||||||
(Auxilio Mutuo) Series A 6.00% 7/1/33 | 2,120,000 | 2,093,542 | ||||||
51
Table of Contents
Schedules of investments
Delaware Tax-Free Colorado Fund
| Principal amount° | Value (U.S. $) | |||||||
| ||||||||
Municipal Bonds (continued) | ||||||||
| ||||||||
Healthcare Revenue Bonds (continued) | ||||||||
University of Colorado Hospital Authority Revenue | ||||||||
Series A 6.00% 11/15/29 | 2,460,000 | $ | 2,832,370 | |||||
|
| |||||||
| 63,943,611 | ||||||||
|
| |||||||
Housing Revenue Bonds – 0.48% | ||||||||
Colorado Housing & Finance Authority | ||||||||
(Single Family Mortgage - Class 1) Series A 5.50% 11/1/29 (FHA) (VA) (HUD) | 10,000 | 10,341 | ||||||
(Single Family Program Class 1) | ||||||||
Series AA 4.50% 5/1/23 (FHLMC) | 405,000 | 443,957 | ||||||
Series AA 4.50% 11/1/23 (FHLMC) | 420,000 | 458,997 | ||||||
|
| |||||||
| 913,295 | ||||||||
|
| |||||||
Lease Revenue Bonds – 3.45% | ||||||||
Aurora Certificates of Participation | ||||||||
Series A 5.00% 12/1/30 | 2,370,000 | 2,658,050 | ||||||
Colorado Building Excellent Schools Today Certificates of Participation | ||||||||
Series G 5.00% 3/15/32 | 2,000,000 | 2,265,840 | ||||||
Regional Transportation District Certificates of Participation | ||||||||
Series A 5.00% 6/1/33 | 1,500,000 | 1,674,135 | ||||||
|
| |||||||
| 6,598,025 | ||||||||
|
| |||||||
Local General Obligation Bonds – 9.34% | ||||||||
Beacon Point Metropolitan District | ||||||||
5.00% 12/1/30 (AGM) | 1,130,000 | 1,282,177 | ||||||
Central Colorado Water Conservancy District | ||||||||
(Limited Tax) 5.00% 12/1/33 | 1,000,000 | 1,122,620 | ||||||
Commerce City Northern Infrastructure General Improvement District | ||||||||
5.00% 12/1/32 (AGM) | 2,125,000 | 2,407,816 | ||||||
Denver City & County | ||||||||
(Better Denver & Zoo) Series A 5.00% 8/1/25 | 3,215,000 | 3,625,170 | ||||||
Denver International Business Center Metropolitan District No. 1 | ||||||||
5.00% 12/1/30 | 350,000 | 366,912 | ||||||
Douglas County School District No. 1 | ||||||||
(Douglas & Elbert Counties) 5.00% 12/15/22 | 1,175,000 | 1,392,493 | ||||||
Eaton Area Park & Recreation District | ||||||||
5.25% 12/1/34 | 360,000 | 369,310 | ||||||
5.50% 12/1/38 | 455,000 | 471,908 | ||||||
Jefferson County School District No. R-1 | ||||||||
5.25% 12/15/24 | 1,250,000 | 1,562,925 | ||||||
52
Table of Contents
| Principal amount° | Value (U.S. $) | |||||||
| ||||||||
Municipal Bonds (continued) | ||||||||
| ||||||||
Local General Obligation Bonds (continued) | ||||||||
North Range Metropolitan | ||||||||
District No. 1 4.50% 12/15/31 (ACA) @ | 1,500,000 | $ | 1,457,535 | |||||
District No. 2 5.50% 12/15/37 @ | 1,200,000 | 1,211,184 | ||||||
Rangely Hospital District | ||||||||
6.00% 11/1/26 | 2,250,000 | 2,595,600 | ||||||
|
| |||||||
| 17,865,650 | ||||||||
|
| |||||||
Pre-Refunded Bonds – 6.85% | ||||||||
Adams & Arapahoe Counties Joint School District No. 28J | ||||||||
(Aurora) 6.00% 12/1/28-18 § | 2,500,000 | 2,902,450 | ||||||
Colorado Health Facilities Authority Revenue | ||||||||
(Adventist Health/Sunbelt) 5.125% 11/15/24-16 § | 75,000 | 79,285 | ||||||
Douglas County School District No. 1 | ||||||||
(Douglas & Elbert Counties) Series B 5.00% 12/15/24-16 § | 1,000,000 | 1,058,900 | ||||||
Garfield County School District No. 2 | ||||||||
5.00% 12/1/25-16 (AGM) § | 2,280,000 | 2,409,778 | ||||||
Grand County School District No. 2 | ||||||||
(East Grand) 5.25% 12/1/25-17 (AGM) § | 1,000,000 | 1,101,730 | ||||||
Gunnison Watershed School District No. 1J Series 2009 | ||||||||
5.25% 12/1/33-18 § | 1,400,000 | 1,591,366 | ||||||
University of Colorado Hospital Authority Revenue | ||||||||
Series A 5.00% 11/15/37-16 § | 2,690,000 | 2,780,760 | ||||||
Weld County School District No. 4 | ||||||||
5.00% 12/1/19-17 (AGM) § | 1,085,000 | 1,189,334 | ||||||
|
| |||||||
| 13,113,603 | ||||||||
|
| |||||||
Special Tax Revenue Bonds – 13.75% | ||||||||
Baptist Road Rural Transportation Authority Sales & Use Tax Revenue | ||||||||
5.00% 12/1/26 @ | 1,575,000 | 1,507,921 | ||||||
Central Platte Valley Metropolitan District | ||||||||
5.00% 12/1/43 | 725,000 | 745,438 | ||||||
Commerce City | ||||||||
5.00% 8/1/44 (AGM) | 1,500,000 | 1,666,170 | ||||||
Denver Convention Center Hotel Authority Revenue | ||||||||
5.00% 12/1/35 (SGI) | 3,665,000 | 3,736,431 | ||||||
Denver International Business Center Metropolitan District No. 1 | ||||||||
5.375% 12/1/35 | 1,750,000 | 1,850,923 | ||||||
Fountain Urban Renewal Authority Tax Increment Revenue | ||||||||
(Academy Highlands Project) Series A 5.50% 11/1/44 | 2,595,000 | 2,577,250 | ||||||
Guam Government Business Privilege Tax Revenue | ||||||||
Series A 5.125% 1/1/42 | 1,250,000 | 1,348,225 | ||||||
53
Table of Contents
Schedules of investments
Delaware Tax-Free Colorado Fund
| Principal amount° | Value (U.S. $) | |||||||
| ||||||||
Municipal Bonds (continued) | ||||||||
| ||||||||
Special Tax Revenue Bonds (continued) | ||||||||
Guam Government Business Privilege Tax Revenue | ||||||||
Series A 5.25% 1/1/36 | 1,675,000 | $ | 1,837,140 | |||||
Park Meadows Business Improvement District Shared Sales Tax Revenue | ||||||||
5.30% 12/1/27 | 950,000 | 994,413 | ||||||
5.35% 12/1/31 | 720,000 | 752,501 | ||||||
Plaza Metropolitan District No. 1 | ||||||||
5.00% 12/1/40 | 1,265,000 | 1,274,171 | ||||||
Regional Transportation District Certificates of Participation | ||||||||
Series A 5.375% 6/1/31 | 1,540,000 | 1,754,922 | ||||||
Regional Transportation District Sales Revenue | ||||||||
(Denver Transit Partners) | ||||||||
6.00% 1/15/34 | 1,450,000 | 1,640,139 | ||||||
6.00% 1/15/41 | 2,400,000 | 2,710,080 | ||||||
Tallyns Reach Metropolitan District No. 3 | ||||||||
(Limited Tax Convertible) 5.125% 11/1/38 | 740,000 | 767,668 | ||||||
Virgin Islands Public Finance Authority | ||||||||
(Matching Fund Loan Senior Lien) 5.00% 10/1/29 (AGM) | 1,000,000 | 1,141,180 | ||||||
|
| |||||||
| 26,304,572 | ||||||||
|
| |||||||
Transportation Revenue Bonds – 11.22% | ||||||||
Colorado High Performance Transportation Enterprise Revenue | ||||||||
(Senior U.S. 36 & I-25 Managed Lanes) 5.75% 1/1/44 (AMT) | 2,140,000 | 2,288,816 | ||||||
Denver City & County Airport System Revenue | ||||||||
Series A 5.00% 11/15/25 (NATL-RE) | 2,000,000 | 2,106,080 | ||||||
Series A 5.25% 11/15/36 | 2,500,000 | 2,804,875 | ||||||
Series B 5.00% 11/15/30 | 1,000,000 | 1,157,800 | ||||||
Series B 5.00% 11/15/32 | 1,000,000 | 1,150,570 | ||||||
Series B 5.00% 11/15/37 | 8,000,000 | 8,963,441 | ||||||
E-470 Public Highway Authority | ||||||||
Series C 5.25% 9/1/25 | 690,000 | 770,978 | ||||||
Series C 5.375% 9/1/26 | 2,000,000 | 2,235,260 | ||||||
|
| |||||||
| 21,477,820 | ||||||||
|
| |||||||
Water & Sewer Revenue Bonds – 0.67% | ||||||||
Eagle River Water & Sanitation District Enterprise Revenue | ||||||||
5.00% 12/1/29 (ASSURED GTY) | 250,000 | 281,710 | ||||||
54
Table of Contents
| Principal amount° | Value (U.S. $) | |||||||
| ||||||||
Municipal Bonds (continued) | ||||||||
| ||||||||
Water & Sewer Revenue Bonds (continued) | ||||||||
Pueblo Board Waterworks Revenue | ||||||||
5.00% 11/1/21 (AGM) | 1,000,000 | $ | 1,008,150 | |||||
|
| |||||||
| 1,289,860 | ||||||||
|
| |||||||
Total Municipal Bonds (cost $171,828,933) | 184,978,032 | |||||||
|
| |||||||
Number of | ||||||||
| ||||||||
Short-Term Investments – 1.81% | ||||||||
| ||||||||
Money Market Mutual Fund – 0.99% | ||||||||
Dreyfus Tax Exempt Cash Management Fund | 1,892,796 | 1,892,796 | ||||||
|
| |||||||
| 1,892,796 | ||||||||
|
| |||||||
| Principal amount° | ||||||||
Variable Rate Demand Notes – 0.82%¤ | ||||||||
Colorado Educational & Cultural Facilities Authority | ||||||||
(National Jewish Federation Bond Program) | ||||||||
0.01% 2/1/35 (LOC-JPMorgan Chase Bank N. A.) | 200,000 | 200,000 | ||||||
0.01% 12/1/37 (LOC-JPMorgan Chase Bank N. A.) | 1,385,000 | 1,385,000 | ||||||
|
| |||||||
| 1,585,000 | ||||||||
|
| |||||||
Total Short-Term Investments (cost $3,477,796) | 3,477,796 | |||||||
|
| |||||||
Total Value of Securities – 98.47% | ||||||||
(cost $175,306,729) | $ | 188,455,828 | ||||||
|
| |||||||
| # | Security exempt from registration under Rule 144A of the Securities Act of 1933, as amended. At Aug. 31, 2015, the aggregate value of Rule 144A securities was $5,405,306, which represents 2.82% of the Fund’s net assets. See Note 8 in “Notes to financial statements.” |
| @ | Illiquid security. At Aug. 31, 2015, the aggregate value of illiquid securities was $4,176,640, which represents 2.18% of the Fund’s net assets. See Note 8 in “Notes to financial statements.” |
| ¤ | Tax-exempt obligations that contain a floating or variable interest rate adjustment formula and an unconditional right of demand to receive payment of the unpaid principal balance plus accrued interest upon a short notice period (generally up to 30 days) prior to specified dates either from the issuer or by drawing on a bank letter of credit, a guarantee, or insurance issued with respect to such instrument. The rate shown is the rate as of Aug. 31, 2015. |
| ° | Principal amount shown is stated in U.S. dollars unless noted that the security is denominated in another currency. |
| ● | Variable rate security. The rate shown is the rate as of Aug. 31, 2015. Interest rates reset periodically. |
| § | Pre-refunded bonds. Municipal bonds that are generally backed or secured by U.S. Treasury bonds. For pre-refunded bonds, the stated maturity is followed by the year in which the bond is pre-refunded. See Note 8 in “Notes to financial statements.” |
55
Table of Contents
Schedules of investments
Delaware Tax-Free Colorado Fund
Summary of abbreviations:
ACA – Insured by American Capital Access
AGM – Insured by Assured Guaranty Municipal Corporation
AMT – Subject to Alternative Minimum Tax
ASSURED GTY – Insured by Assured Guaranty Corporation
FHA – Federal Housing Administration
FHLMC – Federal Home Loan Mortgage Corporation collateral
HUD – Housing and Urban Development Section 8
LOC – Letter of Credit
N.A. – North America
NATL-RE – Insured by National Public Finance Guarantee Corporation
SGI – Insured by Syncora Guarantee Inc.
VA – Veterans Administration collateral
See accompanying notes, which are an integral part of the financial statements.
56
Table of Contents
| Schedules of investments | ||
| Delaware Tax-Free Idaho Fund | August 31, 2015 |
| Principal amount° | Value (U.S. $) | |||||||
| ||||||||
Municipal Bonds – 98.95% | ||||||||
| ||||||||
Corporate Revenue Bonds – 5.42% | ||||||||
Nez Perce County Pollution Control Revenue | ||||||||
(Potlatch Project) 6.00% 10/1/24 | 3,750,000 | $ | 3,753,637 | |||||
Power County Industrial Development Revenue | ||||||||
(FMC Project) 6.45% 8/1/32 (AMT) | 2,000,000 | 2,003,820 | ||||||
|
| |||||||
| 5,757,457 | ||||||||
|
| |||||||
Education Revenue Bonds – 11.93% | ||||||||
Boise State University Revenue | ||||||||
(General Project) | ||||||||
Series A 4.00% 4/1/37 | 1,250,000 | 1,284,950 | ||||||
Series A 4.25% 4/1/32 (NATL-RE) | 675,000 | 699,482 | ||||||
Series A 5.00% 4/1/26 | 965,000 | 1,116,100 | ||||||
Series A 5.00% 4/1/39 | 1,000,000 | 1,089,750 | ||||||
Series A 5.00% 4/1/42 | 1,350,000 | 1,483,097 | ||||||
Idaho Housing & Finance Association | ||||||||
Series A 5.00% 6/1/50 | 1,275,000 | 1,246,121 | ||||||
(North Star Charter School Capital Appreciation Bond) Series B 144A 5.00% 7/1/49 #^ | 2,888,155 | 227,644 | ||||||
(North Star Charter School) Series A 6.75% 7/1/48 | 529,151 | 504,990 | ||||||
University of Idaho | ||||||||
Series 2011 5.25% 4/1/41 ● | 1,875,000 | 2,169,394 | ||||||
Series B 4.50% 4/1/41 (AGM) ● | 1,100,000 | 1,180,696 | ||||||
Series B 5.00% 4/1/28 | 1,000,000 | 1,121,780 | ||||||
Series B 5.00% 4/1/32 | 500,000 | 557,535 | ||||||
|
| |||||||
| 12,681,539 | ||||||||
|
| |||||||
Electric Revenue Bond – 2.10% | ||||||||
Boise-Kuna Irrigation District Revenue | ||||||||
5.00% 6/1/34 | 2,000,000 | 2,235,220 | ||||||
|
| |||||||
| 2,235,220 | ||||||||
|
| |||||||
Healthcare Revenue Bonds – 11.81% | ||||||||
Idaho Health Facilities Authority Revenue | ||||||||
(St. Luke’s Health System Project) | ||||||||
Series A 5.00% 3/1/47 | 1,500,000 | 1,614,375 | ||||||
Series A 6.50% 11/1/23 | 250,000 | 286,515 | ||||||
Series A 6.75% 11/1/37 | 1,250,000 | 1,427,125 | ||||||
(St. Luke’s Regional Medical Center Project) 5.00% 7/1/35 (AGM) | 2,500,000 | 2,738,625 | ||||||
(Trinity Health Center Group) | ||||||||
Series D 4.50% 12/1/37 | 1,385,000 | 1,454,901 | ||||||
Series D 5.00% 12/1/32 | 2,500,000 | 2,821,275 | ||||||
57
Table of Contents
Schedules of investments
Delaware Tax-Free Idaho Fund
| Principal amount° | Value (U.S. $) | |||||||
| ||||||||
Municipal Bonds (continued) | ||||||||
| ||||||||
Healthcare Revenue Bonds (continued) | ||||||||
Puerto Rico Industrial Tourist Educational Medical & Environmental Control Facilities Financing Authority | ||||||||
(Auxilio Mutuo) Series A 6.00% 7/1/33 | 2,245,000 | $ | 2,216,982 | |||||
|
| |||||||
| 12,559,798 | ||||||||
|
| |||||||
Housing Revenue Bonds – 2.36% | ||||||||
Idaho Housing & Finance Association Single Family Mortgage Revenue | ||||||||
Series A Class II 4.375% 7/1/32 | 995,000 | 1,033,815 | ||||||
Series B Class I 5.00% 7/1/37 (AMT) | 435,000 | 435,274 | ||||||
Series C Class II 4.95% 7/1/31 | 995,000 | 1,034,760 | ||||||
|
| |||||||
| 2,503,849 | ||||||||
|
| |||||||
Lease Revenue Bonds – 6.94% | ||||||||
Idaho Housing & Finance Association Revenue | ||||||||
(TDF Facilities Project-Recovery Zone) | ||||||||
Series A 6.50% 2/1/26 | 1,370,000 | 1,641,205 | ||||||
Series A 7.00% 2/1/36 | 1,500,000 | 1,801,920 | ||||||
Idaho State Building Authority Revenue | ||||||||
5.00% 9/1/40 | 1,250,000 | 1,395,925 | ||||||
(Capitol Mall Parking Project) | ||||||||
Series A 4.50% 9/1/25 | 455,000 | 520,256 | ||||||
Series A 4.50% 9/1/26 | 485,000 | 547,187 | ||||||
Series A 4.50% 9/1/27 | 505,000 | 564,868 | ||||||
(Eastern Idaho Technical College Project) Series B 5.00% 9/1/25 | 740,000 | 903,518 | ||||||
|
| |||||||
| 7,374,879 | ||||||||
|
| |||||||
Local General Obligation Bonds – 27.30% | ||||||||
Ada & Canyon Counties Joint School District No. 2 Meridian | ||||||||
4.50% 7/30/22 | 1,500,000 | 1,687,875 | ||||||
5.50% 7/30/16 | 1,305,000 | 1,367,496 | ||||||
Bonneville Joint School District No. 93 | ||||||||
(School Board Guaranteed) | ||||||||
Series A 5.00% 9/15/30 | 1,515,000 | 1,730,736 | ||||||
Series A 5.00% 9/15/31 | 870,000 | 990,312 | ||||||
Series C 5.00% 9/15/23 | 370,000 | 437,540 | ||||||
Canyon County School District No. 131 Nampa | ||||||||
(School Board Guaranteed) Series B 5.00% 8/15/23 | 1,295,000 | 1,550,115 | ||||||
Canyon County School District No. 132 Caldwell | ||||||||
Series A 5.00% 9/15/22 (AGM) | 1,725,000 | 1,891,894 | ||||||
Series A 5.00% 9/15/23 (AGM) | 1,810,000 | 1,985,117 | ||||||
58
Table of Contents
| Principal amount° | Value (U.S. $) | |||||||
| ||||||||
Municipal Bonds (continued) | ||||||||
| ||||||||
Local General Obligation Bonds (continued) | ||||||||
Canyon County School District No. 139 Vallivue | ||||||||
(School Board Guaranteed) | ||||||||
5.00% 9/15/33 | 1,000,000 | $ | 1,137,320 | |||||
Series B 5.00% 9/15/24 | 1,480,000 | 1,751,151 | ||||||
Idaho Bond Bank Authority Revenue | ||||||||
Series A 5.00% 9/15/28 | 890,000 | 987,446 | ||||||
Series A 5.00% 9/15/31 | 1,025,000 | 1,157,573 | ||||||
Series A 5.00% 9/15/33 | 1,125,000 | 1,263,364 | ||||||
Series A 5.25% 9/15/26 | 1,430,000 | 1,606,405 | ||||||
Series B 5.00% 9/15/30 (NATL-RE) | 725,000 | 754,848 | ||||||
Kootenai County School District No. 271 Coeur D’Alene | ||||||||
(School Board Guaranteed) | ||||||||
Series B 4.00% 9/15/24 | 540,000 | 600,518 | ||||||
Series B 4.00% 9/15/25 | 650,000 | 716,827 | ||||||
Madison County School District No. 321 Rexburg | ||||||||
(School Board Guaranteed) | ||||||||
Series B 5.00% 8/15/24 | 1,500,000 | 1,843,140 | ||||||
Series B 5.00% 8/15/25 | 1,080,000 | 1,334,254 | ||||||
Series B 5.00% 8/15/26 | 710,000 | 873,556 | ||||||
Twin Falls County School District No. 411 Twin Falls | ||||||||
Series A 4.75% 9/15/37 | 1,000,000 | 1,125,830 | ||||||
Twin Falls County School District No. 413 Filer | ||||||||
(School Board Guaranteed) 5.25% 9/15/25 | 2,000,000 | 2,232,480 | ||||||
|
| |||||||
| 29,025,797 | ||||||||
|
| |||||||
Pre-Refunded Bonds – 8.57% | ||||||||
Ada & Boise Counties Independent School District Boise City | ||||||||
(School Board Guaranteed) 5.00% 8/1/24-17 (AGM) § | 1,500,000 | 1,625,415 | ||||||
Boise State University | ||||||||
Series A 4.25% 4/1/32-17 (NATL-RE) § | 75,000 | 79,387 | ||||||
Boise-Kuna Irrigation District Revenue | ||||||||
(Arrowrock Hydroelectric Project) 6.30% 6/1/31-18 § | 1,000,000 | 1,146,970 | ||||||
Idaho Bond Bank Authority Revenue | ||||||||
Series A 5.00% 9/15/28-19 § | 360,000 | 409,309 | ||||||
Series A 5.25% 9/15/26-19 § | 570,000 | 653,009 | ||||||
Idaho Health Facilities Authority Revenue | ||||||||
(Trinity Health Center Group) Series B 6.125% 12/1/28-18 § | 1,210,000 | 1,409,190 | ||||||
Idaho Housing & Finance Association Grant Anticipated Revenue | ||||||||
(Federal Highway Trust) 5.00% 7/15/24-16 (NATL-RE) § | 2,000,000 | 2,081,900 | ||||||
59
Table of Contents
Schedules of investments
Delaware Tax-Free Idaho Fund
| Principal amount° | Value (U.S. $) | |||||||
| ||||||||
Municipal Bonds (continued) | ||||||||
| ||||||||
Pre-Refunded Bonds (continued) | ||||||||
Idaho Housing & Finance Association Grant Anticipated Revenue | ||||||||
(Federal Highway Trust) Series A 5.25% 7/15/25-18 (ASSURED GTY) § | 1,500,000 | $ | 1,684,425 | |||||
Puerto Rico Sales Tax Financing Revenue First Subordinate | ||||||||
Series A 5.50% 8/1/28-19 § | 15,000 | 17,480 | ||||||
|
| |||||||
| 9,107,085 | ||||||||
|
| |||||||
Special Tax Revenue Bonds – 14.25% | ||||||||
Guam Government Business Privilege Tax Revenue | ||||||||
Series A 5.125% 1/1/42 | 545,000 | 587,826 | ||||||
Series A 5.25% 1/1/36 | 705,000 | 773,244 | ||||||
Series B-1 5.00% 1/1/42 | 1,425,000 | 1,532,830 | ||||||
Idaho Bond Bank Authority Revenue | ||||||||
Series D 5.00% 9/15/30 | 350,000 | 399,840 | ||||||
Idaho Water Resource Board | ||||||||
(Ground Water Rights Mitigation) Series A 5.00% 9/1/32 | 3,565,000 | 3,887,525 | ||||||
Ketchum Urban Renewal Agency Tax Increment Revenue | ||||||||
5.50% 10/15/34 | 1,500,000 | 1,586,835 | ||||||
Nampa Development Tax Increment Revenue | ||||||||
144A 5.00% 9/1/31 # | 1,000,000 | 1,083,490 | ||||||
5.90% 3/1/30 | 3,000,000 | 3,236,460 | ||||||
Virgin Islands Public Finance Authority Revenue | ||||||||
(Senior Lien-Matching Fund Loan Note) | ||||||||
5.00% 10/1/29 (AGM) | 1,500,000 | 1,711,770 | ||||||
Series A 5.00% 10/1/29 | 325,000 | 351,761 | ||||||
|
| |||||||
| 15,151,581 | ||||||||
|
| |||||||
Transportation Revenue Bonds – 7.20% | ||||||||
Boise City Airport Revenue | ||||||||
(Air Terminal Facilities Project) | ||||||||
5.75% 9/1/19 (AGM) (AMT) | 1,000,000 | 1,162,550 | ||||||
5.75% 9/1/20 (AGM) (AMT) | 1,000,000 | 1,184,880 | ||||||
(Parking Facilities Project) 4.00% 9/1/32 | 2,180,000 | 2,255,254 | ||||||
60
Table of Contents
| Principal amount° | Value (U.S. $) | |||||||
| ||||||||
Municipal Bonds (continued) | ||||||||
| ||||||||
Transportation Revenue Bonds (continued) | ||||||||
Idaho Housing & Finance Association Grant Anticipated Revenue | ||||||||
(Federal Highway Trust) Series A 5.25% 7/15/20 (ASSURED GTY) | 2,750,000 | $ | 3,051,373 | |||||
|
| |||||||
| 7,654,057 | ||||||||
|
| |||||||
Water & Sewer Revenue Bonds – 1.07% | ||||||||
Idaho Bond Bank Authority Revenue | ||||||||
Series C 5.375% 9/15/38 | 1,000,000 | 1,133,500 | ||||||
|
| |||||||
| 1,133,500 | ||||||||
|
| |||||||
Total Municipal Bonds (cost $99,351,621) | 105,184,762 | |||||||
|
| |||||||
Total Value of Securities – 98.95% | ||||||||
(cost $99,351,621) | $ | 105,184,762 | ||||||
|
| |||||||
| # | Security exempt from registration under Rule 144A of the Securities Act of 1933, as amended. At Aug. 31, 2015, the aggregate value of Rule 144A securities was $1,311,134, which represents 1.23% of the Fund’s net assets. See Note 8 in “Notes to financial statements.” |
| ° | Principal amount shown is stated in U.S. dollars unless noted that the security is denominated in another currency. |
| ● | Variable rate security. The rate shown is the rate as of Aug. 31, 2015. Interest rates reset periodically. |
| ^ | Zero coupon security. The rate shown is the yield at the time of purchase. |
| § | Pre-refunded bonds. Municipal bonds that are generally backed or secured by U.S. Treasury bonds. For pre-refunded bonds, the stated maturity is followed by the year in which the bond is pre-refunded. See Note 8 in “Notes to financial statements.” |
Summary of abbreviations:
AGM – Insured by Assured Guaranty Municipal Corporation
AMT – Subject to Alternative Minimum Tax
ASSURED GTY – Insured by Assured Guaranty Corporation
NATL-RE – Insured by National Public Finance Guarantee Corporation
See accompanying notes, which are an integral part of the financial statements.
61
Table of Contents
| Schedules of investments | ||
| Delaware Tax-Free New York Fund | August 31, 2015 |
| Principal amount° | Value (U.S. $) | |||||||
| ||||||||
Municipal Bonds – 97.61% | ||||||||
| ||||||||
Corporate Revenue Bonds – 8.00% | ||||||||
Build NYC Resource | ||||||||
(Pratt Paper Income Project) 144A 5.00% 1/1/35 (AMT) # | 750,000 | $ | 797,677 | |||||
New York City Industrial Development Agency Special Facilities Revenue | ||||||||
(American Airlines – JFK International Airport) 7.75% 8/1/31 (AMT) ● | 250,000 | 265,367 | ||||||
New York Liberty Development Revenue | ||||||||
(Second Priority – Bank of America Tower) | ||||||||
Class 2 5.625% 7/15/47 | 500,000 | 560,795 | ||||||
Class 3 6.375% 7/15/49 | �� | 865,000 | 979,396 | |||||
Niagara Area Development Revenue | ||||||||
(Covanta Energy Project) Series B 144A 4.00% 11/1/24 # | 1,060,000 | 1,069,158 | ||||||
Suffolk County Industrial Development Agency Revenue | ||||||||
(Keyspan-Port Jefferson Energy Center) 5.25% 6/1/27 (AMT) | 250,000 | 253,260 | ||||||
Suffolk Tobacco Asset Securitization | ||||||||
Series B 5.25% 6/1/37 | 700,000 | 759,892 | ||||||
Tobacco Settlement Financing Authority Revenue | ||||||||
(Asset-Backed) Series B 5.00% 6/1/21 | 500,000 | 517,955 | ||||||
TSASC Revenue | ||||||||
(Asset-Backed) | ||||||||
Series 1 5.00% 6/1/34 | 500,000 | 457,805 | ||||||
Series 1 5.125% 6/1/42 | 1,050,000 | 916,083 | ||||||
|
| |||||||
| 6,577,388 | ||||||||
|
| |||||||
Education Revenue Bonds – 23.69% | ||||||||
Albany Industrial Development Agency Civic Facilities Revenue | ||||||||
(Brighter Choice Charter School) Series A 5.00% 4/1/37 | 250,000 | 205,795 | ||||||
Buffalo & Erie County Industrial Land Development | ||||||||
(Buffalo State College Foundation Housing) 6.00% 10/1/31 | 525,000 | 614,003 | ||||||
(Medaille College Project) 5.25% 4/1/35 | 370,000 | 370,418 | ||||||
Build NYC Resource | ||||||||
5.50% 11/1/44 | 1,100,000 | 1,157,530 | ||||||
(Bronx Charter School for Excellence) | ||||||||
5.00% 4/1/33 | 500,000 | 526,305 | ||||||
5.50% 4/1/43 | 500,000 | 541,055 | ||||||
(Packer Collegiate Institution) 5.00% 6/1/40 | 750,000 | 828,510 | ||||||
Dutchess County Local Development | ||||||||
(Marist College Project) Series A 5.00% 7/1/19 | 760,000 | 863,580 | ||||||
62
Table of Contents
| Principal amount° | Value (U.S. $) | |||||||
| ||||||||
Municipal Bonds (continued) | ||||||||
| ||||||||
Education Revenue Bonds (continued) | ||||||||
Madison County Capital Resource Revenue | ||||||||
(Colgate University Project) Series A 5.00% 7/1/28 | 400,000 | $ | 454,720 | |||||
Monroe County Industrial Development Revenue | ||||||||
(Nazareth College Rochester Project) | ||||||||
5.00% 10/1/22 | 340,000 | 386,056 | ||||||
5.00% 10/1/23 | 470,000 | 536,745 | ||||||
5.25% 10/1/31 | 500,000 | 538,190 | ||||||
5.50% 10/1/41 | 500,000 | 539,285 | ||||||
(St. John Fisher College) Series A 5.50% 6/1/39 | 300,000 | 332,928 | ||||||
New York City Trust for Cultural Resources | ||||||||
(Whitney Museum of American Art) 5.00% 7/1/31 | 500,000 | 550,740 | ||||||
New York State Dormitory Authority | ||||||||
(Barnard College) Series A 5.00% 7/1/35 | 400,000 | 454,888 | ||||||
(Brooklyn Law School) 5.75% 7/1/33 | 340,000 | 380,409 | ||||||
(Cornell University) Series A 5.00% 7/1/34 | 170,000 | 192,151 | ||||||
(Fordham University) 5.00% 7/1/44 | 650,000 | 722,982 | ||||||
(Manhattan Marymount) 5.00% 7/1/24 | 350,000 | 386,204 | ||||||
(Mt. Sinai School of Medicine) Series A 5.00% 7/1/19 | 500,000 | 566,345 | ||||||
(New York University) Series A 5.25% 7/1/34 | 500,000 | 564,605 | ||||||
(Pratt Institute) Series A 5.00% 7/1/34 | 1,000,000 | 1,121,160 | ||||||
(Rockefeller University) Series A 5.00% 7/1/27 | 250,000 | 283,323 | ||||||
(Skidmore College) Series A 5.00% 7/1/21 | 325,000 | 375,333 | ||||||
(Teachers College) 5.50% 3/1/39 | 250,000 | 280,280 | ||||||
(Touro College and University) Series A 5.50% 1/1/44 | 1,000,000 | 1,074,430 | ||||||
(University of Rochester) | ||||||||
Series A 5.125% 7/1/39 | 250,000 | 280,063 | ||||||
Unrefunded Series A-2 4.375% 7/1/20 | 85,000 | 87,967 | ||||||
Onondaga Civic Development Revenue | ||||||||
(Le Moyne College Project) 5.20% 7/1/29 | 500,000 | 532,435 | ||||||
Onondaga County Trust for Cultural Research Revenue | ||||||||
(Syracuse University Project) Series B 5.00% 12/1/19 | 350,000 | 404,859 | ||||||
Otsego County Capital Resource | ||||||||
(Hartwick College) Series A 5.00% 10/1/45 | 775,000 | 814,447 | ||||||
St. Lawrence County Industrial Development Agency Civic Facility Revenue | ||||||||
(St. Lawrence University Project) Series A 5.00% 10/1/16 | 500,000 | 524,470 | ||||||
Suffolk County Industrial Development Agency Civic Facility Revenue | ||||||||
(New York Institute of Technology Project) 5.00% 3/1/26 | 600,000 | 610,608 | ||||||
63
Table of Contents
Schedules of investments
Delaware Tax-Free New York Fund
| Principal amount° | Value (U.S. $) | |||||||
| ||||||||
Municipal Bonds (continued) | ||||||||
| ||||||||
Education Revenue Bonds (continued) | ||||||||
Troy Capital Resource Revenue | ||||||||
(Rensselaer Polytechnic) Series B 5.00% 9/1/18 | 165,000 | $ | 183,282 | |||||
Troy Industrial Development Authority | ||||||||
(Rensselaer Polytechnic) Series E 5.20% 4/1/37 | 500,000 | 548,820 | ||||||
Yonkers Economic Development Education Revenue | ||||||||
(Charter School Educational Excellence) Series A 6.25% 10/15/40 | 600,000 | 634,590 | ||||||
|
| |||||||
| 19,469,511 | ||||||||
|
| |||||||
Electric Revenue Bonds – 2.50% | ||||||||
Long Island Power Authority Electric System Revenue | ||||||||
Series A 5.00% 9/1/44 | 750,000 | 825,263 | ||||||
Series A 5.75% 4/1/39 | 350,000 | 392,907 | ||||||
Series B 5.75% 4/1/33 | 250,000 | 281,775 | ||||||
New York State Power Authority Revenue | ||||||||
Series A 5.00% 11/15/38 | 500,000 | 559,070 | ||||||
|
| |||||||
| 2,059,015 | ||||||||
|
| |||||||
Healthcare Revenue Bonds – 17.85% | ||||||||
Buffalo & Erie County Industrial Land Development | ||||||||
(Catholic Health System Obligation) 5.25% 7/1/35 | 250,000 | 279,607 | ||||||
Dutchess County Local Development | ||||||||
Series A 5.00% 7/1/34 | 350,000 | 383,309 | ||||||
Series A 5.00% 7/1/44 | 1,000,000 | 1,081,090 | ||||||
East Rochester Housing Authority Revenue | ||||||||
(Senior Living-Woodland Village Project) 5.50% 8/1/33 | 500,000 | 507,090 | ||||||
Monroe County Industrial Development | ||||||||
(Rochester General Hospital) | ||||||||
Series A 5.00% 12/1/27 | 330,000 | 366,792 | ||||||
Series A 5.00% 12/1/28 | 655,000 | 725,616 | ||||||
(University Hospital of Rochester project) | ||||||||
5.50% 8/15/40 (FHA) | 585,000 | 679,361 | ||||||
Nassau County Local Economic Assistance | ||||||||
(Catholic Health Services of Long Island) | ||||||||
5.00% 7/1/29 | 375,000 | 421,500 | ||||||
5.00% 7/1/33 | 725,000 | 795,717 | ||||||
New York City Health & Hospital Revenue | ||||||||
(Health System) Series A 5.00% 2/15/30 | 500,000 | 551,060 | ||||||
64
Table of Contents
| Principal amount° | Value (U.S. $) | |||||||
| ||||||||
Municipal Bonds (continued) | ||||||||
| ||||||||
Healthcare Revenue Bonds (continued) | ||||||||
New York State Dormitory Authority Revenue Non-State Supported Debt | ||||||||
(Memorial Sloan-Kettering) | ||||||||
Series 1 5.00% 7/1/23 | 600,000 | $ | 708,330 | |||||
Subordinate Series A2 5.00% 7/1/26 | 500,000 | 555,155 | ||||||
(Mt. Sinai Hospital) Series A 5.00% 7/1/26 | 600,000 | 677,790 | ||||||
(North Shore Long Island Jewish Group) Series A 5.00% 5/1/41 | 500,000 | 543,715 | ||||||
(Orange Regional Medical Center) | ||||||||
144A 5.00% 12/1/45 # | 700,000 | 725,095 | ||||||
6.125% 12/1/29 | 540,000 | 594,940 | ||||||
6.25% 12/1/37 | 250,000 | 273,707 | ||||||
Onondaga Civic Development Revenue | ||||||||
(St. Joseph’s Hospital Health Center) | ||||||||
4.50% 7/1/32 | 380,000 | 383,317 | ||||||
5.00% 7/1/42 | 750,000 | 774,923 | ||||||
5.125% 7/1/31 | 500,000 | 524,490 | ||||||
Orange County Funding Assisted Living Residence Revenue | ||||||||
(The Hamlet at Wallkill Project) 6.50% 1/1/46 | 500,000 | 497,970 | ||||||
Saratoga County | ||||||||
(Saratoga Hospital Project) Series A 5.00% 12/1/26 | 500,000 | 574,615 | ||||||
Southold Local Development Revenue | ||||||||
(Peconic Landing Project) 5.00% 12/1/45 | 750,000 | 788,790 | ||||||
Suffolk County Economic Development Revenue | ||||||||
(Catholic Health Services) 5.00% 7/1/28 | 500,000 | 550,320 | ||||||
(Peconic Landing Southhold) 6.00% 12/1/40 | 650,000 | 708,877 | ||||||
|
| |||||||
| 14,673,176 | ||||||||
|
| |||||||
Housing Revenue Bond – 0.44% | ||||||||
New York Mortgage Agency Revenue | ||||||||
44th Series 4.35% 10/1/24 (AMT) | 345,000 | 361,074 | ||||||
|
| |||||||
| 361,074 | ||||||||
|
| |||||||
Lease Revenue Bonds – 9.23% | ||||||||
Erie County Industrial Development Agency School Facility Revenue | ||||||||
(Buffalo City School District) Series A 5.25% 5/1/25 | 500,000 | 560,155 | ||||||
Hudson Yards Infrastructure Revenue | ||||||||
Series A 5.75% 2/15/47 | 1,000,000 | 1,140,540 | ||||||
New York City Industrial Development Agency | ||||||||
(New York Stock Exchange Project) Series A 5.00% 5/1/18 | 350,000 | 385,224 | ||||||
65
Table of Contents
Schedules of investments
Delaware Tax-Free New York Fund
| Principal amount° | Value (U.S. $) | |||||||
| ||||||||
Municipal Bonds (continued) | ||||||||
| ||||||||
Lease Revenue Bonds (continued) | ||||||||
New York City Industrial Development Agency | ||||||||
(Senior Trips) | ||||||||
Series A 5.00% 7/1/22 (AMT) | 1,085,000 | $ | 1,199,066 | |||||
Series A 5.00% 7/1/28 (AMT) | 1,500,000 | 1,611,465 | ||||||
New York Liberty Development | ||||||||
(4 World Trade Center) 5.00% 11/15/31 | 500,000 | 567,115 | ||||||
(Class 1 - 3 World Trade Center) 144A 5.00% 11/15/44 # | 500,000 | 502,530 | ||||||
(Class 2 - 3 World Trade Center) 144A 5.375% 11/15/40 # | 500,000 | 527,435 | ||||||
New York State Dormitory Authority State Supported Debt Revenue | ||||||||
(Consolidated Services Contract) 5.00% 7/1/17 (AGM) | 500,000 | 538,140 | ||||||
United Nations Development Revenue | ||||||||
Series A 5.00% 7/1/26 | 500,000 | 556,400 | ||||||
|
| |||||||
| 7,588,070 | ||||||||
|
| |||||||
Local General Obligation Bonds – 6.29% | ||||||||
New York City | ||||||||
Fiscal 2008 Subordinate Series C-1 5.00% 10/1/19 | 500,000 | 543,725 | ||||||
Fiscal 2014 Subordinate Series D-1 5.00% 8/1/31 | 1,000,000 | 1,146,050 | ||||||
Series B 5.00% 8/1/27 | 500,000 | 582,590 | ||||||
Series G 5.00% 8/1/22 | 500,000 | 591,650 | ||||||
Subordinate Series A-1 5.00% 10/1/27 | 500,000 | 583,765 | ||||||
Subordinate Series I-1 5.375% 4/1/36 | 500,000 | 565,385 | ||||||
New York State Dormitory Authority Revenue Non-State Supported Debt | ||||||||
(School Districts Financing Program) | ||||||||
Series A 5.00% 10/1/23 | 500,000 | 584,025 | ||||||
Series A 5.00% 10/1/25 (AGM) | 500,000 | 572,410 | ||||||
|
| |||||||
| 5,169,600 | ||||||||
|
| |||||||
Pre-Refunded Bonds – 4.05% | ||||||||
Albany Industrial Development Agency Civic Facilities Revenue | ||||||||
(St. Peter’s Hospital Project) Series A 5.25% 11/15/32-17 § | 800,000 | 880,360 | ||||||
New York City Transitional Finance Authority | ||||||||
(Future Tax Secured) Subordinated Series B 5.00% 11/1/18-17 § | 335,000 | 360,038 | ||||||
New York State Dormitory Authority Revenue Non-State Supported Debt | ||||||||
(Memorial Sloan-Kettering) Series 1 5.00% 7/1/35-16 § | 225,000 | 233,919 | ||||||
66
Table of Contents
| Principal amount° | Value (U.S. $) | |||||||
| ||||||||
Municipal Bonds (continued) | ||||||||
| ||||||||
Pre-Refunded Bonds (continued) | ||||||||
New York State Dormitory Authority Revenue Non-State Supported Debt | ||||||||
(Mt. Sinai School of Medicine) 5.125% 7/1/39-19 § | 500,000 | $ | 574,620 | |||||
(North Shore Long Island Jewish Group) Series A 5.50% 5/1/37-19 § | 500,000 | 577,905 | ||||||
(University of Rochester) Series A-2 4.375% 7/1/20-17 § | 65,000 | 68,401 | ||||||
Puerto Rico Commonwealth Highway & Transportation Authority Revenue | ||||||||
Series Y 5.50% 7/1/36-16 § | 475,000 | 495,354 | ||||||
Triborough Bridge & Tunnel Authority | ||||||||
Series C 5.00% 11/15/24-18 § | 120,000 | 135,510 | ||||||
|
| |||||||
| 3,326,107 | ||||||||
|
| |||||||
Resource Recovery Revenue Bond – 0.43% | ||||||||
Jefferson County Industrial Development Agency | ||||||||
(Green Bond) 5.25% 1/1/24 (AMT) | 370,000 | 353,964 | ||||||
|
| |||||||
| 353,964 | ||||||||
|
| |||||||
Special Tax Revenue Bonds – 14.14% | ||||||||
Brooklyn Arena Local Development | ||||||||
(Barclays Center Project) | ||||||||
6.25% 7/15/40 | 500,000 | 574,165 | ||||||
6.375% 7/15/43 | 500,000 | 579,870 | ||||||
6.50% 7/15/30 | 500,000 | 581,540 | ||||||
Guam Government Business Privilege Tax Revenue | ||||||||
Series A 5.25% 1/1/36 | 240,000 | 263,232 | ||||||
Metropolitan Transportation Authority Revenue | ||||||||
(Dedicated Tax Fund) Series B 5.00% 11/15/34 | 500,000 | 565,435 | ||||||
New York City Industrial Development Agency Civic Facility Revenue | ||||||||
(YMCA of Greater New York Project) 5.00% 8/1/36 | 600,000 | 616,740 | ||||||
New York City Transitional Finance Authority Revenue | ||||||||
(Building Aid) | ||||||||
Fiscal 2015 Series S-1 5.00% 7/15/43 | 1,000,000 | 1,127,880 | ||||||
Subordinate Series S-1 A 5.25% 7/15/37 | 1,000,000 | 1,155,090 | ||||||
(Future Tax Secured) | ||||||||
Fiscal 2011 Series D 5.00% 2/1/26 | 250,000 | 287,885 | ||||||
Fiscal 2011 Series D 5.25% 2/1/29 | 500,000 | 582,110 | ||||||
Fiscal 2014 Subordinate Series A-1 5.00% 11/1/42 | 750,000 | 842,017 | ||||||
Subordinate Series B1 5.00% 11/1/40 | 750,000 | 848,107 | ||||||
Subordinate Series C 5.25% 11/1/25 | 500,000 | 591,585 | ||||||
Unrefunded Subordinate Series B 5.00% 11/1/18 | 165,000 | 177,151 | ||||||
New York Convention Center Development Revenue | ||||||||
(Hotel Unit Fee Secured) 5.00% 11/15/35 | 1,000,000 | 1,136,020 | ||||||
67
Table of Contents
Schedules of investments
Delaware Tax-Free New York Fund
| Principal amount° | Value (U.S. $) | |||||||
| ||||||||
Municipal Bonds (continued) | ||||||||
| ||||||||
Special Tax Revenue Bonds (continued) | ||||||||
New York Environmental Facilities | ||||||||
Series A 5.25% 12/15/19 | 350,000 | $ | 407,848 | |||||
New York State Dormitory Authority General Purpose | ||||||||
Series C 5.00% 3/15/34 | 500,000 | 573,385 | ||||||
Sales Tax Asset Receivable | ||||||||
Fiscal 2015 Series A 5.00% 10/15/22 | 500,000 | 604,115 | ||||||
Virgin Islands Public Finance Authority Revenue | ||||||||
(Matching Fund Loan Note - Senior Lien) Series A 5.00% 10/1/29 | 100,000 | 108,234 | ||||||
|
| |||||||
| 11,622,409 | ||||||||
|
| |||||||
State General Obligation Bonds – 0.83% | ||||||||
New York City | ||||||||
Series E 5.00% 8/1/28 | 125,000 | 142,166 | ||||||
New York State | ||||||||
Series A 5.00% 3/1/38 | 500,000 | 543,025 | ||||||
|
| |||||||
| 685,191 | ||||||||
|
| |||||||
Transportation Revenue Bonds – 8.15% | ||||||||
Metropolitan Transportation Authority Revenue | ||||||||
Series 2008C 6.50% 11/15/28 | 200,000 | 234,614 | ||||||
Series C 5.00% 11/15/32 | 500,000 | 569,800 | ||||||
Series D 5.00% 11/15/32 | 500,000 | 569,800 | ||||||
Series D 5.25% 11/15/27 | 500,000 | 576,235 | ||||||
Series F 5.00% 11/15/15 | 150,000 | 151,521 | ||||||
New York State Thruway Authority General Revenue | ||||||||
Series I 5.00% 1/1/32 | 700,000 | 790,734 | ||||||
New York State Thruway Authority Revenue | ||||||||
Series H 5.00% 1/1/30 (NATL-RE) | 750,000 | 809,415 | ||||||
Niagara Frontier Transportation Authority | ||||||||
(Buffalo Niagara International Airport) Series A 5.00% 4/1/29 (AMT) | 350,000 | 381,843 | ||||||
Port Authority of New York & New Jersey | ||||||||
(Consolidated Series 186) 5.00% 10/15/22 (AMT) | 750,000 | 875,010 | ||||||
(Consolidated-One Hundred Fifty-Third) 5.00% 7/15/35 | 250,000 | 274,285 | ||||||
(JFK International Air Terminal) | ||||||||
6.00% 12/1/42 | 700,000 | 815,500 | ||||||
6.50% 12/1/28 | 550,000 | 557,634 | ||||||
Triborough Bridge & Tunnel Authority | ||||||||
Unrefunded Series C 5.00% 11/15/24 | 80,000 | 89,852 | ||||||
|
| |||||||
| 6,696,243 | ||||||||
|
| |||||||
68
Table of Contents
| Principal amount° | Value (U.S. $) | |||||||
| ||||||||
Municipal Bonds (continued) | ||||||||
| ||||||||
Water & Sewer Revenue Bonds – 2.01% | ||||||||
New York City Municipal Water Finance Authority Water & Sewer System Revenue | ||||||||
Fiscal 2009 Series A 5.75% 6/15/40 | 200,000 | $ | 224,242 | |||||
Series FF-2 5.50% 6/15/40 | 250,000 | 285,547 | ||||||
(Second General Resolution) Fiscal 2012 Series BB 5.25% 6/15/44 | 500,000 | 564,170 | ||||||
New York State Environmental Facilities Revenue Clean Water & Drinking Water Revolving Funds | ||||||||
5.00% 6/15/30 | 500,000 | 580,600 | ||||||
|
| |||||||
| 1,654,559 | ||||||||
|
| |||||||
Total Municipal Bonds (cost $75,529,187) | 80,236,307 | |||||||
|
| |||||||
| ||||||||
Short-Term Investment – 1.46% | ||||||||
| ||||||||
Variable Rate Demand Note – 1.46%¤ | ||||||||
Syracuse Industrial Development Agency (Syracuse University Project) Series A-2 0.01% 12/1/37 | ||||||||
(LOC-JPMorgan Chase Bank N.A.)● | 1,200,000 | 1,200,000 | ||||||
|
| |||||||
Total Short-Term Investment (cost $1,200,000) | 1,200,000 | |||||||
|
| |||||||
Total Value of Securities – 99.07% | ||||||||
(cost $76,729,187) | $ | 81,436,307 | ||||||
|
| |||||||
| # | Security exempt from registration under Rule 144A of the Securities Act of 1933, as amended. At Aug. 31, 2015, the aggregate value of Rule 144A securities was $3,621,895, which represents 4.41% of the Fund’s net assets. See Note 8 in “Notes to financial statements.” |
| ¤ | Tax-exempt obligations that contain a floating or variable interest rate adjustment formula and an unconditional right of demand to receive payment of the unpaid principal balance plus accrued interest upon a short notice period (generally up to 30 days) prior to specified dates either from the issuer or by drawing on a bank letter of credit, a guarantee, or insurance issued with respect to such instrument. The rate shown is the rate as of Aug. 31, 2015. |
| ° | Principal amount shown is stated in U.S. dollars unless noted that the security is denominated in another currency. |
| ● | Variable rate security. The rate shown is the rate as of Aug. 31, 2015. Interest rates reset periodically. |
| § | Pre-refunded bonds. Municipal bonds that are generally backed or secured by U.S. Treasury bonds. For pre-refunded bonds, the stated maturity is followed by the year in which the bond is pre-refunded. See Note 8 in “Notes to financial statements.” |
69
Table of Contents
Schedules of investments
Delaware Tax-Free New York Fund
Summary of abbreviations:
AGM – Insured by Assured Guaranty Municipal Corporation
AMT – Subject to Alternative Minimum Tax
FHA – Federal Housing Administration
LOC – Letter of Credit
N.A. – North America
NATL-RE – Insured by National Public Finance Guarantee Corporation
See accompanying notes, which are an integral part of the financial statements.
70
Table of Contents
| Schedules of investments | ||
| Delaware Tax-Free Pennsylvania Fund | August 31, 2015 | |
| Principal amount° | Value (U.S. $) | |||||||
| ||||||||
Municipal Bonds – 98.74% | ||||||||
| ||||||||
Corporate Revenue Bonds – 5.59% | ||||||||
Allegheny County Industrial Development Authority Environmental Improvement Revenue | ||||||||
(U.S. Steel Corp.) 6.75% 11/1/24 | 2,475,000 | $ | 2,689,434 | |||||
Dauphin County Industrial Development Authority Water Revenue | ||||||||
(Dauphin Consolidated Water Supply Project) Series B 6.70% 6/1/17 | 1,750,000 | 1,900,290 | ||||||
Pennsylvania Economic Development Financing Authority | ||||||||
(National Gypson) 5.50% 11/1/44 (AMT) | 4,000,000 | 4,117,160 | ||||||
(PPL Energy Supply Project) Series A 6.40% 12/1/38 | 2,000,000 | 2,027,400 | ||||||
Pennsylvania Economic Development Financing Authority Solid Waste Disposal Revenue | ||||||||
(Proctor & Gamble Paper Project) 5.375% 3/1/31 (AMT) | 11,000,000 | 13,458,720 | ||||||
Pennsylvania Economic Development Financing Authority Water Facility Revenue | ||||||||
(Pennsylvania-American Water Project) 6.20% 4/1/39 | 2,850,000 | 3,263,507 | ||||||
|
| |||||||
| 27,456,511 | ||||||||
|
| |||||||
Education Revenue Bonds – 22.29% | ||||||||
Allegheny County Higher Education Building Authority Revenue | ||||||||
(Carlow University Project) | ||||||||
6.75% 11/1/31 | 750,000 | 858,375 | ||||||
7.00% 11/1/40 | 1,000,000 | 1,154,180 | ||||||
(Carnegie Mellon University) | ||||||||
5.00% 3/1/28 | 3,000,000 | 3,467,880 | ||||||
Series A 5.00% 3/1/24 | 1,000,000 | 1,178,240 | ||||||
(Chatham University) Series A 5.00% 9/1/30 | 1,500,000 | 1,610,685 | ||||||
(Duquesne University) Series A 5.00% 3/1/33 | 425,000 | 469,982 | ||||||
(Robert Morris University) | ||||||||
Series A 5.50% 10/15/30 | 1,275,000 | 1,374,641 | ||||||
Series A 5.75% 10/15/40 | 2,200,000 | 2,380,268 | ||||||
Bucks County Industrial Development Authority Revenue | ||||||||
(George School Project) 5.00% 9/15/36 | 4,455,000 | 4,975,032 | ||||||
Chester County Industrial Development Authority Revenue | ||||||||
(Renaissance Academy Charter School) | ||||||||
5.00% 10/1/34 | 1,000,000 | 1,057,360 | ||||||
5.00% 10/1/39 | 1,250,000 | 1,313,525 | ||||||
5.00% 10/1/44 | 1,000,000 | 1,040,520 | ||||||
Chester County Industrial Development Authority Student Housing Revenue | ||||||||
(West Chester University Project) | ||||||||
Series A 5.00% 8/1/30 | 1,100,000 | 1,166,033 | ||||||
Series A 5.00% 8/1/45 | 1,250,000 | 1,295,087 | ||||||
71
Table of Contents
Schedules of investments
Delaware Tax-Free Pennsylvania Fund
| Principal amount° | Value (U.S. $) | |||||||
| ||||||||
Municipal Bonds (continued) | ||||||||
| ||||||||
Education Revenue Bonds (continued) | ||||||||
Delaware County Authority | ||||||||
(Eastern University) 5.25% 10/1/32 | 3,000,000 | $ | 3,236,670 | |||||
East Hempfield Township Industrial Development Authority | ||||||||
(Student Services Income - Student Housing Project) | ||||||||
5.00% 7/1/39 | 875,000 | 906,771 | ||||||
5.00% 7/1/45 | 2,500,000 | 2,574,375 | ||||||
5.00% 7/1/46 | 1,425,000 | 1,470,443 | ||||||
5.00% 7/1/47 | 1,000,000 | 1,034,530 | ||||||
Huntingdon County General Authority Revenue | ||||||||
(Juniata College) Series A 5.00% 5/1/30 | 2,650,000 | 2,944,707 | ||||||
Lehigh County General Purpose Authority Revenue | ||||||||
(Muhlenberg College Project) | ||||||||
5.00% 2/1/29 | 740,000 | 797,439 | ||||||
5.25% 2/1/34 | 1,000,000 | 1,085,060 | ||||||
5.25% 2/1/39 | 2,750,000 | 2,981,083 | ||||||
Montgomery County Higher Education & Health Authority Revenue | ||||||||
(Arcadia University) | ||||||||
4.25% 4/1/35 | 1,080,000 | 1,077,116 | ||||||
5.625% 4/1/40 | 2,375,000 | 2,559,799 | ||||||
5.75% 4/1/40 | 2,000,000 | 2,184,760 | ||||||
Northampton County General Purpose Authority Revenue | ||||||||
(Higher Education-Lehigh University) 5.00% 11/15/39 | 4,000,000 | 4,414,840 | ||||||
Pennsylvania Higher Educational Facilities Authority College & University Revenue | ||||||||
(Delaware Valley College) 5.00% 11/1/27 | 1,250,000 | 1,340,713 | ||||||
(Edinboro University - Student Housing) 6.00% 7/1/42 | 1,400,000 | 1,467,382 | ||||||
(Edinboro University Foundation) 6.00% 7/1/43 | 1,000,000 | 1,079,050 | ||||||
(Indiana University - Student Housing Project) | ||||||||
Series A 5.00% 7/1/27 | 1,740,000 | 1,914,557 | ||||||
Series A 5.00% 7/1/41 | 1,500,000 | 1,578,750 | ||||||
(Philadelphia University) 5.00% 6/1/32 | 2,000,000 | 2,115,640 | ||||||
(Shippensburg University) | ||||||||
5.00% 10/1/44 | 1,500,000 | 1,540,305 | ||||||
6.25% 10/1/43 | 2,000,000 | 2,212,560 | ||||||
(Slippery Rock University Foundation) Series A 5.00% 7/1/39 (SGI) | 4,000,000 | 4,043,680 | ||||||
(St. Francis University) Series JJ2 6.25% 11/1/41 | 2,355,000 | 2,616,075 | ||||||
(Thomas Jefferson University) 5.00% 3/1/24 | 1,115,000 | 1,301,183 | ||||||
(Trustees of the University of Pennsylvania) | ||||||||
5.00% 9/1/29 | 1,000,000 | 1,150,790 | ||||||
Series A 5.00% 9/1/29 | 1,000,000 | 1,133,220 | ||||||
72
Table of Contents
| Principal amount° | Value (U.S. $) | |||||||
| ||||||||
Municipal Bonds (continued) | ||||||||
| ||||||||
Education Revenue Bonds (continued) | ||||||||
Pennsylvania Higher Educational Facilities Authority College & University Revenue | ||||||||
(Trustees of the University of Pennsylvania) Series A 5.00% 9/1/41 | 5,000,000 | $ | 5,530,250 | |||||
(University of Pennsylvania) | ||||||||
Series B 5.00% 9/1/30 | 1,000,000 | 1,124,340 | ||||||
Series B 5.00% 9/1/31 | 250,000 | 279,750 | ||||||
Series B 5.00% 9/1/32 | 1,000,000 | 1,119,000 | ||||||
(University of the Sciences) | ||||||||
5.00% 11/1/36 | 1,500,000 | 1,669,290 | ||||||
5.00% 11/1/42 | 1,000,000 | 1,098,960 | ||||||
Philadelphia Authority for Industrial Development Revenue | ||||||||
(First Philadelphia Preparatory Project) Series A 7.25% 6/15/43 | 2,500,000 | 2,821,850 | ||||||
(Green Woods Charter School) | ||||||||
Series A 5.50% 6/15/22 | 1,155,000 | 1,228,781 | ||||||
Series A 5.75% 6/15/42 | 2,500,000 | 2,579,025 | ||||||
(International Apartments Temple University) | ||||||||
Series A 5.375% 6/15/30 | 1,500,000 | 1,574,970 | ||||||
Series A 5.625% 6/15/42 | 3,000,000 | 3,156,930 | ||||||
(Mast Charter School) 6.00% 8/1/35 | 1,610,000 | 1,779,581 | ||||||
(New Foundation Charter School Project) 6.625% 12/15/41 | 1,000,000 | 1,098,950 | ||||||
(Performing Arts Charter School Project) 144A 6.75% 6/15/43 # | 2,550,000 | 2,689,409 | ||||||
(Tacony Academy Charter School Project) | ||||||||
6.75% 6/15/33 | 1,020,000 | 1,134,240 | ||||||
7.00% 6/15/43 | 1,535,000 | 1,725,632 | ||||||
Philadelphia Redevelopment Authority Revenue | ||||||||
(Beech Student Housing Complex) | ||||||||
Series A 5.50% 7/1/35 (ACA) | 1,525,000 | 1,526,388 | ||||||
Series A 5.625% 7/1/28 (ACA) | 1,000,000 | 1,001,010 | ||||||
University of Pittsburgh Commonwealth System of Higher Education | ||||||||
(University Capital Project) Series B 5.25% 9/15/25 | 2,000,000 | 2,286,280 | ||||||
|
| |||||||
| 109,527,942 | ||||||||
|
| |||||||
Electric Revenue Bonds – 0.64% | ||||||||
Philadelphia Gas Works Revenue | ||||||||
(8th-1998 General Ordinance) Series A 5.00% 8/1/16 | 3,000,000 | 3,123,810 | ||||||
|
| |||||||
| 3,123,810 | ||||||||
|
| |||||||
73
Table of Contents
Schedules of investments
Delaware Tax-Free Pennsylvania Fund
| Principal amount° | Value (U.S. $) | |||||||
| ||||||||
Municipal Bonds (continued) | ||||||||
| ||||||||
Healthcare Revenue Bonds – 23.84% | ||||||||
Allegheny County Hospital Development Authority Revenue | ||||||||
(University of Pittsburgh Medical Center) 5.50% 8/15/34 | 3,980,000 | $ | 4,442,874 | |||||
Berks County Municipal Authority Revenue | ||||||||
(Reading Hospital & Medical Center Project) Series A-3 5.50% 11/1/31 | 10,000,000 | 11,395,000 | ||||||
Butler County Hospital Authority Revenue 5.00% 7/1/39 | 1,625,000 | 1,751,165 | ||||||
Central Bradford Progress Authority | ||||||||
(Guthrie Healthcare System) 5.375% 12/1/41 | 1,000,000 | 1,130,740 | ||||||
Cumberland County Municipal Authority Revenue | ||||||||
(Diakon Lutheran Ministries Project) | ||||||||
5.00% 1/1/38 | 2,000,000 | 2,121,580 | ||||||
Unrefunded 6.375% 1/1/39 | 495,000 | 568,106 | ||||||
Dauphin County General Authority Health System Revenue | ||||||||
(Pinnacle Health System Project) Series A 6.00% 6/1/36 | 5,000,000 | 5,709,200 | ||||||
Franklin County Industrial Development Authority Revenue | ||||||||
(Chambersburg Hospital Project) 5.375% 7/1/42 | 4,980,000 | 5,425,162 | ||||||
Geisinger Authority Health System Series A-1 5.125% 6/1/41 | 4,000,000 | 4,407,920 | ||||||
Indiana County Hospital Authority Revenue | ||||||||
(Regional Medical Center) Series A 6.00% 6/1/39 | 1,625,000 | 1,826,386 | ||||||
Lancaster County Hospital Authority Revenue | ||||||||
(Brethren Village Project) | ||||||||
5.25% 7/1/35 | 250,000 | 250,323 | ||||||
5.50% 7/1/45 | 1,000,000 | 1,000,970 | ||||||
Series A 6.50% 7/1/40 | 3,000,000 | 3,107,970 | ||||||
(Masonic Villages of the Grand Lodge) 5.00% 11/1/35 | 2,000,000 | 2,215,580 | ||||||
(St. Anne’s Retirement Community) | ||||||||
5.00% 4/1/27 | 1,425,000 | 1,485,762 | ||||||
5.00% 4/1/33 | 1,830,000 | 1,877,379 | ||||||
Lehigh County General Purpose Authority Revenue | ||||||||
(Bible Fellowship Church Homes Project) | ||||||||
5.125% 7/1/32 | 1,000,000 | 1,036,210 | ||||||
5.25% 7/1/42 | 1,500,000 | 1,548,090 | ||||||
Monroe County Hospital Authority | ||||||||
(Pocono Medical Center) | ||||||||
Series A 5.00% 1/1/32 | 1,150,000 | 1,230,649 | ||||||
Series A 5.00% 1/1/41 | 1,500,000 | 1,596,495 | ||||||
Monroeville Finance Authority | ||||||||
5.00% 2/15/25 | 1,000,000 | 1,188,840 | ||||||
74
Table of Contents
| Principal amount° | Value (U.S. $) | |||||||
| ||||||||
Municipal Bonds (continued) | ||||||||
| ||||||||
Healthcare Revenue Bonds (continued) | ||||||||
Montgomery County Higher Education & Health Authority Revenue | ||||||||
(Abington Memorial Hospital) Series A 5.125% 6/1/33 | 5,000,000 | $ | 5,403,500 | |||||
(Abington Memorial Hospital Obligation Group) 5.00% 6/1/31 | 4,000,000 | 4,389,240 | ||||||
Montgomery County Industrial Development Authority Retirement Community Revenue | ||||||||
(ACTS Retirement Life Communities) | ||||||||
5.00% 11/15/27 | 1,250,000 | 1,340,575 | ||||||
5.00% 11/15/28 | 1,600,000 | 1,710,304 | ||||||
5.00% 11/15/29 | 680,000 | 725,172 | ||||||
Series A-1 6.25% 11/15/29 | 700,000 | 788,487 | ||||||
Series B 5.00% 11/15/22 | 3,000,000 | 3,089,100 | ||||||
(Foulkeways at Gwynedd Project) | ||||||||
Series A 5.00% 12/1/24 | 1,000,000 | 1,014,630 | ||||||
Series A 5.00% 12/1/30 | 1,500,000 | 1,534,455 | ||||||
Montgomery County Industrial Development Authority Revenue | ||||||||
(Albert Einstein Healthcare Network) Series A 5.25% 1/15/45 | 5,000,000 | 5,305,500 | ||||||
(Whitemarsh Continuing Care) 5.375% 1/1/50 | 4,000,000 | 3,991,880 | ||||||
Moon Industrial Development Authority Revenue | ||||||||
(Baptist Homes Society Obligation) 6.125% 7/1/50 | 4,000,000 | 4,008,960 | ||||||
Northampton County Industrial Development Authority | ||||||||
(Morningstar Senior Living) | ||||||||
5.00% 7/1/27 | 1,400,000 | 1,466,696 | ||||||
5.00% 7/1/32 | 1,275,000 | 1,311,312 | ||||||
Pennsylvania Economic Development Financing Authority Revenue | ||||||||
(University of Pittsburgh Medical Center) Series A 5.00% 7/1/43 | 1,265,000 | 1,389,413 | ||||||
Pennsylvania Higher Educational Facilities Authority Revenue | ||||||||
(Thomas Jefferson University) Series A 5.25% 9/1/50 | 2,500,000 | 2,747,050 | ||||||
(University of Pennsylvania Health System) | ||||||||
5.00% 8/15/24 | 4,850,000 | 5,609,219 | ||||||
5.25% 8/15/26 | 3,910,000 | 4,536,695 | ||||||
5.75% 8/15/23 | 2,500,000 | 3,021,775 | ||||||
Pocono Mountains Industrial Park Authority Revenue | ||||||||
(St. Luke’s Hospital - Monroe Project) Series A 5.00% 8/15/40 | 2,750,000 | 2,995,190 | ||||||
75
Table of Contents
Schedules of investments
Delaware Tax-Free Pennsylvania Fund
| Principal amount° | Value (U.S. $) | |||||||
| ||||||||
Municipal Bonds (continued) | ||||||||
| ||||||||
Healthcare Revenue Bonds (continued) | ||||||||
St. Mary Hospital Authority Health System Revenue | ||||||||
(Catholic Health East) 6.25% 11/15/34 | 4,795,000 | $ | 5,476,705 | |||||
|
| |||||||
| 117,172,259 | ||||||||
|
| |||||||
Housing Revenue Bonds – 1.75% | ||||||||
Bucks County Industrial Development Authority Multi-Family Housing Revenue Guaranteed | ||||||||
(New Hope Manor Project) | ||||||||
Series A 5.40% 3/1/22 (AMT) | 950,000 | 950,456 | ||||||
Series A 5.50% 3/1/41 (AMT) | 5,340,000 | 5,342,136 | ||||||
Philadelphia Authority for Industrial Development Revenue | ||||||||
(Germantown Senior Living Presbyterian Homes Project) Series A 5.625% 7/1/35 (HUD) | 2,295,000 | 2,324,858 | ||||||
|
| |||||||
| 8,617,450 | ||||||||
|
| |||||||
Lease Revenue Bonds – 3.63% | ||||||||
Allegheny County Industrial Development Authority Lease Revenue | ||||||||
(Residential Resource Project) | ||||||||
5.10% 9/1/26 | 1,335,000 | 1,344,505 | ||||||
5.125% 9/1/31 | 890,000 | 893,693 | ||||||
Pennsylvania Commonwealth Financing Authority Revenue Series B 5.00% 6/1/31 (ASSURED GTY) | 10,000,000 | 11,032,000 | ||||||
Philadelphia Municipal Authority Lease Revenue 6.50% 4/1/39 | 4,000,000 | 4,559,080 | ||||||
|
| |||||||
| 17,829,278 | ||||||||
|
| |||||||
Local General Obligation Bonds – 6.89% | ||||||||
Allegheny County | ||||||||
Series C-65 5.00% 5/1/18 | 3,765,000 | 4,161,341 | ||||||
Series C-69 5.00% 12/1/28 | 1,000,000 | 1,135,150 | ||||||
Series C-70 5.00% 12/1/33 | 2,205,000 | 2,459,898 | ||||||
Bethel Park School District 5.10% 8/1/33 | 3,000,000 | 3,369,330 | ||||||
Chester County | ||||||||
5.00% 11/15/32 | 5,725,000 | 6,564,056 | ||||||
5.00% 11/15/33 | 2,625,000 | 3,001,583 | ||||||
Series C 5.00% 7/15/29 | 3,000,000 | 3,381,450 | ||||||
City of Philadelphia Series A 5.25% 7/15/29 | 2,500,000 | 2,875,675 | ||||||
City of Pittsburgh Series B 5.00% 9/1/26 | 3,000,000 | 3,440,850 | ||||||
Fox Chapel Area School District 5.00% 8/1/25 | 1,000,000 | 1,178,460 | ||||||
76
Table of Contents
| Principal amount° | Value (U.S. $) | |||||||
| ||||||||
Municipal Bonds (continued) | ||||||||
| ||||||||
Local General Obligation Bonds (continued) | ||||||||
State Public School Building Authority | ||||||||
(Montgomery County Community College) 5.00% 5/1/28 | 2,000,000 | $ | 2,301,420 | |||||
|
| |||||||
| 33,869,213 | ||||||||
|
| |||||||
Pre-Refunded/Escrowed to Maturity Bonds – 13.80% | ||||||||
Butler County Hospital Authority Revenue | ||||||||
(Butler Health System Project) 7.25% 7/1/39-19§ | 8,000,000 | 9,823,040 | ||||||
Commonwealth of Pennsylvania Second Series 5.00% 1/1/22-16§ | 10,000,000 | 10,162,700 | ||||||
Cumberland County Municipal Authority Revenue | ||||||||
(Diakon Lutheran Ministries Project) | ||||||||
6.375% 1/1/39-19§ | 4,505,000 | 5,284,635 | ||||||
Series A 5.00% 1/1/36-17§ | 2,500,000 | 2,642,575 | ||||||
Montgomery County Industrial Development Authority Revenue | ||||||||
(New Regional Medical Center Project) 5.375% 8/1/38-20 (FHA)§ | 995,000 | 1,181,234 | ||||||
Pennsylvania Economic Development Financing Authority Health System Revenue | ||||||||
(Albert Einstein Healthcare) Series A 6.25% 10/15/23-19§ | 5,000,000 | 5,822,050 | ||||||
Pennsylvania Higher Educational Facilities Authority College & University Revenue | ||||||||
(University of Pennsylvania) | ||||||||
Series B 5.00% 9/1/26-19§ | 1,450,000 | 1,667,500 | ||||||
Series B 5.00% 9/1/27-19§ | 1,550,000 | 1,782,500 | ||||||
(University of the Arts) 5.20% 3/15/25 (ASSURED GTY) | 4,490,000 | 5,285,359 | ||||||
Pennsylvania Industrial Development Authority Revenue | ||||||||
(Economic Development) | ||||||||
5.50% 7/1/23-18§ | 615,000 | 694,052 | ||||||
Unrefunded 5.50% 7/1/23-18§ | 4,385,000 | 4,948,648 | ||||||
Philadelphia Hospitals & Higher Education Facilities Authority Revenue | ||||||||
(Presbyterian Medical Center) 6.65% 12/1/19 | 8,920,000 | 10,005,475 | ||||||
Puerto Rico Highway & Transportation Authority Revenue | ||||||||
Series AA 5.50% 7/1/18 (NATL-RE) | 3,835,000 | 4,324,499 | ||||||
South Fork Municipal Hospital Authority Revenue | ||||||||
(Conemaugh Health Systems Project) 5.50% 7/1/29-20§ | 3,500,000 | 4,167,450 | ||||||
|
| |||||||
| 67,791,717 | ||||||||
|
| |||||||
Resource Recovery Revenue Bonds – 1.08% | ||||||||
Delaware County Industrial Development Authority | ||||||||
(Covanta Project) 5.00% 7/1/43 | 2,155,000 | 2,163,577 | ||||||
77
Table of Contents
Schedules of investments
Delaware Tax-Free Pennsylvania Fund
| Principal amount° | Value (U.S. $) | |||||||
| ||||||||
Municipal Bonds (continued) | ||||||||
| ||||||||
Resource Recovery Revenue Bonds (continued) | ||||||||
Pennsylvania Economic Development Financing Authority | ||||||||
(Colver Project) Series F 4.625% 12/1/18 (AMBAC) (AMT) | 3,135,000 | $ | 3,162,180 | |||||
|
| |||||||
| 5,325,757 | ||||||||
|
| |||||||
Special Tax Revenue Bonds – 3.24% | ||||||||
Allentown Neighborhood Improvement Zone Development Authority Revenue | ||||||||
Series A 5.00% 5/1/42 | 3,500,000 | 3,639,475 | ||||||
Guam Government Limited Obligation Revenue | ||||||||
(Section 30) | ||||||||
Series A 5.625% 12/1/29 | 90,000 | 99,432 | ||||||
Series A 5.75% 12/1/34 | 3,050,000 | 3,378,333 | ||||||
Northampton County Industrial Development Authority | ||||||||
(Route 33 Project) 7.00% 7/1/32 | 2,000,000 | 2,169,780 | ||||||
Pennsylvania Intergovernmental Cooperation Authority | ||||||||
(Philadelphia Funding Program) 5.00% 6/15/21 | 2,000,000 | 2,307,720 | ||||||
Pittsburgh & Allegheny County Sports & Exhibition Authority | ||||||||
5.00% 2/1/35 (AGM) | 3,000,000 | 3,315,060 | ||||||
Washington County Redevelopment Authority Revenue | ||||||||
(Victory Centre Project-Tanger) Series A 5.45% 7/1/35 | 1,000,000 | 1,013,800 | ||||||
|
| |||||||
| 15,923,600 | ||||||||
|
| |||||||
State General Obligation Bonds – 2.46% | ||||||||
Pennsylvania | ||||||||
First Series 5.00% 4/1/26 | 1,500,000 | 1,739,880 | ||||||
First Series 5.00% 3/15/28 | 5,000,000 | 5,568,500 | ||||||
Second Series 5.00% 4/15/18 | 4,335,000 | 4,779,554 | ||||||
|
| |||||||
| 12,087,934 | ||||||||
|
| |||||||
Transportation Revenue Bonds – 10.45% | ||||||||
Delaware River Joint Toll Bridge Commission | ||||||||
5.00% 7/1/29 | 400,000 | 464,344 | ||||||
5.00% 7/1/31 | 700,000 | 802,368 | ||||||
Lehigh Northampton Airport Authority Revenue | ||||||||
Series A 6.00% 5/15/25 (NATL-RE) (AMT) | 1,525,000 | 1,527,897 | ||||||
Series A 6.00% 5/15/30 (NATL-RE) (AMT) | 2,700,000 | 2,702,862 | ||||||
Pennsylvania Economic Development Financing Authority | ||||||||
(PA Bridges Finco LP) | ||||||||
4.125% 12/31/38 (AMT) | 1,835,000 | 1,748,626 | ||||||
5.00% 6/30/42 (AMT) | 5,000,000 | 5,238,450 | ||||||
78
Table of Contents
| Principal amount° | Value (U.S. $) | |||||||
| ||||||||
Municipal Bonds (continued) | ||||||||
| ||||||||
Transportation Revenue Bonds (continued) | ||||||||
Pennsylvania Economic Development Financing Authority Exempt Facilities Revenue | ||||||||
(Amtrak Project) | ||||||||
Series A 5.00% 11/1/32 (AMT) | 3,500,000 | $ | 3,811,535 | |||||
Series A 5.00% 11/1/41 (AMT) | 5,000,000 | 5,327,850 | ||||||
Pennsylvania Turnpike Commission Revenue | ||||||||
Series A 5.00% 12/1/22 | 2,550,000 | 3,006,144 | ||||||
Series A 5.00% 12/1/23 | 2,450,000 | 2,907,293 | ||||||
Series C 5.00% 12/1/44 | 5,000,000 | 5,504,950 | ||||||
Series E 5.00% 12/1/29 | 5,000,000 | 5,663,250 | ||||||
Series E 5.00% 12/1/30 | 2,000,000 | 2,257,940 | ||||||
Philadelphia Airport Revenue Series A 5.375% 6/15/29 (ASSURED GTY) | 4,030,000 | 4,317,299 | ||||||
Port Authority of Allegheny County 5.75% 3/1/29 | 5,200,000 | 6,091,124 | ||||||
|
| |||||||
| 51,371,932 | ||||||||
|
| |||||||
Water & Sewer Revenue Bonds – 3.08% | ||||||||
Allegheny County Sanitary Authority | ||||||||
5.00% 12/1/28 (BAM) | 2,345,000 | 2,730,026 | ||||||
Cambridge Area Joint Authority Guaranteed Sewer Revenue | ||||||||
5.625% 12/1/28 | 1,150,000 | 1,215,044 | ||||||
6.00% 12/1/37 | 1,000,000 | 1,063,320 | ||||||
Delaware County Regional Water Quality Control Authority | ||||||||
5.00% 5/1/32 | 2,000,000 | 2,257,460 | ||||||
Philadelphia Water & Waste Revenue | ||||||||
5.00% 11/1/28 | 4,500,000 | 5,144,355 | ||||||
Series A 5.00% 7/1/45 | 2,500,000 | 2,733,000 | ||||||
|
| |||||||
| 15,143,205 | ||||||||
|
| |||||||
Total Municipal Bonds (cost $450,126,996) | 485,240,608 | |||||||
|
| |||||||
Total Value of Securities – 98.74% | ||||||||
(cost $450,126,996) | $ | 485,240,608 | ||||||
|
| |||||||
| # | Security exempt from registration under Rule 144A of the Securities Act of 1933, as amended. At Aug. 31, 2015, the aggregate value of Rule 144A securities was $2,689,409, which represents 0.55% of the Fund’s net assets. See Note 8 in “Notes to financial statements.” |
| ° | Principal amount shown is stated in U.S. dollars unless noted that the security is denominated in another currency. |
| § | Pre-refunded bonds. Municipal bonds that are generally backed or secured by U.S. Treasury bonds. For pre-refunded bonds, the stated maturity is followed by the year in which the bond is pre-refunded. See Note 8 in “Notes to financial statements.” |
79
Table of Contents
Schedules of investments
Delaware Tax-Free Pennsylvania Fund
Summary of abbreviations:
ACA – Insured by American Capital Access
AGM – Insured by Assured Guaranty Municipal Corporation
AMBAC – Insured by AMBAC Assurance Corporation
AMT – Subject to Alternative Minimum Tax
ASSURED GTY – Insured by Assured Guaranty Corporation
BAM – Insured by Build America Mutual Assurance
FHA – Federal Housing Administration
HUD – Housing and Urban Development Section 8
NATL-RE – Insured by National Public Finance Guarantee Corporation
SGI – Insured by Syncora Guarantee Inc.
See accompanying notes, which are an integral part of the financial statements.
80
Table of Contents
This page intentionally left blank.
Table of Contents
Statements of assets and liabilities
August 31, 2015
| Delaware Tax-Free Arizona Fund | Delaware Tax-Free California Fund | Delaware Tax-Free Colorado Fund | |||||||||||||
Assets: | |||||||||||||||
Investments, at value1 | $ | 82,181,371 | $ | 84,807,796 | $ | 184,978,032 | |||||||||
Short-term investments, at value2 | 150,000 | 1,765,396 | 3,477,796 | ||||||||||||
Cash | 1,608,208 | — | 4,262 | ||||||||||||
Interest receivable | 823,876 | 1,102,063 | 2,184,540 | ||||||||||||
Receivable for fund shares sold | — | 51,741 | 269,070 | ||||||||||||
Receivable for securities sold | — | — | 1,100,000 | ||||||||||||
|
|
|
|
|
| ||||||||||
Total assets | 84,763,455 | 87,726,996 | 192,013,700 | ||||||||||||
|
|
|
|
|
| ||||||||||
Liabilities: | |||||||||||||||
Cash overdraft | — | 21,412 | — | ||||||||||||
Distribution payable | 72,599 | 82,099 | 184,963 | ||||||||||||
Payable for fund shares redeemed | 2,750 | 606 | 245,353 | ||||||||||||
Payable for securities purchased | — | 794,610 | — | ||||||||||||
Other accrued expenses | 57,385 | 58,658 | 82,182 | ||||||||||||
Investment management fees payable | 28,945 | 29,017 | 73,505 | ||||||||||||
Distribution fees payable to affiliates | 22,275 | 26,399 | 47,301 | ||||||||||||
Other affiliates payable | 2,601 | 3,174 | 7,083 | ||||||||||||
Trustees’ fees and expenses payable | 455 | 462 | 1,016 | ||||||||||||
|
|
|
|
|
| ||||||||||
Total liabilities | 187,010 | 1,016,437 | 641,403 | ||||||||||||
|
|
|
|
|
| ||||||||||
Total Net Assets | $ | 84,576,445 | $ | 86,710,559 | $ | 191,372,297 | |||||||||
|
|
|
|
|
| ||||||||||
Net Assets Consist of: | |||||||||||||||
Paid-in capital | $ | 81,222,974 | $ | 81,269,607 | $ | 183,411,840 | |||||||||
Undistributed net investment income | 19,876 | 20,230 | 350,323 | ||||||||||||
Accumulated net realized loss on investments | (1,689,127 | ) | (1,975,025 | ) | (5,538,965 | ) | |||||||||
Net unrealized appreciation of investments | 5,022,722 | 7,395,747 | 13,149,099 | ||||||||||||
|
|
|
|
|
| ||||||||||
Total Net Assets | $ | 84,576,445 | $ | 86,710,559 | $ | 191,372,297 | |||||||||
|
|
|
|
|
| ||||||||||
82
Table of Contents
| Delaware Tax-Free Arizona Fund | Delaware Tax-Free California Fund | Delaware Tax-Free Colorado Fund | |||||||||||||
Net Asset Value | |||||||||||||||
Class A: | |||||||||||||||
Net assets | $ | 77,084,524 | $ | 60,549,863 | $ | 174,078,265 | |||||||||
Shares of beneficial interest outstanding, unlimited authorization, no par | 6,740,813 | 4,999,869 | 15,491,385 | ||||||||||||
Net asset value per share | $ | 11.44 | $ | 12.11 | $ | 11.24 | |||||||||
Sales charge | 4.50 | % | 4.50 | % | 4.50 | % | |||||||||
Offering price per share, equal to net asset value per share / (1 – sales charge) | $ | 11.98 | $ | 12.68 | $ | 11.77 | |||||||||
Class C: | |||||||||||||||
Net assets | $ | 6,747,367 | $ | 15,852,500 | $ | 12,191,873 | |||||||||
Shares of beneficial interest outstanding, unlimited authorization, no par | 588,478 | 1,306,728 | 1,082,020 | ||||||||||||
Net asset value per share | $ | 11.47 | $ | 12.13 | $ | 11.27 | |||||||||
Institutional Class: | |||||||||||||||
Net assets | $ | 744,554 | $ | 10,308,196 | $ | 5,102,159 | |||||||||
Shares of beneficial interest outstanding, unlimited authorization, no par | 65,107 | 851,283 | 454,088 | ||||||||||||
Net asset value per share | $ | 11.44 | $ | 12.11 | $ | 11.24 | |||||||||
| |||||||||||||||
1 Investments, at cost | $ | 77,158,649 | $ | 77,412,049 | $ | 171,828,933 | |||||||||
2 Short-term investments, at cost | 150,000 | 1,765,396 | 3,477,796 | ||||||||||||
See accompanying notes, which are an integral part of the financial statements.
83
Table of Contents
Statements of assets and liabilities
| Delaware Tax-Free Idaho Fund | Delaware Tax-Free New York Fund | Delaware Tax-Free Pennsylvania Fund | |||||||||||||
Assets: | |||||||||||||||
Investments, at value1 | $ | 105,184,762 | $ | 80,236,307 | $ | 485,240,608 | |||||||||
Short-term investments, at value2 | — | 1,200,000 | — | ||||||||||||
Cash | — | 18,272 | 5,249,673 | ||||||||||||
Interest receivable | 1,617,345 | 919,999 | 6,449,380 | ||||||||||||
Receivable for fund shares sold | 54,483 | 14,873 | 689,804 | ||||||||||||
Receivable for securities sold | — | — | 20,000 | ||||||||||||
|
|
|
|
|
| ||||||||||
Total assets | 106,856,590 | 82,389,451 | 497,649,465 | ||||||||||||
|
|
|
|
|
| ||||||||||
Liabilities: | |||||||||||||||
Cash overdraft | 101,357 | — | — | ||||||||||||
Payable for fund shares redeemed | 219,118 | 11,554 | 483,985 | ||||||||||||
Distribution payable | 85,164 | 61,589 | 489,003 | ||||||||||||
Payable for securities purchased | — | — | 4,715,533 | ||||||||||||
Other accrued expenses | 58,709 | 63,578 | 153,153 | ||||||||||||
Distribution fees payable to affiliates | 40,407 | 25,961 | 118,459 | ||||||||||||
Investment management fees payable | 39,814 | 22,522 | 222,136 | ||||||||||||
Other affiliates payable | 3,139 | 4,164 | 21,090 | ||||||||||||
Trustees’ fees and expenses payable | 565 | 434 | 2,617 | ||||||||||||
|
|
|
|
|
| ||||||||||
Total liabilities | 548,273 | 189,802 | 6,205,976 | ||||||||||||
|
|
|
|
|
| ||||||||||
Total Net Assets | $ | 106,308,317 | $ | 82,199,649 | $ | 491,443,489 | |||||||||
|
|
|
|
|
| ||||||||||
Net Assets Consist of: | |||||||||||||||
Paid-in capital | $ | 105,690,720 | $ | 78,970,275 | $ | 459,472,684 | |||||||||
Distributions in excess of net investment income | (14,880 | ) | (9,778 | ) | (126,680 | ) | |||||||||
Accumulated net realized loss on investments | (5,200,664 | ) | (1,467,968 | ) | (3,016,127 | ) | |||||||||
Net unrealized appreciation of investments | 5,833,141 | 4,707,120 | 35,113,612 | ||||||||||||
|
|
|
|
|
| ||||||||||
Total Net Assets | $ | 106,308,317 | $ | 82,199,649 | $ | 491,443,489 | |||||||||
|
|
|
|
|
| ||||||||||
84
Table of Contents
| Delaware Tax-Free Idaho Fund | Delaware Tax-Free New York Fund | Delaware Tax-Free Pennsylvania Fund | |||||||||||||
Net Asset Value | |||||||||||||||
Class A: | |||||||||||||||
Net assets | $ | 75,163,386 | $ | 51,708,321 | $ | 441,903,735 | |||||||||
Shares of beneficial interest outstanding, unlimited authorization, no par | 6,532,564 | 4,505,306 | 54,250,522 | ||||||||||||
Net asset value per share | $ | 11.51 | $ | 11.48 | $ | 8.15 | |||||||||
Sales charge | 4.50 | % | 4.50 | % | 4.50 | % | |||||||||
Offering price per share, equal to net asset value per share / (1 – sales charge) | $ | 12.05 | $ | 12.02 | $ | 8.53 | |||||||||
Class C: | |||||||||||||||
Net assets | $ | 28,556,865 | $ | 17,825,060 | $ | 32,799,349 | |||||||||
Shares of beneficial interest outstanding, unlimited authorization, no par | 2,483,753 | 1,556,887 | 4,024,998 | ||||||||||||
Net asset value per share | $ | 11.50 | $ | 11.45 | $ | 8.15 | |||||||||
Institutional Class: | |||||||||||||||
Net assets | $ | 2,588,066 | $ | 12,666,268 | $ | 16,740,405 | |||||||||
Shares of beneficial interest outstanding, unlimited authorization, no par | 224,884 | 1,104,097 | 2,056,328 | ||||||||||||
Net asset value per share | $ | 11.51 | $ | 11.47 | $ | 8.14 | |||||||||
| |||||||||||||||
1 Investments, at cost | $ | 99,351,621 | $ | 75,529,187 | $ | 450,126,996 | |||||||||
2 Short-term investments, at cost | — | 1,200,000 | — | ||||||||||||
See accompanying notes, which are an integral part of the financial statements.
85
Table of Contents
Year ended August 31, 2015
Delaware Tax-Free Arizona Fund | Delaware Tax-Free California Fund | Delaware Tax-Free Colorado Fund | |||||||||||||
Investment Income: | |||||||||||||||
Interest | $ | 3,584,360 | $ | 4,077,263 | $ | 8,658,004 | |||||||||
|
|
|
|
|
| ||||||||||
Expenses: | |||||||||||||||
Management fees | 433,347 | 527,856 | 1,082,712 | ||||||||||||
Distribution expenses — Class A | 198,998 | 173,156 | 450,443 | ||||||||||||
Distribution expenses — Class B | 21 | 135 | 9 | ||||||||||||
Distribution expenses — Class C | 65,714 | 160,454 | 120,422 | ||||||||||||
Dividend disbursing and transfer agent fees and expenses | 49,658 | 63,262 | 121,637 | ||||||||||||
Audit and tax fees | 39,221 | 39,690 | 40,327 | ||||||||||||
Accounting and administration expenses | 27,740 | 30,714 | 63,009 | ||||||||||||
Reports and statements to shareholders | 26,410 | 20,158 | 44,960 | ||||||||||||
Registration fees | 18,224 | 10,669 | 12,520 | ||||||||||||
Legal fees | 10,362 | 11,803 | 24,803 | ||||||||||||
Trustees’ fees and expenses | 4,027 | 4,452 | 9,137 | ||||||||||||
Custodian fees | 3,825 | 4,530 | 9,149 | ||||||||||||
Other | 11,938 | 13,803 | 17,492 | ||||||||||||
|
|
|
|
|
| ||||||||||
| 889,485 | 1,060,682 | 1,996,620 | |||||||||||||
Less expenses waived | (106,054 | ) | (173,223 | ) | (250,850 | ) | |||||||||
Less waived distribution expenses — Class B | (16 | ) | (103 | ) | (7 | ) | |||||||||
Less expense paid indirectly | (14 | ) | (11 | ) | (41 | ) | |||||||||
|
|
|
|
|
| ||||||||||
Total operating expenses | 783,401 | 887,345 | 1,745,722 | ||||||||||||
|
|
|
|
|
| ||||||||||
Net Investment Income | 2,800,959 | 3,189,918 | 6,912,282 | ||||||||||||
|
|
|
|
|
| ||||||||||
Net Realized and Unrealized Gain (Loss): | |||||||||||||||
Net realized gain | 89,236 | 74,435 | 642,992 | ||||||||||||
Net change in unrealized appreciation (depreciation) of investments | (210,123 | ) | 104,250 | (2,073,277 | ) | ||||||||||
|
|
|
|
|
| ||||||||||
Net Realized and Unrealized Gain (Loss) | (120,887 | ) | 178,685 | (1,430,285 | ) | ||||||||||
|
|
|
|
|
| ||||||||||
Net Increase in Net Assets Resulting from Operations | $ | 2,680,072 | $ | 3,368,603 | $ | 5,481,997 | |||||||||
|
|
|
|
|
| ||||||||||
See accompanying notes, which are an integral part of the financial statements.
86
Table of Contents
| Delaware Tax-Free Idaho Fund | Delaware Tax-Free New York Fund | Delaware Tax-Free Pennsylvania Fund | |||||||||||||
Investment Income: | |||||||||||||||
Interest | $ | 4,436,450 | $ | 3,132,199 | $ | 21,631,573 | |||||||||
|
|
|
|
|
| ||||||||||
Expenses: | |||||||||||||||
Management fees | 603,667 | 429,814 | 2,702,393 | ||||||||||||
Distribution expenses — Class A | 192,887 | 124,131 | 1,077,489 | ||||||||||||
Distribution expenses — Class B | 122 | 2 | 236 | ||||||||||||
Distribution expenses — Class C | 299,505 | 181,198 | 328,938 | ||||||||||||
Dividend disbursing and transfer agent fees and expenses | 68,374 | 62,600 | 335,491 | ||||||||||||
Audit and tax fees | 39,272 | 41,895 | 41,344 | ||||||||||||
Accounting and administration expenses | 35,132 | 24,994 | 157,233 | ||||||||||||
Reports and statements to shareholders | 24,329 | 37,907 | 94,258 | ||||||||||||
Legal fees | 12,732 | 9,624 | 49,396 | ||||||||||||
Registration fees | 10,699 | 11,305 | 20,867 | ||||||||||||
Custodian fees | 5,314 | 3,262 | 20,240 | ||||||||||||
Trustees’ fees and expenses | 5,098 | 3,624 | 22,817 | ||||||||||||
Other | 13,131 | 16,751 | 31,725 | ||||||||||||
|
|
|
|
|
| ||||||||||
| 1,310,262 | 947,107 | 4,882,427 | |||||||||||||
Less expenses waived | (131,652 | ) | (190,852 | ) | (299,963 | ) | |||||||||
Less waived distribution expenses — Class B | (94 | ) | (2 | ) | (182 | ) | |||||||||
Less expense paid indirectly | (29 | ) | (10 | ) | (115 | ) | |||||||||
|
|
|
|
|
| ||||||||||
Total operating expenses | 1,178,487 | 756,243 | 4,582,167 | ||||||||||||
|
|
|
|
|
| ||||||||||
Net Investment Income | 3,257,963 | 2,375,956 | 17,049,406 | ||||||||||||
|
|
|
|
|
| ||||||||||
Net Realized and Unrealized Gain (Loss): | |||||||||||||||
Net realized gain | 64,943 | 82,653 | 1,937,674 | ||||||||||||
Net change in unrealized appreciation (depreciation) of investments | (615,374 | ) | (72,885 | ) | (2,924,575 | ) | |||||||||
|
|
|
|
|
| ||||||||||
Net Realized and Unrealized Gain (Loss) | (550,431 | ) | 9,768 | (986,901 | ) | ||||||||||
|
|
|
|
|
| ||||||||||
Net Increase in Net Assets Resulting from Operations | $ | 2,707,532 | $ | 2,385,724 | $ | 16,062,505 | |||||||||
|
|
|
|
|
| ||||||||||
See accompanying notes, which are an integral part of the financial statements.
87
Table of Contents
Statements of changes in net assets
Delaware Tax-Free Arizona Fund
| Year ended | ||||||||
| 8/31/15 | 8/31/14 | |||||||
Increase (Decrease) in Net Assets from Operations: | ||||||||
Net investment income | $ | 2,800,959 | $ | 3,389,131 | ||||
Net realized gain (loss) | 89,236 | (1,899,569 | ) | |||||
Net change in unrealized appreciation (depreciation) | (210,123 | ) | 8,167,044 | |||||
|
|
|
| |||||
Net increase in net assets resulting from operations | 2,680,072 | 9,656,606 | ||||||
|
|
|
| |||||
Dividends and Distributions to Shareholders from: | ||||||||
Net investment income: | ||||||||
Class A | (2,609,063 | ) | (3,173,654 | ) | ||||
Class B | (75 | ) | (2,476 | ) | ||||
Class C | (165,788 | ) | (194,104 | ) | ||||
Institutional Class | (17,946 | ) | (1,284 | ) | ||||
Net realized gain: | ||||||||
Class A | — | (209,767 | ) | |||||
Class B | — | (232 | ) | |||||
Class C | — | (15,880 | ) | |||||
|
|
|
| |||||
| (2,792,872 | ) | (3,597,397 | ) | |||||
|
|
|
| |||||
Capital Share Transactions: | ||||||||
Proceeds from shares sold: | ||||||||
Class A | 2,174,576 | 4,631,052 | ||||||
Class B | — | 56 | ||||||
Class C | 1,052,259 | 550,574 | ||||||
Institutional Class | 551,671 | 215,999 | ||||||
Net asset value of shares issued upon reinvestment of dividends and distributions: | ||||||||
Class A | 1,975,880 | 2,589,656 | ||||||
Class B | 81 | 2,708 | ||||||
Class C | 140,376 | 176,745 | ||||||
Institutional Class | 13,235 | 1,080 | ||||||
|
|
|
| |||||
| 5,908,078 | 8,167,870 | |||||||
|
|
|
| |||||
88
Table of Contents
| Year ended | ||||||||
| 8/31/15 | 8/31/14 | |||||||
Capital Share Transactions (continued): | ||||||||
Cost of shares redeemed: | ||||||||
Class A | $ | (8,565,192 | ) | $ | (15,145,773 | ) | ||
Class B | (27,856 | ) | (82,753 | ) | ||||
Class C | (666,706 | ) | (1,402,453 | ) | ||||
Institutional Class | (35,944 | ) | (467 | ) | ||||
|
|
|
| |||||
| (9,295,698 | ) | (16,631,446 | ) | |||||
|
|
|
| |||||
Decrease in net assets derived from capital share transactions | (3,387,620 | ) | (8,463,576 | ) | ||||
|
|
|
| |||||
Net Decrease in Net Assets | (3,500,420 | ) | (2,404,367 | ) | ||||
Net Assets: | ||||||||
Beginning of year | 88,076,865 | 90,481,232 | ||||||
|
|
|
| |||||
End of year | $ | 84,576,445 | $ | 88,076,865 | ||||
|
|
|
| |||||
Undistributed net investment income | $ | 19,876 | $ | 19,968 | ||||
|
|
|
| |||||
See accompanying notes, which are an integral part of the financial statements.
89
Table of Contents
Statements of changes in net assets
Delaware Tax-Free California Fund
| Year ended | ||||||||
| 8/31/15 | 8/31/14 | |||||||
Increase (Decrease) in Net Assets from Operations: | ||||||||
Net investment income | $ | 3,189,918 | $ | 3,445,515 | ||||
Net realized gain (loss) | 74,435 | (1,648,961 | ) | |||||
Net change in unrealized appreciation (depreciation) | 104,250 | 9,770,515 | ||||||
|
|
|
| |||||
Net increase in net assets resulting from operations | 3,368,603 | 11,567,069 | ||||||
|
|
|
| |||||
Dividends and Distributions to Shareholders from: | ||||||||
Net investment income: | ||||||||
Class A | (2,364,024 | ) | (2,927,750 | ) | ||||
Class B | (483 | ) | (9,893 | ) | ||||
Class C | (426,950 | ) | (477,653 | ) | ||||
Institutional Class | (392,947 | ) | (34,509 | ) | ||||
|
|
|
| |||||
| (3,184,404 | ) | (3,449,805 | ) | |||||
|
|
|
| |||||
Capital Share Transactions: | ||||||||
Proceeds from shares sold: | ||||||||
Class A | 5,779,743 | 8,304,547 | ||||||
Class C | 2,314,906 | 1,680,819 | ||||||
Institutional Class | 8,534,618 | 5,948,986 | ||||||
Net asset value of shares issued upon reinvestment of dividends and distributions: | ||||||||
Class A | 2,080,029 | 2,547,795 | ||||||
Class B | 520 | 9,593 | ||||||
Class C | 348,149 | 404,783 | ||||||
Institutional Class | 343,952 | 29,141 | ||||||
|
|
|
| |||||
| 19,401,917 | 18,925,664 | |||||||
|
|
|
| |||||
90
Table of Contents
| Year ended | ||||||||
| 8/31/15 | 8/31/14 | |||||||
Capital Share Transactions (continued): | ||||||||
Cost of shares redeemed: | ||||||||
Class A | $ | (21,408,060 | ) | $ | (28,813,534 | ) | ||
Class B | (181,298 | ) | (309,571 | ) | ||||
Class C | (2,315,796 | ) | (6,229,137 | ) | ||||
Institutional Class | (4,562,327 | ) | (71,562 | ) | ||||
|
|
|
| |||||
| (28,467,481 | ) | (35,423,804 | ) | |||||
|
|
|
| |||||
Decrease in net assets derived from capital share transactions | (9,065,564 | ) | (16,498,140 | ) | ||||
|
|
|
| |||||
Net Decrease in Net Assets | (8,881,365 | ) | (8,380,876 | ) | ||||
Net Assets: | ||||||||
Beginning of year | 95,591,924 | 103,972,800 | ||||||
|
|
|
| |||||
End of year | $ | 86,710,559 | $ | 95,591,924 | ||||
|
|
|
| |||||
Undistributed net investment income | $ | 20,230 | $ | 18,763 | ||||
|
|
|
| |||||
See accompanying notes, which are an integral part of the financial statements.
91
Table of Contents
Statements of changes in net assets
Delaware Tax-Free Colorado Fund
| Year ended | ||||||||
| 8/31/15 | 8/31/14 | |||||||
Increase (Decrease) in Net Assets from Operations: | ||||||||
Net investment income | $ | 6,912,282 | $ | 7,137,041 | ||||
Net realized gain (loss) | 642,992 | (4,499,483 | ) | |||||
Net change in unrealized appreciation (depreciation) | (2,073,277 | ) | 19,363,895 | |||||
|
|
|
| |||||
Net increase in net assets resulting from operations | 5,481,997 | 22,001,453 | ||||||
|
|
|
| |||||
Dividends and Distributions to Shareholders from: | ||||||||
Net investment income: | ||||||||
Class A | (6,384,370 | ) | (6,745,518 | ) | ||||
Class B | (32 | ) | (584 | ) | ||||
Class C | (336,361 | ) | (365,812 | ) | ||||
Institutional Class | (177,644 | ) | (10,576 | ) | ||||
|
|
|
| |||||
| (6,898,407 | ) | (7,122,490 | ) | |||||
|
|
|
| |||||
Capital Share Transactions: | ||||||||
Proceeds from shares sold: | ||||||||
Class A | 6,696,136 | 6,475,422 | ||||||
Class B | — | 7,595 | ||||||
Class C | 1,321,189 | 533,231 | ||||||
Institutional Class | 2,866,479 | 3,111,270 | ||||||
Net asset value of shares issued upon reinvestment of dividends and distributions: | ||||||||
Class A | 5,268,251 | 5,607,046 | ||||||
Class B | 35 | 584 | ||||||
Class C | 302,923 | �� | 329,933 | |||||
Institutional Class | 157,616 | 7,563 | ||||||
|
|
|
| |||||
| 16,612,629 | 16,072,644 | |||||||
|
|
|
| |||||
92
Table of Contents
| Year ended | ||||||||
| 8/31/15 | 8/31/14 | |||||||
Capital Share Transactions (continued): | ||||||||
Cost of shares redeemed: | ||||||||
Class A | $ | (20,168,957 | ) | $ | (32,730,998 | ) | ||
Class B | (11,709 | ) | (12,304 | ) | ||||
Class C | (1,361,395 | ) | (3,571,888 | ) | ||||
Institutional Class | (959,602 | ) | (72,761 | ) | ||||
|
|
|
| |||||
| (22,501,663 | ) | (36,387,951 | ) | |||||
|
|
|
| |||||
Decrease in net assets derived from capital share transactions | (5,889,034 | ) | (20,315,307 | ) | ||||
|
|
|
| |||||
Net Decrease in Net Assets | (7,305,444 | ) | (5,436,344 | ) | ||||
Net Assets: | ||||||||
Beginning of year | 198,677,741 | 204,114,085 | ||||||
|
|
|
| |||||
End of year | $ | 191,372,297 | $ | 198,677,741 | ||||
|
|
|
| |||||
Undistributed net investment income | $ | 350,323 | $ | 352,558 | ||||
|
|
|
| |||||
See accompanying notes, which are an integral part of the financial statements.
93
Table of Contents
Statements of changes in net assets
Delaware Tax-Free Idaho Fund
| Year ended | ||||||||
| 8/31/15 | 8/31/14 | |||||||
Increase (Decrease) in Net Assets from Operations: | ||||||||
Net investment income | $ | 3,257,963 | $ | 3,486,244 | ||||
Net realized gain (loss) | 64,943 | (3,874,468 | ) | |||||
Net change in unrealized appreciation (depreciation) | (615,374 | ) | 9,586,365 | |||||
|
|
|
| |||||
Net increase in net assets resulting from operations | 2,707,532 | 9,198,141 | ||||||
|
|
|
| |||||
Dividends and Distributions to Shareholders from: | ||||||||
Net investment income: | ||||||||
Class A | (2,435,094 | ) | (2,665,570 | ) | ||||
Class B | (406 | ) | (7,007 | ) | ||||
Class C | (720,612 | ) | (803,312 | ) | ||||
Institutional Class | (91,023 | ) | (4,657 | ) | ||||
|
|
|
| |||||
| (3,247,135 | ) | (3,480,546 | ) | |||||
|
|
|
| |||||
Capital Share Transactions: | ||||||||
Proceeds from shares sold: | ||||||||
Class A | 6,241,091 | 9,285,865 | ||||||
Class C | 3,379,466 | 2,144,338 | ||||||
Institutional Class | 2,334,876 | 1,080,575 | ||||||
Net asset value of shares issued upon reinvestment of dividends and distributions: | ||||||||
Class A | 2,101,144 | 2,197,153 | ||||||
Class B | 434 | 7,006 | ||||||
Class C | 669,540 | 743,871 | ||||||
Institutional Class | 71,275 | 3,806 | ||||||
|
|
|
| |||||
| 14,797,826 | 15,462,614 | |||||||
|
|
|
| |||||
94
Table of Contents
| Year ended | ||||||||
| 8/31/15 | 8/31/14 | |||||||
Capital Share Transactions (continued): | ||||||||
Cost of shares redeemed: | ||||||||
Class A | $ | (13,369,493 | ) | $ | (22,518,291 | ) | ||
Class B | (164,649 | ) | (149,948 | ) | ||||
Class C | (6,537,891 | ) | (6,543,849 | ) | ||||
Institutional Class | (900,541 | ) | (16,218 | ) | ||||
|
|
|
| |||||
| (20,972,574 | ) | (29,228,306 | ) | |||||
|
|
|
| |||||
Decrease in net assets derived from capital share transactions | (6,174,748 | ) | (13,765,692 | ) | ||||
|
|
|
| |||||
Net Decrease in Net Assets | (6,714,351 | ) | (8,048,097 | ) | ||||
Net Assets: | ||||||||
Beginning of year | 113,022,668 | 121,070,765 | ||||||
|
|
|
| |||||
End of year | $ | 106,308,317 | $ | 113,022,668 | ||||
|
|
|
| |||||
Distributions in excess of net investment income | $ | (14,880 | ) | $ | (16,644 | ) | ||
|
|
|
| |||||
See accompanying notes, which are an integral part of the financial statements.
95
Table of Contents
Statements of changes in net assets
Delaware Tax-Free New York Fund
| Year ended | ||||||||
| 8/31/15 | 8/31/14 | |||||||
Increase (Decrease) in Net Assets from Operations: | ||||||||
Net investment income | $ | 2,375,956 | $ | 2,293,002 | ||||
Net realized gain (loss) | 82,653 | (1,368,268 | ) | |||||
Net change in unrealized appreciation (depreciation) | (72,885 | ) | 7,286,999 | |||||
|
|
|
| |||||
Net increase in net assets resulting from operations | 2,385,724 | 8,211,733 | ||||||
|
|
|
| |||||
Dividends and Distributions to Shareholders from: | ||||||||
Net investment income: | ||||||||
Class A | (1,580,188 | ) | (1,787,546 | ) | ||||
Class B | (7 | ) | (1,862 | ) | ||||
Class C | (440,833 | ) | (492,130 | ) | ||||
Institutional Class | (355,835 | ) | (7,986 | ) | ||||
|
|
|
| |||||
| (2,376,863 | ) | (2,289,524 | ) | |||||
|
|
|
| |||||
Capital Share Transactions: | ||||||||
Proceeds from shares sold: | ||||||||
Class A | 10,379,452 | 6,939,548 | ||||||
Class B | — | 28 | ||||||
Class C | 2,501,821 | 1,245,823 | ||||||
Institutional Class | 11,718,291 | 1,746,280 | ||||||
Net asset value of shares issued upon reinvestment of dividends and distributions: | ||||||||
Class A | 1,426,469 | 1,603,672 | ||||||
Class B | 8 | 1,796 | ||||||
Class C | 324,818 | 356,769 | ||||||
Institutional Class | 328,661 | 6,488 | ||||||
|
|
|
| |||||
| 26,679,520 | 11,900,404 | |||||||
|
|
|
| |||||
96
Table of Contents
| Year ended | ||||||||
| 8/31/15 | 8/31/14 | |||||||
Capital Share Transactions (continued): | ||||||||
Cost of shares redeemed: | ||||||||
Class A | $ | (12,678,070 | ) | $ | (18,128,340 | ) | ||
Class B | (2,832 | ) | (139,563 | ) | ||||
Class C | (3,507,474 | ) | (5,801,995 | ) | ||||
Institutional Class | (1,152,615 | ) | (6,491 | ) | ||||
|
|
|
| |||||
| (17,340,991 | ) | (24,076,389 | ) | |||||
|
|
|
| |||||
Increase (decrease) in net assets derived from capital share transactions | 9,338,529 | (12,175,985 | ) | |||||
|
|
|
| |||||
Net Increase (Decrease) in Net Assets | 9,347,390 | (6,253,776 | ) | |||||
Net Assets: | ||||||||
Beginning of year | 72,852,259 | 79,106,035 | ||||||
|
|
|
| |||||
End of year | $ | 82,199,649 | $ | 72,852,259 | ||||
|
|
|
| |||||
Distributions in excess of net investment income | $ | (9,778 | ) | $ | (651 | ) | ||
|
|
|
| |||||
See accompanying notes, which are an integral part of the financial statements.
97
Table of Contents
Statements of changes in net assets
Delaware Tax-Free Pennsylvania Fund
| Year ended | ||||||||
| 8/31/15 | 8/31/14 | |||||||
Increase (Decrease) in Net Assets from Operations: | ||||||||
Net investment income | $ | 17,049,406 | $ | 17,708,242 | ||||
Net realized gain (loss) | 1,937,674 | (3,548,060 | ) | |||||
Net change in unrealized appreciation (depreciation) | (2,924,575 | ) | 38,408,517 | |||||
|
|
|
| |||||
Net increase in net assets resulting from operations | 16,062,505 | 52,568,699 | ||||||
|
|
|
| |||||
Dividends and Distributions to Shareholders from: | ||||||||
Net investment income: | ||||||||
Class A | (15,762,881 | ) | (16,741,916 | ) | ||||
Class B | (859 | ) | (15,706 | ) | ||||
Class C | (907,357 | ) | (929,492 | ) | ||||
Institutional Class | (396,023 | ) | (21,128 | ) | ||||
|
|
|
| |||||
| (17,067,120 | ) | (17,708,242 | ) | |||||
|
|
|
| |||||
Capital Share Transactions: | ||||||||
Proceeds from shares sold: | ||||||||
Class A | 25,913,128 | 28,015,218 | ||||||
Class B | — | 8 | ||||||
Class C | 4,242,065 | 3,328,437 | ||||||
Institutional Class | 15,603,971 | 3,678,035 | ||||||
Net asset value of shares issued upon reinvestment of dividends and distributions: | ||||||||
Class A | 12,830,901 | 13,573,156 | ||||||
Class B | 925 | 15,961 | ||||||
Class C | 816,774 | 849,287 | ||||||
Institutional Class | 329,145 | 16,940 | ||||||
|
|
|
| |||||
| 59,736,909 | 49,477,042 | |||||||
|
|
|
| |||||
98
Table of Contents
| Year ended | ||||||||
| 8/31/15 | 8/31/14 | |||||||
Capital Share Transactions (continued): | ||||||||
Cost of shares redeemed: | ||||||||
Class A | $ | (47,293,214 | ) | $ | (76,268,880 | ) | ||
Class B | (317,202 | ) | (340,277 | ) | ||||
Class C | (4,289,756 | ) | (6,951,069 | ) | ||||
Institutional Class | (2,835,778 | ) | (8,738 | ) | ||||
|
|
|
| |||||
| (54,735,950 | ) | (83,568,964 | ) | |||||
|
|
|
| |||||
Increase (Decrease) in net assets derived from capital share transactions | 5,000,959 | (34,091,922 | ) | |||||
|
|
|
| |||||
Net Increase in Net Assets | 3,996,344 | 768,535 | ||||||
Net Assets: | ||||||||
Beginning of year | 487,447,145 | 486,678,610 | ||||||
|
|
|
| |||||
End of year | $ | 491,443,489 | $ | 487,447,145 | ||||
|
|
|
| |||||
Distributions in excess of net investment income | $ | (126,680 | ) | $ | (108,966 | ) | ||
|
|
|
| |||||
See accompanying notes, which are an integral part of the financial statements.
99
Table of Contents
Delaware Tax-Free Arizona Fund Class A
Selected data for each share of the Fund outstanding throughout each period were as follows:
Net asset value, beginning of period |
Income (loss) from investment operations: |
Net investment income1 |
Net realized and unrealized gain (loss) |
Total from investment operations |
Less dividends and distributions from: |
Net investment income |
Net realized gain |
Total dividends and distributions |
Net asset value, end of period |
Total return2 |
Ratios and supplemental data: |
Net assets, end of period (000 omitted) |
Ratio of expenses to average net assets |
Ratio of expenses to average net assets prior to fees waived |
Ratio of net investment income to average net assets |
Ratio of net investment income to average net assets prior to fees waived |
Portfolio turnover |
| 1 | The average shares outstanding have been applied for per share information. |
| 2 | Total investment return is based on the change in net asset value of a share during the period and assumes reinvestment of dividends and distributions at net asset value and does not reflect the impact of a sales charge. Total investment return during all of the periods shown reflects a waiver by the manager. Performance would have been lower had the waiver not been in effect. |
See accompanying notes, which are an integral part of the financial statements.
100
Table of Contents
Year ended | ||||||||||||||||||||
|
| |||||||||||||||||||
| 8/31/15 | 8/31/14 | 8/31/13 | 8/31/12 | 8/31/11 | ||||||||||||||||
| ||||||||||||||||||||
| $ | 11.450 | $ | 10.690 | $ | 12.010 | $ | 11.340 | $ | 11.760 | |||||||||||
| 0.378 | 0.428 | 0.450 | 0.460 | 0.445 | ||||||||||||||||
| (0.011 | ) | 0.784 | (1.206 | ) | 0.670 | (0.394 | ) | |||||||||||||
|
|
|
|
|
|
|
|
|
| |||||||||||
| 0.367 | 1.212 | (0.756 | ) | 1.130 | 0.051 | |||||||||||||||
|
|
|
|
|
|
|
|
|
| |||||||||||
| (0.377 | ) | (0.425 | ) | (0.448 | ) | (0.457 | ) | (0.444 | ) | |||||||||||
| — | (0.027 | ) | (0.116 | ) | (0.003 | ) | (0.027 | ) | ||||||||||||
|
|
|
|
|
|
|
|
|
| |||||||||||
| (0.377 | ) | (0.452 | ) | (0.564 | ) | (0.460 | ) | (0.471 | ) | |||||||||||
|
|
|
|
|
|
|
|
|
| |||||||||||
| $ | 11.440 | $ | 11.450 | $ | 10.690 | $ | 12.010 | $ | 11.340 | |||||||||||
|
|
|
|
|
|
|
|
|
| |||||||||||
| 3.24% | 11.56% | (6.62% | ) | 10.15% | 0.57% | |||||||||||||||
| $ | 77,085 | $ | 81,592 | $ | 83,896 | $ | 99,953 | $ | 95,487 | |||||||||||
| 0.85% | 0.84% | 0.84% | 0.84% | 0.87% | ||||||||||||||||
| 0.97% | 0.96% | 0.94% | 0.90% | 0.93% | ||||||||||||||||
| 3.28% | 3.86% | 3.83% | 3.94% | 3.98% | ||||||||||||||||
| 3.16% | 3.74% | 3.73% | 3.88% | 3.92% | ||||||||||||||||
| 12% | 11% | 18% | 34% | 32% | ||||||||||||||||
101
Table of Contents
Financial highlights
Delaware Tax-Free Arizona Fund Class C
Selected data for each share of the Fund outstanding throughout each period were as follows:
Net asset value, beginning of period |
Income (loss) from investment operations: |
Net investment income1 |
Net realized and unrealized gain (loss) |
Total from investment operations |
Less dividends and distributions from: |
Net investment income |
Net realized gain |
Total dividends and distributions |
Net asset value, end of period |
Total return2 |
Ratios and supplemental data: |
Net assets, end of period (000 omitted) |
Ratio of expenses to average net assets |
Ratio of expenses to average net assets prior to fees waived |
Ratio of net investment income to average net assets |
Ratio of net investment income to average net assets prior to fees waived |
Portfolio turnover |
| 1 | The average shares outstanding have been applied for per share information. |
| 2 | Total investment return is based on the change in net asset value of a share during the period and assumes reinvestment of dividends and distributions at net asset value and does not reflect the impact of a sales charge. Total investment return during all of the periods shown reflects a waiver by the manager. Performance would have been lower had the waiver not been in effect. |
See accompanying notes, which are an integral part of the financial statements.
102
Table of Contents
| Year ended | ||||||||||||||||||||
|
| |||||||||||||||||||
| 8/31/15 | 8/31/14 | 8/31/13 | 8/31/12 | 8/31/11 | ||||||||||||||||
| ||||||||||||||||||||
| $ | 11.480 | $ | 10.720 | $ | 12.040 | $ | 11.370 | $ | 11.790 | |||||||||||
| 0.292 | 0.346 | 0.362 | 0.373 | 0.362 | ||||||||||||||||
| (0.011 | ) | 0.784 | (1.205 | ) | 0.670 | (0.394 | ) | |||||||||||||
|
|
|
|
|
|
|
|
|
| |||||||||||
| 0.281 | 1.130 | (0.843 | ) | 1.043 | (0.032 | ) | ||||||||||||||
|
|
|
|
|
|
|
|
|
| |||||||||||
| (0.291 | ) | (0.343 | ) | (0.361 | ) | (0.370 | ) | (0.361 | ) | |||||||||||
| — | (0.027 | ) | (0.116 | ) | (0.003 | ) | (0.027 | ) | ||||||||||||
|
|
|
|
|
|
|
|
|
| |||||||||||
| (0.291 | ) | (0.370 | ) | (0.477 | ) | (0.373 | ) | (0.388 | ) | |||||||||||
|
|
|
|
|
|
|
|
|
| |||||||||||
| $ | 11.470 | $ | 11.480 | $ | 10.720 | $ | 12.040 | $ | 11.370 | |||||||||||
|
|
|
|
|
|
|
|
|
| |||||||||||
| 2.47% | 10.72% | (7.30% | ) | 9.31% | (0.17% | ) | ||||||||||||||
| $ | 6,747 | $ | 6,238 | $ | 6,482 | $ | 7,108 | $ | 6,801 | |||||||||||
| 1.60% | 1.59% | 1.59% | 1.59% | 1.62% | ||||||||||||||||
| 1.72% | 1.71% | 1.69% | 1.65% | 1.68% | ||||||||||||||||
| 2.54% | 3.11% | 3.08% | 3.19% | 3.23% | ||||||||||||||||
| 2.42% | 2.99% | 2.98% | 3.13% | 3.17% | ||||||||||||||||
| 12% | 11% | 18% | 34% | 32% | ||||||||||||||||
103
Table of Contents
Financial highlights
Delaware Tax-Free Arizona Fund Institutional Class
Selected data for each share of the Fund outstanding throughout each period were as follows:
Year ended | 12/31/131 8/31/14 | |||||||||
| ||||||||||
Net asset value, beginning of period | $ | 11.450 | $ | 10.770 | ||||||
Income (loss) from investment operations: | ||||||||||
Net investment income2 | 0.407 | 0.325 | ||||||||
Net realized and unrealized gain (loss) | (0.011 | ) | 0.675 | |||||||
|
|
|
| |||||||
Total from investment operations | 0.396 | 1.000 | ||||||||
|
|
|
| |||||||
Less dividends and distributions from: | ||||||||||
Net investment income | (0.406 | ) | (0.320 | ) | ||||||
|
|
|
| |||||||
Total dividends and distributions | (0.406 | ) | (0.320 | ) | ||||||
|
|
|
| |||||||
Net asset value, end of period | $ | 11.440 | $ | 11.450 | ||||||
|
|
|
| |||||||
Total return3 | 3.49% | 9.39% | ||||||||
Ratios and supplemental data: | ||||||||||
Net assets, end of period (000 omitted) | $ | 744 | $ | 219 | ||||||
Ratio of expenses to average net assets | 0.60% | 0.59% | ||||||||
Ratio of expenses to average net assets prior to fees waived | 0.72% | 0.71% | ||||||||
Ratio of net investment income to average net assets | 3.54% | 4.06% | ||||||||
Ratio of net investment income to average net assets prior to fees waived | 3.42% | 3.94% | ||||||||
Portfolio turnover | 12% | 11% | 4 | |||||||
| 1 | Date of commencement of operations; ratios have been annualized and total return has not been annualized. |
| 2 | The average shares outstanding have been applied for per share information. |
| 3 | Total investment return is based on the change in net asset value of a share during the period and assumes reinvestment of dividends and distributions at net asset value. Total investment return during all of the periods shown reflects a waiver by the manager. Performance would have been lower had the waiver not been in effect. |
| 4 | Portfolio turnover is representative of the Fund for the entire annual period. |
See accompanying notes, which are an integral part of the financial statements.
104
Table of Contents
This page intentionally left blank.
Table of Contents
Financial highlights
Delaware Tax-Free California Fund Class A
Selected data for each share of the Fund outstanding throughout each period were as follows:
Net asset value, beginning of period |
Income (loss) from investment operations: |
Net investment income1 |
Net realized and unrealized gain (loss) |
Total from investment operations |
Less dividends and distributions from: |
Net investment income |
Total dividends and distributions |
Net asset value, end of period |
Total return2 |
Ratios and supplemental data: |
Net assets, end of period (000 omitted) |
Ratio of expenses to average net assets |
Ratio of expenses to average net assets prior to fees waived |
Ratio of net investment income to average net assets |
Ratio of net investment income to average net assets prior to fees waived |
Portfolio turnover |
| 1 | The average shares outstanding have been applied for per share information. |
| 2 | Total investment return is based on the change in net asset value of a share during the period and assumes reinvestment of dividends and distributions at net asset value and does not reflect the impact of a sales charge. Total investment return during all of the periods shown reflects a waiver by the manager. Performance would have been lower had the waiver not been in effect. |
See accompanying notes, which are an integral part of the financial statements.
106
Table of Contents
| Year ended | ||||||||||||||||||||
|
| |||||||||||||||||||
| 8/31/15 | 8/31/14 | 8/31/13 | 8/31/12 | 8/31/11 | ||||||||||||||||
| ||||||||||||||||||||
| $ | 12.080 | $ | 11.110 | $ | 12.210 | $ | 11.170 | $ | 11.570 | |||||||||||
| 0.416 | 0.427 | 0.439 | 0.484 | 0.476 | ||||||||||||||||
| 0.029 | 0.970 | (1.100 | ) | 1.039 | (0.401 | ) | ||||||||||||||
|
|
|
|
|
|
|
|
|
| |||||||||||
| 0.445 | 1.397 | (0.661 | ) | 1.523 | 0.075 | |||||||||||||||
|
|
|
|
|
|
|
|
|
| |||||||||||
| (0.415 | ) | (0.427 | ) | (0.439 | ) | (0.483 | ) | (0.475 | ) | |||||||||||
|
|
|
|
|
|
|
|
|
| |||||||||||
| (0.415 | ) | (0.427 | ) | (0.439 | ) | (0.483 | ) | (0.475 | ) | |||||||||||
|
|
|
|
|
|
|
|
|
| |||||||||||
| $ | 12.110 | $ | 12.080 | $ | 11.110 | $ | 12.210 | $ | 11.170 | |||||||||||
|
|
|
|
|
|
|
|
|
| |||||||||||
| 3.73% | 12.79% | (5.63% | ) | 13.90% | 0.83% | |||||||||||||||
| $ | 60,550 | $ | 73,955 | $ | 85,269 | $ | 97,821 | $ | 67,047 | |||||||||||
| 0.83% | 0.82% | 0.82% | 0.82% | 0.82% | ||||||||||||||||
| 1.01% | 1.00% | 0.99% | 0.97% | 0.98% | ||||||||||||||||
| 3.42% | 3.69% | 3.62% | 4.10% | 4.36% | ||||||||||||||||
| 3.24% | 3.51% | 3.45% | 3.95% | 4.20% | ||||||||||||||||
| 24% | 13% | 38% | 32% | 44% | ||||||||||||||||
107
Table of Contents
Financial highlights
Delaware Tax-Free California Fund Class C
Selected data for each share of the Fund outstanding throughout each period were as follows:
|
Net asset value, beginning of period |
Income (loss) from investment operations: |
Net investment income1 |
Net realized and unrealized gain (loss) |
Total from investment operations |
Less dividends and distributions from: |
Net investment income |
Total dividends and distributions |
Net asset value, end of period |
Total return2 |
Ratios and supplemental data: |
Net assets, end of period (000 omitted) |
Ratio of expenses to average net assets |
Ratio of expenses to average net assets prior to fees waived |
Ratio of net investment income to average net assets |
Ratio of net investment income to average net assets prior to fees waived |
Portfolio turnover |
| 1 | The average shares outstanding have been applied for per share information. |
| 2 | Total investment return is based on the change in net asset value of a share during the period and assumes reinvestment of dividends and distributions at net asset value and does not reflect the impact of a sales charge. Total investment return during all of the periods shown reflects a waiver by the manager. Performance would have been lower had the waiver not been in effect. |
See accompanying notes, which are an integral part of the financial statements.
108
Table of Contents
| Year ended | ||||||||||||||||||||
|
| |||||||||||||||||||
| 8/31/15 | 8/31/14 | 8/31/13 | 8/31/12 | 8/31/11 | ||||||||||||||||
| ||||||||||||||||||||
| $ | 12.100 | $ | 11.120 | $ | 12.230 | $ | 11.180 | $ | 11.590 | |||||||||||
| 0.325 | 0.341 | 0.349 | 0.397 | 0.394 | ||||||||||||||||
| 0.029 | 0.980 | (1.110 | ) | 1.049 | (0.411 | ) | ||||||||||||||
|
|
|
|
|
|
|
|
|
| |||||||||||
| 0.354 | 1.321 | (0.761 | ) | 1.446 | (0.017 | ) | ||||||||||||||
|
|
|
|
|
|
|
|
|
| |||||||||||
| (0.324 | ) | (0.341 | ) | (0.349 | ) | (0.396 | ) | (0.393 | ) | |||||||||||
|
|
|
|
|
|
|
|
|
| |||||||||||
| (0.324 | ) | (0.341 | ) | (0.349 | ) | (0.396 | ) | (0.393 | ) | |||||||||||
|
|
|
|
|
|
|
|
|
| |||||||||||
| $ | 12.130 | $ | 12.100 | $ | 11.120 | $ | 12.230 | $ | 11.180 | |||||||||||
|
|
|
|
|
|
|
|
|
| |||||||||||
| 2.95% | 12.04% | (6.41% | ) | 13.13% | (0.01% | ) | ||||||||||||||
| $ | 15,853 | $ | 15,473 | $ | 18,248 | $ | 18,830 | $ | 14,863 | |||||||||||
| 1.58% | 1.57% | 1.57% | 1.57% | 1.57% | ||||||||||||||||
| 1.76% | 1.75% | 1.74% | 1.72% | 1.73% | ||||||||||||||||
| 2.67% | 2.94% | 2.87% | 3.35% | 3.61% | ||||||||||||||||
| 2.49% | 2.76% | 2.70% | 3.20% | 3.45% | ||||||||||||||||
| 24% | 13% | 38% | 32% | 44% | ||||||||||||||||
109
Table of Contents
Financial highlights
Delaware Tax-Free California Fund Institutional Class
Selected data for each share of the Fund outstanding throughout each period were as follows:
Year ended | 12/31/131 8/31/14 | |||||||||
Net asset value, beginning of period | $ | 12.080 | $ | 11.270 | ||||||
Income from investment operations: | ||||||||||
Net investment income2 | 0.446 | 0.319 | ||||||||
Net realized and unrealized gain | 0.029 | 0.808 | ||||||||
|
|
|
| |||||||
Total from investment operations | 0.475 | 1.127 | ||||||||
|
|
|
| |||||||
Less dividends and distributions from: | ||||||||||
Net investment income | (0.445 | ) | (0.317 | ) | ||||||
|
|
|
| |||||||
Total dividends and distributions | (0.445 | ) | (0.317 | ) | ||||||
|
|
|
| |||||||
Net asset value, end of period | $ | 12.110 | $ | 12.080 | ||||||
|
|
|
| |||||||
Total return3 | 3.98% | 10.10% | ||||||||
Ratios and supplemental data: | ||||||||||
Net assets, end of period (000 omitted) | $ | 10,308 | $ | 5,983 | ||||||
Ratio of expenses to average net assets | 0.58% | 0.57% | ||||||||
Ratio of expenses to average net assets prior to fees waived | 0.76% | 0.75% | ||||||||
Ratio of net investment income to average net assets | 3.67% | 3.89% | ||||||||
Ratio of net investment income to average net assets prior to fees waived | 3.49% | 3.71% | ||||||||
Portfolio turnover | 24% | 13% | 4 | |||||||
| 1 | Date of commencement of operations; ratios have been annualized and total return has not been annualized. |
| 2 | The average shares outstanding have been applied for per share information. |
| 3 | Total investment return is based on the change in net asset value of a share during the period and assumes reinvestment of dividends and distributions at net asset value. Total investment return during all of the periods shown reflects a waiver by the manager. Performance would have been lower had the waiver not been in effect. |
| 4 | Portfolio turnover is representative of the Fund for the entire annual period. |
See accompanying notes, which are an integral part of the financial statements.
110
Table of Contents
This page intentionally left blank.
Table of Contents
Financial highlights
Delaware Tax-Free Colorado Fund Class A
Selected data for each share of the Fund outstanding throughout each period were as follows:
Net asset value, beginning of period |
Income (loss) from investment operations: |
Net investment income1 |
Net realized and unrealized gain (loss) |
Total from investment operations |
Less dividends and distributions from: |
Net investment income |
Total dividends and distributions |
Net asset value, end of period |
Total return2 |
Ratios and supplemental data: |
Net assets, end of period (000 omitted) |
Ratio of expenses to average net assets |
Ratio of expenses to average net assets prior to fees waived |
Ratio of net investment income to average net assets |
Ratio of net investment income to average net assets prior to fees waived |
Portfolio turnover |
| 1 | The average shares outstanding have been applied for per share information. |
| 2 | Total investment return is based on the change in net asset value of a share during the period and assumes reinvestment of dividends and distributions at net asset value and does not reflect the impact of a sales charge. Total investment return during all of the periods shown reflects a waiver by the manager. Performance would have been lower had the waiver not been in effect. |
See accompanying notes, which are an integral part of the financial statements.
112
Table of Contents
| Year ended | ||||||||||||||||||||
|
| |||||||||||||||||||
8/31/15
| 8/31/14 | 8/31/13 | 8/31/12 | 8/31/11 | ||||||||||||||||
| ||||||||||||||||||||
| $ | 11.320 | $ | 10.490 | $ | 11.640 | $ | 10.880 | $ | 11.260 | |||||||||||
| 0.403 | 0.405 | 0.412 | 0.444 | 0.460 | ||||||||||||||||
| (0.081 | ) | 0.826 | (1.149 | ) | 0.758 | (0.397 | ) | |||||||||||||
|
|
|
|
|
|
|
|
|
| |||||||||||
| 0.322 | 1.231 | (0.737 | ) | 1.202 | 0.063 | |||||||||||||||
|
|
|
|
|
|
|
|
|
| |||||||||||
| (0.402 | ) | (0.401 | ) | (0.413 | ) | (0.442 | ) | (0.443 | ) | |||||||||||
|
|
|
|
|
|
|
|
|
| |||||||||||
| (0.402 | ) | (0.401 | ) | (0.413 | ) | (0.442 | ) | (0.443 | ) | |||||||||||
|
|
|
|
|
|
|
|
|
| |||||||||||
| $ | 11.240 | $ | 11.320 | $ | 10.490 | $ | 11.640 | $ | 10.880 | |||||||||||
|
|
|
|
|
|
|
|
|
| |||||||||||
| 2.87% | 11.94% | (6.56% | ) | 11.23% | 0.71% | |||||||||||||||
| $ | 174,078 | $ | 183,560 | $ | 190,311 | $ | 230,787 | $ | 216,151 | |||||||||||
| 0.85% | 0.84% | 0.84% | 0.84% | 0.88% | ||||||||||||||||
| 0.97% | 0.97% | 0.96% | 0.93% | 0.95% | ||||||||||||||||
| 3.54% | 3.69% | 3.60% | 3.91% | 4.30% | ||||||||||||||||
| 3.42% | 3.56% | 3.48% | 3.82% | 4.23% | ||||||||||||||||
| 10% | 22% | 21% | 24% | 26% | ||||||||||||||||
113
Table of Contents
Financial highlights
Delaware Tax-Free Colorado Fund Class C
Selected data for each share of the Fund outstanding throughout each period were as follows:
Net asset value, beginning of period |
Income (loss) from investment operations: |
Net investment income1 |
Net realized and unrealized gain (loss) |
Total from investment operations |
Less dividends and distributions from: |
Net investment income |
Total dividends and distributions |
Net asset value, end of period |
Total return2 |
Ratios and supplemental data: |
Net assets, end of period (000 omitted) |
Ratio of expenses to average net assets |
Ratio of expenses to average net assets prior to fees waived |
Ratio of net investment income to average net assets |
Ratio of net investment income to average net assets prior to fees waived |
Portfolio turnover |
| 1 | The average shares outstanding have been applied for per share information. |
| 2 | Total investment return is based on the change in net asset value of a share during the period and assumes reinvestment of dividends and distributions at net asset value and does not reflect the impact of a sales charge. Total investment return during all of the periods shown reflects a waiver by the manager. Performance would have been lower had the waiver not been in effect. |
See accompanying notes, which are an integral part of the financial statements.
114
Table of Contents
| Year ended | ||||||||||||||||||||
|
| |||||||||||||||||||
| 8/31/15 | 8/31/14 | 8/31/13 | 8/31/12 | 8/31/11 | ||||||||||||||||
| ||||||||||||||||||||
| $ | 11.350 | $ | 10.520 | $ | 11.670 | $ | 10.910 | $ | 11.290 | |||||||||||
| 0.319 | 0.324 | 0.327 | 0.360 | 0.381 | ||||||||||||||||
| (0.081 | ) | 0.826 | (1.149 | ) | 0.758 | (0.397 | ) | |||||||||||||
|
|
|
|
|
|
|
|
|
| |||||||||||
| 0.238 | 1.150 | (0.822 | ) | 1.118 | (0.016 | ) | ||||||||||||||
|
|
|
|
|
|
|
|
|
| |||||||||||
| (0.318 | ) | (0.320 | ) | (0.328 | ) | (0.358 | ) | (0.364 | ) | |||||||||||
|
|
|
|
|
|
|
|
|
| |||||||||||
| (0.318 | ) | (0.320 | ) | (0.328 | ) | (0.358 | ) | (0.364 | ) | |||||||||||
|
|
|
|
|
|
|
|
|
| |||||||||||
| $ | 11.270 | $ | 11.350 | $ | 10.520 | $ | 11.670 | $ | 10.910 | |||||||||||
|
|
|
|
|
|
|
|
|
| |||||||||||
| 2.10% | 11.09% | (7.23% | ) | 10.39% | (0.03% | ) | ||||||||||||||
| $ | 12,192 | $ | 12,029 | $ | 13,788 | $ | 14,282 | $ | 13,253 | |||||||||||
| 1.60% | 1.59% | 1.59% | 1.59% | 1.63% | ||||||||||||||||
| 1.72% | 1.72% | 1.71% | 1.68% | 1.70% | ||||||||||||||||
| 2.79% | 2.94% | 2.85% | 3.16% | 3.55% | ||||||||||||||||
| 2.67% | 2.81% | 2.73% | 3.07% | 3.48% | ||||||||||||||||
| 10% | 22% | 21% | 24% | 26% | ||||||||||||||||
115
Table of Contents
Financial highlights
Delaware Tax-Free Colorado Fund Institutional Class
Selected data for each share of the Fund outstanding throughout each period were as follows:
Year ended | 12/31/131 to 8/31/14 | |||||||||
| ||||||||||
Net asset value, beginning of period | $ | 11.320 | $ | 10.590 | ||||||
Income (loss) from investment operations: | ||||||||||
Net investment income2 | 0.431 | 0.326 | ||||||||
Net realized and unrealized gain (loss) | (0.081 | ) | 0.710 | |||||||
|
|
|
| |||||||
Total from investment operations | 0.350 | 1.036 | ||||||||
|
|
|
| |||||||
Less dividends and distributions from: | ||||||||||
Net investment income | (0.430 | ) | (0.306 | ) | ||||||
|
|
|
| |||||||
Total dividends and distributions | (0.430 | ) | (0.306 | ) | ||||||
|
|
|
| |||||||
Net asset value, end of period | $ | 11.240 | $ | 11.320 | ||||||
|
|
|
| |||||||
Total return3 | 3.13% | 9.89% | ||||||||
Ratios and supplemental data: | ||||||||||
Net assets, end of period (000 omitted) | $ | 5,102 | $ | 3,077 | ||||||
Ratio of expenses to average net assets | 0.60% | 0.59% | ||||||||
Ratio of expenses to average net assets prior to fees waived | 0.72% | 0.72% | ||||||||
Ratio of net investment income to average net assets | 3.79% | 3.91% | ||||||||
Ratio of net investment income to average net assets prior to fees waived | 3.67% | 3.78% | ||||||||
Portfolio turnover | 10% | 22% | 4 | |||||||
| 1 | Date of commencement of operations; ratios have been annualized and total return has not been annualized. |
| 2 | The average shares outstanding have been applied for per share information. |
| 3 | Total investment return is based on the change in net asset value of a share during the period and assumes reinvestment of dividends and distributions at net asset value. Total investment return during all of the periods shown reflects a waiver by the manager. Performance would have been lower had the waiver not been in effect. |
| 4 | Portfolio turnover is representative of the Fund for the entire annual period. |
See accompanying notes, which are an integral part of the financial statements.
116
Table of Contents
This page intentionally left blank.
Table of Contents
Financial highlights
Delaware Tax-Free Idaho Fund Class A
Selected data for each share of the Fund outstanding throughout each period were as follows:
Net asset value, beginning of period |
Income (loss) from investment operations: |
Net investment income1 |
Net realized and unrealized gain (loss) |
Total from investment operations |
Less dividends and distributions from: |
Net investment income |
Net realized gain |
Total dividends and distributions |
Net asset value, end of period |
Total return2 |
Ratios and supplemental data: |
Net assets, end of period (000 omitted) |
Ratio of expenses to average net assets |
Ratio of expenses to average net assets prior to fees waived |
Ratio of net investment income to average net assets |
Ratio of net investment income to average net assets prior to fees waived |
Portfolio turnover |
| 1 | The average shares outstanding have been applied for per share information. |
| 2 | Total investment return is based on the change in net asset value of a share during the period and assumes reinvestment of dividends and distributions at net asset value and does not reflect the impact of a sales charge. Total investment return during all of the periods shown reflects a waiver by the manager. Performance would have been lower had the waiver not been in effect. |
See accompanying notes, which are an integral part of the financial statements.
118
Table of Contents
| Year ended | ||||||||||||||||||||
|
| |||||||||||||||||||
| 8/31/15 | 8/31/14 | 8/31/13 | 8/31/12 | 8/31/11 | ||||||||||||||||
| ||||||||||||||||||||
| $ | 11.560 | $ | 10.990 | $ | 12.240 | $ | 11.730 | $ | 12.120 | |||||||||||
| 0.366 | 0.374 | 0.419 | 0.438 | 0.438 | ||||||||||||||||
| (0.051 | ) | 0.569 | (1.250 | ) | 0.509 | (0.385 | ) | |||||||||||||
|
|
|
|
|
|
|
|
|
| |||||||||||
| 0.315 | 0.943 | (0.831 | ) | 0.947 | 0.053 | |||||||||||||||
|
|
|
|
|
|
|
|
|
| |||||||||||
| (0.365 | ) | (0.373 | ) | (0.419 | ) | (0.437 | ) | (0.436 | ) | |||||||||||
| — | — | — | — | (0.007 | ) | |||||||||||||||
|
|
|
|
|
|
|
|
|
| |||||||||||
| (0.365 | ) | (0.373 | ) | (0.419 | ) | (0.437 | ) | (0.443 | ) | |||||||||||
|
|
|
|
|
|
|
|
|
| |||||||||||
| $ | 11.510 | $ | 11.560 | $ | 10.990 | $ | 12.240 | $ | 11.730 | |||||||||||
|
|
|
|
|
|
|
|
|
| |||||||||||
| 2.76% | 8.71% | (6.99% | ) | 8.21% | 0.56% | |||||||||||||||
| $ | 75,163 | $ | 80,600 | $ | 87,537 | $ | 119,025 | $ | 98,821 | |||||||||||
| 0.88% | 0.88% | 0.88% | 0.88% | 0.90% | ||||||||||||||||
| 1.00% | 0.99% | 0.97% | 0.94% | 0.96% | ||||||||||||||||
| 3.17% | 3.32% | 3.51% | 3.65% | 3.78% | ||||||||||||||||
| 3.05% | 3.21% | 3.42% | 3.59% | 3.72% | ||||||||||||||||
| 7% | 16% | 17% | 17% | 32% | ||||||||||||||||
119
Table of Contents
Financial highlights
Delaware Tax-Free Idaho Fund Class C
Selected data for each share of the Fund outstanding throughout each period were as follows:
Net asset value, beginning of period |
Income (loss) from investment operations: |
Net investment income1 |
Net realized and unrealized gain (loss) |
Total from investment operations |
Less dividends and distributions from: |
Net investment income |
Net realized gain |
Total dividends and distributions |
Net asset value, end of period |
Total return2 |
Ratios and supplemental data: |
Net assets, end of period (000 omitted) |
Ratio of expenses to average net assets |
Ratio of expenses to average net assets prior to fees waived |
Ratio of net investment income to average net assets |
Ratio of net investment income to average net assets prior to fees waived |
Portfolio turnover |
| 1 | The average shares outstanding have been applied for per share information. |
| 2 | Total investment return is based on the change in net asset value of a share during the period and assumes reinvestment of dividends and distributions at net asset value and does not reflect the impact of a sales charge. Total investment return during all of the periods shown reflects a waiver by the manager. Performance would have been lower had the waiver not been in effect. |
See accompanying notes, which are an integral part of the financial statements.
120
Table of Contents
| Year ended | ||||||||||||||||||||
|
| |||||||||||||||||||
| 8/31/15 | 8/31/14 | 8/31/13 | 8/31/12 | 8/31/11 | ||||||||||||||||
| ||||||||||||||||||||
| $ | 11.550 | $ | 10.980 | $ | 12.230 | $ | 11.720 | $ | 12.110 | |||||||||||
| 0.279 | 0.289 | 0.329 | 0.348 | 0.351 | ||||||||||||||||
| (0.051 | ) | 0.569 | (1.250 | ) | 0.509 | (0.385 | ) | |||||||||||||
|
|
|
|
|
|
|
|
|
| |||||||||||
| 0.228 | 0.858 | (0.921 | ) | 0.857 | (0.034 | ) | ||||||||||||||
|
|
|
|
|
|
|
|
|
| |||||||||||
| (0.278 | ) | (0.288 | ) | (0.329 | ) | (0.347 | ) | (0.349 | ) | |||||||||||
| — | — | — | — | (0.007 | ) | |||||||||||||||
|
|
|
|
|
|
|
|
|
| |||||||||||
| (0.278 | ) | (0.288 | ) | (0.329 | ) | (0.347 | ) | (0.356 | ) | |||||||||||
|
|
|
|
|
|
|
|
|
| |||||||||||
| $ | 11.500 | $ | 11.550 | $ | 10.980 | $ | 12.230 | $ | 11.720 | |||||||||||
|
|
|
|
|
|
|
|
|
| |||||||||||
| 1.99% | 7.91% | (7.70% | ) | 7.41% | (0.20% | ) | ||||||||||||||
| $ | 28,557 | $ | 31,178 | $ | 33,236 | $ | 40,738 | $ | 35,797 | |||||||||||
| 1.63% | 1.63% | 1.63% | 1.63% | 1.65% | ||||||||||||||||
| 1.75% | 1.74% | 1.72% | 1.69% | 1.71% | ||||||||||||||||
| 2.42% | 2.57% | 2.76% | 2.90% | 3.03% | ||||||||||||||||
| 2.30% | 2.46% | 2.67% | 2.84% | 2.97% | ||||||||||||||||
| 7% | 16% | 17% | 17% | 32% | ||||||||||||||||
121
Table of Contents
Financial highlights
Delaware Tax-Free Idaho Fund Institutional Class
Selected data for each share of the Fund outstanding throughout each period were as follows:
| Year ended 8/31/15 | 12/31/131 to 8/31/14 | |||||||||
| ||||||||||
Net asset value, beginning of period | $ | 11.570 | $ | 11.060 | ||||||
Income (loss) from investment operations: | ||||||||||
Net investment income2 | 0.395 | 0.291 | ||||||||
Net realized and unrealized gain (loss) | (0.061 | ) | 0.509 | |||||||
|
|
|
| |||||||
Total from investment operations | 0.334 | 0.800 | ||||||||
|
|
|
| |||||||
Less dividends and distributions from: | ||||||||||
Net investment income | (0.394 | ) | (0.290 | ) | ||||||
|
|
|
| |||||||
Total dividends and distributions | (0.394 | ) | (0.290 | ) | ||||||
|
|
|
| |||||||
Net asset value, end of period | $ | 11.510 | $ | 11.570 | ||||||
|
|
|
| |||||||
Total return3 | 2.92% | 7.31% | ||||||||
Ratios and supplemental data: | ||||||||||
Net assets, end of period (000 omitted) | $ | 2,588 | $ | 1,080 | ||||||
Ratio of expenses to average net assets | 0.63% | 0.63% | ||||||||
Ratio of expenses to average net assets prior to fees waived | 0.75% | 0.74% | ||||||||
Ratio of net investment income to average net assets | 3.42% | 3.46% | ||||||||
Ratio of net investment income to average net assets prior to fees waived | 3.30% | 3.35% | ||||||||
Portfolio turnover | 7% | 16% | 4 | |||||||
| 1 | Date of commencement of operations; ratios have been annualized and total return has not been annualized. |
| 2 | The average shares outstanding have been applied for per share information. |
| 3 | Total investment return is based on the change in net asset value of a share during the period and assumes reinvestment of dividends and distributions at net asset value. Total investment return during all of the periods shown reflects a waiver by the manager. Performance would have been lower had the waiver not been in effect. |
| 4 | Portfolio turnover is representative of the Fund for the entire annual period. |
| See | accompanying notes, which are an integral part of the financial statements. |
122
Table of Contents
This page intentionally left blank.
Table of Contents
Financial highlights
Delaware Tax-Free New York Fund Class A
Selected data for each share of the Fund outstanding throughout each period were as follows:
Net asset value, beginning of period |
Income (loss) from investment operations: |
Net investment income1 |
Net realized and unrealized gain (loss) |
Total from investment operations |
Less dividends and distributions from: |
Net investment income |
Net realized gain |
Total dividends and distributions |
Net asset value, end of period |
Total return2 |
Ratios and supplemental data: |
Net assets, end of period (000 omitted) |
Ratio of expenses to average net assets |
Ratio of expenses to average net assets prior to fees waived |
Ratio of net investment income to average net assets |
Ratio of net investment income to average net assets prior to fees waived |
Portfolio turnover |
| 1 | The average shares outstanding have been applied for per share information. |
| 2 | Total investment return is based on the change in net asset value of a share during the period and assumes reinvestment of dividends and distributions at net asset value and does not reflect the impact of a sales charge. Total investment return during all of the periods shown reflects a waiver by the manager. Performance would have been lower had the waiver not been in effect. |
See accompanying notes, which are an integral part of the financial statements.
124
Table of Contents
| Year ended | ||||||||||||||||||||
|
| |||||||||||||||||||
| 8/31/15 | 8/31/14 | 8/31/13 | 8/31/12 | 8/31/11 | ||||||||||||||||
| ||||||||||||||||||||
| $ | 11.460 | $ | 10.570 | $ | 11.670 | $ | 10.800 | $ | 11.150 | |||||||||||
| 0.367 | 0.366 | 0.374 | 0.426 | 0.406 | ||||||||||||||||
| 0.020 | 0.889 | (1.080 | ) | 0.867 | (0.351 | ) | ||||||||||||||
|
|
|
|
|
|
|
|
|
| |||||||||||
| 0.387 | 1.255 | (0.706 | ) | 1.293 | 0.055 | |||||||||||||||
|
|
|
|
|
|
|
|
|
| |||||||||||
| (0.367 | ) | (0.365 | ) | (0.375 | ) | (0.423 | ) | (0.405 | ) | |||||||||||
| — | — | (0.019 | ) | — | — | |||||||||||||||
|
|
|
|
|
|
|
|
|
| |||||||||||
| (0.367 | ) | (0.365 | ) | (0.394 | ) | (0.423 | ) | (0.405 | ) | |||||||||||
|
|
|
|
|
|
|
|
|
| |||||||||||
| $ | 11.480 | $ | 11.460 | $ | 10.570 | $ | 11.670 | $ | 10.800 | |||||||||||
|
|
|
|
|
|
|
|
|
| |||||||||||
| 3.41% | 12.06% | (6.27% | ) | 12.18% | 0.63% | |||||||||||||||
| $ | 51,708 | $ | 52,589 | $ | 57,816 | $ | 53,456 | $ | 37,051 | |||||||||||
| 0.83% | 0.80% | 0.80% | 0.80% | 0.80% | ||||||||||||||||
| 1.07% | 1.06% | 1.03% | 1.01% | 1.05% | ||||||||||||||||
| 3.18% | 3.32% | 3.23% | 3.77% | 3.82% | ||||||||||||||||
| 2.94% | 3.06% | 3.00% | 3.56% | 3.57% | ||||||||||||||||
| 6% | 20% | 33% | 28% | 54% | ||||||||||||||||
125
Table of Contents
Financial highlights
Delaware Tax-Free New York Fund Class C
Selected data for each share of the Fund outstanding throughout each period were as follows:
|
Net asset value, beginning of period |
Income (loss) from investment operations: |
Net investment income1 |
Net realized and unrealized gain (loss) |
Total from investment operations |
Less dividends and distributions from: |
Net investment income |
Net realized gain |
Total dividends and distributions |
Net asset value, end of period |
Total return2 |
Ratios and supplemental data: |
Net assets, end of period (000 omitted) |
Ratio of expenses to average net assets |
Ratio of expenses to average net assets prior to fees waived |
Ratio of net investment income to average net assets |
Ratio of net investment income to average net assets prior to fees waived |
Portfolio turnover
|
|
| 1 | The average shares outstanding have been applied for per share information. |
| 2 | Total investment return is based on the change in net asset value of a share during the period and assumes reinvestment of dividends and distributions at net asset value and does not reflect the impact of a sales charge. Total investment return during all of the periods shown reflects a waiver by the manager. Performance would have been lower had the waiver not been in effect. |
See accompanying notes, which are an integral part of the financial statements.
126
Table of Contents
| Year ended | ||||||||||||||||||||
|
| |||||||||||||||||||
| 8/31/15 | 8/31/14 | 8/31/13 | 8/31/12 | 8/31/11 | ||||||||||||||||
| ||||||||||||||||||||
| $ | 11.440 | $ | 10.540 | $ | 11.640 | $ | 10.780 | $ | 11.120 | |||||||||||
| ||||||||||||||||||||
| 0.280 | 0.283 | 0.286 | 0.340 | 0.326 | ||||||||||||||||
| 0.010 | 0.899 | (1.080 | ) | 0.857 | (0.341 | ) | ||||||||||||||
|
|
|
|
|
|
|
|
|
| |||||||||||
| 0.290 | 1.182 | (0.794 | ) | 1.197 | (0.015 | ) | ||||||||||||||
|
|
|
|
|
|
|
|
|
| |||||||||||
| ||||||||||||||||||||
| (0.280 | ) | (0.282 | ) | (0.287 | ) | (0.337 | ) | (0.325 | ) | |||||||||||
| — | — | (0.019 | ) | — | — | |||||||||||||||
|
|
|
|
|
|
|
|
|
| |||||||||||
| (0.280 | ) | (0.282 | ) | (0.306 | ) | (0.337 | ) | (0.325 | ) | |||||||||||
|
|
|
|
|
|
|
|
|
| |||||||||||
| $ | 11.450 | $ | 11.440 | $ | 10.540 | $ | 11.640 | $ | 10.780 | |||||||||||
|
|
|
|
|
|
|
|
|
| |||||||||||
| 2.55% | 11.35% | (7.00% | ) | 11.26% | (0.04% | ) | ||||||||||||||
| ||||||||||||||||||||
| $ | 17,825 | $ | 18,491 | $ | 21,152 | $ | 20,524 | $ | 14,235 | |||||||||||
| 1.58% | 1.55% | 1.55% | 1.55% | 1.55% | ||||||||||||||||
| 1.82% | 1.81% | 1.78% | 1.76% | 1.80% | ||||||||||||||||
| 2.43% | 2.57% | 2.48% | 3.02% | 3.07% | ||||||||||||||||
| 2.19% | 2.31% | 2.25% | 2.81% | 2.82% | ||||||||||||||||
|
| 6%
|
|
| 20%
|
|
| 33%
|
|
| 28%
|
|
| 54%
|
| ||||||
| ||||||||||||||||||||
127
Table of Contents
Financial highlights
Delaware Tax-Free New York Fund Institutional Class
Selected data for each share of the Fund outstanding throughout each period were as follows:
| Year ended 8/31/15 | 12/31/131 8/31/14 | |||||||
| ||||||||
Net asset value, beginning of period | $11.460 | $10.710 | ||||||
Income from investment operations: | ||||||||
Net investment income2 | 0.396 | 0.279 | ||||||
Net realized and unrealized gain | 0.010 | 0.749 | ||||||
Total from investment operations | 0.406 | 1.028 | ||||||
Less dividends and distributions from: | ||||||||
Net investment income | (0.396 | ) | (0.278 | ) | ||||
Total dividends and distributions | (0.396 | ) | (0.278 | ) | ||||
Net asset value, end of period | $11.470 | $11.460 | ||||||
Total return3 | 3.58% | 9.69% | ||||||
Ratios and supplemental data: | ||||||||
Net assets, end of period (000 omitted) | $12,667 | $1,769 | ||||||
Ratio of expenses to average net assets | 0.58% | 0.55% | ||||||
Ratio of expenses to average net assets prior to fees waived | 0.82% | 0.80% | ||||||
Ratio of net investment income to average net assets | 3.43% | 3.55% | ||||||
Ratio of net investment income to average net assets prior to fees waived | 3.19% | 3.30% | ||||||
Portfolio turnover
|
| 6%
|
|
| 20%
| 4
| ||
| ||||||||
| 1 | Date of commencement of operations; ratios have been annualized and total return has not been annualized. |
| 2 | The average shares outstanding have been applied for per share information. |
| 3 | Total investment return is based on the change in net asset value of a share during the period and assumes reinvestment of dividends and distributions at net asset value. Total investment return during all of the periods shown reflects a waiver by the manager. Performance would have been lower had the waiver not been in effect. |
| 4 | Portfolio turnover is representative of the Fund for the entire annual period. |
See accompanying notes, which are an integral part of the financial statements.
128
Table of Contents
This page intentionally left blank.
Table of Contents
Financial highlights
Delaware Tax-Free Pennsylvania Fund Class A
Selected data for each share of the Fund outstanding throughout each period were as follows:
|
Net asset value, beginning of period |
Income (loss) from investment operations: |
Net investment income2 |
Net realized and unrealized gain (loss) |
Total from investment operations |
Less dividends and distributions from: |
Net investment income |
Net realized gain |
Total dividends and distributions |
Net asset value, end of period |
Total return3 |
Ratios and supplemental data: |
Net assets, end of period (000 omitted) |
Ratio of expenses to average net assets |
Ratio of expenses to average net assets prior to fees waived |
Ratio of net investment income to average net assets |
Ratio of net investment income to average net assets prior to fees waived |
Portfolio turnover
|
|
| 1 | During the period ended Aug. 31, 2013, the Fund changed its fiscal year end from February to August. Ratios have been annualized and portfolio turnover and total return have not been annualized. |
| 2 | The average shares outstanding have been applied for per share information. |
| 3 | Total investment return is based on the change in net asset value of a share during the period and assumes reinvestment of dividends and distributions at net asset value and does not reflect the impact of a sales charge. Total investment return during all of the periods shown reflects waivers by the manager and/or distributor. Performance would have been lower had the waivers not been in effect. |
See accompanying notes, which are an integral part of the financial statements.
130
Table of Contents
| 3/1/13 | ||||||||||||||||||||||||
| Year ended | to | Year ended | ||||||||||||||||||||||
|
|
|
| |||||||||||||||||||||
| 8/31/15 | 8/31/14 | 8/31/131 | 2/28/13 | 2/29/12 | 2/28/11 | |||||||||||||||||||
| ||||||||||||||||||||||||
| $ | 8.160 | $ | 7.590 | $ | 8.410 | $ | 8.260 | $ | 7.550 | $ | 7.920 | |||||||||||||
| 0.288 | 0.293 | 0.148 | 0.315 | 0.329 | 0.349 | |||||||||||||||||||
| (0.010 | ) | 0.570 | (0.809 | ) | 0.150 | 0.710 | (0.304 | ) | ||||||||||||||||
|
|
|
|
|
|
|
|
|
|
|
| |||||||||||||
| 0.278 | 0.863 | (0.661 | ) | 0.465 | 1.039 | 0.045 | ||||||||||||||||||
|
|
|
|
|
|
|
|
|
|
|
| |||||||||||||
| (0.288 | ) | (0.293 | ) | (0.148 | ) | (0.315 | ) | (0.329 | ) | (0.349 | ) | |||||||||||||
| — | — | (0.011 | ) | — | — | (0.066 | ) | |||||||||||||||||
|
|
|
|
|
|
|
|
|
|
|
| |||||||||||||
| (0.288 | ) | (0.293 | ) | (0.159 | ) | (0.315 | ) | (0.329 | ) | (0.415 | ) | |||||||||||||
|
|
|
|
|
|
|
|
|
|
|
| |||||||||||||
| $ | 8.150 | $ | 8.160 | $ | 7.590 | $ | 8.410 | $ | 8.260 | $ | 7.550 | |||||||||||||
|
|
|
|
|
|
|
|
|
|
|
| |||||||||||||
| 3.45% | 11.58% | (7.94% | ) | 5.73% | 14.06% | 0.48% | ||||||||||||||||||
| $ | 441,904 | $ | 451,301 | $ | 453,451 | $ | 524,539 | $ | 508,505 | $ | 470,369 | |||||||||||||
| 0.89% | 0.88% | 0.88% | 0.88% | 0.88% | 0.90% | |||||||||||||||||||
| 0.95% | 0.95% | 1.00% | 0.98% | 0.98% | 0.98% | |||||||||||||||||||
| 3.51% | 3.73% | 3.64% | 3.77% | 4.19% | 4.42% | |||||||||||||||||||
| 3.45% | 3.66% | 3.52% | 3.67% | 4.09% | 4.34% | |||||||||||||||||||
|
| 13%
|
|
| 7%
|
|
| 5%
|
|
| 20%
|
|
| 21%
|
|
| 31%
|
| |||||||
| ||||||||||||||||||||||||
131
Table of Contents
Financial highlights
Delaware Tax-Free Pennsylvania Fund Class C
Selected data for each share of the Fund outstanding throughout each period were as follows:
|
Net asset value, beginning of period |
Income (loss) from investment operations: |
Net investment income2 |
Net realized and unrealized gain (loss) |
Total from investment operations |
Less dividends and distributions from: |
Net investment income |
Net realized gain |
Total dividends and distributions |
Net asset value, end of period |
Total return3 |
Ratios and supplemental data: |
Net assets, end of period (000 omitted) |
Ratio of expenses to average net assets |
Ratio of expenses to average net assets prior to fees waived |
Ratio of net investment income to average net assets |
Ratio of net investment income to average net assets prior to fees waived |
Portfolio turnover
|
|
| 1 | During the period ended Aug. 31, 2013, the Fund changed its fiscal year end from February to August. Ratios have been annualized and portfolio turnover and total return have not been annualized. |
| 2 | The average shares outstanding have been applied for per share information. |
| 3 | Total investment return is based on the change in net asset value of a share during the period and assumes reinvestment of dividends and distributions at net asset value and does not reflect the impact of a sales charge. Total investment return during all of the periods shown reflects a waiver by the manager. Performance would have been lower had the waiver not been in effect. |
See accompanying notes, which are an integral part of the financial statements.
132
Table of Contents
| 3/1/13 | ||||||||||||||||||||||||
| Year ended | to | Year ended | ||||||||||||||||||||||
|
|
|
| |||||||||||||||||||||
| 8/31/15 | 8/31/14 | 8/31/131 | 2/28/13 | 2/29/12 | 2/28/11 | |||||||||||||||||||
| ||||||||||||||||||||||||
| $ | 8.160 | $ | 7.590 | $ | 8.410 | $ | 8.260 | $ | 7.560 | $ | 7.920 | |||||||||||||
| 0.226 | 0.234 | 0.117 | 0.252 | 0.269 | 0.289 | |||||||||||||||||||
| (0.010 | ) | 0.570 | (0.809 | ) | 0.150 | 0.700 | (0.294 | ) | ||||||||||||||||
|
|
|
|
|
|
|
|
|
|
|
| |||||||||||||
| 0.216 | 0.804 | (0.692 | ) | 0.402 | 0.969 | (0.005 | ) | |||||||||||||||||
|
|
|
|
|
|
|
|
|
|
|
| |||||||||||||
| (0.226 | ) | (0.234 | ) | (0.117 | ) | (0.252 | ) | (0.269 | ) | (0.289 | ) | |||||||||||||
| — | — | (0.011 | ) | — | — | (0.066 | ) | |||||||||||||||||
|
|
|
|
|
|
|
|
|
|
|
| |||||||||||||
| (0.226 | ) | (0.234 | ) | (0.128 | ) | (0.252 | ) | (0.269 | ) | (0.355 | ) | |||||||||||||
|
|
|
|
|
|
|
|
|
|
|
| |||||||||||||
| $ | 8.150 | $ | 8.160 | $ | 7.590 | $ | 8.410 | $ | 8.260 | $ | 7.560 | |||||||||||||
|
|
|
|
|
|
|
|
|
|
|
| |||||||||||||
| 2.67% | 10.74% | (8.29% | ) | 4.93% | 13.05% | (0.15% | ) | |||||||||||||||||
| $ | 32,799 | $ | 32,096 | $ | 32,617 | $ | 39,572 | $ | 27,311 | $ | 21,571 | |||||||||||||
| 1.65% | 1.64% | 1.64% | 1.64% | 1.64% | 1.66% | |||||||||||||||||||
| 1.71% | 1.71% | 1.71% | 1.69% | 1.69% | 1.69% | |||||||||||||||||||
| 2.75% | 2.97% | 2.87% | 3.01% | 3.43% | 3.66% | |||||||||||||||||||
| 2.69% | 2.90% | 2.80% | 2.96% | 3.38% | 3.63% | |||||||||||||||||||
|
| 13%
|
|
| 7%
|
|
| 5%
|
|
| 20%
|
|
| 21%
|
|
| 31%
|
| |||||||
| ||||||||||||||||||||||||
133
Table of Contents
Financial highlights
Delaware Tax-Free Pennsylvania Fund Institutional Class
Selected data for each share of the Fund outstanding throughout each period were as follows:
| Year ended 8/31/15 | 12/31/131 8/31/14 | |||||||
| ||||||||
Net asset value, beginning of period | $ 8.160 | $ 7.670 | ||||||
Income (loss) from investment operations: | ||||||||
Net investment income2 | 0.308 | 0.226 | ||||||
Net realized and unrealized gain (loss) | (0.020 | ) | 0.490 | |||||
Total from investment operations | 0.288 | 0.716 | ||||||
Less dividends and distributions from: | ||||||||
Net investment income | (0.308 | ) | (0.226 | ) | ||||
Total dividends and distributions | (0.308 | ) | (0.226 | ) | ||||
Net asset value, end of period | $ 8.140 | $ 8.160 | ||||||
Total return3 | 3.57% | 9.44% | ||||||
Ratios and supplemental data: | ||||||||
Net assets, end of period (000 omitted) | $16,740 | $ 3,733 | ||||||
Ratio of expenses to average net assets | 0.65% | 0.64% | ||||||
Ratio of expenses to average net assets prior to fees waived | 0.71% | 0.71% | ||||||
Ratio of net investment income to average net assets | 3.75% | 3.89% | ||||||
Ratio of net investment income to average net assets prior to fees waived | 3.69% | 3.82% | ||||||
Portfolio turnover
|
| 13%
|
|
| 7%
| 4
| ||
| ||||||||
| 1 | Date of commencement of operations; ratios have been annualized and total return has not been annualized. |
| 2 | The average shares outstanding have been applied for per share information. |
| 3 | Total investment return is based on the change in net asset value of a share during the period and assumes reinvestment of dividends and distributions at net asset value. Total investment return during all of the periods shown reflects a waiver by the manager. Performance would have been lower had the waiver not been in effect. |
| 4 | Portfolio turnover is representative of the Fund for the entire annual period. |
See accompanying notes, which are an integral part of the financial statements.
134
Table of Contents
| Notes to financial statements | ||
| Delaware Investments® state tax-free funds | August 31, 2015 |
Voyageur Insured Funds is organized as a Delaware statutory trust and offers one series: Delaware Tax-Free Arizona Fund. Voyageur Mutual Funds is organized as a Delaware statutory trust and offers five series: Delaware Minnesota High-Yield Municipal Bond Fund, Delaware National High-Yield Municipal Bond Fund, Delaware Tax-Free California Fund, Delaware Tax-Free Idaho Fund, and Delaware Tax-Free New York Fund. Voyageur Mutual Funds II is organized as a Delaware statutory trust and offers one series: Delaware Tax-Free Colorado Fund. Delaware Group® State Tax-Free Income Trust is organized as a Delaware statutory trust and offers one series: Delaware Tax-Free Pennsylvania Fund. Voyageur Insured Funds, Voyageur Mutual Funds, Voyageur Mutual Funds II, and Delaware Group State Tax-Free Income Trust are each individually referred to as a Trust and collectively as the Trusts. These financial statements and the related notes pertain to Delaware Tax-Free Arizona Fund, Delaware Tax-Free California Fund, Delaware Tax-Free Colorado Fund, Delaware Tax-Free Idaho Fund, Delaware Tax-Free New York Fund, and Delaware Tax-Free Pennsylvania Fund (each referred to as a Fund, or collectively, as the Funds). The above Trusts are open-end investment companies. The Funds are considered diversified under the Investment Company Act of 1940, as amended, and offer Class A, Class C, and Institutional Class shares. Class A shares are sold with a maximum front-end sales charge of 4.50%. Class A share purchases of $1,000,000 or more will incur a contingent deferred sales charge (CDSC) of 1.00% if redeemed during the first year and 0.50% during the second year, provided that Delaware Distributors, L.P. (DDLP) paid a financial advisor a commission on the purchase of those shares. Effective Sept. 25, 2014, all remaining shares of Class B were converted to Class A shares. Between June 1, 2007 and Sept. 25, 2014, Class B shares could be purchased only through dividend reinvestment and certain permitted exchanges. Class B shares automatically converted to Class A shares on a quarterly basis approximately eight years after purchase. Class C shares are sold with a CDSC of 1.00%, if redeemed during the first 12 months. Institutional Class shares are not subject to a sales charge and are offered for sale exclusively to certain eligible investors.
The investment objective of each Fund is to seek as high a level of current income exempt from federal income tax and from personal income taxes in the respective applicable state, as is consistent with preservation of capital.
1. Significant Accounting Policies
The following accounting policies are in accordance with U.S. generally accepted accounting principles (U.S. GAAP) and are consistently followed by the Funds.
Security Valuation – Debt securities are valued based upon valuations provided by an independent pricing service or broker and reviewed by management. To the extent current market prices are not available, the pricing service may take into account developments related to the specific security, as well as transactions in comparable securities. Valuations for fixed income securities utilize matrix systems, which reflect such factors as security prices, yields, maturities, and ratings, and are supplemented by dealer and exchange quotations. Open-end investment companies are valued at their published net asset values. Generally, other securities and assets for which market quotations are not readily available are valued at fair value as determined in good faith under the direction of each Fund’s Board of Trustees (each, a Board or, collectively, the Boards). In determining whether market quotations are readily available or fair valuation will be used, various factors will be taken into consideration, such as market closures or suspension of trading in a security.
135
Table of Contents
Notes to financial statements
Delaware Investments® state tax-free funds
1. Significant Accounting Policies (continued)
Federal Income Taxes – No provision for federal income taxes has been made as each Fund intends to continue to qualify for federal income tax purposes as a regulated investment company under Subchapter M of the Internal Revenue Code of 1986, as amended, and make the requisite distributions to shareholders. Each Fund evaluates tax positions taken or expected to be taken in the course of preparing each Fund’s tax returns to determine whether the tax positions are “more-likely-than-not” of being sustained by the applicable tax authority. Tax positions not deemed to meet the “more-likely-than-not” threshold are recorded as a tax benefit or expense in the current year. Management has analyzed each Fund’s tax positions taken for all open federal income tax years (Aug. 31, 2012–Aug. 31, 2015), and has concluded that no provision for federal income tax is required in each Fund’s financial statements.
Class Accounting – Investment income and common expenses are allocated to the various classes of each Fund on the basis of “settled shares” of each class in relation to the net assets of each Fund. Realized and unrealized gain (loss) on investments are allocated to the various classes of each Fund on the basis of daily net assets of each class. Distribution expenses relating to a specific class are charged directly to that class.
Use of Estimates – Each Fund is an investment company, whose financial statements are prepared in conformity with U.S. GAAP. Therefore, each Fund follows the accounting and reporting guidelines for investment companies. The preparation of financial statements in conformity with U.S. GAAP requires management to make estimates and assumptions that affect the fair value of investments, the reported amounts of assets and liabilities and disclosure of contingent assets and liabilities at the date of the financial statements, and the reported amounts of revenues and expenses during the reporting period. Actual results could differ from those estimates and the differences could be material.
Other – Expenses directly attributable to each Fund are charged directly to the Fund. Other expenses common to various funds within the Delaware Investments Family of Funds are generally allocated among such funds on the basis of average net assets. Management fees and some other expenses are paid monthly. Security transactions are recorded on the date the securities are purchased or sold (trade date) for financial reporting purposes. Costs used in calculating realized gains and losses on the sale of investment securities are those of the specific securities sold. Interest income is recorded on the accrual basis. Discounts and premiums on debt securities are amortized to interest income, respectively, over the lives of the respective securities using the effective interest method. Each Fund declares dividends daily from net investment income and pays the dividends monthly and declares and pays distributions from net realized gain on investments, if any, annually. Each Fund may distribute more frequently, if necessary for tax purposes. Dividends and distributions, if any, are recorded on the ex-dividend date.
Each Fund may receive earnings credits from its custodian when positive cash balances are maintained, which may be used to offset custody fees. There were no earnings credits for the year ended Aug. 31, 2015.
Each Fund receives earnings credits from its transfer agent when positive cash balances are maintained, which may be used to offset transfer agent fees. If the amount earned is greater than one dollar, the expense paid under this arrangement is included on the “Statements of operations” under “Dividend disbursing and transfer agent fees and expenses” with the corresponding expense offset shown under
136
Table of Contents
“Less expense paid indirectly.” For the year ended Aug. 31, 2015, each Fund earned the following amounts under this agreement:
| Delaware Tax-Free Arizona Fund | Delaware Tax-Free California Fund | Delaware Tax-Free Colorado Fund | Delaware Tax-Free Idaho Fund | Delaware Tax-Free New York Fund | Delaware Tax-Free Pennsylvania Fund | |||||||||||||||||||||||
| $14 | $11 | $41 | $29 | $10 | $115 | |||||||||||||||||||||||
2. Investment Management, Administration Agreements, and Other Transactions with Affiliates
In accordance with the terms of its respective investment management agreement, each Fund pays Delaware Management Company (DMC), a series of Delaware Management Business Trust and the investment manager, an annual fee, which is calculated based on each Fund’s average daily net assets as follows:
| Delaware Tax-Free Arizona Fund | Delaware Tax-Free California Fund | Delaware Tax-Free Colorado Fund | Delaware Tax-Free Idaho Fund | Delaware Tax-Free New York Fund | Delaware Tax-Free Pennsylvania Fund | |||||||||||
On the first $500 million | 0.500% | 0.550% | 0.550% | 0.550% | 0.550% | 0.550% | ||||||||||
On the next $500 million | 0.475% | 0.500% | 0.500% | 0.500% | 0.500% | 0.500% | ||||||||||
On the next $1.5 billion | 0.450% | 0.450% | 0.450% | 0.450% | 0.450% | 0.450% | ||||||||||
In excess of $2.5 billion | 0.425% | 0.425% | 0.425% | 0.425% | 0.425% | 0.425% | ||||||||||
DMC has contractually agreed to waive that portion, if any, of its management fee and/or pay/reimburse each Fund to the extent necessary to ensure that total annual operating expenses, (excluding any 12b-1 fees, taxes, interest, short sale and dividend interest expenses, brokerage fees, certain insurance costs, and nonroutine expenses or costs, including, but not limited to, those relating to reorganizations, litigation, conducting shareholder meetings, and liquidations (collectively, nonroutine expenses)), do not exceed specified percentages of each Fund’s average daily net assets from Sept. 1, 2014 through Aug. 31, 2015* as shown below. For purposes of these waivers and reimbursements, nonroutine expenses may also include such additional costs and expenses as may be agreed upon from time to time by the Boards and DMC. These expense waivers and reimbursements apply only to expenses paid directly by each Fund and may only be terminated by agreement of DMC and each Fund.
| Delaware Tax-Free Arizona Fund | Delaware Tax-Free California Fund | Delaware Tax-Free Colorado Fund | Delaware Tax-Free Idaho Fund | Delaware Tax-Free New York Fund | Delaware Tax-Free Pennsylvania Fund | |||||||||
Operating expense limitation as a percentage of average daily net assets (per annum) | 0.59% | 0.57% | 0.59% | 0.61%* | * | 0.55% | 0.64% | |||||||
Effective Nov. 1, 2014, Delaware Investments Fund Services Company (DIFSC), an affiliate of DMC, provides fund accounting and financial administration oversight services to each Fund. Prior to this time, Delaware Service Company, Inc. (DSC), an affiliate of DMC, provided fund accounting and financial administration oversight services to each Fund under a substantially identical agreement with an identical
137
Table of Contents
Notes to financial statements
Delaware Investments® state tax-free funds
2. Investment Management, Administration Agreements, and Other Transactions with Affiliates (continued)
fee schedule. For these services, DIFSC’s fees are calculated based on the aggregate daily net assets of the Delaware Investments Family of Funds at the following annual rate: 0.0050% of the first $30 billion; 0.0045% of the next $10 billion; 0.0040% of the next $10 billion; and 0.0025% of aggregate average daily net assets in excess of $50 billion. The fees payable to DIFSC under the service agreement described above are allocated among all retail funds in the Delaware Investments Family of Funds on a relative net asset value basis. These amounts are included on the “Statements of operations” under “Accounting and administration expenses.” For the year ended Aug. 31, 2015, each Fund was charged for these services as follows:
| Delaware Tax-Free Arizona Fund | Delaware Tax-Free California Fund | Delaware Tax-Free Colorado Fund | Delaware Tax-Free Idaho Fund | Delaware Tax-Free New York Fund | Delaware Tax-Free Pennsylvania Fund | |||||||||||||||||||||||
| $4,102 | $4,542 | $9,317 | $5,195 | $3,698 | $23,253 | |||||||||||||||||||||||
Effective Nov. 1, 2014, DIFSC also became the transfer agent and dividend disbursing agent of each Fund. Prior to this time, DSC was the transfer agent and dividend disbursing agent of the Funds under a substantially identical agreement with an identical fee schedule. For these services, DIFSC’s fees are calculated based on the aggregate daily net assets of the retail funds within the Delaware Investments Family of Funds at the following annual rate: 0.025% of the first $20 billion; 0.020% of the next $5 billion; 0.015% of the next $5 billion; and 0.013% of average daily net assets in excess of $30 billion. The fees payable to DIFSC under the service agreement described above are allocated among all retail Funds in the Delaware Investments Family of Funds on a relative net asset value basis. These amounts are included on the “Statements of operations” under “Dividend disbursing and transfer agent fees and expenses.” For the year ended Aug. 31, 2015, each Fund was charged for these services as follows:
| Delaware Tax-Free Arizona Fund | Delaware Tax-Free California Fund | Delaware Tax-Free Colorado Fund | Delaware Tax-Free Idaho Fund | Delaware Tax-Free New York Fund | Delaware Tax-Free Pennsylvania Fund | |||||||||||||||||||||||
| $18,015 | $19,948 | $40,921 | $22,816 | $16,234 | $102,116 | |||||||||||||||||||||||
Pursuant to a sub-transfer agency agreement between DIFSC and BNY Mellon Investment Servicing (US) Inc. (BNYMIS), BNYMIS provides certain sub-transfer agency services to each Fund. Sub-transfer agency fees are passed on to and paid by each Fund.
Pursuant to a distribution agreement and distribution plan, each Fund pays DDLP, the distributor and an affiliate of DMC, an annual distribution and service fee of 0.25% of the average daily net assets of the Class A shares (except for Delaware Tax-Free Pennsylvania Fund) and 1.00% of the average daily net assets of the Class C shares. The Board for Delaware Tax-Free Pennsylvania Fund has adopted a formula for calculating 12b-1 plan fees for the Fund’s Class A shares that went into effect on June 1, 1992. The Fund’s Class A shares are currently subject to a blended 12b-1 fee equal to the sum of: (1) 0.10% of average daily net assets representing shares acquired prior to June 1, 1992, and (2) 0.25% of average daily net assets representing shares acquired on or after June 1, 1992. All of the Fund’s Class A shareholders bear 12b-1 fees at the same rate, the blended rate, currently 0.24% of average daily net
138
Table of Contents
assets, based on the formula described above. This method of calculating Class A 12b-1 fees may be discontinued at the sole discretion of the Board. Each Fund’s Class B shares were subject to a 12b-1 fee of 1.00% of the average daily net assets, which were contractually waived to 0.25% of the average daily net assets from Sept. 1, 2014 through Sept. 25, 2014. Institutional Class shares pay no distribution and service fees.
As provided in the investment management agreement, each Fund bears a portion of the cost of certain resources shared with DMC, including the cost of internal personnel of DMC and/or its affiliates that provide legal, tax, and regulatory reporting services to each Fund. These amounts are included on the “Statements of operations” under “Legal fees.” For the year ended Aug. 31, 2015, each Fund was charged for internal legal, tax, and regulatory reporting services provided by DMC and/or its affiliates’ employees as follows:
| Delaware Tax-Free Arizona Fund | Delaware Tax-Free California Fund | Delaware Tax-Free Colorado Fund | Delaware Tax-Free Idaho Fund | Delaware Tax-Free New York Fund | Delaware Tax-Free Pennsylvania Fund | |||||||||||||||||||||||
| $2,259 | $2,506 | $4,885 | $2,877 | $2,015 | $14,330 | |||||||||||||||||||||||
For the year ended Aug. 31, 2015, DDLP earned commissions on sales of Class A shares for each Fund as follows:
| Delaware Tax-Free Arizona Fund | Delaware Tax-Free California Fund | Delaware Tax-Free Colorado Fund | Delaware Tax-Free Idaho Fund | Delaware Tax-Free New York Fund | Delaware Tax-Free Pennsylvania Fund | |||||||||||||||||||||||
| $7,178 | $4,762 | $13,338 | $14,732 | $14,710 | $35,984 | |||||||||||||||||||||||
For the year ended Aug. 31, 2015, DDLP received gross CDSC commissions on redemptions of each Fund’s Class A and Class C shares. These commissions were entirely used to offset upfront commissions previously paid by DDLP to broker/dealers on sales of those shares. The amounts received were as follows:
| Delaware Tax-Free Arizona Fund | Delaware Tax-Free California Fund | Delaware Tax-Free Colorado Fund | Delaware Tax-Free Idaho Fund | Delaware Tax-Free New York Fund | Delaware Tax-Free Pennsylvania Fund | |||||||||||||||||||
Class A | $— | $ — | $ 1 | $ — | $ — | $ 35 | ||||||||||||||||||
Class C | 12 | 6,266 | 666 | 3,265 | 1,023 | 2,896 | ||||||||||||||||||
Trustees’ fees include expenses accrued by each Fund for each Trustee’s retainer and meeting fees. Certain officers of DMC, DIFSC, and DDLP are officers and/or Trustees of the Trusts. These officers and Trustees are paid no compensation by the Funds.
* The contractual waiver period is from Dec. 27, 2013 through Dec. 29, 2015 for all Funds except Delaware Tax-Free Pennsylvania Fund, which has a contractual waiver period of June 28, 2012 through Dec. 29, 2015.
** Prior to Dec. 29, 2014, Delaware Tax-Free Idaho Fund’s contractual waiver was 0.63%.
3. Investments
For the year ended Aug. 31, 2015, each Fund made purchases and sales of investment securities other than short-term investments as follows:
139
Table of Contents
Notes to financial statements
Delaware Investments® state tax-free funds
3. Investments (continued)
| Delaware Tax-Free Arizona Fund | Delaware Tax-Free California Fund | Delaware Tax-Free Colorado Fund | Delaware Tax-Free Idaho Fund | Delaware Tax-Free New York Fund | Delaware Tax-Free Pennsylvania Fund | |||||||||||||||||||
Purchases | $10,439,959 | $22,688,200 | $19,473,032 | $ 7,254,834 | $14,031,154 | $70,098,577 | ||||||||||||||||||
Sales | 11,992,598 | 30,913,934 | 26,906,229 | 10,757,762 | 4,594,910 | 60,676,710 | ||||||||||||||||||
At Aug. 31, 2015, the cost and unrealized appreciation (depreciation) of investments for federal income tax purposes for each Fund were as follows:
| Delaware Tax-Free Arizona Fund | Delaware Tax-Free California Fund | Delaware Tax-Free Colorado Fund | Delaware Tax-Free Idaho Fund | Delaware Tax-Free New York Fund | Delaware Tax-Free Pennsylvania Fund | |||||||||||||||||||||||
Cost of investments | $ | 77,194,348 | $ | 79,161,973 | $ | 175,241,924 | $ | 99,328,697 | $ | 76,675,642 | $ | 450,126,996 | ||||||||||||||||
|
|
|
|
|
|
|
|
|
|
|
| |||||||||||||||||
Aggregate unrealized appreciation of investments | $ | 5,299,599 | $ | 7,431,650 | $ | 13,380,440 | $ | 5,996,506 | $ | 4,979,012 | $ | 35,943,571 | ||||||||||||||||
Aggregate unrealized depreciation of investments | (162,576 | ) | (20,431 | ) | (166,536 | ) | (140,441 | ) | (218,347 | ) | (829,959 | ) | ||||||||||||||||
|
|
|
|
|
|
|
|
|
|
|
| |||||||||||||||||
Net unrealized appreciation of investments | $ | 5,137,023 | $ | 7,411,219 | $ | 13,213,904 | $ | 5,856,065 | $ | 4,760,665 | $ | 35,113,612 | ||||||||||||||||
|
|
|
|
|
|
|
|
|
|
|
| |||||||||||||||||
U.S. GAAP defines fair value as the price that each Fund would receive to sell an asset or pay to transfer a liability in an orderly transaction between market participants at the measurement date under current market conditions. A three-level hierarchy for fair value measurements has been established based upon the transparency of inputs to the valuation of an asset or liability. Inputs may be observable or unobservable and refer broadly to the assumptions that market participants would use in pricing the asset or liability. Observable inputs reflect the assumptions market participants would use in pricing the asset or liability based on market data obtained from sources independent of the reporting entity. Unobservable inputs reflect the reporting entity’s own assumptions about the assumptions that market participants would use in pricing the asset or liability based on the best information available under the circumstances. Each Fund’s investment in its entirety is assigned a level based upon the observability of the inputs which are significant to the overall valuation. The three-level hierarchy of inputs is summarized below.
| Level 1 – | Inputs are quoted prices in active markets for identical investments. (Examples: equity securities, open-end investment companies, futures contracts, exchange-traded options contracts) |
140
Table of Contents
| Level 2 – | Other observable inputs, including, but not limited to: quoted prices for similar assets or liabilities in markets that are active, quoted prices for identical or similar assets or liabilities in markets that are not active, inputs other than quoted prices that are observable for the assets or liabilities (such as interest rates, yield curves, volatilities, prepayment speeds, loss severities, credit risks, and default rates), or other market-corroborated inputs. (Examples: debt securities, government securities, swap contracts, foreign currency exchange contracts, foreign securities utilizing international fair value pricing, broker-quoted securities, fair valued securities) |
| Level 3 – | Significant unobservable inputs, including each Fund’s own assumptions used to determine the fair value of investments. (Examples: broker-quoted securities, fair valued securities) |
Level 3 investments are valued using significant unobservable inputs. Each Fund may also use an income-based valuation approach in which the anticipated future cash flows of the investment are discounted to calculate fair value. Discounts may also be applied due to the nature or duration of any restrictions on the disposition of the investments. Valuations may also be based upon current market prices of securities that are comparable in coupon, rating, maturity, and industry. The derived value of a Level 3 investment may not represent the value which is received upon disposition and this could impact the results of operations.
The following tables summarize the valuation of each Fund’s investments by fair value hierarchy levels as of Aug. 31, 2015:
Delaware Tax-Free Arizona Fund | ||
Securities | Level 2 | |
Municipal Bonds | $82,181,371 | |
Short-Term Investments | 150,000 | |
Total Value of Securities | $82,331,371 |
Delaware Tax-Free California Fund | |||||||||||||||
Securities | Level 1 | Level 2 | Total | ||||||||||||
Municipal Bonds | $ | — | $ | 84,807,796 | $ | 84,807,796 | |||||||||
Short-Term Investments1 | 765,396 | 1,000,000 | 1,765,396 | ||||||||||||
|
|
|
|
|
| ||||||||||
Total Value of Securities | $ | 765,396 | $ | 85,807,796 | $ | 86,573,192 | |||||||||
|
|
|
|
|
| ||||||||||
Delaware Tax-Free Colorado Fund | |||||||||||||||
Securities | Level 1 | Level 2 | Total | ||||||||||||
Municipal Bonds | $ | — | $ | 184,978,032 | $ | 184,978,032 | |||||||||
Short-Term Investments1 | 1,892,796 | 1,585,000 | 3,477,796 | ||||||||||||
|
|
|
|
|
| ||||||||||
Total Value of Securities | $ | 1,892,796 | $ | 186,563,032 | $ | 188,455,828 | |||||||||
|
|
|
|
|
| ||||||||||
Delaware Tax-Free Idaho Fund | ||
Securities | Level 2 | |
Municipal Bonds | $105,184,762 |
141
Table of Contents
Notes to financial statements
Delaware Investments® state tax-free funds
3. Investments (continued)
Delaware Tax-Free New York Fund | ||
Securities | Level 2 | |
Municipal Bonds | $80,236,307 | |
Short-Term Investments | 1,200,000 | |
Total Value of Securities | $81,436,307 |
Delaware Tax-Free Pennsylvania Fund | ||
Securities | Level 2 | |
Municipal Bonds | $485,240,608 |
| 1 | Security type is valued across multiple levels. Level 1 investments represent exchange-traded investments while Level 2 investments represent matrix-priced investments. The amounts attributed to Level 1 investments and Level 2 investments represent the following percentages of the total market value of this security type for the Funds: |
Short-Term Investments | Delaware | Delaware | ||||||
Level 1 | 43.36% | 54.43% | ||||||
Level 2 | 56.64% | 45.57% | ||||||
During the year ended Aug. 31, 2015, there were no transfers between Level 1 investments, Level 2 investments, or Level 3 investments that had a significant impact to each Fund. Each Fund’s policy is to recognize transfers between levels at the beginning of the reporting period.
A reconciliation of Level 3 investments is presented when each Fund has a significant amount of Level 3 investments at the beginning, interim, or end of the period in relation to net assets. At Aug. 31, 2015, there were no Level 3 investments.
4. Dividend and Distribution Information
Income and long-term capital gain distributions are determined in accordance with federal income tax regulations, which may differ from U.S. GAAP. Additionally, distributions from net short-term gains on sales of investment securities are treated as ordinary income for federal income tax purposes. The tax character of dividends and distributions paid during the years ended Aug. 31, 2015 and 2014 was as follows:
| Delaware Tax-Free Arizona Fund | Delaware Tax-Free California Fund | Delaware Tax-Free Colorado Fund | Delaware Tax-Free Idaho Fund | Delaware Tax-Free New York Fund | Delaware Pennsylvania Fund | |||||||||||||||||||
Year ended 8/31/15 | ||||||||||||||||||||||||
Tax-exempt income | $ | 2,792,872 | $ | 3,184,248 | $ | 6,898,407 | $ | 3,247,135 | $ | 2,376,283 | $ | 17,042,621 | ||||||||||||
Ordinary income | — | 156 | — | — | 580 | 24,499 | ||||||||||||||||||
|
|
|
|
|
|
|
|
|
|
|
| |||||||||||||
Total | $ | 2,792,872 | $ | 3,184,404 | $ | 6,898,407 | $ | 3,247,135 | $ | 2,376,863 | $ | 17,067,120 | ||||||||||||
|
|
|
|
|
|
|
|
|
|
|
| |||||||||||||
142
Table of Contents
| Delaware Tax-Free Arizona Fund | Delaware Tax-Free California Fund | Delaware Tax-Free Colorado Fund | Delaware Tax-Free Idaho Fund | Delaware Tax-Free New York Fund | Delaware Tax-Free Pennsylvania Fund | |||||||||||||||||||
Year ended 8/31/14 | ||||||||||||||||||||||||
Tax-exempt income | $ | 3,376,852 | $ | 3,441,433 | $ | 7,122,490 | $ | 3,480,546 | $ | 2,280,839 | $ | 17,681,062 | ||||||||||||
Ordinary income | 7 | 8,372 | — | — | 8,685 | 27,180 | ||||||||||||||||||
Long-term capital gains | 220,538 | — | — | — | — | — | ||||||||||||||||||
|
|
|
|
|
|
|
|
|
|
|
| |||||||||||||
Total | $ | 3,597,397 | $ | 3,449,805 | $ | 7,122,490 | $ | 3,480,546 | $ | 2,289,524 | $ | 17,708,242 | ||||||||||||
|
|
|
|
|
|
|
|
|
|
|
| |||||||||||||
5. Components of Net Assets on a Tax Basis
As of Aug. 31, 2015, the components of net assets on a tax basis were as follows:
| Delaware Tax-Free Arizona Fund | Delaware Tax-Free California Fund | Delaware Tax-Free Colorado Fund | Delaware Tax-Free Idaho Fund | Delaware Tax-Free New York Fund | Delaware Tax-Free Pennsylvania Fund | |||||||||||||||||||
Shares of beneficial interest | $81,222,974 | $81,269,607 | $183,411,840 | $105,690,720 | $78,970,275 | $459,472,684 | ||||||||||||||||||
Undistributed tax-exempt income | 92,475 | 102,329 | 535,286 | 70,284 | 51,811 | 362,323 | ||||||||||||||||||
Distributions payable | (72,599 | ) | (82,099 | ) | (184,963 | ) | (85,164 | ) | (61,589 | ) | (489,003 | ) | ||||||||||||
Capital loss carryforwards | (1,803,428 | ) | (1,990,497 | ) | (5,603,770 | ) | (5,223,588 | ) | (1,521,513 | ) | (3,016,127 | ) | ||||||||||||
Unrealized appreciation of investments | 5,137,023 | 7,411,219 | 13,213,904 | 5,856,065 | 4,760,665 | 35,113,612 | ||||||||||||||||||
Net assets | $84,576,445 | $86,710,559 | $191,372,297 | $106,308,317 | $82,199,649 | $491,443,489 | ||||||||||||||||||
The differences between book basis and tax basis components of net assets are primarily attributable to tax treatment of market discount and premium on certain debt instruments.
For financial reporting purposes, capital accounts are adjusted to reflect the tax character of permanent book/tax differences. Reclassifications are primarily due to tax treatment of market discount and premium on debt instruments. Results of operations and net assets were not affected by these reclassifications. For the year ended Aug. 31, 2015, the Funds recorded the following reclassifications:
143
Table of Contents
Notes to financial statements
Delaware Investments® state tax-free funds
5. Components of Net Assets on a Tax Basis (continued)
| Delaware Tax-Free Arizona Fund | Delaware Tax-Free California Fund | Delaware Tax-Free Colorado Fund | Delaware Tax-Free Idaho Fund | Delaware Tax-Free New York Fund | Delaware Tax-Free Pennsylvania Fund | |||||||||||||||||||
Undistributed (distribution in excess of) net investment income | $(8,179 | ) | $(4,047 | ) | $(16,110 | ) | $(9,064 | ) | $(8,220 | ) | $— | |||||||||||||
Accumulated net realized loss on investments | 8,179 | 4,047 | 16,110 | 9,064 | 8,220 | — | ||||||||||||||||||
For federal income tax purposes, capital loss carryforwards may be carried forward and applied against future capital gains. In 2015, the Funds utilized capital loss carryforwards as follows:
| Delaware Tax-Free Arizona Fund | Delaware Tax-Free California Fund | Delaware Tax-Free Colorado Fund | Delaware Tax-Free Idaho Fund | Delaware Tax-Free New York Fund | Delaware Tax-Free Pennsylvania Fund | |||||||||||||||||
| $89,088 | $75,591 | $642,992 | $64,943 | $76,517 | $1,937,674 | |||||||||||||||||
Capital loss carryforwards remaining at Aug. 31, 2015 will expire as follows:
Year of Expiration | Delaware Tax-Free Arizona Fund | Delaware Tax-Free California Fund | Delaware Tax-Free Colorado Fund | Delaware Tax-Free Idaho Fund | Delaware Tax-Free New York Fund | Delaware Tax-Free Pennsylvania Fund | ||||||||||||||||||
2016 | $— | $ — | $44,178 | $— | $— | $— | ||||||||||||||||||
2019 | — | 369,988 | — | — | — | — | ||||||||||||||||||
Total | $— | $369,988 | $44,178 | $— | $— | $— | ||||||||||||||||||
On Dec. 22, 2010, the Regulated Investment Company Modernization Act of 2010 (Act) was enacted, which changed various technical rules governing the tax treatment of regulated investment companies. The changes were generally effective for taxable years beginning after the date of enactment. Under the Act, the Funds are permitted to carry forward capital losses incurred in taxable years beginning after the date of enactment for an unlimited period. However, any losses incurred during those future taxable years will be required to be utilized prior to the losses incurred in pre-enactment taxable years, which carry an expiration date. As a result of this ordering rule, pre-enactment capital loss carryforwards may be more likely to expire unused. Additionally, post-enactment capital loss carryforwards will retain their character as either short-term or long-term capital losses rather than being considered all short-term as permitted under previous regulation.
144
Table of Contents
Losses incurred that will be carried forward under the Act are as follows:
Loss carryforward character | ||||||||
Short-term | Long-term | |||||||
Delaware Tax-Free Arizona Fund | $ | 133,141 | $ | 1,670,287 | ||||
Delaware Tax-Free California Fund | 706,222 | 914,287 | ||||||
Delaware Tax-Free Colorado Fund | 2,753,193 | 2,806,399 | ||||||
Delaware Tax-Free Idaho Fund | 1,817,104 | 3,406,484 | ||||||
Delaware Tax-Free New York Fund | 868,009 | 653,504 | ||||||
Delaware Tax-Free Pennsylvania Fund | 1,200,451 | 1,815,676 | ||||||
6. Capital Shares
Transactions in capital shares were as follows:
| Delaware Tax-Free Arizona Fund | Delaware Tax-Free California Fund | Delaware Tax-Free Colorado Fund | ||||||||||||||||||||||
| Year ended | Year ended | Year ended | ||||||||||||||||||||||
| 8/31/15 | 8/31/14 | 8/31/15 | 8/31/14 | 8/31/15 | 8/31/14 | |||||||||||||||||||
Shares sold: | ||||||||||||||||||||||||
Class A | 188,212 | 422,664 | 475,231 | 716,363 | 590,765 | 587,926 | ||||||||||||||||||
Class B | — | 5 | — | — | — | 717 | ||||||||||||||||||
Class C | 90,627 | 49,012 | 189,314 | 143,852 | 115,561 | 49,345 | ||||||||||||||||||
Institutional Class | 47,938 | 19,087 | 703,979 | 498,884 | 253,199 | 277,679 | ||||||||||||||||||
Shares issued upon reinvestment of dividends and distributions: |
| |||||||||||||||||||||||
Class A | 171,727 | 234,409 | 171,102 | 219,532 | 464,698 | 514,495 | ||||||||||||||||||
Class B | 7 | 254 | 43 | 827 | 3 | 54 | ||||||||||||||||||
Class C | 12,170 | 15,965 | 28,591 | 34,851 | 26,653 | 30,193 | ||||||||||||||||||
Institutional Class | 1,151 | 95 | 28,295 | 2,431 | 13,909 | 673 | ||||||||||||||||||
|
|
|
|
|
|
|
|
|
|
|
| |||||||||||||
| 511,832 | 741,491 | 1,596,555 | 1,616,740 | 1,464,788 | 1,461,082 | |||||||||||||||||||
|
|
|
|
|
|
|
|
|
|
|
| |||||||||||||
Shares redeemed: | ||||||||||||||||||||||||
Class A | (744,808 | ) | (1,380,013 | ) | (1,767,868 | ) | (2,492,660 | ) | (1,780,322 | ) | (3,031,582 | ) | ||||||||||||
Class B | (2,437 | ) | (7,506 | ) | (14,922 | ) | (26,859 | ) | (1,035 | ) | (1,134 | ) | ||||||||||||
Class C | (57,674 | ) | (126,391 | ) | (189,793 | ) | (540,515 | ) | (119,952 | ) | (330,843 | ) | ||||||||||||
Institutional Class | (3,123 | ) | (41 | ) | (376,300 | ) | (6,006 | ) | (84,895 | ) | (6,477 | ) | ||||||||||||
|
|
|
|
|
|
|
|
|
|
|
| |||||||||||||
| (808,042 | ) | (1,513,951 | ) | (2,348,883 | ) | (3,066,040 | ) | (1,986,204 | ) | (3,370,036 | ) | |||||||||||||
|
|
|
|
|
|
|
|
|
|
|
| |||||||||||||
Net decrease | (296,210 | ) | (772,460 | ) | (752,328 | ) | (1,449,300 | ) | (521,416 | ) | (1,908,954 | ) | ||||||||||||
|
|
|
|
|
|
|
|
|
|
|
| |||||||||||||
145
Table of Contents
Notes to financial statements
Delaware Investments® state tax-free funds
6. Capital Shares (continued)
| Delaware Tax-Free Idaho Fund | Delaware Tax-Free New York Fund | Delaware Tax-Free Pennsylvania Fund | ||||||||||||||||||||||
| Year ended | Year ended | Year ended | ||||||||||||||||||||||
| 8/31/15 | 8/31/14 | 8/31/15 | 8/31/14 | 8/31/15 | 8/31/14 | |||||||||||||||||||
Shares sold: | ||||||||||||||||||||||||
Class A | 538,926 | 818,230 | 898,197 | 627,155 | 3,162,192 | 3,568,801 | ||||||||||||||||||
Class B | — | — | — | 3 | — | 1 | ||||||||||||||||||
Class C | 292,319 | 189,865 | 216,895 | 112,124 | 517,225 | 419,579 | ||||||||||||||||||
Institutional Class | 203,055 | 94,436 | 1,021,209 | 154,404 | 1,905,849 | 456,689 | ||||||||||||||||||
Shares issued upon reinvestment of dividends and distributions: |
| |||||||||||||||||||||||
Class A | 181,656 | 194,871 | 123,704 | 145,599 | 1,566,353 | 1,722,816 | ||||||||||||||||||
Class B | 38 | 624 | 1 | 167 | 114 | 2,036 | ||||||||||||||||||
Class C | 57,924 | 66,057 | 28,234 | 32,492 | 99,659 | 107,803 | ||||||||||||||||||
Institutional Class | 6,158 | 331 | 28,510 | 570 | 40,292 | 2,094 | ||||||||||||||||||
|
|
|
|
|
|
|
|
|
|
|
| |||||||||||||
| 1,280,076 | 1,364,414 | 2,316,750 | 1,072,514 | 7,291,684 | 6,279,819 | |||||||||||||||||||
|
|
|
|
|
|
|
|
|
|
|
| |||||||||||||
Shares redeemed: | ||||||||||||||||||||||||
Class A | (1,158,527 | ) | (2,011,144 | ) | (1,104,087 | ) | (1,655,477 | ) | (5,778,538 | ) | (9,731,852 | ) | ||||||||||||
Class B | (14,305 | ) | (13,492 | ) | (248 | ) | (12,988 | ) | (38,921 | ) | (43,672 | ) | ||||||||||||
Class C | (564,826 | ) | (585,307 | ) | (305,269 | ) | (533,776 | ) | (523,075 | ) | (891,469 | ) | ||||||||||||
Institutional Class | (77,674 | ) | (1,422 | ) | (100,027 | ) | (569 | ) | (347,515 | ) | (1,081 | ) | ||||||||||||
|
|
|
|
|
|
|
|
|
|
|
| |||||||||||||
| (1,815,332 | ) | (2,611,365 | ) | (1,509,631 | ) | (2,202,810 | ) | (6,688,049 | ) | (10,668,074 | ) | |||||||||||||
|
|
|
|
|
|
|
|
|
|
|
| |||||||||||||
Net increase (decrease) | (535,256 | ) | (1,246,951 | ) | 807,119 | (1,130,296 | ) | 603,635 | (4,388,255 | ) | ||||||||||||||
|
|
|
|
|
|
|
|
|
|
|
| |||||||||||||
For the years ended Aug. 31, 2015 and 2014, the following shares and values were converted from Class B to Class A. The amounts are included in Class B redemptions and Class A subscriptions in the tables above, and the “Statements of changes in net assets.”
| Year ended 8/31/15 | Year ended 8/31/14 | |||||||||||||||||||||||
| Class B Shares | Class A Shares | Value | Class B Shares | Class A Shares | Value | |||||||||||||||||||
Delaware Tax-Free Arizona Fund | — | — | $— | 1,123 | 1,127 | $12,201 | ||||||||||||||||||
Delaware Tax-Free California Fund | 102 | 102 | 1,234 | 129 | 129 | 1,455 | ||||||||||||||||||
Delaware Tax-Free Idaho Fund | 10,178 | 10,172 | 117,182 | 1,911 | 1,910 | 21,325 | ||||||||||||||||||
Delaware Tax-Free Pennsylvania Fund | 14,130 | 14,134 | 115,189 | 8,129 | 8,125 | 63,471 | ||||||||||||||||||
146
Table of Contents
Certain shareholders may exchange shares of one class of shares for another class in the same Fund. For the year ended Aug. 31, 2015 and 2014, the Funds had the following exchange transactions. These exchange transactions are included as subscriptions and redemptions in the tables on the previous pages, and the “Statements of changes in net assets.”
Year ended 8/31/15 | ||||||||||||||||||||
| Exchange Redemptions | Exchange Subscriptions | |||||||||||||||||||
| Class A Shares | Class C Shares | Value | Institutional Class Shares | Value | ||||||||||||||||
Delaware Tax-Free California Fund | 33,790 | — | $414,230 | 33,842 | $414,230 | |||||||||||||||
Delaware Tax-Free Colorado Fund | — | 6,337 | 72,603 | 6,369 | 72,603 | |||||||||||||||
Delaware Tax-Free Idaho Fund | 2,800 | — | 32,191 | 2,804 | 32,191 | |||||||||||||||
Delaware Tax-Free Pennsylvania Fund | 98,416 | — | 811,211 | 98,547 | 811,211 | |||||||||||||||
Year ended 8/31/14 | ||||||||||||||||
| Exchange Redemptions | Exchange Subscriptions | |||||||||||||||
| Class A Shares | Value | Institutional Class Shares | Value | |||||||||||||
Delaware Tax-Free Colorado Fund | 9,783 | $107,577 | 9,798 | $107,577 | ||||||||||||
7. Line of Credit
Each Fund, along with certain other funds in the Delaware Investments® Family of Funds (Participants), was a participant in a $225,000,000 revolving line of credit intended to be used for temporary or emergency purposes as an additional source of liquidity to fund redemptions of investor shares. Under the agreement, the Participants were charged an annual commitment fee of 0.08%, which was allocated across the Participants on the basis of each Participant’s allocation of the entire facility. The Participants were permitted to borrow up to a maximum of one third of their net assets under the agreement. Each Participant was individually, and not jointly, liable for its particular advances, if any, under the line of credit. The line of credit under the agreement expired on Nov. 10, 2014.
On Nov. 10, 2014, each Fund, along with the other Participants, entered into an amendment to the agreement for a $275,000,000 revolving line of credit. The line of credit is to be used as described above and operates in substantially the same manner as the original agreement. The line of credit available under the agreement expires on Nov. 9, 2015.
The Funds had no amounts outstanding as of Aug. 31, 2015 or at any time during the year then ended.
147
Table of Contents
Notes to financial statements
Delaware Investments® state tax-free funds
8. Geographic, Credit, and Market Risks
The Funds concentrate their investments in securities issued by each corresponding state’s municipalities. The Funds invest primarily in a specific state and may be subject to geographic concentration risk. In addition, the Funds have the flexibility to invest in issuers in U.S. territories and possessions such as the Commonwealth of Puerto Rico, the U.S. Virgin Islands, and Guam whose bonds are also free of federal and individual state income taxes. The value of the Funds’ investments may be adversely affected by new legislation within the states, U.S. territories, regional or local economic conditions, and differing levels of supply and demand for municipal bonds. Many municipalities insure repayment for their obligations. Although bond insurance reduces the risk of loss due to default by an issuer, such bonds remain subject to the risk that value may fluctuate for other reasons and there is no certainty that the insurance company will meet its obligations. A real or perceived decline in creditworthiness of a bond insurer can have an adverse impact on the value of insured bonds held in each Fund. At Aug. 31, 2015, the percentages of each Fund’s net assets insured by bond insurers are listed below and these securities have been identified on the “Schedules of investments.”
| Delaware Tax-Free Arizona Fund | Delaware Tax-Free California Fund | Delaware Tax-Free Colorado Fund | Delaware Tax-Free Idaho Fund | Delaware Tax-Free New York Fund | Delaware Tax-Free Pennsylvania Fund | |||||
| 11.40% | 6.02% | 13.28% | 15.39% | 2.34% | 9.15% |
Each Fund invests a portion of its assets in high yield fixed income securities, which are securities rated lower than BBB- by Standard & Poor’s Financial Services LLC (S&P) and lower than Baa3 by Moody’s Investors Service, Inc. (Moody’s), or similarly rated by another nationally recognized statistical rating organization. Investments in these higher yielding securities are generally accompanied by a greater degree of credit risk than higher rated securities. Additionally, lower rated securities may be more susceptible to adverse economic and competitive industry conditions than investment grade securities.
Each Fund invests in certain obligations that may have liquidity protection designed to ensure that the receipt of payments due on the underlying security is timely. Such protection may be provided through guarantees, insurance policies or letters of credit obtained by the issuer or sponsor through third parties, through various means of structuring the transaction or through a combination of such approaches. Each Fund will not pay any additional fees for such credit support, although the existence of credit support may increase the price of a security.
The Funds may invest in advanced refunded bonds, escrow secured bonds, or defeased bonds. Under current federal tax laws and regulations, state and local government borrowers are permitted to refinance outstanding bonds by issuing new bonds. The issuer refinances the outstanding debt to either reduce interest costs or to remove or alter restrictive covenants imposed by the bonds being refinanced. A refunding transaction where the municipal securities are being refunded within 90 days from the issuance of the refunding issue is known as a “current refunding.” “Advance refunded bonds” are bonds in which the refunded bond issue remains outstanding for more than 90 days following the issuance of the refunding issue. In an advance refunding, the issuer will use the proceeds of a new bond issue to purchase high grade interest bearing debt securities, which are then deposited in an irrevocable escrow account held by an escrow agent to secure all future payments of principal and interest and bond premium of the advance refunded bond. Bonds are “escrowed to maturity” when the proceeds of the
148
Table of Contents
refunding issue are deposited in an escrow account for investment sufficient to pay all of the principal and interest on the original interest payment and maturity dates.
Bonds are considered “pre-refunded” when the refunding issue’s proceeds are escrowed only until a permitted call date or dates on the refunded issue with the refunded issue being redeemed at the time, including any required premium. Bonds become “defeased” when the rights and interests of the bondholders and of their lien on the pledged revenues or other security under the terms of the bond contract are substituted with an alternative source of revenues (the escrow securities) sufficient to meet payments of principal and interest to maturity or to the first call dates. Escrowed secured bonds will often receive a rating of AAA from Moody’s, S&P, and/or Fitch Ratings due to the strong credit quality of the escrow securities and the irrevocable nature of the escrow deposit agreement.
Each Fund may invest up to 15% of its net assets in illiquid securities, which may include securities with contractual restrictions on resale, securities exempt from registration under Rule 144A promulgated under the Securities Act of 1933, as amended, and other securities which may not be readily marketable. The relative illiquidity of these securities may impair each Fund from disposing of them in a timely manner and at a fair price when it is necessary or desirable to do so. While maintaining oversight, the Boards have delegated to DMC, the day-to-day functions of determining whether individual securities are liquid for purposes of each Fund’s limitation on investments in illiquid securities. Securities eligible for resale pursuant to Rule 144A, which are determined to be liquid, are not subject to each Fund’s 15% limit on investments in illiquid securities. Rule 144A and illiquid securities held by the Funds have been identified on the “Schedules of investments.”
9. Contractual Obligations
Each Fund enters into contracts in the normal course of business that contain a variety of indemnifications. Each Fund’s maximum exposure under these arrangements is unknown. However, the Funds have not had prior claims or losses pursuant to these contracts. Management has reviewed each Fund’s existing contracts and expects the risk of loss to be remote.
10. Recent Accounting Pronouncements
In June 2014, the Financial Accounting Standards Board (FASB) issued guidance to improve the financial reporting of reverse repurchase agreements and other similar transactions. The guidance includes expanded disclosure requirements for entities that enter into reverse repurchase agreements and similar transactions accounted for as secured borrowings. The guidance is effective for financial statements with fiscal years beginning on or after Dec. 15, 2014 and interim periods within those fiscal years.
Management has determined that this pronouncement has no impact to the Funds’ financial statements.
In May 2015, the FASB issued Accounting Standards Update (“ASU”) No. 2015-07 regarding “Disclosures for Investments in Certain Entities That Calculate Net Asset Value per Share”. The amendments in this update are effective for the Funds for fiscal years beginning after Dec. 15, 2015, and interim periods within those fiscal years. ASU No. 2015-07 will eliminate the requirement to categorize investments in the fair value hierarchy if their fair value is measured at net asset value (“NAV”) per share (or its equivalent) using the practical expedient in the FASB’s fair value measurement guidance. At this time, management is evaluating the implications of ASU No. 2015-07 and its impact on the financial statement disclosures has not yet been determined.
149
Table of Contents
Notes to financial statements
Delaware Investments® state tax-free funds
11. Subsequent Events
Management has determined that no material events or transactions occurred subsequent to Aug. 31, 2015 that would require recognition or disclosure in the Funds’ financial statements.
150
Table of Contents
registered public accounting firm
To the Board of Trustees of Voyageur Insured Funds, Voyageur Mutual Funds, Voyageur Mutual Funds II and Delaware Group® State Tax-Free Income Trust and the Shareholders of Delaware Tax-Free Arizona Fund, Delaware Tax-Free California Fund, Delaware Tax-Free Idaho Fund, Delaware Tax-Free New York Fund, Delaware Tax-Free Colorado Fund and Delaware Tax-Free Pennsylvania Fund:
In our opinion, the accompanying statements of assets and liabilities, including the schedules of investments, and the related statements of operations and of changes in net assets and the financial highlights present fairly, in all material respects, the financial position of Delaware Tax-Free Arizona Fund (constituting Voyageur Insured Funds), Delaware Tax-Free California Fund, Delaware Tax-Free Idaho Fund, Delaware Tax-Free New York Fund (three of the series constituting Voyageur Mutual Funds), Delaware Tax-Free Colorado Fund (constituting Voyageur Mutual Funds II) and Delaware Tax-Free Pennsylvania Fund (constituting Delaware Group® State Tax-Free Income Trust) (hereafter collectively referred to as the “Funds”) at August 31, 2015, the results of each of their operations for the year then ended, the changes in each of their net assets for each of the two years in the period then ended and the financial highlights for each of the periods indicated, in conformity with accounting principles generally accepted in the United States of America. These financial statements and financial highlights (hereafter referred to as “financial statements”) are the responsibility of the Funds’ management. Our responsibility is to express an opinion on these financial statements based on our audits. We conducted our audits of these financial statements in accordance with the standards of the Public Company Accounting Oversight Board (United States). Those standards require that we plan and perform the audit to obtain reasonable assurance about whether the financial statements are free of material misstatement. An audit includes examining, on a test basis, evidence supporting the amounts and disclosures in the financial statements, assessing the accounting principles used and significant estimates made by management, and evaluating the overall financial statement presentation. We believe that our audits, which included confirmation of securities at August 31, 2015 by correspondence with the custodian and brokers, provide a reasonable basis for our opinion.
PricewaterhouseCoopers LLP
Philadelphia, Pennsylvania
October 22, 2015
151
Table of Contents
Other Fund information (Unaudited)
Delaware Investments® state tax-free funds
Tax Information
The information set forth below is for the Funds’ fiscal year as required by federal income tax laws. Shareholders, however, must report distributions on a calendar year basis for income tax purposes, which may include distributions for portions of two fiscal years of the Funds. Accordingly, the information needed by shareholders for income tax purposes will be sent to them in January of each year. Please consult your tax advisor for proper treatment of this information.
All disclosures are based on financial information available as of the date of this annual report and, accordingly are subject to change. For any and all items requiring reporting, it is the intention of each Fund to report the maximum amount permitted under the Internal Revenue Code and the regulations thereunder.
For the fiscal year ended Aug. 31, 2015, each Fund reports distributions paid during the year as follows:
(A)
Ordinary Income Distributions (Tax Basis) | (B)
Tax-Exempt Income Distributions (Tax Basis) | Total Distributions (Tax Basis) | |||||||||||||
Delaware Tax-Free Arizona Fund | — | 100.00 | % | 100.00 | % | ||||||||||
Delaware Tax-Free California Fund | — | 100.00 | % | 100.00 | % | ||||||||||
Delaware Tax-Free Colorado Fund | — | 100.00 | % | 100.00 | % | ||||||||||
Delaware Tax-Free Idaho Fund | — | 100.00 | % | 100.00 | % | ||||||||||
Delaware Tax-Free New York Fund | 0.02 | % | 99.98 | % | 100.00 | % | |||||||||
Delaware Tax-Free Pennsylvania Fund | 0.14 | % | 99.86 | % | 100.00 | % | |||||||||
| (A) and (B) are based on a percentage of each Fund’s total distributions. | |||||||||||||||
Proxy Results
At Joint Special Meetings of Shareholders of Voyageur Insured Funds, on behalf of Delaware Tax-Free Arizona Fund (the “Fund”), held on March 31, 2015 and reconvened on April 21, 2015 for the proposals listed in items (ii) and (iii) below, at Joint Special Meetings of Shareholders of Voyageur Mutual Funds, on behalf of Delaware Minnesota High-Yield Municipal Bond Fund, Delaware National High-Yield Municipal Bond Fund, Delaware Tax-Free California Fund, Delaware Tax-Free Idaho Fund, and Delaware Tax-Free New York Fund held on March 31, 2015, at Joint Special Meetings of Shareholders of Voyageur Mutual Funds II, on behalf of Delaware Tax-Free Colorado Fund, held on March 31, 2015, and at Joint Special Meetings of Shareholders of Delaware Group® State Tax-Free Income Trust (the “Trust”), on behalf of Delaware Tax-Free Pennsylvania Fund (the “Fund”), held on March 31, 2015 (Delaware Tax-Free Arizona Fund, Delaware Tax-Free California Fund, Delaware Tax-Free Colorado Fund, Delaware Tax-Free Idaho Fund, Delaware Tax-Free New York Fund, and Delaware Tax-Free Pennsylvania Fund each, a “Fund” and together, the “Funds” and Voyageur Insured Funds, Voyageur Mutual Funds, Voyageur Mutual Funds II, and Delaware Group State Tax-Free Income Trust each, a “Trust” and together, the “Trusts”), the shareholders of each Trust/each Fund voted to: (i) elect a Board of Trustees for each Trust; (ii) approve the implementation of a new “manager of managers” order for each Fund except for Delaware Tax-Free New York Fund; (iii) revise the fundamental investment restriction relating to lending for each
152
Table of Contents
Fund except for Delaware Tax-Free New York Fund; and (iv)(a) revise provisions of each Trust’s Agreement and Declaration of Trust related to documenting the transfer of shares, (iv)(b) revise provisions of each Trust’s Agreement and Declaration of Trust related to shareholder disclosure of certain information upon board demand, and (iv)(c) revise provisions of each Trust’s By-Laws so that Delaware law will apply to matters related to proxies. At the meeting, the following people were elected to serve as Independent Trustees: Thomas L. Bennett, Ann D. Borowiec, Joseph W. Chow, John A. Fry, Lucinda S. Landreth, Frances A. Sevilla-Sacasa, Thomas K. Whitford, Janet L. Yeomans, and J. Richard Zecher. In addition, Patrick P. Coyne was elected to serve as an Interested Trustee.
The Joint Special Meeting of Shareholders of the Trust was adjourned to April 21, 2015, May 12, 2015, and June 2, 2015 for the proposals (i) to approve the implementation of a new “manager of managers” order for Delaware Tax-Free New York Fund and (ii) to revise the fundamental investment restriction relating to lending for Delaware Tax-Free New York Fund.
The following proposals were submitted for a vote of the shareholders:
1. To elect a Board of Trustees for each Trust.
A quorum of shares outstanding of the Funds of each Trust was present, and the votes passed with a plurality of these Shares.
Voyageur Insured Funds
Shares Voted For | % of Outstanding Shares | % of Shares Voted | Shares Withheld | % of Outstanding Shares | % of Shares Voted | |||||||||||||||||||
Thomas L. Bennett | 3,451,213.003 | 45.713% | 95.965 | % | 145,108.054 | 1.922% | 4.035 | % | ||||||||||||||||
Ann D. Borowiec | 3,461,378.003 | 45.847% | 96.248 | % | 134,943.054 | 1.787% | 3.752 | % | ||||||||||||||||
Joseph W. Chow | 3,461,378.003 | 45.847% | 96.248 | % | 134,943.054 | 1.787% | 3.752 | % | ||||||||||||||||
Patrick P. Coyne | 3,459,167.003 | 45.818% | 96.186 | % | 137,154.054 | 1.817% | 3.814 | % | ||||||||||||||||
John A. Fry | 3,461,378.003 | 45.847% | 96.248 | % | 134,943.054 | 1.787% | 3.752 | % | ||||||||||||||||
Lucinda S. Landreth | 3,451,213.003 | 45.713% | 95.965 | % | 145,108.054 | 1.922% | 4.035 | % | ||||||||||||||||
Frances A. Sevilla-Sacasa | 3,461,378.003 | 45.847% | 96.248 | % | 134,943.054 | 1.787% | 3.752 | % | ||||||||||||||||
Thomas K. Whitford | 3,461,378.003 | 45.847% | 96.248 | % | 134,943.054 | 1.787% | 3.752 | % | ||||||||||||||||
Janet L. Yeomans | 3,451,213.003 | 45.713% | 95.965 | % | 145,108.054 | 1.922% | 4.035 | % | ||||||||||||||||
J. Richard Zecher | 3,451,213.003 | 45.713% | 95.965 | % | 145,108.054 | 1.922% | 4.035 | % | ||||||||||||||||
153
Table of Contents
Other Fund information (Unaudited)
Delaware Investments® state tax-free funds
Proxy Results (continued)
Voyageur Mutual Funds
Shares Voted For | % of Outstanding Shares | % of Shares Voted | Shares Withheld | % of Outstanding Shares | % of Shares Voted | |||||||||||||||||||
Thomas L. Bennett | 77,276,795.607 | 65.123% | 98.335 | % | 1,308,193.317 | 1.102% | 1.665 | % | ||||||||||||||||
Ann D. Borowiec | 77,397,915.799 | 65.225% | 98.489 | % | 1,187,073.125 | 1.000% | 1.511 | % | ||||||||||||||||
Joseph W. Chow | 77,285,371.301 | 65.130% | 98.346 | % | 1,299,617.623 | 1.095% | 1.654 | % | ||||||||||||||||
Patrick P. Coyne | 77,395,165.343 | 65.222% | 98.486 | % | 1,189,823.581 | 1.003% | 1.514 | % | ||||||||||||||||
John A. Fry | 77,394,790.343 | 65.222% | 98.485 | % | 1,190,198.581 | 1.003% | 1.515 | % | ||||||||||||||||
Lucinda S. Landreth | 77,370,351.799 | 65.202% | 98.454 | % | 1,214,637.125 | 1.024% | 1.546 | % | ||||||||||||||||
Frances A. Sevilla-Sacasa | 77,375,937.301 | 65.206% | 98.461 | % | 1,209,051.623 | 1.019% | 1.539 | % | ||||||||||||||||
Thomas K. Whitford | 77,381,528.607 | 65.211% | 98.469 | % | 1,203,460.317 | 1.014% | 1.531 | % | ||||||||||||||||
Janet L. Yeomans | 77,362,190.845 | 65.195% | 98.444 | % | 1,222,798.079 | 1.030% | 1.556 | % | ||||||||||||||||
J. Richard Zecher | 77,388,843.343 | 65.217% | 98.478 | % | 1,196,145.581 | 1.008% | 1.522 | % | ||||||||||||||||
Voyageur Mutual Funds II
Shares Voted For | % of Outstanding Shares | % of Shares Voted | Shares Withheld | % of Outstanding Shares | % of Shares Voted | |||||||||||||||||||
Thomas L. Bennett | 9,372,394.945 | 53.544% | 96.525 | % | 337,383.313 | 1.927% | 3.475 | % | ||||||||||||||||
Ann D. Borowiec | 9,362,474.509 | 53.487% | 96.423 | % | 347,303.749 | 1.984% | 3.577 | % | ||||||||||||||||
Joseph W. Chow | 9,390,325.360 | 53.646% | 96.710 | % | 319,452.898 | 1.825% | 3.290 | % | ||||||||||||||||
Patrick P. Coyne | 9,363,896.360 | 53.495% | 96.438 | % | 345,881.898 | 1.976% | 3.562 | % | ||||||||||||||||
John A. Fry | 9,364,820.344 | 53.500% | 96.447 | % | 344,957.914 | 1.971% | 3.553 | % | ||||||||||||||||
Lucinda S. Landreth | 9,365,099.119 | 53.502% | 96.450 | % | 344,679.139 | 1.969% | 3.550 | % | ||||||||||||||||
Frances A. Sevilla-Sacasa | 9,315,833.344 | 53.221% | 95.943 | % | 393,944.914 | 2.251% | 4.057 | % | ||||||||||||||||
Thomas K. Whitford | 9,395,741.961 | 53.677% | 96.766 | % | 314,036.297 | 1.794% | 3.234 | % | ||||||||||||||||
Janet L. Yeomans | 9,399,700.060 | 53.700% | 96.807 | % | 310,078.198 | 1.771% | 3.193 | % | ||||||||||||||||
J. Richard Zecher | 9,380,491.811 | 53.590% | 96.609 | % | 329,286.447 | 1.881% | 3.391 | % | ||||||||||||||||
154
Table of Contents
Delaware Group State Tax-Free Income Trust
Shares Voted For | % of Outstanding Shares | % of Shares Voted | Shares Withheld | % of Outstanding Shares | % of Shares Voted | |||||||||||||||||||
Thomas L. Bennett | 36,116,767.729 | 60.438% | 97.401 | % | 963,690.231 | 1.613% | 2.599 | % | ||||||||||||||||
Ann D. Borowiec | 36,090,860.552 | 60.395% | 97.331 | % | 989,597.408 | 1.656% | 2.669 | % | ||||||||||||||||
Joseph W. Chow | 36,057,053.848 | 60.338% | 97.240 | % | 1,023,404.112 | 1.713% | 2.760 | % | ||||||||||||||||
Patrick P. Coyne | 36,101,405.498 | 60.413% | 97.360 | % | 979,052.462 | 1.638% | 2.640 | % | ||||||||||||||||
John A. Fry | 36,069,303.064 | 60.359% | 97.273 | % | 1,011,154.896 | 1.692% | 2.727 | % | ||||||||||||||||
Lucinda S. Landreth | 36,105,618.815 | 60.420% | 97.371 | % | 974,839.145 | 1.631% | 2.629 | % | ||||||||||||||||
Frances A. Sevilla-Sacasa | 36,081,038.585 | 60.378% | 97.305 | % | 999,419.375 | 1.672% | 2.695 | % | ||||||||||||||||
Thomas K. Whitford | 36,078,660.680 | 60.374% | 97.298 | % | 1,001,797.280 | 1.676% | 2.702 | % | ||||||||||||||||
Janet L. Yeomans | 36,058,226.549 | 60.340% | 97.243 | % | 1,022,231.411 | 1.711% | 2.757 | % | ||||||||||||||||
J. Richard Zecher | 36,075,195.158 | 60.369% | 97.289 | % | 1,005,262.802 | 1.682% | 2.711 | % | ||||||||||||||||
2. To approve the implementation of a new “manager of managers” order.
A quorum of the shares outstanding of the following Funds was present, and the votes passed with the required majority of those shares. The results were as follows:
Delaware Tax-Free Arizona Fund
Shares voted for | 3,365,529.966 | |||
Percentage of outstanding shares | 44.578 | % | ||
Percentage of shares voted | 83.343 | % | ||
Shares voted against | 82,259.059 | |||
Percentage of outstanding shares | 1.090 | % | ||
Percentage of shares voted | 2.037 | % | ||
Shares abstained | 161,864.872 | |||
Percentage of outstanding shares | 2.144 | % | ||
Percentage of shares voted | 4.008 | % | ||
Broker non-votes | 428,504.000 |
155
Table of Contents
Other Fund information (Unaudited)
Delaware Investments® state tax-free funds
Proxy Results (continued)
Delaware Tax-Free California Fund
Shares voted for | 3,586,894.995 | |||
Percentage of outstanding shares | 44.871 | % | ||
Percentage of shares voted | 74.524 | % | ||
Shares voted against | 65,490.969 | |||
Percentage of outstanding shares | 0.819 | % | ||
Percentage of shares voted | 1.361 | % | ||
Shares abstained | 33,797.889 | |||
Percentage of outstanding shares | 0.423 | % | ||
Percentage of shares voted | 0.702 | % | ||
Broker non-votes | 1,126,911.000 | |||
| Delaware Tax-Free Colorado Fund | ||||
Shares voted for | 7,065,949.151 | |||
Percentage of outstanding shares | 40.367 | % | ||
Percentage of shares voted | 72.771 | % | ||
Shares voted against | 510,501.193 | |||
Percentage of outstanding shares | 2.916 | % | ||
Percentage of shares voted | 5.258 | % | ||
Shares abstained | 410,601.914 | |||
Percentage of outstanding shares | 2.346 | % | ||
Percentage of shares voted | 4.229 | % | ||
Broker non-votes | 1,722,726.000 | |||
| Delaware Tax-Free Idaho Fund | ||||
Shares voted for | 3,592,784.439 | |||
Percentage of outstanding shares | 37.808 | % | ||
Percentage of shares voted | 72.266 | % | ||
Shares voted against | 144,960.632 | |||
Percentage of outstanding shares | 1.525 | % | ||
Percentage of shares voted | 2.916 | % | ||
Shares abstained | 260,483.063 | |||
Percentage of outstanding shares | 2.741 | % | ||
Percentage of shares voted | 5.239 | % | ||
Broker non-votes | 973,366.000 | |||
156
Table of Contents
Delaware Tax-Free Pennsylvania Fund
Shares voted for | 29,498,704.341 | |||
Percentage of outstanding shares | 49.363 | % | ||
Percentage of shares voted | 79.553 | % | ||
Shares voted against | 1,132,072.728 | |||
Percentage of outstanding shares | 1.894 | % | ||
Percentage of shares voted | 3.053 | % | ||
Shares abstained | 1,125,099.891 | |||
Percentage of outstanding shares | 1.883 | % | ||
Percentage of shares voted | 3.034 | % | ||
Broker non-votes | 5,324,581.000 |
3. To revise the fundamental investment restriction relating to lending.
A quorum of the shares outstanding of the following Funds was present, and the votes passed with the required majority of those shares. The results were as follows:
Delaware Tax-Free Arizona Fund
Shares voted for | 3,280,124.701 | |||
Percentage of outstanding shares | 43.447 | % | ||
Percentage of shares voted | 81.228 | % | ||
Shares voted against | 117,881.363 | |||
Percentage of outstanding shares | 1.561 | % | ||
Percentage of shares voted | 2.919 | % | ||
Shares abstained | 211,648.833 | |||
Percentage of outstanding shares | 2.803 | % | ||
Percentage of shares voted | 5.241 | % | ||
Broker non-votes | 428,503.000 |
157
Table of Contents
Other Fund information (Unaudited)
Delaware Investments® state tax-free funds
Proxy Results (continued)
| Delaware Tax-Free California Fund | ||||
Shares voted for | 3,452,237.351 | |||
Percentage of outstanding shares | 43.187 | % | ||
Percentage of shares voted | 71.726 | % | ||
Shares voted against | 197,767.710 | |||
Percentage of outstanding shares | 2.474 | % | ||
Percentage of shares voted | 4.109 | % | ||
Shares abstained | 36,178.792 | |||
Percentage of outstanding shares | 0.453 | % | ||
Percentage of shares voted | 0.752 | % | ||
Broker non-votes | 1,126,911.000 | |||
| Delaware Tax-Free Colorado Fund | ||||
Shares voted for | 6,934,457.732 | |||
Percentage of outstanding shares | 39.616 | % | ||
Percentage of shares voted | 71.417 | % | ||
Shares voted against | 612,337.967 | |||
Percentage of outstanding shares | 3.498 | % | ||
Percentage of shares voted | 6.306 | % | ||
Shares abstained | 440,252.559 | |||
Percentage of outstanding shares | 2.515 | % | ||
Percentage of shares voted | 4.534 | % | ||
Broker non-votes | 1,722,730.000 | |||
| Delaware Tax-Free Idaho Fund | ||||
Shares voted for | 3,573,829.646 | |||
Percentage of outstanding shares | 37.608 | % | ||
Percentage of shares voted | 71.885 | % | ||
Shares voted against | 236,203.280 | |||
Percentage of outstanding shares | 2.486 | % | ||
Percentage of shares voted | 4.751 | % | ||
Shares abstained | 188,196.208 | |||
Percentage of outstanding shares | 1.980 | % | ||
Percentage of shares voted | 3.785 | % | ||
Broker non-votes | 973,365.000 | |||
158
Table of Contents
| Delaware Tax-Free Pennsylvania Fund | ||||
Shares voted for | 29,190,549.717 | |||
Percentage of outstanding shares | 48.848 | % | ||
Percentage of shares voted | 78.722 | % | ||
Shares voted against | 1,355,584.177 | |||
Percentage of outstanding shares | 2.268 | % | ||
Percentage of shares voted | 3.656 | % | ||
Shares abstained | 1,209,743.066 | |||
Percentage of outstanding shares | 2.024 | % | ||
Percentage of shares voted | 3.262 | % | ||
Broker non-votes | 5,324,581.000 | |||
4. (a) To revise provisions of each Trust’s Agreement and Declaration of Trust related to documenting the transfer of shares.
A quorum of the shares outstanding of each Trust was present, and the votes passed with a majority of those shares. The results were as follows:
| Voyageur Insured Funds | ||||
Shares voted for | 2,875,426.234 | |||
Percentage of outstanding shares | 38.086 | % | ||
Percentage of shares voted | 79.955 | % | ||
Shares voted against | 66,752.981 | |||
Percentage of outstanding shares | 0.884 | % | ||
Percentage of shares voted | 1.856 | % | ||
Shares abstained | 160,054.842 | |||
Percentage of outstanding shares | 2.120 | % | ||
Percentage of shares voted | 4.451 | % | ||
Broker non-votes | 494,087.000 | |||
159
Table of Contents
Other Fund information (Unaudited)
Delaware Investments® state tax-free funds
Proxy Results (continued)
| Voyageur Mutual Funds | ||||
Shares voted for | 53,350,588.915 | |||
Percentage of outstanding shares | 44.960 | % | ||
Percentage of shares voted | 67.889 | % | ||
Shares voted against | 1,291,148.802 | |||
Percentage of outstanding shares | 1.088 | % | ||
Percentage of shares voted | 1.643 | % | ||
Shares abstained | 1,136,878.207 | |||
Percentage of outstanding shares | 0.958 | % | ||
Percentage of shares voted | 1.447 | % | ||
Broker non-votes | 22,806,373.000 | |||
| Voyageur Mutual Funds II | ||||
Shares voted for | 7,091,520.250 | |||
Percentage of outstanding shares | 40.513 | % | ||
Percentage of shares voted | 73.035 | % | ||
Shares voted against | 468,779.642 | |||
Percentage of outstanding shares | 2.678 | % | ||
Percentage of shares voted | 4.828 | % | ||
Shares abstained | 426,752.366 | |||
Percentage of outstanding shares | 2.438 | % | ||
Percentage of shares voted | 4.395 | % | ||
Broker non-votes | 1,722,726.000 | |||
| Delaware Group State Tax-Free Income Trust | ||||
Shares voted for | 29,564,131.277 | |||
Percentage of outstanding shares | 49.473 | % | ||
Percentage of shares voted | 79.730 | % | ||
Shares voted against | 943,197.196 | |||
Percentage of outstanding shares | 1.578 | % | ||
Percentage of shares voted | 2.544 | % | ||
Shares abstained | 1,248,550.487 | |||
Percentage of outstanding shares | 2.089 | % | ||
Percentage of shares voted | 3.367 | % | ||
Broker non-votes | 5,324,579.000 | |||
160
Table of Contents
4. (b) To revise provisions of each Trust’s Agreement and Declaration of Trust related to shareholder disclosure of certain information upon board demand.
A quorum of the shares outstanding of each Trust was present, and the votes passed with a majority of those shares. The results were as follows:
Voyageur Insured Funds
| ||||
Shares voted for | 2,853,777.218 | |||
Percentage of outstanding shares | 37.799 | % | ||
Percentage of shares voted | 79.353 | % | ||
Shares voted against | 94,499.120 | |||
Percentage of outstanding shares | 1.252 | % | ||
Percentage of shares voted | 2.628 | % | ||
Shares abstained | 153,957.719 | |||
Percentage of outstanding shares | 2.039 | % | ||
Percentage of shares voted | 4.281 | % | ||
Broker non-votes | 494,087.000 | |||
Voyageur Mutual Funds
| ||||
Shares voted for | 53,435,861.658 | |||
Percentage of outstanding shares | 45.031 | % | ||
Percentage of shares voted | 67.998 | % | ||
Shares voted against | 1,312,655.329 | |||
Percentage of outstanding shares | 1.106 | % | ||
Percentage of shares voted | 1.670 | % | ||
Shares abstained | 1,030,092.937 | |||
Percentage of outstanding shares | 0.868 | % | ||
Percentage of shares voted | 1.311 | % | ||
Broker non-votes | 22,806,379.000 | �� | ||
Voyageur Mutual Funds II
| ||||
Shares voted for | 6,974,219.210 | |||
Percentage of outstanding shares | 39.843 | % | ||
Percentage of shares voted | 71.827 | % | ||
Shares voted against | 490,891.643 | |||
Percentage of outstanding shares | 2.804 | % | ||
Percentage of shares voted | 5.056 | % | ||
Shares abstained | 521,939.405 | |||
Percentage of outstanding shares | 2.982 | % | ||
Percentage of shares voted | 5.375 | % | ||
Broker non-votes | 1,722,728.000 |
161
Table of Contents
Other Fund information (Unaudited)
Delaware Investments® state tax-free funds
Proxy Results (continued)
Delaware Group State Tax-Free Income Trust
| ||||
Shares voted for | 29,314,582.506 | |||
Percentage of outstanding shares | 49.055 | % | ||
Percentage of shares voted | 79.057 | % | ||
Shares voted against | 1,085,875.381 | |||
Percentage of outstanding shares | 1.817 | % | ||
Percentage of shares voted | 2.928 | % | ||
Shares abstained | 1,355,421.073 | |||
Percentage of outstanding shares | 2.268 | % | ||
Percentage of shares voted | 3.655 | % | ||
Broker non-votes | 5,324,579.000 |
4. (c) To revise provisions of each Trust’s By-Laws so that Delaware law will apply to matters related to proxies.
A quorum of the shares outstanding of each Trust was present, and the votes passed with a majority of those shares. The results were as follows:
Voyageur Insured Funds
| ||||
Shares voted for | 2,893,005.204 | |||
Percentage of outstanding shares | 38.319 | % | ||
Percentage of shares voted | 80.443 | % | ||
Shares voted against | 66,618.326 | |||
Percentage of outstanding shares | 0.882 | % | ||
Percentage of shares voted | 1.852 | % | ||
Shares abstained | 142,614.527 | |||
Percentage of outstanding shares | 1.889 | % | ||
Percentage of shares voted | 3.966 | % | ||
Broker non-votes | 494,083.000 | |||
Voyageur Mutual Funds
| ||||
Shares voted for | 54,268,750.116 | |||
Percentage of outstanding shares | 45.733 | % | ||
Percentage of shares voted | 69.057 | % | ||
Shares voted against | 486,387.431 | |||
Percentage of outstanding shares | 0.410 | % | ||
Percentage of shares voted | 0.619 | % | ||
Shares abstained | 1,023,482.377 | |||
Percentage of outstanding shares | 0.863 | % | ||
Percentage of shares voted | 1.302 | % | ||
Broker non-votes | 22,806,369.000 |
162
Table of Contents
Voyageur Mutual Funds II
| ||||
Shares voted for | 7,346,106.500 | |||
Percentage of outstanding shares | 41.968 | % | ||
Percentage of shares voted | 75.657 | % | ||
Shares voted against | 214,673.913 | |||
Percentage of outstanding shares | 1.226 | % | ||
Percentage of shares voted | 2.211 | % | ||
Shares abstained | 426,271.845 | |||
Percentage of outstanding shares | 2.435 | % | ||
Percentage of shares voted | 4.390 | % | ||
Broker non-votes | 1,722,726.000 | |||
Delaware Group State Tax-Free Income Trust
| ||||
Shares voted for | 29,867,449.976 | |||
Percentage of outstanding shares | 49.981 | % | ||
Percentage of shares voted | 80.548 | % | ||
Shares voted against | 844,476.868 | |||
Percentage of outstanding shares | 1.413 | % | ||
Percentage of shares voted | 2.277 | % | ||
Shares abstained | 1,043,954.116 | |||
Percentage of outstanding shares | 1.747 | % | ||
Percentage of shares voted | 2.815 | % | ||
Broker non-votes | 5,324,577.000 |
163
Table of Contents
Other Fund information (Unaudited)
Delaware Investments® state tax-free funds
Board consideration of Delaware Tax-Free Arizona Fund, Delaware Tax-Free California Fund, Delaware Tax-Free Colorado Fund, Delaware Tax-Free Idaho Fund, Delaware Tax-Free New York Fund, and Delaware Tax-Free Pennsylvania Fund Investment Management Agreements
At a meeting held on Aug. 18-20, 2015 (the “Annual Meeting”), the Boards of Trustees (collectively referred to here as the “Board”), including a majority of disinterested or independent Trustees, approved the renewal of the Investment Advisory Agreements for Delaware Tax-Free Arizona Fund, Delaware Tax-Free California Fund, Delaware Tax-Free Colorado Fund, Delaware Tax-Free Idaho Fund, Delaware Tax-Free New York Fund, and Delaware Tax-Free Pennsylvania Fund (each, a “Fund” and together, the “Funds”). In making its decision, the Board considered information furnished at regular quarterly Board meetings, including reports detailing Fund performance, investment strategies and expenses, as well as information prepared specifically in connection with the renewal of the investment advisory and sub-advisory contracts. Information furnished specifically in connection with the renewal of the Investment Management Agreements with Delaware Management Company (“DMC”) included materials provided by DMC and its affiliates (“Delaware Investments”) concerning, among other things, the nature, extent, and quality of services provided to the Funds; the costs of such services to the Funds; economies of scale; and the investment manager’s financial condition and profitability. In addition, in connection with the Annual Meeting, reports were provided to the Trustees in May 2015 and included reports provided by Lipper, Inc., an independent statistical compilation organization (“Lipper”). The Lipper reports compared each Fund’s investment performance and expenses with those of other comparable mutual funds. The Independent Trustees reviewed and discussed the Lipper reports with independent legal counsel to the Independent Trustees. In addition to the information noted above, the Board also requested and received information regarding DMC’s policy with respect to advisory fee levels and its breakpoint philosophy; the structure of portfolio manager compensation; comparative client fee information; and any constraints or limitations on the availability of securities for certain investment styles, which had in the past year inhibited, or which were likely in the future to inhibit, the investment manager’s ability to invest fully in accordance with Fund policies.
In considering information relating to the approval of each Fund’s advisory agreement, the Independent Trustees received assistance and advice from and met separately with independent legal counsel to the Independent Trustees. They also engaged a consultant to assist them in analyzing portions of the data presented and received. The Independent Trustees reviewed and discussed with such consultant two reports prepared by the consultant with respect to such data. Although the Board gave attention to all information furnished, the following discussion identifies, under separate headings, the primary factors taken into account by the Board during its contract renewal considerations.
Nature, Extent, and Quality of Service. The Board considered the services provided by DMC to each Fund and its shareholders. In reviewing the nature, extent, and quality of services, the Board considered reports furnished to it throughout the year, which covered matters such as the relative performance of the Funds; compliance of portfolio managers with the investment policies, strategies, and restrictions for the Funds; compliance by DMC and Delaware Distributors, L.P. (together, “Management”) personnel with the Code of Ethics adopted throughout the Delaware Investments Family of Funds complex; and adherence to fair value pricing procedures as established by the Board. The Board was pleased with the current staffing of the Funds’ investment advisor and the emphasis placed on research in the investment process. The Board recognized DMC’s receipt of several industry distinctions during the past several
164
Table of Contents
years. The Board gave favorable consideration to DMC’s efforts to control expenditures while maintaining service levels committed to fund matters. The Board noted that, in the third and fourth quarters of 2013, Management reduced the maximum 12b-1 fee for certain funds, and in November 2013 Management negotiated a substantial reduction in fees for fund accounting services provided to the Funds. The Board noted the benefits provided to Fund shareholders through each shareholder’s ability to exchange an investment in one Delaware Investments fund for the same class of shares in another Delaware Investments fund without a sales charge, to reinvest Fund dividends into additional shares of the Fund or into additional shares of other Delaware Investments funds, and the privilege to combine holdings in other Delaware Investments funds to obtain a reduced sales charge. The Board was satisfied with the nature, extent, and quality of the overall services provided by DMC.
Investment Performance. The Board placed significant emphasis on the investment performance of the Funds in view of the importance of investment performance to shareholders. Although the Board gave appropriate consideration to performance reports and discussions with portfolio managers at Investment Committee meetings throughout the year, the Board gave particular weight to the Lipper reports furnished for the Annual Meeting. The Lipper reports prepared for each Fund showed the investment performance of its Class A shares in comparison to a group of similar funds as selected by Lipper (the “Performance Universe”). A fund with the best performance ranked first, and a fund with the poorest performance ranked last. The highest/best performing 25% of funds in the Performance Universe make up the first quartile; the next 25%, the second quartile; the next 25%, the third quartile; and the poorest/ worst performing 25% of funds in the Performance Universe make up the fourth quartile. Comparative annualized performance for each Fund was shown for the past 1-, 3-, 5-, and 10-year periods, to the extent applicable, ended March 31, 2015. The Board’s objective is that each Fund’s performance for the periods considered be at or above the median of its Performance Universe.
Delaware Tax-Free Arizona Fund – The Performance Universe for the Fund consisted of the Fund and all retail and institutional “other states” municipal debt funds as selected by Lipper. The Lipper report comparison showed that the Fund’s total return for the 1-, 3-, and 10-year periods was in the first quartile of its Performance Universe. The report further showed that the Fund’s total return for the 5-year period was in the second quartile of its Performance Universe. The Board was satisfied with performance.
Delaware Tax-Free California Fund – The Performance Universe for the Fund consisted of the Fund and all retail and institutional California municipal debt funds as selected by Lipper. The Lipper report comparison showed that the Fund’s total return for the 1-, 3-, and 5-year periods was in the second quartile of its Performance Universe. The report further showed that the Fund’s total return for the 10-year period was in the first quartile of its Performance Universe. The Board was satisfied with performance.
Delaware Tax-Free Colorado Fund – The Performance Universe for the Fund consisted of the Fund and all retail and institutional “other states” municipal debt funds as selected by Lipper. The Lipper report comparison showed that the Fund’s total return for the 1-, 3-, 5-, and 10-year periods was in the first quartile of its Performance Universe. The Board was satisfied with performance.
Delaware Tax-Free Idaho Fund – The Performance Universe for the Fund consisted of the Fund and all retail and institutional other state municipal debt funds as selected by Lipper. The Lipper report
165
Table of Contents
Other Fund information (Unaudited)
Delaware Investments® state tax-free funds
Board consideration of Delaware Tax-Free Arizona Fund, Delaware Tax-Free California Fund, Delaware Tax-Free Colorado Fund, Delaware Tax-Free Idaho Fund, Delaware Tax-Free New York Fund, and Delaware Tax-Free Pennsylvania Fund Investment Management Agreements (continued)
comparison showed that the Fund’s total return for the 1- and 10-year periods was in the third quartile of its Performance Universe. The report further showed that the Fund’s total return for the 3- and 5-year periods was in the fourth quartile of its Performance Universe. The Board determined that the Fund’s performance results were not in line with the Board’s objective. In evaluating the Fund’s performance, the Board considered the numerous investment and performance reports delivered by Management personnel to the Board’s Investments Committee. The Board was satisfied that Management was taking effective action to improve Fund performance and to meet the Board’s performance objective.
Delaware Tax-Free New York Fund – The Performance Universe for the Fund consisted of the Fund and all retail and institutional New York municipal debt funds as selected by Lipper. The Lipper report comparison showed that the Fund’s total return for the 1-, 3-, 5-, and 10-year periods was in the first quartile of its Performance Universe. The Board was satisfied with performance.
Delaware Tax-Free Pennsylvania Fund – The Performance Universe for the Fund consisted of the Fund and all retail and institutional Pennsylvania municipal debt funds as selected by Lipper. The Lipper report comparison showed that the Fund’s total return for the 1- and 10-year periods was in the first quartile of its Performance Universe. The report further showed that the Fund’s total return for the 3- and 5-year periods was in the second quartile of its Performance Universe. The Board was satisfied with performance.
Comparative Expenses. The Board considered expense comparison data for the Delaware Investments Family of Funds. Management provided the Board with information on pricing levels and fee structures for each Fund as of its most recently completed fiscal year. The Board also focused on the comparative analysis of effective management fees and total expense ratios of each Fund versus effective management fees and expense ratios of a group of similar funds as selected by Lipper (the “Expense Group”). In reviewing comparative costs, each Fund’s contractual management fee and the actual management fee incurred by the Fund were compared with the contractual management fees (assuming all funds in the Expense Group were similar in size to the Fund) and actual management fees (as reported by each fund) within the Expense Group, taking into account any applicable breakpoints and fee waivers. Each Fund’s total expenses were also compared with those of its Expense Group. The Lipper total expenses, for comparative consistency, were shown by Lipper for Class A shares and comparative total expenses including 12b-1 and non 12b-1 service fees. The Board considered fees paid to DMC for non-management services. The Board’s objective is to limit each Fund’s total expense ratio to be competitive with that of the Expense Group.
Delaware Tax-Free Arizona Fund – The expense comparisons for the Fund showed that its actual management fee was in the quartile with the second lowest expenses of its Expense Group and its total expenses were in the quartile with the second highest expenses of its Expense Group. The Board gave favorable consideration to the Fund’s management fee, but noted that the Fund’s total expenses were not in line with the Board’s objective. In evaluating the total expenses, the Board considered fee waivers in place through Dec. 29, 2015 and various initiatives implemented by Management, such as the
166
Table of Contents
negotiation of lower fees for fund accounting services, which had created an opportunity for a further reduction in expenses. The Board was satisfied with Management’s efforts to improve the Fund’s total expense ratio and to bring it in line with the Board’s objective.
Delaware Tax-Free California Fund – The expense comparisons for the Fund showed that its actual management fee was in the quartile with the lowest expenses of its Expense Group and its total expenses were in the quartile with the second lowest expenses of its Expense Group. The Board was satisfied with the management fee and total expenses of the Fund in comparison to those of its Expense Group as shown in the Lipper report.
Delaware Tax-Free Colorado Fund – The expense comparisons for the Fund showed that its actual management fee was in the quartile with the second lowest expenses of its Expense Group and its total expenses were in the quartile with the second highest expenses of its Expense Group. The Board noted that the Fund’s total expenses were not in line with the Board’s objective. In evaluating the total expenses, the Board considered fee waivers in place through Dec. 29, 2015 and various initiatives implemented by Management, such as the outsourcing of certain transfer agency services and a negotiation of lower fees for fund accounting services, which had created an opportunity for a further reduction in expenses. The Board was satisfied with Management’s efforts to improve the Fund’s total expense ratio and to bring it in line with the Board’s objective.
Delaware Tax-Free Idaho Fund – The expense comparisons for the Fund showed that its actual management fee was in the quartile with the second lowest expenses of its Expense Group and its total expenses were in the quartile with the second highest expenses of its Expense Group. The Board gave favorable consideration to the Fund’s management fee, but noted that the Fund’s total expenses were not in line with the Board’s objective. In evaluating the total expenses, the Board considered waivers in place through Dec. 29, 2015 and various initiatives implemented by Management, such as the negotiation of lower fees for fund accounting services, which had created an opportunity for a further reduction in expenses. The Board was satisfied with Management’s efforts to improve the Fund’s total expense ratio and to bring it in line with the Board’s objective.
Delaware Tax-Free New York Fund – The expense comparisons for the Fund showed that its actual management fee was in the quartile with the lowest expenses of its Expense Group and its total expenses were in the quartile with the second highest expenses of its Expense Group. The Board gave favorable consideration to the Fund’s management fee, but noted that the Fund’s total expenses were not in line with the Board’s objective. In evaluating the total expenses, the Board considered fee waivers in place through December 2015 and various initiatives implemented by Management, such as the negotiation of lower fees for fund accounting services, which had created an opportunity for a further reduction in expenses. The Board was satisfied with Management’s efforts to improve the Fund’s total expense ratio and to bring it in line with the Board’s objective.
Delaware Tax-Free Pennsylvania Fund – The expense comparisons for the Fund showed that its actual management fee and total expenses were in the quartile with the second highest expenses of its Expense Group. The Board noted that the Fund’s total expenses were not in line with the Board’s objective. In evaluating total expenses, the Board considered fee waivers in place through Dec. 29, 2015 and various initiatives implemented by Management, such as the outsourcing of certain transfer agency services and a negotiation of lower fees for fund accounting services, which had created an opportunity
167
Table of Contents
Other Fund information (Unaudited)
Delaware Investments® state tax-free funds
Board consideration of Delaware Tax-Free Arizona Fund, Delaware Tax-Free California Fund, Delaware Tax-Free Colorado Fund, Delaware Tax-Free Idaho Fund, Delaware Tax-Free New York Fund, and Delaware Tax-Free Pennsylvania Fund Investment Management Agreements (continued)
for a further reduction in expenses. The Board was satisfied with Management’s efforts to improve the Fund’s total expense ratio and to bring it in line with the Board’s objective.
Management Profitability. The Board considered the level of profits realized by DMC in connection with the operation of the Funds. In this respect, the Board reviewed the Investment Management Profitability Analysis that addressed the overall profitability of DMC’s business in providing management and other services to each of the individual funds and the Delaware Investments Family of Funds as a whole. Specific attention was given to the methodology followed in allocating costs for the purpose of determining profitability. Management stated that the level of profits of DMC, to a certain extent, reflects recent operational cost savings and efficiencies initiated by DMC. The Board considered DMC’s efforts to improve services provided to fund shareholders and to meet additional regulatory and compliance requirements resulting from recent industry-wide Securities and Exchange Commission initiatives. The Board also considered the extent to which DMC might derive ancillary benefits from fund operations, including the potential for procuring additional business as a result of the prestige and visibility associated with its role as service provider to the Delaware Investments Family of Funds and the benefits from allocation of fund brokerage to improve trading efficiencies. The Board found that the management fees were reasonable in light of the services rendered and the level of profitability of DMC.
Economies of Scale. The Trustees considered whether economies of scale are realized by DMC as each Fund’s assets increase and the extent to which any economies of scale are reflected in the level of management fees charged. The Trustees reviewed the standardized advisory fee pricing and structure, approved by the Board and shareholders, which includes breakpoints, and which applies to most funds in the Delaware Investments Family of Funds complex. Breakpoints in the advisory fee occur when the advisory fee rate is reduced on assets in excess of specified levels. Breakpoints result in a lower advisory fee, than would otherwise be the case in the absence of breakpoints, when the asset levels specified in the breakpoints are exceeded. The Board noted that the fee under each Fund’s management contract fell within the standard structure. Although the Funds have not reached a size at which they can take advantage of breakpoints, the Board recognized that each Fund’s fee was structured so that when the Fund grows, economies of scale may be shared.
168
Table of Contents
This page intentionally left blank.
Table of Contents
Board of trustees / directors and officers addendum
Delaware Investments® Family of Funds
A mutual fund is governed by a Board of Trustees/Directors (“Trustees”), which has oversight responsibility for the management of a fund’s business affairs. Trustees establish procedures and oversee and review the performance of the investment manager, the distributor, and others who perform services for the fund. The independent fund trustees, in particular, are advocates
Name, Address, and Birth Date | Position(s) Held with Fund(s) | Length of Time Served | ||||
Interested Trustee
| ||||||
Shawn K. Lytle1 | President, | Trustee since | ||||
| 2005 Market Street | Chief Executive Officer, | September 1, 2015 | ||||
| Philadelphia, PA 19103 | and Trustee | |||||
| February 1970 | President and | |||||
| Chief Executive Officer | ||||||
since August 20, 2015
| ||||||
Independent Trustees
| ||||||
Thomas L. Bennett | Chairman and Trustee | Trustee since | ||||
| 2005 Market Street | March 2005 | |||||
| Philadelphia, PA 19103 | ||||||
| October 1947 | Chairman since | |||||
March 1, 2015
| ||||||
| Ann D. Borowiec | Trustee | Since March 31, 2015 | ||||
| 2005 Market Street | ||||||
| Philadelphia, PA 19103 | ||||||
November 1958
| ||||||
| Joseph W. Chow | Trustee | Since January 2013 | ||||
| 2005 Market Street | ||||||
| Philadelphia, PA 19103 | ||||||
January 1953
|
| 1 | Shawn K. Lytle is considered to be an “Interested Trustee” because he is an executive officer of the Fund’s(s’) investment advisor. |
170
Table of Contents
for shareholder interests. Each trustee has served in that capacity since he or she was elected to or appointed to the Board of Trustees, and will continue to serve until his or her retirement or the election of a new trustee in his or her place. The following is a list of the Trustees and Officers with certain background and related information.
| Number of Portfolios in | ||||||
| Principal Occupation(s) | Fund Complex Overseen | Other Directorships | ||||
| During the Past Five Years | by Trustee or Officer | Held by Trustee or Officer | ||||
Shawn K. Lytle has served as | 64 | Trustee — UBS | ||||
| President of | Relationship Funds, | |||||
| Delaware Investments2 | SMA Relationship | |||||
| since June 2015 and was the | Trust, and UBS Funds | |||||
| Regional Head of Americas for | (May 2010–April 2015) | |||||
| UBS Global Asset | ||||||
| Management from | ||||||
| 2010 through 2015. | ||||||
Private Investor | 64 | Director — | ||||
| (March 2004–Present) | Bryn Mawr Bank Corp. (BMTC) | |||||
(2007–2011)
| ||||||
| Chief Executive Officer | 64 | None | ||||
| Private Wealth Management | ||||||
| (2011–2013) and | ||||||
| Market Manager, | ||||||
| New Jersey Private | ||||||
| Bank (2005–2011) – | ||||||
J.P. Morgan Chase & Co.
| ||||||
| Executive Vice President | 64 | Director and Audit Committee | ||||
| (Emerging Economies | Member — Hercules | |||||
| Strategies, Risks, and | Technology Growth | |||||
| Corporate Administration) | Capital, Inc. | |||||
| State Street Corporation | (2004–2014) | |||||
(July 2004–March 2011)
|
| 2 | Delaware Investments is the marketing name for Delaware Management Holdings, Inc. and its subsidiaries, including the Fund’s(s’) investment advisor, principal underwriter, and its transfer agent. |
171
Table of Contents
Board of trustees / directors and officers addendum
Delaware Investments® Family of Funds
| Name, Address, | Position(s) | Length of | ||||
| and Birth Date | Held with Fund(s) | Time Served | ||||
Independent Trustees (continued)
| ||||||
John A. Fry | Trustee | Since January 2001 | ||||
| 2005 Market Street | ||||||
| Philadelphia, PA 19103 | ||||||
May 1960
| ||||||
| Lucinda S. Landreth | Trustee | Since March 2005 | ||||
| 2005 Market Street | ||||||
| Philadelphia, PA 19103 | ||||||
June 1947
| ||||||
| Frances A. Sevilla-Sacasa | Trustee | Since September 2011 | ||||
| 2005 Market Street | ||||||
| Philadelphia, PA 19103 | ||||||
January 1956
| ||||||
172
Table of Contents
| Number of Portfolios in | ||||||
| Principal Occupation(s) | Fund Complex Overseen | Other Directorships | ||||
| During the Past Five Years | by Trustee or Officer | Held by Trustee or Officer | ||||
President — |
64 |
Director — Hershey Trust | ||||
| Drexel University | Company | |||||
| (August 2010–Present) | ||||||
| Director, Audit Committee, | ||||||
| President — | and Governance Committee | |||||
| Franklin & Marshall College | Member — Community | |||||
| (July 2002–July 2010) | Health Systems | |||||
Director — Drexel | ||||||
Morgan & Co.
| ||||||
Private Investor |
64 |
None | ||||
(2004–Present)
| ||||||
Chief Executive Officer — |
64 |
Trust Manager and | ||||
| Banco Itaú | Audit Committee | |||||
| International | Member — Camden | |||||
| (April 2012–Present) | Property Trust | |||||
Executive Advisor to Dean | ||||||
(August 2011–March 2012) and Interim Dean | ||||||
| (January 2011–July 2011) — | ||||||
| University of Miami School of | ||||||
| Business Administration | ||||||
President — U.S. Trust, | ||||||
| Bank of America Private | ||||||
| Wealth Management | ||||||
| (Private Banking) | ||||||
(July 2007–December 2008)
|
173
Table of Contents
Board of trustees / directors and officers addendum
Delaware Investments® Family of Funds
| Name, Address, | Position(s) | Length of | ||||
| and Birth Date | Held with Fund(s) | Time Served | ||||
Independent Trustees (continued)
| ||||||
Thomas K. Whitford |
Trustee |
Since January 2013 | ||||
| 2005 Market Street | ||||||
| Philadelphia, PA 19103 | ||||||
March 1956
| ||||||
Janet L. Yeomans |
Trustee |
Since April 1999 | ||||
| 2005 Market Street | ||||||
| Philadelphia, PA 19103 | ||||||
July 1948
| ||||||
174
Table of Contents
| Number of Portfolios in | ||||||
| Principal Occupation(s) | Fund Complex Overseen | Other Directorships | ||||
| During the Past Five Years | by Trustee or Officer | Held by Trustee or Officer | ||||
Vice Chairman |
64 |
Director — HSBC Finance | ||||
| (2010–April 2013), | Corporation and HSBC | |||||
| Chief Administrative | North America Holdings Inc. | |||||
Officer (2008–2010), and Executive Vice | Director — | |||||
| President and Chief | HSBC Bank | |||||
| Administrative Officer | ||||||
| (2007–2009) — | ||||||
| PNC Financial | ||||||
Services Group
| ||||||
Vice President and Treasurer |
64 |
Director, Audit and | ||||
| (January 2006–July 2012) | Compliance Committee Chair, | |||||
| Vice President — | Investment Committee | |||||
| Mergers & Acquisitions | Member, and Governance | |||||
| (January 2003–January 2006), | Committee Member — | |||||
| and Vice President | Okabena Company | |||||
| and Treasurer | ||||||
| (July 1995–January 2003) | Chair — 3M | |||||
| 3M Corporation | Investment Management | |||||
| Company | ||||||
(2005–2012)
|
175
Table of Contents
Board of trustees / directors and officers addendum
Delaware Investments® Family of Funds
| Name, Address, | Position(s) | Length of | ||||
| and Birth Date | Held with Fund(s) | Time Served | ||||
Officers
| ||||||
David F. Connor |
Senior Vice President, |
Senior Vice President | ||||
| 2005 Market Street | General Counsel, | since May 2013; | ||||
| Philadelphia, PA 19103 | and Secretary | General Counsel | ||||
| December 1963 | since May 2015; | |||||
| Secretary since | ||||||
October 2005
| ||||||
Daniel V. Geatens |
Vice President |
Treasurer since October 2007 | ||||
| 2005 Market Street | and Treasurer | |||||
| Philadelphia, PA 19103 | ||||||
October 1972
| ||||||
| Richard Salus | Senior Vice President | Chief Financial Officer | ||||
| 2005 Market Street | and Chief Financial Officer | since November 2006 | ||||
| Philadelphia, PA 19103 | ||||||
October 1963
|
The Statement of Additional Information for the Fund(s) includes additional information about the Trustees and Officers and is available, without charge, upon request by calling 800 523-1918.
176
Table of Contents
| Number of Portfolios in | ||||||
| Principal Occupation(s) | Fund Complex Overseen | Other Directorships | ||||
| During the Past Five Years | by Trustee or Officer | Held by Trustee or Officer | ||||
David F. Connor has served as Senior Vice President of the Fund(s) and the investment advisor since 2013, General Counsel of the Fund(s) and the investment advisor since 2015, and Secretary of the Fund(s) and the investment advisor since 2005.
|
64 |
None3 | ||||
Daniel V. Geatens has served as Vice President and Treasurer of the Fund(s) since 2007 and Vice President and Director of Financial Administration of the investment advisor since 2010.
|
64 |
None3 | ||||
Richard Salus has served as Senior Vice President and Chief Financial Officer of the Fund(s) and the investment advisor since 2006.
|
64 |
None3 |
| 3 | David F. Connor, Daniel V. Geatens, and Richard Salus serve in similar capacities for the six portfolios of the Optimum Fund Trust, which have the same investment advisor, principal underwriter, and transfer agent as the registrant. |
177
Table of Contents
Board of trustees
Shawn K. Lytle President and Chief Executive Officer Delaware Investments® Family of Funds Philadelphia, PA
Thomas L. Bennett Chairman of the Board Delaware Investments Family of Funds Private Investor Rosemont, PA | Ann D. Borowiec Former Chief Executive Officer Private Wealth Management J.P. Morgan Chase & Co. New York, NY
Joseph W. Chow Former Executive Vice President State Street Corporation Brookline, MA | John A. Fry President Drexel University Philadelphia, PA
Lucinda S. Landreth Former Chief Investment Officer Assurant, Inc. New York, NY | Frances A. Sevilla-Sacasa Chief Executive Officer Banco Itaú International Miami, FL
Thomas K. Whitford Former Vice Chairman PNC Financial Services Group Pittsburgh, PA
Janet L. Yeomans Former Vice President and Treasurer 3M Corporation St. Paul, MN | |||
Affiliated officers
| David F. Connor | Daniel V. Geatens | Richard Salus | ||||
| Senior Vice President, | Vice President and | Senior Vice President and | ||||
| General Counsel, | Treasurer | Chief Financial Officer | ||||
| and Secretary | Delaware Investments | Delaware Investments | ||||
| Delaware Investments | Family of Funds | Family of Funds | ||||
| Family of Funds | Philadelphia, PA | Philadelphia, PA | ||||
| Philadelphia, PA |
This annual report is for the information of Delaware Tax-Free Arizona Fund, Delaware Tax-Free California Fund, Delaware Tax-Free Colorado Fund, Delaware Tax-Free Idaho Fund, Delaware Tax-Free New York Fund, and Delaware Tax-Free Pennsylvania Fund shareholders, but it may be used with prospective investors when preceded or accompanied by the Delaware Investments Fund fact sheet for the most recently completed calendar quarter. These documents are available at delawareinvestments.com.
Delaware Investments is the marketing name of Delaware Management Holdings, Inc. and its subsidiaries.
Each Fund files its complete schedule of portfolio holdings with the Securities and Exchange Commission (SEC) for the first and third quarters of each fiscal year on Form N-Q. Each Fund’s Forms N-Q, as well as a description of the policies and procedures that each Fund uses to determine how to vote proxies (if any) relating to portfolio securities are available without charge (i) upon request, by calling 800 523-1918; and (ii) on the SEC’s website at sec.gov. In addition, a description of the policies and procedures that each Fund uses to determine how to vote proxies (if any) relating to portfolio securities and the Schedules of Investments included in the Funds’ most recent Forms N-Q are available without charge on the Funds’ website at delawareinvestments.com. Each Fund’s Forms N-Q may be reviewed and copied at the SEC’s Public Reference Room in Washington, D.C.; information on the operation of the Public Reference Room may be obtained by calling 800 SEC-0330.
Information (if any) regarding how the Funds voted proxies relating to portfolio securities during the most recently disclosed 12-month period ended June 30 is available without charge (i) through the Funds’ website at delawareinvestments.com; and (ii) on the SEC’s website at sec.gov.
178
Item 2. Code of Ethics
The registrant has adopted a code of ethics that applies to the registrant’s principal executive officer, principal financial officer, principal accounting officer or controller, or persons performing similar functions, regardless of whether these individuals are employed by the registrant or a third party. A copy of the registrant’s Code of Business Ethics has been posted on the Delaware Investments Internet Web site at www.delawareinvestments.com. Any amendments to the Code of Business Ethics, and information on any waiver from its provisions granted by the registrant, will also be posted on this Web site within five business days of such amendment or waiver and will remain on the Web site for at least 12 months.
Item 3. Audit Committee Financial Expert
The registrant’s Board of Trustees/Directors has determined that certain members of the registrant’s Audit Committee are audit committee financial experts, as defined below. For purposes of this item, an “audit committee financial expert” is a person who has the following attributes:
a. An understanding of generally accepted accounting principles and financial statements;
b. The ability to assess the general application of such principles in connection with the accounting for estimates, accruals, and reserves;
c. Experience preparing, auditing, analyzing, or evaluating financial statements that present a breadth and level of complexity of accounting issues that are generally comparable to the breadth and complexity of issues that can reasonably be expected to be raised by the registrant’s financial statements, or experience actively supervising one or more persons engaged in such activities;
d. An understanding of internal controls and procedures for financial reporting; and
e. An understanding of audit committee functions.
An “audit committee financial expert” shall have acquired such attributes through:
a. Education and experience as a principal financial officer, principal accounting officer, controller, public accountant, or auditor or experience in one or more positions that involve the performance of similar functions;
b. Experience actively supervising a principal financial officer, principal accounting officer, controller, public accountant, auditor, or person performing similar functions;
c. Experience overseeing or assessing the performance of companies or public accountants with respect to the preparation, auditing, or evaluation of financial statements; or
d. Other relevant experience.
The registrant’s Board of Trustees/Directors has also determined that each member of the registrant’s Audit Committee is independent. In order to be “independent” for purposes of this item, the Audit Committee member may not: (i) other than in his or her capacity as a member of the Board of Trustees/Directors or any committee thereof, accept directly or indirectly any consulting, advisory or other compensatory fee from the issuer; or (ii) be an “interested person” of the registrant as defined in Section 2(a)(19) of the Investment Company Act of 1940.
The names of the audit committee financial experts on the registrant’s Audit Committee are set forth below:
Ann D. Borowiec
Joseph W. Chow
Lucinda S. Landreth1
Frances A. Sevilla-Sacasa
Item 4. Principal Accountant Fees and Services
(a) Audit fees.
The aggregate fees billed for services provided to the registrant by its independent auditors for the audit of the registrant’s annual financial statements and for services normally provided by the independent auditors in connection with statutory and regulatory filings or engagements were $185,660 for the fiscal year ended August 31, 2015.
The aggregate fees billed for services provided to the registrant by its independent auditors for the audit of the registrant’s annual financial statements and for services normally provided by the independent auditors in connection with statutory and regulatory filings or engagements were $171,080 for the fiscal year ended August 31, 2014.
(b) Audit-related fees.
The aggregate fees billed by the registrant’s independent auditors for services relating to the performance of the audit of the registrant’s financial statements and not reported under paragraph (a) of this Item were $0 for the fiscal year ended August 31, 2015.
The aggregate fees billed by the registrant’s independent auditors for services relating to the performance of the audit of the financial statements of the registrant’s investment adviser and other service providers under common control with the adviser and that relate directly to the operations or financial reporting of the registrant were $612,000 for the registrant’s fiscal year ended August 31, 2015. The percentage of these fees relating to services approved by the registrant’s Audit Committee pursuant to the de minimis exception from the pre-approval requirement in Rule 2-01(c)(7)(i)(C) of Regulation S-X was 0%. These audit-related services were as follows: year end audit procedures, group reporting and subsidiary statutory audits.
The aggregate fees billed by the registrant’s independent auditors for services relating to the performance of the audit of the registrant’s financial statements and not reported under paragraph (a) of this Item were $0 for the fiscal year ended August 31, 2014.
1 The instructions to Form N-CSR require disclosure on the relevant experience of persons who qualify as audit committee financial experts based on “other relevant experience.” The Board of Trustees/Directors has determined that Ms. Landreth qualifies as an audit committee financial expert by virtue of her experience as a financial analyst, her Chartered Financial Analyst (CFA) designation and her service as an audit committee chairperson for a non-profit organization.
The aggregate fees billed by the registrant’s independent auditors for services relating to the performance of the audit of the financial statements of the registrant’s investment adviser and other service providers under common control with the adviser and that relate directly to the operations or financial reporting of the registrant were $618,000 for the registrant’s fiscal year ended August 31, 2014. The percentage of these fees relating to services approved by the registrant’s Audit Committee pursuant to the de minimis exception from the pre-approval requirement in Rule 2-01(c)(7)(i)(C) of Regulation S-X was 0%. These audit-related services were as follows: year end audit procedures, group reporting and subsidiary statutory audits.
(c) Tax fees.
The aggregate fees billed by the registrant’s independent auditors for tax-related services provided to the registrant were $22,920 for the fiscal year ended August 31, 2015. The percentage of these fees relating to services approved by the registrant’s Audit Committee pursuant to the de minimis exception from the pre-approval requirement in Rule 2-01(c)(7)(i)(C) of Regulation S-X was 0%. These tax-related services were as follows: review of income tax returns and review of annual excise distribution calculations.
The aggregate fees billed by the registrant’s independent auditors for tax-related services provided to the registrant’s investment adviser and other service providers under common control with the adviser and that relate directly to the operations or financial reporting of the registrant were $0 for the registrant’s fiscal year ended August 31, 2015. The percentage of these fees relating to services approved by the registrant’s Audit Committee pursuant to the de minimis exception from the pre-approval requirement in Rule 2-01(c)(7)(i)(C) of Regulation S-X was 0%.
The aggregate fees billed by the registrant’s independent auditors for tax-related services provided to the registrant were $20,600 for the fiscal year ended August 31, 2014. The percentage of these fees relating to services approved by the registrant’s Audit Committee pursuant to the de minimis exception from the pre-approval requirement in Rule 2-01(c)(7)(i)(C) of Regulation S-X was 0%. These tax-related services were as follows: review of income tax returns and review of annual excise distribution calculations.
The aggregate fees billed by the registrant’s independent auditors for tax-related services provided to the registrant’s investment adviser and other service providers under common control with the adviser and that relate directly to the operations or financial reporting of the registrant were $0 for the registrant’s fiscal year ended August 31, 2014. The percentage of these fees relating to services approved by the registrant’s Audit Committee pursuant to the de minimis exception from the pre-approval requirement in Rule 2-01(c)(7)(i)(C) of Regulation S-X was 0%.
(d) All other fees.
The aggregate fees billed for all services provided by the independent auditors to the registrant other than those set forth in paragraphs (a), (b) and (c) of this Item were $0 for the fiscal year ended August 31, 2015.
The aggregate fees billed for all services other than those set forth in paragraphs (b) and (c) of this Item provided by the registrant’s independent auditors to the registrant’s adviser and other service providers under common control with the adviser and that relate directly to the operations or financial reporting of the registrant were $0 for the registrant’s fiscal year ended August 31, 2015. The percentage of these fees relating to services approved by the registrant’s Audit Committee pursuant to the de minimis exception from the pre-approval requirement in Rule 2-01(c)(7)(i)(C) of Regulation S-X was 0%.
The aggregate fees billed for all services provided by the independent auditors to the registrant other than those set forth in paragraphs (a), (b) and (c) of this Item were $0 for the fiscal year ended August 31, 2014.
The aggregate fees billed for all services other than those set forth in paragraphs (b) and (c) of this Item provided by the registrant’s independent auditors to the registrant’s adviser and other service providers under common control with the adviser and that relate directly to the operations or financial reporting of the registrant were $0 for the registrant’s fiscal year ended August 31, 2014. The percentage of these fees relating to services approved by the registrant’s Audit Committee pursuant to the de minimis exception from the pre-approval requirement in Rule 2-01(c)(7)(i)(C) of Regulation S-X was 0%.
(e) The registrant’s Audit Committee has established pre-approval policies and procedures as permitted by Rule 2-01(c)(7)(i)(B) of Regulation S-X (the “Pre-Approval Policy”) with respect to services provided by the registrant’s independent auditors. Pursuant to the Pre-Approval Policy, the Audit Committee has pre-approved the services set forth in the table below with respect to the registrant up to the specified fee limits. Certain fee limits are based on aggregate fees to the registrant and other registrants within the Delaware Investments Family of Funds.
| Service | Range of Fees |
| Audit Services | |
| Statutory audits or financial audits for new Funds | up to $40,000 per Fund |
Services associated with SEC registration statements (e.g., Form N-1A, Form N-14, etc.), periodic reports and other documents filed with the SEC or other documents issued in connection with securities offerings (e.g., comfort letters for closed-end Fund offerings, consents), and assistance in responding to SEC comment letters | up to $10,000 per Fund |
Consultations by Fund management as to the accounting or disclosure treatment of transactions or events and/or the actual or potential impact of final or proposed rules, standards or interpretations by the SEC, FASB, or other regulatory or standard-setting bodies (Note: Under SEC rules, some consultations may be considered “audit-related services” rather than “audit services”) | up to $25,000 in the aggregate |
Audit-Related Services | |
Consultations by Fund management as to the accounting or disclosure treatment of transactions or events and/or the actual or potential impact of final or proposed rules, standards or interpretations by the SEC, FASB, or other regulatory or standard-setting bodies (Note: Under SEC rules, some consultations may be considered “audit services” rather than “audit-related services”) | up to $25,000 in the aggregate |
Tax Services | |
U.S. federal, state and local and international tax planning and advice (e.g., consulting on statutory, regulatory or administrative developments, evaluation of Funds’ tax compliance function, etc.) | up to $25,000 in the aggregate |
U.S. federal, state and local tax compliance (e.g., excise distribution reviews, etc.) | up to $5,000 per Fund |
Review of federal, state, local and international income, franchise and other tax returns | up to $5,000 per Fund |
Under the Pre-Approval Policy, the Audit Committee has also pre-approved the services set forth in the table below with respect to the registrant’s investment adviser and other entities controlling, controlled by or under common control with the investment adviser that provide ongoing services to the registrant (the “Control Affiliates”) up to the specified fee limit. This fee limit is based on aggregate fees to the investment adviser and its Control Affiliates.
| Service | Range of Fees |
| Non-Audit Services | |
| Services associated with periodic reports and other documents filed with the SEC and assistance in responding to SEC comment letters | up to $10,000 in the aggregate |
The Pre-Approval Policy requires the registrant’s independent auditors to report to the Audit Committee at each of its regular meetings regarding all services initiated since the last such report was rendered, including those services authorized by the Pre-Approval Policy.
(f) Not applicable.
(g) The aggregate non-audit fees billed by the registrant’s independent auditors for services rendered to the registrant and to its investment adviser and other service providers under common control with the adviser were $7,530,526 and $8,090,937 for the registrant’s fiscal years ended August 31, 2015 and August 31, 2014, respectively.
(h) In connection with its selection of the independent auditors, the registrant’s Audit Committee has considered the independent auditors’ provision of non-audit services to the registrant’s investment adviser and other service providers under common control with the adviser that were not required to be pre-approved pursuant to Rule 2-01(c)(7)(ii) of Regulation S-X. The Audit Committee has determined that the independent auditors’ provision of these services is compatible with maintaining the auditors’ independence.
Item 5. Audit Committee of Listed Registrants
Not applicable.
Item 6. Investments
(a) Included as part of report to shareholders filed under Item 1 of this Form N-CSR.
(b) Divestment of securities in accordance with Section 13(c) of the Investment Company Act of 1940.
Not applicable.
Item 7. Disclosure of Proxy Voting Policies and Procedures for Closed-End Management Investment Companies
Not applicable.
Item 8. Portfolio Managers of Closed-End Management Investment Companies
Not applicable.
Item 9. Purchases of Equity Securities by Closed-End Management Investment Company and Affiliated Purchasers
Not applicable.
Item 10. Submission of Matters to a Vote of Security Holders
Not applicable.
Item 11. Controls and Procedures
The registrant’s principal executive officer and principal financial officer have evaluated the registrant’s disclosure controls and procedures within 90 days of the filing of this report and have concluded that they are effective in providing reasonable assurance that the information required to be disclosed by the registrant in its reports or statements filed under the Securities Exchange Act of 1934 is recorded, processed, summarized and reported within the time periods specified in the rules and forms of the Securities and Exchange Commission.
There were no significant changes in the registrant’s internal control over financial reporting that occurred during the second fiscal quarter of the period covered by the report to stockholders included herein (i.e., the registrant’s fourth fiscal quarter) that have materially affected, or are reasonably likely to materially affect, the registrant’s internal control over financial reporting.
Item 12. Exhibits
(a) (1) Code of Ethics
Not applicable.
(2) Certifications of Principal Executive Officer and Principal Financial Officer pursuant to Rule 30a-2 under the Investment Company Act of 1940 are attached hereto as Exhibit 99.CERT.
(3) Written solicitations to purchase securities pursuant to Rule 23c-1 under the Securities Exchange Act of 1934.
Not applicable.
(b) Certifications pursuant to Section 906 of the Sarbanes-Oxley Act of 2002 are furnished herewith as Exhibit 99.906CERT.
SIGNATURES
Pursuant to the requirements of the Securities Exchange Act of 1934 and the Investment Company Act of 1940, the registrant has duly caused this report to be signed on its behalf, by the undersigned, thereunto duly authorized.
Name of Registrant: VOYAGEUR MUTUAL FUNDS
| /s/ SHAWN LYTLE | |
| By: | Shawn Lytle |
| Title: | Chief Executive Officer |
| Date: | November 2, 2015 |
Pursuant to the requirements of the Securities Exchange Act of 1934 and the Investment Company Act of 1940, this report has been signed below by the following persons on behalf of the registrant and in the capacities and on the dates indicated.
| /s/ SHAWN LYTLE | |
| By: | Shawn Lytle |
| Title: | Chief Executive Officer |
| Date: | November 2, 2015 |
| /s/ RICHARD SALUS | |
| By: | Richard Salus |
| Title: | Chief Financial Officer |
| Date: | November 2, 2015 |