The five largest detractors were SK Telecom Company, Limited ADR (telecom, South Korea), Gold Fields Limited ADR (gold mining, South Africa), Cintas Corporation (uniform rentals, U.S.), Microsoft Corporation (software, U.S.) and Wendel (holding company, France). Their combined negative performance over the six month period subtracted 1.33% points from the Fund’s performance.
In most of these instances, prices declined in the absence of changes in our estimates of business value. In some cases, the Fund seized these opportunities to add to the positions at prices we deemed attractive.
As of April 30, 2008, our yen position remained unhedged against the U.S. dollar but our euro position was hedged 55% against the U.S. dollar. We were also 10% hedged on the Swiss franc and 100% hedged on the British pound.
First Eagle Overseas Fund
The NAV of the Fund’s Class A shares decreased 2.06% for the six month period while the MSCI EAFE Index declined 9.21%. The Fund’s cash position decreased from 12% at the beginning of the period to 6% on April 30, 2008.
Though global mergers and acquisitions declined in the period, we did benefit from some activity. Koninklijke Grolsch NV (Netherlands), Phoenixtec Power Company, Limited (Taiwan) and Hilti AG (Switzerland) were subject to offers that we viewed as adequate.
The five largest contributors to the performance of First Eagle Overseas Fund over the period were Shimano Inc. (bicycle parts, Japan), gold bullion (gold, U.S.), Industrias Peñoles, SAB de C.V. (mining, Mexico), Koninklijke Grolsch NV (beer, Netherlands) and Petroleo Brasileiro SA ADR (energy, Brazil) collectively accounting for 2.20% points of this period’s performance.
The five largest detractors were SK Telecom Company, Limited (telecom, South Korea), Gold Fields Limited ADR (gold mining, South Africa), Société BIC SA (office supplies, France), Guoco Group Limited (financial services, Hong Kong) and Laurent-Perrier (champagne, France). Their combined negative performance over the six month period subtracted 1.52% points from the Fund’s performance.
In most of these instances, prices declined in the absence of changes in our estimates of business value. In some cases, the Fund seized these opportunities to add to the positions at prices we deemed attractive.
As of April 30, 2008, our yen position remained unhedged against the U.S. dollar but our euro position was hedged 55% against the U.S. dollar. We were also 10% hedged on the Swiss franc and 100% hedged on the British pound.
First Eagle U.S. Value Fund
The NAV of the Fund’s Class A shares increased 0.13% for the six month period while the Standard & Poor’s 500 Index declined 9.64%. The Fund’s cash position decreased from 16% at the beginning of the period to 5% on April 30, 2008.
Though mergers and acquisitions declined in the period, we did benefit from some activity. Getty Images, Inc. (media) was subject to an offer that we viewed as adequate.
The five largest contributors to the performance of First Eagle U.S. Value Fund over the period were Apache Corporation (energy), Helmerich & Payne, Inc. (oil and gas drilling), Wal-Mart Stores, Inc. (retail), gold bullion (gold) and UniFirst Corporation (uniform rental), collectively accounting for 3.0% points of this period’s performance.
The five largest detractors were Sanofi-Aventis ADR (pharmaceutical), Cintas Corporation (uniform rental), Tronox Inc. (chemicals), Yankee Acquisition Corporation (retail) and Microsoft Corporation (software). Their combined negative performance over the six month period subtracted 2.26% points from the Fund’s performance.
In most of these instances, prices declined in the absence of changes in our estimates of business value. In some cases, the Fund seized these opportunities to add to the positions at prices we deemed attractive.
9
First Eagle Gold Fund
The NAV of the Fund’s Class A shares declined 5.44% for the six month period while the FTSE Gold Mines Index declined 12.63%. The Fund’s cash position decreased from 2.5% at the beginning of the period to 2.4% on April 30, 2008.
The five largest contributors to the performance of First Eagle Gold Fund over the period were gold bullion (U.S.), Randgold Resources Limited (South Africa), Industrias Peñoles, SAB de C.V. (Mexico), Metallica Resources Inc. (Canada) and Independence Group NL (Australia) collectively accounting for 4.77% points of this period’s performance.
The five largest detractors were Lihir Gold Limited (Australia), Gold Fields Limited ADR (South Africa), IAMGOLD Corporation (Canada), AngloGold Ashanti Limited ADR (South Africa) and Newcrest Mining Limited (Australia). Their combined negative performance over the six month period subtracted 5.84% points from the Fund’s performance.
In most of these instances, prices declined in the absence of changes in our estimates of business value. In some cases, the Fund seized these opportunities to add to the positions at prices we deemed attractive.
We look at gold as insurance, insurance against “extreme outcomes.” In the U.S., the current financial crisis is the worst since the Great Depression. The status of the U.S. dollar as the world’s reserve currency is suspect, and the other major currencies (the euro, the yen) are not particularly appealing. There is a scarcity side to gold: as we pointed out a year ago, the value of all above ground gold is about 1% of the value of global real estate plus financial assets. So, from a long-term standpoint, gold as insurance still makes sense, we believe.
General Commentary
Our focus has always been, and remains, on preservation of capital. To the Global Value team, minimizing loss is more important than maximizing gain. Together with our team of analysts, we continue to search the globe for what we believe are mispriced securities and recent declines have allowed us to make use of excess cash. In particular, we continue to find value in Japan and have begun looking at some high yield opportunities as well.
As always, we appreciate your confidence and thank you for your support.
| |

| 
|
| |
Jean-Marie Eveillard | Abhay Deshpande |
Portfolio Manager | Associate Portfolio Manager, |
| First Eagle Global, Overseas |
May 2008 | and U.S. Value Funds |
Past performance is no guarantee of future result. Portfolio actively managed. Portfolio and opinions expressed herein are subject to change.
10
| |
FUND OVERVIEW | |
| |
FIRST EAGLE GLOBAL FUND | Data as of April 30, 2008 (Unaudited) |
|
THE INVESTMENT STYLE |
|
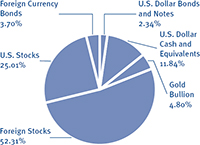
The First Eagle Global Fund seeks long-term growth of capital by investing in a wide range of asset classes from markets in the United States and around the world. This truly global fund is managed with a highly disciplined, bottom-up, value oriented style that helps minimize risk. |
|
ASSET ALLOCATION |
| | | | |
United States | 32.07% | | Brazil | 0.53% |
Japan | 21.19% | | India | 0.50% |
France | 13.27% | | United Kingdom | 0.49% |
Switzerland | 4.25% | | Taiwan | 0.25% |
South Korea | 3.65% | | Canada | 0.24% |
Italy | 2.27% | | Belgium | 0.19% |
Germany | 1.44% | | Sweden | 0.11% |
Mexico | 1.36% | | Other | 0.32% |
Hong Kong | 1.34% | | | |
Singapore | 1.30% | | | |
South Africa | 1.03% | | | |
Netherlands | 0.95% | | | |
Malaysia | 0.86% | | | |
Thailand | 0.55% | | | |
The Fund’s portfolio composition (represented as a percentage of net assets) is subject to change at any time.
| | | | | | | | | | |
| | ONE-YEAR | | FIVE-YEARS | | TEN-YEARS | |
First Eagle Global Fund (A Shares) | | | | | | | | | | |
without sales load | | 5.69 | % | | 19.05 | % | | 13.90 | % | |
with sales load | | 0.41 | % | | 17.84 | % | | 13.47 | % | |
MSCI World Index | | (2.47 | %) | | 15.18 | % | | 5.02 | % | |
Consumer Price Index | | 3.94 | % | | 3.17 | % | | 2.83 | % | |
|
GROWTH OF A $10,000 INITIAL INVESTMENT |
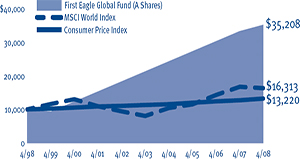
Performance data quoted herein represents past performance and should not be considered indicative of future results. Performance data quoted herein does not reflect the deduction of taxes that a shareholder would pay on Fund distributions or the sale of Fund shares. The average annual returns shown above are historical and reflect changes in share price, reinvested dividends and are net of expenses. The average annual returns for Class A Shares give effect to the deduction of the maximum sales load of 3.75% for periods prior to March 1, 2000 and of 5.00% thereafter. The MSCI World Index is a widely followed, unmanaged group of stocks from 23 international markets and is not available for purchase. This index is a trademark of Morgan Stanley Capital International SA in Geneva, Switzerland. The Consumer Price Index (CPI) represents the change in price of all goods and services purchased for consumption by urban households.
| | | |
TOP 10 HOLDINGS | | | |
Gold bullion (precious metal) | | 4.80 | % |
Berkshire Hathaway Inc., Class ‘A’ (U.S. holding company) | | 2.55 | % |
Sodexo (French food management services provider) | | 2.03 | % |
Pargesa Holding SA (Swiss diversified financials company) | | 1.91 | % |
SMC Corporation (Japanese automated control devices manufacturer) | | 1.72 | % |
Secom Company, Limited (Japanese security services provider) | | 1.68 | % |
Wendel (French holding company) | | 1.67 | % |
Sanofi-Aventis (French health care company) | | 1.63 | % |
Keyence Corporation (Japanese sensors manufacturer) | | 1.58 | % |
Shimano Inc. (Japanese bicycle parts manufacturer) | | 1.37 | % |
11
FIRST EAGLE GLOBAL FUND
SCHEDULE OF INVESTMENTS
April 30, 2008
(Unaudited)
| | | | | | | | | | |
|
|
|
|
|
|
|
|
Number
of Shares | | | | Cost
(Note 1) | | Value
(Note 1) | |
|
|
|
|
|
|
|
|
| | | Common and Preferred Stocks—U.S. (25.01%) | | | | | | | |
| | | | | | | | | | |
| | | Consumer Discretionary (1.47%) | | | | | | | |
| 3,385,151 | | McDonald’s Corporation | | $ | 76,677,208 | | $ | 201,687,297 | |
| 2,837,980 | | International Speedway Corporation, Class ‘A’ (c) | | | 142,336,484 | | | 120,387,112 | |
| 390,000 | | Weyco Group, Inc. | | | 1,285,374 | | | 10,650,900 | |
| 185,000 | | St. John Knits International Inc. (a) | | | 3,180,703 | | | 4,509,375 | |
| | | | |
|
| |
|
| |
| | | | | | 223,479,769 | | | 337,234,684 | |
| | | | |
|
| |
|
| |
| | | Consumer Staples (0.00%) | | | | | | | |
| 4,369 | | Seneca Foods Corporation, Class ‘A’ (a) | | | 65,753 | | | 89,564 | |
| | | | |
|
| |
|
| |
| | | Energy (3.66%) | | | | | | | |
| 3,033,633 | | ConocoPhillips Company | | | 143,979,202 | | | 261,347,483 | |
| 1,868,081 | | Apache Corporation | | | 121,326,511 | | | 251,593,149 | |
| 3,536,320 | | San Juan Basin Royalty Trust (c) | | | 124,324,979 | | | 135,900,778 | |
| 1,107,340 | | Murphy Oil Corporation | | | 45,709,775 | | | 100,037,096 | |
| 1,042,780 | | Helmerich & Payne, Inc. | | | 30,576,616 | | | 56,049,425 | |
| 1,141,326 | | BJ Services Company | | | 30,827,279 | | | 32,265,286 | |
| | | | |
|
| |
|
| |
| | | | | | 496,744,362 | | | 837,193,217 | |
| | | | |
|
| |
|
| |
| | | Financials (1.85%) | | | | | | | |
| 5,456,933 | | American Express Company | | | 238,198,544 | | | 262,041,923 | |
| 1,545,470 | | Legg Mason, Inc. | | | 108,404,247 | | | 93,160,932 | |
| 1,912,740 | | Willis Group Holdings Limited | | | 63,879,298 | | | 66,467,715 | |
| 65,674 | | East Texas Financial Services, Inc. (c) | | | 492,555 | | | 981,826 | |
| | | | |
|
| |
|
| |
| | | | | | 410,974,644 | | | 422,652,396 | |
| | | | |
|
| |
|
| |
| | | Health Care (1.40%) | | | | | | | |
| 2,913,470 | | Johnson & Johnson | | | 171,652,603 | | | 195,464,702 | |
| 2,499,370 | | Wellpoint Inc. (a) | | | 118,103,478 | | | 124,343,657 | |
| | | | |
|
| |
|
| |
| | | | | | 289,756,081 | | | 319,808,359 | |
| | | | |
|
| |
|
| |
| | | Holding Companies (2.56%) | | | | | | | |
| 4,349 | | Berkshire Hathaway Inc., Class ‘A’ (a) | | | 363,235,288 | | | 582,113,650 | |
| 2,485 | | J.G. Boswell Company | | | 573,840 | | | 2,460,150 | |
| | | | |
|
| |
|
| |
| | | | | | 363,809,128 | | | 584,573,800 | |
| | | | |
|
| |
|
| |
| | | Industrials (3.84%) | | | | | | | |
| 9,973,631 | | Cintas Corporation (c) | | | 361,277,175 | | | 295,319,214 | |
| 3,342,210 | | 3M Company | | | 272,794,353 | | | 257,015,949 | |
| 1,175,510 | | Alliant Techsystems Inc. (a) | | | 130,466,425 | | | 129,282,590 | |
| 9,778,961 | | Blount International, Inc. (a)(c) | | | 127,911,050 | | | 120,965,748 | |
| 1,576,258 | | UniFirst Corporation | | | 37,181,601 | | | 73,784,637 | |
|
|
See Notes to Financial Statements. |
12
FIRST EAGLE GLOBAL FUND
SCHEDULE OF INVESTMENTS—(Continued)
April 30, 2008
(Unaudited)
| | | | | | | | | | |
|
|
|
|
|
|
|
|
Number
of Shares | | | | Cost
(Note 1) | | Value
(Note 1) | |
|
|
|
|
|
|
|
|
| | | Common and Preferred Stocks—U.S.—(continued) | | | | | | | |
| | | | | | | | | | |
| | | Industrials—(continued) | | | | | | | |
| 4,654 | | Conbraco Industries, Inc. (a)(c) | | $ | 1,494,362 | | $ | 1,419,470 | |
| 365,000 | | Kaiser Ventures LLC (a)(b)(c)(d)(e)(f ) | | | — | | | 1,047,550 | |
| | | | |
|
| |
|
| |
| | | | | | 931,124,966 | | | 878,835,158 | |
| | | | |
|
| |
|
| |
| | | Materials (0.46%) | | | | | | | |
| 1,523,330 | | Vulcan Materials Company | | | 102,434,431 | | | 104,835,571 | |
| | | | |
|
| |
|
| |
| | | Media (1.75%) | | | | | | | |
| 14,156,665 | | Comcast Corporation-Special Class ‘A’ | | | 298,898,125 | | | 286,530,900 | |
| 3,400,450 | | Getty Images, Inc. (a)(c) | | | 133,280,462 | | | 111,024,693 | |
| 34,924 | | Mills Music Trust (c) | | | 1,055,337 | | | 1,314,015 | |
| | | | |
|
| |
|
| |
| | | | | | 433,233,924 | | | 398,869,608 | |
| | | | |
|
| |
|
| |
| | | Paper and Forest Products (2.40%) | | | | | | | |
| 5,905,362 | | Rayonier Inc. (c) | | | 132,354,108 | | | 248,202,365 | |
| 5,998,248 | | Plum Creek Timber Company, Inc. | | | 213,655,422 | | | 244,968,448 | |
| 1,028,158 | | Deltic Timber Corporation (c) | | | 50,721,718 | | | 54,235,334 | |
| | | | |
|
| |
|
| |
| | | | | | 396,731,248 | | | 547,406,147 | |
| | | | |
|
| |
|
| |
| | | Precious Metals (0.76%) | | | | | | | |
| 7,231,612 | | Newmont Mining Corporation Holding Company | | | 141,938,366 | | | 173,199,002 | |
| | | | |
|
| |
|
| |
| | | Real Estate (0.01%) | | | | | | | |
| 137,785 | | Price Legacy Corporation Pfd., Series ‘A’ | | | 1,343,932 | | | 1,687,866 | |
| 192,250 | | LandCo LLC (a)(b)(d)(e)(f ) | | | 669,030 | | | 669,030 | |
| 21,124 | | Security Capital European Realty (a)(d)(f ) | | | — | | | — | |
| | | | |
|
| |
|
| |
| | | | | | 2,012,962 | | | 2,356,896 | |
| | | | |
|
| |
|
| |
| | | Retail (2.67%) | | | | | | | |
| 2,236,590 | | Costco Wholesale Corporation | | | 82,585,202 | | | 159,357,038 | |
| 4,637,446 | | Barnes & Noble, Inc. (c) | | | 130,777,398 | | | 149,696,757 | |
| 2,408,250 | | Tiffany & Company | | | 73,591,936 | | | 104,855,205 | |
| 3,598,150 | | The Home Depot, Inc. | | | 94,046,983 | | | 103,626,720 | |
| 797,725 | | Wal-Mart Stores, Inc. | | | 34,878,845 | | | 46,252,095 | |
| 2,219,567 | | Dillard’s Inc., Class ‘A’ | | | 40,158,446 | | | 45,279,167 | |
| | | | |
|
| |
|
| |
| | | | | | 456,038,810 | | | 609,066,982 | |
| | | | |
|
| |
|
| |
| | | Technology and Telecommunications (1.49%) | | | | | | | |
| 4,792,737 | | Microsoft Corporation | | | 108,243,282 | | | 136,688,859 | |
| 5,470,010 | | Maxim Integrated Products, Inc. | | | 138,929,570 | | | 115,034,310 | |
| 2,534,490 | | Linear Technology Corporation | | | 82,493,960 | | | 88,605,770 | |
| | | | |
|
| |
|
| |
| | | | | | 329,666,812 | | | 340,328,939 | |
| | | | |
|
| |
|
| |
|
|
See Notes to Financial Statements. |
13
FIRST EAGLE GLOBAL FUND
SCHEDULE OF INVESTMENTS—(Continued)
April 30, 2008
(Unaudited)
| | | | | | | | | | |
|
|
|
|
|
|
|
|
Number
of Shares | | | | Cost
(Note 1) | | Value
(Note 1) | |
|
|
|
|
|
|
|
|
| | | Common and Preferred Stocks—U.S.—(continued) | | | | | | | |
| | | | | | | | | | |
| | | Utilities (0.69%) | | | | | | | |
| 4,440,260 | | IDACORP, Inc. (c) | | $ | 148,334,642 | | $ | 144,042,034 | |
| 325,000 | | CalEnergy Capital Trust 6 ½% Conv. Pfd. | | | 14,327,813 | | | 14,300,000 | |
| | | | |
|
| |
|
| |
| | | | | | 162,662,455 | | | 158,342,034 | |
| | | | |
|
| |
|
| |
| | | Total Common and Preferred Stocks—U.S. | | | 4,740,673,711 | | | 5,714,792,357 | |
| | | | |
|
| |
|
| |
| | | Common and Preferred Stocks—Non-U.S. (52.31%) | | | | | | | |
| | | | | | | | | | |
| | | Belgium (0.19%) | | | | | | | |
| 2,210,071 | | Deceuninck (c)(1) | | | 55,268,004 | | | 43,002,443 | |
| | | | |
|
| |
|
| |
| | | Brazil (0.53%) | | | | | | | |
| 1,196,220 | | Petroleo Brasileiro SA ADR (3) | | | 33,538,839 | | | 120,937,842 | |
| | | | |
|
| |
|
| |
| | | Canada (0.24%) | | | | | | | |
| 1,864,130 | | Harry Winston Diamond Corporation (9) | | | 49,623,285 | | | 55,227,998 | |
| | | | |
|
| |
|
| |
| | | Chile (0.07%) | | | | | | | |
| 7,600,803 | | Quinenco SA (8) | | | 5,676,192 | | | 16,943,679 | |
| | | | |
|
| |
|
| |
| | | France (12.35%) | | | | | | | |
| 6,914,732 | | Sodexo (1) | | | 258,358,340 | | | 462,829,143 | |
| 2,773,458 | | Wendel (c)(7) | | | 205,711,877 | | | 382,630,189 | |
| 4,771,587 | | Sanofi-Aventis (6) | | | 389,867,805 | | | 372,486,617 | |
| 2,912,639 | | Neopost SA (c)(8) | | | 282,256,376 | | | 303,765,433 | |
| 1,836,680 | | Air Liquide (9) | | | 233,583,884 | | | 276,520,080 | |
| 3,715,033 | | Rémy Cointreau SA (c)(2) | | | 156,953,568 | | | 230,445,319 | |
| 2,892,943 | | Carrefour SA (2) | | | 195,311,694 | | | 203,677,640 | |
| 3,008,319 | | Essilor International SA (6) | | | 122,689,871 | | | 187,075,778 | |
| 2,179,805 | | Société BIC SA (8) | | | 123,366,196 | | | 111,564,582 | |
| 422,686 | | Guyenne et Gascogne SA (c)(2) | | | 57,835,938 | | | 72,440,606 | |
| 1,683,950 | | Vivendi SA (10) | | | 63,417,857 | | | 68,335,616 | |
| 657,810 | | Total SA (3) | | | 44,053,939 | | | 55,231,686 | |
| 55,978 | | Société Sucrière de Pithiviers-le-Vieil (c)(2) | | | 30,226,768 | | | 45,397,506 | |
| 158,407 | | Robertet SA (2) | | | 20,913,866 | | | 20,862,817 | |
| 42,252 | | Robertet SA C.I. (2) | | | 800,508 | | | 4,538,092 | |
| 104,457 | | Gaumont SA (10) | | | 6,087,824 | | | 9,754,237 | |
| 385,000 | | Sabeton SA (c)(7) | | | 4,841,233 | | | 7,730,851 | |
| 70,000 | | NSC Groupe (c)(8) | | | 12,400,388 | | | 7,082,528 | |
| | | | |
|
| |
|
| |
| | | | | | 2,208,677,932 | | | 2,822,368,720 | |
| | | | |
|
| |
|
| |
|
|
See Notes to Financial Statements. |
14
FIRST EAGLE GLOBAL FUND
SCHEDULE OF INVESTMENTS—(Continued)
April 30, 2008
(Unaudited)
| | | | | | | | | | |
|
|
|
|
|
|
|
|
Number
of Shares | | | | Cost
(Note 1) | | Value
(Note 1) | |
|
|
|
|
|
|
|
|
| | | Common and Preferred Stocks—Non-U.S.—(continued) | | | | | | | |
| | | | | | | | | | |
| | | Germany (1.44%) | | | | | | | |
| 1,594,305 | | Fraport AG (16) | | $ | 53,543,202 | | $ | 115,249,887 | |
| 872,521 | | Hornbach Holding AG Pfd. (14) | | | 63,413,466 | | | 80,131,780 | |
| 697,298 | | Pfeiffer Vacuum Technology AG (c)(8) | | | 59,860,743 | | | 66,752,944 | |
| 1,337,532 | | Bertelsmann AG D.R.C. (10) | | | 33,414,943 | | | 46,220,437 | |
| 386,842 | | Hornbach Baumarkt AG (14) | | | 21,504,161 | | | 21,376,611 | |
| | | | |
|
| |
|
| |
| | | | | | 231,736,515 | | | 329,731,659 | |
| | | | |
|
| |
|
| |
| | | Hong Kong (0.65%) | | | | | | | |
| 8,128,650 | | Guoco Group Limited (7) | | | 74,964,068 | | | 87,136,817 | |
| 24,198,970 | | Shaw Brothers (Hong Kong) Limited (c)(10) | | | 24,380,422 | | | 58,991,209 | |
| 20,738,780 | | City e-Solutions Limited (c)(1) | | | 936,898 | | | 2,687,456 | |
| | | | |
|
| |
|
| |
| | | | | | 100,281,388 | | | 148,815,482 | |
| | | | |
|
| |
|
| |
| | | India (0.50%) | | | | | | | |
| 4,362,480 | | Tata Motors Limited (1) | | | 59,322,590 | | | 71,550,486 | |
| 1,001,999 | | Nestlé India Limited (2) | | | 12,190,035 | | | 43,497,861 | |
| | | | |
|
| |
|
| |
| | | | | | 71,512,625 | | | 115,048,347 | |
| | | | |
|
| |
|
| |
| | | Italy (2.27%) | | | | | | | |
| 16,294,025 | | Italcementi S.p.A. RNC (c)(9) | | | 228,613,091 | | | 260,227,164 | |
| 3,210,039 | | Italcementi S.p.A. (9) | | | 63,866,506 | | | 69,704,595 | |
| 1,291,611 | | Italmobiliare S.p.A. RNC (9) | | | 96,844,550 | | | 92,745,336 | |
| 844,422 | | Italmobiliare S.p.A. (9) | | | 91,683,994 | | | 80,324,626 | |
| 2,373,788 | | Gewiss S.p.A. (8) | | | 14,488,035 | | | 15,112,702 | |
| | | | |
|
| |
|
| |
| | | | | | 495,496,176 | | | 518,114,423 | |
| | | | |
|
| |
|
| |
| | | Japan (21.19%) | | | | | | | |
| 3,392,000 | | SMC Corporation (8) | | | 408,105,342 | | | 392,578,299 | |
| 8,254,790 | | Secom Company, Limited (8) | | | 372,594,261 | | | 382,784,993 | |
| 1,425,230 | | Keyence Corporation (15) | | | 312,957,895 | | | 361,308,606 | |
| 6,887,970 | | Shimano Inc. (c)(1) | | | 154,872,876 | | | 312,144,652 | |
| 26,505,650 | | Sompo Japan Insurance Inc. (4) | | | 289,674,998 | | | 293,815,924 | |
| 2,724,570 | | FANUC Limited (8) | | | 252,723,797 | | | 285,313,055 | |
| 5,211,900 | | Ono Pharmaceutical Company, Limited (6) | | | 237,044,527 | | | 274,639,042 | |
| 11,490,100 | | Toho Company, Limited (c)(10) | | | 216,544,758 | | | 262,001,801 | |
| 4,567,060 | | Canon Inc. (15) | | | 218,295,606 | | | 227,532,570 | |
| 9,448,600 | | THK Company, Limited (c)(8) | | | 183,755,498 | | | 208,661,298 | |
| 1,684,610 | | Hirose Electric Company, Limited (15) | | | 189,811,382 | | | 198,844,505 | |
| 10,972,000 | | Kirin Holdings Company, Limited (2) | | | 145,500,358 | | | 194,473,772 | |
| 4,329,700 | | Astellas Pharma Inc. (6) | | | 181,371,971 | | | 176,299,162 | |
| 27,577,100 | | Aioi Insurance Company, Limited (4) | | | 110,358,117 | | | 173,058,687 | |
|
|
See Notes to Financial Statements. |
15
FIRST EAGLE GLOBAL FUND
SCHEDULE OF INVESTMENTS—(Continued)
April 30, 2008
(Unaudited)
| | | | | | | | | | |
|
|
|
|
|
|
|
|
|
| Number
of Shares | | | | Cost
(Note 1) | | Value
(Note 1) | |
|
|
|
|
|
|
|
|
|
| | | Common and Preferred Stocks—Non-U.S.—(continued) | | | | | | | |
|
| | | Japan—(continued) | | | | | | | |
| 4,348,874 | | Mitsui Sumitomo Insurance Group Holdings, Inc. (a)(4) | | $ | 154,023,656 | | $ | 172,496,671 | |
| 7,522,450 | | MISUMI Group Inc. (c)(8) | | | 125,229,010 | | | 145,584,182 | |
| 3,663,695 | | Meitec Corporation (c)(8) | | | 109,855,533 | | | 104,426,277 | |
| 5,141,460 | | Aiful Corporation (4) | | | 88,728,107 | | | 100,489,374 | |
| 10,215,760 | | PARK24 Company, Limited (c)(8) | | | 102,739,103 | | | 92,786,017 | |
| 5,102,700 | | T. Hasegawa Company, Limited (c)(2) | | | 79,177,152 | | | 84,869,817 | |
| 3,045,610 | | Shimachu Company, Limited (c)(14) | | | 76,929,113 | | | 83,453,361 | |
| 8,453,000 | | NIPPONKOA Insurance Company, Limited (4) | | | 41,599,718 | | | 82,039,655 | |
| 2,937,480 | | Chofu Seisakusho Company, Limited (c)(1) | | | 53,277,954 | | | 60,508,570 | |
| 3,113,500 | | Circle K Sunkus Company, Limited (2) | | | 54,512,401 | | | 46,952,326 | |
| 3,169,992 | | Nissin Healthcare Food Service Company, Limited (2) | | | 44,621,605 | | | 36,445,417 | |
| 1,725,100 | | Ariake Japan Company, Limited (c)(2) | | | 29,754,119 | | | 24,180,324 | |
| 2,060,700 | | Seikagaku Corporation (6) | | | 21,875,804 | | | 22,704,719 | |
| 407,830 | | Mabuchi Motor Company, Limited (15) | | | 24,369,065 | | | 20,122,869 | |
| 1,051,300 | | Aderans Company, Limited (2) | | | 24,356,774 | | | 19,761,922 | |
| 188,760 | | Shoei Company, Limited (7) | | | 491,308 | | | 2,777,824 | |
| 64 | | Cosel Company, Limited (8) | | | 1,031 | | | 696 | |
| | | | |
|
| |
|
| |
| | | | | | 4,305,152,839 | | | 4,843,056,387 | |
| | | | |
|
| |
|
| |
| | | Malaysia (0.58%) | | | | | | | |
| 65,658,435 | | Genting Berhad (1) | | | 149,283,413 | | | 133,021,204 | |
| | | | |
|
| |
|
| |
| | | Mexico (1.36%) | | | | | | | |
| 10,607,020 | | Industrias Peñoles, SAB de C.V. (12) | | | 22,303,247 | | | 309,827,131 | |
| | | | |
|
| |
|
| |
| | | Netherlands (0.39%) | | | | | | | |
| 1,733,453 | | Heineken Holding NV (2) | | | 43,207,659 | | | 89,043,639 | |
| | | | |
|
| |
|
| |
| | | Singapore (0.49%) | | | | | | | |
| 3,238,180 | | United Overseas Bank Limited (4) | | | 41,783,813 | | | 48,649,609 | |
| 12,704,120 | | Fraser & Neave Limited (2) | | | 12,799,700 | | | 44,721,945 | |
| 13,467,250 | | ComfortDelgro Corporation Limited (16) | | | 3,279,184 | | | 17,356,621 | |
| | | | |
|
| |
|
| |
| | | | | | 57,862,697 | | | 110,728,175 | |
| | | | |
|
| |
|
| |
| | | South Africa (1.03%) | | | | | | | |
| 13,448,440 | | Gold Fields Limited ADR (12) | | | 213,626,143 | | | 181,553,940 | |
| 749,210 | | Gold Fields Limited (12) | | | 2,173,737 | | | 9,896,440 | |
| 2,876,557 | | Harmony Gold Mining Company, Limited ADR (a)(12) | | | 35,612,420 | | | 33,626,951 | |
| 1,000,000 | | Harmony Gold Mining Company, Limited (a)(12) | | | 4,591,642 | | | 11,399,511 | |
| | | | |
|
| |
|
| |
| | | | | | 256,003,942 | | | 236,476,842 | |
| | | | |
|
| |
|
| |
See Notes to Financial Statements.
16
FIRST EAGLE GLOBAL FUND
SCHEDULE OF INVESTMENTS—(Continued)
April 30, 2008
(Unaudited)
| | | | | | | | | | |
|
|
|
|
|
|
|
|
|
| Number
of Shares | | | | Cost
(Note 1) | | Value
(Note 1) | |
|
|
|
|
|
|
|
|
|
|
|
| | | Common and Preferred Stocks—Non-U.S.—(continued) | | | | | | | |
|
| | | South Korea (3.65%) | | | | | | | |
| 560,890 | | Samsung Electronics Company, Limited Pfd. (15) | | $ | 109,912,101 | | $ | 288,654,306 | |
| 1,862,671 | | KT&G Corporation (2) | | | 87,524,545 | | | 154,193,081 | |
| 6,526,491 | | SK Telecom Company, Limited ADR (15) | | | 155,122,977 | | | 147,302,902 | |
| 5,219,873 | | Kangwon Land Inc. (1) | | | 103,995,236 | | | 109,327,615 | |
| 51,900 | | Lotte Confectionery Company, Limited (2) | | | 21,157,499 | | | 61,804,817 | |
| 39,989 | | Nam Yang Dairy Products Company, Limited (c)(2) | | | 7,325,466 | | | 31,507,814 | |
| 124,183 | | SK Holdings Company Limited (3) | | | 15,948,637 | | | 19,259,419 | |
| 1,589,160 | | Daeduck GDS Company, Limited (c)(15) | | | 14,042,994 | | | 12,410,236 | |
| 1,869,420 | | Daeduck Electronics Company, Limited (15) | | | 13,292,480 | | | 9,863,095 | |
| | | | |
|
| |
|
| |
| | | | | | 528,321,935 | | | 834,323,285 | |
| | | | |
|
| |
|
| |
| | | Switzerland (4.25%) | | | | | | | |
| 3,820,052 | | Pargesa Holding SA (7) | | | 241,364,420 | | | 437,479,174 | |
| 496,303 | | Nestlé SA (2) | | | 118,927,370 | | | 236,981,881 | |
| 40,274 | | Lindt & Spruengli AG PC (2) | | | 67,067,587 | | | 123,818,802 | |
| 2,080 | | Lindt & Spruengli AG (2) | | | 60,901,565 | | | 67,824,566 | |
| 847,356 | | Kuehne & Nagel International AG (16) | | | 4,831,442 | | | 90,853,562 | |
| 39,740 | | Edipresse SA (10) | | | 10,811,875 | | | 13,344,027 | |
| | | | |
|
| |
|
| |
| | | | | | 503,904,259 | | | 970,302,012 | |
| | | | |
|
| |
|
| |
| | | Thailand (0.55%) | | | | | | | |
| 26,375,300 | | Bangkok Bank Public Company Limited NVDR (4) | | | 84,757,791 | | | 114,783,709 | |
| 448,850 | | Bangkok Bank Public Company Limited (4) | | | 1,459,292 | | | 1,981,678 | |
| 577,000 | | The Oriental Hotel Public Company, Limited (1) | | | 2,636,472 | | | 9,971,492 | |
| | | | |
|
| |
|
| |
| | | | | | 88,853,555 | | | 126,736,879 | |
| | | | |
|
| |
|
| |
| | | United Kingdom (0.46%) | | | | | | | |
| 1,609,143 | | Anglo American Plc (12) | | | 35,465,322 | | | 104,332,506 | |
| | | | |
|
| |
|
| |
| | | Miscellaneous (0.12%) | | | | | | | |
| 1,404,222 | | Banco Latinoamericano de Exportaciones SA ADR (4) | | | 22,983,667 | | | 26,399,374 | |
| | | | |
|
| |
|
| |
| | | Total Common and Preferred Stocks—Non U.S. | | | 9,265,153,491 | | | 11,954,438,027 | |
| | | | |
|
| |
|
| |
|
|
|
|
|
|
|
|
|
| |
| Ounces | | | | | | | | | |
|
|
|
|
|
|
|
|
|
| |
| | | Commodity (4.80%) | | | | | | | |
| 1,249,002 | | Gold bullion (a) | | | 693,749,790 | | | 1,096,061,595 | |
| | | | |
|
| |
|
| |
See Notes to Financial Statements.
17
FIRST EAGLE GLOBAL FUND
SCHEDULE OF INVESTMENTS—(Continued)
April 30, 2008
(Unaudited)
| | | | | | | | | | |
|
|
|
|
|
|
|
|
|
| Principal
Amount | | | | Cost
(Note 1) | | Value
(Note 1) | |
|
|
|
|
|
|
|
|
|
| | | Notes, Bonds and Convertible Bonds (6.04%) | | | | | | | |
| | | | | | | | | | |
| | | U.S. Treasury Notes (1.35%) | | | | | | | |
$ | 79,217,526 | | U.S. Treasury Inflation Index Note 41/4% due 1/15/2010 (g)(5) | | $ | 81,441,126 | | $ | 85,090,792 | |
| 132,615,903 | | U.S. Treasury Inflation Index Note 23/8% due 4/15/2011 (g)(5) | | | 136,956,348 | | | 140,137,744 | |
| 79,792,185 | | U.S. Treasury Inflation Index Note 17/8% due 7/15/2013 (g)(5) | | | 83,848,603 | | | 83,837,968 | |
| | | | |
|
| |
|
| |
| | | | | | 302,246,077 | | | 309,066,504 | |
| | | | |
|
| |
|
| |
| | | U.S. Dollar Notes and Bonds (0.99%) | | | | | | | |
| 13,500,000 | | GATX Corporation 87/8% due 6/1/2009 (4) | | | 13,319,318 | | | 14,002,821 | |
| 4,910,000 | | American Standard Companies Inc. 81/4% due 6/1/2009 (8) | | | 4,968,816 | | | 5,113,927 | |
| 12,721,000 | | Pulte Homes, Inc. 81/8% due 3/1/2011 (1) | | | 12,416,837 | | | 12,593,790 | |
| 30,962,000 | | Pulte Homes, Inc. 77/8% due 8/1/2011 (1) | | | 29,814,196 | | | 30,342,760 | |
| 5,000,000 | | Pulte Homes, Inc. 5.2% due 2/15/2015 (1) | | | 4,129,206 | | | 4,437,500 | |
| 6,900,000 | | Briggs & Stratton Corporation 87/8% due 3/15/2011 (1) | | | 7,079,804 | | | 7,176,000 | |
| 3,500,000 | | Toys ‘R’ Us, Inc. 75/8% due 8/1/2011 (14) | | | 3,451,298 | | | 3,080,000 | |
| 28,930,000 | | Blount International, Inc. 87/8% due 8/1/2012 (8) | | | 28,958,612 | | | 29,219,300 | |
| 21,147,000 | | Tronox Worldwide LLC 91/2% due 12/1/2012 (9) | | | 21,623,491 | | | 18,292,155 | |
| 12,522,000 | | Sirius Satellite Radio Inc. 95/8% due 8/1/2013 (10) | | | 12,264,285 | | | 10,612,395 | |
| 2,810,655 | | Avis Budget Car Rental LLC 75/8% due 5/15/2014 (8) | | | 2,756,224 | | | 2,582,289 | |
| 14,500,000 | | Level 3 Financing, Inc. 91/4% due 11/1/2014 (15) | | | 14,025,902 | | | 13,267,500 | |
| 12,554,000 | | Yankee Acquisition Corporation 81/2% due 2/15/2015 (1) | | | 12,451,108 | | | 10,670,900 | |
| 22,554,000 | | Yankee Acquisition Corporation 93/4% due 2/15/2017 (1) | | | 21,736,983 | | | 18,212,355 | |
| 28,622,000 | | Valassis Communications, Inc. 81/4% due 3/1/2015 (10) | | | 26,157,519 | | | 25,616,690 | |
| 2,000,000 | | Legrand SA 81/2% due 2/15/2025 (8) | | | 1,957,275 | | | 2,155,604 | |
| 4,200,000 | | Bausch & Lomb Inc. 71/8% due 8/1/2028 (6) | | | 3,561,775 | | | 3,528,000 | |
| | | | | | | | | | |
| 10,000,000 | | Christiania Bank Floating Rate Perpetual Notes (3.0261% @ 4/30/2008) (4) | | | 6,826,750 | | | 6,350,000 | |
| | | | | | | | | | |
| 3,500,000 | | Den Norske Bank Floating Rate Perpetual Notes (2.9886% @ 4/30/2008) (4) | | | 2,610,000 | | | 2,368,236 | |
| | | | | | | | | | |
| 3,170,000 | | Den Norske Bank Floating Rate Perpetual Notes (3.0447% @ 4/30/2008) (4) | | | 2,059,625 | | | 1,997,100 | |
| | | | | | | | | | |
| 5,500,000 | | Bergen Bank Floating Rate Perpetual Notes (2.9636% @ 4/30/2008) (4) | | | 3,888,750 | | | 3,795,000 | |
| | | | |
|
| |
|
| |
| | | | | | 236,057,774 | | | 225,414,322 | |
| | | | |
|
| |
|
| |
| | | Non U.S. Dollar Notes and Bonds (3.70%) | | | | | | | |
EUR | 2,959,000 | | Koninklijke Ahold NV 57/8% due 5/9/2008 (14) | | | 3,391,364 | | | 4,604,873 | |
SEK | 125,000,000 | | Sweden Government I/L 4.6745% due 12/1/2008 (g)(5) | | | 17,287,391 | | | 25,552,187 | |
HKD | 199,650,000 | | Hong Kong Government 3.34% due 12/19/2008 (5) | | | 25,612,102 | | | 26,003,336 | |
HKD | 675,950,000 | | Hong Kong Government 2.52% due 3/24/2009 (5) | | | 87,205,895 | | | 87,825,323 | |
HKD | 324,050,000 | | Hong Kong Government 3.63% due 12/19/2011 (5) | | | 43,462,373 | | | 43,602,698 | |
MYR | 165,000,000 | | Malaysian Government 4.305% due 2/27/2009 (5) | | | 43,535,957 | | | 52,643,618 | |
MYR | 37,014,000 | | Malaysian Government 3.756% due 4/28/2011 (5) | | | 9,915,147 | | | 11,820,882 | |
See Notes to Financial Statements.
18
FIRST EAGLE GLOBAL FUND
SCHEDULE OF INVESTMENTS—(Continued)
April 30, 2008
(Unaudited)
| | | | | | | | | | |
|
|
|
|
|
|
|
|
|
| Principal
Amount | | | | Cost
(Note 1) | | Value
(Note 1) | |
|
|
|
|
|
|
|
|
|
| | | Notes, Bonds and Convertible Bonds—(continued) | | | | | | | |
| | | | | | | | | | |
| | | Non U.S. Dollar Notes and Bonds—(continued) | | | | | | | |
EUR | 2,500,000 | | Independent News & Media Plc 53/4% due 5/17/2009 (10) | | $ | 2,850,468 | | $ | 3,696,924 | |
SGD | 52,947,000 | | Singapore Government 23/8% due 10/1/2009 (5) | | | 32,235,350 | | | 39,731,716 | |
SGD | 154,630,000 | | Singapore Government 45/8% due 7/1/2010 (5) | | | 110,772,512 | | | 122,534,810 | |
SGD | 30,327,000 | | Singapore Government 35/8% due 7/1/2011 (5) | | | 21,774,392 | | | 23,913,784 | |
EUR | 13,650,000 | | Waterford Wedgwood Plc 97/8% due 12/1/2010 (b)(1) | | | 16,030,383 | | | 8,605,271 | |
GBP | 3,000,000 | | Marks & Spencer Group Plc 63/8% due 11/7/2011 (14) | | | 5,191,409 | | | 5,788,839 | |
TWD | 1,741,500,000 | | Taiwan Government 2% due 7/20/2012 (5) | | | 52,804,175 | | | 56,517,831 | |
EUR | 106,082,529 | | Republic of France O.A.T. I/L 3% due 7/25/2012 (g)(5) | | | 141,641,180 | | | 174,515,540 | |
EUR | 31,750,000 | | UPC Holding BV 85/8% due 1/15/2014 (b)(10) | | | 37,244,134 | | | 48,866,037 | |
EUR | 50,300,000 | | UPC Holding BV 73/4% due 1/15/2014 (b)(10) | | | 58,565,257 | | | 75,556,562 | |
EUR | 5,000,000 | | Wendel 47/8% 9/21/2015 (7) | | | 5,914,606 | | | 6,508,143 | |
EUR | 5,000,000 | | Wendel 43/8% 8/9/2017 (7) | | | 5,635,338 | | | 5,863,952 | |
EUR | 12,000,000 | | FINEL 91/2% due 6/30/2017 (b)(d)(e)(f)(11) | | | 14,474,400 | | | 9,339,597 | |
EUR | 15,000,000 | | FINEL 91/2% due 10/15/2017 (b)(d)(e)(f)(11) | | | 18,067,500 | | | 11,674,496 | |
| | | | |
|
| |
|
| |
| | | | | | 753,611,333 | | | 845,166,419 | |
| | | | |
|
| |
|
| |
| | | Total Notes, Bonds and Convertible Bonds | | | 1,291,915,184 | | | 1,379,647,245 | |
| | | | |
|
| |
|
| |
| | | Short-Term Investments (12.17%) | | | | | | | |
$ | 25,000,000 | | 7-Eleven Inc. 2.26% due 5/2/2008 | | | 24,998,431 | | | 24,998,431 | |
| 12,300,000 | | 7-Eleven Inc. 2.23% due 5/6/2008 | | | 12,296,190 | | | 12,296,190 | |
| 11,379,000 | | 7-Eleven Inc. 2.2% due 5/9/2008 | | | 11,373,437 | | | 11,373,437 | |
| 10,500,000 | | 7-Eleven Inc. 2.25% due 5/9/2008 | | | 10,494,750 | | | 10,494,750 | |
| 50,000,000 | | Altria Group, Inc. 3.01% due 5/19/2008 | | | 49,924,750 | | | 49,924,750 | |
| 25,000,000 | | Altria Group, Inc. 3.08% due 5/21/2008 | | | 24,957,222 | | | 24,957,222 | |
| 25,000,000 | | Altria Group, Inc. 3.1% due 5/28/2008 | | | 24,941,875 | | | 24,941,875 | |
| 25,000,000 | | Altria Group, Inc. 3.1% due 6/6/2008 | | | 24,922,500 | | | 24,922,500 | |
| 3,240,000 | | Altria Group, Inc. 3.15% due 6/13/2008 | | | 3,227,810 | | | 3,227,810 | |
| 50,581,000 | | AT&T Corporation 2.25% due 5/9/2008 | | | 50,555,710 | | | 50,555,710 | |
| 20,000,000 | | AT&T 2.25% due 5/12/2008 | | | 19,986,250 | | | 19,986,250 | |
| 47,053,000 | | AT&T 2.25% due 5/19/2008 | | | 47,000,065 | | | 47,000,065 | |
| 18,746,000 | | AT&T 2.15% due 5/22/2008 | | | 18,722,489 | | | 18,722,489 | |
| 29,176,000 | | AT&T 2.2% due 5/27/2008 | | | 29,129,643 | | | 29,129,643 | |
| 25,000,000 | | BASF Corporation 2.25% due 6/4/2008 | | | 24,946,875 | | | 24,946,875 | |
| 30,000,000 | | BASF Corporation 2.2% due 6/6/2008 | | | 29,934,000 | | | 29,934,000 | |
| 50,000,000 | | BASF Corporation 2.25% due 6/10/2008 | | | 49,875,000 | | | 49,875,000 | |
| 26,145,000 | | BASF Corporation 2.25% due 6/25/2008 | | | 26,055,127 | | | 26,055,127 | |
| 30,000,000 | | BASF Corporation 2.2% due 7/7/2008 | | | 29,877,167 | | | 29,877,167 | |
| 25,000,000 | | BMW US Capital LLC 2.13% due 5/8/2008 | | | 24,989,646 | | | 24,989,646 | |
| 12,670,000 | | Cintas Corporation 2.25% due 5/1/2008 | | | 12,670,000 | | | 12,670,000 | |
| 20,000,000 | | Cintas Corporation 2.3% due 5/2/2008 | | | 19,998,722 | | | 19,998,722 | |
See Notes to Financial Statements.
19
FIRST EAGLE GLOBAL FUND
SCHEDULE OF INVESTMENTS—(Continued)
April 30, 2008
(Unaudited)
| | | | | | | | | | |
|
|
|
|
|
|
|
|
|
|
|
Principal
Amount | | | | Cost
(Note 1) | | Value
(Note 1) | |
|
|
|
|
|
|
|
|
| | | Short-Term Investments—(continued) | | | | | | | |
$ | 14,500,000 | | Cintas Corporation 2.24% due 5/5/2008 | | $ | 14,496,391 | | $ | 14,496,391 | |
| 9,500,000 | | Cintas Corporation 2.22% due 5/12/2008 | | | 9,493,556 | | | 9,493,556 | |
| 21,354,000 | | The Clorox Company 2.85% due 5/2/2008 | | | 21,352,309 | | | 21,352,309 | |
| 15,200,000 | | The Clorox Company 2.95% due 5/5/2008 | | | 15,195,018 | | | 15,195,018 | |
| 22,742,000 | | The Clorox Company 2.9% due 5/7/2008 | | | 22,731,008 | | | 22,731,008 | |
| 35,393,000 | | The Clorox Company 2.95% due 5/15/2008 | | | 35,352,396 | | | 35,352,396 | |
| 45,000,000 | | ConocoPhillips Company 2.23% due 5/13/2008 | | | 44,966,550 | | | 44,966,550 | |
| 25,000,000 | | Diageo Capital Plc 3.38% due 5/1/2008 | | | 25,000,000 | | | 25,000,000 | |
| 31,496,000 | | Diageo Capital Plc 3.38% due 5/2/2008 | | | 31,493,043 | | | 31,493,043 | |
| 24,100,000 | | Diageo Capital Plc 2.85% due 5/7/2008 | | | 24,088,553 | | | 24,088,553 | |
| 25,000,000 | | Diageo Capital Plc 2.4% due 5/9/2008 | | | 24,986,667 | | | 24,986,667 | |
| 15,019,000 | | Diageo Capital Plc 2.85% due 5/9/2008 | | | 15,009,488 | | | 15,009,488 | |
| 26,431,000 | | Diageo Capital Plc 2.9% due 5/9/2008 | | | 26,413,967 | | | 26,413,967 | |
| 14,095,000 | | Diageo Capital Plc 2.87% due 5/12/2008 | | | 14,082,639 | | | 14,082,639 | |
| 20,000,000 | | Diageo Capital Plc 2.75% due 6/9/2008 | | | 19,940,417 | | | 19,940,417 | |
| 10,000,000 | | The Dow Chemical Company 3.15% due 6/17/2008 | | | 9,958,875 | | | 9,958,875 | |
| 25,000,000 | | The Dow Chemical Company 3.12% due 6/23/2008 | | | 24,885,167 | | | 24,885,167 | |
| 37,983,000 | | The Dow Chemical Company 3.17% due 6/23/2008 | | | 37,805,735 | | | 37,805,735 | |
| 25,000,000 | | The Dow Chemical Company 3.12% due 6/24/2008 | | | 24,883,000 | | | 24,883,000 | |
| 20,000,000 | | Henkel AG & Company KGaA 2.17% due 5/2/2008 | | | 19,998,794 | | | 19,998,794 | |
| 52,224,000 | | Henkel AG & Company KGaA 2.2% due 5/6/2008 | | | 52,208,043 | | | 52,208,043 | |
| 21,700,000 | | Henkel AG & Company KGaA 2.2% due 5/9/2008 | | | 21,689,391 | | | 21,689,391 | |
| 20,500,000 | | Henkel AG & Company KGaA 2.22% due 5/16/2008 | | | 20,481,038 | | | 20,481,038 | |
| 30,000,000 | | Henkel AG & Company KGaA 2.17% due 6/2/2008 | | | 29,942,133 | | | 29,942,133 | |
| 27,000,000 | | Hitachi Limited 2.9% due 5/27/2008 | | | 26,943,450 | | | 26,943,450 | |
| 18,000,000 | | Hitachi Limited 2.85% due 5/30/2008 | | | 17,958,675 | | | 17,958,675 | |
| 20,000,000 | | H.J. Heinz Company 2.75% due 5/2/2008 | | | 19,998,472 | | | 19,998,472 | |
| 25,000,000 | | H.J. Heinz Company 2.85% due 5/9/2008 | | | 24,984,167 | | | 24,984,167 | |
| 20,717,000 | | H.J. Heinz Company 2.75% due 5/12/2008 | | | 20,699,592 | | | 20,699,592 | |
| 25,000,000 | | H.J. Heinz Company 3.05% due 5/13/2008 | | | 24,974,583 | | | 24,974,583 | |
| 22,000,000 | | H.J. Heinz Company 2.8% due 6/2/2008 | | | 21,945,244 | | | 21,945,244 | |
| 16,125,000 | | H.J. Heinz Company 2.8% due 6/6/2008 | | | 16,079,850 | | | 16,079,850 | |
| 33,325,000 | | H.J. Heinz Company 2.9% due 6/6/2008 | | | 33,228,358 | | | 33,228,358 | |
| 28,000,000 | | H.J. Heinz Company 2.95% due 6/13/2008 | | | 27,901,339 | | | 27,901,339 | |
| 13,250,000 | | H.J. Heinz Company 2.85% due 6/25/2008 | | | 13,192,307 | | | 13,192,307 | |
| 25,000,000 | | H.J. Heinz Company 2.9% due 6/25/2008 | | | 24,889,236 | | | 24,889,236 | |
| 25,000,000 | | The Home Depot, Inc. 2.9% due 5/2/2008 | | | 24,997,986 | | | 24,997,986 | |
| 15,000,000 | | ITT Corporation 2.9% due 5/2/2008 | | | 14,998,792 | | | 14,998,792 | |
| 23,000,000 | | ITT Corporation 2.75% due 5/8/2008 | | | 22,987,701 | | | 22,987,701 | |
| 20,539,000 | | ITT Corporation 2.85% due 5/8/2008 | | | 20,527,618 | | | 20,527,618 | |
| 30,000,000 | | ITT Corporation 2.87% due 5/9/2008 | | | 29,980,867 | | | 29,980,867 | |
See Notes to Financial Statements.
20
FIRST EAGLE GLOBAL FUND
SCHEDULE OF INVESTMENTS—(Continued)
April 30, 2008
(Unaudited)
| | | | | | | | | | |
|
|
|
|
|
|
|
|
|
|
|
Principal
Amount | | | | Cost
(Note 1) | | Value
(Note 1) | |
|
|
|
|
|
|
|
|
| | | Short-Term Investments—(continued) | | | | | | | |
$ | 27,619,000 | | ITT Corporation 2.9% due 5/9/2008 | | $ | 27,601,201 | | $ | 27,601,201 | |
| 13,540,000 | | ITT Corporation 2.4% due 5/13/2008 | | | 13,529,168 | | | 13,529,168 | |
| 13,804,000 | | ITT Corporation 2.9% due 5/13/2008 | | | 13,790,656 | | | 13,790,656 | |
| 11,841,000 | | ITT Corporation 2.9% due 5/16/2008 | | | 11,826,692 | | | 11,826,692 | |
| 50,498,000 | | ITT Corporation 3% due 5/16/2008 | | | 50,434,877 | | | 50,434,877 | |
| 17,661,000 | | ITT Corporation 3% due 5/20/2008 | | | 17,633,037 | | | 17,633,037 | |
| 16,050,000 | | ITT Corporation 3% due 6/10/2008 | | | 15,996,500 | | | 15,996,500 | |
| 19,825,000 | | ITT Corporation 3.02% due 6/10/2008 | | | 19,758,476 | | | 19,758,476 | |
| 30,000,000 | | Kraft Foods Inc. 2.78% due 5/1/2008 | | | 30,000,000 | | | 30,000,000 | |
| 25,000,000 | | Kraft Foods Inc. 2.75% due 5/2/2008 | | | 24,998,090 | | | 24,998,090 | |
| 45,000,000 | | Kraft Foods Inc. 2.69% due 5/5/2008 | | | 44,986,550 | | | 44,986,550 | |
| 23,023,000 | | Kraft Foods Inc. 2.73% due 5/5/2008 | | | 23,016,016 | | | 23,016,016 | |
| 30,000,000 | | Kraft Foods Inc. 2.7% due 5/6/2008 | | | 29,988,750 | | | 29,988,750 | |
| 30,460,000 | | Kraft Foods Inc. 2.81% due 5/7/2008 | | | 30,445,735 | | | 30,445,735 | |
| 31,325,000 | | Kraft Foods Inc. 2.81% due 5/13/2008 | | | 31,295,659 | | | 31,295,659 | |
| 28,276,000 | | Kraft Foods Inc. 2.82% due 5/22/2008 | | | 28,229,486 | | | 28,229,486 | |
| 11,815,000 | | L’Oréal SA 2.18% due 5/16/2008 | | | 11,804,268 | | | 11,804,268 | |
| 50,000,000 | | L’Oréal SA 2.22% due 5/16/2008 | | | 49,953,750 | | | 49,953,750 | |
| 10,480,000 | | Nestlè Capital Corporation 2.2% due 5/9/2008 | | | 10,474,876 | | | 10,474,876 | |
| 25,000,000 | | PepsiCo, Inc. 2.08% due 5/29/2008 | | | 24,959,556 | | | 24,959,556 | |
| 54,923,000 | | Philip Morris USA 2.42% due 5/2/2008 | | | 54,919,307 | | | 54,919,307 | |
| 23,369,000 | | Philip Morris USA 2.44% due 5/14/2008 | | | 23,348,409 | | | 23,348,409 | |
| 25,000,000 | | Philip Morris USA 2.45% due 5/14/2008 | | | 24,977,882 | | | 24,977,882 | |
| 25,000,000 | | Philip Morris USA 2.42% due 5/23/2008 | | | 24,963,028 | | | 24,963,028 | |
| 50,000,000 | | Philip Morris USA 2.45% due 5/23/2008 | | | 49,925,139 | | | 49,925,139 | |
| 44,762,000 | | Procter and Gamble Company 2.1% due 5/5/2008 | | | 44,751,556 | | | 44,751,556 | |
| 10,000,000 | | The Sherwin-Williams Company 2.94% due 5/16/2008 | | | 9,987,750 | | | 9,987,750 | |
| 16,000,000 | | The Sherwin-Williams Company 3% due 5/19/2008 | | | 15,976,000 | | | 15,976,000 | |
| 20,000,000 | | The Sherwin-Williams Company 3% due 5/27/2008 | | | 19,956,667 | | | 19,956,667 | |
| 10,000,000 | | The Sherwin-Williams Company 3% due 5/30/2008 | | | 9,975,833 | | | 9,975,833 | |
| 18,000,000 | | The Sherwin-Williams Company 3.13% due 6/3/2008 | | | 17,948,355 | | | 17,948,355 | |
| 10,000,000 | | The Sherwin-Williams Company 2.95% due 6/9/2008 | | | 9,968,042 | | | 9,968,042 | |
| 29,298,000 | | Starbucks Corporation 2.85% due 5/1/2008 | | | 29,298,000 | | | 29,298,000 | |
| 15,000,000 | | Starbucks Corporation 2.85% due 5/5/2008 | | | 14,995,250 | | | 14,995,250 | |
| 20,225,000 | | Starbucks Corporation 2.9% due 5/6/2008 | | | 20,216,854 | | | 20,216,854 | |
| 8,000,000 | | Telstra Corporation Limited 2.65% due 5/16/2008 | | | 7,991,167 | | | 7,991,167 | |
| 25,000,000 | | Time Warner Inc. 2.94% due 5/2/2008 | | | 24,997,958 | | | 24,997,958 | |
| 21,009,000 | | Time Warner Inc. 2.93% due 5/5/2008 | | | 21,002,160 | | | 21,002,160 | |
| 50,000,000 | | Time Warner Inc. 2.93% due 5/7/2008 | | | 49,975,583 | | | 49,975,583 | |
| 51,904,000 | | Time Warner Inc. 2.93% due 5/9/2008 | | | 51,870,205 | | | 51,870,205 | |
See Notes to Financial Statements.
21
|
FIRST EAGLE GLOBAL FUND |
|
SCHEDULE OF INVESTMENTS—(Continued) |
April 30, 2008
(Unaudited) |
| | | | | | | | | | |
|
|
|
|
|
|
|
|
|
|
|
| Principal
Amount | | | | | Cost
(Note 1) | | | Value
(Note 1) | |
|
|
|
|
|
|
|
|
|
|
|
| | | Short-Term Investments—(continued) | | | | | | | |
$ | 25,000,000 | | Time Warner Inc. 3.09% due 5/22/2008 | | $ | 24,954,937 | | $ | 24,954,937 | |
| 25,000,000 | | Time Warner Inc. 3.03% due 5/28/2008 | | | 24,943,187 | | | 24,943,187 | |
| 32,147,000 | | Time Warner Inc. 2.93% due 6/3/2008 | | | 32,060,659 | | | 32,060,659 | |
| 15,000,000 | | Unilever N.V. 2.18% due 5/23/2008 | | | 14,980,017 | | | 14,980,017 | |
| 25,000,000 | | Vulcan Materials Company 3.05% due 5/5/2008 | | | 24,991,528 | | | 24,991,528 | |
| 13,555,000 | | Vulcan Materials Company 2.97% due 5/14/2008 | | | 13,540,462 | | | 13,540,462 | |
| 21,725,000 | | Vulcan Materials Company 3% due 5/14/2008 | | | 21,701,465 | | | 21,701,465 | |
| 15,725,000 | | Wisconsin Electric Power Company 2.4% due 5/7/2008 | | | 15,718,710 | | | 15,718,710 | |
| 27,000,000 | | Wisconsin Electric Power Company 2.45% due 5/9/2008 | | | 26,985,300 | | | 26,985,300 | |
| | | | |
|
| |
|
| |
| | | Total Short-Term Investments | | | 2,781,264,827 | | | 2,781,264,827 | |
| | | | |
|
| |
|
| |
| | | Total Investments (100.33%) | | $ | 18,772,757,003 | * | | 22,926,204,051 | ** |
| | | | |
|
| | | | |
| | | Liabilities in excess of other assets (–0.33%) | | | | | | (74,580,167 | ) |
| | | | | | | |
|
| |
| | | Net Assets (100.00%) | | | | | $ | 22,851,623,884 | |
| | | | | | | |
|
| |
| | |
|
* | At April 30, 2008 cost is substantially identical for both book and federal income tax purposes. |
** | Gross unrealized appreciation and depreciation of securities at April 30, 2008 were $4,567,162,936 and $413,715,888, respectively (net appreciation was $4,153,447,048). |
Foreign Currency Exchange Contracts
Sales
| | | | | | | | | | | | | | | | | | | | | | | | | |
Settlement
Dates
Through | | Foreign Currency To
Be Delivered | | U.S. $
To Be
Received | | U.S. $ Value at
April 30,
2008 | | Unrealized
Appreciation at
April 30, 2008 | | Unrealized
Depreciation at
April 30, 2008 |
| |
| |
| |
| |
| |
|
| 6/11/2008 | | 1,209,628,000 | | euro | | | $ | 1,791,032,306 | | | | $ | 1,880,735,663 | | | | | — | | | | $ | (89,703,357) | |
| 6/11/2008 | | 311,799,000 | | euro | | | | 481,482,408 | | | | | 484,786,644 | | | | | — | | | | | (3,304,236) | |
| 7/16/2008 | | 54,784,000 | | pound sterling | | | | 106,823,869 | | | | | 108,171,830 | | | | | — | | | | | (1,347,961) | |
| 10/15/2008 | | 96,225,000 | | Swiss franc | | | | 94,907,213 | | | | | 92,518,612 | | | | $ | 2,388,601 | | | | | — | |
| | | | | | | |
|
| | | |
|
| | | |
|
| | | |
|
| |
| | | | | | | | $ | 2,474,245,796 | | | | $ | 2,566,212,749 | | | | $ | 2,388,601 | | | | $ | (94,355,554) | |
| | | | | | | |
|
| | | |
|
| | | |
|
| | | |
|
| |
| |
|
See Notes to Financial Statements. |
22
|
FIRST EAGLE GLOBAL FUND |
|
SCHEDULE OF INVESTMENTS—(Continued) |
April 30, 2008
(Unaudited) |
| | | | | | | | |
Foreign Currencies | | Sector/Industry Classifications | | Percent of Net Assets |
| |
| |
|
EUR | — | euro | | (1) | | Consumer Discretionary | | 7.15% |
|
GBP | — | pound sterling | | (2) | | Consumer Staples | | 8.04% |
|
HKD | — | Hong Kong dollar | | (3) | | Energy | | 4.51% |
|
MYR | — | Malaysian ringgit | | (4) | | Financials | | 6.41% |
|
SEK | — | Swedish krona | | (5) | | Government Issues | | 4.26% |
|
SGD | — | Singapore dollar | | (6) | | Health Care | | 5.94% |
|
TWD | — | Taiwan dollar | | (7) | | Holding Companies | | 6.63% |
|
| | | | (8) | | Industrials | | 13.35% |
|
| | | | (9) | | Materials | | 4.19% |
|
| | | | (10) | | Media | | 4.48% |
|
| | | | (11) | | Paper and Forest Products | | 2.49% |
|
| | | | (12) | | Precious Metals | | 8.40% |
|
| | | | (13) | | Real Estate | | 0.01% |
|
| | | | (14) | | Retail | | 3.54% |
|
| | | | (15) | | Technology and Telecommunications | | 7.09% |
|
| | | | (16) | | Transportation | | 0.98% |
|
| | | | (17) | | Utilities | | 0.69% |
| | |
|
(a) | Non-income producing security/commodity. |
(b) | All or a portion of the security is exempt from registration under the Securities Act of 1933. Rule 144A securities may only be sold to qualified institutional buyers, pursuant to Rule 144A under the Securities Act of 1933. |
| |
|
See Notes to Financial Statements. |
23
FIRST EAGLE GLOBAL FUND
SCHEDULE OF INVESTMENTS—(Continued)
April 30, 2008
(Unaudited)
| |
(c) | Affiliate as defined by the Investment Company Act of 1940. An affiliate is defined as a company in which the Fund directly or indirectly owns, controls, or holds power to vote 5% or more of the outstanding voting securities. Following is a summary of transactions with each such affiliate for the six months ended April 30, 2008. |
| | | | | | | | | | | | | | | | | | | |
|
|
|
|
|
|
|
|
|
|
| | Purchases | | Sales | | Realized
Gain (Loss) | | Dividend
Income | |
| |
| |
| | | |
Affiliate | | Shares | | Cost | | Shares | | Cost | | | |
|
|
|
|
|
|
|
|
|
|
|
|
|
|
Ariake Japan Company, Limited | | | 511,900 | | $ | 7,316,821 | | | — | | | — | | | — | | $ | 219,702 | |
Barnes & Noble, Inc. | | | 3,290,296 | | | 100,611,034 | | | — | | | — | | | — | | | 857,703 | |
Blount International, Inc. | | | 967,810 | | | 11,606,321 | | | — | | | — | | | — | | | — | |
Chofu Seisakusho Company, Limited | | | 1,085,080 | | | 18,294,743 | | | — | | | — | | | — | | | 235,105 | |
Cintas Corporation | | | 2,623,100 | | | 85,614,509 | | | — | | | — | | | — | | | 4,492,682 | |
City e-Solutions Limited | | | — | | | — | | | — | | | — | | | — | | | 79,886 | |
Conbraco Industries, Inc. | | | — | | | — | | | 151 | | $ | 73,688 | | ($ | 24,859 | ) | | — | |
Daeduck GDS Company, Limited | | | — | | | — | | | — | | | — | | | — | | | 340,190 | |
Deceuninck | | | 275,696 | | | 6,662,060 | | | — | | | — | | | — | | | — | |
Deltic Timber Corporation | | | 638,528 | | | 31,718,310 | | | — | | | — | | | — | | | 96,087 | |
East Texas Financial Services, Inc. | | | — | | | — | | | 49,076 | | | 370,133 | | | 372,045 | | | 9,983 | |
Getty Images, Inc. | | | — | | | — | | | — | | | — | | | — | | | — | |
Guyenne et Gascogne SA | | | 237,630 | | | 35,771,253 | | | — | | | — | | | — | | | — | |
IDACORP, Inc. | | | 1,864,980 | | | 64,351,045 | | | — | | | — | | | — | | | 2,104,662 | |
International Speedway Corporation, Class ‘A’ | | | — | | | — | | | 690,050 | | | 35,960,290 | | | (8,473,915 | ) | | — | |
Italcementi S.p.A. RNC | | | 3,993,897 | | | 58,748,465 | | | — | | | — | | | — | | | — | |
Kaiser Ventures LLC | | | — | | | — | | | — | | | — | | | — | | | — | |
Meitec Corporation | | | — | | | — | | | — | | | — | | | — | | | 1,122,857 | |
Mills Music Trust | | | — | | | — | | | — | | | — | | | — | | | 50,769 | |
MISUMI Group Inc. | | | 4,131,750 | | | 67,061,814 | | | — | | | — | | | — | | | 745,605 | |
Nam Yang Dairy Products Company, Limited | | | — | | | — | | | 7,403 | | | 1,807,636 | | | 5,335,322 | | | 27,528 | |
Neopost SA | | | 2,214,187 | | | 229,282,165 | | | — | | | — | | | — | | | — | |
NSC Groupe | | | — | | | — | | | — | | | — | | | — | | | — | |
PARK 24 Company, Limited | | | — | | | — | | | 1,213,040 | | | 13,918,521 | | | (3,077,642 | ) | | — | |
Pfeiffer Vacuum Technology AG | | | 608,204 | | | 54,211,564 | | | — | | | — | | | — | | | — | |
Rayonier Inc. | | | — | | | — | | | — | | | — | | | — | | | 5,905,362 | |
Rémy Cointreau SA | | | 1,319,373 | | | 77,931,651 | | | — | | | — | | | — | | | — | |
Sabeton SA | | | — | | | — | | | — | | | — | | | — | | | — | |
San Juan Basin Royalty Trust | | | 1,748,682 | | | 63,452,158 | | | — | | | — | | | — | | | 3,048,297 | |
Shaw Brothers (Hong Kong) Limited | | | 760,000 | | | 1,466,125 | | | — | | | — | | | — | | | 151,449 | |
Shimachu Company, Limited | | | 1,666,510 | | | 43,979,005 | | | — | | | — | | | — | | | 192,216 | |
Shimano Inc. | | | 1,936,400 | | | 70,917,066 | | | — | | | — | | | — | | | 944,702 | |
Société Sucrière de Pithiviers-le-Vieil | | | 3,835 | | | 3,028,607 | | | — | | | — | | | — | | | 1,943,753 | |
T. Hasegawa Company, Limited | | | 1,271,000 | | | 20,041,773 | | | — | | | — | | | — | | | 577,013 | |
THK Company, Limited (8) | | | 6,806,800 | | | 129,676,944 | | | — | | | — | | | — | | | 1,136,270 | |
Toho Company, Limited | | | 3,453,020 | | | 77,064,690 | | | — | | | — | | | — | | | 1,632,927 | |
Wendel | | | 1,308,259 | | | 172,660,682 | | | — | | | — | | | — | | | — | |
|
|
|
|
|
|
|
|
|
|
|
|
|
|
|
|
|
|
|
|
Total | | | | | | | | | | | | | | ($ | 5,869,049 | ) | $ | 25,914,748 | |
|
|
|
|
|
|
|
|
|
|
|
|
|
|
|
|
|
|
|
|
| |
(d) | Security for which there is less than three market makers. |
(e) | Represents interest in a restricted security which has not been registered with the Securities and Exchange Commission under the Securities Act of 1933. Information concerning each restricted security holding on April 30, 2008 is shown below. |
| | | | | | | | | |
|
|
|
|
|
|
|
|
Security | | Acquisition
Date | | Cost | | Carrying Value
Per Share/Principal | |
|
|
|
|
|
|
|
|
Kaiser Ventures LLC | | | 6/24/1993 | | | — | | $ 2.87 | |
FINEL 9½% due 6/30/2017 | | | 6/22/2005 | | $ | 14,474,400 | | 0.78 | |
FINEL 9½% due 10/15/2017 | | | 10/11/2005 | | | 18,067,500 | | 0.78 | |
LandCo LLC | | | 9/6/2006 | | | 669,030 | | 3.48 | |
|
|
|
|
|
|
|
|
|
|
| |
(f) | Securities valued in accordance with fair value procedures under the supervision of the Board of Trustees, representing 0.10% of net assets. |
(g) | Inflation protected security. |
See Notes to Financial Statements.
24
| |
FUND OVERVIEW | |
| |
FIRST EAGLE OVERSEAS FUND | Data as of April 30, 2008 (Unaudited) |
|
THE INVESTMENT STYLE |
|
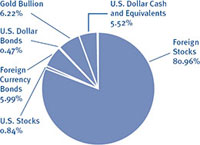
The First Eagle Overseas Fund seeks long-term growth of capital by investing primarily in equities issued by non-U.S. corporations. Management’s research-driven process seeks to minimize risk by focusing on undervalued securities. |
|
ASSET ALLOCATION |
| | | | | | | |
Japan | | 29.98 | % | Mexico | | 1.24 | % |
France | | 17.99 | % | South Africa | | 1.12 | % |
United States | | 7.06 | % | Malaysia | | 1.10 | % |
South Korea | | 6.11 | % | Chile | | 0.58 | % |
Switzerland | | 5.05 | % | India | | 0.51 | % |
Singapore | | 3.95 | % | Belgium | | 0.43 | % |
Germany | | 3.28 | % | Australia | | 0.36 | % |
Italy | | 2.82 | % | Ireland | | 0.15 | % |
Hong Kong | | 2.48 | % | Sweden | | 0.12 | % |
Thailand | | 2.07 | % | Other | | 0.36 | % |
Netherlands | | 2.02 | % | | | | |
Canada | | 1.55 | % | | | | |
Brazil | | 1.43 | % | | | | |
United Kingdom | | 1.41 | % | | | | |
Taiwan | | 1.31 | % | | | | |
The Fund’s portfolio composition (represented as a percentage of net assets) is subject to change at any time.
| | | | | | | | | | | |
| | ONE-YEAR | | | FIVE-YEARS | | | TEN-YEARS |
First Eagle Overseas Fund (A Shares) | | | | | | | | | | | |
without sales load | | 2.20 | % | | | 20.78 | % | | | 15.17 | % |
with sales load | | (2.91 | %) | | | 19.55 | % | | | 14.73 | % |
MSCI EAFE Index | | (1.78 | %) | | | 20.42 | % | | | 6.66 | % |
Consumer Price Index | | 3.94 | % | | | 3.17 | % | | | 2.83 | % |
|
GROWTH OF A $10,000 INITIAL INVESTMENT |
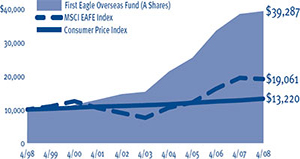
Performance data quoted herein represents past performance and should not be considered indicative of future results. Performance data quoted herein does not reflect the deduction of taxes that a shareholder would pay on Fund distributions or the sale of Fund shares. The average annual returns shown above are historical and reflect changes in share price, reinvested dividends and are net of expenses. The average annual returns for Class A Shares give effect to the deduction of the maximum sales load of 3.75% for periods prior to March 1, 2000 and of 5.00% thereafter. The MSCI EAFE Index is a total return index, reported in U.S. Dollars, based on share prices and reinvested net dividends of approximately 1,100 companies from 21 countries and is not available for purchase. The Consumer Price Index (CPI) represents the change in price of all goods and services purchased for consumption by urban households.
| | | |
Gold bullion (precious metal) | | 6.22 | % |
Pargesa Holding SA (Swiss diversified financials company) | | 2.86 | % |
Shimano Inc. (Japanese bicycle parts manufacturer) | | 2.78 | % |
Sodexo (French food management services provider) | | 2.73 | % |
Republic of France O.A.T. I/L (French government bonds) | | 2.07 | % |
Sompo Japan Insurance Inc. (Japanese insurance company) | | 2.01 | % |
Samsung Electronics Company, Limited (Pfd.) | | 1.79 | % |
(South Korean electronics company) | | | |
Keyence Corporation (Japanese sensors manufacturer) | | 1.55 | % |
SMC Corporation (Japanese automated control devices manufacturer) | | 1.55 | % |
Sanofi-Aventis (French health care company) | | 1.55 | % |
25
FIRST EAGLE OVERSEAS FUND
SCHEDULE OF INVESTMENTS
April 30, 2008
(Unaudited)
| | | | | | | | | | |
|
|
|
|
|
|
|
|
|
| Number
of Shares | | | | Cost
(Note 1) | | Value
(Note 1) | |
|
|
|
|
|
|
|
|
|
|
|
| | | Common and Preferred Stocks (81.80%) | | | | | | | |
| | | | | | | | | | |
| | | Australia and New Zealand (0.41%) | | | | | | | |
| 11,118,174 | | Spotless Group Limited (c)(8) | | $ | 33,300,592 | | $ | 32,996,215 | |
| 5,750,000 | | Tasman Farms (a)(c)(2) | | | 1,054,354 | | | 4,899,619 | |
| | | | |
|
| |
|
| |
| | | | | | 34,354,946 | | | 37,895,834 | |
| | | | |
|
| |
|
| |
| | | Belgium (0.43%) | | | | | | | |
| 2,027,619 | | Deceuninck (c)(1) | | | 47,275,994 | | | 39,452,384 | |
| | | | |
|
| |
|
| |
| | | Brazil (1.43%) | | | | | | | |
| 1,302,232 | | Petroleo Brasiliero SA ADR (3) | | | 29,184,526 | | | 131,655,655 | |
| | | | |
|
| |
|
| |
| | | Canada (1.11%) | | | | | | | |
| 905,890 | | EnCana Corporation (3) | | | 18,012,558 | | | 73,204,971 | |
| 782,650 | | Harry Winston Diamond Corporation (9) | | | 17,836,894 | | | 23,187,327 | |
| 225,892 | | Calfrac Well Services Limited (3) | | | 4,211,062 | | | 5,474,607 | |
| | | | |
|
| |
|
| |
| | | | | | 40,060,514 | | | 101,866,905 | |
| | | | |
|
| |
|
| |
| | | Chile (0.58%) | | | | | | | |
| 24,062,197 | | Quinenco SA (8) | | | 16,182,017 | | | 53,639,353 | |
| | | | |
|
| |
|
| |
| | | Commonwealth of Independent States (0.00%) | | | | | | | |
| 100,000 | | First NIS Regional Fund SICAV (a)(b)(f )(7) | | | 1,000,000 | | | 50,000 | |
| 9,000 | | Baltic Republic Fund (a)(d)(7) | | | 185,750 | | | 6,750 | |
| | | | |
|
| |
|
| |
| | | | | | 1,185,750 | | | 56,750 | |
| | | | |
|
| |
|
| |
| | | France (15.64%) | | | | | | | |
| 3,758,044 | | Sodexo (1) | | | 111,683,443 | | | 251,540,086 | |
| 1,825,563 | | Sanofi-Aventis (6) | | | 151,179,916 | | | 142,509,774 | |
| 1,028,510 | | Wendel (7) | | | 44,759,990 | | | 141,894,695 | |
| 1,186,430 | | Neopost SA (8) | | | 83,868,726 | | | 123,735,356 | |
| 814,500 | | Air Liquide SA (9) | | | 102,537,324 | | | 122,626,481 | |
| 1,477,554 | | Rémy Cointreau SA (2) | | | 43,919,771 | | | 91,653,399 | |
| 1,202,898 | | Carrefour SA (2) | | | 69,676,803 | | | 84,690,029 | |
| 527,048 | | Laurent-Perrier (c)(2) | | | 17,208,120 | | | 76,223,611 | |
| 1,111,540 | | Société BIC SA (8) | | | 57,345,321 | | | 56,889,720 | |
| 842,903 | | Essilor International SA (6) | | | 20,908,156 | | | 52,416,893 | |
| 613,300 | | Total SA (3) | | | 41,767,710 | | | 51,494,494 | |
| 378,980 | | Société Foncière Financière et de Participations (7) | | | 26,414,747 | | | 41,141,027 | |
| 358,791 | | Gaumont SA (10) | | | 21,181,289 | | | 33,504,049 | |
| 39,143 | | Société Sucrière de Pithiviers-le Vieil (c)(2) | | | 15,598,306 | | | 31,744,517 | |
| 227,140 | | Robertet SA (c)(2) | | | 19,306,879 | | | 29,915,220 | |
| 51,500 | | Robertet SA C.I. (2) | | | 2,151,628 | | | 5,531,376 | |
| 540,680 | | Zodiac SA (8) | | | 29,615,032 | | | 28,926,556 | |
See Notes to Financial Statements.
26
FIRST EAGLE OVERSEAS FUND
SCHEDULE OF INVESTMENTS—(Continued)
April 30, 2008
(Unaudited)
| | | | | | | | | | |
|
|
|
|
|
|
|
|
|
| Number
of Shares | | | | Cost
(Note 1) | | Value
(Note 1) | |
|
|
|
|
|
|
|
|
|
|
|
| | | Common and Preferred Stocks—(continued) | | | | | | | |
| | | | | | | | | | |
| | | France—(continued) | | | | | | | |
| 591,120 | | Vivendi SA (10) | | $ | 22,290,481 | | $ | 23,987,974 | |
| 120,246 | | Guyenne et Gascogne SA (2) | | | 20,523,158 | | | 20,607,953 | |
| 300,000 | | Frégate SAS 2% Conv. Pfd. due 3/31/2013 (a)(d)(e)(f)(7) | | | 3,620,400 | | | 8,766,716 | |
| 258,573 | | Trigano SA (1) | | | 11,554,542 | | | 8,693,884 | |
| 3,593,581 | | FINEL (b)(c)(d)(e)(f)(h)(11) | | | 9,152,131 | | | 5,537,828 | |
| 26,499 | | NSC Groupe (8) | | | 4,385,060 | | | 2,681,142 | |
| 100,000 | | Sabeton SA (7) | | | 1,463,142 | | | 2,008,013 | |
| 1,000 | | Société Vermandoise de Sucreries (2) | | | 854,846 | | | 1,902,943 | |
| | | | |
|
| |
|
| |
| | | | | | 932,966,921 | | | 1,440,623,736 | |
| | | | |
|
| |
|
| |
| | | Germany (3.28%) | | | | | | | |
| 915,140 | | Pfeiffer Vacuum Technology AG (c)(8) | | | 39,449,539 | | | 87,607,148 | |
| 784,725 | | Fraport AG (16) | | | 29,042,784 | | | 56,726,578 | |
| 581,442 | | Hornbach Holding AG Pfd. (14) | | | 39,598,447 | | | 53,399,268 | |
| 1,358,769 | | Bertelsmann AG D.R.C. (10) | | | 30,601,684 | | | 46,954,313 | |
| 1,309,950 | | Tognum AG (a)(8) | | | 32,519,141 | | | 37,722,749 | |
| 175,755 | | Axel Springer AG (10) | | | 8,171,772 | | | 19,377,682 | |
| | | | |
|
| |
|
| |
| | | | | | 179,383,367 | | | 301,787,738 | |
| | | | |
|
| |
|
| |
| | | Hong Kong (1.75%) | | | | | | | |
| 7,073,120 | | Guoco Group Limited (7) | | | 52,605,628 | | | 75,821,835 | |
| 17,482,440 | | Shaw Brothers (Hong Kong) Limited (10) | | | 15,754,118 | | | 42,617,941 | |
| 7,000,000 | | Hopewell Holdings Limited (13) | | | 7,763,618 | | | 30,536,114 | |
| 10,000,000 | | SmarTone Telecommunications Holdings Limited (15) | | | 11,260,665 | | | 10,520,846 | |
| 10,851,720 | | City e-Solutions Limited (1) | | | 323,358 | | | 1,406,231 | |
| | | | |
|
| |
|
| |
| | | | | | 87,707,387 | | | 160,902,967 | |
| | | | |
|
| |
|
| |
| | | India (0.51%) | | | | | | | |
| 1,592,150 | | Tata Motors Limited (1) | | | 19,869,354 | | | 26,113,382 | |
| 482,001 | | Nestlé India Limited (2) | | | 6,511,864 | | | 20,924,185 | |
| | | | |
|
| |
|
| |
| | | | | | 26,381,218 | | | 47,037,567 | |
| | | | |
|
| |
|
| |
| | | Italy (2.82%) | | | | | | | |
| 7,315,306 | | Italcementi S.p.A. RNC (9) | | | 87,341,485 | | | 116,830,638 | |
| 1,197,736 | | Italmobiliare S.p.A. RNC (9) | | | 50,324,929 | | | 86,004,554 | |
| 165,635 | | Italmobiliare S.p.A. (9) | | | 19,155,452 | | | 15,755,830 | |
| 6,486,195 | | Gewiss S.p.A. (c)(8) | | | 26,275,520 | | | 41,294,309 | |
| | | | |
|
| |
|
| |
| | | | | | 183,097,386 | | | 259,885,331 | |
| | | | |
|
| |
|
| |
See Notes to Financial Statements.
27
FIRST EAGLE OVERSEAS FUND
SCHEDULE OF INVESTMENTS—(Continued)
April 30, 2008
(Unaudited)
| | | | | | | | | | |
|
|
|
|
|
|
|
|
|
|
|
Number
of Shares | | | | Cost
(Note 1) | | Value
(Note 1) | |
|
|
|
|
|
|
|
|
| | | Common and Preferred Stocks—(continued) | | | | | | | |
| | | | | | | | | | |
| | | Japan (29.98%) | | | | | | | |
| 5,654,500 | | Shimano Inc. (c)(1) | | $ | 104,329,498 | | $ | 256,247,042 | |
| 16,714,550 | | Sompo Japan Insurance Inc. (4) | | | 189,083,834 | | | 185,281,287 | |
| 564,600 | | Keyence Corporation (15) | | | 122,592,037 | | | 143,131,171 | |
| 1,231,500 | | SMC Corporation (8) | | | 156,971,922 | | | 142,529,533 | |
| 2,915,900 | | Secom Company, Limited (8) | | | 124,795,839 | | | 135,213,950 | |
| 2,528,100 | | Ono Pharmaceutical Company, Limited (6) | | | 104,432,562 | | | 133,217,246 | |
| 1,015,780 | | Hirose Electric Company, Limited (15) | | | 120,877,616 | | | 119,898,535 | |
| 4,569,010 | | Toho Company, Limited (10) | | | 70,977,622 | | | 104,184,372 | |
| 926,600 | | FANUC Limited (8) | | | 85,439,855 | | | 97,032,220 | |
| 2,273,020 | | Astellas Pharma Inc. (6) | | | 96,480,690 | | | 92,554,108 | |
| 1,838,970 | | Canon Inc. (15) | | | 88,676,122 | | | 91,618,146 | |
| 13,002,200 | | Aioi Insurance Company, Limited (4) | | | 41,005,681 | | | 81,594,644 | |
| 1,878,480 | | Mitsui Sumitomo Insurance Group Holdings, Inc. (a)(4) | | | 51,364,673 | | | 74,509,291 | |
| 7,500,930 | | NIPPONKOA Insurance Company, Limited (4) | | | 33,069,082 | | | 72,799,445 | |
| 3,710,400 | | MISUMI Group Inc. (8) | | | 63,141,616 | | | 71,808,460 | |
| 2,387,767 | | Meitec Corporation (c)(8) | | | 73,219,254 | | | 68,058,509 | |
| 10,414,300 | | Nissay Dowa General Insurance Company, Limited (4) | | | 52,846,046 | | | 60,465,301 | |
| 3,374,991 | | T. Hasegawa Company, Limited (c)(2) | | | 46,044,962 | | | 56,133,982 | |
| 2,614,150 | | Nitto Kohki Company, Limited (c)(8) | | | 45,743,799 | | | 53,472,673 | |
| 9,513,700 | | Okumura Corporation (8) | | | 49,089,448 | | | 46,759,551 | |
| 2,371,880 | | AIFUL Corporation (4) | | | 40,753,039 | | | 46,358,182 | |
| 3,005,000 | | OSG Corporation (8) | | | 35,696,828 | | | 42,120,383 | |
| 2,022,800 | | Chofu Seisakusho Company, Limited (c)(1) | | | 33,096,084 | | | 41,667,258 | |
| 5,453,000 | | Kansai Paint Company, Limited (9) | | | 41,956,987 | | | 37,250,194 | |
| 2,016,000 | | Fuji Seal International, Inc. (c)(9) | | | 45,363,163 | | | 32,198,055 | |
| 3,341,200 | | Japan Wool Textile Company, Limited (1) | | | 24,718,163 | | | 26,793,623 | |
| 1,716,770 | | Circle K Sunkus Company, Limited (2) | | | 30,450,607 | | | 25,889,303 | |
| 936,347 | | Mandom Corporation (2) | | | 15,567,941 | | | 24,759,930 | |
| 1,760,700 | | Ariake Japan Company, Limited (c)(2) | | | 38,204,234 | | | 24,679,321 | |
| 2,181,200 | | Seikagaku Corporation (6) | | | 17,605,118 | | | 24,032,383 | |
| 2,068,330 | | Maezawa Kasei Industries Company, Limited (c)(8) | | | 31,939,631 | | | 23,680,521 | |
| 2,369,900 | | Yomeishu Seizo Company, Limited (c)(2) | | | 21,291,577 | | | 23,318,681 | |
| 2,376,980 | | Daiichikosho Company, Limited (10) | | | 25,716,873 | | | 23,228,930 | |
| 807,000 | | Shimachu Company, Limited (14) | | | 16,965,249 | | | 22,112,766 | |
| 1,017,260 | | Kose Corporation (2) | | | 28,090,890 | | | 21,928,958 | |
| 1,897,056 | | Nissin Healthcare Food Service Company, Limited (2) | | | 32,039,654 | | | 21,810,464 | |
| 853,360 | | Icom Inc. (c)(15) | | | 22,353,412 | | | 20,112,724 | |
| 1,584,170 | | Cosel Company, Limited (8) | | | 26,081,305 | | | 17,226,663 | |
| 100,000 | | ASAHI Broadcasting Corporation (10) | | | 6,141,481 | | | 16,220,359 | |
| 1,058,246 | | Matsumoto Yushi-Seiyaku Company, Limited (c)(9) | | | 25,950,562 | | | 15,563,187 | |
| 2,681,675 | | The Tokushima Bank, Limited (4) | | | 18,101,280 | | | 15,338,539 | |
|
|
See Notes to Financial Statements. |
28
FIRST EAGLE OVERSEAS FUND
SCHEDULE OF INVESTMENTS—(Continued)
April 30, 2008
(Unaudited)
| | | | | | | | | | |
|
|
|
|
|
|
|
|
|
|
|
Number
of Shares | | | | Cost
(Note 1) | | Value
(Note 1) | |
|
|
|
|
|
|
|
|
| | | Common and Preferred Stocks—(continued) | | | | | | | |
| | | | | | | | | | |
| | | Japan—(continued) | | | | | | | |
| 303,200 | | Mabuchi Motor Company, Limited (15) | | $ | 18,025,224 | | $ | 14,960,287 | |
| 1,547,100 | | PARK24 Company, Limited (8) | | | 13,768,972 | | | 14,051,744 | |
| 507,106 | | SK Kaken Company, Limited (8) | | | 9,442,605 | | | 13,045,074 | |
| 798,380 | | Chudenko Corporation (8) | | | 12,166,734 | | | 12,506,360 | |
| 654,602 | | Nagaileben Company, Limited (6) | | | 12,342,356 | | | 11,916,108 | |
| 594,300 | | Aderans Company, Limited (2) | | | 11,805,545 | | | 11,171,417 | |
| 435,730 | | As One Corporation (6) | | | 9,859,070 | | | 9,392,982 | |
| 1,214,470 | | Sansei Yusoki Company, Limited (c)(8) | | | 10,203,089 | | | 8,843,087 | |
| 1,460,000 | | Shingakukai Company, Limited (c)(1) | | | 10,500,469 | | | 7,301,749 | |
| 378,370 | | Doshisha Corporation, Limited (1) | | | 6,380,105 | | | 5,876,290 | |
| 69,500 | | ROHM Company. Limited (15) | | | 4,514,438 | | | 4,827,545 | |
| 312,785 | | Shoei Company, Limited (7) | | | 1,376,325 | | | 4,602,997 | |
| 423,700 | | Tachi-S Company, Limited (1) | | | 3,263,755 | | | 3,426,135 | |
| 325,000 | | Sonton Food Industry Company, Limited (2) | | | 3,298,777 | | | 2,519,042 | |
| 37,100 | | Tachihi Enterprise Company, Limited (13) | | | 1,374,762 | | | 2,438,381 | |
| 122,100 | | Milbon Company, Limited (2) | | | 3,584,409 | | | 2,339,641 | |
| | | | |
|
| |
|
| |
| | | | | | 2,430,172,871 | | | 2,762,018,729 | |
| | | | |
|
| |
|
| |
| | | Malaysia (0.73%) | | | | | | | |
| 32,980,460 | | Genting Berhad (1) | | | 74,275,581 | | | 66,817,013 | |
| | | | |
|
| |
|
| |
| | | Mexico (1.24%) | | | | | | | |
| 3,901,620 | | Industrias Peñoles SAB de C.V. (12) | | | 3,475,240 | | | 113,964,877 | |
| | | | |
|
| |
|
| |
| | | Netherlands (1.07%) | | | | | | | |
| 496,018 | | Hal Trust NV (7) | | | 13,919,475 | | | 62,540,211 | |
| 698,529 | | Heineken Holding NV (2) | | | 16,264,846 | | | 35,881,887 | |
| | | | |
|
| |
|
| |
| | | | | | 30,184,321 | | | 98,422,098 | |
| | | | |
|
| |
|
| |
| | | Singapore (2.90%) | | | | | | | |
| 19,044,420 | | Haw Par Corporation Limited (c)(8) | | | 56,465,761 | | | 105,190,669 | |
| 3,132,020 | | United Overseas Bank Limited (4) | | | 40,462,665 | | | 47,054,688 | |
| 9,974,000 | | Fraser & Neave Limited (2) | | | 10,285,189 | | | 35,111,183 | |
| 16,750,000 | | Singapore Airport Terminal Services Limited (16) | | | 20,204,311 | | | 28,742,129 | |
| 10,000,000 | | United Overseas Land Limited (7) | | | 12,162,423 | | | 27,985,418 | |
| 17,549,625 | | ComfortDelgro Corporation Limited (16) | | | 6,946,456 | | | 22,617,994 | |
| | | | |
|
| |
|
| |
| | | | | | 146,526,805 | | | 266,702,081 | |
| | | | |
|
| |
|
| |
| | | South Africa (1.12%) | | | | | | | |
| 6,294,170 | | Gold Fields Limited ADR (12) | | | 93,879,639 | | | 84,971,295 | |
| 1,591,010 | | Harmony Gold Mining Company, Limited ADR (a)(12) | | | 17,567,971 | | | 18,598,907 | |
| | | | |
|
| |
|
| |
| | | | | | 111,447,610 | | | 103,570,202 | |
| | | | |
|
| |
|
| |
|
|
See Notes to Financial Statements. |
29
FIRST EAGLE OVERSEAS FUND
SCHEDULE OF INVESTMENTS—(Continued)
April 30, 2008
(Unaudited)
| | | | | | | | | | |
|
|
|
|
|
|
|
|
|
|
|
Number
of Shares | | | | Cost
(Note 1) | | Value
(Note 1) | |
|
|
|
|
|
|
|
|
| | | Common and Preferred Stocks—(continued) | | | | | | | |
| | | | | | | | | | |
| | | South Korea (6.11%) | | | | | | | |
| 320,074 | | Samsung Electronics Company, Limited Pfd. (15) | | $ | 47,837,245 | | $ | 164,721,672 | |
| 1,077,369 | | KT&G Corporation (2) | | | 47,344,293 | | | 89,185,286 | |
| 3,424,534 | | SK Telecom Company, Limited ADR (15) | | | 78,442,399 | | | 77,291,732 | |
| 33,070 | | Lotte Confectionery Company, Limited (2) | | | 10,159,503 | | | 39,381,220 | |
| 2,189,230 | | Kangwon Land Inc. (1) | | | 42,463,170 | | | 45,852,321 | |
| 120,620 | | Nong Shim Company, Limited (2) | | | 31,736,226 | | | 22,195,572 | |
| 39,708 | | Nong Shim Holding Company, Limited (2) | | | 3,625,272 | | | 2,799,936 | |
| 939,030 | | Fursys Inc. (c)(8) | | | 11,308,973 | | | 20,931,851 | |
| 494,900 | | Hankuk Paper Manufacturing Company, Limited (c)(11) | | | 17,020,271 | | | 19,422,844 | |
| 22,950 | | Nam Yang Dairy Products Company, Limited (2) | | | 4,912,653 | | | 18,082,581 | |
| 28,850 | | Nam Yang Dairy Products Company, Limited Pfd. (2) | | | 479,094 | | | 8,459,482 | |
| 117,880 | | Pacific Corporation (2) | | | 18,010,606 | | | 15,460,250 | |
| 1,182,040 | | Dong Ah Tire & Rubber Company, Limited (1) | | | 5,161,359 | | | 11,070,020 | |
| 71,177 | | SK Holdings Company, Limited (3) | | | 9,160,124 | | | 11,038,771 | |
| 1,042,250 | | Daeduck GDS Company, Limited (c)(15) | | | 8,149,986 | | | 8,139,248 | |
| 1,087,440 | | Daeduck Electronics Company, Limited (15) | | | 7,707,302 | | | 5,737,354 | |
| 290,204 | | Sam-A Pharmaceutical Company, Limited (6) | | | 2,323,904 | | | 2,043,425 | |
| 23,136 | | Daekyo Company, Limited Pfd. (1) | | | 905,979 | | | 1,003,756 | |
| | | | |
|
| |
|
| |
| | | | | | 346,748,359 | | | 562,817,321 | |
| | | | |
|
| |
|
| |
| | | Switzerland (5.05%) | | | | | | | |
| 2,300,398 | | Pargesa Holding SA (7) | | | 128,181,891 | | | 263,445,685 | |
| 226,015 | | Nestlé SA (2) | | | 48,733,932 | | | 107,920,887 | |
| 441,106 | | Kuehne & Nagel International AG (16) | | | 2,511,589 | | | 47,295,412 | |
| 1,072 | | Lindt & Spruengli AG (2) | | | 9,210,853 | | | 34,955,738 | |
| 35,000 | | Edipresse SA (10) | | | 11,616,314 | | | 11,752,414 | |
| | | | |
|
| |
|
| |
| | | | | | 200,254,579 | | | 465,370,136 | |
| | | | |
|
| |
|
| |
| | | Taiwan (1.12%) | | | | | | | |
| 44,372,545 | | Compal Electronics Inc. (15) | | | 45,382,197 | | | 49,622,634 | |
| 18,842,980 | | Taiwan Secom Company, Limited (8) | | | 30,321,751 | | | 41,154,715 | |
| 12,908,067 | | Taiwan-Sogo Shinkong Security Company, Limited (8) | | | 11,933,785 | | | 12,760,746 | |
| | | | |
|
| |
|
| |
| | | | | | 87,637,733 | | | 103,538,095 | |
| | | | |
|
| |
|
| |
| | | Thailand (2.07%) | | | | | | | |
| 592,872,785 | | Thai Beverage Public Company Limited (2) | | | 102,744,140 | | | 120,072,184 | |
| 14,789,489 | | Bangkok Bank Public Company Limited NVDR (4) | | | 47,460,044 | | | 64,362,961 | |
| 496,220 | | Bangkok Bank Public Company Limited (4) | | | 1,613,300 | | | 2,190,817 | |
| 250,000 | | The Oriental Hotel Public Company, Limited (1) | | | 1,152,073 | | | 4,320,404 | |
| | | | |
|
| |
|
| |
| | | | | | 152,969,557 | | | 190,946,366 | |
| | | | |
|
| |
|
| |
|
|
See Notes to Financial Statements. |
30
FIRST EAGLE OVERSEAS FUND
SCHEDULE OF INVESTMENTS—(Continued)
April 30, 2008
(Unaudited)
| | | | | | | | | | |
|
|
|
|
|
|
|
|
|
|
|
Number
of Shares | | | | Cost
(Note 1) | | Value
(Note 1) | |
|
|
|
|
|
|
|
|
| | | Common and Preferred Stocks—(continued) | | | | | | | |
| | | | | | | | | | |
| | | United Kingdom (1.39%) | | | | | | | |
| 2,986,700 | | Spirax-Sarco Engineering Plc (8) | | $ | 20,282,387 | | $ | 64,925,041 | |
| 892,218 | | Anglo American Plc (12) | | | 18,748,394 | | | 57,849,017 | |
| 1,819,844 | | JZ Equity Partners, Plc (4) | | | 3,167,687 | | | 4,186,993 | |
| 656,219 | | Chrysalis Group Plc (a)(10) | | | 3,646,833 | | | 1,503,283 | |
| | | | |
|
| |
|
| |
| | | | | | 45,845,301 | | | 128,464,334 | |
| | | | |
|
| |
|
| |
| | | United States (0.84%) | | | | | | | |
| 1,597,613 | | Newmont Mining Corporation Holding Company (12) | | | 51,732,028 | | | 70,630,471 | |
| 34,500 | | Third Avenue Global Value Fund L.P. (a)(b)(d)(7) | | | 3,450,000 | | | 6,970,757 | |
| 14,083 | | Security Capital European Realty (a)(d)(f)(13) | | | — | | | — | |
| | | | |
|
| |
|
| |
| | | | | | 55,182,028 | | | 77,601,228 | |
| | | | |
|
| |
|
| |
| | | Miscellaneous (0.22%) | | | | | | | |
| 1,094,523 | | Banco Latinoamericano de Exportaciones SA ADR (4) | | | 13,960,676 | | | 20,577,032 | |
| | | | |
|
| |
|
| |
| | | Total Common and Preferred Stocks | | | 5,276,460,687 | | | 7,535,613,732 | |
| | | | |
|
| |
|
| |
| | | | | | | | | | |
|
|
|
|
|
|
|
|
|
|
|
Ounces | | | | | | | | | |
|
|
|
|
|
|
|
|
|
|
|
| | | Commodity (6.22%) | | | | | | | |
| 652,751 | | Gold bullion (a) | | | 343,206,873 | | | 572,821,259 | |
| | | | |
|
| |
|
| |
| | | | | | | | | | |
|
|
|
|
|
|
|
|
|
|
|
Principal
Amount | | | | | | | | | |
|
|
|
|
|
|
|
|
|
|
|
| | | Notes, Bonds and Convertible Bond (6.46%) | | | | | | | |
| | | | | | | | | | |
| | | U.S. Dollar Notes and Bonds (0.47%) | | | | | | | |
$ | 1,000,000 | | YPF Sociedad Anonima SA 91/8% due 2/24/2009 (3) | | | 947,617 | | | 1,036,000 | |
| 5,000,000 | | Catalyst Paper Corporation 85/8% due 6/15/2011 (11) | | | 4,438,713 | | | 4,312,500 | |
| 47,142,000 | | Catalyst Paper Corporation 73/8% due 3/01/2014 (11) | | | 38,621,365 | | | 35,827,920 | |
| 2,000,000 | | Legrand SA 81/2% due 2/15/2025 (8) | | | 2,061,744 | | | 2,155,604 | |
| | | | |
|
| |
|
| |
| | | | | | 46,069,439 | | | 43,332,024 | |
| | | | |
|
| |
|
| |
| | | Non U.S. Dollar Notes and Bonds (5.95%) | | | | | | | |
EUR | 9,766,000 | | Koninklijke Ahold NV 57/8% due 5/9/2008 (14) | | | 11,116,584 | | | 15,198,102 | |
SEK | 55,000,000 | | Sweden Government I/L 4.6745% due 12/1/2008 (g)(5) | | | 7,524,078 | | | 11,242,962 | |
HKD | 164,250,000 | | Hong Kong Government 3.34% due 12/19/2008 (5) | | | 21,070,814 | | | 21,392,677 | |
HKD | 351,150,000 | | Hong Kong Government 2.52% due 3/24/2009 (5) | | | 45,273,297 | | | 45,624,473 | |
MYR | 50,260,000 | | Malaysian Government 4.305% due 2/27/2009 (5) | | | 13,258,835 | | | 16,035,565 | |
MYR | 56,664,000 | | Malaysian Government 3.756% due 4/28/2011 (5) | | | 15,178,898 | | | 18,096,354 | |
EUR | 5,500,000 | | Independent News & Media Plc 53/4% due 5/17/2009 (10) | | | 6,238,558 | | | 8,133,232 | |
EUR | 13,869,993 | | Republic of France O.A.T. I/L 3% due 7/25/2009 (g)(5) | | | 13,250,734 | | | 21,982,617 | |
EUR | 102,708,440 | | Republic of France O.A.T. I/L 3% due 7/25/2012 (g)(5) | | | 135,066,942 | | | 168,964,853 | |
|
|
See Notes to Financial Statements. |
31
FIRST EAGLE OVERSEAS FUND
SCHEDULE OF INVESTMENTS—(Continued)
April 30, 2008
(Unaudited)
| | | | | | | | | | |
|
|
|
|
|
|
|
|
|
|
|
Principal
Amount | | | | Cost
(Note 1) | | Value
(Note 1) | |
|
|
|
|
|
|
|
|
| | | Notes, Bonds and Convertible Bond—(continued) | | | | | | | |
| | | | | | | | | | |
| | | Non U.S. Dollar Notes and Bonds—(continued) | | | | | | | |
SGD | 56,842,000 | | Singapore Government 23/8% due 10/1/2009 (5) | | $ | 34,591,318 | | $ | 42,654,545 | |
SGD | 53,282,000 | | Singapore Government 45/8% due 7/1/2010 (5) | | | 38,495,840 | | | 42,222,723 | |
SGD | 15,010,000 | | Singapore Government 35/8% due 7/1/2011 (5) | | | 10,777,003 | | | 11,835,852 | |
EUR | 22,300,000 | | Waterford Wedgwood Plc 97/8% due 12/1/2010 (b)(1) | | | 27,566,598 | | | 14,058,428 | |
GBP | 1,000,000 | | Marks & Spencer 63/8% due 11/7/2011 (1) | | | 1,726,043 | | | 1,929,613 | |
TWD | 538,700,000 | | Taiwan Government 2% due 7/20/2012 (5) | | | 16,376,974 | | | 17,482,719 | |
EUR | 29,150,000 | | UPC Holding BV 73/4% due 1/15/2014 (b)(10) | | | 33,926,339 | | | 43,786,755 | |
EUR | 18,450,000 | | UPC Holding BV 85/8% due 1/15/2014 (b)(10) | | | 21,648,633 | | | 28,396,169 | |
EUR | 4,000,000 | | Wendel 47/8% due 11/4/2014 (7) | | | 4,909,325 | | | 5,119,457 | |
EUR | 8,000,000 | | FINEL 91/2% due 6/30/2017 (b)(d)(e)(f)(11) | | | 9,649,600 | | | 6,226,398 | |
EUR | 10,000,000 | | FINEL 91/2% due 10/15/2017 (b)(d)(e)(f)(11) | | | 12,045,000 | | | 7,782,998 | |
| | | | |
|
| |
|
| |
| | | | | | 479,691,413 | | | 548,166,492 | |
| | | | |
|
| |
|
| |
| | | Non U.S. Dollar Convertible Bond (0.04%) | | | | | | | |
EUR | 243,500 | | Havas SA 4% due 1/01/2009 (10) | | | 1,986,854 | | | 4,087,405 | |
| | | | |
|
| |
|
| |
| | | | | | | | | | |
| | | Total Notes, Bonds and Convertible Bond | | | 527,747,706 | | | 595,585,921 | |
| | | | |
|
| |
|
| |
| | | Short-Term Investments (5.52%) | | | | | | | |
$ | 15,621,000 | | 7-Eleven Inc. 2.2% due 5/9/2008 | | | 15,613,363 | | | 15,613,363 | |
| 39,419,000 | | AT&T Corporation 2.25% due 5/9/2008 | | | 39,399,291 | | | 39,399,291 | |
| 20,000,000 | | AT&T Corporation 2.25% due 5/12/2008 | | | 19,986,250 | | | 19,986,250 | |
| 25,000,000 | | BASF Corporation 2.25% due 6/4/2008 | | | 24,946,875 | | | 24,946,875 | |
| 28,600,000 | | The Clorox Company 2.9% due 5/8/2008 | | | 28,583,873 | | | 28,583,873 | |
| 30,000,000 | | ConocoPhillips Company 2.23% due 5/13/2008 | | | 29,977,700 | | | 29,977,700 | |
| 10,000,000 | | The Dow Chemical Company 3.15% due 6/17/2008 | | | 9,958,875 | | | 9,958,875 | |
| 12,776,000 | | Henkel AG & Company KGaA 2.2% due 5/6/2008 | | | 12,772,096 | | | 12,772,096 | |
| 20,500,000 | | Henkel AG & Company KGaA 2.22% due 5/16/2008 | | | 20,481,038 | | | 20,481,038 | |
| 20,000,000 | | H.J. Heinz Company 2.75% due 5/2/2008 | | | 19,998,472 | | | 19,998,472 | |
| 10,000,000 | | ITT Corporation 2.9% due 5/2/2008 | | | 9,999,194 | | | 9,999,194 | |
| 19,461,000 | | ITT Corporation 2.85% due 5/8/2008 | | | 19,450,215 | | | 19,450,215 | |
| 20,000,000 | | ITT Corporation 2.87% due 5/9/2008 | | | 19,987,245 | | | 19,987,245 | |
| 23,460,000 | | ITT Corporation 2.4% due 5/13/2008 | | | 23,441,232 | | | 23,441,232 | |
| 6,496,000 | | ITT Corporation 2.9% due 5/13/2008 | | | 6,489,721 | | | 6,489,721 | |
| 1,977,000 | | Kraft Foods Inc. 2.73% due 5/5/2008 | | | 1,976,400 | | | 1,976,400 | |
| 19,540,000 | | Kraft Foods Inc. 2.81% due 5/7/2008 | | | 19,530,849 | | | 19,530,849 | |
| 22,194,000 | | L’Oréal SA 2.18% due 5/16/2008 | | | 22,173,840 | | | 22,173,840 | |
| 43,719,000 | | Philip Morris USA 2.42% due 5/2/2008 | | | 43,716,061 | | | 43,716,061 | |
| 26,631,000 | | Philip Morris USA 2.44% due 5/14/2008 | | | 26,607,535 | | | 26,607,535 | |
| 20,238,000 | | Procter and Gamble Company 2.1% due 5/5/2008 | | | 20,233,278 | | | 20,233,278 | |
| 25,172,000 | | Starbucks Corporation 2.85% due 5/1/2008 | | | 25,172,000 | | | 25,172,000 | |
|
|
See Notes to Financial Statements. |
32
FIRST EAGLE OVERSEAS FUND
SCHEDULE OF INVESTMENTS—(Continued)
April 30, 2008
(Unaudited)
| | | | | | | | | | |
|
|
|
|
|
|
|
|
|
|
|
Principal
Amount | | | | Cost
(Note 1) | | Value
(Note 1) | |
|
|
|
|
|
|
|
|
|
| | | Short-Term Investments—(continued) | | | | | | | |
$ | 21,008,000 | | Time Warner Inc. 2.93% due 5/5/2008 | | $ | 21,001,161 | | $ | 21,001,161 | |
| 20,000,000 | | Vulcan Materials Company 3.05% due 5/5/2008 | | | 19,993,222 | | | 19,993,222 | |
| 6,775,000 | | Wisconsin Electric Power Company 2.4% due 5/7/2008 | | | 6,772,290 | | | 6,772,290 | |
| | | | |
|
| |
|
| |
| | | Total Short-Term Investments | | | 508,262,076 | | | 508,262,076 | |
| | | | |
|
| |
|
| |
| | | Total Investments (100.00%) | | $ | 6,655,677,342 | * | | 9,212,282,988 | ** |
| | | | |
|
| | | | |
| | | | | | | | | | |
| | | Other assets in excess of liabilities (0.00%) | | | | | | 368,518 | |
| | | | | | | |
|
| |
| | | Net Assets (100.00%) | | | | | $ | 9,212,651,506 | |
| | | | | | | |
|
| |
| |
|
* | At April 30, 2008 cost is substantially identical for both book and federal income tax purposes. |
** | Gross unrealized appreciation and depreciation of securities at April 30, 2008 were $2,776,608,267 and $220,002,621, respectively (net appreciation was $2,556,605,646). |
Foreign Currency Exchange Contracts
Sales
| | | | | | | | | | | | | | | | | | |
Settlement
Dates
Through | | Foreign Currency To
Be Delivered | | U.S. $
To Be
Received | | U.S. $ Value at
April 30,
2008 | | Unrealized
Appreciation at
April 30, 2008 | | Unrealized
Depreciation at
April 30, 2008 | |
| |
| |
| |
| |
| |
| |
6/11/2008 | | 885,999,000 | euro | | $ | 1,310,369,938 | | $ | 1,377,555,675 | | | | — | | | $ | (67,185,737 | ) |
6/11/2008 | | 97,937,000 | euro | | | 151,650,000 | | | 152,272,937 | | | | — | | | | (622,937 | ) |
7/16/2008 | | 63,991,000 | pound sterling | | | 124,776,690 | | | 126,351,189 | | | | — | | | | (1,574,499 | ) |
10/15/2008 | | 47,189,000 | Swiss franc | | | 46,542,754 | | | 45,371,377 | | | $ | 1,171,377 | | | | — | |
| | | | |
|
| |
|
| | |
|
| | |
|
| |
| | | | | $ | 1,633,339,382 | | $ | 1,701,551,178 | | | $ | 1,171,377 | | | $ | (69,383,173 | ) |
| | | | |
|
| |
|
| | |
|
| | |
|
| |
| | | | | | | |
Foreign Currencies | | Sector/Industry Classifications | | Percent of Net Assets |
| |
| |
|
EUR — euro | | (1) | | Consumer Discretionary | | 8.83 | % |
|
GBP — pound sterling | | (2) | | Consumer Staples | | 12.07 | % |
|
HKD — Hong Kong dollar | | (3) | | Energy | | 2.97 | % |
|
MYR — Malaysian ringgit | | (4) | | Financials | | 7.32 | % |
|
SEK — Swedish krona | | (5) | | Government Issues | | 4.53 | % |
|
SGD — Singapore dollar | | (6) | | Health Care | | 5.08 | % |
|
TWD — Taiwan dollar | | (7) | | Holding Companies | | 6.95 | % |
|
| | (8) | | Industrials | | 15.84 | % |
|
| | (9) | | Materials | | 4.88 | % |
|
| | (10) | | Media | | 4.43 | % |
|
| | (11) | | Paper and Forest Products | | 0.86 | % |
|
| | (12) | | Precious Metals | | 9.97 | % |
|
| | (13) | | Real Estate | | 0.36 | % |
|
| | (14) | | Retail | | 0.99 | % |
|
| | (15) | | Technology and Telecommunications | | 7.71 | % |
|
| | (16) | | Transportation | | 1.69 | % |
| |
|
(a) | Non-income producing security/commodity. |
(b) | All or a portion of this security is exempt from registration under the Securities Act of 1933. Rule 144A securities may only be sold to qualified institutional buyers under the Securities Act of 1933. |
|
|
See Notes to Financial Statements. |
33
FIRST EAGLE OVERSEAS FUND
SCHEDULE OF INVESTMENTS—(Continued)
April 30, 2008
(Unaudited)
| |
(c) | Affiliate as defined by the Investment Company Act of 1940. An affiliate is defined as a company in which the Fund directly or indirectly owns, controls, or holds power to vote 5% or more of the outstanding voting securities. Following is a summary of transactions with each such affiliate for the six months ended April 30, 2008. |
| | | | | | | | | | | | | | | | | |
|
|
|
|
|
|
|
|
|
|
|
|
|
|
| | Purchases | | Sales | | | | | |
| |
| |
| | Realized | | Dividend | |
Affiliate | | Shares | | Cost | | Shares | | Cost | | Gain/(Loss) | | Income | |
|
|
|
|
|
|
|
|
|
|
|
|
|
|
Ariake Japan Company, Limited | | — | | | — | | — | | | — | | | — | | $ | 226,429 | |
Chofu Seisakusho Company, Limited | | 444,700 | | $ | 7,828,181 | | — | | | — | | | — | | | 186,503 | |
Daeduck GDS Company, Limited | | — | | | — | | — | | | — | | | — | | | 223,113 | |
Deceuninck | | — | | | — | | — | | | — | | | — | | | — | |
FINEL | | — | | | — | | — | | | — | | | — | | | — | |
Fuji Seal International, Inc. | | 469,700 | | | 7,396,350 | | — | | | — | | | — | | | 250,747 | |
Fursys Inc. | | — | | | — | | — | | | — | | | — | | | 402,035 | |
Gewiss S.p.A. | | 657,477 | | | 4,346,349 | | — | | | — | | | — | | | — | |
Hankuk Paper Manufacturing Company, Limited | | — | | | — | | — | | | — | | | — | | | 105,943 | |
Haw Par Corporation Limited | | 2,969,770 | | | 13,819,942 | | — | | | — | | | — | | | — | |
Icom Incorporated | | — | | | — | | — | | | — | | | — | | | 146,324 | |
Laurent-Perrier | | — | | | — | | 14,570 | | $ | 663,000 | | $ | 2,012,667 | | | — | |
Maezawa Kasei Industries Company, Limited | | 38,000 | | | 517,168 | | — | | | — | | | — | | | 292,588 | |
Matsumoto Yushi-Seiyaku Company, Limited | | 450,000 | | | 11,183,186 | | — | | | — | | | — | | | 499,003 | |
Meitec Corporation | | — | | | — | | — | | | — | | | — | | | 696,025 | |
Nitto Kohki Company, Limited | | 352,300 | | | 7,485,614 | | 10,000 | | | 226,271 | | | (13,610 | ) | | 655,030 | |
Pfeiffer Vacuum Technology AG | | — | | | — | | — | | | — | | | — | | | — | |
Robertet SA | | — | | | — | | — | | | — | | | — | | | — | |
Sansei Yusoki Company, Limited | | 179,180 | | | 1,055,791 | | — | | | — | | | — | | | 72,640 | |
Shimano Inc. | | 256,000 | | | 9,144,700 | | — | | | — | | | — | | | 854,841 | |
Shingakukai Company, Limited | | 434,000 | | | 2,565,382 | | — | | | — | | | — | | | 200,276 | |
Société Sucrière de Pithiviers-le Vieil | | 393 | | | 288,868 | | — | | | — | | | — | | | 1,103,891 | |
Spotless Group Limited | | — | | | — | | 762,987 | | | 3,082,206 | | | (283,745 | ) | | 904,630 | |
T. Hasegawa Company, Limited | | 227,500 | | | 3,884,872 | | — | | | — | | | — | | | 281,259 | |
Tasman Farms | | — | | | — | | — | | | — | | | — | | | — | |
Yomeishu Seizo Company, Limited | | 1,384,400 | | | 13,089,611 | | — | | | — | | | — | | | 184,659 | |
|
|
|
|
|
|
|
|
|
|
|
|
|
|
|
|
|
|
Total | | | | | | | | | | | | $ | 1,715,312 | | $ | 7,285,936 | |
|
|
|
|
|
|
|
|
|
|
|
|
|
|
|
|
|
|
| |
(d) | Security for which there is less than three market makers. |
(e) | Represents interest in a restricted security which has not been registered with the Securities and Exchange Commission under the Securities Act of 1933. Information concerning each restricted security holding on April 30, 2008 is shown below. |
| | | | | | | | | | | | |
|
|
|
|
|
|
|
|
Security | | Acquisition
Date | | Cost | | Carrying
Value
Per Share/Principal | |
|
|
|
|
|
|
|
|
FINEL | | | 7/14/1999 | | $ | 9,152,131 | | | $ | 1.54 | | |
FINEL 91/2% due 6/30/2017 | | | 6/22/2005 | | | 9,649,600 | | | | 0.78 | | |
FINEL 91/2% due 10/15/2017 | | | 10/11/2005 | | | 12,045,000 | | | | 0.78 | | |
Fregaté SAS 2% Conv. Pfd. due 3/31/2013 | | | 4/30/2004 | | | 3,620,400 | | | | 29.22 | | |
|
|
|
|
|
|
|
|
|
|
|
|
|
| |
(f) | Securities valued in accordance with fair value procedures under the supervision of the Board of Trustees, representing 0.31% of net assets. |
(g) | Inflation protected security. |
(h) | Held through Financiere Bleue, LLC. |
| |
|
See Notes to Financial Statements. |
34
| |
FUND OVERVIEW | |
| |
FIRST EAGLE U.S. VALUE FUND | Data as of April 30, 2008 (Unaudited) |
|
THE INVESTMENT STYLE |
|
The First Eagle U.S. Value Fund seeks long-term growth of capital by investing primarily in equities issued by U.S. corporations. Management utilizes a highly disciplined, bottom-up, value-oriented approach in achieving its investment objective. |
|
ASSET ALLOCATION |
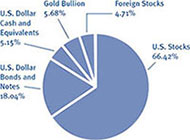
| | |
SECTOR / INDUSTRY | | |
| | |
Industrials | 14.45% | |
Media | 10.83% | |
Energy | 10.57% | |
Consumer Discretionary | 9.76% | |
Health Care | 8.32% | |
Technology | 7.70% | |
Precious Metals | 7.44% | |
Retail | 7.39% | |
Holding Companies | 5.01% | |
Paper & Forest Products | 3.40% | |
Financials | 3.25% | |
Materials | 3.01% | |
Utilities | 1.84% | |
Consumer Staples | 1.19% | |
Government Bonds | 0.69% | |
The Fund’s portfolio composition (represented as a percentage of net assets) is subject to change at any time.
| | | | | | | | | | | | |
AVERAGE ANNUAL RETURNS |
|
| | ONE-YEAR | | | FIVE-YEARS | | | SINCE INCEPTION
(9-04-01) | |
First Eagle U.S. Value Fund (A Shares) | | | | | | | | | | | | |
without sales load | | | 5.20% | | | | 13.67% | | | 12.13 | % | |
with sales load | | | (0.06%) | | | | 12.51% | | | 11.27 | % | |
Standard & Poor’s 500 Index | | | (4.68%) | | | | 10.62% | | | 4.91 | % | |
Consumer Price Index | | | 3.94% | | | | 3.17% | | | 2.90 | % | |
|
GROWTH OF A $10,000 INITIAL INVESTMENT |
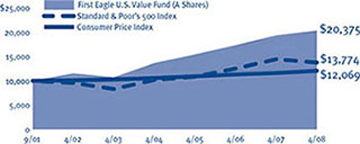
Performance data quoted herein represents past performance and should not be considered indicative of future results. Performance data quoted herein does not reflect the deduction of taxes that a shareholder would pay on Fund distributions or the sale of Fund shares. The average annual returns shown above are historical and reflect changes in share price, reinvested dividends and are net of expenses. The average annual returns for Class A Shares with a sales load gives effect to the deduction of the maximum sales load of 5.00%. The Standard & Poor’s 500 Index is a widely recognized unmanaged index including a representative sample of 500 leading companies in leading sectors of the U.S. economy and is not available for purchase. Although the Standard & Poor’s 500 Index focuses on the large-cap segment of the market, with approximately 75% coverage of U.S. equities, it is also considered a proxy for the total market. The Consumer Price Index (CPI) represents the change in price of all goods and services purchased for consumption by urban households.
| |
TOP 10 HOLDINGS | |
| |
Gold bullion (precious metal) | 5.68% |
Berkshire Hathaway Inc., Class ‘A’(holding company) | 5.01% |
Getty Images, Inc. (media) | 4.23% |
Sanofi-Aventis ADR (French health care company) | 3.71% |
Apache Corporation (energy company) | 3.44% |
Blount International Inc. 87/8% due 8/01/2012
(outdoor industrial equipment manufacturer) | 3.04% |
Johnson & Johnson (health care products manufacturer) | 2.68% |
Yankee Acquisition Corporation (Notes) (consumer retail) | 2.66% |
Cintas Corporation (uniform designer and manufacturer) | 2.62% |
Blount International, Inc. (outdoor industrial equipment manufacturer) | 2.52% |
35
FIRST EAGLE U.S. VALUE FUND
SCHEDULE OF INVESTMENTS
April 30, 2008
(Unaudited)
| | | | | | | | | | |
|
| Number
of Shares | | | | | Cost
(Note 1) | | | Value
(Note 1) | |
|
| | | Common and Preferred Stocks—U.S. (66.42%) | | | | | | | |
| | | | | | | | | | |
| | | Consumer Discretionary (4.19%) | | | | | | | |
| 279,880 | | International Speedway Corporation, Class ‘A’ | | $ | 13,757,768 | | $ | 11,872,510 | |
| 157,990 | | McDonald’s Corporation | | | 4,162,250 | | | 9,413,044 | |
| 129,710 | | Weyco Group, Inc. | | | 2,262,417 | | | 3,542,380 | |
| 70,000 | | Hampshire Group, Limited (a) | | | 1,171,963 | | | 679,000 | |
| 600 | | St. John Knits International Inc. (a) | | | 18,600 | | | 14,625 | |
| | | | |
|
| |
|
| |
| | | | | | 21,372,998 | | | 25,521,559 | |
| | | | |
|
| |
|
| |
| | | | | | | | | | |
| | | Consumer Staples (1.15%) | | | | | | | |
| 168,915 | | Seneca Foods Corporation 0% Conv. Pfd. due 12/31/2049 (a)(c) | | | 2,542,171 | | | 3,462,757 | |
| 54,364 | | Anheuser-Busch Companies Inc. | | | 2,351,957 | | | 2,674,709 | |
| 43,516 | | Seneca Foods Corporation, Class ‘A’ (a) | | | 654,916 | | | 892,078 | |
| | | | |
|
| |
|
| |
| | | | | | 5,549,044 | | | 7,029,544 | |
| | | | |
|
| |
|
| |
| | | | | | | | | | |
| | | Energy (10.57%) | | | | | | | |
| 155,340 | | Apache Corporation | | | 10,336,200 | | | 20,921,191 | |
| 126,970 | | Murphy Oil Corporation | | | 6,509,946 | | | 11,470,470 | |
| 161,760 | | Helmerich & Payne, Inc. | | | 4,793,133 | | | 8,694,600 | |
| 100,808 | | ConocoPhillips Company | | | 3,261,785 | | | 8,684,609 | |
| 187,320 | | San Juan Basin Royalty Trust | | | 6,926,898 | | | 7,198,708 | |
| 179,422 | | BJ Services Company | | | 4,887,125 | | | 5,072,260 | |
| 27,131 | | SEACOR Holdings Inc. (a) | | | 2,047,306 | | | 2,309,119 | |
| | | | |
|
| |
|
| |
| | | | | | 38,762,393 | | | 64,350,957 | |
| | | | |
|
| |
|
| |
| | | Financials (3.03%) | | | | | | | |
| 186,160 | | American Express Company | | | 8,168,523 | | | 8,939,403 | |
| 117,655 | | Willis Group Holdings Limited | | | 3,929,706 | | | 4,088,511 | |
| 48,800 | | Legg Mason, Inc. | | | 3,428,603 | | | 2,941,664 | |
| 49,620 | | Mercury General Corporation | | | 2,712,236 | | | 2,475,542 | |
| | | | |
|
| |
|
| |
| | | | | | 18,239,068 | | | 18,445,120 | |
| | | | |
|
| |
|
| |
| | | Health Care (4.53%) | | | | | | | |
| 242,850 | | Johnson & Johnson | | | 14,777,933 | | | 16,292,807 | |
| 111,522 | | Covidien Limited | | | 3,829,380 | | | 5,206,962 | |
| 90,840 | | Wellpoint Inc. (a) | | | 5,010,131 | | | 4,519,290 | |
| 40,000 | | Dentsply International Inc. | | | 580,150 | | | 1,554,800 | |
| | | | |
|
| |
|
| |
| | | | | | 24,197,594 | | | 27,573,859 | |
| | | | |
|
| |
|
| |
| | | | | | | | | | |
| | | Holding Companies (5.01%) | | | | | | | |
| 228 | | Berkshire Hathaway Inc., Class ‘A’ (a) | | | 20,623,345 | | | 30,517,800 | |
| | | | |
|
| |
|
| |
|
|
See Notes to Financial Statements. |
|
36
FIRST EAGLE U.S. VALUE FUND
SCHEDULE OF INVESTMENTS—(Continued)
April 30, 2008
(Unaudited)
| | | | | | | | | | |
|
| Number
of Shares | | | | | Cost
(Note 1) | | | Value
(Note 1) | |
|
| | | Common and Preferred Stocks—U.S. — (continued) | | | | | | | |
| | | | | | | | | | |
| | | Industrials (11.20%) | | | | | | | |
| 538,210 | | Cintas Corporation | | $ | 19,947,819 | | $ | 15,936,398 | |
| 1,239,695 | | Blount International, Inc. (a) | | | 13,695,961 | | | 15,335,027 | |
| 290,862 | | UniFirst Corporation | | | 8,235,507 | | | 13,615,250 | |
| 108,150 | | 3M Company | | | 8,823,357 | | | 8,316,735 | |
| 165,270 | | Copart, Inc (a) | | | 4,842,500 | | | 6,754,585 | |
| 39,810 | | Alliant Techsystems | | | 4,390,499 | | | 4,378,304 | |
| 175,010 | | UTI Worldwide, Inc. | | | 3,615,331 | | | 3,846,720 | |
| | | | |
|
| |
|
| |
| | | | | | 63,550,974 | | | 68,183,019 | |
| | | | |
|
| |
|
| |
| | | | | | | | | | |
| | | Materials (0.97%) | | | | | | | |
| 63,090 | | Vulcan Materials Company | | | 4,260,470 | | | 4,341,854 | |
| 484,470 | | Tronox Inc. Class ‘A’ | | | 5,166,267 | | | 1,550,304 | |
| | | | |
|
| |
|
| |
| | | | | | 9,426,737 | | | 5,892,158 | |
| | | | |
|
| |
|
| |
| | | | | | | | | | |
| | | Media (7.75%) | | | | | | | |
| 789,390 | | Getty Images, Inc. (a) | | | 28,065,728 | | | 25,773,584 | |
| 473,085 | | Comcast Corporation-Special Class ‘A’ | | | 10,311,701 | | | 9,575,240 | |
| 336,742 | | Liberty Interactive (a) | | | 5,856,746 | | | 5,094,906 | |
| 102,830 | | CBS Corporation, Class ‘B’ | | | 2,969,115 | | | 2,372,288 | |
| 58,216 | | Liberty Entertainment (a) | | | 84,175 | | | 1,510,705 | |
| 72,795 | | News Corporation, Class ‘A’ | | | 1,162,784 | | | 1,303,031 | |
| 33,410 | | Viacom Inc. (a) | | | 1,141,884 | | | 1,284,280 | |
| 14,554 | | Liberty Capital (a) | | | 711,727 | | | 223,695 | |
| | | | |
|
| |
|
| |
| | | | | | 50,303,860 | | | 47,137,729 | |
| | | | |
|
| |
|
| |
| | | | | | | | | | |
| | | Paper and Forest Products (3.40%) | | | | | | | |
| 242,315 | | Plum Creek Timber Company, Inc. | | | 8,168,606 | | | 9,896,145 | |
| 168,900 | | Rayonier Inc. | | | 5,603,666 | | | 7,098,867 | |
| 70,292 | | Deltic Timber Corporation | | | 3,415,633 | | | 3,707,903 | |
| | | | |
|
| |
|
| |
| | | | | | 17,187,905 | | | 20,702,915 | |
| | | | |
|
| |
|
| |
| | | | | | | | | | |
| | | Precious Metals (1.76%) | | | | | | | |
| 242,222 | | Newmont Mining Corporation Holding Company | | | 11,430,875 | | | 10,708,635 | |
| | | | |
|
| |
|
| |
| | | | | | | | | | |
| | | Real Estate (0.00%) | | | | | | | |
| 8,000 | | LandCo LLC (a)(b)(c)(d) | | | 27,840 | | | 27,840 | |
| | | | |
|
| |
|
| |
| | | Retail (7.39%) | | | | | | | |
| 237,034 | | Wal-Mart Stores, Inc. | | | 10,698,940 | | | 13,743,231 | |
| 172,800 | | Costco Wholesale Corporation | | | 7,069,497 | | | 12,312,000 | |
| 202,416 | | Barnes & Noble, Inc. | | | 6,559,266 | | | 6,533,988 | |
| 143,090 | | Tiffany & Company | | | 4,845,079 | | | 6,230,139 | |
|
|
See Notes to Financial Statements. |
|
37
FIRST EAGLE U.S. VALUE FUND
SCHEDULE OF INVESTMENTS—(Continued)
April 30, 2008
(Unaudited)
| | | | | | | | | | |
|
|
|
|
|
|
|
|
|
|
Number
of Shares | | | | Cost
(Note 1) | | Value
(Note 1) | |
|
|
|
|
|
|
|
|
| | | Common and Preferred Stocks—U.S. — (continued) | | | | | | | |
| | | | | | | | | | |
| | | Retail—(continued) | | | | | | | |
| 121,510 | | The Home Depot, Inc. | | $ | 3,161,756 | | $ | 3,499,488 | |
| 129,220 | | Dillard’s Inc., Class ‘A’ | | | 2,516,729 | | | 2,636,088 | |
| | | | |
|
| |
|
| |
| | | | | | 34,851,267 | | | 44,954,934 | |
| | | | |
|
| |
|
| |
| | | Technology and Telecommunications (3.63%) | | | | | | | |
| 228,375 | | Microsoft Corporation | | | 5,124,793 | | | 6,513,255 | |
| 149,870 | | Linear Technology Corporation | | | 4,906,570 | | | 5,239,455 | |
| 225,174 | | Intel Corporation | | | 4,418,164 | | | 5,012,373 | |
| 175,370 | | Maxim Integrated Products | | | 4,957,115 | | | 3,688,031 | |
| 73,955 | | Dell Inc. (a) | | | 1,662,205 | | | 1,377,782 | |
| 150,000 | | Sanmina-SCI Corporation (a) | | | 306,315 | | | 232,500 | |
| | | | |
|
| |
|
| |
| | | | | | 21,375,162 | | | 22,063,396 | |
| | | | |
|
| |
|
| |
| | | Utilities (1.84%) | | | | | | | |
| 194,840 | | IDACORP, Inc. | | | 6,265,544 | | | 6,320,610 | |
| 88,100 | | CalEnergy Capital Trust 6 ½ % Conv. Pfd. | | | 3,778,987 | | | 3,876,400 | |
| 40,000 | | Hawaiian Electric Industries, Inc. | | | 845,477 | | | 986,000 | |
| | | | |
|
| |
|
| |
| | | | | | 10,890,008 | | | 11,183,010 | |
| | | | |
|
| |
|
| |
| | | Total Common and Preferred Stocks—U.S. | | | 347,789,070 | | | 404,292,475 | |
| | | | |
|
| |
|
| |
| | | Common Stocks—Non U.S. (4.71%) | | | | | | | |
| | | | | | | | | | |
| | | Canada (0.50%) | | | | | | | |
| 170,597 | | Franco-Nevada (a)(7) | | | 2,615,303 | | | 3,031,857 | |
| | | | |
|
| |
|
| |
| | | France (3.71%) | | | | | | | |
| 585,440 | | Sanofi-Aventis ADR (5) | | | 23,933,179 | | | 22,586,275 | |
| | | | |
|
| |
|
| |
| | | United Kingdom (0.50%) | | | | | | | |
| 90,110 | | Amdocs Limited (a)(9) | | | 3,134,747 | | | 2,827,652 | |
| 108,139 | | JZ Equity Partners, Plc (3) | | | 215,410 | | | 248,800 | |
| | | | |
|
| |
|
| |
| | | | | | 3,350,157 | | | 3,076,452 | |
| | | | |
|
| |
|
| |
| | | Total Common Stocks—Non U.S. | | | 29,898,639 | | | 28,694,584 | |
| | | | |
|
| |
|
| |
| | | | | | | | | | |
|
|
|
|
|
|
|
|
|
|
|
| Ounces | | | | | | | | | |
|
|
|
|
|
|
|
|
|
|
|
| | | Commodity (5.68%) | | | | | | | |
| 39,366 | | Gold bullion (a) | | | 22,847,023 | | | 34,545,613 | |
| | | | |
|
| |
|
| |
See Notes to Financial Statements.
38
FIRST EAGLE U.S. VALUE FUND
SCHEDULE OF INVESTMENTS—(Continued)
April 30, 2008
(Unaudited)
| | | | | | | | | | |
|
|
|
|
|
|
|
|
Principal
Amount | | | | Cost
(Note 1) | | Value
(Note 1) | |
|
|
|
|
|
|
|
|
| | | Notes, Bonds and Convertible Bonds (18.04%) | | | | | | | |
| | | | | | | | | | |
| | | U.S. Treasury Note (0.69%) | | | | | | | |
$ | 3,988,448 | | U.S. Treasury Inflation Index Note 23/8% due 4/15/2011 (e)(4) | | $ | 4,119,236 | | $ | 4,214,669 | |
| | | | |
|
| |
|
| |
| | | U.S. Dollar Notes and Bonds (17.35%) | | | | | | | |
| 1,075,000 | | GATX Corporation 8 7/8% due 6/1/2009 (3) | | | 1,059,315 | | | 1,115,039 | |
| 500,000 | | American Standard Companies Inc. 8¼% due 6/1/2009 (6) | | | 505,456 | | | 520,767 | |
| 3,000,000 | | Pulte Homes, Inc. 4.875% due 7/15/2009 (1) | | | 2,816,632 | | | 2,910,000 | |
| 2,000,000 | | Pulte Homes, Inc. 6¼% due 2/15/2013 (1) | | | 1,784,159 | | | 1,870,000 | |
| 1,000,000 | | Briggs & Stratton Corporation 87/8% due 3/15/2011 (1) | | | 1,024,476 | | | 1,040,000 | |
| 8,000,000 | | Beazer Homes USA, Inc. 85/8% due 5/15/2011 (1) | | | 6,667,671 | | | 6,940,000 | |
| 6,814,000 | | Celestica Inc. 7 7/8% 7/1/2011 (9) | | | 6,565,519 | | | 6,890,658 | |
| 18,300,000 | | Blount International, Inc. 87/8% due 8/1/2012 (6) | | | 18,554,568 | | | 18,483,000 | |
| 9,681,000 | | Tronox Worldwide LLC 9½% due 12/1/2012 (7) | | | 9,903,967 | | | 8,374,065 | |
| 3,800,000 | | Sanmina-SCI Corporation 6¾% due 3/1/2013 (9) | | | 3,301,470 | | | 3,458,000 | |
| 3,520,000 | | Celestica Inc. 7 5/8% 7/1/2013 (9) | | | 3,292,967 | | | 3,467,200 | |
| 1,000,000 | | Texas Industries, Inc. 7¼% due 7/15/2013 (7) | | | 1,000,000 | | | 995,000 | |
| 12,786,000 | | Sirius Satellite Radio Inc. 9 5/8% due 8/1/2013 (8) | | | 12,320,720 | | | 10,836,135 | |
| 250,000 | | Jostens, Inc. 10¼% due 12/1/2013 (a)(1) | | | 189,101 | | | 241,250 | |
| 250,000 | | Elizabeth Arden Inc. 7¾% due 1/15/2014 (2) | | | 250,000 | | | 247,500 | |
| 814,345 | | Avis Budget Car Rental LLC 75/8% due 5/15/2014 (6) | | | 798,574 | | | 748,179 | |
| 6,862,000 | | Level 3 Financing, Inc. 9¼% due 11/1/2014 (9) | | | 6,630,181 | | | 6,278,730 | |
| 5,424,000 | | Yankee Acquisition Corporation 8½% due 2/15/2015 (1) | | | 5,524,001 | | | 4,610,400 | |
| 14,356,000 | | Yankee Acquisition Corporation 9¾% due 2/15/2017 (1) | | | 14,355,891 | | | 11,592,470 | |
| 8,808,000 | | Valassis Communications, Inc 8¼ due 3/1/2015 (8) | | | 8,035,218 | | | 7,883,160 | |
| 2,000,000 | | Sanmina-SCI Corporation 81/8% due 3/1/2016 (9) | | | 1,740,661 | | | 1,850,000 | |
| 5,000,000 | | Lear Corporation 8¾% due 12/1/2016 (1) | | | 4,726,514 | | | 4,725,000 | |
| 600,000 | | Bausch & Lomb Inc. 7 1/8% due 8/1/2028 (5) | | | 510,925 | | | 504,000 | |
| | | | |
|
| |
|
| |
| | | | | | 111,557,986 | | | 105,580,553 | |
| | | | |
|
| |
|
| |
| | | Total Notes, Bonds and Convertible Bonds | | | 115,677,222 | | | 109,795,222 | |
| | | | |
|
| |
|
| |
| | | Short-Term Investment (4.79%) | | | | | | | |
| 29,181,000 | | Starbucks Corporation 2.85% due 5/1/2008 | | | 29,181,000 | | | 29,181,000 | |
| | | | |
|
| |
|
| |
| | | Total Investments (99.64%) | | $ | 545,392,954 | * | | 606,508,894 | ** |
| | | | |
|
| | | | |
| | | | | | | | | | |
| | | Other assets in excess of liabilities (0.36%) | | | | | | 2,179,314 | |
| | | | | | | |
|
| |
| | | Net assets (100.00%) | | | | | $ | 608,688,208 | |
| | | | | | | |
|
| |
| |
|
* | At April 30, 2008 cost is substantially identical for both book and federal income tax purposes. |
** | Gross unrealized appreciation and depreciation of securities at April 30, 2008 were $89,095,873 and $27,979,933, respectively (net appreciation was $61,115,940). |
See Notes to Financial Statements.
39
FIRST EAGLE U.S. VALUE FUND
SCHEDULE OF INVESTMENTS—(Continued)
April 30, 2008
(Unaudited)
| | |
|
|
|
| Sector/Industry Classifications | |
|
| |
| (1) Consumer Discretionary | |
|
| (2) Consumer Staples | |
|
| (3) Financials | |
|
| (4) Government Issues | |
|
| (5) Health Care | |
|
| (6) Industrials | |
|
| (7) Materials | |
|
| (8) Media | |
|
| (9) Technology and Telecommunications | |
| |
|
(a) | Non-income producing security. |
(b) | Represents interest in a restricted security which has not been registered with the Securities and Exchange Commission under the Securities Act of 1933. Information concerning each restricted security holding on April 30, 2008 is shown below. |
| | | | | | | | | |
|
|
|
|
|
|
|
|
|
|
|
Security | | Acquisition
Date | | Cost | | Carrying
Value Per
Share/Principal | |
|
|
|
|
|
|
|
|
LandCo LLC | | 9/6/2006 | | $ | 27,840 | | $3.48 | |
|
|
|
|
|
|
|
|
|
|
| |
(c) | Securities valued in accordance with fair value procedures under the supervision of the Board of Trustees, representing 0.57% of net assets. |
(d) | Security for which there is less than three market makers. |
(e) | Inflation protected security. |
See Notes to Financial Statements.
40
| |
FIRST EAGLE GOLD FUND | Data as of April 30, 2008 (Unaudited) |
|
|
THE INVESTMENT STYLE |
|
The First Eagle Gold Fund is a non-diversified fund whose investment objective is to provide exposure to the investment characteristics of gold and, to a limited extent, other precious metals. In seeking to achieve its objective, the Fund invests primarily in securities of companies engaged in mining, processing, dealing in or holding gold or other precious metals such as silver, platinum and palladium, both in the United States and in foreign countries. |
|
|
ASSET ALLOCATION |
|
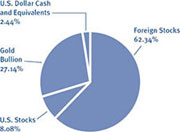
|
|
| | |
COUNTRIES | | |
| | |
United States | 35.22 | % |
Canada | 28.52 | % |
South Africa | 15.09 | % |
Australia | 12.25 | % |
Mexico | 5.37 | % |
United Kingdom | 1.11 | % |
The Fund’s portfolio composition (represented as a percentage of net assets) is subject to change at any time.
| | | | | | | | | | | | |
| | ONE-YEAR | | | FIVE-YEARS | | | TEN-YEARS | |
First Eagle Gold Fund (A Shares) | | | | | | | | | | | | |
without sales load | | 20.72 | % | | | 22.61 | % | | | 16.48 | % | |
with sales load | | 14.68 | % | | | 21.36 | % | | | 16.03 | % | |
FTSE Gold Mines Index | | 18.97 | % | | | 19.99 | % | | | 7.79 | % | |
MSCI World Index | | (2.47 | %) | | | 15.18 | % | | | 5.02 | % | |
Consumer Price Index | | 3.94 | % | | | 3.17 | % | | | 2.83 | % | |
|
|
GROWTH OF A $10,000 INITIAL INVESTMENT |
|
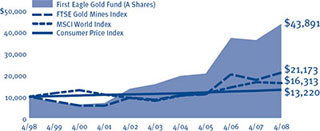
|
|
Performance data quoted herein represents past performance and should not be considered indicative of future results. Performance data quoted herein does not reflect the deduction of taxes that a shareholder would pay on Fund distributions or the sale of Fund shares. The average annual returns shown above are historical and reflect changes in share price, reinvested dividends and are net of expenses. The average annual returns for Class A Shares with a sales load give effect to the deduction of the maximum sales load of 3.75% for periods prior to March 1, 2000 and of 5.00% thereafter. The MSCI World Index is a widely followed, unmanaged group of stocks from 23 international markets and is not available for purchase. This index is a trademark of Morgan Stanley Capital International SA in Geneva, Switzerland. The FTSE Gold Mines Index is an unmanaged index composed of approximately 19 mining companies and is only available without dividends reinvested and is not available for purchase. The Consumer Price Index (CPI) represents the change in price of all goods and services purchased for consumption by urban households.
| | | |
|
TOP 10 HOLDINGS | | | |
|
Gold bullion (United States) | | 27.14 | % |
Randgold Resources Limited ADR (South Africa) | | 6.33 | % |
Newcrest Mining Limited (Australia) | | 5.42 | % |
Industrias Peñoles, SAB de C.V. (Mexico) | | 5.37 | % |
Newmont Mining Corporation Holding Company (United States) | | 4.84 | % |
Gold Fields Limited ADR (South Africa) | | 4.77 | % |
Kinross Gold Corporation (Canada) | | 4.41 | % |
Lihir Gold Limited (Australia) | | 4.21 | % |
Barrick Gold Corporation (Canada) | | 3.84 | % |
Harmony Gold Mining Company Limited ADR (South Africa) | | 3.38 | % |
41
FIRST EAGLE GOLD FUND
SCHEDULE OF INVESTMENTS
April 30, 2008
(Unaudited)
| | | | | | | | | | |
|
|
|
|
|
|
|
|
|
|
|
Number
of Shares | | | | Cost
(Note 1) | | Value
(Note 1) | |
|
|
|
|
|
|
|
|
| | | Common Stocks and Warrants (70.42%) | | | | | | | |
| | | | | | | | | | |
| | | Australia (12.25%) | | | | | | | |
| 2,219,140 | | Newcrest Mining Limited | | $ | 29,675,217 | | $ | 60,423,050 | |
| 16,958,455 | | Lihir Gold Limited (a) | | | 19,567,450 | | | 46,973,586 | |
| 3,354,037 | | Kingsgate Consolidated Limited (a) | | | 12,203,733 | | | 14,694,029 | |
| 1,850,800 | | Independence Group NL | | | 8,497,001 | | | 14,490,408 | |
| | | | |
|
| |
|
| |
| | | | | | 69,943,401 | | | 136,581,073 | |
| | | | |
|
| |
|
| |
| | | Canada (28.52%) | | | | | | | |
| 2,598,122 | | Kinross Gold Corporation | | | 22,681,595 | | | 49,130,487 | |
| 1,108,594 | | Barrick Gold Corporation | | | 30,763,163 | | | 42,813,900 | |
| 1,042,020 | | Goldcorp Inc. | | | 29,297,244 | | | 37,220,954 | |
| 6,098,112 | | IAMGOLD Corporation | | | 34,189,335 | | | 36,750,933 | |
| 2,046,209 | | Yamana Gold Inc. | | | 23,982,805 | | | 26,227,719 | |
| 2,136,414 | | Minefinders Corporation (a) | | | 17,893,103 | | | 22,611,371 | |
| 4,621,350 | | Aurizon Mines Limited (a) | | | 6,761,828 | | | 20,647,414 | |
| 2,819,290 | | Metallica Resources Inc. (a) | | | 3,861,514 | | | 18,978,144 | |
| 2,257,640 | | Dundee Precious Metals, Inc., Class ‘A’ (a) | | | 15,821,906 | | | 14,457,683 | |
| 1,588,178 | | NovaGold Resources Inc. (a) | | | 16,285,174 | | | 11,657,226 | |
| 1,418,981 | | Gammon Gold Inc. (a) | | | 11,555,599 | | | 10,833,959 | |
| 98,763 | | Agnico-Eagle Mines Limited | | | 841,823 | | | 6,202,105 | |
| 345,963 | | Franco-Nevada Corporation (a) | | | 5,594,461 | | | 6,148,469 | |
| 1,787,980 | | Richmont Mines, Inc. (a)(b) | | | 5,728,117 | | | 6,071,179 | |
| 1,440,280 | | Aurelian Resources Inc. (a) | | | 9,491,327 | | | 5,862,935 | |
| 1,187,050 | | Etruscan Resources Inc. (a) | | | 2,920,234 | | | 2,474,985 | |
| | | | |
|
| |
|
| |
| | | | | | 237,669,228 | | | 318,089,463 | |
| | | | |
|
| |
|
| |
| | | Mexico (5.37%) | | | | | | | |
| 2,049,100 | | Industrias Peñoles, SAB de C.V. | | | 5,322,604 | | | 59,853,453 | |
| | | | |
|
| |
|
| |
| | | South Africa (15.09%) | | | | | | | |
| 1,550,810 | | Randgold Resources Limited ADR | | | 27,767,398 | | | 70,592,871 | |
| 3,938,424 | | Gold Fields Limited ADR | | | 57,682,621 | | | 53,168,724 | |
| 3,225,243 | | Harmony Gold Mining Company Limited ADR (a) | | | 35,036,507 | | | 37,703,091 | |
| 202,053 | | AngloGold Ashanti Limited ADR | | | 5,724,303 | | | 6,894,048 | |
| | | | |
|
| |
|
| |
| | | | | | 126,210,829 | | | 168,358,734 | |
| | | | |
|
| |
|
| |
|
|
See Notes to Financial Statements. |
42
FIRST EAGLE GOLD FUND
SCHEDULE OF INVESTMENTS—(Continued)
April 30, 2008
(Unaudited)
| | | | | | | | | | |
|
|
|
|
|
|
|
|
|
|
|
Number
of Shares | | | | Cost
(Note 1) | | Value
(Note 1) | |
|
|
|
|
|
|
|
|
| | | Common Stocks and Warrants—(continued) | | | | | | | |
| | | | | | | | | | |
| | | United States (8.08%) | | | | | | | |
| 1,221,987 | | Newmont Mining Corporation Holding Company | | $ | 50,188,200 | | $ | 54,024,045 | |
| 1,276,851 | | Royal Gold, Inc. | | | 27,030,638 | | | 36,122,115 | |
| 400,000 | | Canyon Resources Corporation warrants exp 12/01/2008 (a)(c)(d) | | | — | | | — | |
| | | | |
|
| |
|
| |
| | | | | | 77,218,838 | | | 90,146,160 | |
| | | | |
|
| |
|
| |
| | | United Kingdom (1.11%) | | | | | | | |
| 190,764 | | Anglo American Plc | | | 11,916,794 | | | 12,368,625 | |
| | | | |
|
| |
|
| |
| | | Total Common Stocks and Warrants | | | 528,281,694 | | | 785,397,508 | |
| | | | |
|
| |
|
| |
| | | | | | | | | | |
|
|
|
|
|
|
|
|
|
|
|
| Ounces | | | | | | | | | |
|
|
|
|
|
|
|
|
|
|
|
| | | Commodity (27.14%) | | | | | | | |
| 344,969 | | Gold bullion (a) | | | 151,703,605 | | | 302,727,153 | |
| | | | |
|
| |
|
| |
| | | | | | | | | | |
|
|
|
|
|
|
|
|
|
|
|
| Principal
Amount | | | | | | | | | |
|
|
|
|
|
|
|
|
|
|
|
| | | Short-Term Investment (2.17%) | | | | | | | |
$ | 24,167,000 | | Starbucks Corporation 2.85% due 5/1/2008 | | | 24,167,000 | | | 24,167,000 | |
| | | | |
|
| |
|
| |
| | | | | | | | | | |
| | | Total Investments (99.73%) | | $ | 704,152,299 | * | | 1,112,291,661 | ** |
| | | | |
|
| | | | |
| | | | | | | | | | |
| | | Other assets in excess of liabilities (0.27%) | | | | | | 3,005,663 | |
| | | | | | | |
|
| |
| | | Net Assets (100.00%) | | | | | $ | 1,115,297,324 | |
| | | | | | | |
|
| |
| |
|
* | At April 30, 2008 cost is substantially identical for both book and federal income tax purposes. |
** | Gross unrealized appreciation and depreciation of securities at April 30, 2008 were $423,440,709 and $15,301,347, respectively (net appreciation was $408,139,362). |
(a) | Non-income producing security/commodity. |
(b) | Affiliate as defined by the Investment Company Act of 1940. An affiliate is defined as a company in which the Fund directly or indirectly owns, controls, or holds power to vote 5% or more of the outstanding voting securities. |
| Following is a summary of transactions with each such affiliate for the six months ended April 30, 2008. |
|
| | | | | | | | | | |
|
|
|
|
|
|
|
|
|
|
|
| | Sales | | | |
| |
| | Realized
(Loss) | |
Affiliate | | Shares | | Cost | | |
|
|
|
|
|
|
|
|
Richmont Mines, Inc. | | | 10,500 | | $ | 55,288 | | ($ | 14,185 | ) |
|
|
|
|
|
|
|
|
|
|
|
|
| |
(c) | Security for which there is less than three market makers. |
(d) | Securities valued in accordance with fair value procedures under the supervision of the Board of Trustees, representing 0.00% of net assets. |
|
|
See Notes to Financial Statements. |
43
FIRST EAGLE FUNDS
First Eagle Fund of America
MANAGEMENT’S DISCUSSION OF FUND PERFORMANCE

Harold Levy
The first six months of fiscal 2008 produced modestly negative returns for FEA shareholders of 1.40% vs. negative 9.64% for the Standard & Poor’s 500 Index.
When we wrote in our annual letter last November that we expected the current environment to be difficult we were, unfortunately, accurate. As the financial implications of the sub-prime debacle worked its way through the economic system stock markets worldwide were roiled. Our damage was modest due to our lack of exposure to financial and consumer oriented companies.
We don’t know where we are in the process of stock market adjustment but, since we are absolute return focused and are cognizant of but not frozen by macroeconomic events, the current environment has also created very interesting opportunities for us to exploit. Several new positions have been initiated. The most significant event in the period, however, was the purchase of one of our top holdings, Millennium Pharmaceuticals Inc. at a very significant premium by Takeda of Japan. We also note several other transactions of non-portfolio companies that were done at very significant premiums. This has to say something about the attractiveness of at least some companies, if not the stock market overall.
The process we anticipated of shareholders of financial institutions being diluted while the rest of the world goes on is well underway. Post Bear Stearns, financial markets are functioning better and if economic growth is not robust, it is not significantly negative. We believe superior research and stock selection can produce positive results for our owners even in difficult times such as these and that is the mission we are pursuing.
Sincerely,
|

|
Harold Levy
Portfolio Manager
May 2008 |
First Eagle Fund of America Class Y will only accept additional investments from existing shareholders. However, Class A and Class C remain open to all investors.
Past performance is no guarantee of future result. Portfolio actively managed. Portfolio and opinions expressed herein are subject to change.
44
| |
FIRST EAGLE FUND OF AMERICA | Data as of April 30, 2008 (Unaudited) |
|
THE INVESTMENT STYLE |
|
The First Eagle Fund of America is a non-diversified U.S. equity fund that seeks long-term capital appreciation. The Fund has a unique event-driven bias that focuses on identifying companies poised to benefit from change that the market has not yet recognized. |
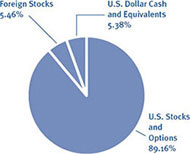
| |
Energy | 19.40% |
Materials | 15.89% |
Health Care Services | 12.61% |
Information Technology | 11.86% |
Industrials | 11.19% |
Consumer Discretionary | 10.49% |
Pharmaceuticals | 8.51% |
Telecommunication Services | 3.32% |
Consumer Staples | 1.79% |
*percentages exclude option positions
The Fund’s portfolio composition (represented as a percentage of net assets) is subject to change at any time.
| | | | | | |
| | ONE-YEAR | | FIVE-YEARS | | TEN-YEARS |
| | | | | | |
First Eagle Fund of America
(Y Shares) | | 5.07% | | 14.54% | | 8.96% |
Standard & Poor’s 500 Index | | (4.68%) | | 10.62% | | 3.89% |
|
GROWTH OF A $10,000 INITIAL INVESTMENT |
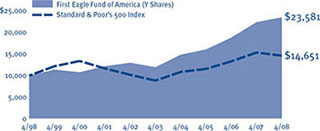
Performance data quoted herein represents past performance and should not be considered indicative of future results. Performance data quoted herein does not reflect the deduction of taxes that a shareholder would pay on Fund distributions or the sale of Fund shares. The Fund’s average annual returns shown above are historical and reflect changes in share price, reinvested dividends and is net of expenses. The Standard & Poor’s 500 Index is a widely recognized unmanaged index including a representative sample of 500 leading companies in leading sectors of the U.S. economy and is not available for purchase. Although the Standard & Poor’s 500 Index focuses on the large-cap segment of the market, with approximately 75% coverage of U.S. equities, it is also considered a proxy for the total market.
| |
Devon Energy Corporation (energy company) | 4.34% |
Baxter International Inc. (diversified medical products and services) | 4.09% |
General Dynamics Corporation (aerospace and defense manufacturer) | 3.87% |
Teekay Corporation (marine transportation) | 3.83% |
Agilent Technologies Inc. (electronic equipment provider) | 3.76% |
DST Systems Inc. (data processing services provider) | 3.46% |
Millennium Pharmaceuticals Inc. (biopharmaceutical company) | 3.43% |
Edwards Lifesciences Corporation (health care equipment
provider) | 2.98% |
Autoliv Inc. (automobile components supplier) | 2.89% |
Eastman Chemical Company (chemicals manufacturer) | 2.86% |
45
FIRST EAGLE FUND OF AMERICA
SCHEDULE OF INVESTMENTS
April 30, 2008
(Unaudited)
| | | | | | | | | | |
|
|
|
|
|
|
|
|
|
|
|
Number | | | | Cost | | Value | |
of Shares | | | | (Note 1) | | (Note 1) | |
|
|
|
|
|
|
|
|
|
|
|
| | | Common and Preferred Stocks—U.S. (89.60%) | | | | | | | |
| | | | | | | | | | |
| | | Consumer Discretionary (10.49%) | | | | | | | |
| 400,940 | | Autoliv Inc. | | $ | 17,468,511 | | $ | 24,553,566 | |
| 897,920 | | The DIRECTV Group, Inc. (a) | | | 21,402,142 | | | 22,124,749 | |
| 439,550 | | The Stanley Works | | | 21,414,766 | | | 21,203,892 | |
| 173,553 | | WABCO Holdings Inc. (b) | | | 6,349,269 | | | 8,288,891 | |
| 141,500 | | Starwood Hotels & Resorts Worldwide, Inc. (b) | | | 7,518,555 | | | 7,387,715 | |
| 296,290 | | Domino’s Pizza Inc. | | | 4,572,334 | | | 3,934,731 | |
| 43,710 | | Harley-Davidson, Inc. | | | 2,253,889 | | | 1,671,908 | |
| | | | |
|
| |
|
| |
| | | | | | 80,979,466 | | | 89,165,452 | |
| | | | |
|
| |
|
| |
| | | Consumer Staples (1.79%) | | | | | | | |
| 517,390 | | Dean Foods Company (a) | | | 7,242,854 | | | 12,024,144 | |
| 141,940 | | Treehouse Foods Inc. (a) | | | 2,978,566 | | | 3,217,780 | |
| | | | |
|
| |
|
| |
| | | | | | 10,221,420 | | | 15,241,924 | |
| | | | |
|
| |
|
| |
| | | Energy (17.10%) | | | | | | | |
| 325,550 | | Devon Energy Corporation (b) | | | 22,062,255 | | | 36,917,370 | |
| 713,670 | | Teekay Corporation | | | 30,376,147 | | | 32,571,899 | |
| 293,930 | | Atlas America Inc. | | | 12,796,200 | | | 20,445,771 | |
| 506,390 | | Dresser-Rand Group Inc. (a) | | | 16,603,067 | | | 18,518,682 | |
| 523,600 | | Denbury Resources Inc. (a)(b) | | | 9,091,835 | | | 16,001,216 | |
| 440,250 | | McMoran Exploration Company (a)(b) | | | 5,780,009 | | | 12,071,655 | |
| 98,400 | | Halliburton Company | | | 3,331,503 | | | 4,517,544 | |
| 190,830 | | Teekay Tankers Limited, Class ‘A’ | | | 3,567,512 | | | 3,850,949 | |
| 22,300 | | Teekay Offshore Partners LP | | | 468,300 | | | 479,227 | |
| | | | |
|
| |
|
| |
| | | | | | 104,076,828 | | | 145,374,313 | |
| | | | |
|
| |
|
| |
| | | Health Care Services (11.65%) | | | | | | | |
| 557,600 | | Baxter International Inc. | | | 22,535,835 | | | 34,749,632 | |
| 457,800 | | Edwards Lifesciences Corporation (a) | | | 19,271,419 | | | 25,371,276 | |
| 791,640 | | HealthSouth Corporation (a) | | | 19,523,294 | | | 15,571,559 | |
| 193,380 | | Covidien Limited (b) | | | 8,358,798 | | | 9,028,912 | |
| 249,280 | | Chemed Corporation | | | 13,016,342 | | | 8,500,448 | |
| 643,290 | | Odyssey Healthcare Inc. (a) | | | 6,380,896 | | | 5,886,104 | |
| | | | |
|
| |
|
| |
| | | | | | 89,086,584 | | | 99,107,931 | |
| | | | |
|
| |
|
| |
| |
|
See Notes to Financial Statements. |
46
FIRST EAGLE FUND OF AMERICA
SCHEDULE OF INVESTMENTS — (Continued)
April 30, 2008
(Unaudited)
| | | | | | | | | | |
|
|
|
|
|
|
|
|
|
|
|
Number | | | | Cost | | Value | |
of Shares | | | | (Note 1) | | (Note 1) | |
|
|
|
|
|
|
|
|
|
|
|
| | | Common and Preferred Stocks—U.S.—(continued) | | | | | | | |
| | | | | | | | | | |
| | | Industrials (11.19%) | | | | | | | |
| 363,700 | | General Dynamics Corporation (b) | | $ | 20,579,243 | | $ | 32,885,754 | |
| 185,600 | | Precision Castparts Corporation (b) | | | 12,829,173 | | | 21,819,136 | |
| 880,160 | | DynCorp International Inc. (a) | | | 11,703,582 | | | 15,798,872 | |
| 321,840 | | WESCO International Inc. (a) | | | 17,608,488 | | | 11,975,666 | |
| 251,540 | | J.B. Hunt Transport Services, Inc. | | | 6,868,559 | | | 8,544,814 | |
| 114,670 | | Armstrong World Industries, Inc. | | | 4,678,042 | | | 4,081,105 | |
| | | | |
|
| |
|
| |
| | | | | | 74,267,087 | | | 95,105,347 | |
| | | | |
|
| |
|
| |
| | | Information Technology (11.19%) | | | | | | | |
| 1,059,080 | | Agilent Technologies Inc. (a)(b) | | | 32,056,304 | | | 31,994,807 | |
| 491,210 | | DST Systems Inc. (a) | | | 26,498,212 | | | 29,394,006 | |
| 3,395,338 | | LSI Corporation (a) | | | 24,938,909 | | | 21,051,096 | |
| 441,210 | | SAVVIS, Inc. (a)(b) | | | 8,611,426 | | | 6,463,726 | |
| 398,090 | | Brooks Automation, Inc. (a) | | | 5,021,403 | | | 4,124,212 | |
| 146,500 | | L-1 Identity Solutions, Inc. (a) | | | 2,007,145 | | | 2,111,065 | |
| | | | |
|
| |
|
| |
| | | | | | 99,133,399 | | | 95,138,912 | |
| | | | |
|
| |
|
| |
| | | Materials (15.89%) | | | | | | | |
| 330,970 | | Eastman Chemical Company (b) | | | 20,473,745 | | | 24,326,295 | |
| 265,030 | | Praxair, Inc. (b) | | | 18,641,271 | | | 24,199,889 | |
| 874,520 | | Crown Holdings Inc. (a) | | | 15,848,464 | | | 23,472,117 | |
| 502,320 | | Celanese Corporation, Series ‘A’ | | | 19,665,661 | | | 22,478,820 | |
| 343,750 | | Ball Corporation | | | 10,533,105 | | | 18,486,875 | |
| 425,060 | | Eagle Materials Inc. | | | 17,862,474 | | | 15,421,177 | |
| 239,430 | | Valspar Corporation | | | 5,098,822 | | | 5,262,671 | |
| 12,660 | | Freeport-McMoRan Copper & Gold Inc., Class ‘B’ | | | 912,406 | | | 1,440,075 | |
| | | | |
|
| |
|
| |
| | | | | | 109,035,948 | | | 135,087,919 | |
| | | | |
|
| |
|
| |
| | | Pharmaceuticals (6.98%) | | | | | | | |
| 1,171,520 | | Millennium Pharmaceuticals Inc. (a) | | | 12,708,862 | | | 29,135,702 | |
| 918,500 | | PDL BioPhama, Inc. (a) | | | 12,846,525 | | | 12,179,310 | |
| 633,810 | | Valeant Pharmaceuticals International (a) | | | 8,003,494 | | | 8,416,997 | |
| 862,095 | | Enzon Pharmaceuticals, Inc. (a) | | | 7,675,756 | | | 7,517,468 | |
| 59,300 | | Onyx Pharmaceuticals, Inc. (a)(b) | | | 2,068,034 | | | 2,084,988 | |
| | | | |
|
| |
|
| |
| | | | | | 43,302,671 | | | 59,334,465 | |
| | | | |
|
| |
|
| |
| | | Telecommunication Services (3.32%) | | | | | | | |
| 315,650 | | Leap Wireless International Inc. (a) | | | 13,541,371 | | | 16,877,805 | |
| 1,111,712 | | General Communication Inc. (a) | | | 7,101,497 | | | 6,903,732 | |
| 265,600 | | Global Crossing Limited (a) | | | 5,380,649 | | | 4,440,832 | |
| | | | |
|
| |
|
| |
| | | | | | 26,023,517 | | | 28,222,369 | |
| | | | |
|
| |
|
| |
| | | Total Common and Preferred Stocks—U.S. | | | 636,126,920 | | | 761,778,632 | |
| | | | |
|
| |
|
| |
| |
|
See Notes to Financial Statements. |
| |
47
FIRST EAGLE FUND OF AMERICA
SCHEDULE OF INVESTMENTS—(Continued)
April 30, 2008
(Unaudited)
| | | | | | | | | | |
|
|
|
|
|
|
|
|
|
|
|
Number | | | | Cost | | Value | |
of Shares | | | | (Note 1) | | (Note 1) | |
|
|
|
|
|
|
|
|
|
|
|
| | | Common Stocks—Non U.S. (5.46%) | | | | | | | |
| | | | | | | | | | |
| | | Canada (3.26%) | | | | | | | |
| 3,641,070 | | UTS Energy Corporation (1)(a) | | $ | 19,671,647 | | $ | 19,557,376 | |
| 406,110 | | MDS Inc. (2)(a) | | | 7,104,569 | | | 8,085,650 | |
| | | | |
|
| |
|
| |
| | | | | | 26,776,216 | | | 27,643,026 | |
| | | | |
|
| |
|
| |
| | | Singapore (0.67%) | | | | | | | |
| 267,930 | | Verigy Limited (3)(a) | | | 4,777,285 | | | 5,725,664 | |
| | | | |
|
| |
|
| |
| | | United Kingdom (1.53%) | | | | | | | |
| 236,850 | | Shire Plc ADR (4) | | | 6,264,382 | | | 13,012,539 | |
| | | | |
|
| |
|
| |
| | | Total Common Stocks—Non U.S. | | | 37,817,883 | | | 46,381,229 | |
| | | | |
|
| |
|
| |
| | | Warrant—U.S. (0.00%) | | | | | | | |
| 1,470,588 | | Regen Biologics Inc. (a)(c)(d)(e)(2) | | | — | | | — | |
| | | | |
|
| |
|
| |
| | | Total Investment Portfolio Excluding Options Written | | | 673,944,803 | | | 808,159,861 | |
| | | | |
|
| |
|
| |
| | | | | | | | | | |
|
|
|
|
|
|
|
|
|
|
|
Contracts | | | | | | | | | |
|
|
|
|
|
|
|
|
|
|
|
| | | Covered Call Options Written (–0.44%) | | | | | | | |
| 594 | | Agilent Technologies Inc. @ $32.5 May 2008 | | | | | | (15,741 | ) |
| 496 | | Covidien Limited @ $45 May 2008 | | | | | | (131,440 | ) |
| 162 | | Denbury Resources Inc. @ $25 May 2008 | | | | | | (89,910 | ) |
| 260 | | Devon Energy Corporation @ $110 Jun 2008 | | | | | | (219,700 | ) |
| 110 | | Devon Energy Corporation @ $90 May 2008 | | | | | | (259,050 | ) |
| 106 | | Eastman Chemical Company @ $60 May 2008 | | | | | | (144,160 | ) |
| 315 | | Eastman Chemical Company @ $65 May 2008 | | | | | | (274,050 | ) |
| 344 | | General Dynamics Corporation @ $80 May 2008 | | | | | | (359,480 | ) |
| 534 | | McMoran Exploration Company @ $22.5 May 2008 | | | | | | (267,000 | ) |
| 593 | | Onyx Pharmaceuticals, Inc. @ $35 May 2008 | | | | | | (118,600 | ) |
| 669 | | Praxair, Inc. @ $75 May 2008 | | | | | | (1,097,160 | ) |
| 160 | | Precision Castparts Corporation @ $105 May 2008 | | | | | | (214,400 | ) |
| 118 | | Precision Castparts Corporation @ $110 June 2008 | | | | | | (137,470 | ) |
| 141 | | Precision Castparts Corporation @ $110 May 2008 | | | | | | (132,540 | ) |
| 19 | | Precision Castparts Corporation @ $115 May 2008 | | | | | | (10,830 | ) |
| 850 | | SAVVIS, Inc. Communications @ $20 Jun 2008 | | | | | | (21,250 | ) |
| 161 | | Starwood Hotels & Resorts Worldwide, Inc. @ $55 Jun 2008 | | | | | | (30,187 | ) |
| 1,254 | | Starwood Hotels & Resorts Worldwide, Inc. @ $55 May 2008 | | | | | | (87,780 | ) |
| 167 | | WABCO Holdings Inc. @ $45 Jun 2008 | | | | | | (63,460 | ) |
| 184 | | WABCO Holdings Inc. @ $45 May 2008 | | | | | | (57,960 | ) |
| | | | | | | |
|
| |
| | | Total Covered Call Options Written (premium received $3,709,060) | | | | | | (3,732,168 | ) |
| | | | | | | |
|
| |
| | | Total Investment Portfolio (94.62%) | | $ | 670,235,743 | * | | 804,427,693 | ** |
| | | | |
|
| | | | |
| | | Other assets in excess of liabilities (5.38%) | | | | | | 45,740,094 | |
| | | | | | | |
|
| |
| | | Net Assets (100.00%) | | | | | $ | 850,167,787 | |
| | | | | | | |
|
| |
| |
|
See Notes to Financial Statements. |
| |
48
FIRST EAGLE FUND OF AMERICA
SCHEDULE OF INVESTMENTS—(Continued)
April 30, 2008
(Unaudited)
| |
|
* | At April 30, 2008 cost is substantially identical for both book and federal income tax purposes. |
** | Gross unrealized appreciation and depreciation of securities at April 30, 2008 were $163,130,935 and $28,938,985, respectively (net appreciation was $134,191,950). |
| | | |
| Sector/Industry Classification | |
| | | |
| (1) | Energy | |
| (2) | Health Care Services | |
| (3) | Information Technology | |
| (4) | Pharmaceuticals | |
| |
|
(a) | Non-income producing security. |
(b) | At April 30, 2008 all or a portion of this security was segregated to cover collateral requirement for options. |
(c) | Security for which there is less than three market makers. |
(d) | Securities valued in accordance with the fair value procedures under the supervision of the Board of Trustees, representing 0.00% of net assets |
(e) | All or a portion of the security is exempt from registration under the Securities Act of 1933. |
49
FIRST EAGLE FUNDS
|
STATEMENTS OF ASSETS AND LIABILITIES |
April 30, 2008 |
(Unaudited) |
| | | | | | | | | | | | | | | | |
|
|
|
|
|
|
|
|
|
|
|
|
|
|
|
| |
| | First Eagle
Global Fund | | First Eagle
Overseas Fund | | First Eagle
U.S. Value Fund | | First Eagle
Gold Fund | | First Eagle
Fund of America | |
|
|
|
|
|
|
|
|
|
|
|
|
|
|
|
| |
Assets: | | | | | | | | | | | | | | | | |
Investments in: (Note 1) | | | | | | | | | | | | | | | | |
Unaffiliated issuers, at value (cost: $15,145,607,696, $5,845,871,182, $545,392,954, $698,424,182 and $673,944,803, respectively) | | $ | 18,637,979,158 | | $ | 8,077,650,736 | | $ | 606,508,894 | | $ | 1,106,220,182 | | $ | 808,159,861 | |
Non-controlled affiliates, at value (cost: $3,627,149,307, $809,806,160, $0, $5,728,117 and $0, respectively) | | | 4,288,224,893 | | | 1,134,632,252 | | | — | | | 6,071,479 | | | — | |
Cash | | | 2,726,951 | | | 367,103 | | | 687 | | | 40 | | | 44,974,680 | |
Foreign cash (cost: $35,790,383 and $26,738,445, respectively) | | | 37,257,617 | | | 27,561,678 | | | — | | | — | | | — | |
Receivable for forward currency contracts held, at value (Note 1) | | | 2,388,601 | | | 1,171,377 | | | — | | | — | | | — | |
Receivable for investment securities sold | | | 3,689,203 | | | 9,869,612 | | | 55,580 | | | 7,579,371 | | | 4,221,180 | |
Receivable for premiums for written options | | | — | | | — | | | — | | | — | | | — | |
Receivable for Fund shares sold | | | 79,028,767 | | | 16,156,452 | | | 971,893 | | | 2,098,811 | | | 627,458 | |
Accrued interest and dividends receivable | | | 66,023,757 | | | 41,925,256 | | | 3,095,376 | | | 167,858 | | | 249,480 | |
Investment for trustee deferred compensation plan (Note 2) | | | 361,023 | | | 406,316 | | | 98,831 | | | 34,454 | | | 240,853 | |
Other assets | | | 428,289 | | | 187,994 | | | 13,449 | | | 26,631 | | | 24,679 | |
| |
|
| |
|
| |
|
| |
|
| |
|
| |
Total Assets | | | 23,118,108,259 | | | 9,309,928,776 | | | 610,744,710 | | | 1,122,198,826 | | | 858,498,191 | |
| |
|
| |
|
| |
|
| |
|
| |
|
| |
Liabilities: | | | | | | | | | | | | | | | | |
Options written, at value (premiums received $3,709,060) (Note 3) | | | — | | | — | | | — | | | — | | | 3,732,169 | |
Payable for Fund shares redeemed | | | 9,750,846 | | | 5,257,207 | | | 795,337 | | | 1,414,854 | | | 141,000 | |
Payable for investment securities purchased | | | 128,160,515 | | | 8,244,579 | | | 241,416 | | | 1,676,193 | | | 2,999,894 | |
Payable for forward currency contracts held,at value (Note 1) | | | 94,355,554 | | | 69,383,173 | | | — | | | 2,140,426 | | | — | |
Investment advisory fees payable (Note 2) | | | 13,759,569 | | | 5,636,750 | | | 370,992 | | | 738,977 | | | 679,353 | |
Administrative costs payable (Note 2) | | | 311,884 | | | 127,766 | | | 8,409 | | | 16,750 | | | 11,549 | |
Distribution fees payable (Note 4) | | | 6,214,517 | | | 1,747,147 | | | 189,328 | | | 302,546 | | | 195,354 | |
Services fees payable (Note 4) | | | 1,179,432 | | | 221,218 | | | 42,791 | | | 40,457 | | | 12,758 | |
Trustee deferred compensation plan (Note 2) | | | 361,023 | | | 406,316 | | | 98,831 | | | 34,454 | | | 240,853 | |
Accrued expenses and other liabilities | | | 12,391,035 | | | 6,253,114 | | | 309,398 | | | 536,845 | | | 317,474 | |
| |
|
| |
|
| |
|
| |
|
| |
|
| |
Total Liabilities | | | 266,484,375 | | | 97,277,270 | | | 2,056,502 | | | 6,901,502 | | | 8,330,404 | |
| |
|
| |
|
| |
|
| |
|
| |
|
| |
Net Assets: | | | | | | | | | | | | | | | | |
Capital stock (par value, $0.001 per share) | | | 503,202 | | | 392,053 | | | 37,898 | | | 46,490 | | | 32,074 | |
Capital surplus | | | 18,290,182,290 | | | 6,579,955,423 | | | 537,301,440 | | | 707,730,245 | | | 662,841,215 | |
Net unrealized appreciation (depreciation) on: | | | | | | | | | | | | | | | | |
Investments | | | 4,153,447,048 | | | 2,556,605,646 | | | 61,115,940 | | | 408,139,362 | | | 134,215,058 | |
Foreign currency related transactions | | | (95,507,950 | ) | | (70,014,406 | ) | | — | | | — | | | — | |
Written Options | | | — | | | — | | | — | | | — | | | (23,108 | ) |
Undistributed net realized gains on investments | | | 845,655,122 | | | 470,356,682 | | | 6,733,685 | | | 39,851,975 | | | 55,597,694 | |
Undistributed net investment income (loss) | | | (342,655,828 | ) | | (324,643,892 | ) | | 3,499,245 | | | (40,470,748 | ) | | (2,495,146 | ) |
| |
|
| |
|
| |
|
| |
|
| |
|
| |
Net Assets | | $ | 22,851,623,884 | | $ | 9,212,651,506 | | $ | 608,688,208 | | $ | 1,115,297,324 | | $ | 850,167,787 | |
| |
|
| |
|
| |
|
| |
|
| |
|
| |
Class A share capital | | $ | 13,275,426,527 | | $ | 5,308,689,799 | | $ | 301,806,651 | | $ | 819,474,281 | | $ | 89,091,153 | |
Shares of beneficial interest outstanding (Class A) (Note 6) | | | 291,782,932 | | | 226,256,487 | | | 18,779,695 | | | 34,105,687 | | | 3,379,927 | |
Net asset value per share | | $ | 45.50 | | $ | 23.46 | | $ | 16.07 | | $ | 24.03 | | $ | 26.36 | |
Maximum offering price per share | | $ | 47.89 | | $ | 24.69 | | $ | 16.92 | | $ | 25.29 | | $ | 27.75 | |
Class I share capital | | $ | 3,670,172,087 | | $ | 2,810,599,647 | | $ | 98,769,031 | | $ | 111,720,551 | | | — | |
Shares of beneficial interest outstanding (Class I) (Note 6) | | | 80,370,388 | | | 118,590,563 | | | 6,090,486 | | | 4,619,134 | | | — | |
Net asset value per share | | $ | 45.67 | | $ | 23.70 | | $ | 16.22 | | $ | 24.19 | | | — | |
Class C share capital | | $ | 5,906,025,270 | | $ | 1,093,362,060 | | $ | 208,112,526 | | $ | 184,102,492 | | $ | 64,499,654 | |
Shares of beneficial interest outstanding (Class C) (Note 6) | | | 131,048,204 | | | 47,205,675 | | | 13,027,938 | | | 7,764,929 | | | 2,690,823 | |
Net asset value per share | | $ | 45.07 | | $ | 23.16 | | $ | 15.97 | | $ | 23.71 | | $ | 23.97 | |
Class Y share capital | | | — | | | — | | | — | | | — | | $ | 696,576,980 | |
Shares of beneficial interest outstanding (Class Y) (Note 6) | | | — | | | — | | | — | | | — | | | 26,003,096 | |
Net asset value per share | | | — | | | — | | | — | | | — | | $ | 26.79 | |
|
|
See Notes to Financial Statements. |
|
50 |
|
FIRST EAGLE FUNDS |
|
STATEMENTS OF OPERATIONS |
FOR THE SIX MONTHS ENDED APRIL 30, 2008 |
(Unaudited) |
| | | | | | | | | | | | | | | | |
|
|
|
|
|
|
|
|
|
|
|
|
|
|
|
| |
| | First Eagle
Global Fund | | First Eagle
Overseas Fund | | First Eagle
U.S. Value Fund | | First Eagle
Gold Fund | | First Eagle
Fund of America | |
|
|
|
|
|
|
|
|
|
|
|
|
|
|
|
| |
Investment Income: | | | | | | | | | | | | | | | | |
Income: | | | | | | | | | | | | | | | | |
Interest | | $ | 104,830,290 | | $ | 33,672,626 | | $ | 7,194,241 | | $ | 342,684 | | $ | 318,319 | |
Dividends from: (net of $11,507,526, $8,058,820, $0, $165,966, $7,860, foreign taxes withheld, respectively) | | | | | | | | | | | | | | | | |
Unaffiliated issuers | | | 128,635,753 | | | 69,331,999 | | | 3,054,377 | | | 2,736,397 | | | 3,127,832 | |
Non-controlled affiliates | | | 25,914,748 | | | 7,285,936 | | | — | | | — | | | — | |
Other Income | | | 293,993 | | | 44,332 | | | — | | | — | | | 66,872 | |
| |
|
| |
|
| |
|
| |
|
| |
|
| |
Total income | | | 259,674,784 | | | 110,334,893 | | | 10,248,618 | | | 3,079,081 | | | 3,513,023 | |
| |
|
| |
|
| |
|
| |
|
| |
|
| |
Expenses: | | | | | | | | | | | | | | | | |
Investment advisory fees (Note 2) | | | 80,060,166 | | | 35,792,243 | | | 2,314,699 | | | 4,508,774 | | | 4,079,670 | |
Administrative costs (Note 2) | | | 2,001,463 | | | 899,168 | | | 58,089 | | | 111,836 | | | 76,757 | |
Distribution fees (Note 4) | | | | | | | | | | | | | | | | |
Class A | | | 15,925,648 | | | 6,649,130 | | | 375,769 | | | 1,094,762 | | | 100,497 | |
Class C | | | 20,267,760 | | | 4,052,112 | | | 812,277 | | | 729,792 | | | 226,521 | |
Class Y | | | — | | | — | | | — | | | — | | | 843,913 | |
Service fees—Class C (Note 4) | | | 6,755,920 | | | 1,350,704 | | | 270,759 | | | 243,264 | | | 75,507 | |
Shareholder servicing agent fees | | | 8,432,652 | | | 3,587,011 | | | 418,291 | | | 631,930 | | | 441,186 | |
Custodian fees | | | 1,715,007 | | | 1,401,607 | | | 18,920 | | | 162,093 | | | 16,613 | |
Printing fees | | | 955,172 | | | 392,535 | | | 39,226 | | | 65,998 | | | 34,476 | |
Accounting fees | | | 505,700 | | | 281,876 | | | 16,438 | | | 28,262 | | | 19,445 | |
Trustees’ fees | | | 296,743 | | | 150,924 | | | 8,986 | | | 17,846 | | | 11,405 | |
Legal fees | | | 191,317 | | | 103,835 | | | 5,838 | | | 11,351 | | | 7,385 | |
Registration and filing fees | | | 171,916 | | | 98,590 | | | 48,637 | | | 38,424 | | | 46,792 | |
Insurance fees | | | 158,000 | | | 87,047 | | | 4,540 | | | 8,527 | | | 5,979 | |
Professional fees | | | 145,204 | | | 54,224 | | | 23,805 | | | 40,053 | | | 30,696 | |
Miscellaneous fees | | | 26,067 | | | 14,214 | | | 787 | | | 1,329 | | | 6,797 | |
| |
|
| |
|
| |
|
| |
|
| |
|
| |
Total expenses | | | 137,608,735 | | | 54,915,220 | | | 4,417,061 | | | 7,694,241 | | | 6,023,639 | |
| |
|
| |
|
| |
|
| |
|
| |
|
| |
Expense reductions due to earnings credits (Note 1) | | | (351,420 | ) | | (192,781 | ) | | (9,049 | ) | | (18,013 | ) | | (43,424 | ) |
| |
|
| |
|
| |
|
| |
|
| |
|
| |
Net expenses | | | 137,257,315 | | | 54,722,439 | | | 4,408,012 | | | 7,676,228 | | | 5,980,215 | |
| |
|
| |
|
| |
|
| |
|
| |
|
| |
Net investment income (loss) (Note 1) | | | 122,417,469 | | | 55,612,454 | | | 5,840,606 | | | (4,597,147 | ) | | (2,467,192 | ) |
| |
|
| |
|
| |
|
| |
|
| |
|
| |
Realized and Unrealized Gains (Losses) on Investments, Foreign Currency Related Transactions and Written Options (Note 1): | | | | | | | | | | | | | | | | |
Net realized gains (losses) from: | | | | | | | | | | | | | | | | |
Unaffiliated issuers | | | 774,859,834 | | | 478,028,445 | | | 6,807,532 | | | 41,633,294 | | | 47,986,852 | |
Non-controlled affiliates | | | — | | | 1,715,312 | | | — | | | — | | | — | |
Foreign currency related transactions | | | (90,004,286 | ) | | (71,089,658 | ) | | (390 | ) | | (203,913 | ) | | — | |
Written Options | | | — | | | — | | | — | | | — | | | 11,028,855 | |
| |
|
| |
|
| |
|
| |
|
| |
|
| |
| | | 684,855,548 | | | 408,654,099 | | | 6,807,142 | | | 41,429,381 | | | 59,015,707 | |
| |
|
| |
|
| |
|
| |
|
| |
|
| |
Change in unrealized appreciation (depreciation) of: | | | | | | | | | | | | | | | | |
Investments | | | (816,840,841 | ) | | (725,785,377 | ) | | (14,739,007 | ) | | (106,699,488 | ) | | (73,405,606 | ) |
Foreign currency related transactions | | | (23,117,193 | ) | | (5,245,034 | ) | | — | | | — | | | — | |
Written Options | | | — | | | — | | | — | | | — | | | 1,891,303 | |
| |
|
| |
|
| |
|
| |
|
| |
|
| |
| | | (839,958,034 | ) | | (731,030,411 | ) | | (14,739,007 | ) | | (106,699,488 | ) | | (71,514,303 | ) |
| |
|
| |
|
| |
|
| |
|
| |
|
| |
Net (losses) on investments, foreign currency related transactions and written options | | | (155,102,486 | ) | | (322,376,312 | ) | | (7,931,865 | ) | | (65,270,107 | ) | | (12,498,596 | ) |
| |
|
| |
|
| |
|
| |
|
| |
|
| |
Net Decrease in Net Assets Resulting from Operations | | ($ | 32,685,017 | ) | ($ | 266,763,858 | ) | ($ | 2,091,259 | ) | ($ | 69,867,254 | ) | ($ | 14,965,788 | ) |
| |
|
| |
|
| |
|
| |
|
| |
|
| |
|
|
See Notes to Financial Statements. |
51
|
FIRST EAGLE FUNDS |
|
STATEMENTS OF CHANGES IN NET ASSETS |
| | | | | | | | | | | | | |
|
|
|
|
|
|
|
|
|
|
|
|
| |
| | First Eagle
Global Fund | | First Eagle
Overseas Fund | |
| |
| |
| |
| | Six Months Ended
April 30, 2008
(Unaudited) | | Year Ended
October 31, 2007 | | Six Months Ended
April 30, 2008
(Unaudited) | | Year Ended
October 31, 2007 | |
|
|
|
|
|
|
|
|
| |
Operations: | | | | | | | | | | | | | |
Net investment income (loss) | | $ | 122,417,469 | | $ | 262,550,196 | | $ | 55,612,454 | | $ | 178,924,456 | |
Net realized gain from investments, foreign currency related transactions and written options | | | 684,855,548 | | | 2,229,151,330 | | | 408,654,099 | | | 1,483,048,927 | |
Increase in unrealized appreciation (depreciation) of investments, foreign currency translation and written options | | | (839,958,034 | ) | | 753,238,101 | | | (731,030,411 | ) | | 248,570,641 | |
| |
|
| |
|
| |
|
| |
|
| |
Net increase (decrease) in net assets resulting from operations | | | (32,685,017 | ) | | 3,244,939,627 | | | (266,763,858 | ) | | 1,910,544,024 | |
| |
|
| |
|
| |
|
| |
|
| |
Distributions to Shareholders: | | | | | | | | | | | | | |
Dividends paid from net investment income | | | (429,976,039 | ) | | (466,827,023 | ) | | (329,968,079 | ) | | (357,741,423 | ) |
Distributions paid from net realized gains from investment transactions | | | | | | | | | | | | | |
Class A | | | (1,149,497,546 | ) | | (890,383,733 | ) | | (652,293,124 | ) | | (474,701,910 | ) |
Class I | | | (273,763,610 | ) | | (199,381,200 | ) | | (406,827,856 | ) | | (329,439,371 | ) |
Class C | | | (481,349,457 | ) | | (374,703,576 | ) | | (133,975,356 | ) | | (95,188,701 | ) |
Class Y | | | — | | | — | | | — | | | — | |
| |
|
| |
|
| |
|
| |
|
| |
Decrease in net assets resulting from distributions | | | (2,334,586,652 | ) | | (1,931,295,532 | ) | | (1,523,064,415 | ) | | (1,257,071,405 | ) |
| |
|
| |
|
| |
|
| |
|
| |
Fund Share Transactions (Note 6): | | | | | | | | | | | | | |
Net proceeds from shares sold | | | 3,497,682,124 | | | 2,599,172,960 | | | 1,022,509,819 | | | 1,215,645,963 | |
Net asset value of shares issued for reinvested dividends and distributions | | | 1,934,139,194 | | | 1,592,691,429 | | | 1,295,750,389 | | | 1,061,174,198 | |
Cost of shares redeemed | | | (2,450,218,158 | ) | | (2,691,012,778 | ) | | (2,434,885,633 | ) | | (2,771,757,783 | ) |
| |
|
| |
|
| |
|
| |
|
| |
Increase (decrease) in net assets from Fund share transactions | | | 2,981,603,160 | | | 1,500,851,611 | | | (116,625,425 | ) | | (494,937,622 | ) |
| |
|
| |
|
| |
|
| |
|
| |
Net increase (decrease) in net assets | | | 614,331,491 | | | 2,814,495,706 | | | (1,906,453,698 | ) | | 158,534,997 | |
| |
|
| |
|
| |
|
| |
|
| |
Net Assets (Note 1): | | | | | | | | | | | | | |
Beginning of period | | | 22,237,292,393 | | | 19,422,796,687 | | | 11,119,105,204 | | | 10,960,570,207 | |
| |
|
| |
|
| |
|
| |
|
| |
End of period (including undistributed net investment (loss) income of ($342,655,828), $56,362,031, ($324,643,892), ($50,288,264), $3,499,245, $8,101,890, $(40,470,748), ($2,137,143), ($2,495,146) and $1,561,650, respectively) | | $ | 22,851,623,884 | | $ | 22,237,292,393 | | $ | 9,212,651,506 | | $ | 11,119,105,204 | |
| |
|
| |
|
| |
|
| |
|
| |
|
|
See Notes to Financial Statements. |
|
52 |
| | | | | | | | | | | | | | | | | |
|
|
|
|
|
|
|
|
|
|
|
|
|
|
|
|
| |
First Eagle
U.S. Value Fund | | First Eagle
Gold Fund | | First Eagle
Fund of America | |
| |
| |
| |
Six Months Ended
April 30, 2008
(Unaudited) | | Year Ended
October 31, 2007 | | Six Months Ended
April 30, 2008
(Unaudited) | | Year Ended
October 31, 2007 | | Six Months Ended
April 30, 2008
(Unaudited) | | Year Ended
October 31, 2007 | |
|
|
|
|
|
|
|
|
|
|
|
|
|
|
|
|
| |
| | | | | | | | | | | | | | | | | |
$ | 5,840,606 | | $ | 11,885,737 | | ($ | 4,597,147 | ) | ($ | 6,735,703 | ) | ($ | 2,467,192 | ) | $ | 1,632,810 | |
| | | | | | | | | | | | | | | | | |
| 6,807,142 | | | 27,345,319 | | | 41,429,381 | | | 81,074,679 | | | 59,015,707 | | | 87,674,002 | |
| | | | | | | | | | | | | | | | | |
| (14,739,007 | ) | | 28,496,843 | | | (106,699,488 | ) | | 277,311,717 | | | (71,514,303 | ) | | 66,112,225 | |
|
| |
|
| |
|
| |
|
| |
|
| |
|
| |
| | | | | | | | | | | | | | | | | |
| (2,091,259 | ) | | 67,727,899 | | | (69,867,254 | ) | | 351,650,693 | | | (14,965,788 | ) | | 155,419,037 | |
|
| |
|
| |
|
| |
|
| |
|
| |
|
| |
| | | | | | | | | | | | | | | | | |
| (10,476,212 | ) | | (9,311,493 | ) | | (33,736,458 | ) | | (33,158,082 | ) | | (1,589,571 | ) | | — | |
| | | | | | | | | | | | | | | | | |
| (12,287,319 | ) | | (10,814,242 | ) | | (30,818,251 | ) | | (100,864,904 | ) | | (8,095,784 | ) | | (5,917,839 | ) |
| (3,944,580 | ) | | (4,725,972 | ) | | (4,799,864 | ) | | (19,372,844 | ) | | — | | | — | |
| (9,027,699 | ) | | (6,912,351 | ) | | (6,948,463 | ) | | (21,208,209 | ) | | (6,936,699 | ) | | (6,484,100 | ) |
| — | | | — | | | — | | | — | | | (71,479,766 | ) | | (81,196,044 | ) |
|
| |
|
| |
|
| |
|
| |
|
| |
|
| |
| | | | | | | | | | | | | | | | | |
| (35,735,810 | ) | | (31,764,058 | ) | | (76,303,036 | ) | | (174,604,039 | ) | | (88,101,820 | ) | | (93,597,983 | ) |
|
| |
|
| |
|
| |
|
| |
|
| |
|
| |
| | | | | | | | | | | | | | | | | |
| 69,007,695 | | | 246,698,098 | | | 135,814,274 | | | 130,832,536 | | | 54,653,699 | | | 134,432,746 | |
| | | | | | | | | | | | | | | | | |
| 29,227,280 | | | 22,893,687 | | | 62,146,503 | | | 141,010,689 | | | 77,214,426 | | | 78,266,917 | |
| (113,258,802 | ) | | (173,473,004 | ) | | (188,397,516 | ) | | (275,883,221 | ) | | (81,547,498 | ) | | (137,169,995 | ) |
|
| |
|
| |
|
| |
|
| |
|
| |
|
| |
| | | | | | | | | | | | | | | | | |
| (15,023,827 | ) | | 96,118,781 | | | 9,563,261 | | | (4,039,996 | ) | | 50,320,627 | | | 75,529,668 | |
|
| |
|
| |
|
| |
|
| |
|
| |
|
| |
| (52,850,896 | ) | | 132,082,622 | | | (136,607,029 | ) | | 173,006,658 | | | (52,746,981 | ) | | 137,350,722 | |
|
| |
|
| |
|
| |
|
| |
|
| |
|
| |
| | | | | | | | | | | | | | | | | |
| 661,539,104 | | | 529,456,482 | | | 1,251,904,353 | | | 1,078,897,695 | | | 902,914,768 | | | 765,564,046 | |
|
| |
|
| |
|
| |
|
| |
|
| |
|
| |
| | | | | | | | | | | | | | | | | |
$ | 608,688,208 | | $ | 661,539,104 | | $ | 1,115,297,324 | | $ | 1,251,904,353 | | $ | 850,167,787 | | $ | 902,914,768 | |
|
| |
|
| |
|
| |
|
| |
|
| |
|
| |
53
FIRST EAGLE FUNDS
NOTES TO FINANCIAL STATEMENTS (Unaudited)
Note 1—Significant Accounting Policies
First Eagle Funds (the “Trust”), is an open-end management investment company registered under the Investment Company Act of 1940, as amended (“1940 Act”). The Trust consists of five separate portfolios, First Eagle Global Fund, First Eagle Overseas Fund, First Eagle U.S. Value Fund, First Eagle Gold Fund and First Eagle Fund of America (each individually a “Fund” or collectively the “Funds”). All the Funds are diversified mutual funds except for First Eagle Gold Fund and First Eagle Fund of America, which are non-diversified. The Trust is a Delaware statutory trust and was, until April 23, 2004, a Maryland corporation operating under the name First Eagle Funds, Inc. (First Eagle SoGen Funds, Inc. prior to December 31, 2002). First Eagle Fund of America, previously a portfolio of a separate Delaware statutory trust, was reorganized as a portfolio of the Trust effective December 31, 2002. The First Eagle Global Fund seeks long-term growth of capital by investing in a wide range of asset classes from markets in the United States and around the world. The First Eagle Overseas Fund seeks long-term growth of capital by investing primarily in equities issued by non-U.S. corporations. The First Eagle U.S. Value Fund seeks long-term growth of capital by investing primarily in equities issued by U.S. corporations. The First Eagle Gold Fund’s investment objective is to provide exposure to the investment characteristics of gold and, to a limited extent, other precious metals. The First Eagle Fund of America is a U.S. equity fund with a unique event-driven bias that seeks capital appreciation.
The following is a summary of significant accounting policies adhered to by the Funds and are in conformity with U.S. generally accepted accounting principles (“GAAP”).
a) Investment valuation—Each Fund computes its net asset value once daily as of the close of trading on each day the New York Stock Exchange (“NYSE”) is open for trading. The Exchange is closed on the following days: New Year’s Day, Rev. Dr. Martin Luther King, Jr. Day, Presidents’ Day, Memorial Day, Independence Day, Labor Day, Thanksgiving Day and Christmas Day. The net asset value per share is computed by dividing the total current value of the assets of a Fund, less its liabilities, by the total number of shares outstanding at the time of such computation.
A portfolio security (including an option), other than a bond, which is traded on a U.S. national securities exchange or a securities exchange abroad is normally valued at the price of the last sale on the exchange as of the close of business on the date on which assets are valued. If there are no sales on such date, such portfolio investment will be valued at the mean between the closing bid and asked prices (and if there is only a bid or only an asked price on such date, valuation will be at such bid or asked price for long or short positions, respectively). Securities, other than bonds, traded in the over-the-counter market are valued at the mean between the last bid and asked prices prior to the time of valuation (and if there is only a bid or only an asked price on such date, valuation will be at such bid or asked price for long or short positions, respectively), except if such unlisted security traded on the NASDAQ in which case it is valued at its last sale price (or, if available in the case of NASDAQ securities, the NASDAQ Official Closing Price (“NOCP”)).
54
FIRST EAGLE FUNDS
NOTES TO FINANCIAL STATEMENTS (Unaudited)—(Continued)
Commodities (such as physical metals) are valued at the spot price at the time trading on the New York Stock Exchange closes (normally 4:00 p.m. E.S.T.). Forward currency contracts are valued at the current cost of covering or offsetting such contracts.
All bonds, whether listed on an exchange or traded in the over-the-counter market (and except for short-term investments as described in the next sentence), for which market quotations are readily available are valued at the mean between the last bid and asked prices received from dealers in the over-the-counter market in the United States or abroad, except that when no asked price is available, bonds are valued at the last bid price alone. Short-term investments maturing in sixty days or less are valued at cost plus interest earned (or discount amortized, as the case may be), which is deemed to approximate value.
London closing exchange rates typically are used to convert foreign security prices into U.S. dollars. Any security that is listed or traded on more than one exchange (or traded in multiple markets) is valued at the relevant quotation on the exchange or market deemed to be the primary trading venue for that security. In the absence of such a quotation, a quotation from the exchange or market deemed by Arnhold and S. Bleichroeder Advisers, LLC (the “Adviser”) to be the secondary trading venue for the particular security shall be used. The Funds use pricing services to identify the market prices of publicly traded securities in their portfolios. When market prices are determined to be “stale” as a result of limited market activity for a particular holding, or in other circumstances when market prices are unavailable, such as for private placements, or determined to be unreliable for a particular holding, such holdings may be “fair valued” in accordance with procedures approved by the Board of Trustees (“Board”).
Additionally, with respect to foreign holdings, specifically in circumstances leading the Adviser to believe that significant events occurring after the close of a foreign market have materially affected the value of a Fund’s holdings in that market, such holdings may be fair valued to reflect the events in accordance with procedures approved by the Board. The determination of whether a particular foreign investment should be fair valued will be based on review of a number of factors, including developments in foreign markets, the performance of U.S. securities markets, and security-specific events. The Funds have adopted procedures under which movements in the prices for U.S. securities (beyond specified thresholds) occurring after the close of a foreign market may require fair valuation of securities traded on that foreign market. The values assigned to a Fund’s holdings therefore may differ on occasion from reported market values. The Trust and the Adviser believe relying on the procedures described above will result in prices that are more reflective of the actual market value of portfolio securities held by the Funds.
b) Investment transactions and income—Investment transactions are accounted for on a trade date basis. The specific identification method is used in determining realized gains and losses from investment transactions. Dividend income is recorded on the ex-dividend date. Interest income is recorded daily on the accrual basis. In computing investment income, each Fund accretes discounts and amortizes premiums on debt obligations using the interest method. Investment income is allocated to each Fund’s share class in proportion to its relative net assets. Payments received from certain investments held by
55
FIRST EAGLE FUNDS
NOTES TO FINANCIAL STATEMENTS (Unaudited)—(Continued)
the Funds may be comprised of dividends, capital gains and return capital. The Funds originally estimate the expected classification of such payments. The amounts may subsequently be reclassified upon receipt of information from the issuer.
c) Expenses—Expenses arising in connection with a Fund are charged directly to that Fund. Expenses common to all Funds are allocated to each Fund in proportion to its relative net assets. Certain expenses are shared with the First Eagle Variable Funds, an affiliated fund group. Such costs are generally allocated using the ratio of the Fund’s average daily net assets relative to the total average daily net assets of the First Eagle Variable Funds. Earnings credits reduce custody fees, shareholder servicing agent fees and accounting fees by the amount of interest earned on balances with such service provider.
d) Foreign currency translation—The market values of securities which are not traded in U.S. currency are recorded in the financial statements after translation to U.S. dollars based on the applicable exchange rates at the end of the period. The costs of such securities are translated at exchange rates prevailing when acquired. Related dividends, interest and withholding taxes are accrued at the rates of exchange prevailing on the respective dates of such transactions.
The net assets of each of the Funds are presented at the foreign exchange rates and market values at the close of the period. The Funds do not isolate that portion of gains and losses on investments which is due to changes in foreign exchange rates from that which is due to changes in market prices of the equity securities. However, for federal income tax purposes each Fund does isolate the effect of changes in foreign exchange rates from the changes in market prices for realized gains and losses on debt obligations.
e) Forward currency contracts—In connection with portfolio purchases and sales of securities denominated in foreign currencies, the Funds may enter into forward currency contracts. Additionally, each Fund may enter into such contracts to hedge certain other foreign currency denominated investments. These contracts are valued at the current cost of covering or offsetting such contracts, and the related realized and unrealized foreign exchange gains and losses are included in the statement of operations. In the event that counterparties fail to settle these currency contracts or the related foreign security trades, a Fund could be exposed to foreign currency fluctuations.
f) Repurchase agreements—The First Eagle Fund of America may enter into repurchase agreement transactions with institutions that meet the advisor’s credit guidelines. Each repurchase agreement is valued at amortized cost. The Fund requires that the collateral received in a repurchase agreement transaction be transferred to a custodian in a manner sufficient to enable the Fund to obtain collateral in the event of a counterparty default. If the counterparty defaults and the fair value of the collateral declines, realization of the collateral by the Fund may be delayed or limited.
56
FIRST EAGLE FUNDS
NOTES TO FINANCIAL STATEMENTS (Unaudited)—(Continued)
g) Options—In order to produce incremental earnings or protect against changes in the value of portfolio securities, the First Eagle Fund of America may buy and sell put and call options, write covered call options on portfolio securities and write cash-secured put options.
First Eagle Fund of America generally purchases put options or writes covered call options to hedge against adverse movements in the value of portfolio holdings. First Eagle Fund of America may also use options for speculative purposes, although it does not employ options for this purpose at the present time. First Eagle Fund of America will segregate assets to cover its obligations under option contracts.
Options contracts are valued daily based upon the last sale price on the principal exchange on which the option is traded and unrealized appreciation/depreciation is recorded. If there is no sale on such day, the mean between the last bid and asked prices is used. First Eagle Fund of America will realize a gain or loss upon the expiration or closing of the option transaction. When an option is exercised, the proceeds on the sale of a written call option, the purchase cost of a written put option, or the cost of the security for a purchased put or call option is adjusted by the amount of premium received or paid. When a written option expires, First Eagle Fund of America will realize a gain equal to the amount of the premium received. When First Eagle Fund of America enters into a closing purchase transaction, First Eagle Fund of America will realize a gain (or loss, if the cost of the closing purchase transaction exceeds the premium received when the option was written) without regard to any unrealized gain or loss on the underlying security and the liability related to such option is eliminated.
The risk in writing a call option is that the Fund gives up the opportunity for profit if the market price of the security increases and the option is exercised. The risk in writing a put option is that First Eagle Fund of America may incur a loss if the market price of the security decreases and the option is exercised. First Eagle Fund of America also has the additional risk of not being able to enter into a closing transaction if a liquid secondary market does not exist. The Fund may also write over-the-counter options where the completion of the obligation is dependent upon the credit standing of the counterparty.
h) Treasury Inflation-Protected Securities—The Funds may invest in Treasury Inflation-Protected Securities (“TIPS”) which are specially structured bonds in which the principal amount is adjusted to keep pace with inflation, as measured by the U.S. Consumer Price Index (“CPI”). The inflation (deflation) adjustment is applied to the principal of each bond on a monthly basis and is accounted for as interest income on the Statements of Operations. TIPS are subject to interest rate risk.
i) Structured notes—In order to qualify as a regulated investment company (“RIC”) under the Internal Revenue Code of 1986, as amended (the “Code”), the Fund must meet certain requirements regarding the source of its income, the diversification of its assets and the distribution of its income. One of these requirements is that the Fund derive at least 90% of its gross income for each taxable year from dividends, interest, payments with respect to certain securities loans, gains from the sale or other
57
FIRST EAGLE FUNDS
NOTES TO FINANCIAL STATEMENTS (Unaudited)—(Continued)
disposition of stock, securities or foreign currencies, other income derived with respect to its business of investing in such stock, securities or currencies or net income derived from interests in certain publicly traded partnerships (“Qualifying Income”). There currently is some uncertainty as to the status of income from commodity-linked structured notes in which certain of the First Eagle Funds have invested, and these Funds have treated such income as Qualifying Income. If any Fund fails to qualify as a RIC, the Fund will be subject to federal, state and local income tax on its net income and capital gains at regular corporate rates (without reduction for distributions to shareholders). When distributed, that income would also be taxable to shareholders as an ordinary dividend to the extent attributable to each Fund’s earnings and profits. None of the Funds held structured notes as of April 30, 2008.
j) Short Sales—The First Eagle Fund of America may seek to realize additional gains through short sale transactions in securities listed on one or more national security exchanges, or in unlisted securities. At the time a short sale is effected, the Fund incurs an obligation to replace the security borrowed at whatever its price may be at the time the Fund purchases it for delivery to the lender. The price at such time may be more or less than the price at which the security was sold by the Fund. Until the security is replaced, the Fund is required to pay the lender amounts equal to any dividend or interest that accrues during the period of the loan. To borrow the security, the Fund may also be required to pay a premium. The proceeds of the short sale will be retained by the broker, to the extent necessary to meet margin requirements, until the short position is closed. There were no open short sales as of April 30, 2008.
k) United States income taxes—It is the intention of each Fund to distribute to shareholders all taxable net investment income and net realized gains on investments, if any, within the allowable time limit, and to comply with the provisions of the Internal Revenue Code for a regulated investment company. First Eagle Global Fund, First Eagle Overseas Fund, First Eagle U.S. Value Fund, First Eagle Gold Fund and First Eagle Fund of America declare and pay such income, dividends and capital gains distributions on an annual basis. In June 2006, the Financial Accounting Standards Board (FASB) issued FASB Interpretation No. 48 – Accounting for Uncertainty in Income Taxes that require the tax effects of certain tax positions to be recognized. These tax positions must meet a “more likely than not” standard that based on their technical merits, have a more than 50 percent likelihood of being sustained upon examination. FASB Interpretation No. 48 is effective for fiscal periods beginning after December 15, 2006. At implementation, the financial statements must be adjusted to reflect only those tax positions that are more likely than not of being sustained. Since the Funds’ fiscal year ends October 31st, the Funds are subject to the new rules effective November 1, 2007. Management of the Trust has evaluated its tax positions and determined that FASB Interpretation No. 48 has no impact on the Trust’s financial statements.
l) Distributions to shareholders—Distributions to shareholders, which are determined in accordance with income tax regulations, are recorded on the ex-dividend date.
58
FIRST EAGLE FUNDS
NOTES TO FINANCIAL STATEMENTS (Unaudited)—(Continued)
m) Class Accounting—Investment income, common expenses and realized/unrealized gain (loss) on investments are allocated to the various classes of the Fund on the basis of daily net assets of each class. Fees relating to a specific class are charged directly to that class.
n) Use of estimates—The preparation of financial statements in conformity with generally accepted accounting principles requires management to make estimates and assumptions that affect the reported amounts of assets and liabilities at the date of the financial statements and the reported amounts of revenues and expenses during the reporting period. Actual results could differ from those estimates.
o) Recently issued accounting pronouncements—In September 2006, the FASB issued SFAS No. 157, “Fair Value Measurements (“SFAS 157”).” SFAS 157 defines fair value, establishes a framework for measuring fair value, and expands disclosures about fair value measurements. SFAS 157 applies to reporting periods beginning after November 15, 2007. Management of the Trust is currently evaluating the impact the adoption of SFAS 157 will have on the Funds’ financial statements disclosures.
Note 2—Investment Advisory Agreement and Transactions with Related Persons
Arnhold and S. Bleichroeder Advisers, LLC (the “Adviser”), a wholly owned subsidiary of Arnhold and S. Bleichroeder Holdings, Inc. (“ASB Holdings”), manages the Funds. For its services, the Adviser receives, pursuant to an Investment Advisory Agreement between the Funds and the Adviser (the “Advisory Agreement”) an annual advisory fee as follows: First Eagle Global Fund, First Eagle Overseas Fund, First Eagle U.S. Value Fund and First Eagle Gold Fund at 0.75% of each Fund’s average daily net assets and First Eagle Fund of America at 1% of the Fund’s average daily net assets. Prior to March 1, 2004, First Eagle Global Fund’s annual advisory fee was at a rate of 1% of the first $25,000,000 and 0.75% in excess of $25,000,000.
The Adviser also performs certain administrative, accounting, operations, compliance and other services on behalf of the Funds, and in accordance with its agreement with them, the Funds reimburse the Adviser for costs (including personnel, related overhead and other costs) related to those services. For the six months ended April 30, 2008, the Funds reimbursed the Adviser amounts as disclosed in the Statements of Operations.
Prior to December 31, 2002, the Adviser had agreed to reimburse the First Eagle U.S. Value Fund to the extent that the aggregate annualized expenses exceeded 1.50% for Class A, 1.25% for Class I and 2.25% for Class C of average daily net assets. If necessary, the Adviser agreed to reimburse the First Eagle Gold Fund to the extent that the aggregate annualized expenses exceeded 2% for Class I and 3% for Class C of average daily net assets until February 29, 2004. For the period from November 1, 2003 to February 29, 2004, the Adviser did not need to reimburse or waive any of First Eagle Gold Fund’s fees.
59
FIRST EAGLE FUNDS
NOTES TO FINANCIAL STATEMENTS (Unaudited)—(Continued)
Pursuant to a subadvisory agreement, dated December 10, 2002 (“Subadvisory Agreement”) with the Adviser/Iridian Asset Management LLC (“Iridian” or the “Subadviser”) manages the investments of the First Eagle Fund of America. Iridian, a registered investment adviser whose primary office is at 276 Post Road West, Westport, CT 06880, is a majority-owned subsidiary of BIAM (US), Inc., a U.S. subsidiary of The Governor and Company of The Bank of Ireland. The fees paid to Iridian by the Adviser under the Subadvisory Agreement are based on a reference amount equal to 50% of the combined (i) fees received by the Adviser for advisory services on behalf of the Fund and (ii) the fees received by the Fund’s distributor for its shareholder liaison services on behalf of the Fund. These amounts are reduced by certain direct marketing costs borne by the Adviser in connection with the Fund and are further reduced by the amount paid by the Adviser for certain administrative expenses incurred in providing services to the Fund.
On December 6, 2002, First Eagle Funds Distributors, a division of ASB Securities LLC, a wholly owned subsidiary of ASB Holdings, assumed the duties of the Funds’ principal underwriter. Previously, Arnhold and S. Bleichroeder, Inc. (“ASB”) acted as the Funds’ principal underwriter. For the six months ended April 30, 2008, First Eagle Funds Distributors realized $931,769, $180,066, $16,809, $87,659 and $15,516, pertaining to the sales of shares of First Eagle Global Fund, First Eagle Overseas Fund, First Eagle U.S. Value Fund, First Eagle Gold Fund and First Eagle Fund of America, respectively.
Included in the accrued expenses, on the accompanying statements of assets and liabilities of First Eagle Global Fund, First Eagle Overseas Fund, First Eagle U.S. Value Fund, First Eagle Gold Fund and First Eagle Fund of America are fees that are payable to trustees in the amounts of $19,297, $28,940, $1,121, $1,283 and $904, respectively. The Trust adopted a Trustee Deferred Compensation Plan, which allows the independent Trustees to defer the receipt of all or a portion of compensation related to performance of their duties as a Trustee. The deferred fees are invested in various First Eagle Funds until distribution in accordance with the Trustee Deferred Compensation Plan.
Note 3—Options
For the six months ended April 30, 2008, First Eagle Fund of America had the following written options transactions:
| | | | | | | |
|
|
|
|
|
|
|
| Number of Contracts | | | Premium | |
|
|
|
|
|
|
|
Options outstanding at October 31, 2007 | | 30,492 | | | $ | 15,679,877 | |
Options written | | 46,075 | | | | 22,164,156 | |
Options assigned | | (2,192 | ) | | | (847,589 | ) |
Options expired/closed | | (67,138 | ) | | | (33,287,384 | ) |
| |
| | |
|
| |
Options outstanding at April 30, 2008 | | 7,237 | | | $ | 3,709,060 | |
| |
| | |
|
| |
|
|
|
|
|
|
|
|
As of April 30, 2008, portfolio securities valued at $41,201,651 were segregated to cover collateral requirements for written options.
60
FIRST EAGLE FUNDS
NOTES TO FINANCIAL STATEMENTS (Unaudited)—(Continued)
Note 4—Plans of Distribution
Under the terms of the Distribution Plans and Agreements (“the Plans”) with First Eagle Funds Distributors, a division of ASB Securities LLC (“the Distributor”), pursuant to the provisions of Rule 12b-1 under the 1940 Act, the First Eagle Global Fund, First Eagle Overseas Fund, First Eagle U.S. Value Fund and First Eagle Gold Fund pay the Distributor quarterly, a distribution fee with respect to Class A and Class C shares at an annual rate of up to 0.25% and 0.75%, respectively, of each Fund’s average daily net assets. In the case of First Eagle Fund of America, it pays the Distributor quarterly, a distribution fee with respect to Class Y, Class C and Class A shares at an annual rate of up to 0.25%, 0.75% and 0.25%, respectively of the average daily net assets. Prior to March 1, 2005, First Eagle Fund of America’s distribution fee for its Class A shares was at an annual rate of 0.50% of average daily net assets. Under the Plan, the Distributor is obligated to use the amounts received under the Plans for payments to qualifying dealers for their assistance in the distribution of a Fund’s shares and the provision of shareholder services and for other expenses such as advertising costs and the payment for the printing and distribution of prospectuses to prospective investors.
The Distributor bears distribution costs of a Fund to the extent they exceed payments received under the Plan. For the six months ended April 30, 2008, the distribution fees incurred by the Funds were as disclosed in the Statements of Operations.
The Distributor receives an annual service fee with respect to Class C at the annual rate of 0.25% of each Fund’s average daily net assets, payable quarterly to cover expenses incurred by the Distributor for providing shareholder liaison services, including assistance with subscriptions, redemptions and other shareholder questions. For the year six months ended April 30, 2008, the services fees incurred by the Funds were as disclosed in the Statement of Operations.
Note 5—Purchases and Sales of Securities
During the six months ended April 30, 2008, the aggregate cost of purchases of investments, excluding short-term securities, totaled $5,682,384,426, $801,133,545, $87,526,477, $65,618,008 and $192,844,331 for First Eagle Global Fund, First Eagle Overseas Fund, First Eagle U.S. Value Fund, First Eagle Gold Fund and First Eagle Fund of America, respectively. Proceeds from sales of investments, excluding short-term securities, totaled $3,547,284,566, $1,470,457,239, $59,104,660, $108,290,499 and $234,893,416 for First Eagle Global Fund, First Eagle Overseas Fund, First Eagle U.S. Value Fund, First Eagle Gold Fund and First Eagle Fund of America, respectively.
61
FIRST EAGLE FUNDS
NOTES TO FINANCIAL STATEMENTS (Unaudited)—(Continued)
Note 6—Capital Stock
At April 30, 2008, the Funds have an unlimited number of shares authorized for issuance. The Funds have the ability to issue multiple classes of shares.
Transactions in shares of capital stock were as follows:
| | | | | | | | | | | | | | | | | | | |
|
| | Six months ended April 30, 2008 | |
| |
| |
| | First Eagle Global Fund | | First Eagle Overseas Fund | | First Eagle U.S. Value Fund | |
| |
| |
| |
| |
| | Class A | | Class I | | Class C | | Class A | | Class I | | Class C | | Class A | | Class I | | Class C | |
|
|
|
|
|
|
|
|
|
|
|
|
|
|
|
|
|
|
|
|
Shares sold | | 35,134,611 | | 24,038,347 | | 19,901,812 | | 24,537,840 | | 14,879,967 | | 4,999,469 | | 2,127,484 | | 1,177,597 | | 1,038,726 | |
Shares issued for reinvested dividends and distributions | | 28,071,819 | | 5,754,096 | | 9,114,495 | | 32,392,050 | | 18,060,451 | | 5,046,138 | | 985,725 | | 284,778 | | 545,993 | |
Shares redeemed | | (34,696,526 | ) | (11,629,847 | ) | (8,819,546 | ) | (43,324,885 | ) | (53,267,435 | ) | (6,312,530 | ) | (3,360,180 | ) | (1,447,236 | ) | (2,392,776 | ) |
| |
| |
| |
| |
| |
| |
| |
| |
| |
| |
Net increase (decrease) | | 28,509,904 | | 18,162,596 | | 20,196,761 | | 13,605,005 | | (20,327,017 | ) | 3,733,077 | | (246,971 | ) | 15,139 | | (808,057 | ) |
|
|
|
|
|
|
|
|
|
|
|
|
|
|
|
|
|
|
|
|
| | | | | | | | | | | | | | | | | | | |
|
|
|
|
|
|
|
|
|
|
|
|
|
|
|
|
|
|
|
|
| | Year ended October 31, 2007 | |
| |
| |
| | First Eagle Global Fund | | First Eagle Overseas Fund | | First Eagle U.S. Value Fund | |
| |
| |
| |
| |
| | Class A | | Class I | | Class C | | Class A | | Class I | | Class C | | Class A | | Class I | | Class C | |
|
|
|
|
|
|
|
|
|
|
|
|
|
|
|
|
|
|
|
|
Shares sold | | 29,423,126 | | 13,408,641 | | 11,833,957 | | 25,527,944 | | 17,695,896 | | 2,943,615 | | 8,319,730 | | 1,806,798 | | 5,219,216 | |
Shares issued for reinvested dividends and distributions | | 23,202,772 | | 4,328,546 | | 7,497,567 | | 24,146,635 | | 14,846,977 | | 3,553,059 | | 870,048 | | 157,706 | | 435,662 | |
Shares redeemed | | (34,474,198 | ) | (9,914,371 | ) | (11,511,953 | ) | (53,710,207 | ) | (43,244,940 | ) | (6,500,188 | ) | (5,829,160 | ) | (2,921,414 | ) | (1,827,587 | ) |
| |
| |
| |
| |
| |
| |
| |
| |
| |
| |
Net increase (decrease) | | 18,151,700 | | 7,822,816 | | 7,819,571 | | (4,035,628 | ) | (10,702,067 | ) | (3,514 | ) | 3,360,618 | | (956,910 | ) | 3,827,291 | |
|
|
|
|
|
|
|
|
|
|
|
|
|
|
|
|
|
|
|
|
62
| | | | | | | | | | | |
|
|
|
|
|
|
|
|
|
|
|
|
Six months ended April 30, 2008 | |
|
First Eagle Gold Fund | | First Eagle Fund of America | |
| |
|
Class A | | Class I | | Class C | | Class Y | | Class A | | Class C | |
|
|
|
|
|
|
|
|
|
|
|
|
4,147,231 | | 114,277 | | 919,910 | | 978,912 | | 752,342 | | 429,290 | |
| | | | | | | | | | | |
| | | | | | | | | | | |
1,974,866 | | 307,964 | | 358,191 | | 2,452,363 | | 292,451 | | 224,578 | |
(4,643,672 | ) | (1,847,290 | ) | (802,846 | ) | (2,434,273 | ) | (420,220 | ) | (343,926 | ) |
| |
| |
| |
| |
| |
| |
1,478,425 | | (1,425,049 | ) | 475,255 | | 997,002 | | 624,573 | | 309,942 | |
|
|
|
|
|
|
|
|
|
|
|
|
| | | | | | | | | | | |
|
|
|
|
|
|
|
|
|
|
|
|
Year ended October 31, 2007 | |
|
First Eagle Gold Fund | | First Eagle Fund of America | |
| |
|
Class A | | Class I | | Class C | | Class Y | | Class A | | Class C | |
|
|
|
|
|
|
|
|
|
|
|
|
3,911,647 | | 915,411 | | 1,085,929 | | 2,845,188 | | 1,320,584 | | 666,151 | |
| | | | | | | | | | | |
| | | | | | | | | | | |
4,971,320 | | 934,960 | | 928,749 | | 2,621,034 | | 219,398 | | 213,865 | |
(9,216,431 | ) | (2,043,469 | ) | (1,532,639 | ) | (4,201,617 | ) | (433,618 | ) | (338,596 | ) |
| |
| |
| |
| |
| |
| |
(333,464 | ) | (193,098 | ) | 482,039 | | 1,264,605 | | 1,106,364 | | 541,420 | |
|
|
|
|
|
|
|
|
|
|
|
|
63
FIRST EAGLE FUNDS
NOTES TO FINANCIAL STATEMENTS (Unaudited) — (Continued)
Transactions in dollars of capital stock were as follows:
| | | | | | | | | | | | | | | | | | | |
|
|
|
|
| | Six Months Ended April 30, 2008 | |
| |
|
|
| | First Eagle Global Fund | | First Eagle Overseas Fund | |
| |
| |
|
|
| | Class A | | Class I | | Class C | | Class A | | Class I | | Class C | |
|
|
|
|
|
|
|
|
|
|
|
|
|
|
Shares sold | | $ | 1,565,737,854 | | $ | 1,058,650,764 | | $ | 873,293,506 | | $ | 564,620,472 | | $ | 344,638,195 | | $ | 113,251,152 | |
Shares issued for reinvested dividends and distributions | | | 1,265,758,306 | | | 260,142,643 | | | 408,238,245 | | | 754,734,774 | | | 424,601,202 | | | 116,414,413 | |
Shares redeemed | | | (1,538,933,651 | ) | | (517,759,342 | ) | | (393,525,165 | ) | | (1,017,752,537 | ) | | (1,271,606,544 | ) | | (145,526,552 | ) |
| |
|
| |
|
| |
|
| |
|
| |
|
| |
|
| |
Net increase (decrease) | | $ | 1,292,562,509 | | $ | 801,034,065 | | $ | 888,006,586 | | $ | 301,602,709 | | $ | (502,367,147 | ) | $ | 84,139,013 | |
|
|
|
|
|
|
|
|
|
|
|
|
|
|
|
|
|
|
|
|
| | | | | | | | | | | | | | | | | | | |
|
|
|
|
|
|
|
|
|
|
|
|
|
|
|
|
|
|
|
|
| | Year Ended October 31, 2007 | |
| |
|
|
| | First Eagle Global Fund | | First Eagle Overseas Fund | |
| |
| |
|
|
| | Class A | | Class I | | Class C | | Class A | | Class I | | Class C | |
|
|
|
|
|
|
|
|
|
|
|
|
|
|
Shares sold | | $ | 1,405,054,425 | | $ | 639,851,362 | | $ | 554,267,173 | | $ | 673,109,394 | | $ | 467,501,394 | | $ | 75,035,175 | |
Shares issued for reinvested dividends and distributions | | | 1,055,958,184 | | | 197,468,312 | | | 339,264,933 | | | 601,009,577 | | | 372,510,660 | | | 87,653,961 | |
Shares redeemed | | | (1,660,695,277 | ) | | (480,504,284 | ) | | (549,813,217 | ) | | (1,429,894,742 | ) | | (1,170,779,059 | ) | | (171,083,982 | ) |
| |
|
| |
|
| |
|
| |
|
| |
|
| |
|
| |
Net increase (decrease) | | $ | 800,317,332 | | $ | 356,815,390 | | $ | 343,718,889 | | $ | (155,775,771 | ) | $ | (330,767,005 | ) | $ | (8,394,846 | ) |
|
|
|
|
|
|
|
|
|
|
|
|
|
|
|
|
|
|
|
|
Note 7—Indemnification and Foreign Investment Risk
In the normal course of business the Funds enter into contracts that contain a variety of representations which provide general indemnifications. Each Fund’s maximum exposure under these arrangements is unknown, as this would involve future claims that may be made against each Fund that have not yet occurred. However, based on experience, the Funds expect the risk of loss to be remote.
The Funds may have elements of risk not typically associated with investments in the United States of America due to their investments in foreign countries or regions. Such foreign investments may subject the Funds to additional risks resulting from political or economic conditions in such countries or regions and the possible imposition of adverse governmental laws or currency exchange restrictions could cause the securities and their markets to be less liquid and their prices to be more volatile than those of comparable U.S. securities.
64
| | | | | | | | | | | | | | | | | | | | | | | | | | |
|
|
Six Months Ended April 30, 2008 | |
|
|
First Eagle U.S. Value Fund | | First Eagle Gold Fund | | First Eagle Fund of America | |
| |
| |
|
|
Class A | | Class I | | Class C | | Class A | | Class I | | Class C | | Class Y | | Class A | | Class C | |
|
|
|
|
|
|
|
|
|
|
|
|
|
|
|
|
|
|
$ | 33,812,766 | | $ | 18,689,742 | | $ | 16,505,188 | | $ | 109,096,075 | | $ | 3,008,457 | | $ | 23,709,742 | | $ | 25,517,993 | | $ | 19,102,681 | | $ | 10,033,025 | |
| | | | | | | | | | | | | | | | | | | | | | | | | | |
| 15,850,446 | | | 4,619,106 | | | 8,757,729 | | | 46,508,074 | | | 7,292,576 | | | 8,345,853 | | | 64,374,523 | | | 7,551,098 | | | 5,288,805 | |
| (52,934,875 | ) | | (22,850,105 | ) | | (37,473,823 | ) | | (120,618,965 | ) | | (47,223,877 | ) | | (20,554,673 | ) | | (63,103,979 | ) | | (10,545,325 | ) | | (7,898,194 | ) |
|
| |
|
| |
|
| |
|
| |
|
| |
|
| |
|
| |
|
| |
|
| |
$ | (3,271,663 | ) | $ | 458,743 | | $ | (12,210,906 | ) | $ | 34,985,184 | | $ | (36,922,844 | ) | $ | 11,500,922 | | $ | 26,788,537 | | $ | 16,108,454 | | $ | 7,423,636 | |
|
|
|
|
|
|
|
|
|
|
|
|
|
|
|
|
|
|
|
|
|
|
|
|
|
|
|
| | | | | | | | | | | | | | | | | | | | | | | | | | |
|
|
|
|
|
|
|
|
|
|
|
|
|
|
|
|
|
|
|
|
|
|
|
|
|
|
|
Year Ended October 31, 2007 | |
|
|
First Eagle U.S. Value Fund | | First Eagle Gold Fund | | First Eagle Fund of America | |
| |
| |
|
|
Class A | | Class I | | Class C | | Class A | | Class I | | Class C | | Class Y | | Class A | | Class C | |
|
|
|
|
|
|
|
|
|
|
|
|
|
|
|
|
|
|
$ | 133,936,401 | | $ | 29,137,821 | | $ | 83,623,876 | | $ | 86,695,475 | | $ | 19,969,661 | | $ | 24,167,400 | | $ | 79,945,230 | | $ | 37,384,703 | | $ | 17,102,813 | |
| | | | | | | | | | | | | | | | | | | | | | | | | | |
| 13,607,553 | | | 2,485,438 | | | 6,800,696 | | | 102,608,042 | | | 19,400,427 | | | 19,002,220 | | | 67,648,890 | | | 5,581,501 | | | 5,036,526 | |
| (96,094,297 | ) | | (47,792,894 | ) | | (29,585,813 | ) | | (197,397,958 | ) | | (46,005,974 | ) | | (32,479,289 | ) | | (116,426,130 | ) | | (12,092,526 | ) | | (8,651,339 | ) |
|
| |
|
| |
|
| |
|
| |
|
| |
|
| |
|
| |
|
| |
|
| |
$ | 51,449,657 | | $ | (16,169,635 | ) | $ | 60,838,759 | | $ | (8,094,441 | ) | $ | (6,635,886 | ) | $ | 10,690,331 | | $ | 31,167,990 | | $ | 30,873,678 | | $ | 13,488,000 | |
|
|
|
|
|
|
|
|
|
|
|
|
|
|
|
|
|
|
|
|
|
|
|
|
|
|
|
65
FIRST EAGLE FUNDS
FINANCIAL HIGHLIGHTS
| | | | | | | | | | | | | | | | | | | | | | | | | | | | |
|
|
|
|
|
|
|
|
|
|
|
|
|
|
|
|
|
|
|
|
| | Six Months Ended April 30, 2008
(Unaudited) | | Year Ended October 31, | |
| | |
|
|
| | | 2007 | | 2006 | |
| |
| |
| |
|
|
| | Class A | | Class I | | Class C | | Class A | | Class I | | Class C | | Class A | | Class I | | Class C | |
|
|
|
|
|
|
|
|
|
|
|
|
|
|
|
|
|
|
|
|
First Eagle Global Fund | | | | | | | | | | | | | | | | | | | | | | | | | | | | |
Selected Per Share Data* | | | | | | | | | | | | | | | | | | | | | | | | | | | | |
Net asset value, beginning of period | | $ | 51.09 | | $ | 51.32 | | $ | 50.46 | | $ | 48.36 | | $ | 48.56 | | $ | 47.83 | | $ | 42.47 | | $ | 42.62 | | $ | 42.06 | |
| |
|
| |
|
| |
|
| |
|
| |
|
| |
|
| |
|
| |
|
| |
|
| |
Income from investment operations: | | | | | | | | | | | | | | | | | | | | | | | | | | | | |
Net investment income | | | 0.29 | | | 0.36 | | | 0.12 | | | 0.67 | | | 0.79 | | | 0.31 | | | 0.59 | | | 0.71 | | | 0.25 | |
Net realized and unrealized (losses) gains on investments | | | (0.42 | ) | | (0.43 | ) | | (0.42 | ) | | 6.91 | | | 6.94 | | | 6.84 | | | 7.82 | | | 7.85 | | | 7.77 | |
| |
|
| |
|
| |
|
| |
|
| |
|
| |
|
| |
|
| |
|
| |
|
| |
Total from investment operations | | | (0.13 | ) | | (0.07 | ) | | (0.30 | ) | | 7.58 | | | 7.73 | | | 7.15 | | | 8.41 | | | 8.56 | | | 8.02 | |
| |
|
| |
|
| |
|
| |
|
| |
|
| |
|
| |
|
| |
|
| |
|
| |
Less distributions: | | | | | | | | | | | | | | | | | | | | | | | | | | | | |
Dividends from net investment income | | | (1.07 | ) | | (1.19 | ) | | (0.70 | ) | | (1.22 | ) | | (1.34 | ) | | (0.89 | ) | | (0.84 | ) | | (0.94 | ) | | (0.57 | ) |
Distributions from capital gains | | | (4.39 | ) | | (4.39 | ) | | (4.39 | ) | | (3.63 | ) | | (3.63 | ) | | (3.63 | ) | | (1.68 | ) | | (1.68 | ) | | (1.68 | ) |
| |
|
| |
|
| |
|
| |
|
| |
|
| |
|
| |
|
| |
|
| |
|
| |
Total distributions | | | (5.46 | ) | | (5.58 | ) | | (5.09 | ) | | (4.85 | ) | | (4.97 | ) | | (4.52 | ) | | (2.52 | ) | | (2.62 | ) | | (2.25 | ) |
| |
|
| |
|
| |
|
| |
|
| |
|
| |
|
| |
|
| |
|
| |
|
| |
Net asset value, end of period | | $ | 45.50 | | $ | 45.67 | | $ | 45.07 | | $ | 51.09 | | $ | 51.32 | | $ | 50.46 | | $ | 48.36 | | $ | 48.56 | | $ | 47.83 | |
| |
|
| |
|
| |
|
| |
|
| |
|
| |
|
| |
|
| |
|
| |
|
| |
Total Returnc | | | (0.16 | %)b | | (0.02 | %)b | | (0.54 | %)b | | 16.91 | % | | 17.19 | % | | 16.03 | % | | 20.73 | % | | 21.06 | % | | 19.86 | % |
Ratios and Supplemental Data | | | | | | | | | | | | | | | | | | | | | | | | | | | | |
Net assets, end of period (millions) | | $ | 13,276 | | $ | 3,670 | | $ | 5,906 | | $ | 13,451 | | $ | 3,193 | | $ | 5,593 | | $ | 11,854 | | $ | 2,641 | | $ | 4,928 | |
Ratio of operating expenses to average net assetse | | | 1.13 | %a | | 0.88 | %a | | 1.88 | %a | | 1.12 | % | | 0.87 | % | | 1.87 | % | | 1.13 | % | | 0.88 | % | | 1.88 | % |
Ratio of net investment income to average net assetsf | | | 1.31 | %a | | 1.59 | %a | | 0.57 | %a | | 1.40 | % | | 1.64 | % | | 0.65 | % | | 1.31 | % | | 1.57 | % | | 0.56 | % |
Portfolio turnover rate | | | 19.24 | %b | | 19.24 | %b | | 19.24 | %b | | 37.58 | % | | 37.58 | % | | 37.58 | % | | 28.59 | % | | 28.59 | % | | 28.59 | % |
| |
|
* | Per share amounts have been calculated using the average shares method. |
|
|
See Notes to Financial Highlights. |
See Notes to Financial Statements. |
66
| | | | | | | | | | | | | | | | | | | | | | | | | | |
|
|
Year Ended October 31, | |
|
|
2005 | | 2004 | | 2003 | |
| |
| |
|
|
Class A | | Class I | | Class C | | Class A | | Class I | | Class C | | Class A | | Class I | | Class C | |
|
|
|
|
|
|
|
|
|
|
|
|
|
|
|
|
|
|
| | | | | | | | | | | | | | | | | | | | | | | | | | |
$ | 36.53 | | $ | 36.64 | | $ | 36.30 | | $ | 32.37 | | $ | 32.41 | | $ | 32.15 | | $ | 24.34 | | $ | 24.36 | | $ | 24.15 | |
|
| |
|
| |
|
| |
|
| |
|
| |
|
| |
|
| |
|
| |
|
| |
| | | | | | | | | | | | | | | | | | | | | | | | | | |
| 0.48 | | | 0.60 | | | 0.19 | | | 0.50 | | | 0.56 | | | 0.23 | | | 0.53 | | | 0.59 | | | 0.30 | |
| | | | | | | | | | | | | | | | | | | | | | | | | | |
| 6.07 | | | 6.06 | | | 6.01 | | | 5.18 | | | 5.22 | | | 5.18 | | | 8.39 | | | 8.41 | | | 8.38 | |
|
| |
|
| |
|
| |
|
| |
|
| |
|
| |
|
| |
|
| |
|
| |
| | | | | | | | | | | | | | | | | | | | | | | | | | |
| 6.55 | | | 6.66 | | | 6.20 | | | 5.68 | | | 5.78 | | | 5.41 | | | 8.92 | | | 9.00 | | | 8.68 | |
|
| |
|
| |
|
| |
|
| |
|
| |
|
| |
|
| |
|
| |
|
| |
| | | | | | | | | | | | | | | | | | | | | | | | | | |
| (0.43 | ) | | (0.50 | ) | | (0.26 | ) | | (0.67 | ) | | (0.70 | ) | | (0.41 | ) | | (0.49 | ) | | (0.55 | ) | | (0.28 | ) |
| | | | | | | | | | | | | | | | | | | | | | | | | | |
| (0.18 | ) | | (0.18 | ) | | (0.18 | ) | | (0.85 | ) | | (0.85 | ) | | (0.85 | ) | | (0.40 | ) | | (0.40 | ) | | (0.40 | ) |
|
| |
|
| |
|
| |
|
| |
|
| |
|
| |
|
| |
|
| |
|
| |
| (0.61 | ) | | (0.68 | ) | | (0.44 | ) | | (1.52 | ) | | (1.55 | ) | | (1.26 | ) | | (0.89 | ) | | (0.95 | ) | | (0.68 | ) |
|
| |
|
| |
|
| |
|
| |
|
| |
|
| |
|
| |
|
| |
|
| |
| | | | | | | | | | | | | | | | | | | | | | | | | | |
$ | 42.47 | | $ | 42.62 | | $ | 42.06 | | $ | 36.53 | | $ | 36.64 | | $ | 36.30 | | $ | 32.37 | | $ | 32.41 | | $ | 32.15 | |
|
| |
|
| |
|
| |
|
| |
|
| |
|
| |
|
| |
|
| |
|
| |
| 18.15 | % | | 18.42 | % | | 17.23 | % | | 18.18 | % | | 18.47 | % | | 17.31 | % | | 37.75 | % | | 38.14 | % | | 36.77 | % |
| | | | | | | | | | | | | | | | | | | | | | | | | | |
$ | 9,526 | | $ | 1,752 | | $ | 3,828 | | $ | 5,972 | | $ | 641 | | $ | 1,986 | | $ | 3,255 | | $ | 242 | | $ | 617 | |
| | | | | | | | | | | | | | | | | | | | | | | | | | |
| 1.20 | % | | 0.95 | % | | 1.95 | % | | 1.24 | % | | 0.99 | % | | 1.99 | % | | 1.32 | % | | 1.06 | % | | 2.07 | % |
| | | | | | | | | | | | | | | | | | | | | | | | | | |
| 1.21 | % | | 1.48 | % | | 0.47 | % | | 1.46 | % | | 1.67 | % | | 0.66 | % | | 1.91 | % | | 2.11 | % | | 1.07 | % |
| 12.29 | % | | 12.29 | % | | 12.29 | % | | 4.94 | % | | 4.94 | % | | 4.94 | % | | 7.20 | % | | 7.20 | % | | 7.20 | % |
67
FIRST EAGLE FUNDS
| | | | | | | | | | | | | | | | | | | | | | | | | | | | |
FINANCIAL HIGHLIGHTS—(Continued) | |
| |
| | | | | |
| | Six Months Ended April 30, 2008
(Unaudited) | | Year Ended October 31, | |
| | |
| |
| | | 2007 | | 2006 | |
| |
| |
| |
| |
| | Class A | | Class I | | Class C | | Class A | | Class I | | Class C | | Class A | | Class I | | Class C | |
|
|
|
|
|
|
|
|
|
|
|
|
|
|
|
|
|
|
| |
First Eagle Overseas Fund | | | | | | | | | | | | | | | | | | | | | | | | | | | | |
Selected Per Share Data* | | | | | | | | | | | | | | | | | | | | | | | | | | | | |
Net asset value,
beginning of period | | $ | 28.09 | | $ | 28.38 | | $ | 27.66 | | $ | 26.70 | | $ | 26.94 | | $ | 26.33 | | $ | 24.13 | | $ | 24.33 | | $ | 23.83 | |
| |
|
| |
|
| |
|
| |
|
| |
|
| |
|
| |
|
| |
|
| |
|
| |
Income from investment
operations: | | | | | | | | | | | | | | | | | | | | | | | | | | | | |
Net investment income | | | 0.14 | | | 0.17 | | | 0.05 | | | 0.41 | | | 0.48 | | | 0.21 | | | 0.39 | | | 0.46 | | | 0.20 | |
Net realized and
unrealized (losses)
gains on investments | | | (0.75 | ) | | (0.76 | ) | | (0.74 | ) | | 4.05 | | | 4.10 | | | 4.00 | | | 4.57 | | | 4.60 | | | 4.53 | |
| |
|
| |
|
| |
|
| |
|
| |
|
| |
|
| |
|
| |
|
| |
|
| |
Total from investment
operations | | | (0.61 | ) | | (0.59 | ) | | (0.69 | ) | | 4.46 | | | 4.58 | | | 4.21 | | | 4.96 | | | 5.06 | | | 4.73 | |
| |
|
| |
|
| |
|
| |
|
| |
|
| |
|
| |
|
| |
|
| |
|
| |
Less distributions: | | | | | | | | | | | | | | | | | | | | | | | | | | | | |
Dividends from net
investment income | | | (0.87 | ) | | (0.94 | ) | | (0.66 | ) | | (0.87 | ) | | (0.94 | ) | | (0.68 | ) | | (0.81 | ) | | (0.87 | ) | | (0.65 | ) |
Distributions from
capital gains | | | (3.15 | ) | | (3.15 | ) | | (3.15 | ) | | (2.20 | ) | | (2.20 | ) | | (2.20 | ) | | (1.58 | ) | | (1.58 | ) | | (1.58 | ) |
| |
|
| |
|
| |
|
| |
|
| |
|
| |
|
| |
|
| |
|
| |
|
| |
Total distributions | | | (4.02 | ) | | (4.09 | ) | | (3.81 | ) | | (3.07 | ) | | (3.14 | ) | | (2.88 | ) | | (2.39 | ) | | (2.45 | ) | | (2.23 | ) |
| |
|
| |
|
| |
|
| |
|
| |
|
| |
|
| |
|
| |
|
| |
|
| |
Net asset value,
end of period | | $ | 23.46 | | $ | 23.70 | | $ | 23.16 | | $ | 28.09 | | $ | 28.38 | | $ | 27.66 | | $ | 26.70 | | $ | 26.94 | | $ | 26.33 | |
| |
|
| |
|
| |
|
| |
|
| |
|
| |
|
| |
|
| |
|
| |
|
| |
Total Returnc | | | (2.06 | %)b | | (1.94 | %)b | | (2.43 | %)b | | 18.20 | % | | 18.52 | % | | 17.31 | % | | 22.24 | % | | 22.53 | % | | 21.33 | % |
Ratios and Supplemental Data | | | | | | | | | | | | | | | | | | | | | | | | | | | | |
Net assets, end of period
(millions) | | $ | 5,309 | | $ | 2,811 | | $ | 1,093 | | $ | 5,974 | | $ | 3,942 | | $ | 1,203 | | $ | 5,785 | | $ | 4,031 | | $ | 1,145 | |
Ratio of operating expenses
to average net assetse | | | 1.15 | %a | | 0.89 | %a | | 1.90 | %a | | 1.12 | % | | 0.87 | % | | 1.87 | % | | 1.12 | % | | 0.87 | % | | 1.87 | % |
Ratio of net investment
income to average
net assetsf | | | 1.19 | %a | | 1.38 | %a | | 0.44 | %a | | 1.54 | % | | 1.80 | % | | 0.79 | % | | 1.57 | % | | 1.82 | % | | 0.81 | % |
Portfolio turnover rate | | | 9.03 | %b | | 9.03 | %b | | 9.03 | %b | | 34.29 | % | | 34.29 | % | | 34.29 | % | | 27.98 | % | | 27.98 | % | | 27.98 | % |
| |
|
* | Per share amounts have been calculated using the average shares method. |
| |
|
See Notes to Financial Highlights. |
See Notes to Financial Statements. |
68
| | | | | | | | | | | | | | | | | | | | | | | | | | |
| |
Year Ended October 31, | |
| |
2005 | | 2004 | | 2003 | |
| |
| |
| |
Class A | | Class I | | Class C | | Class A | | Class I | | Class C | | Class A | | Class I | | Class C | |
|
|
|
|
|
|
|
|
|
|
|
|
|
|
|
|
| |
| | | | | | | | | | | | | | | | | | | | | | | | | | |
$ | 20.25 | | $ | 20.37 | | $ | 19.97 | | $ | 17.50 | | $ | 17.57 | | $ | 17.28 | | $ | 12.45 | | $ | 12.48 | | $ | 12.30 | |
|
| |
|
| |
|
| |
|
| |
|
| |
|
| |
|
| |
|
| |
|
| |
| | | | | | | | | | | | | | | | | | | | | | | | | | |
| 0.27 | | | 0.33 | | | 0.10 | | | 0.17 | | | 0.22 | | | 0.03 | | | 0.18 | | | 0.22 | | | 0.07 | |
| | | | | | | | | | | | | | | | | | | | | | | | | | |
| 3.96 | | | 3.99 | | | 3.93 | | | 3.20 | | | 3.22 | | | 3.17 | | | 5.09 | | | 5.10 | | | 5.04 | |
|
| |
|
| |
|
| |
|
| |
|
| |
|
| |
|
| |
|
| |
|
| |
| 4.23 | | | 4.32 | | | 4.03 | | | 3.37 | | | 3.44 | | | 3.20 | | | 5.27 | | | 5.32 | | | 5.11 | |
|
| |
|
| |
|
| |
|
| |
|
| |
|
| |
|
| |
|
| |
|
| |
| | | | | | | | | | | | | | | | | | | | | | | | | | |
| (0.24 | ) | | (0.25 | ) | | (0.06 | ) | | (0.47 | ) | | (0.49 | ) | | (0.36 | ) | | (0.21 | ) | | (0.22 | ) | | (0.12 | ) |
|
| (0.11 | ) | | (0.11 | ) | | (0.11 | ) | | (0.15 | ) | | (0.15 | ) | | (0.15 | ) | | (0.01 | ) | | (0.01 | ) | | (0.01 | ) |
|
| |
|
| |
|
| |
|
| |
|
| |
|
| |
|
| |
|
| |
|
| |
| (0.35 | ) | | (0.36 | ) | | (0.17 | ) | | (0.62 | ) | | (0.64 | ) | | (0.51 | ) | | (0.22 | ) | | (0.23 | ) | | (0.13 | ) |
|
| |
|
| |
|
| |
|
| |
|
| |
|
| |
|
| |
|
| |
|
| |
| | | | | | | | | | | | | | | | | | | | | | | | | | |
$ | 24.13 | | $ | 24.33 | | $ | 23.83 | | $ | 20.25 | | $ | 20.37 | | $ | 19.97 | | $ | 17.50 | | $ | 17.57 | | $ | 17.28 | |
|
| |
|
| |
|
| |
|
| |
|
| |
|
| |
|
| |
|
| |
|
| |
| 21.16 | % | | 21.47 | % | | 20.28 | % | | 19.77 | % | | 20.09 | % | | 18.89 | % | | 42.96 | % | | 43.29 | % | | 41.91 | % |
| | | | | | | | | | | | | | | | | | | | | | | | | | |
$ | 4,866 | | $ | 3,028 | | $ | 994 | | $ | 3,846 | | $ | 2,152 | | $ | 804 | | $ | 2,345 | | $ | 1,084 | | $ | 390 | |
|
| 1.18 | % | | 0.93 | % | | 1.93 | % | | 1.25 | % | | 1.00 | % | | 2.00 | % | | 1.31 | % | | 1.05 | % | | 2.05 | % |
| | | | | | | | | | | | | | | | | | | | | | | | | | |
| 1.21 | % | | 1.46 | % | | 0.46 | % | | 0.90 | % | | 1.17 | % | | 0.17 | % | | 1.23 | % | | 1.48 | % | | 0.45 | % |
| 19.40 | % | | 19.40 | % | | 19.40 | % | | 5.88 | % | | 5.88 | % | | 5.88 | % | | 3.46 | % | | 3.46 | % | | 3.46 | % |
69
FIRST EAGLE FUNDS
FINANCIAL HIGHLIGHTS—(Continued)
| | | | | | | | | | | | | | | | | | | | | | | | | | | | |
| |
| | | | Year Ended October 31, | |
| | Six Months Ended April 30, 2008 | |
| |
| | (Unaudited) | | 2007 | | 2006 | |
| |
| |
| |
| |
| | Class A | | Class I | | Class C | | Class A | | Class I | | Class C | | Class A | | Class I | | Class C | |
|
|
|
|
|
|
|
|
|
|
|
|
|
|
|
|
|
|
| |
First Eagle U.S. Value Fund | | | | | | | | | | | | | | | | | | | | | | | | | | | | |
Selected Per Share Data* | | | | | | | | | | | | | | | | | | | | | | | | | | | | |
Net asset value, beginning of period | | $ | 17.01 | | $ | 17.19 | | $ | 16.87 | | $ | 16.19 | | $ | 16.34 | | $ | 16.08 | | $ | 14.95 | | $ | 15.07 | | $ | 14.90 | |
| |
|
| |
|
| |
|
| |
|
| |
|
| |
|
| |
|
| |
|
| |
|
| |
Income from investment operations: | | | | | | | | | | | | | | | | | | | | | | | | | | | | |
Net investment income | | | 0.17 | | | 0.19 | | | 0.11 | | | 0.33 | | | 0.38 | | | 0.21 | | | 0.29 | | | 0.33 | | | 0.17 | |
Net realized and unrealized (losses) gains on investments | | | (0.14 | ) | | (0.15 | ) | | (0.16 | ) | | 1.45 | | | 1.46 | | | 1.44 | | | 1.46 | | | 1.48 | | | 1.47 | |
| |
|
| |
|
| |
|
| |
|
| |
|
| |
|
| |
|
| |
|
| |
|
| |
Total from investment operations | | | 0.03 | | | 0.04 | | | (0.05 | ) | | 1.78 | | | 1.84 | | | 1.65 | | | 1.75 | | | 1.81 | | | 1.64 | |
| |
|
| |
|
| |
|
| |
|
| |
|
| |
|
| |
|
| |
|
| |
|
| |
Less distributions: | | | | | | | | | | | | | | | | | | | | | | | | | | | | |
Dividends from net investment income | | | (0.31 | ) | | (0.35 | ) | | (0.19 | ) | | (0.30 | ) | | (0.33 | ) | | (0.20 | ) | | (0.24 | ) | | (0.27 | ) | | (0.19 | ) |
Distributions from capital gains | | | (0.66 | ) | | (0.66 | ) | | (0.66 | ) | | (0.66 | ) | | (0.66 | ) | | (0.66 | ) | | (0.27 | ) | | (0.27 | ) | | (0.27 | ) |
| |
|
| |
|
| |
|
| |
|
| |
|
| |
|
| |
|
| |
|
| |
|
| |
Total distributions | | | (0.97 | ) | | (1.01 | ) | | (0.85 | ) | | (0.96 | ) | | (0.99 | ) | | (0.86 | ) | | (0.51 | ) | | (0.54 | ) | | (0.46 | ) |
| |
|
| |
|
| |
|
| |
|
| |
|
| |
|
| |
|
| |
|
| |
|
| |
Net asset value, end of period | | $ | 16.07 | | $ | 16.22 | | $ | 15.97 | | $ | 17.01 | | $ | 17.19 | | $ | 16.87 | | $ | 16.19 | | $ | 16.34 | | $ | 16.08 | |
| |
|
| |
|
| |
|
| |
|
| |
|
| |
|
| |
|
| |
|
| |
|
| |
Total Returnc | | | 0.13 | %b | | 0.22 | %b | | (0.32 | %)b | | 11.47 | % | | 11.78 | % | | 10.65 | % | | 12.05 | % | | 12.35 | % | | 11.26 | % |
Ratios and Supplemental Data | | | | | | | | | | | | | | | | | | | | | | | | | | | | |
Net assets, end of period (millions) | | $ | 302 | | $ | 99 | | $ | 208 | | $ | 324 | | $ | 104 | | $ | 233 | | $ | 254 | | $ | 115 | | $ | 161 | |
Ratio of operating expenses to average net assetse | | | 1.21 | %a | | 0.96 | %a | | 1.96 | %a | | 1.20 | % | | 0.95 | % | | 1.95 | % | | 1.25 | % | | 0.99 | % | | 1.99 | % |
Ratio of net investment income to average net assetsf | | | 2.11 | %a | | 2.36 | %a | | 1.37 | %a | | 2.04 | % | | 2.32 | % | | 1.29 | % | | 1.87 | % | | 2.13 | % | | 1.13 | % |
Portfolio turnover rate | | | 10.66 | %b | | 10.66 | %b | | 10.66 | %b | | 32.54 | % | | 32.54 | % | | 32.54 | % | | 31.76 | % | | 31.76 | % | | 31.76 | % |
| |
* | Per share amounts have been calculated using the average shares method. |
See Notes to Financial Highlights.
See Notes to Financial Statements.
70
| | | | | | | | | | | | | | | | | | | | | | | | | | |
| |
Year Ended October 31, | |
| |
2005 | | 2004 | | 2003 | |
| |
| |
| |
Class A | | Class I | | Class C | | Class A | | Class I | | Class C | | Class A | | Class I | | Class C | |
|
|
|
|
|
|
|
|
|
|
|
|
|
|
|
|
| |
| | | | | | | | | | | | | | | | | | | | | | | | | | |
$ | 13.95 | | $ | 14.05 | | $ | 13.92 | | $ | 12.71 | | $ | 12.76 | | $ | 12.61 | | $ | 10.56 | | $ | 10.59 | | $ | 10.48 | |
|
| |
|
| |
|
| |
|
| |
|
| |
|
| |
|
| |
|
| |
|
| |
| | | | | | | | | | | | | | | | | | | | | | | | | | |
| 0.20 | | | 0.24 | | | 0.10 | | | 0.22 | | | 0.27 | | | 0.13 | | | 0.19 | | | 0.23 | | | 0.11 | |
| | | | | | | | | | | | | | | | | | | | | | | | | | |
| 1.35 | | | 1.36 | | | 1.35 | | | 1.66 | | | 1.65 | | | 1.64 | | | 2.46 | | | 2.45 | | | 2.43 | |
|
| |
|
| |
|
| |
|
| |
|
| |
|
| |
|
| |
|
| |
|
| |
| | | | | | | | | | | | | | | | | | | | | | | | | | |
| 1.55 | | | 1.60 | | | 1.45 | | | 1.88 | | | 1.92 | | | 1.77 | | | 2.65 | | | 2.68 | | | 2.54 | |
|
| |
|
| |
|
| |
|
| |
|
| |
|
| |
|
| |
|
| |
|
| |
| | | | | | | | | | | | | | | | | | | | | | | | | | |
| (0.20 | ) | | (0.23 | ) | | (0.12 | ) | | (0.32 | ) | | (0.31 | ) | | (0.14 | ) | | (0.16 | ) | | (0.17 | ) | | (0.07 | ) |
| | | | | | | | | | | | | | | | | | | | | | | | | | |
| (0.35 | ) | | (0.35 | ) | | (0.35 | ) | | (0.32 | ) | | (0.32 | ) | | (0.32 | ) | | (0.34 | ) | | (0.34 | ) | | (0.34 | ) |
|
| |
|
| |
|
| |
|
| |
|
| |
|
| |
|
| |
|
| |
|
| |
| (0.55 | ) | | (0.58 | ) | | (0.47 | ) | | (0.64 | ) | | (0.63 | ) | | (0.46 | ) | | (0.50 | ) | | (0.51 | ) | | (0.41 | ) |
|
| |
|
| |
|
| |
|
| |
|
| |
|
| |
|
| |
|
| |
|
| |
| | | | | | | | | | | | | | | | | | | | | | | | | | |
$ | 14.95 | | $ | 15.07 | | $ | 14.90 | | $ | 13.95 | | $ | 14.05 | | $ | 13.92 | | $ | 12.71 | | $ | 12.76 | | $ | 12.61 | |
|
| |
|
| |
|
| |
|
| |
|
| |
|
| |
|
| |
|
| |
|
| |
| 11.35 | % | | 11.65 | % | | 10.56 | % | | 15.38 | % | | 15.58 | % | | 14.43 | % | | 26.10 | % | | 26.34 | % | | 25.03 | % |
| | | | | | | | | | | | | | | | | | | | | | | | | | |
$ | 150 | | $ | 68 | | $ | 97 | | $ | 62 | | $ | 54 | | $ | 29 | | $ | 41 | | $ | 49 | | $ | 20 | |
| | | | | | | | | | | | | | | | | | | | | | | | | | |
| 1.28 | % | | 1.04 | % | | 2.02 | % | | 1.38 | % | | 1.13 | % | | 2.13 | % | | 1.51 | % | | 1.26 | % | | 2.26 | % |
| | | | | | | | | | | | | | | | | | | | | | | | | | |
| 1.40 | % | | 1.63 | % | | 0.67 | % | | 1.66 | % | | 2.00 | % | | 0.95 | % | | 1.72 | % | | 1.99 | % | | 0.97 | % |
| 17.22 | % | | 17.22 | % | | 17.22 | % | | 23.47 | % | | 23.47 | % | | 23.47 | % | | 33.45 | % | | 33.45 | % | | 33.45 | % |
71
FIRST EAGLE FUNDS
FINANCIAL HIGHLIGHTS—(Continued)
| | | | | | | | | | | | | | | | | | | | | | | | | | | | |
| |
| | | | Year Ended October 31, | |
| | Six Months Ended April 30, 2008 | |
| |
| | (Unaudited) | | 2007 | | 2006 | |
| |
| |
| |
| |
| | Class A | | Class I | | Class C | | Class A | | Class I | | Class C | | Class A | | Class I | | Class C | |
|
|
|
|
|
|
|
|
|
|
|
|
|
|
|
|
|
|
| |
First Eagle Gold Fund | | | | | | | | | | | | | | | | | | | | | | | | | | | | |
Selected Per Share Data* | | | | | | | | | | | | | | | | | | | | | | | | | | | | |
Net asset value, beginning of period | | $ | 27.28 | | $ | 27.48 | | $ | 26.86 | | $ | 23.48 | | $ | 23.62 | | $ | 23.17 | | $ | 17.45 | | $ | 17.55 | | $ | 17.25 | |
| |
|
| |
|
| |
|
| |
|
| |
|
| |
|
| |
|
| |
|
| |
|
| |
Income from investment operations: | | | | | | | | | | | | | | | | | | | | | | | | | | | | |
Net investment (loss) income | | | (0.09 | ) | | (0.06 | ) | | (0.18 | ) | | (0.12 | ) | | (0.07 | ) | | (0.28 | ) | | (0.13 | ) | | (0.08 | ) | | (0.30 | ) |
Net realized and unrealized (losses) gains on investments | | | (1.43 | ) | | (1.44 | ) | | (1.40 | ) | | 7.72 | | | 7.78 | | | 7.61 | | | 6.65 | | | 6.69 | | | 6.60 | |
| |
|
| |
|
| |
|
| |
|
| |
|
| |
|
| |
|
| |
|
| |
|
| |
Total from investment operations | | | (1.52 | ) | | (1.50 | ) | | (1.58 | ) | | 7.60 | | | 7.71 | | | 7.33 | | | 6.52 | | | 6.61 | | | 6.30 | |
| |
|
| |
|
| |
|
| |
|
| |
|
| |
|
| |
|
| |
|
| |
|
| |
Less distributions: | | | | | | | | | | | | | | | | | | | | | | | | | | | | |
Dividends from net investment income | | | (0.78 | ) | | (0.84 | ) | | (0.62 | ) | | (0.74 | ) | | (0.79 | ) | | (0.58 | ) | | (0.49 | ) | | (0.54 | ) | | (0.38 | ) |
Distributions from capital gains | | | (0.95 | ) | | (0.95 | ) | | (0.95 | ) | | (3.06 | ) | | (3.06 | ) | | (3.06 | ) | | — | | | — | | | — | |
| |
|
| |
|
| |
|
| |
|
| |
|
| |
|
| |
|
| |
|
| |
|
| |
Total distributions | | | (1.73 | ) | | (1.79 | ) | | (1.57 | ) | | (3.80 | ) | | (3.85 | ) | | (3.64 | ) | | (0.49 | ) | | (0.54 | ) | | (0.38 | ) |
| |
|
| |
|
| |
|
| |
|
| |
|
| |
|
| |
|
| |
|
| |
|
| |
Net asset value, end of period | | $ | 24.03 | | $ | 24.19 | | $ | 23.71 | | $ | 27.28 | | $ | 27.48 | | $ | 26.86 | | $ | 23.48 | | $ | 23.62 | | $ | 23.17 | |
| |
|
| |
|
| |
|
| |
|
| |
|
| |
|
| |
|
| |
|
| |
|
| |
Total Returnc | | | (5.44 | %)b | | (5.31 | %)b | | (5.79 | %)b | | 37.57 | % | | 37.93 | % | | 36.55 | % | | 37.97 | % | | 38.29 | % | | 36.95 | % |
Ratios and Supplemental Data | | | | | | | | | | | | | | | | | | | | | | | | | | | | |
Net assets, end of period (millions) | | $ | 819 | | $ | 112 | | $ | 184 | | $ | 890 | | $ | 166 | | $ | 196 | | $ | 774 | | $ | 147 | | $ | 158 | |
Ratio of operating expenses to average net assetse | | | 1.18 | %a | | 0.93 | %a | | 1.93 | %a | | 1.20 | % | | 0.95 | % | | 1.95 | % | | 1.21 | % | | 0.96 | % | | 1.96 | % |
Ratio of net investment (loss) income to average net assetsf | | | (0.67 | %)a | | (0.43 | %)a | | (1.42 | %)a | | (0.55 | %) | | (0.30 | %) | | (1.30 | %) | | (0.59 | %) | | (0.34 | %) | | (1.33 | %) |
Portfolio turnover rate | | | 5.56 | %b | | 5.56 | %b | | 5.56 | %b | | 16.37 | % | | 16.37 | % | | 16.37 | % | | 32.26 | % | | 32.26 | % | | 32.26 | % |
| |
* | Per share amounts have been calculated using the average shares method. |
** | Amount represents less than $0.01 per share. |
See Notes to Financial Highlights.
See Notes to Financial Statements.
72
| | | | | | | | | | | | | | | | | | | | | | | | | | |
| |
Year Ended October 31, | |
| |
2005 | | 2004 | | 2003 | |
| |
| |
| |
Class A | | Class I | | Class C | | Class A | | Class I | | Class C | | Class A | | Class Id | | Class Cd | |
|
|
|
|
|
|
|
|
|
|
|
|
|
|
|
|
| |
| | | | | | | | | | | | | | | | | | | | | | | | | | |
$ | 16.82 | | $ | 16.88 | | $ | 16.76 | | $ | 15.99 | | $ | 16.03 | | $ | 15.96 | | $ | 10.41 | | $ | 12.41 | | $ | 12.41 | |
|
| |
|
| |
|
| |
|
| |
|
| |
|
| |
|
| |
|
| |
|
| |
| | | | | | | | | | | | | | | | | | | | | | | | | | |
| (0.04 | ) | | 0.00 | ** | | (0.16 | ) | | (0.10 | ) | | (0.05 | ) | | (0.21 | ) | | (0.06 | ) | | (0.02 | ) | | (0.09 | ) |
| | | | | | | | | | | | | | | | | | | | | | | | | | |
| 0.67 | | | 0.67 | | | 0.65 | | | 1.49 | | | 1.48 | | | 1.47 | | | 5.72 | | | 3.64 | | | 3.64 | |
|
| |
|
| |
|
| |
|
| |
|
| |
|
| |
|
| |
|
| |
|
| |
| | | | | | | | | | | | | | | | | | | | | | | | | | |
| 0.63 | | | 0.67 | | | 0.49 | | | 1.39 | | | 1.43 | | | 1.26 | | | 5.66 | | | 3.62 | | | 3.55 | |
|
| |
|
| |
|
| |
|
| |
|
| |
|
| |
|
| |
|
| |
|
| |
| | | | | | | | | | | | | | | | | | | | | | | | | | |
| — | | | — | | | — | | | (0.56 | ) | | (0.58 | ) | | (0.46 | ) | | (0.08 | ) | | — | | | — | |
| — | | | — | | | — | | | — | | | — | | | — | | | — | | | — | | | — | |
|
| |
|
| |
|
| |
|
| |
|
| |
|
| |
|
| |
|
| |
|
| |
| — | | | — | | | — | | | (0.56 | ) | | (0.58 | ) | | (0.46 | ) | | (0.08 | ) | | — | | | — | |
|
| |
|
| |
|
| |
|
| |
|
| |
|
| |
|
| |
|
| |
|
| |
| | | | | | | | | | | | | | | | | | | | | | | | | | |
$ | 17.45 | | $ | 17.55 | | $ | 17.25 | | $ | 16.82 | | $ | 16.88 | | $ | 16.76 | | $ | 15.99 | | $ | 16.03 | | $ | 15.96 | |
|
| |
|
| |
|
| |
|
| |
|
| |
|
| |
|
| |
|
| |
|
| |
| 3.75 | % | | 3.97 | % | | 2.92 | % | | 8.59 | % | | 8.82 | % | | 7.79 | % | | 54.64 | % | | 29.17 | %b | | 28.61 | %b |
| | | | | | | | | | | | | | | | | | | | | | | | | | |
$ | 570 | | $ | 84 | | $ | 115 | | $ | 516 | | $ | 75 | | $ | 92 | | $ | 374 | | $ | 30 | | $ | 32 | |
| | | | | | | | | | | | | | | | | | | | | | | | | | |
| 1.29 | % | | 1.04 | % | | 2.04 | % | | 1.39 | % | | 1.14 | % | | 2.14 | % | | 1.49 | % | | 1.23 | %a | | 2.19 | %a |
| | | | | | | | | | | | | | | | | | | | | | | | | | |
| (0.24 | %) | | 0.02 | % | | (0.98 | %) | | (0.62 | %) | | (0.35 | %) | | (1.34 | %) | | (0.43 | %) | | (0.24 | )%a | | (1.26 | )%a |
| 21.73 | % | | 21.73 | % | | 21.73 | % | | 3.61 | % | | 3.61 | % | | 3.61 | % | | 0.98 | % | | 0.98 | %b | | 0.98 | %b |
73
FIRST EAGLE FUNDS
FINANCIAL HIGHLIGHTS—(Continued)
| | | | | | | | | | | | | | | | | | | | | | | | | | | | |
|
|
|
|
|
|
|
|
|
|
|
|
|
|
|
|
|
|
|
|
|
|
|
|
|
|
|
| |
| | Six Months Ended April 30, 2008
(Unaudited) | | Year Ended October 31, | |
| | |
| |
| | | 2007 | | 2006 | |
| |
| |
| |
| |
| | Class Y | | Class C | | Class A | | Class Y | | Class C | | Class A | | Class Y | | Class C | | Class A | |
|
|
|
|
|
|
|
|
|
|
|
|
|
|
|
|
|
|
| |
First Eagle Fund of America | | | | | | | | | | | | | | | | | | | | | | | | | | | | |
Selected Per Share Data* | | | | | | | | | | | | | | | | | | | | | | | | | | | | |
Net asset value, beginning of period | | $ | 30.22 | | $ | 27.39 | | $ | 29.79 | | $ | 28.28 | | $ | 26.12 | | $ | 27.92 | | $ | 26.42 | | $ | 24.74 | | $ | 26.11 | |
| |
|
| |
|
| |
|
| |
|
| |
|
| |
|
| |
|
| |
|
| |
|
| |
Income from investment operations: | | | | | | | | | | | | | | | | | | | | | | | | | | | | |
Net investment (loss) income | | | (0.07 | ) | | (0.16 | ) | | (0.10 | ) | | 0.07 | g | | (0.13 | )g | | 0.05 | g | | (0.08 | ) | | (0.26 | ) | | (0.08 | ) |
Net realized and unrealized (losses) gains on investments | | | (6.31 | ) | | (6.15 | ) | | (6.29 | ) | | 5.35 | | | 4.88 | | | 5.30 | | | 4.28 | | | 3.98 | | | 4.23 | |
| |
|
| |
|
| |
|
| |
|
| |
|
| |
|
| |
|
| |
|
| |
|
| |
Total from investment operations | | | (6.38 | ) | | (6.31 | ) | | (6.39 | ) | | 5.42 | | | 4.75 | | | 5.35 | | | 4.20 | | | 3.72 | | | 4.15 | |
| |
|
| |
|
| |
|
| |
|
| |
|
| |
|
| |
|
| |
|
| |
|
| |
Less distributions: | | | | | | | | | | | | | | | | | | | | | | | | | | | | |
Dividends from net investment income | | | 0.06 | | | — | | | 0.07 | | | — | | | — | | | — | | | — | | | — | | | — | |
Distributions from capital gains | | | 2.89 | | | 2.89 | | | 2.89 | | | (3.48 | ) | | (3.48 | ) | | (3.48 | ) | | (2.34 | ) | | (2.34 | ) | | (2.34 | ) |
| |
|
| |
|
| |
|
| |
|
| |
|
| |
|
| |
|
| |
|
| |
|
| |
Total distributions | | | 2.95 | | | 2.89 | | | 2.96 | | | (3.48 | ) | | (3.48 | ) | | (3.48 | ) | | (2.34 | ) | | (2.34 | ) | | (2.34 | ) |
| |
|
| |
|
| |
|
| |
|
| |
|
| |
|
| |
|
| |
|
| |
|
| |
Net asset value, end of period | | $ | 26.79 | | $ | 23.97 | | $ | 26.36 | | $ | 30.22 | | $ | 27.39 | | $ | 29.79 | | $ | 28.28 | | $ | 26.12 | | $ | 27.92 | |
| |
|
| |
|
| |
|
| |
|
| |
|
| |
|
| |
|
| |
|
| |
|
| |
Total Returnc | | | (1.40 | %)b | | (1.75 | %)b | | (1.36 | %)b | | 21.25 | % | | 20.34 | % | | 21.28 | % | | 16.80 | % | | 15.93 | % | | 16.81 | % |
Ratios and Supplemental Data | | | | | | | | | | | | | | | | | | | | | | | | | | | | |
Net assets, end of period (millions) | | $ | 697 | | $ | 64 | | $ | 89 | | $ | 756 | | $ | 65 | | $ | 82 | | $ | 671 | | $ | 48 | | $ | 46 | |
Ratio of operating expenses to average net assetse | | | 1.41 | %a | | 2.16 | %a | | 1.41 | %a | | 1.40 | % | | 2.15 | % | | 1.40 | % | | 1.41 | % | | 2.16 | % | | 1.41 | % |
Ratio of net investment loss to average net assetsf | | | (0.52 | %)a | | (1.35 | %)a | | (0.75 | %)a | | 0.26 | %g | | (0.51 | %)g | | 0.18 | %g | | (0.30 | %) | | (1.05 | %) | | (0.30 | %) |
Portfolio turnover rate | | | 24.05 | %b | | 24.05 | %b | | 24.05 | %b | | 50.26 | % | | 50.26 | % | | 50.26 | % | | 40.38 | % | | 40.38 | % | | 40.38 | % |
| |
|
* | Per share amounts have been calculated using the average shares method. |
|
|
See Notes to Financial Highlights. |
See Notes to Financial Statements. |
74
| | | | | | | | | | | | | | | | | | | | | | | | | | |
| |
Year Ended October 31, | |
| |
2005 | | 2004 | | 2003 | |
| |
| |
| |
Class Y | | Class C | | Class A | | Class Y | | Class C | | Class A | | Class Y | | Class C | | Class A | |
|
|
|
|
|
|
|
|
|
|
|
|
|
|
|
|
| |
| | | | | | | | | | | | | | | | | |
$ | 25.81 | | $ | 24.44 | | $ | 25.54 | | $ | 23.03 | | $ | 21.99 | | $ | 22.80 | | $ | 19.47 | | $ | 18.73 | | $ | 19.29 | |
|
| |
|
| |
|
| |
|
| |
|
| |
|
| |
|
| |
|
| |
|
| |
| | | | | | | | | | | | | | | | | | | | | | | | | | |
| (0.07 | ) | | (0.26 | ) | | (0.09 | ) | | (0.16 | ) | | (0.33 | ) | | (0.22 | ) | | (0.17 | ) | | (0.31 | ) | | (0.22 | ) |
| | | | | | | | | | | | | | | | | | | | | | | | | | |
| 2.38 | | | 2.26 | | | 2.36 | | | 3.41 | | | 3.25 | | | 3.43 | | | 3.73 | | | 3.57 | | | 3.73 | |
|
| |
|
| |
|
| |
|
| |
|
| |
|
| |
|
| |
|
| |
|
| |
| | | | | | | | | | | | | | | | | | | | | | | | | | |
| 2.31 | | | 2.00 | | | 2.27 | | | 3.25 | | | 2.92 | | | 3.21 | | | 3.56 | | | 3.26 | | | 3.51 | |
|
| |
|
| |
|
| |
|
| |
|
| |
|
| |
|
| |
|
| |
|
| |
| | | | | | | | | | | | | | | | | | | | | | | | | | |
| — | | | — | | | — | | | — | | | — | | | — | | | | | | | | | | |
| | | | | | | | | | | | | | | | | | | | | | | | | | |
| (1.70 | ) | | (1.70 | ) | | (1.70 | ) | | (0.47 | ) | | (0.47 | ) | | (0.47 | ) | | — | | | — | | | — | |
|
| |
|
| |
|
| |
|
| |
|
| |
|
| |
|
| |
|
| |
|
| |
| (1.70 | ) | | (1.70 | ) | | (1.70 | ) | | (0.47 | ) | | (0.47 | ) | | (0.47 | ) | | — | | | — | | | — | |
|
| |
|
| |
|
| |
|
| |
|
| |
|
| |
|
| |
|
| |
|
| |
| | | | | | | | | | | | | | | | | | | | | | | | | | |
$ | 26.42 | | $ | 24.74 | | $ | 26.11 | | $ | 25.81 | | $ | 24.44 | | $ | 25.54 | | $ | 23.03 | | $ | 21.99 | | $ | 22.80 | |
|
| |
|
| |
|
| |
|
| |
|
| |
|
| |
|
| |
|
| |
|
| |
| 9.23 | % | | 8.43 | % | | 9.16 | % | | 14.30 | % | | 13.46 | % | | 14.27 | % | | 18.28 | % | | 17.41 | % | | 18.20 | % |
| | | | | | | | | | | | | | | | | | | | | | | | | | |
$ | 684 | | $ | 36 | | $ | 29 | | $ | 601 | | $ | 14 | | $ | 17 | | $ | 554 | | $ | 11 | | $ | 6 | |
| | | | | | | | | | | | | | | | | | | | | | | | | | |
| 1.43 | % | | 2.17 | % | | 1.49 | % | | 1.46 | % | | 2.21 | % | | 1.72 | % | | 1.50 | % | | 2.25 | % | | 1.75 | % |
| | | | | | | | | | | | | | | | | | | | | | | | | | |
| (0.27 | %) | | (1.03 | %) | | (0.34 | %) | | (0.63 | %) | | (1.39 | %) | | (0.91 | %) | | (0.79 | %) | | (1.55 | %) | | (1.07 | %) |
| 54.54 | % | | 54.54 | % | | 54.54 | % | | 44.68 | % | | 44.68 | % | | 44.68 | % | | 47.88 | % | | 47.88 | % | | 47.88 | % |
75
FIRST EAGLE FUNDS
NOTES TO FINANCIAL HIGHLIGHTS
| |
a | Annualized |
b | Not annualized |
c | Does not give effect to the deduction of the CDSC (Contingent Deferred Sales Charge) of 1.00% |
d | May 15, 2003 inception date |
e | The ratio of operating expenses to average net assets without the effect of earnings credits and in the case of the First Eagle U.S. Value Fund, without the effect of earnings credits and expense reimbursements are as follows: |
| | | | | | | | | | | | | | | | | | | | | | | | | | | | |
|
| |
| | Six Months Ended April 30, 2008a
(Unaudited) | | Year Ended October 31, |
| | |
|
| | | 2007 | | 2006 |
| |
|
| |
| |
|
| | | Class A | | Class I | | Class C | | Class A | | Class I | | Class C | | Class A | | Class I | | Class C |
|
First Eagle Global Fund | | | 1.14 | % | | 0.89 | % | | 1.89 | % | | 1.12 | % | | 0.87 | % | | 1.87 | % | | 1.14 | % | | 0.89 | % | | 1.89 | % |
First Eagle Overseas Fund | | | 1.15 | % | | 0.90 | % | | 1.90 | % | | 1.12 | % | | 0.87 | % | | 1.87 | % | | 1.12 | % | | 0.87 | % | | 1.87 | % |
First Eagle U.S. Value Fund | | | 1.21 | % | | 0.96 | % | | 1.96 | % | | 1.20 | % | | 0.96 | % | | 1.95 | % | | 1.25 | % | | 1.00 | % | | 2.00 | % |
First Eagle Gold Fund | | | 1.19 | % | | 0.94 | % | | 1.94 | % | | 1.20 | % | | 0.95 | % | | 1.95 | % | | 1.22 | % | | 0.97 | % | | 1.97 | % |
| | | | | | | | | | | | | | | | | | | | | | | | | | | | |
|
| | | | | | | | | | | | | | | | | | | | | | | | | | | | |
| | | | | | | | | | | | | | | | | | | | | | | | | | | | |
| | Six Months Ended April 30, 2008a
(Unaudited) | | | Year Ended October 31, |
| | |
|
| | | 2007 | | 2006 |
| |
|
| |
| |
|
| | | Class Y | | Class C | | Class A | | Class Y | | Class C | | Class A | | Class Y | | Class C | | Class A |
|
|
First Eagle Fund of America | | | 1.42 | % | | 2.17 | % | | 1.42 | % | | 1.41 | % | | 2.16 | % | | 1.41 | % | | 1.41 | % | | 2.16 | % | | 1.41 | % |
| |
f | The ratio of net investment income (loss) to average net assets without the effect of earnings credits and in the case of the First Eagle U.S. Value Fund, without the effect of earnings credits and expense reimbursements are as follows: |
| | | | | | | | | | | | | | | | | | | | | | | | | | | | |
|
|
| |
| | Six Months Ended April 30, 2008a
(Unaudited) | | | Year Ended October 31, |
| | |
|
| | | 2007 | | 2006 |
| |
|
| |
| |
|
| | | Class A | | Class I | | Class C | | Class A | | Class I | | Class C | | Class A | | Class I | | Class C |
|
First Eagle Global Fund | | | 1.29 | % | | 1.57 | % | | 0.55 | % | | 1.39 | % | | 1.64 | % | | 0.64 | % | | 1.30 | % | | 1.57 | % | | 0.56 | % |
First Eagle Overseas Fund | | | 1.18 | % | | 1.38 | % | | 0.43 | % | | 1.54 | % | | 1.79 | % | | 0.78 | % | | 1.56 | % | | 1.82 | % | | 0.81 | % |
First Eagle U.S. Value Fund | | | 2.11 | % | | 2.36 | % | | 1.37 | % | | 2.04 | % | | 2.32 | % | | 1.28 | % | | 1.87 | % | | 2.12 | % | | 1.12 | % |
First Eagle Gold Fund | | | (0.67 | %) | | (0.43 | %) | | (1.42 | %) | | (0.56 | %) | | (0.31 | %) | | (1.31 | %) | | (0.59 | %) | | (0.34 | %) | | (1.34 | %) |
| | | | | | | | | | | | | | | | | | | | | | | | | | | | |
|
| | | | | | | | | | | | | | | | | | | | | | | | | | | | |
| | | | | | | | | | | | | | | | | | | | | | | | | | | | |
| | Six Months Ended April 30, 2008a
(Unaudited) | | | Year Ended October 31, |
| | |
|
| | 2007 | | | 2006 |
| |
|
| |
| |
|
| | | Class Y | | Class C | | Class A | | Class Y | | Class C | | Class A | | Class Y | | Class C | | Class A |
|
First Eagle Fund of America | | | (0.53 | %) | | (1.36 | %) | | (0.76 | %) | | 0.25 | %g | | (0.52 | %)g | | 0.17 | %g | | (0.30 | %) | | (1.05 | %) | | (0.30 | %) |
|
| |
g | Investment income (loss) per share reflects special dividends received in the First Eagle Fund of America (Class Y, C and A) which amounted to $0.13, $0.12, and $0.13 per share. Excluding the special dividend, the ratio of net investment income (loss) to average net assets both with and without the effect of earnings credits in First Eagle Fund of America (Class Y, C and A) would have been (0.22%), (0.99%), and (0.30%). |
76
| | | | | | | | | | | | | | | | | | | | | | | | | | |
|
| | | | | | | | | | | | | | | | | | | | | | | | | | |
Year Ended October 31, |
|
2005 | | 2004 | | | 2003 |
| |
| |
|
| Class A | | Class I | | Class C | | | Class A | | Class I | | Class C | | Class A | | Class I | | Class C |
|
| 1.20 | % | | 0.95 | % | | 1.95% | | | 1.24 | % | | 0.99 | % | | 1.99 | % | | 1.32 | % | | 1.07 | % | | 2.07 | % |
| 1.18 | % | | 0.93 | % | | 1.93% | | | 1.25 | % | | 1.00 | % | | 2.00 | % | | 1.31 | % | | 1.06 | % | | 2.05 | % |
| 1.28 | % | | 1.04 | % | | 2.02% | | | 1.38 | % | | 1.13 | % | | 2.13 | % | | 1.51 | % | | 1.26 | % | | 2.26 | % |
| 1.30 | % | | 1.05 | % | | 2.05% | | | 1.39 | % | | 1.14 | % | | 2.14 | % | | 1.50 | % | | 1.23 | %ad | | 2.19 | %ad |
| | | | | | | | | | | | | | | | | | | | | | | | | | |
|
| | | | | | | | | | | | | | | | | | | | | | | | | | |
Year Ended October 31, |
|
2005 | | 2004 | | 2003 |
| |
| |
|
Class Y | Class C | Class A | | Class Y | Class C | Class A | Class Y | Class C | Class A |
|
| 1.43 | % | | 2.17 | % | | 1.49% | | | 1.46 | % | | 2.21 | % | | 1.72 | % | | 1.50 | % | | 2.25 | % | | 1.75 | % |
| | | | | | | | | | | | | | | | | | | | | | | | | | |
|
| | | | | | | | | | | | | | | | | | | | | | | | | | |
Year Ended October 31, |
|
2005 | | 2004 | | 2003 |
| |
| |
|
| Class A | | Class I | | Class C | | | Class A | | Class I | | Class C | | Class A | | Class I | | Class C |
|
| 1.20 | % | | 1.48 | % | | 0.47% | | | 1.46 | % | | 1.67 | % | | 0.66 | % | | 1.91 | % | | 2.10 | % | | 1.07 | % |
| 1.21 | % | | 1.46 | % | | 0.46% | | | 0.90 | % | | 1.17 | % | | 0.17 | % | | 1.23 | % | | 1.48 | % | | 0.45 | % |
| 1.40 | % | | 1.63 | % | | 0.66% | | | 1.66 | % | | 2.00 | % | | 0.95 | % | | 1.72 | % | | 1.99 | % | | 0.97 | % |
| (0.24 | %) | | (0.01 | %) | | (0.98% | ) | | (0.62 | %) | | (0.35 | %) | | (1.34 | %) | | (0.43 | %) | | (0.25 | %)ad | | (1.26 | %)ad |
| | | | | | | | | | | | | | | | | | | | | | | | | | |
|
| | | | | | | | | | | | | | | | | | | | | | | | | | |
Year Ended October 31, |
|
2005 | | 2004 | | 2003 |
| |
| |
|
| Class Y | | Class C | | Class A | | | Class Y | | Class C | | Class A | | Class Y | | Class C | | Class A |
|
| (0.27 | %) | | (1.04 | %) | | (0.34% | ) | | (0.57 | %) | | (1.32 | %) | | (0.84 | %) | | (0.79 | %) | | (1.55 | %) | | (1.07 | %) |
|
77

FIRST EAGLE FUNDS
Fund Expenses
(Unaudited)
Example
As a shareholder of the First Eagle Funds, you may incur two types of costs: (1) transaction costs, including front-end and contingent deferred sales charges (loads), and (2) ongoing costs, including advisory fees; distribution (12b-1) and/or service fees; and other fund expenses. This Example is intended to help you understand your ongoing costs (in dollars) of investing in each of the First Eagle Funds and to compare these costs with the ongoing costs of investing in other mutual funds.
This Example is based on an investment of $1,000 invested on November 1, 2007 and held for the six months ended April 30, 2008.
Actual Expenses
The table below titled “Based on Actual Total Return” provides information about actual account values and actual expenses. You may use the information provided in this table, together with the amount you invested, to estimate the expenses that you paid over the period. To estimate the expenses you paid on your account, divide your ending account value by $1,000 (for example, an $8,600 ending account value divided by $1,000 = 8.6), then multiply the result by the number under the heading entitled “Expenses Paid During the Period”.
Based on Actual Total Return (1)
| | | | | | | | | | | | | | | |
|
|
|
|
|
|
|
|
|
|
|
|
|
|
|
|
| | Actual Total
Return
Without
Sales Charges(2) | | Beginning
Account
Value | | Ending
Account
Value | | Expenses
Paid
During the
Period(3) | |
|
|
|
|
|
|
|
|
|
|
First Eagle Global Fund Class A | | | (0.16% | ) | | $ | 1,000.00 | | $ | 998.40 | | $ | 5.61 | | |
First Eagle Global Fund Class I | | | (0.02% | ) | | | 1,000.00 | | | 999.80 | | | 4.38 | | |
First Eagle Global Fund Class C | | | (0.54% | ) | | | 1,000.00 | | | 994.60 | | | 9.32 | | |
First Eagle Overseas Fund Class A | | | (2.06% | ) | | | 1,000.00 | | | 979.40 | | | 5.66 | | |
First Eagle Overseas Fund Class I | | | (1.94% | ) | | | 1,000.00 | | | 980.60 | | | 4.38 | | |
First Eagle Overseas Fund Class C | | | (2.43% | ) | | | 1,000.00 | | | 975.70 | | | 9.33 | | |
First Eagle U.S. Value Fund Class A | | | 0.13% | | | | 1,000.00 | | | 1,001.30 | | | 6.02 | | |
First Eagle U.S. Value Fund Class I | | | 0.22% | | | | 1,000.00 | | | 1,002.20 | | | 4.78 | | |
First Eagle U.S. Value Fund Class C | | | (0.32% | ) | | | 1,000.00 | | | 996.80 | | | 9.73 | | |
First Eagle Gold Fund Class A | | | (5.44% | ) | | | 1,000.00 | | | 945.60 | | | 5.71 | | |
First Eagle Gold Fund Class I | | | (5.31% | ) | | | 1,000.00 | | | 946.90 | | | 4.50 | | |
First Eagle Gold Fund Class C | | | (5.79% | ) | | | 1,000.00 | | | 942.10 | | | 9.32 | | |
First Eagle Fund of America Class A | | | (1.36% | ) | | | 1,000.00 | | | 986.40 | | | 6.96 | | |
First Eagle Fund of America Class C | | | (1.75% | ) | | | 1,000.00 | | | 982.50 | | | 10.65 | | |
First Eagle Fund of America Class Y | | | (1.40% | ) | | | 1,000.00 | | | 986.00 | | | 6.96 | | |
|
|
|
|
|
|
|
|
|
|
|
|
|
|
|
|
| |
(1) | For the six months ended April 30, 2008. |
(2) | Assumes reinvestment of all dividends and capital gain distributions, if any, at net asset value and does not reflect the deduction of the applicable sales charge. Had the effect of sales charges been reflected, expenses would have been higher and returns lower. Total return is not annualized, as it may not be representative of the total return for the year. |
(3) | Expenses are equal to the annualized expense ratio of 1.13%, 0.88%, 1.88%, 1.15%, 0.89%, 1.90%, 1.21%, 0.96%, 1.96%, 1.18%, 0.93%, 1.93%, 1.41%, 2.16% and 1.41% for the First Eagle Global Fund Class A, I and C; First Eagle Overseas Fund Class A, I and C; First Eagle U.S. Value Fund Class A, I and C; First Eagle Gold Fund Class A, I and C; and First Eagle Fund of America Class A, C and Y, respectively, multiplied by the average account value over the period, multiplied by 182/366 (to reflect the one-half year period). |
79
FIRST EAGLE FUNDS
Fund Expenses—(Continued)
(Unaudited)
Hypothetical Example for Comparison Purposes
The table below titled “Based on Hypothetical Total Return” provides information about hypothetical account values and hypothetical expenses based on the actual expense ratios and an assumed rate of return of 5.00% per year before expenses, which is not the First Eagle Fund’s actual return. The hypothetical account values and expenses may not be used to estimate the actual ending account balance or expenses you paid for the period. You may use the information provided in this table to compare the ongoing costs of investing in the First Eagle Funds and other funds. To do so, compare the 5.00% hypothetical example relating to the First Eagle Funds with the 5.00% hypothetical examples that appear in the shareholder reports of other funds.
Please note that the expenses shown in the table below are meant to highlight your ongoing costs only and do not reflect any transactional costs, such as front-end or back-end sales charges (loads). Therefore, the table is useful in comparing ongoing costs only, and will not help you determine the relative total costs of owning different funds. In addition, if these transaction costs were included, your costs would have been higher.
Based on Hypothetical Total Return (1)
| | | | | | | | | | | | | | | |
|
|
|
|
|
|
|
|
|
|
|
|
|
|
|
|
| | Hypothetical
Annualized
Total
Return | | Beginning
Account
Value | | Ending
Account
Value | | Expenses
Paid
During the
Period(2) | |
|
|
|
|
|
|
|
|
|
|
First Eagle Global Fund Class A | | | 5.00 | % | | $ | 1,000.00 | | $ | 1,019.24 | | $ | 5.67 | | |
First Eagle Global Fund Class I | | | 5.00 | % | | | 1,000.00 | | | 1,020.49 | | | 4.42 | | |
First Eagle Global Fund Class C | | | 5.00 | % | | | 1,000.00 | | | 1,015.51 | | | 9.42 | | |
First Eagle Overseas Fund Class A | | | 5.00 | % | | | 1,000.00 | | | 1,019.14 | | | 5.77 | | |
First Eagle Overseas Fund Class I | | | 5.00 | % | | | 1,000.00 | | | 1,020.39 | | | 4.47 | | |
First Eagle Overseas Fund Class C | | | 5.00 | % | | | 1,000.00 | | | 1,015.42 | | | 9.52 | | |
First Eagle U.S. Value Fund Class A | | | 5.00 | % | | | 1,000.00 | | | 1,018.85 | | | 6.07 | | |
First Eagle U.S. Value Fund Class I | | | 5.00 | % | | | 1,000.00 | | | 1,020.09 | | | 4.82 | | |
First Eagle U.S. Value Fund Class C | | | 5.00 | % | | | 1,000.00 | | | 1,015.12 | | | 9.82 | | |
First Eagle Gold Fund Class A | | | 5.00 | % | | | 1,000.00 | | | 1,019.00 | | | 5.92 | | |
First Eagle Gold Fund Class I | | | 5.00 | % | | | 1,000.00 | | | 1,020.24 | | | 4.67 | | |
First Eagle Gold Fund Class C | | | 5.00 | % | | | 1,000.00 | | | 1,015.27 | | | 9.67 | | |
First Eagle Fund of America Class A | | | 5.00 | % | | | 1,000.00 | | | 1,017.85 | | | 7.07 | | |
First Eagle Fund of America Class C | | | 5.00 | % | | | 1,000.00 | | | 1,014.12 | | | 10.82 | | |
First Eagle Fund of America Class Y | | | 5.00 | % | | | 1,000.00 | | | 1,017.85 | | | 7.07 | | |
|
|
|
|
|
|
|
|
|
|
|
|
|
|
|
|
| |
(1) | For the six months ended April 30, 2008. |
(2) | Expenses are equal to the annualized expense ratio of 1.13%, 0.88%, 1.88%, 1.15%, 0.89%, 1.90%, 1.21%, 0.96%, 1.96%, 1.18%, 0.93%, 1.93%, 1.41%, 2.16%, and 1.41% for the First Eagle Global fund Class A, I, and C; First Eagle Overseas Fund Class A, I, and C; First Eagle U.S. Value Fund Class A, I, and C; First Eagle Gold Fund Class A, I, and C; and First Eagle Fund of America Class A, C, and Y, respectively, multiplied by the average account value over the period, multiplied by 182/366 (to reflect the one-half year period). |
80
FIRST EAGLE FUNDS
ADDITIONAL INFORMATION
(Unaudited)
MANAGEMENT OF THE TRUST
The business of the Trust is managed by its Board of Trustees, which elects officers responsible for the day to day operations of the Funds and for the execution of the policies formulated by the Board of Trustees.
Pertinent information regarding the members of the Board of Trustees and principal officers of the Trust is set forth below. Some of the Trustees and officers are employees of the Adviser and its affiliates. At least a majority of the Trust’s Board of Trustees are not “interested persons” as that term is defined in the Investment Company Act.
INDEPENDENT TRUSTEES(1)
| | | | | | | | | | |
Name, Age and Address | | Position(s)
Held with
the Trust | | Term of
Office(2)
and Length
of Time
Served | | Principal
Occupation(s)
During Past 5 Years | | Number of
Portfolios
in the Fund
Complex
Overseen by
Trustee | | Other
Directorships/
Trusteeships
Held by Trustee |
| |
| |
| |
| |
| |
|
Lisa Anderson
1345 Avenue of the Americas
New York, New York 10105
(born October 1950) | | Trustee | | December
2005 to
present | | James T. Shotwell Professor of International Relations and Dean, School of International and Public Affairs, Columbia University; President, Middle East Studies Association | | 6 | | Chair, Social Science Research Council; Member, Carnegie Council on Ethics and International Affairs; Member Emerita, Human Rights Watch; Trustee, First Eagle Variable Funds (1 portfolio) |
| | | | | | | | | | |
Candace K. Beinecke
One Battery Park Plaza
New York, New York 10004
(born December 1946) | | Trustee
(Chair) | | December
1999 to
present(3) | | Chair, Hughes Hubbard & Reed LLP | | 6 | | Director, ALSTOM; Trustee, Vornado Realty Trust; Director, Rockefeller Financial Services, Inc.; Director, Rockefeller & Company, Inc.; Trustee, The Wallace Foundation; Director, Vice Chair, and member of the Executive Committee, Partnership for New York City; Board of Advisors, Yale Law School Center for the Study of Corporate Law; Trustee, First Eagle Variable Funds (Chair)
(1 portfolio) |
| |
|
(1) | Trustees who are not “interested persons” of the Trust as defined in the Investment Company Act. |
(2) | The term of office of each Independent Trustee expires on his/her 70th birthday. |
(3) | Ms. Beinecke also served as a trustee of a predecessor fund to First Eagle Fund of America since 1996. |
81
| | | | | | | | | | |
Name, Age and Address | | Position(s)
Held with
the Trust | | Term of
Office(1)
and Length
of Time
Served | | Principal
Occupation(s)
During Past 5 Years | | Number of
Portfolios
in the Fund
Complex
Overseen by
Trustee | | Other
Directorships/
Trusteeships
Held by Trustee |
| |
| |
| |
| |
| |
|
Jean D. Hamilton
1345 Avenue of the Americas
New York, New York 10105
(born January 1947) | | Trustee | | March
2003 to
present | | Private Investor/ Independent Consultant/ Member, Brock Capital Group LLC; prior to November 2002, Chief Executive Officer, Prudential Institutional; Executive Vice President, Prudential Financial, Inc. | | 6 | | Director, RenaissanceRe Holdings Ltd.; Director, Four Nations; Trustee, First Eagle Variable Funds (1 portfolio) |
| | | | | | | | | | |
James E. Jordan
1345 Avenue of the Americas
New York, New York 10105
(born April 1944) | | Trustee | | December
1999 to
present | | Private Investor and Independent Consultant; prior to July 2005, Managing Director, Arnhold and S. Bleichroeder Advisers, LLC and Director, ASB Securities LLC and ASB Advisers UK, Limited; prior to July 2002, private investor and consultant to The Jordan Company (private investment banking firm) since June 1997 | | 6 | | Director, Leucadia National Corporation; Director, JZ Equity Partners, Plc. (U.K. investment trust company); Director, Columbia University School of International and Public Affairs; Chairman’s Council, Conservation International; Trustee, First Eagle Variable Funds (1 portfolio) |
| | | | | | | | | | |
William M. Kelly
500 Fifth Avenue,
50th Floor
New York, New York 10110
(born February 1944) | | Trustee | | December
1999 to
present(2) | | President, Lingold Associates | | 6 | | Treasurer and Trustee, Black Rock Forest Preservation and Consortium; Trustee, St. Anselm College; Trustee, First Eagle Variable Funds (1 portfolio) |
| | | | | | | | | | |
Paul J. Lawler
One Michigan Avenue
East Battle Creek,
Michigan 49017
(born May 1948) | | Trustee | | March
2002 to
present | | Vice President Investments and Chief Investment Officer, W.K. Kellogg Foundation | | 6 | | Finance and Investment Committee Member, Battle Creek Community Foundation; Custody Advisory Committee Member, The Bank of New York; Advisory Committee, Common Fund Capital; Advisory Committee, TA Realty Advisors; Trustee, First Eagle Variable Funds
(1 portfolio) |
| | | | | | | | | | |
Dominique M. Raillard
15 Boulevard Delessert
75016 Paris France
(born June 1938) | | Trustee | | April
1987 to
present | | Private Investor and Independent Consultant | | 6 | | Trustee, First Eagle Variable Funds
(1 portfolio) |
| |
|
(1) | The term of office of each Independent Trustee expires on his/her 70th birthday. |
(2) | Mr. Kelly also served as a trustee of a predecessor fund to First Eagle Fund of America since 1998. |
82
INTERESTED TRUSTEES
| | | | | | | | | | |
Name, Age and Address | | Position(s)
Held with
the Trust | | Term of
Office(1)
and Length
of Time
Served | | Principal
Occupation(s)
During Past 5 Years | | Number of
Portfolios
in the Fund
Complex
Overseen by
Trustee | | Other
Directorships/
Trusteeships
Held by Trustee |
| |
| |
| |
| |
| |
|
John P. Arnhold
1345 Avenue of the Americas
New York, New York 10105
(born December 1953) | | President
and
Trustee | | December
1999 to
present | | Co-President, Co-CEO and Director, Arnhold and S. Bleichroeder Holdings, Inc.; Chairman, CEO and Director, Arnhold and S. Bleichroeder Advisers, LLC and ASB Securities LLC; prior to March 2005, President and Director, Natexis Bleichroeder, Inc. and Natexis Bleichroeder, UK | | 6 | | Director, Arnhold Ceramics; Director, The Arnhold Foundation; Director, The Mulago Foundation; Director, Hanseatic Asset Management LBG; Director, Quantum Endowment Fund; Director, Educational Broadcasting Corporation; Trustee, Trinity Episcopal Schools Corp.; Trustee, Vassar College; Trustee, Sports and Arts in Schools Foundation; Trustee, Jazz at Lincoln Center; President and Trustee, First Eagle Variable Funds (1 portfolio) |
| | | | | | | | | | |
Jean-Marie Eveillard
1345 Avenue of the Americas
New York, New York 10105
(born January 1940) | | Portfolio
Manager
and
Trustee | | June 2008
to present
(with
portfolio
management
tenure
described
in next
column) | | Portfolio Manager of First Eagle Global Fund, First Eagle Overseas Fund, First Eagle U.S. Value Fund, First Eagle Gold Fund, and First Eagle Variable Funds since March 2007 and prior to December 2004 (portfolio management responsibilities commenced 1979); Senior Advisor to Arnhold and S. Bleichroeder Advisers, LLC since January 2005 | | 6 | | Portfolio Manager and Trustee, First Eagle Variable Funds (1 portfolio) |
| |
|
(1) | The term of office of each Interested Trustee is indefinite. |
83
| | | | | | |
| | OFFICERS
| | |
Name, Age and Address | | Position(s)
Held with
the Trust | | Term of Office
and Length of
Time Served(1) | | Principal Occupation(s)
During Past Five (5) Years |
| |
| |
| |
|
John P. Arnhold
1345 Avenue of the Americas
New York, New York 10105
(born December 1953) | | President and Trustee | | December 1999
to present | | See table on preceding page related to Interested Trustees |
| | | | | | |
Robert Bruno
1345 Avenue of the Americas
New York, New York 10105
(born June 1964) | | Chief Operations
and Financial
Officer | | December 1999
to present | | Senior Vice President, Arnhold and S. Bleichroeder Advisers, LLC; President and Chief Compliance Officer, ASB Securities LLC; Chief Operations and Financial Officer, First Eagle Variable Funds |
| | | | | | |
Mark D. Goldstein
1345 Avenue of the Americas
New York, New York 10105
(born October 1964) | | Chief
Compliance
Officer | | February 2005
to present | | General Counsel, Chief Compliance Officer and Senior Vice President, Arnhold and S. Bleichroeder Advisers, LLC; General Counsel and Secretary of Arnhold and S. Bleichroeder Holdings, Inc., and Chief Compliance Officer, First Eagle Variable Funds from February 2005; Chief Compliance Officer, Good Hope Advisers, LLC from January 2006; Senior Counsel and Chief Compliance Officer, MacKay Shields LLC from April 2004; Senior Associate General Counsel, UBS Financial Services, Inc. from May 1998 |
| | | | | | |
Suzan J. Afifi
1345 Avenue of the Americas
New York, New York 10105
(born October 1952) | | Vice President
and Secretary | | December 1999
to present | | Vice President, Arnhold and S. Bleichroeder Advisers, LLC; Vice President, ASB Securities LLC; Vice President and Secretary, First Eagle Variable Funds |
| | | | | | |
Michael Luzzatto
1345 Avenue of the Americas
New York, New York 10105
(born April 1977) | | Assistant Vice
President | | December 2004
to present | | Vice President, Arnhold and S. Bleichroeder Advisers, LLC; Vice President, ASB Securities LLC; Assistant Vice President, First Eagle Variable Funds |
| | | | | | |
Winnie Chin
1345 Avenue of the Americas
New York, New York 10105
(born July 1974) | | Assistant
Treasurer | | March 2001
to present | | Vice President, Arnhold and S. Bleichroeder Advisers, LLC; Assistant Treasurer, First Eagle Variable Funds |
| | | | | | |
Philip Santopadre
1345 Avenue of the Americas
New York, New York 10105
(born August 1977) | | Assistant
Treasurer | | September 2005
to present | | Vice President, Arnhold and S. Bleichroeder Advisers, LLC; Assistant Treasurer, First Eagle Variable Funds |
| |
|
(1) | The term of office of each officer is indefinite. Length of time served represents time served as an officer of the Trust (or its predecessor entities), although various positions may have been held during the period. |
84
CONSIDERATION OF INVESTMENT ADVISORY AGREEMENTS
On December 22, 1999, the shareholders of the Global Fund, the Overseas Fund and the Gold Fund approved the Advisory Agreement between the Trust and the Adviser. The shareholders of the U.S. Value Fund approved the Advisory Agreement applicable to that Fund on August 31, 2001, and the shareholders of the First Eagle Fund of America approved the Advisory Agreement applicable to that Fund on December 10, 2002. The Board of Trustees of the Trust approved the Advisory Agreement most recently on December 11, 2007. In doing so, the Trustees considered the desirability of continuing the Fund’s historic relationship with the Adviser in light of the total compensation to be received by the Adviser, the expenses incurred by the Adviser in performing services under the Advisory Agreement and the total cost to the Fund of using the Adviser’s services, taking into account any expenses that the Adviser may pass to the Fund. The Trustees determined that the compensation to be received by the Adviser and the expenses both incurred by the Adviser and passed to the Fund are reasonable and appropriate in light of the nature, extent and quality of the services provided by the Adviser. Turnover among investment personnel was commented on, with the Trustees expressing their appreciation that management had secured the return of longtime portfolio manager Mr. Jean-Marie Eveillard, maintained the depth of the analyst team and added key resources in promoting Mr. Abhay Deshpande and hiring Mr. Bruce Greenwald as the Global Value team’s Director of Research. The Trustees also considered the effects of indirect compensation to the Adviser, such as soft dollar and other service benefits, and the effect of the advisory fee on the ratio of total expenses to total assets (including the allocation of the benefits of economies of scale among the parties as the Fund grows), which the Trustees determined are reasonable and appropriate. The Trustees noted, in particular, the generally low levels of soft dollars and the absence of any affiliated broker-dealer relationships. The Trustees also noted that the Fund’s expense ratio has declined over a period of years as the Fund has grown, suggesting that the shareholders are benefiting from economies of scale in the operation of the Fund. In addition, they compared competitive prices for comparable services and advisory fees charged to institutional clients of the Adviser and evaluated the Adviser’s past performance and reliability as well as its profitability, capabilities and financial condition. Among other things, the Trustees determined that the Adviser’s fees were competitive to those charged by investment advisers to similar funds (i.e., the Fund’s net management fee was approximately the same as or lower than its reviewed peer group average, except in the case of First Eagle Fund of America, whose net management fee was higher than average) and, given differences in the legal and practical requirements of such clients, to institutional clients of the Adviser, total compensation was reasonable, and the Fund’s expense ratio was reasonable both on an absolute basis and when compared to those of similar funds. The Trustees also determined that the Adviser’s past performance and reliability on behalf of the Fund were excellent (i.e., generally higher and more consistent on a medium- and long-term basis than the reviewed group average) when compared with investment advisers to similar funds and the Adviser’s profitability and financial condition were satisfactory. Attention was given to the fact that the advisory fee charged to the First Eagle Fund of America is higher than the reviewed peer group median. The Trustees determined this was appropriate in light of the superior service record delivered. They referred to the Fund’s consistent long-term performance and stability of the management team. The Trustees also noted their confidence in the capability and integrity of the senior management and staff of the Adviser. Accordingly, they concluded that the Advisory Agreement serves the interests of the Fund and its shareholders.
The shareholders of the First Eagle Fund of America approved the Subadvisory Agreement on December 10, 2002. The Board of Trustees approved the Agreement most recently on December 11, 2007. In doing so, the Trustees considered the desirability of continuing the Fund’s historic relationship with Messrs. Levy and Cohen and the Adviser’s commitment to supervise their provision of portfolio management services delivered by the Subadviser. They also noted that the fees paid to the Subadviser are paid by the Adviser and do not increase the advisory fees borne directly by Fund shareholders. In this regard, they noted positively the quality of the services (measured in terms of investment performance, which generally was higher and more consistent on a long-term basis than that of its reviewed peer group average) delivered by the Subadviser. They also considered the costs incurred by the Subadviser relative to these services
85
and to the fees paid under the Subadvisory Agreement. In doing so, they considered the effects of other benefits to the Subadviser resulting from its relationship to the Fund, including soft dollar and other service benefits. The Trustees concluded that the Subadvisory Agreement serves the interest of the Fund and its shareholders. (A number of the factors evaluated by the Trustees in considering the Advisory Agreement were found not to be additionally relevant in respect of the Subadvisory Agreement, principally because the payments in question had been separately evaluated in respect of the Advisory Agreement.)
The Advisory Agreement, and additionally with respect to the First Eagle Fund of America, the Subadvisory Agreement, will continue in effect only so long as such continuance is specifically approved at least annually in conformity with the Investment Company Act. The Advisory Agreement provides that the Adviser will not be liable for any error of judgment or for any loss suffered by the Fund in connection with the matters to which the Advisory Agreement relates, except a loss resulting from willful misfeasance, bad faith, gross negligence or reckless disregard of duty. The Advisory Agreement provides that it will terminate automatically if assigned, within the meaning of the Investment Company Act, and that it may be terminated without penalty by either party upon not more than 60 days’ nor less than 30 days’ written notice. The Subadvisory Agreement provides that Iridian will not be liable for any error of judgment or for any loss suffered by the First Eagle Fund of America in connection with the matters to which the Subadvisory Agreement relates, except a loss resulting from willful misfeasance, bad faith, gross negligence or reckless disregard of duty. The Subadvisory Agreement provides that it will terminate automatically if assigned, within the meaning of the Investment Company Act, and that it may be terminated without penalty by either party upon not more than 60 days’ nor less than 30 days’ written notice.
86
| |
This prospectus is printed on recycled paper which is 30% post-industrial recycled fiber and manufactured using biogas energy. | 
|
| | | |
| | | |
| | | |
| | | |
| | | |
| First Eagle Funds | | Investment Adviser |
| 1345 Avenue of the Americas | | Arnhold and S. Bleichroeder |
| New York, NY 10105 | | Advisers, LLC |
| www.firsteaglefunds.com | | 1345 Avenue of the Americas |
| | | New York, NY 10105 |
| Trustees | | |
| Lisa Anderson | | Legal Counsel |
| John P. Arnhold | | Shearman & Sterling LLP |
| Candace K. Beinecke (Chair) | | 599 Lexington Avenue |
| Jean-Marie Eveillard | | New York, NY 10022 |
| Jean D. Hamilton | | |
| James E. Jordan | | Custodian |
| William M. Kelly | | State Street Bank and Trust Company |
| Paul J. Lawler | | 801 Pennsylvania |
| Dominique Raillard | | Kansas City, MO 64105 |
| | | |
| Officers | | Shareholder Servicing Agent |
| John P. Arnhold | | DST Systems, Inc. |
| President | | 330 West 9th Street |
| | | Kansas City, MO 64105 |
| Robert Bruno | | (800) 334-2143 |
| Chief Operations & Financial Officer | | |
| | | Underwriter |
| Mark D. Goldstein | | First Eagle Funds Distributors, |
| Chief Compliance Officer | | a division of ASB Securities LLC |
| | | 1345 Avenue of the Americas |
| Suzan J. Afifi | | New York, NY 10105 |
| Vice President & Secretary | | |
| | | Independent Registered |
| Michael Luzzatto | | Public Accounting Firm |
| Assistant Vice President | | PricewaterhouseCoopers LLP |
| | | 300 Madison Avenue |
| Winnie Chin | | New York, NY 10017 |
| Assistant Treasurer | | |
| | | |
| Philip Santopadre | | |
| Assistant Treasurer | | |
| | | |
| | | |
| | | |
| | | |
| | | |
| | |
| This report is not authorized for distribution to prospective investors unless preceded or accompanied by a currently effective prospectus of First Eagle Funds.
The financial information included herein is taken from records of the Funds without examination by the Funds’ independent auditors, who do not express an opinion thereon. | 
|
Item 2. Code of Ethics.
The Registrant has adopted a code of ethics that applies to its principal executive officer and principal financial officer. Copies of the code of ethics may be requested free of charge by calling 1-800-334-2143 (toll free).
Item 3. Audit Committee Financial Expert.
Not applicable to this semi-annual report.
Item 4. Principal Accountant Fees and Services
Not applicable to this semi-annual report.
Item 5. Audit Committee of Listed Registrants.
Not applicable at this time.
Item 6. Schedule of Investments.
Please see schedule of investments contained in the Report to Stockholders included under Item 1 of this Form N-CSR.
Item 7. Disclosure of Proxy Voting Policies and Procedures for Closed-End Management Investment Companies.
Not applicable at this time.
Item 8. Purchases of Equity Securities by Close-End Management Investment Company and Affiliated Purchasers.
Not applicable at this time.
Item 9. Submission of Matters to a Vote of Security Holders.
Not applicable at this time.
Item 10. Controls and Procedures.
(a) In the opinion of the principal executive officer and principal financial officer, based on their evaluation, the registrant's disclosure controls and procedures are adequately designed and are operating effectively to ensure (i) that material information relating to the registrant, including its consolidated subsidiaries, is made known to them by others within those entities, particularly during the period in which this report is being prepared; and (ii) that information required to be disclosed by the registrant on Form N-CSR is recorded, processed, summarized and reported within the time periods specified in the Securities and Exchange Commission's rules and forms.
(b) There were no changes in the registrant's internal control over financial reporting that occurred during the registrant's most recent fiscal half-year (the registrant's second fiscal half-year in the case of an annual report) that
have materially affected or are reasonably likely to materially affect, the registrant's internal control over financial reporting.
Item 11. Exhibits.
(a)(1) Not applicable to this semi-annual report.
(a)(2) Certifications pursuant to Rule 30a-2(a) under the Investment Company Act of 1940 (17 CFR 270.30a -2(a)): Attached hereto.
(a)(3) Not applicable.
(b) Certification pursuant to Rule 30a-2(b) under the Investment Company Act of 1940 (17 CFR 270.30a -2(b)): Attached hereto.
SIGNATURES
Pursuant to the requirements of the Securities Exchange Act of 1934 and the Investment Company Act of 1940, the registrant has duly caused this report to be signed on its behalf by the undersigned, thereunto duly authorized.
| (Registrant) | First Eagle Funds |
| | |
| By (Signature and Title)* | /s/ John P. Arnhold |
| | John P. Arnhold, President |
Date: July 2, 2008
Pursuant to the requirements of the Securities Exchange Act of 1934 and the Investment Company Act of 1940, this report has been signed below by the following persons on behalf of the registrant and in the capacities and on the dates indicated.
| By (Signature and Title)* | /s/ John P. Arnhold |
| | John P. Arnhold, Principal Executive Officer |
| | |
| Date: July 2, 2008 | |
| | |
| |
| By (Signature and Title)* | /s/ Robert Bruno |
| | Robert Bruno, Principal Financial Officer |
Date: July 2, 2008
* Print the name and title of each signing officer under his or her signature.