UNITED STATES
SECURITIES AND EXCHANGE COMMISSION
Washington, D.C. 20549
FORM N-CSR
CERTIFIED SHAREHOLDER REPORT OF REGISTERED
MANAGEMENT INVESTMENT COMPANIES
Investment Company Act file number | 811-7762 |
|
First Eagle Funds |
(Exact name of registrant as specified in charter) |
|
1345 Avenue of the Americas New York, NY | | 10105-4300 |
(Address of principal executive offices) | | (Zip code) |
|
Robert Bruno First Eagle Funds 1345 Avenue of the Americas New York, NY 10105-4300 |
(Name and address of agent for service) |
|
Registrant’s telephone number, including area code: | 1-212-632-2700 | |
|
Date of fiscal year end: | October 31 | |
|
Date of reporting period: | April 30, 2011 | |
| | | | | | | | |
Form N-CSR is to be used by management investment companies to file reports with the Commission not later than 10 days after the transmission to stockholders of any report that is required to be transmitted to stockholders under Rule 30e-1 under the Investment Company Act of 1940 (17 CFR 270.30e-1). The Commission may use the information provided on Form N-CSR in its regulatory, disclosure review, inspection, and policymaking roles.
A registrant is required to disclose the information specified by Form N-CSR, and the Commission will make this information public. A registrant is not required to respond to the collection of information contained in Form N-CSR unless the Form displays a currently valid Office of Management and Budget (“OMB”) control number. Please direct comments concerning the accuracy of the information collection burden estimate and any suggestions for reducing the burden to Secretary, Securities and Exchange Commission, 450 Fifth Street, NW, Washington, DC 20549-0609. The OMB has reviewed this collection of information under the clearance requirements of 44 U.S.C. § 3507.
Item 1. Reports to Stockholders.
Semi-Annual Report
APRIL 30, 2011
Global Fund
Overseas Fund
U.S. Value Fund
Gold Fund
Fund of America
ADVISED BY FIRST EAGLE INVESTMENT MANAGEMENT, LLC

Forward-Looking Statement Disclosure
One of our most important responsibilities as mutual fund managers is to communicate with shareholders in an open and direct manner. Some of our comments in our letters to shareholders are based on current management expectations and are considered "forward-looking statements". Actual future results, however, may prove to be different from our expectations. You can identify forward-looking statements by words such as "may", "will", "believe", "attempt", "seem", "think", "ought", "try" and other similar terms. We cannot promise future returns. Our opinions are a reflection of our best judgment at the time this report is compiled, and we disclaim any obligation to update or alter forward-looking statements as a result of new information, future events, or otherwise.
Table of Contents
| Letter from the President | | | 4 | | |
|
| Letter from the Global Value Team Portfolio Managers | | | 6 | | |
|
Management's Discussion of Fund Performance: First Eagle Global,
Overseas, U.S. Value and Gold Funds | | | 12 | | |
|
| Performance Chart | | | 17 | | |
|
| First Eagle Global Fund: | |
|
| Fund Overview | | | 20 | | |
|
| Schedule of Investments | | | 22 | | |
|
| First Eagle Overseas Fund: | |
|
| Fund Overview | | | 44 | | |
|
| Schedule of Investments | | | 46 | | |
|
| First Eagle U.S. Value Fund: | |
|
| Fund Overview | | | 62 | | |
|
| Schedule of Investments | | | 64 | | |
|
| First Eagle Gold Fund: | |
|
| Fund Overview | | | 74 | | |
|
| Consolidated Schedule of Investments | | | 76 | | |
|
| First Eagle Fund of America: | |
|
| Management's Discussion of Fund Performance | | | 81 | | |
|
| Fund Overview | | | 84 | | |
|
| Schedule of Investments | | | 86 | | |
|
| Statements of Assets and Liabilities | | | 94 | | |
|
| Statements of Operations | | | 98 | | |
|
| Statements of Changes in Net Assets | | | 100 | | |
|
| Financial Highlights | | | 104 | | |
|
| Notes to Financial Statements | | | 114 | | |
|
| Fund Expenses | | | 142 | | |
|
| General Information | | | 146 | | |
|
| Consideration of Investment Advisory Agreements | | | 147 | | |
|
Letter from the President

John P. Arnhold
Dear Fellow Shareholders,
Since I last wrote to you in December, financial markets around the world have continued their upward trajectory. Both the S&P 500 Index and the MSCI World Index are up over 9% year to date through April 30th despite an abundance of geopolitical turmoil. Whether it is recent catastrophic natural disasters, widespread political upheaval in the Middle East or European sovereign debt issues, world markets have faced several disturbances with uncertain outcomes.
At First Eagle, we accept that there will always be uncertainty in the market and that we are unable to predict the future with any accuracy. That is why our primary focus — identifying quality businesses trading at a discount to what we believe are their intrinsic values — remains unchanged in all market environments. We keep an eye toward the macro landscape, but we do not let it distract us from our global search for quality companies to purchase at prices which we believe afford us a margin of safety. Investing in sound business models with a margin of safety makes it easier to weather unexpected market fluctuations.
Following the March 11th earthquake in Fukushima, Japan we promptly updated you on our exposures. We concluded that we felt any losses to our holdings would likely be limited and temporary in nature. The resulting volatility in the Japanese markets following the earthquake provided us with an opportunity to add to our existing holdings. At First Eagle, we have often said that volatility is our friend, offering greater opportunity to effectively deploy capital.
Despite the market's positive momentum, we continue to find investment opportunities that provide us with our required margin of safety. Our cash position has grown slightly since my last letter as valuations have increased across the board, and we continue to hold gold as a potential hedge against unforeseen events.
Our Global Value Team is hard at work, with the solid leadership of Matt McLennan alongside Portfolio Managers Abhay Deshpande,
FIRST EAGLE FUNDS | SEMI-ANNUAL REPORT | APRIL 30, 2011
4
Letter from the President (continued)
Kimball Brooker, Rachel Benepe and Matt Lamphier. The Portfolio Managers and analyst team continue to demonstrate their unwavering commitment to striving to protect shareholders' capital and building wealth over the long term.
First Eagle Fund of America maintains an impressive 24-year track record with managers Harold Levy and David Cohen of Iridian Asset Management. The Fund of America provides a strong complement to the First Eagle Fund family with its unique event-driven approach and commitment to seek downside protection.
Please be assured that your investments in our Funds will continue to be managed in the same prudent manner as they have been for over 30 years. Our portfolio managers and other senior executives have substantial investments alongside of yours and we are grateful for your continued confidence.
Sincerely,

John P. Arnhold
President
June 2011
Past performance is no guarantee of future results. The portfolios are actively managed. The portfolio and opinions expressed herein are subject to change. Current and future portfolio holdings are subject to risk.
FIRST EAGLE FUNDS | SEMI-ANNUAL REPORT | APRIL 30, 2011
5
Letter from the Global Value Team Portfolio Managers
The tragic events in Japan serve as a reminder of the need to accept that as a society we operate on fault lines that can behave in complex, unpredictable and potentially disruptive ways. In the case of Japan, the fault line was geophysical. But as a metaphor for the broader global system, fault lines extend beyond the geophysical to the less tangible realms of the geopolitical and the underlying financial architecture of our global economy.
Just as no forecaster predicted the specific timing and devastating magnitude of the Japanese earthquake, nor the Egyptian riots and surprise leadership transition, it is extremely challenging to know what financial fissure could surface next. Global financial stability is influenced by a number of factors, including exchange rates, capital flows and reserve currencies. Our recent period of global financial crisis has demonstrated the inherent vulnerability of the long-term, large-scale monetary and fiscal imbalances that exist in our current system.
Our global financial architecture faces challenges. At the heart of the challenge is the notion of the United States Dollar reserve and the complications it creates. As the export driven economies (who are also the structural United States Dollar reserve accumulators) have grown in economic scale relative to earlier generations, the past decade's current account deficit in the United States has averaged between 4% and 5% of GDP compared to closer to 1% for the prior three decades. The structural foreign demand for dollar assets, which facilitates these substantial current account deficits, first manifested itself in equity and real estate bubbles which in turn fueled savings deficits and leverage growth in the private sector. More recently, with a more prudent private sector in saving surplus alongside less extreme asset values, the foreign demand for dollar assets shows up in the government running structural deficits well above 5% of GDP. Either asset bubbles with a leveraging private sector or a more normal private sector with structurally high fiscal deficits both represent breaks from the post-World War II financial order and are not the recipe for a sustainable AAA sovereign credit. Thus, we face the paradox of the world's reserve currency foundation being a questionable one as long as too many countries want to accumulate it as a reserve! We hope that a recovery in private sector confidence, solid productivity trends and perhaps a moderation of the global reserve accumulation pace could lead to a better outcome, but we must recognize there is a potentially complex and uncertain path that the global capital markets could fall prey to if recent trends do not abate. As with any fault line, a
FIRST EAGLE FUNDS | SEMI-ANNUAL REPORT | APRIL 30, 2011
6

From left to right: Matthew McLennan, Abhay Deshpande, Kimball Brooker, Jr., Rachel Benepe and Matt Lamphier
cumulative vulnerability to crisis builds yet the precise form and timing of such crisis is unpredictable. Against such a back drop, we feel that a portfolio primarily invested in enterprise with some cash and gold as deferred purchasing power enables investors to participate in the progress of the global economy in order to preserve purchasing power, but also remain resilient in the face of distress and capitalize on the opportunities provided by such distress.
Over the past half year, most risk assets performed strongly given the easy monetary policy stance pursued by the Federal Reserve along with recovering confidence and earnings power. Not only did equities fare well, but, in parallel with issues of global financial stability, gold has also continued to perform well as a universal currency outside of the current architecture. In fact, after what was a window of private sector purchases of gold for the past few years, central banks have now commenced restocking gold for the first time in a generation which is starting to bring gold back into the financial foundation. We have kept our gold exposure in terms of both bullion and equities to around 10% of the portfolios rather than let it grow unbounded. We own gold as a potential hedge, not as a directional view, so we are mindful of not letting the exposure become outsized as prices have moved higher. While we recognize that gold is clearing at higher real prices than we have seen for some time, it is hard not to observe that the quality of the fiat money alternative is hardly alluring. Gold remains a potential source of ballast for us if the G20 wanders further down the path of fiscal unsustainability. Other than gold, the portfolio also benefitted from strong price performance of certain equities representing ownership interest in scarce real assets from silver to timberlands and energy to cement.
But the news was not all good. We had some declines in the portfolio, most notably our holding in Cisco which has a dominant market position in routers and switches, the basic nuts, bolts and software that make the internet tick. In recent months, the market has fretted about cutbacks in government spending budgets (perhaps a sneak preview of things to come more broadly), product cycle issues in their switching business and fears of competitors encroaching on their territory. Our team feels that Cisco is deeply embedded in its customers' technology
FIRST EAGLE FUNDS | SEMI-ANNUAL REPORT | APRIL 30, 2011
7
Letter from the Global Value Team Portfolio Managers (continued)
platforms and serves as part of an entrenched, interlinked mesh of hardware and software. Cisco also stands to benefit from the growth in video-based traffic over the internet. While we wait for better times ahead, Cisco is exceptionally well capitalized with net cash and has returned substantial capital to shareholders through repurchases and a recently initiated dividend. As such, we have committed some incremental capital to this investment as the valuation margin of safety expanded. In our top ten list, you'll also see the emergence of Sysco, not a router company but rather a route company which distributes food to the away-from-home eating market — restaurants, hotels, hospitals, schools and the like. They are the largest player in this market across the United States, and this is a business where route density helps provide a structural cost advantage and therefore serves as a competitive advantage. They are also investing in widening the gap through specialized systems. We believe this is a company with a degree of pricing power over time, yet it offers a dividend yield above the yield of a 10 year treasury investment. Ironically, what gave us the opportunity to purchase Sysco at what we believe is a reasonable price were shorter term investor fears over their ability to pass through food price inflation. We are likely to own this stock for the long term assuming the valuation remains attractive.
Over the past half year we were also hurt by some of our partial hedges on the Euro. We have maintained a conservative stance in our approach to hedging currencies and our philosophy is simple: we do not want to lose what we make on a cheap stock to an expensive currency. The basket of currencies which comprise the Euro have historically traded at closer to €1.20 than the recent levels in the mid €1.40 range. The Euro had strengthened on the basis of the ECB being more hawkish than the Fed, having raised rates while the Fed embarked on QE2, and on positive sentiment regarding the resolution of fiscal crisis (with the banks having performed well early in the calendar year). It is not, however, clear to us that we are out of the woods on the fiscal adjustment in Europe so we maintain a partial hedge against the Euro and we're not owners of the big European banks. Our concern is straightforward — the peripheral countries are running large current account and fiscal deficits. In a floating currency regime, they would likely devalue to address this competitive challenge and to stimulate growth thus cushioning the path of fiscal adjustment. Under the aegis of the Euro, they are subject to the discipline of having to undertake fiscal austerity measures which are deflationary in nature and run counter to engrained historical policy responses from these countries. The political will for deflation is limited. Meanwhile, Germany is running large current account
FIRST EAGLE FUNDS | SEMI-ANNUAL REPORT | APRIL 30, 2011
8
Letter from the Global Value Team Portfolio Managers (continued)
surpluses and has a very modest fiscal deficit by comparison. The Deutschmark is arguably undervalued within the Euro wrapper. This could lead to a build in inflationary pressures in Germany, which also runs counter to the political grain of that country. So the Euro requires its people to do what does not come naturally in order to work towards a more harmonized balance of fundamentals. The markets are skeptical and thus facilities have had to be extended to provide liquidity to the peripherals but this is just adding more debt to an already unsustainable dynamic. Meanwhile, if the talk of a "voluntary restructuring" of some of the peripheral debt comes to fruition, what does it mean for the value of banking sector equity if sovereign debt is devalued and equity to asset ratios are less than 10%? Creative proposals are starting to surface on how to cross this river of trouble but the fact remains that the architecture was not in place to deal with this challenge up front and there will be a degree of improvisation required, with the potential for unpredictable consequences.
In emerging markets, much of our exposure is indirect through the ownership of globally strong businesses listed in developed markets that have meaningful presence in those markets such as Nestle in consumer products or Heidelberg Cement in aggregates and cement. Our direct emerging market investments span a range of intriguing businesses from dominant franchises in spirits, tobacco, and gaming, to holding companies owning unique underlying consumer businesses to owners of scarce real assets, but we remain conspicuously absent from direct equity holdings in China. China has become the marginal bid for base metals and may well be a key driver of the global price of risk going forward. China is so big that it is shifting the global equilibrium for everything from iron ore to French wines so why should the global price of risk be any less impacted? The monetary authorities have been tightening the reins in China to try and keep a lid on inflation through a series of interest rate hikes and raised bank reserve requirements. Beyond that, China must transition from a capital expenditure and low cost labor export story to one driven more by services, domestic demand and factory automation. The combination of tighter financial conditions and a phase transition in economic structure may move China to a structurally lower but more sustainable growth rate, but the path from here to there is very uncertain. We are open-minded about investing in China and are deeply impressed by the commerciality of the Chinese diaspora throughout
FIRST EAGLE FUNDS | SEMI-ANNUAL REPORT | APRIL 30, 2011
9
Letter from the Global Value Team Portfolio Managers (continued)
South East Asia, but await the right businesses at the right prices rather than betting on a theme. If inflation pressures ebb and the market rallies, we may well have missed an opportunity, but we remain focused on investing with a margin of safety.
Over the past six months our cash levels have built from the low double digit level to the mid to high teens as a percent of the portfolio. This is not a reflection of lack of hard work; in fact our analyst and trading team have been as diligent and dedicated as ever to uncovering opportunities. It is rather a reflection of our patience — we are still finding opportunities but, in a market that has rallied strongly, the margin of safety we seek is a bit harder to come by. Valuation multiples are not exorbitant relative to the low real rates on offer in the fixed income markets but there is an air of complacency in markets today with low levels of implied volatility, above-average business expectations and all this against a backdrop of unusually high corporate profit margins despite close to double digit unemployment. Were it not for the demand support of near double digit fiscal deficits, where would earnings be for the corporate sector? Record levels of stimulus have supported earnings power and put in place the seed for future capital expenditures and hiring growth but the poor state of public finance means that the stimulus may need to be withdrawn ahead of the recovery in private sector confidence so the future path of earnings power is less certain than with a traditional cyclical recovery. Our hats go off to the hard work of the analyst team as they toggle between globe-trotting company visits and burying their heads in annual reports — we are told that their lifestyle is fine "on average" but we know that a great deal of gumption is required beyond the patient temperament. Likewise, our trading team worked with fiduciary zeal in the past half year, with unrelenting, around-the-clock commitment during the crisis in Japan.
On a final note, we would like to express our gratitude to our investors — most of whom share our long term perspective. If you are new to the fund and you do not share our three to five year horizon, you should consider closely the appropriateness of this investment as we will not attempt to mirror shorter term market movements. Whilst we remain philosophically focused on seeking to avoid a permanent impairment of capital in each of our investments, we are primarily invested in enterprise and thus will not be immune to any adverse changes in sentiment over the short term. We are investing for the long haul, not the next quarter, so we ask that you think carefully about your time horizon. When we look to the horizon, our goal is to extend our legacy track record but
FIRST EAGLE FUNDS | SEMI-ANNUAL REPORT | APRIL 30, 2011
10
Letter from the Global Value Team Portfolio Managers (continued)
we want you to be realistic — high real returns are hard to come by in a world of negative real yields in fixed income, an equity market that has doubled off the bottom and even our potential hedge, gold, hitting record prices. The Federal Reserve has ironically succeeded in reducing the margin of safety available while risks abound.

Matthew McLennan
Head of the Global Value Team
Portfolio Manager

Abhay Deshpande
Portfolio Manager
June 2011
FIRST EAGLE FUNDS | SEMI-ANNUAL REPORT | APRIL 30, 2011
11
Management's Discussion of Fund Performance
Despite one of the worst natural disasters in Japan's history, turbulence in the Middle East and the ongoing sovereign debt crisis in Europe, markets around the world rose during the six months ended April 30, 2011. The MSCI World Index increased 14.8%. In Europe, the German DAX Index rose 13.8% while the French CAC 40 Index rose 7.1%. In Japan, the Nikkei 225 Index rose 7.0% and in the U.S., the S&P 500 Index rose 16.4%. Crude oil rose 40.0% to a record high of $114 a barrel — the result of the civil unrest in oil-producing nations and global concerns about supply — and gold rose 15.0% to $1,564 an ounce. The U.S. dollar rose a modest 1.0% against the yen and it fell 5.8% against the Euro as the Euro strengthened on hopes that the European Central Bank would raise interest rates.
First Eagle Global Fund
The net asset value ("NAV") of the Fund's Class A shares increased 13.4% for the six month period while the MSCI World Index rose 14.8%. The Fund's position in cash and cash equivalents increased from 11.4% at the end of October to 15.8% on April 30, 2011.
The five largest contributors to the performance of First Eagle Global Fund over the period were Gold bullion (gold, U.S.), Weyerhaeuser Company (forest products, U.S.), Heidelberg Cement AG (building products, Germany), ConocoPhillips (energy, U.S.) and Industrias Penoles S.A.B. de C.V. (mining, Mexico) collectively accounting for 2.6% of this period's performance.
The five largest detractors were Cisco Systems, Inc. (networking, U.S.), Carrefour SA (supermarkets, France), Alliant Techsystems, Inc. (defense systems, U.S.), NKSJ Holdings, Inc. (insurance, Japan) and Newmont Mining Corporation (gold mining, U.S.). Their combined negative performance over the six month period subtracted 0.39% from the Fund's performance.
In most instances, prices declined in the absence of changes in our estimates of business value. In some cases, the Fund seized the opportunity to add to the positions at prices we deemed attractive.
As of April 30, 2011, the Fund was approximately 35% hedged versus the Japanese yen and 45% hedged versus the Euro.
FIRST EAGLE FUNDS | SEMI-ANNUAL REPORT | APRIL 30, 2011
12
First Eagle Global, Overseas, U.S. Value and Gold Funds
First Eagle Overseas Fund
The NAV of the Fund's Class A shares rose 12.4% for the six month period while the MSCI EAFE Index increased 12.7%. The Fund's position in cash and cash equivalents was unchanged at 15.8% from the end of October through April 30, 2011.
The five largest contributors to the performance of First Eagle Overseas Fund over the period were Gold bullion (gold, U.S.), Heidelberg Cement AG (building products, Germany), Pargesa Holding SA (holding company, Switzerland), SMC Corporation (electrical machinery, Japan) and Wendel (holding company, France) collectively accounting for 3.1% of this period's performance.
The five largest detractors were Newmont Mining Corporation (gold mining, U.S.), Carrefour SA (supermarkets, France), NKSJ Holdings, Inc. (insurance, Japan), Gaumont SA (film distributor, France) and Singapore Airport Terminal Services Limited (airline catering services, Singapore). Their combined negative performance over the six month period subtracted 0.17% from the Fund's performance.
In most instances, prices declined in the absence of changes in our estimates of business value. In some cases, the Fund seized the opportunity to add to the positions at prices we deemed attractive.
As of April 30, 2011, the Fund was approximately 35% hedged versus the Japanese yen and 45% hedged versus the Euro.
First Eagle U.S. Value Fund
The NAV of the Fund's Class A shares increased 12.9% for the six month period while the S&P 500 Index rose 16.4%. The Fund's position in cash and cash equivalents rose from 17.3% at the beginning of the period to 24.2% on April 30, 2011.
The five largest contributors to the performance of First Eagle U.S. Value Fund over the period were Weyerhaeuser Company (forest products), Conoco Phillips (energy), Gold bullion (gold), Helmerich & Payne, Inc. (oil & gas drilling) and Comcast Corporation (cable company) collectively accounting for 3.6% of this period's performance.
The five largest detractors were Cisco Systems, Inc. (networking), Alliant Techsystems, Inc. (defense systems), Amdocs Limited (IT services), Mercury General Corporation (insurance) and Microsoft Corporation (software). Their combined negative performance over the six month period subtracted 0.41% from the Fund's performance.
FIRST EAGLE FUNDS | SEMI-ANNUAL REPORT | APRIL 30, 2011
13
Management's Discussion of Fund Performance (continued)
First Eagle Gold Fund
The NAV of the Fund's Class A shares rose 13.6% for the six month period while the FT Gold Mines Index increased 6.4%. The Fund's position in cash and cash equivalents decreased from 4.1% in October to 2.4% on April 30, 2011.
The five largest contributors to the performance of First Eagle Gold Fund over the period were Gold bullion (U.S.), Goldcorp, Inc. (Canada), New Gold, Inc. (Canada), Harmony Gold Mining Company (South Africa) and Fresnillo PLC (U.K.) collectively accounting for 6.7% of this period's performance.
The five largest detractors were Kinross Gold Corporation (Canada), Rangold Resources Limited (U.K.), Agnico-Eagle Mines Limited (Canada), Centamin Egypt (U.K.) and Kingsgate Consolidated (Australia). Their combined negative performance over the six month period subtracted 1.44% from the Fund's performance.
We view gold as a hedge against "extreme outcomes," which might include such things as inflation, deflation or outright currency debasement. While we may view any of these outcomes as low probability, we believe gold can at least partially protect a portfolio against the potential negative developments that these events could cause. Currently, we see the fiat currency system facing a number of challenges. The status of the U.S. dollar as the world's reserve currency is suspect, the EU is facing major issues and the Euro is facing its most critical challenge in its 10 year history and the yen also lacks appeal. Gold is currently playing the role of a substitute currency.
Investment in gold and gold related investments present certain risks. Gold related investments as a group have not performed as well as the stock market in general during periods when the U.S. dollar is strong, inflation is low and general economic conditions are stable. In addition, returns on gold related investments have traditionally been more volatile than investments in broader equity or debt markets. Investment in gold and gold related investments may be speculative and may be subject to greater price volatility than investments in other assets and types of companies.
FIRST EAGLE FUNDS | SEMI-ANNUAL REPORT | APRIL 30, 2011
14
First Eagle Global, Overseas, U.S. Value and Gold Funds
As always, we appreciate your confidence and thank you for your support.
 | |  | |
|
| Matthew McLennan | | Abhay Deshpande | |
|
Head of the Global Value Team
Portfolio Manager
Global, Overseas
and U.S. Value Funds | | Portfolio Manager
Global, Overseas,
U.S. Value and Gold Funds
| |
|
 | |  | |
|
| Kimball Brooker, Jr. | | Rachel Benepe | |
|
Portfolio Manager
Overseas and U.S. Value Funds
Associate Portfolio Manager
Global Fund | | Portfolio Manager
Gold Fund
| |
|

Matt Lamphier
Associate Portfolio Manager
U.S. Value Fund
June 2011
FIRST EAGLE FUNDS | SEMI-ANNUAL REPORT | APRIL 30, 2011
15
Management's Discussion of Fund Performance (continued)
Past performance is no guarantee of future results. The portfolios are actively managed. Current and future portfolio holdings are subject to risk.
There are risks associated with investing in funds that invest in securities of foreign countries, such as erratic market conditions, economic and political instability and fluctuations in currency exchange rates. Funds whose investments are concentrated in a specific industry or sector may be subject to a higher degree of risk than funds whose investments are diversified and may not be suitable for all investors. Hedging can reduce exposure to currency exchange movements, but cannot eliminate that exposure. It is possible to lose money under a hedge. Results from hedging transactions, which for the Funds are primarily currency forward contracts, are further described in the financial statements that follow this commentary.
The commentary represents the opinion of the Global Value Team Portfolio Managers as of June 2011 and is subject to change based on market and other conditions. These materials are provided for informational purposes only. These opinions are not intended to be a forecast of future events, a guarantee of future results, or investment advice. The views expressed herein may change at any time subsequent of the date of issue hereof. The information provided is not to be construed as a recommendation or an offer to buy or sell or the solicitation of an offer to buy or sell any fund or security.
Investment in gold and gold related investments present certain risks, including political and economic risks affecting the price of gold and other precious metals like changes in U.S. or foreign tax, currency or mining laws, increased environmental costs, international monetary and political policies, economic conditions within an individual country, trade imbalances, and trade or currency restrictions between countries. The price of gold, in turn, is likely to affect the market prices of securities of companies mining or processing gold, and accordingly, the value of investments in such securities may also be affected. Gold related investments as a group have not performed as well as the stock market in general during periods when the U.S. dollar is strong, inflation is low and general economic conditions are stable. In addition, returns on gold related investments have traditionally been more volatile than investments in broader equity or debt markets.
FIRST EAGLE FUNDS | SEMI-ANNUAL REPORT | APRIL 30, 2011
16
Performance Chart1 (unaudited)
| | | ONE-YEAR | | THREE-YEARS | | FIVE-YEARS | | TEN-YEARS | | SINCE
INCEPTION | | INCEPTION
DATE | |
| First Eagle Global Fund | |
| Class A (SGENX) | |
| without sales charge | | | 18.20 | % | | | 6.39 | % | | | 7.77 | % | | | 13.17 | % | | | 14.67 | % | | 01/01/792 | |
| with sales charge | | | 12.29 | | | | 4.58 | | | | 6.67 | | | | 12.59 | | | | 14.53 | | | 01/01/792 | |
| Class C (FESGX) | | | 16.32 | | | | 5.59 | | | | 6.96 | | | | 12.33 | | | | 12.70 | | | 06/05/00 | |
| Class I (SGIIX) | | | 18.51 | | | | 6.65 | | | | 8.04 | | | | 13.45 | | | | 13.02 | | | 07/31/98 | |
| MSCI World Index3 | | | 18.25 | | | | -0.57 | | | | 2.32 | | | | 3.90 | | | | 10.00 | | | 01/01/79 | |
| First Eagle Overseas Fund | |
| Class A (SGOVX) | |
| without sales charge | | | 19.07 | % | | | 5.94 | % | | | 6.90 | % | | | 13.69 | % | | | 12.91 | % | | 08/31/93 | |
| with sales charge | | | 13.10 | | | | 4.16 | | | | 5.80 | | | | 13.11 | | | | 12.66 | | | 08/31/93 | |
| Class C (FESOX) | | | 17.18 | | | | 5.13 | | | | 6.09 | | | | 12.86 | | | | 12.78 | | | 06/05/00 | |
| Class I (SGOIX) | | | 19.35 | | | | 6.20 | | | | 7.16 | | | | 13.96 | | | | 13.69 | | | 07/31/98 | |
| MSCI EAFE Index4 | | | 19.18 | | | | -2.85 | | | | 1.54 | | | | 5.29 | | | | 5.51 | | | 08/31/93 | |
| First Eagle U.S. Value Fund | |
| Class A (FEVAX) | |
| without sales charge | | | 13.79 | % | | | 5.25 | % | | | 6.49 | % | | | — | | | | 9.96 | % | | 09/04/01 | |
| with sales charge | | | 8.10 | | | | 3.47 | | | | 5.40 | | | | — | | | | 9.37 | | | 09/04/01 | |
| Class C (FEVCX) | | | 11.87 | | | | 4.47 | | | | 5.68 | | | | — | | | | 9.13 | | | 09/04/01 | |
| Class I (FEVIX) | | | 14.01 | | | | 5.51 | | | | 6.73 | | | | — | | | | 10.21 | | | 09/04/01 | |
Standard & Poor's
500 Index5 | | | 17.22 | | | | 1.73 | | | | 2.95 | | | | — | | | | 3.91 | | | 09/04/01 | |
| First Eagle Gold Fund | |
| Class A (SGGDX) | |
| without sales charge | | | 31.82 | % | | | 19.16 | % | | | 14.73 | % | | | 26.48 | % | | | 11.73 | % | | 08/31/93 | |
| with sales charge | | | 25.23 | | | | 17.14 | | | | 13.56 | | | | 25.83 | | | | 11.49 | | | 08/31/93 | |
| Class C (FEGOX) | | | 29.82 | | | | 18.26 | | | | 13.87 | | | | — | | | | 19.60 | | | 05/15/03 | |
| Class I (FEGIX) | | | 32.11 | | | | 19.45 | | | | 15.02 | | | | — | | | | 20.79 | | | 05/15/03 | |
| FTSE Gold Mines Index6 | | | 19.97 | | | | 13.27 | | | | 8.58 | | | | 18.19 | | | | 4.36 | | | 08/31/93 | |
| MSCI World Index3 | | | 18.25 | | | | -0.57 | | | | 2.32 | | | | 3.90 | | | | 6.57 | | | 08/31/93 | |
Please see the following pages for important notes to this table.
FIRST EAGLE FUNDS | SEMI-ANNUAL REPORT | APRIL 30, 2011
17
Performance Chart (unaudited) (continued)
| | | ONE-YEAR | | THREE-YEARS | | FIVE-YEARS | | TEN-YEARS | | SINCE
INCEPTION | | INCEPTION
DATE | |
| First Eagle Fund of America | |
| Class A (FEFAX) | |
| without sales charge | | | 25.37 | % | | | 4.68 | % | | | 7.51 | % | | | 8.24 | % | | | 8.35 | % | | 11/20/98 | |
| with sales charge | | | 19.10 | | | | 2.91 | | | | 6.41 | | | | 7.69 | | | | 7.90 | | | 11/20/98 | |
| Class C (FEAMX) | | | 23.45 | | | | 3.90 | | | | 6.69 | | | | 7.48 | | | | 7.57 | | | 03/02/98 | |
| Class Y (FEAFX)7 | | | 25.44 | | | | 4.68 | | | | 7.50 | | | | 8.29 | | | | 12.30 | | | 04/10/87 | |
Standard & Poor's
500 Index5 | | | 17.22 | | | | 1.73 | | | | 2.95 | | | | 2.82 | | | | 9.07 | | | 04/10/87 | |
1 The performance data quoted herein represents past performance and does not guarantee future results. Market volatility can dramatically impact the funds' short term performance. Current performance may be lower or higher than figures shown. The investment return and principal value will fluctuate so that an investor's shares, when redeemed, may be worth more or less than their original cost. Past performance data through the most recent month end is available at www.firsteaglefunds.com or by calling 800.334.2143. The average annual returns shown on the prior page are historical and reflect changes in share price, reinvested dividends and are net of expenses. The average annual returns for Class A Shares "with sales charge" of First Eagle Global Fund, First Eagle Overseas Fund, First Eagle Gold Fund, First Eagle U.S. Value Fund, and First Eagle Fund of America give effect to the deduction of the maximum sales charge of 5.00%.
The average annual returns for Class C Shares reflect the CDSC (Contingent Deferred Sales Charge) of 1.00% which pertains to the first year or less of investment only.
Class I Shares of First Eagle Global Fund, First Eagle Overseas Fund, First Eagle U.S. Value Fund, and First Eagle Gold Fund require $1mm minimum investment and are offered without sales charge.
Class Y Shares of First Eagle Fund of America are offered without sales charge.
2 Commencement of management by Jean-Marie Eveillard. Mr. Eveillard transitioned to senior adviser on March 26, 2009, a position he also held from January 2005 to March 2007, and continues to be a member of First Eagle Fund's Board of Trustees and a Senior Vice President of First Eagle Investment Management, LLC. The Fund commenced operation April 28, 1970.
3 The MSCI World Index is a widely followed, unmanaged group of stocks from 23 international markets and is not available for purchase. The index provides total returns in U.S. dollars with net dividends reinvested.
4 The MSCI EAFE Index is a total return index, reported in U.S. dollars, based on share prices and reinvested net dividends of approximately 1,100 companies from 21 countries and is not available for purchase.
Please see the following page for important notes to this table.
FIRST EAGLE FUNDS | SEMI-ANNUAL REPORT | APRIL 30, 2011
18
Average Annual Returns as of April 30, 2011 (unaudited)
5 The Standard & Poor's 500 Index is a widely recognized unmanaged index including a representative sample of 500 leading companies in leading sectors of the U.S. economy and is not available for purchase. Although the Standard & Poor's 500 Index focuses on the large-cap segment of the market, with approximately 75% coverage of U.S. equities, it is also considered a proxy for the total market. The Standard & Poor's 500 Index includes dividends reinvested.
6 The FTSE Gold Mines Index is an unmanaged index composed of approximately 19 mining companies and is only available without dividends reinvested and is not available for purchase.
7 As of September 1, 2005 First Eagle Fund of America Class Y is closed to new accounts.
Expense Ratios As Stated In The Most Recent Prospectus
Total Annual Gross Operating Expense Ratios
| | | CLASS A | | CLASS C | | CLASS I | | CLASS Y | |
| First Eagle Global Fund | | | 1.16 | % | | | 1.91 | % | | | 0.91 | % | | | — | | |
| First Eagle Overseas Fund | | | 1.17 | | | | 1.92 | | | | 0.92 | | | | — | | |
| First Eagle U.S. Value Fund | | | 1.24 | | | | 1.99 | | | | 1.00 | | | | — | | |
| First Eagle Gold Fund | | | 1.22 | | | | 1.97 | | | | 0.97 | | | | — | | |
| First Eagle Fund of America | | | 1.49 | | | | 2.24 | | | | — | | | | 1.49 | % | |
These expense ratios are presented as of October 31, 2010 and may differ from corresponding ratios shown elsewhere in this report because of differing time periods (and/or, if applicable, because these expense ratios do not include expense credits or waivers).
There are risks associated with investing in funds that invest in securities of foreign countries, such as erratic market conditions, economic and political instability and fluctuations in currency exchange rates. Funds whose investments are concentrated in a specific industry or sector may be subject to a higher degree of risk than funds whose investments are diversified and may not be suitable for all investors.
Investment in gold and gold related investments present certain risks, including political and economic risks affecting the price of gold and other precious metals like changes in U.S. or foreign tax, currency or mining laws, increased environmental costs, international monetary and political policies, economic conditions within an individual country, trade imbalances, and trade or currency restrictions between countries. The price of gold, in turn, is likely to affect the market prices of securities of companies mining or processing gold, and accordingly, the value of investments in such securities may also be affected. Gold related investments as a group have not performed as well as the stock market in general during periods when the U.S. dollar is strong, inflation is low and general economic conditions are stable. In addition, returns on gold related investments have traditionally been more volatile than investments in broader equity or debt markets.
The event-driven investment style used by First Eagle Fund of America carries the additional risk that the event anticipated occurs later than expected, does not occur at all or does not have the desired effect on the market price of the securities.
FIRST EAGLE FUNDS | SEMI-ANNUAL REPORT | APRIL 30, 2011
19

Fund Overview | Data as of April 30, 2011 (unaudited)
INVESTMENT OBJECTIVE
The First Eagle Global Fund seeks long-term growth of capital by investing in a range of asset classes from markets in the United States and around the world. This truly global fund is managed with a highly disciplined, bottom-up, value oriented style that may help to minimize risk.
| Average Annual Returns | |
| | | ONE-YEAR | | FIVE-YEARS | | TEN-YEARS | |
First Eagle Global
Fund (A Shares) | |
| without sales charge | | | 18.20 | % | | | 7.77 | % | | | 13.17 | % | |
| with sales charge | | | 12.29 | | | | 6.67 | | | | 12.59 | | |
| MSCI World Index | | | 18.25 | | | | 2.32 | | | | 3.90 | | |
| Consumer Price Index | | | 3.16 | | | | 2.22 | | | | 2.43 | | |
Asset Allocation
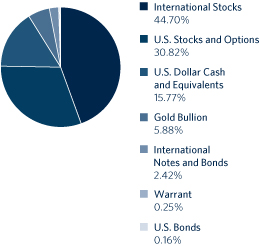
Asset Allocation and Countries percentages are based on total investments in the portfolio. The Fund's portfolio composition is subject to change at any time.
| Countries | |
| United States | | | 37.12 | % | |
| Japan | | | 17.90 | | |
| France | | | 6.59 | | |
| Germany | | | 3.18 | | |
| Switzerland | | | 3.05 | | |
| Mexico | | | 2.65 | | |
| United Kingdom | | | 1.98 | | |
| South Korea | | | 1.84 | | |
| South Africa | | | 1.62 | | |
| Hong Kong | | | 1.25 | | |
| Singapore | | | 0.96 | | |
| Italy | | | 0.88 | | |
| Canada | | | 0.87 | | |
| Belgium | | | 0.73 | | |
| Australia | | | 0.72 | | |
| Thailand | | | 0.59 | | |
| Malaysia | | | 0.57 | | |
| Spain | | | 0.45 | | |
| Taiwan | | | 0.42 | | |
| Brazil | | | 0.39 | | |
| Austria | | | 0.24 | | |
| Sweden | | | 0.10 | | |
| Netherlands | | | 0.08 | | |
| Norway | | | 0.05 | | |
FIRST EAGLE FUNDS | SEMI-ANNUAL REPORT | APRIL 30, 2011
20
Global Fund
Growth of a $10,000 Initial Investment
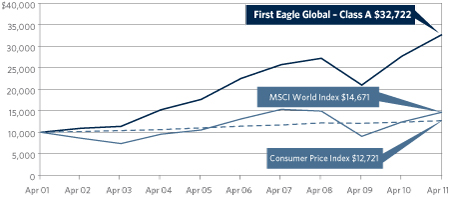
Performance data quoted herein represents past performance and should not be considered indicative of future results. Performance data quoted herein does not reflect the deduction of taxes that a shareholder would pay on Fund distributions or the sale of Fund shares. The average annual returns shown above are historical and reflect changes in share price, reinvested dividends and are net of expenses.
The average annual returns for Class A Shares give effect to the deduction of the maximum sales charge of 5.00%.
The MSCI World Index is a widely followed, unmanaged group of stocks from 23 international markets and is not available for purchase. The index provides total returns in U.S. dollars with net dividends reinvested. The Consumer Price Index (CPI) represents the change in price of all goods and services purchased for consumption by urban households.
| Top 10 Holdings* | |
| Gold Bullion (precious metal) | | | 5.88 | % | |
| Secom Company, Limited (Japanese security services provider) | | | 1.87 | | |
| Fanuc Limited (Japanese industrial manufacturing company) | | | 1.73 | | |
| SMC Corporation (Japanese automated control devices manufacturer) | | | 1.58 | | |
| Keyence Corporation (Japanese sensors manufacturer) | | | 1.33 | | |
| Cintas Corporation (U.S. uniform designer and manufacturer) | | | 1.32 | | |
| Shimano, Inc. (Japanese bicycle parts manufacturer) | | | 1.29 | | |
| Comcast Corporation, Class 'A' (U.S. cable/satellite television company) | | | 1.28 | | |
| Pargesa Holding SA (Swiss diversified financials company) | | | 1.27 | | |
| Microsoft Corporation (U.S. software developer) | | | 1.26 | | |
| Total | | | 18.81 | % | |
* Excludes cash, commercial paper and money market funds.
FIRST EAGLE FUNDS | SEMI-ANNUAL REPORT | APRIL 30, 2011
21
First Eagle Global Fund
| NUMBER OF SHARES | | DESCRIPTION | | COST (NOTE 1) | | VALUE (NOTE 1) | |
| Common Stocks — 74.24% | | | |
| U.S. Common Stocks — 30.77% | | | |
| Consumer Discretionary 5.03% | | | |
| | 13,051,511 | | | Cintas Corporation (a) | | $ | 438,387,413 | | | $ | 405,249,416 | | |
| | 16,016,312 | | | Comcast Corporation, Class 'A' | | | 266,139,825 | | | | 393,200,460 | | |
| | 5,571,290 | | | Omnicom Group, Inc. | | | 162,938,225 | | | | 274,051,755 | | |
| | 5,300,650 | | | Home Depot, Inc. | | | 131,119,191 | | | | 196,866,141 | | |
| | 2,051,045 | | | Wal-Mart Stores, Inc. | | | 101,774,692 | | | | 112,766,454 | | |
| | 1,075,480 | | | Costco Wholesale Corporation | | | 33,417,180 | | | | 87,027,842 | | |
| | 1,381,358 | | | Unifirst Corporation | | | 30,865,195 | | | | 71,499,090 | | |
| | 2,485 | | | JG Boswell Company (b) | | | 573,840 | | | | 1,963,150 | | |
| | 184,753 | | | St. John Knits
International, Inc. (b)(c) | | | 3,174,837 | | | | 1,110,366 | | |
| | | | | | | | 1,168,390,398 | | | | 1,543,734,674 | | |
| Consumer Staples 2.46% | | | |
| | 13,171,404 | | | Sysco Corporation | | | 374,099,914 | | | | 380,785,290 | | |
| | 1,837,950 | | | Lorillard, Inc. | | | 135,716,878 | | | | 195,741,675 | | |
| | 2,132,090 | | | Colgate-Palmolive Company | | | 164,260,763 | | | | 179,841,791 | | |
| | | | | | | | 674,077,555 | | | | 756,368,756 | | |
| Energy 2.34% | | | |
| | 4,700,563 | | | ConocoPhillips | | | 230,084,270 | | | | 371,015,438 | | |
| | 1,442,501 | | | Apache Corporation | | | 90,693,919 | | | | 192,386,358 | | |
| | 3,975,644 | | | San Juan Basin Royalty Trust (a) | | | 141,567,357 | | | | 99,232,074 | | |
| | 851,950 | | | Helmerich & Payne, Inc. | | | 18,084,022 | | | | 56,518,363 | | |
| | | | | | | | 480,429,568 | | | | 719,152,233 | | |
| Financials 5.75% | | | |
| | 7,551,993 | | | American Express Company | | | 318,860,508 | | | | 370,651,817 | | |
| | 2,624 | | | Berkshire Hathaway, Inc., Class 'A' (c) | | | 209,446,032 | | | | 327,344,000 | | |
| | 8,975,246 | | | Cincinnati Financial Corporation (a) | | | 229,993,905 | | | | 284,335,793 | | |
| | 8,500,496 | | | Bank of New York Mellon Corporation | | | 220,277,942 | | | | 246,174,364 | | |
| | 567,206 | | | Mastercard, Inc., Class 'A' | | | 115,777,628 | | | | 156,486,463 | | |
| | 5,728,995 | | | BB&T Corporation | | | 154,967,404 | | | | 154,224,545 | | |
| | 4,386,051 | | | WR Berkley Corporation | | | 117,583,057 | | | | 143,029,123 | | |
| | 1,033,330 | | | Visa, Inc., Class 'A' | | | 74,587,533 | | | | 80,723,740 | | |
| | 34,924 | | | Mills Music Trust (a)(b) | | | 1,055,337 | | | | 1,344,574 | | |
| | | | | | | | 1,442,549,346 | | | | 1,764,314,419 | | |
| Health Care 0.88% | | | |
| | 2,594,970 | | | WellPoint, Inc. | | | 122,915,513 | | | | 199,267,746 | | |
See Notes to Financial Statements.
FIRST EAGLE FUNDS | SEMI-ANNUAL REPORT | APRIL 30, 2011
22
Schedule of Investments | Six-Month Period Ended April 30, 2011 (unaudited)
| NUMBER OF SHARES | | DESCRIPTION | | COST (NOTE 1) | | VALUE (NOTE 1) | |
| U.S. Common Stocks — 30.77% — (continued) | | | |
| Health Care 0.88% — (continued) | | | |
| | 1,059,980 | | | Johnson & Johnson | | $ | 59,610,843 | | | $ | 69,661,886 | | |
| | | | | | | | 182,526,356 | | | | 268,929,632 | | |
| Industrials 3.88% | | | |
| | 3,375,980 | | | 3M Company | | | 263,499,538 | | | | 328,179,016 | | |
| | 3,256,818 | | | Alliant Techsystems, Inc. (a) | | | 294,573,629 | | | | 230,094,191 | | |
| | 2,860,552 | | | Lockheed Martin Corporation | | | 202,039,274 | | | | 226,698,746 | | |
| | 9,049,000 | | | Blount International, Inc. (a)(c) | | | 115,722,600 | | | | 150,213,400 | | |
| | 2,365,411 | | | Automatic Data Processing, Inc. | | | 85,148,200 | | | | 128,560,088 | | |
| | 1,911,836 | | | Northrop Grumman Corporation | | | 117,301,337 | | | | 121,611,888 | | |
| | 149,923 | | | Huntington Ingalls Industries, Inc. (c) | | | 5,649,077 | | | | 5,996,920 | | |
| | | | | | | | 1,083,933,655 | | | | 1,191,354,249 | | |
| Information Technology 3.63% | | | |
| | 14,892,064 | | | Microsoft Corporation | | | 365,199,954 | | | | 387,491,505 | | |
| | 10,697,110 | | | Intel Corporation | | | 174,210,286 | | | | 248,065,981 | | |
| | 5,703,320 | | | Linear Technology Corporation | | | 160,046,637 | | | | 198,475,536 | | |
| | 4,203,010 | | | Texas Instruments, Inc. | | | 102,357,670 | | | | 149,332,945 | | |
| | 3,010,552 | | | KLA-Tencor Corporation (d) | | | 86,433,226 | | | | 132,163,233 | | |
| | | | | | | | 888,247,773 | | | | 1,115,529,200 | | |
| Materials 3.75% | | | |
| | 10,535,770 | | | Weyerhaeuser Company | | | 187,506,558 | | | | 242,428,068 | | |
| | 4,387,079 | | | Vulcan Materials Company | | | 223,679,544 | | | | 198,295,971 | | |
| | 3,987,548 | | | Plum Creek Timber
Company, Inc., REIT | | | 147,118,846 | | | | 171,823,443 | | |
| | 1,709,260 | | | Martin Marietta Materials, Inc. | | | 152,089,232 | | | | 155,867,419 | | |
| | 2,342,121 | | | Rayonier, Inc., REIT | | | 38,588,260 | | | | 155,423,150 | | |
| | 1,780,037 | | | Newmont Mining Corporation | | | 45,037,176 | | | | 104,327,969 | | |
| | 1,258,500 | | | Deltic Timber Corporation (a) | | | 62,903,243 | | | | 85,326,300 | | |
| | 626,842 | | | Ashland, Inc. | | | 32,273,130 | | | | 38,914,351 | | |
| | | | | | | | 889,195,989 | | | | 1,152,406,671 | | |
| Telecommunication Services 1.01% | | | |
| | 17,684,458 | | | Cisco Systems, Inc. | | | 314,957,660 | | | | 310,539,083 | | |
| Utilities 2.04% | | | |
| | 9,003,021 | | | FirstEnergy Corporation | | | 325,646,875 | | | | 359,760,719 | | |
| | 4,117,660 | | | IDACorporation, Inc. (a) | | | 136,695,396 | | | | 161,453,449 | | |
| | 1,513,630 | | | Entergy Corporation | | | 100,134,585 | | | | 105,530,284 | | |
| | | | | | | | 562,476,856 | | | | 626,744,452 | | |
| Total U.S. Common Stocks | | | 7,686,785,156 | | | | 9,449,073,369 | | |
See Notes to Financial Statements.
FIRST EAGLE FUNDS | SEMI-ANNUAL REPORT | APRIL 30, 2011
23
Global Fund
| NUMBER OF SHARES | | DESCRIPTION | | COST (NOTE 1) | | VALUE (NOTE 1) | |
| International Common Stocks — 43.47% | | | |
| Australia 0.72% | | | |
| | 4,843,236 | | | Newcrest Mining Limited | | $ | 163,187,463 | | | $ | 220,004,265 | | |
| Austria 0.24% | | | |
| | 1,626,729 | | | OMV AG | | | 67,045,549 | | | | 74,306,531 | | |
| Belgium 0.73% | | | |
| | 2,271,065 | | | Groupe Bruxelles Lambert SA | | | 189,789,405 | | | | 225,570,465 | | |
| Brazil 0.39% | | | |
| | 3,625,916 | | | Petroleo Brasileiro SA, ADR | | | 68,857,936 | | | | 120,996,817 | | |
| Canada 0.65% | | | |
| | 3,358,189 | | | Cenovus Energy, Inc. | | | 84,672,345 | | | | 128,954,457 | | |
| | 2,773,965 | | | Penn West Petroleum Limited | | | 52,580,541 | | | | 71,041,244 | | |
| | | | | | | | 137,252,886 | | | | 199,995,701 | | |
| France 6.36% | | | |
| | 4,179,227 | | | Sanofi-Aventis SA | | | 323,385,924 | | | | 331,084,848 | | |
| | 4,070,936 | | | Sodexo | | | 110,028,806 | | | | 317,734,713 | | |
| | 2,044,437 | | | Neopost SA (a) | | | 184,799,958 | | | | 195,387,394 | | |
| | 3,733,423 | | | Carrefour SA | | | 230,370,943 | | | | 177,294,377 | | |
| | 2,359,340 | | | Total SA | | | 130,161,165 | | | | 151,278,560 | | |
| | 1,162,042 | | | Wendel | | | 25,161,141 | | | | 145,794,199 | | |
| | 956,044 | | | Guyenne et Gascogne SA (a) | | | 108,257,344 | | | | 138,160,378 | | |
| | 1,400,548 | | | Rémy Cointreau SA | | | 41,298,503 | | | | 115,607,819 | | |
| | 2,078,658 | | | Bouygues SA | | | 100,326,768 | | | | 103,661,680 | | |
| | 806,452 | | | Société BIC SA | | | 38,193,195 | | | | 78,532,457 | | |
| | 63,019 | | | Sucrière de Pithiviers-Le-Vieil (a) | | | 35,947,627 | | | | 78,065,666 | | |
| | 721,719 | | | Cie Generale d'Optique Essilor
International SA | | | 14,254,370 | | | | 60,516,302 | | |
| | 157,260 | | | Robertet SA (a) | | | 20,623,058 | | | | 28,927,241 | | |
| | 42,252 | | | Robertet SA CI (b)(e)(h) | | | 800,508 | | | | 5,829,043 | | |
| | 385,000 | | | Sabeton SA (a) | | | 4,841,233 | | | | 7,653,633 | | |
| | 104,457 | | | Gaumont SA | | | 6,087,824 | | | | 7,213,721 | | |
| | 12,000,000 | | | FINEL (a)(b)(c)(e)(f)(g) | | | — | | | | 6,408,935 | | |
| | 69,500 | | | NSC Groupe (a)(b)(c) | | | 12,298,421 | | | | 4,222,219 | | |
| | | | | | | | 1,386,836,788 | | | | 1,953,373,185 | | |
| Germany 2.74% | | | |
| | 4,485,848 | | | HeidelbergCement AG | | | 242,684,169 | | | | 343,596,528 | | |
| | 2,680,681 | | | Daimler AG | | | 128,871,063 | | | | 207,555,632 | | |
| | 1,193,748 | | | Fraport AG | | | 38,267,364 | | | | 95,686,289 | | |
See Notes to Financial Statements.
FIRST EAGLE FUNDS | SEMI-ANNUAL REPORT | APRIL 30, 2011
24
Schedule of Investments | Six-Month Period Ended April 30, 2011 (unaudited)
| NUMBER OF SHARES | | DESCRIPTION | | COST (NOTE 1) | | VALUE (NOTE 1) | |
| International Common Stocks — 43.47% — (continued) | | | |
| Germany 2.74% — (continued) | | | |
| | 2,464,510 | | | Tognum AG | | $ | 26,236,180 | | | $ | 94,696,175 | | |
| | 517,675 | | | Pfeiffer Vacuum Technology AG (a) | | | 42,989,536 | | | | 71,807,679 | | |
| | 386,842 | | | Hornbach Baumarkt AG | | | 21,504,161 | | | | 28,390,799 | | |
| | | | | | | | 500,552,473 | | | | 841,733,102 | | |
| Hong Kong 0.52% | | | |
| | 12,693,580 | | | Guoco Group Limited | | | 115,086,260 | | | | 157,791,316 | | |
| | 20,738,780 | | | City e-Solutions Limited (a)(b)(c) | | | 936,898 | | | | 2,403,103 | | |
| | | | | | | | 116,023,158 | | | | 160,194,419 | | |
| Italy 0.88% | | | |
| | 18,139,395 | | | Italcementi S.p.A. RSP | | | 249,186,230 | | | | 102,798,848 | | |
| | 4,682,069 | | | Italcementi S.p.A. | | | 86,201,872 | | | | 51,435,736 | | |
| | 1,734,972 | | | Italmobiliare S.p.A. RSP | | | 121,356,934 | | | | 47,617,467 | | |
| | 1,021,137 | | | Italmobiliare S.p.A. | | | 107,360,738 | | | | 44,735,217 | | |
| | 3,208,913 | | | Gewiss S.p.A. | | | 18,972,618 | | | | 24,183,756 | | |
| | | | | | | | 583,078,392 | | | | 270,771,024 | | |
| Japan 17.81% | | | |
| | 11,590,430 | | | Secom Company Limited | | | 528,330,685 | | | | 573,239,424 | | |
| | 3,204,100 | | | Fanuc Limited | | | 270,423,910 | | | | 530,859,140 | | |
| | 2,673,456 | | | SMC Corporation | | | 292,290,699 | | | | 485,753,585 | | |
| | 1,571,990 | | | Keyence Corporation | | | 313,389,646 | | | | 409,747,578 | | |
| | 7,449,590 | | | Shimano, Inc. (a) | | | 181,501,011 | | | | 397,348,173 | | |
| | 8,977,860 | | | Astellas Pharma, Inc. | | | 362,418,345 | | | | 341,729,335 | | |
| | 12,811,860 | | | MISUMI Group, Inc. (a) | | | 221,342,849 | | | | 321,795,794 | | |
| | 12,970,300 | | | MS&AD Insurance Group Holdings | | | 325,978,421 | | | | 301,809,518 | | |
| | 5,211,900 | | | Ono Pharmaceutical Company Limited | | | 237,044,526 | | | | 264,190,299 | | |
| | 38,276,900 | | | NKSJ Holdings, Inc. | | | 284,279,705 | | | | 244,240,382 | | |
| | 4,896,260 | | | Canon, Inc. | | | 232,564,293 | | | | 229,191,771 | | |
| | 1,930,700 | | | Hirose Electric Company Limited | | | 208,019,877 | | | | 199,776,792 | | |
| | 9,672,280 | | | Mitsubishi Estate Company Limited | | | 143,042,330 | | | | 167,757,702 | | |
| | 24,702 | | | KDDI Corporation | | | 153,433,464 | | | | 163,706,282 | | |
| | 21,141 | | | Inpex Corporation | | | 105,392,518 | | | | 160,419,512 | | |
| | 6,166,510 | | | THK Company Limited | | | 107,947,983 | | | | 156,251,676 | | |
| | 71,439 | | | NTT DoCoMo, Inc. | | | 108,868,051 | | | | 131,385,104 | | |
| | 3,383,520 | | | Nissin Foods Holdings
Company Limited | | | 119,507,437 | | | | 119,536,036 | | |
| | 3,501,380 | | | Chofu Seisakusho
Company Limited (a) | | | 63,721,317 | | | | 84,925,071 | | |
See Notes to Financial Statements.
FIRST EAGLE FUNDS | SEMI-ANNUAL REPORT | APRIL 30, 2011
25
Global Fund
| NUMBER OF SHARES | | DESCRIPTION | | COST (NOTE 1) | | VALUE (NOTE 1) | |
| International Common Stocks — 43.47% — (continued) | | | |
| Japan 17.81% — (continued) | | | |
| | 5,147,000 | | | T. Hasegawa Company Limited (a) | | $ | 79,849,658 | | | $ | 78,745,676 | | |
| | 2,719,100 | | | Meitec Corporation (a) | | | 79,203,905 | | | | 52,251,737 | | |
| | 1,725,100 | | | Ariake Japan Company Limited (a) | | | 29,754,119 | | | | 29,027,921 | | |
| | 2,002,100 | | | Seikagaku Corporation | | | 21,143,745 | | | | 23,133,405 | | |
| | 232,910 | | | Unihair Company Limited (c) | | | 5,287,339 | | | | 2,240,733 | | |
| | | | | | | | 4,474,735,833 | | | | 5,469,062,646 | | |
| Malaysia 0.57% | | | |
| | 134,626,930 | | | Genting Malaysia Berhad | | | 116,786,948 | | | | 167,261,007 | | |
| | 1,655,665 | | | Genting Berhad | | | 2,727,877 | | | | 6,484,036 | | |
| | | | | | | | 119,514,825 | | | | 173,745,043 | | |
| Mexico 2.65% | | | |
| | 8,766,773 | | | Industrias Peñoles S.A.B. de C.V. | | | 14,740,763 | | | | 341,307,811 | | |
| | 12,512,115 | | | Grupo Televisa SA, ADR (c) | | | 236,037,035 | | | | 296,787,368 | | |
| | 6,414,687 | | | Fresnillo PLC | | | 43,993,880 | | | | 175,876,691 | | |
| | | | | | | | 294,771,678 | | | | 813,971,870 | | |
| Netherlands 0.08% | | | |
| | 1,042,730 | | | TNT N.V. | | | 24,788,935 | | | | 25,717,906 | | |
| Singapore 0.22% | | | |
| | 10,153,710 | | | Fraser and Neave Limited | | | 8,655,703 | | | | 52,042,640 | | |
| | 13,467,250 | | | ComfortDelgro Corporation Limited | | | 3,279,184 | | | | 16,843,695 | | |
| | | | | | | | 11,934,887 | | | | 68,886,335 | | |
| South Africa 1.62% | | | |
| | 20,830,304 | | | Gold Fields Limited, ADR | | | 231,208,540 | | | | 371,612,623 | | |
| | 8,092,307 | | | Harmony Gold Mining Company
Limited, ADR | | | 69,852,451 | | | | 125,997,220 | | |
| | | | | | | | 301,060,991 | | | | 497,609,843 | | |
| South Korea 1.12% | | | |
| | 3,979,661 | | | KT&G Corporation | | | 216,773,359 | | | | 235,441,149 | | |
| | 51,900 | | | Lotte Confectionery Company Limited | | | 21,157,499 | | | | 76,906,826 | | |
| | 39,989 | | | Namyang Dairy Products
Company Limited (a) | | | 7,325,466 | | | | 30,113,491 | | |
| | | | | | | | 245,256,324 | | | | 342,461,466 | | |
| Spain 0.45% | | | |
| | 2,176,646 | | | Red Electrica Corporation SA | | | 105,631,283 | | | | 139,112,318 | | |
| Sweden 0.10% | | | |
| | 1,215,304 | | | Investor AB, Class 'A' | | | 26,759,103 | | | | 29,405,283 | | |
See Notes to Financial Statements.
FIRST EAGLE FUNDS | SEMI-ANNUAL REPORT | APRIL 30, 2011
26
Schedule of Investments | Six-Month Period Ended April 30, 2011 (unaudited)
| NUMBER OF SHARES | | DESCRIPTION | | COST (NOTE 1) | | VALUE (NOTE 1) | |
| International Common Stocks — 43.47% — (continued) | | | |
| Switzerland 3.05% | | | |
| | 3,783,070 | | | Pargesa Holding SA | | $ | 237,781,696 | | | $ | 388,601,217 | | |
| | 4,643,250 | | | Nestlé SA | | | 118,121,050 | | | | 288,107,372 | | |
| | 39,705 | | | Lindt & Spruengli AG PC (c) | | | 65,203,420 | | | | 131,669,478 | | |
| | 800 | | | Lindt & Spruengli AG (c) | | | 16,046,392 | | | | 29,760,240 | | |
| | 614,726 | | | Kuehne & Nagel International AG | | | 19,542,476 | | | | 98,162,960 | | |
| | | | | | | | 456,695,034 | | | | 936,301,267 | | |
| Thailand 0.59% | | | |
| | 30,251,300 | | | Bangkok Bank PCL NVDR | | | 98,647,613 | | | | 172,285,461 | | |
| | 577,000 | | | OHTL PCL (b) | | | 2,636,472 | | | | 9,085,092 | | |
| | | | | | | | 101,284,085 | | | | 181,370,553 | | |
| United Kingdom 1.98% | | | |
| | 9,342,277 | | | Berkeley Group Holdings PLC (a)(c) | | | 114,104,302 | | | | 165,456,122 | | |
| | 7,387,420 | | | GlaxoSmithKline PLC | | | 140,774,624 | | | | 161,136,491 | | |
| | 2,714,983 | | | Anglo American PLC | | | 62,810,160 | | | | 141,551,845 | | |
| | 3,387,940 | | | Willis Group Holdings PLC | | | 87,537,759 | | | | 139,989,681 | | |
| | | | | | | | 405,226,845 | | | | 608,134,139 | | |
| Total International Common Stocks | | | 9,780,283,873 | | | | 13,352,724,178 | | |
| Total Common Stocks | | | 17,467,069,029 | | | | 22,801,797,547 | | |
| Preferred Stocks — 1.27% | | | |
| U.S. Preferred Stocks — 0.06% | | | |
| Utilities 0.06% | | | |
| | 335,000 | | | Calenergy Capital Trust III
6.50% (b)(i) | | | 14,782,813 | | | | 16,900,750 | | |
| International Preferred Stocks — 1.21% | | | |
| Canada 0.13% | | | |
| | 2,750,391 | | | Postmedia Network (b) | | | 18,719,011 | | | | 39,880,670 | | |
| Germany 0.43% | | | |
| | 877,242 | | | Hornbach Holding AG | | | 63,837,360 | | | | 134,047,503 | | |
| South Korea 0.65% | | | |
| | 338,589 | | | Samsung Electronics
Company Limited | | | 49,993,100 | | | | 199,049,195 | | |
| Total International Preferred Stocks | | | 132,549,471 | | | | 372,977,368 | | |
| Total Preferred Stocks | | | 147,332,284 | | | | 389,878,118 | | |
See Notes to Financial Statements.
FIRST EAGLE FUNDS | SEMI-ANNUAL REPORT | APRIL 30, 2011
27
Global Fund
| NUMBER OF SHARES | | DESCRIPTION | | COST (NOTE 1) | | VALUE (NOTE 1) | |
| Warrant — 0.25% | | | |
| United States — 0.25% | | | |
| | 4,716,220 | | | JPMorgan Chase & Co.
Warrant expire 10/28/18 (c) | | $ | 61,320,499
| | | $ | 78,289,252
| | |
| OUNCES | | | | | | | |
| Commodity — 5.88% | | | |
| | 1,155,839 | | | Gold bullion (c) | | | 648,342,611 | | | | 1,805,594,108 | | |
| PRINCIPAL AMOUNT | | | | | | | |
| Bonds — 2.58% | | | |
| U.S. Bonds — 0.15% | | | |
| Corporate Bonds 0.15% | | | |
| $ | 5,467,000 | | | Bausch & Lomb, Inc.
7.125% due 08/01/28 (b) | | | 4,741,169
| | | | 4,543,022
| | |
| | 5,000,000 | | | Pulte Group, Inc.
5.20% due 02/15/15 | | | 4,453,496
| | | | 5,000,000
| | |
| | 12,554,000 | | | Yankee Acquisition Corporation,
Series 'B' 8.50% due 02/15/15 | | | 12,489,400
| | | | 13,150,315
| | |
| | 22,554,000 | | | Yankee Acquisition Corporation,
Series 'B' 9.75% due 02/15/17 | | | 21,932,851
| | | | 24,189,165
| | |
| Total U.S. Bonds | | | 43,616,916 | | | | 46,882,502 | | |
| International Notes and Bonds — 2.43% | | | |
| International Corporate Notes and Bonds — 0.37% | | | |
| Canada 0.09% | | | |
| 28,460,000
USD | | | Catalyst Paper Corporation
11.00% due 12/15/16 (b)(j) | | | 24,858,141
| | | | 28,709,025
| | |
| France 0.23% | | | |
| 15,000,000
EUR | | | Emin Leydier SA FRN
6.511% due 07/31/16 (b)(e)(f) | | | 21,410,094
| | | | 22,253,245
| | |
| 12,000,000
EUR | | | FINEL
9.50% due 06/30/17 (b)(e)(f) | | | 14,474,400
| | | | 13,351,947
| | |
| 12,050,000
EUR | | | Wendel
4.375% due 08/09/17 | | | 11,178,962
| | | | 15,999,712
| | |
| 3,500,000
EUR | | | Wendel
4.875% due 05/26/16 | | | 2,690,019
| | | | 4,887,369
| | |
| 10,000,000
EUR | | | Wendel
4.875% due 09/21/15 (k) | | | 10,530,962
| | | | 14,464,609
| | |
| | | | | | | | 60,284,437 | | | | 70,956,882 | | |
See Notes to Financial Statements.
FIRST EAGLE FUNDS | SEMI-ANNUAL REPORT | APRIL 30, 2011
28
Schedule of Investments | Six-Month Period Ended April 30, 2011 (unaudited)
| PRINCIPAL AMOUNT | | DESCRIPTION | | COST (NOTE 1) | | VALUE (NOTE 1) | |
| International Corporate Notes and Bonds — 0.37% — (continued) | | | |
| Norway 0.05% | | | |
| 5,500,000
USD | | | Den Norske Bank ASA FRN
0.625% due 08/31/11 (b) | | $ | 3,888,750
| | | $ | 3,451,250
| | |
| 3,170,000
USD | | | Den Norske Creditbank FRN
0.563% due 05/31/11 (b) | | | 2,059,625
| | | | 1,981,250
| | |
| 3,500,000
USD | | | Den Norske Creditbank FRN
0.65% due 08/31/11 (b) | | | 2,610,000
| | | | 2,152,500
| | |
| 10,000,000
USD | | | Nordea Bank Norge ASA FRN
0.625% due 11/21/11 (b) | | | 6,826,750
| | | | 6,300,000
| | |
| | | | | | | | 15,385,125 | | | | 13,885,000 | | |
| Total International Corporate Notes and Bonds | | | 100,527,703 | | | | 113,550,907 | | |
| International Government Bonds — 2.06% | | | |
| Hong Kong 0.73% | | | |
| 371,900,000
HKD | | | Hong Kong Government Bond
0.48% due 09/03/12 | | | 48,030,896
| | | | 47,866,791
| | |
| 732,250,000
HKD | | | Hong Kong Government Bond
2.66% due 12/17/12 | | | 98,101,071
| | | | 97,587,514
| | |
| 586,700,000
HKD | | | Hong Kong Government Bond
4.20% due 09/17/12 | | | 79,766,565
| | | | 79,415,703
| | |
| | | | | | | | 225,898,532 | | | | 224,870,008 | | |
| Japan 0.09% | | | |
| 2,163,399,300
JPY | | | Japanese Government CPI Linked Bond
1.40% due 06/10/18 (l) | | | 19,795,759
| | | | 27,274,235
| | |
| Singapore 0.74% | | | |
| 275,440,000
SGD | | | Singapore Government Bond
3.625% due 07/01/11 | | | 200,224,328
| | | | 226,425,730
| | |
| South Korea 0.08% | | | |
| 24,494,400,000
KRW | | | Inflation Linked Korea Treasury Bond
2.75% due 03/10/17 (l) | | | 23,337,721
| | | | 23,924,125
| | |
| Taiwan 0.42% | | | |
| 1,767,500,000
TWD | | | Taiwan Government Bond
2.00% due 07/20/12 | | | 54,308,701
| | | | 62,740,094
| | |
| 1,826,000,000
TWD | | | Taiwan Government Bond
2.375% due 01/16/13 | | | 59,266,472
| | | | 65,512,711
| | |
| | | | | | | | 113,575,173 | | | | 128,252,805 | | |
| Total International Government Bonds | | | 582,831,513 | | | | 630,746,903 | | |
| Total International Notes and Bonds | | | 683,359,216 | | | | 744,297,810 | | |
| Total Notes and Bonds | | | 726,976,132 | | | | 791,180,312 | | |
See Notes to Financial Statements.
FIRST EAGLE FUNDS | SEMI-ANNUAL REPORT | APRIL 30, 2011
29
Global Fund
| PRINCIPAL AMOUNT | | DESCRIPTION | | COST (NOTE 1) | | VALUE (NOTE 1) | |
| Commercial Paper — 15.76% | | | |
| International Commercial Paper — 8.56% | | | |
| France 2.08% | | | |
| 6,066,000
USD | | | Électricité de France
0.17% due 05/02/11 | | $ | 6,065,971
| | | $ | 6,065,971
| | |
| 50,000,000
USD | | | Électricité de France
0.19% due 06/15/11 | | | 49,988,125
| | | | 49,988,125
| | |
| 46,815,000
USD | | | Électricité de France
0.26% due 06/20/11 | | | 46,798,095
| | | | 46,798,095
| | |
| 58,000,000
USD | | | Électricité de France
0.26% due 06/21/11 | | | 57,978,637
| | | | 57,978,637
| | |
| 100,000,000
USD | | | Électricité de France
0.27% due 05/16/11 | | | 99,988,750
| | | | 99,988,750
| | |
| 25,400,000
USD | | | GDF Suez SA
0.19% due 06/13/11 | | | 25,394,236
| | | | 25,394,236
| | |
| 25,000,000
USD | | | GDF Suez SA
0.26% due 05/27/11 | | | 24,995,306
| | | | 24,995,306
| | |
| 15,560,000
USD | | | GDF Suez SA
0.27% due 06/10/11 | | | 15,555,332
| | | | 15,555,332
| | |
| 51,000,000
USD | | | GDF Suez SA
0.28% due 06/22/11 | | | 50,979,373
| | | | 50,979,373
| | |
| 40,000,000
USD | | | GDF Suez SA
0.34% due 05/02/11 | | | 39,999,622
| | | | 39,999,622
| | |
| 47,500,000
USD | | | GDF Suez SA
0.35% due 05/06/11 | | | 47,497,757
| | | | 47,497,757
| | |
| 25,000,000
USD | | | GDF Suez SA
0.35% due 05/20/11 | | | 24,995,514
| | | | 24,995,514
| | |
| 45,229,000
USD | | | Sanofi-Aventis SA
0.28% due 09/12/11 | | | 45,181,861
| | | | 45,180,985
| | |
| 25,000,000
USD | | | Sanofi-Aventis SA
0.30% due 09/12/11 | | | 24,972,083
| | | | 24,973,460
| | |
| 18,000,000
USD | | | Sanofi-Aventis SA
0.32% due 05/10/11 | | | 17,998,560
| | | | 17,998,560
| | |
| 27,255,000
USD | | | Sanofi-Aventis SA
0.33% due 10/13/11 | | | 27,215,026
| | | | 27,214,161
| | |
| 10,733,000
USD | | | Sanofi-Aventis SA
0.38% due 05/24/11 | | | 10,730,428
| | | | 10,730,428
| | |
| 22,000,000
USD | | | Sanofi-Aventis SA
0.38% due 06/01/11 | | | 21,992,896
| | | | 21,992,896
| | |
| Germany 0.21% | | | |
| 14,855,000
USD | | | BASF AG
0.13% due 06/02/11 | | | 14,853,284
| | | | 14,853,284
| | |
| 50,000,000
USD | | | BASF AG
0.18% due 06/29/11 | | | 49,985,250
| | | | 49,984,415
| | |
See Notes to Financial Statements.
FIRST EAGLE FUNDS | SEMI-ANNUAL REPORT | APRIL 30, 2011
30
Schedule of Investments | Six-Month Period Ended April 30, 2011 (unaudited)
| PRINCIPAL AMOUNT | | DESCRIPTION | | COST (NOTE 1) | | VALUE (NOTE 1) | |
| International Commercial Paper — 8.56% — (continued) | | | |
| Germany 0.21% — (continued) | | | |
| 100,000
USD | | | BMW
0.31% due 05/02/11 | | $ | 99,999
| | | $ | 99,999
| | |
| Italy 0.60% | | | |
| 50,000,000
USD | | | Eni S.p.A.
0.20% due 06/01/11 | | | 49,991,389
| | | | 49,991,389
| | |
| 50,000,000
USD | | | Eni S.p.A.
0.32% due 06/08/11 | | | 49,983,639
| | | | 49,983,639
| | |
| 43,000,000
USD | | | Eni S.p.A.
0.35% due 06/20/11 | | | 42,979,694
| | | | 42,979,694
| | |
| 9,000,000
USD | | | Eni S.p.A.
0.37% due 07/11/11 | | | 8,993,610
| | | | 8,995,566
| | |
| 32,699,000
USD | | | Eni S.p.A.
0.37% due 07/29/11 | | | 32,669,898
| | | | 32,677,428
| | |
| Japan 3.24% | | | |
| 10,000,000
USD | | | Mitsubishi Company
0.25% due 05/20/11 | | | 9,998,681
| | | | 9,998,681
| | |
| 50,000,000
USD | | | Mitsubishi Company
0.25% due 07/13/11 | | | 49,974,653
| | | | 49,974,480
| | |
| 30,000,000
USD | | | Mitsubishi Company
0.25% due 07/26/11 | | | 29,982,083
| | | | 29,981,079
| | |
| 34,000,000
USD | | | Mitsubishi Company
0.26% due 07/06/11 | | | 33,983,793
| | | | 33,984,714
| | |
| 20,000,000
USD | | | Mitsubishi Company
0.26% due 07/29/11 | | | 19,987,144
| | | | 19,986,806
| | |
| 50,000,000
USD | | | Mitsubishi Company
0.27% due 05/17/11 | | | 49,994,000
| | | | 49,994,000
| | |
| 39,893,000
USD | | | Mitsubishi Company
0.27% due 06/13/11 | | | 39,880,135
| | | | 39,880,134
| | |
| 40,391,000
USD | | | Mitsui & Company, Limited
0.23% due 05/10/11 | | | 40,388,678
| | | | 40,388,678
| | |
| 50,000,000
USD | | | Mitsui & Company, Limited
0.23% due 07/05/11 | | | 49,979,236
| | | | 49,977,945
| | |
| 20,000,000
USD | | | Mitsui & Company, Limited
0.23% due 07/26/11 | | | 19,989,011
| | | | 19,987,386
| | |
| 30,000,000
USD | | | Mitsui & Company, Limited
0.24% due 06/24/11 | | | 29,989,200
| | | | 29,989,200
| | |
| 44,000,000
USD | | | Mitsui & Company, Limited
0.27% due 07/18/11 | | | 43,974,260
| | | | 43,975,554
| | |
| 40,000,000
USD | | | Mitsui & Company, Limited
0.30% due 07/22/11 | | | 39,972,667
| | | | 39,976,292
| | |
| 50,000,000
USD | | | Sumitomo Corporation
0.23% due 07/13/11 | | | 49,976,681
| | | | 49,974,480
| | |
See Notes to Financial Statements.
FIRST EAGLE FUNDS | SEMI-ANNUAL REPORT | APRIL 30, 2011
31
Global Fund
| PRINCIPAL AMOUNT | | DESCRIPTION | | COST (NOTE 1) | | VALUE (NOTE 1) | |
| International Commercial Paper — 8.56% — (continued) | | | |
| Japan 3.24% — (continued) | | | |
| 50,000,000
USD | | | Sumitomo Corporation
0.26% due 07/07/11 | | $ | 49,975,806
| | | $ | 49,977,095
| | |
| 38,500,000
USD | | | Sumitomo Corporation
0.27% due 07/28/11 | | | 38,474,590
| | | | 38,474,975
| | |
| 35,000,000
USD | | | Sumitomo Corporation
0.28% due 06/24/11 | | | 34,985,300
| | | | 34,985,300
| | |
| 20,000,000
USD | | | Sumitomo Corporation
0.31% due 07/05/11 | | | 19,989,167
| | | | 19,991,178
| | |
| 25,000,000
USD | | | Sumitomo Corporation
0.32% due 07/25/11 | | | 24,981,701
| | | | 24,984,472
| | |
| 35,000,000
USD | | | Sumitomo Corporation
0.36% due 09/21/11 | | | 34,951,340
| | | | 34,954,465
| | |
| 20,000,000
USD | | | Toyota Motor Corporation
0.20% due 06/23/11 | | | 19,994,111
| | | | 19,994,111
| | |
| 30,000,000
USD | | | Toyota Motor Corporation
0.21% due 06/15/11 | | | 29,992,125
| | | | 29,992,125
| | |
| 25,000,000
USD | | | Toyota Motor Corporation
0.23% due 08/18/11 | | | 24,982,590
| | | | 24,984,275
| | |
| 50,000,000
USD | | | Toyota Motor Corporation
0.24% due 08/01/11 | | | 49,969,333
| | | | 49,974,805
| | |
| 19,000,000
USD | | | Toyota Motor Corporation
0.24% due 07/06/11 | | | 18,991,640
| | | | 18,993,971
| | |
| 25,000,000
USD | | | Toyota Motor Corporation
0.25% due 09/23/11 | | | 24,974,826
| | | | 24,977,645
| | |
| 30,000,000
USD | | | Toyota Motor Corporation
0.27% due 07/01/11 | | | 29,986,275
| | | | 29,991,444
| | |
| 50,000,000
USD | | | Toyota Motor Corporation
0.27% due 08/05/11 | | | 49,964,000
| | | | 49,973,460
| | |
| 35,000,000
USD | | | Toyota Motor Corporation
0.31% due 05/05/11 | | | 34,998,794
| | | | 34,998,794
| | |
| Switzerland 1.88% | | | |
| 17,525,000
USD | | | Nestlé SA
0.19% due 07/12/11 | | | 17,518,341
| | | | 17,519,956
| | |
| 30,000,000
USD | | | Nestlé SA
0.19% due 08/16/11 | | | 29,983,058
| | | | 29,986,737
| | |
| 38,078,000
USD | | | Nestlé SA
0.20% due 09/09/11 | | | 38,050,288
| | | | 38,053,805
| | |
| 48,000,000
USD | | | Nestlé SA
0.20% due 09/16/11 | | | 47,963,200
| | | | 47,965,838
| | |
| 25,361,000
USD | | | Nestlé SA
0.21% due 10/24/11 | | | 25,334,963
| | | | 25,335,921
| | |
| 41,000,000
USD | | | Nestlé SA
0.23% due 06/13/11 | | | 40,988,736
| | | | 40,988,736
| | |
See Notes to Financial Statements.
FIRST EAGLE FUNDS | SEMI-ANNUAL REPORT | APRIL 30, 2011
32
Schedule of Investments | Six-Month Period Ended April 30, 2011 (unaudited)
| PRINCIPAL AMOUNT | | DESCRIPTION | | COST (NOTE 1) | | VALUE (NOTE 1) | |
| International Commercial Paper — 8.56% — (continued) | | | |
| Switzerland 1.88% — (continued) | | | |
| 30,000,000
USD | | | Nestlé SA
0.23% due 06/14/11 | | $ | 29,991,567
| | | $ | 29,991,567
| | |
| 9,755,000
USD | | | Nestlé SA
0.25% due 07/20/11 | | | 9,749,581
| | | | 9,751,889
| | |
| 40,789,000
USD | | | Nestlé SA
0.25% due 07/21/11 | | | 40,766,056
| | | | 40,775,833
| | |
| 18,965,000
USD | | | Novartis International AG
0.21% due 10/11/11 | | | 18,946,967
| | | | 18,937,184
| | |
| 50,000,000
USD | | | Novartis International AG
0.22% due 06/14/11 | | | 49,986,556
| | | | 49,986,556
| | |
| 20,000,000
USD | | | Novartis International AG
0.23% due 06/17/11 | | | 19,993,994
| | | | 19,993,994
| | |
| 25,000,000
USD | | | Novartis International AG
0.23% due 07/14/11 | | | 24,988,181
| | | | 24,988,600
| | |
| 35,000,000
USD | | | Novartis International AG
0.23% due 09/15/11 | | | 34,969,365
| | | | 34,961,486
| | |
| 45,035,000
USD | | | Novartis International AG
0.23% due 10/11/11 | | | 44,988,101
| | | | 44,968,947
| | |
| 40,000,000
USD | | | Novartis International AG
0.24% due 07/19/11 | | | 39,978,933
| | | | 39,980,112
| | |
| 40,000,000
USD | | | Novartis International AG
0.25% due 09/15/11 | | | 39,961,944
| | | | 39,955,984
| | |
| 21,700,000
USD | | | Novartis International AG
0.26% due 08/08/11 | | | 21,684,484
| | | | 21,685,329
| | |
| United Kingdom 0.11% | | | |
| 15,000,000
USD | | | Reckitt Benckiser Group PLC
0.25% due 06/16/11 | | | 14,995,208
| | | | 14,995,208
| | |
| 20,000,000
USD | | | Reckitt Benckiser Group PLC
0.39% due 09/26/11 | | | 19,968,756
| | | | 19,972,500
| | |
| Venezuela 0.44% | | | |
| 58,257,000
USD | | | Corporación Andina de Fomento
0.37% due 08/25/11 | | | 58,189,422
| | | | 58,202,005
| | |
| 77,554,000
USD | | | Corporación Andina de Fomento
0.40% due 07/08/11 | | | 77,496,869
| | | | 77,517,806
| | |
| Total International Commercial Paper | | | 2,629,660,725 | | | | 2,629,726,159 | | |
| U.S. Commercial Paper — 7.20% | | | |
| $ | 23,055,000 | | | Abbott Laboratories
0.16% due 05/31/11 | | | 23,051,926
| | | | 23,051,926
| | |
| | 19,000,000 | | | Abbott Laboratories
0.17% due 06/07/11 | | | 18,996,680
| | | | 18,996,680
| | |
| | 20,000,000 | | | Abbott Laboratories
0.19% due 06/06/11 | | | 19,996,200
| | | | 19,996,200
| | |
See Notes to Financial Statements.
FIRST EAGLE FUNDS | SEMI-ANNUAL REPORT | APRIL 30, 2011
33
Global Fund
| PRINCIPAL AMOUNT | | DESCRIPTION | | COST (NOTE 1) | | VALUE (NOTE 1) | |
| U.S. Commercial Paper — 7.20% — (continued) | | | |
| $ | 25,000,000 | | | Archer Daniels Midland Company
0.30% due 05/04/11 | | $ | 24,999,375
| | | $ | 24,999,375
| | |
| | 34,271,000 | | | Bemis Company, Inc.
0.26% due 05/18/11 | | | 34,266,792
| | | | 34,266,792
| | |
| | 45,000,000 | | | Campbell Soup Company
0.23% due 07/27/11 | | | 44,974,988
| | | | 44,981,086
| | |
| | 33,133,000 | | | Campbell Soup Company
0.24% due 08/10/11 | | | 33,110,691
| | | | 33,116,506
| | |
| | 26,555,000 | | | Campbell Soup Company
0.25% due 08/08/11 | | | 26,536,743
| | | | 26,542,036
| | |
| | 29,482,000 | | | Campbell Soup Company
0.26% due 08/08/11 | | | 29,460,920
| | | | 29,467,607
| | |
| | 64,912,000 | | | Cisco Systems, Inc.
0.19% due 05/05/11 | | | 64,910,630
| | | | 64,910,630
| | |
| | 50,000,000 | | | Coca-Cola Company
0.20% due 08/04/11 | | | 49,973,611
| | | | 49,976,830
| | |
| | 50,000,000 | | | Coca-Cola Company
0.22% due 09/02/11 | | | 49,962,111
| | | | 49,966,750
| | |
| | 6,658,000 | | | Coca-Cola Company
0.22% due 09/07/11 | | | 6,652,751
| | | | 6,653,203
| | |
| | 25,000,000 | | | Coca-Cola Company
0.22% due 09/13/11 | | | 24,979,375
| | | | 24,980,210
| | |
| | 12,050,000 | | | Coca-Cola Company
0.25% due 05/31/11 | | | 12,047,490
| | | | 12,047,490
| | |
| | 23,532,000 | | | Coca-Cola Company
0.25% due 06/20/11 | | | 23,523,829
| | | | 23,523,829
| | |
| | 4,539,000 | | | Coca-Cola Company
0.25% due 07/01/11 | | | 4,537,077
| | | | 4,537,650
| | |
| | 25,000,000 | | | Coca-Cola Company
0.25% due 07/18/11 | | | 24,986,458
| | | | 24,990,555
| | |
| | 70,000,000 | | | Coca-Cola Company
0.25% due 07/28/11 | | | 69,957,222
| | | | 69,970,250
| | |
| | 25,000,000 | | | Coca-Cola Company
0.25% due 07/29/11 | | | 24,984,549
| | | | 24,989,257
| | |
| | 49,370,000 | | | ConocoPhillips
0.20% due 07/25/11 | | | 49,346,686
| | | | 49,349,719
| | |
| | 39,000,000 | | | ConocoPhillips
0.22% due 05/09/11 | | | 38,998,093
| | | | 38,998,093
| | |
| | 17,941,000 | | | ConocoPhillips
0.22% due 06/07/11 | | | 17,936,943
| | | | 17,936,943
| | |
| | 11,300,000 | | | ConocoPhillips
0.22% due 06/09/11 | | | 11,297,307
| | | | 11,297,307
| | |
See Notes to Financial Statements.
FIRST EAGLE FUNDS | SEMI-ANNUAL REPORT | APRIL 30, 2011
34
Schedule of Investments | Six-Month Period Ended April 30, 2011 (unaudited)
| PRINCIPAL AMOUNT | | DESCRIPTION | | COST (NOTE 1) | | VALUE (NOTE 1) | |
| U.S. Commercial Paper — 7.20% — (continued) | | | |
| $ | 34,050,000 | | | ConocoPhillips
0.22% due 07/07/11 | | $ | 34,036,058
| | | $ | 34,038,907
| | |
| | 10,100,000 | | | ConocoPhillips
0.22% due 07/11/11 | | | 10,095,618
| | | | 10,096,519
| | |
| | 49,600,000 | | | ConocoPhillips
0.23% due 05/16/11 | | | 49,595,247
| | | | 49,595,247
| | |
| | 34,050,000 | | | ConocoPhillips
0.25% due 07/07/11 | | | 34,034,157
| | | | 34,038,907
| | |
| | 7,615,000 | | | Dover Corporation
0.07% due 05/02/11 | | | 7,614,985
| | | | 7,614,985
| | |
| | 25,000,000 | | | DuPont
0.29% due 06/16/11 | | | 24,990,736
| | | | 24,990,736
| | |
| | 45,000,000 | | | DuPont
0.31% due 06/30/11 | | | 44,976,750
| | | | 44,982,018
| | |
| | 44,220,000 | | | H.J. Heinz Company Limited
0.25% due 05/26/11 | | | 44,212,323
| | | | 44,212,323
| | |
| | 38,000,000 | | | Honeywell International, Inc.
0.22% due 06/27/11 | | | 37,986,763
| | | | 37,986,763
| | |
| | 60,651,000 | | | ITT Corporation
0.34% due 05/13/11 | | | 60,644,328
| | | | 60,644,328
| | |
| | 15,338,000 | | | Johnson & Johnson
0.16% due 07/25/11 | | | 15,332,206
| | | | 15,332,811
| | |
| | 19,695,000 | | | Johnson & Johnson
0.18% due 07/25/11 | | | 19,686,630
| | | | 19,688,337
| | |
| | 27,000,000 | | | Johnson & Johnson
0.20% due 05/13/11 | | | 26,998,200
| | | | 26,998,200
| | |
| | 18,995,000 | | | Johnson & Johnson
0.20% due 09/06/11 | | | 18,981,492
| | | | 18,983,544
| | |
| | 31,589,000 | | | Johnson & Johnson
0.21% due 09/06/11 | | | 31,565,414
| | | | 31,569,949
| | |
| | 42,000,000 | | | Johnson & Johnson
0.21% due 09/14/11 | | | 41,966,680
| | | | 41,971,020
| | |
| | 10,000,000 | | | Kraft Foods, Inc.
0.15% due 05/02/11 | | | 9,999,958
| | | | 9,999,958
| | |
| | 1,125,000 | | | Kraft Foods, Inc.
0.36% due 05/12/11 | | | 1,124,876
| | | | 1,124,876
| | |
| | 34,546,000 | | | Kraft Foods, Inc.
0.37% due 05/24/11 | | | 34,538,054
| | | | 34,538,054
| | |
| | 2,063,000 | | | Kraft Foods, Inc.
0.38% due 05/27/11 | | | 2,062,449
| | | | 2,062,449
| | |
| | 14,732,000 | | | Kraft Foods, Inc.
0.43% due 07/07/11 | | | 14,720,485
| | | | 14,722,429
| | |
See Notes to Financial Statements.
FIRST EAGLE FUNDS | SEMI-ANNUAL REPORT | APRIL 30, 2011
35
Global Fund
| PRINCIPAL AMOUNT | | DESCRIPTION | | COST (NOTE 1) | | VALUE (NOTE 1) | |
| U.S. Commercial Paper — 7.20% — (continued) | | | |
| $ | 12,034,000 | | | Kraft Foods, Inc.
0.45% due 06/22/11 | | $ | 12,026,352
| | | $ | 12,026,352
| | |
| | 12,059,000 | | | Kraft Foods, Inc.
0.45% due 06/27/11 | | | 12,050,599
| | | | 12,050,599
| | |
| | 85,000,000 | | | Medtronic, Inc.
0.17% due 07/25/11 | | | 84,965,882
| | | | 84,953,369
| | |
| | 34,495,000 | | | Medtronic, Inc.
0.19% due 09/13/11 | | | 34,470,422
| | | | 34,457,849
| | |
| | 50,000,000 | | | Medtronic, Inc.
0.20% due 06/13/11 | | | 49,988,056
| | | | 49,988,056
| | |
| | 43,000,000 | | | Medtronic, Inc.
0.21% due 10/19/11 | | | 42,957,108
| | | | 42,931,604
| | |
| | 5,000,000 | | | PepsiCo, Inc.
0.17% due 06/06/11 | | | 4,999,150
| | | | 4,999,150
| | |
| | 15,000,000 | | | PepsiCo, Inc.
0.17% due 06/10/11 | | | 14,997,167
| | | | 14,997,167
| | |
| | 40,000,000 | | | PepsiCo, Inc.
0.18% due 05/31/11 | | | 39,994,000
| | | | 39,994,000
| | |
| | 21,640,000 | | | Philip Morris International, Inc.
0.13% due 05/25/11 | | | 21,638,125
| | | | 21,638,125
| | |
| | 25,000,000 | | | Proctor & Gamble Company
0.12% due 06/23/11 | | | 24,995,583
| | | | 24,995,583
| | |
| | 12,500,000 | | | Proctor & Gamble Company
0.13% due 06/30/11 | | | 12,497,292
| | | | 12,496,986
| | |
| | 25,000,000 | | | Proctor & Gamble Company
0.18% due 05/31/11 | | | 24,996,250
| | | | 24,996,250
| | |
| | 30,000,000 | | | Proctor & Gamble Company
0.18% due 06/09/11 | | | 29,994,150
| | | | 29,994,150
| | |
| | 25,500,000 | | | Proctor & Gamble Company
0.19% due 05/18/11 | | | 25,497,712
| | | | 25,497,712
| | |
| | 32,500,000 | | | Proctor & Gamble Company
0.19% due 05/23/11 | | | 32,496,226
| | | | 32,496,226
| | |
| | 32,564,000 | | | Proctor & Gamble Company
0.19% due 05/24/11 | | | 32,560,047
| | | | 32,560,047
| | |
| | 20,000,000 | | | Sherwin-Williams Company
0.26% due 06/08/11 | | | 19,994,511
| | | | 19,994,511
| | |
| | 25,000,000 | | | Sherwin-Williams Company
0.26% due 06/14/11 | | | 24,992,056
| | | | 24,992,056
| | |
| | 19,000,000 | | | Sherwin-Williams Company
0.26% due 06/28/11 | | | 18,992,041
| | | | 18,992,041
| | |
| | 50,000,000 | | | Verizon Communications, Inc.
0.37% due 05/03/11 | | | 49,998,972
| | | | 49,998,972
| | |
See Notes to Financial Statements.
FIRST EAGLE FUNDS | SEMI-ANNUAL REPORT | APRIL 30, 2011
36
Schedule of Investments | Six-Month Period Ended April 30, 2011 (unaudited)
| PRINCIPAL AMOUNT | | DESCRIPTION | | COST (NOTE 1) | | VALUE (NOTE 1) | |
| U.S. Commercial Paper — 7.20% — (continued) | | | |
| $ | 25,000,000 | | | Verizon Communications, Inc.
0.39% due 05/20/11 | | $ | 24,994,986
| | | $ | 24,994,986
| | |
| | 30,199,000 | | | Verizon Communications, Inc.
0.41% due 05/25/11 | | | 30,190,947
| | | | 30,190,947
| | |
| | 25,000,000 | | | Verizon Communications, Inc.
0.46% due 07/11/11 | | | 24,977,813
| | | | 24,982,613
| | |
| | 13,749,000 | | | Verizon Communications, Inc.
0.47% due 06/29/11 | | | 13,738,409
| | | | 13,740,902
| | |
| | 42,000,000 | | | Verizon Communications, Inc.
0.49% due 07/15/11 | | | 41,957,125
| | | | 41,968,828
| | |
| | 50,000,000 | | | Verizon Communications, Inc.
0.55% due 08/11/11 | | | 49,923,500
| | | | 49,945,980
| | |
| | 45,000,000 | | | Walt Disney Company
0.15% due 07/14/11 | | | 44,986,125
| | | | 44,981,950
| | |
| | 4,420,000 | | | WellPoint, Inc.
0.36% due 06/08/11 | | | 4,418,367
| | | | 4,418,367
| | |
| | 8,920,000 | | | WellPoint, Inc.
0.36% due 07/11/11 | | | 8,913,843
| | | | 8,914,754
| | |
| | 20,000,000 | | | WellPoint, Inc.
0.37% due 07/20/11 | | | 19,983,556
| | | | 19,986,788
| | |
| | 17,300,000 | | | WellPoint, Inc.
0.38% due 06/23/11 | | | 17,290,576
| | | | 17,290,576
| | |
| | 20,000,000 | | | WellPoint, Inc.
0.38% due 06/28/11 | | | 19,988,078
| | | | 19,988,078
| | |
| Total U.S. Commercial Paper | | | 2,211,116,882 | | | | 2,211,194,858 | | |
| Total Commercial Paper | | | 4,840,777,607 | | | | 4,840,921,017 | | |
Total Investment Portfolio
Excluding Options Written — 99.98% | | $ | 23,891,818,162 | | | $ | 30,707,660,354 | | |
| CONTRACTS | | | | STRIKE PRICE | | EXPIRATION DATE | | VALUE (NOTE 1) | |
| Covered Call Options Written — (0.01)% | | | |
| | 2,500 | | | KLA-Tencor Corporation | | $ | 46.00 | | | June 2011 | | $ | (337,500 | ) | |
| | 2,500 | | | KLA-Tencor Corporation | | | 46.00 | | | September 2011 | | | (587,500 | ) | |
| | 2,500 | | | KLA-Tencor Corporation | | | 47.00 | | | September 2011 | | | (537,500 | ) | |
| | Total Covered Call Options Written (Premiums Received: $2,664,915) | | | | | | | | | | | | | | | | (1,462,500 | ) | |
| | Total Investments — 99.97% (Cost $23,889,153,247) | | | | | | | | | | | | | | | | 30,706,197,854 | | |
| | Other Assets in Excess of Liabilities — 0.03% | | | | | | | | | | | | | | | | 8,410,475 | | |
| | Net Assets — 100.00% | | | | | | | | | | | | | | | $ | 30,714,608,329 | | |
See Notes to Financial Statements.
FIRST EAGLE FUNDS | SEMI-ANNUAL REPORT | APRIL 30, 2011
37
Global Fund
(a) An affiliate of the Fund as defined by the Investment Company Act of 1940. An affiliate is defined as a company in which the Fund directly or indirectly owns, controls, or holds power to vote 5% or more of the outstanding voting securities.
(b) Security is deemed illiquid. At April 30, 2011, the value of these securities amounted to $171,890,141 or 0.56% of net assets.
(c) Non-income producing security/commodity.
(d) At April 30, 2011, all or a portion of this security was segregated to cover collateral requirement for options.
(e) Securities valued in accordance with fair value procedures under the supervision of the Board of Trustees, representing $47,843,170 or 0.16% of net assets.
(f) Represents interest in a restricted security which has not been registered with the Securities and Exchange Commission under the Securities Act of 1933. At April 30, 2011, the value of these securities amounted to $42,014,127 or 0.14% of net assets.
(g) Held through Financiere Rouge, LLC, wholly owned subsidiary and disregarded entity for U.S. tax purposes.
(h) Represents non-voting class of shares.
(i) This security is convertible until September 1, 2027 and is subject to a call feature and may be called in full or partially on or anytime after May 20, 2011.
(j) All or a portion of the security is exempt from registration under the Securities Act of 1933. Rule 144A securities may only be sold to qualified institutional buyers, pursuant to Rule 144A under the Securities Act of 1933.
(k) Represents a security registered under Regulation S. Bonds sold under Regulation S may not be offered, sold or delivered within the U.S., or for the account or benefit of, U.S. persons, except pursuant to an exemption from, or in a transaction not subject to, the registration requirements of the Securities Act of 1933.
(l) Inflation protected security.
At April 30, 2011, cost is substantially identical for both book and federal income tax purposes. Net unrealized appreciation consisted of:
| Gross unrealized appreciation | | $ | 7,500,576,181 | | |
| Gross unrealized depreciation | | | (683,531,574 | ) | |
| Net unrealized appreciation | | $ | 6,817,044,607 | | |
Abbreviations used in this schedule include:
ADR — American Depository Receipt
CPI — Consumer Price Index
FRN — Floating Rate Note
NVDR — Non-Voting Depository Receipt
PC — Participation Certificate
PCL — Public Company Limited
PLC — Public Limited Company
REIT — Real Estate Investment Trust
RSP — Represents Non-Voting Shares
Currencies
EUR — Euro
HKD — Hong Kong Dollar
JPY — Japanese Yen
KRW — South Korean Won
SGD — Singapore Dollar
TWD — Taiwan Dollar
USD — United States Dollar
See Notes to Financial Statements.
FIRST EAGLE FUNDS | SEMI-ANNUAL REPORT | APRIL 30, 2011
38
Schedule of Investments | Six-Month Period Ended April 30, 2011 (unaudited)
| RESTRICTED SECURITIES | | ACQUISITION
DATE | | COST | | CARRYING VALUE PER
SHARE/PRINCIPAL | |
| Emin Leydier SA 6.51% due 7/31/16 | | 07/30/09 | | $ | 21,410,094 | | | $ | 1.48 | | |
| FINEL 9.50% due 6/30/17 | | 06/22/05 | | | 14,474,400 | | | | 1.11 | | |
| FINEL | | 07/30/09 | | | — | | | | 0.53 | | |
Foreign Currency Exchange Contracts — Sales
SETTLEMENT
DATES
THROUGH | | FOREIGN CURRENCY
TO BE DELIVERED | | U.S. $
TO BE
RECEIVED | | U.S. $ VALUE
AT APRIL 30,
2011 | | UNREALIZED
APPRECIATION
AT APRIL 30,
2011 | | UNREALIZED
DEPRECIATION
AT APRIL 30,
2011 | |
| 08/17/11 | | | 356,421,000 | | | Euro | | $ | 492,006,004 | | | $ | 527,616,474 | | | $ | — | | | $ | (35,610,470 | ) | |
| 06/15/11 | | | 165,092,000 | | | Euro | | | 219,611,982 | | | | 244,637,356 | | | | — | | | | (25,025,374 | ) | |
| 07/20/11 | | | 241,705,000 | | | Euro | | | 327,759,231 | | | | 357,808,257 | | | | — | | | | (30,049,026 | ) | |
| 09/21/11 | | | 328,310,000 | | | Euro | | | 473,987,713 | | | | 484,978,882 | | | | — | | | | (10,991,169 | ) | |
| 08/17/11 | | | 70,301,428,000 | | | Japanese Yen | | | 846,432,640 | | | | 866,369,663 | | | | — | | | | (19,937,023 | ) | |
| 06/15/11 | | | 22,444,444,000 | | | Japanese Yen | | | 271,576,560 | | | | 276,526,898 | | | | — | | | | (4,950,338 | ) | |
| 07/20/11 | | | 30,763,925,000 | | | Japanese Yen | | | 369,727,607 | | | | 379,104,094 | | | | — | | | | (9,376,487 | ) | |
| 09/21/11 | | | 27,143,141,000 | | | Japanese Yen | | | 322,978,832 | | | | 334,656,069 | | | | — | | | | (11,677,237 | ) | |
| | | | | | | $ | 3,324,080,569 | | | $ | 3,471,697,693 | | | $ | — | | | $ | (147,617,124 | ) | |
Affiliated Securities
AFFILIATED
SECURITIES | | SHARES
OCTOBER 31,
2010 | | GROSS
ADDITIONS | | GROSS
REDUCTIONS | | SHARES
APRIL 30,
2011 | | MARKET VALUE
APRIL 30,
2011 | | REALIZED
GAIN/(LOSS) | | DIVIDEND
INCOME | |
Alliant
Techsystems,
Inc. | | | 2,864,349 | | | | 392,469 | | | | — | | | | 3,256,818 | | | $ | 230,094,191 | | | $ | — | | | $ | 572,870 | | |
Ariake
Japan
Company
Limited | | | 1,725,100 | | | | — | | | | — | | | | 1,725,100 | | | | 29,027,921 | | | | — | | | | 390,438 | | |
Berkeley
Group
Holdings
PLC | | | 8,354,385 | | | | 987,892 | | | | — | | | | 9,342,277 | | | | 165,456,122 | | | | — | | | | — | | |
Blount
International,
Inc. | | | 9,778,961 | | | | — | | | | 729,961 | | | | 9,049,000 | | | | 150,213,400 | | | | (304,062 | ) | | | — | | |
Chofu
Seisakusho
Company
Limited | | | 3,501,380 | | | | — | | | | — | | | | 3,501,380 | | | | 84,925,071 | | | | — | | | | 593,274 | | |
Cincinnati
Financial
Corporation | | | 8,975,246 | | | | — | | | | — | | | | 8,975,246 | | | | 284,335,793 | | | | — | | | | 7,180,197 | | |
Cintas
Corporation | | | 13,051,511 | | | | — | | | | — | | | | 13,051,511 | | | | 405,249,416 | | | | — | | | | 6,395,240 | | |
City
e-Solutions
Limited | | | 20,738,780 | | | | — | | | | — | | | | 20,738,780 | | | | 2,403,103 | | | | — | | | | — | | |
See Notes to Financial Statements.
FIRST EAGLE FUNDS | SEMI-ANNUAL REPORT | APRIL 30, 2011
39
Global Fund
| (continued) | |
AFFILIATED
SECURITIES | | SHARES
OCTOBER 31,
2010 | | GROSS
ADDITIONS | | GROSS
REDUCTIONS | | SHARES
APRIL 30,
2011 | | MARKET VALUE
APRIL 30,
2011 | | REALIZED
GAIN/(LOSS) | | DIVIDEND
INCOME | |
Deltic
Timber
Corporation | | | 1,258,500 | | | | — | | | | — | | | | 1,258,500 | | | $ | 85,326,300 | | | $ | — | | | $ | 188,775 | | |
| FINEL | | | 12,000,000 | | | | — | | | | — | | | | 12,000,000 | | | | 6,408,935 | | | | — | | | | — | | |
Guyenne et
Gascogne SA | | | 956,044 | | | | — | | | | — | | | | 956,044 | | | | 138,160,378 | | | | — | | | | — | | |
IDA
Corporation,
Inc. | | | 4,117,660 | | | | — | | | | — | | | | 4,117,660 | | | | 161,453,449 | | | | — | | | | 2,470,596 | | |
Meitec
Corporation | | | 2,719,100 | | | | — | | | | — | | | | 2,719,100 | | | | 52,251,737 | | | | — | | | | 736,935 | | |
Mills Music
Trust | | | 34,924 | | | | — | | | | — | | | | 34,924 | | | | 1,344,574 | | | | — | | | | 69,122 | | |
MISUMI
Group, Inc. | | | 13,629,830 | | | | — | | | | 817,970 | | | | 12,811,860 | | | | 321,795,794 | | | | 4,959,635 | | | | 1,348,662 | | |
Namyang
Dairy
Products
Company
Limited | | | 39,989 | | | | — | | | | — | | | | 39,989 | | | | 30,113,491 | | | | — | | | | 29,128 | | |
| Neopost SA | | | 2,306,626 | | | | — | | | | 262,189 | | | | 2,044,437 | | | | 195,387,394 | | | | (3,063,134 | ) | | | 4,277,053 | | |
| NSC Groupe | | | 69,500 | | | | — | | | | — | | | | 69,500 | | | | 4,222,219 | | | | — | | | | — | | |
Pfeiffer
Vacuum
Technology
AG | | | 1,172,304 | | | | — | | | | 654,629 | | | | 517,675 | | | | 71,807,679 | | | | 18,387,503 | | | | — | | |
| Robertet SA | | | 160,048 | | | | — | | | | 2,788 | | | | 157,260 | | | | 28,927,241 | | | | (23,422 | ) | | | — | | |
| Sabeton SA | | | 385,000 | | | | — | | | | — | | | | 385,000 | | | | 7,653,633 | | | | — | | | | — | | |
San Juan
Basin
Royalty
Trust | | | 3,975,644 | | | | — | | | | — | | | | 3,975,644 | | | | 99,232,074 | | | | — | | | | 2,460,383 | | |
Shimano,
Inc. | | | 7,096,370 | | | | 353,220 | | | | — | | | | 7,449,590 | | | | 397,348,173 | | | | — | | | | 2,444,899 | | |
Sucrière de
Pithiviers-
Le-Vieil | | | 63,019 | | | | — | | | | — | | | | 63,019 | | | | 78,065,666 | | | | — | | | | 3,244,742 | | |
T. Hasegawa
Company
Limited | | | 5,147,000 | | | | — | | | | — | | | | 5,147,000 | | | | 78,745,676 | | | | — | | | | 583,067 | | |
| Total | | | | | | | | | | $ | 3,109,949,430 | | | $ | 19,956,520 | | | $ | 32,985,381 | | |
See Notes to Financial Statements.
FIRST EAGLE FUNDS | SEMI-ANNUAL REPORT | APRIL 30, 2011
40
Schedule of Investments | Six-Month Period Ended April 30, 2011 (unaudited)
| INDUSTRY DIVERSIFICATION FOR PORTFOLIO HOLDINGS | | PERCENT OF
NET ASSETS | |
| U.S. Common Stocks | |
| Consumer Discretionary | | | 5.03 | % | |
| Consumer Staples | | | 2.46 | | |
| Energy | | | 2.34 | | |
| Financials | | | 5.75 | | |
| Health Care | | | 0.88 | | |
| Industrials | | | 3.88 | | |
| Information Technology | | | 3.63 | | |
| Materials | | | 3.75 | | |
| Telecommunication Services | | | 1.01 | | |
| Utilities | | | 2.04 | | |
| Total U.S. Common Stocks | | | 30.77 | | |
| International Common Stocks | |
| Consumer Discretionary | | | 5.51 | | |
| Consumer Staples | | | 4.77 | | |
| Energy | | | 2.29 | | |
| Financials | | | 5.96 | | |
| Health Care | | | 3.85 | | |
| Industrials | | | 9.54 | | |
| Information Technology | | | 3.37 | | |
| Materials | | | 6.77 | | |
| Telecommunication Services | | | 0.96 | | |
| Utilities | | | 0.45 | | |
| Total International Common Stocks | | | 43.47 | | |
| U.S. Preferred Stocks | |
| Utilities | | | 0.06 | | |
| Total U.S. Preferred Stocks | | | 0.06 | | |
| International Preferred Stocks | |
| Consumer Discretionary | | | 0.43 | | |
| Energy | | | 0.13 | | |
| Information Technology | | | 0.65 | | |
| Total International Preferred Stocks | | | 1.21 | | |
See Notes to Financial Statements.
FIRST EAGLE FUNDS | SEMI-ANNUAL REPORT | APRIL 30, 2011
41
Global Fund
| INDUSTRY DIVERSIFICATION FOR PORTFOLIO HOLDINGS — (CONTINUED) | | PERCENT OF
NET ASSETS | |
| Warrant | | | 0.25 | % | |
| Commodity | | | 5.88 | | |
| U.S. Bonds | |
| Consumer Discretionary | | | 0.15 | | |
| Total U.S. Bonds | | | 0.15 | | |
| International Notes and Bonds | |
| Financials | | | 0.16 | | |
| Government Issues | | | 2.06 | | |
| Industrials | | | 0.05 | | |
| Materials | | | 0.16 | | |
| Total International Notes and Bonds | | | 2.43 | | |
| Commercial Paper | |
| International Commercial Paper | | | 8.56 | | |
| U.S. Commercial Paper | | | 7.20 | | |
| Total Commercial Paper | | | 15.76 | | |
| Covered Call Options Written | | | (0.01 | ) | |
| Total Investments | | | 99.97 | % | |
See Notes to Financial Statements.
FIRST EAGLE FUNDS | SEMI-ANNUAL REPORT | APRIL 30, 2011
42
This page was intentionally left blank.

Fund Overview | Data as of April 30, 2011 (unaudited)
INVESTMENT OBJECTIVE
The First Eagle Overseas Fund seeks long-term growth of capital by investing primarily in equities issued by non-U.S. corporations. Management's research-driven process seeks to minimize risk by focusing on undervalued securities.
| Average Annual Returns | |
| | | ONE-YEAR | | FIVE-YEARS | | TEN-YEARS | |
First Eagle Overseas
Fund (A Shares) | |
| without sales charge | | | 19.07 | % | | | 6.90 | % | | | 13.69 | % | |
| with sales charge | | | 13.10 | | | | 5.80 | | | | 13.11 | | |
| MSCI EAFE Index | | | 19.18 | | | | 1.54 | | | | 5.29 | | |
| Consumer Price Index | | | 3.16 | | | | 2.22 | | | | 2.43 | | |
Asset Allocation
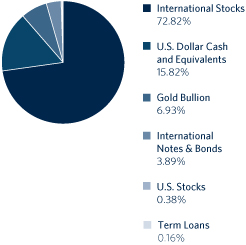
Asset Allocation and Countries percentages are based on total investments in the portfolio. The Fund's portfolio composition is subject to change at any time.
| Countries | |
| Japan | | | 28.31 | % | |
| France | | | 10.07 | | |
| United States | | | 7.31 | | |
| Germany | | | 5.85 | | |
| Switzerland | | | 4.75 | | |
| Singapore | | | 3.67 | | |
| South Korea | | | 3.56 | | |
| Mexico | | | 2.47 | | |
| Hong Kong | | | 2.41 | | |
| South Africa | | | 1.93 | | |
| Thailand | | | 1.87 | | |
| United Kingdom | | | 1.83 | | |
| Canada | | | 1.73 | | |
| Italy | | | 1.18 | | |
| Australia | | | 1.04 | | |
| Netherlands | | | 0.91 | | |
| Malaysia | | | 0.85 | | |
| Taiwan | | | 0.84 | | |
| Brazil | | | 0.83 | | |
| Spain | | | 0.70 | | |
| Austria | | | 0.64 | | |
| Bermuda | | | 0.61 | | |
| Belgium | | | 0.34 | | |
| Greece | | | 0.26 | | |
| Sweden | | | 0.15 | | |
| Turkey | | | 0.07 | | |
FIRST EAGLE FUNDS | SEMI-ANNUAL REPORT | APRIL 30, 2011
44
Overseas Fund
Growth of a $10,000 Initial Investment
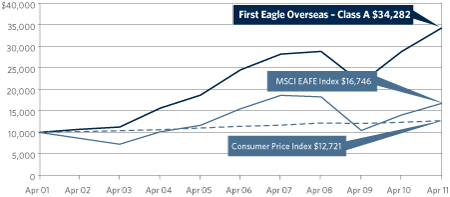
Performance data quoted herein represents past performance and should not be considered indicative of future results. Performance data quoted herein does not reflect the deduction of taxes that a shareholder would pay on Fund distributions or the sale of Fund shares. The average annual returns shown above are historical and reflect changes in share price, reinvested dividends and are net of expenses.
The average annual returns for Class A Shares give effect to the deduction of the maximum sales charge of 5.00%.
The MSCI EAFE Index is a total return index, reported in U.S. Dollars, based on share prices and reinvested net dividends of approximately 1,100 companies from 21 countries and is not available for purchase. The Consumer Price Index (CPI) represents the change in price of all goods and services purchased for consumption by urban households.
| Top 10 Holdings* | |
| Gold Bullion (precious metal) | | | 6.94 | % | |
| Shimano, Inc. (Japanese bicycle parts manufacturer) | | | 2.41 | | |
| Pargesa Holding SA (Swiss diversified financials company) | | | 2.08 | | |
| Fanuc Limited (Japanese automated machine tools manufacturer) | | | 2.08 | | |
| SMC Corporation (Japanese automated control devices manufacturer) | | | 1.99 | | |
| Secom Company, Limited (Japanese security services provider) | | | 1.90 | | |
| HeidelbergCement AG (German building materials manufacturer) | | | 1.72 | | |
| MS&AD Insurance Group Holdings (Japanese insurance company) | | | 1.54 | | |
| Keyence Corporation (Japanese sensors manufacturer) | | | 1.47 | | |
| Gold Fields Limited, ADR (South African gold mining company) | | | 1.43 | | |
| Total | | | 23.56 | % | |
* Excludes cash, commercial paper and money market funds.
FIRST EAGLE FUNDS | SEMI-ANNUAL REPORT | APRIL 30, 2011
45
First Eagle Overseas Fund
| NUMBER OF SHARES | | DESCRIPTION | | COST (NOTE 1) | | VALUE (NOTE 1) | |
| Common Stocks — 71.27% | | | |
| International Common Stocks — 70.89% | | | |
| Australia 1.05% | | | |
| | 1,991,110 | | | Newcrest Mining Limited | | $ | 67,088,242 | | | $ | 90,446,283 | | |
| | 10,636,295 | | | Spotless Group Limited | | | 28,448,633 | | | | 22,846,379 | | |
| | | | | | | | 95,536,875 | | | | 113,292,662 | | |
| Austria 0.64% | | | |
| | 889,525 | | | OMV AG | | | 36,661,516 | | | | 40,632,162 | | |
| | 1,351,248 | | | Wienerberger AG (a) | | | 22,316,084 | | | | 28,937,029 | | |
| | | | | | | | 58,977,600 | | | | 69,569,191 | | |
| Belgium 0.34% | | | |
| | 366,943 | | | Groupe Bruxelles Lambert SA | | | 27,696,696 | | | | 36,446,118 | | |
| Bermuda 0.61% | | | |
| | 1,365,900 | | | Jardine Matheson Holdings Limited | | | 40,577,021 | | | | 65,563,200 | | |
| Brazil 0.83% | | | |
| | 2,707,494 | | | Petroleo Brasileiro SA, ADR | | | 37,277,860 | | | | 90,349,075 | | |
| Canada 1.19% | | | |
| | 1,321,427 | | | Cenovus Energy, Inc. | | | 18,791,533 | | | | 50,742,797 | | |
| | 1,100,050 | | | EnCana Corporation | | | 14,298,776 | | | | 36,873,676 | | |
| | 989,931 | | | Penn West Petroleum Limited | | | 18,763,266 | | | | 25,352,133 | | |
| | 332,036 | | | Cogeco Cable, Inc. | | | 14,536,855 | | | | 15,918,093 | | |
| | | | | | | | 66,390,430 | | | | 128,886,699 | | |
| France 9.60% | | | |
| | 1,748,375 | | | Sodexo | | | 48,634,328 | | | | 136,459,878 | | |
| | 1,660,633 | | | Sanofi-Aventis SA | | | 135,351,026 | | | | 131,557,923 | | |
| | 827,900 | | | Neopost SA | | | 44,073,366 | | | | 79,122,626 | | |
| | 630,208 | | | Wendel | | | 14,922,055 | | | | 79,068,287 | | |
| | 1,608,488 | | | Carrefour SA | | | 69,265,330 | | | | 76,384,561 | | |
| | 563,378 | | | Laurent-Perrier (b) | | | 20,236,693 | | | | 72,045,894 | | |
| | 943,121 | | | Total SA | | | 58,346,454 | | | | 60,471,991 | | |
| | 1,110,655 | | | Bouygues SA | | | 53,605,943 | | | | 55,387,834 | | |
| | 348,206 | | | Guyenne et Gascogne SA | | | 40,270,290 | | | | 50,320,145 | | |
| | 39,143 | | | Sucrière de Pithiviers-Le-Vieil (b) | | | 15,598,306 | | | | 48,488,938 | | |
| | 235,837 | | | Robertet SA (b) | | | 20,591,064 | | | | 43,381,113 | | |
| | 513,850 | | | Rémy Cointreau SA | | | 13,882,400 | | | | 42,415,596 | | |
| | 442,830 | | | Société Foncière Financière et
de Participations | | | 29,139,582 | | | | 36,770,068 | | |
| | 895,904 | | | Fregate (a)(b)(c)(d)(e) | | | 23,101,992 | | | | 34,729,855 | | |
See Notes to Financial Statements.
FIRST EAGLE FUNDS | SEMI-ANNUAL REPORT | APRIL 30, 2011
46
Schedule of Investments | Six-Month Period Ended April 30, 2011 (unaudited)
| NUMBER OF SHARES | | DESCRIPTION | | COST (NOTE 1) | | VALUE (NOTE 1) | |
| International Common Stocks — 70.89% — (continued) | | | |
| France 9.60% — (continued) | | | |
| | 297,268 | | | Société BIC SA | | $ | 11,253,819 | | | $ | 28,948,017 | | |
| | 364,373 | | | Gaumont SA | | | 21,698,753 | | | | 25,163,321 | | |
| | 258,984 | | | Cie Generale d'Optique Essilor
International SA | | | 4,968,106 | | | | 21,715,867 | | |
| | 51,500 | | | Robertet SA CI (d)(e)(f) | | | 2,151,628 | | | | 7,104,888 | | |
| | 11,593,581 | | | FINEL (a)(b)(c)(d)(e)(g) | | | 9,152,131 | | | | 6,191,875 | | |
| | 1,000 | | | Société Vermandoise de Sucreries | | | 854,846 | | | | 2,498,298 | | |
| | 100,000 | | | Sabeton SA | | | 1,463,142 | | | | 1,987,956 | | |
| | | | | | | | 638,561,254 | | | | 1,040,214,931 | | |
| Germany 4.88% | | | |
| | 2,433,048 | | | HeidelbergCement AG | | | 130,732,832 | | | | 186,360,939 | | |
| | 1,314,843 | | | Daimler AG | | | 64,046,716 | | | | 101,803,635 | | |
| | 6,418,531 | | | Deutsche Wohnen AG (a)(b) | | | 67,969,040 | | | | 101,268,698 | | |
| | 1,392,952 | | | Tognum AG | | | 21,316,812 | | | | 53,522,699 | | |
| | 510,427 | | | Fraport AG | | | 16,339,785 | | | | 40,913,882 | | |
| | 186,209 | | | Pfeiffer Vacuum Technology AG | | | 5,412,516 | | | | 25,829,403 | | |
| | 381,004 | | | Hamburger Hafen und Logistik AG | | | 12,551,847 | | | | 18,511,556 | | |
| | | | | | | | 318,369,548 | | | | 528,210,812 | | |
| Greece 0.26% | | | |
| | 3,488,350 | | | Jumbo SA | | | 22,414,086 | | | | 28,204,515 | | |
| Hong Kong 1.11% | | | |
| | 7,806,340 | | | Guoco Group Limited | | | 57,283,838 | | | | 97,039,028 | | |
| | 7,069,700 | | | Hopewell Holdings Limited | | | 7,819,937 | | | | 21,344,723 | | |
| | 10,851,720 | | | City e-Solutions Limited (a)(e) | | | 323,358 | | | | 1,257,441 | | |
| | | | | | | | 65,427,133 | | | | 119,641,192 | | |
| Italy 1.18% | | | |
| | 6,116,020 | | | Gewiss S.p.A. (b) | | | 23,508,434 | | | | 46,092,971 | | |
| | 7,315,306 | | | Italcementi S.p.A. RSP | | | 87,341,485 | | | | 41,457,007 | | |
| | 1,197,736 | | | Italmobiliare S.p.A. RSP | | | 50,324,929 | | | | 32,872,665 | | |
| | 168,142 | | | Italmobiliare S.p.A. | | | 19,250,153 | | | | 7,366,170 | | |
| | | | | | | | 180,425,001 | | | | 127,788,813 | | |
| Japan 28.34% | | | |
| | 4,886,870 | | | Shimano, Inc. (b) | | | 81,201,320 | | | | 260,657,146 | | |
| | 1,361,840 | | | Fanuc Limited | | | 121,493,378 | | | | 225,631,288 | | |
| | 1,187,390 | | | SMC Corporation | | | 152,820,186 | | | | 215,742,825 | | |
| | 4,170,700 | | | Secom Company Limited | | | 178,984,614 | | | | 206,274,458 | | |
See Notes to Financial Statements.
FIRST EAGLE FUNDS | SEMI-ANNUAL REPORT | APRIL 30, 2011
47
Overseas Fund
| NUMBER OF SHARES | | DESCRIPTION | | COST (NOTE 1) | | VALUE (NOTE 1) | |
| International Common Stocks — 70.89% — (continued) | | | |
| Japan 28.34% — (continued) | | | |
| | 7,175,100 | | | MS&AD Insurance Group Holdings | | $ | 169,497,975 | | | $ | 166,959,398 | | |
| | 610,300 | | | Keyence Corporation | | | 120,033,342 | | | | 159,077,950 | | |
| | 20,997,700 | | | NKSJ Holdings, Inc. | | | 155,345,297 | | | | 133,983,846 | | |
| | 2,552,600 | | | Ono Pharmaceutical Company Limited | | | 105,639,342 | | | | 129,390,848 | | |
| | 3,260,440 | | | Astellas Pharma, Inc. | | | 133,084,592 | | | | 124,103,962 | | |
| | 4,119,770 | | | MISUMI Group, Inc. | | | 70,730,692 | | | | 103,476,362 | | |
| | 927,500 | | | Hirose Electric Company Limited | | | 103,636,842 | | | | 95,971,914 | | |
| | 2,035,070 | | | Canon, Inc. | | | 97,083,761 | | | | 95,260,729 | | |
| | 11,565 | | | Inpex Corporation | | | 57,873,206 | | | | 87,756,098 | | |
| | 13,072 | | | KDDI Corporation | | | 81,226,239 | | | | 86,631,387 | | |
| | 2,699,196 | | | Nitto Kohki Company Limited (b) | | | 47,367,728 | | | | 65,667,801 | | |
| | 1,831,860 | | | Nissin Foods Holdings Company Limited | | | 64,705,384 | | | | 64,717,596 | | |
| | 3,729,250 | | | Mitsubishi Estate Company Limited | | | 54,944,112 | | | | 64,680,759 | | |
| | 2,737,860 | | | Nomura Research Institute Limited | | | 52,533,035 | | | | 58,615,431 | | |
| | 6,577,300 | | | Japan Wool Textile Company Limited (b) | | | 49,871,284 | | | | 58,011,170 | | |
| | 2,252,610 | | | THK Company Limited | | | 36,188,958 | | | | 57,078,329 | | |
| | 6,036,330 | | | Kansai Paint Company Limited | | | 46,990,834 | | | | 53,983,439 | | |
| | 3,452,591 | | | T. Hasegawa Company Limited (b) | | | 47,344,131 | | | | 52,822,346 | | |
| | 2,022,800 | | | Chofu Seisakusho Company Limited (b) | | | 33,096,084 | | | | 49,062,493 | | |
| | 26,230 | | | NTT DoCoMo, Inc. | | | 39,858,813 | | | | 48,240,195 | | |
| | 2,485,480 | | | Daiichikosho Company Limited | | | 27,081,144 | | | | 43,322,915 | | |
| | 2,819,780 | | | OSG Corporation | | | 33,175,151 | | | | 37,617,908 | | |
| | 1,472,300 | | | Meitec Corporation | | | 43,510,664 | | | | 28,292,535 | | |
| | 1,006,662 | | | Nagaileben Company Limited (b) | | | 19,961,972 | | | | 26,834,400 | | |
| | 1,570,700 | | | Ariake Japan Company Limited | | | 32,942,453 | | | | 26,429,862 | | |
| | 1,286,140 | | | AS One Corporation (b) | | | 26,246,127 | | | | 25,982,626 | | |
| | 861,660 | | | Icom, Inc. (b) | | | 22,557,750 | | | | 25,431,601 | | |
| | 2,184,600 | | | Seikagaku Corporation | | | 17,648,500 | | | | 25,242,114 | | |
| | 1,058,246 | | | Matsumoto Yushi-Seiyaku
Company Limited (b) | | | 25,950,562 | | | | 24,442,119 | | |
| | 2,535,900 | | | Yomeishu Seizo Company Limited (b) | | | 22,847,623 | | | | 22,772,494 | | |
| | 2,068,330 | | | Maezawa Kasei Industries
Company Limited (b) | | | 31,939,631 | | | | 20,815,787 | | |
| | 5,316,000 | | | Okumura Corporation | | | 26,721,400 | | | | 20,627,494 | | |
| | 508,106 | | | SK Kaken Company Limited | | | 9,470,131 | | | | 17,259,205 | | |
| | 639,200 | | | Fuji Seal International, Inc. | | | 12,089,732 | | | | 13,314,698 | | |
| | 493,250 | | | Mandom Corporation | | | 6,249,764 | | | | 12,966,192 | | |
See Notes to Financial Statements.
FIRST EAGLE FUNDS | SEMI-ANNUAL REPORT | APRIL 30, 2011
48
Schedule of Investments | Six-Month Period Ended April 30, 2011 (unaudited)
| NUMBER OF SHARES | | DESCRIPTION | | COST (NOTE 1) | | VALUE (NOTE 1) | |
| International Common Stocks — 70.89% — (continued) | | | |
| Japan 28.34% — (continued) | | | |
| | 806,280 | | | Chudenko Corporation | | $ | 12,295,496 | | | $ | 9,912,139 | | |
| | 2,572,675 | | | TOMONY Holdings, Inc. | | | 17,372,743 | | | | 9,000,243 | | |
| | 1,223,670 | | | Sansei Yusoki Company Limited (b) | | | 10,265,159 | | | | 6,858,461 | | |
| | 1,424,100 | | | Shingakukai Company Limited (b) | | | 10,266,277 | | | | 5,262,749 | | |
| | 784,900 | | | Asahi Broadcasting Corporation | | | 4,255,296 | | | | 3,819,112 | | |
| | | | | | | | 2,514,398,724 | | | | 3,070,002,424 | | |
| Malaysia 0.85% | | | |
| | 72,262,570 | | | Genting Malaysia Berhad | | | 62,743,594 | | | | 89,779,290 | | |
| | 607,050 | | | Genting Berhad | | | 999,650 | | | | 2,377,374 | | |
| | | | | | | | 63,743,244 | | | | 92,156,664 | | |
| Mexico 2.48% | | | |
| | 6,494,097 | | | Grupo Televisa SA, ADR (a) | | | 126,518,946 | | | | 154,039,981 | | |
| | 2,931,292 | | | Industrias Peñoles S.A.B. de C.V. | | | 2,500,676 | | | | 114,120,995 | | |
| | | | | | | | 129,019,622 | | | | 268,160,976 | | |
| Netherlands 0.91% | | | |
| | 539,055 | | | HAL Trust | | | 18,095,972 | | | | 84,649,818 | | |
| | 555,630 | | | TNT NV | | | 13,209,269 | | | | 13,704,066 | | |
| | | | | | | | 31,305,241 | | | | 98,353,884 | | |
| Singapore 2.37% | | | |
| | 23,192,830 | | | Haw Par Corporation Limited (b) | | | 76,875,317 | | | | 117,736,838 | | |
| | 62,622,735 | | | ComfortDelgro Corporation Limited | | | 60,129,362 | | | | 78,323,212 | | |
| | 15,238,450 | | | Singapore Airport Terminal
Services Limited | | | 16,538,036 | | | | 32,138,642 | | |
| | 5,640,520 | | | Fraser and Neave Limited | | | 6,680,505 | | | | 28,910,374 | | |
| | | | | | | | 160,223,220 | | | | 257,109,066 | | |
| South Africa 1.93% | | | |
| | 8,701,891 | | | Gold Fields Limited, ADR | | | 113,631,009 | | | | 155,241,735 | | |
| | 3,446,659 | | | Harmony Gold Mining Company
Limited, ADR | | | 32,680,302 | | | | 53,664,481 | | |
| | | | | | | | 146,311,311 | | | | 208,906,216 | | |
| South Korea 2.48% | | | |
| | 1,660,372 | | | KT&G Corporation | | | 90,106,497 | | | | 98,229,445 | | |
| | 35,325 | | | Lotte Confectionery Company Limited | | | 12,445,892 | | | | 52,345,542 | | |
| | 186,884 | | | Nong Shim Company Limited | | | 43,886,371 | | | | 43,510,062 | | |
| | 119,080 | | | Pacific Corporation | | | 18,151,496 | | | | 23,445,976 | | |
| | 872,463 | | | Fursys, Inc. (b) | | | 10,110,165 | | | | 22,022,231 | | |
See Notes to Financial Statements.
FIRST EAGLE FUNDS | SEMI-ANNUAL REPORT | APRIL 30, 2011
49
Overseas Fund
| NUMBER OF SHARES | | DESCRIPTION | | COST (NOTE 1) | | VALUE (NOTE 1) | |
| International Common Stocks — 70.89% — (continued) | | | |
| South Korea 2.48% — (continued) | | | |
| | 22,950 | | | Namyang Dairy Products
Company Limited | | $ | 4,912,653
| | | $ | 17,282,368
| | |
| | 1,182,040 | | | Dong Ah Tire & Rubber
Company Limited | | | 5,161,359
| | | | 10,313,138
| | |
| | 75,866 | | | Teems, Inc. (a)(b) | | | 1,401,053 | | | | 1,868,952 | | |
| | | | | | | | 186,175,486 | | | | 269,017,714 | | |
| Spain 0.70% | | | |
| | 1,190,720 | | | Red Electrica Corporation SA | | | 57,683,751 | | | | 76,100,486 | | |
| Sweden 0.15% | | | |
| | 660,107 | | | Investor AB, Class 'A' | | | 14,534,528 | | | | 15,971,834 | | |
| Switzerland 4.76% | | | |
| | 2,196,591 | | | Pargesa Holding SA | | | 115,479,876 | | | | 225,636,305 | | |
| | 2,378,850 | | | Nestlé SA | | | 64,791,575 | | | | 147,604,420 | | |
| | 164,816 | | | Rieter Holding AG (a) | | | 28,754,529 | | | | 71,033,991 | | |
| | 260,960 | | | Kuehne & Nagel International AG | | | 8,287,573 | | | | 41,671,584 | | |
| | 792 | | | Lindt & Spruengli AG (a) | | | 5,105,206 | | | | 29,462,638 | | |
| | | | | | | | 222,418,759 | | | | 515,408,938 | | |
| Taiwan 0.46% | | | |
| | 20,184,980 | | | Taiwan Secom Company Limited | | | 32,105,415 | | | | 38,765,085 | | |
| | 13,102,028 | | | Taiwan Sogo Shin Kong Security
Company Limited | | | 11,831,241 | | | | 11,483,175 | | |
| | | | | | | | 43,936,656 | | | | 50,248,260 | | |
| Thailand 1.87% | | | |
| | 463,467,885 | | | Thai Beverage PCL | | | 82,153,734 | | | | 107,977,068 | | |
| | 15,979,859 | | | Bangkok Bank PCL NVDR | | | 56,870,621 | | | | 91,007,572 | | |
| | 250,000 | | | OHTL PCL (e) | | | 1,152,073 | | | | 3,936,348 | | |
| | | | | | | | 140,176,428 | | | | 202,920,988 | | |
| Turkey 0.07% | | | |
| | 895,639 | | | Yazicilar Holding AS | | | 6,807,909 | | | | 7,957,830 | | |
| United Kingdom 1.83% | | | |
| | 3,995,640 | | | GlaxoSmithKline PLC | | | 76,140,895 | | | | 87,154,028 | | |
| | 3,378,628 | | | Berkeley Group Holdings PLC (a) | | | 41,275,902 | | | | 59,837,092 | | |
| | 978,218 | | | Anglo American PLC | | | 22,102,752 | | | | 51,001,632 | | |
| | | | | | | | 139,519,549 | | | | 197,992,752 | | |
| Total International Common Stocks | | | 5,407,907,932 | | | | 7,678,475,240 | | |
See Notes to Financial Statements.
FIRST EAGLE FUNDS | SEMI-ANNUAL REPORT | APRIL 30, 2011
50
Schedule of Investments | Six-Month Period Ended April 30, 2011 (unaudited)
| NUMBER OF SHARES | | DESCRIPTION | | COST (NOTE 1) | | VALUE (NOTE 1) | |
| U.S. Common Stocks — 0.38% | | | |
| Materials 0.38% | | | |
| | 707,683 | | | Newmont Mining Corporation | | $ | 18,468,982 | | | $ | 41,477,300 | | |
| Total Common Stocks | | | 5,426,376,914 | | | | 7,719,952,540 | | |
| International Preferred Stocks — 2.01% | | | |
| Canada 0.11% | | | |
| | 822,828 | | | Postmedia Network (e) | | | 5,591,396 | | | | 11,931,006 | | |
| Germany 0.82% | | | |
| | 581,442 | | | Hornbach Holding AG | | | 39,598,446 | | | | 88,847,602 | | |
| South Korea 1.08% | | | |
| | 186,879 | | | Samsung Electronics Company Limited | | | 23,663,909 | | | | 109,862,147 | | |
| | 27,183 | | | Namyang Dairy Products
Company Limited | | | 387,445 | | | | 6,683,824 | | |
| | | | | | | | 24,051,354 | | | | 116,545,971 | | |
| Total International Preferred Stocks | | | 69,241,196 | | | | 217,324,579 | | |
| OUNCES | | | | | | | |
| Commodity — 6.94% | | | |
| | 481,210 | | | Gold bullion (a) | | | 240,147,323 | | | | 751,722,100 | | |
| PRINCIPAL AMOUNT | | | | | | | |
| Term Loans — 0.16%(j) | | | |
| Germany 0.16% | | | |
| 1,647,055
EUR | | | Pfleiderer AG Term 1A
due 12/31/13 (a)(k) | | | 1,639,425
| | | | 1,710,441
| | |
| 5,000,000
EUR | | | Pfleiderer AG Term Loan
due 12/31/13 (a)(k) | | | 5,391,975
| | | | 5,192,424
| | |
| 5,000,000
EUR | | | Pfleiderer AG Term Loan
due 12/31/13 (a)(k) | | | 5,003,535
| | | | 5,192,424
| | |
| 441,014
EUR | | | Pfleiderer AG Term Facility 1A
due 12/31/13 (a)(k) | | | 465,783
| | | | 457,993
| | |
| 2,488,890
CAD | | | Pfleiderer AG Term Facility 2A
due 12/31/13 (a)(k) | | | 1,868,045
| | | | 1,836,800
| | |
| 799,835
EUR | | | Pfleiderer AG Revolving Credit Facility
due 12/31/13 (a)(k) | | | 844,758
| | | | 830,629
| | |
| 468,914
CAD | | | Pfleiderer AG Revolving Credit Facility
due 12/31/13 (a)(k) | | | 351,945
| | | | 346,058
| | |
| 2,578,274
USD | | | Pfleiderer AG Revolving Credit Facility
due 12/31/13 (a)(k) | | | 1,835,493
| | | | 1,804,714
| | |
| Total Term Loans | | | 17,400,959 | | | | 17,371,483 | | |
See Notes to Financial Statements.
FIRST EAGLE FUNDS | SEMI-ANNUAL REPORT | APRIL 30, 2011
51
Overseas Fund
| PRINCIPAL AMOUNT | | DESCRIPTION | | COST (NOTE 1) | | VALUE (NOTE 1) | |
| International Bonds — 3.90% | | | |
| International Corporate Bonds — 0.68% | | | |
| Canada 0.43% | | | |
| 17,142,000
USD | | | Catalyst Paper Corporation
7.375% due 03/01/14 (e) | | $ | 15,229,769
| | | $ | 11,999,400
| | |
| 34,110,000
USD | | | Catalyst Paper Corporation
11.00% due 12/15/16 (e)(h) | | | 30,603,986
| | | | 34,408,462
| | |
| | | | | | | | 45,833,755 | | | | 46,407,862 | | |
| France 0.25% | | | |
| 10,000,000
EUR | | | Emin Leydier SA FRN
6.511% due 07/31/16 (c)(d)(e) | | | 14,273,396
| | | | 14,835,497
| | |
| 8,000,000
EUR | | | FINEL
9.50% due 06/30/17 (c)(d)(e) | | | 9,649,600
| | | | 8,901,298
| | |
| 1,950,000
EUR | | | Wendel
4.875% due 09/21/15 (i) | | | 1,613,313
| | | | 2,820,599
| | |
| | | | | | | | 25,536,309 | | | | 26,557,394 | | |
| Total International Corporate Bonds | | | 71,370,064 | | | | 72,965,256 | | |
| International Government Bonds — 3.22% | | | |
| France 0.23% | | | |
| 15,764,006
EUR | | | France Government Bond OAT
3.00% due 07/25/12 (l) | | | 19,253,995
| | | | 24,806,516
| | |
| Hong Kong 1.31% | | | |
| 137,300,000
HKD | | | Hong Kong Government Bond
0.48% due 09/03/12 | | | 17,732,299
| | | | 17,671,714
| | |
| 415,700,000
HKD | | | Hong Kong Government Bond
2.66% due 12/17/12 | | | 55,553,734
| | | | 55,400,655
| | |
| 359,500,000
HKD | | | Hong Kong Government Bond
4.20% due 09/17/12 | | | 48,774,191
| | | | 48,661,915
| | |
| 145,500,000
HKD | | | Hong Kong Government Bond
4.49% due 11/26/12 | | | 19,849,501
| | | | 19,908,341
| | |
| | | | | | | | 141,909,725 | | | | 141,642,625 | | |
| Singapore 1.30% | | | |
| 120,000,000
SGD | | | Singapore Government Bond
3.50% due 07/01/12 | | | 97,294,655
| | | | 101,624,099
| | |
| 48,254,000
SGD | | | Singapore Government Bond
3.625% due 07/01/11 | | | 34,633,389
| | | | 39,667,249
| | |
| | | | | | | | 131,928,044 | | | | 141,291,348 | | |
See Notes to Financial Statements.
FIRST EAGLE FUNDS | SEMI-ANNUAL REPORT | APRIL 30, 2011
52
Schedule of Investments | Six-Month Period Ended April 30, 2011 (unaudited)
| PRINCIPAL AMOUNT | | DESCRIPTION | | COST (NOTE 1) | | VALUE (NOTE 1) | |
| International Government Bonds — 3.22% — (continued) | | | |
| Taiwan 0.38% | | | |
| 582,300,000
TWD | | | Taiwan Government Bond
2.00% due 07/20/12 | | $ | 18,046,438
| | | $ | 20,669,622
| | |
| 574,500,000
TWD | | | Taiwan Government Bond
2.375% due 01/16/13 | | | 18,484,655
| | | | 20,611,748
| | |
| | | | | | | | 36,531,093 | | | | 41,281,370 | | |
| Total International Government Bonds | | | 329,622,857 | | | | 349,021,859 | | |
| Total International Bonds | | | 400,992,921 | | | | 421,987,115 | | |
| Commercial Paper — 15.84% | | | |
| International Commercial Paper — 13.65% | | | |
| France 2.89% | | | |
| 22,850,000
USD | | | Électricité de France
0.19% due 05/31/11 | | | 22,846,382
| | | | 22,846,382
| | |
| 36,000,000
USD | | | Électricité de France
0.26% due 06/21/11 | | | 35,986,740
| | | | 35,986,740
| | |
| 50,000,000
USD | | | Électricité de France
0.27% due 05/16/11 | | | 49,994,375
| | | | 49,994,375
| | |
| 25,026,000
USD | | | GDF Suez SA
0.20% due 06/20/11 | | | 25,019,049
| | | | 25,019,049
| | |
| 50,000,000
USD | | | GDF Suez SA
0.20% due 07/01/11 | | | 49,983,055
| | | | 49,979,615
| | |
| 15,000,000
USD | | | GDF Suez SA
0.35% due 05/05/11 | | | 14,999,433
| | | | 14,999,433
| | |
| 15,000,000
USD | | | GDF Suez SA
0.35% due 05/06/11 | | | 14,999,292
| | | | 14,999,292
| | |
| 38,000,000
USD | | | Sanofi-Aventis SA
0.32% due 05/10/11 | | | 37,996,960
| | | | 37,996,960
| | |
| 39,267,000
USD | | | Sanofi-Aventis SA
0.38% due 05/24/11 | | | 39,257,592
| | | | 39,257,592
| | |
| 22,000,000
USD | | | Sanofi-Aventis SA
0.38% due 06/01/11 | | | 21,992,896
| | | | 21,992,896
| | |
| Germany 0.53% | | | |
| 58,000,000
USD | | | BASF AG
0.18% due 06/29/11 | | | 57,982,890
| | | | 57,981,921
| | |
| Italy 0.95% | | | |
| 50,000,000
USD | | | Eni S.p.A.
0.34% due 07/01/11 | | | 49,972,042
| | | | 49,979,615
| | |
| 20,000,000
USD | | | Eni S.p.A.
0.35% due 06/20/11 | | | 19,990,556
| | | | 19,990,556
| | |
| 8,361,000
USD | | | Eni S.p.A.
0.35% due 08/01/11 | | | 8,353,735
| | | | 8,355,237
| | |
See Notes to Financial Statements.
FIRST EAGLE FUNDS | SEMI-ANNUAL REPORT | APRIL 30, 2011
53
Overseas Fund
| PRINCIPAL AMOUNT | | DESCRIPTION | | COST (NOTE 1) | | VALUE (NOTE 1) | |
| International Commercial Paper — 13.65% — (continued) | | | |
| Italy 0.95% — (continued) | | | |
| 25,000,000
USD | | | Eni S.p.A.
0.39% due 09/22/11 | | $ | 24,962,000
| | | $ | 24,967,047
| | |
| Japan 4.06% | | | |
| 40,000,000
USD | | | Mitsubishi Company
0.25% due 05/20/11 | | | 39,994,722
| | | | 39,994,722
| | |
| 25,000,000
USD | | | Mitsubishi Company
0.25% due 05/27/11 | | | 24,995,486
| | | | 24,995,486
| | |
| 10,000,000
USD | | | Mitsubishi Company
0.26% due 07/06/11 | | | 9,995,233
| | | | 9,995,504
| | |
| 30,000,000
USD | | | Mitsubishi Company
0.26% due 07/29/11 | | | 29,980,717
| | | | 29,980,209
| | |
| 22,017,000
USD | | | Mitsui & Company, Limited
0.13% due 05/02/11 | | | 22,016,920
| | | | 22,016,920
| | |
| 30,107,000
USD | | | Mitsui & Company, Limited
0.23% due 05/10/11 | | | 30,105,269
| | | | 30,105,269
| | |
| 40,000,000
USD | | | Mitsui & Company, Limited
0.23% due 07/26/11 | | | 39,978,022
| | | | 39,974,772
| | |
| 20,000,000
USD | | | Mitsui & Company, Limited
0.24% due 06/24/11 | | | 19,992,800
| | | | 19,992,800
| | |
| 10,000,000
USD | | | Mitsui & Company, Limited
0.30% due 07/22/11 | | | 9,993,167
| | | | 9,994,073
| | |
| 30,000,000
USD | | | Sumitomo Corporation
0.26% due 06/06/11 | | | 29,992,200
| | | | 29,992,200
| | |
| 15,000,000
USD | | | Sumitomo Corporation
0.30% due 06/24/11 | | | 14,993,250
| | | | 14,993,250
| | |
| 9,575,000
USD | | | Sumitomo Corporation
0.31% due 05/02/11 | | | 9,574,918
| | | | 9,574,918
| | |
| 5,000,000
USD | | | Sumitomo Corporation
0.31% due 07/05/11 | | | 4,997,292
| | | | 4,997,795
| | |
| 25,000,000
USD | | | Sumitomo Corporation
0.31% due 07/27/11 | | | 24,981,875
| | | | 24,983,993
| | |
| 25,000,000
USD | | | Sumitomo Corporation
0.33% due 05/26/11 | | | 24,994,271
| | | | 24,994,271
| | |
| 10,000,000
USD | | | Toyota Motor Corporation
0.20% due 06/23/11 | | | 9,997,056
| | | | 9,997,056
| | |
| 10,000,000
USD | | | Toyota Motor Corporation
0.21% due 06/15/11 | | | 9,997,375
| | | | 9,997,375
| | |
| 25,000,000
USD | | | Toyota Motor Corporation
0.24% due 07/06/11 | | | 24,989,000
| | | | 24,992,067
| | |
| 10,000,000
USD | | | Toyota Motor Corporation
0.25% due 05/10/11 | | | 9,999,375
| | | | 9,999,375
| | |
| 10,000,000
USD | | | Toyota Motor Corporation
0.26% due 08/03/11 | | | 9,993,211
| | | | 9,994,827
| | |
See Notes to Financial Statements.
FIRST EAGLE FUNDS | SEMI-ANNUAL REPORT | APRIL 30, 2011
54
Schedule of Investments | Six-Month Period Ended April 30, 2011 (unaudited)
| PRINCIPAL AMOUNT | | DESCRIPTION | | COST (NOTE 1) | | VALUE (NOTE 1) | |
| International Commercial Paper — 13.65% — (continued) | | | |
| Japan 4.06% — (continued) | | | |
| 22,707,000
USD | | | Toyota Motor Corporation
0.27% due 06/23/11 | | $ | 22,697,974
| | | $ | 22,697,974
| | |
| 15,000,000
USD | | | Toyota Motor Corporation
0.27% due 07/01/11 | | | 14,993,137
| | | | 14,995,722
| | |
| Switzerland 3.13% | | | |
| 10,000,000
USD | | | Nestlé SA
0.18% due 08/02/11 | | | 9,995,350
| | | | 9,996,253
| | |
| 15,000,000
USD | | | Nestlé SA
0.20% due 05/02/11 | | | 14,999,917
| | | | 14,999,917
| | |
| 8,771,000
USD | | | Nestlé SA
0.20% due 09/09/11 | | | 8,764,617
| | | | 8,765,427
| | |
| 2,824,000
USD | | | Nestlé SA
0.21% due 10/24/11 | | | 2,821,101
| | | | 2,821,207
| | |
| 7,000,000
USD | | | Nestlé SA
0.22% due 06/03/11 | | | 6,998,588
| | | | 6,998,588
| | |
| 30,000,000
USD | | | Nestlé SA
0.22% due 08/08/11 | | | 29,981,850
| | | | 29,987,880
| | |
| 10,000,000
USD | | | Nestlé SA
0.23% due 06/14/11 | | | 9,997,189
| | | | 9,997,189
| | |
| 12,450,000
USD | | | Nestlé SA
0.24% due 08/03/11 | | | 12,442,198
| | | | 12,445,285
| | |
| 29,595,000
USD | | | Nestlé SA
0.25% due 07/20/11 | | | 29,578,558
| | | | 29,585,562
| | |
| 10,000,000
USD | | | Novartis International AG
0.22% due 06/14/11 | | | 9,997,311
| | | | 9,997,311
| | |
| 50,000,000
USD | | | Novartis International AG
0.23% due 06/13/11 | | | 49,986,264
| | | | 49,986,264
| | |
| 15,000,000
USD | | | Novartis International AG
0.23% due 09/15/11 | | | 14,986,871
| | | | 14,983,494
| | |
| 14,000,000
USD | | | Novartis International AG
0.24% due 05/09/11 | | | 13,999,253
| | | | 13,999,253
| | |
| 20,000,000
USD | | | Novartis International AG
0.24% due 07/14/11 | | | 19,990,133
| | | | 19,990,880
| | |
| 10,000,000
USD | | | Novartis International AG
0.24% due 07/19/11 | | | 9,994,733
| | | | 9,995,028
| | |
| 10,000,000
USD | | | Novartis International AG
0.25% due 09/12/11 | | | 9,990,694
| | | | 9,989,384
| | |
| 20,000,000
USD | | | Roche Holdings, Inc.
0.17% due 05/02/11 | | | 19,999,906
| | | | 19,999,906
| | |
| 35,000,000
USD | | | Roche Holdings, Inc.
0.18% due 05/17/11 | | | 34,997,200
| | | | 34,997,200
| | |
| 29,000,000
USD | | | Roche Holdings, Inc.
0.18% due 05/19/11 | | | 28,997,390
| | | | 28,997,390
| | |
See Notes to Financial Statements.
FIRST EAGLE FUNDS | SEMI-ANNUAL REPORT | APRIL 30, 2011
55
Overseas Fund
| PRINCIPAL AMOUNT | | DESCRIPTION | | COST (NOTE 1) | | VALUE (NOTE 1) | |
| International Commercial Paper — 13.65% — (continued) | | | |
| United Kingdom 0.95% | | | |
| 30,000,000
USD | | | Reckitt Benckiser Group PLC
0.35% due 06/13/11 | | $ | 29,987,458
| | | $ | 29,987,458
| | |
| 25,000,000
USD | | | Reckitt Benckiser Group PLC
0.39% due 09/26/11 | | | 24,960,944
| | | | 24,965,625
| | |
| 29,379,000
USD | | | Reckitt Benckiser Group PLC
0.40% due 07/13/11 | | | 29,355,170
| | | | 29,364,005
| | |
| 18,221,000
USD | | | Reckitt Benckiser Group PLC
0.41% due 07/13/11 | | | 18,206,221
| | | | 18,211,700
| | |
| Venezuela 1.14% | | | |
| 20,000,000
USD | | | Corporación Andina de Fomento
0.29% due 08/15/11 | | | 19,982,922
| | | | 19,983,320
| | |
| 10,000,000
USD | | | Corporación Andina de Fomento
0.37% due 08/25/11 | | | 9,988,400
| | | | 9,990,560
| | |
| 94,000,000
USD | | | Corporación Andina de Fomento
0.44% due 07/12/11 | | | 93,917,280
| | | | 93,952,850
| | |
| Total International Commercial Paper | | | 1,478,507,785 | | | | 1,478,596,224 | | |
| U.S. Commercial Paper — 2.19% | | | |
| $ | 19,995,000 | | | Campbell Soup Company
0.25% due 08/08/11 | | | 19,981,253
| | | | 19,985,238
| | |
| | 32,500,000 | | | Cisco Systems, Inc.
0.21% due 05/18/11 | | | 32,496,777
| | | | 32,496,777
| | |
| | 4,559,000 | | | ConocoPhillips
0.22% due 06/07/11 | | | 4,557,969
| | | | 4,557,969
| | |
| | 22,385,000 | | | Dover Corporation
0.07% due 05/02/11 | | | 22,384,956
| | | | 22,384,956
| | |
| | 25,000,000 | | | DuPont
0.29% due 06/16/11 | | | 24,990,736
| | | | 24,990,736
| | |
| | 20,000,000 | | | Johnson & Johnson
0.20% due 05/13/11 | | | 19,998,667
| | | | 19,998,667
| | |
| | 12,500,000 | | | Medtronic, Inc.
0.19% due 09/13/11 | | | 12,491,094
| | | | 12,486,538
| | |
| | 12,500,000 | | | Proctor & Gamble Company
0.13% due 06/30/11 | | | 12,497,292
| | | | 12,496,986
| | |
| | 20,000,000 | | | Proctor & Gamble Company
0.18% due 05/31/11 | | | 19,997,000
| | | | 19,997,000
| | |
| | 14,123,000 | | | Proctor & Gamble Company
0.19% due 05/24/11 | | | 14,121,286
| | | | 14,121,286
| | |
| | 1,807,000 | | | Sysco Corporation
0.07% due 05/02/11 | | | 1,806,996
| | | | 1,806,996
| | |
| | 20,998,000 | | | Verizon Communications, Inc.
0.38% due 05/25/11 | | | 20,992,821
| | | | 20,992,821
| | |
See Notes to Financial Statements.
FIRST EAGLE FUNDS | SEMI-ANNUAL REPORT | APRIL 30, 2011
56
Schedule of Investments | Six-Month Period Ended April 30, 2011 (unaudited)
| PRINCIPAL AMOUNT | | DESCRIPTION | | COST (NOTE 1) | | VALUE (NOTE 1) | |
| U.S. Commercial Paper — 2.19% — (continued) | |
| $ | 11,080,000 | | | WellPoint, Inc.
0.36% due 07/11/11 | | $ | 11,072,352
| | | $ | 11,073,484
| | |
| | 20,000,000 | | | Wisconsin Electric Power Company
0.11% due 05/02/11 | | | 19,999,939
| | | | 19,999,939
| | |
| Total U.S. Commercial Paper | | | 237,389,138 | | | | 237,389,393 | | |
| Total Commercial Paper | | | 1,715,896,923 | | | | 1,715,985,617 | | |
| Total Investments — 100.12% | | $ | 7,870,056,236 | | | | 10,844,343,434 | | |
| Liabilities in Excess of Other Assets — (0.12)% | | | | | (12,752,499 | ) | |
| Net Assets — 100.00% | | | | $ | 10,831,590,935 | | |
(a) Non-income producing security/commodity.
(b) An affiliate of the Fund as defined by the Investment Company Act of 1940. An affiliate is defined as a company in which the Fund directly or indirectly owns, controls, or holds power to vote 5% or more of the outstanding voting securities.
(c) Represents interest in a restricted security which has not been registered with the Securities and Exchange Commission under the Securities Act of 1933. At April 30, 2011, the value of these securities amounted to $64,658,525 or 0.60% of net assets.
(d) Securities valued in accordance with fair value procedures under the supervision of the Board of Trustees, representing $71,763,413 or 0.66% of net assets.
(e) Security is deemed illiquid. At April 30, 2011, the value of these securities amounted to $135,296,070 or 1.25% of net assets.
(f) Represents non-voting class of shares.
(g) Held through Financiere Bleue, LLC, a wholly owned subsidiary and disregarded entity for U.S. tax purposes.
(h) All or a portion of the security is exempt from registration under the Securities Act of 1933. Rule 144A securities may only be sold to qualified institutional buyers, pursuant to Rule 144A under the Securities Act of 1933.
(i) Represents a security registered under Regulation S. Bonds sold under Regulation S may not be offered, sold or delivered within the U.S., or for the account or benefit of, U.S. persons, except pursuant to an exemption from, or in a transaction not subject to, the registration requirements of the Securities Act of 1933.
(j) Term loans are generally subject to legal or contractual restrictions on resale. A Fund's ability to receive payments of principal, interest and other amounts in connection with term loans will depend primarily on the financial condition of the borrower. A Fund's failure to receive scheduled payments on a term loan due to a default, bankruptcy or other reason may affect the Fund's income and would likely reduce the value of its assets.
(k) All or a portion of this position represents unsettled loan commitment.
(l) Inflation protected security.
At April 30, 2011, cost is substantially identical for both book and federal income tax purposes. Net unrealized appreciation consisted of:
| Gross unrealized appreciation | | $ | 3,170,181,594 | | |
| Gross unrealized depreciation | | | (195,894,396 | ) | |
| Net unrealized appreciation | | $ | 2,974,287,198 | | |
See Notes to Financial Statements.
FIRST EAGLE FUNDS | SEMI-ANNUAL REPORT | APRIL 30, 2011
57
Overseas Fund
Abbreviations used in this schedule include:
ADR — American Depository Receipt
FRN — Floating Rate Note
NVDR — Non-Voting Depository Receipt
OAT — French Treasury Obligation
PCL — Public Company Limited
PLC — Public Limited Company
RSP — Represents Non-Voting Shares
Currencies
EUR — Euro
HKD — Hong Kong Dollar
SGD — Singapore Dollar
TWD — Taiwan Dollar
USD — United States Dollar
| RESTRICTED SECURITIES | | ACQUISITION
DATE | | COST | | CARRYING VALUE PER
SHARE/PRINCIPAL | |
| Emin Leydier SA FRN 6.51% due 7/31/16 | | 07/30/09 | | $ | 14,273,396 | | | $ | 1.48 | | |
| FINEL 9.50% due 6/30/17 | | 06/22/05 | | | 9,649,600 | | | | 1.11 | | |
| FINEL | | 07/14/99 | | | 9,152,131 | | | | 0.53 | | |
| Fregate | | 04/30/04 | | | 23,101,992 | | | | 38.77 | | |
| Foreign Currency Exchange Contracts — Sales | |
SETTLEMENT
DATES
THROUGH | | FOREIGN CURRENCY
TO BE DELIVERED | | U.S. $
TO BE
RECEIVED | | U.S. $ VALUE
AT APRIL 30,
2011 | | UNREALIZED
APPRECIATION
AT APRIL 30,
2011 | | UNREALIZED
DEPRECIATION
AT APRIL 30,
2011 | |
| 06/15/11 | | | 103,846,000 | | | Euro | | $ | 138,140,103 | | | $ | 153,881,538 | | | $ | — | | | $ | (15,741,435 | ) | |
| 07/20/11 | | | 115,797,000 | | | Euro | | | 157,024,206 | | | | 171,420,214 | | | | — | | | | (14,396,008 | ) | |
| 08/17/11 | | | 228,262,000 | | | Euro | | | 314,181,164 | | | | 337,944,983 | | | | — | | | | (23,763,819 | ) | |
| 09/21/11 | | | 176,174,000 | | | Euro | | | 254,345,928 | | | | 260,243,884 | | | | — | | | | (5,897,956 | ) | |
| 06/15/11 | | | 11,874,054,000 | | | Japanese Yen | | | 143,675,412 | | | | 146,294,349 | | | | — | | | | (2,618,937 | ) | |
| 07/20/11 | | | 20,256,240,000 | | | Japanese Yen | | | 243,443,941 | | | | 249,617,807 | | | | — | | | | (6,173,866 | ) | |
| 08/17/11 | | | 38,354,912,000 | | | Japanese Yen | | | 461,593,797 | | | | 472,659,884 | | | | — | | | | (11,066,087 | ) | |
| 09/21/11 | | | 13,696,552,000 | | | Japanese Yen | | | 162,976,582 | | | | 168,868,969 | | | | — | | | | (5,892,387 | ) | |
| | | | | | | $ | 1,875,381,133 | | | $ | 1,960,931,628 | | | $ | — | | | $ | (85,550,495 | ) | |
Affiliated Securities
AFFILIATED
SECURITIES | | SHARES
OCTOBER 31,
2010 | | GROSS
ADDITIONS | | GROSS
REDUCTIONS | | SHARES
APRIL 30,
2011 | | MARKET
VALUE
APRIL 30,
2011 | | REALIZED
GAIN/(LOSS) | | DIVIDEND
INCOME | |
| AS One
Corporation | | | | 1,286,140 | | | | — | | | | — | | | | 1,286,140 | | | $ | 25,982,626 | | | $ | — | | | $ | 262,072 | | |
| Chofu
Seisakusho
Company
Limited | | | | 2,022,800 | | | | — | | | | — | | | | 2,022,800 | | | | 49,062,493 | | | | — | | | | 342,743 | | |
See Notes to Financial Statements.
FIRST EAGLE FUNDS | SEMI-ANNUAL REPORT | APRIL 30, 2011
58
Schedule of Investments | Six-Month Period Ended April 30, 2011 (unaudited)
| (continued) | |
AFFILIATED
SECURITIES | | SHARES
OCTOBER 31,
2010 | | GROSS
ADDITIONS | | GROSS
REDUCTIONS | | SHARES
APRIL 30,
2011 | | MARKET
VALUE
APRIL 30,
2011 | | REALIZED
GAIN/(LOSS) | | DIVIDEND
INCOME | |
Deutsche
Wohnen AG | | | 6,418,531 | | | | — | | | | — | | | | 6,418,531 | | | $ | 101,268,698 | | | $ | — | | | $ | — | | |
| FINEL | | | 11,593,581 | | | | — | | | | — | | | | 11,593,581 | | | | 6,191,875 | | | | — | | | | — | | |
| Fregate | | | 895,904 | | | | — | | | | — | | | | 895,904 | | | | 34,729,855 | | | | — | | | | — | | |
| Fursys, Inc. | | | 948,330 | | | | — | | | | 75,867 | | | | 872,463 | | | | 22,022,231 | | | | — | | | | 444,851 | | |
| Gewiss S.p.A. | | | 6,116,020 | | | | — | | | | — | | | | 6,116,020 | | | | 46,092,971 | | | | — | | | | — | | |
Haw Par
Corporation
Limited | | | 23,192,830 | | | | — | | | | — | | | | 23,192,830 | | | | 117,736,838 | | | | — | | | | — | | |
| Icom, Inc. | | | 861,660 | | | | — | | | | — | | | | 861,660 | | | | 25,431,601 | | | | — | | | | 97,509 | | |
Japan Wool
Textile
Company
Limited | | | 6,577,300 | | | | — | | | | — | | | | 6,577,300 | | | | 58,011,170 | | | | — | | | | 728,028 | | |
Laurent-
Perrier | | | 563,378 | | | | — | | | | — | | | | 563,378 | | | | 72,045,894 | | | | — | | | | — | | |
Maezawa
Kasei
Industries
Company
Limited | | | 2,068,330 | | | | — | | | | — | | | | 2,068,330 | | | | 20,815,787 | | | | — | | | | 292,257 | | |
Matsumoto
Yushi-Seiyaku
Company
Limited | | | 1,058,246 | | | | — | | | | — | | | | 1,058,246 | | | | 24,442,119 | | | | — | | | | 597,516 | | |
Nagaileben
Company
Limited | | | 1,005,672 | | | | 990 | | | | — | | | | 1,006,662 | | | | 26,834,400 | | | | — | | | | — | | |
Nitto Kohki
Company
Limited | | | 2,832,150 | | | | — | | | | 132,954 | | | | 2,699,196 | | | | 65,667,801 | | | | 653,699 | | | | 382,336 | | |
Pfeiffer
Vacuum
Technology
AG* | | | 895,398 | | | | — | | | | 709,189 | | | | 186,209 | | | | 25,829,403 | | | | 51,381,855 | | | | — | | |
| Robertet SA | | | 235,944 | | | | — | | | | 107 | | | | 235,837 | | | | 43,381,113 | | | | (1,332 | ) | | | — | | |
Sansei Yusoki
Company
Limited | | | 1,223,670 | | | | — | | | | — | | | | 1,223,670 | | | | 6,858,461 | | | | — | | | | 96,933 | | |
| Shimano, Inc. | | | 4,886,870 | | | | — | | | | — | | | | 4,886,870 | | | | 260,657,146 | | | | — | | | | 1,683,664 | | |
Shingakukai
Company
Limited | | | 1,424,100 | | | | — | | | | — | | | | 1,424,100 | | | | 5,262,749 | | | | — | | | | 160,818 | | |
Sucrière de
Pithiviers-
Le-Vieil | | | 39,143 | | | | — | | | | — | | | | 39,143 | | | | 48,488,938 | | | | — | | | | 2,015,407 | | |
T. Hasegawa
Company
Limited | | | 3,452,591 | | | | — | | | | — | | | | 3,452,591 | | | | 52,822,346 | | | | — | | | | 391,120 | | |
| Teems, Inc. | | | — | | | | 75,866 | | | | — | | | | 75,866 | | | | 1,868,952 | | | | — | | | | — | | |
See Notes to Financial Statements.
FIRST EAGLE FUNDS | SEMI-ANNUAL REPORT | APRIL 30, 2011
59
Overseas Fund
| (continued) | |
AFFILIATED
SECURITIES | | SHARES
OCTOBER 31,
2010 | | GROSS
ADDITIONS | | GROSS
REDUCTIONS | | SHARES
APRIL 30,
2011 | | MARKET
VALUE
APRIL 30,
2011 | | REALIZED
GAIN/(LOSS) | | DIVIDEND
INCOME | |
Yomeishu
Seizo
Company
Limited | | | 2,535,900 | | | | — | | | | — | | | | 2,535,900 | | | $ | 22,772,494 | | | $ | — | | | $ | 515,463 | | |
| Total | | | | $1,164,277,961 | | $52,034,222 | | $8,010,717 | |
* Not an affiliated issuer as of April 30, 2011.
| INDUSTRY DIVERSIFICATION FOR PORTFOLIO HOLDINGS | | PERCENT OF
NET ASSETS | |
| International Common Stocks | |
| Consumer Discretionary | | | 10.69 | % | |
| Consumer Staples | | | 8.68 | | |
| Energy | | | 3.61 | | |
| Financials | | | 10.07 | | |
| Health Care | | | 5.28 | | |
| Industrials | | | 17.13 | | |
| Information Technology | | | 4.74 | | |
| Materials | | | 8.74 | | |
| Telecommunication Services | | | 1.25 | | |
| Utilities | | | 0.70 | | |
| Total International Common Stocks | | | 70.89 | | |
| U.S. Common Stocks | |
| Materials | | | 0.38 | | |
| Total U.S. Common Stocks | | | 0.38 | | |
| International Preferred Stocks | |
| Consumer Discretionary | | | 0.82 | | |
| Consumer Staples | | | 0.06 | | |
| Energy | | | 0.11 | | |
| Information Technology | | | 1.02 | | |
| Total International Preferred Stocks | | | 2.01 | | |
| Commodity | | | 6.94 | | |
| Term Loans | | | 0.16 | | |
See Notes to Financial Statements.
FIRST EAGLE FUNDS | SEMI-ANNUAL REPORT | APRIL 30, 2011
60
Schedule of Investments | Six-Month Period Ended April 30, 2011 (unaudited)
| INDUSTRY DIVERSIFICATION FOR PORTFOLIO HOLDINGS — (CONTINUED) | | PERCENT OF
NET ASSETS | |
| International Bonds | |
| Financials | | | 0.08 | % | |
| Government Issues | | | 3.22 | | |
| Industrials | | | 0.03 | | |
| Materials | | | 0.57 | | |
| Total International Bonds | | | 3.90 | | |
| Commercial Paper | |
| International Commercial Paper | | | 13.65 | | |
| U.S. Commercial Paper | | | 2.19 | | |
| Total Commercial Paper | | | 15.84 | | |
| Total Investments | | | 100.12 | % | |
See Notes to Financial Statements.
FIRST EAGLE FUNDS | SEMI-ANNUAL REPORT | APRIL 30, 2011
61

Fund Overview | Data as of April 30, 2011 (unaudited)
INVESTMENT OBJECTIVE
The First Eagle U.S. Value Fund seeks long-term growth of capital by investing, under normal market conditions, primarily in equity and debt securities issued by U.S. corporations. Management utilizes a highly disciplined, bottom-up, value-oriented approach in achieving its investment objective.
| Average Annual Returns | |
| | | ONE-YEAR | | FIVE-YEARS | | SINCE
INCEPTION
(09-04-01) | |
First Eagle U.S. Value
Fund (A Shares) | |
| without sales charge | | | 13.79 | % | | | 6.49 | % | | | 9.96 | % | |
| with sales charge | | | 8.10 | | | | 5.40 | | | | 9.37 | | |
Standard & Poor's
500 Index | | | 17.22 | | | | 2.95 | | | | 3.91 | | |
| Consumer Price Index | | | 3.16 | | | | 2.22 | | | | 2.48 | | |
Asset Allocation
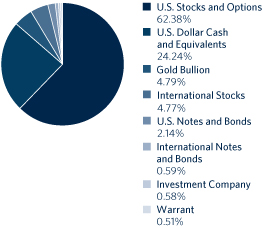
| Sector/Industry* | |
| Financials | | | 12.23 | % | |
| Consumer Discretionary | | | 11.74 | | |
| Industrials | | | 9.07 | | |
| Materials | | | 8.87 | | |
| Information Technology | | | 8.32 | | |
| Consumer Staples | | | 5.11 | | |
| Energy | | | 4.85 | | |
| Commodity (Gold Bullion) | | | 4.79 | | |
| Health Care | | | 4.44 | | |
| Utilities | | | 3.25 | | |
Telecommunication
Services | | | 2.04 | | |
| Investment Company | | | 0.58 | | |
| Warrant | | | 0.51 | | |
* percentages exclude option positions
Asset Allocation and Sector/Industry percentages are based on total investments in the portfolio. The Fund's portfolio composition is subject to change at any time.
FIRST EAGLE FUNDS | SEMI-ANNUAL REPORT | APRIL 30, 2011
62
U.S. Value Fund
Growth of a $10,000 Initial Investment
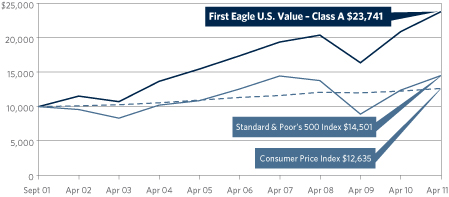
Performance data quoted herein represents past performance and should not be considered indicative of future results. Performance data quoted herein does not reflect the deduction of taxes that a shareholder would pay on Fund distributions or the sale of Fund shares. The average annual returns shown above are historical and reflect changes in share price, reinvested dividends and are net of expenses.
The average annual returns for Class A Shares with a sales charge gives effect to the deduction of the maximum sales charge of 5.00%.
The Standard & Poor's 500 Index is a widely recognized unmanaged index including a representative sample of 500 leading companies in leading sectors of the U.S. economy and is not available for purchase. Although the Standard & Poor's 500 Index focuses on the large-cap segment of the market, with approximately 75% coverage of U.S. equities, it is also considered a proxy for the total market. The Consumer Price Index (CPI) represents the change in price of all goods and services purchased for consumption by urban households.
| Top 10 Holdings* | |
| Gold Bullion (precious metal) | | | 4.78 | % | |
| Sysco Corporation (U.S. wholesale distributor) | | | 2.39 | | |
| Comcast Corporation, Class 'A' (U.S. cable/satellite television company) | | | 2.33 | | |
| Cintas Corporation (U.S. uniform designer and manufacturer) | | | 2.07 | | |
| Cisco Systems, Inc. (U.S. networking company) | | | 2.03 | | |
| ConocoPhillips (U.S. energy company) | | | 2.00 | | |
| 3M Company (U.S. industrial conglomerate) | | | 1.95 | | |
| American Express Company (U.S. credit card and travel services company) | | | 1.90 | | |
| Microsoft Corporation (U.S. software developer) | | | 1.82 | | |
| Newmont Mining Corporation (U.S. gold mining company) | | | 1.78 | | |
| Total | | | 23.05 | % | |
* Excludes cash, commercial paper and money market funds.
FIRST EAGLE FUNDS | SEMI-ANNUAL REPORT | APRIL 30, 2011
63
First Eagle U.S. Value Fund
| NUMBER OF SHARES | | DESCRIPTION | | COST (NOTE 1) | | VALUE (NOTE 1) | |
| Common Stocks — 66.53% | | | |
| U.S. Common Stocks — 61.77% | | | |
| Consumer Discretionary 10.27% | | | |
| | 1,626,946 | | | Comcast Corporation, Class 'A' | | $ | 25,954,315 | | | $ | 39,941,524 | | |
| | 1,143,570 | | | Cintas Corporation | | | 34,510,670 | | | | 35,507,848 | | |
| | 573,750 | | | Omnicom Group, Inc. | | | 17,421,015 | | | | 28,222,763 | | |
| | 744,610 | | | Home Depot, Inc. | | | 17,004,979 | | | | 27,654,815 | | |
| | 310,834 | | | Wal-Mart Stores, Inc. | | | 14,497,317 | | | | 17,089,653 | | |
| | 524,496 | | | International Speedway
Corporation, Class 'A' | | | 18,296,765 | | | | 16,049,578 | | |
| | 132,122 | | | Unifirst Corporation | | | 3,467,476 | | | | 6,838,635 | | |
| | 62,900 | | | Costco Wholesale Corporation | | | 2,566,072 | | | | 5,089,868 | | |
| | 590 | | | St. John Knits International, Inc. (a)(b) | | | 18,290 | | | | 3,546 | | |
| | | | | | | | 133,736,899 | | | | 176,398,230 | | |
| Consumer Staples 4.82% | | | |
| | 1,419,161 | | | Sysco Corporation | | | 40,467,087 | | | | 41,027,945 | | |
| | 199,910 | | | Lorillard, Inc. | | | 14,817,964 | | | | 21,290,415 | | |
| | 243,070 | | | Colgate-Palmolive Company | | | 18,724,902 | | | | 20,502,954 | | |
| | | | | | | | 74,009,953 | | | | 82,821,314 | | |
| Energy 4.47% | | | |
| | 435,648 | | | ConocoPhillips | | | 20,515,610 | | | | 34,385,697 | | |
| | 154,753 | | | Apache Corporation | | | 10,032,993 | | | | 20,639,408 | | |
| | 352,139 | | | San Juan Basin Royalty Trust | | | 10,234,184 | | | | 8,789,389 | | |
| | 66,671 | | | SEACOR Holdings, Inc. | | | 4,706,611 | | | | 6,589,095 | | |
| | 96,200 | | | Helmerich & Payne, Inc. | | | 1,773,877 | | | | 6,381,908 | | |
| | | | | | | | 47,263,275 | | | | 76,785,497 | | |
| Financials 11.32% | | | |
| | 665,890 | | | American Express Company | | | 19,687,007 | | | | 32,681,881 | | |
| | 953,848 | | | Bank of New York Mellon Corporation | | | 25,752,325 | | | | 27,623,438 | | |
| | 832,550 | | | Cincinnati Financial Corporation | | | 21,580,935 | | | | 26,375,184 | | |
| | 145 | | | Berkshire Hathaway, Inc., Class 'A' (a) | | | 11,905,798 | | | | 18,088,750 | | |
| | 640,411 | | | BB&T Corporation | | | 17,315,379 | | | | 17,239,864 | | |
| | 520,235 | | | WR Berkley Corporation | | | 13,980,972 | | | | 16,964,864 | | |
| | 48,897 | | | Alleghany Corporation (a) | | | 13,907,571 | | | | 16,087,034 | | |
| | 398,045 | | | Mercury General Corporation | | | 16,845,049 | | | | 15,818,308 | | |
| | 51,759 | | | Mastercard, Inc., Class 'A' | | | 10,626,144 | | | | 14,279,791 | | |
| | 116,750 | | | Visa, Inc., Class 'A' | | | 8,427,216 | | | | 9,120,510 | | |
| | | | | | | | 160,028,396 | | | | 194,279,624 | | |
See Notes to Financial Statements.
FIRST EAGLE FUNDS | SEMI-ANNUAL REPORT | APRIL 30, 2011
64
Schedule of Investments | Six-Month Period Ended April 30, 2011 (unaudited)
| NUMBER OF SHARES | | DESCRIPTION | | COST (NOTE 1) | | VALUE (NOTE 1) | |
| U.S. Common Stocks — 61.77% — (continued) | | | |
| Health Care 2.69% | | | |
| | 309,780 | | | WellPoint, Inc. | | $ | 14,454,331 | | | $ | 23,788,006 | | |
| | 296,570 | | | Johnson & Johnson | | | 17,865,833 | | | | 19,490,581 | | |
| | 79,310 | | | DENTSPLY International, Inc. | | | 1,696,098 | | | | 2,977,297 | | |
| | | | | | | | 34,016,262 | | | | 46,255,884 | | |
| Industrials 8.71% | | | |
| | 344,360 | | | 3M Company | | | 23,938,700 | | | | 33,475,236 | | |
| | 365,667 | | | Alliant Techsystems, Inc. | | | 30,163,088 | | | | 25,834,373 | | |
| | 320,795 | | | Lockheed Martin Corporation | | | 22,855,964 | | | | 25,423,004 | | |
| | 317,471 | | | Automatic Data Processing, Inc. | | | 11,701,372 | | | | 17,254,549 | | |
| | 375,535 | | | Rofin-Sinar Technologies, Inc. (a)(c) | | | 8,544,636 | | | | 16,264,421 | | |
| | 215,814 | | | Northrop Grumman Corporation | | | 13,242,093 | | | | 13,727,928 | | |
| | 771,165 | | | Blount International, Inc. (a) | | | 7,560,148 | | | | 12,801,339 | | |
| | 267,100 | | | Insteel Industries, Inc. | | | 2,988,830 | | | | 3,987,803 | | |
| | 16,939 | | | Huntington Ingalls Industries, Inc. (a) | | | 638,265 | | | | 677,560 | | |
| | | | | | | | 121,633,096 | | | | 149,446,213 | | |
| Information Technology 7.07% | | | |
| | 1,202,227 | | | Microsoft Corporation | | | 28,343,767 | | | | 31,281,946 | | |
| | 1,218,104 | | | Intel Corporation | | | 21,638,683 | | | | 28,247,832 | | |
| | 785,560 | | | Linear Technology Corporation | | | 20,156,649 | | | | 27,337,488 | | |
| | 449,730 | | | Texas Instruments, Inc. | | | 11,019,620 | | | | 15,978,907 | | |
| | 332,733 | | | KLA-Tencor Corporation (c) | | | 9,552,516 | | | | 14,606,979 | | |
| | 250,000 | | | Dell, Inc. (a)(c) | | | 2,921,969 | | | | 3,877,500 | | |
| | | | | | | | 93,633,204 | | | | 121,330,652 | | |
| Materials 7.40% | | | |
| | 521,812 | | | Newmont Mining Corporation | | | 24,247,219 | | | | 30,583,401 | | |
| | 963,365 | | | Weyerhaeuser Company | | | 14,976,807 | | | | 22,167,029 | | |
| | 414,372 | | | Vulcan Materials Company | | | 19,096,262 | | | | 18,729,615 | | |
| | 259,500 | | | Rayonier, Inc., REIT | | | 8,431,039 | | | | 17,220,420 | | |
| | 174,580 | | | Martin Marietta Materials, Inc. | | | 15,555,076 | | | | 15,919,950 | | |
| | 260,137 | | | Plum Creek Timber Company, Inc., REIT | | | 8,483,182 | | | | 11,209,303 | | |
| | 101,150 | | | Deltic Timber Corporation | | | 4,802,970 | | | | 6,857,970 | | |
| | 68,879 | | | Ashland, Inc. | | | 3,546,254 | | | | 4,276,008 | | |
| | | | | | | | 99,138,809 | | | | 126,963,696 | | |
| Telecommunication Services 2.03% | | | |
| | 1,987,129 | | | Cisco Systems, Inc. | | | 36,634,104 | | | | 34,893,985 | | |
See Notes to Financial Statements.
FIRST EAGLE FUNDS | SEMI-ANNUAL REPORT | APRIL 30, 2011
65
U.S. Value Fund
| NUMBER OF SHARES | | DESCRIPTION | | COST (NOTE 1) | | VALUE (NOTE 1) | |
| U.S. Common Stocks — 61.77% — (continued) | | | |
| Utilities 2.99% | | | |
| | 753,583 | | | FirstEnergy Corporation | | $ | 27,205,057 | | | $ | 30,113,177 | | |
| | 170,860 | | | Entergy Corporation | | | 11,303,420 | | | | 11,912,359 | | |
| | 236,150 | | | IDACorporation, Inc. | | | 7,470,208 | | | | 9,259,441 | | |
| | | | | | | | 45,978,685 | | | | 51,284,977 | | |
| Total U.S. Common Stocks | | | 846,072,683 | | | | 1,060,460,072 | | |
| International Common Stocks — 4.76% | | | |
| Canada 1.24% | | | |
| | 379,197 | | | Franco-Nevada Corporation | | | 7,074,309 | | | | 15,023,729 | | |
| | 244,199 | | | Penn West Petroleum Limited | | | 4,630,169 | | | | 6,253,937 | | |
| | | | | | | | 11,704,478 | | | | 21,277,666 | | |
| France 1.74% | | | |
| | 754,462 | | | Sanofi-Aventis SA, ADR | | | 28,866,657 | | | | 29,816,338 | | |
| United Kingdom 1.78% | | | |
| | 370,363 | | | Willis Group Holdings PLC | | | 9,103,778 | | | | 15,303,399 | | |
| | 496,990 | | | Amdocs Limited (a) | | | 11,894,360 | | | | 15,282,443 | | |
| | | | | | | | 20,998,138 | | | | 30,585,842 | | |
| Total International Common Stocks | | | 61,569,273 | | | | 81,679,846 | | |
| Total Common Stocks | | | 907,641,956 | | | | 1,142,139,918 | | |
| U.S. Preferred Stocks — 0.54% | | | |
| Consumer Staples 0.28% | | | |
| | 168,915 | | | Seneca Foods Corporation,
Series '2003' (a)(b)(d)(e) | | | 2,542,171
| | | | 4,722,863
| | |
| Utilities 0.26% | | | |
| | 88,100 | | | Calenergy Capital Trust III
6.50% (b)(f)(g) | | | 3,778,988
| | | | 4,444,645
| | |
| Total U.S. Preferred Stocks | | | 6,321,159 | | | | 9,167,508 | | |
| Investment Company — 0.58% | | | |
| | 292,960 | | | PowerShares DB Agriculture Fund, ETF (a) | | | 7,191,808 | | | | 9,978,218 | | |
| Warrant — 0.51% | | | |
| United States 0.51% | | | |
| | 526,579 | | | JPMorgan Chase & Co.
Warrant expire 10/28/18 (a) | | | 6,827,718
| | | | 8,741,211
| | |
See Notes to Financial Statements.
FIRST EAGLE FUNDS | SEMI-ANNUAL REPORT | APRIL 30, 2011
66
Schedule of Investments | Six-Month Period Ended April 30, 2011 (unaudited)
| OUNCES | | DESCRIPTION | | COST (NOTE 1) | | VALUE (NOTE 1) | |
| Commodity — 4.78% | | | |
| | 52,516 | | | Gold bullion (a) | | $ | 34,140,381 | | | $ | 82,038,104 | | |
| PRINCIPAL AMOUNT | | | | | | | |
| Bonds — 2.73% | | | |
| International Corporate Bond — 0.59% | | | |
| Canada 0.59% | | | |
| 10,000,000
USD | | | Catalyst Paper Corporation
11.00% due 12/15/16 (b)(h) | | | 8,734,413
| | | | 10,087,500
| | |
| U.S. Bonds — 2.14% | | | |
| Corporate Bonds 2.14% | | | |
| $ | 600,000 | | | Bausch & Lomb, Inc.
7.125% due 08/01/28 (b) | | | 516,609
| | | | 498,594
| | |
| | 5,975,000 | | | Mueller Water Products, Inc.
7.375% due 06/01/17 | | | 4,789,467
| | | | 5,960,063
| | |
| | 2,000,000 | | | Pulte Homes, Inc.
6.25% due 02/15/13 | | | 1,908,487
| | | | 2,092,500
| | |
| | 3,800,000 | | | Sanmina-SCI Corporation
6.75% due 03/01/13 | | | 3,582,439
| | | | 3,838,000
| | |
| | 2,000,000 | | | Sanmina-SCI Corporation
8.125% due 03/01/16 | | | 1,816,389
| | | | 2,095,000
| | |
| | 10,169,000 | | | Sealy Mattress Company
8.25% due 06/15/14 | | | 7,873,879
| | | | 10,245,267
| | |
| | 5,424,000 | | | Yankee Acquisition Corporation,
Series 'B' 8.50% due 02/15/15 | | | 5,486,372
| | | | 5,681,640
| | |
| | 5,877,000 | | | Yankee Acquisition Corporation,
Series 'B' 9.75% due 02/15/17 | | | 5,871,827
| | | | 6,303,083
| | |
| Total U.S. Bonds | | | 31,845,469 | | | | 36,714,147 | | |
| Total Bonds | | | 40,579,882 | | | | 46,801,647 | | |
| U.S. Treasury Bills — 6.58% | | | |
| | 15,000,000 | | | U.S. Treasury Bill
0.07% due 08/18/11 | | | 14,996,707
| | | | 14,997,885
| | |
| | 8,000,000 | | | U.S. Treasury Bill
0.10% due 10/20/11 | | | 7,996,093
| | | | 7,996,696
| | |
| | 15,000,000 | | | U.S. Treasury Bill
0.14% due 08/18/11 | | | 14,993,642
| | | | 14,997,885
| | |
| | 15,000,000 | | | U.S. Treasury Bill
0.14% due 09/15/11 | | | 14,992,294
| | | | 14,996,490
| | |
| | 15,000,000 | | | U.S. Treasury Bill
0.14% due 10/20/11 | | | 14,990,325
| | | | 14,993,805
| | |
See Notes to Financial Statements.
FIRST EAGLE FUNDS | SEMI-ANNUAL REPORT | APRIL 30, 2011
67
U.S. Value Fund
| PRINCIPAL AMOUNT | | DESCRIPTION | | COST (NOTE 1) | | VALUE (NOTE 1) | |
| U.S. Treasury Bills — 6.58% — (continued) | | | |
| $ | 15,000,000 | | | U.S. Treasury Bill
0.16% due 05/19/11 | | $ | 14,998,838
| | | $ | 14,998,838
| | |
| | 15,000,000 | | | U.S. Treasury Bill
0.18% due 06/23/11 | | | 14,996,025
| | | | 14,996,025
| | |
| | 15,000,000 | | | U.S. Treasury Bill
0.18% due 07/21/11 | | | 14,994,094
| | | | 14,999,430
| | |
| Total U.S. Treasury Bills | | | 112,958,018 | | | | 112,977,054 | | |
| Commercial Paper — 17.62% | | | |
| International Commercial Paper — 2.76% | | | |
| France 0.16% | | | |
| 2,745,000
USD | | | Sanofi-Aventis SA
0.33% due 10/13/11 | | | 2,740,974
| | | | 2,740,887
| | |
| Italy 0.70% | | | |
| 12,000,000
USD | | | Eni S.p.A.
0.35% due 06/20/11 | | | 11,994,333
| | | | 11,994,333
| | |
| Japan 1.28% | | | |
| 22,050,000
USD | | | Mitsui & Company, Limited
0.13% due 05/02/11 | | | 22,049,920
| | | | 22,049,920
| | |
| Switzerland 0.62% | | | |
| 10,650,000
USD | | | Nestlé SA
0.25% due 07/20/11 | | | 10,644,083
| | | | 10,646,604
| | |
| Total International Commercial Paper | | | 47,429,310 | | | | 47,431,744 | | |
| U.S. Commercial Paper — 14.86% | | | |
| $ | 16,000,000 | | | Abbott Laboratories
0.17% due 06/07/11 | | | 15,997,204
| | | | 15,997,204
| | |
| | 5,000,000 | | | Campbell Soup Company
0.23% due 07/27/11 | | | 4,997,221
| | | | 4,997,899
| | |
| | 10,000,000 | | | Campbell Soup Company
0.24% due 08/10/11 | | | 9,993,267
| | | | 9,995,022
| | |
| | 7,500,000 | | | Cisco Systems, Inc.
0.19% due 05/05/11 | | | 7,499,842
| | | | 7,499,842
| | |
| | 7,500,000 | | | Cisco Systems, Inc.
0.21% due 05/18/11 | | | 7,499,256
| | | | 7,499,256
| | |
| | 5,000,000 | | | Coca-Cola Company
0.19% due 07/19/11 | | | 4,997,915
| | | | 4,998,087
| | |
| | 3,342,000 | | | Coca-Cola Company
0.22% due 09/07/11 | | | 3,339,365
| | | | 3,339,592
| | |
| | 5,461,000 | | | Coca-Cola Company
0.25% due 07/01/11 | | | 5,458,687
| | | | 5,459,375
| | |
See Notes to Financial Statements.
FIRST EAGLE FUNDS | SEMI-ANNUAL REPORT | APRIL 30, 2011
68
Schedule of Investments | Six-Month Period Ended April 30, 2011 (unaudited)
| PRINCIPAL AMOUNT | | DESCRIPTION | | COST (NOTE 1) | | VALUE (NOTE 1) | |
| U.S. Commercial Paper — 14.86% — (continued) | | | |
| $ | 5,000,000 | | | Coca-Cola Company
0.25% due 07/13/11 | | $ | 4,997,465
| | | $ | 4,998,229
| | |
| | 11,730,000 | | | ConocoPhillips
0.22% due 05/09/11 | | | 11,729,427
| | | | 11,729,427
| | |
| | 5,000,000 | | | ConocoPhillips
0.22% due 07/07/11 | | | 4,997,953
| | | | 4,998,371
| | |
| | 5,000,000 | | | ConocoPhillips
0.25% due 07/07/11 | | | 4,997,674
| | | | 4,998,371
| | |
| | 5,000,000 | | | DuPont
0.31% due 06/30/11 | | | 4,997,417
| | | | 4,998,002
| | |
| | 14,581,000 | | | ITT Corporation
0.34% due 05/13/11 | | | 14,579,396
| | | | 14,579,396
| | |
| | 3,662,000 | | | Johnson & Johnson
0.16% due 07/25/11 | | | 3,660,617
| | | | 3,660,761
| | |
| | 3,000,000 | | | Johnson & Johnson
0.20% due 05/13/11 | | | 2,999,800
| | | | 2,999,800
| | |
| | 2,005,000 | | | Johnson & Johnson
0.20% due 09/06/11 | | | 2,003,574
| | | | 2,003,791
| | |
| | 12,000,000 | | | Johnson & Johnson
0.25% due 05/03/11 | | | 11,999,833
| | | | 11,999,833
| | |
| | 5,437,000 | | | Kraft Foods, Inc.
0.38% due 05/27/11 | | | 5,435,547
| | | | 5,435,547
| | |
| | 12,941,000 | | | Kraft Foods, Inc.
0.45% due 06/27/11 | | | 12,931,984
| | | | 12,931,984
| | |
| | 15,000,000 | | | Medtronic, Inc.
0.17% due 07/25/11 | | | 14,993,979
| | | | 14,991,771
| | |
| | 2,000,000 | | | Medtronic, Inc.
0.21% due 10/19/11 | | | 1,998,005
| | | | 1,996,819
| | |
| | 5,000,000 | | | PepsiCo, Inc.
0.17% due 06/06/11 | | | 4,999,150
| | | | 4,999,150
| | |
| | 10,000,000 | | | PepsiCo, Inc.
0.18% due 05/31/11 | | | 9,998,500
| | | | 9,998,500
| | |
| | 3,360,000 | | | Philip Morris International, Inc.
0.13% due 05/25/11 | | | 3,359,709
| | | | 3,359,709
| | |
| | 5,000,000 | | | Proctor & Gamble Company
0.18% due 05/31/11 | | | 4,999,250
| | | | 4,999,250
| | |
| | 7,500,000 | | | Proctor & Gamble Company
0.19% due 05/23/11 | | | 7,499,129
| | | | 7,499,129
| | |
| | 3,313,000 | | | Proctor & Gamble Company
0.19% due 05/24/11 | | | 3,312,598
| | | | 3,312,598
| | |
| | 10,000,000 | | | Sherwin-Williams Company
0.26% due 06/14/11 | | | 9,996,822
| | | | 9,996,822
| | |
See Notes to Financial Statements.
FIRST EAGLE FUNDS | SEMI-ANNUAL REPORT | APRIL 30, 2011
69
U.S. Value Fund
| PRINCIPAL AMOUNT | | DESCRIPTION | | COST (NOTE 1) | | VALUE (NOTE 1) | |
| U.S. Commercial Paper — 14.86% — (continued) | | | |
| $ | 6,000,000 | | | Sherwin-Williams Company
0.26% due 06/28/11 | | $ | 5,997,487
| | | $ | 5,997,487
| | |
| | 6,251,000 | | | Verizon Communications, Inc.
0.47% due 06/29/11 | | | 6,246,185
| | | | 6,247,318
| | |
| | 8,000,000 | | | Verizon Communications, Inc.
0.49% due 07/15/11 | | | 7,991,833
| | | | 7,994,062
| | |
| | 5,000,000 | | | Walt Disney Company
0.15% due 07/14/11 | | | 4,998,458
| | | | 4,997,995
| | |
| | 10,889,000 | | | WellPoint, Inc.
0.14% due 05/02/11 | | | 10,888,958
| | | | 10,888,958
| | |
| | 10,000,000 | | | WellPoint, Inc.
0.34% due 07/18/11 | | | 9,992,850
| | | | 9,993,556
| | |
| | 2,700,000 | | | WellPoint, Inc.
0.37% due 06/23/11 | | | 2,698,529
| | | | 2,698,529
| | |
| | Total U.S. Commercial Paper | | | | | | 255,084,886 | | | | 255,091,442 | | |
| | Total Commercial Paper | | | | | | 302,514,196 | | | | 302,523,186 | | |
| Total Investment Portfolio
Excluding Options Written — 99.87% | | | | | $ | 1,418,175,118 | | | $ | 1,714,366,846 | | |
| CONTRACTS | | | | STRIKE PRICE | | EXPIRATION DATE | | VALUE (NOTE 1) | |
| Covered Call Options Written — (0.03)% | | | |
| | 625 | | | Dell, Inc. | | $ | 15.00 | | | May 2011 | | $ | (50,000 | ) | |
| | 625 | | | Dell, Inc. | | | 16.00 | | | May 2011 | | | (18,750 | ) | |
| | 1,250 | | | Dell, Inc. | | | 16.00 | | | August 2011 | | | (96,250 | ) | |
| | 280 | | | KLA-Tencor Corporation | | | 46.00 | | | June 2011 | | | (37,800 | ) | |
| | 280 | | | KLA-Tencor Corporation | | | 46.00 | | | September 2011 | | | (65,800 | ) | |
| | 280 | | | KLA-Tencor Corporation | | | 47.00 | | | September 2011 | | | (60,200 | ) | |
| | 1,000 | | | Rofin-Sinar Technologies, Inc. | | | 45.00 | | | June 2011 | | | (120,000 | ) | |
| | Total Covered Call Options Written (Premiums Received: $522,648) | | | | | | | | | | | | | | (448,800 | ) | |
| | Total Investments — 99.84% (Cost: $1,417,652,470) | | | | | | | | | | | | | | | | 1,713,918,046 | | |
| | Other Assets in Excess of Liabilities — 0.16% | | | | | | | | | | 2,793,985 | | |
| | Net Assets — 100.00% | | | | | | | | | | | | | | | $ | 1,716,712,031 | | |
See Notes to Financial Statements.
FIRST EAGLE FUNDS | SEMI-ANNUAL REPORT | APRIL 30, 2011
70
Schedule of Investments | Six-Month Period Ended April 30, 2011 (unaudited)
(a) Non-income producing security/commodity.
(b) Security is deemed illiquid. At April 30, 2011, the value of these securities amounted to $19,757,148 or 1.15% of net assets.
(c) At April 30, 2011, all or a portion of this security was segregated to cover collateral requirement for options.
(d) This security is convertible until December 31, 2049.
(e) Securities valued in accordance with fair value procedures under the supervision of the Board of Trustees, representing $4,722,863 or 0.28% of net assets.
(f) This security is subject to a call feature and may be called in full or partially on or anytime after May 20, 2011.
(g) This security is convertible until September 1, 2027.
(h) All or a portion of the security is exempt from registration under the Securities Act of 1933. Rule 144A securities may only be sold to qualified institutional buyers, pursuant to Rule 144A under the Securities Act of 1933.
At April 30, 2011 cost is substantially identical for both book and federal income tax purposes. Net unrealized appreciation consisted of:
| Gross unrealized appreciation | | $ | 307,592,820 | | |
| Gross unrealized depreciation | | | (11,327,244 | ) | |
| Net unrealized appreciation | | $ | 296,265,576 | | |
Abbreviations used in this schedule include:
ADR — American Depository Receipt
ETF — Exchange Traded Fund
PLC — Public Limited Company
REIT — Real Estate Investment Trust
Currencies
USD — United States Dollar
| INDUSTRY DIVERSIFICATION FOR PORTFOLIO HOLDINGS | | PERCENT OF
NET ASSETS | |
| U.S. Common Stocks | |
| Consumer Discretionary | | | 10.27 | % | |
| Consumer Staples | | | 4.82 | | |
| Energy | | | 4.47 | | |
| Financials | | | 11.32 | | |
| Health Care | | | 2.69 | | |
| Industrials | | | 8.71 | | |
| Information Technology | | | 7.07 | | |
| Materials | | | 7.40 | | |
| Telecommunication Services | | | 2.03 | | |
| Utilities | | | 2.99 | | |
| Total U.S. Common Stocks | | | 61.77 | | |
See Notes to Financial Statements.
FIRST EAGLE FUNDS | SEMI-ANNUAL REPORT | APRIL 30, 2011
71
U.S. Value Fund
| INDUSTRY DIVERSIFICATION FOR PORTFOLIO HOLDINGS — (CONTINUED) | | PERCENT OF
NET ASSETS | |
| International Common Stocks | |
| Energy | | | 0.36 | % | |
| Financials | | | 0.89 | | |
| Health Care | | | 1.74 | | |
| Information Technology | | | 0.89 | | |
| Materials | | | 0.88 | | |
| Total International Common Stocks | | | 4.76 | | |
| U.S. Preferred Stocks | |
| Consumer Staples | | | 0.28 | | |
| Utilities | | | 0.26 | | |
| Total U.S. Preferred Stocks | | | 0.54 | | |
| Investment Company | | | 0.58 | | |
| Warrant | | | 0.51 | | |
| Commodity | | | 4.78 | | |
| U.S. Bonds | |
| Consumer Discretionary | | | 1.45 | | |
| Industrials | | | 0.35 | | |
| Information Technology | | | 0.34 | | |
| Total U.S. Bonds | | | 2.14 | | |
| International Bond | |
| Materials | | | 0.59 | | |
| Total International Bond | | | 0.59 | | |
| U.S. Treasury Bills | | | 6.58 | | |
See Notes to Financial Statements.
FIRST EAGLE FUNDS | SEMI-ANNUAL REPORT | APRIL 30, 2011
72
Schedule of Investments | Six-Month Period Ended April 30, 2011 (unaudited)
| INDUSTRY DIVERSIFICATION FOR PORTFOLIO HOLDINGS — (CONTINUED) | | PERCENT OF
NET ASSETS | |
| Commercial Paper | |
| International Commercial Paper | | | 2.76 | % | |
| U.S. Commercial Paper | | | 14.86 | | |
| Total Commercial Paper | | | 17.62 | | |
| Covered Call Options Written | | | (0.03) | | |
| Total Investments | | | 99.84 | % | |
See Notes to Financial Statements.
FIRST EAGLE FUNDS | SEMI-ANNUAL REPORT | APRIL 30, 2011
73

Fund Overview | Data as of April 30, 2011 (unaudited)
INVESTMENT OBJECTIVE
The First Eagle Gold Fund is a non-diversified fund whose investment objective is to provide exposure to the investment characteristics of gold and, to a limited extent, other precious metals. In seeking to achieve its objective, the Fund invests primarily in gold, gold related securities and issuers principally engaged in the gold industry.
| Average Annual Returns | |
| | | ONE-YEAR | | FIVE-YEARS | | TEN-YEARS | |
First Eagle Gold
Fund (A Shares) | |
| without sales charge | | | 31.82 | % | | | 14.73 | % | | | 26.48 | % | |
| with sales charge | | | 25.23 | | | | 13.56 | | | | 25.83 | | |
| FTSE Gold Mines Index | | | 19.97 | | | | 8.58 | | | | 18.19 | | |
| MSCI World Index | | | 18.25 | | | | 2.32 | | | | 3.90 | | |
| Consumer Price Index | | | 3.16 | | | | 2.22 | | | | 2.43 | | |
Asset Allocation
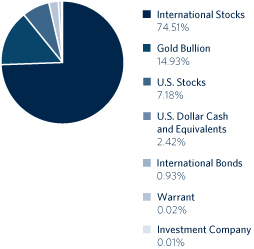
| Countries | |
| Canada | | | 41.08 | % | |
| United States | | | 22.12 | | |
| South Africa | | | 13.67 | | |
| Australia | | | 10.05 | | |
| Mexico | | | 5.56 | | |
| Africa | | | 3.43 | | |
| United Kingdom | | | 1.67 | | |
Asset Allocation and Countries percentages are based on total investments in the portfolio. The Fund's portfolio composition is subject to change at any time.
FIRST EAGLE FUNDS | SEMI-ANNUAL REPORT | APRIL 30, 2011
74
Gold Fund
Growth of a $10,000 Initial Investment
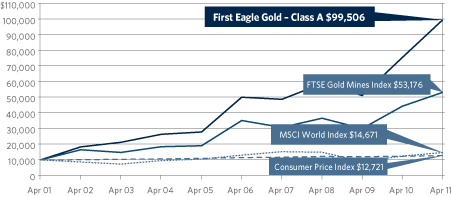
Performance data quoted herein represents past performance and should not be considered indicative of future results. Performance data quoted herein does not reflect the deduction of taxes that a shareholder would pay on Fund distributions or the sale of Fund shares. The average annual returns shown above are historical and reflect changes in share price, reinvested dividends and are net of expenses.
The average annual returns for Class A Shares with a sales charge give effect to the deduction of the maximum sales charge of 5.00%.
The MSCI World Index is a widely followed, unmanaged group of stocks from 23 international markets and is not available for purchase. The index provides total returns in U.S. dollars with net dividends reinvested. The FTSE Gold Mines Index is an unmanaged index composed of approximately 19 mining companies and is only available without dividends reinvested and is not available for purchase. The Consumer Price Index (CPI) represents the change in price of all goods and services purchased for consumption by urban households.
| Top 10 Holdings* | |
| Gold Bullion (United States) | | | 14.85 | % | |
| Newcrest Mining Limited (Australia) | | | 6.14 | | |
| Goldcorp, Inc. (Canada) | | | 5.92 | | |
| AngloGold Ashanti Limited, ADR (South Africa) | | | 5.04 | | |
| IAMGOLD Corporation (Canada) | | | 4.91 | | |
| Barrick Gold Corporation (Canada) | | | 4.30 | | |
| Harmony Gold Mining Company Limited, ADR (South Africa) | | | 3.96 | | |
| Newmont Mining Corporation (United States) | | | 3.96 | | |
| Kinross Gold Corporation (Canada) | | | 3.73 | | |
| Gold Fields Limited, ADR (South Africa) | | | 3.46 | | |
| Total | | | 56.27 | % | |
* Excludes cash, commercial paper and money market funds.
FIRST EAGLE FUNDS | SEMI-ANNUAL REPORT | APRIL 30, 2011
75
First Eagle Gold Fund
| NUMBER OF SHARES | | DESCRIPTION | | COST (NOTE 1) | | VALUE (NOTE 1) | |
| Common Stocks — 81.04% | | | |
| International Common Stocks — 73.90% | | | |
| Africa 3.41% | | | |
| | 1,405,836 | | | Randgold Resources Limited, ADR (a) | | $ | 35,887,547 | | | $ | 121,703,223 | | |
| Australia 10.00% | | | |
| | 4,818,953 | | | Newcrest Mining Limited | | | 146,512,280 | | | | 218,901,209 | | |
| | 10,790,230 | | | CGA Mining Limited (a)(b) | | | 21,440,352 | | | | 34,410,237 | | |
| | 2,943,481 | | | Kingsgate Consolidated Limited | | | 9,873,862 | | | | 25,031,904 | | |
| | 3,173,890 | | | Independence Group NL | | | 11,667,659 | | | | 23,339,166 | | |
| | 11,598,427 | | | Intrepid Mines Limited (a) | | | 18,806,320 | | | | 23,197,057 | | |
| | 2,613,520 | | | Medusa Mining Limited | | | 12,846,050 | | | | 22,999,178 | | |
| | 8,263,115 | | | St. Augustine Gold and Copper
Limited (a)(c) | | | 9,337,709
| | | | 8,725,570
| | |
| | | | | | | | 230,484,232 | | | | 356,604,321 | | |
| Canada 39.98% | | | |
| | 3,781,920 | | | Goldcorp, Inc. | | | 129,619,026 | | | | 211,144,594 | | |
| | 8,437,992 | | | IAMGOLD Corporation | | | 69,800,684 | | | | 175,264,311 | | |
| | 3,009,934 | | | Barrick Gold Corporation | | | 110,970,131 | | | | 153,536,733 | | |
| | 8,404,412 | | | Kinross Gold Corporation | | | 125,033,153 | | | | 133,125,886 | | |
| | 1,505,663 | | | Agnico-Eagle Mines Limited | | | 90,980,997 | | | | 104,808,136 | | |
| | 8,333,451 | | | New Gold, Inc. (a) | | | 18,188,041 | | | | 93,542,328 | | |
| | 2,051,140 | | | Detour Gold Corporation (a)(b) | | | 49,645,561 | | | | 69,266,586 | | |
| | 1,721,883 | | | Franco-Nevada Corporation | | | 36,820,248 | | | | 68,220,750 | | |
| | 8,351,290 | | | Gabriel Resources Limited (a) | | | 49,761,903 | | | | 63,670,870 | | |
| | 13,935,220 | | | Lake Shore Gold Corporation (a) | | | 48,172,940 | | | | 59,743,393 | | |
| | 4,679,200 | | | Alacer Gold Corporation (a)(b) | | | 19,514,511 | | | | 48,768,431 | | |
| | 3,207,400 | | | Osisko Mining Corporation (a)(b) | | | 25,178,940 | | | | 46,908,648 | | |
| | 2,651,590 | | | European Goldfields Limited (a) | | | 7,220,475 | | | | 36,847,861 | | |
| | 3,702,396 | | | Dundee Precious Metals, Inc. (a)(b) | | | 13,462,262 | | | | 35,811,983 | | |
| | 11,244,411 | | | Northgate Minerals Corporation (a) | | | 33,139,737 | | | | 33,958,121 | | |
| | 3,857,550 | | | Aurizon Mines Limited (a) | | | 5,296,594 | | | | 26,273,704 | | |
| | 4,138,370 | | | Orezone Gold Corporation (a)(b) | | | 15,713,538 | | | | 19,664,905 | | |
| | 1,872,803 | | | Guyana Goldfields, Inc. (a) | | | 16,698,724 | | | | 18,490,716 | | |
| | 722,000 | | | Eldorado Gold Corporation | | | 8,458,455 | | | | 13,425,998 | | |
| | 2,447,600 | | | Primero Mining Corporation (a)(b) | | | 12,683,195 | | | | 11,966,619 | | |
| | 552,000 | | | Eurasian Minerals, Inc. (a) | | | 1,623,583 | | | | 1,812,798 | | |
| | | | | | | | 887,982,698 | | | | 1,426,253,371 | | |
See Notes to Financial Statements.
FIRST EAGLE FUNDS | SEMI-ANNUAL REPORT | APRIL 30, 2011
76
Consolidated Schedule of Investments | Six-Month Period Ended April 30, 2011 (unaudited)
| NUMBER OF SHARES | | DESCRIPTION | | COST (NOTE 1) | | VALUE (NOTE 1) | |
| International Common Stocks — 73.90% — (continued) | | | |
| Mexico 5.53% | | | |
| | 4,197,841 | | | Fresnillo PLC | | $ | 16,620,435 | | | $ | 115,095,621 | | |
| | 2,109,555 | | | Industrias Peñoles S.A.B. de C.V. | | | 10,573,599 | | | | 82,129,148 | | |
| | | | | | | | 27,194,034 | | | | 197,224,769 | | |
| South Africa 13.32% | | | |
| | 3,526,279 | | | AngloGold Ashanti Limited, ADR | | | 128,078,396 | | | | 179,769,703 | | |
| | 9,080,083 | | | Harmony Gold Mining Company
Limited, ADR | | | 96,024,836
| | | | 141,376,892
| | |
| | 6,921,044 | | | Gold Fields Limited, ADR | | | 93,344,394 | | | | 123,471,425 | | |
| | 11,567,600 | | | Great Basin Gold Limited (a) | | | 15,774,951 | | | | 30,659,637 | | |
| | | | | | | | 333,222,577 | | | | 475,277,657 | | |
| United Kingdom 1.66% | | | |
| | 1,600,000 | | | Vallar PLC (a) | | | 24,085,667 | | | | 37,399,167 | | |
| | 416,864 | | | Anglo American PLC | | | 19,462,003 | | | | 21,734,158 | | |
| | | | | | | | 43,547,670 | | | | 59,133,325 | | |
| Total International Common Stocks | | | 1,558,318,758 | | | | 2,636,196,666 | | |
| U.S. Common Stocks — 7.14% | | | |
| Materials 7.14% | | | |
| | 2,412,617 | | | Newmont Mining Corporation | | | 106,060,099 | | | | 141,403,482 | | |
| | 1,371,501 | | | Royal Gold, Inc. | | | 31,907,515 | | | | 83,634,131 | | |
| | 1,302,590 | | | Tahoe Resources, Inc. (a)(b) | | | 17,461,621 | | | | 29,600,567 | | |
| Total U.S. Common Stocks | | | 155,429,235 | | | | 254,638,180 | | |
| Total Common Stocks | | | 1,713,747,993 | | | | 2,890,834,846 | | |
| Investment Company — 0.01% | | | |
| | 381,045 | | | State Street Institutional
U.S. Government Money Market
Fund, Institutional Class | | | 381,045
| | | | 381,045
| | |
| International Preferred Stocks — 0.19% | | | |
| South Africa 0.19% | | | |
| | 120,000 | | | AngloGold Ashanti Limited 6.00% (d) | | | 6,000,000 | | | | 6,768,000 | | |
| Warrant — 0.02% | | | |
| Canada 0.02% | | | |
| | 666,680 | | | Primero Mining Corporation
Warrants expire 07/15/20 (a)(b) | | | 558,606
| | | | 774,391
| | |
See Notes to Financial Statements.
FIRST EAGLE FUNDS | SEMI-ANNUAL REPORT | APRIL 30, 2011
77
Gold Fund
| OUNCES | | DESCRIPTION | | COST (NOTE 1) | | VALUE (NOTE 1) | |
| Commodity — 14.85% | | | |
| | 338,964 | | | Gold bullion (a) | | $ | 169,482,646 | | | $ | 529,513,273 | | |
| PRINCIPAL AMOUNT | | | | | | | |
| International Convertible Bonds — 0.92% | | | |
| Canada 0.84% | | | |
| 30,000,000
USD | | | Detour Gold Corporation
5.50% due 11/30/17 (e)(f) | | | 30,000,000
| | | | 30,000,000
| | |
| South Africa 0.08% | | | |
| 2,000,000
CAD | | | Great Basin Gold Limited
8.00% due 11/30/14 (b)(g) | | | 1,900,057
| | | | 2,903,907
| | |
| Total International Convertible Bonds | | | 31,900,057 | | | | 32,903,907 | | |
| Commercial Paper — 2.41% | | | |
| International Commercial Paper — 1.15% | | | |
| Japan 0.87% | | | |
| 30,933,000
USD | | | Mitsui & Company, Limited
0.13% due 05/02/11 | | | 30,932,888
| | | | 30,932,888
| | |
| United Kingdom 0.28% | | | |
| 10,000,000
USD | | | Reckitt Benckiser Group PLC
0.25% due 06/16/11 | | | 9,996,806
| | | | 9,996,806
| | |
| Total International Commercial Paper | | | 40,929,694 | | | | 40,929,694 | | |
| U.S. Commercial Paper — 1.26% | | | |
| $ | 10,000,000 | | | Cisco Systems, Inc.
0.21% due 05/18/11 | | | 9,999,008
| | | | 9,999,008
| | |
| | 25,000,000 | | | Kraft Foods, Inc.
0.38% due 05/16/11 | | | 24,996,042
| | | | 24,996,042
| | |
| | 10,000,000 | | | Proctor & Gamble Company
0.19% due 05/23/11 | | | 9,998,839
| | | | 9,998,839
| | |
| Total U.S. Commercial Paper | | | 44,993,889 | | | | 44,993,889 | | |
| Total Commercial Paper | | | 85,923,583 | | | | 85,923,583 | | |
| Total Investments — 99.44% | | $ | 2,007,993,930 | | | | 3,547,099,045 | | |
| Other Assets in Excess of Liabilities — 0.56% | | | | | 19,944,795 | | |
| Net Assets — 100.00% | | | | $ | 3,567,043,840 | | |
See Notes to Financial Statements.
FIRST EAGLE FUNDS | SEMI-ANNUAL REPORT | APRIL 30, 2011
78
Consolidated Schedule of Investments | Six-Month Period Ended April 30, 2011 (unaudited)
(a) Non-income producing security/commodity.
(b) All or a portion of the security is exempt from registration under the Securities Act of 1933. Rule 144A securities may only be sold to qualified institutional buyers, pursuant to Rule 144A under the Securities Act of 1933.
(c) Represents a security registered under Regulation D. Regulation D provides exemptions for small companies to offer and sell their securities without having to register the securities under the Securities Act of 1933.
(d) This security is convertible until September 15, 2013.
(e) This security is convertible until November 30, 2017.
(f) Securities valued in accordance with fair value procedures under the supervision of the Board of Trustees, representing $30,000,000 or 0.84% of net assets.
(g) This security is convertible until November 30, 2014.
At April 30, 2011, cost is substantially identical for both book and federal income tax purposes. Net unrealized appreciation consisted of:
| Gross unrealized appreciation | | $ | 1,540,433,830 | | |
| Gross unrealized depreciation | | | (1,328,715 | ) | |
| Net unrealized appreciation | | $ | 1,539,105,115 | | |
Abbreviations used in this schedule include:
ADR — American Depository Receipt
PLC — Public Limited Company
Currencies
CAD — Canadian Dollar
USD — United States Dollar
| INDUSTRY DIVERSIFICATION FOR PORTFOLIO HOLDINGS | | PERCENT OF
NET ASSETS | |
| International Common Stocks | |
| Materials | | | 73.90 | % | |
| Total International Common Stocks | | | 73.90 | | |
| U.S. Common Stocks | |
| Materials | | | 7.14 | | |
| Total U.S. Common Stocks | | | 7.14 | | |
| Investment Company | | | 0.01 | | |
| International Preferred Stocks | |
| Materials | | | 0.19 | | |
| Total International Preferred Stocks | | | 0.19 | | |
| Warrant | | | 0.02 | | |
See Notes to Financial Statements.
FIRST EAGLE FUNDS | SEMI-ANNUAL REPORT | APRIL 30, 2011
79
Gold Fund
| INDUSTRY DIVERSIFICATION FOR PORTFOLIO HOLDINGS — (CONTINUED) | | PERCENT OF
NET ASSETS | |
| Commodity | | | 14.85% | | |
| International Convertible Bonds | |
| Materials | | | 0.92 | | |
| Total International Convertible Bonds | | | 0.92 | | |
| Commercial Paper | |
| International Commercial Paper | | | 1.15 | | |
| U.S. Commercial Paper | | | 1.26 | | |
| Total Commercial Paper | | | 2.41 | | |
| Total Investments | | | 99.44 | % | |
See Notes to Financial Statements.
FIRST EAGLE FUNDS | SEMI-ANNUAL REPORT | APRIL 30, 2011
80
Management's Discussion of Fund Performance

Harold Levy
The value of the Fund's Class Y shares increased by 17.6% for the six month period compared to an increase of 16.4% for the S&P 500 index for the same period. The Fund's position in cash and cash equivalents increased from 6.04% to 7.54% from the end of October 2010 to April 30, 2011. Over the period, much went well for the companies we are invested in and fortunately little in the way of negative developments occurred. The five largest contributors to performance were Valeant Pharmaceuticals International, Inc., Eastman Chemical Company, Dresser-Rand Group, Inc., Devon Energy Corporation and Rockwood Holdings, Inc., collectively accounting for 10.9% of the Fund's performance. The Fund's only detractors for the period were AOL, Inc., Exterran Holdings, Inc. and Amgen, Inc., which accounted for -0.76% of Fund performance.
Much of what was written in the annual letter six months ago is still true today. The Federal Reserve continues its accommodative monetary policy attempting to drive inflation higher and the value of the dollar lower. They have been very successful in achieving the latter as measured by currency and commodities prices and, to some extent, stock prices. (A portion of the gains we have experienced in equities reflects a lower dollar value.) Our concern is that the Fed will be equally successful in achieving inflation as well. Specifically, the question is how successful and over what period of time. A little inflation would likely prove beneficial for equities; however, a high degree of inflation would curtail consumer demand and result in negative consequences for equity values.
Federal deficits continue to be huge and intractable, although at least they have become a topic of conversation among government officials. Whether serious policy changes occur as a result of these conversations is certainly speculation at this point.
We continue to focus on finding suitable investment opportunities regardless of macroeconomic uncertainties. Despite the significant price improvements of the last six months we still find our portfolio holdings compelling from a valuation perspective. In general, our companies are strong financially, continue to
FIRST EAGLE FUNDS | SEMI-ANNUAL REPORT | APRIL 30, 2011
81
Management's Discussion of Fund Performance (continued)
generate free cash flows and are making investments to grow their value over time. In addition, the recent uptick in merger and acquisition activity should be beneficial for equities in general and our portfolio in particular.
We remain dedicated to doing what we have always done — managing your money in a prudent manner and seeking to maintain and grow your purchasing power over time, while remaining cognizant of all the risks investors face in today's world.
We thank you for your continued confidence.

Harold Levy
Portfolio Manager
June 2011
FIRST EAGLE FUNDS | SEMI-ANNUAL REPORT | APRIL 30, 2011
82
First Eagle Fund of America
The performance data quoted herein represents past performance and does not guarantee future results. Market volatility can dramatically impact the fund's short-term performance. Current performance may be lower or higher than figures shown. The investment return and principal value will fluctuate so that an investor's shares, when redeemed, may be worth more or less than their original cost. Past performance data through the most recent month end is available at firsteaglefunds.com or by calling 800.334.2143. As of September 1, 2005, Class Y Shares are closed to new accounts. Class Y shares are offered without sales charge. The portfolio is actively managed and holdings can change at any time. Current and future portfolio holdings are subject to risk.
The event-driven investment style used by First Eagle Fund of America carries the additional risk that the event anticipated occurs later than expected, does not occur at all or does not have the desired effect on the market price of the securities. Selling covered call options generates fee income ("premiums") from parties buying the options. When the security underlying a covered call option appreciates in value sufficiently, the Fund may be required to deliver securities or cash to the buyer of the option. Results from options trading are further described in the financial statements that follow this commentary. Investment in gold and gold related investments present certain risks, and returns on gold related investments have traditionally been more volatile than investments in broader equity or debt markets.
Standard & Poor's 500 Index is a widely recognized unmanaged index including a representative sample of 500 leading companies in leading sectors of the U.S. economy and is not available for purchase. Although the Standard & Poor's 500 Index focuses on the large-cap segment of the market, with approximately 75% coverage of U.S. equities, it is also considered a proxy for the total market. The Standard & Poor's 500 Index includes dividends reinvested.
The commentary represents the opinion of Harold Levy as of June 2011 and is subject to change based on market and other conditions. The opinions expressed are not necessarily those of the firm. These materials are provided for informational purpose only. These opinions are not intended to be a forecast of future events, a guarantee of future results, or investment advice. Any statistics contained herein have been obtained from sources believed to be reliable, but the accuracy of this information cannot be guaranteed. The views expressed herein may change at any time subsequent to the date of issue hereof. The information provided is not to be construed as a recommendation or an offer to buy or sell or the solicitation of an offer to buy or sell any fund or security.
FIRST EAGLE FUNDS | SEMI-ANNUAL REPORT | APRIL 30, 2011
83

Fund Overview | Data as of April 30, 2011 (unaudited)
INVESTMENT OBJECTIVE
The First Eagle Fund of America is a non-diversified U.S. equity fund that seeks long-term capital appreciation by investing primarily in U.S. stocks and to a lesser extent in debt and foreign equity securities. The Fund has a unique event-driven bias that focuses on identifying companies poised to benefit from change that the market has not yet recognized.
| Average Annual Returns | |
| | | ONE-YEAR | | FIVE-YEARS | | TEN-YEARS | |
First Eagle
Fund of America
(Y Shares) | | | 25.44 | % | | | 7.50 | % | | | 8.29 | % | |
Standard & Poor's
500 Index | | | 17.22 | | | | 2.95 | | | | 2.82 | | |
Asset Allocation

| Sector/Industry* | |
| Materials | | | 23.59 | % | |
| Health Care | | | 22.31 | | |
| Energy | | | 12.80 | | |
| Industrials | | | 12.69 | | |
| Information Technology | | | 11.76 | | |
| Consumer Discretionary | | | 6.82 | | |
| Exchange Traded Fund | | | 4.23 | | |
| Consumer Staples | | | 1.02 | | |
Telecommunication
Services | | | 0.51 | | |
| Rights | | | 0.27 | | |
* percentages exclude option positions
Asset Allocation and Sector/Industry percentages are based on total investments in the portfolio. The Fund's portfolio composition is subject to change at any time.
FIRST EAGLE FUNDS | SEMI-ANNUAL REPORT | APRIL 30, 2011
84
Fund of America
Growth of a $10,000 Initial Investment
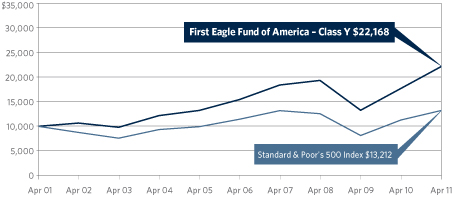
* Excludes cash, commercial paper and money market funds.
Performance data quoted herein represents past performance and should not be considered indicative of future results. Performance data quoted herein does not reflect the deduction of taxes that a shareholder would pay on Fund distributions or the sale of Fund shares.
The Fund's average annual returns shown above are historical and reflect changes in share price, reinvested dividends and is net of expenses. Class Y shares are offered without a sales charge.
The Standard & Poor's 500 Index is a widely recognized unmanaged index including a representative sample of 500 leading companies in leading sectors of the U.S. economy and is not available for purchase. Although the Standard & Poor's 500 Index focuses on the large-cap segment of the market, with approximately 75% coverage of U.S. equities, it is also considered a proxy for the total market. The Standard & Poor's 500 Index includes dividends reinvested.
| Top 10 Holdings* | |
| Eastman Chemical Company (chemicals company) | | | 5.89 | % | |
| Valeant Pharmaceuticals International (pharmaceuticals company) | | | 5.07 | | |
| Baxter International, Inc. (health technology company) | | | 5.00 | | |
| SPDR Gold Trust (exchange traded fund) | | | 4.23 | | |
| Devon Energy Corporation (energy company) | | | 4.17 | | |
| Rockwood Holdings, Inc. (inorganic chemicals company) | | | 4.16 | | |
| Computer Sciences Corporation (information technology company) | | | 4.11 | | |
| General Dynamics Corporation (aerospace and defense manufacturer) | | | 4.08 | | |
| Ball Corporation (containers and packaging manufacturer) | | | 3.66 | | |
| TE Connectivity Limited (electronics company) | | | 3.37 | | |
| Total | | | 43.74 | % | |
FIRST EAGLE FUNDS | SEMI-ANNUAL REPORT | APRIL 30, 2011
85
First Eagle Fund of America
| NUMBER OF SHARES | | DESCRIPTION | | COST (NOTE 1) | | VALUE (NOTE 1) | |
| Common Stocks — 91.23% | | | |
| U.S. Common Stocks — 82.55% | | | |
| Consumer Discretionary 6.83% | | | |
| | 132,100 | | | AutoZone, Inc. (a)(b) | | $ | 23,380,272 | | | $ | 37,302,398 | | |
| | 804,900 | | | Wyndham Worldwide Corporation (b) | | | 24,397,211 | | | | 27,857,589 | | |
| | 217,100 | | | Sherwin-Williams Company (b) | | | 12,560,771 | | | | 17,865,159 | | |
| | 378,400 | | | Tenneco, Inc. (a)(b) | | | 15,753,015 | | | | 17,485,864 | | |
| | | | | | | | 76,091,269 | | | | 100,511,010 | | |
| Consumer Staples 1.02% | | | |
| | 779,240 | | | Sara Lee Corporation (b) | | | 12,164,373 | | | | 14,961,408 | | |
| Energy 10.84% | | | |
| | 675,200 | | | Devon Energy Corporation (b) | | | 49,881,484 | | | | 61,443,200 | | |
| | 1,133,200 | | | Arch Coal, Inc. (b) | | | 37,449,563 | | | | 38,868,760 | | |
| | 1,289,550 | | | Covanta Holding Corporation (b) | | | 22,101,824 | | | | 22,141,573 | | |
| | 409,090 | | | Dresser-Rand Group, Inc. (a)(b) | | | 9,432,228 | | | | 21,493,589 | | |
| | 722,000 | | | Exterran Holdings, Inc. (a)(b) | | | 18,866,961 | | | | 15,674,620 | | |
| | | | | | | | 137,732,060 | | | | 159,621,742 | | |
| Health Care 21.99% | | | |
| | 1,417,032 | | | Valeant Pharmaceuticals
International (b) | | | 18,065,700 | | | | 74,578,394 | | |
| | 1,292,700 | | | Baxter International, Inc. (b) | | | 67,055,362 | | | | 73,554,630 | | |
| | 1,382,500 | | | Omnicare, Inc. (b) | | | 34,508,310 | | | | 43,438,150 | | |
| | 1,265,300 | | | Health Net, Inc. (a)(b) | | | 31,889,842 | | | | 42,134,490 | | |
| | 1,388,100 | | | Pfizer, Inc. (b) | | | 28,277,373 | | | | 29,094,576 | | |
| | 462,010 | | | Amgen, Inc. (a)(b) | | | 24,483,635 | | | | 26,265,268 | | |
| | 1,213,387 | | | Enzon Pharmaceuticals, Inc. (a) | | | 10,244,912 | | | | 13,929,683 | | |
| | 1,466,860 | | | Celera Corporation (a) | | | 10,223,009 | | | | 11,602,863 | | |
| | 326,710 | | | Theravance, Inc. (a) | | | 6,029,780 | | | | 9,066,203 | | |
| | | | | | | | 230,777,923 | | | | 323,664,257 | | |
| Industrials 9.35% | | | |
| | 824,590 | | | General Dynamics Corporation (b) | | | 50,557,056 | | | | 60,046,644 | | |
| | 254,500 | | | Precision Castparts Corporation (b) | | | 22,526,586 | | | | 39,325,340 | | |
| | 567,700 | | | Owens Corning, Inc. (a)(b) | | | 12,635,848 | | | | 21,481,768 | | |
| | 137,340 | | | Rockwell Collins, Inc. (b) | | | 6,443,126 | | | | 8,666,154 | | |
| | 167,900 | | | Raytheon Company | | | 8,322,041 | | | | 8,151,545 | | |
| | | | | | | | 100,484,657 | | | | 137,671,451 | | |
See Notes to Financial Statements.
FIRST EAGLE FUNDS | SEMI-ANNUAL REPORT | APRIL 30, 2011
86
Schedule of Investments | Six-Month Period Ended April 30, 2011 (unaudited)
| NUMBER OF SHARES | | DESCRIPTION | | COST (NOTE 1) | | VALUE (NOTE 1) | |
| U.S. Common Stocks — 82.55% — (continued) | | | |
| Information Technology 8.40% | | | |
| | 1,187,210 | | | Computer Sciences Corporation (b) | | $ | 57,690,600 | | | $ | 60,523,966 | | |
| | 3,040,826 | | | LSI Corporation (a)(b) | | | 17,264,659 | | | | 22,289,254 | | |
| | 927,440 | | | AOL, Inc. (a) | | | 22,671,976 | | | | 18,901,227 | | |
| | 768,110 | | | Seagate Technology (b) | | | 12,447,092 | | | | 13,534,098 | | |
| | 269,160 | | | Nvidia Corporation (a)(b) | | | 3,721,032 | | | | 5,383,200 | | |
| | 192,160 | | | Atmel Corporation (a) | | | 932,094 | | | | 2,940,048 | | |
| | | | | | | | 114,727,453 | | | | 123,571,793 | | |
| Materials 23.61% | | | |
| | 808,000 | | | Eastman Chemical Company (b) | | | 48,997,918 | | | | 86,658,000 | | |
| | 1,080,370 | | | Rockwood Holdings, Inc. (a)(b) | | | 44,703,832 | | | | 61,300,194 | | |
| | 1,442,560 | | | Ball Corporation (b) | | | 31,136,230 | | | | 53,821,913 | | |
| | 1,152,070 | | | Crown Holdings, Inc. (a)(b) | | | 23,372,817 | | | | 43,087,418 | | |
| | 1,452,700 | | | Packaging Corporation of America (b) | | | 33,843,716 | | | | 41,445,531 | | |
| | 302,830 | | | Praxair, Inc. (b) | | | 22,540,957 | | | | 32,227,169 | | |
| | 736,770 | | | Valspar Corporation (b) | | | 15,562,118 | | | | 28,962,429 | | |
| | | | | | | | 220,157,588 | | | | 347,502,654 | | |
| Telecommunication Services 0.51% | | | |
| | 506,960 | | | Leap Wireless International, Inc. (a) | | | 17,067,583 | | | | 7,523,286 | | |
| Total U.S. Common Stocks | | | 909,202,906 | | | | 1,215,027,601 | | |
| International Common Stocks — 8.68% | | | |
| Bahamas 1.96% | | | |
| | 850,790 | | | Teekay Corporation (b) | | | 30,625,904 | | | | 28,918,352 | | |
| Ireland 1.18% | | | |
| | 344,200 | | | Ingersoll-Rand PLC (b) | | | 13,513,788 | | | | 17,382,100 | | |
| Switzerland 5.54% | | | |
| | 1,383,990 | | | TE Connectivity Limited (b) | | | 42,114,503 | | | | 49,616,041 | | |
| | 654,900 | | | Tyco International Limited (b) | | | 30,037,316 | | | | 31,919,826 | | |
| | | | | | | | 72,151,819 | | | | 81,535,867 | | |
| Total International Common Stocks | | | 116,291,511 | | | | 127,836,319 | | |
| Total Common Stocks | | | 1,025,494,417 | | | | 1,342,863,920 | | |
| Exchange Traded Fund — 4.23% | | | |
| | 408,600 | | | SPDR Gold Trust (a)(b) | | | 41,000,137 | | | | 62,254,296 | | |
See Notes to Financial Statements.
FIRST EAGLE FUNDS | SEMI-ANNUAL REPORT | APRIL 30, 2011
87
Fund of America
| NUMBER OF SHARES | | DESCRIPTION | | COST (NOTE 1) | | VALUE (NOTE 1) | |
| Investment Company — 7.55% | | | |
| | 111,101,932 | | | State Street Institutional U.S. | | $ | 111,101,932 | | | $ | 111,101,932 | | |
| | | | | Government Money Market Fund, | | | | | |
| |
| | | | | Institutional Class | | | | | | | | | |
| Rights — 0.27% | | | |
| France 0.27% | | | |
| | 1,610,183 | | | Sanofi-Aventis SA
Right expire 12/31/20 (a) | | | 4,099,062
| | | | 3,993,254
| | |
| PRINCIPAL AMOUNT | | | | | |
| Bond — 0.34% | | | |
| U.S. Convertible Bond 0.34% | | | |
| $ | 3,730,000 | | | Omnicare, Inc.
3.75% due 12/15/25 (c) | | | 3,730,000
| | | | 4,988,875
| | |
| CONTRACTS | | | | STRIKE PRICE | | EXPIRATION DATE | | VALUE (NOTE 1) | |
| Purchased Options — 0.19% | | | |
| | 2,799 | | | Seagate Technology | | $ | 12.50 | | | January 2012 | | $ | 1,519,857 | | |
| | 2,869 | | | Seagate Technology | | | 13.00 | | | June 2011 | | | 1,319,740 | | |
| | Total Purchased Options (Cost: $1,806,590) | | | | | | | | | | 2,839,597 | | |
| Total Investment Portfolio
Excluding Options Written — 103.81% (Cost: $1,187,232,138) | | | | | | | | | $ | 1,528,041,874 | | |
| Covered Call Options Written — (3.73)% | | | |
| | 323 | | | Amgen, Inc. | | $ | 55.00 | | | May 2011 | | $ | (66,538 | ) | |
| | 343 | | | Amgen, Inc. | | | 55.00 | | | July 2011 | | | (102,900 | ) | |
| | 300 | | | Arch Coal, Inc. | | | 33.00 | | | July 2011 | | | (79,500 | ) | |
| | 1,700 | | | Arch Coal, Inc. | | | 35.00 | | | July 2011 | | | (290,700 | ) | |
| | 580 | | | Arch Coal, Inc. | | | 36.00 | | | July 2011 | | | (75,400 | ) | |
| | 270 | | | Arch Coal, Inc. | | | 37.00 | | | July 2011 | | | (27,000 | ) | |
| | 3,546 | | | Arch Coal, Inc. | | | 38.00 | | | July 2011 | | | (308,502 | ) | |
| | 637 | | | AutoZone, Inc. | | | 230.00 | | | June 2011 | | | (3,385,655 | ) | |
| | 119 | | | AutoZone, Inc. | | | 270.00 | | | June 2011 | | | (196,350 | ) | |
| | 719 | | | Ball Corporation | | | 35.00 | | | May 2011 | | | (172,560 | ) | |
| | 1,120 | | | Ball Corporation | | | 37.50 | | | August 2011 | | | (190,400 | ) | |
| | 670 | | | Baxter International, Inc. | | | 50.00 | | | May 2011 | | | (482,400 | ) | |
| | 1,628 | | | Baxter International, Inc. | | | 52.50 | | | May 2011 | | | (739,112 | ) | |
See Notes to Financial Statements.
FIRST EAGLE FUNDS | SEMI-ANNUAL REPORT | APRIL 30, 2011
88
Schedule of Investments | Six-Month Period Ended April 30, 2011 (unaudited)
| CONTRACTS | | DESCRIPTION | | STRIKE PRICE | | EXPIRATION DATE | | VALUE (NOTE 1) | |
| Covered Call Options Written — (3.73)% — (continued) | | | |
| | 232 | | | Baxter International, Inc. | | $ | 55.00 | | | August 2011 | | $ | (84,448 | ) | |
| | 387 | | | Baxter International, Inc. | | | 57.50 | | | August 2011 | | | (87,849 | ) | |
| | 819 | | | Computer Sciences Corporation | | | 47.50 | | | June 2011 | | | (343,980 | ) | |
| | 2,068 | | | Computer Sciences Corporation | | | 50.00 | | | June 2011 | | | (537,680 | ) | |
| | 81 | | | Computer Sciences Corporation | | | 52.50 | | | May 2011 | | | (8,100 | ) | |
| | 8,843 | | | Covanta Holding Corporation | | | 17.50 | | | June 2011 | | | (309,505 | ) | |
| | 1,631 | | | Crown Holdings, Inc. | | | 33.00 | | | May 2011 | | | (717,640 | ) | |
| | 197 | | | Crown Holdings, Inc. | | | 37.00 | | | July 2011 | | | (33,490 | ) | |
| | 1,026 | | | Crown Holdings, Inc. | | | 38.00 | | | July 2011 | | | (117,990 | ) | |
| | 160 | | | Devon Energy Corporation | | | 90.00 | | | June 2011 | | | (62,880 | ) | |
| | 2,324 | | | Devon Energy Corporation | | | 90.00 | | | July 2011 | | | (1,050,448 | ) | |
| | 107 | | | Devon Energy Corporation | | | 95.00 | | | June 2011 | | | (17,120 | ) | |
| | 511 | | | Devon Energy Corporation | | | 95.00 | | | July 2011 | | | (118,552 | ) | |
| | 210 | | | Dresser-Rand Group, Inc. | | | 50.00 | | | May 2011 | | | (63,000 | ) | |
| | 970 | | | Dresser-Rand Group, Inc. | | | 50.00 | | | June 2011 | | | (400,610 | ) | |
| | 406 | | | Dresser-Rand Group, Inc. | | | 55.00 | | | May 2011 | | | (30,450 | ) | |
| | 697 | | | Dresser-Rand Group, Inc. | | | 55.00 | | | June 2011 | | | (94,095 | ) | |
| | 1,431 | | | Eastman Chemical Company | | | 90.00 | | | June 2011 | | | (2,718,900 | ) | |
| | 70 | | | Eastman Chemical Company | | | 95.00 | | | May 2011 | | | (96,600 | ) | |
| | 2,637 | | | Eastman Chemical Company | | | 95.00 | | | June 2011 | | | (3,652,245 | ) | |
| | 144 | | | Exterran Holdings, Inc. | | | 25.00 | | | August 2011 | | | (8,280 | ) | |
| | 1,177 | | | General Dynamics Corporation | | | 70.00 | | | May 2011 | | | (388,410 | ) | |
| | 280 | | | General Dynamics Corporation | | | 72.50 | | | June 2011 | | | (61,600 | ) | |
| | 902 | | | General Dynamics Corporation | | | 75.00 | | | August 2011 | | | (207,460 | ) | |
| | 166 | | | General Dynamics Corporation | | | 80.00 | | | May 2011 | | | (664 | ) | |
| | 2,838 | | | Health Net, Inc. | | | 30.00 | | | July 2011 | | | (1,121,010 | ) | |
| | 2,497 | | | Health Net, Inc. | | | 32.50 | | | July 2011 | | | (543,098 | ) | |
| | 847 | | | Ingersoll-Rand PLC | | | 47.00 | | | June 2011 | | | (351,505 | ) | |
| | 7,650 | | | LSI Corporation | | | 6.00 | | | July 2011 | | | (1,090,125 | ) | |
| | 1,008 | | | LSI Corporation | | | 7.00 | | | July 2011 | | | (67,536 | ) | |
| | 673 | | | Nvidia Corporation | | | 18.00 | | | May 2011 | | | (155,463 | ) | |
| | 1,346 | | | Nvidia Corporation | | | 19.00 | | | May 2011 | | | (219,398 | ) | |
| | 672 | | | Nvidia Corporation | | | 20.00 | | | May 2011 | | | (68,544 | ) | |
| | 232 | | | Omnicare, Inc. | | | 30.00 | | | May 2011 | | | (42,340 | ) | |
| | 6,341 | | | Omnicare, Inc. | | | 30.00 | | | June 2011 | | | (1,521,840 | ) | |
| | 991 | | | Omnicare, Inc. | | | 32.00 | | | June 2011 | | | (96,606 | ) | |
| | 789 | | | Owens Corning, Inc. | | | 36.00 | | | May 2011 | | | (177,525 | ) | |
See Notes to Financial Statements.
FIRST EAGLE FUNDS | SEMI-ANNUAL REPORT | APRIL 30, 2011
89
Fund of America
| CONTRACTS | | DESCRIPTION | | STRIKE PRICE | | EXPIRATION DATE | | VALUE (NOTE 1) | |
| Covered Call Options Written — (3.73)% — (continued) | | | |
| | 1,643 | | | Owens Corning, Inc. | | $ | 37.00 | | | May 2011 | | $ | (230,020 | ) | |
| | 567 | | | Owens Corning, Inc. | | | 37.00 | | | June 2011 | | | (111,982 | ) | |
| | 394 | | | Owens Corning, Inc. | | | 38.00 | | | May 2011 | | | (35,460 | ) | |
| | 1,148 | | | Owens Corning, Inc. | | | 38.00 | | | June 2011 | | | (154,980 | ) | |
| | 1,136 | | | Owens Corning, Inc. | | | 39.00 | | | June 2011 | | | (107,920 | ) | |
| | 3,402 | | | Packaging Corporation of America | | | 30.00 | | | July 2011 | | | (204,120 | ) | |
| | 906 | | | Pfizer, Inc. | | | 20.00 | | | June 2011 | | | (108,720 | ) | |
| | 1,695 | | | Pfizer, Inc. | | | 21.00 | | | May 2011 | | | (66,105 | ) | |
| | 6,819 | | | Pfizer, Inc. | | | 21.00 | | | June 2011 | | | (381,864 | ) | |
| | 1,106 | | | Pfizer, Inc. | | | 21.00 | | | July 2011 | | | (69,661 | ) | |
| | 424 | | | Praxair, Inc. | | | 90.00 | | | May 2011 | | | (697,480 | ) | |
| | 846 | | | Praxair, Inc. | | | 95.00 | | | May 2011 | | | (972,900 | ) | |
| | 521 | | | Praxair, Inc. | | | 95.00 | | | July 2011 | | | (622,595 | ) | |
| | 1,647 | | | Precision Castparts Corporation | | | 140.00 | | | June 2011 | | | (2,536,380 | ) | |
| | 601 | | | Precision Castparts Corporation | | | 150.00 | | | May 2011 | | | (396,660 | ) | |
| | 297 | | | Precision Castparts Corporation | | | 150.00 | | | June 2011 | | | (247,995 | ) | |
| | 201 | | | Rockwell Collins, Inc. | | | 65.00 | | | May 2011 | | | (5,025 | ) | |
| | 4,374 | | | Rockwood Holdings, Inc. | | | 40.00 | | | May 2011 | | | (6,604,740 | ) | |
| | 1,443 | | | Rockwood Holdings, Inc. | | | 45.00 | | | May 2011 | | | (1,702,740 | ) | |
| | 3,222 | | | Rockwood Holdings, Inc. | | | 50.00 | | | May 2011 | | | (2,190,960 | ) | |
| | 1,109 | | | Rockwood Holdings, Inc. | | | 50.00 | | | August 2011 | | | (930,451 | ) | |
| | 519 | | | Rockwood Holdings, Inc. | | | 55.00 | | | August 2011 | | | (246,525 | ) | |
| | 1,264 | | | Sara Lee Corporation | | | 17.00 | | | July 2011 | | | (303,360 | ) | |
| | 94 | | | Seagate Technology | | | 17.00 | | | June 2011 | | | (11,513 | ) | |
| | 1,878 | | | Seagate Technology | | | 18.00 | | | June 2011 | | | (137,094 | ) | |
| | 255 | | | Sherwin-Williams Company | | | 80.00 | | | June 2011 | | | (91,800 | ) | |
| | 927 | | | Sherwin-Williams Company | | | 85.00 | | | May 2011 | | | (40,788 | ) | |
| | 989 | | | Sherwin-Williams Company | | | 85.00 | | | June 2011 | | | (108,790 | ) | |
| | 207 | | | SPDR Gold Trust | | | 138.00 | | | May 2011 | | | (294,975 | ) | |
| | 100 | | | SPDR Gold Trust | | | 140.00 | | | May 2011 | | | (124,500 | ) | |
| | 225 | | | SPDR Gold Trust | | | 144.00 | | | June 2011 | | | (209,475 | ) | |
| | 100 | | | SPDR Gold Trust | | | 148.00 | | | June 2011 | | | (66,000 | ) | |
| | 3,189 | | | TE Connectivity Limited | | | 35.00 | | | May 2011 | | | (398,625 | ) | |
| | 561 | | | TE Connectivity Limited | | | 35.00 | | | June 2011 | | | (95,370 | ) | |
| | 1,157 | | | TE Connectivity Limited | | | 35.00 | | | July 2011 | | | (237,185 | ) | |
| | 2,113 | | | TE Connectivity Limited | | | 40.00 | | | July 2011 | | | (52,825 | ) | |
| | 5,293 | | | Teekay Corporation | | | 35.00 | | | July 2011 | | | (635,160 | ) | |
See Notes to Financial Statements.
FIRST EAGLE FUNDS | SEMI-ANNUAL REPORT | APRIL 30, 2011
90
Schedule of Investments | Six-Month Period Ended April 30, 2011 (unaudited)
| CONTRACTS | | DESCRIPTION | | STRIKE PRICE | | EXPIRATION DATE | | VALUE (NOTE 1) | |
| Covered Call Options Written — (3.73)% — (continued) | | | |
| | 731 | | | Tenneco, Inc. | | $ | 41.00 | | | May 2011 | | $ | (380,120 | ) | |
| | 481 | | | Tenneco, Inc. | | | 42.00 | | | May 2011 | | | (203,944 | ) | |
| | 1,136 | | | Tenneco, Inc. | | | 43.00 | | | May 2011 | | | (374,880 | ) | |
| | 347 | | | Tenneco, Inc. | | | 43.00 | | | June 2011 | | | (157,885 | ) | |
| | 1,562 | | | Tyco International Limited | | | 46.00 | | | July 2011 | | | (613,085 | ) | |
| | 2,241 | | | Tyco International Limited | | | 47.00 | | | July 2011 | | | (750,735 | ) | |
| | 900 | | | Tyco International Limited | | | 48.00 | | | July 2011 | | | (238,500 | ) | |
| | 481 | | | Tyco International Limited | | | 49.00 | | | July 2011 | | | (101,242 | ) | |
| | 810 | | | Tyco International Limited | | | 50.00 | | | June 2011 | | | (97,200 | ) | |
| | 555 | | | Tyco International Limited | | | 50.00 | | | July 2011 | | | (101,010 | ) | |
| | 3,491 | | | Valeant Pharmaceuticals International | | | 40.00 | | | July 2011 | | | (4,520,845 | ) | |
| | 597 | | | Valeant Pharmaceuticals International | | | 44.00 | | | July 2011 | | | (573,120 | ) | |
| | 1,013 | | | Valeant Pharmaceuticals International | | | 55.00 | | | May 2011 | | | (167,145 | ) | |
| | 567 | | | Valeant Pharmaceuticals International | | | 55.00 | | | June 2011 | | | (128,992 | ) | |
| | 737 | | | Valspar Corporation | | | 40.00 | | | July 2011 | | | (84,755 | ) | |
| | 3,213 | | | Wyndham Worldwide Corporation | | | 30.00 | | | May 2011 | | | (1,477,980 | ) | |
| | 833 | | | Wyndham Worldwide Corporation | | | 31.00 | | | May 2011 | | | (308,210 | ) | |
| | 959 | | | Wyndham Worldwide Corporation | | | 34.00 | | | August 2011 | | | (249,340 | ) | |
| | 381 | | | Wyndham Worldwide Corporation | | | 35.00 | | | May 2011 | | | (24,765 | ) | |
| | 583 | | | Wyndham Worldwide Corporation | | | 35.00 | | | August 2011 | | | (119,515 | ) | |
| | Total Covered Call Options Written (Premiums Received: $31,543,058) | | | | | | | | | | (54,890,014 | ) | |
| | Total Investments — 100.08% (Cost: $1,155,689,080) | | | | | | | | | | 1,473,151,860 | | |
| | Liabilities in Excess of Other Assets — (0.08)% | | | | | | | | | | (1,201,476 | ) | |
| | Net Assets — 100.00% | | | | | | | | | $ | 1,471,950,384 | | |
(a) Non-income producing security/commodity.
(b) At April 30, 2011, all or a portion of this security was segregated to cover collateral requirement for options.
(c) The security is convertible until December 15, 2025.
At April 30, 2011, cost is substantially identical for both book and federal income tax purposes. Net unrealized appreciation consisted of:
| Gross unrealized appreciation | | $ | 363,037,113 | | |
| Gross unrealized depreciation | | | (45,574,333 | ) | |
| Net unrealized appreciation | | $ | 317,462,780 | | |
Abbreviations used in this schedule include:
PLC — Public Limited Company
SPDR — Standard & Poor's Depository Receipts
See Notes to Financial Statements.
FIRST EAGLE FUNDS | SEMI-ANNUAL REPORT | APRIL 30, 2011
91
Fund of America
| INDUSTRY DIVERSIFICATION FOR PORTFOLIO HOLDINGS | | PERCENT OF
NET ASSETS | |
| U.S. Common Stocks | |
| Consumer Discretionary | | | 6.83 | % | |
| Consumer Staples | | | 1.02 | | |
| Energy | | | 10.84 | | |
| Health Care | | | 21.99 | | |
| Industrials | | | 9.35 | | |
| Information Technology | | | 8.40 | | |
| Materials | | | 23.61 | | |
| Telecommunication Services | | | 0.51 | | |
| Total U.S. Common Stocks | | | 82.55 | | |
| International Common Stocks | |
| Energy | | | 1.96 | | |
| Industrials | | | 3.35 | | |
| Information Technology | | | 3.37 | | |
| Total International Common Stocks | | | 8.68 | | |
| Investment Companies | | | 11.78 | | |
| U.S. Convertible Bond | |
| Health Care | | | 0.34 | | |
| Total U.S. Convertible Bond | | | 0.34 | | |
| Rights | | | 0.27 | | |
| Purchased Options | | | 0.19 | | |
| Covered Call Options Written | | | (3.73 | ) | |
| Total Investments | | | 100.08 | % | |
See Notes to Financial Statements.
FIRST EAGLE FUNDS | SEMI-ANNUAL REPORT | APRIL 30, 2011
92
This page was intentionally left blank.
Statements of Assets and Liabilities
* First Eagle Gold Fund financial statements are shown on a consolidated basis and includes the balances of the First Eagle Gold Cayman Fund, Ltd.
** The amount of $1,457,500 represents restricted cash used as collateral for covered call options of the cash balance.
| | | FIRST EAGLE
GLOBAL FUND | | FIRST EAGLE
OVERSEAS FUND | | FIRST EAGLE
U.S. VALUE FUND | |
| Assets | |
| Investments, at Cost (Note 1) | |
| Unaffiliated issuers | | $ | 20,635,079,969 | | | $ | 6,932,449,070 | | | $ | 1,384,034,737 | | |
| Affiliated issuers | | | 2,608,395,582 | | | | 697,459,843 | | | | — | | |
| Gold bullion | | | 648,342,611 | | | | 240,147,323 | | | | 34,140,381 | | |
| Foreign currency | | | — | | | | 160,241 | | | | — | | |
| Total Investments, at Cost | | | 23,891,818,162 | | | | 7,870,216,477 | | | | 1,418,175,118 | | |
| Investments, at Value (Note 1) | |
| Unaffiliated issuers | | | 25,792,116,816 | | | | 8,954,172,776 | | | | 1,632,328,742 | | |
| Affiliated issuers | | | 3,109,949,430 | | | | 1,138,448,558 | | | | — | | |
| Gold bullion | | | 1,805,594,108 | | | | 751,722,100 | | | | 82,038,104 | | |
| Foreign currency | | | — | | | | 162,575 | | | | — | | |
| Total Investments, at Value | | | 30,707,660,354 | | | | 10,844,506,009 | | | | 1,714,366,846 | | |
| Cash | | | — | | | | 22,668 | | | | 5,419 | | |
| Receivable for investment securities sold | | | 46,820,097 | | | | 15,605,858 | | | | 396,823 | | |
| Receivable for premiums for written options | | | — | | | | — | | | | — | | |
| Receivable for Fund shares sold | | | 143,429,242 | | | | 40,736,854 | | | | 9,329,389 | | |
| Accrued interest and dividends receivable | | | 103,726,476 | | | | 55,160,340 | | | | 1,838,556 | | |
| Investment for trustee deferred compensation plan (Note 2) | | | 1,352,568 | | | | 1,530,344 | | | | 922,476 | | |
| Other assets | | | 441,552 | | | | 162,233 | | | | 26,647 | | |
| Total Assets | | | 31,003,430,289 | | | | 10,957,724,306 | | | | 1,726,886,156 | | |
| Liabilities | |
Option contracts written, at value (premiums received $2,664,915,
$0, $522,648, $0, and $31,543,058, respectively) (Note 1) | | | 1,462,500 | | | | — | | | | 448,800 | | |
| Payable for Fund shares redeemed | | | 32,346,837 | | | | 16,487,116 | | | | 2,251,195 | | |
| Payable for investment securities purchased | | | 62,807,755 | | | | 7,235,565 | | | | 4,621,775 | | |
| Payable for forward currency contracts held, at value (Note 1) | | | 147,617,124 | | | | 85,550,495 | | | | — | | |
| Investment advisory fees payable (Note 2) | | | 18,244,730 | | | | 6,455,270 | | | | 1,026,201 | | |
| Distribution fees payable (Note 3) | | | 7,985,333 | | | | 1,745,844 | | | | 417,831 | | |
| Services fees payable (Note 3) | | | 1,667,488 | | | | 220,639 | | | | 78,727 | | |
| Trustee deferred compensation plan (Note 2) | | | 1,352,568 | | | | 1,530,344 | | | | 922,476 | | |
| Administrative fees payable (Note 2) | | | 320,548 | | | | 116,877 | | | | 17,671 | | |
| Due to custodian | | | 102,078 | | | | — | | | | — | | |
| Trustee fees payable | | | 82,648 | | | | 25,944 | | | | 5,971 | | |
| Accrued expenses and other liabilities | | | 14,832,351 | | | | 6,765,277 | | | | 383,478 | | |
| Total Liabilities | | | 288,821,960 | | | | 126,133,371 | | | | 10,174,125 | | |
| Net Assets | | $ | 30,714,608,329 | | | $ | 10,831,590,935 | | | $ | 1,716,712,031 | | |
See Notes to Financial Statements.
FIRST EAGLE FUNDS | SEMI-ANNUAL REPORT | APRIL 30, 2011
94
April 30, 2011 (unaudited)
| | | FIRST EAGLE
GOLD FUND* | | FIRST EAGLE
FUND OF AMERICA | |
| Assets | |
| Investments, at Cost (Note 1) | |
| Unaffiliated issuers | | $ | 1,838,511,284 | | | $ | 1,187,232,138 | | |
| Affiliated issuers | | | — | | | | — | | |
| Gold bullion | | | 169,482,646 | | | | — | | |
| Foreign currency | | | 4 | | | | — | | |
| Total Investments, at Cost | | | 2,007,993,934 | | | | 1,187,232,138 | | |
| Investments, at Value (Note 1) | |
| Unaffiliated issuers | | | 3,017,585,772 | | | | 1,528,041,874 | | |
| Affiliated issuers | | | — | | | | — | | |
| Gold bullion | | | 529,513,273 | | | | — | | |
| Foreign currency | | | 3 | | | | — | | |
| Total Investments, at Value | | | 3,547,099,048 | | | | 1,528,041,874 | | |
| Cash | | | 8,792 | | | | 3,165,667 | ** | |
| Receivable for investment securities sold | | | 16,351,887 | | | | 1,127,837 | | |
| Receivable for premiums for written options | | | — | | | | 566,753 | | |
| Receivable for Fund shares sold | | | 13,277,927 | | | | 15,102,028 | | |
| Accrued interest and dividends receivable | | | 2,407,967 | | | | 701,234 | | |
| Investment for trustee deferred compensation plan (Note 2) | | | 195,943 | | | | 539,514 | | |
| Other assets | | | 67,449 | | | | 22,782 | | |
| Total Assets | | | 3,579,409,013 | | | | 1,549,267,689 | | |
| Liabilities | |
Option contracts written, at value (premiums received $2,664,915,
$0, $522,648, $0, and $31,543,058, respectively) (Note 1) | | | — | | | | 54,890,014 | | |
| Payable for Fund shares redeemed | | | 5,969,819 | | | | 1,658,761 | | |
| Payable for investment securities purchased | | | 2,483,776 | | | | 18,359,953 | | |
| Payable for forward currency contracts held, at value (Note 1) | | | — | | | | — | | |
| Investment advisory fees payable (Note 2) | | | 2,176,387 | | | | 1,163,057 | | |
| Distribution fees payable (Note 3) | | | 827,792 | | | | 364,989 | | |
| Services fees payable (Note 3) | | | 142,283 | | | | 37,112 | | |
| Trustee deferred compensation plan (Note 2) | | | 195,943 | | | | 539,514 | | |
| Administrative fees payable (Note 2) | | | 35,096 | | | | 14,836 | | |
| Due to custodian | | | — | | | | — | | |
| Trustee fees payable | | | 43,548 | | | | 5,489 | | |
| Accrued expenses and other liabilities | | | 490,529 | | | | 283,580 | | |
| Total Liabilities | | | 12,365,173 | | | | 77,317,305 | | |
| Net Assets | | $ | 3,567,043,840 | | | $ | 1,471,950,384 | | |
FIRST EAGLE FUNDS | SEMI-ANNUAL REPORT | APRIL 30, 2011
95
Statements of Assets and Liabilities (continued)
| | | FIRST EAGLE
GLOBAL FUND | | FIRST EAGLE
OVERSEAS FUND | | FIRST EAGLE
U.S. VALUE FUND | |
| Net Assets Consist of | |
| Capital stock (par value, $0.001 per share) | | $ | 621,840 | | | $ | 450,079 | | | $ | 97,286 | | |
| Capital surplus | | | 24,184,161,429 | | | | 8,014,501,079 | | | | 1,383,181,612 | | |
| Net unrealized appreciation (depreciation) on: | |
Investments (net of $9,628,409, $4,430,420, $0, $0, and $0
deferred capital gain country tax, respectively) | | | 6,806,213,783 | | | | 2,969,856,778 | | | | 296,191,728 | | |
| Foreign currency and forward contract related translation | | | (143,455,034 | ) | | | (83,539,288 | ) | | | — | | |
| Written options | | | 1,202,415 | | | | — | | | | 73,848 | | |
| Undistributed net realized gains on investments | | | 43,068,187 | | | | 188,851,079 | | | | 38,044,497 | | |
| Undistributed net investment loss | | | (177,204,291 | ) | | | (258,528,792 | ) | | | (876,940 | ) | |
| Net Assets | | $ | 30,714,608,329 | | | $ | 10,831,590,935 | | | $ | 1,716,712,031 | | |
| Class A | |
| Net assets | | $ | 15,023,389,774 | | | $ | 5,446,946,989 | | | $ | 911,458,175 | | |
| Shares outstanding | | | 302,974,415 | | | | 227,066,065 | | | | 51,683,360 | | |
| Net asset value per share and redemption proceeds per share | | $ | 49.59 | | | $ | 23.99 | | | $ | 17.64 | | |
| Offering price per share (NAV per share plus maximum sales charge)1 | | $ | 52.20 | | | $ | 25.25 | | | $ | 18.57 | | |
| Class C | |
| Net assets | | $ | 8,421,218,574 | | | $ | 1,110,529,805 | | | $ | 393,351,612 | | |
| Shares outstanding | | | 172,846,636 | | | | 47,491,853 | | | | 22,501,940 | | |
| Net asset value per share | | $ | 48.72 | | | $ | 23.38 | | | $ | 17.48 | | |
Redemption proceeds per share (NAV per share less maximum
contingent deferred sale charge)2 | | $ | 48.23 | | | $ | 23.15 | | | $ | 17.31 | | |
| Class I | |
| Net assets | | $ | 7,269,999,981 | | | $ | 4,274,114,141 | | | $ | 411,902,244 | | |
| Shares outstanding | | | 146,019,278 | | | | 175,520,905 | | | | 23,100,998 | | |
| Net asset value per share and redemption proceeds per share | | $ | 49.79 | | | $ | 24.35 | | | $ | 17.83 | | |
| Class Y | |
| Net assets | | | — | | | | — | | | | — | | |
| Shares outstanding | | | — | | | | — | | | | — | | |
| Net asset value per share and redemption proceeds per share | | | — | | | | — | | | | — | | |
* First Eagle Gold Fund financial statements are shown on a consolidated basis and includes the balances of the First Eagle Gold Cayman Fund, Ltd.
1 The maximum sales charge is 5.00% for Class A shares. Classes C, I and Y have no front-end sales charges.
2 The maximum CDSC (Contingent Deferred Sales Charge) is 1.00% for Class C shares, which is charged on the lesser of the offering price or the net asset value at the time of sale by shareholder. This pertains to investments of one year or less.
See Notes to Financial Statements.
FIRST EAGLE FUNDS | SEMI-ANNUAL REPORT | APRIL 30, 2011
96
April 30, 2011 (unaudited)
| | | FIRST EAGLE
GOLD FUND* | | FIRST EAGLE
FUND OF AMERICA | |
| Net Assets Consist of | |
| Capital stock (par value, $0.001 per share) | | $ | 99,857 | | | $ | 52,777 | | |
| Capital surplus | | | 2,062,973,343 | | | | 1,122,361,632 | | |
| Net unrealized appreciation (depreciation) on: | |
Investments (net of $9,628,409, $4,430,420, $0, $0, and $0
deferred capital gain country tax, respectively) | | | 1,539,105,115 | | | | 340,809,736 | | |
| Foreign currency and forward contract related translation | | | 9,283 | | | | — | | |
| Written options | | | — | | | | (23,346,956 | ) | |
| Undistributed net realized gains on investments | | | 106,255,237 | | | | 32,558,080 | | |
| Undistributed net investment loss | | | (141,398,995 | ) | | | (484,885 | ) | |
| Net Assets | | $ | 3,567,043,840 | | | $ | 1,471,950,384 | | |
| Class A | |
| Net assets | | $ | 1,997,922,898 | | | $ | 557,133,016 | | |
| Shares outstanding | | | 55,751,389 | | | | 19,818,048 | | |
| Net asset value per share and redemption proceeds per share | | $ | 35.84 | | | $ | 28.11 | | |
| Offering price per share (NAV per share plus maximum sales charge)1 | | $ | 37.73 | | | $ | 29.59 | | |
| Class C | |
| Net assets | | $ | 712,436,430 | | | $ | 189,968,519 | | |
| Shares outstanding | | | 20,478,637 | | | | 7,619,932 | | |
| Net asset value per share | | $ | 34.79 | | | $ | 24.93 | | |
Redemption proceeds per share (NAV per share less maximum
contingent deferred sale charge)2 | | $ | 34.44 | | | $ | 24.68 | | |
| Class I | |
| Net assets | | $ | 856,684,512 | | | | — | | |
| Shares outstanding | | | 23,626,501 | | | | — | | |
| Net asset value per share and redemption proceeds per share | | $ | 36.26 | | | | — | | |
| Class Y | |
| Net assets | | | — | | | $ | 724,848,849 | | |
| Shares outstanding | | | — | | | | 25,338,741 | | |
| Net asset value per share and redemption proceeds per share | | | — | | | $ | 28.61 | | |
FIRST EAGLE FUNDS | SEMI-ANNUAL REPORT | APRIL 30, 2011
97
Statements of Operations
| | | FIRST EAGLE
GLOBAL FUND | | FIRST EAGLE
OVERSEAS FUND | | FIRST EAGLE
U.S. VALUE FUND | |
| Investment Income | |
Interest (net of $198,326, $63,718, $0, $0, and $0,
foreign taxes withheld, respectively) | | $ | 19,307,602 | | | $ | 8,139,377 | | | $ | 3,818,720 | | |
Dividends from: (net of $14,985,902, $7,610,792, $25,258,
$499,470 and $318,815, foreign taxes withheld, respectively) | |
| Unaffiliated issuers | | | 200,115,350 | | | | 64,833,055 | | | | 12,012,713 | | |
| Affiliated issuers | | | 32,985,381 | | | | 8,010,717 | | | | — | | |
| Other Income | | | 1,412 | | | | 755 | | | | 5,862 | | |
| Total Income | | | 252,409,745 | | | | 80,983,904 | | | | 15,837,295 | | |
| Expenses | |
| Investment advisory fees (Note 2) | | | 100,923,555 | | | | 36,501,080 | | | | 5,587,821 | | |
| Administrative costs (Note 2) | | | 1,400,569 | | | | 528,818 | | | | 82,887 | | |
| Distribution fees (Note 3) | |
| Class A | | | 16,830,806 | | | | 6,272,282 | | | | 973,597 | | |
| Class C | | | 27,561,347 | | | | 3,755,732 | | | | 1,314,249 | | |
| Class Y | | | — | | | | — | | | | — | | |
| Service fees - Class C (Note 3) | | | 9,187,116 | | | | 1,251,911 | | | | 438,083 | | |
| Shareholder servicing agent fees | | | 11,394,737 | | | | 4,218,157 | | | | 947,339 | | |
| Custodian and accounting fees | | | 2,030,641 | | | | 1,026,297 | | | | 87,631 | | |
| Shareholder reporting fees | | | 985,353 | | | | 358,951 | | | | 88,215 | | |
| Trustees' fees | | | 376,337 | | | | 132,948 | | | | 21,321 | | |
| Registration and filing fees | | | 518,080 | | | | 227,355 | | | | 96,546 | | |
| Professional fees | | | 303,121 | | | | 158,016 | | | | 63,380 | | |
| Other Expenses | | | 323,395 | | | | 128,550 | | | | 23,731 | | |
| Total Expenses | | | 171,835,057 | | | | 54,560,097 | | | | 9,724,800 | | |
| Expense reductions due to earnings credits (Note 1) | | | (1,349 | ) | | | (518 | ) | | | (264 | ) | |
| Net Expenses | | | 171,833,708 | | | | 54,559,579 | | | | 9,724,536 | | |
| Net Investment Income (Loss) (Note 1) | | | 80,576,037 | | | | 26,424,325 | | | | 6,112,759 | | |
Realized and Unrealized Gains (Losses) on Investments, Foreign
Currency Related Transactions and Written Options (Note 1) | |
| Net realized gains (losses) from: | |
| Investment transactions of unaffiliated issuers | | | 378,693,390 | | | | 107,605,687 | | | | 45,005,922 | | |
| Investment transactions of affiliated issuers | | | 19,956,520 | | | | 52,034,222 | | | | — | | |
| Foreign currency and forward contract related transactions | | | (104,280,100 | ) | | | (57,174,640 | ) | | | 1,050 | | |
| Written options | | | — | | | | — | | | | (7,854 | ) | |
| Net increase from payments by affiliate (Note 2) | | | — | | | | 714,808 | | | | 7,854 | | |
| | | | 294,369,810 | | | | 103,180,077 | | | | 45,006,972 | | |
| Changes in unrealized appreciation (depreciation) of: | |
Investment transactions (net of increase in deferred capital gain country
tax accruals of $3,061,146, $1,618,246, $0, $0, and $0, respectively) | | | 2,969,745,270 | | | | 1,000,175,335 | | | | 130,204,260 | | |
| Foreign currency and forward contract related translation | | | 38,471,389 | | | | 17,020,625 | | | | (234 | ) | |
| Written options | | | 1,202,415 | | | | — | | | | 73,848 | | |
| | | | 3,009,419,074 | | | | 1,017,195,960 | | | | 130,277,874 | | |
Net realized and unrealized gains on investments, foreign currency
and forward contract related transactions and written options | | | 3,303,788,884 | | | | 1,120,376,037 | | | | 175,284,846 | | |
| Net Increase in Net Assets Resulting from Operations | | $ | 3,384,364,921 | | | $ | 1,146,800,362 | | | $ | 181,397,605 | | |
* First Eagle Gold Fund financial statements are shown on a consolidated basis and includes the balances of the First Eagle Gold Cayman Fund, Ltd.
See Notes to Financial Statements.
FIRST EAGLE FUNDS | SEMI-ANNUAL REPORT | APRIL 30, 2011
98
Six-Months Ended April 30, 2011 (unaudited)
| | | FIRST EAGLE
GOLD FUND* | | FIRST EAGLE
FUND OF AMERICA | |
| Investment Income | |
Interest (net of $198,326, $63,718, $0, $0, and $0,
foreign taxes withheld, respectively) | | $ | 916,129 | | | $ | 58,698 | | |
Dividends from: (net of $14,985,902, $7,610,792, $25,258,
$499,470 and $318,815, foreign taxes withheld, respectively) | |
| Unaffiliated issuers | | | 9,235,052 | | | | 8,133,590 | | |
| Affiliated issuers | | | — | | | | — | | |
| Other Income | | | 1,054 | | | | — | | |
| Total Income | | | 10,152,235 | | | | 8,192,288 | | |
| Expenses | |
| Investment advisory fees (Note 2) | | | 12,412,636 | | | | 6,275,079 | | |
| Administrative costs (Note 2) | | | 190,535 | | | | 69,162 | | |
| Distribution fees (Note 3) | |
| Class A | | | 2,373,882 | | | | 564,486 | | |
| Class C | | | 2,430,272 | | | | 560,232 | | |
| Class Y | | | — | | | | 817,539 | | |
| Service fees - Class C (Note 3) | | | 810,091 | | | | 186,744 | | |
| Shareholder servicing agent fees | | | 1,746,328 | | | | 708,809 | | |
| Custodian and accounting fees | | | 325,076 | | | | 87,647 | | |
| Shareholder reporting fees | | | 142,452 | | | | 55,635 | | |
| Trustees' fees | | | 62,622 | | | | 18,122 | | |
| Registration and filing fees | | | 177,216 | | | | 85,225 | | |
| Professional fees | | | 120,835 | | | | 70,583 | | |
| Other Expenses | | | 73,179 | | | | 21,254 | | |
| Total Expenses | | | 20,865,124 | | | | 9,520,517 | | |
| Expense reductions due to earnings credits (Note 1) | | | (393 | ) | | | (236 | ) | |
| Net Expenses | | | 20,864,731 | | | | 9,520,281 | | |
| Net Investment Income (Loss) (Note 1) | | | (10,712,496 | ) | | | (1,327,993 | ) | |
Realized and Unrealized Gains (Losses) on Investments, Foreign
Currency Related Transactions and Written Options (Note 1) | |
| Net realized gains (losses) from: | |
| Investment transactions of unaffiliated issuers | | | 98,076,458 | | | | 95,087,797 | | |
| Investment transactions of affiliated issuers | | | 9,270,922 | | | | — | | |
| Foreign currency and forward contract related transactions | | | 223,780 | | | | — | | |
| Written options | | | — | | | | (36,650,729 | ) | |
| Net increase from payments by affiliate (Note 2) | | | — | | | | 544 | | |
| | | | 107,571,160 | | | | 58,437,612 | | |
| Changes in unrealized appreciation (depreciation) of: | |
Investment transactions (net of increase in deferred capital gain country
tax accruals of $3,061,146, $1,618,246, $0, $0, and $0, respectively) | | | 331,812,515 | | | | 159,009,867 | | |
| Foreign currency and forward contract related translation | | | 5,250 | | | | — | | |
| Written options | | | — | | | | (11,997,988 | ) | |
| | | | 331,817,765 | | | | 147,011,879 | | |
Net realized and unrealized gains on investments, foreign currency
and forward contract related transactions and written options | | | 439,388,925 | | | | 205,449,491 | | |
| Net Increase in Net Assets Resulting from Operations | | $ | 428,676,429 | | | $ | 204,121,498 | | |
FIRST EAGLE FUNDS | SEMI-ANNUAL REPORT | APRIL 30, 2011
99
Statements of Changes in Net Assets
| | | FIRST EAGLE
GLOBAL FUND | | FIRST EAGLE
OVERSEAS FUND | |
| | | SIX-MONTHS
ENDED
APRIL 30, 2011
(unaudited) | | YEAR ENDED
OCTOBER 31,
2010 | | SIX-MONTHS
ENDED
APRIL 30, 2011
(unaudited) | | YEAR ENDED
OCTOBER 31,
2010 | |
| Operations | |
| Net investment income (loss) | | $ | 80,576,037 | | | $ | 261,070,340 | | | $ | 26,424,325 | | | $ | 59,676,774 | | |
Net realized gain from investments, foreign currency
and forward contract related transactions and written options | | | 294,369,810 | | | | 717,773,345 | | | | 103,180,077 | | | | 389,944,027 | | |
Change in unrealized appreciation of investments, foreign
currency and forward contract related transactions and
written options | | | 3,009,419,074 | | | | 2,170,300,536 | | | | 1,017,195,960 | | | | 680,529,450 | | |
| Net increase in net assets resulting from operations | | | 3,384,364,921 | | | | 3,149,144,221 | | | | 1,146,800,362 | | | | 1,130,150,251 | | |
| Distribution to Shareholders | |
| Dividends paid from net investment income | |
| Class A | | | (179,125,249 | ) | | | (156,973,830 | ) | | | (68,667,245 | ) | | | (124,712,908 | ) | |
| Class C | | | (53,722,987 | ) | | | (50,152,071 | ) | | | (7,990,749 | ) | | | (20,270,175 | ) | |
| Class I | | | (94,957,034 | ) | | | (56,542,814 | ) | | | (56,678,049 | ) | | | (71,876,457 | ) | |
Distributions paid from net realized gains from
investment transactions | |
| Class A | | | — | | | | — | | | | (44,782,633 | ) | | | — | | |
| Class C | | | — | | | | — | | | | (9,220,791 | ) | | | — | | |
| Class I | | | — | | | | — | | | | (31,995,749 | ) | | | — | | |
| Decrease in net assets resulting from distributions | | | (327,805,270 | ) | | | (263,668,715 | ) | | | (219,335,216 | ) | | | (216,859,540 | ) | |
| Fund Share Transactions (Note 6) | |
| Net proceeds from shares sold | | | 5,637,843,692 | | | | 5,983,606,868 | | | | 2,002,711,486 | | | | 2,718,513,835 | | |
Net asset value of shares issued for reinvested dividends and
distributions | | | 261,507,604 | | | | 216,340,170 | | | | 184,257,841 | | | | 182,833,092 | | |
| Cost of shares redeemed | | | (2,305,791,010 | ) | | | (4,080,271,834 | ) | | | (1,157,671,174 | ) | | | (1,967,558,448 | ) | |
| Redemption fees | | | 532,459 | | | | 580,971 | | | | 305,298 | | | | 545,912 | | |
| Increase in net assets from Fund share transactions | | | 3,594,092,745 | | | | 2,120,256,175 | | | | 1,029,603,451 | | | | 934,334,391 | | |
| Net increase in net assets | | | 6,650,652,396 | | | | 5,005,731,681 | | | | 1,957,068,597 | | | | 1,847,625,102 | | |
| Net Assets (Note 1) | |
| Beginning of period | | | 24,063,955,933 | | | | 19,058,224,252 | | | | 8,874,522,338 | | | | 7,026,897,236 | | |
| End of period | | $ | 30,714,608,329 | | | $ | 24,063,955,933 | | | $ | 10,831,590,935 | | | $ | 8,874,522,338 | | |
| Undistributed net investment income (loss) | | $ | (177,204,291 | ) | | $ | 70,024,942 | | | $ | (258,528,792 | ) | | $ | (151,617,074 | ) | |
* First Eagle Gold Fund financial statements are shown on a consolidated basis and includes the balances of the First Eagle Gold Cayman Fund, Ltd.
See Notes to Financial Statements.
FIRST EAGLE FUNDS | SEMI-ANNUAL REPORT | APRIL 30, 2011
100
| | | FIRST EAGLE
U.S. VALUE FUND | | FIRST EAGLE
GOLD FUND* | |
| | | SIX-MONTHS
ENDED
APRIL 30, 2011
(unaudited) | | YEAR ENDED
OCTOBER 31,
2010 | | SIX-MONTHS
ENDED
APRIL 30, 2011
(unaudited) | | YEAR ENDED
OCTOBER 31,
2010 | |
| Operations | |
| Net investment income (loss) | | $ | 6,112,759 | | | $ | 23,706,578 | | | $ | (10,712,496 | ) | | $ | (16,630,800 | ) | |
Net realized gain from investments, foreign currency
and forward contract related transactions and written options | | | 45,006,972 | | | | 18,613,556 | | | | 107,571,160 | | | | 131,930,991 | | |
Change in unrealized appreciation of investments, foreign
currency and forward contract related transactions and
written options | | | 130,277,874 | | | | 102,060,384 | | | | 331,817,765 | | | | 582,457,912 | | |
| Net increase in net assets resulting from operations | | | 181,397,605 | | | | 144,380,518 | | | | 428,676,429 | | | | 697,758,103 | | |
| Distribution to Shareholders | |
| Dividends paid from net investment income | |
| Class A | | | (14,601,729 | ) | | | (7,510,123 | ) | | | (41,372,108 | ) | | | (19,206,629 | ) | |
| Class C | | | (4,588,209 | ) | | | (1,828,449 | ) | | | (10,828,155 | ) | | | (4,203,516 | ) | |
| Class I | | | (7,711,426 | ) | | | (3,213,302 | ) | | | (16,752,495 | ) | | | (4,149,787 | ) | |
Distributions paid from net realized gains from
investment transactions | |
| Class A | | | — | | | | — | | | | (68,368,215 | ) | | | — | | |
| Class C | | | — | | | | — | | | | (23,482,892 | ) | | | — | | |
| Class I | | | — | | | | — | | | | (25,391,355 | ) | | | — | | |
| Decrease in net assets resulting from distributions | | | (26,901,364 | ) | | | (12,551,874 | ) | | | (186,195,220 | ) | | | (27,559,932 | ) | |
| Fund Share Transactions (Note 6) | |
| Net proceeds from shares sold | | | 373,560,240 | | | | 486,075,265 | | | | 595,933,035 | | | | 1,391,677,772 | | |
Net asset value of shares issued for reinvested dividends and
distributions | | | 21,330,711 | | | | 10,092,866 | | | | 137,426,605 | | | | 22,128,723 | | |
| Cost of shares redeemed | | | (160,614,293 | ) | | | (309,421,451 | ) | | | (619,397,680 | ) | | | (726,113,835 | ) | |
| Redemption fees | | | — | | | | — | | | | 112,713 | | | | 266,030 | | |
| Increase in net assets from Fund share transactions | | | 234,276,658 | | | | 186,746,680 | | | | 114,074,673 | | | | 687,958,690 | | |
| Net increase in net assets | | | 388,772,899 | | | | 318,575,324 | | | | 356,555,882 | | | | 1,358,156,861 | | |
| Net Assets (Note 1) | |
| Beginning of period | | | 1,327,939,132 | | | | 1,009,363,808 | | | | 3,210,487,958 | | | | 1,852,331,097 | | |
| End of period | | $ | 1,716,712,031 | | | $ | 1,327,939,132 | | | $ | 3,567,043,840 | | | $ | 3,210,487,958 | | |
| Undistributed net investment income (loss) | | $ | (876,940 | ) | | $ | 19,911,665 | | | $ | (141,398,995 | ) | | $ | (61,733,741 | ) | |
FIRST EAGLE FUNDS | SEMI-ANNUAL REPORT | APRIL 30, 2011
101
Statements of Changes in Net Assets (continued)
| | | FIRST EAGLE
FUND OF AMERICA | |
| | | SIX-MONTHS
ENDED
APRIL 30, 2011
(unaudited) | | YEAR ENDED
OCTOBER 31,
2010 | |
| Operations | |
| Net investment income (loss) | | $ | (1,327,993 | ) | | $ | 5,216,525 | | |
Net realized gain from investments, foreign
currency and forward contract related transactions
and written options | | | 58,437,612 | | | | 42,187,399 | | |
Change in unrealized appreciation of investments,
foreign currency and forward contract related transactions
and written options | | | 147,011,879 | | | | 164,849,816 | | |
| Net increase in net assets resulting from operations | | | 204,121,498 | | | | 212,253,740 | | |
| Distribution to Shareholders | |
| Dividends paid from net investment income | |
| Class A | | | (2,737,506 | ) | | | — | | |
| Class C | | | (253,288 | ) | | | — | | |
| Class Y | | | (3,991,165 | ) | | | — | | |
Distributions paid from net realized gains from
investment transaction | |
| Class A | | | — | | | | — | | |
| Class C | | | — | | | | — | | |
| Class Y | | | — | | | | — | | |
| Decrease in net assets resulting from distributions | | | (6,981,959 | ) | | | — | | |
| Fund Share Transactions (Note 6) | |
| Net proceeds from shares sold | | | 259,735,660 | | | | 195,796,652 | | |
Net asset value of shares issued for reinvested dividends
and distributions | | | 6,163,174 | | | | — | | |
| Cost of shares redeemed | | | (90,395,670 | ) | | | (177,951,130 | ) | |
| Increase in net assets from Fund share transactions | | | 175,503,164 | | | | 17,845,522 | | |
| Net increase in net assets | | | 372,642,703 | | | | 230,099,262 | | |
| Net Assets (Note 1) | |
| Beginning of period | | | 1,099,307,681 | | | | 869,208,419 | | |
| End of period | | $ | 1,471,950,384 | | | $ | 1,099,307,681 | | |
| Undistributed net investment income (loss) | | $ | (484,885 | ) | | $ | 7,825,067 | | |
See Notes to Financial Statements.
FIRST EAGLE FUNDS | SEMI-ANNUAL REPORT | APRIL 30, 2011
102
This page was intentionally left blank.

Financial Highlights
| | | SIX-MONTHS ENDED | | YEAR ENDED OCTOBER 31, | |
| | | APRIL 30, 2011 (UNAUDITED) | | 2010 | |
| | | CLASS A | | CLASS C | | CLASS I | | CLASS A | | CLASS C | | CLASS I | |
Selected data for a share of beneficial interest outstanding throughout
each period is presented below:* | |
Net asset value,
beginning of period ($) | | | 44.36 | | | | 43.47 | | | | 44.59 | | | | 38.74 | | | | 38.07 | | | | 38.92 | | |
| Income from investment operations: | |
| Net investment income ($) | | | 0.17 | | | | 0.00 | ** | | | 0.24 | | | | 0.56 | | | | 0.26 | | | | 0.69 | | |
Net realized and unrealized
gains (losses) on investments | | | 5.70 | | | | 5.60 | | | | 5.72 | | | | 5.63 | | | | 5.51 | | | | 5.63 | | |
Total income (loss) from
investment operations | | | 5.87 | | | | 5.60 | | | | 5.96 | | | | 6.19 | | | | 5.77 | | | | 6.32 | | |
| Less distributions: | |
Dividends from net
investment income ($) | | | -0.64 | | | | -0.35 | | | | -0.76 | | | | -0.57 | | | | -0.37 | | | | -0.65 | | |
Distributions from
capital gains | | | — | | | | — | | | | — | | | | — | | | | — | | | | — | | |
| Total distributions | | | -0.64 | | | | -0.35 | | | | -0.76 | | | | -0.57 | | | | -0.37 | | | | -0.65 | | |
Net asset value,
end of period ($) | | | 49.59 | | | | 48.72 | | | | 49.79 | | | | 44.36 | | | | 43.47 | | | | 44.59 | | |
| Total return(c) (%) | | | 13.35 | (a) | | | 12.94 | (a) | | | 13.51 | (a) | | | 16.13 | | | | 15.23 | | | | 16.40 | | |
| Ratios and supplemental data | |
Net assets, end of period
(millions) ($) | | | 15,023 | | | | 8,421 | | | | 7,270 | | | | 12,195 | | | | 6,524 | | | | 5,345 | | |
Ratio of operating expenses
to average net assets
including earnings credits (%) | | | 1.13 | (b) | | | 1.88 | (b) | | | 0.88 | (b) | | | 1.16 | | | | 1.91 | | | | 0.91 | | |
Ratio of operating expenses
to average net assets
excluding earnings credits (%) | | | 1.13 | (b) | | | 1.88 | (b) | | | 0.88 | (b) | | | 1.16 | | | | 1.91 | | | | 0.91 | | |
Ratio of net investment
income to average net assets
including earnings credits (%) | | | 0.74 | (b) | | | 0.00 | ***(b) | | | 1.01 | (b) | | | 1.36 | | | | 0.63 | | | | 1.68 | | |
Ratio of net investment
income to average net assets
excluding earnings credits (%) | | | 0.74 | (b) | | | 0.00 | ***(b) | | | 1.01 | (b) | | | 1.36 | | | | 0.63 | | | | 1.68 | | |
| Portfolio turnover rate (%) | | | 7.16 | (a) | | | 7.16 | (a) | | | 7.16 | (a) | | | 17.37 | | | | 17.37 | | | | 17.37 | | |
* Per share amounts have been calculated using the average shares method.
** Amount represents less than $0.01 per share.
*** Amount is less than 0.01%.
(a) Not Annualized
(b) Annualized
(c) Does not take into account the sales charge of 5.00% for Class A shares and the CDSC (Contingent Deferred Sales Charge) of 1.00% for Class C shares.
See Notes to Financial Statements.
FIRST EAGLE FUNDS | SEMI-ANNUAL REPORT | APRIL 30, 2011
104
Global Fund
| | | YEAR ENDED OCTOBER 31, | |
| | | 2009 | | 2008 | | 2007 | | 2006 | |
| | | CLASS A | | CLASS C | | CLASS I | | CLASS A | | CLASS C | | CLASS I | | CLASS A | | CLASS C | | CLASS I | | CLASS A | | CLASS C | | CLASS I | |
Selected data for a share of beneficial interest outstanding throughout
each period is presented below:* | |
Net asset value,
beginning of period ($) | | | 34.45 | | | | 33.99 | | | | 34.62 | | | | 51.09 | | | | 50.46 | | | | 51.32 | | | | 48.36 | | | | 47.83 | | | | 48.56 | | | | 42.47 | | | | 42.06 | | | | 42.62 | | |
| Income from investment operations: | |
| Net investment income ($) | | | 0.39 | | | | 0.13 | | | | 0.47 | | | | 0.64 | | | | 0.31 | | | | 0.76 | | | | 0.67 | | | | 0.31 | | | | 0.79 | | | | 0.59 | | | | 0.25 | | | | 0.71 | | |
Net realized and unrealized
gains (losses) on investments | | | 6.35 | | | | 6.26 | | | | 6.39 | | | | -11.82 | | | | -11.69 | | | | -11.88 | | | | 6.91 | | | | 6.84 | | | | 6.94 | | | | 7.82 | | | | 7.77 | | | | 7.85 | | |
Total income (loss) from
investment operations | | | 6.74 | | | | 6.39 | | | | 6.86 | | | | -11.18 | | | | -11.38 | | | | -11.12 | | | | 7.58 | | | | 7.15 | | | | 7.73 | | | | 8.41 | | | | 8.02 | | | | 8.56 | | |
| Less distributions: | |
Dividends from net
investment income ($) | | | -0.14 | | | | -0.00 | ** | | | -0.25 | | | | -1.07 | | | | -0.70 | | | | -1.19 | | | | -1.22 | | | | -0.89 | | | | -1.34 | | | | -0.84 | | | | -0.57 | | | | -0.94 | | |
Distributions from
capital gains | | | -2.31 | | | | -2.31 | | | | -2.31 | | | | -4.39 | | | | -4.39 | | | | -4.39 | | | | -3.63 | | | | -3.63 | | | | -3.63 | | | | -1.68 | | | | -1.68 | | | | -1.68 | | |
| Total distributions | | | -2.45 | | | | -2.31 | | | | -2.56 | | | | -5.46 | | | | -5.09 | | | | -5.58 | | | | -4.85 | | | | -4.52 | | | | -4.97 | | | | -2.52 | | | | -2.25 | | | | -2.62 | | |
Net asset value,
end of period ($) | | | 38.74 | | | | 38.07 | | | | 38.92 | | | | 34.45 | | | | 33.99 | | | | 34.62 | | | | 51.09 | | | | 50.46 | | | | 51.32 | | | | 48.36 | | | | 47.83 | | | | 48.56 | | |
| Total return(c) (%) | | | 20.81 | | | | 19.93 | | | | 21.13 | | | | -24.41 | | | | -24.99 | | | | -24.21 | | | | 16.91 | | | | 16.03 | | | | 17.19 | | | | 20.73 | | | | 19.86 | | | | 21.06 | | |
| Ratios and supplemental data | |
Net assets, end of period
(millions) ($) | | | 10,562 | | | | 5,158 | | | | 3,338 | | | | 9,784 | | | | 4,623 | | | | 2,898 | | | | 13,451 | | | | 5,593 | | | | 3,193 | | | | 11,854 | | | | 4,928 | | | | 2,641 | | |
Ratio of operating expenses
to average net assets
including earnings credits (%) | | | 1.19 | | | | 1.94 | | | | 0.94 | | | | 1.14 | | | | 1.89 | | | | 0.89 | | | | 1.12 | | | | 1.87 | | | | 0.87 | | | | 1.13 | | | | 1.88 | | | | 0.88 | | |
Ratio of operating expenses
to average net assets
excluding earnings credits (%) | | | 1.19 | | | | 1.94 | | | | 0.94 | | | | 1.14 | | | | 1.89 | | | | 0.89 | | | | 1.12 | | | | 1.87 | | | | 0.87 | | | | 1.14 | | | | 1.89 | | | | 0.89 | | |
Ratio of net investment
income to average net assets
including earnings credits (%) | | | 1.14 | | | | 0.38 | | | | 1.37 | | | | 1.48 | | | | 0.73 | | | | 1.74 | | | | 1.40 | | | | 0.65 | | | | 1.64 | | | | 1.31 | | | | 0.56 | | | | 1.57 | | |
Ratio of net investment
income to average net assets
excluding earnings credits (%) | | | 1.14 | | | | 0.38 | | | | 1.37 | | | | 1.48 | | | | 0.73 | | | | 1.74 | | | | 1.39 | | | | 0.64 | | | | 1.64 | | | | 1.30 | | | | 0.56 | | | | 1.57 | | |
| Portfolio turnover rate (%) | | | 12.52 | | | | 12.52 | | | | 12.52 | | | | 29.69 | | | | 29.69 | | | | 29.69 | | | | 37.58 | | | | 37.58 | | | | 37.58 | | | | 28.59 | | | | 28.59 | | | | 28.59 | | |
FIRST EAGLE FUNDS | SEMI-ANNUAL REPORT | APRIL 30, 2011
105

Financial Highlights
| | | SIX-MONTHS ENDED | | YEAR ENDED OCTOBER 31, | |
| | | APRIL 30, 2011 (UNAUDITED) | | 2010 | |
| | | CLASS A | | CLASS C | | CLASS I | | CLASS A | | CLASS C | | CLASS I | |
Selected data for a share of beneficial interest outstanding throughout
each period is presented below:* | |
Net asset value,
beginning of period ($) | | | 21.86 | | | | 21.26 | | | | 22.20 | | | | 19.51 | | | | 19.03 | | | | 19.80 | | |
| Income (loss) from investment operations: | |
| Net investment income (loss) ($) | | | 0.06 | | | | -0.02 | | | | 0.09 | | | | 0.15 | | | | 0.00 | ** | | | 0.21 | | |
Net realized and unrealized
gains (losses) on investments | | | 2.60 | | | | 2.53 | | | | 2.64 | | | | 2.80 | | | | 2.72 | | | | 2.82 | | |
Total income (loss) from
investment operations | | | 2.66 | | | | 2.51 | | | | 2.73 | | | | 2.95 | | | | 2.72 | | | | 3.03 | | |
| Less distributions: | |
Dividends from net
investment income ($) | | | -0.32 | | | | -0.18 | | | | -0.37 | | | | -0.60 | | | | -0.49 | | | | -0.63 | | |
Distributions from
capital gains | | | -0.21 | | | | -0.21 | | | | -0.21 | | | | — | | | | — | | | | — | | |
| Total distributions | | | -0.53 | | | | -0.39 | | | | -0.58 | | | | -0.60 | | | | -0.49 | | | | -0.63 | | |
Net asset value,
end of period ($) | | | 23.99 | | | | 23.38 | | | | 24.35 | | | | 21.86 | | | | 21.26 | | | | 22.20 | | |
| Total return(c) (%) | | | 12.37 | (a) | | | 11.96 | (a) | | | 12.52 | (a) | | | 15.45 | | | | 14.55 | | | | 15.68 | | |
| Ratios and supplemental data | |
Net assets, end of period
(millions) ($) | | | 5,447 | | | | 1,111 | | | | 4,274 | | | | 4,676 | | | | 914 | | | | 3,284 | | |
Ratio of operating expenses
to average net assets
including earnings credits (%) | | | 1.14 | (b) | | | 1.89 | (b) | | | 0.89 | (b) | | | 1.17 | | | | 1.92 | | | | 0.92 | | |
Ratio of operating expenses
to average net assets
excluding earnings credits (%) | | | 1.14 | (b) | | | 1.89 | (b) | | | 0.89 | (b) | | | 1.17 | | | | 1.92 | | | | 0.92 | | |
Ratio of net investment income
(loss) to average net assets
including earnings credits (%) | | | 0.51 | (b) | | | -0.23 | (b) | | | 0.80 | (b) | | | 0.76 | | | | 0.01 | | | | 1.03 | | |
Ratio of net investment income
(loss) to average net assets
excluding earnings credits (%) | | | 0.51 | (b) | | | -0.23 | (b) | | | 0.80 | (b) | | | 0.76 | | | | 0.01 | | | | 1.03 | | |
| Portfolio turnover rate (%) | | | 6.48 | (a) | | | 6.48 | (a) | | | 6.48 | (a) | | | 15.53 | | | | 15.53 | | | | 15.53 | | |
* Per share amounts have been calculated using the average shares method.
** Amount represents less than $0.01 per share.
(a) Not Annualized
(b) Annualized
(c) Does not take into account the sales charge of 5.00% for Class A shares and the CDSC (Contingent Deferred Sales Charge) of 1.00% for Class C shares.
See Notes to Financial Statements.
FIRST EAGLE FUNDS | SEMI-ANNUAL REPORT | APRIL 30, 2011
106
Overseas Fund
| | | YEAR ENDED OCTOBER 31, | |
| | | 2009 | | 2008 | | 2007 | | 2006 | |
| | | CLASS A | | CLASS C | | CLASS I | | CLASS A | | CLASS C | | CLASS I | | CLASS A | | CLASS C | | CLASS I | | CLASS A | | CLASS C | | CLASS I | |
Selected data for a share of beneficial interest outstanding throughout
each period is presented below:* | |
Net asset value,
beginning of period ($) | | | 17.21 | | | | 16.93 | | | | 17.41 | | | | 28.09 | | | | 27.66 | | | | 28.38 | | | | 26.70 | | | | 26.33 | | | | 26.94 | | | | 24.13 | | | | 23.83 | | | | 24.33 | | |
| Income (loss) from investment operations: | |
| Net investment income (loss) ($) | | | 0.26 | | | | 0.13 | | | | 0.30 | | | | 0.35 | | | | 0.18 | | | | 0.40 | | | | 0.41 | | | | 0.21 | | | | 0.48 | | | | 0.39 | | | | 0.20 | | | | 0.46 | | |
Net realized and unrealized
gains (losses) on investments | | | 3.72 | | | | 3.63 | | | | 3.78 | | | | -7.21 | | | | -7.10 | | | | -7.28 | | | | 4.05 | | | | 4.00 | | | | 4.10 | | | | 4.57 | | | | 4.53 | | | | 4.60 | | |
Total income (loss) from
investment operations | | | 3.98 | | | | 3.76 | | | | 4.08 | | | | -6.86 | | | | -6.92 | | | | -6.88 | | | | 4.46 | | | | 4.21 | | | | 4.58 | | | | 4.96 | | | | 4.73 | | | | 5.06 | | |
| Less distributions: | |
Dividends from net
investment income ($) | | | -0.02 | | | | 0.00 | ** | | | -0.03 | | | | -0.87 | | | | -0.66 | | | | -0.94 | | | | -0.87 | | | | -0.68 | | | | -0.94 | | | | -0.81 | | | | -0.65 | | | | -0.87 | | |
Distributions from
capital gains | | | -1.66 | | | | -1.66 | | | | -1.66 | | | | -3.15 | | | | -3.15 | | | | -3.15 | | | | -2.20 | | | | -2.20 | | | | -2.20 | | | | -1.58 | | | | -1.58 | | | | -1.58 | | |
| Total distributions | | | -1.68 | | | | -1.66 | | | | -1.69 | | | | -4.02 | | | | -3.81 | | | | -4.09 | | | | -3.07 | | | | -2.88 | | | | -3.14 | | | | -2.39 | | | | -2.23 | | | | -2.45 | | |
Net asset value,
end of period ($) | | | 19.51 | | | | 19.03 | | | | 19.80 | | | | 17.21 | | | | 16.93 | | | | 17.41 | | | | 28.09 | | | | 27.66 | | | | 28.38 | | | | 26.70 | | | | 26.33 | | | | 26.94 | | |
| Total return(c) (%) | | | 24.95 | | | | 23.96 | | | | 25.26 | | | | -28.15 | | | | -28.67 | | | | -27.97 | | | | 18.20 | | | | 17.31 | | | | 18.52 | | | | 22.24 | | | | 21.33 | | | | 22.53 | | |
| Ratios and supplemental data | |
Net assets, end of period
(millions) ($) | | | 4,024 | | | | 792 | | | | 2,211 | | | | 3,518 | | | | 737 | | | | 1,968 | | | | 5,974 | | | | 1,203 | | | | 3,942 | | | | 5,785 | | | | 1,145 | | | | 4,031 | | |
Ratio of operating expenses
to average net assets
including earnings credits (%) | | | 1.20 | | | | 1.95 | | | | 0.95 | | | | 1.15 | | | | 1.90 | | | | 0.90 | | | | 1.12 | | | | 1.87 | | | | 0.87 | | | | 1.12 | | | | 1.87 | | | | 0.87 | | |
Ratio of operating expenses
to average net assets
excluding earnings credits (%) | | | 1.20 | | | | 1.95 | | | | 0.95 | | | | 1.15 | | | | 1.90 | | | | 0.90 | | | | 1.12 | | | | 1.87 | | | | 0.87 | | | | 1.12 | | | | 1.87 | | | | 0.87 | | |
Ratio of net investment income
(loss) to average net assets
including earnings credits (%) | | | 1.51 | | | | 0.76 | | | | 1.75 | | | | 1.57 | | | | 0.82 | | | | 1.76 | | | | 1.54 | | | | 0.79 | | | | 1.80 | | | | 1.57 | | | | 0.81 | | | | 1.82 | | |
Ratio of net investment income
(loss) to average net assets
excluding earnings credits (%) | | | 1.51 | | | | 0.76 | | | | 1.75 | | | | 1.57 | | | | 0.82 | | | | 1.76 | | | | 1.54 | | | | 0.78 | | | | 1.79 | | | | 1.56 | | | | 0.81 | | | | 1.82 | | |
| Portfolio turnover rate (%) | | | 8.65 | | | | 8.65 | | | | 8.65 | | | | 15.72 | | | | 15.72 | | | | 15.72 | | | | 34.29 | | | | 34.29 | | | | 34.29 | | | | 27.98 | | | | 27.98 | | | | 27.98 | | |
FIRST EAGLE FUNDS | SEMI-ANNUAL REPORT | APRIL 30, 2011
107

Financial Highlights
| | | SIX-MONTHS ENDED | | YEAR ENDED OCTOBER 31, | |
| | | APRIL 30, 2011 (UNAUDITED) | | 2010 | |
| | | CLASS A | | CLASS C | | CLASS I | | CLASS A | | CLASS C | | CLASS I | |
Selected data for a share of beneficial interest outstanding throughout
each period is presented below:* | |
Net asset value,
beginning of period ($) | | | 15.94 | | | | 15.75 | | | | 16.12 | | | | 14.21 | | | | 14.06 | | | | 14.37 | | |
| Income from investment operations: | |
| Net investment income ($) | | | 0.08 | | | | 0.02 | | | | 0.10 | | | | 0.32 | | | | 0.21 | | | | 0.38 | | |
Net realized and unrealized
gains (losses) on investments | | | 1.95 | | | | 1.93 | | | | 1.98 | | | | 1.60 | | | | 1.58 | | | | 1.59 | | |
Total income (loss) from
investment operations | | | 2.03 | | | | 1.95 | | | | 2.08 | | | | 1.92 | | | | 1.79 | | | | 1.97 | | |
| Less distributions: | |
Dividends from net
investment income ($) | | | -0.33 | | | | -0.22 | | | | -0.37 | | | | -0.19 | | | | -0.10 | | | | -0.22 | | |
Distributions from
capital gains | | | — | | | | — | | | | — | | | | — | | | | — | | | | — | | |
| Total distributions | | | -0.33 | | | | -0.22 | | | | -0.37 | | | | -0.19 | | | | -0.10 | | | | -0.22 | | |
Net asset value,
end of period ($) | | | 17.64 | | | | 17.48 | | | | 17.83 | | | | 15.94 | | | | 15.75 | | | | 16.12 | | |
| Total return(c) (%) | | | 12.93 | (a) | | | 12.52 | (a) | | | 13.10 | (a) | | | 13.64 | | | | 12.75 | | | | 13.84 | | |
| Ratios and supplemental data | |
Net assets, end of period
(millions) ($) | | | 912 | | | | 393 | | | | 412 | | | | 680 | | | | 320 | | | | 328 | | |
Ratio of operating expenses
to average net assets
including earnings credits (%) | | | 1.19 | (b) | | | 1.94 | (b) | | | 0.94 | (b) | | | 1.23 | | | | 1.98 | | | | 0.99 | | |
Ratio of operating expenses
to average net assets
excluding earnings credits (%) | | | 1.19 | (b) | | | 1.94 | (b) | | | 0.94 | (b) | | | 1.23 | | | | 1.98 | | | | 0.99 | | |
Ratio of net investment
income to average net assets
including earnings credits (%) | | | 0.93 | (b) | | | 0.19 | (b) | | | 1.19 | (b) | | | 2.15 | | | | 1.41 | | | | 2.46 | | |
Ratio of net investment
income to average net assets
excluding earnings credits (%) | | | 0.93 | (b) | | | 0.19 | (b) | | | 1.19 | (b) | | | 2.15 | | | | 1.41 | | | | 2.46 | | |
| Portfolio turnover rate (%) | | | 16.85 | (a) | | | 16.85 | (a) | | | 16.85 | (a) | | | 12.23 | | | | 12.23 | | | | 12.23 | | |
* Per share amounts have been calculated using the average shares method.
(a) Not Annualized
(b) Annualized
(c) Does not take into account the sales charge of 5.00% for Class A shares and the CDSC (Contingent Deferred Sales Charge) of 1.00% for Class C shares.
See Notes to Financial Statements.
FIRST EAGLE FUNDS | SEMI-ANNUAL REPORT | APRIL 30, 2011
108
U.S. Value Fund
| | | YEAR ENDED OCTOBER 31, | |
| | | 2009 | | 2008 | | 2007 | | 2006 | |
| | | CLASS A | | CLASS C | | CLASS I | | CLASS A | | CLASS C | | CLASS I | | CLASS A | | CLASS C | | CLASS I | | CLASS A | | CLASS C | | CLASS I | |
Selected data for a share of beneficial interest outstanding throughout
each period is presented below:* | |
Net asset value,
beginning of period ($) | | | 12.75 | | | | 12.63 | | | | 12.89 | | | | 17.01 | | | | 16.87 | | | | 17.19 | | | | 16.19 | | | | 16.08 | | | | 16.34 | | | | 14.95 | | | | 14.90 | | | | 15.07 | | |
| Income from investment operations: | |
| Net investment income ($) | | | 0.21 | | | | 0.12 | | | | 0.24 | | | | 0.36 | | | | 0.24 | | | | 0.40 | | | | 0.33 | | | | 0.21 | | | | 0.38 | | | | 0.29 | | | | 0.17 | | | | 0.33 | | |
Net realized and unrealized
gains (losses) on investments | | | 1.58 | | | | 1.56 | | | | 1.60 | | | | -3.65 | | | | -3.63 | | | | -3.69 | | | | 1.45 | | | | 1.44 | | | | 1.46 | | | | 1.46 | | | | 1.47 | | | | 1.48 | | |
Total income (loss) from
investment operations | | | 1.79 | | | | 1.68 | | | | 1.84 | | | | -3.29 | | | | -3.39 | | | | -3.29 | | | | 1.78 | | | | 1.65 | | | | 1.84 | | | | 1.75 | | | | 1.64 | | | | 1.81 | | |
| Less distributions: | |
Dividends from net
investment income ($) | | | -0.22 | | | | -0.14 | | | | -0.25 | | | | -0.31 | | | | -0.19 | | | | -0.35 | | | | -0.30 | | | | -0.20 | | | | -0.33 | | | | -0.24 | | | | -0.19 | | | | -0.27 | | |
Distributions from
capital gains | | | -0.11 | | | | -0.11 | | | | -0.11 | | | | -0.66 | | | | -0.66 | | | | -0.66 | | | | -0.66 | | | | -0.66 | | | | -0.66 | | | | -0.27 | | | | -0.27 | | | | -0.27 | | |
| Total distributions | | | -0.33 | | | | -0.25 | | | | -0.36 | | | | -0.97 | | | | -0.85 | | | | -1.01 | | | | -0.96 | | | | -0.86 | | | | -0.99 | | | | -0.51 | | | | -0.46 | | | | -0.54 | | |
Net asset value,
end of period ($) | | | 14.21 | | | | 14.06 | | | | 14.37 | | | | 12.75 | | | | 12.63 | | | | 12.89 | | | | 17.01 | | | | 16.87 | | | | 17.19 | | | | 16.19 | | | | 16.08 | | | | 16.34 | | |
| Total return(c) (%) | | | 14.52 | | | | 13.63 | | | | 14.78 | | | | -20.56 | | | | -21.17 | | | | -20.36 | | | | 11.47 | | | | 10.65 | | | | 11.78 | | | | 12.05 | | | | 11.26 | | | | 12.35 | | |
| Ratios and supplemental data | |
Net assets, end of period
(millions) ($) | | | 547 | | | | 263 | | | | 199 | | | | 271 | | | | 167 | | | | 104 | | | | 324 | | | | 233 | | | | 104 | | | | 254 | | | | 161 | | | | 115 | | |
Ratio of operating expenses
to average net assets
including earnings credits (%) | | | 1.26 | | | | 2.00 | | | | 1.01 | | | | 1.20 | | | | 1.96 | | | | 0.95 | | | | 1.20 | | | | 1.95 | | | | 0.95 | | | | 1.25 | | | | 1.99 | | | | 0.99 | | |
Ratio of operating expenses
to average net assets
excluding earnings credits (%) | | | 1.26 | | | | 2.00 | | | | 1.01 | | | | 1.21 | | | | 1.96 | | | | 0.96 | | | | 1.20 | | | | 1.95 | | | | 0.96 | | | | 1.25 | | | | 2.00 | | | | 1.00 | | |
Ratio of net investment
income to average net assets
including earnings credits (%) | | | 1.63 | | | | 0.93 | | | | 1.90 | | | | 2.28 | | | | 1.53 | | | | 2.53 | | | | 2.04 | | | | 1.29 | | | | 2.32 | | | | 1.87 | | | | 1.13 | | | | 2.13 | | |
Ratio of net investment
income to average net assets
excluding earnings credits (%) | | | 1.63 | | | | 0.93 | | | | 1.90 | | | | 2.28 | | | | 1.52 | | | | 2.53 | | | | 2.04 | | | | 1.28 | | | | 2.32 | | | | 1.87 | | | | 1.12 | | | | 2.12 | | |
| Portfolio turnover rate (%) | | | 14.88 | | | | 14.88 | | | | 14.88 | | | | 21.75 | | | | 21.75 | | | | 21.75 | | | | 32.54 | | | | 32.54 | | | | 32.54 | | | | 31.76 | | | | 31.76 | | | | 31.76 | | |
FIRST EAGLE FUNDS | SEMI-ANNUAL REPORT | APRIL 30, 2011
109

Financial Highlights
| | | SIX-MONTHS ENDED | | YEAR ENDED OCTOBER 31, | |
| | | APRIL 30, 2011 (UNAUDITED) | | 2010 | |
| | | CLASS A | | CLASS C | | CLASS I | | CLASS A | | CLASS C | | CLASS I | |
Selected data for a share of beneficial interest outstanding throughout
each period is presented below:* | |
Net asset value,
beginning of period ($) | | | 33.42 | | | | 32.44 | | | | 33.81 | | | | 25.15 | | | | 24.52 | | | | 25.43 | | |
| Income (loss) from investment operations: | |
| Net investment loss ($) | | | -0.09 | | | | -0.21 | | | | -0.05 | | | | -0.17 | | | | -0.38 | | | | -0.11 | | |
Net realized and unrealized
gains (losses) on investments | | | 4.45 | | | | 4.33 | | | | 4.51 | | | | 8.82 | | | | 8.58 | | | | 8.92 | | |
Total income (loss) from
investment operations | | | 4.36 | | | | 4.12 | | | | 4.46 | | | | 8.65 | | | | 8.20 | | | | 8.81 | | |
| Less distributions: | |
Dividends from net
investment income ($) | | | -0.73 | | | | -0.56 | | | | -0.80 | | | | -0.38 | | | | -0.28 | | | | -0.43 | | |
Distributions from
capital gains | | | -1.21 | | | | -1.21 | | | | -1.21 | | | | — | | | | — | | | | — | | |
| Total distributions | | | -1.94 | | | | -1.77 | | | | -2.01 | | | | -0.38 | | | | -0.28 | | | | -0.43 | | |
Net asset value,
end of period ($) | | | 35.84 | | | | 34.79 | | | | 36.26 | | | | 33.42 | | | | 32.44 | | | | 33.81 | | |
| Total return(c) (%) | | | 13.56 | (a) | | | 13.15 | (a) | | | 13.71 | (a) | | | 34.73 | | | | 33.66 | | | | 35.01 | | |
| Ratios and supplemental data | |
Net assets, end of period
(millions) ($) | | | 1,998 | | | | 712 | | | | 857 | | | | 1,900 | | | | 616 | | | | 695 | | |
Ratio of operating expenses
to average net assets
including earnings credits (%) | | | 1.17 | (b) | | | 1.92 | (b) | | | 0.92 | (b) | | | 1.22 | | | | 1.97 | | | | 0.97 | | |
Ratio of operating expenses
to average net assets
excluding earnings credits (%) | | | 1.17 | (b) | | | 1.92 | (b) | | | 0.92 | (b) | | | 1.22 | | | | 1.97 | | | | 0.97 | | |
Ratio of net investment
loss to average net assets
including earnings credits (%) | | | -0.56 | (b) | | | -1.31 | (b) | | | -0.29 | (b) | | | -0.60 | | | | -1.35 | | | | -0.36 | | |
Ratio of net investment
loss to average net assets
excluding earnings credits (%) | | | -0.56 | (b) | | | -1.31 | (b) | | | -0.29 | (b) | | | -0.60 | | | | -1.35 | | | | -0.36 | | |
| Portfolio turnover rate (%) | | | 7.04 | (a) | | | 7.04 | (a) | | | 7.04 | (a) | | | 5.50 | | | | 5.50 | | | | 5.50 | | |
* Per share amounts have been calculated using the average shares method.
(a) Not Annualized
(b) Annualized
(c) Does not take into account the sales charge of 5.00% for Class A shares and the CDSC (Contingent Deferred Sales Charge) of 1.00% for Class C shares.
See Notes to Financial Statements.
FIRST EAGLE FUNDS | SEMI-ANNUAL REPORT | APRIL 30, 2011
110
Gold Fund
| | | YEAR ENDED OCTOBER 31, | |
| | | 2009 | | 2008 | | 2007 | | 2006 | |
| | | CLASS A | | CLASS C | | CLASS I | | CLASS A | | CLASS C | | CLASS I | | CLASS A | | CLASS C | | CLASS I | | CLASS A | | CLASS C | | CLASS I | |
Selected data for a share of beneficial interest outstanding throughout
each period is presented below:* | |
Net asset value,
beginning of period ($) | | | 14.85 | | | | 14.60 | | | | 14.98 | | | | 27.28 | | | | 26.86 | | | | 27.48 | | | | 23.48 | | | | 23.17 | | | | 23.62 | | | | 17.45 | | | | 17.25 | | | | 17.55 | | |
| Income (loss) from investment operations: | |
| Net investment loss ($) | | | -0.14 | | | | -0.30 | | | | -0.09 | | | | -0.09 | | | | -0.27 | | | | -0.05 | | | | -0.12 | | | | -0.28 | | | | -0.07 | | | | -0.13 | | | | -0.30 | | | | -0.08 | | |
Net realized and unrealized
gains (losses) on investments | | | 11.50 | | | | 11.28 | | | | 11.60 | | | | -10.61 | | | | -10.43 | | | | -10.66 | | | | 7.72 | | | | 7.61 | | | | 7.78 | | | | 6.65 | | | | 6.60 | | | | 6.69 | | |
Total income (loss) from
investment operations | | | 11.36 | | | | 10.98 | | | | 11.51 | | | | -10.70 | | | | -10.70 | | | | -10.71 | | | | 7.60 | | | | 7.33 | | | | 7.71 | | | | 6.52 | | | | 6.30 | | | | 6.61 | | |
| Less distributions: | |
Dividends from net
investment income ($) | | | — | | | | — | | | | — | | | | -0.78 | | | | -0.61 | | | | -0.84 | | | | -0.74 | | | | -0.58 | | | | -0.79 | | | | -0.49 | | | | -0.38 | | | | -0.54 | | |
Distributions from
capital gains | | | -1.06 | | | | -1.06 | | | | -1.06 | | | | -0.95 | | | | -0.95 | | | | -0.95 | | | | -3.06 | | | | -3.06 | | | | -3.06 | | | | — | | | | — | | | | — | | |
| Total distributions | | | -1.06 | | | | -1.06 | | | | -1.06 | | | | -1.73 | | | | -1.56 | | | | -1.79 | | | | -3.80 | | | | -3.64 | | | | -3.85 | | | | -0.49 | | | | -0.38 | | | | -0.54 | | |
Net asset value,
end of period ($) | | | 25.15 | | | | 24.52 | | | | 25.43 | | | | 14.85 | | | | 14.60 | | | | 14.98 | | | | 27.28 | | | | 26.86 | | | | 27.48 | | | | 23.48 | | | | 23.17 | | | | 23.62 | | |
| Total return(c) (%) | | | 78.93 | | | | 77.62 | | | | 79.27 | | | | -41.56 | | | | -41.99 | | | | -41.36 | | | | 37.57 | | | | 36.55 | | | | 37.93 | | | | 37.97 | | | | 36.95 | | | | 38.29 | | |
| Ratios and supplemental data | |
Net assets, end of period
(millions) ($) | | | 1,325 | | | | 362 | | | | 165 | | | | 480 | | | | 109 | | | | 71 | | | | 890 | | | | 196 | | | | 166 | | | | 774 | | | | 158 | | | | 147 | | |
Ratio of operating expenses
to average net assets
including earnings credits (%) | | | 1.26 | | | | 2.01 | | | | 1.01 | | | | 1.21 | | | | 1.96 | | | | 0.95 | | | | 1.20 | | | | 1.95 | | | | 0.95 | | | | 1.21 | | | | 1.96 | | | | 0.96 | | |
Ratio of operating expenses
to average net assets
excluding earnings credits (%) | | | 1.26 | | | | 2.01 | | | | 1.01 | | | | 1.21 | | | | 1.96 | | | | 0.96 | | | | 1.20 | | | | 1.95 | | | | 0.95 | | | | 1.22 | | | | 1.97 | | | | 0.97 | | |
Ratio of net investment
loss to average net assets
including earnings credits (%) | | | -0.65 | | | | -1.40 | | | | -0.40 | | | | -0.38 | | | | -1.13 | | | | -0.20 | | | | -0.55 | | | | -1.30 | | | | -0.30 | | | | -0.59 | | | | -1.33 | | | | -0.34 | | |
Ratio of net investment
loss to average net assets
excluding earnings credits (%) | | | -0.65 | | | | -1.40 | | | | -0.40 | | | | -0.38 | | | | -1.14 | | | | -0.20 | | | | -0.56 | | | | -1.31 | | | | -0.31 | | | | -0.59 | | | | -1.34 | | | | -0.34 | | |
| Portfolio turnover rate (%) | | | 3.00 | | | | 3.00 | | | | 3.00 | | | | 8.74 | | | | 8.74 | | | | 8.74 | | | | 16.37 | | | | 16.37 | | | | 16.37 | | | | 32.26 | | | | 32.26 | | | | 32.26 | | |
FIRST EAGLE FUNDS | SEMI-ANNUAL REPORT | APRIL 30, 2011
111

Financial Highlights
| | | SIX-MONTHS ENDED | | YEAR ENDED OCTOBER 31, | |
| | | APRIL 30, 2011 (UNAUDITED) | | 2010 | |
| | | CLASS A | | CLASS C | | CLASS Y | | CLASS A | | CLASS C | | CLASS Y | |
Selected data for a share of beneficial interest outstanding throughout
each period is presented below:* | |
Net asset value,
beginning of period ($) | | | 24.06 | | | | 21.32 | | | | 24.47 | | | | 19.32 | | | | 17.25 | | | | 19.66 | | |
| Income (loss) from investment operations: | |
| Net investment income (loss) ($) | | | -0.02 | | | | -0.10 | | | | -0.01 | | | | 0.13 | | | | -0.03 | | | | 0.14 | | |
Net realized and unrealized
gains (losses) on investments | | | 4.24 | | | | 3.75 | | | | 4.31 | | | | 4.61 | | | | 4.10 | | | | 4.67 | | |
Total income (loss) from
investment operations | | | 4.22 | | | | 3.65 | | | | 4.30 | | | | 4.74 | | | | 4.07 | | | | 4.81 | | |
| Less distributions: | |
Dividends from net
investment income ($) | | | -0.17 | | | | -0.04 | | | | -0.16 | | | | — | | | | — | | | | — | | |
Distributions from
capital gains | | | — | | | | — | | | | — | | | | — | | | | — | | | | — | | |
| Total distributions | | | -0.17 | | | | -0.04 | | | | -0.16 | | | | — | | | | — | | | | — | | |
Net asset value,
end of period ($) | | | 28.11 | | | | 24.93 | | | | 28.61 | | | | 24.06 | | | | 21.32 | | | | 24.47 | | |
| Total return(c) (%) | | | 17.61 | (a) | | | 17.15 | (a) | | | 17.65 | (a) | | | 24.53 | | | | 23.59 | | | | 24.47 | | |
| Ratios and supplemental data | |
Net assets, end of period
(millions) ($) | | | 557 | | | | 190 | | | | 725 | | | | 379 | | | | 122 | | | | 599 | | |
Ratio of operating expenses
to average net assets
including earnings credits (%) | | | 1.43 | (b) | | | 2.17 | (b) | | | 1.43 | (b) | | | 1.47 | | | | 2.22 | | | | 1.47 | | |
Ratio of operating expenses
to average net assets
excluding earnings credits (%) | | | 1.43 | (b) | | | 2.17 | (b) | | | 1.43 | (b) | | | 1.47 | | | | 2.22 | | | | 1.47 | | |
Ratio of net investment income
(loss) to average net assets
including earnings credits (%) | | | -0.13 | (b) | | | -0.89 | (b) | | | -0.11 | (b) | | | 0.61 | | | | -0.14 | | | | 0.62 | | |
Ratio of net investment income
(loss) to average net assets
excluding earnings credits (%) | | | -0.13 | (b) | | | -0.89 | (b) | | | -0.11 | (b) | | | 0.61 | | | | -0.14 | | | | 0.62 | | |
| Portfolio turnover rate (%) | | | 23.92 | (a) | | | 23.92 | (a) | | | 23.92 | (a) | | | 40.00 | | | | 40.00 | | | | 40.00 | | |
* Per share amounts have been calculated using the average shares method.
(a) Not Annualized
(b) Annualized
(c) Does not take into account the sales charge of 5.00% for Class A shares and the CDSC (Contingent Deferred Sales Charge) of 1.00% for Class C shares.
(d) Investment income (loss) per share reflects special dividends received in Class A, C and Y which amounts to $0.13, $0.12, and $0.13 per share. Excluding the special dividend, the ratio of net investment income (loss) to average new assets both with and without the effect of earnings credits in Class A, C and Y would have been -0.31%, -1.00%, and -0.22%.
See Notes to Financial Statements.
FIRST EAGLE FUNDS | SEMI-ANNUAL REPORT | APRIL 30, 2011
112
Fund of America
| | | YEAR ENDED OCTOBER 31, | |
| | | 2009 | | 2008 | | 2007 | | 2006 | |
| | | CLASS A | | CLASS C | | CLASS Y | | CLASS A | | CLASS C | | CLASS Y | | CLASS A | | CLASS C | | CLASS Y | | CLASS A | | CLASS C | | CLASS Y | |
Selected data for a share of beneficial interest outstanding throughout
each period is presented below:* | |
Net asset value,
beginning of period ($) | | | 18.92 | | | | 17.14 | | | | 19.23 | | | | 29.79 | | | | 27.39 | | | | 30.22 | | | | 27.92 | | | | 26.12 | | | | 28.28 | | | | 26.11 | | | | 24.74 | | | | 26.42 | | |
| Income (loss) from investment operations: | |
| Net investment income (loss) ($) | | | -0.06 | | | | -0.18 | | | | -0.07 | | | | -0.06 | | | | -0.20 | | | | -0.01 | | | | 0.05 | (d) | | | -0.13 | (d) | | | 0.07 | (d) | | | -0.08 | | | | -0.26 | | | | -0.08 | | |
Net realized and unrealized
gains (losses) on investments | | | 1.61 | | | | 1.44 | | | | 1.65 | | | | -7.85 | | | | -7.16 | | | | -8.03 | | | | 5.30 | | | | 4.88 | | | | 5.35 | | | | 4.23 | | | | 3.98 | | | | 4.28 | | |
Total income (loss) from
investment operations | | | 1.55 | | | | 1.26 | | | | 1.58 | | | | -7.91 | | | | -7.36 | | | | -8.04 | | | | 5.35 | | | | 4.75 | | | | 5.42 | | | | 4.15 | | | | 3.72 | | | | 4.20 | | |
| Less distributions: | |
Dividends from net
investment income ($) | | | — | | | | — | | | | — | | | | -0.07 | | | | — | | | | -0.06 | | | | — | | | | — | | | | — | | | | — | | | | — | | | | — | | |
Distributions from
capital gains | | | -1.15 | | | | -1.15 | | | | -1.15 | | | | -2.89 | | | | -2.89 | | | | -2.89 | | | | -3.48 | | | | -3.48 | | | | -3.48 | | | | -2.34 | | | | -2.34 | | | | -2.34 | | |
| Total distributions | | | -1.15 | | | | -1.15 | | | | -1.15 | | | | -2.96 | | | | -2.89 | | | | -2.95 | | | | -3.48 | | | | -3.48 | | | | -3.48 | | | | -2.34 | | | | -2.34 | | | | -2.34 | | |
Net asset value,
end of period ($) | | | 19.32 | | | | 17.25 | | | | 19.66 | | | | 18.92 | | | | 17.14 | | | | 19.23 | | | | 29.79 | | | | 27.39 | | | | 30.22 | | | | 27.92 | | | | 26.12 | | | | 28.28 | | |
| Total return(c) (%) | | | 9.13 | | | | 8.34 | | | | 9.14 | | | | -29.20 | | | | -29.74 | | | | -29.23 | | | | 21.28 | | | | 20.34 | | | | 21.25 | | | | 16.81 | | | | 15.93 | | | | 16.80 | | |
| Ratios and supplemental data | |
Net assets, end of period
(millions) ($) | | | 276 | | | | 90 | | | | 503 | | | | 127 | | | | 61 | | | | 501 | | | | 82 | | | | 65 | | | | 756 | | | | 46 | | | | 48 | | | | 671 | | |
Ratio of operating expenses
to average net assets
including earnings credits (%) | | | 1.50 | | | | 2.25 | | | | 1.50 | | | | 1.41 | | | | 2.16 | | | | 1.41 | | | | 1.40 | | | | 2.15 | | | | 1.40 | | | | 1.41 | | | | 2.16 | | | | 1.41 | | |
Ratio of operating expenses
to average net assets
excluding earnings credits (%) | | | 1.50 | | | | 2.25 | | | | 1.50 | | | | 1.42 | | | | 2.17 | | | | 1.42 | | | | 1.41 | | | | 2.16 | | | | 1.41 | | | | 1.41 | | | | 2.16 | | | | 1.41 | | |
Ratio of net investment income
(loss) to average net assets
including earnings credits (%) | | | -0.34 | | | | -1.10 | | | | -0.37 | | | | -0.23 | | | | -0.87 | | | | -0.06 | | | | 0.18 | (d) | | | -0.51 | (d) | | | 0.26 | (d) | | | -0.30 | | | | -1.05 | | | | -0.30 | | |
Ratio of net investment income
(loss) to average net assets
excluding earnings credits (%) | | | -0.34 | | | | -1.10 | | | | -0.37 | | | | -0.24 | | | | -0.88 | | | | -0.07 | | | | 0.17 | (d) | | | -0.52 | (d) | | | 0.25 | (d) | | | -0.30 | | | | -1.05 | | | | -0.30 | | |
| Portfolio turnover rate (%) | | | 40.41 | | | | 40.41 | | | | 40.41 | | | | 63.97 | | | | 63.97 | | | | 63.97 | | | | 50.26 | | | | 50.26 | | | | 50.26 | | | | 40.38 | | | | 40.38 | | | | 40.38 | | |
FIRST EAGLE FUNDS | SEMI-ANNUAL REPORT | APRIL 30, 2011
113
Notes to Financial Statements (unaudited)
Note 1 — Significant Accounting Policies
First Eagle Funds (the "Trust"), is an open-end management investment company registered under the Investment Company Act of 1940, as amended ("1940 Act"). The Trust consists of five separate portfolios, First Eagle Global Fund, First Eagle Overseas Fund, First Eagle U.S. Value Fund, First Eagle Gold Fund and First Eagle Fund of America (each individually a "Fund" or collectively the "Funds"). All the Funds are diversified mutual funds except for First Eagle Gold Fund and First Eagle Fund of America, which are non-diversified. The Trust is a Delaware statutory trust. The First Eagle Global Fund seeks long-term growth of capital by investing in a range of asset classes from markets in the United States and around the world. The First Eagle Overseas Fund seeks long-term growth of capital by investing primarily in equities issued by non-U.S. corporations. The First Eagle U.S. Value Fund seeks long-term growth of capital by investing, under normal market conditions, primarily in equity and debt securities issued by U.S. corporations. The First Eagle Gold Fund is a non-diversified fund whose investment objective is to provide exposure to the investment characteristics of gold and, to a limited extent, other precious metals. The First Eagle Fund of America is a non-diversified fund that seeks capital appreciation by investing primarily in U.S. stocks and, to a lesser extent, in debt and international equity securities.
The following is a summary of significant accounting policies adhered to by the Funds and are in conformity with U.S. generally accepted accounting principles ("GAAP").
a) Investment in Subsidiary — The First Eagle Gold Fund (the "Gold Fund") may invest in certain precious metals through its investment in the First Eagle Gold Cayman Fund, Ltd., a wholly owned subsidiary (the "Subsidiary"). The Gold Fund may invest up to 25% of its total assets in shares of the Subsidiary. The Subsidiary has the ability to invest in commodities and securities consistent with the investment objective of the Gold Fund.
The Subsidiary, established on May 28, 2010, is an exempted company under the laws of the Cayman Islands. The consolidated financial statements include the accounts of the Gold Fund and the Subsidiary. All intercompany transactions and balances have been eliminated. As of April 30, 2011, the Subsidiary has $40,898,869 in net assets, representing 1.15% of the Gold Fund's net assets.
FIRST EAGLE FUNDS | SEMI-ANNUAL REPORT | APRIL 30, 2011
114
(continued)
b) Investment valuation — Each Fund computes its net asset value once daily as of the close of trading on each day the New York Stock Exchange ("NYSE") is open for trading. The net asset value per share is computed by dividing the total current value of the assets of a Fund, less its liabilities, by the total number of shares outstanding at the time of such computation.
A portfolio security (including an option), other than a bond, which is traded on a U.S. national securities exchange or a securities exchange abroad is normally valued at the price of the last sale on the exchange as of the close of business on the date on which assets are valued. If there are no sales on such date, such portfolio investment will be valued at the mean between the closing bid and asked prices (and if there is only a bid or only an asked price on such date, valuation will be at such bid or asked price for long or short positions, respectively). Securities, other than bonds, traded in the over-the-counter market are valued at the mean between the last bid and asked prices prior to the time of valuation (and if there is only a bid or only an asked price on such date, valuation will be at such bid or asked price for long or short positions, respectively), except if such unlisted security traded on the NASDAQ, in which case it is valued at its last sale price (or, if available, the NASDAQ Official Closing Price).
Commodities (such as physical metals) are valued at the spot price at the time trading on the New York Stock Exchange closes (normally 4:00 p.m. E.S.T.).
All bonds, whether listed on an exchange or traded in the over-the-counter market (and except for short-term investments as described in the next sentence), for which market quotations are readily available are valued at the mean between the last bid and asked prices received from dealers in the over-the-counter market in the United States or abroad, except that when no asked price is available, bonds are valued at the last bid price alone. Short-term investments maturing in sixty days or less are valued at cost plus interest earned (or discount amortized, as the case may be), which is deemed to approximate value.
The 2:00 p.m. E.S.T. exchange rates typically are used to convert foreign security prices into U.S. dollars. Any security that is listed or traded on more than one exchange (or traded in multiple markets) is valued at the relevant quotation on the exchange or market deemed to be the primary trading venue for that security. In the absence of such a quotation, a quotation from the exchange or market deemed by the Adviser to be the secondary trading
FIRST EAGLE FUNDS | SEMI-ANNUAL REPORT | APRIL 30, 2011
115
Notes to Financial Statements (unaudited)
venue for the particular security shall be used. The Funds use pricing services to identify the market prices of publicly traded securities in their portfolios. When market prices are determined to be "stale" as a result of limited market activity for a particular holding, or in other circumstances when market prices are unavailable, such as for private placements, or determined to be unreliable for a particular holding, such holdings may be "fair valued" in accordance with procedures approved by the Board of Trustees ("Board"). Additionally, with respect to foreign holdings, specifically in circumstances leading the Adviser to believe that significant events occurring after the close of a foreign market have materially affected the value of a Fund's holdings in that market, such holdings may be fair valued to reflect the events in accordance with procedures approved by the Board. The determination of whether a particular foreign investment should be fair valued will be based on review of a number of factors, including developments in foreign markets, the performance of U.S. securities markets and security-specific events. The values assigned to a Fund's holdings therefore may differ on occasion from reported market values.
Certain Funds with non-U.S. holdings have adopted procedures under which movements in U.S. securities markets (beyond specified thresholds) occurring after the close of a foreign market may require fair valuation of securities traded in that foreign market. The values assigned to a Fund's foreign holdings therefore may differ on occasion from reported market values. The Trust and the Adviser believe relying on the procedures described above will result in prices that are more reflective of the actual market value of portfolio securities held by the Funds as of 4:00 p.m. E.S.T.
The Funds adopted provisions surrounding fair value measurements and disclosures that define fair value, establishes a framework for measuring fair value in generally accepted accounting principles and expands disclosures about fair value measurements. This applies to fair value measurements that are already required or permitted by other accounting standards and is intended to increase consistency of those measurements and applies broadly to securities and other types of assets and liabilities.
FIRST EAGLE FUNDS | SEMI-ANNUAL REPORT | APRIL 30, 2011
116
(continued)
The Funds disclose the fair value of their investments in a hierarchy that prioritizes the inputs or assumptions to valuation techniques used to measure fair value. These inputs are used in determining the value of the Funds' investments and are summarized in the following fair value hierarchy:
Level 1 — Quoted prices in active markets for identical securities.
Level 2 — Other significant observable inputs (including quoted prices for similar securities, interest rates, prepayment speeds, credit risk, etc.).
Level 3 — Other significant unobservable inputs (including Fund's own assumption in determining the fair value of investments).
FIRST EAGLE FUNDS | SEMI-ANNUAL REPORT | APRIL 30, 2011
117
Notes to Financial Statements (unaudited)
The following is a summary of the Funds' inputs used to value the Funds' investments as of April 30, 2011:
| First Eagle Global Fund | |
| DESCRIPTION | | LEVEL 1 | | LEVEL 2 | | LEVEL 3(a) | | TOTAL | |
| Assets: † | |
| U.S. Common Stocks | | $ | 9,444,655,279 | | | $ | 4,418,090 | | | $ | — | | | $ | 9,449,073,369 | | |
International
Common Stocks | | | 13,324,775,786 | | | | 15,710,414 | | | | 12,237,978 | | | | 13,352,724,178 | | |
| U.S. Preferred Stocks | | | — | | | | 16,900,750 | | | | — | | | | 16,900,750 | | |
International
Preferred Stocks | | | 333,096,698 | | | | 39,880,670 | | | | — | | | | 372,977,368 | | |
| Warrant | | | 78,289,252 | | | | — | | | | — | | | | 78,289,252 | | |
| Commodity* | | | 1,805,594,108 | | | | — | | | | — | | | | 1,805,594,108 | | |
| U.S. Bonds | | | — | | | | 46,882,502 | | | | — | | | | 46,882,502 | | |
International
Corporate Notes
and Bonds | | | — | | | | 77,945,715 | | | | 35,605,192 | | | | 113,550,907 | | |
International
Government Bonds | | | — | | | | 630,746,903 | | | | — | | | | 630,746,903 | | |
International
Commercial Paper | | | — | | | | 2,629,726,159 | | | | — | | | | 2,629,726,159 | | |
| U.S. Commercial Paper | | | — | | | | 2,211,194,858 | | | | — | | | | 2,211,194,858 | | |
| Total | | $ | 24,986,411,123 | | | $ | 5,673,406,061 | | | $ | 47,843,170 | | | $ | 30,707,660,354 | | |
| Liabilities: | |
Covered Call
Options Written | | $ | — | | | $ | 1,462,500 | | | $ | — | | | $ | 1,462,500 | | |
Foreign Currency
Contracts** | | | 147,617,124 | | | | — | | | | — | | | | 147,617,124 | | |
| Total | | $ | 147,617,124 | | | $ | 1,462,500 | | | $ | — | | | $ | 149,079,624 | | |
(a) Level 3 securities are identified in the Schedule of Investments with footnote (e).
† See Schedule of Investments for additional detailed categorizations.
* Represents gold bullion.
** Foreign currency contracts are value at net unrealized appreciation (depreciation) on the investment.
For the six-month period ended April 30, 2011, there was no security transfer activity from Level 1 to Level 2 and no security transfer activity from Level 2 to Level 1.
FIRST EAGLE FUNDS | SEMI-ANNUAL REPORT | APRIL 30, 2011
118
(continued)
Fair Value Level 3 activity for the period ended April 30, 2011 was as follows:
| First Eagle Global Fund — (continued) | |
| | | | | INTERNATIONAL | | INTERNATIONAL | | | |
| | | INTERNATIONAL | | PREFERRED | | CORPORATE | | | |
| | | COMMON STOCKS | | STOCKS | | BONDS | | TOTAL VALUE | |
Beginning Balance —
market value | | $ | 5,478,123 | | | $ | 26,991,080 | | | $ | 29,212,067 | | | $ | 61,681,270 | | |
| Purchases (Sales) | | | — | | | | — | | | | — | # | | | — | | |
| Transfer In — Level 3^ | | | — | | | | — | | | | — | | | | — | | |
| Transfer Out — Level 3^ | | | — | | | | (26,991,080 | ) | | | — | | | | (26,991,080 | ) | |
| Accrued Amortization | | | — | | | | — | | | | — | | | | — | | |
| Realized Gains (Losses)* | | | — | | | | — | | | | (16,339,337 | ) | | | (16,339,337 | ) | |
Change in Unrealized
Appreciation (Depreciation)** | | | 6,759,855 | | | | — | | | | 22,732,462 | | | | 29,492,317 | | |
Ending Balance —
market value | | $ | 12,237,978 | | | $ | — | | | $ | 35,605,192 | | | $ | 47,843,170 | | |
Change in unrealized gains or
losses relating to assets still
held at reporting date | | $ | 6,759,855 | | | $ | — | | | $ | 6,393,125 | | | $ | 13,152,980 | | |
* Statements of Operations location: Net realized gains (losses) from investment transactions.
** Statements of Operations location: Changes in unrealized appreciation (depreciation) of investment transactions.
^ Transfers into/out of Level 3 represent values as of the beginning of the period.
International Preferred Stocks valued at $26,991,080 were transferred from Level 3 to Level 2 during the six-month period ended April 30, 2011. At October 31, 2010 these securities were valued based on the fair value procedures approved by the Board of Trustees; at April 30, 2011, these securities were valued using broker-dealer bid quotations based on inputs observable to the Fund.
# Security was matured as such there was no sale amount associated with the realized gains (losses) balance.
FIRST EAGLE FUNDS | SEMI-ANNUAL REPORT | APRIL 30, 2011
119
Notes to Financial Statements (unaudited)
| First Eagle Overseas Fund | |
| DESCRIPTION | | LEVEL 1 | | LEVEL 2 | | LEVEL 3(a) | | TOTAL | |
| Assets: † | |
International
Common Stocks | | $ | 7,623,385,881 | | | $ | 7,062,741 | | | $ | 48,026,618 | | | $ | 7,678,475,240 | | |
| U.S. Common Stocks | | | 41,477,300 | | | | — | | | | — | | | | 41,477,300 | | |
International
Preferred Stocks | | | 205,393,573 | | | | 11,931,006 | | | | — | | | | 217,324,579 | | |
| Commodity* | | | 751,722,100 | | | | — | | | | — | | | | 751,722,100 | | |
| Term loans | | | — | | | | 17,371,483 | | | | — | | | | 17,371,483 | | |
International
Corporate Bonds | | | — | | | | 49,228,461 | | | | 23,736,795 | | | | 72,965,256 | | |
International
Government Bonds | | | — | | | | 349,021,859 | | | | — | | | | 349,021,859 | | |
International
Commercial Paper | | | — | | | | 1,478,596,224 | | | | — | | | | 1,478,596,224 | | |
| U.S. Commercial Paper | | | — | | | | 237,389,393 | | | | — | | | | 237,389,393 | | |
| Total | | $ | 8,621,978,854 | | | $ | 2,150,601,167 | | | $ | 71,763,413 | | | $ | 10,844,343,434 | | |
| Liabilities: | |
Foreign Currency
Contracts** | | $ | 85,550,495 | | | $ | — | | | $ | — | | | $ | 85,550,495 | | |
| Total | | $ | 85,550,495 | | | $ | — | | | $ | — | | | $ | 85,550,495 | | |
(a) Level 3 securities are identified in the Schedule of Investments with footnote (d).
† See Schedule of Investments for additional detailed categorizations.
* Represents gold bullion.
** Foreign currency contracts are value at net unrealized appreciation (depreciation) on the investment.
For the six-month period ended April 30, 2011, there was no security transfer activity from Level 1 to Level 2 and no security transfer activity from Level 2 to Level 1.
FIRST EAGLE FUNDS | SEMI-ANNUAL REPORT | APRIL 30, 2011
120
(continued)
Fair Value Level 3 activity for the period ended April 30, 2011 was as follows:
| First Eagle Overseas Fund — (continued) | |
| | | | | INTERNATIONAL | | INTERNATIONAL | | | |
| | | INTERNATIONAL | | PREFERRED | | CORPORATE | | | |
| | | COMMON STOCKS | | STOCKS | | BONDS | | TOTAL VALUE | |
Beginning Balance —
market value | | $ | 39,030,672 | | | $ | 8,074,858 | | | $ | 19,474,711 | | | $ | 66,580,241 | | |
| Purchases (Sales) | | | — | | | | — | | | | — | # | | | — | | |
| Transfer In — Level 3^ | | | — | | | | — | | | | — | | | | — | | |
| Transfer Out — Level 3^ | | | — | | | | (8,074,858 | ) | | | — | | | | (8,074,858 | ) | |
| Accrued Amortization | | | — | | | | — | | | | — | | | | — | | |
| Realized Losses* | | | — | | | | — | | | | (27,682,258 | ) | | | (27,682,258 | ) | |
Change in Unrealized
Appreciation (Depreciation)** | | | 8,995,946 | | | | — | | | | 31,944,342 | | | | 40,940,288 | | |
Ending Balance —
market value | | $ | 48,026,618 | | | $ | — | | | $ | 23,736,795 | | | $ | 71,763,413 | | |
Change in unrealized gains or
losses relating to assets still
held at reporting date | | $ | 8,995,946 | | | $ | — | | | $ | 4,262,084 | | | $ | 13,258,030 | | |
* Statements of Operations location: Net realized gains (losses) from investment transactions.
** Statements of Operations location: Changes in unrealized appreciation (depreciation) of investment transactions.
^ Transfers into/out of Level 3 represent values as of the beginning of the period.
International Preferred Stocks valued at $8,074,858 were transferred from Level 3 to Level 2 during the six-month period ended April 30, 2011. At October 31, 2010 these securities were valued based on the fair value procedures approved by the Board of Trustees; at April 30, 2011, these securities were valued using broker-dealer bid quotations based on inputs observable to the Fund.
# Security was matured as such there was no sale amount associated with the realized gains (losses) balance.
FIRST EAGLE FUNDS | SEMI-ANNUAL REPORT | APRIL 30, 2011
121
Notes to Financial Statements (unaudited)
| First Eagle U.S. Value Fund | |
| DESCRIPTION | | LEVEL 1 | | LEVEL 2 | | LEVEL 3(a) | | TOTAL | |
| Assets: † | |
| U.S. Common Stocks | | $ | 1,060,456,526 | | | $ | 3,546 | | | $ | — | | | $ | 1,060,460,072 | | |
International
Common Stocks | | | 81,679,846 | | | | — | | | | — | | | | 81,679,846 | | |
| U.S. Preferred Stocks | | | — | | | | 4,444,645 | | | | 4,722,863 | | | | 9,167,508 | | |
| Investment Company | | | 9,978,218 | | | | — | | | | — | | | | 9,978,218 | | |
| Warrant | | | 8,741,211 | | | | — | | | | — | | | | 8,741,211 | | |
| Commodity* | | | 82,038,104 | | | | — | | | | — | | | | 82,038,104 | | |
International
Corporate Bond | | | — | | | | 10,087,500 | | | | — | | | | 10,087,500 | | |
| U.S. Bonds | | | — | | | | 36,714,147 | | | | — | | | | 36,714,147 | | |
| U.S. Treasury Bills | | | — | | | | 112,977,054 | | | | — | | | | 112,977,054 | | |
International
Commercial Paper | | | — | | | | 47,431,744 | | | | — | | | | 47,431,744 | | |
| U.S. Commercial Paper | | | — | | | | 255,091,442 | | | | — | | | | 255,091,442 | | |
| Total | | $ | 1,242,893,905 | | | $ | 466,750,078 | | | $ | 4,722,863 | | | $ | 1,714,366,846 | | |
| Liabilities: | |
Covered Call
Options Written | | $ | — | | | $ | 448,800 | | | $ | — | | | $ | 448,800 | | |
| Total | | $ | — | | | $ | 448,800 | | | $ | — | | | $ | 448,800 | | |
(a) Level 3 securities are identified in the Schedule of Investments with footnote (e).
† See Schedule of Investments for additional detailed categorizations.
* Represents gold bullion.
For the six-month period ended April 30, 2011, there was no security transfer activity from Level 1 to Level 2 and no security transfer activity from Level 2 to Level 1.
FIRST EAGLE FUNDS | SEMI-ANNUAL REPORT | APRIL 30, 2011
122
(continued)
Fair Value Level 3 activity for the period ended April 30, 2011 was as follows:
| First Eagle U.S. Value Fund — (continued) | |
| | | U.S. PREFERRED STOCK | |
| Beginning Balance — market value | | $ | 3,901,937 | | |
| Purchases (Sales) | | | — | | |
| Transfer In — Level 3 | | | — | | |
| Transfer Out — Level 3 | | | — | | |
| Accrued Amortization | | | — | | |
| Realized Gains (Losses) | | | — | | |
| Change in Unrealized Appreciation (Depreciation)** | | | 820,926 | | |
| Ending Balance — market value | | $ | 4,722,863 | | |
Change in unrealized gains or losses relating to assets still held at
reporting date | | $ | 820,926 | | |
| First Eagle Gold Fund | |
| DESCRIPTION | | LEVEL 1 | | LEVEL 2 | | LEVEL 3(a) | | TOTAL | |
| Assets: † | |
International
Common Stocks | | $ | 2,636,196,666 | | | $ | — | | | $ | — | | | $ | 2,636,196,666 | | |
| U.S. Common Stocks | | | 254,638,180 | | | | — | | | | — | | | | 254,638,180 | | |
| Investment Company | | | — | | | | 381,045 | | | | — | | | | 381,045 | | |
International
Preferred Stocks | | | 6,768,000 | | | | — | | | | — | | | | 6,768,000 | | |
| Warrant | | | 774,391 | | | | — | | | | — | | | | 774,391 | | |
| Commodity* | | | 529,513,273 | | | | — | | | | — | | | | 529,513,273 | | |
International
Convertible Bonds | | | — | | | | 2,903,907 | | | | 30,000,000 | | | | 32,903,907 | | |
International
Commercial Paper | | | — | | | | 40,929,694 | | | | — | | | | 40,929,694 | | |
| U.S. Commercial Paper | | | — | | | | 44,993,889 | | | | — | | | | 44,993,889 | | |
| Total | | $ | 3,427,890,510 | | | $ | 89,208,535 | | | $ | 30,000,000 | | | $ | 3,547,099,045 | | |
* Represents gold bullion.
** Statements of Operations location: Changes in unrealized appreciation (depreciation) of investment transactions.
(a) Level 3 securities are identified in the Schedule of Investments with footnote (f).
† See Consolidated Schedule of Investments for additional detailed categorizations.
For the six-month period ended April 30, 2011, there was no security transfer activity from Level 1 to Level 2 and no security transfer activity from Level 2 to Level 1.
FIRST EAGLE FUNDS | SEMI-ANNUAL REPORT | APRIL 30, 2011
123
Notes to Financial Statements (unaudited)
Fair Value Level 3 activity for the period ended April 30, 2011 was as follows:
| First Eagle Gold Fund — (continued) | |
| | | U.S. PREFERRED STOCK | |
| Beginning Balance — market value | | $ | — | | |
| Purchases (Sales) | | | 30,000,000 | | |
| Transfer In — Level 3 | | | — | | |
| Transfer Out — Level 3 | | | — | | |
| Accrued Amortization | | | — | | |
| Realized Gains (Losses) | | | — | | |
| Change in Unrealized Appreciation (Depreciation) | | | — | | |
| Ending Balance — market value | | $ | 30,000,000 | | |
Change in unrealized gains or losses relating to assets still held at
reporting date | | $ | — | | |
| First Eagle Fund of America | |
| DESCRIPTION | | LEVEL 1 | | LEVEL 2 | | LEVEL 3 | | TOTAL | |
| Assets: † | |
| U.S. Common Stocks | | $ | 1,215,027,601 | | | $ | — | | | $ | — | | | $ | 1,215,027,601 | | |
International
Common Stocks | | | 127,836,319 | | | | — | | | | — | | | | 127,836,319 | | |
| Investment Companies | | | 62,254,296 | | | | 111,101,932 | | | | — | | | | 173,356,228 | | |
| Rights | | | 3,993,254 | | | | — | | | | — | | | | 3,993,254 | | |
| U.S. Bond | | | — | | | | 4,988,875 | | | | — | | | | 4,988,875 | | |
| Purchased Options | | | — | | | | 2,839,597 | | | | — | | | | 2,839,597 | | |
| Total | | $ | 1,409,111,470 | | | $ | 118,930,404 | | | $ | — | | | $ | 1,528,041,874 | | |
| Liabilities: | |
Covered Call
Options Written | | $ | — | | | $ | 54,890,014 | | | $ | — | | | $ | 54,890,014 | | |
| Total | | $ | — | | | $ | 54,890,014 | | | $ | — | | | $ | 54,890,014 | | |
† See Schedule of Investments for additional detailed categorizations.
For the six-month period ended April 30, 2011, there was no security transfer activity from Level 1 to Level 2 and no security transfer activity from Level 2 to Level 1.
FIRST EAGLE FUNDS | SEMI-ANNUAL REPORT | APRIL 30, 2011
124
(continued)
c) Investment transactions and income — Investment transactions are accounted for on a trade date basis. The specific identification method is used in determining realized gains and losses from investment transactions. Dividend income is recorded on the ex-dividend date. Interest income is recorded daily on the accrual basis. In computing investment income, each Fund accretes discounts and amortizes premiums on debt obligations using the interest method. Investment income is allocated to each Fund's share class in proportion to its relative net assets. Payments received from certain investments held by the Funds may be comprised of dividends, capital gains and return of capital. The Funds originally estimate the expected classification of such payments. The amounts may subsequently be reclassified upon receipt of information from the issuer.
d) Expenses — Expenses arising in connection with a Fund are charged directly to that Fund. Expenses common to all Funds are generally allocated to each Fund in proportion to its relative net assets. Certain expenses are shared with the First Eagle Variable Funds, an affiliated fund group. Such costs are generally allocated using the ratio of the Fund's average daily net assets relative to the total average daily net assets of the First Eagle Variable Funds. Earnings credits may reduce shareholder servicing agent fees by the amount of interest earned on balances with such service provider.
e) Foreign currency translation — The books and records of the Funds are maintained in U.S. dollars. The market values of securities which are not traded in U.S. currency are recorded in the financial statements after translation to U.S. dollars based on the applicable exchange rates at the end of the period. The costs of such securities are translated at exchange rates prevailing when acquired. Related dividends, interest and withholding taxes are accrued at the rates of exchange prevailing on the respective dates of such transactions.
The net assets of each of the Funds are presented at the foreign exchange rates and market values at the close of the period. The Funds do not isolate that portion of gains and losses on investments which is due to changes in foreign exchange rates from that which is due to changes in market prices of the equity securities. However, for federal income tax purposes each Fund does isolate the effect of changes in foreign exchange rates from the changes in market prices for realized gains and losses on debt obligations.
FIRST EAGLE FUNDS | SEMI-ANNUAL REPORT | APRIL 30, 2011
125
Notes to Financial Statements (unaudited)
f) Forward currency contracts — In connection with portfolio purchases and sales of securities denominated in foreign currencies, each Fund may enter into forward currency contracts. The First Eagle Global and Overseas Funds enter into foreign exchange contracts primarily to manage and/or gain exposure to certain foreign currencies. The Funds' currency transactions include portfolio hedging on portfolio positions. Portfolio hedging is the use of a forward contract (or other cash management position) with respect to one or more portfolio security positions denominated or quoted in a particular currency. Currency exchange transactions involve currencies of the different countries that the Fund invests in and serves as hedges against possible variations in the exchange rates between the currencies and U.S. dollar. Each Fund may engage in portfolio hedging with respect to the currency of a particular country in amounts approximating actual or anticipated positions in securities denominated in that currency. Hedging can reduce exposure to currency exchange movements, but cannot eliminate that exposure. It is possible to lose money under a hedge. These contracts are valued at the current cost of covering or offsetting such contracts, and the related realized and unrealized foreign exchange gains and losses are included in the Statements of Operations.
Funds' investing in foreign exchange contracts are exposed to risk if the value of the currency changes unfavorably, if the counterparties to the contracts are unable to meet the terms of their contracts or if the Fund is unable to enter into a closing position. Forward currency contracts outstanding at period end, if any, are listed after the Fund's portfolio. Outstanding contracts at period-end are indicative of the volume of activity during the period.
The Funds adopted provisions surrounding disclosures and derivative instruments and hedging activities which require qualitative disclosures about objectives and strategies for using derivatives, quantitative disclosures about fair value amounts of gains and losses on derivative instruments, and disclosures about currency-risk-related contingent features in derivative agreements.
FIRST EAGLE FUNDS | SEMI-ANNUAL REPORT | APRIL 30, 2011
126
(continued)
At April 30, 2011, the Funds had the following foreign forward currency contracts grouped into appropriate risk categories illustrated below:
| First Eagle Global Fund | |
| | | | | | | GAIN OR (LOSS) ON
DERIVATIVES RECOGNIZED
IN INCOME | |
| RISK TYPE | | ASSET DERIVATIVE
FAIR VALUE1 | | LIABILITY DERIVATIVE
FAIR VALUE2 | | REALIZED
LOSS3 | | CHANGE IN
APPRECIATION4 | |
| Foreign Currency | | $ | — | | | $ | 147,617,124 | | | $ | (101,302,927 | ) | | $ | 36,900,271 | | |
| First Eagle Overseas Fund | |
| | | | | | | GAIN OR (LOSS) ON
DERIVATIVES RECOGNIZED
IN INCOME | |
| RISK TYPE | | ASSET DERIVATIVE
FAIR VALUE1 | | LIABILITY DERIVATIVE
FAIR VALUE2 | | REALIZED
LOSS3 | | CHANGE IN
APPRECIATION4 | |
| Foreign Currency | | $ | — | | | $ | 85,550,495 | | | $ | (54,683,012 | ) | | $ | 16,298,385 | | |
g) Options — In order to produce incremental earnings or protect against declines in the value of portfolio securities, First Eagle Global Fund, First Eagle U.S. Value Fund and First Eagle Fund of America write covered call options on portfolio securities. The Fund may also use options for speculative purposes, although it generally does not employ options for this purpose.
Options contracts are valued daily based upon the last sale price on the principal exchange on which the option is traded and unrealized appreciation/depreciation is recorded. If there is no sale on such day, the mean between the last bid and asked prices is used. When an option is exercised, the proceeds on the sale of a written call option is adjusted by the amount of premium received or paid. When a written option expires, the Fund will realize a gain equal to the amount of the premium received. When the Fund enters into a closing purchase transaction, the Fund will realize a gain (or loss, if the cost of the closing purchase transaction exceeds the premium received when the option was written) without regard to any unrealized gain or loss on the underlying security and the liability related to such option is eliminated.
1 Any balances would be located in Statements of Assets and Liabilities location: Receivable for forward currency contracts held, at value.
2 Statements of Assets and Liabilities location: Payable for forward currency contracts held, at value.
3 Statements of Operations location: Net realized gains (losses) from: foreign currency and forward contract related transactions.
4 Statements of Operations location: Changes in unrealized appreciation (depreciation) of: foreign currency and forward contract related translation.
FIRST EAGLE FUNDS | SEMI-ANNUAL REPORT | APRIL 30, 2011
127
Notes to Financial Statements (unaudited)
The Fund will earmark assets to cover its obligations under option contracts. A call option is covered if the Fund holds, on a share-for-share basis, either the underlying shares or a call on the same security as the call written where the exercise price of the call held is equal to or less than the exercise price of the call written (or greater than the exercise price of the call written if the difference is maintained by the Fund in cash, Treasury bills or other high grade short-term obligations in a segregated account with its custodian). One reason for writing options is to attempt to realize, through the receipt of premiums, a greater return than would be realized on the securities alone. Another reason for writing options is to hedge against a moderate decline in the value of securities owned by a Fund in the case of a call option. If an increase occurs in the underlying security or stock index sufficient to result in the exercise of a call written by the Fund, it may be required to deliver securities or cash and may thereby forego some or all of the gain that otherwise may have been realized on the securities underlying the call option. This "opportunity cost" may be partially or wholly offset by the premium received for the covered call written by the Fund. The risk in writing a covered call option is that the Fund gives up the opportunity for profit if the market price of the underlying security increases and the option is exercised. The Fund also has the additional risk of not being able to enter into a closing transaction if a liquid secondary market does not exist.
The Fund may also write over-the-counter options where the completion of the obligation is dependent upon the credit standing of the counterparty.
For the six-month period ended April 30, 2011, First Eagle Global Fund, First Eagle U.S. Value, and First Eagle Fund of America had the following options transactions.
| First Eagle Global Fund | |
| WRITTEN OPTIONS | | NUMBER
OF CONTRACTS | | PREMIUMS
RECEIVED | |
| Options outstanding at October 31, 2010 | | | — | | | $ | — | | |
| Option written | | | 7,500 | | | | 2,664,915 | | |
| Options assigned | | | — | | | | — | | |
| Options expired/closed | | | — | | | | — | | |
| Options outstanding April 30, 2011 | | | 7,500 | | | $ | 2,664,915 | | |
FIRST EAGLE FUNDS | SEMI-ANNUAL REPORT | APRIL 30, 2011
128
(continued)
As of April 30, 2011, portfolio securities valued at $32,925,000 were segregated to cover collateral requirements for written options.
| First Eagle U.S. Value Fund | |
| WRITTEN OPTIONS | | NUMBER
OF CONTRACTS | | PREMIUMS
RECEIVED | |
| Options outstanding at October 31, 2010 | | | — | | | $ | — | | |
| Option written | | | 5,590 | | | | 546,381 | | |
| Options assigned | | | — | | | | — | | |
| Options expired/closed | | | (1,250 | ) | | | (23,733 | ) | |
| Options outstanding April 30, 2011 | | | 4,340 | | | $ | 522,648 | | |
As of April 30, 2011, portfolio securities valued at $11,896,100 were segregated to cover collateral requirements for written options.
| First Eagle Fund of America | |
| WRITTEN OPTIONS | | NUMBER
OF CONTRACTS | | PREMIUMS
RECEIVED | |
| Options outstanding at October 31, 2010 | | | 99,493 | | | $ | 19,064,884 | | |
| Option written | | | 327,205 | | | | 75,013,506 | | |
| Options assigned | | | (44,870 | ) | | | (8,073,933 | ) | |
| Options expired/closed | | | (242,523 | ) | | | (54,461,399 | ) | |
| Options outstanding April 30, 2011 | | | 139,305 | | | $ | 31,543,058 | | |
| PURCHASED OPTIONS | | NUMBER
OF CONTRACTS | | COST | |
| Options outstanding at October 31, 2010 | | | — | | | $ | — | | |
| Option purchased | | | 5,668 | | | | 1,806,590 | | |
| Options closed | | | — | | | | — | | |
| Options outstanding April 30, 2011 | | | 5,668 | | | $ | 1,806,590 | | |
As of April 30, 2011, portfolio securities valued at $620,101,443 were segregated to cover collateral requirements for written options.
Outstanding contracts at period-end are indicative of the volume of activity during the period.
FIRST EAGLE FUNDS | SEMI-ANNUAL REPORT | APRIL 30, 2011
129
Notes to Financial Statements (unaudited)
At April 30, 2011, the Funds had the following options grouped into appropriate risk categories illustrated below:
| First Eagle Global Fund | |
| | | | | GAIN OR (LOSS) ON
DERIVATIVES RECOGNIZED
IN INCOME | |
| RISK TYPE | | LIABILITY DERIVATIVE
FAIR VALUE2 | | REALIZED
GAIN (LOSS)3 | | CHANGE IN
APPRECIATION4 | |
| Covered call option written | | $ | 1,462,500 | | | $ | — | | | $ | 1,202,415 | | |
| First Eagle U.S. Value Fund | |
| | | | | GAIN OR (LOSS) ON
DERIVATIVES RECOGNIZED
IN INCOME | |
| RISK TYPE | | LIABILITY DERIVATIVE
FAIR VALUE2 | | REALIZED LOSS3 | | CHANGE IN
APPRECIATION4 | |
| Covered call option written | | $ | 448,800 | | | $ | (7,854 | ) | | $ | 73,848 | | |
| First Eagle Fund of America | |
| | | | | | | GAIN OR (LOSS) ON
DERIVATIVES RECOGNIZED
IN INCOME | |
| RISK TYPE | | ASSET DERIVATIVE
FAIR VALUE1 | | LIABILITY DERIVATIVE
FAIR VALUE2 | | REALIZED
GAIN (LOSS)3 | | CHANGE IN
APPRECIATION
(DEPRECIATION)4 | |
Covered call
option written | | $ | — | | | $ | 54,890,014 | | | $ | (36,650,729 | ) | | $ | (11,997,988 | ) | |
| Purchased option | | | 2,839,597 | | | | — | | | | — | | | | 1,033,007 | | |
h) Repurchase agreements — The Funds may enter into repurchase agreement transactions with institutions that meet the adviser's credit guidelines. Each repurchase agreement is valued at amortized cost. The Funds require that the collateral received in a repurchase agreement transaction be transferred to a custodian in a manner sufficient to enable the Funds to obtain collateral in the event of a counterparty default. If the counterparty defaults and the fair value of the collateral declines, realization of the collateral by the Funds may be delayed or limited.
1 Statements of Assets and Liabilities location: Investments, at value, unaffiliated issuers.
2 Statements of Assets and Liabilities location: Option contracts written, at value.
3 Statements of Operations location: Net realized gains (losses) from: Written options & Investment transactions of unaffiliated issuers.
4 Statements of Operations location: Changes in unrealized appreciation (depreciation) of: Written options.
FIRST EAGLE FUNDS | SEMI-ANNUAL REPORT | APRIL 30, 2011
130
(continued)
i) Treasury Inflation-Protected Securities — The Funds invest in Treasury Inflation-Protected Securities ("TIPS") which are specially structured bonds in which the principal amount is adjusted to keep pace with inflation. The inflation (deflation) adjustment is applied to the principal of each bond on a monthly basis and is accounted for as interest income on the Statements of Operations. TIPS are subject to interest rate risk.
j) Restricted Securities — The Funds may invest in securities that are subject to legal or contractual restrictions on resale. These securities generally may be resold in transactions exempt from registration or to the public if the securities are registered. Disposal of these securities may involve time-consuming negotiations and expenses, and prompt sale at an acceptable price may be difficult. Information regarding restricted securities, if any, is included at the end of each Fund's Schedule of Investments.
k) United States income taxes — No provision has been made for U.S. federal income taxes since it is the intention of each Fund to distribute to shareholders all taxable net investment income and net realized gains on investments, if any, within the allowable time limit, and to comply with the provisions of the Code for a Regulated Investment Company. The Funds declare and pay such income, dividends and capital gains distributions on an annual basis.
The Funds adopted provisions surrounding income taxes, which require the tax effects of certain tax positions to be recognized. These tax positions must meet a "more likely than not" standard that based on their technical merits, have a more than 50% likelihood of being sustained upon examination. Management of the Trust has analyzed the Funds' tax positions taken on federal and state income tax returns for all open tax years (the current and the prior three tax years) and has concluded that no provision for income tax is required in the Funds' financial statements.
l) Class Accounting — Investment income, common expenses and realized/unrealized gain or loss on investments are allocated to the various classes of the Fund on the basis of daily net assets of each class. Fees relating to a specific class are charged directly to that class.
m) Use of estimates — The preparation of financial statements in conformity with generally accepted accounting principles requires management to make estimates and assumptions that affect the reported amounts of assets and
FIRST EAGLE FUNDS | SEMI-ANNUAL REPORT | APRIL 30, 2011
131
Notes to Financial Statements (unaudited)
liabilities at the date of the financial statements and the reported amounts of revenues and expenses during the reporting period. Actual results could differ from those estimates.
n) Redemption Fee — A redemption fee of 2% will be applied to the First Eagle Global Fund, First Eagle Overseas Fund and First Eagle Gold Fund for the sale or exchange within 60 days of the purchase of such shares.
Note 2 — Investment Advisory, Custody and Administration Agreements; Transactions with Related Persons
First Eagle Investment Management, LLC (the "Adviser"), a subsidiary of Arnhold and S. Bleichroeder Holdings, Inc. ("ASB Holdings"), manages the Funds. For its services, the Adviser receives, pursuant to an Investment Advisory Agreement between the Funds and the Adviser (the "Advisory Agreement") an annual advisory fee as follows: First Eagle Global Fund, First Eagle Overseas Fund, First Eagle U.S. Value Fund and First Eagle Gold Fund at 0.75% of each Fund's average daily net assets and First Eagle Fund of America at 1% of the Fund's average daily net assets.
The Adviser also performs certain administrative, accounting, operations, compliance and other services on behalf of the Funds, and in accordance with its agreement with them, the Funds reimburse the Adviser for costs (including personnel, related overhead and other costs) related to those services. For the six-month period ended April 30, 2011, the Funds reimbursed and had payable to the Adviser amounts shown below:
| FUND | | PAID TO ADVISER | | PAYABLE TO ADVISER | |
| First Eagle Global Fund | | $ | 1,421,021 | | | $ | 320,548 | | |
| First Eagle Overseas Fund | | | 533,626 | | | | 116,877 | | |
| First Eagle U.S. Value Fund | | | 84,064 | | | | 17,671 | | |
| First Eagle Gold Fund | | | 200,116 | | | | 35,096 | | |
| First Eagle Fund of America | | | 70,073 | | | | 14,836 | | |
Pursuant to a subadvisory agreement, dated December 10, 2002 (agreement was amended and restated most recently in September 2009) ("Subadvisory Agreement") Iridian Asset Management LLC ("Iridian") manages the investments of the First Eagle Fund of America. The fees paid to Iridian by the Adviser under the Subadvisory Agreement are based on a reference amount equal to 50% of the combined (i) fees received by the Adviser for advisory services on behalf of the Fund and (ii) the fees received by the Fund's distributor for its
FIRST EAGLE FUNDS | SEMI-ANNUAL REPORT | APRIL 30, 2011
132
(continued)
shareholder liaison services on behalf of the Fund. These amounts are reduced by certain direct marketing costs borne by the Adviser in connection with the Fund and are further reduced by the amount paid by the Adviser for certain administrative expenses incurred in providing services to the Fund.
The Funds have entered into Custody Agreements with State Street Bank and Trust Co. ("SSB"). The Custody Agreements provide for an annual fee based on the amount of assets under custody plus transaction charges. SSB serves as custodian of the Funds' portfolio securities and other assets. SSB has directly entered into sub-custodial agreements to maintain the custody of gold bullion in the Funds. Under the terms of the Custody Agreement between the Funds and SSB, SSB maintains and deposits in separate accounts, cash, securities and other assets of the Funds. SSB is also required, upon the order of the Funds, to deliver securities held by SSB and the sub-custodian, and to make payments for securities purchased by the Funds. SSB has also entered into sub-custodian agreements with a number of foreign banks and clearing agencies, pursuant to which portfolio securities purchased outside the United States are maintained in the custody of these entities.
The Funds have also entered into an Administration Agreement with SSB, pursuant to which SSB provides certain tax-related and other administrative services. SSB, as the Funds' Administrator, receives annual fees separate from and in addition to the fees it receives for its services as the Funds' custodian.
FEF Distributors, LLC, a wholly owned subsidiary of the Adviser, serves as the Funds' principal underwriter. For the six-month period ended April 30, 2011, FEF Distributors, LLC realized $1,706,995, $280,356, $132,812, $174,393 and $95,512, pertaining to the sales of shares of First Eagle Global Fund, First Eagle Overseas Fund, First Eagle U.S. Value Fund, First Eagle Gold Fund and First Eagle Fund of America, respectively.
The Trust adopted a Trustee Deferred Compensation Plan, which allows the independent Trustees to defer the receipt of all or a portion of compensation related to performance of their duties as a Trustee. The deferred fees are invested in various First Eagle Funds until distribution in accordance with the Trustee Deferred Compensation Plan. As of April 30, 2011, balances to the Plan are recorded on the Statements of Assets and Liabilities.
For the six-month period ended April 30, 2011, the Adviser reimbursed First Eagle Overseas Fund, First Eagle U.S. Value Fund and First Eagle Fund of America $714,808, $7,854 and $544, respectively, for losses incurred in connection with trading errors.
FIRST EAGLE FUNDS | SEMI-ANNUAL REPORT | APRIL 30, 2011
133
Notes to Financial Statements (unaudited)
Note 3 — Plans of Distribution
Under the terms of the Distribution Plans and Agreements (the "Plans") with FEF Distributors, LLC (the "Distributor"), pursuant to the provisions of Rule 12b-1 under the 1940 Act, the First Eagle Global Fund, First Eagle Overseas Fund, First Eagle U.S. Value Fund and First Eagle Gold Fund pay the Distributor monthly, a distribution fee with respect to Class A and Class C shares at an annual rate of up to 0.25% and 0.75%, respectively, of each Fund's average daily net assets. In the case of First Eagle Fund of America, it pays the Distributor monthly, a distribution fee with respect to Class A, Class C and Class Y shares at an annual rate of up to 0.25%, 0.75% and 0.25%, respectively of the average daily net assets. Under the Plans, the Distributor is obligated to use the amounts received under the Plans for payments to qualifying dealers for their assistance in the distribution of a Fund's shares and the provision of shareholder services and for other expenses such as advertising costs and the payment for the printing and distribution of prospectuses to prospective investors.
The Distributor bears distribution costs of a Fund to the extent they exceed payments received under the Plan. For the six-month period ended April 30, 2011, the distribution fees incurred by the Funds are disclosed in the Statements of Operations.
The Distributor receives an annual service fee with respect to Class C at the annual rate of 0.25% of each Fund's average daily net assets, payable monthly to cover expenses incurred by the Distributor for providing shareholder liaison services, including assistance with subscriptions, redemptions and other shareholder questions. For the six-month period ended April 30, 2011, the services fees incurred by the Funds are disclosed in the Statements of Operations.
Note 4 — Purchases and Sales of Securities
During the six-month period ended April 30, 2011, the cost of purchases of investments, excluding U.S. Government and short-term securities, totaled $2,833,643,708, $1,020,438,047, $221,575,323, $227,220,365 and $396,299,197 for First Eagle Global Fund, First Eagle Overseas Fund, First Eagle U.S. Value Fund, First Eagle Gold Fund and First Eagle Fund of America, respectively. Proceeds from sales of investments, excluding U.S. government securities and short-term securities, totaled $1,432,046,202, $527,613,415, $156,694,068,
FIRST EAGLE FUNDS | SEMI-ANNUAL REPORT | APRIL 30, 2011
134
(continued)
$275,750,860 and $298,568,277 for First Eagle Global Fund, First Eagle Overseas Fund, First Eagle U.S. Value Fund, First Eagle Gold Fund and First Eagle Fund of America, respectively.
There were no purchases of U.S. Government securities, excluding short-term securities for First Eagle Global Fund, First Eagle Overseas Fund, First Eagle U.S. Value Fund, First Eagle Gold Fund and First Eagle Fund of America. Proceeds from sales of U.S. government securities, totaled $225,124,227, $0, $39,628,601, $0 and $0 for First Eagle Global Fund, First Eagle Overseas Fund, First Eagle U.S. Value Fund, First Eagle Gold Fund and First Eagle Fund of America, respectively.
Note 5 — Line of Credit
As of September 13, 2010, the Board of Trustees approved continuing a $200 million committed, unsecured line of credit ("Credit Facility") with State Street Bank and Trust Company for the Funds, to be utilized for temporarily financing the purchase or sale of securities for prompt delivery in the ordinary course of business or for temporarily financing the redemption of shares of each Fund at the request of shareholders and other temporary or emergency purposes. Under the Credit Facility arrangement, each Fund has agreed to pay an annual commitment fee on the unused balance, allocated pro rata, based on the relative asset size of the Funds. Commitment fees related to the line of credit are paid by the Funds and are included in miscellaneous expenses in the Statements of Operations. During the six-month period ended April 30, 2011, the Funds had borrowings under the agreement as follows:
| FUND | | AVERAGE
DAILY LOAN
BALANCE | | NUMBER OF DAYS
OUTSTANDING | | INTEREST
EXPENSE | | WEIGHTED
AVERAGE
ANNUALIZED
INTEREST RATE | |
| First Eagle Global Fund | | $ | 2,998,664 | | | | 5 | | | $ | 493 | | | | 1.48 | % | |
As of April 30, 2011 there were no outstanding borrowings from the credit facility.
Note 6 — Capital Stock
At April 30, 2011, the Funds have an unlimited number of shares authorized for issuance. The Funds have the ability to issue multiple classes of shares.
FIRST EAGLE FUNDS | SEMI-ANNUAL REPORT | APRIL 30, 2011
135
Notes to Financial Statements (unaudited)
Transactions in shares of capital stock were as follows:
| | | SIX-MONTH PERIOD ENDED APRIL 30, 2011 | |
| | | FIRST EAGLE GLOBAL FUND | |
| | | CLASS A | | CLASS C | | CLASS I | |
| Shares sold | | | 46,999,562 | | | | 31,716,041 | | | | 42,010,061 | | |
Shares issued for reinvested
dividends and distributions | | | 3,377,141 | | | | 815,954 | | | | 1,528,605 | | |
| Shares redeemed | | | (22,330,062 | ) | | | (9,759,431 | ) | | | (17,386,099 | ) | |
| Net increase | | | 28,046,641 | | | | 22,772,564 | | | | 26,152,567 | | |
| | | SIX-MONTH PERIOD ENDED APRIL 30, 2011 | |
| | | FIRST EAGLE GOLD FUND | |
| | | CLASS A | | CLASS C | | CLASS I | |
| Shares sold | | | 8,244,183 | | | | 2,851,077 | | | | 6,749,247 | | |
Shares issued for reinvested
dividends and distributions | | | 2,866,928 | | | | 787,656 | | | | 535,343 | | |
| Shares redeemed | | | (12,223,331 | ) | | | (2,137,630 | ) | | | (4,201,061 | ) | |
| Net increase (decrease) | | | (1,112,220 | ) | | | 1,501,103 | | | | 3,083,529 | | |
| | | YEAR ENDED OCTOBER 31, 2010 | |
| | | FIRST EAGLE GLOBAL FUND | |
| | | CLASS A | | CLASS C | | CLASS I | |
| Shares sold | | | 56,104,057 | | | | 35,584,529 | | | | 54,269,413 | | |
Shares issued for reinvested
dividends and distributions | | | 3,444,109 | | | | 889,953 | | | | 1,030,798 | | |
| Shares redeemed | | | (57,239,727 | ) | | | (21,890,851 | ) | | | (21,198,794 | ) | |
| Net increase | | | 2,308,439 | | | | 14,583,631 | | | | 34,101,417 | | |
| | | YEAR ENDED OCTOBER 31, 2010 | |
| | | FIRST EAGLE GOLD FUND | |
| | | CLASS A | | CLASS C | | CLASS I | |
| Shares sold | | | 22,560,831 | | | | 7,211,831 | | | | 17,424,005 | | |
Shares issued for reinvested
dividends and distributions | | | 591,466 | | | | 116,850 | | | | 97,788 | | |
| Shares redeemed | | | (18,973,371 | ) | | | (3,103,005 | ) | | | (3,481,174 | ) | |
| Net increase (decrease) | | | 4,178,926 | | | | 4,225,676 | | | | 14,040,619 | | |
FIRST EAGLE FUNDS | SEMI-ANNUAL REPORT | APRIL 30, 2011
136
(continued)
| | | SIX-MONTH PERIOD ENDED APRIL 30, 2011 | |
| | | FIRST EAGLE OVERSEAS FUND | | FIRST EAGLE U.S. VALUE FUND | |
| | | CLASS A | | CLASS C | | CLASS I | | CLASS A | | CLASS C | | CLASS I | |
| Shares sold | | | 42,736,940 | | | | 7,252,446 | | | | 37,848,602 | | | | 12,550,918 | | | | 3,718,215 | | | | 5,963,266 | | |
Shares issued for reinvested
dividends and distributions | | | 4,608,501 | | | | 588,534 | | | | 3,075,256 | | | | 770,417 | | | | 204,916 | | | | 335,285 | | |
| Shares redeemed | | | (34,207,249 | ) | | | (3,343,679 | ) | | | (13,331,072 | ) | | | (4,329,093 | ) | | | (1,737,085 | ) | | | (3,508,456 | ) | |
| Net increase | | | 13,138,192 | | | | 4,497,301 | | | | 27,592,786 | | | | 8,992,242 | | | | 2,186,046 | | | | 2,790,095 | | |
| | | SIX-MONTH PERIOD ENDED APRIL 30, 2011 | |
| | | FIRST EAGLE FUND OF AMERICA | |
| | | CLASS A | | CLASS C | | CLASS Y | |
| Shares sold | | | 5,595,765 | | | | 2,281,619 | | | | 2,220,407 | | |
Shares issued for reinvested
dividends and distributions | | | 91,034 | | | | 8,600 | | | | 142,915 | | |
| Shares redeemed | | | (1,609,500 | ) | | | (377,170 | ) | | | (1,496,110 | ) | |
| Net increase (decrease) | | | 4,077,299 | | | | 1,913,049 | | | | 867,212 | | |
| | | YEAR ENDED OCTOBER 31, 2010 | |
| | | FIRST EAGLE OVERSEAS FUND | | FIRST EAGLE U.S. VALUE FUND | |
| | | CLASS A | | CLASS C | | CLASS I | | CLASS A | | CLASS C | | CLASS I | |
| Shares sold | | | 63,800,432 | | | | 9,029,755 | | | | 61,460,804 | | | | 16,510,083 | | | | 5,318,538 | | | | 10,241,203 | | |
Shares issued for reinvested
dividends and distributions | | | 5,754,113 | | | | 784,521 | | | | 2,725,898 | | | | 441,268 | | | | 88,898 | | | | 146,754 | | |
| Shares redeemed | | | (61,841,533 | ) | | | (8,421,330 | ) | | | (27,960,441 | ) | | | (12,748,260 | ) | | | (3,838,500 | ) | | | (3,904,178 | ) | |
| Net increase | | | 7,713,012 | | | | 1,392,946 | | | | 36,226,261 | | | | 4,203,091 | | | | 1,568,936 | | | | 6,483,779 | | |
| | | YEAR ENDED OCTOBER 31, 2010 | |
| | | FIRST EAGLE FUND OF AMERICA | |
| | | CLASS A | | CLASS C | | CLASS Y | |
| Shares sold | | | 5,478,006 | | | | 1,552,419 | | | | 2,092,973 | | |
Shares issued for reinvested
dividends and distributions | | | — | | | | — | | | | — | | |
| Shares redeemed | | | (3,994,098 | ) | | | (1,083,277 | ) | | | (3,227,060 | ) | |
| Net increase (decrease) | | | 1,483,908 | | | | 469,142 | | | | (1,134,087 | ) | |
FIRST EAGLE FUNDS | SEMI-ANNUAL REPORT | APRIL 30, 2011
137
Notes to Financial Statements (unaudited)
Transactions in dollars of capital stock were as follows:
| | | SIX-MONTH PERIOD ENDED APRIL 30, 2011 | |
| | | FIRST EAGLE GLOBAL FUND | |
| | | CLASS A | | CLASS C | | CLASS I | |
| Shares sold | | $ | 2,200,893,773 | | | $ | 1,461,405,931 | | | $ | 1,975,543,988 | | |
Shares issued for reinvested
dividends and distributions | | | 154,537,968 | | | | 36,791,366 | | | | 70,178,270 | | |
| Shares redeemed | | | (1,044,822,074 | ) | | | (448,636,331 | ) | | | (811,800,146 | ) | |
| Net increase | | $ | 1,310,609,667 | | | $ | 1,049,560,966 | | | $ | 1,233,922,112 | | |
| | | SIX-MONTH PERIOD ENDED APRIL 30, 2011 | |
| | | FIRST EAGLE U.S. VALUE FUND | |
| | | CLASS A | | CLASS C | | CLASS I | |
| Shares sold | | $ | 210,387,816 | | | $ | 61,848,466 | | | $ | 101,323,958 | | |
Shares issued for reinvested
dividends and distributions | | | 12,519,283 | | | | 3,309,400 | | | | 5,502,028 | | |
| Shares redeemed | | | (72,524,585 | ) | | | (28,770,614 | ) | | | (59,319,094 | ) | |
| Net increase (decrease) | | $ | 150,382,514 | | | $ | 36,387,252 | | | $ | 47,506,892 | | |
| | | YEAR ENDED OCTOBER 31, 2010 | |
| | | FIRST EAGLE GLOBAL FUND | |
| | | CLASS A | | CLASS C | | CLASS I | |
| Shares sold | | $ | 2,310,390,017 | | | $ | 1,440,881,738 | | | $ | 2,232,335,113 | | |
Shares issued for reinvested
dividends and distributions | | | 139,107,607 | | | | 35,464,634 | | | | 41,767,929 | | |
| Shares redeemed | | | (2,329,396,908 | ) | | | (881,251,536 | ) | | | (869,042,419 | ) | |
| Net increase | | $ | 120,100,716 | | | $ | 595,094,836 | | | $ | 1,405,060,623 | | |
| | | YEAR ENDED OCTOBER 31, 2010 | |
| | | FIRST EAGLE U.S. VALUE FUND | |
| | | CLASS A | | CLASS C | | CLASS I | |
| Shares sold | | $ | 249,887,613 | | | $ | 79,766,902 | | | $ | 156,420,750 | | |
Shares issued for reinvested
dividends and distributions | | | 6,570,564 | | | | 1,316,582 | | | | 2,205,720 | | |
| Shares redeemed | | | (192,467,396 | ) | | | (57,364,539 | ) | | | (59,589,516 | ) | |
| Net increase (decrease) | | $ | 63,990,781 | | | $ | 23,718,945 | | | $ | 99,036,954 | | |
FIRST EAGLE FUNDS | SEMI-ANNUAL REPORT | APRIL 30, 2011
138
(continued)
| | | SIX-MONTH PERIOD ENDED APRIL 30, 2011 | |
| | | FIRST EAGLE OVERSEAS FUND | |
| | | CLASS A | | CLASS C | | CLASS I | |
| Shares sold | | $ | 970,259,284 | | | $ | 160,543,295 | | | $ | 871,908,907 | | |
Shares issued for reinvested
dividends and distributions | | | 102,262,636 | | | | 12,771,196 | | | | 69,224,009 | | |
| Shares redeemed | | | (776,473,509 | ) | | | (73,808,248 | ) | | | (307,084,119 | ) | |
| Net increase | | $ | 296,048,411 | | | $ | 99,506,243 | | | $ | 634,048,797 | | |
| | | SIX-MONTH PERIOD ENDED APRIL 30, 2011 | |
| | | FIRST EAGLE GOLD FUND | | FIRST EAGLE FUND OF AMERICA | |
| | | CLASS A | | CLASS C | | CLASS I | | CLASS A | | CLASS C | | CLASS Y | |
| Shares sold | | $ | 276,638,497 | | | $ | 93,141,390 | | | $ | 226,153,148 | | | $ | 147,206,403 | | | $ | 53,280,851 | | | $ | 59,248,406 | | |
Shares issued for reinvested
dividends and distributions | | | 94,379,255 | | | | 25,236,503 | | | | 17,810,847 | | | | 2,298,611 | | | | 193,070 | | | | 3,671,493 | | |
| Shares redeemed | | | (405,912,725 | ) | | | (68,416,844 | ) | | | (144,955,398 | ) | | | (41,886,566 | ) | | | (8,713,121 | ) | | | (39,795,983 | ) | |
| Net increase (decrease) | | $ | (34,894,973 | ) | | $ | 49,961,049 | | | $ | 99,008,597 | | | $ | 107,618,448 | | | $ | 44,760,800 | | | $ | 23,123,916 | | |
| | | YEAR ENDED OCTOBER 31, 2010 | |
| | | FIRST EAGLE OVERSEAS FUND | |
| | | CLASS A | | CLASS C | | CLASS I | |
| Shares sold | | $ | 1,285,277,712 | | | $ | 178,038,513 | | | $ | 1,255,197,610 | | |
Shares issued for reinvested
dividends and distributions | | | 113,298,593 | | | | 15,125,573 | | | | 54,408,926 | | |
| Shares redeemed | | | (1,235,178,673 | ) | | | (164,770,456 | ) | | | (567,063,407 | ) | |
| Net increase | | $ | 163,397,632 | | | $ | 28,393,630 | | | $ | 742,543,129 | | |
| | | YEAR ENDED OCTOBER 31, 2010 | |
| | | FIRST EAGLE GOLD FUND | | FIRST EAGLE FUND OF AMERICA | |
| | | CLASS A | | CLASS C | | CLASS I | | CLASS A | | CLASS C | | CLASS Y | |
| Shares sold | | $ | 650,143,781 | | | $ | 202,617,937 | | | $ | 538,916,054 | | | $ | 119,245,037 | | | $ | 30,126,386 | | | $ | 46,425,229 | | |
Shares issued for reinvested
dividends and distributions | | | 16,271,246 | | | | 3,140,932 | | | | 2,716,545 | | | | — | | | | — | | | | — | | |
| Shares redeemed | | | (537,112,467 | ) | | | (85,301,292 | ) | | | (103,434,046 | ) | | | (85,893,877 | ) | | | (20,888,300 | ) | | | (71,168,953 | ) | |
| Net increase (decrease) | | $ | 129,302,560 | | | $ | 120,457,577 | | | $ | 438,198,553 | | | $ | 33,351,160 | | | $ | 9,238,086 | | | $ | (24,743,724 | ) | |
FIRST EAGLE FUNDS | SEMI-ANNUAL REPORT | APRIL 30, 2011
139
Notes to Financial Statements (unaudited)
Note 7 — Indemnification and Foreign Investment Risk
In the normal course of business, the Funds enter into contracts that contain a variety of representations which provide general indemnifications. Each Fund's maximum exposure under these arrangements is unknown, as this would involve future claims that may be made against each Fund that have not yet occurred. However, based on experience, the Funds expect the risk of loss to be remote. The Funds may have elements of risk not typically associated with investments in the United States of America due to their investments in foreign countries or regions. Such foreign investments may subject the Funds to additional risks resulting from political or economic conditions in such countries or regions and the possible imposition of adverse governmental laws or currency exchange restrictions could cause the securities and their markets to be less liquid and their prices to be more volatile than those of comparable U.S. securities. The securities markets in many emerging-market countries are substantially smaller, less developed, less liquid and more volatile than the securities markets of developed countries.
Note 8 — Redemption In-Kind Transactions
The redemption in-kind policy for all of the Funds reserves the right of the Funds to pay redemptions in-kind (i.e., payments in the form of marketable securities or, as needed, other traded assets, rather than cash) if the redemption request is large enough to affect a Fund's operations (for example, if it represents more than $250,000 or 1% of the Fund's assets). When receiving assets distributed in-kind, the recipient will bear applicable commissions or other costs on their sale. There have been no redemptions in-kind as of April 30, 2011.
Note 9 — Accounting Pronouncements
In May 2011, the Financial Accounting Standard Board (FASB) issued Accounting Standards Update 2011-4, Amendment to Achieve Common Fair Value Measurement and Disclosures Requirements in U.S. GAAP and IFRS. This update contains amendments that will result in common fair value measurement and disclosure requirements in U.S. GAAP and IFRS. Consequently, the amendments change the wording used to describe many of the requirements in U.S. GAAP for measuring fair value and for disclosing information about fair value measurements. The amendments also clarify that a reporting entity should disclose quantitative information about the unobservable inputs used in a fair value measurement that is categorized within Level 3 of the fair value hierarchy.
FIRST EAGLE FUNDS | SEMI-ANNUAL REPORT | APRIL 30, 2011
140
(continued)
This update is effective during interim and annual periods beginning after December 15, 2011 for public entities and is to be applied prospectively. Early application is not permitted. Management of the Trust is currently evaluating the effect of this update to the Trust's financial statement.
Note 10 — Subsequent Events
In accordance with the provision surrounding Subsequent Events adopted by the Funds, management has evaluated the possibility of subsequent events existing in the Funds' financial statements. Management has determined that there are no material events that would require disclosures in the Funds' financial statements.
FIRST EAGLE FUNDS | SEMI-ANNUAL REPORT | APRIL 30, 2011
141
Fund Expenses (unaudited)
Example
As a shareholder of the First Eagle Funds, you may incur two types of costs: (1) transaction costs, including front-end and contingent deferred sales charges (loads), and (2) ongoing costs, including advisory fees; distribution (12b-1) and/or service fees; and other Fund expenses. This Example is intended to help you understand your ongoing costs (in dollars) of investing in each of the First Eagle Funds and to compare these costs with the ongoing costs of investing in other mutual funds.
This Example is based on an investment of $1,000 invested on November 1, 2010 and held for the six-months ended April 30, 2011.
Actual Expenses
The table titled "Based on Actual Total Return" provides information about actual account values and actual expenses. You may use the information provided in this table, together with the amount you invested, to estimate the expenses that you paid over the period. To estimate the expenses you paid on your account, divide your ending account value by $1,000 (for example, an $8,600 ending account value divided by $1,000 = 8.6), then multiply the result by the number under the column heading entitled "Expenses Paid During the Period".
FIRST EAGLE FUNDS | SEMI-ANNUAL REPORT | APRIL 30, 2011
142
(continued)
Based on Actual Total Return1
| | | ACTUAL TOTAL
RETURN
WITHOUT
SALES CHARGE2 | | BEGINNING
ACCOUNT
VALUE | | ENDING
ACCOUNT
VALUE | | ANNUALIZED
EXPENSE
RATIO | | EXPENSES
PAID
DURING THE
PERIOD3 | |
| First Eagle Global Fund | |
| Class A | | | 13.35 | % | | $ | 1,000.00 | | | $ | 1,133.50 | | | | 1.13 | % | | $ | 5.98 | | |
| Class C | | | 12.94 | | | | 1,000.00 | | | | 1,129.40 | | | | 1.88 | | | | 9.93 | | |
| Class I | | | 13.51 | | | | 1,000.00 | | | | 1,135.10 | | | | 0.88 | | | | 4.66 | | |
| First Eagle Overseas Fund | |
| Class A | | | 12.37 | | | | 1,000.00 | | | | 1,123.70 | | | | 1.14 | | | | 6.00 | | |
| Class C | | | 11.96 | | | | 1,000.00 | | | | 1,119.60 | | | | 1.89 | | | | 9.93 | | |
| Class I | | | 12.52 | | | | 1,000.00 | | | | 1,125.20 | | | | 0.89 | | | | 4.69 | | |
| First Eagle U.S. Value Fund | |
| Class A | | | 12.93 | | | | 1,000.00 | | | | 1,129.30 | | | | 1.19 | | | | 6.28 | | |
| Class C | | | 12.52 | | | | 1,000.00 | | | | 1,125.20 | | | | 1.94 | | | | 10.22 | | |
| Class I | | | 13.10 | | | | 1,000.00 | | | | 1,131.00 | | | | 0.94 | | | | 4.97 | | |
| First Eagle Gold Fund Consolidated | |
| Class A | | | 13.56 | | | | 1,000.00 | | | | 1,135.60 | | | | 1.17 | | | | 6.20 | | |
| Class C | | | 13.15 | | | | 1,000.00 | | | | 1,131.50 | | | | 1.92 | | | | 10.15 | | |
| Class I | | | 13.71 | | | | 1,000.00 | | | | 1,137.10 | | | | 0.92 | | | | 4.87 | | |
| First Eagle Fund of America | |
| Class A | | | 17.61 | | | | 1,000.00 | | | | 1,176.10 | | | | 1.43 | | | | 7.72 | | |
| Class C | | | 17.15 | | | | 1,000.00 | | | | 1,171.50 | | | | 2.17 | | | | 11.68 | | |
| Class Y | | | 17.65 | | | | 1,000.00 | | | | 1,176.50 | | | | 1.43 | | | | 7.72 | | |
1 For the six-months ended April 30, 2011.
2 Past performance does not guarantee future results. Assumes reinvestment of all dividends and capital gain distributions, if any, at net asset value and does not reflect the deduction of the applicable sales charge, exchange fees or redemption fees. Had the effect of sales charges been reflected, expenses would have been higher and returns lower. Total return is not annualized, as it may not be representative of the total return for the year.
3 Expenses are equal to the annualized expense ratio multiplied by the average account value over the period, multiplied by 181/365 (to reflect the one-half year period).
FIRST EAGLE FUNDS | SEMI-ANNUAL REPORT | APRIL 30, 2011
143
Fund Expenses (unaudited) (continued)
Hypothetical Example for Comparison Purposes
The table below titled "Based on Hypothetical Total Return" provides information about hypothetical account values and hypothetical expenses based on the actual expense ratios and an assumed rate of return of 5% per year before expenses, which is not the First Eagle Fund's actual return. The hypothetical account values and expenses may not be used to estimate the actual ending account balance or expenses you paid for the period. You may use the information provided in this table to compare the ongoing costs of investing in the First Eagle Funds and other funds. To do so, compare the 5% hypothetical example relating to the First Eagle Funds with the 5% hypothetical examples that appear in the shareholder reports of other funds.
This Example is based on an investment of $1,000 invested on November 1, 2010 and held for the six-months ended April 30, 2011.
Please note that the expenses shown in the table below are meant to highlight your ongoing costs only and do not reflect any transactional costs, such as front-end or back-end sales charges (loads). Therefore, the table is useful in comparing ongoing costs only, and will not help you determine the relative total costs of owning different funds. In addition, if these transaction costs were included, your costs would have been higher.
FIRST EAGLE FUNDS | SEMI-ANNUAL REPORT | APRIL 30, 2011
144
(continued)
Based on Hypothetical Total Return1
| | | HYPOTHETICAL
ANNUALIZED
TOTAL
RETURN | | BEGINNING
ACCOUNT
VALUE | | ENDING
ACCOUNT
VALUE | | ANNUALIZED
EXPENSE
RATIO | | EXPENSES
PAID
DURING THE
PERIOD2 | |
| First Eagle Global Fund | |
| Class A | | | 5.00 | % | | $ | 1,000.00 | | | $ | 1,019.19 | | | | 1.13 | % | | $ | 5.66 | | |
| Class C | | | 5.00 | | | | 1,000.00 | | | | 1,015.47 | | | | 1.88 | | | | 9.39 | | |
| Class I | | | 5.00 | | | | 1,000.00 | | | | 1,020.43 | | | | 0.88 | | | | 4.41 | | |
| First Eagle Overseas Fund | |
| Class A | | | 5.00 | | | | 1,000.00 | | | | 1,019.14 | | | | 1.14 | | | | 5.71 | | |
| Class C | | | 5.00 | | | | 1,000.00 | | | | 1,015.42 | | | | 1.89 | | | | 9.44 | | |
| Class I | | | 5.00 | | | | 1,000.00 | | | | 1,020.38 | | | | 0.89 | | | | 4.46 | | |
| First Eagle U.S. Value Fund | |
| Class A | | | 5.00 | | | | 1,000.00 | | | | 1,018.89 | | | | 1.19 | | | | 5.96 | | |
| Class C | | | 5.00 | | | | 1,000.00 | | | | 1,015.47 | | | | 1.94 | | | | 9.69 | | |
| Class I | | | 5.00 | | | | 1,000.00 | | | | 1,020.13 | | | | 0.94 | | | | 4.71 | | |
| First Eagle Gold Fund Consolidated | |
| Class A | | | 5.00 | | | | 1,000.00 | | | | 1,018.99 | | | | 1.17 | | | | 5.86 | | |
| Class C | | | 5.00 | | | | 1,000.00 | | | | 1,015.27 | | | | 1.92 | | | | 9.59 | | |
| Class I | | | 5.00 | | | | 1,000.00 | | | | 1,020.23 | | | | 0.92 | | | | 4.61 | | |
| First Eagle Fund of America | |
| Class A | | | 5.00 | | | | 1,000.00 | | | | 1,017.70 | | | | 1.43 | | | | 7.15 | | |
| Class C | | | 5.00 | | | | 1,000.00 | | | | 1,014.03 | | | | 2.17 | | | | 10.84 | | |
| Class Y | | | 5.00 | | | | 1,000.00 | | | | 1,017.70 | | | | 1.43 | | | | 7.15 | | |
1 For the six-months ended April 30, 2011.
2 Expenses are equal to the annualized expense ratio multiplied by the average account value over the period, multiplied by 181/365 (to reflect the one-half year period).
FIRST EAGLE FUNDS | SEMI-ANNUAL REPORT | APRIL 30, 2011
145
General Information
Quarterly Form N-Q portfolio schedule
The First Eagle Funds file their complete schedule of portfolio holdings with the Securities and Exchange Commission ("SEC") for the first and third quarters of each fiscal year on Form N-Q. The Funds' Forms N-Q are available on the SEC's Web site at www.sec.gov. The Funds' Forms N-Q may be reviewed and copied at the SEC's Public Reference Room in Washington, D.C. Information on the operation of the SEC's Public Reference Room may be obtained by calling 1.800.SEC.0330. Additionally, you may obtain copies of Forms N-Q from the Funds upon request by calling 1.800.334.2143.
Proxy voting policies, procedures and record
You may obtain a description of the Funds' (1) proxy voting policies, (2) proxy voting procedures and (3) information regarding how the Funds voted any proxies related to portfolio securities during the most recent twelve-month period ended June 30 for which an SEC filing has been made, without charge, upon request by contacting the Funds directly at 1.800.334.2143 or on the EDGAR Database on the SEC's Web site at www.sec.gov.
FIRST EAGLE FUNDS | SEMI-ANNUAL REPORT | APRIL 30, 2011
146
Consideration of Investment Advisory Agreements
On December 22, 1999, the shareholders of the Global Fund, the Overseas Fund and the Gold Fund, and on August 31, 2001, the shareholders of the U.S. Value Fund approved the Advisory Agreement between the Trust and the Adviser applicable to those Funds. On December 10, 2002, the shareholders of the Fund of America approved the Advisory Agreement between the Trust and the Adviser applicable to that Fund. The Board of Trustees approved these Advisory Agreements most recently on December 16, 2010.
During the course of their most recent review, the Trustees covered the following, among other topics:
• The Trustees reviewed each Fund's long-standing historical relationship with the Adviser and the institutional resources available to the Adviser.
• The Trustees reviewed the performance of each Fund on both an absolute and a relative basis. Significant short-term and long-term outperformance (over most periods reviewed) was noted for all Funds relative to the Funds' benchmarks, to the performance of peer mutual funds and to Morningstar, Lipper and similar composites. While longer-term outperformance was noted for the Gold Fund, the Trustees commented on (and management discussed) the two Funds' trailing one-year relative performance. The Trustees also commented on each Fund's performance against benchmarks and peers during the down market of 2008, noting relative outperformance during that period as an indicator of solid market risk management. Performance for each Fund was determined to be excellent given its returns relative to benchmarks and peers (looking primarily to medium- and longer-term returns in the case of the Gold Fund).
• The Trustees reviewed the total compensation to be received by the Adviser and the Funds' total cost for using the Adviser's services, taking into account expenses incurred by the Adviser that are passed through to the Funds. They concluded that this compensation was commensurate with the nature, extent, and quality of the services provided and therefore reasonable under the circumstances. As part of their analysis, the Trustees considered competitive prices for services comparable to those provided by the Adviser. In doing so, they considered fees charged by investment advisers to peer mutual funds and determined that the Adviser's fees were competitive, as each Fund's net management fee, except that of the First Eagle Fund of America, was generally similar to or lower than its reviewed peer group average and peer group median. After noting that First Eagle Fund of America's net management
FIRST EAGLE FUNDS | SEMI-ANNUAL REPORT | APRIL 30, 2011
147
Consideration of Investment Advisory Agreements (continued)
fee was higher than any of its reviewed peers, the Trustees determined that the fee was justified by the superior service record, consistent long-term performance, and management team stability achieved. The Trustees also considered the advisory fees charged to institutional clients of the Adviser, taking into consideration the differing requirements of such clients. While analyzing the effects of indirect compensation to the Adviser, such as soft dollar and other service benefits, the Trustees considered the levels of soft dollars and absence of affiliated broker-dealer relationships.
• The Trustees' reviewed the Funds' expense ratios, which were deemed reasonable both on an absolute basis and in comparison to peer funds. The Trustees discussed the impact of the advisory fee on the ratio of total expenses to total assets and noted that the Funds' expense ratios decreased over several years as the Funds grew, highlighting a benefit to shareholders resulting from the development of economies of scale in the operation of the Funds. The Trustees also noted that expense ratios for the Funds generally had decreased over the prior fiscal year, after generally experiencing increases in the 2009 period (except that the expense ratio for Overseas Variable Fund had increased in the 2010 period after a decrease in 2009). All changes in the expense ratios during those two periods were viewed as modest. The Trustees also considered the effect on expense ratios of Fund asset size and of particular categories of expenses, both currently and relative to prior periods.
• The Trustees' reviewed the Adviser's financial condition and profitability. They commented that profits appear healthy and that the Adviser has always shown the willingness to commit resources to support investment in the business. The Trustees noted the effect of particular categories of expenses, including compensation, on the Adviser's financial condition.
At the conclusion of their review, with no single factor being determinative, the Trustees determined that the Advisory Agreements serve the interests of the Funds and their shareholders and should be continued.
FIRST EAGLE FUNDS | SEMI-ANNUAL REPORT | APRIL 30, 2011
148
First Eagle Funds
Trustees
Lisa Anderson
John P. Arnhold
Candace K. Beinecke (Chair)
Jean-Marie Eveillard
Jean D. Hamilton
James E. Jordan
William M. Kelly
Paul J. Lawler
Officers
John P. Arnhold
President
Robert Bruno
Senior Vice President
Joseph T. Malone
Chief Financial Officer
Mark D. Goldstein
Chief Compliance Officer
Suzan J. Afifi
Secretary & Vice President
Philip Santopadre
Treasurer
Michael Luzzatto
Vice President
Investment Adviser
First Eagle Investment Management, LLC
1345 Avenue of the Americas
New York, NY 10105
Legal Counsel
Shearman & Sterling LLP
599 Lexington Avenue
New York, NY 10022
Custodian
State Street Bank and Trust Company
801 Pennsylvania Avenue
Kansas City, MO 64105
Shareholder Servicing Agent
DST Systems, Inc.
330 West 9th Street
Kansas City, MO 64105
800.334.2143
Underwriter
FEF Distributors, LLC
1345 Avenue of the Americas
New York, NY 10105
Independent Registered
Public Accounting Firm
PricewaterhouseCoopers LLP
300 Madison Avenue
New York, NY 10017
This report is not authorized for distribution to prospective investors unless preceded or accompanied by a currently effective prospectus of First Eagle Funds.
FIRST EAGLE FUNDS | SEMI-ANNUAL REPORT | APRIL 30, 2011
149
This page was intentionally left blank.
This page was intentionally left blank.
This page was intentionally left blank.
This page was intentionally left blank.
This page was intentionally left blank.
1345 Avenue of the Americas | New York, NY | 10105-4300
800.334.2143 | firsteaglefunds.com

Item 2. Code of Ethics.
The Registrant has adopted a code of ethics that applies to its principal executive officer and principal financial officer. Copies of the code of ethics may be requested free of charge by calling 1-800-334-2143 (toll free).
Item 3. Audit Committee Financial Expert.
Not applicable to this Semi-Annual Report.
Item 4. Principal Accountant Fees and Services
Not applicable to this Semi-Annual Report.
Item 5. Audit Committee of Listed Registrants
Not applicable at this time.
Item 6. Schedule of Investments
Please see schedule of investments contained in the Report to Stockholders included under Item 1 of this Form N-CSR.
Item 7. Disclosure of Proxy Voting Policies and Procedures for Closed-End Management Investment Companies.
Not applicable.
Item 8. Portfolio Managers of Closed-End Investment companies.
Not applicable.
Item 9. Purchases of Equity Securities by Closed-End Management Investment Company and Affiliated Purchasers.
Not applicable.
Item 10. Submission of Matters to a Vote of Security Holders.
No material change to report at this time.
Item 11. Controls and Procedures.
(a) In the opinion of the principal executive officer and principal financial officer, based on their evaluation, the registrant’s disclosure controls and procedures are adequately designed and are operating effectively to ensure (i) that material information relating to the registrant, including its consolidated subsidiaries, is made known to them by others within those entities, particularly during the period in which this report is being prepared; and (ii) that information required to be disclosed by the registrant on Form N-CSR is recorded, processed, summarized and reported within the time periods specified in the Securities and Exchange Commission’s rules and forms.
(b) There were no changes in the registrant’s internal control over financial reporting that occurred during the registrant’s most recent fiscal half-year (the registrant’s second fiscal half-year in the case of an annual report) that have materially affected or are reasonably likely to materially affect, the registrant’s internal control over financial reporting.
Item 12. Exhibits.
(a)(1) Not applicable to this Semi-Annual Report.
(a)(2) Certifications pursuant to Rule 30a-2(a) under the Investment Company Act of 1940 (17 CFR 270.30a-2(a)): Attached hereto.
(a)(3) Not applicable.
(b) Certification pursuant to Rule 30a-2(b) under the Investment Company Act of 1940 (17 CFR 270.30a-2(b)): Attached hereto.
SIGNATURES
Pursuant to the requirements of the Securities Exchange Act of 1934 and the Investment Company Act of 1940, the registrant has duly caused this report to be signed on its behalf by the undersigned, thereunto duly authorized.
(Registrant) | First Eagle Funds |
| |
By (Signature and Title)* | /s/ John P. Arnhold |
| |
| John P. Arnhold, Principal Executive Officer |
Date: July 7, 2011
Pursuant to the requirements of the Securities Exchange Act of 1934 and the Investment Company Act of 1940, this report has been signed below by the following persons on behalf of the registrant and in the capacities and on the dates indicated.
By (Signature and Title)* | /s/ John P. Arnhold |
| |
| John P. Arnhold, Principal Executive Officer |
Date: July 7, 2011
By (Signature and Title)* | /s/ Joseph T. Malone |
| |
| Joseph T. Malone, Principal Financial Officer |
Date: July 7, 2011
* Print the name and title of each signing officer under his or her signature.