UNITED STATES
SECURITIES AND EXCHANGE COMMISSION
Washington, D.C. 20549
FORM N-CSR
CERTIFIED SHAREHOLDER REPORT OF REGISTERED
MANAGEMENT INVESTMENT COMPANIES
Investment Company Act file number | 811-7762 |
|
First Eagle Funds |
(Exact name of registrant as specified in charter) |
|
1345 Avenue of the Americas New York, NY | | 10105 |
(Address of principal executive offices) | | (Zip code) |
|
Robert Bruno First Eagle Funds 1345 Avenue of the Americas New York, NY 10105 |
(Name and address of agent for service) |
|
Registrant’s telephone number, including area code: | 1-212-632-2700 | |
|
Date of fiscal year end: | October 31 | |
|
Date of reporting period: | April 30, 2013 | |
| | | | | | | | |
Form N-CSR is to be used by management investment companies to file reports with the Commission not later than 10 days after the transmission to stockholders of any report that is required to be transmitted to stockholders under Rule 30e-1 under the Investment Company Act of 1940 (17 CFR 270.30e-1). The Commission may use the information provided on Form N-CSR in its regulatory, disclosure review, inspection, and policymaking roles.
A registrant is required to disclose the information specified by Form N-CSR, and the Commission will make this information public. A registrant is not required to respond to the collection of information contained in Form N-CSR unless the Form displays a currently valid Office of Management and Budget (“OMB”) control number. Please direct comments concerning the accuracy of the information collection burden estimate and any suggestions for reducing the burden to Secretary, Securities and Exchange Commission, 450 Fifth Street, NW, Washington, DC 20549-0609. The OMB has reviewed this collection of information under the clearance requirements of 44 U.S.C. § 3507.
Item 1. Reports to Stockholders.
Semi-Annual Report
APRIL 30, 2013
Global Fund
Overseas Fund
U.S. Value Fund
Gold Fund
Global Income Builder Fund
High Yield Fund
Fund of America
ADVISED BY FIRST EAGLE INVESTMENT MANAGEMENT, LLC

Forward-Looking Statement Disclosure
One of our most important responsibilities as mutual fund managers is to communicate with shareholders in an open and direct manner. Some of our comments in our letters to shareholders are based on current management expectations and are considered "forward-looking statements". Actual future results, however, may prove to be different from our expectations. You can identify forward-looking statements by words such as "may", "will", "believe", "attempt", "seem", "think", "ought", "try" and other similar terms. We cannot promise future returns. Our opinions are a reflection of our best judgment at the time this report is compiled, and we disclaim any obligation to update or alter forward-looking statements as a result of new information, future events, or otherwise.
Letter from the President | | | 4 | | |
Management's Discussion of Fund Performance | | | 8 | | |
Performance Chart | | | 15 | | |
First Eagle Global Fund: | |
Fund Overview | | | 20 | | |
Schedule of Investments | | | 22 | | |
First Eagle Overseas Fund: | |
Fund Overview | | | 44 | | |
Schedule of Investments | | | 46 | | |
First Eagle U.S. Value Fund: | |
Fund Overview | | | 68 | | |
Schedule of Investments | | | 70 | | |
First Eagle Gold Fund: | |
Fund Overview | | | 86 | | |
Consolidated Schedule of Investments | | | 88 | | |
First Eagle Global Income Builder Fund: | |
Fund Overview | | | 94 | | |
Schedule of Investments | | | 96 | | |
First Eagle High Yield Fund: | |
Fund Overview | | | 108 | | |
Schedule of Investments | | | 110 | | |
First Eagle Fund of America: | |
Fund Overview | | | 122 | | |
Schedule of Investments | | | 124 | | |
Statements of Assets and Liabilities | | | 132 | | |
Statements of Operations | | | 140 | | |
Statements of Changes in Net Assets | | | 144 | | |
Financial Highlights | | | 148 | | |
Notes to Financial Statements | | | 162 | | |
Fund Expenses | | | 198 | | |
General Information | | | 202 | | |
Consideration of Investment Advisory Agreements | | | 203 | | |
Letter from the President

Dear Fellow Shareholders,
At First Eagle, we remain committed to the mission that has guided our investment approach over our long history: To provide prudent stewardship of the assets you have placed in our care. Regardless of short-term market events, swings in investor confidence or the pressures to follow new market paradigms, we continue to seek to provide our shareholders with attractive absolute returns over the long-term.
Market Overview
Since I wrote you last December, financial markets have been characterized by a near absence of fear and caution. Given that this time last year we were in the midst of a period of unusual change and uncertainty driven by historic macro interventions, it is noteworthy and perhaps troubling that a mere twelve months later investors appear to be generally ignoring potential signs of distress.
For instance, during the six-month period ending April 30, 2013, the American and Japanese markets have expanded rapidly — largely as a result of accommodative monetary policy. In the U.S., the stock market began 2013 with the strongest first quarter since 19981. Similarly, Japan's equity market, as measured by the Nikkei 225, has risen approximately 55% since the start of First Eagle's fiscal year on November 1, 2012.
It is important to note that this expansion has not been uniform across the globe. In fact, markets remained sluggish in Europe as the region digested fiscal austerity measures and Europe's recession deepened. In addition, China experienced the pressure of challenging property markets, a slowdown in GDP growth2 and higher real exchange rates.
During the same time period, global corporate fixed income yields have touched and often moved below their past lows. Nonetheless, it is important to note that while absolute yields are very low, high yield market spreads over treasuries — while gradually eroding — remained within historical ranges3, during the six-month period.
FIRST EAGLE FUNDS | SEMI-ANNUAL REPORT | APRIL 30, 2013
4
Letter from the President (continued)
In the first half of our fiscal year, the gold spot price has declined. This was punctuated by the 9% drop on April 15th, driven by fears (later proven to be unfounded) that European central banks would follow Cyprus's Finance Minister by liquidating gold reserves to raise capital in order to qualify for economic aid. We continue to believe that predicting the price of gold is a fool's errand. Bullion's price declines have been steep; nonetheless, we remain comfortable with our view of gold as a potential hedge against unforeseen circumstances.
In our quest to protect our clients' capital while providing absolute returns, we continue to focus on seeking to identify quality businesses and quality credit at what we believe to be attractive prices. We are global, fundamental investors. While we do not make decisions based on macro views, we stay abreast of macro changes across the globe as large shifts may impact the long-term fundamentals of the businesses we own on behalf of our shareholders.
Global Value Team
The First Eagle Global, Overseas, and U.S. Value Funds continue to seek opportunities to invest in high-quality companies at what we consider to be attractive prices. With the rapid rise of equity valuations in the U.S. and Japan, it seems that we may have entered a market period where equity valuations are on the higher side of fair. Even in Europe, where market valuations grew at a more measured pace, we've found that good companies are generally fairly valued. In this type of environment, it has been more difficult to find opportunities with what we believe to be an adequate margin of safety in price. In addition, several of our investments have reached what we believe to be their intrinsic values. As a result, we have trimmed or exited several long-term holdings.
Since cash is a residual of our investment process, in times like these, our cash levels grow as a percentage of our Global Value Funds. This period has been no exception.
The price of gold has also been volatile, declining approximately 12% since January 1st. Gold mining stocks have displayed the historical 2 to 3 times price movement of the metal and have lost approximately 34% since the start of the year4. Nonetheless, we remain committed to our views about gold. In this regard, the First Eagle Gold Fund continues to invest in gold bullion and gold mining companies with the objective of providing our shareholders exposure to the investment characteristics of gold and, to a limited extent, other precious metals.
FIRST EAGLE FUNDS | SEMI-ANNUAL REPORT | APRIL 30, 2013
5
Letter from the President (continued)
The current low-yield environment can be very troubling for income-oriented investors. With traditional income sources such as CDs and Treasury Bonds providing low to negative yields after inflation, we believe it is essential to not only focus on generating income today, but also to seek to preserve purchasing power for the future. The First Eagle Global Income Builder Fund's portfolio management team searches the globe in an attempt to deliver meaningful and sustainable income in today's low-yield environment.
When equity markets are rising to new heights, it can be challenging for value investors to search patiently, one security at a time, for companies priced with what we view to be a margin of safety. Under the thoughtful leadership of Matthew McLennan alongside Portfolio Managers Abhay Deshpande, Kimball Brooker, Rachel Benepe, Giorgio Caputo, Robert Hordon, Edward Meigs and Sean Slein, First Eagle's Global Value Team remains disciplined and continues to demonstrate the patient temperament required to weather this part of the cycle.
High Yield Team
While high yield debt is charting new territory in terms of absolute yields, First Eagle Portfolio Managers Ed Meigs and Sean Slein feel that high-yield spreads at 432 bps5, while gradually narrowing, remain reasonable given the level of credit risk in the market today. The team also continued its attempts to manage interest rate risk. As a result the team continued to favor single B credits over longer duration BB rated credits. In addition, over the first six months of this fiscal year, it increased the Fund's exposure to bank loans. These loans have floating interest rates and are generally senior to the bonds in a company's capital structure. As of April 30th, loans comprised approximately 18% of our High Yield Fund and 7% of our Global Income Builder Fund.
Fund of America Team
Although the broader markets have rallied substantially over the last five quarters, Portfolio Managers Harold Levy and David Cohen believe that numerous global concerns remain, which are commonly overlooked by investors. Building on their belief that the Fed will be the dominant influence on debt and equity markets in 2013, the First Eagle Fund of America portfolio managers remain optimistic that the combination of strong corporate balance sheets, relative regulatory clarity and historically low borrowing costs could lead to a significant reacceleration of merger and acquisition activity through the
FIRST EAGLE FUNDS | SEMI-ANNUAL REPORT | APRIL 30, 2013
6
Letter from the President (continued)
year. So, the team continues to adhere to its philosophy of investing in companies undergoing significant corporate change, with strong free cash flows and solid management teams. Over time and across a variety of market environments, this philosophy has generally served shareholders well.
Closing
Please be assured that we remain dedicated to our goal of managing your investments in our Funds in the same prudent manner we have been practicing for over 30 years. Our portfolio managers and senior executives have substantial investments alongside yours. We are grateful for your continued confidence.
Sincerely,

John P. Arnhold
President
June 2013
1 As measured by the change in the Dow Jones Industrial Average from January 1, 2013 to April 30, 2013. Source: Factset
2 Source: Bloomberg
3 Source: Barclays. Average high-yield spread from 2003 to 2013 is 565 basis points. Across the same period, one standard deviation is 303 basis points. Absolute low was 233 basis points (May 2007).
4 As measured by the FTSE Gold Mines Index from January 1st, 2013 to April 30, 2013.
5 Barclays U.S. High Yield — Corporate Index as of April 30, 2013. Source: Factset
The commentary represents the opinion of John Arnhold as of June 2013 and is subject to change based on market and other conditions. These materials are provided for informational purposes only. These opinions are not intended to be a forecast of future events, a guarantee of future results, or investment advice. The views expressed herein may change at any time subsequent of the date of issue hereof. The information provided is not to be construed as a recommendation or an offer to buy or sell or the solicitation of an offer to buy or sell any fund or security.
FIRST EAGLE FUNDS | SEMI-ANNUAL REPORT | APRIL 30, 2013
7
Management's Discussion of Fund Performance
In the six months ending April 30, 2013, the MSCI World Index increased 14.7%, while in the U.S., the S&P 500 Index increased 14.4%. In Europe, the German DAX Index rose 9.0% and the French CAC 40 Index rose 12.5% during the period. The Nikkei 225 Index surged 55.2% during the six-month period. This large move was, in part, the result of the December election of Shinzo Abe and the belief that his reflationary policies would be fully enacted. Although our portfolio benefited from a rising Japanese equity market, these gains were partially offset by the weakness in gold mining stocks and gold bullion. Crude oil rose 8.4% to $93 a barrel, and the price of gold fell 14.2% to $1,476 an ounce as of April 30th. On April 15th, gold fell 9%. Market participants appeared to react strongly to comments by the Cyprian Finance Minister that the Central Bank of Cyprus might sell some of its gold reserves to help Cyprus qualify for international aid. Over the six-month period, the Japanese Yen weakened 22.2% against the U.S. Dollar, and in Europe, the U.S. Dollar strengthened 1.6% against the Euro.
First Eagle Global Fund
The net asset value ("NAV") of the Fund's Class A shares increased 10.3% for the six-month period while the MSCI World Index rose 14.7%. The Fund's cash & cash equivalents position increased from 18.8% at the end of October to 20.6% on April 30, 2013.
The five largest contributors to the performance of First Eagle Global Fund over the period were Mitsubishi Estate Company Limited (real estate, Japan), Cisco Systems, Inc. (networking, U.S.), HeidelbergCement AG (cement, Germany), MS&AD Insurance Group Holdings (insurance, Japan) and Shimano, Inc. (bicycle parts, Japan) collectively accounting for 2.1% of this period's performance.
The five largest detractors were gold bullion, Newcrest Mining Limited (mining, Australia), Goldcorp, Inc. (mining, Canada), Gold Fields Limited, ADR (mining, South Africa) and Fresnillo PLC (mining, Mexico). Their combined negative performance over the six months subtracted 1.8% from the Fund's performance.
As of April 30, 2013, the Fund was approximately 35% hedged versus the Japanese Yen and 30% hedged versus the Euro.
FIRST EAGLE FUNDS | SEMI-ANNUAL REPORT | APRIL 30, 2013
8
First Eagle Overseas Fund
The NAV of the Fund's Class A shares rose 10.8% for the six-month period while the MSCI EAFE Index increased 16.9%. The Fund's cash and cash equivalents position increased from 21.2% at the end of October to 23.6% on April 30, 2013.
The five largest contributors to the performance of First Eagle Overseas Fund over the period were MS&AD Insurance Group Holdings (insurance, Japan), Mitsubishi Estate Company Limited (real estate, Japan), Shimano, Inc. (bicycle parts, Japan), HeidelbergCement AG (cement, Germany) and NKSJ Holdings, Inc. (insurance, Japan) collectively accounting for 2.9% of this period's performance.
The five largest detractors were gold bullion, Agnico-Eagle Mines Limited (mining, Canada), Newcrest Mining Limited (mining, Australia), Gold Fields Limited (mining, South Africa) and Penn West Petroleum Limited (oil, Canada). Their combined negative performance over the six-month period subtracted 2.2% from the Fund's performance.
As of April 30, 2013, the Fund was approximately 35% hedged versus the Japanese Yen and 30% hedged versus the Euro.
First Eagle U.S. Value Fund
The NAV of the Fund's Class A shares increased 7.3% for the six-month period while the S&P 500 Index rose 14.4%. The Fund's cash and cash equivalents position decreased from 21.5% at the beginning of the period to 16.7% on April 30, 2013.
The five largest contributors to the performance of First Eagle U.S. Value Fund over the period were Cisco Systems, Inc. (networking), Alliant Techsystems, Inc. (defense manufacturer), Rofin-Sinar Technologies, Inc. (laser-based products), Microsoft Corporation (software) and Cincinnati Financial Corporation (property & casualty insurance) collectively accounting for 2.4% of this period's performance.
The five largest detractors were Agnico-Eagle Mines Limited (mining), gold bullion, Newcrest Mining Limited (mining), Newmont Mining Corporation (mining) and Penn West Petroleum Limited (oil). Their combined negative performance over the six-month period subtracted 2.3% from the Fund's performance.
FIRST EAGLE FUNDS | SEMI-ANNUAL REPORT | APRIL 30, 2013
9
Management's Discussion of Fund Performance (continued)
First Eagle Gold Fund
The NAV of the Fund's Class A shares fell 33.7% for the six-month period while the FTSE Gold Mines Index declined 42.2%. The Fund's cash and cash equivalents position decreased from 6.1% in October to 2.6% on April 30, 2013.
The five largest contributors to the performance of First Eagle Gold Fund over the period were Primero Mining Corporation (Canada), Detour Gold Corporation 5.5% bond due 11/30/17 (Canada), Great Basin Gold Limited 8.0% bond due 11/30/14 (South Africa), Aurizon Mines Limited (Canada) and CGA Mining Limited (Canada) collectively accounting for no benefit to the period's performance.
The five largest detractors were Agnico-Eagle Mines Limited (Canada), Barrick Gold Corporation (Canada), gold bullion, Kinross Gold Corporation (Canada) and AngloGold Ashanti Limited, ADR (South Africa). Their combined negative performance over the six-month period subtracted 12.5% from the Fund's performance.
First Eagle Global Income Builder Fund
The NAV of the Fund's Class A shares rose 7.5% for the six-month period while the Barclays US Aggregate Bond Index rose 0.9% and the MSCI World Index increased 14.7%. The Fund's cash and cash equivalents position increased from 5.6% in October to 7.3% on April 30, 2013.
The five largest contributors to the performance of First Eagle Global Income Builder Fund over the period were Bouygues SA (infrastructure construction, France), H&R Block, Inc. (professional services, U.S.), Sanofi (pharmaceuticals, France), Investor AB, Class 'A' (holding company, Sweden) and Microsoft Corporation (software, U.S.), collectively accounting for 1.6% of this period's performance.
The five largest detractors were Barrick Gold Corporation (mining, Canada), Newmont Mining Corporation (mining, U.S.), Penn West Petroleum Limited (oil, Canada), Newcrest Mining Limited (mining, Australia) and Goldcorp, Inc. (mining, Canada). Their combined negative performance over the six-month period subtracted 1.59% from the Fund's performance.
As of April 30, 2013, the First Eagle Global Income Builder Fund was approximately 35% hedged against the Japanese Yen and 30% hedged against the Euro on equities. The Fund was 100% hedged on Euro-denominated bonds.
FIRST EAGLE FUNDS | SEMI-ANNUAL REPORT | APRIL 30, 2013
10
First Eagle High Yield Fund
The NAV of the Fund's Class I shares rose 6.1% for the six-month period, while the Barclays Capital U.S. Corporate High Yield Index increased 7.3%. We continued to favor B-rated issues, which accounted for more than half of the Fund's assets as of April 30, 2013. The Fund's cash and cash equivalents position increased from 3.9% in October to 5.6% on April 30, 2013.
The five largest contributors to the performance of the Fund for the six-month period were Bi-Lo LLC, Offshore Group Investments Limited, Advanced Micro Devices, Inc., HeidelbergCement Finance BV, and Sheridan Group, Inc., collectively accounting for 0.76% of this period's performance.
The five largest detractors were OGX Petroleo E Gas Participacoes, Mood Media Corporation, OGX Austria GmbH, Quiksilver, Inc., and Sugarhouse HSP Gaming Prop. Mezz L.P. Their combined negative performance over the six month period subtracted 0.35% from this period's performance.
As of April 30, 2013, the Fund was 98% hedged against the Euro.
First Eagle Fund of America
The NAV of the Fund's Class Y shares increased 15.3% for the six months ended April 30, 2013 versus 14.4% for the S&P 500 Index. We continue to find a number of new investment opportunities despite the broader markets' recent rally. Our primary focus continues to be investing in quality companies that are trading at what we believe to be a discount to their intrinsic values.
The five largest contributors to the performance of the First Eagle Fund of America over the period were Rockwood Holdings Inc., Valeant Pharmaceuticals International Inc., Seagate Technology PLC, Packaging Corporation of America, and Wyndham Worldwide Corporation, collectively accounting for 7.5% of the Fund's performance.
The five largest detractors were SPDR Gold Trust, Garmin Limited, General Dynamics Corporation, Lowe's Companies, Inc., and Atlas Resource Partners LP. Their combined negative performance over the six-month period subtracted 0.47% from the Fund's performance.
FIRST EAGLE FUNDS | SEMI-ANNUAL REPORT | APRIL 30, 2013
11
Management's Discussion of Fund Performance (continued)

| | 
| |
Matthew McLennan | | Abhay Deshpande | |
Head of the Global Value Team
Portfolio Manager
Global, Overseas,
U.S. Value and Gold Funds | | Portfolio Manager
Global, Overseas
and U.S. Value Funds
| |

| | 
| |
T. Kimball Brooker, Jr. | | Rachel Benepe | |
Portfolio Manager
Global, Overseas and U.S. Value Funds | | Portfolio Manager
Gold Fund | |

| | 
| |
Giorgio Caputo | | Robert Hordon | |
Portfolio Manager
Global Income Builder Fund | | Portfolio Manager
Global Income Builder Fund | |
FIRST EAGLE FUNDS | SEMI-ANNUAL REPORT | APRIL 30, 2013
12

| | 
| |
Edward Meigs | | Sean Slein | |
Portfolio Manager
Global Income Builder and High Yield Funds | | Portfolio Manager
Global Income Builder and High Yield Funds | |

Harold Levy
Portfolio Manager
Fund of America
June 2013
The performance data quoted herein represents past performance and does not guarantee future results. Market volatility can dramatically impact the fund's short-term performance. Current performance may be lower or higher than figures shown. The investment return and principal value will fluctuate so that an investor's shares, when redeemed, may be worth more or less than their original cost. Past performance data through the most recent month end is available at firsteaglefunds.com or by calling 800.334.2143.
The commentary represents the opinion of the Portfolio Management Teams as of June 2013 and is subject to change based on market and other conditions. These materials are provided for informational purposes only. These opinions are not intended to be a forecast of future events, a guarantee of future results, or investment advice. The views expressed herein may change at any time subsequent of the date of issue hereof. The information provided is not to be construed as a recommendation or an offer to buy or sell or the solicitation of an offer to buy or sell any fund or security.
FIRST EAGLE FUNDS | SEMI-ANNUAL REPORT | APRIL 30, 2013
13
Management's Discussion of Fund Performance (continued)
There are risks associated with investing in funds that invest in securities of foreign countries, such as erratic market conditions, economic and political instability and fluctuations in currency exchange rates. Funds whose investments are concentrated in a specific industry or sector may be subject to a higher degree of risk than funds whose investments are diversified and may not be suitable for all investors. Hedging can reduce exposure to currency exchange movements, but cannot eliminate that exposure. It is possible to lose money under a hedge. Results from hedging transactions, which for the Funds are primarily currency forward contracts, are further described in the financial statements that follow this commentary.
Investment in gold and gold related investments present certain risks, including negative tax consequences (e.g., a change in a fund's tax status causing the fund to be subject to tax at the fund level on its taxable income), political and economic risks affecting the price of gold and other precious metals like changes in U.S. or foreign tax, currency or mining laws, increased environmental costs, international monetary and political policies, economic conditions within an individual country, trade imbalances, and trade or currency restrictions between countries. The price of gold, in turn, is likely to affect the market prices of securities of companies mining or processing gold, and accordingly, the value of investments in such securities may also be affected. Gold related investments as a group have not performed as well as the stock market in general during periods when the U.S. dollar is strong, inflation is low and general economic conditions are stable. In addition, returns on gold related investments have traditionally been more volatile than investments in broader equity or debt markets.
The First Eagle Global Income Builder Fund and High Yield Fund invest in high yield securities that are non-investment grade (commonly known as "junk bonds") which are generally considered speculative because they may be subject to greater levels of interest rate, credit (including issuer default) and liquidity risk than investment grade securities and may be subject to greater volatility. High yield securities are rated lower than investment-grade securities because there is a greater possibility that the issuer may be unable to make interest and principal payments on those securities.
Funds that invest in bonds are subject to interest-rate risk and can lose principal value when interest rates rise. Bonds are also subject to credit risk, in which the bond issuer may fail to pay interest and principal in a timely manner, or that negative perception of the issuer's ability to make such payments may cause the price of that bond to decline.
Bank loans are often less liquid than other types of debt instruments. There is no assurance that the liquidation of any collateral from a secured bank loan would satisfy the borrower's obligation, or that such collateral could be liquidated.
The High Yield Fund's investment strategies may result in high turnover rates. This may increase the Fund's brokerage commission costs, which would reduce performance. Rapid portfolio turnover also exposes shareholders to a higher current realization of short-term gains, which could cause you to pay higher taxes.
Income generation and dividends are not guaranteed. If dividend paying stocks in the Fund's portfolio stop paying or reduce dividends, the fund's ability to generate income will be adversely affected.
The event-driven investment style used by First Eagle Fund of America carries the additional risk that the event anticipated occurs later than expected, does not occur at all or does not have the desired effect on the market price of the securities.
The principal risk of investing in value stocks is that the price of the security may not approach its anticipated value or may decline in value.
All investments involve the risk of loss.
FIRST EAGLE FUNDS | SEMI-ANNUAL REPORT | APRIL 30, 2013
14
Performance Chart1 (unaudited)
Average Annual Returns as of April 30, 2013
| | |
ONE-YEAR | |
THREE-YEARS | |
FIVE-YEARS | |
TEN-YEARS | | SINCE
INCEPTION | | INCEPTION
DATE | |
First Eagle Global Fund | |
Class A (SGENX) | |
without sales charge | | | 12.45 | % | | | 9.89 | % | | | 6.22 | % | | | 12.45 | % | | | 14.14 | % | | 1/1/19792 | |
with sales charge | | | 6.83 | | | | 8.03 | | | | 5.14 | | | | 11.88 | | | | 14.01 | | | 1/1/19792 | |
Class C (FESGX) | | | 10.61 | | | | 9.07 | | | | 5.42 | | | | 11.61 | | | | 11.50 | | | 06/05/00 | |
Class I (SGIIX) | | | 12.73 | | | | 10.17 | | | | 6.48 | | | | 12.73 | | | | 12.08 | | | 07/31/98 | |
MSCI World Index3 | | | 16.70 | | | | 9.59 | | | | 1.81 | | | | 8.29 | | | | 9.73 | | | 01/01/79 | |
First Eagle Overseas Fund | |
Class A (SGOVX) | |
without sales charge | | | 13.28 | % | | | 8.75 | % | | | 5.13 | % | | | 12.69 | % | | | 11.96 | % | | 08/31/93 | |
with sales charge | | | 7.60 | | | | 6.90 | | | | 4.06 | | | | 12.11 | | | | 11.74 | | | 08/31/93 | |
Class C (FESOX) | | | 11.43 | | | | 7.94 | | | | 4.34 | | | | 11.84 | | | | 11.23 | | | 06/05/00 | |
Class I (SGOIX) | | | 13.54 | | | | 9.00 | | | | 5.38 | | | | 12.96 | | | | 12.35 | | | 07/31/98 | |
MSCI EAFE Index4 | | | 19.39 | | | | 7.44 | | | | -0.93 | | | | 9.23 | | | | 5.15 | | | 08/31/93 | |
First Eagle U.S. Value Fund | |
Class A (FEVAX) | |
without sales charge | | | 9.91 | % | | | 9.45 | % | | | 6.09 | % | | | 9.81 | % | | | 9.50 | % | | 09/04/01 | |
with sales charge | | | 4.41 | | | | 7.60 | | | | 5.00 | | | | 9.25 | | | | 9.02 | | | 09/04/01 | |
Class C (FEVCX) | | | 8.05 | | | | 8.62 | | | | 5.30 | | | | 8.99 | | | | 8.68 | | | 09/04/01 | |
Class I (FEVIX) | | | 10.17 | | | | 9.71 | | | | 6.35 | | | | 10.08 | | | | 9.76 | | | 09/04/01 | |
Standard & Poor's
500 Index5 | | | 16.89 | | | | 12.80 | | | | 5.21 | | | | 7.88 | | | | 5.04 | | | 09/04/01 | |
First Eagle Gold Fund | |
Class A (SGGDX) | |
without sales charge | | | -26.95 | % | | | -8.79 | % | | | -0.53 | % | | | 10.44 | % | | | 7.42 | % | | 08/31/93 | |
with sales charge | | | -30.62 | | | | -10.34 | | | | -1.54 | | | | 9.87 | | | | 7.21 | | | 08/31/93 | |
Class C (FEGOX) | | | -28.25 | | | | -9.48 | | | | -1.28 | | | | — | | | | 8.99 | | | 05/15/03 | |
Class I (FEGIX) | | | -26.77 | | | | -8.58 | | | | -0.29 | | | | — | | | | 10.08 | | | 05/15/03 | |
FTSE Gold Mines Index6 | | | -36.48 | | | | -17.70 | | | | -7.55 | | | | 5.32 | | | | -0.06 | | | 08/31/93 | |
MSCI World Index3 | | | 16.70 | | | | 9.59 | | | | 1.81 | | | | 8.29 | | | | 6.46 | | | 08/31/93 | |
Please see the following pages for important notes to this table.
FIRST EAGLE FUNDS | SEMI-ANNUAL REPORT | APRIL 30, 2013
15
Performance Chart1 (unaudited) (continued)
| | | ONE-YEAR | | THREE-YEARS | | FIVE-YEARS | | TEN-YEARS | | SINCE
INCEPTION | | INCEPTION
DATE | |
First Eagle Global Income Builder Fund | |
Class A (FEBAX) | |
without sales charge | | | — | | | | — | | | | — | | | | — | | | | 12.21 | % | | 05/01/12 | |
with sales charge | | | — | | | | — | | | | — | | | | — | | | | 6.56 | | | 05/01/12 | |
Class C (FEBCX) | | | — | | | | — | | | | — | | | | — | | | | 10.34 | | | 05/01/12 | |
Class I (FEBIX) | | | — | | | | — | | | | — | | | | — | | | | 12.44 | | | 05/01/12 | |
MSCI World Index3 | | | — | | | | — | | | | — | | | | — | | | | 16.42 | | | 05/01/12 | |
Barclays Capital U.S.
Aggregate Bond Index7 | | | — | | | | — | | | | — | | | | — | | | | 3.81 | | | 05/01/12 | |
First Eagle High Yield Fund | |
Class A (FEHAX) | |
without sales charge | | | 11.34 | % | | | — | | | | — | | | | — | | | | 13.23 | % | | 01/03/12 | |
with sales charge | | | 6.33 | | | | — | | | | — | | | | — | | | | 9.38 | | | 01/03/12 | |
Class C (FEHCX) | | | 9.51 | | | | — | | | | — | | | | — | | | | 12.28 | | | 01/03/12 | |
Class I (FEHIX) | | | 11.80 | | | | 10.16 | % | | | 14.14 | % | | | — | | | | 13.05 | | | 11/19/078 | |
Barclays Capital U.S.
Corporate High Yield
Index9 | | | 13.98 | | | | 11.05 | | | | 11.11 | | | | — | | | | 10.53 | | | 11/19/07 | |
First Eagle Fund of America | |
Class A (FEFAX) | |
without sales charge | | | 17.26 | % | | | 14.26 | % | | | 6.42 | % | | | 10.41 | % | | | 8.45 | % | | 11/20/98 | |
with sales charge | | | 11.40 | | | | 12.32 | | | | 5.33 | | | | 9.84 | | | | 8.07 | | | 11/20/98 | |
Class C (FEAMX) | | | 15.39 | | | | 13.42 | | | | 5.63 | | | | 9.59 | | | | 7.67 | | | 03/02/98 | |
Class I (FEAIX) | | | — | | | | — | | | | — | | | | — | | | | 1.77 | | | 03/08/13 | |
Class Y (FEAFX)10 | | | 17.28 | | | | 14.28 | | | | 6.42 | | | | 10.41 | | | | 12.05 | | | 04/10/87 | |
Standard & Poor's
500 Index5 | | | 16.89 | | | | 12.80 | | | | 5.21 | | | | 7.88 | | | | 9.19 | | | 04/10/87 | |
1 The performance data quoted herein represents past performance and does not guarantee future results. Market volatility can dramatically impact the funds' short-term performance. Current performance may be lower or higher than figures shown. The investment return and principal value will fluctuate so that an investor's shares, when redeemed, may be worth more or less than their original cost. Past performance data through the most recent month end is available at firsteaglefunds.com or by calling 800.334.2143. Performance figures represent certain fee waivers and/or expense limitations, without which returns would have been lower. The average annual returns for Class A Shares "with sales charge" of First Eagle Global,
Please see the following page for important notes to this table.
FIRST EAGLE FUNDS | SEMI-ANNUAL REPORT | APRIL 30, 2013
16
Average Annual Returns as of April 30, 2013 (unaudited)
Overseas, U.S. Value, Gold, Global Income Builder and Fund of America give effect to the deduction of the maximum sales charge of 5.00%. The average annual returns for Class A Shares "with sales charge" of First Eagle High Yield Fund gives effect to the deduction of the maximum sales charge of 4.50%.
The average annual returns for Class C Shares reflect the CDSC (Contingent Deferred Sales Charge) of 1.00% which pertains to the first year or less of investment only.
Class I Shares of First Eagle Global Fund, First Eagle Overseas Fund, First Eagle U.S. Value Fund, First Eagle Gold Fund, First Eagle Global Income Builder Fund, First Eagle High Yield Fund, and First Eagle Fund of America require $1mm minimum investment and are offered without sales charge.
Class Y Shares of First Eagle Fund of America are offered without charge.
2 Commencement of management by Jean-Marie Eveillard. Mr. Eveillard transitioned to senior adviser on March 26, 2009, a position he also held from January 2005 to March 2007, and continues to be a member of First Eagle Fund's Board of Trustees and a Senior Adviser to First Eagle Investment Management, LLC. The Fund commenced operation April 28, 1970.
3 The MSCI World Index is a widely followed, unmanaged group of stocks from 23 international markets and is not available for purchase. The index provides total returns in U.S. dollars with net dividends reinvested.
4 The MSCI EAFE Index is a total return index, reported in U.S. dollars, based on share prices and reinvested net dividends of approximately 1,100 companies from 22 countries and is not available for purchase.
5 The Standard & Poor's 500 Index is a widely recognized unmanaged index including a representative sample of 500 leading companies in leading sectors of the U.S. economy and is not available for purchase. Although the Standard & Poor's 500 Index focuses on the large-cap segment of the market, with approximately 75% coverage of U.S. equities, it is also considered a proxy for the total market. The Standard & Poor's 500 Index includes dividends reinvested.
6 The FTSE Gold Mines Index is an unmanaged index composed of approximately 19 mining companies, is available without dividends reinvested, and is not available for purchase.
7 The Barclays Capital U.S. Aggregate Bond Index is an unmanaged broad-based benchmark that measures the investment grade, U.S. dollar-denominated, fixed-rate taxable bond market, including Treasuries, government-related and corporate securities, MBS (agency fixed-rate and hybrid ARM passthroughs), ABS, and CMBS and is not available for purchase.
8 First Eagle High Yield Fund commenced operations in its present form on December 30, 2011, and is successor to another mutual fund pursuant to a reorganization December 30, 2011. Information prior to December 30, 2011 is for this predecessor fund. Immediately after the reorganization, changes in net asset value of the Class I shares were partially impacted by differences in how the Fund and the predecessor fund price portfolio securities.
9 The Barclays Capital U.S Corporate High Yield Bond Index is composed of fixed-rate, publicly issued, non-investment grade debt, is unmanaged, with dividends reinvested, and is not available for purchase. The index includes both corporate and non-corporate sectors. The corporate sectors are Industrial, Utility, and Finance, which include both U.S. and non-U.S. corporations. The index is presented here for comparison purposes only. One cannot invest directly in an index.
10 As of September 1, 2005 First Eagle Fund of America Class Y is closed to new accounts.
FIRST EAGLE FUNDS | SEMI-ANNUAL REPORT | APRIL 30, 2013
17
Performance Chart1 (unaudited) (continued)
Expense Ratios As Stated In The Most Recent Prospectus
Total Annual Gross Operating Expense Ratios
| | | CLASS A | | CLASS C | | CLASS I | | CLASS Y | |
First Eagle Global Fund | | | 1.15 | % | | | 1.89 | % | | | 0.90 | % | | | — | | |
First Eagle Overseas Fund | | | 1.17 | | | | 1.92 | | | | 0.92 | | | | — | | |
First Eagle U.S. Value Fund | | | 1.17 | | | | 1.92 | | | | 0.93 | | | | — | | |
First Eagle Gold Fund | | | 1.21 | | | | 1.96 | | | | 0.96 | | | | — | | |
First Eagle Global Income Builder* | | | 2.13 | | | | 2.88 | | | | 2.20 | | | | — | | |
First Eagle High Yield Fund** | | | 1.27 | | | | 2.02 | | | | 1.03 | | | | — | | |
First Eagle Fund of America | | | 1.45 | | | | 2.20 | | | | 1.20 | *** | | | 1.45 | | |
* These are the actual fund operating expenses prior to the application of fee waivers and/or expense reimbursements. The Adviser has contractually agreed to limit operating expenses of the Fund to an annual rate of 1.30% for A Shares, 2.05% for C Shares, and 1.05% for I Shares with gross operating expenses of 2.13%, 2.88%, and 2.20% respectively. This limitation excludes certain expenses as described in the Fees and Expenses section of the prospectus. This limitation will continue until December 31, 2013. The expense limitation may be terminated by the Adviser in future years.
** These are the actual fund operating expenses prior to the application of fee waivers and/or expense reimbursements. The Adviser has contractually agreed to limit operating expenses of the Fund to an annual rate of 0.80% for I Shares, 1.25% for A Shares, and 2.00% for C Shares, with gross operating expenses of 1.03%, 1.27%, and 2.02 % respectively. This limitation excludes certain expenses as described in the Fees and Expenses section of the prospectus. This limitation will continue until December 31, 2013. The expense limitation may be terminated by the Adviser in future years.
*** The Fund's Class I Shares commenced investment operations on March 8, 2013. The percentages shown above are based on anticipated expenses of Class I for the first fiscal year. However, the rate at which expenses are accrued during the fiscal year may not be constant and, at any particular point, may be greater or less than the stated average percentage.
These expense ratios are presented as of October 31, 2012 and may differ from corresponding ratios shown elsewhere in this report because of differing time periods (and/or, if applicable, because these expense ratios do not include expense credits or waivers).
There are risks associated with investing in funds that invest in securities of foreign countries, such as erratic market conditions, economic and political instability and fluctuations in currency exchange rates. Funds whose investments are concentrated in a specific industry or sector may be subject to a higher degree of risk than funds whose investments are diversified and may not be suitable for all investors. Hedging can reduce exposure to currency exchange movements, but cannot eliminate that exposure. It is possible to lose money under a hedge. Results from hedging transactions, which for the Funds are primarily currency forward contracts, are further described in the financial statements that follow this commentary.
FIRST EAGLE FUNDS | SEMI-ANNUAL REPORT | APRIL 30, 2013
18
Average Annual Returns as of April 30, 2013 (unaudited)
Investment in gold and gold related investments present certain risks, including negative tax consequences (e.g., a change in a fund's tax status causing the fund to be subject to tax at the fund level on its taxable income), political and economic risks affecting the price of gold and other precious metals like changes in U.S. or foreign tax, currency or mining laws, increased environmental costs, international monetary and political policies, economic conditions within an individual country, trade imbalances, and trade or currency restrictions between countries. The price of gold, in turn, is likely to affect the market prices of securities of companies mining or processing gold, and accordingly, the value of investments in such securities may also be affected. Gold related investments as a group have not performed as well as the stock market in general during periods when the U.S. Dollar is strong, inflation is low and general economic conditions are stable. In addition, returns on gold related investments have traditionally been more volatile than investments in broader equity or debt markets.
First Eagle Global Income Builder Fund and First Eagle High Yield Fund invest in high yield securities that are non-investment grade (commonly known as "junk bonds") which are generally considered speculative because they may be subject to greater levels of interest rate, credit (including issuer default) and liquidity risk than investment grade securities and may be subject to greater volatility. High yield securities are rated lower than investment-grade securities because there is a greater possibility that the issuer may be unable to make interest and principal payments on those securities.
Funds that invest in bonds are subject to interest-rate risk and can lose principal value when interest rates rise. Bonds are also subject to credit risk, in which the bond issuer may fail to pay interest and principal in a timely manner, or that negative perception of the issuer's ability to make such payments may cause the price of that bond to decline.
Bank loans are often less liquid than other types of debt instruments. There is no assurance that the liquidation of any collateral from a secured bank loan would satisfy the borrower's obligation, or that such collateral could be liquidated.
The First Eagle High Yield Fund's investment strategies may result in high turnover rates. This may increase the Fund's brokerage commission costs, which would reduce performance. Rapid portfolio turnover also exposes shareholders to a higher current realization of short-term gains, which could cause you to pay higher taxes.
Income generation and dividends are not guaranteed. If dividend paying stocks in the Fund's portfolio stop paying or reduce dividends, the Fund's ability to generate income will be adversely affected.
The event-driven investment style used by First Eagle Fund of America carries the additional risk that the event anticipated occurs later than expected, does not occur at all or does not have the desired effect on the market price of the securities.
The principal risk of investing in value stocks is that the price of the security may not approach its anticipated value or may decline in value.
All investments involve the risk of loss.
FIRST EAGLE FUNDS | SEMI-ANNUAL REPORT | APRIL 30, 2013
19

Fund Overview | Data as of April 30, 2013 (unaudited)
INVESTMENT OBJECTIVE
First Eagle Global Fund seeks long-term growth of capital by investing in a range of asset classes from markets in the United States and around the world. This truly global fund is managed with a highly disciplined, bottom-up, value oriented style.
Average Annual Returns | |
| | | ONE-YEAR | | FIVE-YEARS | | TEN-YEARS | |
First Eagle Global
Fund (A Shares) | |
without sales load | | | 12.45 | % | | | 6.22 | % | | | 12.45 | % | |
with sales load | | | 6.83 | | | | 5.14 | | | | 11.88 | | |
MSCI World Index | | | 16.70 | | | | 1.81 | | | | 8.29 | | |
Consumer Price Index | | | 1.06 | | | | 1.60 | | | | 2.38 | | |
Countries** | |
United States | | | 37.63 | % | |
Japan | | | 15.75 | | |
France | | | 5.44 | | |
Canada | | | 3.95 | | |
Germany | | | 2.36 | | |
Mexico | | | 2.31 | | |
United Kingdom | | | 2.26 | | |
Switzerland | | | 1.95 | | |
South Korea | | | 1.06 | | |
Australia | | | 0.97 | | |
Sweden | | | 0.65 | | |
South Africa | | | 0.61 | | |
Thailand | | | 0.59 | | |
Ireland | | | 0.52 | | |
Belgium | | | 0.52 | | |
Bermuda | | | 0.45 | | |
Austria | | | 0.44 | | |
Spain | | | 0.42 | | |
Malaysia | | | 0.39 | | |
Hong Kong | | | 0.37 | | |
Italy | | | 0.31 | | |
Israel | | | 0.23 | | |
Netherlands | | | 0.19 | | |
Singapore | | | 0.05 | | |
Norway | | | 0.03 | | |
* Asset Allocation and Countries percentages are based on total investments in the portfolio.
** Country allocations reflect country of the issuer (not currency of issue) and exclude short term investments. Bonds of non-U.S. issuers may be U.S. dollar denominated.
The Fund's portfolio composition is subject to change at any time.
FIRST EAGLE FUNDS | SEMI-ANNUAL REPORT | APRIL 30, 2013
20
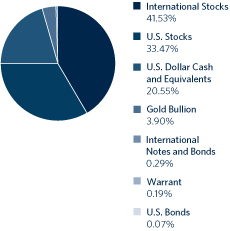
Growth of a $10,000 Initial Investment
Performance data quoted herein represents past performance and should not be considered indicative of future results. Performance data quoted herein does not reflect the deduction of taxes that a shareholder would pay on Fund distributions or the sale of Fund shares. The average annual returns shown above are historical and reflect changes in share price, reinvested dividends and are net of expenses.
The average annual returns for Class A Shares give effect to the deduction of the maximum sales charge of 5.00%.
The MSCI World Index is a widely followed, unmanaged group of stocks from 23 international markets and is not available for purchase. The index provides total returns in U.S. dollars with net dividends reinvested. The Consumer Price Index (CPI) represents the change in price of all goods and services purchased for consumption by urban households.
| Top 10 Holdings* | |
| Gold Bullion (precious metal) | | | 3.89 | % | |
| Comcast Corporation, Class 'A' (U.S. cable/satellite television company) | | | 1.64 | | |
| Microsoft Corporation (U.S. software developer) | | | 1.58 | | |
| Cisco Systems, Inc. (U.S. computer communications company) | | | 1.55 | | |
| Secom Company Limited (Japanese security services provider) | | | 1.55 | | |
| Sysco Corporation (U.S. food services distributor) | | | 1.46 | | |
| Keyence Corporation (Japanese sensors manufacturer) | | | 1.43 | | |
| Cintas Corporation (U.S. commercial services equipment supplier) | | | 1.41 | | |
| Intel Corporation (U.S. computer components and related products manufacturer) | | | 1.36 | | |
| HeidelbergCement AG (German cement company) | | | 1.34 | | |
Total | | | 17.21 | % | |
* Holdings in cash, commercial paper and other short term cash equivalents have been excluded. Percentages are based on total net assets.
FIRST EAGLE FUNDS | SEMI-ANNUAL REPORT | APRIL 30, 2013
21
SHARES | | DESCRIPTION | | COST (NOTE 1) | | VALUE (NOTE 1) | |
Common Stocks — 74.44% | |
U.S. Common Stocks — 33.35% | | | |
Consumer Discretionary 2.81% | | | |
| | 17,414,912 | | | Comcast Corporation, Class 'A' | | $ | 296,976,000 | | | $ | 684,231,893 | | |
| | 6,208,490 | | | Omnicom Group, Inc. | | | 186,093,077 | | | | 371,081,447 | | |
| | 3,992,318 | | | H&R Block, Inc. | | | 67,554,206 | | | | 110,746,901 | | |
| | 2,485 | | | JG Boswell Company | | | 573,840 | | | | 2,107,280 | | |
| | 33,892 | | | Mills Music Trust (a)(b) | | | 1,015,863 | | | | 1,106,235 | | |
| 184,753 | | | St. John Knits International,
Inc. (b)(c) | | | 3,174,837 | | | | 1,025,379 | | |
| | | | 555,387,823 | | | | 1,170,299,135 | | |
Consumer Staples 3.07% | | | |
| | 17,479,577 | | | Sysco Corporation | | | 495,705,689 | | | | 609,338,054 | | |
| | 8,055,054 | | | Lorillard, Inc. | | | 232,652,802 | | | | 345,481,266 | | |
| | 1,629,490 | | | Colgate-Palmolive Company | | | 125,309,063 | | | | 194,577,401 | | |
| | 1,693,404 | | | Wal-Mart Stores, Inc. | | | 82,465,011 | | | | 131,611,359 | | |
| | | | 936,132,565 | | | | 1,281,008,080 | | |
Energy 2.14% | | | |
| | 6,224,163 | | | ConocoPhillips | | | 250,797,600 | | | | 376,250,653 | | |
| | 5,498,448 | | | Devon Energy Corporation | | | 312,965,847 | | | | 302,744,547 | | |
| | 1,442,501 | | | Apache Corporation | | | 90,693,920 | | | | 106,571,974 | | |
| | 3,908,035 | | | San Juan Basin Royalty Trust (a) | | | 138,744,050 | | | | 60,379,141 | | |
| | 806,395 | | | Helmerich & Payne, Inc. | | | 17,026,317 | | | | 47,270,875 | | |
| | | | 810,227,734 | | | | 893,217,190 | | |
Financials 8.52% | | | |
| | 7,529,993 | | | American Express Company | | | 317,870,387 | | | | 515,126,821 | | |
| 17,571,107 | | | Bank of New York
Mellon Corporation | | | 441,008,507 | | | | 495,856,640 | | |
| 2,714 | | | Berkshire Hathaway, Inc.,
Class 'A' (c) | | | 218,995,900 | | | | 431,526,000 | | |
| | 6,930,015 | | | Cincinnati Financial Corporation | | | 173,611,074 | | | | 338,947,034 | | |
| | 9,921,397 | | | Weyerhaeuser Company, REIT | | | 154,182,567 | | | | 302,701,822 | | |
| | 9,693,682 | | | BB&T Corporation | | | 245,863,323 | | | | 298,274,595 | | |
| 5,719,208 | | | Plum Creek Timber Company,
Inc., REIT | | | 212,342,604 | | | | 294,767,980 | | |
| | 7,819,459 | | | U.S. Bancorp | | | 192,949,644 | | | | 260,231,596 | | |
| | 4,386,051 | | | WR Berkley Corporation | | | 117,583,057 | | | | 190,442,334 | | |
| | 2,858,553 | | | Rayonier, Inc., REIT | | | 27,837,041 | | | | 169,855,219 | | |
| | 743,437 | | | Visa, Inc., Class 'A' | | | 53,618,674 | | | | 125,239,397 | | |
| | 202,406 | | | Mastercard, Inc., Class 'A' | | | 40,702,513 | | | | 111,916,350 | | |
See Notes to Financial Statements.
FIRST EAGLE FUNDS | SEMI-ANNUAL REPORT | APRIL 30, 2013
22
Schedule of Investments | Six-Month Period Ended April 30, 2013 (unaudited)
SHARES | | DESCRIPTION | | COST (NOTE 1) | | VALUE (NOTE 1) | |
U.S. Common Stocks — 33.35% — (continued) | | | |
Financials 8.52% — (continued) | | | |
| | 40,182 | | | Alleghany Corporation (c) | | $ | 13,132,071 | | | $ | 15,821,261 | | |
| | | | 2,209,697,362 | | | | 3,550,707,049 | | |
Health Care 1.00% | | | |
| | 4,469,770 | | | WellPoint, Inc. | | | 240,056,531 | | | | 325,935,629 | | |
| | 1,059,980 | | | Johnson & Johnson | | | 59,610,843 | | | | 90,342,095 | | |
| | | | 299,667,374 | | | | 416,277,724 | | |
Industrials 4.63% | | | |
| | 13,051,511 | | | Cintas Corporation (a) | | | 438,387,413 | | | | 585,621,298 | | |
| | 4,069,880 | | | 3M Company | | | 315,646,157 | | | | 426,157,135 | | |
| | 3,069,252 | | | Lockheed Martin Corporation | | | 217,057,860 | | | | 304,132,181 | | |
| | 3,867,416 | | | Northrop Grumman Corporation | | | 231,724,655 | | | | 292,918,088 | | |
| | 3,638,247 | | | Alliant Techsystems, Inc. (a) | | | 314,316,906 | | | | 270,540,047 | | |
| | 558,107 | | | Unifirst Corporation | | | 7,536,171 | | | | 50,815,642 | | |
| | | | 1,524,669,162 | | | | 1,930,184,391 | | |
Information Technology 7.59% | | | |
| | 19,924,734 | | | Microsoft Corporation | | | 501,658,947 | | | | 659,508,695 | | |
| | 30,972,653 | | | Cisco Systems, Inc. | | | 507,076,395 | | | | 647,947,901 | | |
| | 23,729,320 | | | Intel Corporation | | | 444,931,301 | | | | 568,317,214 | | |
| | 14,959,315 | | | Oracle Corporation | | | 426,029,947 | | | | 490,366,346 | | |
| | 8,019,789 | | | Linear Technology Corporation | | | 227,165,656 | | | | 292,722,298 | | |
| | 282,275 | | | Google, Inc., Class 'A' (c) | | | 149,382,648 | | | | 232,755,497 | | |
| | 2,365,411 | | | Automatic Data Processing, Inc. | | | 85,148,200 | | | | 159,286,777 | | |
| | 2,031,390 | | | Texas Instruments, Inc. | | | 55,783,759 | | | | 73,556,632 | | |
| | 1,137,229 | | | NetApp, Inc. (c) | | | 36,048,304 | | | | 39,677,920 | | |
| | | | 2,433,225,157 | | | | 3,164,139,280 | | |
Materials 1.63% | | | |
| | 4,056,879 | | | Vulcan Materials Company | | | 200,596,336 | | | | 202,357,124 | | |
| 4,172,577 | | | Scotts Miracle-Gro Company,
Class 'A' (a) | | | 182,102,946 | | | | 189,226,367 | | |
| | 1,752,640 | | | Martin Marietta Materials, Inc. | | | 155,134,877 | | | | 176,999,114 | | |
| | 1,780,037 | | | Newmont Mining Corporation | | | 45,037,176 | | | | 57,673,199 | | |
| | 811,480 | | | Deltic Timber Corporation (a) | | | 39,544,384 | | | | 50,701,270 | | |
| | | | 622,415,719 | | | | 676,957,074 | | |
Utilities 1.96% | | | |
| | 9,696,381 | | | FirstEnergy Corporation | | | 353,449,107 | | | | 451,851,354 | | |
| | 3,760,485 | | | IDACorp, Inc. (a) | | | 124,066,738 | | | | 185,053,467 | | |
See Notes to Financial Statements.
FIRST EAGLE FUNDS | SEMI-ANNUAL REPORT | APRIL 30, 2013
23
SHARES | | DESCRIPTION | | COST (NOTE 1) | | VALUE (NOTE 1) | |
U.S. Common Stocks — 33.35% — (continued) | | | |
Utilities 1.96% — (continued) | | | |
| | 2,491,660 | | | Entergy Corporation | | $ | 164,249,120 | | | $ | 177,480,942 | | |
| | | | 641,764,965 | | | | 814,385,763 | | |
Total U.S. Common Stocks | | | 10,033,187,861 | | | | 13,897,175,686 | | |
International Common Stocks — 41.09% | | | |
Australia 0.97% | | | |
| | 23,189,619 | | | Newcrest Mining Limited | | | 627,125,396 | | | | 403,928,746 | | |
Austria 0.43% | | | |
| | 3,857,199 | | | OMV AG | | | 157,989,372 | | | | 181,040,671 | | |
Belgium 0.52% | | | |
| | 2,788,865 | | | Groupe Bruxelles Lambert SA | | | 234,732,253 | | | | 215,747,088 | | |
Bermuda 0.45% | | | |
| 2,875,070 | | | Jardine Matheson
Holdings Limited | | | 141,681,818 | | | | 186,678,295 | | |
Canada 3.90% | | | |
| | 15,808,675 | | | Goldcorp, Inc. | | | 530,262,725 | | | | 467,620,606 | | |
| 10,343,600 | | | Canadian Natural
Resources Limited | | | 297,690,279 | | | | 303,408,160 | | |
| 7,007,471 | | | Potash Corporation of
Saskatchewan, Inc. | | | 276,000,358 | | | | 295,014,529 | | |
| | 6,608,500 | | | Cenovus Energy, Inc. | | | 184,336,874 | | | | 197,858,490 | | |
| | 5,216,450 | | | Agnico-Eagle Mines Limited | | | 173,749,110 | | | | 168,392,847 | | |
| | 17,645,244 | | | Penn West Petroleum Limited | | | 273,529,232 | | | | 162,865,602 | | |
| | 4,951,070 | | | Kinross Gold Corporation | | | 26,309,629 | | | | 26,933,821 | | |
| 1,493,910 | | | Postmedia Network Canada
Corporation (b)(c)(d) | | | 6,692,131 | | | | 2,891,726 | | |
| 1,008,427 | | | Catalyst Paper
Corporation (a)(b)(c)(e) | | | 17,346 | | | | 2,016,854 | | |
| | | | 1,768,587,684 | | | | 1,627,002,635 | | |
France 5.26% | | | |
| | 4,179,227 | | | Sanofi | | | 323,385,924 | | | | 457,576,588 | | |
| | 8,485,204 | | | Total SA | | | 432,228,230 | | | | 427,229,147 | | |
| | 10,735,807 | | | Bouygues SA | | | 391,146,130 | | | | 299,299,351 | | |
| | 3,330,779 | | | Sodexo | | | 88,582,313 | | | | 277,871,301 | | |
| | 8,755,798 | | | Carrefour SA | | | 363,896,634 | | | | 259,190,080 | | |
| | 2,044,437 | | | Neopost SA (a) | | | 184,799,958 | | | | 134,340,164 | | |
| | 11,803,362 | | | Société Télévision Francaise 1 (a) | | | 184,371,882 | | | | 124,745,135 | | |
| | 921,669 | | | Wendel SA | | | 19,716,342 | | | | 99,747,911 | | |
| | 1,130,913 | | | Legrand SA | | | 35,203,833 | | | | 52,648,805 | | |
See Notes to Financial Statements.
FIRST EAGLE FUNDS | SEMI-ANNUAL REPORT | APRIL 30, 2013
24
Schedule of Investments | Six-Month Period Ended April 30, 2013 (unaudited)
SHARES | | DESCRIPTION | | COST (NOTE 1) | | VALUE (NOTE 1) | |
International Common Stocks — 41.09% — (continued) | | | |
France 5.26% — (continued) | | | |
| | 157,260 | | | Robertet SA (a)(c) | | $ | 20,623,058 | | | $ | 29,377,589 | | |
| | 42,252 | | | Robertet SA CI (b)(c)(f)(g) | | | 800,508 | | | | 5,597,793 | | |
| | 385,000 | | | Sabeton SA (a)(c) | | | 4,841,233 | | | | 6,524,042 | | |
| | 12,000,000 | | | FINEL (a)(b)(c)(e)(f)(h) | | | 0 | | | | 5,683,605 | | |
| | 69,500 | | | NSC Groupe (a)(b) | | | 12,298,421 | | | | 5,577,695 | | |
| | 104,457 | | | Gaumont SA | | | 6,087,824 | | | | 5,098,608 | | |
| | | | 2,067,982,290 | | | | 2,190,507,814 | | |
Germany 2.07% | | | |
| | 7,775,691 | | | HeidelbergCement AG | | | 424,710,748 | | | | 559,278,586 | | |
| | 4,285,909 | | | Daimler AG | | | 200,355,962 | | | | 236,912,206 | | |
| | 693,440 | | | Fraport AG | | | 20,976,007 | | | | 41,401,255 | | |
| | 773,684 | | | Hornbach Baumarkt AG | | | 21,504,161 | | | | 25,289,646 | | |
| | | | 667,546,878 | | | | 862,881,693 | | |
Hong Kong 0.37% | | | |
| | 12,693,580 | | | Guoco Group Limited | | | 115,086,260 | | | | 151,545,360 | | |
| | 20,738,780 | | | City e-Solutions Limited (a)(b)(c) | | | 936,898 | | | | 2,004,276 | | |
| | | | 116,023,158 | | | | 153,549,636 | | |
Ireland 0.52% | | | |
| | 10,094,915 | | | CRH PLC | | | 175,024,030 | | | | 216,703,442 | | |
Israel 0.22% | | | |
| | 7,864,560 | | | Israel Chemicals Limited | | | 81,267,220 | | | | 93,520,229 | | |
Italy 0.31% | | | |
| | 18,139,395 | | | Italcementi S.p.A. RSP | | | 249,186,230 | | | | 55,844,291 | | |
| | 4,682,069 | | | Italcementi S.p.A. | | | 86,201,872 | | | | 29,013,414 | | |
| | 1,734,972 | | | Italmobiliare S.p.A. RSP (c) | | | 121,356,934 | | | | 22,769,081 | | |
| | 1,021,137 | | | Italmobiliare S.p.A. (c) | | | 107,360,738 | | | | 20,810,166 | | |
| | | | 564,105,774 | | | | 128,436,952 | | |
Japan 15.69% | | | |
| | 11,590,430 | | | Secom Company Limited | | | 528,330,685 | | | | 646,255,719 | | |
| | 1,882,590 | | | Keyence Corporation | | | 348,832,346 | | | | 596,238,723 | | |
| | 2,684,256 | | | SMC Corporation | | | 293,714,079 | | | | 536,768,663 | | |
| | 10,288,400 | | | KDDI Corporation | | | 327,454,046 | | | | 493,514,191 | | |
| | 8,483,960 | | | Astellas Pharma, Inc. | | | 340,690,755 | | | | 493,046,207 | | |
| | 5,025,290 | | | Shimano, Inc. (a) | | | 86,342,617 | | | | 436,265,119 | | |
| | 2,888,400 | | | Fanuc Corporation | | | 255,486,281 | | | | 435,191,718 | | |
| | 14,618,720 | | | MS&AD Insurance Group Holdings | | | 356,085,457 | | | | 390,921,339 | | |
See Notes to Financial Statements.
FIRST EAGLE FUNDS | SEMI-ANNUAL REPORT | APRIL 30, 2013
25
SHARES | | DESCRIPTION | | COST (NOTE 1) | | VALUE (NOTE 1) | |
International Common Stocks — 41.09% — (continued) | | | |
Japan 15.69% — (continued) | | | |
| | 14,917,300 | | | NKSJ Holdings, Inc. | | $ | 402,645,728 | | | $ | 377,347,372 | | |
| 2,307,100 | | | Hirose Electric
Company Limited (a) | | | 244,784,088 | | | | 331,055,194 | | |
| 9,491,980 | | | Mitsubishi Estate
Company Limited | | | 139,735,575 | | | | 307,918,995 | | |
| | 14,298,940 | | | Hoya Corporation | | | 305,848,299 | | | | 285,495,158 | | |
| | 8,807,560 | | | MISUMI Group, Inc. (a) | | | 146,993,290 | | | | 268,203,359 | | |
| 3,007,000 | | | Ono Pharmaceutical
Company Limited | | | 124,896,566 | | | | 197,867,473 | | |
| 6,464,110 | | | Nomura Research
Institute Limited | | | 135,171,359 | | | | 194,456,648 | | |
| 4,274,630 | | | Nissin Foods Holdings
Company Limited | | | 152,059,580 | | | | 191,463,466 | | |
| | 59,245 | | | NTT DoCoMo, Inc. | | | 90,107,766 | | | | 97,765,028 | | |
| 3,526,280 | | | Chofu Seisakusho
Company Limited (a) | | | 64,322,538 | | | | 81,574,478 | | |
| | 5,147,000 | | | T. Hasegawa Company Limited (a) | | | 79,849,658 | | | | 75,808,323 | | |
| 1,100,560 | | | Shin-Etsu Chemical
Company Limited | | | 51,374,809 | | | | 73,998,602 | | |
| | 1,959,900 | | | Seikagaku Corporation | | | 20,639,723 | | | | 26,717,235 | | |
| | | | 4,495,365,245 | | | | 6,537,873,010 | | |
Malaysia 0.38% | | | |
| | 129,221,380 | | | Genting Malaysia Berhad | | | 111,924,255 | | | | 159,695,115 | | |
Mexico 2.31% | | | |
| | 15,044,166 | | | Grupo Televisa S.A.B., ADR | | | 289,394,927 | | | | 380,918,283 | | |
| | 17,363,483 | | | Fresnillo PLC | | | 235,897,571 | | | | 310,702,268 | | |
| | 6,401,020 | | | Industrias Peñoles S.A.B. de C.V. | | | 7,339,323 | | | | 269,284,563 | | |
| | | | 532,631,821 | | | | 960,905,114 | | |
Netherlands 0.19% | | | |
| | 10,519,454 | | | TNT Express NV | | | 115,928,316 | | | | 80,742,045 | | |
Singapore 0.05% | | | |
| 13,467,250 | | | ComfortDelGro
Corporation Limited | | | 3,279,184 | | | | 21,684,370 | | |
South Africa 0.61% | | | |
| | 25,019,071 | | | Gold Fields Limited, ADR | | | 233,463,377 | | | | 186,642,270 | | |
| 8,092,307 | | | Harmony Gold Mining Company
Limited, ADR | | | 69,852,451 | | | | 41,513,535 | | |
| | 4,769,860 | | | Sibanye Gold Limited, ADR (c) | | | 28,713,214 | | | | 18,363,961 | | |
See Notes to Financial Statements.
FIRST EAGLE FUNDS | SEMI-ANNUAL REPORT | APRIL 30, 2013
26
Schedule of Investments | Six-Month Period Ended April 30, 2013 (unaudited)
SHARES | | DESCRIPTION | | COST (NOTE 1) | | VALUE (NOTE 1) | |
International Common Stocks — 41.09% — (continued) | | | |
South Africa 0.61% — (continued) | | | |
| | 324,020 | | | AngloGold Ashanti
Limited, ADR | | $ | 5,810,748
| | | $ | 6,318,390
| | |
| | | | 337,839,790 | | | | 252,838,156 | | |
South Korea 0.99% | | | |
| | 3,898,597 | | | KT&G Corporation | | | 216,376,344 | | | | 280,721,640 | | |
| 51,900 | | | Lotte Confectionery
Company Limited | | | 21,157,499 | | | | 90,482,158 | | |
| 39,989 | | | Namyang Dairy Products
Company Limited (a) | | | 7,325,466 | | | | 42,301,993 | | |
| | | | 244,859,309 | | | | 413,505,791 | | |
Spain 0.42% | | | |
| | 3,295,234 | | | Red Electrica Corporation SA | | | 165,292,750 | | | | 175,105,681 | | |
Sweden 0.65% | | | |
| | 5,939,940 | | | Investor AB, Class 'A' | | | 116,378,542 | | | | 171,667,683 | | |
| | 3,394,798 | | | Investor AB, Class 'B' | | | 63,888,333 | | | | 99,996,363 | | |
| | | | 180,266,875 | | | | 271,664,046 | | |
Switzerland 1.95% | | | |
| | 5,091,560 | | | Nestlé SA | | | 146,056,201 | | | | 363,213,992 | | |
| | 4,327,670 | | | Pargesa Holding SA | | | 272,881,781 | | | | 301,281,710 | | |
| | 26,528 | | | Lindt & Spruengli AG PC | | | 23,885,815 | | | | 102,600,774 | | |
| | 388,803 | | | Kuehne & Nagel International AG | | | 7,503,142 | | | | 44,444,176 | | |
| | | | 450,326,939 | | | | 811,540,652 | | |
Thailand 0.58% | | | |
| | 30,023,200 | | | Bangkok Bank PCL, NVDR | | | 97,800,376 | | | | 231,183,754 | | |
| | 577,000 | | | OHTL PCL (b) | | | 2,636,473 | | | | 11,795,571 | | |
| | | | 100,436,849 | | | | 242,979,325 | | |
United Kingdom 2.25% | | | |
| | 7,749,898 | | | Berkeley Group Holdings PLC (a) | | | 93,521,018 | | | | 250,990,420 | | |
| | 55,018,479 | | | WM Morrison Supermarkets PLC | | | 243,196,894 | | | | 249,629,115 | | |
| | 7,387,420 | | | GlaxoSmithKline PLC | | | 140,774,624 | | | | 190,540,267 | | |
| | 4,355,040 | | | Willis Group Holdings PLC | | | 119,957,625 | | | | 172,807,987 | | |
| | 3,052,693 | | | Anglo American PLC | | | 74,109,213 | | | | 74,208,315 | | |
| | | | 671,559,374 | | | | 938,176,104 | | |
Total International Common Stocks | | | 14,011,776,580 | | | | 17,126,706,610 | | |
Total Common Stocks | | | 24,044,964,441 | | | | 31,023,882,296 | | |
See Notes to Financial Statements.
FIRST EAGLE FUNDS | SEMI-ANNUAL REPORT | APRIL 30, 2013
27
SHARES | | DESCRIPTION | | COST (NOTE 1) | | VALUE (NOTE 1) | |
International Preferred Stock — 0.28% | | | |
Germany 0.28% | | | |
| | 1,754,484 | | | Hornbach Holding AG | | $ | 63,837,360 | | | $ | 117,491,735 | | |
Warrant — 0.19% | | | |
United States — 0.19% | | | |
| | 5,806,899 | | | JPMorgan Chase & Company
Warrant expire 10/28/18 (c) | | | 75,108,859
| | | | 80,425,551
| | |
OUNCES | | | | | | | |
Commodity — 3.89% | | | |
| | 1,097,527 | | | Gold bullion (c) | | | 799,578,304 | | | | 1,619,895,681 | | |
PRINCIPAL | | | | | | | |
Notes and Bonds — 0.35% | | | |
U.S. Corporate Bonds — 0.07% | | | |
$ | 5,467,000 | | | Bausch & Lomb, Inc.
7.125% due 08/01/28 (b) | | | 4,781,483
| | | | 5,084,310
| | |
| | 22,554,000 | | | Yankee Candle Company, Inc.
Series 'B' 9.75% due 02/15/17 | | | 22,103,094
| | | | 23,428,193
| | |
Total U.S. Corporate Bonds | | | 26,884,577 | | | | 28,512,503 | | |
International Notes and Bonds — 0.28% | | | |
International Corporate Notes and Bonds — 0.22% | | | |
Canada 0.03% | | | |
| 17,593,454
USD | | | Catalyst Paper Corporation
11.00% due 10/30/17 (e)(i) | | | 21,613,126
| | | | 13,634,927
| | |
France 0.16% | | | |
| 15,000,000
EUR | | | Emin Leydier SA FRN
7.32% due 07/31/16 (b)(e)(f)(j) | | | 21,437,036
| | | | 19,734,739
| | |
| 12,000,000
EUR | | | FINEL
9.50% due 06/30/17 (b)(e)(f) | | | 14,495,954
| | | | 11,840,843
| | |
| 12,050,000
EUR | | | Wendel SA
4.375% due 08/09/17 | | | 12,488,633
| | | | 16,709,666
| | |
| 10,000,000
EUR | | | Wendel SA
4.875% due 09/21/15 | | | 11,792,715
| | | | 13,995,219
| | |
| 3,500,000
EUR | | | Wendel SA
4.875% due 05/26/16 | | | 3,254,781
| | | | 4,924,804
| | |
| | | | 63,469,119 | | | | 67,205,271 | | |
See Notes to Financial Statements.
FIRST EAGLE FUNDS | SEMI-ANNUAL REPORT | APRIL 30, 2013
28
Schedule of Investments | Six-Month Period Ended April 30, 2013 (unaudited)
PRINCIPAL | | DESCRIPTION | | COST (NOTE 1) | | VALUE (NOTE 1) | |
International Corporate Notes and Bonds — 0.22% — (continued) | | | |
Norway 0.03% | | | |
| 5,500,000
USD | | | Den Norske Bank ASA FRN
0.625% due 08/30/13 (b)(j) | | $ | 3,974,431
| | | $ | 3,052,500
| | |
| 3,170,000
USD | | | Den Norske Creditbank FRN
0.563% due 05/31/13 (b)(j) | | | 2,111,394
| | | | 1,711,800
| | |
| 3,500,000
USD | | | Den Norske Creditbank FRN
0.607% due 08/30/13 (b)(j) | | | 2,659,615
| | | | 1,890,000
| | |
| 10,000,000
USD | | | Nordea Bank Norge ASA FRN
0.711% due 11/21/13 (b)(j) | | | 6,992,567
| | | | 5,450,000
| | |
| | | | 15,738,007 | | | | 12,104,300 | | |
Total International Corporate Notes and Bonds | | | 100,820,252 | | | | 92,944,498 | | |
International Government Bond — 0.06% | | | |
South Korea 0.06% | | | |
| 25,729,620,000
KRW | | | Inflation Linked Korea Treasury Bond
2.75% due 03/10/17 (k) | | | 24,503,766
| | | | 25,302,592
| | |
Total International Notes and Bonds | | | 125,324,018 | | | | 118,247,090 | | |
Total Notes and Bonds | | | 152,208,595 | | | | 146,759,593 | | |
Commercial Paper — 20.48% | | | |
International Commercial Paper — 6.36% | | | |
Canada 0.53% | | | |
| 53,227,000
USD | | | Canadian Natural Resources Limited
0.32% due 05/22/13 | | | 53,217,064
| | | | 53,217,064
| | |
| 32,543,000
USD | | | Canadian Natural Resources Limited
0.33% due 05/10/13 | | | 32,540,315
| | | | 32,540,315
| | |
| 16,941,000
USD
| | | Potash Corporation of
Saskatchewan, Inc.
0.27% due 05/29/13 | | | 16,937,443
| | | | 16,937,443
| | |
| 26,769,000
USD | | | Suncor Energy, Inc.
0.29% due 06/12/13 | | | 26,759,943
| | | | 26,759,943
| | |
| 55,833,000
USD | | | Suncor Energy, Inc.
0.29% due 06/13/13 | | | 55,813,660
| | | | 55,813,660
| | |
| 35,905,000
USD | | | Suncor Energy, Inc.
0.29% due 06/24/13 | | | 35,889,382
| | | | 35,889,382
| | |
France 1.35% | | | |
| 39,699,000
USD | | | GDF Suez SA
0.22% due 07/09/13 | | | 39,682,260
| | | | 39,680,707
| | |
| 72,318,000
USD | | | Sanofi
0.11% due 06/17/13 | | | 72,307,614
| | | | 72,307,614
| | |
| 34,775,000
USD | | | Sanofi
0.13% due 06/20/13 | | | 34,768,721
| | | | 34,768,721
| | |
See Notes to Financial Statements.
FIRST EAGLE FUNDS | SEMI-ANNUAL REPORT | APRIL 30, 2013
29
PRINCIPAL | | DESCRIPTION | | COST (NOTE 1) | | VALUE (NOTE 1) | |
International Commercial Paper — 6.36% — (continued) | | | |
France 1.35% — (continued) | | | |
| 67,959,000
USD | | | Sanofi
0.13% due 07/15/13 | | $ | 67,940,595
| | | $ | 67,939,584
| | |
| 85,598,000
USD | | | Sanofi
0.14% due 06/25/13 | | | 85,579,691
| | | | 85,579,691
| | |
| 50,534,000
USD | | | Total SA
0.09% due 05/01/13 | | | 50,534,000
| | | | 50,534,000
| | |
| 67,797,000
USD | | | Total SA
0.12% due 05/02/13 | | | 67,796,774
| | | | 67,796,774
| | |
| 73,591,000
USD | | | Total SA
0.12% due 05/22/13 | | | 73,585,849
| | | | 73,585,849
| | |
| 70,167,000
USD | | | Total SA
0.12% due 06/04/13 | | | 70,159,048
| | | | 70,159,048
| | |
Germany 0.61% | | | |
| 36,651,000
USD | | | BASF AG
0.11% due 05/29/13 | | | 36,647,864
| | | | 36,647,864
| | |
| 43,430,000
USD | | | BASF AG
0.13% due 06/18/13 | | | 43,422,472
| | | | 43,422,472
| | |
| 60,967,000
USD | | | Siemens Company
0.12% due 06/18/13 | | | 60,957,245
| | | | 60,957,245
| | |
| 33,220,000
USD | | | Siemens Company
0.12% due 06/19/13 | | | 33,214,574
| | | | 33,214,574
| | |
| 81,514,000
USD | | | Siemens Company
0.12% due 06/21/13 | | | 81,500,143
| | | | 81,500,143
| | |
Italy 0.38% | | | |
| 27,766,000
USD | | | Eni S.p.A.
0.34% due 05/15/13 | | | 27,762,329
| | | | 27,762,329
| | |
| 20,871,000
USD | | | Eni S.p.A.
0.38% due 05/21/13 | | | 20,866,710
| | | | 20,866,710
| | |
| 34,393,000
USD | | | Eni S.p.A.
0.40% due 05/01/13 | | | 34,393,000
| | | | 34,393,000
| | |
| 61,832,000
USD | | | Eni S.p.A.
0.40% due 05/20/13 | | | 61,819,273
| | | | 61,819,273
| | |
| 14,803,000
USD | | | Eni S.p.A.
0.42% due 05/09/13 | | | 14,801,651
| | | | 14,801,651
| | |
Japan 0.63% | | | |
| 21,175,000
USD | | | Hitachi Limited
0.31% due 05/23/13 | | | 21,170,989
| | | | 21,170,989
| | |
| 38,105,000
USD | | | Honda Corporation
0.12% due 06/07/13 | | | 38,100,300
| | | | 38,100,300
| | |
| 106,232,000
USD | | | Honda Corporation
0.13% due 05/10/13 | | | 106,228,547
| | | | 106,228,547
| | |
| 43,036,000
USD | | | Honda Corporation
0.14% due 06/07/13 | | | 43,029,808
| | | | 43,029,808
| | |
See Notes to Financial Statements.
FIRST EAGLE FUNDS | SEMI-ANNUAL REPORT | APRIL 30, 2013
30
Schedule of Investments | Six-Month Period Ended April 30, 2013 (unaudited)
PRINCIPAL | | DESCRIPTION | | COST (NOTE 1) | | VALUE (NOTE 1) | |
International Commercial Paper — 6.36% — (continued) | | | |
Japan 0.63% — (continued) | | | |
| 32,108,000
USD | | | Mitsui & Company Limited
0.18% due 06/25/13 | | $ | 32,099,170
| | | $ | 32,099,170
| | |
| 20,067,000
USD | | | Mitsui & Company Limited
0.19% due 07/22/13 | | | 20,058,316
| | | | 20,055,664
| | |
Luxembourg 0.09% | | | |
| 35,905,000
USD | | | Michelin Luxembourg S.C.S.
0.25% due 05/23/13 | | | 35,899,515
| | | | 35,899,515
| | |
Switzerland 0.99% | | | |
| 71,233,000
USD | | | Nestlé SA
0.12% due 05/08/13 | | | 71,231,338
| | | | 71,231,338
| | |
| 68,801,000
USD | | | Nestlé SA
0.12% due 05/09/13 | | | 68,799,165
| | | | 68,799,165
| | |
| 20,773,000
USD | | | Nestlé SA
0.12% due 05/15/13 | | | 20,772,031
| | | | 20,772,031
| | |
| 34,393,000
USD | | | Nestlé SA
0.12% due 06/05/13 | | | 34,388,987
| | | | 34,388,987
| | |
| 74,396,000
USD | | | Nestlé SA
0.14% due 06/04/13 | | | 74,386,163
| | | | 74,386,163
| | |
| 16,622,000
USD | | | Nestlé SA
0.14% due 06/11/13 | | | 16,619,350
| | | | 16,619,350
| | |
| 20,555,000
USD | | | Nestlé SA
0.14% due 06/25/13 | | | 20,550,603
| | | | 20,550,603
| | |
| 9,380,000
USD | | | Nestlé SA
0.14% due 07/09/13 | | | 9,377,483
| | | | 9,378,116
| | |
| 30,403,000
USD | | | Nestlé SA
0.15% due 06/03/13 | | | 30,398,820
| | | | 30,398,820
| | |
| 17,737,000
USD | | | Roche Holdings, Inc.
0.12% due 06/20/13 | | | 17,734,044
| | | | 17,734,044
| | |
| 47,967,000
USD | | | Roche Holdings, Inc.
0.13% due 06/20/13 | | | 47,958,339
| | | | 47,958,339
| | |
United Arab Emirates 0.55% | | | |
| 68,728,000
USD | | | Xstrata Finance Dubai Limited
0.39% due 05/09/13 | | | 68,722,196
| | | | 68,722,196
| | |
| 33,655,000
USD | | | Xstrata Finance Dubai Limited
0.39% due 05/17/13 | | | 33,649,316
| | | | 33,649,316
| | |
| 33,655,000
USD | | | Xstrata Finance Dubai Limited
0.39% due 05/21/13 | | | 33,647,895
| | | | 33,647,895
| | |
| 32,453,000
USD | | | Xstrata Finance Dubai Limited
0.39% due 05/24/13 | | | 32,445,121
| | | | 32,445,121
| | |
| 62,576,000
USD | | | Xstrata Finance Dubai Limited
0.41% due 06/10/13 | | | 62,548,189
| | | | 62,548,189
| | |
See Notes to Financial Statements.
FIRST EAGLE FUNDS | SEMI-ANNUAL REPORT | APRIL 30, 2013
31
PRINCIPAL | | DESCRIPTION | | COST (NOTE 1) | | VALUE (NOTE 1) | |
International Commercial Paper — 6.36% — (continued) | | | |
United Kingdom 1.23% | | | |
| 20,619,000
USD | | | AstraZeneca PLC
0.09% due 05/09/13 | | $ | 20,618,588
| | | $ | 20,618,588
| | |
| 35,485,000
USD | | | AstraZeneca PLC
0.10% due 06/10/13 | | | 35,481,057
| | | | 35,481,057
| | |
| 34,895,000
USD | | | AstraZeneca PLC
0.10% due 06/14/13 | | | 34,890,735
| | | | 34,890,735
| | |
| 40,136,000
USD | | | AstraZeneca PLC
0.10% due 07/25/13 | | | 40,126,524
| | | | 40,115,194
| | |
| 27,901,000
USD | | | AstraZeneca PLC
0.11% due 05/01/13 | | | 27,901,000
| | | | 27,901,000
| | |
| 36,681,000
USD | | | AstraZeneca PLC
0.11% due 05/13/13 | | | 36,679,655
| | | | 36,679,655
| | |
| 51,601,000
USD | | | AstraZeneca PLC
0.11% due 05/20/13 | | | 51,598,004
| | | | 51,598,004
| | |
| 33,643,000
USD | | | AstraZeneca PLC
0.11% due 07/17/13 | | | 33,635,085
| | | | 33,627,548
| | |
| 69,145,000
USD | | | AstraZeneca PLC
0.12% due 05/03/13 | | | 69,144,539
| | | | 69,144,539
| | |
| 32,735,000
USD | | | AstraZeneca PLC
0.12% due 05/07/13 | | | 32,734,345
| | | | 32,734,345
| | |
| 25,528,000
USD | | | AstraZeneca PLC
0.12% due 07/23/13 | | | 25,520,937
| | | | 25,515,134
| | |
| 35,569,000
USD | | | Reckitt Benckiser
0.13% due 05/14/13 | | | 35,567,330
| | | | 35,567,330
| | |
| 68,826,000
USD | | | Reckitt Benckiser
0.14% due 05/13/13 | | | 68,822,788
| | | | 68,822,788
| | |
Total International Commercial Paper | | | 2,651,433,892 | | | | 2,651,404,639 | | |
U.S. Commercial Paper — 14.12% | | | |
$ | 83,590,000 | | | Abbott Laboratories
0.12% due 06/21/13 | | | 83,575,790
| | | | 83,575,790
| | |
| | 34,785,000 | | | Abbott Laboratories
0.13% due 05/08/13 | | | 34,784,121
| | | | 34,784,121
| | |
| | 21,974,000 | | | Abbott Laboratories
0.13% due 05/21/13 | | | 21,972,413
| | | | 21,972,413
| | |
| | 47,821,000 | | | Abbott Laboratories
0.13% due 05/28/13 | | | 47,816,338
| | | | 47,816,338
| | |
| | 19,069,000 | | | Abbott Laboratories
0.13% due 06/10/13 | | | 19,066,246
| | | | 19,066,246
| | |
| | 70,983,000 | | | Abbott Laboratories
0.13% due 07/16/13 | | | 70,963,519
| | | | 70,970,855
| | |
| | 40,226,000 | | | Abbott Laboratories
0.13% due 07/19/13 | | | 40,214,525
| | | | 40,218,848
| | |
See Notes to Financial Statements.
FIRST EAGLE FUNDS | SEMI-ANNUAL REPORT | APRIL 30, 2013
32
Schedule of Investments | Six-Month Period Ended April 30, 2013 (unaudited)
PRINCIPAL | | DESCRIPTION | | COST (NOTE 1) | | VALUE (NOTE 1) | |
U.S. Commercial Paper — 14.12% — (continued) | | | |
$ | 19,180,000 | | | Abbott Laboratories
0.14% due 06/10/13 | | $ | 19,177,016
| | | $ | 19,177,016
| | |
| | 39,919,000 | | | Air Products
0.12% due 05/13/13 | | | 39,917,403
| | | | 39,917,403
| | |
| | 13,409,000 | | | Avery Dennison Corporation
0.27% due 05/01/13 | | | 13,409,000
| | | | 13,409,000
| | |
| | 9,771,000 | | | Avery Dennison Corporation
0.28% due 05/01/13 | | | 9,771,000
| | | | 9,771,000
| | |
| | 18,599,000 | | | Baker Hughes, Inc.
0.13% due 05/07/13 | | | 18,598,597
| | | | 18,598,597
| | |
| | 68,728,000 | | | BHP Billiton Finance USA Limited
0.12% due 05/06/13 | | | 68,726,855
| | | | 68,726,855
| | |
| | 50,482,000 | | | BHP Billiton Finance USA Limited
0.12% due 05/07/13 | | | 50,480,990
| | | | 50,480,990
| | |
| | 33,655,000 | | | BHP Billiton Finance USA Limited
0.12% due 05/08/13 | | | 33,654,215
| | | | 33,654,215
| | |
| | 35,485,000 | | | BHP Billiton Finance USA Limited
0.13% due 06/11/13 | | | 35,479,746
| | | | 35,479,746
| | |
| | 35,485,000 | | | BHP Billiton Finance USA Limited
0.13% due 06/12/13 | | | 35,479,618
| | | | 35,479,618
| | |
| | 69,374,000 | | | BHP Billiton Finance USA Limited
0.13% due 06/13/13 | | | 69,363,228
| | | | 69,363,228
| | |
| | 69,975,000 | | | BHP Billiton Finance USA Limited
0.13% due 06/18/13 | | | 69,962,871
| | | | 69,962,871
| | |
| | 25,693,000 | | | BHP Billiton Finance USA Limited
0.14% due 05/17/13 | | | 25,691,401
| | | | 25,691,401
| | |
| | 51,589,000 | | | BHP Billiton Finance USA Limited
0.14% due 05/21/13 | | | 51,584,988
| | | | 51,584,988
| | |
| | 72,108,000 | | | Caterpillar Financial
Services Company
0.14% due 07/10/13 | | | 72,088,371
| | | | 72,086,670
| | |
| | 34,994,000 | | | Caterpillar Financial
Services Company
0.15% due 06/20/13 | | | 34,986,710
| | | | 34,986,710
| | |
| | 39,497,000 | | | CBS Corporation
0.30% due 05/20/13 | | | 39,490,746
| | | | 39,490,746
| | |
| | 35,465,000 | | | CBS Corporation
0.30% due 05/29/13 | | | 35,456,725
| | | | 35,456,725
| | |
| | 31,911,000 | | | Celgene Corporation
0.26% due 05/17/13 | | | 31,907,313
| | | | 31,907,313
| | |
| | 57,349,000 | | | Celgene Corporation
0.27% due 06/07/13 | | | 57,333,086
| | | | 57,333,086
| | |
| | 24,223,000 | | | Chevron Corporation
0.07% due 06/06/13 | | | 24,221,304
| | | | 24,221,304
| | |
See Notes to Financial Statements.
FIRST EAGLE FUNDS | SEMI-ANNUAL REPORT | APRIL 30, 2013
33
PRINCIPAL | | DESCRIPTION | | COST (NOTE 1) | | VALUE (NOTE 1) | |
U.S. Commercial Paper — 14.12% — (continued) | | | |
$ | 15,955,000 | | | Chevron Corporation
0.08% due 05/22/13 | | $ | 15,954,255
| | | $ | 15,954,255
| | |
| | 85,403,000 | | | Chevron Corporation
0.10% due 05/15/13 | | | 85,399,679
| | | | 85,399,679
| | |
| | 66,187,000 | | | Chevron Corporation
0.11% due 05/03/13 | | | 66,186,596
| | | | 66,186,596
| | |
| | 56,579,000 | | | Chevron Corporation
0.12% due 05/07/13 | | | 56,577,868
| | | | 56,577,868
| | |
| | 30,403,000 | | | Church & Dwight Company, Inc.
0.33% due 05/02/13 | | | 30,402,721
| | | | 30,402,721
| | |
| | 49,706,000 | | | Coca-Cola Company
0.11% due 05/09/13 | | | 49,704,785
| | | | 49,704,785
| | |
| | 28,524,000 | | | Coca-Cola Company
0.11% due 05/17/13 | | | 28,522,605
| | | | 28,522,605
| | |
| | 36,098,000 | | | Coca-Cola Company
0.11% due 05/23/13 | | | 36,095,573
| | | | 36,095,573
| | |
| | 36,159,000 | | | Coca-Cola Company
0.12% due 07/17/13 | | | 36,149,719
| | | | 36,152,734
| | |
| | 47,866,000 | | | Coca-Cola Company
0.12% due 07/19/13 | | | 47,853,395
| | | | 47,857,489
| | |
| | 11,238,000 | | | Coca-Cola Company
0.13% due 05/17/13 | | | 11,237,351
| | | | 11,237,351
| | |
| | 71,103,000 | | | Coca-Cola Company
0.13% due 06/12/13 | | | 71,092,216
| | | | 71,092,216
| | |
| | 35,128,000 | | | Coca-Cola Company
0.13% due 06/13/13 | | | 35,122,545
| | | | 35,122,545
| | |
| | 35,975,000 | | | Coca-Cola Company
0.14% due 06/19/13 | | | 35,968,145
| | | | 35,968,145
| | |
| | 35,975,000 | | | Coca-Cola Company
0.14% due 06/20/13 | | | 35,968,005
| | | | 35,968,005
| | |
| | 16,845,000 | | | Coca-Cola Company
0.20% due 05/01/13 | | | 16,845,000
| | | | 16,845,000
| | |
| | 69,801,000 | | | Colgate-Palmolive Company
0.07% due 05/01/13 | | | 69,801,000
| | | | 69,801,000
| | |
| | 9,434,000 | | | Con Edison, Inc.
0.23% due 05/01/13 | | | 9,434,000
| | | | 9,434,000
| | |
| | 20,938,000 | | | ConocoPhillips
0.14% due 06/11/13 | | | 20,934,662
| | | | 20,934,662
| | |
| | 11,750,000 | | | Deere & Company
0.10% due 05/23/13 | | | 11,749,282
| | | | 11,749,282
| | |
| | 32,874,000 | | | Deere & Company
0.11% due 05/02/13 | | | 32,873,900
| | | | 32,873,900
| | |
| | 22,085,000 | | | Deere & Company
0.11% due 05/23/13 | | | 22,083,515
| | | | 22,083,515
| | |
See Notes to Financial Statements.
FIRST EAGLE FUNDS | SEMI-ANNUAL REPORT | APRIL 30, 2013
34
Schedule of Investments | Six-Month Period Ended April 30, 2013 (unaudited)
PRINCIPAL | | DESCRIPTION | | COST (NOTE 1) | | VALUE (NOTE 1) | |
U.S. Commercial Paper — 14.12% — (continued) | | | |
$ | 41,177,000 | | | Deere & Company
0.12% due 05/03/13 | | $ | 41,176,725
| | | $ | 41,176,725
| | |
| | 17,849,000 | | | Deere & Company
0.12% due 05/08/13 | | | 17,848,584
| | | | 17,848,584
| | |
| | 34,364,000 | | | Devon Energy Corporation
0.23% due 05/10/13 | | | 34,362,024
| | | | 34,362,024
| | |
| | 34,687,000 | | | Devon Energy Corporation
0.23% due 05/21/13 | | | 34,682,568
| | | | 34,682,568
| | |
| | 40,421,000 | | | Devon Energy Corporation
0.27% due 05/01/13 | | | 40,421,000
| | | | 40,421,000
| | |
| | 35,128,000 | | | Devon Energy Corporation
0.28% due 05/17/13 | | | 35,123,629
| | | | 35,123,629
| | |
| | 33,655,000 | | | Devon Energy Corporation
0.28% due 06/05/13 | | | 33,645,838
| | | | 33,645,838
| | |
| | 35,584,000 | | | Devon Energy Corporation
0.29% due 06/12/13 | | | 35,571,961
| | | | 35,571,961
| | |
| | 31,911,000 | | | Devon Energy Corporation
0.31% due 07/10/13 | | | 31,891,765
| | | | 31,887,734
| | |
| | 63,873,000 | | | Dominion Resources
0.30% due 05/22/13 | | | 63,861,822
| | | | 63,861,822
| | |
| | 31,763,000 | | | Dominion Resources
0.30% due 06/19/13 | | | 31,750,030
| | | | 31,750,030
| | |
| | 35,907,000 | | | Duke Energy Corporation
0.33% due 06/03/13 | | | 35,896,138
| | | | 35,896,138
| | |
| | 37,199,000 | | | Emerson Electric Company
0.11% due 05/23/13 | | | 37,196,499
| | | | 37,196,499
| | |
| | 32,569,000 | | | Emerson Electric Company
0.11% due 05/28/13 | | | 32,566,313
| | | | 32,566,313
| | |
| | 20,680,000 | | | Emerson Electric Company
0.11% due 06/13/13 | | | 20,677,283
| | | | 20,677,283
| | |
| | 46,677,000 | | | Google, Inc.
0.06% due 06/25/13 | | | 46,672,721
| | | | 46,672,721
| | |
| | 48,854,000 | | | Google, Inc.
0.10% due 07/16/13 | | | 48,843,687
| | | | 48,840,414
| | |
| | 32,378,000 | | | Google, Inc.
0.11% due 05/30/13 | | | 32,375,131
| | | | 32,375,131
| | |
| | 37,036,000 | | | Google, Inc.
0.12% due 06/04/13 | | | 37,031,803
| | | | 37,031,803
| | |
| | 9,617,000 | | | Google, Inc.
0.15% due 05/02/13 | | | 9,616,960
| | | | 9,616,960
| | |
| | 32,652,000 | | | Google, Inc.
0.18% due 05/02/13 | | | 32,651,837
| | | | 32,651,837
| | |
| | 38,139,000 | | | Honeywell International, Inc.
0.12% due 05/13/13 | | | 38,137,474
| | | | 38,137,474
| | |
See Notes to Financial Statements.
FIRST EAGLE FUNDS | SEMI-ANNUAL REPORT | APRIL 30, 2013
35
PRINCIPAL | | DESCRIPTION | | COST (NOTE 1) | | VALUE (NOTE 1) | |
U.S. Commercial Paper — 14.12% — (continued) | | | |
$ | 37,199,000 | | | Honeywell International, Inc.
0.12% due 05/14/13 | | $ | 37,197,388
| | | $ | 37,197,388
| | |
| | 54,282,000 | | | Honeywell International, Inc.
0.13% due 06/21/13 | | | 54,272,003
| | | | 54,272,003
| | |
| | 57,825,000 | | | Honeywell International, Inc.
0.15% due 06/24/13 | | | 57,811,989
| | | | 57,811,989
| | |
| | 66,923,000 | | | Johnson & Johnson
0.05% due 05/22/13 | | | 66,921,048
| | | | 66,921,048
| | |
| | 47,948,000 | | | Johnson & Johnson
0.06% due 05/06/13 | | | 47,947,600
| | | | 47,947,600
| | |
| | 63,930,000 | | | Johnson & Johnson
0.06% due 05/07/13 | | | 63,929,361
| | | | 63,929,361
| | |
| | 67,745,000 | | | Johnson & Johnson
0.06% due 05/08/13 | | | 67,744,210
| | | | 67,744,210
| | |
| | 57,208,000 | | | Johnson & Johnson
0.08% due 06/06/13 | | | 57,203,423
| | | | 57,203,423
| | |
| | 57,208,000 | | | Johnson & Johnson
0.08% due 06/07/13 | | | 57,203,296
| | | | 57,203,296
| | |
| | 30,580,000 | | | Kimberly Clark
0.10% due 05/06/13 | | | 30,579,575
| | | | 30,579,575
| | |
| | 19,527,000 | | | Kimberly Clark
0.10% due 05/13/13 | | | 19,526,349
| | | | 19,526,349
| | |
| | 36,188,000 | | | Kimberly Clark
0.11% due 06/03/13 | | | 36,184,351
| | | | 36,184,351
| | |
| | 40,775,000 | | | Merck & Company, Inc.
0.08% due 05/14/13 | | | 40,773,822
| | | | 40,773,822
| | |
| | 40,775,000 | | | Merck & Company, Inc.
0.08% due 05/17/13 | | | 40,773,550
| | | | 40,773,550
| | |
| | 52,481,000 | | | Merck & Company, Inc.
0.11% due 06/17/13 | | | 52,473,463
| | | | 52,473,463
| | |
| | 52,481,000 | | | Merck & Company, Inc.
0.11% due 06/19/13 | | | 52,473,142
| | | | 52,473,142
| | |
| | 61,007,000 | | | Merck & Company, Inc.
0.12% due 05/14/13 | | | 61,004,356
| | | | 61,004,356
| | |
| | 71,233,000 | | | Merck & Company, Inc.
0.12% due 05/16/13 | | | 71,229,438
| | | | 71,229,438
| | |
| | 33,536,000 | | | MetLife
0.13% due 06/03/13 | | | 33,532,004
| | | | 33,532,004
| | |
| | 39,497,000 | | | MetLife
0.14% due 06/06/13 | | | 39,491,470
| | | | 39,491,470
| | |
| | 36,631,000 | | | MetLife
0.14% due 06/12/13 | | | 36,625,017
| | | | 36,625,017
| | |
| | 87,594,000 | | | MetLife
0.15% due 05/15/13 | | | 87,588,890
| | | | 87,588,890
| | |
See Notes to Financial Statements.
FIRST EAGLE FUNDS | SEMI-ANNUAL REPORT | APRIL 30, 2013
36
Schedule of Investments | Six-Month Period Ended April 30, 2013 (unaudited)
PRINCIPAL | | DESCRIPTION | | COST (NOTE 1) | | VALUE (NOTE 1) | |
U.S. Commercial Paper — 14.12% — (continued) | | | |
$ | 65,405,000 | | | MetLife
0.15% due 05/16/13 | | $ | 65,400,912
| | | $ | 65,400,912
| | |
| | 19,836,000 | | | NetJets, Inc.
0.08% due 05/02/13 | | | 19,835,956
| | | | 19,835,956
| | |
| | 34,558,000 | | | Parker-Hannifin Corporation
0.10% due 05/24/13 | | | 34,555,792
| | | | 34,555,792
| | |
| | 34,393,000 | | | Parker-Hannifin Corporation
0.12% due 05/16/13 | | | 34,391,280
| | | | 34,391,280
| | |
| | 38,105,000 | | | Parker-Hannifin Corporation
0.12% due 05/21/13 | | | 38,102,460
| | | | 38,102,460
| | |
| | 27,598,000 | | | Parker-Hannifin Corporation
0.13% due 05/01/13 | | | 27,598,000
| | | | 27,598,000
| | |
| | 31,911,000 | | | PepsiCo, Inc.
0.05% due 05/14/13 | | | 31,910,424
| | | | 31,910,424
| | |
| | 51,838,000 | | | PepsiCo, Inc.
0.05% due 06/12/13 | | | 51,834,976
| | | | 51,834,976
| | |
| | 51,838,000 | | | PepsiCo, Inc.
0.05% due 06/14/13 | | | 51,834,832
| | | | 51,834,832
| | |
| | 15,105,000 | | | PepsiCo, Inc.
0.05% due 06/19/13 | | | 15,103,972
| | | | 15,103,972
| | |
| | 36,159,000 | | | PepsiCo, Inc.
0.06% due 05/16/13 | | | 36,158,096
| | | | 36,158,096
| | |
| | 38,105,000 | | | PepsiCo, Inc.
0.06% due 06/07/13 | | | 38,102,650
| | | | 38,102,650
| | |
| | 38,105,000 | | | Philip Morris International, Inc.
0.07% due 05/23/13 | | | 38,103,370
| | | | 38,103,370
| | |
| | 32,116,000 | | | Philip Morris International, Inc.
0.07% due 06/06/13 | | | 32,113,752
| | | | 32,113,752
| | |
| | 35,584,000 | | | Philip Morris International, Inc.
0.08% due 06/13/13 | | | 35,580,600
| | | | 35,580,600
| | |
| | 57,314,000 | | | Philip Morris International, Inc.
0.08% due 06/14/13 | | | 57,308,396
| | | | 57,308,396
| | |
| | 27,935,000 | | | Philip Morris International, Inc.
0.09% due 06/17/13 | | | 27,931,718
| | | | 27,931,718
| | |
| | 80,272,000 | | | Philip Morris International, Inc.
0.09% due 07/22/13 | | | 80,255,544
| | | | 80,226,654
| | |
| | 40,136,000 | | | Philip Morris International, Inc.
0.09% due 07/25/13 | | | 40,127,471
| | | | 40,112,316
| | |
| | 35,975,000 | | | Philip Morris International, Inc.
0.12% due 06/05/13 | | | 35,970,803
| | | | 35,970,803
| | |
| | 37,199,000 | | | Philip Morris International, Inc.
0.15% due 05/13/13 | | | 37,197,140
| | | | 37,197,140
| | |
| | 26,055,000 | | | Precision Castparts Corporation
0.15% due 05/01/13 | | | 26,055,000
| | | | 26,055,000
| | |
See Notes to Financial Statements.
FIRST EAGLE FUNDS | SEMI-ANNUAL REPORT | APRIL 30, 2013
37
PRINCIPAL | | DESCRIPTION | | COST (NOTE 1) | | VALUE (NOTE 1) | |
U.S. Commercial Paper — 14.12% — (continued) | | | |
$ | 34,785,000 | | | Proctor & Gamble Company
0.10% due 05/02/13 | | $ | 34,784,903
| | | $ | 34,784,903
| | |
| | 58,411,000 | | | Proctor & Gamble Company
0.11% due 05/06/13 | | | 58,410,108
| | | | 58,410,108
| | |
| | 77,300,000 | | | Proctor & Gamble Company
0.13% due 05/20/13 | | | 77,294,696
| | | | 77,294,696
| | |
| | 52,938,000 | | | Schlumberger Investments SA
0.17% due 07/24/13 | | | 52,917,001
| | | | 52,907,127
| | |
| | 35,292,000 | | | Syngenta Wilmington, Inc.
0.16% due 07/22/13 | | | 35,279,138
| | | | 35,272,064
| | |
| | 31,911,000 | | | United Healthcare Company
0.30% due 06/17/13 | | | 31,898,502
| | | | 31,898,502
| | |
| | 64,659,000 | | | United Healthcare Company
0.31% due 06/05/13 | | | 64,639,512
| | | | 64,639,512
| | |
| | 69,374,000 | | | United Parcel Service, Inc.
0.07% due 06/14/13 | | | 69,368,065
| | | | 69,368,065
| | |
| | 9,280,000 | | | Verizon Communications, Inc.
0.24% due 05/06/13 | | | 9,279,691
| | | | 9,279,691
| | |
| | 28,927,000 | | | Verizon Communications, Inc.
0.26% due 05/16/13 | | | 28,923,866
| | | | 28,923,866
| | |
| | 17,206,000 | | | Verizon Communications, Inc.
0.27% due 05/06/13 | | | 17,205,355
| | | | 17,205,355
| | |
| | 47,396,000 | | | Viacom, Inc.
0.27% due 05/03/13 | | | 47,395,289
| | | | 47,395,289
| | |
| | 13,727,000 | | | Wal-Mart Stores, Inc.
0.08% due 05/20/13 | | | 13,726,420
| | | | 13,726,420
| | |
| | 17,213,000 | | | Wal-Mart Stores, Inc.
0.08% due 05/21/13 | | | 17,212,235
| | | | 17,212,235
| | |
| | 34,895,000 | | | Wal-Mart Stores, Inc.
0.10% due 06/11/13 | | | 34,891,026
| | | | 34,891,026
| | |
| | 91,210,000 | | | Wal-Mart Stores, Inc.
0.13% due 06/10/13 | | | 91,196,825
| | | | 91,196,825
| | |
| | 99,280,000 | | | Wal-Mart Stores, Inc.
0.13% due 06/11/13 | | | 99,265,301
| | | | 99,265,301
| | |
| | 38,105,000 | | | Walt Disney Company
0.08% due 05/24/13 | | | 38,103,052
| | | | 38,103,052
| | |
| | 35,084,000 | | | Walt Disney Company
0.10% due 06/03/13 | | | 35,080,784
| | | | 35,080,784
| | |
| | 35,084,000 | | | Walt Disney Company
0.11% due 06/18/13 | | | 35,078,854
| | | | 35,078,854
| | |
| | 35,084,000 | | | Walt Disney Company
0.12% due 06/19/13 | | | 35,078,270
| | | | 35,078,270
| | |
| | 37,891,000 | | | Walt Disney Company
0.12% due 06/20/13 | | | 37,884,685
| | | | 37,884,685
| | |
See Notes to Financial Statements.
FIRST EAGLE FUNDS | SEMI-ANNUAL REPORT | APRIL 30, 2013
38
Schedule of Investments | Six-Month Period Ended April 30, 2013 (unaudited)
PRINCIPAL | | DESCRIPTION | | COST (NOTE 1) | | VALUE (NOTE 1) | |
U.S. Commercial Paper — 14.12% — (continued) | | | |
$ | 34,988,000 | | | Walt Disney Company
0.12% due 07/11/13 | | $ | 34,979,720
| | | $ | 34,977,504
| | |
| | 36,640,000 | | | WellPoint, Inc.
0.22% due 05/10/13 | | | 36,637,985
| | | | 36,637,985
| | |
| | 39,142,000 | | | WellPoint, Inc.
0.22% due 06/06/13 | | | 39,133,389
| | | | 39,133,389
| | |
| | 33,093,000 | | | WellPoint, Inc.
0.23% due 06/03/13 | | | 33,086,023
| | | | 33,086,023
| | |
| | 35,504,000 | | | WellPoint, Inc.
0.24% due 05/13/13 | | | 35,501,160
| | | | 35,501,160
| | |
| | 16,058,000 | | | WellPoint, Inc.
0.26% due 06/14/13 | | | 16,052,897
| | | | 16,052,897
| | |
Total U.S. Commercial Paper | | | 5,881,396,385 | | | | 5,881,342,939 | | |
Total Commercial Paper | | | 8,532,830,277 | | | | 8,532,747,578 | | |
Total Investments — 99.63% | | $ | 33,668,527,836 | | | | 41,521,202,434 | | |
Other Assets in Excess of Liabilities — 0.37% | | | | | 154,148,935 | | |
Net Assets — 100.00% | | | | $ | 41,675,351,369 | | |
(a) An affiliate of the Fund as defined by the Investment Company Act of 1940. An affiliate is defined as a company in which the Fund directly or indirectly owns, controls, or holds power to vote 5% or more of the outstanding voting securities.
(b) Security is deemed illiquid. At April 30, 2013, the value of these securities amounted to $86,463,326 or 0.21% of net assets.
(c) Non-income producing security/commodity.
(d) Represents variable voting shares.
(e) Represents securities that are subject to legal or contractual restrictions on resale. At April 30, 2013, the value of these securities amounted to $52,910,968 or 0.13% of net assets.
(f) Securities valued in accordance with fair value procedures under the supervision of the Board of Trustees, representing $42,856,980 or 0.10% of net assets.
(g) Represents non-voting class of shares.
(h) Held through Financiere Rouge, LLC, a wholly owned subsidiary and disregarded entity for U.S. tax purposes.
(i) Payment-in-kind security.
(j) Floating rate security. Rate shown is the rate in effect at April 30, 2013.
(k) Inflation protected security.
At April 30, 2013, cost is substantially identical for both book and federal income tax purposes. Net unrealized appreciation consisted of:
Gross unrealized appreciation | | $ | 9,353,308,870 | | |
Gross unrealized depreciation | | | (1,500,634,272 | ) | |
Net unrealized appreciation | | $ | 7,852,674,598 | | |
See Notes to Financial Statements.
FIRST EAGLE FUNDS | SEMI-ANNUAL REPORT | APRIL 30, 2013
39
Abbreviations used in this schedule include:
ADR — American Depository Receipt
FRN — Floating Rate Note
NVDR — Non-Voting Depository Receipt
PC — Participation Certificate
PCL — Public Company Limited
PLC — Public Limited Company
REIT — Real Estate Investment Trust
RSP — Represents Non-Voting Shares
Currencies
EUR — Euro
KRW — South Korean Won
USD — United States Dollar
RESTRICTED SECURITIES | | ACQUISITION
DATE | | COST | | CARRYING VALUE PER
SHARE/PRINCIPAL | |
Catalyst Paper Corporation | | 09/17/12 | | $ | 17,346 | | | $ | 2.00 | | |
Catalyst Paper Corporation 11.00% due 10/30/17 | | 09/17/12 | | | 21,613,126 | | | | 0.78 | | |
Emin Leydier SA FRN 7.32% due 07/31/16 | | 07/30/09 | | | 21,437,036 | | | | 1.32 | | |
FINEL 9.50% due 06/30/17 | | 06/22/05 | | | 14,495,954 | | | | 0.99 | | |
FINEL | | 07/30/09 | | | — | | | | 0.47 | | |
Foreign Currency Exchange Contracts — Sales
SETTLEMENT
DATES
THROUGH | | FOREIGN CURRENCY
TO BE DELIVERED | | U.S. $
TO BE
RECEIVED | | U.S. $ VALUE
AT APRIL 30,
2013 | | UNREALIZED
APPRECIATION
AT APRIL 30,
2013 | | UNREALIZED
DEPRECIATION
AT APRIL 30,
2013 | |
06/19/13 | | | 129,831,000 | | | Euro | | $ | 168,852,602 | | | $ | 171,033,446 | | | $ | — | | | $ | (2,180,844 | ) | |
07/17/13 | | | 180,410,000 | | | Euro | | | 235,833,756 | | | | 237,710,375 | | | | — | | | | (1,876,619 | ) | |
08/21/13 | | | 356,024,000 | | | Euro | | | 469,556,997 | | | | 469,123,058 | | | | 433,939 | | | | — | | |
09/18/13 | | | 146,801,000 | | | Euro | | | 191,964,328 | | | | 193,521,784 | | | | — | | | | (1,557,456 | ) | |
10/16/13 | | | 101,538,000 | | | Euro | | | 133,402,147 | | | | 133,883,724 | | | | — | | | | (481,577 | ) | |
06/19/13 | | | 41,843,556,000 | | | Japanese Yen | | | 503,820,172 | | | | 429,334,399 | | | | 74,485,773 | | | | — | | |
07/17/13 | | | 48,313,402,000 | | | Japanese Yen | | | 550,959,944 | | | | 495,803,084 | | | | 55,156,860 | | | | — | | |
08/21/13 | | | 92,902,207,000 | | | Japanese Yen | | | 1,055,973,974 | | | | 953,405,487 | | | | 102,568,487 | | | | — | | |
09/18/13 | | | 47,348,905,000 | | | Japanese Yen | | | 494,479,714 | | | | 486,129,281 | | | | 8,350,433 | | | | — | | |
10/16/13 | | | 16,596,569,000 | | | Japanese Yen | | | 167,056,569 | | | | 170,432,658 | | | | — | | | | (3,376,089 | ) | |
| | | | | | | $ | 3,971,900,203 | | | $ | 3,740,377,296 | | | $ | 240,995,492 | | | $ | (9,472,585 | ) | |
Foreign Currency Exchange Contracts — Purchases
SETTLEMENT
DATES
THROUGH | | FOREIGN CURRENCY
TO BE RECEIVED | | U.S. $
TO BE
DELIVERED | | U.S. $ VALUE
AT APRIL 30,
2013 | | UNREALIZED
APPRECIATION
AT APRIL 30,
2013 | | UNREALIZED
DEPRECIATION
AT APRIL 30,
2013 | |
07/17/13 | | | 26,795,455,000 | | | Japanese Yen | | $ | 294,875,180 | | | $ | 274,981,034 | | | $ | — | | | $ | (19,894,146 | ) | |
See Notes to Financial Statements.
FIRST EAGLE FUNDS | SEMI-ANNUAL REPORT | APRIL 30, 2013
40
Schedule of Investments | Six-Month Period Ended April 30, 2013 (unaudited)
Affiliated Securities
AFFILIATED
SECURITIES | | SHARES
OCTOBER 31,
2012 | | GROSS
ADDITIONS | | GROSS
REDUCTIONS | | SHARES
APRIL 30,
2013 | | MARKET VALUE
APRIL 30,
2013 | | REALIZED
GAIN/(LOSS) | | DIVIDEND
INCOME | |
Alliant
Techsystems,
Inc. | | | 3,638,247 | | | | — | | | | — | | | | 3,638,247 | | | $ | 270,540,047 | | | $ | — | | | $ | 1,891,888 | | |
Berkeley
Group
Holdings PLC | | | 9,342,277 | | | | — | | | | 1,592,379 | | | | 7,749,898 | | | | 250,990,420 | | | | 25,356,162 | | | | 1,758,548 | | |
Catalyst
Paper
Corporation | | | 1,008,427 | | | | — | | | | — | | | | 1,008,427 | | | | 2,016,854 | | | | — | | | | — | | |
Chofu
Seisakusho
Company
Limited | | | 3,526,280 | | | | — | | | | — | | | | 3,526,280 | | | | 81,574,478 | | | | — | | | | 573,291 | | |
Cincinnati
Financial
Corporation* | | | 8,511,151 | | | | — | | | | 1,581,136 | | | | 6,930,015 | | | | 338,947,034 | | | | 26,677,004 | | | | 6,119,180 | | |
Cintas
Corporation | | | 13,051,511 | | | | — | | | | — | | | | 13,051,511 | | | | 585,621,298 | | | | — | | | | 8,352,967 | | |
City
e-Solutions
Limited | | | 20,738,780 | | | | — | | | | — | | | | 20,738,780 | | | | 2,004,276 | | | | — | | | | — | | |
Deltic
Timber
Corporation | | | 1,249,382 | | | | — | | | | 437,902 | | | | 811,480 | | | | 50,701,270 | | | | 7,983,912 | | | | 173,854 | | |
FINEL | | | 12,000,000 | | | | — | | | | — | | | | 12,000,000 | | | | 5,683,605 | | | | — | | | | — | | |
Hirose
Electric
Company
Limited | | | 2,318,500 | | | | — | | | | 11,400 | | | | 2,307,100 | | | | 331,055,194 | | | | 215,532 | | | | 1,596,680 | | |
IDACorp,
Inc. | | | 3,760,485 | | | | — | | | | — | | | | 3,760,485 | | | | 185,053,467 | | | | — | | | | 2,857,969 | | |
Mills Music
Trust | | | 33,892 | | | | — | | | | — | | | | 33,892 | | | | 1,106,235 | | | | — | | | | 16,959 | | |
MISUMI
Group, Inc. | | | 12,811,860 | | | | — | | | | 4,004,300 | | | | 8,807,560 | | | | 268,203,359 | | | | 32,778,569 | | | | 945,402 | | |
Namyang
Dairy
Products
Company
Limited | | | 39,989 | | | | — | | | | — | | | | 39,989 | | | | 42,301,993 | | | | — | | | | 29,092 | | |
Neopost SA | | | 2,044,437 | | | | — | | | | — | | | | 2,044,437 | | | | 134,340,164 | | | | — | | | | 4,157,563 | | |
NSC Groupe | | | 69,500 | | | | — | | | | — | | | | 69,500 | | | | 5,577,695 | | | | — | | | | — | | |
Robertet SA | | | 157,260 | | | | — | | | | — | | | | 157,260 | | | | 29,377,589 | | | | — | | | | — | | |
Sabeton SA | | | 385,000 | | | | — | | | | — | | | | 385,000 | | | | 6,524,042 | | | | — | | | | — | | |
San Juan
Basin
Royalty
Trust | | | 3,908,035 | | | | — | | | | — | | | | 3,908,035 | | | | 60,379,141 | | | | — | | | | 395,153 | | |
Scotts
Miracle-Gro
Company | | | 4,172,577 | | | | — | | | | — | | | | 4,172,577 | | | | 189,226,367 | | | | — | | | | 2,712,175 | | |
See Notes to Financial Statements.
FIRST EAGLE FUNDS | SEMI-ANNUAL REPORT | APRIL 30, 2013
41
Affiliated Securities — (continued)
AFFILIATED
SECURITIES | | SHARES
OCTOBER 31,
2012 | | GROSS
ADDITIONS | | GROSS
REDUCTIONS | | SHARES
APRIL 30,
2013 | | MARKET VALUE
APRIL 30,
2013 | | REALIZED
GAIN/(LOSS) | | DIVIDEND
INCOME | |
Shimano, Inc. | | | 6,969,690 | | | | — | | | | 1,944,400 | | | | 5,025,290 | | | $ | 436,265,119 | | | $ | 71,530,050 | | | $ | 2,814,037 | | |
Société
Télévision
Francaise 1 | | | 11,803,362 | | | | — | | | | — | | | | 11,803,362 | | | | 124,745,135 | | | | — | | | | 7,183,427 | | |
T. Hasegawa
Company
Limited | | | 5,147,000 | | | | — | | | | — | | | | 5,147,000 | | | | 75,808,323 | | | | — | | | | 506,487 | | |
Total | | | | | | | | | | $ | 3,478,043,105 | | | $ | 164,541,229 | | | $ | 42,084,672 | | |
* Represents an unaffiliated issuer as of April 30, 2013, as such, amounts represented above will not agree to balances in the Statements of Assets and Liabilities and Statements of Operations.
INDUSTRY DIVERSIFICATION FOR PORTFOLIO HOLDINGS | | PERCENT OF
NET ASSETS | |
U.S. Common Stocks | |
Consumer Discretionary | | | 2.81 | % | |
Consumer Staples | | | 3.07 | | |
Energy | | | 2.14 | | |
Financials | | | 8.52 | | |
Health Care | | | 1.00 | | |
Industrials | | | 4.63 | | |
Information Technology | | | 7.59 | | |
Materials | | | 1.63 | | |
Utilities | | | 1.96 | | |
Total U.S. Common Stocks | | | 33.35 | | |
International Common Stocks | |
Consumer Discretionary | | | 4.80 | | |
Consumer Staples | | | 3.81 | | |
Energy | | | 3.06 | | |
Financials | | | 6.05 | | |
Health Care | | | 3.28 | | |
Industrials | | | 6.28 | | |
Information Technology | | | 3.70 | | |
Materials | | | 8.28 | | |
Telecommunication Services | | | 1.41 | | |
Utilities | | | 0.42 | | |
Total International Common Stocks | | | 41.09 | | |
See Notes to Financial Statements.
FIRST EAGLE FUNDS | SEMI-ANNUAL REPORT | APRIL 30, 2013
42
Schedule of Investments | Six-Month Period Ended April 30, 2013 (unaudited)
INDUSTRY DIVERSIFICATION FOR PORTFOLIO HOLDINGS — (CONTINUED) | | PERCENT OF
NET ASSETS | |
International Preferred Stock | |
Consumer Discretionary | | | 0.28 | % | |
Total International Preferred Stock | | | 0.28 | | |
Warrant | | | 0.19 | | |
Commodity | | | 3.89 | | |
U.S. Corporate Bonds | |
Consumer Discretionary | | | 0.07 | | |
Total U.S. Corporate Bonds | | | 0.07 | | |
International Notes and Bonds | |
Financials | | | 0.14 | | |
Government Issues | | | 0.06 | | |
Materials | | | 0.08 | | |
Total International Notes and Bonds | | | 0.28 | | |
Commercial Paper | |
International Commercial Paper | | | 6.36 | | |
U.S. Commercial Paper | | | 14.12 | | |
Total Commercial Paper | | | 20.48 | | |
Total Investments | | | 99.63 | % | |
See Notes to Financial Statements.
FIRST EAGLE FUNDS | SEMI-ANNUAL REPORT | APRIL 30, 2013
43

Fund Overview | Data as of April 30, 2013 (unaudited)
INVESTMENT OBJECTIVE
First Eagle Overseas Fund seeks long-term growth of capital by investing primarily in equities issued by non-U.S. corporations. Management's research-driven process seeks to minimize risk by focusing on undervalued securities.
Average Annual Returns | |
| | | ONE-YEAR | | FIVE-YEARS | | TEN-YEARS | |
First Eagle Overseas
Fund (A Shares) | |
without sales load | | | 13.28 | % | | | 5.13 | % | | | 12.69 | % | |
with sales load | | | 7.60 | | | | 4.06 | | | | 12.11 | | |
MSCI EAFE Index | | | 19.39 | | | | -0.93 | | | | 9.23 | | |
Consumer Price Index | | | 1.06 | | | | 1.60 | | | | 2.38 | | |
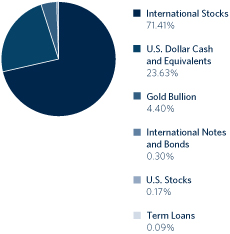
Countries** | |
Japan | | | 25.56 | % | |
France | | | 8.87 | | |
Canada | | | 5.72 | | |
United States | | | 4.57 | | |
Germany | | | 4.49 | | |
Switzerland | | | 3.37 | | |
Mexico | | | 2.99 | | |
United Kingdom | | | 2.78 | | |
South Korea | | | 2.57 | | |
Singapore | | | 2.27 | | |
Thailand | | | 1.73 | | |
Austria | | | 1.28 | | |
Hong Kong | | | 1.10 | | |
Sweden | | | 1.00 | | |
Australia | | | 0.98 | | |
Netherlands | | | 0.82 | | |
Ireland | | | 0.77 | | |
Greece | | | 0.69 | | |
Spain | | | 0.68 | | |
South Africa | | | 0.67 | | |
Bermuda | | | 0.59 | | |
Norway | | | 0.56 | | |
Malaysia | | | 0.52 | | |
Italy | | | 0.42 | | |
Belgium | | | 0.38 | | |
Taiwan | | | 0.37 | | |
Israel | | | 0.33 | | |
Turkey | | | 0.29 | | |
* Asset Allocation and Countries percentages are based on total investments in the portfolio.
** Country allocations reflect country of the issuer (not currency of issue) and exclude short term investments. Bonds of non-U.S. issuers may be U.S. dollar denominated.
The Fund's portfolio composition is subject to change at any time.
FIRST EAGLE FUNDS | SEMI-ANNUAL REPORT | APRIL 30, 2013
44
Growth of a $10,000 Initial Investment
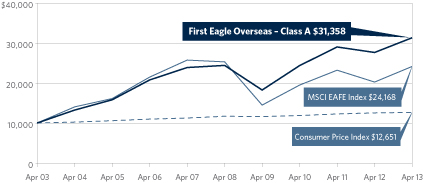
Performance data quoted herein represents past performance and should not be considered indicative of future results. Performance data quoted herein does not reflect the deduction of taxes that a shareholder would pay on Fund distributions or the sale of Fund shares. The average annual returns shown above are historical and reflect changes in share price, reinvested dividends and are net of expenses.
The average annual returns for Class A Shares give effect to the deduction of the maximum sales charge of 5.00%.
The MSCI EAFE Index is a total return index, reported in U.S. Dollars, based on share prices and reinvested net dividends of approximately 1,100 companies from 22 countries and is not available for purchase. The Consumer Price Index (CPI) represents the change in price of all goods and services purchased for consumption by urban households.
Top 10 Holdings* | |
| Gold Bullion (precious metal) | | | 4.37 | % | |
| SMC Corporation (Japanese automated control devices manufacturer) | | | 1.78 | | |
| Keyence Corporation (Japanese sensors manufacturer) | | | 1.78 | | |
| Secom Company Limited (Japanese security services provider) | | | 1.74 | | |
| MS&AD Insurance Group Holdings (Japanese life insurance company) | | | 1.55 | | |
| Shimano, Inc. (Japanese bicycle parts manufacturer) | | | 1.54 | | |
| HeidelbergCement AG (German cement company) | | | 1.53 | | |
| Total SA (French energy company) | | | 1.53 | | |
| Fanuc Corporation (Japanese industrial manufacturing company) | | | 1.52 | | |
| Grupo Televisa S.A.B., ADR (Mexican media company) | | | 1.52 | | |
Total | | | 18.86 | % | |
* Holdings in cash, commercial paper and other short term cash equivalents have been excluded. Percentages are based on total net assets.
FIRST EAGLE FUNDS | SEMI-ANNUAL REPORT | APRIL 30, 2013
45
First Eagle Overseas Fund
SHARES | | DESCRIPTION | | COST (NOTE 1) | | VALUE (NOTE 1) | |
Common Stocks — 70.08% | | | |
International Common Stocks — 69.91% | | | |
Australia 0.97% | | | |
| | 7,417,268 | | | Newcrest Mining Limited | | $ | 198,700,259 | | | $ | 129,197,800 | | |
Austria 1.27% | | | |
| | 2,047,932 | | | OMV AG | | | 83,876,284 | | | | 96,121,300 | | |
| | 5,915,786 | | | Wienerberger AG (a) | | | 88,605,267 | | | | 72,771,980 | | |
| | | | 172,481,551 | | | | 168,893,280 | | |
Belgium 0.38% | | | |
| | 585,351 | | | Groupe Bruxelles Lambert SA | | | 43,921,938 | | | | 45,282,856 | | |
| | 57,420 | | | Sofina SA | | | 4,474,251 | | | | 5,458,096 | | |
| | | | 48,396,189 | | | | 50,740,952 | | |
Bermuda 0.58% | | | |
| | 1,192,400 | | | Jardine Matheson Holdings Limited | | | 38,970,319 | | | | 77,422,532 | | |
Canada 5.54% | | | |
| | 4,963,700 | | | Canadian Natural Resources Limited | | | 143,057,438 | | | | 145,599,896 | | |
| | 4,798,623 | | | Goldcorp, Inc. | | | 146,451,707 | | | | 141,943,268 | | |
| | 3,354,274 | | | Potash Corporation of
Saskatchewan, Inc. | | | 132,295,030
| | | | 141,214,935
| | |
| | 3,232,111 | | | Agnico-Eagle Mines Limited | | | 115,573,420 | | | | 104,336,162 | | |
| | 3,163,494 | | | Cenovus Energy, Inc. | | | 76,334,881 | | | | 94,715,010 | | |
| | 8,606,885 | | | Penn West Petroleum Limited | | | 134,619,835 | | | | 79,441,549 | | |
| | 1,100,050 | | | EnCana Corporation | | | 14,298,775 | | | | 20,295,923 | | |
| | 1,585,980 | | | Kinross Gold Corporation | | | 8,427,783 | | | | 8,627,731 | | |
| | 1,266,835 | | | Catalyst Paper Corporation (a)(b)(c)(d) | | | 27,586,952 | | | | 2,533,670 | | |
| | 447,064 | | | Postmedia Network Canada
Corporation (b)(c)(e) | | | 1,993,344
| | | | 865,371
| | |
| | | | 800,639,165 | | | | 739,573,515 | | |
France 8.61% | | | |
| | 4,052,350 | | | Total SA | | | 211,131,291 | | | | 204,035,405 | | |
| | 1,660,633 | | | Sanofi | | | 135,351,026 | | | | 181,819,935 | | |
| | 5,176,813 | | | Bouygues SA | | | 189,847,951 | | | | 144,322,339 | | |
| | 1,472,625 | | | Sodexo | | | 40,712,418 | | | | 122,854,211 | | |
| | 4,130,173 | | | Carrefour SA | | | 132,598,775 | | | | 122,261,828 | | |
| | 5,931,165 | | | Société Télévision Francaise 1 | | | 93,465,134 | | | | 62,684,173 | | |
| | 505,501 | | | Wendel SA | | | 10,862,584 | | | | 54,708,001 | | |
| | 827,900 | | | Neopost SA | | | 44,073,366 | | | | 54,401,393 | | |
| | 558,938 | | | Laurent-Perrier (a) | | | 19,851,603 | | | | 45,225,031 | | |
| | 235,837 | | | Robertet SA (a)(b) | | | 20,591,064 | | | | 44,056,483 | | |
See Notes to Financial Statements.
FIRST EAGLE FUNDS | SEMI-ANNUAL REPORT | APRIL 30, 2013
46
Schedule of Investments | Six-Month Period Ended April 30, 2013 (unaudited)
SHARES | | DESCRIPTION | | COST (NOTE 1) | | VALUE (NOTE 1) | |
International Common Stocks — 69.91% — (continued) | | | |
France 8.61% — (continued) | | | |
| | 51,500 | | | Robertet SA CI (b)(c)(f)(g) | | $ | 2,151,628 | | | $ | 6,823,023 | | |
| | 896,416 | | | Legris Industries SA (a)(c)(d)(f) | | | 23,119,325 | | | | 25,615,896 | | |
| | 514,850 | | | Legrand SA | | | 16,026,208 | | | | 23,968,455 | | |
| | 442,830 | | | Société Foncière Financière et
de Participations | | | 29,139,582
| | | | 17,909,399
| | |
| | 364,373 | | | Gaumont SA | | | 21,698,753 | | | | 17,785,260 | | |
| | 146,562 | | | BioMerieux | | | 11,367,766 | | | | 13,919,978 | | |
| | 11,593,581 | | | FINEL (a)(b)(c)(d)(f)(h) | | | 9,166,547 | | | | 5,491,111 | | |
| | 100,000 | | | Sabeton SA (b) | | | 1,463,142 | | | | 1,694,556 | | |
| | | | 1,012,618,163 | | | | 1,149,576,477 | | |
Germany 3.79% | | | |
| | 2,840,411 | | | HeidelbergCement AG | | | 152,136,558 | | | | 204,300,949 | | |
| | 6,446,343 | | | Deutsche Wohnen AG | | | 67,848,829 | | | | 113,562,282 | | |
| | 1,913,346 | | | Daimler AG | | | 90,981,705 | | | | 105,764,033 | | |
| | 2,970,617 | | | Hamburger Hafen und Logistik AG | | | 87,244,824 | | | | 63,861,459 | | |
| | 296,503 | | | Fraport AG | | | 8,930,449 | | | | 17,702,463 | | |
| | | | 407,142,365 | | | | 505,191,186 | | |
Greece 0.69% | | | |
| | 9,744,762 | | | Jumbo SA (a) | | | 53,227,661 | | | | 91,667,925 | | |
Hong Kong 1.09% | | | |
| | 7,806,340 | | | Guoco Group Limited | | | 57,283,838 | | | | 93,197,869 | | |
| | 8,166,100 | | | Hopewell Holdings Limited | | | 11,153,124 | | | | 31,462,917 | | |
| | 4,626,000 | | | Great Eagle Holdings Limited | | | 14,415,545 | | | | 19,552,062 | | |
| | 10,851,720 | | | City e-Solutions Limited (b)(c) | | | 323,358 | | | | 1,048,752 | | |
| | | | 83,175,865 | | | | 145,261,600 | | |
Ireland 0.76% | | | |
| | 4,723,559 | | | CRH PLC | | | 81,822,477 | | | | 101,398,723 | | |
Israel 0.32% | | | |
| | 3,627,690 | | | Israel Chemicals Limited | | | 37,500,950 | | | | 43,138,129 | | |
Italy 0.42% | | | |
| | 7,315,306 | | | Italcementi S.p.A. RSP | | | 87,341,485 | | | | 22,521,042 | | |
| | 1,197,736 | | | Italmobiliare S.p.A. RSP (b) | | | 50,324,930 | | | | 15,718,610 | | |
| | 168,142 | | | Italmobiliare S.p.A. (b) | | | 19,250,153 | | | | 3,426,634 | | |
| | 1,385,400 | | | Recordati S.p.A. | | | 9,200,042 | | | | 14,271,745 | | |
| | | | 166,116,610 | | | | 55,938,031 | | |
See Notes to Financial Statements.
FIRST EAGLE FUNDS | SEMI-ANNUAL REPORT | APRIL 30, 2013
47
SHARES | | DESCRIPTION | | COST (NOTE 1) | | VALUE (NOTE 1) | |
International Common Stocks — 69.91% — (continued) | | | |
Japan 25.33% | | | |
| | 1,190,890 | | | SMC Corporation | | $ | 153,234,830 | | | $ | 238,141,382 | | |
| | 749,000 | | | Keyence Corporation | | | 138,023,596 | | | | 237,217,240 | | |
| | 4,170,700 | | | Secom Company Limited | | | 178,984,614 | | | | 232,548,639 | | |
| | 7,730,800 | | | MS&AD Insurance Group Holdings | | | 179,151,117 | | | | 206,730,459 | | |
| | 2,371,770 | | | Shimano, Inc. | | | 32,354,996 | | | | 205,902,648 | | |
| | 1,346,040 | | | Fanuc Corporation | | | 125,798,034 | | | | 202,806,211 | | |
| | 4,138,000 | | | KDDI Corporation | | | 131,538,320 | | | | 198,491,672 | | |
| | 7,316,700 | | | NKSJ Holdings, Inc. | | | 201,780,857 | | | | 185,082,925 | | |
| | 3,060,940 | | | Astellas Pharma, Inc. | | | 124,295,455 | | | | 177,886,843 | | |
| | 1,048,100 | | | Hirose Electric Company Limited | | | 115,447,378 | | | | 150,396,146 | | |
| | 7,118,930 | | | Hoya Corporation | | | 151,068,607 | | | | 142,137,812 | | |
| | 4,120,850 | | | Mitsubishi Estate Company Limited | | | 60,815,472 | | | | 133,680,011 | | |
| | 4,092,170 | | | MISUMI Group, Inc. | | | 70,195,915 | | | | 124,612,690 | | |
| | 3,488,760 | | | Nomura Research Institute Limited | | | 67,843,048 | | | | 104,950,654 | | |
| | 2,146,230 | | | Nissin Foods Holdings
Company Limited | | | 76,085,758
| | | | 96,131,042
| | |
| | 1,433,000 | | | Ono Pharmaceutical
Company Limited | | | 51,882,188
| | | | 94,294,675
| | |
| | 6,736,430 | | | Kansai Paint Company Limited | | | 52,830,721 | | | | 86,237,904 | | |
| | 2,485,480 | | | Daiichikosho Company Limited | | | 27,081,143 | | | | 73,852,370 | | |
| | 6,577,300 | | | Japan Wool Textile
Company Limited (a) | | | 49,871,284
| | | | 56,695,632
| | |
| | 2,485,660 | | | Nitto Kohki Company Limited (a) | | | 42,682,905 | | | | 47,285,245 | | |
| | 3,206,911 | | | T. Hasegawa Company Limited (a) | | | 43,073,853 | | | | 47,233,445 | | |
| | 2,023,800 | | | Chofu Seisakusho
Company Limited (a) | | | 33,120,144
| | | | 46,817,164
| | |
| | 544,180 | | | Shin-Etsu Chemical
Company Limited | | | 25,384,114
| | | | 36,589,154
| | |
| | 21,981 | | | NTT DoCoMo, Inc. | | | 33,331,355 | | | | 36,272,649 | | |
| | 2,011,124 | | | Nagaileben Company Limited (a) | | | 19,934,850 | | | | 34,362,156 | | |
| | 1,286,140 | | | As One Corporation (a) | | | 26,246,127 | | | | 30,345,865 | | |
| | 2,158,100 | | | Seikagaku Corporation | | | 17,326,940 | | | | 29,419,085 | | |
| | 508,106 | | | SK Kaken Company Limited | | | 9,470,131 | | | | 26,039,358 | | |
| | 1,549,790 | | | OSG Corporation | | | 17,248,953 | | | | 23,525,229 | | |
| | 2,068,330 | | | Maezawa Kasei Industries
Company Limited (a) | | | 31,939,631
| | | | 22,768,272
| | |
| | 2,535,900 | | | Yomeishu Seizo
Company Limited (a) | | | 22,847,623
| | | | 22,457,004
| | |
| | 493,250 | | | Mandom Corporation | | | 6,249,764 | | | | 18,023,228 | | |
See Notes to Financial Statements.
FIRST EAGLE FUNDS | SEMI-ANNUAL REPORT | APRIL 30, 2013
48
Schedule of Investments | Six-Month Period Ended April 30, 2013 (unaudited)
SHARES | | DESCRIPTION | | COST (NOTE 1) | | VALUE (NOTE 1) | |
International Common Stocks — 69.91% — (continued) | | | |
Japan 25.33% — (continued) | | | |
| | 199,150 | | | Kobayashi Pharmaceutical
Company Limited | | $ | 9,171,366
| | | $ | 10,859,201
| | |
| | 120,200 | | | Shingakukai Company Limited | | | 673,484 | | | | 421,344 | | |
| | | | 2,326,984,573 | | | | 3,380,215,354 | | |
Malaysia 0.52% | | | |
| | 55,981,850 | | | Genting Malaysia Berhad | | | 48,153,235 | | | | 69,183,815 | | |
Mexico 2.97% | | | |
| | 7,987,622 | | | Grupo Televisa S.A.B., ADR | | | 158,160,868 | | | | 202,246,589 | | |
| | 5,543,609 | | | Fresnillo PLC | | | 96,576,524 | | | | 99,197,373 | | |
| | 2,246,692 | | | Industrias Peñoles S.A.B. de C.V. | | | 1,833,690 | | | | 94,516,104 | | |
| | | | 256,571,082 | | | | 395,960,066 | | |
Netherlands 0.81% | | | |
| | 539,055 | | | HAL Trust | | | 18,095,972 | | | | 69,502,316 | | |
| | 5,026,304 | | | TNT Express NV | | | 53,447,821 | | | | 38,579,385 | | |
| | | | 71,543,793 | | | | 108,081,701 | | |
Norway 0.55% | | | |
| | 8,230,541 | | | Orkla ASA | | | 58,334,500 | | | | 73,986,556 | | |
Singapore 2.25% | | | |
| | 23,192,830 | | | Haw Par Corporation Limited (a) | | | 76,875,317 | | | | 145,989,910 | | |
| | 70,167,015 | | | ComfortDelGro Corporation Limited | | | 68,385,814 | | | | 112,979,822 | | |
| | 16,373,450 | | | Singapore Airport Terminal
Services Limited | | | 18,528,182
| | | | 41,836,768
| | |
| | | | 163,789,313 | | | | 300,806,500 | | |
South Africa 0.67% | | | |
| | 8,597,734 | | | Gold Fields Limited, ADR | | | 90,123,142 | | | | 64,139,096 | | |
| | 3,275,059 | | | Harmony Gold Mining Company
Limited, ADR | | | 30,822,097
| | | | 16,801,053
| | |
| | 1,646,604 | | | Sibanye Gold Limited, ADR (b) | | | 11,065,865 | | | | 6,339,425 | | |
| | 103,790 | | | AngloGold Ashanti Limited, ADR | | | 1,861,297 | | | | 2,023,905 | | |
| | | | 133,872,401 | | | | 89,303,479 | | |
South Korea 2.26% | | | |
| | 1,906,638 | | | KT&G Corporation | | | 110,380,112 | | | | 137,289,016 | | |
| | 35,325 | | | Lotte Confectionery Company Limited | | | 12,445,892 | | | | 61,585,399 | | |
| | 186,884 | | | Nong Shim Company Limited | | | 43,886,371 | | | | 56,932,336 | | |
| | 22,950 | | | Namyang Dairy Products
Company Limited | | | 4,912,653
| | | | 24,277,445
| | |
| | 872,463 | | | Fursys, Inc. (a) | | | 10,110,166 | | | | 21,152,059 | | |
| | | | 181,735,194 | | | | 301,236,255 | | |
See Notes to Financial Statements.
FIRST EAGLE FUNDS | SEMI-ANNUAL REPORT | APRIL 30, 2013
49
SHARES | | DESCRIPTION | | COST (NOTE 1) | | VALUE (NOTE 1) | |
International Common Stocks — 69.91% — (continued) | | | |
Spain 0.67% | | | |
| | 1,688,700 | | | Red Electrica Corporation SA | | $ | 84,248,760 | | | $ | 89,735,953 | | |
Sweden 0.99% | | | |
| | 3,013,030 | | | Investor AB, Class 'A' | | | 59,333,861 | | | | 87,078,300 | | |
| | 1,515,198 | | | Investor AB, Class 'B' | | | 29,407,014 | | | | 44,631,312 | | |
| | | | 88,740,875 | | | | 131,709,612 | | |
Switzerland 3.34% | | | |
| | 2,610,500 | | | Nestlé SA | | | 79,226,014 | | | | 186,223,894 | | |
| | 2,413,791 | | | Pargesa Holding SA | | | 129,478,662 | | | | 168,042,175 | | |
| | 193,016 | | | Rieter Holding AG | | | 26,177,079 | | | | 32,183,158 | | |
| | 639 | | | Lindt & Spruengli AG | | | 4,092,177 | | | | 28,404,195 | | |
| | 137,452 | | | Kuehne & Nagel International AG | | | 1,733,811 | | | | 15,712,175 | | |
| | 225,026 | | | Autoneum Holding AG (b) | | | 12,062,900 | | | | 15,448,175 | | |
| | | | 252,770,643 | | | | 446,013,772 | | |
Taiwan 0.37% | | | |
| | 20,184,980 | | | Taiwan Secom Company Limited | | | 32,105,415 | | | | 48,971,421 | | |
Thailand 1.71% | | | |
| | 234,402,685 | | | Thai Beverage PCL | | | 39,626,292 | | | | 115,033,764 | | |
| | 14,068,859 | | | Bangkok Bank PCL, NVDR | | | 47,289,992 | | | | 108,332,611 | | |
| | 250,000 | | | OHTL PCL (c) | | | 1,152,072 | | | | 5,110,733 | | |
| | | | 88,068,356 | | | | 228,477,108 | | |
Turkey 0.29% | | | |
| | 3,205,889 | | | Yazicilar Holding AS | | | 21,541,251 | | | | 38,247,261 | | |
United Kingdom 2.76% | | | |
| | 26,216,814 | | | WM Morrison Supermarkets PLC | | | 116,650,657 | | | | 118,950,581 | | |
| | 3,378,628 | | | Berkeley Group Holdings PLC | | | 41,275,902 | | | | 109,421,215 | | |
| | 3,995,640 | | | GlaxoSmithKline PLC | | | 76,140,895 | | | | 103,057,673 | | |
| | 1,505,388 | | | Anglo American PLC | | | 39,361,076 | | | | 36,594,675 | | |
| | | | 273,428,530 | | | | 368,024,144 | | |
Total International Common Stocks | | | 7,182,679,495 | | | | 9,327,953,147 | | |
U.S. Common Stock — 0.17% | | | |
Materials 0.17% | | | |
| | 691,883 | | | Newmont Mining Corporation | | | 17,601,872 | | | | 22,417,009 | | |
Total Common Stocks | | | 7,200,281,367 | | | | 9,350,370,156 | | |
See Notes to Financial Statements.
FIRST EAGLE FUNDS | SEMI-ANNUAL REPORT | APRIL 30, 2013
50
Schedule of Investments | Six-Month Period Ended April 30, 2013 (unaudited)
SHARES | | DESCRIPTION | | COST (NOTE 1) | | VALUE (NOTE 1) | |
International Preferred Stocks — 0.87% | | | |
Germany 0.58% | | | |
| | 1,160,182 | | | Hornbach Holding AG | | $ | 39,421,559 | | | $ | 77,693,382 | | |
South Korea 0.29% | | | |
| | 38,590 | | | Samsung Electronics Company Limited | | | 4,573,363 | | | | 30,520,195 | | |
| | 27,183 | | | Namyang Dairy Products
Company Limited | | | 387,444
| | | | 7,700,986
| | |
| | | | 4,960,807 | | | | 38,221,181 | | |
Total International Preferred Stocks | | | 44,382,366 | | | | 115,914,563 | | |
Right — 0.00% | | | |
| | 55,324 | | | Pfleiderer Atlantik Raco
RI Rights (b)(c)(f) | | | 7,625
| | | | 0
| | |
OUNCES | | | | | | | |
Commodity — 4.37% | | | |
| | 394,744 | | | Gold bullion (b) | | | 199,148,724 | | | | 582,622,734 | | |
PRINCIPAL | | | | | | | |
Term Loans — 0.08% | | | |
Germany 0.08% | | | |
| 1,880,723
EUR | | | Atlantik Senior Debt 79.5M
6.00% due 05/30/17 (c)(d)(f)(i) | | | 2,553,647
| | | | 618,593
| | |
| 132,149
EUR | | | Atlantik Senior Debt
due 05/30/17 (b)(c)(d)(f) | | | 0
| | | | 43,466
| | |
| 371,719
EUR | | | Atlantik Senior Debt Term Facility 1A
6.00% due 05/30/17 (c)(d)(f)(i) | | | 504,720
| | | | 122,263
| | |
| 364,387
EUR | | | Atlantik Senior Debt Term Facility 2A
6.00% due 05/30/17 (c)(d)(f)(i) | | | 494,765
| | | | 119,852
| | |
| 346,348
EUR | | | Atlantik Senior Debt Term Facility 3A
6.00% due 05/30/17 (c)(d)(f)(i) | | | 470,272
| | | | 113,918
| | |
| 219,842
EUR | | | Atlantik Senior Debt Term Facility 4A
6.00% due 05/30/17 (c)(d)(f)(i) | | | 298,502
| | | | 72,309
| | |
| 2,605,530
EUR | | | Atlantik Subordinated Debt
due 05/30/17 (b)(c)(d)(f) | | | 0
| | | | 0
| | |
| 4,000,000
EUR | | | Atlantik Subordinated Debt 79.5M
15.00% due 05/30/17 (c)(d)(f)(i) | | | 5,431,204
| | | | 0
| | |
| 790,586
EUR | | | Atlantik Subordinated Debt
Term Facility 1A
15.00% due 05/30/17 (c)(d)(f)(i) | | | 1,073,458
| | | | 0
| | |
See Notes to Financial Statements.
FIRST EAGLE FUNDS | SEMI-ANNUAL REPORT | APRIL 30, 2013
51
PRINCIPAL | | DESCRIPTION | | COST (NOTE 1) | | VALUE (NOTE 1) | |
Term Loans — 0.08% — (continued) | | | |
Germany 0.08% — (continued) | | | |
| 774,993
EUR | | | Atlantik Subordinated Debt
Term Facility 2A
15.00% due 05/30/17 (c)(d)(f)(i) | | $ | 1,052,286
| | | $ | 0
| | |
| 739,302
EUR | | | Atlantik Subordinated Debt
Term Facility 3A
15.00% due 05/30/17 (c)(d)(f)(i) | | | 1,003,825
| | | | 0
| | |
| 469,266
EUR | | | Atlantik Subordinated Debt
Term Facility 4A
15.00% due 05/30/17 (c)(d)(f)(i) | | | 637,170
| | | | 0
| | |
| 4,119,277
EUR | | | Pfleiderer AG 79.5M
4.19% due 05/30/17 (c)(d)(f)(i)(j) | | | 5,593,158
| | | | 5,419,524
| | |
| 264,297
EUR | | | Pfleiderer AG Debt
due 05/30/17 (b)(c)(d)(f) | | | 0
| | | | 347,722
| | |
| 814,161
EUR | | | Pfleiderer AG Term Facility 1A
4.19% due 05/30/17 (c)(d)(f)(i)(j) | | | 1,105,469
| | | | 1,071,150
| | |
| 798,102
EUR | | | Pfleiderer AG Term Facility 2A
4.19% due 05/30/17 (c)(d)(f)(i)(j) | | | 1,083,664
| | | | 1,050,022
| | |
| 761,348
EUR | | | Pfleiderer AG Term Facility 3A
4.19% due 05/30/17 (c)(d)(f)(i)(j) | | | 1,033,759
| | | | 1,001,667
| | |
| 483,259
EUR | | | Pfleiderer AG Term Facility 4A
4.19% due 05/30/17 (c)(d)(f)(i)(j) | | | 656,169
| | | | 635,799
| | |
| 621,387
EUR | | | Pfleiderer AG Term Loan B
6.12% due 05/02/18 (c) | | | 890,684
| | | | 743,949
| | |
Total Term Loans | | | 23,882,752 | | | | 11,360,234 | | |
International Corporate Bonds — 0.30% | | | |
Canada 0.12% | | | |
| 21,221,754
USD | | | Catalyst Paper Corporation
11.00% due 10/30/17 (d)(i) | | | 26,384,136
| | | | 16,446,859
| | |
France 0.18% | | | |
| 10,000,000
EUR | | | Emin Leydier SA FRN
7.32% due 07/31/16 (c)(d)(f)(j) | | | 14,285,831
| | | | 13,156,493
| | |
| 8,000,000
EUR | | | FINEL
9.50% due 06/30/17 (b)(c)(d)(f) | | | 9,659,548
| | | | 7,893,895
| | |
| 1,950,000
EUR | | | Wendel SA
4.875% due 09/21/15 | | | 1,954,833
| | | | 2,729,068
| | |
| | | | 25,900,212 | | | | 23,779,456 | | |
Total International Corporate Bonds | | | 52,284,348 | | | | 40,226,315 | | |
See Notes to Financial Statements.
FIRST EAGLE FUNDS | SEMI-ANNUAL REPORT | APRIL 30, 2013
52
Schedule of Investments | Six-Month Period Ended April 30, 2013 (unaudited)
PRINCIPAL | | DESCRIPTION | | COST (NOTE 1) | | VALUE (NOTE 1) | |
Commercial Paper — 23.42% | | | |
International Commercial Paper — 7.05% | | | |
Canada 0.58% | | | |
| 17,729,000
USD | | | Canadian Natural Resources Limited
0.32% due 05/22/13 | | $ | 17,725,691
| | | $ | 17,725,691
| | |
| 11,716,000
USD | | | Canadian Natural Resources Limited
0.33% due 05/10/13 | | | 11,715,033
| | | | 11,715,033
| | |
| 6,123,000
USD | | | Potash Corporation of Saskatchewan,
Inc. 0.27% due 05/29/13 | | | 6,121,714
| | | | 6,121,714
| | |
| 9,768,000
USD | | | Suncor Energy, Inc.
0.29% due 06/12/13 | | | 9,764,695
| | | | 9,764,695
| | |
| 21,169,000
USD | | | Suncor Energy, Inc.
0.29% due 06/13/13 | | | 21,161,667
| | | | 21,161,667
| | |
| 11,539,000
USD | | | Suncor Energy, Inc.
0.29% due 06/24/13 | | | 11,533,981
| | | | 11,533,981
| | |
France 1.48% | | | |
| 14,404,000
USD | | | GDF Suez SA
0.22% due 07/09/13 | | | 14,397,926
| | | | 14,397,363
| | |
| 26,035,000
USD | | | Sanofi
0.11% due 06/17/13 | | | 26,031,261
| | | | 26,031,261
| | |
| 11,583,000
USD | | | Sanofi
0.13% due 06/20/13 | | | 11,580,909
| | | | 11,580,909
| | |
| 23,851,000
USD | | | Sanofi
0.13% due 07/15/13 | | | 23,844,541
| | | | 23,844,186
| | |
| 30,177,000
USD | | | Sanofi
0.14% due 06/25/13 | | | 30,170,545
| | | | 30,170,545
| | |
| 12,633,000
USD | | | Total SA
0.09% due 05/01/13 | | | 12,633,000
| | | | 12,633,000
| | |
| 32,229,000
USD | | | Total SA
0.12% due 05/02/13 | | | 32,228,892
| | | | 32,228,892
| | |
| 22,903,000
USD | | | Total SA
0.12% due 05/22/13 | | | 22,901,397
| | | | 22,901,397
| | |
| 24,312,000
USD | | | Total SA
0.12% due 06/04/13 | | | 24,309,245
| | | | 24,309,245
| | |
Germany 0.68% | | | |
| 11,580,000
USD | | | BASF AG
0.11% due 05/29/13 | | | 11,579,009
| | | | 11,579,009
| | |
| 16,305,000
USD | | | BASF AG
0.13% due 06/18/13 | | | 16,302,174
| | | | 16,302,174
| | |
| 17,463,000
USD | | | Siemens Company
0.12% due 06/18/13 | | | 17,460,206
| | | | 17,460,206
| | |
| 12,596,000
USD | | | Siemens Company
0.12% due 06/19/13 | | | 12,593,943
| | | | 12,593,943
| | |
| 32,854,000
USD | | | Siemens Company
0.12% due 06/21/13 | | | 32,848,415
| | | | 32,848,415
| | |
See Notes to Financial Statements.
FIRST EAGLE FUNDS | SEMI-ANNUAL REPORT | APRIL 30, 2013
53
PRINCIPAL | | DESCRIPTION | | COST (NOTE 1) | | VALUE (NOTE 1) | |
International Commercial Paper — 7.05% — (continued) | | | |
Italy 0.40% | | | |
| 7,384,000
USD | | | Eni S.p.A.
0.34% due 05/15/13 | | $ | 7,383,024
| | | $ | 7,383,024
| | |
| 4,387,000
USD | | | Eni S.p.A.
0.38% due 05/21/13 | | | 4,386,098
| | | | 4,386,098
| | |
| 13,780,000
USD | | | Eni S.p.A.
0.40% due 05/01/13 | | | 13,780,000
| | | | 13,780,000
| | |
| 22,260,000
USD | | | Eni S.p.A.
0.40% due 05/20/13 | | | 22,255,418
| | | | 22,255,418
| | |
| 5,397,000
USD | | | Eni S.p.A.
0.42% due 05/09/13 | | | 5,396,508
| | | | 5,396,508
| | |
Japan 0.61% | | | |
| 7,654,000
USD | | | Hitachi Limited
0.31% due 05/23/13 | | | 7,652,550
| | | | 7,652,550
| | |
| 10,914,000
USD | | | Honda Corporation
0.12% due 06/07/13 | | | 10,912,654
| | | | 10,912,654
| | |
| 34,912,000
USD | | | Honda Corporation
0.13% due 05/10/13 | | | 34,910,865
| | | | 34,910,865
| | |
| 16,585,000
USD | | | Honda Corporation
0.14% due 06/07/13 | | | 16,582,613
| | | | 16,582,613
| | |
| 6,750,000
USD | | | Mitsui & Company Limited
0.18% due 06/25/13 | | | 6,748,144
| | | | 6,748,144
| | |
| 4,219,000
USD | | | Mitsui & Company Limited
0.19% due 07/22/13 | | | 4,217,175
| | | | 4,216,617
| | |
Luxembourg 0.09% | | | |
| 11,539,000
USD | | | Michelin Luxembourg S.C.S.
0.25% due 05/23/13 | | | 11,537,237
| | | | 11,537,237
| | |
Switzerland 1.12% | | | |
| 22,990,000
USD | | | Nestlé SA
0.12% due 05/08/13 | | | 22,989,464
| | | | 22,989,464
| | |
| 25,101,000
USD | | | Nestlé SA
0.12% due 05/09/13 | | | 25,100,331
| | | | 25,100,331
| | |
| 8,323,000
USD | | | Nestlé SA
0.12% due 05/15/13 | | | 8,322,612
| | | | 8,322,612
| | |
| 13,780,000
USD | | | Nestlé SA
0.12% due 06/05/13 | | | 13,778,392
| | | | 13,778,392
| | |
| 21,653,000
USD | | | Nestlé SA
0.14% due 06/04/13 | | | 21,650,137
| | | | 21,650,137
| | |
| 7,684,000
USD | | | Nestlé SA
0.14% due 06/11/13 | | | 7,682,775
| | | | 7,682,775
| | |
| 9,929,000
USD | | | Nestlé SA
0.14% due 06/25/13 | | | 9,926,876
| | | | 9,926,876
| | |
| 3,159,000
USD | | | Nestlé SA
0.14% due 07/09/13 | | | 3,158,152
| | | | 3,158,365
| | |
See Notes to Financial Statements.
FIRST EAGLE FUNDS | SEMI-ANNUAL REPORT | APRIL 30, 2013
54
Schedule of Investments | Six-Month Period Ended April 30, 2013 (unaudited)
PRINCIPAL | | DESCRIPTION | | COST (NOTE 1) | | VALUE (NOTE 1) | |
International Commercial Paper — 7.05% — (continued) | | | |
Switzerland 1.12% — (continued) | | | |
| 15,055,000
USD | | | Nestlé SA
0.15% due 06/03/13 | | $ | 15,052,930
| | | $ | 15,052,930
| | |
| 6,225,000
USD | | | Roche Holdings, Inc.
0.12% due 06/20/13 | | | 6,223,962
| | | | 6,223,962
| | |
| 15,155,000
USD | | | Roche Holdings, Inc.
0.13% due 06/20/13 | | | 15,152,264
| | | | 15,152,264
| | |
United Arab Emirates 0.64% | | | |
| 28,074,000
USD | | | Xstrata Finance Dubai Limited
0.39% due 05/09/13 | | | 28,071,629
| | | | 28,071,629
| | |
| 12,198,000
USD | | | Xstrata Finance Dubai Limited
0.39% due 05/17/13 | | | 12,195,940
| | | | 12,195,940
| | |
| 12,198,000
USD | | | Xstrata Finance Dubai Limited
0.39% due 05/21/13 | | | 12,195,425
| | | | 12,195,425
| | |
| 10,253,000
USD | | | Xstrata Finance Dubai Limited
0.39% due 05/24/13 | | | 10,250,511
| | | | 10,250,511
| | |
| 22,705,000
USD | | | Xstrata Finance Dubai Limited
0.41% due 06/10/13 | | | 22,694,909
| | | | 22,694,909
| | |
United Kingdom 1.45% | | | |
| 8,422,000
USD | | | AstraZeneca PLC
0.09% due 05/09/13 | | | 8,421,832
| | | | 8,421,832
| | |
| 11,819,000
USD | | | AstraZeneca PLC
0.10% due 06/10/13 | | | 11,817,687
| | | | 11,817,687
| | |
| 13,231,000
USD | | | AstraZeneca PLC
0.10% due 06/14/13 | | | 13,229,383
| | | | 13,229,383
| | |
| 8,437,000
USD | | | AstraZeneca PLC
0.10% due 07/25/13 | | | 8,435,007
| | | | 8,432,626
| | |
| 12,099,000
USD | | | AstraZeneca PLC
0.11% due 05/01/13 | | | 12,099,000
| | | | 12,099,000
| | |
| 11,634,000
USD | | | AstraZeneca PLC
0.11% due 05/13/13 | | | 11,633,573
| | | | 11,633,573
| | |
| 18,826,000
USD | | | AstraZeneca PLC
0.11% due 05/20/13 | | | 18,824,907
| | | | 18,824,907
| | |
| 12,207,000
USD | | | AstraZeneca PLC
0.11% due 07/17/13 | | | 12,204,128
| | | | 12,201,393
| | |
| 30,855,000
USD | | | AstraZeneca PLC
0.12% due 05/03/13 | | | 30,854,794
| | | | 30,854,794
| | |
| 12,317,000
USD | | | AstraZeneca PLC
0.12% due 05/07/13 | | | 12,316,754
| | | | 12,316,754
| | |
| 12,136,000
USD | | | AstraZeneca PLC
0.12% due 07/23/13 | | | 12,132,642
| | | | 12,129,883
| | |
| 14,251,000
USD | | | Reckitt Benckiser
0.13% due 05/14/13 | | | 14,250,331
| | | | 14,250,331
| | |
See Notes to Financial Statements.
FIRST EAGLE FUNDS | SEMI-ANNUAL REPORT | APRIL 30, 2013
55
PRINCIPAL | | DESCRIPTION | | COST (NOTE 1) | | VALUE (NOTE 1) | |
International Commercial Paper — 7.05% — (continued) | | | |
United Kingdom 1.45% — (continued) | | | |
| 27,780,000
USD | | | Reckitt Benckiser
0.14% due 05/13/13 | | $ | 27,778,704
| | | $ | 27,778,704
| | |
Total International Commercial Paper | | | 941,111,581 | | | | 941,102,443 | | |
U.S. Commercial Paper — 16.37% | | | |
$ | 29,579,000 | | | Abbott Laboratories
0.12% due 06/21/13 | | | 29,573,972
| | | | 29,573,972
| | |
| | 9,668,000 | | | Abbott Laboratories
0.13% due 05/08/13 | | | 9,667,756
| | | | 9,667,756
| | |
| | 12,383,000 | | | Abbott Laboratories
0.13% due 05/21/13 | | | 12,382,106
| | | | 12,382,106
| | |
| | 22,647,000 | | | Abbott Laboratories
0.13% due 05/28/13 | | | 22,644,792
| | | | 22,644,792
| | |
| | 5,931,000 | | | Abbott Laboratories
0.13% due 06/10/13 | | | 5,930,143
| | | | 5,930,143
| | |
| | 26,923,000 | | | Abbott Laboratories
0.13% due 07/16/13 | | | 26,915,611
| | | | 26,918,393
| | |
| | 15,523,000 | | | Abbott Laboratories
0.13% due 07/19/13 | | | 15,518,572
| | | | 15,520,240
| | |
| | 8,866,000 | | | Abbott Laboratories
0.14% due 06/10/13 | | | 8,864,621
| | | | 8,864,621
| | |
| | 16,112,000 | | | Air Products
0.12% due 05/13/13 | | | 16,111,356
| | | | 16,111,356
| | |
| | 3,352,000 | | | Avery Dennison Corporation
0.27% due 05/01/13 | | | 3,352,000
| | | | 3,352,000
| | |
| | 2,442,000 | | | Avery Dennison Corporation
0.28% due 05/01/13 | | | 2,442,000
| | | | 2,442,000
| | |
| | 5,413,000 | | | Baker Hughes, Inc.
0.13% due 05/07/13 | | | 5,412,883
| | | | 5,412,883
| | |
| | 28,074,000 | | | BHP Billiton Finance USA Limited
0.12% due 05/06/13 | | | 28,073,532
| | | | 28,073,532
| | |
| | 18,297,000 | | | BHP Billiton Finance USA Limited
0.12% due 05/07/13 | | | 18,296,634
| | | | 18,296,634
| | |
| | 12,198,000 | | | BHP Billiton Finance USA Limited
0.12% due 05/08/13 | | | 12,197,715
| | | | 12,197,715
| | |
| | 11,819,000 | | | BHP Billiton Finance USA Limited
0.13% due 06/11/13 | | | 11,817,250
| | | | 11,817,250
| | |
| | 11,819,000 | | | BHP Billiton Finance USA Limited
0.13% due 06/12/13 | | | 11,817,207
| | | | 11,817,207
| | |
| | 27,960,000 | | | BHP Billiton Finance USA Limited
0.13% due 06/13/13 | | | 27,955,658
| | | | 27,955,658
| | |
| | 25,702,000 | | | BHP Billiton Finance USA Limited
0.13% due 06/18/13 | | | 25,697,545
| | | | 25,697,545
| | |
See Notes to Financial Statements.
FIRST EAGLE FUNDS | SEMI-ANNUAL REPORT | APRIL 30, 2013
56
Schedule of Investments | Six-Month Period Ended April 30, 2013 (unaudited)
PRINCIPAL | | DESCRIPTION | | COST (NOTE 1) | | VALUE (NOTE 1) | |
U.S. Commercial Paper — 16.37% — (continued) | | | |
$ | 9,902,000 | | | BHP Billiton Finance USA Limited
0.14% due 05/17/13 | | $ | 9,901,384
| | | $ | 9,901,384
| | |
| | 20,670,000 | | | BHP Billiton Finance USA Limited
0.14% due 05/21/13 | | | 20,668,392
| | | | 20,668,392
| | |
| | 25,507,000 | | | Caterpillar Financial Services Company
0.14% due 07/10/13 | | | 25,500,056
| | | | 25,499,455
| | |
| | 31,163,000 | | | Caterpillar Financial Services Company
0.15% due 06/20/13 | | | 31,156,508
| | | | 31,156,508
| | |
| | 10,503,000 | | | CBS Corporation
0.30% due 05/20/13 | | | 10,501,337
| | | | 10,501,337
| | |
| | 14,535,000 | | | CBS Corporation
0.30% due 05/29/13 | | | 14,531,609
| | | | 14,531,609
| | |
| | 15,169,000 | | | Celgene Corporation
0.26% due 05/17/13 | | | 15,167,247
| | | | 15,167,247
| | |
| | 15,251,000 | | | Celgene Corporation
0.27% due 06/07/13 | | | 15,246,768
| | | | 15,246,768
| | |
| | 8,789,000 | | | Chevron Corporation
0.07% due 06/06/13 | | | 8,788,385
| | | | 8,788,385
| | |
| | 7,585,000 | | | Chevron Corporation
0.08% due 05/22/13 | | | 7,584,646
| | | | 7,584,646
| | |
| | 28,760,000 | | | Chevron Corporation
0.10% due 05/15/13 | | | 28,758,882
| | | | 28,758,882
| | |
| | 28,520,000 | | | Chevron Corporation
0.11% due 05/03/13 | | | 28,519,826
| | | | 28,519,826
| | |
| | 17,596,000 | | | Chevron Corporation
0.12% due 05/07/13 | | | 17,595,648
| | | | 17,595,648
| | |
| | 15,055,000 | | | Church & Dwight Company, Inc.
0.33% due 05/02/13 | | | 15,054,862
| | | | 15,054,862
| | |
| | 16,318,000 | | | Coca-Cola Company
0.11% due 05/09/13 | | | 16,317,601
| | | | 16,317,601
| | |
| | 11,476,000 | | | Coca-Cola Company
0.11% due 05/17/13 | | | 11,475,439
| | | | 11,475,439
| | |
| | 13,739,000 | | | Coca-Cola Company
0.11% due 05/23/13 | | | 13,738,076
| | | | 13,738,076
| | |
| | 13,018,000 | | | Coca-Cola Company
0.12% due 07/17/13 | | | 13,014,659
| | | | 13,015,744
| | |
| | 22,754,000 | | | Coca-Cola Company
0.12% due 07/19/13 | | | 22,748,008
| | | | 22,749,954
| | |
| | 3,462,000 | | | Coca-Cola Company
0.13% due 05/17/13 | | | 3,461,800
| | | | 3,461,800
| | |
| | 23,503,000 | | | Coca-Cola Company
0.13% due 06/12/13 | | | 23,499,435
| | | | 23,499,435
| | |
See Notes to Financial Statements.
FIRST EAGLE FUNDS | SEMI-ANNUAL REPORT | APRIL 30, 2013
57
PRINCIPAL | | DESCRIPTION | | COST (NOTE 1) | | VALUE (NOTE 1) | |
U.S. Commercial Paper — 16.37% — (continued) | | | |
$ | 11,409,000 | | | Coca-Cola Company
0.13% due 06/13/13 | | $ | 11,407,228
| | | $ | 11,407,228
| | |
| | 12,094,000 | | | Coca-Cola Company
0.14% due 06/19/13 | | | 12,091,695
| | | | 12,091,695
| | |
| | 12,094,000 | | | Coca-Cola Company
0.14% due 06/20/13 | | | 12,091,648
| | | | 12,091,648
| | |
| | 4,211,000 | | | Coca-Cola Company
0.20% due 05/01/13 | | | 4,211,000
| | | | 4,211,000
| | |
| | 20,242,000 | | | Colgate-Palmolive Company
0.07% due 05/01/13 | | | 20,242,000
| | | | 20,242,000
| | |
| | 2,358,000 | | | Con Edison, Inc.
0.23% due 05/01/13 | | | 2,358,000
| | | | 2,358,000
| | |
| | 7,938,000 | | | ConocoPhillips
0.14% due 06/11/13 | | | 7,936,734
| | | | 7,936,734
| | |
| | 4,534,000 | | | Deere & Company
0.10% due 05/23/13 | | | 4,533,723
| | | | 4,533,723
| | |
| | 11,986,000 | | | Deere & Company
0.11% due 05/02/13 | | | 11,985,963
| | | | 11,985,963
| | |
| | 8,059,000 | | | Deere & Company
0.11% due 05/23/13 | | | 8,058,458
| | | | 8,058,458
| | |
| | 12,234,000 | | | Deere & Company
0.12% due 05/03/13 | | | 12,233,918
| | | | 12,233,918
| | |
| | 5,551,000 | | | Deere & Company
0.12% due 05/08/13 | | | 5,550,870
| | | | 5,550,870
| | |
| | 14,037,000 | | | Devon Energy Corporation
0.23% due 05/10/13 | | | 14,036,193
| | | | 14,036,193
| | |
| | 13,980,000 | | | Devon Energy Corporation
0.23% due 05/21/13 | | | 13,978,214
| | | | 13,978,214
| | |
| | 16,032,000 | | | Devon Energy Corporation
0.27% due 05/01/13 | | | 16,032,000
| | | | 16,032,000
| | |
| | 11,409,000 | | | Devon Energy Corporation
0.28% due 05/17/13 | | | 11,407,580
| | | | 11,407,580
| | |
| | 12,198,000 | | | Devon Energy Corporation
0.28% due 06/05/13 | | | 12,194,679
| | | | 12,194,679
| | |
| | 11,243,000 | | | Devon Energy Corporation
0.29% due 06/12/13 | | | 11,239,196
| | | | 11,239,196
| | |
| | 15,169,000 | | | Devon Energy Corporation
0.31% due 07/10/13 | | | 15,159,856
| | | | 15,157,940
| | |
| | 21,274,000 | | | Dominion Resources
0.30% due 05/22/13 | | | 21,270,277
| | | | 21,270,277
| | |
| | 11,481,000 | | | Dominion Resources
0.30% due 06/19/13 | | | 11,476,312
| | | | 11,476,312
| | |
See Notes to Financial Statements.
FIRST EAGLE FUNDS | SEMI-ANNUAL REPORT | APRIL 30, 2013
58
Schedule of Investments | Six-Month Period Ended April 30, 2013 (unaudited)
PRINCIPAL | | DESCRIPTION | | COST (NOTE 1) | | VALUE (NOTE 1) | |
U.S. Commercial Paper — 16.37% — (continued) | | | |
$ | 13,093,000 | | | Duke Energy Corporation
0.33% due 06/03/13 | | $ | 13,089,039
| | | $ | 13,089,039
| | |
| | 10,826,000 | | | Emerson Electric Company
0.11% due 05/23/13 | | | 10,825,272
| | | | 10,825,272
| | |
| | 13,353,000 | | | Emerson Electric Company
0.11% due 05/28/13 | | | 13,351,898
| | | | 13,351,898
| | |
| | 8,320,000 | | | Emerson Electric Company
0.11% due 06/13/13 | | | 8,318,907
| | | | 8,318,907
| | |
| | 15,001,000 | | | Google, Inc.
0.06% due 06/25/13 | | | 14,999,625
| | | | 14,999,625
| | |
| | 18,523,000 | | | Google, Inc.
0.10% due 07/16/13 | | | 18,519,089
| | | | 18,517,849
| | |
| | 10,884,000 | | | Google, Inc.
0.11% due 05/30/13 | | | 10,883,036
| | | | 10,883,036
| | |
| | 14,419,000 | | | Google, Inc.
0.12% due 06/04/13 | | | 14,417,366
| | | | 14,417,366
| | |
| | 4,793,000 | | | Google, Inc.
0.15% due 05/02/13 | | | 4,792,980
| | | | 4,792,980
| | |
| | 11,190,000 | | | Google, Inc.
0.18% due 05/02/13 | | | 11,189,944
| | | | 11,189,944
| | |
| | 11,861,000 | | | Honeywell International, Inc.
0.12% due 05/13/13 | | | 11,860,526
| | | | 11,860,526
| | |
| | 10,826,000 | | | Honeywell International, Inc.
0.12% due 05/14/13 | | | 10,825,531
| | | | 10,825,531
| | |
| | 18,279,000 | | | Honeywell International, Inc.
0.13% due 06/21/13 | | | 18,275,634
| | | | 18,275,634
| | |
| | 32,586,000 | | | Honeywell International, Inc.
0.15% due 06/24/13 | | | 32,578,668
| | | | 32,578,668
| | |
| | 24,421,000 | | | Johnson & Johnson
0.05% due 05/22/13 | | | 24,420,288
| | | | 24,420,288
| | |
| | 22,166,000 | | | Johnson & Johnson
0.06% due 05/06/13 | | | 22,165,815
| | | | 22,165,815
| | |
| | 29,555,000 | | | Johnson & Johnson
0.06% due 05/07/13 | | | 29,554,704
| | | | 29,554,704
| | |
| | 27,255,000 | | | Johnson & Johnson
0.06% due 05/08/13 | | | 27,254,682
| | | | 27,254,682
| | |
| | 17,792,000 | | | Johnson & Johnson
0.08% due 06/06/13 | | | 17,790,577
| | | | 17,790,577
| | |
| | 17,792,000 | | | Johnson & Johnson
0.08% due 06/07/13 | | | 17,790,537
| | | | 17,790,537
| | |
| | 9,420,000 | | | Kimberly Clark
0.10% due 05/06/13 | | | 9,419,869
| | | | 9,419,869
| | |
See Notes to Financial Statements.
FIRST EAGLE FUNDS | SEMI-ANNUAL REPORT | APRIL 30, 2013
59
PRINCIPAL | | DESCRIPTION | | COST (NOTE 1) | | VALUE (NOTE 1) | |
U.S. Commercial Paper — 16.37% — (continued) | | | |
$ | 7,525,000 | | | Kimberly Clark
0.10% due 05/13/13 | | $ | 7,524,749
| | | $ | 7,524,749
| | |
| | 12,186,000 | | | Kimberly Clark
0.11% due 06/03/13 | | | 12,184,771
| | | | 12,184,771
| | |
| | 14,311,000 | | | Merck & Company, Inc.
0.08% due 05/14/13 | | | 14,310,587
| | | | 14,310,587
| | |
| | 14,311,000 | | | Merck & Company, Inc.
0.08% due 05/17/13 | | | 14,310,491
| | | | 14,310,491
| | |
| | 19,277,000 | | | Merck & Company, Inc.
0.11% due 06/17/13 | | | 19,274,232
| | | | 19,274,232
| | |
| | 19,277,000 | | | Merck & Company, Inc.
0.11% due 06/19/13 | | | 19,274,114
| | | | 19,274,114
| | |
| | 28,436,000 | | | Merck & Company, Inc.
0.12% due 05/14/13 | | | 28,434,768
| | | | 28,434,768
| | |
| | 22,990,000 | | | Merck & Company, Inc.
0.12% due 05/16/13 | | | 22,988,850
| | | | 22,988,850
| | |
| | 10,777,000 | | | MetLife
0.13% due 06/03/13 | | | 10,775,716
| | | | 10,775,716
| | |
| | 10,503,000 | | | MetLife
0.14% due 06/06/13 | | | 10,501,530
| | | | 10,501,530
| | |
| | 14,136,000 | | | MetLife
0.14% due 06/12/13 | | | 14,133,691
| | | | 14,133,691
| | |
| | 32,929,000 | | | MetLife
0.15% due 05/15/13 | | | 32,927,079
| | | | 32,927,079
| | |
| | 27,014,000 | | | MetLife
0.15% due 05/16/13 | | | 27,012,312
| | | | 27,012,312
| | |
| | 8,914,000 | | | NetJets, Inc.
0.08% due 05/02/13 | | | 8,913,980
| | | | 8,913,980
| | |
| | 13,336,000 | | | Parker-Hannifin Corporation
0.10% due 05/24/13 | | | 13,335,148
| | | | 13,335,148
| | |
| | 13,780,000 | | | Parker-Hannifin Corporation
0.12% due 05/16/13 | | | 13,779,311
| | | | 13,779,311
| | |
| | 10,914,000 | | | Parker-Hannifin Corporation
0.12% due 05/21/13 | | | 10,913,272
| | | | 10,913,272
| | |
| | 12,402,000 | | | Parker-Hannifin Corporation
0.13% due 05/01/13 | | | 12,402,000
| | | | 12,402,000
| | |
| | 15,169,000 | | | PepsiCo, Inc.
0.05% due 05/14/13 | | | 15,168,726
| | | | 15,168,726
| | |
| | 20,003,000 | | | PepsiCo, Inc.
0.05% due 06/12/13 | | | 20,001,833
| | | | 20,001,833
| | |
| | 20,003,000 | | | PepsiCo, Inc.
0.05% due 06/14/13 | | | 20,001,778
| | | | 20,001,778
| | |
See Notes to Financial Statements.
FIRST EAGLE FUNDS | SEMI-ANNUAL REPORT | APRIL 30, 2013
60
Schedule of Investments | Six-Month Period Ended April 30, 2013 (unaudited)
PRINCIPAL | | DESCRIPTION | | COST (NOTE 1) | | VALUE (NOTE 1) | |
U.S. Commercial Paper — 16.37% — (continued) | | | |
$ | 5,460,000 | | | PepsiCo, Inc.
0.05% due 06/19/13 | | $ | 5,459,628
| | | $ | 5,459,628
| | |
| | 13,018,000 | | | PepsiCo, Inc.
0.06% due 05/16/13 | | | 13,017,675
| | | | 13,017,675
| | |
| | 10,914,000 | | | PepsiCo, Inc.
0.06% due 06/07/13 | | | 10,913,327
| | | | 10,913,327
| | |
| | 10,914,000 | | | Philip Morris International, Inc.
0.07% due 05/23/13 | | | 10,913,533
| | | | 10,913,533
| | |
| | 12,377,000 | | | Philip Morris International, Inc.
0.07% due 06/06/13 | | | 12,376,134
| | | | 12,376,134
| | |
| | 11,243,000 | | | Philip Morris International, Inc.
0.08% due 06/13/13 | | | 11,241,926
| | | | 11,241,926
| | |
| | 21,412,000 | | | Philip Morris International, Inc.
0.08% due 06/14/13 | | | 21,409,906
| | | | 21,409,906
| | |
| | 8,977,000 | | | Philip Morris International, Inc.
0.09% due 06/17/13 | | | 8,975,945
| | | | 8,975,945
| | |
| | 16,874,000 | | | Philip Morris International, Inc.
0.09% due 07/22/13 | | | 16,870,541
| | | | 16,864,468
| | |
| | 8,437,000 | | | Philip Morris International, Inc.
0.09% due 07/25/13 | | | 8,435,207
| | | | 8,432,021
| | |
| | 12,094,000 | | | Philip Morris International, Inc.
0.12% due 06/05/13 | | | 12,092,589
| | | | 12,092,589
| | |
| | 10,826,000 | | | Philip Morris International, Inc.
0.15% due 05/13/13 | | | 10,825,459
| | | | 10,825,459
| | |
| | 10,682,000 | | | Precision Castparts Corporation
0.15% due 05/01/13 | | | 10,682,000
| | | | 10,682,000
| | |
| | 9,668,000 | | | Proctor & Gamble Company
0.10% due 05/02/13 | | | 9,667,973
| | | | 9,667,973
| | |
| | 18,852,000 | | | Proctor & Gamble Company
0.11% due 05/06/13 | | | 18,851,712
| | | | 18,851,712
| | |
| | 21,484,000 | | | Proctor & Gamble Company
0.13% due 05/20/13 | | | 21,482,526
| | | | 21,482,526
| | |
| | 19,135,000 | | | Schlumberger Investments SA
0.17% due 07/24/13 | | | 19,127,410
| | | | 19,123,840
| | |
| | 12,757,000 | | | Syngenta Wilmington, Inc.
0.16% due 07/22/13 | | | 12,752,351
| | | | 12,749,794
| | |
| | 15,169,000 | | | United Healthcare Company
0.30% due 06/17/13 | | | 15,163,059
| | | | 15,163,059
| | |
| | 31,232,000 | | | United Healthcare Company
0.31% due 06/05/13 | | | 31,222,587
| | | | 31,222,587
| | |
| | 27,960,000 | | | United Parcel Service, Inc.
0.07% due 06/14/13 | | | 27,957,608
| | | | 27,957,608
| | |
See Notes to Financial Statements.
FIRST EAGLE FUNDS | SEMI-ANNUAL REPORT | APRIL 30, 2013
61
PRINCIPAL | | DESCRIPTION | | COST (NOTE 1) | | VALUE (NOTE 1) | |
U.S. Commercial Paper — 16.37% — (continued) | | | |
$ | 4,201,000 | | | Verizon Communications, Inc.
0.24% due 05/06/13 | | $ | 4,200,860
| | | $ | 4,200,860
| | |
| | 10,414,000 | | | Verizon Communications, Inc.
0.26% due 05/16/13 | | | 10,412,872
| | | | 10,412,872
| | |
| | 6,945,000 | | | Verizon Communications, Inc.
0.27% due 05/06/13 | | | 6,944,740
| | | | 6,944,740
| | |
| | 12,604,000 | | | Viacom, Inc.
0.27% due 05/03/13 | | | 12,603,811
| | | | 12,603,811
| | |
| | 13,321,000 | | | Wal-Mart Stores, Inc.
0.08% due 05/20/13 | | | 13,320,438
| | | | 13,320,438
| | |
| | 16,703,000 | | | Wal-Mart Stores, Inc.
0.08% due 05/21/13 | | | 16,702,258
| | | | 16,702,258
| | |
| | 13,231,000 | | | Wal-Mart Stores, Inc.
0.10% due 06/11/13 | | | 13,229,493
| | | | 13,229,493
| | |
| | 45,164,000 | | | Wal-Mart Stores, Inc.
0.13% due 06/10/13 | | | 45,157,476
| | | | 45,157,476
| | |
| | 42,779,000 | | | Wal-Mart Stores, Inc.
0.13% due 06/11/13 | | | 42,772,666
| | | | 42,772,666
| | |
| | 10,914,000 | | | Walt Disney Company
0.08% due 05/24/13 | | | 10,913,442
| | | | 10,913,442
| | |
| | 12,156,000 | | | Walt Disney Company
0.10% due 06/03/13 | | | 12,154,886
| | | | 12,154,886
| | |
| | 12,156,000 | | | Walt Disney Company
0.11% due 06/18/13 | | | 12,154,217
| | | | 12,154,217
| | |
| | 12,156,000 | | | Walt Disney Company
0.12% due 06/19/13 | | | 12,154,015
| | | | 12,154,015
| | |
| | 13,128,000 | | | Walt Disney Company
0.12% due 06/20/13 | | | 13,125,812
| | | | 13,125,812
| | |
| | 12,851,000 | | | Walt Disney Company
0.12% due 07/11/13 | | | 12,847,958
| | | | 12,847,145
| | |
| | 13,360,000 | | | WellPoint, Inc.
0.22% due 05/10/13 | | | 13,359,265
| | | | 13,359,265
| | |
| | 12,367,000 | | | WellPoint, Inc.
0.22% due 06/06/13 | | | 12,364,279
| | | | 12,364,279
| | |
| | 14,260,000 | | | WellPoint, Inc.
0.23% due 06/03/13 | | | 14,256,994
| | | | 14,256,994
| | |
| | 11,656,000 | | | WellPoint, Inc.
0.24% due 05/13/13 | | | 11,655,068
| | | | 11,655,068
| | |
See Notes to Financial Statements.
FIRST EAGLE FUNDS | SEMI-ANNUAL REPORT | APRIL 30, 2013
62
Schedule of Investments | Six-Month Period Ended April 30, 2013 (unaudited)
PRINCIPAL | | DESCRIPTION | | COST (NOTE 1) | | VALUE (NOTE 1) | |
U.S. Commercial Paper — 16.37% — (continued) | |
$ | 6,188,000 | | | WellPoint, Inc.
0.26% due 06/14/13 | | $ | 6,186,034
| | | $ | 6,186,034
| | |
Total U.S. Commercial Paper | | | 2,183,846,070 | | | | 2,183,833,595 | | |
Total Commercial Paper | | | 3,124,957,651 | | | | 3,124,936,038 | | |
Total Investments — 99.12% | | $ | 10,644,944,833 | | | | 13,225,430,040 | | |
Other Assets in Excess of Liabilities — 0.88% | | | | | 117,670,016 | | |
Net Assets — 100.00% | | | | $ | 13,343,100,056 | | |
(a) An affiliate of the Fund as defined by the Investment Company Act of 1940. An affiliate is defined as a company in which the Fund directly or indirectly owns, controls, or holds power to vote 5% or more of the outstanding voting securities.
(b) Non-income producing security/commodity.
(c) Security is deemed illiquid. At April 30, 2013, the value of these securities amounted to $79,899,178 or 0.60% of net assets.
(d) Represents securities that are subject to legal or contractual restrictions on resale. At April 30, 2013, the value of these securities amounted to $81,754,209 or 0.61% of net assets.
(e) Represents variable voting shares.
(f) Securities valued in accordance with fair value procedures under the supervision of the Board of Trustees, representing $69,596,703 or 0.52% of net assets.
(g) Represents non-voting class of shares.
(h) Held through Financiere Bleue, LLC, wholly owned subsidiary and disregarded entity for U.S. tax purposes.
(i) Payment-in-kind security.
(j) Floating rate security. Rate shown is the rate in effect at April 30, 2013.
At April 30, 2013, cost is substantially identical for both book and federal income tax purposes. Net unrealized appreciation consisted of:
Gross unrealized appreciation | | $ | 3,137,710,474 | | |
Gross unrealized depreciation | | | (557,225,267 | ) | |
Net unrealized appreciation | | $ | 2,580,485,207 | | |
Abbreviations used in this schedule include:
ADR — American Depository Receipt
FRN — Floating Rate Note
NVDR — Non-Voting Depository Receipt
PCL — Public Company Limited
PLC — Public Limited Company
RSP — Represents Non-Voting Shares
See Notes to Financial Statements.
FIRST EAGLE FUNDS | SEMI-ANNUAL REPORT | APRIL 30, 2013
63
Currencies
EUR — Euro
USD — United States Dollar
RESTRICTED SECURITIES | | ACQUISITION
DATE | | COST | | CARRYING VALUE PER
SHARE/PRINCIPAL | |
Catalyst Paper Corporation | | 09/17/12 | | $ | 27,586,952 | | | $ | 2.00 | | |
Catalyst Paper Corporation
11.00% due 10/30/17 | | 09/17/12 | | | 26,384,136 | | | | 0.77 | | |
Emin Leydier SA FRN
7.32% due 07/31/16 | | 07/30/09 | | | 14,285,831 | | | | 1.32 | | |
FINEL 9.50% due 06/30/17 | | 06/22/05 | | | 9,659,548 | | | | 0.99 | | |
FINEL | | 07/14/99 | | | 9,166,547 | | | | 0.47 | | |
Legris Industries SA | | 04/30/04 | | | 23,119,325 | | | | 28.58 | | |
Foreign Currency Exchange Contracts — Sales
SETTLEMENT
DATES
THROUGH | | FOREIGN CURRENCY
TO BE DELIVERED | | U.S. $
TO BE
RECEIVED | | U.S. $ VALUE
AT APRIL 30,
2013 | | UNREALIZED
APPRECIATION
AT APRIL 30,
2013 | | UNREALIZED
DEPRECIATION
AT APRIL 30,
2013 | |
06/19/13 | | | 78,917,000 | | | Euro | | $ | 102,524,830 | | | $ | 103,961,662 | | | $ | — | | | $ | (1,436,832 | ) | |
07/17/13 | | | 120,465,000 | | | Euro | | | 157,473,053 | | | | 158,726,126 | | | | — | | | | (1,253,073 | ) | |
08/21/13 | | | 190,191,000 | | | Euro | | | 249,725,828 | | | | 250,592,788 | | | | — | | | | (866,960 | ) | |
09/18/13 | | | 71,465,000 | | | Euro | | | 93,451,207 | | | | 94,209,401 | | | | — | | | | (758,194 | ) | |
10/16/13 | | | 68,752,000 | | | Euro | | | 90,327,409 | | | | 90,653,487 | | | | — | | | | (326,078 | ) | |
06/19/13 | | | 17,293,525,000 | | | Japanese Yen | | | 207,822,131 | | | | 177,439,631 | | | | 30,382,500 | | | | — | | |
07/17/13 | | | 27,997,682,000 | | | Japanese Yen | | | 319,282,035 | | | | 287,318,560 | | | | 31,963,475 | | | | — | | |
08/21/13 | | | 43,088,687,000 | | | Japanese Yen | | | 491,116,659 | | | | 442,191,685 | | | | 48,924,974 | | | | — | | |
09/18/13 | | | 29,791,842,000 | | | Japanese Yen | | | 311,125,706 | | | | 305,871,630 | | | | 5,254,076 | | | | — | | |
10/16/13 | | | 8,383,194,000 | | | Japanese Yen | | | 84,382,961 | | | | 86,088,277 | | | | — | | | | (1,705,316 | ) | |
| | | | | | | $ | 2,107,231,819 | | | $ | 1,997,053,247 | | | $ | 116,525,025 | | | $ | (6,346,453 | ) | |
Foreign Currency Exchange Contracts — Purchases
SETTLEMENT
DATES
THROUGH | | FOREIGN CURRENCY
TO BE RECEIVED | | U.S. $
TO BE
DELIVERED | | U.S. $ VALUE
AT APRIL 30,
2013 | | UNREALIZED
APPRECIATION
AT APRIL 30,
2013 | | UNREALIZED
DEPRECIATION
AT APRIL 30,
2013 | |
07/17/13 | | | 13,885,236,000 | | | Japanese Yen | | $ | 152,802,461 | | | $ | 142,493,440 | | | $ | — | | | $ | (10,309,021 | ) | |
See Notes to Financial Statements.
FIRST EAGLE FUNDS | SEMI-ANNUAL REPORT | APRIL 30, 2013
64
Schedule of Investments | Six-Month Period Ended April 30, 2013 (unaudited)
Affiliated Securities
AFFILIATED
SECURITIES | | SHARES
OCTOBER 31,
2012 | | GROSS
ADDITIONS | | GROSS
REDUCTIONS | | SHARES
APRIL 30,
2013 | | MARKET VALUE
APRIL 30,
2013 | | REALIZED
GAIN/(LOSS) | | DIVIDEND
INCOME | |
As One
Corporation | | | 1,286,140 | | | | — | | | | — | | | | 1,286,140 | | | $ | 30,345,865 | | | $ | — | | | $ | 379,596 | | |
Catalyst
Paper
Corporation | | | 1,217,500 | | | | 49,335 | | | | — | | | | 1,266,835 | | | | 2,533,670 | | | | — | | | | — | | |
Chofu
Seisakusho
Company
Limited | | | 2,023,800 | | | | — | | | | — | | | | 2,023,800 | | | | 46,817,164 | | | | — | | | | 329,023 | | |
FINEL | | | 11,593,581 | | | | — | | | | — | | | | 11,593,581 | | | | 5,491,111 | | | | — | | | | — | | |
Fursys, Inc. | | | 872,463 | | | | — | | | | — | | | | 872,463 | | | | 21,152,059 | | | | — | | | | 444,298 | | |
Haw Par
Corporation
Limited | | | 23,192,830 | | | | — | | | | — | | | | 23,192,830 | | | | 145,989,910 | | | | — | | | | — | | |
Japan Wool
Textile
Company
Limited | | | 6,577,300 | | | | — | | | | — | | | | 6,577,300 | | | | 56,695,632 | | | | — | | | | 745,692 | | |
Jumbo SA | | | 10,722,438 | | | | — | | | | 977,676 | | | | 9,744,762 | | | | 91,667,925 | | | | 2,914,091 | | | | — | | |
Laurent-
Perrier | | | 558,938 | | | | — | | | | — | | | | 558,938 | | | | 45,225,031 | | | | — | | | | — | | |
Legris
Industries
SA# | | | 896,416 | | | | — | | | | — | | | | 896,416 | | | | 25,615,896 | | | | — | | | | — | | |
Maezawa
Kasei
Industries
Company
Limited | | | 2,068,330 | | | | — | | | | — | | | | 2,068,330 | | | | 22,768,272 | | | | — | | | | 254,356 | | |
Matsumoto
Yushi-
Seiyaku
Company
Limited* | | | 974,746 | | | | — | | | | 974,746 | | | | — | | | | — | | | | (3,511,090 | ) | | | — | | |
Nagaileben
Company
Limited | | | 2,013,324 | | | | — | | | | 2,200 | | | | 2,011,124 | | | | 34,362,156 | | | | 9,930 | | | | — | | |
Nitto Kohki
Company
Limited | | | 2,657,590 | | | | — | | | | 171,930 | | | | 2,485,660 | | | | 47,285,245 | | | | (363,197 | ) | | | 419,534 | | |
Robertet SA | | | 235,837 | | | | — | | | | — | | | | 235,837 | | | | 44,056,483 | | | | — | | | | — | | |
Shingakukai
Company
Limited* | | | 1,305,700 | | | | — | | | | 1,185,500 | | | | 120,200 | | | | 421,344 | | | | (4,187,925 | ) | | | 28,911 | | |
T. Hasegawa
Company
Limited | | | 3,206,911 | | | | — | | | | — | | | | 3,206,911 | | | | 47,233,445 | | | | — | | | | 315,574 | | |
Wienerberger
AG | | | 5,915,786 | | | | — | | | | — | | | | 5,915,786 | | | | 72,771,980 | | | | — | | | | — | | |
See Notes to Financial Statements.
FIRST EAGLE FUNDS | SEMI-ANNUAL REPORT | APRIL 30, 2013
65
Affiliated Securities — (continued)
AFFILIATED
SECURITIES | | SHARES
OCTOBER 31,
2012 | | GROSS
ADDITIONS | | GROSS
REDUCTIONS | | SHARES
APRIL 30,
2013 | | MARKET VALUE
APRIL 30,
2013 | | REALIZED
GAIN/(LOSS) | | DIVIDEND
INCOME | |
Yomeishu
Seizo
Company
Limited | | | 2,535,900 | | | | — | | | | — | | | | 2,535,900 | | | $ | 22,457,004 | | | $ | — | | | $ | 448,863 | | |
Total | | | | | | | | | | $ | 762,890,192 | | | $ | (5,138,191 | ) | | $ | 3,365,847 | | |
* Represents an unaffiliated issuer as of April 30, 2013, as such, amounts represented above will not agree to balances in the Statements of Assets and Liabilities and Statements of Operations.
# Formerly known as Fregate.
INDUSTRY DIVERSIFICATION FOR PORTFOLIO HOLDINGS | | PERCENT OF
NET ASSETS | |
International Common Stocks | |
Consumer Discretionary | | | 9.03 | % | |
Consumer Staples | | | 7.83 | | |
Energy | | | 4.80 | | |
Financials | | | 10.24 | | |
Health Care | | | 6.19 | | |
Industrials | | | 13.09 | | |
Information Technology | | | 5.18 | | |
Materials | | | 11.12 | | |
Telecommunication Services | | | 1.76 | | |
Utilities | | | 0.67 | | |
Total International Common Stocks | | | 69.91 | | |
U.S. Common Stocks | |
Materials | | | 0.17 | | |
Total U.S. Common Stocks | | | 0.17 | | |
International Preferred Stocks | |
Consumer Discretionary | | | 0.58 | | |
Consumer Staples | | | 0.06 | | |
Information Technology | | | 0.23 | | |
Total International Preferred Stocks | | | 0.87 | | |
Right | | | 0.00 | | |
See Notes to Financial Statements.
FIRST EAGLE FUNDS | SEMI-ANNUAL REPORT | APRIL 30, 2013
66
Schedule of Investments | Six-Month Period Ended April 30, 2013 (unaudited)
INDUSTRY DIVERSIFICATION FOR PORTFOLIO HOLDINGS — (CONTINUED) | | PERCENT OF
NET ASSETS | |
Commodity | | | 4.37% | | |
Term Loans | | | 0.08 | | |
International Corporate Bonds | |
Financials | | | 0.08 | | |
Materials | | | 0.22 | | |
Total International Corporate Bonds | | | 0.30 | | |
Commercial Paper | |
International Commercial Paper | | | 7.05 | | |
U.S. Commercial Paper | | | 16.37 | | |
Total Commercial Paper | | | 23.42 | | |
Total Investments | | | 99.12 | % | |
See Notes to Financial Statements.
FIRST EAGLE FUNDS | SEMI-ANNUAL REPORT | APRIL 30, 2013
67

Fund Overview | Data as of April 30, 2013 (unaudited)
INVESTMENT OBJECTIVE
First Eagle U.S. Value Fund seeks long-term growth of capital by investing, under normal market conditions, at least 80% of its assets in domestic equity and debt securities. Management utilizes a highly disciplined, bottom-up, value-oriented approach in achieving its investment objective.
Average Annual Returns | |
| | | ONE-YEAR | | FIVE-YEARS | | TEN-YEARS | |
First Eagle U.S. Value
Fund (A Shares) | |
without sales charge | | | 9.91 | % | | | 6.09 | % | | | 9.81 | % | |
with sales charge | | | 4.41 | | | | 5.00 | | | | 9.25 | | |
Standard & Poor's
500 Index | | | 16.89 | | | | 5.21 | | | | 7.88 | | |
Consumer Price Index | | | 1.06 | | | | 1.60 | | | | 2.38 | | |
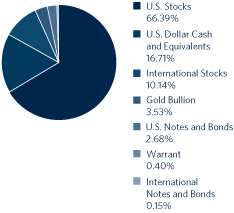
Sector/Industry** | |
Financials | | | 17.56 | % | |
Information Technology | | | 15.74 | | |
Industrials | | | 10.61 | | |
Materials | | | 9.06 | | |
Energy | | | 8.14 | | |
Consumer Staples | | | 6.13 | | |
Consumer Discretionary | | | 5.87 | | |
Commodity | | | 3.53 | | |
Health Care | | | 3.40 | | |
Utilities | | | 2.85 | | |
Warrant | | | 0.40 | | |
* Asset Allocation and Sector/Industry percentages are based on total investments in the portfolio.
** Sector/Industry allocations exclude short term investments.
The Fund's portfolio composition is subject to change at any time.
FIRST EAGLE FUNDS | SEMI-ANNUAL REPORT | APRIL 30, 2013
68
Growth of a $10,000 Initial Investment
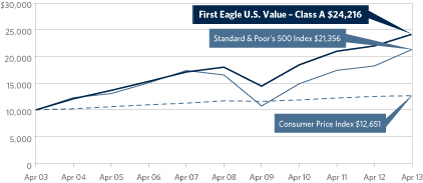
Performance data quoted herein represents past performance and should not be considered indicative of future results. Performance data quoted herein does not reflect the deduction of taxes that a shareholder would pay on Fund distributions or the sale of Fund shares. The average annual returns shown above are historical and reflect changes in share price, reinvested dividends and are net of expenses.
The average annual returns for Class A Shares with a sales charge gives effect to the deduction of the maximum sales charge of 5.00%.
The Standard & Poor's 500 Index is a widely recognized unmanaged index including a representative sample of 500 leading companies in leading sectors of the U.S. economy and is not available for purchase. Although the Standard & Poor's 500 Index focuses on the large-cap segment of the market, with approximately 75% coverage of U.S. equities, it is also considered a proxy for the total market. The Consumer Price Index (CPI) represents the change in price of all goods and services purchased for consumption by urban households.
Top 10 Holdings* | |
| Gold Bullion (precious metal) | | | 3.54 | % | |
| Comcast Corporation, Class 'A' (U.S. cable/satellite television company) | | | 2.97 | | |
| Intel Corporation (U.S. computer components and related products manufacturer) | | | 2.87 | | |
| Microsoft Corporation (U.S. software developer) | | | 2.87 | | |
| Sysco Corporation (U.S. food services distributor) | | | 2.64 | | |
| Cisco Systems, Inc. (U.S. computer communications company) | | | 2.61 | | |
| Bank of New York Mellon Corporation (U.S. financial services company) | | | 2.30 | | |
| Oracle Corporation (U.S. software developer) | | | 2.15 | | |
| 3M Company (U.S. industrial conglomerate) | | | 2.07 | | |
| Alliant Techsystems, Inc. (U.S. aerospace and defense manufacturer) | | | 2.06 | | |
Total | | | 26.08 | % | |
* Holdings in cash, commercial paper and other short term cash equivalents have been excluded. Percentages are based on total net assets.
FIRST EAGLE FUNDS | SEMI-ANNUAL REPORT | APRIL 30, 2013
69
First Eagle U.S. Value Fund
SHARES | | DESCRIPTION | | COST (NOTE 1) | | VALUE (NOTE 1) | |
Common Stocks — 76.50% | | | |
U.S. Common Stocks — 66.34% | | | |
Consumer Discretionary 5.24% | | | |
| | 2,438,946 | | | Comcast Corporation, Class 'A' | | $ | 44,510,095 | | | $ | 95,826,188 | | |
| | 929,280 | | | Omnicom Group, Inc. | | | 32,253,946 | | | | 55,543,066 | | |
| | 642,257 | | | H&R Block, Inc. | | | 10,866,974 | | | | 17,816,209 | | |
| | 590 | | | St. John Knits International, Inc. (a)(b) | | | 18,290 | | | | 3,274 | | |
| | | | 87,649,305 | | | | 169,188,737 | | |
Consumer Staples 5.97% | | | |
| | 2,440,500 | | | Sysco Corporation | | | 69,941,483 | | | | 85,075,830 | | |
| | 1,287,375 | | | Lorillard, Inc. | | | 40,938,552 | | | | 55,215,514 | | |
| | 271,170 | | | Colgate-Palmolive Company | | | 21,838,388 | | | | 32,380,409 | | |
| | 257,451 | | | Wal-Mart Stores, Inc. | | | 12,385,227 | | | | 20,009,092 | | |
| | | | 145,103,650 | | | | 192,680,845 | | |
Energy 4.98% | | | |
| | 1,017,408 | | | ConocoPhillips | | | 46,509,238 | | | | 61,502,314 | | |
| | 872,238 | | | Devon Energy Corporation | | | 49,706,372 | | | | 48,025,424 | | |
| | 1,033,843 | | | San Juan Basin Royalty Trust | | | 20,806,015 | | | | 15,972,874 | | |
| | 189,445 | | | SEACOR Holdings, Inc. | | | 12,151,359 | | | | 13,660,879 | | |
| | 182,753 | | | Apache Corporation | | | 12,681,438 | | | | 13,501,792 | | |
| | 94,454 | | | Helmerich & Payne, Inc. | | | 1,871,008 | | | | 5,536,894 | | |
| | 109,071 | | | Era Group, Inc. (a) | | | 1,826,871 | | | | 2,492,272 | | |
| | | | 145,552,301 | | | | 160,692,449 | | |
Financials 16.71% | | | |
| | 2,634,204 | | | Bank of New York Mellon Corporation | | | 64,331,532 | | | | 74,337,237 | | |
| | 362 | | | Berkshire Hathaway, Inc., Class 'A' (a) | | | 35,598,996 | | | | 57,558,000 | | |
| | 1,114,598 | | | Cincinnati Financial Corporation | | | 29,539,601 | | | | 54,514,988 | | |
| | 725,973 | | | American Express Company | | | 22,615,997 | | | | 49,663,813 | | |
| | 1,570,669 | | | Weyerhaeuser Company, REIT | | | 25,069,761 | | | | 47,921,111 | | |
| | 117,066 | | | Alleghany Corporation (a) | | | 34,293,700 | | | | 46,093,567 | | |
| | 1,487,386 | | | BB&T Corporation | | | 37,879,375 | | | | 45,766,867 | | |
| | 753,107 | | | Plum Creek Timber Company, Inc., REIT | | | 26,873,535 | | | | 38,815,135 | | |
| | 1,133,543 | | | U.S. Bancorp | | | 28,174,022 | | | | 37,724,311 | | |
| | 671,735 | | | WR Berkley Corporation | | | 18,780,775 | | | | 29,166,734 | | |
| | 370,729 | | | Rayonier, Inc., REIT | | | 8,796,435 | | | | 22,028,717 | | |
| | 111,272 | | | Visa, Inc., Class 'A' | | | 8,072,605 | | | | 18,744,881 | | |
| | 30,859 | | | Mastercard, Inc., Class 'A' | | | 7,849,654 | | | | 17,062,867 | | |
| | | | 347,875,988 | | | | 539,398,228 | | |
See Notes to Financial Statements.
FIRST EAGLE FUNDS | SEMI-ANNUAL REPORT | APRIL 30, 2013
70
Schedule of Investments | Six-Month Period Ended April 30, 2013 (unaudited)
SHARES | | DESCRIPTION | | COST (NOTE 1) | | VALUE (NOTE 1) | |
U.S. Common Stocks — 66.34% — (continued) | | | |
Health Care 2.07% | | | |
| | 717,380 | | | WellPoint, Inc. | | $ | 40,049,472 | | | $ | 52,311,350 | | |
| | 169,270 | | | Johnson & Johnson | | | 10,123,420 | | | | 14,426,882 | | |
| | | | 50,172,892 | | | | 66,738,232 | | |
Industrials 9.42% | | | |
| | 636,940 | | | 3M Company | | | 47,534,193 | | | | 66,693,987 | | |
| | 893,622 | | | Alliant Techsystems, Inc. | | | 58,961,742 | | | | 66,449,732 | | |
| | 1,219,970 | | | Cintas Corporation | | | 36,915,327 | | | | 54,740,054 | | |
| | 655,085 | | | Northrop Grumman Corporation | | | 38,909,740 | | | | 49,616,138 | | |
| | 439,695 | | | Lockheed Martin Corporation | | | 31,929,898 | | | | 43,569,377 | | |
| | 887,051 | | | Insteel Industries, Inc. | | | 9,879,258 | | | | 14,707,306 | | |
| | 88,540 | | | Unifirst Corporation | | | 2,161,593 | | | | 8,061,567 | | |
| | | | 226,291,751 | | | | 303,838,161 | | |
Information Technology 15.77% | | | |
| | 3,868,819 | | | Intel Corporation | | | 78,061,376 | | | | 92,658,215 | | |
| | 2,793,554 | | | Microsoft Corporation | | | 71,708,716 | | | | 92,466,637 | | |
| | 4,023,927 | | | Cisco Systems, Inc. | | | 68,110,657 | | | | 84,180,553 | | |
| | 2,117,125 | | | Oracle Corporation | | | 60,350,391 | | | | 69,399,358 | | |
| | 1,267,360 | | | Linear Technology Corporation | | | 34,323,276 | | | | 46,258,640 | | |
| | 1,840,310 | | | Rofin-Sinar Technologies, Inc. (a)(c) | | | 42,514,481 | | | | 45,823,719 | | |
| | 43,456 | | | Google, Inc., Class 'A' (a) | | | 23,794,562 | | | | 35,832,514 | | |
| | 353,471 | | | Automatic Data Processing, Inc. | | | 13,637,378 | | | | 23,802,737 | | |
| | 330,702 | | | Texas Instruments, Inc. | | | 9,079,788 | | | | 11,974,719 | | |
| | 186,729 | | | NetApp, Inc. (a) | | | 5,919,005 | | | | 6,514,975 | | |
| | | | 407,499,630 | | | | 508,912,067 | | |
Materials 3.32% | | | |
| | 672,467 | | | Scotts Miracle-Gro Company, Class 'A' | | | 29,427,519 | | | | 30,496,379 | | |
| | 255,880 | | | Martin Marietta Materials, Inc. | | | 22,000,503 | | | | 25,841,321 | | |
| | 477,672 | | | Vulcan Materials Company | | | 19,201,638 | | | | 23,826,279 | | |
| | 598,612 | | | Newmont Mining Corporation | | | 29,016,804 | | | | 19,395,029 | | |
| | 123,219 | | | Deltic Timber Corporation | | | 6,140,201 | | | | 7,698,723 | | |
| | | | 105,786,665 | | | | 107,257,731 | | |
Utilities 2.86% | | | |
| | 1,184,103 | | | FirstEnergy Corporation | | | 45,783,800 | | | | 55,179,200 | | |
| | 371,420 | | | Entergy Corporation | | | 24,857,694 | | | | 26,456,247 | | |
| | 216,687 | | | IDACorp, Inc. | | | 6,780,723 | | | | 10,663,167 | | |
| | | | 77,422,217 | | | | 92,298,614 | | |
Total U.S. Common Stocks | | | 1,593,354,399 | | | | 2,141,005,064 | | |
See Notes to Financial Statements.
FIRST EAGLE FUNDS | SEMI-ANNUAL REPORT | APRIL 30, 2013
71
SHARES | | DESCRIPTION | | COST (NOTE 1) | | VALUE (NOTE 1) | |
International Common Stocks — 10.16% | | | |
Australia 0.98% | | | |
| | 1,809,486 | | | Newcrest Mining Limited | | $ | 53,672,463 | | | $ | 31,518,560 | | |
Canada 5.65% | | | |
| | 1,652,700 | | | Canadian Natural Resources Limited | | | 47,541,442 | | | | 48,478,544 | | |
| 1,120,206 | | | Potash Corporation of
Saskatchewan, Inc. | | | 44,147,451 | | | | 47,160,673 | | |
| | 1,162,733 | | | Goldcorp, Inc. | | | 36,611,910 | | | | 34,393,642 | | |
| | 2,917,406 | | | Penn West Petroleum Limited | | | 43,744,708 | | | | 26,927,657 | | |
| | 767,100 | | | Agnico-Eagle Mines Limited | | | 36,175,285 | | | | 24,762,847 | | |
| | 354,331 | | | Catalyst Paper Corporation (a)(b)(d) | | | 6,095 | | | | 708,662 | | |
| | | | 208,226,891 | | | | 182,432,025 | | |
France 1.34% | | | |
| | 808,762 | | | Sanofi, ADR | | | 30,754,162 | | | | 43,147,453 | | |
Mexico 0.74% | | | |
| | 1,339,700 | | | Fresnillo PLC | | | 28,987,353 | | | | 23,972,600 | | |
South Africa 0.57% | | | |
| | 2,246,380 | | | Gold Fields Limited, ADR | | | 26,932,492 | | | | 16,757,995 | | |
| | 433,085 | | | Sibanye Gold Limited, ADR (a) | | | 3,555,254 | | | | 1,667,377 | | |
| | | | 30,487,746 | | | | 18,425,372 | | |
United Kingdom 0.88% | | | |
| | 714,063 | | | Willis Group Holdings PLC | | | 20,724,473 | | | | 28,334,020 | | |
Total International Common Stocks | | | 372,853,088 | | | | 327,830,030 | | |
Total Common Stocks | | | 1,966,207,487 | | | | 2,468,835,094 | | |
U.S. Preferred Stock — 0.17% | | | |
Consumer Staples 0.17% | | | |
| | 168,915 | | | Seneca Foods Corporation,
Series '2003' (a)(b)(e)(f) | | | 2,542,171
| | | | 5,504,940
| | |
Warrant — 0.40% | | | |
United States 0.40% | | | |
| | 939,766 | | | JPMorgan Chase & Company
Warrant expire 10/28/18 (a) | | | 11,329,284
| | | | 13,015,759
| | |
OUNCES | | | | | | | |
Commodity — 3.54% | | | |
| | 77,345 | | | Gold bullion (a) | | | 89,045,569 | | | | 114,156,844 | | |
See Notes to Financial Statements.
FIRST EAGLE FUNDS | SEMI-ANNUAL REPORT | APRIL 30, 2013
72
Schedule of Investments | Six-Month Period Ended April 30, 2013 (unaudited)
PRINCIPAL | | DESCRIPTION | | COST (NOTE 1) | | VALUE (NOTE 1) | |
Bonds — 2.83% | | | |
International Corporate Bond — 0.15% | | | |
Canada 0.15% | | | |
| 6,181,818
USD | | | Catalyst Paper Corporation
11.00% due 10/30/17 (d)(g) | | $ | 7,594,211
| | | $ | 4,790,909
| | |
U.S. Convertible Bond — 1.02% | | | |
$ | 32,480,000 | | | Advanced Micro Devices, Inc.
6.00% due 05/01/15 (h) | | | 30,628,700
| | | | 32,967,200
| | |
U.S. Corporate Bonds — 1.66% | | | |
| | 600,000 | | | Bausch & Lomb, Inc.
7.125% due 08/01/28 (b) | | | 521,214
| | | | 558,000
| | |
| | 23,411,000 | | | Citgo Petroleum Corporation
11.50% due 07/01/17 (i) | | | 25,547,904
| | | | 27,039,705
| | |
| | 5,975,000 | | | Mueller Water Products, Inc.
7.375% due 06/01/17 | | | 5,088,722
| | | | 6,169,187
| | |
| | 13,785,000 | | | New Albertsons, Inc.
7.25% due 05/01/13 | | | 13,785,000
| | | | 13,785,000
| | |
| | 5,877,000 | | | Yankee Candle Company, Inc.
Series 'B' 9.75% due 02/15/17 | | | 5,873,302
| | | | 6,104,793
| | |
Total U.S. Corporate Bonds | | | 50,816,142 | | | | 53,656,685 | | |
Total Bonds | | | 89,039,053 | | | | 91,414,794 | | |
Commercial Paper — 16.74% | | | |
International Commercial Paper — 5.37% | | | |
Canada 0.42% | | | |
| | 4,044,000 | | | Canadian Natural Resources Limited
USD0.32% due 05/22/13 | | | 4,043,245
| | | | 4,043,245
| | |
| | 741,000 | | | Canadian Natural Resources Limited
USD0.33% due 05/10/13 | | | 740,939
| | | | 740,939
| | |
| | 936,000 | | | Potash Corporation of Saskatchewan, Inc.
USD0.27% due 05/29/13 | | | 935,803
| | | | 935,803
| | |
| | 2,219,000 | | | Suncor Energy, Inc.
USD0.29% due 06/12/13 | | | 2,218,249
| | | | 2,218,249
| | |
| | 2,998,000 | | | Suncor Energy, Inc.
USD0.29% due 06/13/13 | | | 2,996,962
| | | | 2,996,962
| | |
| | 2,556,000 | | | Suncor Energy, Inc.
USD0.29% due 06/24/13 | | | 2,554,888
| | | | 2,554,888
| | |
France 1.44% | | | |
| | 4,897,000 | | | GDF Suez SA
USD0.22% due 07/09/13 | | | 4,894,935
| | | | 4,894,743
| | |
| | 1,647,000 | | | Sanofi
USD0.11% due 06/17/13 | | | 1,646,764
| | | | 1,646,764
| | |
See Notes to Financial Statements.
FIRST EAGLE FUNDS | SEMI-ANNUAL REPORT | APRIL 30, 2013
73
PRINCIPAL | | DESCRIPTION | | COST (NOTE 1) | | VALUE (NOTE 1) | |
International Commercial Paper — 5.37% — (continued) | | | |
France 1.44% — (continued) | | | |
| | 2,642,000 | | | Sanofi
USD0.13% due 06/20/13 | | $ | 2,641,523
| | | $ | 2,641,523
| | |
| | 8,190,000 | | | Sanofi
USD0.13% due 07/15/13 | | | 8,187,782
| | | | 8,187,660
| | |
| | 4,323,000 | | | Sanofi
USD0.14% due 06/25/13 | | | 4,322,075
| | | | 4,322,075
| | |
| | 11,421,000 | | | Total SA
USD0.09% due 05/01/13 | | | 11,421,000
| | | | 11,421,000
| | |
| | 4,410,000 | | | Total SA
USD0.12% due 05/02/13 | | | 4,409,985
| | | | 4,409,985
| | |
| | 3,506,000 | | | Total SA
USD0.12% due 05/22/13 | | | 3,505,755
| | | | 3,505,755
| | |
| | 5,521,000 | | | Total SA
USD0.12% due 06/04/13 | | | 5,520,374
| | | | 5,520,374
| | |
Germany 0.24% | | | |
| | 3,269,000 | | | BASF AG
USD0.11% due 05/29/13 | | | 3,268,720
| | | | 3,268,720
| | |
| | 2,765,000 | | | BASF AG
USD0.13% due 06/18/13 | | | 2,764,521
| | | | 2,764,521
| | |
| | 1,784,000 | | | Siemens Company
USD0.12% due 06/19/13 | | | 1,783,709
| | | | 1,783,709
| | |
Italy 0.12% | | | |
| | 742,000 | | | Eni S.p.A.
USD0.38% due 05/21/13 | | | 741,848
| | | | 741,848
| | |
| | 1,827,000 | | | Eni S.p.A.
USD0.40% due 05/01/13 | | | 1,827,000
| | | | 1,827,000
| | |
| | 1,408,000 | | | Eni S.p.A.
USD0.40% due 05/20/13 | | | 1,407,710
| | | | 1,407,710
| | |
Japan 0.52% | | | |
| | 1,171,000 | | | Hitachi Limited
USD0.31% due 05/23/13 | | | 1,170,778
| | | | 1,170,778
| | |
| | 8,856,000 | | | Honda Corporation
USD0.13% due 05/10/13 | | | 8,855,712
| | | | 8,855,712
| | |
| | 4,721,000 | | | Honda Corporation
USD0.14% due 06/07/13 | | | 4,720,321
| | | | 4,720,321
| | |
| | 1,142,000 | | | Mitsui & Company Limited
USD0.18% due 06/25/13 | | | 1,141,686
| | | | 1,141,686
| | |
| | 714,000 | | | Mitsui & Company Limited
USD0.19% due 07/22/13 | | | 713,691
| | | | 713,597
| | |
See Notes to Financial Statements.
FIRST EAGLE FUNDS | SEMI-ANNUAL REPORT | APRIL 30, 2013
74
Schedule of Investments | Six-Month Period Ended April 30, 2013 (unaudited)
PRINCIPAL | | DESCRIPTION | | COST (NOTE 1) | | VALUE (NOTE 1) | |
International Commercial Paper — 5.37% — (continued) | | | |
Luxembourg 0.08% | | | |
| | 2,556,000 | | | Michelin Luxembourg S.C.S.
USD0.25% due 05/23/13 | | $ | 2,555,609
| | | $ | 2,555,609
| | |
Switzerland 0.96% | | | |
| | 5,777,000 | | | Nestlé SA
USD0.12% due 05/08/13 | | | 5,776,865
| | | | 5,776,865
| | |
| | 6,098,000 | | | Nestlé SA
USD0.12% due 05/09/13 | | | 6,097,837
| | | | 6,097,837
| | |
| | 1,104,000 | | | Nestlé SA
USD0.12% due 05/15/13 | | | 1,103,948
| | | | 1,103,948
| | |
| | 1,827,000 | | | Nestlé SA
USD0.12% due 06/05/13 | | | 1,826,787
| | | | 1,826,787
| | |
| | 3,951,000 | | | Nestlé SA
USD0.14% due 06/04/13 | | | 3,950,478
| | | | 3,950,478
| | |
| | 1,694,000 | | | Nestlé SA
USD0.14% due 06/11/13 | | | 1,693,730
| | | | 1,693,730
| | |
| | 421,000 | | | Nestlé SA
USD0.14% due 07/09/13 | | | 420,887
| | | | 420,915
| | |
| | 3,566,000 | | | Nestlé SA
USD0.15% due 06/03/13 | | | 3,565,510
| | | | 3,565,510
| | |
| | 2,138,000 | | | Roche Holdings, Inc.
USD0.12% due 06/20/13 | | | 2,137,644
| | | | 2,137,644
| | |
| | 4,278,000 | | | Roche Holdings, Inc.
USD0.13% due 06/20/13 | | | 4,277,228
| | | | 4,277,228
| | |
United Arab Emirates 0.68% | | | |
| | 3,198,000 | | | Xstrata Finance Dubai Limited
USD0.39% due 05/09/13 | | | 3,197,730
| | | | 3,197,730
| | |
| | 4,147,000 | | | Xstrata Finance Dubai Limited
USD0.39% due 05/17/13 | | | 4,146,300
| | | | 4,146,300
| | |
| | 4,147,000 | | | Xstrata Finance Dubai Limited
USD0.39% due 05/21/13 | | | 4,146,125
| | | | 4,146,125
| | |
| | 2,894,000 | | | Xstrata Finance Dubai Limited
USD0.39% due 05/24/13 | | | 2,893,297
| | | | 2,893,297
| | |
| | 7,719,000 | | | Xstrata Finance Dubai Limited
USD0.41% due 06/10/13 | | | 7,715,569
| | | | 7,715,569
| | |
United Kingdom 0.91% | | | |
| | 959,000 | | | AstraZeneca PLC
USD0.09% due 05/09/13 | | | 958,981
| | | | 958,981
| | |
| | 2,696,000 | | | AstraZeneca PLC
USD0.10% due 06/10/13 | | | 2,695,700
| | | | 2,695,700
| | |
| | 1,874,000 | | | AstraZeneca PLC
USD0.10% due 06/14/13 | | | 1,873,771
| | | | 1,873,771
| | |
See Notes to Financial Statements.
FIRST EAGLE FUNDS | SEMI-ANNUAL REPORT | APRIL 30, 2013
75
PRINCIPAL | | DESCRIPTION | | COST (NOTE 1) | | VALUE (NOTE 1) | |
International Commercial Paper — 5.37% — (continued) | | | |
United Kingdom 0.91% — (continued) | | | |
| | 1,427,000 | | | AstraZeneca PLC
USD0.10% due 07/25/13 | | $ | 1,426,663
| | | $ | 1,426,260
| | |
| | 1,685,000 | | | AstraZeneca PLC
USD0.11% due 05/13/13 | | | 1,684,938
| | | | 1,684,938
| | |
| | 4,573,000 | | | AstraZeneca PLC
USD0.11% due 05/20/13 | | | 4,572,735
| | | | 4,572,735
| | |
| | 4,150,000 | | | AstraZeneca PLC
USD0.11% due 07/17/13 | | | 4,149,023
| | | | 4,148,094
| | |
| | 4,948,000 | | | AstraZeneca PLC
USD0.12% due 05/07/13 | | | 4,947,901
| | | | 4,947,901
| | |
| | 1,660,000 | | | AstraZeneca PLC
USD0.12% due 07/23/13 | | | 1,659,541
| | | | 1,659,163
| | |
| | 1,890,000 | | | Reckitt Benckiser
USD0.13% due 05/14/13 | | | 1,889,911
| | | | 1,889,911
| | |
| | 3,394,000 | | | Reckitt Benckiser
USD0.14% due 05/13/13 | | | 3,393,842
| | | | 3,393,842
| | |
Total International Commercial Paper | | | 173,194,525 | | | | 173,192,435 | | |
U.S. Commercial Paper — 11.37% | | | |
$ | 547,000 | | | Abbott Laboratories
0.12% due 05/08/13 | | | 546,987
| | | | 546,987
| | |
| | 10,131,000 | | | Abbott Laboratories
0.12% due 06/21/13 | | | 10,129,278
| | | | 10,129,278
| | |
| | 3,643,000 | | | Abbott Laboratories
0.13% due 05/21/13 | | | 3,642,737
| | | | 3,642,737
| | |
| | 8,503,000 | | | Abbott Laboratories
0.13% due 05/28/13 | | | 8,502,171
| | | | 8,502,171
| | |
| | 5,694,000 | | | Abbott Laboratories
0.13% due 07/16/13 | | | 5,692,437
| | | | 5,693,026
| | |
| | 2,451,000 | | | Abbott Laboratories
0.13% due 07/19/13 | | | 2,450,301
| | | | 2,450,564
| | |
| | 1,954,000 | | | Abbott Laboratories
0.14% due 06/10/13 | | | 1,953,696
| | | | 1,953,696
| | |
| | 1,969,000 | | | Air Products
0.12% due 05/13/13 | | | 1,968,921
| | | | 1,968,921
| | |
| | 3,030,000 | | | Avery Dennison Corporation
0.27% due 05/01/13 | | | 3,030,000
| | | | 3,030,000
| | |
| | 2,208,000 | | | Avery Dennison Corporation
0.28% due 05/01/13 | | | 2,208,000
| | | | 2,208,000
| | |
| | 988,000 | | | Baker Hughes, Inc.
0.13% due 05/07/13 | | | 987,979
| | | | 987,979
| | |
See Notes to Financial Statements.
FIRST EAGLE FUNDS | SEMI-ANNUAL REPORT | APRIL 30, 2013
76
Schedule of Investments | Six-Month Period Ended April 30, 2013 (unaudited)
PRINCIPAL | | DESCRIPTION | | COST (NOTE 1) | | VALUE (NOTE 1) | |
U.S. Commercial Paper — 11.37% — (continued) | | | |
$ | 3,198,000 | | | BHP Billiton Finance USA Limited
0.12% due 05/06/13 | | $ | 3,197,947
| | | $ | 3,197,947
| | |
| | 6,221,000 | | | BHP Billiton Finance USA Limited
0.12% due 05/07/13 | | | 6,220,876
| | | | 6,220,876
| | |
| | 4,147,000 | | | BHP Billiton Finance USA Limited
0.12% due 05/08/13 | | | 4,146,903
| | | | 4,146,903
| | |
| | 2,696,000 | | | BHP Billiton Finance USA Limited
0.13% due 06/11/13 | | | 2,695,601
| | | | 2,695,601
| | |
| | 2,696,000 | | | BHP Billiton Finance USA Limited
0.13% due 06/12/13 | | | 2,695,591
| | | | 2,695,591
| | |
| | 4,323,000 | | | BHP Billiton Finance USA Limited
0.13% due 06/18/13 | | | 4,322,251
| | | | 4,322,251
| | |
| | 2,818,000 | | | BHP Billiton Finance USA Limited
0.14% due 05/17/13 | | | 2,817,825
| | | | 2,817,825
| | |
| | 2,741,000 | | | BHP Billiton Finance USA Limited
0.14% due 05/21/13 | | | 2,740,787
| | | | 2,740,787
| | |
| | 6,076,000 | | | Caterpillar Financial Services Company
0.15% due 06/20/13 | | | 6,074,734
| | | | 6,074,734
| | |
| | 2,076,000 | | | Celgene Corporation
0.26% due 05/17/13 | | | 2,075,760
| | | | 2,075,760
| | |
| | 2,988,000 | | | Chevron Corporation
0.07% due 06/06/13 | | | 2,987,791
| | | | 2,987,791
| | |
| | 1,038,000 | | | Chevron Corporation
0.08% due 05/22/13 | | | 1,037,952
| | | | 1,037,952
| | |
| | 3,837,000 | | | Chevron Corporation
0.10% due 05/15/13 | | | 3,836,851
| | | | 3,836,851
| | |
| | 3,403,000 | | | Chevron Corporation
0.11% due 05/03/13 | | | 3,402,979
| | | | 3,402,979
| | |
| | 3,566,000 | | | Church & Dwight Company, Inc.
0.33% due 05/02/13 | | | 3,565,967
| | | | 3,565,967
| | |
| | 3,976,000 | | | Coca-Cola Company
0.11% due 05/09/13 | | | 3,975,903
| | | | 3,975,903
| | |
| | 5,163,000 | | | Coca-Cola Company
0.11% due 05/23/13 | | | 5,162,653
| | | | 5,162,653
| | |
| | 823,000 | | | Coca-Cola Company
0.12% due 07/17/13 | | | 822,789
| | | | 822,857
| | |
| | 3,113,000 | | | Coca-Cola Company
0.12% due 07/19/13 | | | 3,112,180
| | | | 3,112,446
| | |
| | 5,394,000 | | | Coca-Cola Company
0.13% due 06/12/13 | | | 5,393,182
| | | | 5,393,182
| | |
| | 3,463,000 | | | Coca-Cola Company
0.13% due 06/13/13 | | | 3,462,462
| | | | 3,462,462
| | |
See Notes to Financial Statements.
FIRST EAGLE FUNDS | SEMI-ANNUAL REPORT | APRIL 30, 2013
77
PRINCIPAL | | DESCRIPTION | | COST (NOTE 1) | | VALUE (NOTE 1) | |
U.S. Commercial Paper — 11.37% — (continued) | | | |
$ | 1,931,000 | | | Coca-Cola Company
0.14% due 06/19/13 | | $ | 1,930,632
| | | $ | 1,930,632
| | |
| | 1,931,000 | | | Coca-Cola Company
0.14% due 06/20/13 | | | 1,930,625
| | | | 1,930,625
| | |
| | 3,807,000 | | | Coca-Cola Company
0.20% due 05/01/13 | | | 3,807,000
| | | | 3,807,000
| | |
| | 2,157,000 | | | Colgate-Palmolive Company
0.07% due 05/01/13 | | | 2,157,000
| | | | 2,157,000
| | |
| | 2,132,000 | | | Con Edison, Inc.
0.23% due 05/01/13 | | | 2,132,000
| | | | 2,132,000
| | |
| | 1,124,000 | | | ConocoPhillips
0.14% due 06/11/13 | | | 1,123,821
| | | | 1,123,821
| | |
| | 716,000 | | | Deere & Company
0.10% due 05/23/13 | | | 715,956
| | | | 715,956
| | |
| | 1,830,000 | | | Deere & Company
0.11% due 05/23/13 | | | 1,829,877
| | | | 1,829,877
| | |
| | 1,599,000 | | | Devon Energy Corporation
0.23% due 05/10/13 | | | 1,598,908
| | | | 1,598,908
| | |
| | 6,238,000 | | | Devon Energy Corporation
0.27% due 05/01/13 | | | 6,238,000
| | | | 6,238,000
| | |
| | 3,463,000 | | | Devon Energy Corporation
0.28% due 05/17/13 | | | 3,462,569
| | | | 3,462,569
| | |
| | 4,147,000 | | | Devon Energy Corporation
0.28% due 06/05/13 | | | 4,145,871
| | | | 4,145,871
| | |
| | 3,173,000 | | | Devon Energy Corporation
0.29% due 06/12/13 | | | 3,171,926
| | | | 3,171,926
| | |
| | 2,076,000 | | | Devon Energy Corporation
0.31% due 07/10/13 | | | 2,074,749
| | | | 2,074,486
| | |
| | 4,853,000 | | | Dominion Resources
0.30% due 05/22/13 | | | 4,852,151
| | | | 4,852,151
| | |
| | 1,756,000 | | | Dominion Resources
0.30% due 06/19/13 | | | 1,755,283
| | | | 1,755,283
| | |
| | 1,975,000 | | | Emerson Electric Company
0.11% due 05/23/13 | | | 1,974,867
| | | | 1,974,867
| | |
| | 4,078,000 | | | Emerson Electric Company
0.11% due 05/28/13 | | | 4,077,664
| | | | 4,077,664
| | |
| | 3,322,000 | | | Google, Inc.
0.06% due 06/25/13 | | | 3,321,695
| | | | 3,321,695
| | |
| | 2,623,000 | | | Google, Inc.
0.10% due 07/16/13 | | | 2,622,446
| | | | 2,622,271
| | |
| | 1,738,000 | | | Google, Inc.
0.11% due 05/30/13 | | | 1,737,846
| | | | 1,737,846
| | |
See Notes to Financial Statements.
FIRST EAGLE FUNDS | SEMI-ANNUAL REPORT | APRIL 30, 2013
78
Schedule of Investments | Six-Month Period Ended April 30, 2013 (unaudited)
PRINCIPAL | | DESCRIPTION | | COST (NOTE 1) | | VALUE (NOTE 1) | |
U.S. Commercial Paper — 11.37% — (continued) | | | |
$ | 7,001,000 | | | Google, Inc.
0.12% due 06/04/13 | | $ | 7,000,207
| | | $ | 7,000,207
| | |
| | 340,000 | | | Google, Inc.
0.15% due 05/02/13 | | | 339,999
| | | | 339,999
| | |
| | 1,158,000 | | | Google, Inc.
0.18% due 05/02/13 | | | 1,157,994
| | | | 1,157,994
| | |
| | 1,975,000 | | | Honeywell International, Inc.
0.12% due 05/14/13 | | | 1,974,914
| | | | 1,974,914
| | |
| | 2,439,000 | | | Honeywell International, Inc.
0.13% due 06/21/13 | | | 2,438,551
| | | | 2,438,551
| | |
| | 9,589,000 | | | Honeywell International, Inc.
0.15% due 06/24/13 | | | 9,586,842
| | | | 9,586,842
| | |
| | 5,546,000 | | | Johnson & Johnson
0.05% due 05/22/13 | | | 5,545,838
| | | | 5,545,838
| | |
| | 4,886,000 | | | Johnson & Johnson
0.06% due 05/06/13 | | | 4,885,959
| | | | 4,885,959
| | |
| | 6,515,000 | | | Johnson & Johnson
0.06% due 05/07/13 | | | 6,514,935
| | | | 6,514,935
| | |
| | 2,142,000 | | | Kimberly Clark
0.10% due 05/13/13 | | | 2,141,929
| | | | 2,141,929
| | |
| | 1,626,000 | | | Kimberly Clark
0.11% due 06/03/13 | | | 1,625,836
| | | | 1,625,836
| | |
| | 4,914,000 | | | Merck & Company, Inc.
0.08% due 05/14/13 | | | 4,913,858
| | | | 4,913,858
| | |
| | 4,914,000 | | | Merck & Company, Inc.
0.08% due 05/17/13 | | | 4,913,825
| | | | 4,913,825
| | |
| | 3,242,000 | | | Merck & Company, Inc.
0.11% due 06/17/13 | | | 3,241,534
| | | | 3,241,534
| | |
| | 3,242,000 | | | Merck & Company, Inc.
0.11% due 06/19/13 | | | 3,241,515
| | | | 3,241,515
| | |
| | 10,557,000 | | | Merck & Company, Inc.
0.12% due 05/14/13 | | | 10,556,542
| | | | 10,556,542
| | |
| | 5,777,000 | | | Merck & Company, Inc.
0.12% due 05/16/13 | | | 5,776,711
| | | | 5,776,711
| | |
| | 2,387,000 | | | MetLife
0.13% due 06/03/13 | | | 2,386,716
| | | | 2,386,716
| | |
| | 2,233,000 | | | MetLife
0.14% due 06/12/13 | | | 2,232,635
| | | | 2,232,635
| | |
| | 4,477,000 | | | MetLife
0.15% due 05/15/13 | | | 4,476,739
| | | | 4,476,739
| | |
| | 4,860,000 | | | MetLife
0.15% due 05/16/13 | | | 4,859,696
| | | | 4,859,696
| | |
See Notes to Financial Statements.
FIRST EAGLE FUNDS | SEMI-ANNUAL REPORT | APRIL 30, 2013
79
PRINCIPAL | | DESCRIPTION | | COST (NOTE 1) | | VALUE (NOTE 1) | |
U.S. Commercial Paper — 11.37% — (continued) | | | |
$ | 2,106,000 | | | Parker-Hannifin Corporation
0.10% due 05/24/13 | | $ | 2,105,865
| | | $ | 2,105,865
| | |
| | 1,827,000 | | | Parker-Hannifin Corporation
0.12% due 05/16/13 | | | 1,826,909
| | | | 1,826,909
| | |
| | 2,076,000 | | | PepsiCo, Inc.
0.05% due 05/14/13 | | | 2,075,962
| | | | 2,075,962
| | |
| | 3,159,000 | | | PepsiCo, Inc.
0.05% due 06/12/13 | | | 3,158,816
| | | | 3,158,816
| | |
| | 3,159,000 | | | PepsiCo, Inc.
0.05% due 06/14/13 | | | 3,158,807
| | | | 3,158,807
| | |
| | 835,000 | | | PepsiCo, Inc.
0.05% due 06/19/13 | | | 834,943
| | | | 834,943
| | |
| | 823,000 | | | PepsiCo, Inc.
0.06% due 05/16/13 | | | 822,979
| | | | 822,979
| | |
| | 3,523,000 | | | Philip Morris International, Inc.
0.07% due 06/06/13 | | | 3,522,753
| | | | 3,522,753
| | |
| | 3,173,000 | | | Philip Morris International, Inc.
0.08% due 06/13/13 | | | 3,172,697
| | | | 3,172,697
| | |
| | 3,732,000 | | | Philip Morris International, Inc.
0.08% due 06/14/13 | | | 3,731,635
| | | | 3,731,635
| | |
| | 1,988,000 | | | Philip Morris International, Inc.
0.09% due 06/17/13 | | | 1,987,766
| | | | 1,987,766
| | |
| | 2,854,000 | | | Philip Morris International, Inc.
0.09% due 07/22/13 | | | 2,853,415
| | | | 2,852,388
| | |
| | 1,427,000 | | | Philip Morris International, Inc.
0.09% due 07/25/13 | | | 1,426,697
| | | | 1,426,158
| | |
| | 1,931,000 | | | Philip Morris International, Inc.
0.12% due 06/05/13 | | | 1,930,775
| | | | 1,930,775
| | |
| | 1,975,000 | | | Philip Morris International, Inc.
0.15% due 05/13/13 | | | 1,974,901
| | | | 1,974,901
| | |
| | 3,263,000 | | | Precision Castparts Corporation
0.15% due 05/01/13 | | | 3,263,000
| | | | 3,263,000
| | |
| | 547,000 | | | Proctor & Gamble Company
0.10% due 05/02/13 | | | 546,998
| | | | 546,998
| | |
| | 4,737,000 | | | Proctor & Gamble Company
0.11% due 05/06/13 | | | 4,736,928
| | | | 4,736,928
| | |
| | 1,216,000 | | | Proctor & Gamble Company
0.13% due 05/20/13 | | | 1,215,917
| | | | 1,215,917
| | |
| | 2,927,000 | | | Schlumberger Investments SA
0.17% due 07/24/13 | | | 2,925,839
| | | | 2,925,293
| | |
| | 1,951,000 | | | Syngenta Wilmington, Inc.
0.16% due 07/22/13 | | | 1,950,289
| | | | 1,949,898
| | |
See Notes to Financial Statements.
FIRST EAGLE FUNDS | SEMI-ANNUAL REPORT | APRIL 30, 2013
80
Schedule of Investments | Six-Month Period Ended April 30, 2013 (unaudited)
PRINCIPAL | | DESCRIPTION | | COST (NOTE 1) | | VALUE (NOTE 1) | |
U.S. Commercial Paper — 11.37% — (continued) | |
$ | 2,076,000 | | | United Healthcare Company
0.30% due 06/17/13 | | $ | 2,075,187
| | | $ | 2,075,187
| | |
| | 1,019,000 | | | Verizon Communications, Inc.
0.24% due 05/06/13 | | | 1,018,966
| | | | 1,018,966
| | |
| | 659,000 | | | Verizon Communications, Inc.
0.26% due 05/16/13 | | | 658,929
| | | | 658,929
| | |
| | 849,000 | | | Verizon Communications, Inc.
0.27% due 05/06/13 | | | 848,968
| | | | 848,968
| | |
| | 4,852,000 | | | Wal-Mart Stores, Inc.
0.08% due 05/20/13 | | | 4,851,795
| | | | 4,851,795
| | |
| | 6,084,000 | | | Wal-Mart Stores, Inc.
0.08% due 05/21/13 | | | 6,083,730
| | | | 6,083,730
| | |
| | 1,874,000 | | | Wal-Mart Stores, Inc.
0.10% due 06/11/13 | | | 1,873,787
| | | | 1,873,787
| | |
| | 10,699,000 | | | Wal-Mart Stores, Inc.
0.13% due 06/10/13 | | | 10,697,455
| | | | 10,697,455
| | |
| | 5,105,000 | | | Wal-Mart Stores, Inc.
0.13% due 06/11/13 | | | 5,104,244
| | | | 5,104,244
| | |
| | 2,760,000 | | | Walt Disney Company
0.10% due 06/03/13 | | | 2,759,747
| | | | 2,759,747
| | |
| | 2,760,000 | | | Walt Disney Company
0.11% due 06/18/13 | | | 2,759,595
| | | | 2,759,595
| | |
| | 2,760,000 | | | Walt Disney Company
0.12% due 06/19/13 | | | 2,759,549
| | | | 2,759,549
| | |
| | 2,981,000 | | | Walt Disney Company
0.12% due 06/20/13 | | | 2,980,503
| | | | 2,980,503
| | |
| | 2,161,000 | | | Walt Disney Company
0.12% due 07/11/13 | | | 2,160,488
| | | | 2,160,352
| | |
| | 3,491,000 | | | WellPoint, Inc.
0.22% due 06/06/13 | | | 3,490,232
| | | | 3,490,232
| | |
| | 1,702,000 | | | WellPoint, Inc.
0.23% due 06/03/13 | | | 1,701,641
| | | | 1,701,641
| | |
| | 2,840,000 | | | WellPoint, Inc.
0.24% due 05/13/13 | | | 2,839,773
| | | | 2,839,773
| | |
| | 1,762,000 | | | WellPoint, Inc.
0.26% due 06/14/13 | | | 1,761,440
| | | | 1,761,440
| | |
Total U.S. Commercial Paper | | | 366,985,072 | | | | 366,983,181 | | |
Total Commercial Paper | | | 540,179,597 | | | | 540,175,616 | | |
Total Investments — 100.18% | | $ | 2,698,343,161 | | | | 3,233,103,047 | | |
Liabilities in Excess of Other Assets — (0.18)% | | | | | | | (5,785,911 | ) | |
Net Assets — 100.00% | | | | | | $ | 3,227,317,136 | | |
See Notes to Financial Statements.
FIRST EAGLE FUNDS | SEMI-ANNUAL REPORT | APRIL 30, 2013
81
(a) Non-income producing security/commodity.
(b) Security is deemed illiquid. At April 30, 2013, the value of these securities amounted to $6,774,876 or 0.21% of net assets.
(c) An affiliate of the Fund as defined by the Investment Company Act of 1940. An affiliate is defined as a company in which the Fund directly or indirectly owns, controls, or holds power to vote 5% or more of the outstanding voting securities.
(d) Represents securities that are subject to legal or contractual restrictions on resale. At April 30, 2013, the value of these securities amounted to $5,499,571 or 0.17% of net assets.
(e) This security is convertible until December 31, 2049.
(f) Securities valued in accordance with fair value procedures under the supervision of the Board of Trustees, representing $5,504,940 or 0.17% of net assets.
(g) Payment-in-kind security.
(h) This security is convertible until April 30, 2015.
(i) All or a portion of the security is exempt from registration under the Securities Act of 1933. Rule 144A securities may only be sold to qualified institutional buyers, pursuant to Rule 144A under the Securities Act of 1933.
At April 30, 2013, cost is substantially identical for both book and federal income tax purposes. Net unrealized appreciation consisted of:
Gross unrealized appreciation | | $ | 623,398,050 | | |
Gross unrealized depreciation | | | (88,638,164 | ) | |
Net unrealized appreciation | | $ | 534,759,886 | | |
Abbreviations used in this schedule include:
ADR — American Depository Receipt
PLC — Public Limited Company
REIT — Real Estate Investment Trust
Currencies
USD — United States Dollar
RESTRICTED SECURITIES | | ACQUISITION
DATE | | COST | | CARRYING VALUE PER
SHARE/PRINCIPAL | |
Catalyst Paper Corporation | | 09/17/12 | | $ | 6,095 | | | $ | 2.00 | | |
Catalyst Paper Corporation
11.00% due 10/30/17 | | 09/17/12 | | | 7,594,211 | | | | 0.78 | | |
Affiliated Securities | |
AFFILIATED
SECURITIES | | SHARES
OCTOBER 31,
2012 | | GROSS
ADDITIONS | | GROSS
REDUCTIONS | | SHARES
APRIL 30,
2013 | | MARKET VALUE
APRIL 30,
2013 | | REALIZED
GAIN / (LOSS) | | DIVIDEND
INCOME | |
Insteel
Industries, Inc.* | | | 887,051 | | | | — | | | | — | | | | 887,051 | | | $ | 14,707,306 | | | $ | — | | | $ | 274,986 | | |
Rofin-Sinar
Technologies, Inc. | | | 1,840,310 | | | | — | | | | — | | | | 1,840,310 | | | | 45,823,719 | | | | — | | | | — | | |
Total | | $ | 60,531,025 | | | $ | — | | | $ | 274,986 | | |
* Represents an unaffiliated issuer as of April 30, 2013, as such, amounts represented above will not agree to balances in the Statements of Assets and Liabilities and Statements of Operations.
See Notes to Financial Statements.
FIRST EAGLE FUNDS | SEMI-ANNUAL REPORT | APRIL 30, 2013
82
Schedule of Investments | Six-Month Period Ended April 30, 2013 (unaudited)
INDUSTRY DIVERSIFICATION FOR PORTFOLIO HOLDINGS | | PERCENT OF
NET ASSETS | |
U.S. Common Stocks | |
Consumer Discretionary | | | 5.24 | % | |
Consumer Staples | | | 5.97 | | |
Energy | | | 4.98 | | |
Financials | | | 16.71 | | |
Health Care | | | 2.07 | | |
Industrials | | | 9.42 | | |
Information Technology | | | 15.77 | | |
Materials | | | 3.32 | | |
Utilities | | | 2.86 | | |
Total U.S. Common Stocks | | | 66.34 | | |
International Common Stocks | |
Energy | | | 2.33 | | |
Financials | | | 0.88 | | |
Health Care | | | 1.34 | | |
Materials | | | 5.61 | | |
Total International Common Stocks | | | 10.16 | | |
U.S. Preferred Stock | |
Consumer Staples | | | 0.17 | | |
Total U.S. Preferred Stock | | | 0.17 | | |
Warrant | | | 0.40 | | |
Commodity | | | 3.54 | | |
International Corporate Bond | |
Materials | | | 0.15 | | |
Total International Corporate Bond | | | 0.15 | | |
U.S. Convertible Bond | |
Industrials | | | 1.02 | | |
Total U.S. Convertible Bond | | | 1.02 | | |
See Notes to Financial Statements.
FIRST EAGLE FUNDS | SEMI-ANNUAL REPORT | APRIL 30, 2013
83
INDUSTRY DIVERSIFICATION FOR PORTFOLIO HOLDINGS — (CONTINUED) | | PERCENT OF
NET ASSETS | |
U.S. Corporate Bonds | |
Consumer Discretionary | | | 0.63 | % | |
Energy | | | 0.84 | | |
Industrials | | | 0.19 | | |
Total U.S. Corporate Bonds | | | 1.66 | | |
Commercial Paper | |
International Commercial Paper | | | 5.37 | | |
U.S. Commercial Paper | | | 11.37 | | |
Total Commercial Paper | | | 16.74 | | |
Total Investments | | | 100.18 | % | |
See Notes to Financial Statements.
FIRST EAGLE FUNDS | SEMI-ANNUAL REPORT | APRIL 30, 2013
84
This page was intentionally left blank.

Fund Overview | Data as of April 30, 2013 (unaudited)
INVESTMENT OBJECTIVE
First Eagle Gold Fund seeks to provide investors the opportunity to participate in the investment characteristics of gold (and, to a limited extent, other precious metals) for a portion of their overall investment portfolio. In seeking to achieve its objective, the Fund invests primarily in gold, gold related securities and issuers principally engaged in the gold industry.
Average Annual Returns | |
| | | ONE-YEAR | | FIVE-YEARS | | TEN-YEARS | |
First Eagle Gold
Fund (A Shares) | |
without sales load | | | –26.95 | % | | | –0.53 | % | | | 10.44 | % | |
with sales load | | | –30.62 | % | | | –1.54 | % | | | 9.87 | % | |
FTSE Gold Mines Index | | | –36.48 | % | | | –7.55 | % | | | 5.32 | % | |
MSCI World Index | | | 16.70 | % | | | 1.81 | % | | | 8.29 | % | |
Consumer Price Index | | | 1.06 | % | | | 1.60 | % | | | 2.38 | % | |
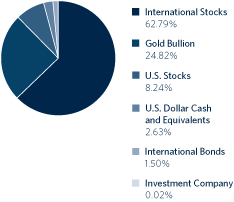
Countries** | |
Canada | | | 34.21 | % | |
United States | | | 33.08 | | |
South Africa | | | 9.14 | | |
Mexico | | | 7.82 | | |
Australia | | | 6.91 | | |
West Africa | | | 5.19 | | |
Bermuda | | | 0.76 | | |
Channel Island | | | 0.26 | | |
* Asset Allocation and Countries percentages are based on total investments in the portfolio.
** Country allocations reflect country of the issuer (not currency of issue) and exclude short term investments. Bonds of non-U.S. issuers may be U.S. dollar denominated.
The Fund's portfolio composition is subject to change at any time.
FIRST EAGLE FUNDS | SEMI-ANNUAL REPORT | APRIL 30, 2013
86
Growth of a $10,000 Initial Investment
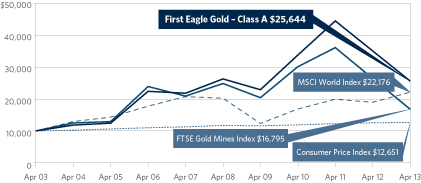
Performance data quoted herein represents past performance and should not be considered indicative of future results. Performance data quoted herein does not reflect the deduction of taxes that a shareholder would pay on Fund distributions or the sale of Fund shares. The average annual returns shown above are historical and reflect changes in share price, reinvested dividends and are net of expenses.
The average annual returns for Class A Shares with a sales charge give effect to the deduction of the maximum sales charge of 5.00%.
The MSCI World Index is a widely followed, unmanaged group of stocks from 23 international markets and is not available for purchase. The index provides total returns in U.S. dollars with net dividends reinvested. The FTSE Gold Mines Index is an unmanaged index composed of approximately 19 mining companies and is only available without dividends reinvested and is not available for purchase. The Consumer Price Index (CPI) represents the change in price of all goods and services purchased for consumption by urban households.
| Top 10 Holdings* | |
| Gold Bullion (United States) | | | 24.85 | % | |
| Agnico-Eagle Mines Limited (Canada) | | | 6.65 | | |
| Goldcorp, Inc. (Canada) | | | 5.66 | | |
| Randgold Resources Limited, ADR (Africa) | | | 5.19 | | |
| Newcrest Mining Limited (Australia) | | | 4.59 | | |
| AngloGold Ashanti Limited, ADR (South Africa) | | | 4.36 | | |
| Fresnillo PLC (Mexico) | | | 4.17 | | |
| Industrias Peñoles S.A.B. de C.V. (Mexico) | | | 3.67 | | |
| Kinross Gold Corporation (Canada) | | | 3.54 | | |
| Barrick Gold Corporation (Canada) | | | 3.35 | | |
Total | | | 66.03 | % | |
* Holdings in cash, commercial paper, money market funds and other short term cash equivalents have been excluded. Percentages are based on total net assets.
FIRST EAGLE FUNDS | SEMI-ANNUAL REPORT | APRIL 30, 2013
87
SHARES | | DESCRIPTION | | COST (NOTE 1) | | VALUE (NOTE 1) | |
Common Stocks — 70.96% | |
International Common Stocks — 62.71% | | | |
Africa 5.19% | | | |
| | 1,264,736 | | | Randgold Resources Limited, ADR | | $ | 28,073,424 | | | $ | 103,430,110 | | |
Australia 6.91% | | | |
| | 5,247,646 | | | Newcrest Mining Limited | | | 159,004,290 | | | | 91,406,205 | | |
| | 6,890,791 | | | Regis Resources Limited (a) | | | 32,462,689 | | | | 26,918,687 | | |
| | 4,118,481 | | | Kingsgate Consolidated Limited | | | 18,612,918 | | | | 9,217,948 | | |
| | 2,613,520 | | | Medusa Mining Limited | | | 12,846,050 | | | | 8,855,580 | | |
| | 7,991,615 | | | St. Augustine Gold and
Copper Limited (a)(b) | | | 8,188,305
| | | | 1,229,601
| | |
| | | | 231,114,252 | | | | 137,628,021 | | |
Bermuda 0.77% | | | |
| | 3,081,450 | | | Continental Gold Limited (a) | | | 22,650,691 | | | | 15,232,898 | | |
Canada 32.74% | | | |
| | 4,100,010 | | | Agnico-Eagle Mines Limited | | | 196,140,991 | | | | 132,352,914 | | |
| | 3,808,920 | | | Goldcorp, Inc. | | | 126,600,740 | | | | 112,667,854 | | |
| | 12,974,472 | | | Kinross Gold Corporation | | | 170,463,438 | | | | 70,581,128 | | |
| | 3,386,013 | | | Barrick Gold Corporation | | | 113,560,925 | | | | 66,738,316 | | |
| | 1,003,033 | | | Franco-Nevada Corporation | | | 17,431,540 | | | | 43,669,870 | | |
| | 5,379,731 | | | New Gold, Inc. (a) | | | 9,472,072 | | | | 43,148,924 | | |
| | 5,123,257 | | | Eldorado Gold Corporation | | | 54,896,928 | | | | 40,532,418 | | |
| | 5,755,592 | | | IAMGOLD Corporation | | | 31,401,352 | | | | 30,909,026 | | |
| | 6,750,740 | | | Osisko Mining Corporation (a)(c) | | | 51,245,902 | | | | 28,479,894 | | |
| | 1,918,596 | | | Dundee Precious Metals, Inc. (a)(c) | | | 3,080,638 | | | | 12,303,087 | | |
| | 4,991,700 | | | Rainy River Resources Limited (a) | | | 25,914,627 | | | | 11,495,676 | | |
| | 4,309,970 | | | B2Gold Corporation (a) | | | 11,219,363 | | | | 10,824,126 | | |
| | 5,612,300 | | | SEMAFO, Inc. | | | 21,126,151 | | | | 10,640,751 | | |
| | 868,060 | | | Detour Gold Corporation (a)(c) | | | 19,303,138 | | | | 10,443,604 | | |
| | 2,815,100 | | | Alacer Gold Corporation | | | 12,734,387 | | | | 8,439,152 | | |
| | 4,535,313 | | | Guyana Goldfields, Inc. (a) | | | 19,295,573 | | | | 8,103,597 | | |
| | 3,512,880 | | | Gabriel Resources Limited (a) | | | 20,363,078 | | | | 6,346,478 | | |
| | 708,800 | | | Primero Mining Corporation (a) | | | 4,122,348 | | | | 4,186,381 | | |
| | | | 908,373,191 | | | | 651,863,196 | | |
Channel Island 0.26% | | | |
| | 3,066,400 | | | Lydian International Limited (a) | | | 6,767,759 | | | | 5,083,272 | | |
Mexico 7.83% | | | |
| | 4,636,741 | | | Fresnillo PLC | | | 24,306,771 | | | | 82,969,871 | | |
See Notes to Financial Statements.
FIRST EAGLE FUNDS | SEMI-ANNUAL REPORT | APRIL 30, 2013
88
Consolidated Schedule of Investments | Six-Month Period Ended April 30, 2013 (unaudited)
SHARES | | DESCRIPTION | | COST (NOTE 1) | | VALUE (NOTE 1) | |
International Common Stocks — 62.71% — (continued) | | | |
Mexico 7.83% — (continued) | | | |
| | 1,734,777 | | | Industrias Peñoles S.A.B. de C.V. | | $ | 3,522,352 | | | $ | 72,980,348 | | |
| | | | 27,829,123 | | | | 155,950,219 | | |
South Africa 9.01% | | | |
| | 4,453,996 | | | AngloGold Ashanti Limited, ADR | | | 158,128,325 | | | | 86,852,922 | | |
| | 7,103,944 | | | Gold Fields Limited, ADR | | | 80,462,583 | | | | 52,995,422 | | |
| | 6,627,793 | | | Harmony Gold Mining Company
Limited, ADR | | | 64,457,630
| | | | 34,000,578
| | |
| | 1,448,373 | | | Sibanye Gold Limited, ADR (a) | | | 10,377,975 | | | | 5,576,236 | | |
| | | | 313,426,513 | | | | 179,425,158 | | |
Total International Common Stocks | | | 1,538,234,953 | | | | 1,248,612,874 | | |
U.S. Common Stocks — 8.25% | | | |
Materials 8.25% | | | |
| | 1,879,377 | | | Newmont Mining Corporation | | | 77,323,655 | | | | 60,891,816 | | |
| | 3,171,490 | | | Tahoe Resources, Inc. (a)(c) | | | 44,486,169 | | | | 55,093,384 | | |
| | 867,401 | | | Royal Gold, Inc. | | | 14,962,981 | | | | 48,210,147 | | |
Total U.S. Common Stocks | | | 136,772,805 | | | | 164,195,347 | | |
Total Common Stocks | | | 1,675,007,758 | | | | 1,412,808,221 | | |
International Preferred Stock — 0.14% | | | |
South Africa 0.14% | | | |
| | 120,000 | | | AngloGold Ashanti Holdings
Finance PLC 6.00% (d) | | | 6,000,000
| | | | 2,844,000
| | |
Investment Company — 0.02% | | | |
| | 416,472 | | | State Street Institutional
U.S. Government Money Market
Fund, Institutional Class | | | 416,472
| | | | 416,472
| | |
Warrants — 0.00% | | | |
Canada — 0.00% | | | |
| | 5,500,000 | | | Great Basin Gold Limited Warrant
expire 03/30/14 (a)(e)(f)(g) | | | 664,820
| | | | 0
| | |
| | 500,000 | | | St. Augustine Gold & Copper Warrant
expire 07/15/13 (a)(b)(e)(f) | | | 0
| | | | 0
| | |
Total Warrants | | | 664,820 | | | | 0 | | |
See Notes to Financial Statements.
FIRST EAGLE FUNDS | SEMI-ANNUAL REPORT | APRIL 30, 2013
89
OUNCES | | DESCRIPTION | | COST (NOTE 1) | | VALUE (NOTE 1) | |
Commodity — 24.85% | | | |
| | 335,178 | | | Gold bullion (a) | | $ | 183,135,784 | | | $ | 494,705,610 | | |
PRINCIPAL | | | | | | | |
International Convertible Bonds — 1.51% | | | |
Canada 1.51% | | | |
| 30,000,000
USD | | | Detour Gold Corporation
5.50% due 11/30/17 (f)(h) | | | 30,000,000
| | | | 30,000,000
| | |
South Africa 0.00% | | | |
| 2,000,000
CAD | | | Great Basin Gold Limited
8.00% due 11/30/14 (c)(e)(f)(g)(i) | | | 1,900,540
| | | | 0
| | |
Total International Convertible Bonds | | | 31,900,540 | | | | 30,000,000 | | |
Commercial Paper — 2.63% | | | |
International Commercial Paper — 1.33% | | | |
France 1.33% | | | |
| 26,484,000
USD | | | Total SA
0.09% due 05/01/13 | | | 26,484,000
| | | | 26,484,000
| | |
U.S. Commercial Paper — 1.30% | | | |
$ | 7,027,000 | | | Avery Dennison Corporation
0.27% due 05/01/13 | | | 7,027,000
| | | | 7,027,000
| | |
| | 5,120,000 | | | Avery Dennison Corporation
0.28% due 05/01/13 | | | 5,120,000
| | | | 5,120,000
| | |
| | 8,828,000 | | | Coca-Cola Company
0.20% due 05/01/13 | | | 8,828,000
| | | | 8,828,000
| | |
| | 4,944,000 | | | Con Edison, Inc.
0.23% due 05/01/13 | | | 4,944,000
| | | | 4,944,000
| | |
Total U.S. Commercial Paper | | | 25,919,000 | | | | 25,919,000 | | |
Total Commercial Paper | | | 52,403,000 | | | | 52,403,000 | | |
Total Investments — 100.11% | | $ | 1,949,528,374 | | | | 1,993,177,303 | | |
Liabilities in Excess of Other Assets — (0.11)% | | | | | (2,139,719 | ) | |
Net Assets — 100.00% | | | | $ | 1,991,037,584 | | |
(a) Non-income producing security/commodity.
(b) Represents a security registered under Regulation D. Regulation D provides exemptions for small companies to offer and sell their securities without having to register the securities under the Securities Act of 1933.
(c) All or a portion of the security is exempt from registration under the Securities Act of 1933. Rule 144A securities may only be sold to qualified institutional buyers, pursuant to Rule 144A under the Securities Act of 1933.
(d) This security is convertible until August 9, 2013.
See Notes to Financial Statements.
FIRST EAGLE FUNDS | SEMI-ANNUAL REPORT | APRIL 30, 2013
90
Consolidated Schedule of Investments | Six-Month Period Ended April 30, 2013 (unaudited)
(e) Security is deemed illiquid. At April 30, 2013, the value of these securities amounted to $0 or 0.00% of net assets.
(f) Securities valued in accordance with fair value procedures under the supervision of the Board of Trustees, representing $30,000,000 or 1.51% of net assets.
(g) Issuer is in default.
(h) This security is convertible until November 30, 2017.
(i) This security is convertible until November 30, 2014.
At April 30, 2013, cost is substantially identical for both book and federal income tax purposes. Net unrealized appreciation consisted of:
Gross unrealized appreciation | | $ | 628,103,654 | | |
Gross unrealized depreciation | | | (584,454,725 | ) | |
Net unrealized appreciation | | $ | 43,648,929 | | |
Abbreviations used in this schedule include:
ADR — American Depository Receipt
PLC — Public Limited Company
Currencies
CAD — Canadian Dollar
USD — United States Dollar
INDUSTRY DIVERSIFICATION FOR PORTFOLIO HOLDINGS | | PERCENT OF
NET ASSETS | |
International Common Stocks | |
Materials | | | 62.71 | % | |
Total International Common Stocks | | | 62.71 | | |
U.S. Common Stocks | |
Materials | | | 8.25 | | |
Total U.S. Common Stocks | | | 8.25 | | |
International Preferred Stock | |
Materials | | | 0.14 | | |
Total International Preferred Stock | | | 0.14 | | |
Investment Company | | | 0.02 | | |
Warrants | | | 0.00 | | |
Commodity | | | 24.85 | | |
See Notes to Financial Statements.
FIRST EAGLE FUNDS | SEMI-ANNUAL REPORT | APRIL 30, 2013
91
INDUSTRY DIVERSIFICATION FOR PORTFOLIO HOLDINGS — (CONTINUED) | | PERCENT OF
NET ASSETS | |
International Convertible Bonds | |
Materials | | | 1.51 | % | |
Total International Convertible Bonds | | | 1.51 | | |
Commercial Paper | |
International Commercial Paper | | | 1.33 | | |
U.S. Commercial Paper | | | 1.30 | | |
Total Commercial Paper | | | 2.63 | | |
Total Investments | | | 100.11 | % | |
See Notes to Financial Statements.
FIRST EAGLE FUNDS | SEMI-ANNUAL REPORT | APRIL 30, 2013
92
This page was intentionally left blank.

Fund Overview | Data as of April 30, 2013 (unaudited)
INVESTMENT OBJECTIVE
First Eagle Global Income Builder seeks current income generation and long-term growth of capital. Fundamental research drives the identification of income-producing investment opportunities across all market environments.
| Average Annual Returns^ | |
| | | ONE-YEAR | | THREE-YEARS | | SINCE
INCEPTION
(5/1/2012) | |
First Eagle Global Income
Builder (A Shares) | |
without sales load | | | — | | | | — | | | | 12.21 | % | |
with sales load | | | — | | | | — | | | | 6.56 | | |
MSCI World Index | | | 16.70 | % | | | 9.59 | % | | | 16.42 | | |
Barclays Capital U.S.
Aggregate Bond Index | | | 3.68 | | | | 5.51 | | | | 3.81 | | |
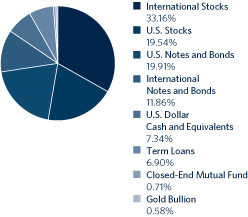
Countries** | |
United States | | | 46.17 | % | |
France | | | 7.71 | | |
Canada | | | 6.39 | | |
Sweden | | | 4.18 | | |
Japan | | | 3.58 | | |
United Kingdom | | | 3.09 | | |
Netherlands | | | 2.84 | | |
Germany | | | 2.11 | | |
Australia | | | 1.97 | | |
Italy | | | 1.84 | | |
Singapore | | | 1.79 | | |
Switzerland | | | 1.72 | | |
Norway | | | 1.46 | | |
Belgium | | | 1.37 | | |
Austria | | | 1.31 | | |
Ireland | | | 1.08 | | |
Mexico | | | 0.73 | | |
Bermuda | | | 0.71 | | |
Hong Kong | | | 0.60 | | |
South Korea | | | 0.59 | | |
Spain | | | 0.56 | | |
Israel | | | 0.32 | | |
Thailand | | | 0.26 | | |
South Africa | | | 0.18 | | |
Greece | | | 0.10 | | |
^ Performance figures reflect certain fee waivers and/or expense limitations, without which returns may have been lower.
* Asset Allocation and Countries percentages are based on total investments in the portfolio.
** Country allocations reflect country of the issuer (not currency of issue) and exclude short term investments. Bonds of non-U.S. issuers may be U.S. dollar denominated.
The Fund's portfolio composition is subject to change at any time.
FIRST EAGLE FUNDS | SEMI-ANNUAL REPORT | APRIL 30, 2013
94
Global Income Builder Fund
Growth of a $10,000 Initial Investment
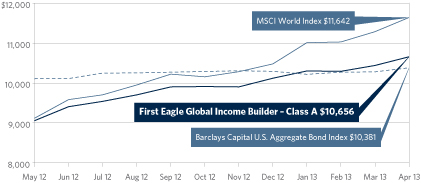
The Adviser has contractually agreed to limit operating expenses of the Fund to an annual rate of 1.30% for A Shares, 2.05% for C Shares, and 1.05% for I Shares with gross operating expenses of 1.41%, 2.15%, and 1.17% respectively. This limitation excludes certain expenses as described in the Fees and Expenses section of the prospectus. This limitation will continue until December 31, 2013. The expense limitation may be terminated by the Adviser in future years. Performance figures reflect contractual waivers and/or expense limitations, without which total returns may have been lower.
Performance data quoted herein represents past performance and should not be considered indicative of future results. Performance data quoted herein does not reflect the deduction of taxes that a shareholder would pay on Fund distributions or the sale of Fund shares. The average annual returns shown above are historical and reflect changes in share price, reinvested dividends and are net of expenses.
The average annual returns for Class A Shares give effect to the deduction of the maximum sales charge of 5.00%.
The MSCI World Index is a widely followed, unmanaged group of stocks from 23 international markets and is not available for purchase. The index provides total returns in U.S. dollars with net dividends reinvested. The Barclays Capital U.S. Aggregate Bond Index is a broad-based benchmark that measures the investment grade, U.S. dollar-denominated, fixed-rate taxable bond market, including Treasuries, government-related and corporate securities, MBS (agency fixed-rate and hybrid ARM passthroughs, ABS, and CMBS. The index is presented here for comparison purposes only. One cannot invest directly in an index.
| Top 10 Holdings* | |
| Bouygues SA (French industrial company) | | | 1.85 | % | |
| Nestlé SA (Swiss food product manufacturer) | | | 1.73 | | |
| Microsoft Corporation (U.S. software developer) | | | 1.68 | | |
| FirstEnergy Corporation (U.S. diversified energy company) | | | 1.61 | | |
| Intel Corporation (U.S. computer components and related products manufacturer) | | | 1.58 | | |
| Thompson Creek Metals Company, Inc. (Canadian mining company) | | | 1.55 | | |
| Roundy's Supermarkets, Inc. Term Loan B (U.S. wholesale grocery company) | | | 1.55 | | |
| SandRidge Energy, Inc. (U.S. oil & gas company) | | | 1.55 | | |
| Sysco Corporation (U.S. food services distributor) | | | 1.53 | | |
| Hoya Corporation (Japanese electronic components company) | | | 1.51 | | |
Total | | | 16.14 | % | |
* Holdings in cash, commercial paper and other short term cash equivalents have been excluded. Percentages are based on total net assets.
FIRST EAGLE FUNDS | SEMI-ANNUAL REPORT | APRIL 30, 2013
95
First Eagle Global Income Builder Fund
SHARES | | DESCRIPTION | | COST (NOTE 1) | | VALUE (NOTE 1) | |
Common Stocks — 53.00% | |
U.S. Common Stocks — 19.65% | | | |
Consumer Discretionary 0.57% | | | |
| | 68,149 | | | H&R Block, Inc. | | $ | 1,277,495 | | | $ | 1,890,453 | | |
Consumer Staples 3.58% | | | |
| | 144,503 | | | Sysco Corporation | | | 4,473,679 | | | | 5,037,374 | | |
| | 108,866 | | | Lorillard, Inc. | | | 4,301,598 | | | | 4,669,263 | | |
| | 17,541 | | | Colgate-Palmolive Company | | | 1,856,601 | | | | 2,094,571 | | |
| | | | 10,631,878 | | | | 11,801,208 | | |
Energy 1.93% | | | |
| | 76,536 | | | ConocoPhillips | | | 4,398,653 | | | | 4,626,601 | | |
| | 112,184 | | | San Juan Basin Royalty Trust | | | 1,759,160 | | | | 1,733,243 | | |
| | | | 6,157,813 | | | | 6,359,844 | | |
Financials 2.49% | | | |
| | 1,989,500 | | | Frasers Commercial Trust, REIT | | | 1,866,057 | | | | 2,517,537 | | |
| | 46,311 | | | Plum Creek Timber Company, Inc., REIT | | | 2,011,671 | | | | 2,386,869 | | |
| | 20,967 | | | Rayonier, Inc., REIT | | | 1,038,569 | | | | 1,245,859 | | |
| | 36,101 | | | Weyerhaeuser Company, REIT | | | 860,609 | | | | 1,101,442 | | |
| | 19,769 | | | Cincinnati Financial Corporation | | | 751,475 | | | | 966,902 | | |
| | | | 6,528,381 | | | | 8,218,609 | | |
Industrials 2.43% | | | |
| | 39,731 | | | Lockheed Martin Corporation | | | 3,542,247 | | | | 3,936,945 | | |
| | 19,905 | | | 3M Company | | | 1,833,235 | | | | 2,084,252 | | |
| | 26,447 | | | Northrop Grumman Corporation | | | 1,747,227 | | | | 2,003,096 | | |
| | | | 7,122,709 | | | | 8,024,293 | | |
Information Technology 5.56% | | | |
| | 166,868 | | | Microsoft Corporation | | | 4,747,887 | | | | 5,523,331 | | |
| | 217,408 | | | Intel Corporation | | | 4,819,146 | | | | 5,206,922 | | |
| | 153,300 | | | Cisco Systems, Inc. | | | 3,050,426 | | | | 3,207,036 | | |
| | 67,016 | | | Linear Technology Corporation | | | 2,196,137 | | | | 2,446,084 | | |
| | 24,083 | | | Automatic Data Processing, Inc. | | | 1,401,215 | | | | 1,621,749 | | |
| | 8,496 | | | Texas Instruments, Inc. | | | 230,380 | | | | 307,640 | | |
| | | | 16,445,191 | | | | 18,312,762 | | |
Materials 0.60% | | | |
| | 61,083 | | | Newmont Mining Corporation | | | 2,640,926 | | | | 1,979,089 | | |
Utilities 2.49% | | | |
| | 113,976 | | | FirstEnergy Corporation | | | 4,863,075 | | | | 5,311,281 | | |
See Notes to Financial Statements.
FIRST EAGLE FUNDS | SEMI-ANNUAL REPORT | APRIL 30, 2013
96
Schedule of Investments | Six-Month Period Ended April 30, 2013 (unaudited)
SHARES | | DESCRIPTION | | COST (NOTE 1) | | VALUE (NOTE 1) | |
U.S. Common Stocks — 19.65% — (continued) | | | |
Utilities 2.49% — (continued) | | | |
| | 40,543 | | | Entergy Corporation | | $ | 2,654,321 | | | $ | 2,887,878 | | |
| | | | 7,517,396 | | | | 8,199,159 | | |
Total U.S. Common Stocks | | | 58,321,789 | | | | 64,785,417 | | |
International Common Stocks — 33.35% | | | |
Australia 0.53% | | | |
| | 100,455 | | | Newcrest Mining Limited | | | 2,431,742 | | | | 1,749,777 | | |
Austria 1.31% | | | |
| | 24,783 | | | Mayr Melnhof Karton AG | | | 2,677,507 | | | | 2,662,584 | | |
| | 35,573 | | | OMV AG | | | 1,274,797 | | | | 1,669,647 | | |
| | | | 3,952,304 | | | | 4,332,231 | | |
Belgium 1.38% | | | |
| | 58,862 | | | Groupe Bruxelles Lambert SA | | | 4,557,665 | | | | 4,553,575 | | |
Canada 2.52% | | | |
| | 331,325 | | | Penn West Petroleum Limited | | | 3,899,920 | | | | 3,058,130 | | |
| | 49,700 | | | Cenovus Energy, Inc. | | | 1,529,202 | | | | 1,488,018 | | |
| | 70,795 | | | Barrick Gold Corporation | | | 2,451,404 | | | | 1,395,369 | | |
| | 46,518 | | | Goldcorp, Inc. | | | 1,724,270 | | | | 1,376,002 | | |
| | 31,036 | | | Agnico-Eagle Mines Limited | | | 1,383,842 | | | | 1,001,877 | | |
| | | | 10,988,638 | | | | 8,319,396 | | |
France 7.08% | | | |
| | 218,667 | | | Bouygues SA | | | 5,899,823 | | | | 6,096,132 | | |
| | 90,657 | | | Total SA | | | 4,565,970 | | | | 4,564,571 | | |
| | 38,429 | | | Sanofi | | | 3,387,051 | | | | 4,207,527 | | |
| | 55,701 | | | Ciments Francais SA | | | 3,213,041 | | | | 3,040,511 | | |
| | 36,077 | | | Neopost SA | | | 1,986,446 | | | | 2,370,623 | | |
| | 73,980 | | | Carrefour SA | | | 1,796,055 | | | | 2,189,964 | | |
| | 18,902 | | | Legrand SA | | | 743,904 | | | | 879,968 | | |
| | | | 21,592,290 | | | | 23,349,296 | | |
Germany 2.12% | | | |
| | 85,778 | | | Daimler AG | | | 4,653,524 | | | | 4,741,551 | | |
| | 104,419 | | | Hamburger Hafen und Logistik AG | | | 2,452,757 | | | | 2,244,769 | | |
| | | | 7,106,281 | | | | 6,986,320 | | |
Greece 0.10% | | | |
| | 33,961 | | | Jumbo SA | | | 148,295 | | | | 319,467 | | |
Hong Kong 0.60% | | | |
| | 215,000 | | | Hopewell Holdings Limited | | | 770,186 | | | | 828,367 | | |
See Notes to Financial Statements.
FIRST EAGLE FUNDS | SEMI-ANNUAL REPORT | APRIL 30, 2013
97
Global Income Builder Fund
SHARES | | DESCRIPTION | | COST (NOTE 1) | | VALUE (NOTE 1) | |
International Common Stocks — 33.35% — (continued) | | | |
Hong Kong 0.60% — (continued) | | | |
| | 67,700 | | | Guoco Group Limited | | $ | 589,955 | | | $ | 808,253 | | |
| | 80,000 | | | Great Eagle Holdings Limited | | | 263,852 | | | | 338,124 | | |
| | | | 1,623,993 | | | | 1,974,744 | | |
Ireland 1.09% | | | |
| | 167,155 | | | CRH PLC | | | 3,238,908 | | | | 3,588,249 | | |
Israel 0.33% | | | |
| | 90,007 | | | Israel Chemicals Limited | | | 1,107,788 | | | | 1,070,305 | | |
Italy 1.85% | | | |
| | 131,865 | | | Eni S.p.A | | | 3,087,915 | | | | 3,150,544 | | |
| | 819,982 | | | Italcementi S.p.A. RSP | | | 2,225,141 | | | | 2,524,412 | | |
| | 41,371 | | | Recordati S.p.A. | | | 349,496 | | | | 426,185 | | |
| | | | 5,662,552 | | | | 6,101,141 | | |
Japan 3.60% | | | |
| | 248,600 | | | Hoya Corporation | | | 4,977,297 | | | | 4,963,591 | | |
| | 63,300 | | | Astellas Pharma, Inc. | | | 3,033,608 | | | | 3,678,686 | | |
| | 88,800 | | | NKSJ Holdings, Inc. | | | 1,880,381 | | | | 2,246,281 | | |
| | 14,800 | | | Ono Pharmaceutical Company Limited | | | 869,307 | | | | 973,874 | | |
| | | | 10,760,593 | | | | 11,862,432 | | |
Mexico 0.74% | | | |
| | 136,020 | | | Fresnillo PLC | | | 2,821,720 | | | | 2,433,943 | | |
Netherlands 1.69% | | | |
| | 90,916 | | | Sligro Food Group NV | | | 2,748,155 | | | | 2,990,339 | | |
| | 19,967 | | | HAL Trust | | | 2,430,287 | | | | 2,574,418 | | |
| | | | 5,178,442 | | | | 5,564,757 | | |
Norway 0.99% | | | |
| | 363,571 | | | Orkla ASA | | | 2,999,420 | | | | 3,268,238 | | |
Singapore 0.32% | | | |
| | 416,000 | | | Singapore Airport Terminal Services Limited | | | 935,194 | | | | 1,062,946 | | |
South Africa 0.18% | | | |
| | 31,088 | | | AngloGold Ashanti Limited, ADR | | | 991,926 | | | | 606,216 | | |
South Korea 0.59% | | | |
| | 27,200 | | | KT&G Corporation | | | 2,102,431 | | | | 1,958,558 | | |
Spain 0.56% | | | |
| | 34,768 | | | Red Electrica Corporation SA | | | 1,634,742 | | | | 1,847,539 | | |
Sweden 1.23% | | | |
| | 139,947 | | | Investor AB, Class 'A' | | | 3,601,565 | | | | 4,044,549 | | |
See Notes to Financial Statements.
FIRST EAGLE FUNDS | SEMI-ANNUAL REPORT | APRIL 30, 2013
98
Schedule of Investments | Six-Month Period Ended April 30, 2013 (unaudited)
SHARES | | DESCRIPTION | | COST (NOTE 1) | | VALUE (NOTE 1) | |
International Common Stocks — 33.35% — (continued) | | | |
Switzerland 1.73% | | | |
| | 79,783 | | | Nestlé SA | | $ | 5,294,620 | | | $ | 5,691,439 | | |
Thailand 0.26% | | | |
| | 1,762,000 | | | Thai Beverage PCL | | | 512,015 | | | | 864,706 | | |
United Kingdom 2.55% | | | |
| | 165,040 | | | GlaxoSmithKline PLC | | | 3,714,270 | | | | 4,256,799 | | |
| | 914,050 | | | WM Morrison Supermarkets PLC | | | 3,864,341 | | | | 4,147,216 | | |
| | | | 7,578,611 | | | | 8,404,015 | | |
Total International Common Stocks | | | 106,821,735 | | | | 109,953,839 | | |
Total Common Stocks | | | 165,143,524 | | | | 174,739,256 | | |
Closed-End Mutual Fund — 0.71% | | | |
Singapore 0.71% | | | |
| | 4,645,200 | | | Macquarie International Infrastructure
Fund Limited | | | 2,200,610
| | | | 2,355,005
| | |
| OUNCES | | | | | | | |
Commodity — 0.59% | | | |
| | 1,308 | | | Gold bullion (a) | | | 2,094,674 | | | | 1,929,691 | | |
| PRINCIPAL | | | | | | | |
Bonds — 31.95% | | | |
U.S. Convertible Bond 1.05% | | | |
$ | 3,400,000 | | | Advanced Micro Devices, Inc.
6.00% due 05/01/15 (b) | | | 3,213,245
| | | | 3,451,000
| | |
U.S. Corporate Bonds — 18.97% | | | |
| | 959,000 | | | Air Medical Group Holdings, Inc.
9.25% due 11/01/18 | | | 1,014,839
| | | | 1,066,888
| | |
| | 1,357,000 | | | Aleris International, Inc.
7.875% due 11/01/20 | | | 1,353,392
| | | | 1,475,738
| | |
| | 881,000 | | | American Axle & Manufacturing, Inc.
6.25% due 03/15/21 | | | 881,000
| | | | 932,759
| | |
| | 2,522,000 | | | American Axle & Manufacturing, Inc.
6.625% due 10/15/22 | | | 2,573,066
| | | | 2,707,997
| | |
| | 2,475,000 | | | Basic Energy Services, Inc.
7.75% due 02/15/19 | | | 2,471,849
| | | | 2,598,750
| | |
| | 475,000 | | | Basic Energy Services, Inc.
7.75% due 10/15/22 | | | 475,000
| | | | 502,313
| | |
See Notes to Financial Statements.
FIRST EAGLE FUNDS | SEMI-ANNUAL REPORT | APRIL 30, 2013
99
Global Income Builder Fund
PRINCIPAL | | DESCRIPTION | | COST (NOTE 1) | | VALUE (NOTE 1) | |
U.S. Corporate Bonds — 18.97% — (continued) | | | |
$ | 3,600,000 | | | Bi-Lo LLC
9.25% due 02/15/19 (c) | | $ | 3,839,863
| | | $ | 3,960,000
| | |
| | 500,000 | | | Carrizo Oil & Gas, Inc.
7.50% due 09/15/20 | | | 509,696
| | | | 545,000
| | |
| | 900,000 | | | Carrizo Oil & Gas, Inc.
8.625% due 10/15/18 | | | 943,554
| | | | 1,001,250
| | |
| | 1,500,000 | | | CCO Holdings LLC
7.375% due 06/01/20 | | | 1,647,966
| | | | 1,691,250
| | |
| | 780,000 | | | Citgo Petroleum Corporation
11.50% due 07/01/17 (c) | | | 862,627
| | | | 900,900
| | |
| | 2,225,000 | | | CommScope, Inc.
8.25% due 01/15/19 (c) | | | 2,388,799
| | | | 2,441,937
| | |
| | 4,500,000 | | | Drill Rigs Holdings, Inc.
6.50% due 10/01/17 (c) | | | 4,524,852
| | | | 4,578,750
| | |
| | 375,000 | | | Everest Acquisition LLC
6.875% due 05/01/19 | | | 393,169
| | | | 412,500
| | |
| | 1,200,000 | | | Everest Acquisition LLC
7.75% due 09/01/22 | | | 1,216,951
| | | | 1,383,000
| | |
| | 3,350,000 | | | Fiesta Restaurant Group, Inc.
8.875% due 08/15/16 | | | 3,588,337
| | | | 3,647,312
| | |
| | 3,000,000 | | | Frontier Communications Corporation
8.50% due 04/15/20 | | | 3,387,409
| | | | 3,465,000
| | |
| | 1,525,000 | | | Huntington Ingalls Industries, Inc.
7.125% due 03/15/21 | | | 1,654,115
| | | | 1,704,187
| | |
| | 1,000,000 | | | International Lease Finance Corporation
5.875% due 04/01/19 | | | 1,061,113
| | | | 1,102,390
| | |
| | 550,000 | | | International Lease Finance Corporation
6.25% due 05/15/19 | | | 557,491
| | | | 619,438
| | |
| | 3,300,000 | | | Mead Products
6.75% due 04/30/20 (c) | | | 3,447,451
| | | | 3,522,750
| | |
| | 850,000 | | | PHH Corporation
7.375% due 09/01/19 | | | 857,301
| | | | 975,375
| | |
| | 350,000 | | | PHH Corporation
9.25% due 03/01/16 | | | 360,870
| | | | 412,125
| | |
| | 2,000,000 | | | Rentech Nitrogen Partners L.P.
6.50% due 04/15/21 (c) | | | 2,037,399
| | | | 2,057,500
| | |
| | 4,925,000 | | | SandRidge Energy, Inc.
7.50% due 02/15/23 | | | 5,133,754
| | | | 5,097,375
| | |
| | 2,350,000 | | | STHI Holding Corporation
8.00% due 03/15/18 (c) | | | 2,533,555
| | | | 2,585,000
| | |
| | 2,373,000 | | | Taylor Morrison Communities, Inc.
7.75% due 04/15/20 (c) | | | 2,540,661
| | | | 2,675,558
| | |
See Notes to Financial Statements.
FIRST EAGLE FUNDS | SEMI-ANNUAL REPORT | APRIL 30, 2013
100
Schedule of Investments | Six-Month Period Ended April 30, 2013 (unaudited)
PRINCIPAL | | DESCRIPTION | | COST (NOTE 1) | | VALUE (NOTE 1) | |
U.S. Corporate Bonds — 18.97% — (continued) | | | |
$ | 2,575,000 | | | Toys R Us Property Company I
10.75% due 07/15/17 | | $ | 2,740,500
| | | $ | 2,764,906
| | |
| | 1,255,000 | | | Toys R Us Property Company II
8.50% due 12/01/17 | | | 1,318,611
| | | | 1,353,831
| | |
| | 3,700,000 | | | Tronox Finance LLC
6.375% due 08/15/20 (c) | | | 3,737,710
| | | | 3,704,625
| | |
| | 600,000 | | | Wolverine World Wide, Inc.
6.125% due 10/15/20 (c) | | | 610,008
| | | | 656,250
| | |
Total U.S. Corporate Bonds | | | 60,662,908 | | | | 62,542,654 | | |
International Corporate Bonds — 11.93% | | | |
Australia 1.45% | | | |
| 1,354,000
USD | | | Ausdrill Finance Pty Limited
6.875% due 11/01/19 (d) | | | 1,355,215
| | | | 1,377,695
| | |
| 3,300,000
USD | | | Nufarm Australia Limited
6.375% due 10/15/19 (c) | | | 3,451,046
| | | | 3,407,250
| | |
| | | | 4,806,261 | | | | 4,784,945 | | |
Bermuda 0.72% | | | |
| 500,000
USD | | | Aircastle Limited
6.25% due 12/01/19 | | | 511,975
| | | | 560,000
| | |
| 1,525,000
USD | | | Aircastle Limited
7.625% due 04/15/20 | | | 1,631,348
| | | | 1,807,125
| | |
| | | | 2,143,323 | | | | 2,367,125 | | |
Canada 3.90% | | | |
| 1,500,000
USD | | | New Gold, Inc.
6.25% due 11/15/22 (c) | | | 1,522,899
| | | | 1,552,500
| | |
| 500,000
USD | | | New Gold, Inc.
7.00% due 04/15/20 (c) | | | 515,169
| | | | 532,500
| | |
| 4,000,000
USD | | | PetroBakken Energy Limited
8.625% due 02/01/20 (c) | | | 4,117,323
| | | | 4,140,000
| | |
| 1,000,000
USD | | | Precision Drilling Corporation
6.50% due 12/15/21 | | | 1,053,612
| | | | 1,087,500
| | |
| 400,000
USD | | | Precision Drilling Corporation
6.625% due 11/15/20 | | | 400,885
| | | | 433,000
| | |
| 4,788,000
USD | | | Thompson Creek Metals Company, Inc.
9.75% due 12/01/17 | | | 5,059,630
| | | | 5,123,160
| | |
| | | | 12,669,518 | | | | 12,868,660 | | |
France 0.67% | | | |
| 500,000
USD | | | Rexel SA
5.25% due 06/15/20 (c) | | | 499,906
| | | | 530,000
| | |
| 1,550,000
USD | | | Rexel SA
6.125% due 12/15/19 (c) | | | 1,588,729
| | | | 1,674,000
| | |
| | | | 2,088,635 | | | | 2,204,000 | | |
See Notes to Financial Statements.
FIRST EAGLE FUNDS | SEMI-ANNUAL REPORT | APRIL 30, 2013
101
Global Income Builder Fund
PRINCIPAL | | DESCRIPTION | | COST (NOTE 1) | | VALUE (NOTE 1) | |
International Corporate Bonds — 11.93% — (continued) | | | |
Netherlands 1.17% | | | |
| 2,300,000
EUR | | | HeidelbergCement Finance BV
8.50% due 10/31/19 (e) | | $ | 3,523,247
| | | $ | 3,865,707
| | |
Norway 0.48% | | | |
| 1,630,000
USD | | | Eksportfinans ASA
2.00% due 09/15/15 | | | 1,548,796
| | | | 1,579,556
| | |
Sweden 2.98% | | | |
| 2,350,000
EUR | | | Eileme 2 AB
11.75% due 01/31/20 (c) | | | 3,457,148
| | | | 3,679,213
| | |
| 1,700,000
USD | | | Perstorp Holding AB
8.75% due 05/15/17 (c) | | | 1,728,068
| | | | 1,838,125
| | |
| 2,000,000
EUR | | | Perstorp Holding AB
9.00% due 05/15/17 (c) | | | 2,799,083
| | | | 2,868,115
| | |
| 1,000,000
EUR | | | Perstorp Holding AB
9.00% due 05/15/17 (e) | | | 1,361,490
| | | | 1,434,058
| | |
| | | | 9,345,789 | | | | 9,819,511 | | |
United Kingdom 0.56% | | | |
| 210,000
USD | | | Jaguar Land Rover PLC
5.625% due 02/01/23 (c) | | | 210,000
| | | | 220,500
| | |
| 1,400,000
USD | | | Jaguar Land Rover PLC
8.125% due 05/15/21 (c) | | | 1,492,673
| | | | 1,610,000
| | |
| | | | 1,702,673 | | | | 1,830,500 | | |
Total International Corporate Bonds | | | 37,828,242 | | | | 39,320,004 | | |
Total Bonds | | | 101,704,395 | | | | 105,313,658 | | |
Term Loans — 6.94% | | | |
United States 6.94% | | | |
| 3,336,637
USD | | | Alcatel-Lucent, Term Loan C
7.25% due 01/30/19 | | | 3,382,551
| | | | 3,426,310
| | |
| 873,810
USD | | | Ameriforge Group, Inc.
6.00% due 12/19/19 | | | 869,532
| | | | 888,009
| | |
| 590,000
USD | | | Calceus Acquisition, Inc.
5.75% due 02/01/20 | | | 587,122
| | | | 599,588
| | |
| 2,634,000
USD | | | Caraustar Industry, Inc.
due 04/10/19 (f)(g) | | | 2,663,965
| | | | 2,660,340
| | |
| 2,189,000
USD | | | Fortescue Metals Group
5.25% due 10/18/17 | | | 2,186,388
| | | | 2,228,067
| | |
| 2,149,613
USD | | | NEP Supershooters L.P.
4.75% due 01/22/20 | | | 2,153,363
| | | | 2,186,560
| | |
See Notes to Financial Statements.
FIRST EAGLE FUNDS | SEMI-ANNUAL REPORT | APRIL 30, 2013
102
Schedule of Investments | Six-Month Period Ended April 30, 2013 (unaudited)
PRINCIPAL | | DESCRIPTION | | COST (NOTE 1) | | VALUE (NOTE 1) | |
Term Loans — 6.94% — (continued) | | | |
United States 6.94% — (continued) | | | |
| 5,176,591
USD | | | Roundy's Supermarkets, Inc.,
Term Loan B 0.00% — 5.75%
due 02/13/19 (f)(g) | | $ | 4,964,798
| | | $ | 5,111,884
| | |
| 2,057,000
EUR | | | U.S. Coating Acquisition, Inc.,
Term Loan B 0.00% — 5.25%
due 01/18/20 (f)(g) | | | 2,772,893
| | | | 2,744,468
| | |
| 2,963,110
USD | | | Van Wagner Communications,
Term Loan B 8.25% due 08/03/18 | | | 2,997,915
| | | | 3,029,780
| | |
Total Term Loans | | | 22,578,527 | | | | 22,875,006 | | |
Commercial Paper — 7.38% | | | |
International Commercial Paper — 3.73% | | | |
France 3.73% | | | |
| 12,297,000
USD | | | Total SA
0.09% due 05/01/13 | | | 12,297,000
| | | | 12,297,000
| | |
U.S. Commercial Paper — 3.65% | | | |
$ | 3,263,000 | | | Avery Dennison Corporation
0.27% due 05/01/13 | | | 3,263,000
| | | | 3,263,000
| | |
| | 2,377,000 | | | Avery Dennison Corporation
0.28% due 05/01/13 | | | 2,377,000
| | | | 2,377,000
| | |
| | 4,099,000 | | | Coca-Cola Company
0.20% due 05/01/13 | | | 4,099,000
| | | | 4,099,000
| | |
| | 2,295,000 | | | Con Edison, Inc.
0.23% due 05/01/13 | | | 2,295,000
| | | | 2,295,000
| | |
Total U.S. Commercial Paper | | | 12,034,000 | | | | 12,034,000 | | |
Total Commercial Paper | | | 24,331,000 | | | | 24,331,000 | | |
Total Investments — 100.57% | | $ | 318,052,730 | | | | 331,543,616 | | |
Liabilities in Excess of Other Assets — (0.57)% | | | | | (1,867,971 | ) | |
Net Assets — 100.00% | | | | $ | 329,675,645 | | |
(a) Non-income producing security/commodity.
(b) This security is convertible until April 30, 2015.
(c) All or a portion of the security is exempt from registration under the Securities Act of 1933. Rule 144A securities may only be sold to qualified institutional buyers, pursuant to Rule 144A under the Securities Act of 1933.
(d) Security is deemed illiquid. At April 30, 2013, the value of these securities amounted to $1,377,695 or 0.42% of net assets.
(e) Represents a security registered under Regulation S. Bonds sold under Regulation S may not be offered, sold or delivered within the U.S., or for the account or benefit of, U.S. persons, except pursuant to an exemption from, or in a transaction not subject to, the registration requirements of the Securities Act of 1933.
(f) At April 30, 2013, all or a portion of the security was segregated to cover collateral requirements for extended trade settlements.
See Notes to Financial Statements.
FIRST EAGLE FUNDS | SEMI-ANNUAL REPORT | APRIL 30, 2013
103
Global Income Builder Fund
(g) All or a portion of the security represents unsettled loan positions.
At April 30, 2013, cost is substantially identical for both book and federal income tax purposes. Net unrealized appreciation consisted of:
Gross unrealized appreciation | | $ | 19,209,619 | | |
Gross unrealized depreciation | | | (5,718,733 | ) | |
Net unrealized appreciation | | $ | 13,490,886 | | |
Abbreviations used in this schedule include:
ADR — American Depository Receipt
PCL — Public Company Limited
PLC — Public Limited Company
REIT — Real Estate Investment Trust
RSP — Represents Non-Voting Shares
Currencies
EUR — Euro
USD — United States Dollar
Foreign Currency Exchange Contracts — Sales
SETTLEMENT
DATES
THROUGH | | FOREIGN CURRENCY
TO BE DELIVERED | | U.S. $
TO BE
RECEIVED | | U.S. $ VALUE
AT APRIL 30,
2013 | | UNREALIZED
APPRECIATION
AT APRIL 30,
2013 | | UNREALIZED
DEPRECIATION
AT APRIL 30,
2013 | |
06/19/13 | | | 1,265,000 | | | Euro | | $ | 1,647,307 | | | $ | 1,666,453 | | | $ | — | | | $ | (19,146 | ) | |
07/17/13 | | | 12,335,000 | | | Euro | | | 16,262,473 | | | | 16,249,986 | | | | 12,487 | | | | — | | |
08/21/13 | | | 3,429,000 | | | Euro | | | 4,523,566 | | | | 4,518,213 | | | | 5,353 | | | | — | | |
09/18/13 | | | 2,413,000 | | | Euro | | | 3,124,040 | | | | 3,180,960 | | | | — | | | | (56,920 | ) | |
10/16/13 | | | 2,228,000 | | | Euro | | | 2,927,180 | | | | 2,937,747 | | | | — | | | | (10,567 | ) | |
06/19/13 | | | 60,506,000 | | | Japanese Yen | | | 629,707 | | | | 620,820 | | | | 8,887 | | | | — | | |
07/17/13 | | | 60,506,000 | | | Japanese Yen | | | 629,924 | | | | 620,926 | | | | 8,998 | | | | — | | |
08/21/13 | | | 121,012,000 | | | Japanese Yen | | | 1,259,597 | | | | 1,241,788 | | | | 17,809 | | | | — | | |
09/18/13 | | | 89,440,000 | | | Japanese Yen | | | 939,441 | | | | 918,277 | | | | 21,164 | | | | — | | |
10/16/13 | | | 62,904,000 | | | Japanese Yen | | | 633,175 | | | | 645,971 | | | | — | | | | (12,796 | ) | |
| | | | | | | $ | 32,576,410 | | | $ | 32,601,141 | | | $ | 74,698 | | | $ | (99,429 | ) | |
INDUSTRY DIVERSIFICATION FOR PORTFOLIO HOLDINGS | | PERCENT OF
NET ASSETS | |
U.S. Common Stocks | |
Consumer Discretionary | | | 0.57 | % | |
Consumer Staples | | | 3.58 | | |
Energy | | | 1.93 | | |
Financials | | | 2.49 | | |
Industrials | | | 2.43 | | |
Information Technology | | | 5.56 | | |
Materials | | | 0.60 | | |
Utilities | | | 2.49 | | |
Total U.S. Common Stocks | | | 19.65 | | |
See Notes to Financial Statements.
FIRST EAGLE FUNDS | SEMI-ANNUAL REPORT | APRIL 30, 2013
104
Schedule of Investments | Six-Month Period Ended April 30, 2013 (unaudited)
INDUSTRY DIVERSIFICATION FOR PORTFOLIO HOLDINGS — (CONTINUED) | | PERCENT OF
NET ASSETS | |
International Common Stocks | |
Consumer Discretionary | | | 1.54 | % | |
Consumer Staples | | | 5.41 | | |
Energy | | | 4.21 | | |
Financials | | | 4.42 | | |
Health Care | | | 4.11 | | |
Industrials | | | 4.36 | | |
Information Technology | | | 2.23 | | |
Materials | | | 6.51 | | |
Utilities | | | 0.56 | | |
Total International Common Stocks | | | 33.35 | | |
Closed-End Mutual Fund | | | 0.71 | | |
Commodity | | | 0.59 | | |
U.S. Convertible Bond | |
Industrials | | | 1.05 | | |
Total U.S. Convertible Bond | | | 1.05 | | |
U.S. Corporate Bonds | |
Consumer Discretionary | | | 5.54 | | |
Consumer Staples | | | 1.20 | | |
Energy | | | 5.17 | | |
Financials | | | 0.52 | | |
Health Care | | | 0.78 | | |
Industrials | | | 1.27 | | |
Materials | | | 2.19 | | |
Telecommunication Services | | | 2.30 | | |
Total U.S. Corporate Bonds | | | 18.97 | | |
See Notes to Financial Statements.
FIRST EAGLE FUNDS | SEMI-ANNUAL REPORT | APRIL 30, 2013
105
Global Income Builder Fund
INDUSTRY DIVERSIFICATION FOR PORTFOLIO HOLDINGS — (CONTINUED) | | PERCENT OF
NET ASSETS | |
International Corporate Bonds | |
Consumer Discretionary | | | 0.56 | % | |
Energy | | | 1.72 | | |
Financials | | | 1.62 | | |
Industrials | | | 0.67 | | |
Materials | | | 6.24 | | |
Telecommunication Services | | | 1.12 | | |
Total International Corporate Bonds | | | 11.93 | | |
Term Loans | | | 6.94 | | |
Commercial Paper | |
International Commercial Paper | | | 3.73 | | |
U.S. Commercial Paper | | | 3.65 | | |
Total Commercial Paper | | | 7.38 | | |
Total Investments | | | 100.57 | % | |
See Notes to Financial Statements.
FIRST EAGLE FUNDS | SEMI-ANNUAL REPORT | APRIL 30, 2013
106
This page was intentionally left blank.

Fund Overview | Data as of April 30, 2013 (unaudited)
INVESTMENT OBJECTIVE
First Eagle High Yield Fund seeks to provide investors with a high level of current income. To pursue its investment objective the Fund normally invests at least 80% of its net assets in high yield, below investment-grade instruments, or other instruments.
| Average Annual Returns^ | |
| | | ONE-YEAR | | FIVE-YEARS | | SINCE
INCEPTION
(11-19-07) | |
First Eagle
High Yield Fund
(I Shares) | | | 11.80 | % | | | 14.14 | % | | | 13.05 | % | |
Barclays Capital
U.S. Corporate
High Yield Bond Index | | | 13.98 | | | | 11.11 | | | | 10.53 | | |
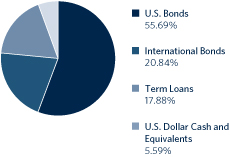
Countries** | |
United States | | | 71.33 | % | |
Canada | | | 4.63 | | |
Cayman Islands | | | 3.06 | | |
Sweden | | | 2.51 | | |
United Kingdom | | | 2.09 | | |
Australia | | | 2.05 | | |
Germany | | | 1.52 | | |
Netherlands | | | 1.48 | | |
Bermuda | | | 1.48 | | |
Ireland | | | 1.36 | | |
Norway | | | 1.17 | | |
France | | | 1.00 | | |
Austria | | | 0.73 | | |
^ Performance figures reflect certain fee waivers and/or expense limitations, without which returns may have been lower.
* Asset Allocation and Countries percentages are based on total investments in the portfolio.
** Country allocations reflect country of the issuer (not currency of issue) and exclude short term investments. Bonds of non-U.S. issuers may be U.S. dollar denominated.
The Fund's portfolio composition is subject to change at any time.
FIRST EAGLE FUNDS | SEMI-ANNUAL REPORT | APRIL 30, 2013
108
Growth of a $10,000 Initial Investment
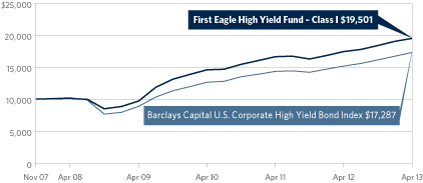
The Adviser has contractually agreed to limit operating expenses of the Fund to an annual rate of 0.80% for I Shares, 1.25% for A Shares, and 2.00% for C Shares, with gross operating expenses of 0.94%, 1.19%, and 1.94% respectively. This limitation excludes certain expenses as described in the Fees and Expenses section of the prospectus. This limitation will continue until December 31, 2013. The expense limitation may be terminated by the Adviser in future years. Performance figures reflect contractual waivers and/or expense limitations, without which total returns may have been lower.
Performance data quoted herein represents past performance and should not be considered indicative of future results. Performance data quoted herein does not reflect the deduction of taxes that a shareholder would pay on Fund distributions or the sale of Fund shares. The average annual returns shown above are historical and reflect changes in share price, reinvested dividends and are net of expenses.
The average annual returns for Class I Shares do not give effect to the deduction of a maximum sales charge.
The Barclays Capital U.S. Corporate High Yield Bond Index is composed of fixed-rate, publicly issued, non-investment grade debt, is unmanaged, with dividends reinvested, and is not available for purchase. The index includes both corporate and non-corporate sectors. The corporate sectors are Industrial, Utility, and Finance, which include both U.S. and non-U.S. corporations. The index is presented here for comparison purposes only. One cannot invest directly in an index.
Top 10 Holdings* | |
| Bi-Lo LLC (U.S. food-retail company) | | | 1.69 | % | |
| Roundy's Supermarkets, Inc. Term Loan B (U.S. wholesale grocery company) | | | 1.53 | | |
| Advanced Micro Devices, Inc. (U.S. integrated circuits manufacturer) | | | 1.44 | | |
| Toys R Us Property Company I (U.S. toy retailer) | | | 1.42 | | |
| HeidelbergCement Finance BV (German building materials manufacturer) | | | 1.36 | | |
| Frontier Communications Corporation (U.S. communications services provider) | | | 1.30 | | |
| CCO Holdings LLC (U.S. cable services provider) | | | 1.29 | | |
| Citgo Petroleum Corporation (U.S. refiner and marketer of transportation fuels) | | | 1.27 | | |
| Tronox Finance LLC (U.S. mineral exploration company) | | | 1.25 | | |
| RDS Ultra-Deepwater Limited (Cayman Islands oil and gas drilling company) | | | 1.24 | | |
Total | | | 13.79 | % | |
* Holdings in cash, commercial paper and other short term cash equivalents have been excluded. Percentages are based on total net assets.
FIRST EAGLE FUNDS | SEMI-ANNUAL REPORT | APRIL 30, 2013
109
First Eagle High Yield Fund
PRINCIPAL | | DESCRIPTION | | COST (NOTE 1) | | VALUE (NOTE 1) | |
Bonds — 76.91% | |
U.S. Convertible Bonds — 2.07% | | | |
$ | 12,650,000 | | | Advanced Micro Devices, Inc.
6.00% due 05/01/15 (a) | | $ | 11,940,005
| | | $ | 12,839,750
| | |
| | 1,915,000 | | | Headwaters, Inc.
8.75% due 02/01/16 (b) | | | 1,956,477
| | | | 2,117,272
| | |
| | 3,452,000 | | | RadioShack Corporation
2.50% due 08/01/13 (c)(d) | | | 3,413,923
| | | | 3,426,110
| | |
Total U.S. Convertible Bonds | | | 17,310,405 | | | | 18,383,132 | | |
U.S. Corporate Bonds — 53.90% | | | |
| | 766,000 | | | Affinia Group, Inc.
7.75% due 05/01/21 (d) | | | 766,000
| | | | 791,853
| | |
| | 4,037,000 | | | Air Medical Group Holdings, Inc.
9.25% due 11/01/18 | | | 4,270,029
| | | | 4,491,163
| | |
| | 5,221,000 | | | Aleris International, Inc.
7.875% due 11/01/20 | | | 5,218,113
| | | | 5,677,837
| | |
| | 9,931,000 | | | Alliance One International, Inc.
10.00% due 07/15/16 | | | 9,971,850
| | | | 10,595,384
| | |
| | 2,909,000 | | | American Axle & Manufacturing, Inc.
6.25% due 03/15/21 | | | 2,909,000
| | | | 3,079,904
| | |
| | 3,478,000 | | | American Axle & Manufacturing, Inc.
6.625% due 10/15/22 | | | 3,522,722
| | | | 3,734,503
| | |
| | 9,825,000 | | | Appleton Papers, Inc.
10.50% due 06/15/15 (d) | | | 10,114,539
| | | | 10,414,500
| | |
| | 8,672,000 | | | Atlas Energy Holdings Operating
Company LLC
7.75% due 01/15/21 (d)(e) | | | 8,690,563
| | | | 8,541,920
| | |
| | 1,157,000 | | | Atlas Pipeline Partners L.P.
5.875% due 08/01/23 (d) | | | 1,157,000
| | | | 1,191,710
| | |
| | 2,950,000 | | | Atwood Oceanics, Inc.
6.50% due 02/01/20 | | | 3,075,383
| | | | 3,230,250
| | |
| | 6,238,000 | | | Basic Energy Services, Inc.
7.75% due 02/15/19 | | | 6,165,557
| | | | 6,549,900
| | |
| | 3,475,000 | | | Basic Energy Services, Inc.
7.75% due 10/15/22 | | | 3,475,000
| | | | 3,674,813
| | |
| | 13,625,000 | | | Bi-Lo LLC
9.25% due 02/15/19 (d) | | | 14,391,754
| | | | 14,987,500
| | |
| | 1,925,000 | | | Bon-Ton Department Stores, Inc.
10.25% due 03/15/14 | | | 1,917,295
| | | | 1,946,656
| | |
| | 6,410,000 | | | Bon-Ton Department Stores, Inc.
10.625% due 07/15/17 | | | 5,164,221
| | | | 6,482,112
| | |
| | 7,687,800 | | | Brickman Group Holdings, Inc.
9.125% due 11/01/18 (d)(e) | | | 7,693,326
| | | | 8,408,531
| | |
| | 7,625,000 | | | Carrizo Oil & Gas, Inc.
8.625% due 10/15/18 | | | 7,912,712
| | | | 8,482,812
| | |
See Notes to Financial Statements.
FIRST EAGLE FUNDS | SEMI-ANNUAL REPORT | APRIL 30, 2013
110
Schedule of Investments | Six-Month Period Ended April 30, 2013 (unaudited)
PRINCIPAL | | DESCRIPTION | | COST (NOTE 1) | | VALUE (NOTE 1) | |
U.S. Corporate Bonds — 53.90% — (continued) | | | |
$ | 441,000 | | | CCO Holdings LLC
6.625% due 01/31/22 | | $ | 456,564
| | | $ | 487,305
| | |
| | 10,210,000 | | | CCO Holdings LLC
7.375% due 06/01/20 | | | 11,125,289
| | | | 11,511,775
| | |
| | 9,810,000 | | | Citgo Petroleum Corporation
11.50% due 07/01/17 (d) | | | 10,773,514
| | | | 11,330,550
| | |
| | 8,522,000 | | | Cleaver-Brooks, Inc.
8.75% due 12/15/19 (d) | | | 8,771,972
| | | | 9,416,810
| | |
| | 2,150,000 | | | Cloud Peak Energy Resources
8.25% due 12/15/17 | | | 2,263,470
| | | | 2,322,000
| | |
| | 110,000 | | | Cloud Peak Energy Resources
8.50% due 12/15/19 | | | 110,754
| | | | 121,000
| | |
| | 4,547,000 | | | Coinstar, Inc.
6.00% due 03/15/19 (d) | | | 4,594,250
| | | | 4,728,880
| | |
| | 8,073,000 | | | CommScope, Inc.
8.25% due 01/15/19 (d) | | | 8,493,425
| | | | 8,860,117
| | |
| | 10,283,000 | | | Drill Rigs Holdings, Inc.
6.50% due 10/01/17 (d) | | | 10,379,815
| | | | 10,462,952
| | |
| | 7,400,000 | | | DriveTime Automotive Group, Inc.
12.625% due 06/15/17 | | | 8,069,598
| | | | 8,315,750
| | |
| | 3,500,000 | | | DriveTime Automotive Group, Inc.
12.625% due 06/15/17 (d) | | | 3,885,000
| | | | 3,933,125
| | |
| | 4,000,000 | | | EP Energy LLC
9.375% due 05/01/20 | | | 4,049,601
| | | | 4,680,000
| | |
| | 1,325,000 | | | Everest Acquisition LLC
6.875% due 05/01/19 | | | 1,351,847
| | | | 1,457,500
| | |
| | 7,320,000 | | | Fiesta Restaurant Group, Inc.
8.875% due 08/15/16 | | | 7,691,304
| | | | 7,969,650
| | |
| | 10,036,000 | | | Frontier Communications Corporation
8.50% due 04/15/20 | | | 10,908,452
| | | | 11,591,580
| | |
| | 7,409,000 | | | GenCorp, Inc.
7.125% due 03/15/21 (d) | | | 7,708,139
| | | | 8,020,242
| | |
| | 7,107,000 | | | Goodman Networks, Inc.
13.125% due 07/01/18 (d)(e) | | | 7,368,275
| | | | 7,924,305
| | |
| | 6,970,000 | | | Headwaters, Inc.
7.625% due 04/01/19 | | | 6,901,677
| | | | 7,579,875
| | |
| | 3,000,000 | | | Huntington Ingalls Industries, Inc.
6.875% due 03/15/18 | | | 3,136,361
| | | | 3,333,750
| | |
| | 5,762,000 | | | Huntington Ingalls Industries, Inc.
7.125% due 03/15/21 | | | 6,145,613
| | | | 6,439,035
| | |
| | 3,350,000 | | | Interface, Inc.
7.625% due 12/01/18 | | | 3,568,431
| | | | 3,655,688
| | |
See Notes to Financial Statements.
FIRST EAGLE FUNDS | SEMI-ANNUAL REPORT | APRIL 30, 2013
111
PRINCIPAL | | DESCRIPTION | | COST (NOTE 1) | | VALUE (NOTE 1) | |
U.S. Corporate Bonds — 53.90% — (continued) | | | |
$ | 6,000,000 | | | International Lease Finance Corporation
5.875% due 04/01/19 | | $ | 6,244,452
| | | $ | 6,614,340
| | |
| | 5,210,000 | | | International Lease Finance Corporation
6.25% due 05/15/19 | | | 5,314,133
| | | | 5,867,762
| | |
| | 2,000,000 | | | International Lease Finance Corporation
8.625% due 09/15/15 | | | 2,132,796
| | | | 2,287,500
| | |
| | 2,205,000 | | | JC Penney Corporation, Inc. Series A
6.875% due 10/15/15 | | | 2,184,662
| | | | 2,224,294
| | |
| | 5,937,000 | | | JMC Steel Group
8.25% due 03/15/18 (d)(e) | | | 6,067,235
| | | | 6,241,271
| | |
| | 10,333,000 | | | Kemet Corporation
10.50% due 05/01/18 | | | 10,553,964
| | | | 10,849,650
| | |
| | 3,646,000 | | | Kraton Polymers
6.75% due 03/01/19 | | | 3,726,640
| | | | 3,837,415
| | |
| | 6,500,000 | | | Landry's, Inc.
9.375% due 05/01/20 (d) | | | 6,681,178
| | | | 7,190,625
| | |
| | 2,245,000 | | | Manitowoc Company, Inc.
9.50% due 02/15/18 | | | 2,401,319
| | | | 2,480,725
| | |
| | 5,684,000 | | | Mcron Finance Corporation
8.375% due 05/15/19 (d) | | | 5,760,815
| | | | 6,280,820
| | |
| | 9,225,000 | | | Mead Products
6.75% due 04/30/20 (d) | | | 9,623,018
| | | | 9,847,687
| | |
| | 762,000 | | | Milacron LLC
7.75% due 02/15/21 (d) | | | 762,000
| | | | 796,290
| | |
| | 9,372,000 | | | New Albertsons, Inc.
7.25% due 05/01/13 | | | 9,372,000
| | | | 9,372,000
| | |
| | 2,274,000 | | | Noranda Aluminum
Acquisition Corporation
11.00% due 06/01/19 (d)(e) | | | 2,274,000
| | | | 2,262,630
| | |
| | 4,300,000 | | | Parker Drilling Company
9.125% due 04/01/18 | | | 4,495,604
| | | | 4,730,000
| | |
| | 2,919,000 | | | PHH Corporation
9.25% due 03/01/16 | | | 2,937,064
| | | | 3,437,123
| | |
| | 3,750,000 | | | Post Holdings, Inc.
7.375% due 02/15/22 | | | 3,884,006
| | | | 4,181,250
| | |
| | 3,729,000 | | | Quality Distribution
9.875% due 11/01/18 | | | 4,009,694
| | | | 4,157,835
| | |
| | 9,800,000 | | | Quiksilver, Inc.
6.875% due 04/15/15 | | | 9,800,000
| | | | 9,824,696
| | |
| | 6,386,000 | | | Radio Systems Corporation
8.375% due 11/01/19 (d) | | | 6,531,969
| | | | 6,960,740
| | |
| | 6,879,000 | | | Rentech Nitrogen Partners L.P.
6.50% due 04/15/21 (d) | | | 7,002,305
| | | | 7,076,771
| | |
| | 6,240,000 | | | Rex Energy Corporation
8.875% due 12/01/20 (d)(e) | | | 6,216,315
| | | | 6,684,600
| | |
See Notes to Financial Statements.
FIRST EAGLE FUNDS | SEMI-ANNUAL REPORT | APRIL 30, 2013
112
Schedule of Investments | Six-Month Period Ended April 30, 2013 (unaudited)
PRINCIPAL | | DESCRIPTION | | COST (NOTE 1) | | VALUE (NOTE 1) | |
U.S. Corporate Bonds — 53.90% — (continued) | | | |
$ | 8,846,000 | | | ROC Finance
12.125% due 09/01/18 (d) | | $ | 9,946,593
| | | $ | 10,438,280
| | |
| | 1,148,000 | | | Rosetta Resources, Inc.
5.625% due 05/01/21 | | | 1,148,000
| | | | 1,198,225
| | |
| | 3,950,000 | | | Samson Investment Company
9.75% due 02/15/20 (d) | | | 4,063,624
| | | | 4,216,625
| | |
| | 9,275,000 | | | SandRidge Energy, Inc.
7.50% due 02/15/23 | | | 9,450,012
| | | | 9,599,625
| | |
| | 8,363,000 | | | Seitel, Inc.
9.50% due 04/15/19 (d) | | | 8,404,052
| | | | 8,760,242
| | |
| | 2,690,000 | | | Shea Homes L.P.
8.625% due 05/15/19 | | | 2,720,727
| | | | 3,069,963
| | |
| | 6,430,990 | | | Sheridan Group, Inc.
12.50% due 04/15/14 | | | 5,839,130
| | | | 6,447,068
| | |
| | 6,982,000 | | | STHI Holding Corporation
8.00% due 03/15/18 (d) | | | 7,501,046
| | | | 7,680,200
| | |
| | 8,516,000 | | | Sugarhouse HSP Gaming Prop Mezz L.P.
8.625% due 04/15/16 (d) | | | 9,000,888
| | | | 9,144,055
| | |
| | 7,264,000 | | | Taylor Morrison Communities, Inc.
7.75% due 04/15/20 (d) | | | 7,662,830
| | | | 8,190,160
| | |
| | 2,714,000 | | | Tower Automotive Holdings USA
10.625% due 09/01/17 (d) | | | 2,978,048
| | | | 2,900,615
| | |
| | 11,781,000 | | | Toys R Us Property Company I
10.75% due 07/15/17 | | | 12,515,511
| | | | 12,649,849
| | |
| | 1,745,000 | | | Toys R Us Property Company II
8.50% due 12/01/17 | | | 1,810,404
| | | | 1,882,419
| | |
| | 11,082,000 | | | Tronox Finance LLC
6.375% due 08/15/20 (d) | | | 11,197,436
| | | | 11,095,852
| | |
| | 4,650,000 | | | United Rentals North America, Inc.
7.375% due 05/15/20 | | | 4,719,817
| | | | 5,289,375
| | |
| | 200,000 | | | United Rentals North America, Inc.
7.625% due 04/15/22 | | | 200,000
| | | | 230,500
| | |
| | 3,064,000 | | | Wolverine World Wide, Inc.
6.125% due 10/15/20 (d) | | | 3,115,108
| | | | 3,351,250
| | |
| | 10,238,000 | | | Yankee Candle Company, Inc. Series 'B'
9.75% due 02/15/17 | | | 10,538,742
| | | | 10,634,825
| | |
| | 2,839,000 | | | YCC Holdings
10.25% due 02/15/16 (f) | | | 2,818,978
| | | | 2,945,491
| | |
Total U.S. Corporate Bonds | | | 457,774,530 | | | | 479,353,880 | | |
See Notes to Financial Statements.
FIRST EAGLE FUNDS | SEMI-ANNUAL REPORT | APRIL 30, 2013
113
PRINCIPAL | | DESCRIPTION | | COST (NOTE 1) | | VALUE (NOTE 1) | |
International Corporate Bonds — 20.94% | | | |
Australia 2.06% | | | |
| 7,544,000
USD | | | Ausdrill Finance Pty Limited
6.875% due 11/01/19 (d)(e) | | $ | 7,551,476
| | | $ | 7,676,020
| | |
| 10,296,000
USD | | | Nufarm Australia Limited
6.375% due 10/15/19 (d) | | | 10,624,687
| | | | 10,630,620
| | |
| | | | 18,176,163 | | | | 18,306,640 | | |
Austria 0.74% | | | |
| 2,326,000
USD | | | OGX Austria GmbH
8.375% due 04/01/22 (d) | | | 2,323,193
| | | | 1,424,675
| | |
| 8,128,000
USD | | | OGX Austria GmbH
8.50% due 06/01/18 (d) | | | 7,255,304
| | | | 5,140,960
| | |
| | | | 9,578,497 | | | | 6,565,635 | | |
Bermuda 1.48% | | | |
| 5,325,000
USD | | | Aircastle Limited
7.625% due 04/15/20 | | | 5,489,043
| | | | 6,310,125
| | |
| 6,150,000
USD | | | Viking Cruises, Limited
8.50% due 10/15/22 (d) | | | 6,313,655
| | | | 6,903,375
| | |
| | | | 11,802,698 | | | | 13,213,500 | | |
Canada 3.94% | | | |
| 10,081,000
USD | | | Mood Media Corporation
9.25% due 10/15/20 (d) | | | 10,570,342
| | | | 10,081,000
| | |
| 3,792,000
USD | | | New Gold, Inc.
7.00% due 04/15/20 (d) | | | 3,856,561
| | | | 4,038,480
| | |
| 7,729,000
USD | | | PetroBakken Energy Limited
8.625% due 02/01/20 (d) | | | 7,824,623
| | | | 7,999,515
| | |
| 1,087,000
USD | | | Precision Drilling Corporation
6.50% due 12/15/21 | | | 1,120,341
| | | | 1,182,112
| | |
| 2,550,000
USD | | | Thompson Creek Metals Company, Inc.
7.375% due 06/01/18 | | | 2,250,293
| | | | 2,097,375
| | |
| 7,214,000
USD | | | Thompson Creek Metals Company, Inc.
9.75% due 12/01/17 | | | 7,534,223
| | | | 7,718,980
| | |
| 2,000,000
USD | | | Thompson Creek Metals Company, Inc.
12.50% due 05/01/19 | | | 2,015,429
| | | | 1,910,000
| | |
| | | | 35,171,812 | | | | 35,027,462 | | |
Cayman Islands 3.07% | | | |
| 6,350,000
USD | | | Marfrig Overseas Limited
9.50% due 05/04/20 (d) | | | 5,739,462
| | | | 5,842,000
| | |
| 9,700,000
USD | | | Offshore Group Investment Limited
7.50% due 11/01/19 (d) | | | 9,705,714
| | | | 10,500,250
| | |
| 9,877,000
USD | | | RDS Ultra-Deepwater Limited
11.875% due 03/15/17 (d) | | | 10,865,728
| | | | 10,988,163
| | |
| | | | 26,310,904 | | | | 27,330,413 | | |
See Notes to Financial Statements.
FIRST EAGLE FUNDS | SEMI-ANNUAL REPORT | APRIL 30, 2013
114
Schedule of Investments | Six-Month Period Ended April 30, 2013 (unaudited)
PRINCIPAL | | DESCRIPTION | | COST (NOTE 1) | | VALUE (NOTE 1) | |
International Corporate Bonds — 20.94% — (continued) | | | |
France 1.00% | | | |
| 3,500,000
USD | | | Rexel SA
5.25% due 06/15/20 (d) | | $ | 3,499,341
| | | $ | 3,710,000
| | |
| 4,805,000
USD | | | Rexel SA
6.125% due 12/15/19 (d) | | | 4,856,600
| | | | 5,189,400
| | |
| | | | 8,355,941 | | | | 8,899,400 | | |
Ireland 1.37% | | | |
| 2,891,000
USD | | | Ardagh Packaging Finance PLC
7.00% due 11/15/20 (d) | | | 2,891,000
| | | | 3,064,460
| | |
| 8,031,000
USD | | | Ardagh Packaging Finance PLC
9.125% due 10/15/20 (d) | | | 8,326,184
| | | | 9,085,030
| | |
| | | | 11,217,184 | | | | 12,149,490 | | |
Netherlands 1.49% | | | |
| 7,215,000
EUR | | | HeidelbergCement Finance BV
8.50% due 10/31/19 (g) | | | 10,466,297
| | | | 12,126,553
| | |
| 1,205,000
USD | | | Marfrig Holding Europe BV
9.875% due 07/24/17 (d) | | | 1,226,764
| | | | 1,132,700
| | |
| | | | 11,693,061 | | | | 13,259,253 | | |
Norway 1.17% | | | |
| 10,755,000
USD | | | Eksportfinans ASA
2.00% due 09/15/15 | | | 9,891,802
| | | | 10,422,165
| | |
Sweden 2.52% | | | |
| 688,037
USD | | | Eileme 1 AB
14.25% due 08/15/20 (d)(e)(f) | | | 660,372
| | | | 782,642
| | |
| 2,850,000
USD | | | Eileme 2 AB
11.625% due 01/31/20 (d) | | | 2,942,518
| | | | 3,412,875
| | |
| 4,450,000
EUR | | | Eileme 2 AB
11.75% due 01/31/20 (d) | | | 5,972,091
| | | | 6,967,021
| | |
| 7,750,000
USD | | | Perstorp Holding AB
8.75% due 05/15/17 (d) | | | 7,803,252
| | | | 8,379,687
| | |
| 1,000,000
EUR | | | Perstorp Holding AB
9.00% due 05/15/17 (d) | | | 1,399,539
| | | | 1,434,058
| | |
| 1,000,000
EUR | | | Perstorp Holding AB
9.00% due 05/15/17 (g) | | | 1,361,490
| | | | 1,434,058
| | |
| | | | 20,139,262 | | | | 22,410,341 | | |
United Kingdom 2.10% | | | |
| 4,400,000
USD | | | Ineos Finance PLC
8.375% due 02/15/19 (d) | | | 4,572,975
| | | | 4,977,500
| | |
| 790,000
USD | | | Jaguar Land Rover PLC
5.625% due 02/01/23 (d) | | | 790,000
| | | | 829,500
| | |
| 5,700,000
USD | | | Jaguar Land Rover PLC
8.125% due 05/15/21 (d) | | | 5,874,721
| | | | 6,555,000
| | |
See Notes to Financial Statements.
FIRST EAGLE FUNDS | SEMI-ANNUAL REPORT | APRIL 30, 2013
115
PRINCIPAL | | DESCRIPTION | | COST (NOTE 1) | | VALUE (NOTE 1) | |
International Corporate Bonds — 20.94% — (continued) | | | |
United Kingdom 2.10% — (continued) | | | |
| 500,000
EUR | | | Viridian Group FundCo II
11.125% due 04/01/17 (d) | | $ | 599,835
| | | $ | 715,384
| | |
| 5,200,000
USD | | | Viridian Group FundCo II
11.125% due 04/01/17 (d) | | | 5,032,993
| | | | 5,603,000
| | |
| | | | 16,870,524 | | | | 18,680,384 | | |
Total International Corporate Bonds Bonds | | | 179,207,848 | | | | 186,264,683 | | |
Total Bonds | | | 654,292,783 | | | | 684,001,695 | | |
Term Loans — 17.97% | | | |
Canada 0.71% | | | |
| 6,202,655
USD | | | Essar Steel Algoma, Inc., ABL Term Loan
8.75% due 09/20/14 | | | 6,172,039
| | | | 6,339,629
| | |
Germany 1.53% | | | |
| 8,470,988
USD | | | Grohe Holding GMBH, Term Loan B
6.75% due 05/16/17 | | | 8,404,436
| | | | 8,523,931
| | |
| 3,790,000
EUR | | | Schaeffler AG, Term Loan C2
due 01/27/17 (h)(i) | | | 4,632,902
| | | | 5,032,185
| | |
| | | | 13,037,338 | | | | 13,556,116 | | |
United States 15.73% | | | |
| 9,635,850
USD | | | Alcatel-Lucent, Term Loan C
7.25% due 01/30/19 | | | 9,766,347
| | | | 9,894,813
| | |
| 961,590
USD | | | Ameriforge Group, Inc.,
First Lien Term Loan
6.00% due 12/19/19 | | | 956,883
| | | | 977,216
| | |
| 7,230,000
USD | | | Ameriforge Group, Inc.,
Second Lien Term Loan
8.75% due 12/18/20 | | | 7,376,959
| | | | 7,464,975
| | |
| 9,171,000
USD | | | Atkins Nutritionals, Inc.,
First Lien Term Loan
6.25% due 01/02/19 | | | 9,100,887
| | | | 9,216,855
| | |
| 1,528,000
USD | | | Atkins Nutritionals, Inc.,
Second Lien Term Loan
9.75% due 04/03/19 | | | 1,497,639
| | | | 1,547,100
| | |
| 2,242,000
USD | | | Calceus Acquisition, Inc.
5.75% due 02/01/20 | | | 2,231,065
| | | | 2,278,432
| | |
| 2,873,063
USD | | | Cannery Casino Resorts LLC, Term Loan B
6.00% due 10/02/18 | | | 2,847,015
| | | | 2,939,502
| | |
| 5,712,500
USD | | | Cannery Casino Resorts LLC,
Second Lien Term Loan
10.00% due 10/02/19 | | | 5,588,387
| | | | 5,658,945
| | |
| 4,109,000
USD | | | Caraustar Industry, Inc.
due 04/10/19 (h)(i) | | | 4,136,882
| | | | 4,150,090
| | |
See Notes to Financial Statements.
FIRST EAGLE FUNDS | SEMI-ANNUAL REPORT | APRIL 30, 2013
116
Schedule of Investments | Six-Month Period Ended April 30, 2013 (unaudited)
PRINCIPAL | | DESCRIPTION | | COST (NOTE 1) | | VALUE (NOTE 1) | |
Term Loans — 17.97% — (continued) | | | |
United States 15.73% — (continued) | | | |
| 767,000
USD | | | CBAC Borrowers LLC
due 04/24/20 (h)(i) | | $ | 759,330
| | | $ | 770,835
| | |
| 8,822,887
USD | | | Dematic S.A.
5.25% due 12/27/19 | | | 8,840,819
| | | | 8,914,796
| | |
| 7,263,500
USD | | | Fortescue Metals Group
5.25% due 10/18/17 | | | 7,223,999
| | | | 7,393,132
| | |
| 8,392,000
USD | | | Hostess Brands, Inc.
0.00% - 6.75% due 03/12/20 (h)(i) | | | 8,491,619
| | | | 8,617,535
| | |
| 6,859,808
USD | | | NEP Supershooters L.P.
4.75% due 01/22/20 | | | 6,871,488
| | | | 6,977,714
| | |
| 2,890,857
USD | | | NEP Supershooters, L.P.,
Second Lien Term Loan
9.50% due 08/18/20 | | | 2,995,435
| | | | 3,023,354
| | |
| 13,777,061
USD | | | Roundy's Supermarkets, Inc.,
Term Loan B
0.00% -5.75% due 02/13/19 (h)(i) | | | 13,468,073
| | | | 13,604,848
| | |
| 8,361,000
USD | | | Supervalu, Inc., Term Loan B
0.00% - 6.25% due 03/21/19 (h)(i) | | | 8,419,111
| | | | 8,500,353
| | |
| 2,297,000
USD | | | Tower International, Inc.
due 04/16/20 (h)(i) | | | 2,285,515
| | | | 2,337,197
| | |
| 7,396,000
EUR | | | U.S. Coating Acquisition, Inc.,
Term Loan B
0.00% - 5.25% due 02/01/20 (h)(i) | | | 9,973,864
| | | | 9,867,811
| | |
| 10,684,310
USD | | | Van Wagner Communications LLC,
Term Loan B
8.25% due 08/03/18 | | | 10,714,123
| | | | 10,924,707
| | |
| 9,104,000
USD | | | Veyance Technologies, Inc.,
First Lien Term Loan
5.25% due 09/08/17 | | | 8,970,987
| | | | 9,181,766
| | |
| 5,606,250
USD | | | Wilton Brands LLC
7.50% due 08/30/18 | | | 5,503,839
| | | | 5,683,336
| | |
| | | | | | | | 138,020,266 | | | | 139,925,312 | | |
Total Term Loans | | | 157,229,643 | | | | 159,821,057 | | |
Commercial Paper — 5.62% | | | |
International Commercial Paper — 2.84% | | | |
France 2.84% | | | |
| 25,245,000
USD | | | Total SA
0.09% due 05/01/13 | | | 25,245,000
| | | | 25,245,000
| | |
U.S. Commercial Paper — 2.78% | | | |
$ | 6,698,000 | | | Avery Dennison Corporation
0.27% d13-11830-2ue 05/01/13 | | | 6,698,000
| | | | 6,698,000
| | |
See Notes to Financial Statements.
FIRST EAGLE FUNDS | SEMI-ANNUAL REPORT | APRIL 30, 2013
117
PRINCIPAL | | DESCRIPTION | | COST (NOTE 1) | | VALUE (NOTE 1) | |
Commercial Paper — 5.62% — (continued) | | | |
U.S. Commercial Paper — 2.78% — (continued) | | | |
$ | 4,881,000 | | | Avery Dennison Corporation
0.28% due 05/01/13 | | $ | 4,881,000
| | | $ | 4,881,000
| | |
| | 8,415,000 | | | Coca-Cola Company
0.20% due 05/01/13 | | | 8,415,000
| | | | 8,415,000
| | |
| | 4,712,000 | | | Con Edison, Inc.
0.23% due 05/01/13 | | | 4,712,000
| | | | 4,712,000
| | |
Total U.S. Commercial Paper | | | 24,706,000 | | | | 24,706,000 | | |
Total Commercial Paper | | | 49,951,000 | | | | 49,951,000 | | |
Total Investments — 100.50% | | $ | 861,473,426 | | | | 893,773,752 | | |
Liabilities in Excess of Other Assets — (0.50)% | | | | | (4,444,907 | ) | |
Net Assets — 100.00% | | | | $ | 889,328,845 | | |
(a) This security is convertible until April 30, 2015.
(b) This security is convertible until January 27, 2016.
(c) This security is convertible until July 29, 2013.
(d) All or a portion of the security is exempt from registration under the Securities Act of 1933. Rule 144A securities may only be sold to qualified institutional buyers, pursuant to Rule 144A under the Securities Act of 1933.
(e) Security is deemed illiquid. At April 30, 2013, the value of these securities amounted to $48,521,919 or 5.46% of net assets.
(f) Payment-in-kind security.
(g) Represents a security registered under Regulation S. Bonds sold under Regulation S may not be offered, sold or delivered within the U.S., or for the account or benefit of, U.S. persons, except pursuant to an exemption from, or in a transaction not subject to, the registration requirements of the Securities Act of 1933.
(h) All or a portion of the security represents unsettled loan positions.
(i) At April 30, 2013, all or a portion of the security was segregated to cover collateral requirements for extended trade settlements.
See Notes to Financial Statements.
FIRST EAGLE FUNDS | SEMI-ANNUAL REPORT | APRIL 30, 2013
118
Schedule of Investments | Six-Month Period Ended April 30, 2013 (unaudited)
At April 30, 2013, cost is substantially identical for both book and federal income tax purposes. Net unrealized appreciation consisted of:
Gross unrealized appreciation | | $ | 36,600,024 | | |
Gross unrealized depreciation | | | (4,299,698 | ) | |
Net unrealized appreciation | | $ | 32,300,326 | | |
Abbreviations used in this schedule include:
PLC — Public Limited Company
Currencies
EUR — Euro
USD — United States Dollar
Foreign Currency Exchange Contracts — Sales
SETTLEMENT
DATES
THROUGH | | FOREIGN CURRENCY
TO BE DELIVERED | | U.S. $
TO BE
RECEIVED | | U.S. $ VALUE
AT APRIL 30,
2013 | | UNREALIZED
APPRECIATION
AT APRIL 30,
2013 | | UNREALIZED
DEPRECIATION
AT APRIL 30,
2013 | |
06/19/13 | | | 27,760,000 | | | Euro | | $ | 35,763,440 | | | $ | 36,569,760 | | | $ | — | | | $ | (806,320 | ) | |
INDUSTRY DIVERSIFICATION FOR PORTFOLIO HOLDINGS | | PERCENT OF
NET ASSETS | |
U.S. Convertible Bonds | |
Consumer Discretionary | | | 0.39 | % | |
Industrials | | | 1.68 | | |
Total U.S. Convertible Bonds | | | 2.07 | | |
U.S. Corporate Bonds | |
Consumer Discretionary | | | 16.30 | | |
Consumer Staples | | | 3.97 | | |
Energy | | | 10.91 | | |
Financials | | | 2.83 | | |
Health Care | | | 0.86 | | |
Industrials | | | 9.11 | | |
Materials | | | 5.39 | | |
Telecommunication Services | | | 4.53 | | |
Total U.S. Corporate Bonds | | | 53.90 | | |
See Notes to Financial Statements.
FIRST EAGLE FUNDS | SEMI-ANNUAL REPORT | APRIL 30, 2013
119
INDUSTRY DIVERSIFICATION FOR PORTFOLIO HOLDINGS — (CONTINUED) | | PERCENT OF
NET ASSETS | |
International Corporate Bonds | |
Consumer Discretionary | | | 1.60 | % | |
Consumer Staples | | | 0.79 | | |
Energy | | | 4.18 | | |
Financials | | | 2.74 | | |
Industrials | | | 2.37 | | |
Materials | | | 6.16 | | |
Telecommunication Services | | | 2.39 | | |
Utilities | | | 0.71 | | |
Total International Corporate Bonds | | | 20.94 | | |
Term Loans | | | 17.97 | | |
Commercial Paper | |
International Commercial Paper | | | 2.84 | | |
U.S. Commercial Paper | | | 2.78 | | |
Total Commercial Paper | | | 5.62 | | |
Total Investments | | | 100.50 | % | |
See Notes to Financial Statements.
FIRST EAGLE FUNDS | SEMI-ANNUAL REPORT | APRIL 30, 2013
120
This page was intentionally left blank.

Fund Overview | Data as of April 30, 2013 (unaudited)
INVESTMENT OBJECTIVE
First Eagle Fund of America seeks capital appreciation by investing primarily in domestic stocks and to a lesser extent, in debt and foreign equity securities. The Fund has a unique event-driven bias that focuses on identifying companies poised to benefit from change that the market has not yet recognized.
Average Annual Returns | |
| | | ONE-YEAR | | FIVE-YEARS | | TEN-YEARS | |
First Eagle Fund
of America
(Y Shares) | | | 17.28 | % | | | 6.42 | % | | | 10.41 | % | |
Standard & Poor's
500 Index | | | 16.89 | | | | 5.21 | | | | 7.88 | | |
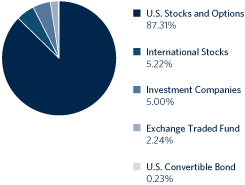
Sector/Industry** | |
Materials | | | 28.68 | % | |
Health Care | | | 24.10 | | |
Consumer Discretionary | | | 12.75 | | |
Information Technology | | | 12.19 | | |
Energy | | | 8.90 | | |
Industrials | | | 7.56 | | |
Exchange Traded Funds | | | 2.24 | | |
Telecommunications | | | 1.61 | | |
* Asset Allocation and Sector/Industry percentages are based on total investments in the portfolio.
** Sector/Industry allocations exclude short term investments and options positions.
The Fund's portfolio composition is subject to change at any time.
FIRST EAGLE FUNDS | SEMI-ANNUAL REPORT | APRIL 30, 2013
122
Growth of a $10,000 Initial Investment
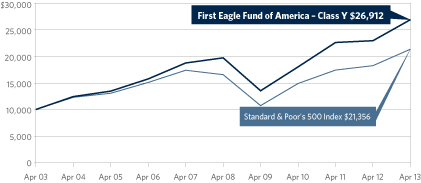
Performance data quoted herein represents past performance and should not be considered indicative of future results. Performance data quoted herein does not reflect the deduction of taxes that a shareholder would pay on Fund distributions or the sale of Fund shares. The Fund's average annual returns shown above are historical and reflect changes in share price, reinvested dividends and is net of expenses.
The Standard & Poor's 500 Index is a widely recognized unmanaged index including a representative sample of 500 leading companies in leading sectors of the U.S. economy and is not available for purchase. Although the Standard & Poor's 500 Index focuses on the large-cap segment of the market, with approximately 75% coverage of U.S. equities, it is also considered a proxy for the total market.
Top 10 Holdings* | |
| Pfizer, Inc. (biopharmaceutical company) | | | 6.03 | % | |
| Eastman Chemical Company (chemicals company) | | | 5.83 | | |
| Wyndham Worldwide Corporation (hotel and resorts) | | | 5.57 | | |
| Valeant Pharmaceuticals International, Inc. (pharmaceuticals company) | | | 5.02 | | |
| Occidental Petroleum Corporation (oil and gas production and exploration) | | | 4.82 | | |
| Omnicare, Inc. (pharmaceutical company) | | | 4.68 | | |
| Seagate Technology PLC (hard disk drive manufacturer) | | | 4.15 | | |
| Rockwood Holdings, Inc. (specialty chemicals manufacturer) | | | 4.09 | | |
| WR Grace & Company (chemicals and materials manufacturer) | | | 4.04 | | |
| Packaging Corporation of America (container and packaging producer) | | | 3.68 | | |
Total | | | 47.91 | % | |
* Holdings in cash, money market funds and other short term cash equivalents have been excluded. Percentages are based on total net assets.
FIRST EAGLE FUNDS | SEMI-ANNUAL REPORT | APRIL 30, 2013
123
First Eagle Fund of America
SHARES | | DESCRIPTION | | COST (NOTE 1) | | VALUE (NOTE 1) | |
Common Stocks — 96.06% | |
U.S. Common Stocks — 90.82% | | | |
Consumer Discretionary 12.82% | | | |
| | 1,890,800 | | | Wyndham Worldwide Corporation (a) | | $ | 63,344,693 | | | $ | 113,599,264 | | |
| | 1,066,200 | | | Viacom, Inc., Class 'B' (a) | | | 56,271,168 | | | | 68,226,138 | | |
| | 4,267,970 | | | Interpublic Group of
Companies, Inc. (a) | | | 45,569,658
| | | | 59,068,705
| | |
| | 533,000 | | | Lowe's Companies, Inc. (a) | | | 20,665,633 | | | | 20,477,860 | | |
| | | | 185,851,152 | | | | 261,371,967 | | |
Energy 8.94% | | | |
| | 1,100,260 | | | Occidental Petroleum Corporation (a) | | | 98,529,220 | | | | 98,209,207 | | |
| | 857,590 | | | Dresser-Rand Group, Inc. (a)(b) | | | 35,830,301 | | | | 47,690,580 | | |
| | 601,300 | | | Atlas Energy L.P. (a) | | | 11,886,916 | | | | 30,185,260 | | |
| | 121,200 | | | SemGroup Corporation, Class 'A' (a)(b) | | | 5,511,752 | | | | 6,284,220 | | |
| | | | 151,758,189 | | | | 182,369,267 | | |
Health Care 21.57% | | | |
| | 4,230,900 | | | Pfizer, Inc. (a) | | | 87,304,162 | | | | 122,992,263 | | |
| | 1,345,942 | | | Valeant Pharmaceuticals
International, Inc. (a)(b) | | | 29,703,062
| | | | 102,399,267
| | |
| | 2,178,800 | | | Omnicare, Inc. (a) | | | 61,292,174 | | | | 95,366,076 | | |
| | 877,300 | | | Baxter International, Inc. (a) | | | 45,852,710 | | | | 61,296,951 | | |
| | 1,428,900 | | | Health Net, Inc. (a)(b) | | | 36,743,611 | | | | 42,009,660 | | |
| | 464,010 | | | Theravance, Inc. (a)(b) | | | 8,771,116 | | | | 15,660,337 | | |
| | | | 269,666,835 | | | | 439,724,554 | | |
Industrials 4.78% | | | |
| | 801,225 | | | ADT Corporation (a) | | | 24,035,347 | | | | 34,965,459 | | |
| | 160,300 | | | Flowserve Corporation (a) | | | 19,674,969 | | | | 25,346,636 | | |
| | 797,200 | | | Avis Budget Group, Inc. (a)(b) | | | 15,615,314 | | | | 22,991,248 | | |
| | 191,300 | | | Alliant Techsystems, Inc. (a) | | | 11,999,686 | | | | 14,225,068 | | |
| | | | 71,325,316 | | | | 97,528,411 | | |
Information Technology 12.25% | | | |
| | 2,303,820 | | | Seagate Technology PLC (a) | | | 56,217,427 | | | | 84,550,194 | | |
| | 2,745,600 | | | Hewlett-Packard Company (a) | | | 48,213,165 | | | | 56,559,360 | | |
| | 1,189,340 | | | AOL, Inc. (a)(b) | | | 23,229,952 | | | | 45,956,098 | | |
| | 800,890 | | | Motorola Solutions, Inc. (a) | | | 39,989,239 | | | | 45,810,908 | | |
| | 969,900 | | | SAIC, Inc. (a) | | | 14,191,247 | | | | 14,490,306 | | |
| | 80,900 | | | Lexmark International, Inc., Class 'A' (a) | | | 1,741,922 | | | | 2,452,079 | | |
| | | | 183,582,952 | | | | 249,818,945 | | |
See Notes to Financial Statements.
FIRST EAGLE FUNDS | SEMI-ANNUAL REPORT | APRIL 30, 2013
124
Schedule of Investments | Six-Month Period Ended April 30, 2013 (unaudited)
SHARES | | DESCRIPTION | | COST (NOTE 1) | | VALUE (NOTE 1) | |
U.S. Common Stocks — 90.82% — (continued) | | | |
Materials 28.84% | | | |
| | 1,782,900 | | | Eastman Chemical Company (a) | | $ | 57,795,047 | | | $ | 118,830,285 | | |
| | 1,284,670 | | | Rockwood Holdings, Inc. (a) | | | 53,507,709 | | | | 83,362,236 | | |
| | 1,067,800 | | | WR Grace & Company (a)(b) | | | 61,184,560 | | | | 82,338,058 | | |
| | 1,578,800 | | | Packaging Corporation of America (a) | | | 37,429,695 | | | | 75,087,728 | | |
| | 1,400,660 | | | Ball Corporation (a) | | | 29,551,352 | | | | 61,797,119 | | |
| | 1,321,270 | | | Crown Holdings, Inc. (a)(b) | | | 29,670,944 | | | | 56,391,804 | | |
| | 909,000 | | | FMC Corporation (a) | | | 49,751,084 | | | | 55,176,300 | | |
| | 860,750 | | | Valspar Corporation (a) | | | 22,128,163 | | | | 54,933,065 | | |
| | | | 341,018,554 | | | | 587,916,595 | | |
Telecommunication Services 1.62% | | | |
| | 1,334,600 | | | Yahoo!, Inc. (a)(b) | | | 25,644,689 | | | | 33,004,658 | | |
Total U.S. Common Stocks | | | 1,228,847,687 | | | | 1,851,734,397 | | |
International Common Stocks — 5.24% | | | |
Ireland 1.57% | | | |
| | 2,741,600 | | | Elan Corporation PLC, ADR (a)(b) | | | 30,756,934 | | | | 32,076,720 | | |
Switzerland 2.82% | | | |
| | 1,790,350 | | | Tyco International Limited (a) | | | 42,605,158 | | | | 57,506,042 | | |
United Kingdom 0.85% | | | |
| | 336,600 | | | GlaxoSmithKline PLC, ADR (a) | | | 15,004,177 | | | | 17,382,024 | | |
Total International Common Stocks | | | 88,366,269 | | | | 106,964,786 | | |
Total Common Stocks | | | 1,317,213,956 | | | | 1,958,699,183 | | |
Exchange Traded Fund — 2.25% | | | |
| | 321,180 | | | SPDR Gold Trust (b) | | | 52,703,972 | | | | 45,854,869 | | |
Investment Companies — 5.03% | | | |
| | 4,905,027 | | | State Street Institutional
Treasury Money Market
Fund, Institutional Class | | | 4,905,027
| | | | 4,905,027
| | |
| | 97,595,166 | | | State Street Institutional
U.S. Government Money
Market Fund, Institutional Class | | | 97,595,166
| | | | 97,595,166
| | |
Total Investment Companies | | | 102,500,193 | | | | 102,500,193 | | |
See Notes to Financial Statements.
FIRST EAGLE FUNDS | SEMI-ANNUAL REPORT | APRIL 30, 2013
125
PRINCIPAL | | DESCRIPTION | | COST (NOTE 1) | | VALUE (NOTE 1) | |
Bond — 0.23% | |
U.S. Convertible Bond 0.23% | |
$ | 2,730,000 | | | Omnicare, Inc.
3.75% due 12/15/25 (c) | | $ | 2,730,000
| | | $ | 4,724,606
| | |
CONTRACTS | | | | STRIKE PRICE | | EXPIRATION DATE | | | |
Call Option Purchased — 0.01% | | | |
| | 2,000 | | | Baxter International, Inc.
(Cost: $252,075) | | $ | 75.00
| | | May 2013
| | | 148,000
| | |
Total Investment Portfolio
Excluding Options Written — 103.58% (Cost: $1,475,400,196) | | | | $2,111,926,851 | |
Covered Call Options Written — (3.05)% | | | |
| | 3,074 | | | ADT Corporation | | $ | 44.00 | | | July 2013 | | $ | (676,280 | ) | |
| | 1,133 | | | ADT Corporation | | | 45.00 | | | July 2013 | | | (203,940 | ) | |
| | 401 | | | ADT Corporation | | | 46.00 | | | July 2013 | | | (46,115 | ) | |
| | 660 | | | Alliant Techsystems, Inc. | | | 70.00 | | | August 2013 | | | (402,600 | ) | |
| | 777 | | | Alliant Techsystems, Inc. | | | 75.00 | | | August 2013 | | | (256,410 | ) | |
| | 1,250 | | | AOL, Inc. | | | 36.00 | | | July 2013 | | | (531,250 | ) | |
| | 1,493 | | | AOL, Inc. | | | 37.00 | | | July 2013 | | | (552,410 | ) | |
| | 1,239 | | | AOL, Inc. | | | 38.00 | | | July 2013 | | | (384,090 | ) | |
| | 595 | | | AOL, Inc. | | | 40.00 | | | May 2013 | | | (77,350 | ) | |
| | 1,243 | | | Atlas Energy L.P. | | | 36.00 | | | May 2013 | | | (1,777,490 | ) | |
| | 2,255 | | | Atlas Energy L.P. | | | 37.00 | | | May 2013 | | | (2,999,150 | ) | |
| | 2,110 | | | Avis Budget Group, Inc. | | | 19.00 | | | May 2013 | | | (2,057,250 | ) | |
| | 994 | | | Avis Budget Group, Inc. | | | 20.00 | | | May 2013 | | | (869,750 | ) | |
| | 408 | | | Avis Budget Group, Inc. | | | 24.00 | | | May 2013 | | | (208,488 | ) | |
| | 1,276 | | | Avis Budget Group, Inc. | | | 26.00 | | | August 2013 | | | (561,440 | ) | |
| | 1,760 | | | Avis Budget Group, Inc. | | | 27.00 | | | August 2013 | | | (689,920 | ) | |
| | 1,321 | | | Avis Budget Group, Inc. | | | 28.00 | | | August 2013 | | | (396,300 | ) | |
| | 222 | | | Ball Corporation | | | 45.00 | | | May 2013 | | | (6,105 | ) | |
| | 1,165 | | | Baxter International, Inc. | | | 67.50 | | | August 2013 | | | (623,275 | ) | |
| | 1,130 | | | Crown Holdings, Inc. | | | 40.00 | | | July 2013 | | | (355,950 | ) | |
| | 1,734 | | | Crown Holdings, Inc. | | | 41.00 | | | July 2013 | | | (416,160 | ) | |
| | 1,546 | | | Dresser-Rand Group, Inc. | | | 55.00 | | | June 2013 | | | (332,390 | ) | |
| | 800 | | | Dresser-Rand Group, Inc. | | | 60.00 | | | June 2013 | | | (58,000 | ) | |
| | 262 | | | Eastman Chemical Company | | | 65.00 | | | June 2013 | | | (96,940 | ) | |
| | 1,381 | | | Eastman Chemical Company | | | 67.50 | | | June 2013 | | | (303,820 | ) | |
| | 3,058 | | | Eastman Chemical Company | | | 70.00 | | | June 2013 | | | (382,250 | ) | |
See Notes to Financial Statements.
FIRST EAGLE FUNDS | SEMI-ANNUAL REPORT | APRIL 30, 2013
126
Schedule of Investments | Six-Month Period Ended April 30, 2013 (unaudited)
CONTRACTS | | DESCRIPTION | | STRIKE PRICE | | EXPIRATION DATE | | VALUE (NOTE 1) | |
Covered Call Options Written — (3.05)% — (continued) | | | |
| | 150 | | | Eastman Chemical Company | | $ | 70.00 | | | September 2013 | | $ | (49,193 | ) | |
| | 5,414 | | | Elan Corporation PLC | | | 11.00 | | | July 2013 | | | (541,400 | ) | |
| | 7,305 | | | Elan Corporation PLC | | | 12.00 | | | May 2013 | | | (73,050 | ) | |
| | 851 | | | Elan Corporation PLC | | | 12.00 | | | June 2013 | | | (28,083 | ) | |
| | 5,789 | | | Elan Corporation PLC | | | 12.00 | | | July 2013 | | | (202,615 | ) | |
| | 100 | | | Flowserve Corporation | | | 155.00 | | | July 2013 | | | (78,000 | ) | |
| | 175 | | | Flowserve Corporation | | | 160.00 | | | July 2013 | | | (70,000 | ) | |
| | 1,240 | | | Flowserve Corporation | | | 165.00 | | | July 2013 | | | (387,500 | ) | |
| | 693 | | | FMC Corporation | | | 55.00 | | | July 2013 | | | (440,055 | ) | |
| | 1,907 | | | FMC Corporation | | | 60.00 | | | July 2013 | | | (512,983 | ) | |
| | 3,366 | | | GlaxoSmithKline PLC | | | 45.00 | | | May 2013 | | | (2,278,782 | ) | |
| | 146 | | | Health Net, Inc. | | | 27.50 | | | May 2013 | | | (33,580 | ) | |
| | 3,539 | | | Hewlett-Packard Company | | | 20.00 | | | June 2013 | | | (520,233 | ) | |
| | 979 | | | Hewlett-Packard Company | | | 20.00 | | | August 2013 | | | (178,178 | ) | |
| | 3,087 | | | Hewlett-Packard Company | | | 21.00 | | | June 2013 | | | (299,439 | ) | |
| | 7,443 | | | Hewlett-Packard Company | | | 21.00 | | | August 2013 | | | (915,489 | ) | |
| | 1,159 | | | Hewlett-Packard Company | | | 22.00 | | | August 2013 | | | (107,787 | ) | |
| | 1,969 | | | Hewlett-Packard Company | | | 23.00 | | | August 2013 | | | (127,985 | ) | |
| | 7,726 | | | Interpublic Group of Companies, Inc. | | | 12.00 | | | July 2013 | | | (1,506,570 | ) | |
| | 6,235 | | | Interpublic Group of Companies, Inc. | | | 13.00 | | | July 2013 | | | (717,025 | ) | |
| | 438 | | | Lexmark International, Inc., Class 'A' | | | 23.00 | | | July 2013 | | | (319,740 | ) | |
| | 1,059 | | | Lowe's Companies, Inc. | | | 38.00 | | | June 2013 | | | (166,263 | ) | |
| | 205 | | | Lowe's Companies, Inc. | | | 39.00 | | | June 2013 | | | (22,550 | ) | |
| | 406 | | | Lowe's Companies, Inc. | | | 39.00 | | | July 2013 | | | (56,434 | ) | |
| | 879 | | | Lowe's Companies, Inc. | | | 40.00 | | | July 2013 | | | (86,142 | ) | |
| | 490 | | | Motorola Solutions, Inc. | | | 55.00 | | | June 2013 | | | (147,000 | ) | |
| | 1,299 | | | Motorola Solutions, Inc. | | | 60.00 | | | July 2013 | | | (101,322 | ) | |
| | 708 | | | Occidental Petroleum Corporation | | | 80.00 | | | August 2013 | | | (743,400 | ) | |
| | 1,349 | | | Occidental Petroleum Corporation | | | 82.50 | | | August 2013 | | | (1,106,180 | ) | |
| | 728 | | | Occidental Petroleum Corporation | | | 85.00 | | | August 2013 | | | (493,584 | ) | |
| | 235 | | | Occidental Petroleum Corporation | | | 87.50 | | | August 2013 | | | (123,375 | ) | |
| | 230 | | | Occidental Petroleum Corporation | | | 90.00 | | | August 2013 | | | (83,940 | ) | |
| | 1,768 | | | Omnicare, Inc. | | | 38.00 | | | June 2013 | | | (1,043,120 | ) | |
| | 827 | | | Omnicare, Inc. | | | 39.00 | | | June 2013 | | | (396,960 | ) | |
| | 8,250 | | | Omnicare, Inc. | | | 41.00 | | | September 2013 | | | (3,382,500 | ) | |
| | 500 | | | Omnicare, Inc. | | | 43.00 | | | September 2013 | | | (145,000 | ) | |
| | 1,950 | | | Packaging Corporation of America | | | 42.50 | | | July 2013 | | | (982,800 | ) | |
| | 2,367 | | | Packaging Corporation of America | | | 45.00 | | | July 2013 | | | (705,366 | ) | |
| | 2,268 | | | Pfizer, Inc. | | | 28.00 | | | May 2013 | | | (272,160 | ) | |
See Notes to Financial Statements.
FIRST EAGLE FUNDS | SEMI-ANNUAL REPORT | APRIL 30, 2013
127
CONTRACTS | | DESCRIPTION | | STRIKE PRICE | | EXPIRATION DATE | | VALUE (NOTE 1) | |
Covered Call Options Written — (3.05)% — (continued) | | | |
| | 936 | | | Pfizer, Inc. | | $ | 29.00 | | | May 2013 | | $ | (37,440 | ) | |
| | 2,936 | | | Pfizer, Inc. | | | 29.00 | | | June 2013 | | | (199,648 | ) | |
| | 4,000 | | | Pfizer, Inc. | | | 30.00 | | | June 2013 | | | (124,000 | ) | |
| | 1,500 | | | Pfizer, Inc. | | | 30.00 | | | August 2013 | | | (100,441 | ) | |
| | 1,520 | | | Rockwood Holdings, Inc. | | | 60.00 | | | May 2013 | | | (912,000 | ) | |
| | 225 | | | Rockwood Holdings, Inc. | | | 60.00 | | | August 2013 | | | (156,375 | ) | |
| | 500 | | | Rockwood Holdings, Inc. | | | 65.00 | | | May 2013 | | | (102,500 | ) | |
| | 2,355 | | | Rockwood Holdings, Inc. | | | 65.00 | | | August 2013 | | | (918,450 | ) | |
| | 500 | | | Rockwood Holdings, Inc. | | | 65.00 | | | November 2013 | | | (243,976 | ) | |
| | 1,416 | | | SAIC, Inc. | | | 14.00 | | | August 2013 | | | (177,000 | ) | |
| | 8,283 | | | SAIC, Inc. | | | 15.00 | | | August 2013 | | | (455,565 | ) | |
| | 1,340 | | | Seagate Technology PLC | | | 31.00 | | | June 2013 | | | (783,900 | ) | |
| | 2,449 | | | Seagate Technology PLC | | | 34.00 | | | June 2013 | | | (820,415 | ) | |
| | 772 | | | Seagate Technology PLC | | | 35.00 | | | May 2013 | | | (177,560 | ) | |
| | 1,650 | | | Seagate Technology PLC | | | 36.00 | | | June 2013 | | | (334,950 | ) | |
| | 495 | | | Seagate Technology PLC | | | 37.00 | | | June 2013 | | | (79,200 | ) | |
| | 318 | | | SemGroup Corporation | | | 45.00 | | | May 2013 | | | (214,650 | ) | |
| | 196 | | | SemGroup Corporation | | | 50.00 | | | May 2013 | | | (44,100 | ) | |
| | 400 | | | SemGroup Corporation | | | 50.00 | | | July 2013 | | | (135,000 | ) | |
| | 100 | | | SemGroup Corporation | | | 55.00 | | | July 2013 | | | (10,500 | ) | |
| | 469 | | | Theravance, Inc. | | | 25.00 | | | June 2013 | | | (450,240 | ) | |
| | 1,782 | | | Tyco International Limited | | | 31.00 | | | July 2013 | | | (363,528 | ) | |
| | 1,390 | | | Tyco International Limited | | | 32.00 | | | July 2013 | | | (208,500 | ) | |
| | 1,645 | | | Tyco International Limited | | | 33.00 | | | July 2013 | | | (141,470 | ) | |
| 978 | | | Valeant Pharmaceuticals
International, Inc. | | | 57.50 | | | July 2013 | | | (1,892,430 | ) | |
| 1,667 | | | Valeant Pharmaceuticals
International, Inc. | | | 60.00 | | | May 2013 | | | (2,717,210 | ) | |
| 370 | | | Valeant Pharmaceuticals
International, Inc. | | | 60.00 | | | July 2013 | | | (627,150 | ) | |
| 1,122 | | | Valeant Pharmaceuticals
International, Inc. | | | 62.50 | | | July 2013 | | | (1,649,340 | ) | |
| 1,800 | | | Valeant Pharmaceuticals
International, Inc. | | | 67.50 | | | July 2013 | | | (1,881,000 | ) | |
| 2,000 | | | Valeant Pharmaceuticals
International, Inc. | | | 70.00 | | | July 2013 | | | (1,680,000 | ) | |
| 328 | | | Valeant Pharmaceuticals
International, Inc. | | | 72.50 | | | May 2013 | | | (180,400 | ) | |
| 2,000 | | | Valeant Pharmaceuticals
International, Inc. | | | 75.00 | | | July 2013 | | | (1,040,000 | ) | |
| | 1,207 | | | Valspar Corporation | | | 60.00 | | | July 2013 | | | (609,535 | ) | |
| | 421 | | | Valspar Corporation | | | 65.00 | | | July 2013 | | | (86,305 | ) | |
See Notes to Financial Statements.
FIRST EAGLE FUNDS | SEMI-ANNUAL REPORT | APRIL 30, 2013
128
Schedule of Investments | Six-Month Period Ended April 30, 2013 (unaudited)
CONTRACTS | | DESCRIPTION | | STRIKE PRICE | | EXPIRATION DATE | | VALUE (NOTE 1) | |
Covered Call Options Written — (3.05)% — (continued) | | | |
| | 1,159 | | | Viacom, Inc., Class 'B' | | $ | 60.00 | | | June 2013 | | $ | (624,701 | ) | |
| | 2,920 | | | Viacom, Inc., Class 'B' | | | 62.50 | | | June 2013 | | | (963,600 | ) | |
| | 310 | | | Viacom, Inc., Class 'B' | | | 65.00 | | | June 2013 | | | (60,450 | ) | |
| | 250 | | | Viacom, Inc., Class 'B' | | | 65.00 | | | September 2013 | | | (86,250 | ) | |
| | 972 | | | WR Grace & Company | | | 70.00 | | | June 2013 | | | (743,580 | ) | |
| | 2,501 | | | WR Grace & Company | | | 72.50 | | | June 2013 | | | (1,388,055 | ) | |
| | 1,943 | | | WR Grace & Company | | | 75.00 | | | June 2013 | | | (718,910 | ) | |
| | 1,323 | | | Wyndham Worldwide Corporation | | | 60.00 | | | August 2013 | | | (449,820 | ) | |
| | 2,257 | | | Wyndham Worldwide Corporation | | | 65.00 | | | August 2013 | | | (270,840 | ) | |
| | 250 | | | Yahoo!, Inc. | | | 21.00 | | | July 2013 | | | (98,750 | ) | |
| | 1,147 | | | Yahoo!, Inc. | | | 22.00 | | | June 2013 | | | (336,071 | ) | |
| | 1,000 | | | Yahoo!, Inc. | | | 22.00 | | | July 2013 | | | (310,000 | ) | |
| | 5,000 | | | Yahoo!, Inc. | | | 23.00 | | | June 2013 | | | (1,020,000 | ) | |
| | 990 | | | Yahoo!, Inc. | | | 23.00 | | | July 2013 | | | (229,680 | ) | |
| | 2,323 | | | Yahoo!, Inc. | | | 24.00 | | | June 2013 | | | (318,251 | ) | |
| | 2,283 | | | Yahoo!, Inc. | | | 24.00 | | | July 2013 | | | (378,977 | ) | |
| | Total Covered Call Options Written (Premiums Received: $49,648,802) | | | | | | | | | | (62,263,619 | ) | |
Put Option Written — 0.00% | | | |
| | 261 | | | Baxter International, Inc.
(Premium Received $33,397) | | $ | 62.50
| | | August 2013
| | $ | (36,540
| ) | |
| Total Investments — 100.53% (Cost: $1,425,717,997) | | | | | | $ | 2,049,626,692 | | |
Liabilities in Excess of Other Assets — (0.53)% | | | | | | | (10,716,409 | ) | |
| Net Assets — 100.00% | | | | | | $ | 2,038,910,283 | | |
(a) At April 30, 2013, all or a portion of this security was segregated to cover collateral requirement for options.
(b) Non-income producing security/commodity.
(c) This security is convertible until December 15, 2025.
At April 30, 2013, cost is substantially identical for both book and federal income tax purposes. Net unrealized appreciation consisted of:
Gross unrealized appreciation | | $ | 649,488,685 | | |
Gross unrealized depreciation | | | (25,579,990 | ) | |
Net unrealized appreciation | | $ | 623,908,695 | | |
Abbreviations used in this schedule include:
ADR — American Depository Receipt
PLC — Public Limited Company
SPDR — Standard & Poor's Depository Receipts
See Notes to Financial Statements.
FIRST EAGLE FUNDS | SEMI-ANNUAL REPORT | APRIL 30, 2013
129
INDUSTRY DIVERSIFICATION FOR PORTFOLIO HOLDINGS | | PERCENT OF
NET ASSETS | |
U.S. Common Stocks | |
Consumer Discretionary | | | 12.82 | % | |
Energy | | | 8.94 | | |
Health Care | | | 21.57 | | |
Industrials | | | 4.78 | | |
Information Technology | | | 12.25 | | |
Materials | | | 28.84 | | |
Telecommunication Services | | | 1.62 | | |
Total U.S. Common Stocks | | | 90.82 | | |
International Common Stocks | |
Health Care | | | 2.42 | | |
Industrials | | | 2.82 | | |
Total International Common Stocks | | | 5.24 | | |
Exchange Traded Fund | | | 2.25 | | |
Investment Companies | | | 5.03 | | |
U.S. Convertible Bond | |
Health Care | | | 0.23 | | |
Total U.S. Convertible Bond | | | 0.23 | | |
Call Option Purchased | | | 0.01 | | |
Covered Call Options Written | | | (3.05 | ) | |
Put Option Written | | | (0.00 | ) | |
Total Investments | | | 100.53 | % | |
See Notes to Financial Statements.
FIRST EAGLE FUNDS | SEMI-ANNUAL REPORT | APRIL 30, 2013
130
This page was intentionally left blank.
Statements of Assets and Liabilities
| | | FIRST EAGLE
GLOBAL FUND | | FIRST EAGLE
OVERSEAS FUND | |
Assets | |
Investments, at Cost (Note 1) | |
Unaffiliated issuers | | $ | 30,499,743,761 | | | $ | 9,846,945,790 | | |
Affiliated issuers | | | 2,369,205,771 | | | | 598,850,319 | | |
Gold bullion | | | 799,578,304 | | | | 199,148,724 | | |
Foreign currency | | | 5,952,392 | | | | 5,803,591 | | |
Total Investments, at Cost | | | 33,674,480,228 | | | | 10,650,748,424 | | |
Investments, at Value (Note 1) | |
Unaffiliated issuers | | | 36,762,210,682 | | | | 11,880,338,458 | | |
Affiliated issuers | | | 3,139,096,071 | | | | 762,468,848 | | |
Gold bullion | | | 1,619,895,681 | | | | 582,622,734 | | |
Foreign currency | | | 5,978,745 | | | | 5,833,942 | | |
Total Investments, at Value | | | 41,527,181,179 | | | | 13,231,263,982 | | |
Cash | | | 26,096 | | | | 21,919 | | |
Receivable for forward currency contracts held, at value (Note 1) | | | 240,995,492 | | | | 116,525,025 | | |
Receivable for investment securities sold | | | 80,209,614 | | | | 21,882,296 | | |
Receivable for Fund shares sold | | | 100,589,620 | | | | 44,207,786 | | |
Accrued interest and dividends receivable | | | 143,594,932 | | | | 66,876,084 | | |
Investment for trustee deferred compensation plan (Note 2) | | | 2,045,775 | | | | 1,886,078 | | |
Other assets | | | 315,615 | | | | 137,986 | | |
Total Assets | | | 42,094,958,323 | | | | 13,482,801,156 | | |
Liabilities | |
Payable for Fund shares redeemed | | | 84,934,808 | | | | 20,283,012 | | |
Payable for investment securities purchased | | | 235,615,340 | | | | 79,363,577 | | |
Payable for forward currency contracts held, at value (Note 1) | | | 29,366,731 | | | | 16,655,474 | | |
Investment advisory fees payable (Note 2) | | | 25,145,828 | | | | 8,024,777 | | |
Distribution fees payable (Note 3) | | | 9,899,390 | | | | 1,791,939 | | |
Services fees payable (Note 3) | | | 2,115,258 | | | | 216,183 | | |
Trustee deferred compensation plan (Note 2) | | | 2,045,775 | | | | 1,886,078 | | |
Administrative fees payable (Note 2) | | | 645,488 | | | | 195,352 | | |
Trustee fees payable | | | 31,371 | | | | 7,438 | | |
Accrued expenses and other liabilities | | | 29,806,965 | | | | 11,277,270 | | |
Total Liabilities | | | 419,606,954 | | | | 139,701,100 | | |
Net Assets | | $ | 41,675,351,369 | | | $ | 13,343,100,056 | | |
* First Eagle Gold Fund financial statements are shown on a consolidated basis and include the balances of the First Eagle Gold Cayman Fund, Ltd.
See Notes to Financial Statements.
FIRST EAGLE FUNDS | SEMI-ANNUAL REPORT | APRIL 30, 2013
132
April 30, 2013 (unaudited)
| | | FIRST EAGLE
U.S. VALUE FUND | | FIRST EAGLE
GOLD FUND* | |
Assets | |
Investments, at Cost (Note 1) | |
Unaffiliated issuers | | $ | 2,566,783,111 | | | $ | 1,766,392,590 | | |
Affiliated issuers | | | 42,514,481 | | | | — | | |
Gold bullion | | | 89,045,569 | | | | 183,135,784 | | |
Foreign currency | | | 29 | | | | 585,244 | | |
Total Investments, at Cost | | | 2,698,343,190 | | | | 1,950,113,618 | | |
Investments, at Value (Note 1) | |
Unaffiliated issuers | | | 3,073,122,484 | | | | 1,498,471,693 | | |
Affiliated issuers | | | 45,823,719 | | | | — | | |
Gold bullion | | | 114,156,844 | | | | 494,705,610 | | |
Foreign currency | | | 29 | | | | 585,244 | | |
Total Investments, at Value | | | 3,233,103,076 | | | | 1,993,762,547 | | |
Cash | | | 8,129 | | | | 4,871 | | |
Receivable for forward currency contracts held, at value (Note 1) | | | — | | | | — | | |
Receivable for investment securities sold | | | 3,525,538 | | | | 6,967,896 | | |
Receivable for Fund shares sold | | | 8,608,651 | | | | 11,697,284 | | |
Accrued interest and dividends receivable | | | 4,415,401 | | | | 2,505,478 | | |
Investment for trustee deferred compensation plan (Note 2) | | | 1,271,881 | | | | 148,189 | | |
Other assets | | | 76,667 | | | | 74,224 | | |
Total Assets | | | 3,251,009,343 | | | | 2,015,160,489 | | |
Liabilities | |
Payable for Fund shares redeemed | | | 3,847,517 | | | | 7,413,124 | | |
Payable for investment securities purchased | | | 14,222,639 | | | | 13,248,938 | | |
Payable for forward currency contracts held, at value (Note 1) | | | — | | | | — | | |
Investment advisory fees payable (Note 2) | | | 1,968,522 | | | | 1,276,781 | | |
Distribution fees payable (Note 3) | | | 720,031 | | | | 457,673 | | |
Services fees payable (Note 3) | | | 139,409 | | | | 82,008 | | |
Trustee deferred compensation plan (Note 2) | | | 1,271,881 | | | | 148,189 | | |
Administrative fees payable (Note 2) | | | 43,130 | | | | 129,480 | | |
Trustee fees payable | | | 2,155 | | | | 10,894 | | |
Accrued expenses and other liabilities | | | 1,476,923 | | | | 1,355,818 | | |
Total Liabilities | | | 23,692,207 | | | | 24,122,905 | | |
Net Assets | | $ | 3,227,317,136 | | | $ | 1,991,037,584 | | |
FIRST EAGLE FUNDS | SEMI-ANNUAL REPORT | APRIL 30, 2013
133
Statements of Assets and Liabilities (continued)
| | | FIRST EAGLE
GLOBAL FUND | | FIRST EAGLE
OVERSEAS FUND | |
Net Assets Consist of | |
Capital stock (par value, $0.001 per share) | | $ | 804,586 | | | $ | 567,281 | | |
Capital surplus | | | 32,996,959,710 | | | | 10,663,154,016 | | |
Net unrealized appreciation (depreciation) on: | |
Investments (net of $17,426,195, $7,596,882, $0 and $0
deferred capital gain country tax, respectively) | | | 7,835,248,403 | | | | 2,572,888,325 | | |
Foreign currency and forward contract related translation | | | 209,708,340 | | | | 98,751,834 | | |
Undistributed net realized gains (losses) on investments | | | 792,984,141 | | | | 259,420,580 | | |
Undistributed net investment income (loss) | | | (160,353,811 | ) | | | (251,681,980 | ) | |
Net Assets | | $ | 41,675,351,369 | | | $ | 13,343,100,056 | | |
Class A | |
Net assets | | $ | 17,640,134,408 | | | $ | 5,675,782,023 | | |
Shares outstanding | | | 339,364,532 | | | | 242,712,763 | | |
Net asset value per share and redemption proceeds per share | | $ | 51.98 | | | $ | 23.38 | | |
Offering price per share (NAV per share plus maximum sales charge) | | $ | 54.721 | | | $ | 24.611 | | |
Class C | |
Net assets | | $ | 10,512,894,647 | | | $ | 1,072,993,109 | | |
Shares outstanding | | | 206,211,105 | | | | 47,171,448 | | |
Net asset value per share | | $ | 50.98 | | | $ | 22.75 | | |
Redemption proceeds per share (NAV per share less maximum
contingent deferred sale charge)2 | | $ | 50.47 | | | $ | 22.52 | | |
Class I | |
Net assets | | $ | 13,522,322,314 | | | $ | 6,594,324,924 | | |
Shares outstanding | | | 259,010,169 | | | | 277,396,315 | | |
Net asset value per share and redemption proceeds per share | | $ | 52.21 | | | $ | 23.77 | | |
* First Eagle Gold Fund financial statements are shown on a consolidated basis and include the balances of the First Eagle Gold Cayman Fund, Ltd.
1 The maximum sales charge is 5.00% for Class A shares. Classes C, I and Y have no front-end sales charges.
2 The maximum CDSC (Contingent Deferred Sales Charge) is 1.00% for Class C shares, which is charged on the lesser of the offering price or the net asset value at the time of sale by shareholder. This pertains to investments of one year or less.
See Notes to Financial Statements.
FIRST EAGLE FUNDS | SEMI-ANNUAL REPORT | APRIL 30, 2013
134
April 30, 2013 (unaudited)
| | FIRST EAGLE
U.S. VALUE FUND | | FIRST EAGLE
GOLD FUND* | |
Net Assets Consist of | |
Capital stock (par value, $0.001 per share) | | $ | 169,432 | | | $ | 101,234 | | |
Capital surplus | | | 2,638,572,249 | | | | 2,176,689,513 | | |
Net unrealized appreciation (depreciation) on: | |
Investments (net of $17,426,195, $7,596,882, $0 and $0
deferred capital gain country tax, respectively) | | | 534,759,886 | | | | 43,648,929 | | |
Foreign currency and forward contract related translation | | | (1,019 | ) | | | 36,943 | | |
Undistributed net realized gains (losses) on investments | | | 43,019,549 | | | | (117,205,623 | ) | |
Undistributed net investment income (loss) | | | 10,797,039 | | | | (112,233,412 | ) | |
Net Assets | | $ | 3,227,317,136 | | | $ | 1,991,037,584 | | |
Class A | |
Net assets | | $ | 1,482,225,789 | | | $ | 985,093,416 | | |
Shares outstanding | | | 77,944,283 | | | | 49,928,846 | | |
Net asset value per share and redemption proceeds per share | | $ | 19.02 | | | $ | 19.73 | | |
Offering price per share (NAV per share plus maximum sales charge) | | $ | 20.021 | | | $ | 20.771 | | |
Class C | |
Net assets | | $ | 688,527,462 | | | $ | 377,283,322 | | |
Shares outstanding | | | 36,602,795 | | | | 19,813,355 | | |
Net asset value per share | | $ | 18.81 | | | $ | 19.04 | | |
Redemption proceeds per share (NAV per share less maximum
contingent deferred sale charge)2 | | $ | 18.62 | | | $ | 18.85 | | |
Class I | |
Net assets | | $ | 1,056,563,885 | | | $ | 628,660,846 | | |
Shares outstanding | | | 54,884,428 | | | | 31,491,789 | | |
Net asset value per share and redemption proceeds per share | | $ | 19.25 | | | $ | 19.96 | | |
FIRST EAGLE FUNDS | SEMI-ANNUAL REPORT | APRIL 30, 2013
135
Statements of Assets and Liabilities (continued)
| | | FIRST EAGLE
GLOBAL INCOME
BUILDER FUND | | FIRST EAGLE
HIGH YIELD FUND | |
Assets | |
Investments, at Cost (Note 1) | |
Unaffiliated issuers | | $ | 315,958,056 | | | $ | 861,473,426 | | |
Gold bullion | | | 2,094,674 | | | | — | | |
Foreign currency | | | 724,944 | | | | 7,232,369 | | |
Total Investments, at Cost | | | 318,777,674 | | | | 868,705,795 | | |
Investments, at Value (Note 1) | |
Unaffiliated issuers | | | 329,613,925 | | | | 893,773,752 | | |
Gold bullion | | | 1,929,691 | | | | — | | |
Foreign currency | | | 727,544 | | | | 7,271,639 | | |
Total Investments, at Value | | | 332,271,160 | | | | 901,045,391 | | |
Cash | | | 3,694 | | | | 6,402 | | |
Restricted cash** | | | — | | | | — | | |
Receivable for forward currency contracts held, at value (Note 1) | | | 74,698 | | | | — | | |
Receivable for investment securities sold | | | 90,052 | | | | — | | |
Receivable for premiums for written options | | | — | | | | — | | |
Receivable for Fund shares sold | | | 3,208,441 | | | | 4,438,734 | | |
Accrued interest and dividends receivable | | | 3,057,179 | | | | 14,679,299 | | |
Investment for trustee deferred compensation plan (Note 2) | | | 13,496 | | | | 41,928 | | |
Other assets | | | 50,299 | | | | 47,015 | | |
Total Assets | | | 338,769,019 | | | | 920,258,769 | | |
Liabilities | |
Option contracts written, at value (premiums received $0,
$0, and $49,682,199, respectively) (Note 1) | | | — | | | | — | | |
Payable for Fund shares redeemed | | | 222,028 | | | | 1,305,120 | | |
Payable for investment securities purchased | | | 6,549,956 | | | | 26,545,481 | | |
Payable for forward currency contracts held, at value (Note 1) | | | 99,429 | | | | 806,320 | | |
Payable for dividends to shareholders | | | 1,750,090 | | | | 1,090,796 | | |
Investment advisory fees payable (Note 2) | | | 163,725 | | | | 450,217 | | |
Distribution fees payable (Note 3) | | | 84,453 | | | | 161,443 | | |
Services fees payable (Note 3) | | | 18,696 | | | | 31,462 | | |
Trustee deferred compensation plan (Note 2) | | | 13,496 | | | | 41,928 | | |
Administrative fees payable (Note 2) | | | 12,796 | | | | 7,914 | | |
Trustee fees payable | | | 202 | | | | 619 | | |
Accrued expenses and other liabilities | | | 178,503 | | | | 488,624 | | |
Total Liabilities | | | 9,093,374 | | | | 30,929,924 | | |
Net Assets | | $ | 329,675,645 | | | $ | 889,328,845 | | |
** The amount of $6,871,500 represents restricted cash used as collateral for covered call options.
See Notes to Financial Statements.
FIRST EAGLE FUNDS | SEMI-ANNUAL REPORT | APRIL 30, 2013
136
April 30, 2013 (unaudited)
| | | FIRST EAGLE
FUND OF AMERICA | |
Assets | |
Investments, at Cost (Note 1) | |
Unaffiliated issuers | | $ | 1,475,400,196 | | |
Gold bullion | | | — | | |
Foreign currency | | | — | | |
Total Investments, at Cost | | | 1,475,400,196 | | |
Investments, at Value (Note 1) | |
Unaffiliated issuers | | | 2,111,926,851 | | |
Gold bullion | | | — | | |
Foreign currency | | | — | | |
Total Investments, at Value | | | 2,111,926,851 | | |
Cash | | | 188,967 | | |
Restricted cash** | | | 6,871,500 | | |
Receivable for forward currency contracts held, at value (Note 1) | | | — | | |
Receivable for investment securities sold | | | 1,671,708 | | |
Receivable for premiums for written options | | | 952,863 | | |
Receivable for Fund shares sold | | | 6,382,469 | | |
Accrued interest and dividends receivable | | | 358,554 | | |
Investment for trustee deferred compensation plan (Note 2) | | | 1,199,448 | | |
Other assets | | | 162,048 | | |
Total Assets | | | 2,129,714,408 | | |
Liabilities | |
Option contracts written, at value (premiums received $0,
$0, and $49,682,199, respectively) (Note 1) | | | 62,300,159 | | |
Payable for Fund shares redeemed | | | 1,574,234 | | |
Payable for investment securities purchased | | | 23,083,125 | | |
Payable for forward currency contracts held, at value (Note 1) | | | — | | |
Payable for dividends to shareholders | | | — | | |
Investment advisory fees payable (Note 2) | | | 1,628,692 | | |
Distribution fees payable (Note 3) | | | 505,153 | | |
Services fees payable (Note 3) | | | 67,254 | | |
Trustee deferred compensation plan (Note 2) | | | 1,199,448 | | |
Administrative fees payable (Note 2) | | | 22,779 | | |
Trustee fees payable | | | 670 | | |
Accrued expenses and other liabilities | | | 422,611 | | |
Total Liabilities | | | 90,804,125 | | |
Net Assets | | $ | 2,038,910,283 | | |
FIRST EAGLE FUNDS | SEMI-ANNUAL REPORT | APRIL 30, 2013
137
Statements of Assets and Liabilities (continued)
| | | FIRST EAGLE
GLOBAL INCOME
BUILDER FUND | | FIRST EAGLE
HIGH YIELD FUND | |
Net Assets Consist of | |
Capital stock (par value, $0.001 per share) | | $ | 30,309 | | | $ | 86,767 | | |
Capital surplus | | | 315,552,342 | | | | 853,327,497 | | |
Net unrealized appreciation (depreciation) on: | |
Investments | | | 13,490,886 | | | | 32,300,326 | | |
Foreign currency and forward contract related translation | | | (21,974 | ) | | | (1,131,338 | ) | |
Written options | | | — | | | | — | | |
Undistributed net realized gains (losses) on investments | | | 350,119 | | | | 4,450,055 | | |
Undistributed net investment income | | | 273,963 | | | | 295,538 | | |
Net Assets | | $ | 329,675,645 | | | $ | 889,328,845 | | |
Class A | |
Net assets | | $ | 147,313,039 | | | $ | 336,282,789 | | |
Shares outstanding | | | 13,524,977 | | | | 32,803,339 | | |
Net asset value per share and redemption proceeds per share | | $ | 10.89 | | | $ | 10.25 | | |
Offering price per share (NAV per share plus maximum sales charge) | | $ | 11.461 | | | $ | 10.732 | | |
Class C | |
Net assets | | $ | 97,072,728 | | | $ | 156,437,733 | | |
Shares outstanding | | | 8,936,190 | | | | 15,276,367 | | |
Net asset value per share | | $ | 10.86 | | | $ | 10.24 | | |
Redemption proceeds per share (NAV per share less maximum
contingent deferred sale charge)3 | | $ | 10.75 | | | $ | 10.14 | | |
Class I | |
Net assets | | $ | 85,289,878 | | | $ | 396,608,323 | | |
Shares outstanding | | | 7,848,326 | | | | 38,687,706 | | |
Net asset value per share and redemption proceeds per share | | $ | 10.87 | | | $ | 10.25 | | |
Class Y | |
Net assets | | | — | | | | — | | |
Shares outstanding | | | — | | | | — | | |
Net asset value per share and redemption proceeds per share | | | — | | | | — | | |
1 The maximum sales charge is 5.00% for Class A shares. Classes C, I and Y have no front-end sales charges.
2 The maximum sales charge is 4.50% for Class A shares. Classes C, I and Y have no front-end sales charges.
3 The maximum CDSC (Contingent Deferred Sales Charge) is 1.00% for Class C shares, which is charged on the lesser of the offering price or the net asset value at the time of sale by shareholder. This pertains to investments of one year or less.
See Notes to Financial Statements.
FIRST EAGLE FUNDS | SEMI-ANNUAL REPORT | APRIL 30, 2013
138
April 30, 2013 (unaudited)
| | | FIRST EAGLE
FUND OF AMERICA | |
Net Assets Consist of | |
Capital stock (par value, $0.001 per share) | | $ | 67,042 | | |
Capital surplus | | | 1,496,559,531 | | |
Net unrealized appreciation (depreciation) on: | |
Investments | | | 636,526,655 | | |
Foreign currency and forward contract related translation | | | — | | |
Written options | | | (12,617,960 | ) | |
Undistributed net realized gains (losses) on investments | | | (82,447,370 | ) | |
Undistributed net investment income | | | 822,385 | | |
Net Assets | | $ | 2,038,910,283 | | |
Class A | |
Net assets | | $ | 861,749,782 | | |
Shares outstanding | | | 27,830,325 | | |
Net asset value per share and redemption proceeds per share | | $ | 30.96 | | |
Offering price per share (NAV per share plus maximum sales charge) | | $ | 32.591 | | |
Class C | |
Net assets | | $ | 335,848,180 | | |
Shares outstanding | | | 12,544,674 | | |
Net asset value per share | | $ | 26.77 | | |
Redemption proceeds per share (NAV per share less maximum
contingent deferred sale charge)3 | | $ | 26.50 | | |
Class I | |
Net assets | | $ | 252,293,510 | | |
Shares outstanding | | | 7,994,783 | | |
Net asset value per share and redemption proceeds per share | | $ | 31.56 | | |
Class Y | |
Net assets | | $ | 589,018,811 | | |
Shares outstanding | | | 18,671,719 | | |
Net asset value per share and redemption proceeds per share | | $ | 31.55 | | |
FIRST EAGLE FUNDS | SEMI-ANNUAL REPORT | APRIL 30, 2013
139
* First Eagle Gold Fund financial statements are shown on a consolidated basis and include the balances of the First Eagle Gold Cayman Fund, Ltd.
| | | FIRST EAGLE
GLOBAL FUND | | FIRST EAGLE
OVERSEAS FUND | |
Investment Income | |
Interest (net of $46,343, $14,580, $0 and $0, foreign taxes
withheld, respectively) | | $ | 9,116,682 | | | $ | 1,009,281 | | |
Dividends from: (net of $25,289,014, $13,082,683, $418,612
and $1,402,580, foreign taxes withheld, respectively) | |
Unaffiliated issuers | | | 342,678,919 | | | | 99,437,852 | | |
Affiliated issuers | | | 35,965,492 | | | | 3,336,936 | | |
Other Income | | | 1,335,966 | | | | — | | |
Total Income | | | 389,097,059 | | | | 103,784,069 | | |
Expenses | |
Investment advisory fees (Note 2) | | | 143,209,460 | | | | 45,342,534 | | |
Administrative costs (Note 2) | | | 1,952,817 | | | | 606,181 | | |
Distribution fees (Note 3) | |
Class A | | | 20,510,443 | | | | 6,597,882 | | |
Class C | | | 36,417,459 | | | | 3,790,853 | | |
Service fees - Class C (Note 3) | | | 12,139,153 | | | | 1,263,618 | | |
Shareholder servicing agent fees | | | 18,021,301 | | | | 6,434,224 | | |
Custodian and accounting fees | | | 2,231,303 | | | | 1,256,906 | | |
Shareholder reporting fees | | | 1,414,394 | | | | 585,936 | | |
Trustees' fees | | | 398,141 | | | | 122,336 | | |
Registration and filing fees | | | 447,596 | | | | 242,486 | | |
Professional fees | | | 285,760 | | | | 129,600 | | |
Other Expenses | | | 378,858 | | | | 126,053 | | |
Total Expenses | | | 237,406,685 | | | | 66,498,609 | | |
Expense reductions due to earnings credits (Note 1) | | | (1,872 | ) | | | (563 | ) | |
Net Expenses | | | 237,404,813 | | | | 66,498,046 | | |
Net Investment Income (Loss) (Note 1) | | | 151,692,246 | | | | 37,286,023 | | |
Realized and Unrealized Gains (Losses) on Investments, Foreign
Currency Related Transactions and Written Options (Note 1) | |
Net realized gains (losses) from: | |
Investment transactions of unaffiliated issuers (net of capital gain country
tax of $0, $591,538, $0 and $0, respectively) | | | 383,953,269 | | | | 119,919,361 | | |
Investment transactions of affiliated issuers | | | 137,864,224 | | | | 2,560,824 | | |
Foreign currency and forward contract related transactions | | | 292,636,586 | | | | 148,034,492 | | |
Written options | | | 7,325,471 | | | | — | | |
| | | | 821,779,550 | | | | 270,514,677 | | |
Changes in unrealized appreciation (depreciation) of: | |
Investment transactions (net of increase in deferred capital gain country
tax accruals of $7,619,023, $3,096,852, $0 and $0, respectively) | | | 2,566,223,809 | | | | 836,024,771 | | |
Foreign currency and forward contract related translation | | | 219,142,917 | | | | 106,608,605 | | |
Written options | | | (4,556,262 | ) | | | — | | |
| | | | 2,780,810,464 | | | | 942,633,376 | | |
Net realized and unrealized gains (losses) on investments, foreign
currency and forward contract related transactions and written options | | | 3,602,590,014 | | | | 1,213,148,053 | | |
Net Increase (Decrease) in Net Assets Resulting from Operations | | $ | 3,754,282,260 | | | $ | 1,250,434,076 | | |
See Notes to Financial Statements.
FIRST EAGLE FUNDS | SEMI-ANNUAL REPORT | APRIL 30, 2013
140
Six Months Ended April 30, 2013 (unaudited)
| | | FIRST EAGLE
U.S. VALUE FUND | | FIRST EAGLE
GOLD FUND* | |
Investment Income | |
Interest (net of $46,343, $14,580, $0 and $0, foreign taxes
withheld, respectively) | | $ | 3,896,766 | | | $ | 841,273 | | |
Dividends from: (net of $25,289,014, $13,082,683, $418,612
and $1,402,580, foreign taxes withheld, respectively) | |
Unaffiliated issuers | | | 28,497,078 | | | | 12,575,574 | | |
Affiliated issuers | | | — | | | | — | | |
Other Income | | | — | | | | — | | |
Total Income | | | 32,393,844 | | | | 13,416,847 | | |
Expenses | |
Investment advisory fees (Note 2) | | | 11,563,472 | | | | 9,622,521 | | |
Administrative costs (Note 2) | | | 161,072 | | | | 165,348 | | |
Distribution fees (Note 3) | |
Class A | | | 1,793,869 | | | | 1,596,245 | | |
Class C | | | 2,456,110 | | | | 1,892,925 | | |
Service fees - Class C (Note 3) | | | 818,704 | | | | 630,975 | | |
Shareholder servicing agent fees | | | 2,143,302 | | | | 1,902,353 | | |
Custodian and accounting fees | | | 129,971 | | | | 301,477 | | |
Shareholder reporting fees | | | 162,806 | | | | 204,162 | | |
Trustees' fees | | | 33,514 | | | | 38,496 | | |
Registration and filing fees | | | 135,117 | | | | 96,755 | | |
Professional fees | | | 64,576 | | | | 88,076 | | |
Other Expenses | | | 40,598 | | | | 45,522 | | |
Total Expenses | | | 19,503,111 | | | | 16,584,855 | | |
Expense reductions due to earnings credits (Note 1) | | | (242 | ) | | | (236 | ) | |
Net Expenses | | | 19,502,869 | | | | 16,584,619 | | |
Net Investment Income (Loss) (Note 1) | | | 12,890,975 | | | | (3,167,772 | ) | |
Realized and Unrealized Gains (Losses) on Investments, Foreign
Currency Related Transactions and Written Options (Note 1) | |
Net realized gains (losses) from: | |
Investment transactions of unaffiliated issuers (net of capital gain country
tax of $0, $591,538, $0 and $0, respectively) | | | 42,512,308 | | | | (104,209,939 | ) | |
Investment transactions of affiliated issuers | | | — | | | | — | | |
Foreign currency and forward contract related transactions | | | 3,383 | | | | 16,601 | | |
Written options | | | 734,554 | | | | — | | |
| | | | 43,250,245 | | | | (104,193,338 | ) | |
Changes in unrealized appreciation (depreciation) of: | |
Investment transactions (net of increase in deferred capital gain country
tax accruals of $7,619,023, $3,096,852, $0 and $0, respectively) | | | 163,239,707 | | | | (930,965,006 | ) | |
Foreign currency and forward contract related translation | | | (1,019 | ) | | | 37,426 | | |
Written options | | | (392,263 | ) | | | — | | |
| | | | 162,846,425 | | | | (930,927,580 | ) | |
Net realized and unrealized gains (losses) on investments, foreign
currency and forward contract related transactions and written options | | | 206,096,670 | | | | (1,035,120,918 | ) | |
Net Increase (Decrease) in Net Assets Resulting from Operations | | $ | 218,987,645 | | | $ | (1,038,288,690 | ) | |
FIRST EAGLE FUNDS | SEMI-ANNUAL REPORT | APRIL 30, 2013
141
Statements of Operations (continued)
See Notes to Financial Statements.
| | | FIRST EAGLE
GLOBAL INCOME
BUILDER FUND | | FIRST EAGLE
HIGH YIELD FUND | |
Investment Income | |
Interest (net of $0, $(3,088) and $0, foreign taxes withheld, respectively) | | $ | 2,700,474 | | | $ | 26,361,610 | | |
Dividends from: (net of $362,029, $0 and $8,664, foreign taxes
withheld, respectively) | |
Unaffiliated issuers | | | 3,290,393 | | | | — | | |
Other Income | | | — | | | | 713,072 | | |
Total Income | | | 5,990,867 | | | | 27,074,682 | | |
Expenses | |
Investment advisory fees (Note 2) | | | 798,536 | | | | 2,676,139 | | |
Administrative costs (Note 2) | | | 53,236 | | | | 33,178 | | |
Distribution fees (Note 3) | |
Class A | | | 115,385 | | | | 346,620 | | |
Class C | | | 222,339 | | | | 509,429 | | |
Class Y | | | — | | | | — | | |
Service fees - Class C (Note 3) | | | 74,113 | | | | 169,810 | | |
Shareholder servicing agent fees | | | 172,019 | | | | 535,720 | | |
Custodian and accounting fees | | | 77,230 | | | | 70,927 | | |
Shareholder reporting fees | | | 8,272 | | | | 30,558 | | |
Trustees' fees | | | 1,810 | | | | 9,218 | | |
Registration and filing fees | | | 66,554 | | | | 172,167 | | |
Professional fees | | | 47,249 | | | | 59,090 | | |
Other Expenses | | | 21,342 | | | | 12,012 | | |
Total Expenses | | | 1,658,085 | | | | 4,624,868 | | |
Investment Advisory Fee Waiver | | | (128,284 | ) | | | (251,070 | ) | |
Expense reductions due to earnings credits (Note 1) | | | (14 | ) | | | (36 | ) | |
Net Expenses | | | 1,529,787 | | | | 4,373,762 | | |
Net Investment Income (Note 1) | | | 4,461,080 | | | | 22,700,920 | | |
Realized and Unrealized Gains (Losses) on Investments, Foreign
Currency Related Transactions and Written Options (Note 1) | |
Net realized gains (losses) from: | |
Investment transactions of unaffiliated issuers | | | 345,165 | | | | 3,523,256 | | |
Foreign currency and forward contract related transactions | | | (75,655 | ) | | | 263,558 | | |
Payment from affiliates | | | — | | | | — | | |
Written options | | | — | | | | — | | |
| | | | 269,510 | | | | 3,786,814 | | |
Changes in unrealized appreciation (depreciation) of: | |
Investment transactions | | | 11,285,876 | | | | 17,811,766 | | |
Foreign currency and forward contract related translation | | | 152,175 | | | | (168,522 | ) | |
Written options | | | — | | | | — | | |
| | | | 11,438,051 | | | | 17,643,244 | | |
Net realized and unrealized gains on investments, foreign currency
and forward contract related transactions and written options | | | 11,707,561 | | | | 21,430,058 | | |
Net Increase in Net Assets Resulting from Operations | | $ | 16,168,641 | | | $ | 44,130,978 | | |
FIRST EAGLE FUNDS | SEMI-ANNUAL REPORT | APRIL 30, 2013
142
Six Months Ended April 30, 2013 (unaudited)
| | FIRST EAGLE
FUND OF AMERICA | |
Investment Income | |
Interest (net of $0, $(3,088) and $0, foreign taxes withheld, respectively) | | $ | 60,632 | | |
Dividends from: (net of $362,029, $0 and $8,664, foreign taxes
withheld, respectively) | |
Unaffiliated issuers | | | 15,231,910 | | |
Other Income | | | — | | |
Total Income | | | 15,292,542 | | |
Expenses | |
Investment advisory fees (Note 2) | | | 8,982,106 | | |
Administrative costs (Note 2) | | | 86,926 | | |
Distribution fees (Note 3) | |
Class A | | | 1,009,869 | | |
Class C | | | 1,067,189 | | |
Class Y | | | 839,220 | | |
Service fees - Class C (Note 3) | | | 355,730 | | |
Shareholder servicing agent fees | | | 889,396 | | |
Custodian and accounting fees | | | 85,577 | | |
Shareholder reporting fees | | | 73,508 | | |
Trustees' fees | | | 17,930 | | |
Registration and filing fees | | | 76,838 | | |
Professional fees | | | 92,255 | | |
Other Expenses | | | 27,320 | | |
Total Expenses | | | 13,603,864 | | |
Investment Advisory Fee Waiver | | | — | | |
Expense reductions due to earnings credits (Note 1) | | | (131 | ) | |
Net Expenses | | | 13,603,733 | | |
Net Investment Income (Note 1) | | | 1,688,809 | | |
Realized and Unrealized Gains (Losses) on Investments, Foreign
Currency Related Transactions and Written Options (Note 1) | |
Net realized gains (losses) from: | |
Investment transactions of unaffiliated issuers | | | 13,786,821 | | |
Foreign currency and forward contract related transactions | | | — | | |
Payment from affiliates | | | 10,466 | | |
Written options | | | (47,581,217 | ) | |
| | | | (33,783,930 | ) | |
Changes in unrealized appreciation (depreciation) of: | |
Investment transactions | | | 302,381,582 | | |
Foreign currency and forward contract related translation | | | — | | |
Written options | | | (18,240,307 | ) | |
| | | | 284,141,275 | | |
Net realized and unrealized gains on investments, foreign currency
and forward contract related transactions and written options | | | 250,357,345 | | |
Net Increase in Net Assets Resulting from Operations | | $ | 252,046,154 | | |
FIRST EAGLE FUNDS | SEMI-ANNUAL REPORT | APRIL 30, 2013
143
Statements of Changes in Net Assets
| | | FIRST EAGLE
GLOBAL FUND | | FIRST EAGLE
OVERSEAS FUND | |
| | | SIX MONTHS
ENDED
APRIL 30, 2013
(unaudited) | | YEAR ENDED
OCTOBER 31,
2012 | | SIX MONTHS
ENDED
APRIL 30, 2013
(unaudited) | | YEAR ENDED
OCTOBER 31,
2012 | |
Operations | |
Net investment income (loss) | | $ | 151,692,246 | | | $ | 276,508,210 | | | $ | 37,286,023 | | | $ | 120,903,565 | | |
Net realized gain (loss) from investments, foreign currency and
forward contract related transactions and written options | | | 821,779,550 | | | | 1,354,006,926 | | | | 270,514,677 | | | | 572,354,242 | | |
Change in unrealized appreciation (depreciation) of investments, foreign
currency and forward contract related transactions and written options | | | 2,780,810,464 | | | | 810,758,524 | | | | 942,633,376 | | | | (166,817,810 | ) | |
Net increase (decrease) in net assets resulting from operations | | | 3,754,282,260 | | | | 2,441,273,660 | | | | 1,250,434,076 | | | | 526,439,997 | | |
Distribution to Shareholders | |
Dividends paid from net investment income | |
Class A | | | (163,783,319 | ) | | | (161,651,447 | ) | | | (59,748,117 | ) | | | (87,147,378 | ) | |
Class C | | | (31,090,889 | ) | | | (37,795,689 | ) | | | (5,650,460 | ) | | | (9,351,396 | ) | |
Class I | | | (144,298,326 | ) | | | (117,693,838 | ) | | | (73,001,519 | ) | | | (83,348,638 | ) | |
Distributions paid from net realized gains from
investment transactions | |
Class A | | | (515,356,389 | ) | | | (187,416,480 | ) | | | (205,372,548 | ) | | | (144,484,153 | ) | |
Class C | | | (311,092,874 | ) | | | (112,464,797 | ) | | | (40,854,132 | ) | | | (30,206,608 | ) | |
Class I | | | (367,245,305 | ) | | | (111,887,923 | ) | | | (213,569,253 | ) | | | (117,992,781 | ) | |
Decrease in net assets resulting from distributions | | | (1,532,867,102 | ) | | | (728,910,174 | ) | | | (598,196,029 | ) | | | (472,530,954 | ) | |
Fund Share Transactions (Note 6) | |
Net proceeds from shares sold | | | 5,395,286,872 | | | | 8,576,084,794 | | | | 2,139,443,449 | | | | 3,366,030,361 | | |
Net asset value of shares issued for reinvested dividends and
distributions | | | 1,212,640,048 | | | | 575,698,338 | | | | 505,564,770 | | | | 394,213,613 | | |
Cost of shares redeemed | | | (3,497,846,501 | ) | | | (5,713,371,171 | ) | | | (1,302,981,228 | ) | | | (2,651,211,522 | ) | |
Redemption fees | | | 241,370 | | | | 730,073 | | | | 56,973 | | | | 319,996 | | |
Increase (decrease) in net assets from Fund share transactions | | | 3,110,321,789 | | | | 3,439,142,034 | | | | 1,342,083,964 | | | | 1,109,352,448 | | |
Net increase (decrease) in net assets | | | 5,331,736,947 | | | | 5,151,505,520 | | | | 1,994,322,011 | | | | 1,163,261,491 | | |
Net Assets (Note 1) | |
Beginning of period | | | 36,343,614,422 | | | | 31,192,108,902 | | | | 11,348,778,045 | | | | 10,185,516,554 | | |
End of period | | $ | 41,675,351,369 | | | $ | 36,343,614,422 | | | $ | 13,343,100,056 | | | $ | 11,348,778,045 | | |
Undistributed net investment income (loss) | | $ | (160,353,811 | ) | | $ | 27,126,477 | | | $ | (251,681,980 | ) | | $ | (150,567,907 | ) | |
* First Eagle Gold Fund financial statements are shown on a consolidated basis and include the balances of the First Eagle Gold Cayman Fund, Ltd.
See Notes to Financial Statements.
FIRST EAGLE FUNDS | SEMI-ANNUAL REPORT | APRIL 30, 2013
144
| | | FIRST EAGLE
U.S. VALUE FUND | | FIRST EAGLE
GOLD FUND* | |
| | | SIX MONTHS
ENDED
APRIL 30, 2013
(unaudited) | | YEAR ENDED
OCTOBER 31,
2012 | | SIX MONTHS
ENDED
APRIL 30, 2013
(unaudited) | | YEAR ENDED
OCTOBER 31,
2012 | |
Operations | |
Net investment income (loss) | | $ | 12,890,975 | | | $ | 19,450,806 | | | $ | (3,167,772 | ) | | $ | (3,518,438 | ) | |
Net realized gain (loss) from investments, foreign currency and
forward contract related transactions and written options | | | 43,250,245 | | | | 75,573,696 | | | | (104,193,338 | ) | | | 11,739,292 | | |
Change in unrealized appreciation (depreciation) of investments, foreign
currency and forward contract related transactions and written options | | | 162,846,425 | | | | 155,816,068 | | | | (930,927,580 | ) | | | (318,100,640 | ) | |
Net increase (decrease) in net assets resulting from operations | | | 218,987,645 | | | | 250,840,570 | | | | (1,038,288,690 | ) | | | (309,879,786 | ) | |
Distribution to Shareholders | |
Dividends paid from net investment income | |
Class A | | | (9,726,109 | ) | | | (8,668,560 | ) | | | (4,158,233 | ) | | | (21,160,789 | ) | |
Class C | | | (247,938 | ) | | | (761,790 | ) | | | — | | | | (3,321,956 | ) | |
Class I | | | (8,637,463 | ) | | | (5,904,350 | ) | | | (4,720,219 | ) | | | (14,147,644 | ) | |
Distributions paid from net realized gains from
investment transactions | |
Class A | | | (32,729,995 | ) | | | (27,270,843 | ) | | | — | | | | (48,611,807 | ) | |
Class C | | | (14,995,423 | ) | | | (11,485,203 | ) | | | — | | | | (18,719,722 | ) | |
Class I | | | (21,670,124 | ) | | | (14,754,342 | ) | | | — | | | | (26,628,986 | ) | |
Decrease in net assets resulting from distributions | | | (88,007,052 | ) | | | (68,845,088 | ) | | | (8,878,452 | ) | | | (132,590,904 | ) | |
Fund Share Transactions (Note 6) | |
Net proceeds from shares sold | | | 486,972,697 | | | | 1,361,319,863 | | | | 585,082,420 | | | | 1,162,012,459 | | |
Net asset value of shares issued for reinvested dividends and
distributions | | | 71,616,802 | | | | 57,064,131 | | | | 5,749,456 | | | | 92,471,546 | | |
Cost of shares redeemed | | | (456,073,896 | ) | | | (519,076,926 | ) | | | (627,962,928 | ) | | | (1,256,911,726 | ) | |
Redemption fees | | | — | | | | — | | | | 75,413 | | | | 239,954 | | |
Increase (decrease) in net assets from Fund share transactions | | | 102,515,603 | | | | 899,307,068 | | | | (37,055,639 | ) | | | (2,187,767 | ) | |
Net increase (decrease) in net assets | | | 233,496,196 | | | | 1,081,302,550 | | | | (1,084,222,781 | ) | | | (444,658,457 | ) | |
Net Assets (Note 1) | |
Beginning of period | | | 2,993,820,940 | | | | 1,912,518,390 | | | | 3,075,260,365 | | | | 3,519,918,822 | | |
End of period | | $ | 3,227,317,136 | | | $ | 2,993,820,940 | | | $ | 1,991,037,584 | | | $ | 3,075,260,365 | | |
Undistributed net investment income (loss) | | $ | 10,797,039 | | | $ | 16,517,574 | | | $ | (112,233,412 | ) | | $ | (100,187,188 | ) | |
FIRST EAGLE FUNDS | SEMI-ANNUAL REPORT | APRIL 30, 2013
145
Statements of Changes in Net Assets (continued)
| | | FIRST EAGLE
GLOBAL INCOME
BUILDER FUND | | FIRST EAGLE
HIGH YIELD FUND | |
| | | SIX MONTHS
ENDED
APRIL 30, 2013
(unaudited) | | PERIOD
MAY 1, 2012 TO
OCTOBER 31,
2012 | | SIX MONTHS
ENDED
APRIL 30, 2013
(unaudited) | | PERIOD
APRIL 1, 2012 TO
OCTOBER 31,
2012 | |
Operations | |
Net investment income (loss) | | $ | 4,461,080 | | | $ | 869,230 | | | $ | 22,700,920 | | | $ | 15,254,773 | | |
Net realized gain (loss) from investments, foreign currency and
forward contract related transactions and written options | | | 269,510 | | | | 87,310 | | | | 3,786,814 | | | | 1,562,963 | | |
Change in unrealized appreciation (depreciation) of investments, foreign
currency and forward contract related transactions and written options | | | 11,438,051 | | | | 2,030,861 | | | | 17,643,244 | | | | 12,067,997 | | |
Net increase (decrease) in net assets resulting from operations | | | 16,168,641 | | | | 2,987,401 | | | | 44,130,978 | | | | 28,885,733 | | |
Distribution to Shareholders | |
Dividends paid from net investment income | |
Class A | | | (1,947,541 | ) | | | (207,258 | ) | | | (8,152,593 | ) | | | (5,146,846 | ) | |
Class C | | | (1,005,673 | ) | | | (93,296 | ) | | | (3,488,349 | ) | | | (2,099,621 | ) | |
Class I | | | (1,439,658 | ) | | | (375,701 | ) | | | (11,059,969 | ) | | | (8,021,377 | ) | |
Class Y | | | — | | | | — | | | | — | | | | — | | |
Distributions paid from net realized gains from
investment transactions | |
Class A | | | — | | | | — | | | | (236,977 | ) | | | — | | |
Class C | | | — | | | | — | | | | (125,800 | ) | | | — | | |
Class I | | | — | | | | — | | | | (322,171 | ) | | | — | | |
Class Y | | | — | | | | — | | | | — | | | | — | | |
Decrease in net assets resulting from distributions | | | (4,392,872 | ) | | | (676,255 | ) | | | (23,385,859 | ) | | | (15,267,844 | ) | |
Fund Share Transactions (Note 6) | |
Net proceeds from shares sold | | | 223,399,385 | | | | 106,407,315 | | | | 297,002,791 | | | | 448,132,515 | | |
Net asset value of shares issued for reinvested dividends and distributions | | | 1,987,351 | | | | 453,949 | | | | 17,404,484 | | | | 11,996,758 | | |
Cost of shares redeemed | | | (14,840,258 | ) | | | (1,819,012 | ) | | | (87,723,263 | ) | | | (34,728,034 | ) | |
Increase (decrease) in net assets from Fund share transactions | | | 210,546,478 | | | | 105,042,252 | | | | 226,684,012 | | | | 425,401,239 | | |
Net increase (decrease) in net assets | | | 222,322,247 | | | | 107,353,398 | | | | 247,429,131 | | | | 439,019,128 | | |
Net Assets (Note 1) | |
Beginning of period | | | 107,353,398 | | | | — | | | | 641,899,714 | | | | 202,880,586 | | |
End of period | | $ | 329,675,645 | | | $ | 107,353,398 | | | $ | 889,328,845 | | | $ | 641,899,714 | | |
Undistributed net investment income (loss) | | $ | 273,963 | | | $ | 205,755 | | | $ | 295,538 | | | $ | 295,529 | | |
See Notes to Financial Statements.
FIRST EAGLE FUNDS | SEMI-ANNUAL REPORT | APRIL 30, 2013
146
| | | FIRST EAGLE
FUND OF AMERICA | |
| | | SIX MONTHS
ENDED
APRIL 30, 2013
(unaudited) | | YEAR ENDED
OCTOBER 31,
2012 | |
Operations | |
Net investment income (loss) | | $ | 1,688,809 | | | $ | 496,431 | | |
Net realized gain (loss) from investments, foreign currency and
forward contract related transactions and written options | | | (33,783,930 | ) | | | (34,795,479 | ) | |
Change in unrealized appreciation (depreciation) of investments, foreign
currency and forward contract related transactions and written options | | | 284,141,275 | | | | 256,165,635 | | |
Net increase (decrease) in net assets resulting from operations | | | 252,046,154 | | | | 221,866,587 | | |
Distribution to Shareholders | |
Dividends paid from net investment income | |
Class A | | | (239,974 | ) | | | — | | |
Class C | | | — | | | | — | | |
Class I | | | — | | | | — | | |
Class Y | | | (211,957 | ) | | | — | | |
Distributions paid from net realized gains from
investment transactions | |
Class A | | | — | | | | (39,934,200 | ) | |
Class C | | | — | | | | (15,978,381 | ) | |
Class I | | | — | | | | — | | |
Class Y | | | — | | | | (44,697,643 | ) | |
Decrease in net assets resulting from distributions | | | (451,931 | ) | | | (100,610,224 | ) | |
Fund Share Transactions (Note 6) | |
Net proceeds from shares sold | | | 581,278,170 | | | | 308,241,688 | | |
Net asset value of shares issued for reinvested dividends and distributions | | | 384,672 | | | | 88,825,318 | | |
Cost of shares redeemed | | | (405,415,395 | ) | | | (283,000,180 | ) | |
Increase (decrease) in net assets from Fund share transactions | | | 176,247,447 | | | | 114,066,826 | | |
Net increase (decrease) in net assets | | | 427,841,670 | | | | 235,323,189 | | |
Net Assets (Note 1) | |
Beginning of period | | | 1,611,068,613 | | | | 1,375,745,424 | | |
End of period | | $ | 2,038,910,283 | | | $ | 1,611,068,613 | | |
Undistributed net investment income (loss) | | $ | 822,385 | | | $ | (414,493 | ) | |
FIRST EAGLE FUNDS | SEMI-ANNUAL REPORT | APRIL 30, 2013
147

| | | SIX MONTHS ENDED | | YEAR ENDED OCTOBER 31, | |
| | | APRIL 30, 2013 (unaudited) | | 2012 | |
| | | CLASS A | | CLASS C | | CLASS I | | CLASS A | | CLASS C | | CLASS I | |
Selected data for a share of beneficial interest outstanding throughout
each period is presented below:* | |
Net asset value,
beginning of period ($) | | | 49.24 | | | | 48.16 | | | | 49.50 | | | | 46.90 | | | | 45.91 | | | | 47.15 | | |
Income (loss) from investment operations: | |
Net investment income ($) | | | 0.22 | | | | 0.04 | | | | 0.29 | | | | 0.45 | | | | 0.09 | | | | 0.57 | | |
Net realized and unrealized
gains (losses) on investments | | | 4.64 | | | | 4.55 | | | | 4.66 | | | | 3.03 | | | | 2.98 | | | | 3.03 | | |
Total income (loss) from
investment operations | | | 4.86 | | | | 4.59 | | | | 4.95 | | | | 3.48 | | | | 3.07 | | | | 3.60 | | |
Less distributions: | |
Dividends from net
investment income ($) | | | -0.51 | | | | -0.16 | | | | -0.63 | | | | -0.53 | | | | -0.21 | | | | -0.64 | | |
Distributions from
capital gains | | | -1.61 | | | | -1.61 | | | | -1.61 | | | | -0.61 | | | | -0.61 | | | | -0.61 | | |
Total distributions | | | -2.12 | | | | -1.77 | | | | -2.24 | | | | -1.14 | | | | -0.82 | | | | -1.25 | | |
Net asset value,
end of period ($) | | | 51.98 | | | | 50.98 | | | | 52.21 | | | | 49.24 | | | | 48.16 | | | | 49.50 | | |
Total Return(c) (%) | | | 10.26 | (a) | | | 9.85 | (a) | | | 10.41 | (a) | | | 7.64 | | | | 6.83 | | | | 7.90 | | |
Ratios and supplemental data | |
Net assets, end of period
(millions) ($) | | | 17,640 | | | | 10,513 | | | | 13,522 | | | | 15,840 | | | | 9,322 | | | | 11,182 | | |
Ratio of operating expenses
to average net assets
including earnings credits (%) | | | 1.13 | (b) | | | 1.88 | (b) | | | 0.88 | (b) | | | 1.15 | | | | 1.89 | | | | 0.90 | | |
Ratio of operating expenses
to average net assets
excluding earnings credits (%) | | | 1.13 | (b) | | | 1.88 | (b) | | | 0.88 | (b) | | | 1.15 | | | | 1.89 | | | | 0.90 | | |
Ratio of net investment
income to average net assets
including earnings credits (%) | | | 0.90 | (b) | | | 0.15 | (b) | | | 1.17 | (b) | | | 0.94 | | | | 0.19 | | | | 1.19 | | |
Ratio of net investment
income to average net assets
excluding earnings credits (%) | | | 0.90 | (b) | | | 0.15 | (b) | | | 1.17 | (b) | | | 0.94 | | | | 0.19 | | | | 1.19 | | |
Portfolio turnover rate (%) | | | 7.16 | (a) | | | 7.16 | (a) | | | 7.16 | (a) | | | 11.29 | | | | 11.29 | | | | 11.29 | | |
* Per share amounts have been calculated using the average shares method.
** Amount represents less than $0.01 per share.
(a) Not Annualized
(b) Annualized
(c) Does not take into account the sale charge of 5.00% for Class A and the CDSC (Contingent Deferred Sales Charge) of 1.00% for Class C shares.
See Notes to Financial Statements.
FIRST EAGLE FUNDS | SEMI-ANNUAL REPORT | APRIL 30, 2013
148
Global Fund
| | | YEAR ENDED OCTOBER 31, | |
| | | 2011 | | 2010 | | 2009 | | 2008 | |
| | | CLASS A | | CLASS C | | CLASS I | | CLASS A | | CLASS C | | CLASS I | | CLASS A | | CLASS C | | CLASS I | | CLASS A | | CLASS C | | CLASS I | |
Selected data for a share of beneficial interest outstanding throughout
each period is presented below:* | |
Net asset value,
beginning of period ($) | | | 44.36 | | | | 43.47 | | | | 44.59 | | | | 38.74 | | | | 38.07 | | | | 38.92 | | | | 34.45 | | | | 33.99 | | | | 34.62 | | | | 51.09 | | | | 50.46 | | | | 51.32 | | |
Income (loss) from investment operations: | |
Net investment income ($) | | | 0.39 | | | | 0.04 | | | | 0.51 | | | | 0.56 | | | | 0.26 | | | | 0.69 | | | | 0.39 | | | | 0.13 | | | | 0.47 | | | | 0.64 | | | | 0.31 | | | | 0.76 | | |
Net realized and unrealized
gains (losses) on investments | | | 2.79 | | | | 2.75 | | | | 2.81 | | | | 5.63 | | | | 5.51 | | | | 5.63 | | | | 6.35 | | | | 6.26 | | | | 6.39 | | | | -11.82 | | | | -11.69 | | | | -11.88 | | |
Total income (loss) from
investment operations | | | 3.18 | | | | 2.79 | | | | 3.32 | | | | 6.19 | | | | 5.77 | | | | 6.32 | | | | 6.74 | | | | 6.39 | | | | 6.86 | | | | -11.18 | | | | -11.38 | | | | -11.12 | | |
Less distributions: | |
Dividends from net
investment income ($) | | | -0.64 | | | | -0.35 | | | | -0.76 | | | | -0.57 | | | | -0.37 | | | | -0.65 | | | | -0.14 | | | | -0.00 | ** | | | -0.25 | | | | -1.07 | | | | -0.70 | | | | -1.19 | | |
Distributions from
capital gains | | | — | | | | — | | | | — | | | | — | | | | — | | | | — | | | | -2.31 | | | | -2.31 | | | | -2.31 | | | | -4.39 | | | | -4.39 | | | | -4.39 | | |
Total distributions | | | -0.64 | | | | -0.35 | | | | -0.76 | | | | -0.57 | | | | -0.37 | | | | -0.65 | | | | -2.45 | | | | -2.31 | | | | -2.56 | | | | -5.46 | | | | -5.09 | | | | -5.58 | | |
Net asset value,
end of period ($) | | | 46.90 | | | | 45.91 | | | | 47.15 | | | | 44.36 | | | | 43.47 | | | | 44.59 | | | | 38.74 | | | | 38.07 | | | | 38.92 | | | | 34.45 | | | | 33.99 | | | | 34.62 | | |
Total Return(c) (%) | | | 7.23 | | | | 6.45 | | | | 7.52 | | | | 16.13 | | | | 15.23 | | | | 16.40 | | | | 20.81 | | | | 19.93 | | | | 21.13 | | | | -24.41 | | | | -24.99 | | | | -24.21 | | |
Ratios and supplemental data | |
Net assets, end of period
(millions) ($) | | | 14,352 | | | | 8,385 | | | | 8,455 | | | | 12,195 | | | | 6,524 | | | | 5,345 | | | | 10,562 | | | | 5,158 | | | | 3,338 | | | | 9,784 | | | | 4,623 | | | | 2,898 | | |
Ratio of operating expenses
to average net assets
including earnings credits (%) | | | 1.13 | | | | 1.88 | | | | 0.88 | | | | 1.16 | | | | 1.91 | | | | 0.91 | | | | 1.19 | | | | 1.94 | | | | 0.94 | | | | 1.14 | | | | 1.89 | | | | 0.89 | | |
Ratio of operating expenses
to average net assets
excluding earnings credits (%) | | | 1.13 | | | | 1.88 | | | | 0.88 | | | | 1.16 | | | | 1.91 | | | | 0.91 | | | | 1.19 | | | | 1.94 | | | | 0.94 | | | | 1.14 | | | | 1.89 | | | | 0.89 | | |
Ratio of net investment
income to average net assets
including earnings credits (%) | | | 0.83 | | | | 0.08 | | | | 1.07 | | | | 1.36 | | | | 0.63 | | | | 1.68 | | | | 1.14 | | | | 0.38 | | | | 1.37 | | | | 1.48 | | | | 0.73 | | | | 1.74 | | |
Ratio of net investment
income to average net assets
excluding earnings credits (%) | | | 0.83 | | | | 0.08 | | | | 1.07 | | | | 1.36 | | | | 0.63 | | | | 1.68 | | | | 1.14 | | | | 0.38 | | | | 1.37 | | | | 1.48 | | | | 0.73 | | | | 1.74 | | |
Portfolio turnover rate (%) | | | 11.57 | | | | 11.57 | | | | 11.57 | | | | 17.37 | | | | 17.37 | | | | 17.37 | | | | 12.52 | | | | 12.52 | | | | 12.52 | | | | 29.69 | | | | 29.69 | | | | 29.69 | | |
FIRST EAGLE FUNDS | SEMI-ANNUAL REPORT | APRIL 30, 2013
149

| | | SIX MONTHS ENDED | | YEAR ENDED OCTOBER 31, | |
| | | APRIL 30, 2013 (unaudited) | | 2012 | |
| | | CLASS A | | CLASS C | | CLASS I | | CLASS A | | CLASS C | | CLASS I | |
Selected data for a share of beneficial interest outstanding throughout
each period is presented below:* | |
Net asset value,
beginning of period ($) | | | 22.26 | | | | 21.62 | | | | 22.63 | | | | 22.25 | | | | 21.61 | | | | 22.61 | | |
Income (loss) from investment operations: | |
Net investment income (loss) ($) | | | 0.06 | | | | -0.02 | | | | 0.09 | | | | 0.24 | | | | 0.08 | | | | 0.30 | | |
Net realized and unrealized
gains (losses) on investments | | | 2.22 | | | | 2.18 | | | | 2.26 | | | | 0.80 | | | | 0.77 | | | | 0.81 | | |
Total income (loss) from
investment operations | | | 2.28 | | | | 2.16 | | | | 2.35 | | | | 1.04 | | | | 0.85 | | | | 1.11 | | |
Less distributions: | |
Dividends from net
investment income ($) | | | -0.26 | | | | -0.13 | | | | -0.31 | | | | -0.39 | | | | -0.20 | | | | -0.45 | | |
Distributions from
capital gains | | | -0.90 | | | | -0.90 | | | | -0.90 | | | | -0.64 | | | | -0.64 | | | | -0.64 | | |
Total distributions | | | -1.16 | | | | -1.03 | | | | -1.21 | | | | -1.03 | | | | -0.84 | | | | -1.09 | | |
Net asset value,
end of period ($) | | | 23.38 | | | | 22.75 | | | | 23.77 | | | | 22.26 | | | | 21.62 | | | | 22.63 | | |
Total Return(c) (%) | | | 10.79 | (a) | | | 10.40 | (a) | | | 10.88 | (a) | | | 5.06 | | | | 4.28 | | | | 5.36 | | |
Ratios and supplemental data | |
Net assets, end of period
(millions) ($) | | | 5,676 | | | | 1,073 | | | | 6,594 | | | | 5,111 | | | | 986 | | | | 5,252 | | |
Ratio of operating expenses
to average net assets
including earnings credits (%) | | | 1.16 | (b) | | | 1.91 | (b) | | | 0.91 | (b) | | | 1.17 | | | | 1.92 | | | | 0.92 | | |
Ratio of operating expenses
to average net assets
excluding earnings credits (%) | | | 1.16 | (b) | | | 1.91 | (b) | | | 0.91 | (b) | | | 1.17 | | | | 1.92 | | | | 0.92 | | |
Ratio of net investment
income (loss) to average net assets
including earnings credits (%) | | | 0.54 | (b) | | | -0.22 | (b) | | | 0.83 | (b) | | | 1.12 | | | | 0.37 | | | | 1.36 | | |
Ratio of net investment
income (loss) to average net assets
excluding earnings credits (%) | | | 0.54 | (b) | | | -0.22 | (b) | | | 0.83 | (b) | | | 1.12 | | | | 0.37 | | | | 1.36 | | |
Portfolio turnover rate (%) | | | 8.06 | (a) | | | 8.06 | (a) | | | 8.06 | (a) | | | 10.50 | | | | 10.50 | | | | 10.50 | | |
* Per share amounts have been calculated using the average shares method.
** Amount represents less than $0.01 per share.
(a) Not Annualized
(b) Annualized
(c) Does not take into account the sales charge of 5.00% for Class A shares and the CDSC (Contingent Deferred Sales Charge) of 1.00% for Class C shares.
See Notes to Financial Statements.
FIRST EAGLE FUNDS | SEMI-ANNUAL REPORT | APRIL 30, 2013
150
Overseas Fund
| | | YEAR ENDED OCTOBER 31, | |
| | | 2011 | | 2010 | | 2009 | | 2008 | |
| | | CLASS A | | CLASS C | | CLASS I | | CLASS A | | CLASS C | | CLASS I | | CLASS A | | CLASS C | | CLASS I | | CLASS A | | CLASS C | | CLASS I | |
Selected data for a share of beneficial interest outstanding throughout
each period is presented below:* | |
Net asset value,
beginning of period ($) | | | 21.86 | | | | 21.26 | | | | 22.20 | | | | 19.51 | | | | 19.03 | | | | 19.80 | | | | 17.21 | | | | 16.93 | | | | 17.41 | | | | 28.09 | | | | 27.66 | | | | 28.38 | | |
Income (loss) from investment operations: | |
Net investment income (loss) ($) | | | 0.18 | | | | 0.01 | | | | 0.24 | | | | 0.15 | | | | 0.00 | ** | | | 0.21 | | | | 0.26 | | | | 0.13 | | | | 0.30 | | | | 0.35 | | | | 0.18 | | | | 0.40 | | |
Net realized and unrealized
gains (losses) on investments | | | 0.74 | | | | 0.73 | | | | 0.75 | | | | 2.80 | | | | 2.72 | | | | 2.82 | | | | 3.72 | | | | 3.63 | | | | 3.78 | | | | -7.21 | | | | -7.10 | | | | -7.28 | | |
Total income (loss) from
investment operations | | | 0.92 | | | | 0.74 | | | | 0.99 | | | | 2.95 | | | | 2.72 | | | | 3.03 | | | | 3.98 | | | | 3.76 | | | | 4.08 | | | | -6.86 | | | | -6.92 | | | | -6.88 | | |
Less distributions: | |
Dividends from net
investment income ($) | | | -0.32 | | | | -0.18 | | | | -0.37 | | | | -0.60 | | | | -0.49 | | | | -0.63 | | | | -0.02 | | | | 0.00 | ** | | | -0.03 | | | | -0.87 | | | | -0.66 | | | | -0.94 | | |
Distributions from
capital gains | | | -0.21 | | | | -0.21 | | | | -0.21 | | | | — | | | | — | | | | — | | | | -1.66 | | | | -1.66 | | | | -1.66 | | | | -3.15 | | | | -3.15 | | | | -3.15 | | |
Total distributions | | | -0.53 | | | | -0.39 | | | | -0.58 | | | | -0.60 | | | | -0.49 | | | | -0.63 | | | | -1.68 | | | | -1.66 | | | | -1.69 | | | | -4.02 | | | | -3.81 | | | | -4.09 | | |
Net asset value,
end of period ($) | | | 22.25 | | | | 21.61 | | | | 22.61 | | | | 21.86 | | | | 21.26 | | | | 22.20 | | | | 19.51 | | | | 19.03 | | | | 19.80 | | | | 17.21 | | | | 16.93 | | | | 17.41 | | |
Total Return(c) (%) | | | 4.27 | | | | 3.48 | | | | 4.52 | | | | 15.45 | | | | 14.55 | | | | 15.68 | | | | 24.95 | | | | 23.96 | | | | 25.26 | | | | -28.15 | | | | -28.67 | | | | -27.97 | | |
Ratios and supplemental data | |
Net assets, end of period
(millions) ($) | | | 5,023 | | | | 1,027 | | | | 4,136 | | | | 4,676 | | | | 914 | | | | 3,284 | | | | 4,024 | | | | 792 | | | | 2,211 | | | | 3,518 | | | | 737 | | | | 1,968 | | |
Ratio of operating expenses
to average net assets
including earnings credits (%) | | | 1.14 | | | | 1.89 | | | | 0.89 | | | | 1.17 | | | | 1.92 | | | | 0.92 | | | | 1.20 | | | | 1.95 | | | | 0.95 | | | | 1.15 | | | | 1.90 | | | | 0.90 | | |
Ratio of operating expenses
to average net assets
excluding earnings credits (%) | | | 1.14 | | | | 1.89 | | | | 0.89 | | | | 1.17 | | | | 1.92 | | | | 0.92 | | | | 1.20 | | | | 1.95 | | | | 0.95 | | | | 1.15 | | | | 1.90 | | | | 0.90 | | |
Ratio of net investment
income (loss) to average net assets
including earnings credits (%) | | | 0.78 | | | | 0.04 | | | | 1.06 | | | | 0.76 | | | | 0.01 | | | | 1.03 | | | | 1.51 | | | | 0.76 | | | | 1.75 | | | | 1.57 | | | | 0.82 | | | | 1.76 | | |
Ratio of net investment
income (loss) to average net assets
excluding earnings credits (%) | | | 0.78 | | | | 0.04 | | | | 1.06 | | | | 0.76 | | | | 0.01 | | | | 1.03 | | | | 1.51 | | | | 0.76 | | | | 1.75 | | | | 1.57 | | | | 0.82 | | | | 1.76 | | |
Portfolio turnover rate (%) | | | 12.22 | | | | 12.22 | | | | 12.22 | | | | 15.53 | | | | 15.53 | | | | 15.53 | | | | 8.65 | | | | 8.65 | | | | 8.65 | | | | 15.72 | | | | 15.72 | | | | 15.72 | | |
FIRST EAGLE FUNDS | SEMI-ANNUAL REPORT | APRIL 30, 2013
151

| | | SIX MONTHS ENDED | | YEAR ENDED OCTOBER 31, | |
| | | APRIL 30, 2013 (unaudited) | | 2012 | |
| | | CLASS A | | CLASS C | | CLASS I | | CLASS A | | CLASS C | | CLASS I | |
Selected data for a share of beneficial interest outstanding throughout
each period is presented below:* | |
Net asset value,
beginning of period ($) | | | 18.27 | | | | 18.02 | | | | 18.50 | | | | 17.12 | | | | 16.91 | | | | 17.33 | | |
Income (loss) from investment operations: | |
Net investment income ($) | | | 0.08 | | | | 0.01 | | | | 0.11 | | | | 0.15 | | | | 0.02 | | | | 0.19 | | |
Net realized and unrealized
gains (losses) on investments | | | 1.22 | | | | 1.21 | | | | 1.23 | | | | 1.59 | | | | 1.57 | | | | 1.61 | | |
Total income (loss) from
investment operations | | | 1.30 | | | | 1.22 | | | | 1.34 | | | | 1.74 | | | | 1.59 | | | | 1.80 | | |
Less distributions: | |
Dividends from net
investment income ($) | | | -0.13 | | | | -0.01 | | | | -0.17 | | | | -0.14 | | | | -0.03 | | | | -0.18 | | |
Distributions from
capital gains | | | -0.42 | | | | -0.42 | | | | -0.42 | | | | -0.45 | | | | -0.45 | | | | -0.45 | | |
Total distributions | | | -0.55 | | | | -0.43 | | | | -0.59 | | | | -0.59 | | | | -0.48 | | | | -0.63 | | |
Net asset value,
end of period ($) | | | 19.02 | | | | 18.81 | | | | 19.25 | | | | 18.27 | | | | 18.02 | | | | 18.50 | | |
Total Return(c) (%) | | | 7.33 | (a) | | | 6.93 | (a) | | | 7.49 | (a) | | | 10.63 | | | | 9.75 | | | | 10.86 | | |
Ratios and supplemental data | |
Net assets, end of period
(millions) ($) | | | 1,482 | | | | 689 | | | | 1,057 | | | | 1,425 | | | | 631 | | | | 938 | | |
Ratio of operating expenses
to average net assets
including earnings credits (%) | | | 1.19 | (b) | | | 1.94 | (b) | | | 0.94 | (b) | | | 1.17 | | | | 1.92 | | | | 0.93 | | |
Ratio of operating expenses
to average net assets
excluding earnings credits (%) | | | 1.19 | (b) | | | 1.94 | (b) | | | 0.94 | (b) | | | 1.17 | | | | 1.92 | | | | 0.93 | | |
Ratio of net investment
income to average net assets
including earnings credits (%) | | | 0.92 | (b) | | | 0.16 | (b) | | | 1.16 | (b) | | | 0.84 | | | | 0.09 | | | | 1.08 | | |
Ratio of net investment
income to average net assets
excluding earnings credits (%) | | | 0.92 | (b) | | | 0.16 | (b) | | | 1.16 | (b) | | | 0.84 | | | | 0.09 | | | | 1.08 | | |
Portfolio turnover rate (%) | | | 6.58 | (a) | | | 6.58 | (a) | | | 6.58 | (a) | | | 14.34 | | | | 14.34 | | | | 14.34 | | |
* Per share amounts have been calculated using the average shares method.
(a) Not Annualized
(b) Annualized
(c) Does not take into account the sales charge of 5.00% for Class A shares and the CDSC (Contingent Deferred Sales Charge) of 1.00% for Class C shares.
See Notes to Financial Statements.
FIRST EAGLE FUNDS | SEMI-ANNUAL REPORT | APRIL 30, 2013
152
U.S. Value Fund
| | | YEAR ENDED OCTOBER 31, | |
| | | 2011 | | 2010 | | 2009 | | 2008 | |
| | | CLASS A | | CLASS C | | CLASS I | | CLASS A | | CLASS C | | CLASS I | | CLASS A | | CLASS C | | CLASS I | | CLASS A | | CLASS C | | CLASS I | |
Selected data for a share of beneficial interest outstanding throughout
each period is presented below:* | |
Net asset value,
beginning of period ($) | | | 15.94 | | | | 15.75 | | | | 16.12 | | | | 14.21 | | | | 14.06 | | | | 14.37 | | | | 12.75 | | | | 12.63 | | | | 12.89 | | | | 17.01 | | | | 16.87 | | | | 17.19 | | |
Income (loss) from investment operations: | |
Net investment income ($) | | | 0.17 | | | | 0.04 | | | | 0.21 | | | | 0.32 | | | | 0.21 | | | | 0.38 | | | | 0.21 | | | | 0.12 | | | | 0.24 | | | | 0.36 | | | | 0.24 | | | | 0.40 | | |
Net realized and unrealized
gains (losses) on investments | | | 1.34 | | | | 1.34 | | | | 1.37 | | | | 1.60 | | | | 1.58 | | | | 1.59 | | | | 1.58 | | | | 1.56 | | | | 1.60 | | | | -3.65 | | | | -3.63 | | | | -3.69 | | |
Total income (loss) from
investment operations | | | 1.51 | | | | 1.38 | | | | 1.58 | | | | 1.92 | | | | 1.79 | | | | 1.97 | | | | 1.79 | | | | 1.68 | | | | 1.84 | | | | -3.29 | | | | -3.39 | | | | -3.29 | | |
Less distributions: | |
Dividends from net
investment income ($) | | | -0.33 | | | | -0.22 | | | | -0.37 | | | | -0.19 | | | | -0.10 | | | | -0.22 | | | | -0.22 | | | | -0.14 | | | | -0.25 | | | | -0.31 | | | | -0.19 | | | | -0.35 | | |
Distributions from
capital gains | | | — | | | | — | | | | — | | | | — | | | | — | | | | — | | | | -0.11 | | | | -0.11 | | | | -0.11 | | | | -0.66 | | | | -0.66 | | | | -0.66 | | |
Total distributions | | | -0.33 | | | | -0.22 | | | | -0.37 | | | | -0.19 | | | | -0.10 | | | | -0.22 | | | | -0.33 | | | | -0.25 | | | | -0.36 | | | | -0.97 | | | | -0.85 | | | | -1.01 | | |
Net asset value,
end of period ($) | | | 17.12 | | | | 16.91 | | | | 17.33 | | | | 15.94 | | | | 15.75 | | | | 16.12 | | | | 14.21 | | | | 14.06 | | | | 14.37 | | | | 12.75 | | | | 12.63 | | | | 12.89 | | |
Total Return(c) (%) | | | 9.60 | | | | 8.85 | | | | 9.92 | | | | 13.64 | | | | 12.75 | | | | 13.84 | | | | 14.52 | | | | 13.63 | | | | 14.78 | | | | -20.56 | | | | -21.17 | | | | -20.36 | | |
Ratios and supplemental data | |
Net assets, end of period
(millions) ($) | | | 967 | | | | 408 | | | | 538 | | | | 680 | | | | 320 | | | | 328 | | | | 547 | | | | 263 | | | | 199 | | | | 271 | | | | 167 | | | | 104 | | |
Ratio of operating expenses
to average net assets
including earnings credits (%) | | | 1.18 | | | | 1.93 | | | | 0.93 | | | | 1.23 | | | | 1.98 | | | | 0.99 | | | | 1.26 | | | | 2.00 | | | | 1.01 | | | | 1.20 | | | | 1.96 | | | | 0.95 | | |
Ratio of operating expenses
to average net assets
excluding earnings credits (%) | | | 1.18 | | | | 1.93 | | | | 0.93 | | | | 1.23 | | | | 1.98 | | | | 0.99 | | | | 1.26 | | | | 2.00 | | | | 1.01 | | | | 1.21 | | | | 1.96 | | | | 0.96 | | |
Ratio of net investment
income to average net assets
including earnings credits (%) | | | 0.98 | | | | 0.24 | | | | 1.23 | | | | 2.15 | | | | 1.41 | | | | 2.46 | | | | 1.63 | | | | 0.93 | | | | 1.90 | | | | 2.28 | | | | 1.53 | | | | 2.53 | | |
Ratio of net investment
income to average net assets
excluding earnings credits (%) | | | 0.98 | | | | 0.24 | | | | 1.23 | | | | 2.15 | | | | 1.41 | | | | 2.46 | | | | 1.63 | | | | 0.93 | | | | 1.90 | | | | 2.28 | | | | 1.52 | | | | 2.53 | | |
Portfolio turnover rate (%) | | | 18.54 | | | | 18.54 | | | | 18.54 | | | | 12.23 | | | | 12.23 | | | | 12.23 | | | | 14.88 | | | | 14.88 | | | | 14.88 | | | | 21.75 | | | | 21.75 | | | | 21.75 | | |
FIRST EAGLE FUNDS | SEMI-ANNUAL REPORT | APRIL 30, 2013
153

| | | SIX MONTHS ENDED | | YEAR ENDED OCTOBER 31, | |
| | | APRIL 30, 2013 (unaudited) | | 2012 | |
| | | CLASS A | | CLASS C | | CLASS I | | CLASS A | | CLASS C | | CLASS I | |
Selected data for a share of beneficial interest outstanding throughout
each period is presented below:* | |
Net asset value,
beginning of period ($) | | | 29.86 | | | | 28.84 | | | | 30.26 | | | | 33.89 | | | | 32.78 | | | | 34.33 | | |
Income (loss) from investment operations: | |
Net investment income (loss) ($) | | | -0.02 | | | | -0.11 | | | | 0.01 | | | | -0.01 | | | | -0.22 | | | | 0.06 | | |
Net realized and unrealized
gains (losses) on investments | | | -10.03 | | | | -9.69 | | | | -10.16 | | | | -2.73 | | | | -2.66 | | | | -2.75 | | |
Total income (loss) from
investment operations | | | -10.05 | | | | -9.80 | | | | -10.15 | | | | -2.74 | | | | -2.88 | | | | -2.69 | | |
Less distributions: | |
Dividends from net
investment income ($) | | | -0.08 | | | | — | | | | -0.15 | | | | -0.39 | | | | -0.16 | | | | -0.48 | | |
Distributions from
capital gains | | | — | | | | — | | | | — | | | | -0.90 | | | | -0.90 | | | | -0.90 | | |
Total distributions | | | -0.08 | | | | — | | | | -0.15 | | | | -1.29 | | | | -1.06 | | | | -1.38 | | |
Net asset value,
end of period ($) | | | 19.73 | | | | 19.04 | | | | 19.96 | | | | 29.86 | | | | 28.84 | | | | 30.26 | | |
Total Return(c) (%) | | | -33.73 | (a) | | | -33.98 | (a) | | | -33.67 | (a) | | | -8.14 | | | | -8.86 | | | | -7.89 | | |
Ratios and supplemental data | |
Net assets, end of period
(millions) ($) | | | 985 | | | | 377 | | | | 629 | | | | 1,535 | | | | 608 | | | | 932 | | |
Ratio of operating expenses
to average net assets
including earnings credits (%) | | | 1.22 | (b) | | | 1.97 | (b) | | | 0.97 | (b) | | | 1.21 | | | | 1.96 | | | | 0.96 | | |
Ratio of operating expenses
to average net assets
excluding earnings credits (%) | | | 1.22 | (b) | | | 1.97 | (b) | | | 0.97 | (b) | | | 1.21 | | | | 1.96 | | | | 0.96 | | |
Ratio of net investment
income (loss) to average net assets
including earnings credits (%) | | | -0.18 | (b) | | | -0.93 | (b) | | | 0.07 | (b) | | | -0.05 | | | | -0.80 | | | | 0.21 | | |
Ratio of net investment
income (loss) to average net assets
excluding earnings credits (%) | | | -0.18 | (b) | | | -0.93 | (b) | | | 0.07 | (b) | | | -0.05 | | | | -0.80 | | | | 0.21 | | |
Portfolio turnover rate (%) | | | 5.09 | (a) | | | 5.09 | (a) | | | 5.09 | (a) | | | 9.19 | | | | 9.19 | | | | 9.19 | | |
* Per share amounts have been calculated using the average shares method.
(a) Not Annualized
(b) Annualized
(c) Does not take into account the sales charge of 5.00% for Class A shares and the CDSC (Contingent Deferred Sales Charge) of 1.00% for Class C shares.
See Notes to Financial Statements.
FIRST EAGLE FUNDS | SEMI-ANNUAL REPORT | APRIL 30, 2013
154
Gold Fund
| | | YEAR ENDED OCTOBER 31, | |
| | | 2011 | | 2010 | | 2009 | | 2008 | |
| | | CLASS A | | CLASS C | | CLASS I | | CLASS A | | CLASS C | | CLASS I | | CLASS A | | CLASS C | | CLASS I | | CLASS A | | CLASS C | | CLASS I | |
Selected data for a share of beneficial interest outstanding throughout
each period is presented below:* | |
Net asset value,
beginning of period ($) | | | 33.42 | | | | 32.44 | | | | 33.81 | | | | 25.15 | | | | 24.52 | | | | 25.43 | | | | 14.85 | | | | 14.60 | | | | 14.98 | | | | 27.28 | | | | 26.86 | | | | 27.48 | | |
Income (loss) from investment operations: | |
Net investment income (loss) ($) | | | -0.19 | | | | -0.42 | | | | -0.10 | | | | -0.17 | | | | -0.38 | | | | -0.11 | | | | -0.14 | | | | -0.30 | | | | -0.09 | | | | -0.09 | | | | -0.27 | | | | -0.05 | | |
Net realized and unrealized
gains (losses) on investments | | | 2.60 | | | | 2.53 | | | | 2.63 | | | | 8.82 | | | | 8.58 | | | | 8.92 | | | | 11.50 | | | | 11.28 | | | | 11.60 | | | | -10.61 | | | | -10.43 | | | | -10.66 | | |
Total income (loss) from
investment operations | | | 2.41 | | | | 2.11 | | | | 2.53 | | | | 8.65 | | | | 8.20 | | | | 8.81 | | | | 11.36 | | | | 10.98 | | | | 11.51 | | | | -10.70 | | | | -10.70 | | | | -10.71 | | |
Less distributions: | |
Dividends from net
investment income ($) | | | -0.73 | | | | -0.56 | | | | -0.80 | | | | -0.38 | | | | -0.28 | | | | -0.43 | | | | — | | | | — | | | | — | | | | -0.78 | | | | -0.61 | | | | -0.84 | | |
Distributions from
capital gains | | | -1.21 | | | | -1.21 | | | | -1.21 | | | | — | | | | — | | | | — | | | | -1.06 | | | | -1.06 | | | | -1.06 | | | | -0.95 | | | | -0.95 | | | | -0.95 | | |
Total distributions | | | -1.94 | | | | -1.77 | | | | -2.01 | | | | -0.38 | | | | -0.28 | | | | -0.43 | | | | -1.06 | | | | -1.06 | | | | -1.06 | | | | -1.73 | | | | -1.56 | | | | -1.79 | | |
Net asset value,
end of period ($) | | | 33.89 | | | | 32.78 | | | | 34.33 | | | | 33.42 | | | | 32.44 | | | | 33.81 | | | | 25.15 | | | | 24.52 | | | | 25.43 | | | | 14.85 | | | | 14.60 | | | | 14.98 | | |
Total Return(c) (%) | | | 7.38 | | | | 6.61 | | | | 7.66 | | | | 34.73 | | | | 33.66 | | | | 35.01 | | | | 78.93 | | | | 77.62 | | | | 79.27 | | | | -41.56 | | | | -41.99 | | | | -41.36 | | |
Ratios and supplemental data | |
Net assets, end of period
(millions) ($) | | | 1,834 | | | | 683 | | | | 1,003 | | | | 1,900 | | | | 616 | | | | 695 | | | | 1,325 | | | | 362 | | | | 165 | | | | 480 | | | | 109 | | | | 71 | | |
Ratio of operating expenses
to average net assets
including earnings credits (%) | | | 1.20 | | | | 1.95 | | | | 0.95 | | | | 1.22 | | | | 1.97 | | | | 0.97 | | | | 1.26 | | | | 2.01 | | | | 1.01 | | | | 1.21 | | | | 1.96 | | | | 0.95 | | |
Ratio of operating expenses
to average net assets
excluding earnings credits (%) | | | 1.20 | | | | 1.95 | | | | 0.95 | | | | 1.22 | | | | 1.97 | | | | 0.97 | | | | 1.26 | | | | 2.01 | | | | 1.01 | | | | 1.21 | | | | 1.96 | | | | 0.96 | | |
Ratio of net investment
income (loss) to average net assets
including earnings credits (%) | | | -0.56 | | | | -1.30 | | | | -0.30 | | | | -0.60 | | | | -1.35 | | | | -0.36 | | | | -0.65 | | | | -1.40 | | | | -0.40 | | | | -0.38 | | | | -1.13 | | | | -0.20 | | |
Ratio of net investment
income (loss) to average net assets
excluding earnings credits (%) | | | -0.56 | | | | -1.30 | | | | -0.30 | | | | -0.60 | | | | -1.35 | | | | -0.36 | | | | -0.65 | | | | -1.40 | | | | -0.40 | | | | -0.38 | | | | -1.14 | | | | -0.20 | | |
Portfolio turnover rate (%) | | | 13.26 | | | | 13.26 | | | | 13.26 | | | | 5.50 | | | | 5.50 | | | | 5.50 | | | | 3.00 | | | | 3.00 | | | | 3.00 | | | | 8.74 | | | | 8.74 | | | | 8.74 | | |
FIRST EAGLE FUNDS | SEMI-ANNUAL REPORT | APRIL 30, 2013
155

| | | SIX MONTHS ENDED
APRIL 30, 2013 (unaudited) | | PERIOD MAY 1, 2012^ TO
OCTOBER 31, 2012 | |
| | | CLASS A | | CLASS C | | CLASS I | | CLASS A | | CLASS C | | CLASS I | |
Selected data for a share of beneficial interest outstanding throughout
each period is presented below:* | |
Net asset value,
beginning of period ($) | | | 10.32 | | | | 10.30 | | | | 10.33 | | | | 10.00 | | | | 10.00 | | | | 10.00 | | |
Income from investment operations: | |
Net investment income ($) | | | 0.23 | | | | 0.19 | | | | 0.23 | | | | 0.15 | | | | 0.11 | | | | 0.18 | | |
Net realized and unrealized
gains (losses) on investments | | | 0.53 | | | | 0.52 | | | | 0.54 | | | | 0.28 | | | | 0.29 | | | | 0.27 | | |
Total income (loss) from
investment operations | | | 0.76 | | | | 0.71 | | | | 0.77 | | | | 0.43 | | | | 0.40 | | | | 0.45 | | |
Less distributions: | |
Dividends from net investment
income ($) | | | -0.19 | | | | -0.15 | | | | -0.23 | | | | -0.11 | | | | -0.10 | | | | -0.12 | | |
Total distributions | | | -0.19 | | | | -0.15 | | | | -0.23 | | | | -0.11 | | | | -0.10 | | | | -0.12 | | |
Net asset value, end of period ($) | | | 10.89 | | | | 10.86 | | | | 10.87 | | | | 10.32 | | | | 10.30 | | | | 10.33 | | |
Total Return(c) (%) | | | 7.50 | (a) | | | 7.05 | (a) | | | 7.56 | (a) | | | 4.37 | (a) | | | 4.00 | (a) | | | 4.53 | (a) | |
Ratios and supplemental data | |
Net assets, end of period
(millions) ($) | | | 147 | | | | 97 | | | | 85 | | | | 43 | | | | 26 | | | | 38 | | |
Ratio of operating expenses to
average net assets including fee
waivers and reimbursements (%) | | | 1.29 | (b) | | | 2.04 | (b) | | | 1.05 | (b) | | | 1.30 | (b)(d) | | | 2.05 | (b)(d) | | | 1.05 | (b)(d) | |
Ratio of operating expenses to
average net assets excluding fee
waivers and reimbursements (%) | | | 1.41 | (b) | | | 2.15 | (b) | | | 1.17 | (b) | | | 2.13 | (b)(d) | | | 2.88 | (b)(d) | | | 2.20 | (b)(d) | |
Ratio of net investment income to
average net assets including fee
waivers and reimbursements (%) | | | 4.33 | (b) | | | 3.60 | (b) | | | 4.47 | (b) | | | 2.89 | (b)(d) | | | 2.16 | (b)(d) | | | 3.56 | (b)(d) | |
Ratio of net investment income to
average net assets excluding fee
waivers and reimbursements (%) | | | 4.21 | (b) | | | 3.48 | (b) | | | 4.35 | (b) | | | 2.06 | (b)(d) | | | 1.33 | (b)(d) | | | 2.40 | (b)(d) | |
Portfolio turnover rate (%) | | | 3.48 | (a) | | | 3.48 | (a) | | | 3.48 | (a) | | | 5.17 | (a) | | | 5.17 | (a) | | | 5.17 | (a) | |
�� ^ Commencement of investment operations.
* Per share amounts have been calculated using the average shares method.
(a) Not Annualized
(b) Annualized
(c) Does not take into account the sales charge of 5.00% for Class A shares and the CDSC (Contingent Deferred Sales Charge) of 1.00% for Class C shares.
(d) Certain non-recurring expenses incurred by the Fund were not annualized for the period ended October 31, 2012.
See Notes to Financial Statements.
FIRST EAGLE FUNDS | SEMI-ANNUAL REPORT | APRIL 30, 2013
156
This page was intentionally left blank.

| | | SIX MONTHS ENDED | | PERIOD APRIL 1,2012 TO | |
| | | APRIL 30, 2013 (unaudited) | | OCTOBER 31, 2012 | |
| | | CLASS A | | CLASS C | | CLASS I | | CLASS A | | CLASS C | | CLASS I | |
Selected data for a share of beneficial interest outstanding throughout
each period is presented below:* | |
Net asset value,
beginning of period ($) | | | 9.98 | | | | 9.97 | | | | 9.98 | | | | 9.75 | | | | 9.74 | | | | 9.75 | | |
Income (loss) from investment operations: | |
Net investment income ($) | | | 0.29 | | | | 0.26 | | | | 0.32 | | | | 0.33 | | | | 0.29 | | | | 0.36 | | |
Net realized and unrealized
gains (losses) on investments | | | 0.29 | | | | 0.28 | | | | 0.28 | | | | 0.24 | | | | 0.23 | | | | 0.23 | | |
Total income (loss) from
investment operations | | | 0.58 | | | | 0.54 | | | | 0.60 | | | | 0.57 | | | | 0.52 | | | | 0.59 | | |
Less distributions: | |
Dividends from net
investment income ($) | | | -0.30 | | | | -0.26 | | | | -0.32 | | | | -0.34 | | | | -0.29 | | | | -0.36 | | |
Distributions from capital gains | | | -0.01 | | | | -0.01 | | | | -0.01 | | | | — | | | | — | | | | — | | |
Total distributions | | | -0.31 | | | | -0.27 | | | | -0.33 | | | | -0.34 | | | | -0.29 | | | | -0.36 | | |
Net asset value, end of period ($) | | | 10.25 | | | | 10.24 | | | | 10.25 | | | | 9.98 | | | | 9.97 | | | | 9.98 | | |
Total Return(c) (%) | | | 5.86 | (a) | | | 5.47 | (a) | | | 6.06 | (a) | | | 5.94 | (a) | | | 5.47 | (a) | | | 6.20 | (a) | |
Ratios and supplemental data | |
Net assets, end of period
(millions) ($) | | | 336 | | | | 156 | | | | 397 | | | | 220 | | | | 113 | | | | 309 | | |
Ratio of operating expenses to
average net assets including fee
waivers and reimbursements (%) | | | 1.19 | (b) | | | 1.94 | (b) | | | 0.80 | (b) | | | 1.25 | (b)(d) | | | 2.00 | (b)(d) | | | 0.80 | (b)(d) | |
Ratio of operating expenses to
average net assets excluding fee
waivers and reimbursements (%) | | | 1.19 | (b) | | | 1.94 | (b) | | | 0.94 | (b) | | | 1.27 | (b)(d) | | | 2.02 | (b)(d) | | | 1.03 | (b)(d) | |
Ratio of net investment income to
average net assets including fee
waivers and reimbursements (%) | | | 5.87 | (b) | | | 5.13 | (b) | | | 6.28 | (b) | | | 5.75 | (b)(d) | | | 4.98 | (b)(d) | | | 6.23 | (b)(d) | |
Ratio of net investment income to
average net assets excluding fee
waivers and reimbursements (%) | | | 5.87 | (b) | | | 5.13 | (b) | | | 6.14 | (b) | | | 5.73 | (b)(d) | | | 4.96 | (b)(d) | | | 6.00 | (b)(d) | |
Portfolio turnover rate (%) | | | 21.82 | (a) | | | 21.82 | (a) | | | 21.82 | (a) | | | 25.02 | (a) | | | 25.02 | (a) | | | 25.02 | (a) | |
^ The Fund commenced investment operations in its present form on December 30, 2011.
^^ Class A and Class C commenced operations on January 3, 2012.
^^^ The predecessor Fund, Old Mutual High Yield Fund, commenced operations on November 19, 2007.
* Per share amounts have been calculated using the average shares method.
(a) Not Annualized
(b) Annualized
(c) Does not take into account the sales charge of 4.50% for Class A shares and the CDSC (Contingent Deferred Sales Charge) of 1.00% for Class C shares.
(d) Certain non-recurring expenses incurred by the Fund were not annualized for the period ended October 31, 2012.
See Notes to Financial Statements.
FIRST EAGLE FUNDS | SEMI-ANNUAL REPORT | APRIL 30, 2013
158
| | | YEAR ENDED MARCH 31, | |
| | | 2012^ | | 2011 | | 2010 | | 2009 | | 2008^^^ | |
| | | CLASS A^^ | | CLASS C^^ | | CLASS I | | CLASS I | | CLASS I | | CLASS I | | CLASS I | |
Selected data for a share of beneficial interest outstanding throughout
each period is presented below:* | |
Net asset value,
beginning of period ($) | | | 9.40 | | | | 9.40 | | | | 10.29 | | | | 10.67 | | | | 7.72 | | | | 9.29 | | | | 10.00 | | |
Income (loss) from investment operations: | |
Net investment income ($) | | | 0.13 | | | | 0.11 | | | | 0.68 | | | | 0.98 | | | | 1.31 | | | | 0.85 | | | | 0.36 | | |
Net realized and unrealized
gains (losses) on investments | | | 0.35 | | | | 0.34 | | | | -0.11 | | | | 0.47 | | | | 3.07 | | | | -1.55 | | | | -0.69 | | |
Total income (loss) from
investment operations | | | 0.48 | | | | 0.45 | | | | 0.57 | | | | 1.45 | | | | 4.38 | | | | -0.70 | | | | -0.33 | | |
Less distributions: | |
Dividends from net
investment income ($) | | | -0.13 | | | | -0.11 | | | | -0.83 | | | | -0.98 | | | | -1.28 | | | | -0.87 | | | | -0.38 | | |
Distributions from capital gains | | | — | | | | — | | | | -0.28 | | | | -0.85 | | | | -0.15 | | | | — | | | | — | | |
Total distributions | | | -0.13 | | | | -0.11 | | | | -1.11 | | | | -1.83 | | | | -1.43 | | | | -0.87 | | | | -0.38 | | |
Net asset value, end of period ($) | | | 9.75 | | | | 9.74 | | | | 9.75 | | | | 10.29 | | | | 10.67 | | | | 7.72 | | | | 9.29 | | |
Total Return(c) (%) | | | 5.11 | | | | 4.78 | | | | 6.11 | | | | 14.81 | | | | 59.30 | | | | -7.78 | | | | -3.39 | | |
Ratios and supplemental data | |
Net assets, end of period
(millions) ($) | | | 60 | | | | 28 | | | | 115 | | | | 11 | | | | 10 | | | | 9 | | | | 9 | | |
Ratio of operating expenses to
average net assets including fee
waivers and reimbursements (%) | | | 0.95 | (b) | | | 1.66 | (b) | | | 0.80 | | | | 0.80 | | | | 0.80 | | | | 0.80 | | | | 0.80 | | |
Ratio of operating expenses to
average net assets excluding fee
waivers and reimbursements (%) | | | 1.12 | (b) | | | 1.83 | (b) | | | 1.05 | | | | 1.21 | | | | 1.04 | | | | 1.05 | | | | 1.86 | (b) | |
Ratio of net investment income to
average net assets including fee
waivers and reimbursements (%) | | | 5.48 | (b) | | | 4.74 | (b) | | | 6.98 | | | | 9.33 | | | | 13.34 | | | | 10.04 | | | | 10.90 | (b) | |
Ratio of net investment income to
average net assets excluding fee
waivers and reimbursements (%) | | | 5.31 | (b) | | | 4.57 | (b) | | | 6.73 | | | | 8.92 | | | | 13.10 | | | | 9.79 | | | | 9.84 | | |
Portfolio turnover rate (%) | | | 45.21 | | | | 45.21 | | | | 45.21 | | | | 145.96 | | | | 292.11 | | | | 74.19 | | | | 10.78 | | |
FIRST EAGLE FUNDS | SEMI-ANNUAL REPORT | APRIL 30, 2013
159

| | | SIX MONTHS ENDED | | YEAR ENDED OCTOBER 31, | |
| | | APRIL 30, 2013 (unaudited) | | 2012 | |
| | | CLASS A | | CLASS C | | CLASS I^ | | CLASS Y | | CLASS A | | CLASS C | | CLASS Y | |
Selected data for a share of beneficial interest outstanding throughout
each period is presented below:* | |
Net asset value,
beginning of period ($) | | | 26.86 | | | | 23.30 | | | | 31.01 | | | | 27.37 | | | | 24.91 | | | | 22.01 | | | | 25.35 | | |
Income (loss) from investment operations: | |
Net investment income (loss) ($) | | | 0.04 | | | | -0.06 | | | | -0.04 | | | | 0.06 | | | | 0.04 | | | | -0.13 | | | | 0.04 | | |
Net realized and unrealized
gains (losses) on investments | | | 4.07 | | | | 3.53 | | | | 0.59 | | | | 4.13 | | | | 3.73 | | | | 3.24 | | | | 3.80 | | |
Total income (loss) from
investment operations | | | 4.11 | | | | 3.47 | | | | 0.55 | | | | 4.19 | | | | 3.77 | | | | 3.11 | | | | 3.84 | | |
Less distributions: | |
Dividends from net
investment income ($) | | | -0.01 | | | | — | | | | — | | | | -0.01 | | | | — | | | | — | | | | — | | |
Distributions from
capital gains | | | — | | | | — | | | | — | | | | — | | | | -1.82 | | | | -1.82 | | | | -1.82 | | |
Total distributions | | | -0.01 | | | | — | | | | — | | | | -0.01 | | | | -1.82 | | | | -1.82 | | | | -1.82 | | |
Net asset value,
end of period ($) | | | 30.96 | | | | 26.77 | | | | 31.56 | | | | 31.55 | | | | 26.86 | | | | 23.30 | | | | 27.37 | | |
Total Return(c) (%) | | | 15.30 | (a) | | | 14.84 | (a) | | | 1.77 | (a) | | | 15.31 | (a) | | | 16.46 | | | | 15.62 | | | | 16.50 | | |
Ratios and supplemental data | |
Net assets, end of period
(millions) ($) | | | 862 | | | | 336 | | | | 252 | | | | 589 | | | | 699 | | | | 246 | | | | 667 | | |
Ratio of operating expenses
to average net assets
including earnings credits (%) | | | 1.39 | (b) | | | 2.14 | (b) | | | 1.16 | (b) | | | 1.39 | (b) | | | 1.44 | | | | 2.19 | | | | 1.44 | | |
Ratio of operating expenses
to average net assets
excluding earnings credits (%) | | | 1.39 | (b) | | | 2.14 | (b) | | | 1.16 | (b) | | | 1.39 | (b) | | | 1.44 | | | | 2.19 | | | | 1.44 | | |
Ratio of net investment income
(loss) to average net assets
including earnings credits (%) | | | 0.30 | (b) | | | -0.47 | (b) | | | -0.86 | (b) | | | 0.39 | (b) | | | 0.14 | | | | -0.61 | | | | 0.14 | | |
Ratio of net investment income
(loss) to average net assets
excluding earnings credits (%) | | | 0.30 | (b) | | | -0.47 | (b) | | | -0.86 | (b) | | | 0.39 | (b) | | | 0.14 | | | | -0.61 | | | | 0.14 | | |
Portfolio turnover rate (%) | | | 10.86 | (a) | | | 10.86 | (a) | | | 10.86 | (a) | | | 10.86 | (a) | | | 31.48 | | | | 31.48 | | | | 31.48 | | |
^ Class I commenced investment operations on March 8, 2013.
* Per share amounts have been calculated using the average shares method.
(a) Not Annualized
(b) Annualized
(c) Does not take into account the sales charge of 5.00% for Class A shares and the CDSC (Contingent Deferred Sales Charge) of 1.00% for Class C shares.
See Notes to Financial Statements.
FIRST EAGLE FUNDS | SEMI-ANNUAL REPORT | APRIL 30, 2013
160
Fund of America
| | | YEAR ENDED OCTOBER 31, | |
| | | 2011 | | 2010 | | 2009 | | 2008 | |
| | | CLASS A | | CLASS C | | CLASS Y | | CLASS A | | CLASS C | | CLASS Y | | CLASS A | | CLASS C | | CLASS Y | | CLASS A | | CLASS C | | CLASS Y | |
Selected data for a share of beneficial interest outstanding throughout
each period is presented below:* | |
Net asset value,
beginning of period ($) | | | 24.06 | | | | 21.32 | | | | 24.47 | | | | 19.32 | | | | 17.25 | | | | 19.66 | | | | 18.92 | | | | 17.14 | | | | 19.23 | | | | 29.79 | | | | 27.39 | | | | 30.22 | | |
Income (loss) from investment operations: | |
Net investment income (loss) ($) | | | -0.09 | | | | -0.25 | | | | -0.08 | | | | 0.13 | | | | -0.03 | | | | 0.14 | | | | -0.06 | | | | -0.18 | | | | -0.07 | | | | -0.06 | | | | -0.20 | | | | -0.01 | | |
Net realized and unrealized
gains (losses) on investments | | | 1.11 | | | | 0.98 | | | | 1.12 | | | | 4.61 | | | | 4.10 | | | | 4.67 | | | | 1.61 | | | | 1.44 | | | | 1.65 | | | | -7.85 | | | | -7.16 | | | | -8.03 | | |
Total income (loss) from
investment operations | | | 1.02 | | | | 0.73 | | | | 1.04 | | | | 4.74 | | | | 4.07 | | | | 4.81 | | | | 1.55 | | | | 1.26 | | | | 1.58 | | | | -7.91 | | | | -7.36 | | | | -8.04 | | |
Less distributions: | |
Dividends from net
investment income ($) | | | -0.17 | | | | -0.04 | | | | -0.16 | | | | — | | | | — | | | | — | | | | — | | | | — | | | | — | | | | -0.07 | | | | — | | | | -0.06 | | |
Distributions from
capital gains | | | — | | | | — | | | | — | | | | — | | | | — | | | | — | | | | -1.15 | | | | -1.15 | | | | -1.15 | | | | -2.89 | | | | -2.89 | | | | -2.89 | | |
Total distributions | | | -0.17 | | | | -0.04 | | | | -0.16 | | | | — | | | | — | | | | — | | | | -1.15 | | | | -1.15 | | | | -1.15 | | | | -2.96 | | | | -2.89 | | | | -2.95 | | |
Net asset value,
end of period ($) | | | 24.91 | | | | 22.01 | | | | 25.35 | | | | 24.06 | | | | 21.32 | | | | 24.47 | | | | 19.32 | | | | 17.25 | | | | 19.66 | | | | 18.92 | | | | 17.14 | | | | 19.23 | | |
Total Return(c) (%) | | | 4.22 | | | | 3.43 | | | | 4.20 | | | | 24.53 | | | | 23.59 | | | | 24.47 | | | | 9.13 | | | | 8.34 | | | | 9.14 | | | | -29.20 | | | | -29.74 | | | | -29.23 | | |
Ratios and supplemental data | |
Net assets, end of period
(millions) ($) | | | 549 | | | | 194 | | | | 633 | | | | 379 | | | | 122 | | | | 599 | | | | 276 | | | | 90 | | | | 503 | | | | 127 | | | | 61 | | | | 501 | | |
Ratio of operating expenses
to average net assets
including earnings credits (%) | | | 1.43 | | | | 2.18 | | | | 1.43 | | | | 1.47 | | | | 2.22 | | | | 1.47 | | | | 1.50 | | | | 2.25 | | | | 1.50 | | | | 1.41 | | | | 2.16 | | | | 1.41 | | |
Ratio of operating expenses
to average net assets
excluding earnings credits (%) | | | 1.43 | | | | 2.18 | | | | 1.43 | | | | 1.47 | | | | 2.22 | | | | 1.47 | | | | 1.50 | | | | 2.25 | | | | 1.50 | | | | 1.42 | | | | 2.17 | | | | 1.42 | | |
Ratio of net investment income
(loss) to average net assets
including earnings credits (%) | | | -0.33 | | | | -1.08 | | | | -0.31 | | | | 0.61 | | | | -0.14 | | | | 0.62 | | | | -0.34 | | | | -1.10 | | | | -0.37 | | | | -0.23 | | | | -0.87 | | | | -0.06 | | |
Ratio of net investment income
(loss) to average net assets
excluding earnings credits (%) | | | -0.33 | | | | -1.08 | | | | -0.31 | | | | 0.61 | | | | -0.14 | | | | 0.62 | | | | -0.34 | | | | -1.10 | | | | -0.37 | | | | -0.24 | | | | -0.88 | | | | -0.07 | | |
Portfolio turnover rate (%) | | | 67.61 | | | | 67.61 | | | | 67.61 | | | | 40.00 | | | | 40.00 | | | | 40.00 | | | | 40.41 | | | | 40.41 | | | | 40.41 | | | | 63.97 | | | | 63.97 | | | | 63.97 | | |
FIRST EAGLE FUNDS | SEMI-ANNUAL REPORT | APRIL 30, 2013
161
Notes to Financial Statements (unaudited)
Note 1 — Significant Accounting Policies
First Eagle Funds (the "Trust"), is an open-end management investment company registered under the Investment Company Act of 1940, as amended ("1940 Act"). The Trust consists of seven separate portfolios, First Eagle Global Fund, First Eagle Overseas Fund, First Eagle U.S. Value Fund, First Eagle Gold Fund, First Eagle Global Income Builder Fund, First Eagle High Yield Fund and First Eagle Fund of America (each individually a "Fund" or collectively the "Funds"). All the Funds are diversified mutual funds except for First Eagle Gold Fund and First Eagle Fund of America, which are non-diversified. The Trust is a Delaware statutory trust. The First Eagle Global Fund seeks long-term growth of capital by investing in a range of asset classes from markets in the United States and throughout the world. The First Eagle Overseas Fund seeks long-term growth of capital by investing primarily in equities issued by non-U.S. corporations. The First Eagle U.S. Value Fund seeks long-term growth of capital by investing, under normal market conditions, at least 80% of its assets in domestic equity and debt securities. The First Eagle Gold Fund seeks to provide investors the opportunity to participate in the investment characteristics of gold (and to a limited extent other precious metals) for a portion of their overall investment portfolio. The First Eagle Global Income Builder Fund (which commenced operations on May 1, 2012) seeks current income generation and long-term growth of capital. The First Eagle High Yield Fund seeks to provide investors with a high level of current income. The First Eagle Fund of America seeks capital appreciation by investing primarily in domestic stocks and, to a lesser extent, in debt and international equity securities.
First Eagle Investment Management, LLC (the "Adviser"), a subsidiary of Arnhold and S. Bleichroeder Holdings, Inc. ("ASB Holdings"), manages the Funds.
The following is a summary of significant accounting policies adhered to by the Funds and are in conformity with U.S. generally accepted accounting principles ("GAAP").
a) Investment in Subsidiary — The First Eagle Gold Fund (the "Gold Fund") may invest in certain precious metals through its investment in the First Eagle Gold Cayman Fund, Ltd., a wholly owned subsidiary (the "Subsidiary"). The Gold Fund may invest up to 25% of its total assets in shares of the Subsidiary. The Subsidiary has the ability to invest in commodities and securities consistent with the investment objective of the Gold Fund. Substantially all of the Subsidiary's assets represent physical gold (bullion).
FIRST EAGLE FUNDS | SEMI-ANNUAL REPORT | APRIL 30, 2013
162
Trading in bullion directly by the Gold Fund presents the risk of negative tax consequences (e.g., a change in the Fund's tax status subjecting the Fund to tax at the Fund level on all its income if the Fund's "non-qualifying income" exceeds 10% of the Fund's gross income in any taxable year). Trading in bullion by the Subsidiary generally does not present the same tax risks.
The Subsidiary, established on May 28, 2010, is an exempted company under the laws of the Cayman Islands. The consolidated financial statements include the accounts of the Gold Fund and the Subsidiary. All intercompany transactions and balances have been eliminated. As of April 30, 2013, the Subsidiary has $56,487,379 in net assets, representing 2.84% of the Gold Fund's net assets.
b) Investment valuation — Each Fund computes its net asset value once daily as of the close of trading on each day the New York Stock Exchange ("NYSE") is open for trading. The net asset value per share is computed by dividing the total current value of the assets of a Fund, less its liabilities, by the total number of shares outstanding at the time of such computation.
A portfolio security (including an option), other than a bond, which is traded on a U.S. national securities exchange or a securities exchange abroad is normally valued at the price of the last sale on the exchange as of the close of business on the date on which assets are valued. If there are no sales on such date, such portfolio investment will be valued at the mean between the closing bid and asked prices (and if there is only a bid or only an asked price on such date, valuation will be at such bid or asked price for long or short positions, respectively). Securities, other than bonds, traded in the over-the-counter market are valued at the mean between the last bid and asked prices prior to the time of valuation (and if there is only a bid or only an asked price on such date, valuation will be at such bid or asked price for long or short positions, respectively), except if such unlisted security traded on the NASDAQ, in which case it is valued at its last sale price (or, if available, the NASDAQ Official Closing Price).
All bonds, whether listed on an exchange or traded in the over-the-counter market (and except for short-term investments as described in the next sentence), for which market quotations are readily available are valued at the mean between the last bid and asked prices received from dealers in the over-the-counter market in the United States or abroad, except that when no asked price is available, bonds are valued at the last bid price alone. Broker-Dealers
FIRST EAGLE FUNDS | SEMI-ANNUAL REPORT | APRIL 30, 2013
163
Notes to Financial Statements (unaudited)
or pricing services use multiple valuation techniques to determine value. In instances where sufficient market activity exists, dealers or pricing services may utilize a market-based approach through which quotes from market makers are used to determine fair value. In instances where sufficient market activity may not exist or is limited, the dealers or pricing services also utilize proprietary valuation models which may consider market transactions in comparable securities and the various relationships between securities in determining value and/or market characteristics such as benchmark yield curves, option-adjusted spreads, credit spreads, estimated default rates, coupon-rates, anticipated timing of principal repayments, underlying collateral, and other unique security features in order to estimate the relevant cash flows, which are then discounted to calculate the fair values. Short-term investments maturing in sixty days or less are valued at cost plus interest earned (or discount amortized, as the case may be), which is deemed to approximate value.
Commodities (such as physical metals) are valued at the spot price at the time trading on the NYSE closes (normally 4:00 p.m. E.S.T.).
Forward contracts are valued at the current cost of covering or offsetting such contracts at the time NYSE closes (normally 4:00 p.m. E.S.T.).
Effective March 1, 2013 the 4:00 p.m. E.S.T. exchange rates are used to convert foreign security prices into U.S. dollars. Any security that is listed or traded on more than one exchange (or traded in multiple markets) is valued at the relevant quotation on the exchange or market deemed to be the primary trading venue for that security. In the absence of such a quotation, a quotation from the exchange or market deemed by the Adviser to be the secondary trading venue for the particular security shall be used. The Funds use pricing services to identify the market prices of publicly traded securities in their portfolios. When market prices are determined to be "stale" as a result of limited market activity for a particular holding, or in other circumstances when market prices are unavailable, such as for private placements, or determined to be unreliable for a particular holding, such holdings may be "fair valued" in accordance with procedures approved by the Board of Trustees ("Board"). Additionally, with respect to foreign holdings, specifically in circumstances leading the Adviser to believe that significant events occurring after the close of a foreign market have materially affected the value of a Fund's holdings in that market, such holdings may be fair valued to reflect the
FIRST EAGLE FUNDS | SEMI-ANNUAL REPORT | APRIL 30, 2013
164
events in accordance with procedures approved by the Board. The determination of whether a particular foreign investment should be fair valued will be based on review of a number of factors, including developments in foreign markets, the performance of U.S. securities markets and security-specific events. The values assigned to a Fund's holdings therefore may differ on occasion from reported market values.
Certain Funds with non-U.S. holdings have adopted procedures under which movements in the prices for U.S. securities (beyond specified thresholds) occurring after the close of a foreign market may require fair valuation of securities traded in that foreign market. The values assigned to a Fund's foreign holdings therefore may differ on occasion from reported market values. The Trust and the Adviser believe relying on the procedures as just described will result in prices that are more reflective of the actual market value of portfolio securities held by the Funds as of 4:00 p.m. E.S.T.
The Funds adopted provisions surrounding fair value measurements and disclosures that define fair value, establishes a framework for measuring fair value in GAAP and expands disclosures about fair value measurements. This applies to fair value measurements that are already required or permitted by other accounting standards and is intended to increase consistency of those measurements and applies broadly to securities and other types of assets and liabilities.
The Funds disclose the fair value of their investments in a hierarchy that prioritizes the inputs or assumptions to valuation techniques used to measure fair value. These inputs are used in determining the value of the Funds' investments and are summarized in the following fair value hierarchy:
Level 1 — Quoted prices in active markets for identical securities.
Level 2 — Other significant observable inputs (including quoted prices for similar securities, interest rates, prepayment speeds, credit risk, etc.).
Level 3 — Other significant unobservable inputs (including the Fund's own assumption in determining the fair value of investments).
The significant unobservable inputs that may be used in determining valuations for investments identified within Level 3 are market comparables and the enterprise value of a company. Indications of value and quotations may be observable at any given time, but are currently treated by the Funds as unobservable. Significant changes in any of the unobservable inputs may
FIRST EAGLE FUNDS | SEMI-ANNUAL REPORT | APRIL 30, 2013
165
Notes to Financial Statements (unaudited)
significantly impact the fair value measurement. The impact is based on the relationship between each unobservable input and the fair value measurement.
Significant increases (decreases) in enterprise multiples may increase (decrease) the fair value measurement. Significant increases (decreases) in the discount for marketability, probability of insolvency and probability of default may decrease (increase) the fair value measurement.
Fair valuation of securities, other financial investments or other assets (collectively, "securities") held by the Funds shall be determined in good faith by or under the direction of the Board, generally acting through its designated Valuation Committee or Valuation Panel (collectively, the "Committees"). The Committees' responsibilities include making determinations regarding Level 3 fair value measurements and providing the results to the Board, in accordance with the Funds' valuation policies.
It is the policy of the Funds to recognize significant transfers between Levels 1, 2 and 3 and to disclose those transfers as of the date of the underlying event which caused the movement.
FIRST EAGLE FUNDS | SEMI-ANNUAL REPORT | APRIL 30, 2013
166
The following is a summary of the Funds' inputs used to value the Funds' investments as of April 30, 2013:
First Eagle Global Fund | |
DESCRIPTION | | LEVEL 1 | | LEVEL 2(a) | | LEVEL 3(b) | | TOTAL | |
Assets: † | |
U.S. Common Stocks | | $ | 13,895,044,072 | | | $ | 2,131,614 | | | $ | — | | | $ | 13,897,175,686 | | |
International
Common Stocks | | | 17,091,139,090 | | | | 24,286,122 | | | | 11,281,398 | | | | 17,126,706,610 | | |
International
Preferred Stock | | | 117,491,735 | | | | — | | | | — | | | | 117,491,735 | | |
Warrant | | | 80,425,551 | | | | — | | | | — | | | | 80,425,551 | | |
Commodity* | | | 1,619,895,681 | | | | — | | | | — | | | | 1,619,895,681 | | |
U.S. Corporate Bonds | | | — | | | | 28,512,503 | | | | — | | | | 28,512,503 | | |
International
Corporate Notes
and Bonds | | | — | | | | 61,368,916 | | | | 31,575,582 | | | | 92,944,498 | | |
International
Government Bond | | | — | | | | 25,302,592 | | | | — | | | | 25,302,592 | | |
International
Commercial Paper | | | — | | | | 2,651,404,639 | | | | — | | | | 2,651,404,639 | | |
U.S. Commercial Paper | | | — | | | | 5,881,342,939 | | | | — | | | | 5,881,342,939 | | |
Foreign Currency
Contracts** | | | — | | | | 240,995,492 | | | | — | | | | 240,995,492 | | |
Total | | $ | 32,803,996,129 | | | $ | 8,915,344,817 | | | $ | 42,856,980 | | | $ | 41,762,197,926 | | |
Liabilities: | |
Foreign Currency
Contracts** | | $ | — | | | $ | 29,366,731 | | | $ | — | | | $ | 29,366,731 | | |
Total | | $ | — | | | $ | 29,366,731 | | | $ | — | | | $ | 29,366,731 | | |
(a) Transfer into/out of Level 2 represent value as of the beginning of the period. Common stock valued at $2,159,465 was transferred from Level 2 to Level 1 during the six-month period ended April 30, 2013. At October 31, 2012, this security was deemed illiquid; at April 30, 2013, this security was valued using quoted market prices in active markets. There were no transfers from Level 1 to Level 2 as of the six-month period ended April 30, 2013.
(b) Level 3 securities are identified in the Schedule of Investments with footnote (f).
† See Schedule of Investments for additional detailed categorizations.
* Represents gold bullion.
** Foreign currency contracts are valued at net unrealized appreciation (depreciation) on the investment.
FIRST EAGLE FUNDS | SEMI-ANNUAL REPORT | APRIL 30, 2013
167
Notes to Financial Statements (unaudited)
Fair Value Level 3 activity for the period ended April 30, 2013 was as follows:
First Eagle Global Fund — (continued) | |
| | | INTERNATIONAL | | INTERNATIONAL | | | |
| | | COMMON STOCKS | | CORPORATE BONDS | | TOTAL VALUE | |
Beginning Balance — market value | | $ | 10,721,439 | | | $ | 31,128,000 | | | $ | 41,849,439 | | |
Purchases | | | — | | | | — | | | | — | | |
Sales | | | | | | | |
Transfer In — Level 3 | | | — | | | | — | | | | — | | |
Transfer Out — Level 3 | | | — | | | | — | | | | — | | |
Accrued Amortization | | | — | | | | — | | | | — | | |
Realized Gains (Losses) | | | — | | | | — | | | | — | | |
Change in Unrealized Appreciation
(Depreciation) | | | 559,959 | | | | 447,582 | | | | 1,007,541 | | |
Ending Balance — market value | | $ | 11,281,398 | | | $ | 31,575,582 | | | $ | 42,856,980 | | |
Change in unrealized gains or (losses)
relating to assets still held at reporting date | | $ | 559,959 | | | $ | 447,582 | | | $ | 1,007,541 | | |
FIRST EAGLE FUNDS | SEMI-ANNUAL REPORT | APRIL 30, 2013
168
First Eagle Overseas Fund | |
DESCRIPTION | | LEVEL 1 | | LEVEL 2 | | LEVEL 3(a) | | TOTAL | |
Assets: † | |
International
Common Stocks | | $ | 9,280,464,591 | | | $ | 9,558,526 | | | $ | 37,930,030 | | | $ | 9,327,953,147 | | |
U.S. Common Stock | | | 22,417,009 | | | | — | | | | — | | | | 22,417,009 | | |
International
Preferred Stocks | | | 115,914,563 | | | | — | | | | — | | | | 115,914,563 | | |
Right | | | — | | | | — | | | | 0 | | | | 0 | | |
Commodity* | | | 582,622,734 | | | | — | | | | — | | | | 582,622,734 | | |
Term Loans | | | — | | | | 743,949 | | | | 10,616,285 | | | | 11,360,234 | | |
International
Corporate Bonds | | | — | | | | 19,175,927 | | | | 21,050,388 | | | | 40,226,315 | | |
International
Commercial Paper | | | — | | | | 941,102,443 | | | | — | | | | 941,102,443 | | |
U.S. Commercial Paper | | | — | | | | 2,183,833,595 | | | | — | | | | 2,183,833,595 | | |
Foreign Currency
Contracts** | | | — | | | | 116,525,025 | | | | — | | | | 116,525,025 | | |
Total | | $ | 10,001,418,897 | | | $ | 3,270,939,465 | | | $ | 69,596,703 | | | $ | 13,341,955,065 | | |
Liabilities: | |
Foreign Currency
Contracts** | | $ | — | | | $ | 16,655,474 | | | $ | — | | | $ | 16,655,474 | | |
Total | | $ | — | | | $ | 16,655,474 | | | $ | — | | | $ | 16,655,474 | | |
(a) Level 3 securities are identified in the Schedule of Investments with footnote (f).
† See Schedule of Investments for additional detailed categorizations.
* Represents gold bullion.
** Foreign currency contracts are valued at net unrealized appreciation (depreciation) on the investment.
For the six-month period ended April 30, 2013, there was no security transfer activity from Level 1 to Level 2 and no security transfer activity from Level 2 to Level 1.
FIRST EAGLE FUNDS | SEMI-ANNUAL REPORT | APRIL 30, 2013
169
Notes to Financial Statements (unaudited)
Fair Value Level 3 activity for the period ended April 30, 2013 was as follows:
First Eagle Overseas Fund — (continued) | |
| | | INTERNATIONAL | | | | INTERNATIONAL | | | | | |
| | | COMMON STOCKS | | RIGHT | | CORPORATE BONDS | | TERM LOANS* | | TOTAL VALUE | |
Beginning Balance —
market value | | $ | 36,904,767 | | | $ | — | | | $ | 20,752,000 | | | $ | — | | | $ | 57,656,767 | | |
Purchases | | | — | | | | 7,625 | | | | — | | | | 22,994,658 | | | | 23,002,283 | | |
Sales | | | — | | | | — | | | | — | | | | (22,992,069 | ) | | | (22,992,069 | ) | |
Transfer In — Level 3 | | | — | | | | — | | | | — | | | | 10,925,318 | | | | 10,925,318 | | |
Transfer Out — Level 3 | | | — | | | | — | | | | — | | | | — | | | | — | | |
Accrued Amortization | | | — | | | | — | | | | — | | | | 642,084 | | | | 642,084 | | |
Realized Gains
(Losses) | | | — | | | | — | | | | — | | | | 1,769,366 | | | | 1,769,366 | | |
Change in Unrealized
Appreciation
(Depreciation) | | | 1,025,263 | | | | (7,625 | ) | | | 298,388 | | | | (2,723,072 | ) | | | (1,407,046 | ) | |
Ending Balance —
market value | | $ | 37,930,030 | | | $ | 0 | | | $ | 21,050,388 | | | $ | 10,616,285 | | | $ | 69,596,703 | | |
Change in unrealized
gains or (losses)
relating to assets
still held at
reporting date | | $ | 1,025,263 | | | $ | (7,625 | ) | | $ | 298,388 | | | $ | (2,723,072 | ) | | $ | (1,407,046 | ) | |
* Amounts reflected herein represents company reorganization.
FIRST EAGLE FUNDS | SEMI-ANNUAL REPORT | APRIL 30, 2013
170
First Eagle U.S. Value Fund | |
DESCRIPTION | | LEVEL 1 | | LEVEL 2 | | LEVEL 3(a) | | TOTAL | |
Assets: † | |
U.S. Common Stocks | | $ | 2,141,001,790 | | | $ | 3,274 | | | $ | — | | | $ | 2,141,005,064 | | |
International
Common Stocks | | | 327,121,368 | | | | 708,662 | | | | — | | | | 327,830,030 | | |
U.S. Preferred Stock | | | — | | | | — | | | | 5,504,940 | | | | 5,504,940 | | |
Warrant | | | 13,015,759 | | | | — | | | | — | | | | 13,015,759 | | |
Commodity* | | | 114,156,844 | | | | — | | | | — | | | | 114,156,844 | | |
International
Corporate Bond | | | — | | | | 4,790,909 | | | | — | | | | 4,790,909 | | |
U.S. Convertible Bond | | | — | | | | 32,967,200 | | | | — | | | | 32,967,200 | | |
U.S. Corporate Bonds | | | — | | | | 53,656,685 | | | | — | | | | 53,656,685 | | |
International
Commercial Paper | | | — | | | | 173,192,435 | | | | — | | | | 173,192,435 | | |
U.S. Commercial Paper | | | — | | | | 366,983,181 | | | | — | | | | 366,983,181 | | |
Total | | $ | 2,595,295,761 | | | $ | 632,302,346 | | | $ | 5,504,940 | | | $ | 3,233,103,047 | | |
(a) Level 3 securities are identified in the Schedule of Investments with footnote (f).
† See Schedule of Investments for additional detailed categorizations.
* Represents gold bullion.
For the six-month period ended April 30, 2013, there was no security transfer activity from Level 1 to Level 2 and no security transfer activity from Level 2 to Level 1.
FIRST EAGLE FUNDS | SEMI-ANNUAL REPORT | APRIL 30, 2013
171
Notes to Financial Statements (unaudited)
Fair Value Level 3 activity for the period ended April 30, 2013 was as follows:
First Eagle U.S. Value Fund — (continued) | |
| | | U.S. PREFERED STOCK | |
Beginning Balance — market value | | $ | 4,828,435 | | |
Purchases | | | — | | |
Sales | | | — | | |
Transfer In — Level 3 | | | — | | |
Transfer Out — Level 3 | | | — | | |
Accrued Amortization | | | — | | |
Realized Gains (Losses) | | | — | | |
Change in Unrealized Appreciation (Depreciation) | | | 676,505 | | |
Ending Balance — market value | | $ | 5,504,940 | | |
Change in unrealized gains or (losses) relating to assets still held at
reporting date | | $ | 676,505 | | |
First Eagle Gold Fund | |
DESCRIPTION | | LEVEL 1 | | LEVEL 2 | | LEVEL 3(a) | | TOTAL | |
Assets: † | |
International
Common Stocks | | $ | 1,248,612,874 | | | $ | — | | | $ | — | | | $ | 1,248,612,874 | | |
U.S. Common Stocks | | | 164,195,347 | | | | — | | | | — | | | | 164,195,347 | | |
International
Preferred Stock | | | 2,844,000 | | | | — | | | | — | | | | 2,844,000 | | |
Investment Company | | | 416,472 | | | | — | | | | — | | | | 416,472 | | |
Warrants | | | — | | | | — | | | | — | | | | — | | |
Commodity* | | | 494,705,610 | | | | — | | | | — | | | | 494,705,610 | | |
International
Convertible Bonds | | | — | | | | — | | | | 30,000,000 | | | | 30,000,000 | | |
International
Commercial Paper | | | — | | | | 26,484,000 | | | | — | | | | 26,484,000 | | |
U.S. Commercial Paper | | | — | | | | 25,919,000 | | | | — | | | | 25,919,000 | | |
Total | | $ | 1,910,774,303 | | | $ | 52,403,000 | | | $ | 30,000,000 | | | $ | 1,993,177,303 | | |
(a) Level 3 securities are identified in the Schedule of Investments with footnote (f).
† See Consolidated Schedule of Investments for additional detailed categorizations.
* Represents gold bullion.
For the six-month period ended April 30, 2013, there was no security transfer activity from Level 1 to Level 2 and no security transfer activity from Level 2 to Level 1.
FIRST EAGLE FUNDS | SEMI-ANNUAL REPORT | APRIL 30, 2013
172
Fair Value Level 3 activity for the period ended April 30, 2013 was as follows:
First Eagle Gold Fund — (continued) | |
| | | INTERNATIONAL | | | | | |
| | | CONVERTIBLE BONDS | | WARRANTS | | TOTAL VALUE | |
Beginning Balance — market value | | $ | 30,000,000 | | | $ | 0 | | | $ | 30,000,000 | | |
Purchases | | | 482 | | | | — | | | | 482 | | |
Sales | | | — | | | | — | | | | — | | |
Transfer In — Level 3 | | | — | | | | — | | | | — | | |
Transfer Out — Level 3 | | | — | | | | — | | | | — | | |
Accrued Amortization | | | — | | | | — | | | | — | | |
Realized Gains (Losses) | | | — | | | | — | | | | — | | |
Change in Unrealized Appreciation
(Depreciation) | | | (482 | ) | | | 0 | | | | (482 | ) | |
Ending Balance — market value | | $ | 30,000,000 | | | $ | 0 | | | $ | 30,000,000 | | |
Change in unrealized gains or (losses)
relating to assets still held at reporting date | | $ | (482 | ) | | $ | 0 | | | $ | (482 | ) | |
FIRST EAGLE FUNDS | SEMI-ANNUAL REPORT | APRIL 30, 2013
173
Notes to Financial Statements (unaudited)
First Eagle Global Income Builder Fund | |
DESCRIPTION | | LEVEL 1 | | LEVEL 2 | | LEVEL 3 | | TOTAL | |
Assets: † | |
U.S. Common Stocks | | $ | 64,785,417 | | | $ | — | | | $ | — | | | $ | 64,785,417 | | |
International
Common Stocks | | | 109,953,839 | | | | — | | | | — | | | | 109,953,839 | | |
Closed-End Mutual Fund | | | 2,355,005 | | | | — | | | | — | | | | 2,355,005 | | |
Commodity* | | | 1,929,691 | | | | — | | | | — | | | | 1,929,691 | | |
U.S. Convertible Bond | | | — | | | | 3,451,000 | | | | — | | | | 3,451,000 | | |
U.S. Corporate Bonds | | | — | | | | 62,542,654 | | | | — | | | | 62,542,654 | | |
International
Corporate Bonds | | | — | | | | 39,320,004 | | | | — | | | | 39,320,004 | | |
Term Loans | | | — | | | | 22,875,006 | | | | — | | | | 22,875,006 | | |
International
Commercial Paper | | | — | | | | 12,297,000 | | | | — | | | | 12,297,000 | | |
U.S. Commercial Paper | | | — | | | | 12,034,000 | | | | — | | | | 12,034,000 | | |
Foreign Currency
Contracts** | | | — | | | | 74,698 | | | | — | | | | 74,698 | | |
Total | | $ | 179,023,952 | | | $ | 152,594,362 | | | $ | — | | | $ | 331,618,314 | | |
Liabilities: | |
Foreign Currency
Contracts** | | $ | — | | | $ | 99,429 | | | $ | — | | | $ | 99,429 | | |
Total | | $ | — | | | $ | 99,429 | | | $ | — | | | $ | 99,429 | | |
† See Schedule of Investments for additional detailed categorizations.
* Represents gold bullion.
** Foreign currency contracts are valued at net unrealized appreciation (depreciation) on the investment.
For the six-month period ended April 30, 2013, there was no security transfer activity from Level 1 to Level 2 and no security transfer activity from Level 2 to Level 1.
FIRST EAGLE FUNDS | SEMI-ANNUAL REPORT | APRIL 30, 2013
174
First Eagle High Yield Fund | |
DESCRIPTION | | LEVEL 1 | | LEVEL 2 | | LEVEL 3 | | TOTAL | |
Assets: † | |
U.S. Convertible Bonds | | $ | — | | | $ | 18,383,132 | | | $ | — | | | $ | 18,383,132 | | |
U.S. Corporate Bonds | | | — | | | | 479,353,880 | | | | — | | | | 479,353,880 | | |
International Corporate Bonds | | | — | | | | 186,264,683 | | | | — | | | | 186,264,683 | | |
Term Loans | | | — | | | | 159,821,057 | | | | — | | | | 159,821,057 | | |
International Commercial Paper | | | — | | | | 25,245,000 | | | | — | | | | 25,245,000 | | |
U.S. Commercial Paper | | | — | | | | 24,706,000 | | | | — | | | | 24,706,000 | | |
Total | | $ | — | | | $ | 893,773,752 | | | $ | — | | | $ | 893,773,752 | | |
Liabilities: | |
Foreign Currency Contracts** | | $ | — | | | $ | 806,320 | | | $ | — | | | $ | 806,320 | | |
Total | | $ | — | | | $ | 806,320 | | | $ | — | | | $ | 806,320 | | |
† See Schedule of Investments for additional detailed categorizations.
** Foreign currency contracts are valued at net unrealized appreciation (depreciation) on the investment.
For the six-month period ended April 30, 2013, there was no security transfer activity from Level 1 to Level 2 and no security transfer activity from Level 2 to Level 1.
FIRST EAGLE FUNDS | SEMI-ANNUAL REPORT | APRIL 30, 2013
175
Notes to Financial Statements (unaudited)
First Eagle Fund of America | |
DESCRIPTION | | LEVEL 1 | | LEVEL 2 | | LEVEL 3 | | TOTAL | |
Assets: † | |
U.S. Common Stocks | | $ | 1,851,734,397 | | | $ | — | | | $ | — | | | $ | 1,851,734,397 | | |
International Common Stocks | | | 106,964,786 | | | | — | | | | — | | | | 106,964,786 | | |
Exchange Traded Fund | | | 45,854,869 | | | | — | | | | — | | | | 45,854,869 | | |
Investment Companies | | | 102,500,193 | | | | — | | | | — | | | | 102,500,193 | | |
U.S. Convertible Bond | | | — | | | | 4,724,606 | | | | — | | | | 4,724,606 | | |
Call Option Purchased | | | 148,000 | | | | — | | | | — | | | | 148,000 | | |
Total | | $ | 2,107,202,245 | | | $ | 4,724,606 | | | $ | — | | | $ | 2,111,926,851 | | |
Liabilities: | |
Covered Call Options Written | | $ | 62,263,619 | | | $ | — | | | $ | — | | | $ | 62,263,619 | | |
Put Option Written | | | 36,540 | | | | — | | | | — | | | | 36,540 | | |
Total | | $ | 62,300,159 | | | $ | — | | | $ | — | | | $ | 62,300,159 | | |
† See Schedule of Investments for additional detailed categorizations.
For the six-month period ended April 30, 2013, there was no security transfer activity from Level 1 to Level 2 and no security transfer activity from Level 2 to Level 1.
FIRST EAGLE FUNDS | SEMI-ANNUAL REPORT | APRIL 30, 2013
176
c) Investment transactions and income — Investment transactions are accounted for on a trade date basis. The specific identification method is used in determining realized gains and losses from investment transactions. Dividend income is recorded on the ex-dividend date. Interest income is recorded daily on the accrual basis. In computing investment income, each Fund accretes discounts and amortizes premiums on debt obligations using the effective yield method. Investment income is allocated to each Fund's share class in proportion to its relative net assets. Payments received from certain investments held by the Funds may be comprised of dividends, capital gains and return of capital. The Funds originally estimate the expected classification of such payments. The amounts may subsequently be reclassified upon receipt of information from the issuer.
d) Expenses — Expenses arising in connection with a Fund are charged directly to that Fund. Expenses common to all Funds are generally allocated to each Fund in proportion to its relative net assets. Certain expenses are shared with the First Eagle Variable Funds, an affiliated fund group. Such costs are generally allocated using the ratio of the Fund's average daily net assets relative to the total average daily net assets of the First Eagle Variable Funds. Earnings credits may reduce shareholder servicing agent fees by the amount of interest earned on balances with such service provider.
e) Foreign currency translation — The books and records of the Funds are maintained in U.S. dollars. The market values of securities which are not traded in U.S. currency are recorded in the financial statements after translation to U.S. dollars based on the applicable exchange rates at the end of the period. The costs of such securities are translated at exchange rates prevailing when acquired. Related interest, dividends and withholding taxes are accrued at the rates of exchange prevailing on the respective dates of such transactions.
The net assets of each of the Funds are presented at the foreign exchange rates and market values at the close of the period. The Funds do not isolate that portion of gains and losses on investments which is due to changes in foreign exchange rates from that which is due to changes in market prices of the securities. Accordingly, such foreign currency gains (losses) are included in the reported net realized and unrealized gains (losses) on investment transactions on the Statement of Operations. However, for federal income
FIRST EAGLE FUNDS | SEMI-ANNUAL REPORT | APRIL 30, 2013
177
Notes to Financial Statements (unaudited)
tax purposes each Fund does isolate the effect of changes in foreign exchange rates from the changes in market prices for realized gains and losses on debt obligations.
f) Forward currency contracts — In connection with portfolio purchases and sales of securities denominated in foreign currencies, each Fund may enter into forward currency contracts. The First Eagle Global, Overseas, Global Income Builder and High Yield Funds enter into foreign exchange contracts primarily to manage and/or gain exposure to certain foreign currencies. The Funds' currency transactions include portfolio hedging on portfolio positions. Portfolio hedging is the use of a forward contract (or other cash management position) with respect to one or more portfolio security positions denominated or quoted in a particular currency. Currency exchange transactions involve currencies of different countries that the Funds invest in and serve as hedges against possible variations in the exchange rates between these currencies and the U.S. dollar. Each Fund may engage in portfolio hedging with respect to the currency of a particular country in amounts approximating actual or anticipated positions in securities denominated in that currency. Hedging can reduce exposure to currency exchange movements, but cannot eliminate that exposure. It is possible to lose money under a hedge.
Funds investing in foreign exchange contracts are exposed to risk if the value of the currency changes unfavorably, if the counterparties to the contracts are unable to meet the terms of their contracts or if the Fund is unable to enter into a closing position. Forward currency contracts outstanding at period end, if any, are listed after the Fund's portfolio. Outstanding contracts at period end are indicative of the volume of activity during the period.
The Funds adopted provisions surrounding disclosures and derivative instruments and hedging activities which require qualitative disclosures about objectives and strategies for using derivatives, quantitative disclosures about fair value amounts of gains and losses on derivative instruments, and disclosures about currency-risk-related contingent features in derivative agreements.
FIRST EAGLE FUNDS | SEMI-ANNUAL REPORT | APRIL 30, 2013
178
At April 30, 2013, the Funds had the following foreign forward currency contracts grouped into appropriate risk categories illustrated below:
First Eagle Global Fund | |
| | | | | | | GAIN OR (LOSS)
DERIVATIVE RECOGNIZED
IN INCOME | |
RISK TYPE | | ASSET DERIVATIVE
FAIR VALUE1 | | LIABILITY DERIVATIVE
FAIR VALUE2 | | REALIZED
GAIN3 | | CHANGE IN
APPRECIATION4 | |
Foreign Currency | | $ | 240,995,492 | | | $ | 29,366,731 | | | $ | 295,746,488 | | | $ | 220,581,821 | | |
First Eagle Overseas Fund | |
| | | | | | | GAIN OR (LOSS)
DERIVATIVE RECOGNIZED
IN INCOME | |
RISK TYPE | | ASSET DERIVATIVE
FAIR VALUE1 | | LIABILITY DERIVATIVE
FAIR VALUE2 | | REALIZED
GAIN3 | | CHANGE IN
APPRECIATION4 | |
Foreign Currency | | $ | 116,525,025 | | | $ | 16,655,474 | | | $ | 149,770,188 | | | $ | 107,159,214 | | |
First Eagle Global Income Builder Fund | |
| | | | | | | GAIN OR (LOSS)
DERIVATIVE RECOGNIZED
IN INCOME | |
RISK TYPE | | ASSET DERIVATIVE
FAIR VALUE1 | | LIABILITY DERIVATIVE
FAIR VALUE2 | | REALIZED
LOSS3 | | CHANGE IN
APPRECIATION4 | |
Foreign Currency | | $ | 74,698 | | | $ | 99,429 | | | $ | (117,655 | ) | | $ | 151,102 | | |
First Eagle High Yield Fund | |
| | | | | | | GAIN OR (LOSS)
DERIVATIVE RECOGNIZED
IN INCOME | |
RISK TYPE | | ASSET DERIVATIVE
FAIR VALUE1 | | LIABILITY DERIVATIVE
FAIR VALUE2 | | REALIZED
GAINS/(LOSS)3 | | CHANGE IN
DEPRECIATION4 | |
Foreign Currency | | $ | 0 | | | $ | 806,320 | | | $ | 0 | | | $ | (113,319 | ) | |
g) Options — In order to produce incremental earnings or protect against declines in the value of portfolio securities, First Eagle Global Fund, First Eagle
1 Statements of Assets and Liabilities location: Receivable for forward currency contracts held, at value.
2 Statements of Assets and Liabilities location: Payable for forward currency contracts held, at value.
3 Statements of Operations location: Net realized gains (losses) from: foreign currency and forward contract related transactions.
4 Statements of Operations location: Changes in unrealized appreciation (depreciation) of: foreign currency and forward contract related translation.
FIRST EAGLE FUNDS | SEMI-ANNUAL REPORT | APRIL 30, 2013
179
Notes to Financial Statements (unaudited)
U.S. Value Fund and First Eagle Fund of America write covered call options on portfolio securities. The Funds may also use options for speculative purposes, although they generally do not employ options for this purpose.
Options contracts are valued daily based upon the last sale price on the principal exchange on which the option is traded and unrealized appreciation/depreciation is recorded. If there is no sale on such day, the mean between the last bid and asked prices is used. When an option is exercised, the proceeds on the sale of a written call option are adjusted by the amount of premium received or paid. When a written option expires, the Funds will realize a gain equal to the amount of the premium received. When the Funds enter into a closing purchase transaction, the Funds will realize a gain (or loss, if the cost of the closing purchase transaction exceeds the premium received when the option was written) without regard to any unrealized gain or loss on the underlying security and the liability related to such option is eliminated.
The Funds may be required to earmark assets to cover its obligations under option contracts. A call option is covered if the Funds hold, on a share-for-share basis, either the underlying shares or a call on the same security as the call written where the exercise price of the call held is equal to or less than the exercise price of the call written (or greater than the exercise price of the call written if the difference is maintained by the Funds in cash, Treasury bills or other high grade short-term obligations in a segregated account with its custodian). One reason for writing options is to attempt to realize, through the receipt of premiums, a greater return than would be realized on the securities alone. Another reason for writing options is to hedge against a moderate decline in the value of securities owned by the Funds in the case of a call option. If an increase occurs in the underlying security or stock index sufficient to result in the exercise of a call written by the Funds, it may be required to deliver securities or cash and may thereby forego some or all of the gain that otherwise may have been realized on the securities underlying the call option. This "opportunity cost" may be partially or wholly offset by the premium received for the covered call written by the Funds. The risk in writing a covered call option is that the Funds give up the opportunity for profit if the market price of the underlying security increases and the option is exercised. The Funds also have the additional risk of not being able to enter into a closing transaction if a liquid secondary market does not exist.
FIRST EAGLE FUNDS | SEMI-ANNUAL REPORT | APRIL 30, 2013
180
The Funds may also write over-the-counter options where the completion of the obligation is dependent upon the credit standing of the counterparty.
For the six-month period ended April 30, 2013, First Eagle Global Fund, First Eagle U.S. Value Fund and First Eagle Fund of America had the following options transactions.
First Eagle Global Fund | |
WRITTEN OPTIONS | | NUMBER
OF CONTRACTS | | PREMIUM
RECEIVED | |
Options outstanding at October 31, 2012 | | | 31,931 | | | $ | 6,108,142 | | |
Options written | | | 34,917 | | | | 6,341,638 | | |
Options assigned | | | (19,696 | ) | | | (2,902,367 | ) | |
Options expired/closed | | | (47,152 | ) | | | (9,547,413 | ) | |
Options outstanding at April 30, 2013 | | | 0 | | | $ | 0 | | |
As of April 30, 2013, there were no segregated securities for written options.
First Eagle U.S. Value Fund | |
WRITTEN OPTIONS | | NUMBER
OF CONTRACTS | | PREMIUM
RECEIVED | |
Options outstanding at October 31, 2012 | | | 3,593 | | | $ | 604,523 | | |
Options written | | | 5,016 | | | | 917,816 | | |
Options assigned | | | (2,676 | ) | | | (389,079 | ) | |
Options expired/closed | | | (5,933 | ) | | | (1,133,260 | ) | |
Options outstanding at April 30, 2013 | | | 0 | | | $ | 0 | | |
As of April 30, 2013, there were no segregated securities for written options.
First Eagle Fund of America | |
WRITTEN OPTIONS | | NUMBER
OF CONTRACTS | | PREMIUM
RECEIVED | |
Options outstanding at October 31, 2012 | | | 145,331 | | | $ | 36,222,702 | | |
Options written | | | 584,420 | | | | 133,219,435 | | |
Options assigned | | | (33,448 | ) | | | (11,086,942 | ) | |
Options expired/closed | | | (501,828 | ) | | | (108,672,996 | ) | |
Options outstanding at April 30, 2013 | | | 194,475 | | | $ | 49,682,199 | | |
PURCHASED OPTIONS | | NUMBER
OF CONTRACTS | |
COST | |
Options outstanding at October 31, 2012 | | | 1,500 | | | $ | 309,736 | | |
Options purchased | | | 3,340 | | | | 665,022 | | |
Options closed | | | (2,840 | ) | | | (722,683 | ) | |
Options outstanding at April 30, 2013 | | | 2,000 | | | $ | 252,075 | | |
FIRST EAGLE FUNDS | SEMI-ANNUAL REPORT | APRIL 30, 2013
181
Notes to Financial Statements (unaudited)
As of April 30, 2013, portfolio securities valued at $754,890,068 were segregated to cover collateral requirements for written options.
Outstanding contracts at period-end are indicative of the volume of activity during the period.
At April 30, 2013, the Funds had the following options grouped into appropriate risk categories illustrated below:
First Eagle Global Fund | |
| | | | | GAIN OR (LOSS)
DERIVATIVE RECOGNIZED
IN INCOME | |
RISK TYPE | | LIABILITY DERIVATIVE
FAIR VALUE2 | | REALIZED
GAIN3 | | CHANGE IN
DEPRECIATION4 | |
Equity —
Written options | | $ | 0 | | | $ | 7,325,471 | | | $ | (4,556,262 | ) | |
First Eagle U.S. Value Fund | |
| | | | | GAIN OR (LOSS)
DERIVATIVE RECOGNIZED
IN INCOME | |
RISK TYPE | | LIABILITY DERIVATIVE
FAIR VALUE2 | | REALIZED
GAIN3 | | CHANGE IN
DEPRECIATION4 | |
Equity —
Written options | | $ | 0 | | | $ | 734,554 | | | $ | (392,263 | ) | |
First Eagle Fund of America | |
| | | | | | | GAIN OR (LOSS)
DERIVATIVE RECOGNIZED
IN INCOME | |
RISK TYPE | | ASSET DERIVATIVE
FAIR VALUE1 | | LIABILITY DERIVATIVE
FAIR VALUE2 | | REALIZED
GAIN (LOSS)3 | | CHANGE IN
(DEPRECIATION)4 | |
Equity —
Written options | | $ | 0 | | | $ | 62,300,159 | | | $ | (47,581,217 | ) | | $ | (18,240,307 | ) | |
Equity —
Purchased options | | | 148,000 | | | | 0 | | | | 290,459 | | | | (109,339 | ) | |
h) Repurchase agreements — The Funds may enter into repurchase agreement transactions with institutions that meet the adviser's credit guidelines. Each repurchase agreement is valued at amortized cost. The Funds require that the collateral received in a repurchase agreement transaction be
1 Statements of Assets and Liabilities location: Investments, at value, Unaffiliated issuers.
2 Statements of Assets and Liabilities location: Option contracts written, at value.
3 Statements of Operations location: Net realized gains (losses) from: Written options & Investment transactions of unaffiliated issuers.
4 Statements of Operations location: Changes in unrealized appreciation (depreciation) of: Written options & Investment transactions.
FIRST EAGLE FUNDS | SEMI-ANNUAL REPORT | APRIL 30, 2013
182
transferred to a custodian in a manner sufficient to enable the Funds to obtain collateral in the event of a counterparty default. If the counterparty defaults and the fair value of the collateral declines, realization of the collateral by the Funds may be delayed or limited.
i) Term Loans — A Fund may invest in term loans, which usually take the form of loan participations and assignments. Loan participations and assignments are agreements to make money available to U.S. or foreign corporations, partnerships or other business entities (the "Borrower") in a specified amount, at a specified rate and within a specified time. A loan is typically originated, negotiated and structured by a U.S. or foreign bank, insurance company or other financial institution (the "Agent") for a group of loan investors ("Loan Investors"). The Agent typically administers and enforces the loan on behalf of the other Loan Investors in the syndicate and may hold any collateral on behalf of the Loan Investors. Such loan participations and assignments are typically senior, secured and collateralized in nature. A Fund records an investment when the Borrower withdraws money and records interest as earned. The Fund generally has no right to enforce compliance with the terms of the loan agreement with the Borrower. As a result, the Fund assumes the credit risk of the Borrower, the selling participant and any intermediary between the Fund and the Borrower ("Intermediate Participants"). In the event that the Borrower, selling participant or Intermediate Participants become insolvent or enters into bankruptcy, each Fund may incur certain costs and delays in realizing payment or may suffer a loss of principal and/or interest.
j) Treasury Inflation-Protected Securities — The Funds invest in Treasury Inflation-Protected Securities ("TIPS") which are specially structured bonds in which the principal amount is adjusted to keep pace with inflation. The inflation (deflation) adjustment is applied to the principal of each bond on a monthly basis and is accounted for as interest income on the Statements of Operations. TIPS are subject to interest rate risk.
k) Restricted Securities — The Funds may invest in securities that are subject to legal or contractual restrictions on resale. These securities generally may be resold in transactions exempt from registration or to the public if the securities are registered. Disposal of these securities may involve time-consuming negotiations and expenses, and prompt sale at an acceptable price may be difficult. Information regarding restricted securities, if any, is included at the end of each Fund's Schedule of Investments.
FIRST EAGLE FUNDS | SEMI-ANNUAL REPORT | APRIL 30, 2013
183
Notes to Financial Statements (unaudited)
l) United States income taxes — No provision has been made for U.S. federal income taxes since it is the intention of each Fund to distribute to shareholders all taxable net investment income and net realized gains on investments, if any, within the allowable time limit, and to comply with the provisions of the Code for a Regulated Investment Company. The Funds declare and pay such income and capital gains on an annual basis except for the First Eagle High Yield Fund which declares income daily and pays monthly. First Eagle Global Income Builder Fund declared and paid income quarterly for the period October 1, 2012 to March 31, 2013. As of April 1, 2013, the First Eagle Global Income Builder Fund declares income daily and pays quarterly.
The Funds adopted provisions surrounding income taxes, which require the tax effects of certain tax positions to be recognized. These tax positions must meet a "more likely than not" standard that based on their technical merits, have a more than 50% likelihood of being sustained upon examination. Management of the Trust has analyzed the Funds' tax positions taken on federal and state income tax returns for all open tax years (the current and the prior three tax years) and has concluded that no provision for income tax is required in the Funds' financial statements.
m) Class Accounting — Investment income, common expenses and realized/unrealized gain or loss on investments are allocated to the various classes of the Fund on the basis of daily net assets of each class. Fees relating to a specific class are charged directly to that class.
n) Use of estimates — The preparation of financial statements in conformity with GAAP requires management to make estimates and assumptions that affect the reported amounts of assets and liabilities at the date of the financial statements and the reported amounts of revenues and expenses during the reporting period. Actual results could differ from those estimates.
o) Redemption Fee — A redemption fee of 2% will be applied to the First Eagle Global Fund, First Eagle Overseas Fund and First Eagle Gold Fund for the sale or exchange within 60 days of the purchase of such shares. Effective March 1, 2013, the First Eagle Global Fund and First Eagle Overseas Fund no longer charge redemption fees.
p) Foreign Taxes — The Funds may be subject to foreign taxes on income, gains on investments or currency purchases/repatriation, a portion of which may be recoverable. The Funds will accrue such taxes and recoveries as applicable, based upon their current interpretation of tax rules and regulations that exist in the markets in which they invest.
FIRST EAGLE FUNDS | SEMI-ANNUAL REPORT | APRIL 30, 2013
184
Note 2 — Investment Advisory, Custody and Administration Agreements; Transactions with Related Persons
For its services, the Adviser receives, pursuant to an Investment Advisory Agreement between the Funds and the Adviser (the "Advisory Agreement") an annual advisory fee as follows: First Eagle Global Fund, First Eagle Overseas Fund, First Eagle U.S. Value Fund, First Eagle Gold Fund and First Eagle Global Income Builder Fund at 0.75% of each Fund's average daily net assets, First Eagle High Yield Fund at 0.70% of the Fund's average daily net assets and First Eagle Fund of America at 1% of the Fund's average daily net assets.
Effective March 1, 2013, the Adviser receives from First Eagle Fund of America an annual advisory fee at the rate of 1.00% of the first $1.5 billion of the average daily net assets, 0.95% of the next $1 billion of the average daily net assets; 0.90% on the next $2.5 billion of the average daily net assets and 0.85% in excess of $5 billion of the average daily net assets.
Pursuant to a subadvisory agreement, dated December 10, 2002 (agreement was amended and restated most recently in September 2009) ("Subadvisory Agreement") Iridian Asset Management LLC ("Iridian" or "Sub-Adviser") manages the investments of the First Eagle Fund of America. The fees paid to Iridian by the Adviser under the Subadvisory Agreement are based on a reference amount equal to 50% of the combined (i) fees received by the Adviser for advisory services on behalf of the Fund and (ii) the fees received by the Fund's distributor for its shareholder liaison services on behalf of the Fund. These amounts are reduced by certain direct marketing costs borne by the Adviser in connection with the Fund and are further reduced by the amount paid by the Adviser for certain administrative expenses incurred in providing services to the Fund.
The Adviser has contractually agreed to waive its management fee and/or reimburse expenses, for the First Eagle High Yield Fund and First Eagle Global Income Builder Fund, as allowed by law, so that the total annual operating expenses (excluding certain items) of the First Eagle High Yield Fund's Class A, Class C and Class I shares do not exceed 1.25%, 2.00% and 0.80%, respectively, and the First Eagle Global Income Builder Fund's Class A, Class C, and Class I shares do not exceed 1.30%, 2.05% and 1.05%, respectively, through December 31, 2013.
The Adviser may seek reimbursement for fees waived and other expenses paid by the Adviser pursuant to the Fee Waiver and Expense Reimbursement
FIRST EAGLE FUNDS | SEMI-ANNUAL REPORT | APRIL 30, 2013
185
Notes to Financial Statements (unaudited)
Agreement ("Agreement"). A repayment should be payable only to the extent it can be made during the thirty-six months following the applicable period during which the Adviser waived fees or reimbursed operating expenses under the Agreement. As of April 30, 2013, the Adviser may seek reimbursement of previously waived and reimbursed fees as follows:
First Eagle Global Income Builder Fund | |
EXPIRATION | | AMOUNT | |
October 31, 2015 | | $ | 305,915 | | |
April 30, 2016 | | | 128,284 | | |
First Eagle HIgh Yield Fund | |
EXPIRATION | | AMOUNT | |
March 31, 2014 | | $ | 38,000 | | |
March 31, 2015 | | | 72,599 | | |
October 31, 2015 | | | 324,266 | | |
April 30, 2016 | | | 251,070 | | |
The Adviser also performs certain administrative, accounting, operations, compliance and other services on behalf of the Funds, and in accordance with its agreement with them, the Funds reimburse the Adviser for costs (including personnel, related overhead and other costs) related to those services. First Eagle Global Income Builder Fund pays the Adviser a monthly administration fee that is accrued daily at an annual rate of 0.05% of the Fund's average daily net assets.
The Adviser also performs certain administrative, accounting, operations, compliance and other services on behalf of the First Eagle High Yield Fund, and in accordance with the agreement between them, the Fund reimburses the Adviser for costs (including personnel, related overhead and other costs) related to those services. In accordance with the plan of reorganization, those reimbursements may not exceed an annual rate of 0.05% of the value of the Fund's average daily net assets. After December 31, 2013, the Fund will no longer reimburse these costs and instead will pay a fixed administrative services fee to the Adviser at an annual rate of 0.05% of the value of the Fund's average daily net assets.
FIRST EAGLE FUNDS | SEMI-ANNUAL REPORT | APRIL 30, 2013
186
For the period ended April 30, 2013, the Funds reimbursed and had payable to the Adviser amounts shown below:
FUND | | REIMBURSED TO ADVISER | | PAYABLE TO ADVISER | |
First Eagle Global Fund | | $ | 1,772,570 | | | $ | 645,488 | | |
First Eagle Overseas Fund | | | 559,253 | | | | 195,352 | | |
First Eagle U.S. Value Fund | | | 144,261 | | | | 43,130 | | |
First Eagle Gold Fund | | | 128,355 | | | | 129,480 | | |
First Eagle Global Income Builder Fund | | | 40,440 | | | | 12,796 | | |
First Eagle High Yield Fund | | | 34,378 | | | | 7,914 | | |
First Eagle Fund of America | | | 82,558 | | | | 22,779 | | |
The Funds have entered into Custody Agreements with State Street Bank and Trust Company ("SSB"). The Custody Agreements provide for an annual fee based on the amount of assets under custody plus transaction charges. SSB serves as custodian of the Funds' portfolio securities and other assets. SSB has directly entered into sub-custodial agreements to maintain the custody of gold bullion in the Funds. Under the terms of the Custody Agreement between the Funds and SSB, SSB maintains and deposits in separate accounts, cash, securities and other assets of the Funds. SSB is also required, upon the order of the Funds, to deliver securities held by SSB and the sub-custodian, and to make payments for securities purchased by the Funds. SSB has also entered into sub-custodian agreements with a number of foreign banks and clearing agencies, pursuant to which portfolio securities purchased outside the United States are maintained in the custody of these entities.
The Funds have also entered into an Administration Agreement with SSB, pursuant to which SSB provides certain financial reporting and other administrative services. SSB, as the Funds' Administrator, receives annual fees separate from and in addition to the fees it receives for its services as the Funds' custodian.
FEF Distributors, LLC, a wholly owned subsidiary of the Adviser, serves as the Funds' principal underwriter. For the six-month period ended April 30, 2013, FEF Distributors, LLC realized $1,254,770, $125,581, $128,283, $120,797, $89,305, $110,062, and $102,325 , pertaining to the sales of shares of First Eagle Global Fund, First Eagle Overseas Fund, First Eagle U.S. Value Fund, First Eagle Gold Fund, First Eagle Global Income Builder Fund, First Eagle High Yield Fund and First Eagle Fund of America, respectively.
The Trust adopted a Trustee Deferred Compensation Plan, which allows the independent Trustees to defer the receipt of all or a portion of compensation related to performance of their duties as a Trustee. The deferred fees are
FIRST EAGLE FUNDS | SEMI-ANNUAL REPORT | APRIL 30, 2013
187
Notes to Financial Statements (unaudited)
invested in various First Eagle Funds until distribution in accordance with the Trustee Deferred Compensation Plan. As of April 30, 2013, balances to the Plan are recorded on the Statements of Assets and Liabilities.
For the six-month period ended April 30, 2013, the Sub-Adviser reimbursed First Eagle Fund of America $10,466 for losses incurred in connection with trading errors.
Note 3 — Plans of Distribution
Under the terms of the Distribution Plans and Agreements ("the Plans") with FEF Distributors, LLC ("the Distributor"), pursuant to the provisions of Rule 12b-1 under the 1940 Act, the First Eagle Global Fund, First Eagle Overseas Fund, First Eagle U.S. Value Fund, First Eagle Gold Fund, First Eagle Global Income Builder Fund and First Eagle High Yield Fund pay the Distributor monthly, a distribution fee with respect to Class A and Class C shares at an annual rate of up to 0.25% and 0.75%, respectively, of each Fund's average daily net assets. In the case of First Eagle Fund of America, it pays the Distributor monthly, a distribution fee with respect to Class A, Class C and Class Y shares at an annual rate of up to 0.25%, 0.75% and 0.25%, respectively of the average daily net assets. Under the Plans, the Distributor is obligated to use the amounts received under the Plans for payments to qualifying dealers for their assistance in the distribution of a Fund's shares and the provision of shareholder services and for other expenses such as advertising costs and the payment for the printing and distribution of prospectuses to prospective investors.
The Distributor bears distribution costs of a Fund to the extent they exceed payments received under the Plan. For the six-month period ended April 30, 2013, the distribution fees incurred by the Funds are disclosed in the Statements of Operations.
The Distributor receives an annual service fee with respect to Class C at the annual rate of 0.25% of each Fund's average daily net assets, payable monthly to cover expenses incurred by the Distributor for providing shareholder liaison services, including assistance with subscriptions, redemptions and other shareholder questions. For the six-month period ended April 30, 2013, the services fees incurred by the Funds are disclosed in the Statements of Operations.
Note 4 — Purchases and Sales of Securities
During the six-month period ended April 30, 2013, the cost of purchases of investments, excluding U.S. Government and short-term securities, totaled $2,477,312,503, $968,186,549, $293,051,390, $211,435,569, $210,583,164,
FIRST EAGLE FUNDS | SEMI-ANNUAL REPORT | APRIL 30, 2013
188
$365,063,906 and $346,450,896 for First Eagle Global Fund, First Eagle Overseas Fund, First Eagle U.S. Value Fund, First Eagle Gold Fund, First Eagle Global Income Builder Fund, First Eagle High Yield Fund and First Eagle Fund of America, respectively. Proceeds from sales of investments, excluding U.S. Government securities and short-term securities, totaled $2,223,505,766, $759,031,791, $165,112,731, $127,103,905, $6,981,496, $156,529,796 and $193,900,016 for First Eagle Global Fund, First Eagle Overseas Fund, First Eagle U.S. Value Fund, First Eagle Gold Fund, First Eagle Global Income Builder Fund, First Eagle High Yield Fund and First Eagle Fund of America, respectively.
There were no purchases or sales of U.S. Government securities, excluding short-term securities, for First Eagle Global Fund, First Eagle Overseas Fund, First Eagle U.S. Value Fund, First Eagle Gold Fund, First Eagle Global Income Builder Fund, First Eagle High Yield Fund and First Eagle Fund of America.
Note 5 — Line of Credit
At a meeting on September 12, 2012, the Board of Trustees approved continuing a $300 million committed, unsecured line of credit ("Credit Facility") with State Street Bank and Trust Company for the Funds, to be utilized for temporarily financing the purchase or sale of securities for prompt delivery in the ordinary course of business or for temporarily financing the redemption of shares of each Fund at the request of shareholders and other temporary or emergency purposes. Under the Credit Facility arrangement, each Fund has agreed to pay an annual commitment fee on the unused balance, allocated pro rata, based on the relative asset size of the Funds. A portion of the commitment fees related to the line of credit are paid by the Funds and are included in other expenses in the Statements of Operations. During the six-month period ended April 30, 2013, the Funds had borrowings under the agreement as follows:
FUND | | AVERAGE
DAILY LOAN
BALANCE | | NUMBER OF DAYS
OUTSTANDING | | INTEREST
EXPENSE | | WEIGHTED
AVERAGE
ANNUALIZED
INTEREST RATE | |
First Eagle Global Fund | | $ | 9,277,221 | | | | 1 | | | $ | 366 | | | | 1.42 | % | |
As of April 30, 2013 there were no outstanding borrowings from the credit facility.
Note 6 — Capital Stock
At April 30, 2013, the Funds have an unlimited number of shares authorized for issuance. The Funds have the ability to issue multiple classes of shares.
FIRST EAGLE FUNDS | SEMI-ANNUAL REPORT | APRIL 30, 2013
189
Notes to Financial Statements (unaudited)
Transactions in shares of capital stock were as follows:
| | | SIX-MONTH PERIOD ENDED APRIL 30, 2013 | |
| | | FIRST EAGLE GLOBAL FUND | |
| | | CLASS A | | CLASS C | | CLASS I | |
Shares sold | | | 35,727,915 | | | | 21,568,763 | | | | 51,392,823 | | |
Shares issued for reinvested
dividends and distributions | | | 12,310,707 | | | | 5,240,700 | | | | 7,790,626 | | |
Shares redeemed | | | (30,378,987 | ) | | | (14,158,816 | ) | | | (26,058,214 | ) | |
Net increase (decrease) | | | 17,659,635 | | | | 12,650,647 | | | | 33,125,235 | | |
| | | YEAR ENDED OCTOBER 31, 2012 | |
| | | FIRST EAGLE GLOBAL FUND | |
| | | CLASS A | | CLASS C | | CLASS I | |
Shares sold | | | 62,388,629 | | | | 35,230,795 | | | | 83,665,600 | | |
Shares issued for reinvested
dividends and distributions | | | 6,801,942 | | | | 2,393,384 | | | | 3,768,498 | | |
Shares redeemed | | | (53,467,391 | ) | | | (26,699,689 | ) | | | (40,856,280 | ) | |
Net increase (decrease) | | | 15,723,180 | | | | 10,924,490 | | | | 46,577,818 | | |
| | | SIX-MONTH PERIOD ENDED APRIL 30, 2013 | |
| | | FIRST EAGLE GOLD FUND | |
| | | CLASS A | | CLASS C | | CLASS I | |
Shares sold | | | 10,317,807 | | | | 2,647,485 | | | | 10,977,433 | | |
Shares issued for reinvested
dividends and distributions | | | 131,174 | | | | 3 | | | | 77,683 | | |
Shares redeemed | | | (11,936,916 | ) | | | (3,908,832 | ) | | | (10,363,280 | ) | |
Net increase (decrease) | | | (1,487,935 | ) | | | (1,261,344 | ) | | | 691,836 | | |
| | | YEAR ENDED OCTOBER 31, 2012 | |
| | | FIRST EAGLE GOLD FUND | |
| | | CLASS A | | CLASS C | | CLASS I | |
Shares sold | | | 16,136,242 | | | | 4,442,711 | | | | 19,622,203 | | |
Shares issued for reinvested
dividends and distributions | | | 1,926,165 | | | | 553,133 | | | | 592,601 | | |
Shares redeemed | | | (20,754,725 | ) | | | (4,756,926 | ) | | | (18,630,497 | ) | |
Net increase (decrease) | | | (2,692,318 | ) | | | 238,918 | | | | 1,584,307 | | |
FIRST EAGLE FUNDS | SEMI-ANNUAL REPORT | APRIL 30, 2013
190
(continued)
| | | SIX-MONTH PERIOD ENDED APRIL 30, 2013 | |
| | | FIRST EAGLE OVERSEAS FUND | | FIRST EAGLE U.S. VALUE FUND | |
| | | CLASS A | | CLASS C | | CLASS I | | CLASS A | | CLASS C | | CLASS I | |
Shares sold | | | 30,970,659 | | | | 4,092,992 | | | | 59,610,061 | | | | 10,090,469 | | | | 4,400,121 | | | | 11,863,456 | | |
Shares issued for reinvested
dividends and distributions | | | 11,078,245 | | | | 1,679,606 | | | | 10,459,996 | | | | 2,102,155 | | | | 661,683 | | | | 1,255,195 | | |
Shares redeemed | | | (28,950,149 | ) | | | (4,216,224 | ) | | | (24,777,028 | ) | | | (12,240,772 | ) | | | (3,458,399 | ) | | | (8,949,352 | ) | |
Net increase (decrease) | | | 13,098,755 | | | | 1,556,374 | | | | 45,293,029 | | | | (48,148 | ) | | | 1,603,405 | | | | 4,169,299 | | |
| | | YEAR ENDED OCTOBER 31, 2012 | |
| | | FIRST EAGLE OVERSEAS FUND | | FIRST EAGLE U.S. VALUE FUND | |
| | | CLASS A | | CLASS C | | CLASS I | | CLASS A | | CLASS C | | CLASS I | |
Shares sold | | | 55,443,712 | | | | 6,338,133 | | | | 93,794,727 | | | | 34,764,626 | | | | 14,439,563 | | | | 28,860,840 | | |
Shares issued for reinvested
dividends and distributions | | | 10,323,759 | | | | 1,491,162 | | | | 7,558,176 | | | | 1,938,704 | | | | 561,949 | | | | 995,161 | | |
Shares redeemed | | | (61,897,888 | ) | | | (9,731,745 | ) | | | (52,137,111 | ) | | | (15,159,004 | ) | | | (4,115,236 | ) | | | (10,193,717 | ) | |
Net increase (decrease) | | | 3,869,583 | | | | (1,902,450 | ) | | | 49,215,792 | | | | 21,544,326 | | | | 10,886,276 | | | | 19,662,284 | | |
| | | SIX-MONTH PERIOD ENDED APRIL 30, 2013 | |
| | | FIRST EAGLE GLOBAL INCOME BUILDER FUND | | FIRST EAGLE HIGH YIELD FUND | |
| | | CLASS A | | CLASS C | | CLASS I | | CLASS A | | CLASS C | | CLASS I | |
Shares sold | | | 9,889,917 | | | | 6,611,481 | | | | 4,618,074 | | | | 13,372,175 | | | | 4,910,195 | | | | 11,086,926 | | |
Shares issued for reinvested
dividends and distributions | | | 92,452 | | | | 40,049 | | | | 55,540 | | | | 701,484 | | | | 250,301 | | | | 765,216 | | |
Shares redeemed | | | (665,275 | ) | | | (218,828 | ) | | | (516,110 | ) | | | (3,295,757 | ) | | | (1,271,391 | ) | | | (4,096,360 | ) | |
Net increase (decrease) | | | 9,317,094 | | | | 6,432,702 | | | | 4,157,504 | | | | 10,777,902 | | | | 3,889,105 | | | | 7,755,782 | | |
| | | YEAR ENDED OCTOBER 31, 2012 | |
| | | FIRST EAGLE GLOBAL INCOME BUILDER FUND* | | FIRST EAGLE HIGH YIELD FUND** | |
| | | CLASS A | | CLASS C | | CLASS I | | CLASS A | | CLASS C | | CLASS I | |
Shares sold | | | 4,289,987 | | | | 2,549,996 | | | | 3,695,841 | | | | 17,342,363 | | | | 8,932,758 | | | | 19,594,646 | | |
Shares issued for reinvested
dividends and distributions | | | 16,856 | | | | 8,099 | | | | 19,628 | | | | 458,671 | | | | 149,881 | | | | 611,736 | | |
Shares redeemed | | | (98,960 | ) | | | (54,607 | ) | | | (24,647 | ) | | | (1,973,303 | ) | | | (535,928 | ) | | | (1,046,409 | ) | |
Net increase (decrease) | | | 4,207,883 | | | | 2,503,488 | | | | 3,690,822 | | | | 15,827,731 | | | | 8,546,711 | | | | 19,159,973 | | |
FIRST EAGLE FUNDS | SEMI-ANNUAL REPORT | APRIL 30, 2013
191
Notes to Financial Statements (unaudited)
| | | SIX-MONTH PERIOD ENDED APRIL 30, 2013 | |
| | | FIRST EAGLE FUND OF AMERICA | |
| | | CLASS A | | CLASS C | | CLASS I*** | | CLASS Y | |
Shares sold | | | 7,474,138 | | | | 2,821,293 | | | | 8,081,415 | | | | 1,279,188 | | |
Shares issued for reinvested
dividends and distributions | | | 7,576 | | | | 3 | | | | 0 | | | | 6,187 | | |
Shares redeemed | | | (5,666,933 | ) | | | (816,441 | ) | | | (86,632 | ) | | | (6,967,118 | ) | |
Net increase (decrease) | | | 1,814,781 | | | | 2,004,855 | | | | 7,994,783 | | | | (5,681,743 | ) | |
| | | YEAR ENDED OCTOBER 31, 2012 | |
| | | FIRST EAGLE FUND OF AMERICA | |
| | | CLASS A | | CLASS C | | CLASS Y | |
Shares sold | | | 7,799,688 | | | | 2,865,457 | | | | 1,801,446 | | |
Shares issued for reinvested
dividends and distributions | | | 1,591,289 | | | | 631,712 | | | | 1,733,825 | | |
Shares redeemed | | | (5,418,574 | ) | | | (1,755,620 | ) | | | (4,156,267 | ) | |
Net increase (decrease) | | | 3,972,403 | | | | 1,741,549 | | | | (620,996 | ) | |
* Represents the period May 1, 2012 to October 31, 2012.
** Represents the period April 1, 2012 to October 31, 2012.
*** Represents the period March 8, 2013 to April 30, 2013.
FIRST EAGLE FUNDS | SEMI-ANNUAL REPORT | APRIL 30, 2013
192
(continued)
Transactions in dollars of capital stock were as follows:
| | | SIX-MONTH PERIOD ENDED APRIL 30, 2013 | | SIX-MONTH PERIOD ENDED APRIL 30, 2013 | |
| | | FIRST EAGLE GLOBAL FUND | | FIRST EAGLE OVERSEAS FUND | |
| | | CLASS A | | CLASS C | | CLASS I | | CLASS A | | CLASS C | | CLASS I | |
Shares sold | | $ | 1,776,359,502 | | | $ | 1,052,902,746 | | | $ | 2,566,024,624 | | | $ | 694,612,106 | | | $ | 89,211,911 | | | $ | 1,355,619,432 | | |
Shares issued for reinvested
dividends and distributions | | | 590,420,981 | | | | 247,256,223 | | | | 374,962,844 | | | | 239,954,779 | | | | 35,490,076 | | | | 230,119,915 | | |
Shares redeemed | | | (1,507,214,831 | ) | | | (690,062,614 | ) | | | (1,300,327,686 | ) | | | (647,750,492 | ) | | | (91,883,014 | ) | | | (563,290,749 | ) | |
Net increase (decrease) | | $ | 859,565,652 | | | $ | 610,096,355 | | | $ | 1,640,659,782 | | | $ | 286,816,393 | | | $ | 32,818,973 | | | $ | 1,022,448,598 | | |
| | | YEAR ENDED OCTOBER 31, 2012 | | YEAR ENDED OCTOBER 31, 2012 | |
| | | FIRST EAGLE GLOBAL FUND | | FIRST EAGLE OVERSEAS FUND | |
| | | CLASS A | | CLASS C | | CLASS I | | CLASS A | | CLASS C | | CLASS I | |
Shares sold | | $ | 2,956,278,063 | | | $ | 1,637,915,493 | | | $ | 3,981,891,238 | | | $ | 1,189,229,650 | | | $ | 131,960,536 | | | $ | 2,044,840,175 | | |
Shares issued for reinvested
dividends and distributions | | | 302,618,460 | | | | 104,854,140 | | | | 168,225,738 | | | | 209,262,697 | | | | 29,554,809 | | | | 155,396,107 | | |
Shares redeemed | | | (2,527,517,394 | ) | | | (1,243,056,770 | ) | | | (1,942,066,934 | ) | | | (1,322,271,401 | ) | | | (202,837,114 | ) | | | (1,125,783,011 | ) | |
Net increase (decrease) | | $ | 731,379,129 | | | $ | 499,712,863 | | | $ | 2,208,050,042 | | | $ | 76,220,946 | | | $ | (41,321,769 | ) | | $ | 1,074,453,271 | | |
FIRST EAGLE FUNDS | SEMI-ANNUAL REPORT | APRIL 30, 2013
193
Notes to Financial Statements (unaudited)
| | SIX-MONTH PERIOD ENDED APRIL 30, 2013 | |
| | | FIRST EAGLE U.S. VALUE FUND | |
| | | CLASS A | | CLASS C | | CLASS I | |
Shares sold | | $ | 185,833,307 | | | $ | 80,126,071 | | | $ | 221,013,319 | | |
Shares issued for reinvested
dividends and distributions | | | 37,376,299 | | | | 11,672,102 | | | | 22,568,401 | | |
Shares redeemed | | | (225,264,666 | ) | | | (63,294,644 | ) | | | (167,514,586 | ) | |
Net increase (decrease) | | $ | (2,055,060 | ) | | $ | 28,503,529 | | | $ | 76,067,134 | | |
| | | YEAR ENDED OCTOBER 31, 2012 | |
| | | FIRST EAGLE U.S. VALUE FUND | |
| | | CLASS A | | CLASS C | | CLASS I | |
Shares sold | | $ | 604,973,317 | | | $ | 248,353,887 | | | $ | 507,992,659 | | |
Shares issued for reinvested
dividends and distributions | | | 31,581,497 | | | | 9,092,330 | | | | 16,390,304 | | |
Shares redeemed | | | (266,732,905 | ) | | | (71,576,152 | ) | | | (180,767,869 | ) | |
Net increase (decrease) | | $ | 369,821,909 | | | $ | 185,870,065 | | | $ | 343,615,094 | | |
| | SIX-MONTH PERIOD ENDED APRIL 30, 2013 | |
| | | FIRST EAGLE HIGH YIELD FUND | |
| | | CLASS A | | CLASS C | | CLASS I | |
Shares sold | | $ | 135,254,818 | | | $ | 49,561,059 | | | $ | 112,186,914 | | |
Shares issued for reinvested
dividends and distributions | | | 7,111,875 | | | | 2,535,004 | | | | 7,757,605 | | |
Shares redeemed | | | (33,374,960 | ) | | | (12,878,315 | ) | | | (41,469,988 | ) | |
Net increase (decrease) | | $ | 108,991,733 | | | $ | 39,217,748 | | | $ | 78,474,531 | | |
| | | YEAR ENDED OCTOBER 31, 2012 | |
| | | FIRST EAGLE HIGH YIELD FUND** | |
| | | CLASS A | | CLASS C | | CLASS I | |
Shares sold | | $ | 169,517,068 | | | $ | 87,418,098 | | | $ | 191,197,349 | | |
Shares issued for reinvested
dividends and distributions | | | 4,510,338 | | | | 1,472,774 | | | | 6,013,646 | | |
Shares redeemed | | | (19,213,078 | ) | | | (5,270,289 | ) | | | (10,244,667 | ) | |
Net increase (decrease) | | $ | 154,814,328 | | | $ | 83,620,583 | | | $ | 186,966,328 | | |
* Represents the period May 1, 2012 to October 31, 2012.
** Represents the period April 1, 2012 to October 31, 2012.
*** Represents the period March 8, 2013 to April 30, 2013.
FIRST EAGLE FUNDS | SEMI-ANNUAL REPORT | APRIL 30, 2013
194
(continued)
| | | SIX-MONTH PERIOD ENDED APRIL 30, 2013 | |
| | | FIRST EAGLE GOLD FUND | | FIRST EAGLE GLOBAL INCOME BUILDER FUND | |
| | | CLASS A | | CLASS C | | CLASS I | | CLASS A | | CLASS C | | CLASS I | |
Shares sold | | $ | 251,031,337 | | | $ | 64,063,137 | | | $ | 269,987,946 | | | $ | 104,755,603 | | | $ | 69,754,874 | | | $ | 48,888,908 | | |
Shares issued for reinvested
dividends and distributions | | | 3,596,790 | | | | 62 | | | | 2,152,604 | | | | 979,849 | | | | 422,775 | | | | 584,727 | | |
Shares redeemed | | | (285,195,320 | ) | | | (89,483,393 | ) | | | (253,208,802 | ) | | | (7,030,958 | ) | | | (2,320,402 | ) | | | (5,488,898 | ) | |
Net increase (decrease) | | $ | (30,567,193 | ) | | $ | (25,420,194 | ) | | $ | 18,931,748 | | | $ | 98,704,494 | | | $ | 67,857,247 | | | $ | 43,984,737 | | |
| | | YEAR ENDED OCTOBER 31, 2012 | |
| | | FIRST EAGLE GOLD FUND | | FIRST EAGLE GLOBAL INCOME BUILDER FUND* | |
| | | CLASS A | | CLASS C | | CLASS I | | CLASS A | | CLASS C | | CLASS I | |
Shares sold | | $ | 471,675,630 | | | $ | 126,090,905 | | | $ | 564,245,924 | | | $ | 43,500,772 | | | $ | 25,874,606 | | | $ | 37,031,937 | | |
Shares issued for reinvested
dividends and distributions | | | 58,150,919 | | | | 16,234,432 | | | | 18,086,195 | | | | 173,094 | | | | 83,136 | | | | 197,719 | | |
Shares redeemed | | | (592,856,546 | ) | | | (131,067,219 | ) | | | (532,748,007 | ) | | | (1,010,534 | ) | | | (560,866 | ) | | | (247,612 | ) | |
Net increase (decrease) | | $ | (63,029,997 | ) | | $ | 11,258,118 | | | $ | 49,584,112 | | | $ | 42,663,332 | | | $ | 25,396,876 | | | $ | 36,982,044 | | |
| | | SIX-MONTH PERIOD ENDED APRIL 30, 2013 | |
| | | FIRST EAGLE FUND OF AMERICA | |
| | | CLASS A | | CLASS C | | CLASS I*** | | CLASS Y | |
Shares sold | | $ | 218,329,419 | | | $ | 72,044,933 | | | $ | 252,910,283 | | | $ | 37,993,535 | | |
Shares issued for reinvested
dividends and distributions | | | 210,001 | | | | 74 | | | | 0 | | | | 174,597 | | |
Shares redeemed | | | (168,355,701 | ) | | | (20,477,297 | ) | | | (2,712,324 | ) | | | (213,870,073 | ) | |
Net increase (decrease) | | $ | 50,183,719 | | | $ | 51,567,710 | | | $ | 250,197,959 | | | $ | (175,701,941 | ) | |
| | | YEAR ENDED OCTOBER 31, 2012 | |
| | | FIRST EAGLE FUND OF AMERICA | |
| | | CLASS A | | CLASS C | | CLASS Y | |
Shares sold | | $ | 198,358,338 | | | $ | 63,407,921 | | | $ | 46,475,429 | | |
Shares issued for reinvested
dividends and distributions | | | 36,154,075 | | | | 12,533,184 | | | | 40,138,059 | | |
Shares redeemed | | | (136,684,626 | ) | | | (38,844,456 | ) | | | (107,471,098 | ) | |
Net increase (decrease) | | $ | 97,827,787 | | | $ | 37,096,649 | | | $ | (20,857,610 | ) | |
FIRST EAGLE FUNDS | SEMI-ANNUAL REPORT | APRIL 30, 2013
195
Notes to Financial Statements (unaudited)
At April 30, 2013, ASB Holdings, Inc. owned more than 5% of the First Eagle Global Income Builder Fund Class I shares. At April 30, 2013, Strafe & Co. owned more than 5% of the First Eagle Fund of America Class I shares.
Note 7 — Indemnification and Investment Risk
In the normal course of business, the Funds enter into contracts that contain a variety of representations which provide general indemnifications. Each Fund's maximum exposure under these arrangements is unknown, as this would involve future claims that may be made against each Fund that have not yet occurred. However, based on experience, the Funds expect the risk of loss to be remote. The Funds may have elements of risk not typically associated with investments in the United States of America due to their investments in foreign countries or regions. Such foreign investments may subject the Funds to additional risks resulting from political or economic conditions in such countries or regions and the possible imposition of adverse governmental laws or currency exchange restrictions could cause the securities and their markets to be less liquid and their prices to be more volatile than those of comparable U.S. securities. The securities markets in many emerging-market countries are substantially smaller, less developed, less liquid and more volatile than the securities markets of developed countries.
The First Eagle High Yield Fund invests in high yield securities which may be subject to greater levels of interest rate, credit and liquidity risk than investment grade securities. These high yield securities may be considered speculative with respect to the issuer's continuing ability to make principal and interest payments and may be subject to significant price fluctuations.
The Funds are subject to interest rate and credit risk. The value of debt securities may decline as interest rates increase. The Funds could lose money if the issuer of a fixed income security is unable to pay interest or repay principal when it is due. The ability of the issuers of debt to meet their obligations may be affected by the economic and political developments in a specific industry or region.
The Funds enter into derivatives which may represent off-balance sheet risk. Off-balance sheet risk exists when the maximum potential loss on a particular investment is greater than the value of such investment as reflected in the Statements of Assets and Liabilities.
FIRST EAGLE FUNDS | SEMI-ANNUAL REPORT | APRIL 30, 2013
196
Note 8 — Redemption In-Kind Transactions
The redemption in-kind policy for all of the Funds reserves the right of the Funds to pay redemptions in-kind (i.e., payments in the form of marketable securities or, as needed, other traded assets, rather than cash) if the redemption request is large enough to affect a Fund's operations (for example, if it represents more than $250,000 or 1% of the Fund's assets). When receiving assets distributed in-kind, the recipient will bear applicable commissions or other costs on their sale. There were no redemptions in-kind as of April 30, 2013.
Note 9 — Accounting Pronouncements
In December 2011, FASB issued ASU No. 2011-11, "Disclosures about Offsetting Assets and Liabilities". ASU No. 2011-11 requires disclosures to make financial statements that are prepared under U.S. GAAP more comparable to those prepared under International Financial Reporting Standards ("IFRS"). The new disclosure requirements mandate that entities disclose both gross and net information about instruments and transactions subject to an agreement similar to a master netting arrangement. In addition, ASU No. 2011-11 requires disclosure of collateral received and posted in connection with master netting agreements or similar arrangements. New disclosures are required for annual reporting periods beginning on or after January 1, 2013, and interim periods within those annual periods. Management is evaluating the impact of ASU No. 2011-11 on the financial statements and disclosures.
Note 10 — Subsequent Events
In accordance with the provision surrounding Subsequent Events adopted by the Funds, management has evaluated the possibility of subsequent events existing in the Funds' financial statements. Management has determined that there are no material events that would require disclosures in the Funds' financial statements.
FIRST EAGLE FUNDS | SEMI-ANNUAL REPORT | APRIL 30, 2013
197
Fund Expenses (unaudited)
Example
As a shareholder of the First Eagle Funds, you may incur two types of costs: (1) transaction costs including front-end and contingent deferred sales charges (loads), and (2) ongoing costs, including advisory fees; distribution fees (12b-1) and/or service fees; and other Fund expenses. This Example is intended to help you understand your ongoing costs (in dollars) of investing in the Funds and to compare these costs with the ongoing costs of investing in other mutual funds.
This Example is based on an investment of $1,000 invested on November 1, 2012 and held for the six-months ended April 30, 2013.
Actual Expenses
The table below titled "Based on Actual Total Return" provides information about actual account values and actual expenses. You may use the information provided in this table, together with the amount you invested, to estimate the expenses that you paid over the period. To estimate the expenses you paid on your account, divide your ending account value by $1,000 (for example, an $8,600 ending account value divided by $1,000 = 8.6), then multiply the result by the number under the heading entitled "Expenses Paid During the Period".
FIRST EAGLE FUNDS | SEMI-ANNUAL REPORT | APRIL 30, 2013
198
Based on Actual Total Return1
| | | ACTUAL TOTAL
RETURN
WITHOUT
SALES CHARGES2 | | BEGINNING
ACCOUNT
VALUE | | ENDING
ACCOUNT
VALUE | | ANNUALIZED
EXPENSE
RATIO | | EXPENSES
PAID
DURING THE
PERIOD3 | |
First Eagle Global Fund | |
Class A | | | 10.26 | % | | $ | 1,000.00 | | | $ | 1,102.60 | | | | 1.13 | % | | $ | 5.89 | | |
Class C | | | 9.85 | | | | 1,000.00 | | | | 1,098.50 | | | | 1.88 | | | | 9.78 | | |
Class I | | | 10.41 | | | | 1,000.00 | | | | 1,104.10 | | | | 0.88 | | | | 4.59 | | |
First Eagle Overseas Fund | |
Class A | | | 10.79 | | | | 1,000.00 | | | | 1,107.90 | | | | 1.16 | | | | 6.06 | | |
Class C | | | 10.40 | | | | 1,000.00 | | | | 1,104.00 | | | | 1.91 | | | | 9.96 | | |
Class I | | | 10.88 | | | | 1,000.00 | | | | 1,108.80 | | | | 0.91 | | | | 4.76 | | |
First Eagle U.S. Value Fund | |
Class A | | | 7.33 | | | | 1,000.00 | | | | 1,073.30 | | | | 1.19 | | | | 6.12 | | |
Class C | | | 6.93 | | | | 1,000.00 | | | | 1,069.30 | | | | 1.94 | | | | 9.95 | | |
Class I | | | 7.49 | | | | 1,000.00 | | | | 1,074.90 | | | | 0.94 | | | | 4.84 | | |
First Eagle Gold Fund Consolidated | |
Class A | | | –33.73 | | | | 1,000.00 | | | | 662.70 | | | | 1.22 | | | | 5.03 | | |
Class C | | | –33.98 | | | | 1,000.00 | | | | 660.20 | | | | 1.97 | | | | 8.11 | | |
Class I | | | –33.67 | | | | 1,000.00 | | | | 663.30 | | | | 0.97 | | | | 4.00 | | |
First Eagle Global Income Builder Fund | |
Class A4 | | | 7.50 | | | | 1,000.00 | | | | 1,075.00 | | | | 1.29 | | | | 6.64 | | |
Class C4 | | | 7.05 | | | | 1,000.00 | | | | 1,070.50 | | | | 2.04 | | | | 10.47 | | |
Class I4 | | | 7.56 | | | | 1,000.00 | | | | 1,075.60 | | | | 1.05 | | | | 5.40 | | |
First Eagle High Yield Fund | |
Class A4 | | | 5.86 | | | | 1,000.00 | | | | 1,058.60 | | | | 1.19 | | | | 6.07 | | |
Class C4 | | | 5.47 | | | | 1,000.00 | | | | 1,054.70 | | | | 1.94 | | | | 9.88 | | |
Class I4 | | | 6.06 | | | | 1,000.00 | | | | 1,060.60 | | | | 0.80 | | | | 4.09 | | |
First Eagle Fund of America | |
Class A | | | 15.30 | | | | 1,000.00 | | | | 1,153.00 | | | | 1.39 | | | | 7.42 | | |
Class C | | | 14.84 | | | | 1,000.00 | | | | 1,148.40 | | | | 2.14 | | | | 11.40 | | |
Class I5 | | | 1.77 | | | | 1,000.00 | | | | 1,017.70 | | | | 1.16 | | | | 1.736 | | |
Class Y | | | 15.31 | | | | 1,000.00 | | | | 1,153.10 | | | | 1.39 | | | | 7.42 | | |
1 For the six-months ended April 30, 2013.
2 Past performance does not guarantee future results. Assumes reinvestment of all dividends and capital gain distributions, if any, at net asset value and does not reflect the deduction of the applicable sales charge, exchange fees or redemption fees. Had the effect of sales charges been reflected, expenses would have been higher and returns lower. Total return is not annualized, as it may not be representative of the total return for the year.
3 Expenses are equal to the annualized expense ratio multiplied by the average account value over the period, multiplied by 181/365 (to reflect the one-half year period).
4 Expense and performance figures reflect certain fee waivers and/or expense limitations without which returns and expenses may have been lower or higher, respectively.
5 First Eagle Fund of America Class I commenced investment operations on March 8, 2013.
6 Expenses are equal to the annualized expense ratio multiplied by the average account value over the period, multiplied by 54/365 (to reflect the actual days in the period).
FIRST EAGLE FUNDS | SEMI-ANNUAL REPORT | APRIL 30, 2013
199
Fund Expenses (unaudited)
Hypothetical Example for Comparison Purposes
The table below titled "Based on Hypothetical Total Return" provides information about hypothetical account values and hypothetical expenses based on the actual expense ratios and an assumed rate of return of 5% per year before expenses, which is not the First Eagle Funds' actual return. The hypothetical account values and expenses may not be used to estimate the actual ending account balance or expenses you paid for the period. You may use the information provided in this table to compare the ongoing costs of investing in the Funds and other funds. To do so, compare the 5% hypothetical example relating to the Funds with the 5% hypothetical examples that appear in the shareholder reports of other funds.
This Example is based on an investment of $1,000 invested on November 1, 2012 and held for the six-months ended April 30, 2013.
Please note that the expenses shown in the table below are meant to highlight your ongoing costs only and do not reflect any transactional costs, such as front-end or back-end sales charges (loads). Therefore, the table is useful in comparing ongoing costs only, and will not help you determine the relative total costs of owning different funds. In addition, if these transaction costs were included, your costs would have been higher.
FIRST EAGLE FUNDS | SEMI-ANNUAL REPORT | APRIL 30, 2013
200
Based on Hypothetical Total Return1
| | | HYPOTHETICAL
ANNUALIZED
TOTAL
RETURN | | BEGINNING
ACCOUNT
VALUE | | ENDING
ACCOUNT
VALUE | | ANNUALIZED
EXPENSE
RATIO | | EXPENSES
PAID
DURING THE
PERIOD2 | |
First Eagle Global Fund | |
Class A | | | 5.00 | % | | $ | 1,000.00 | | | $ | 1,019.19 | | | | 1.13 | % | | $ | 5.66 | | |
Class C | | | 5.00 | | | | 1,000.00 | | | | 1,015.47 | | | | 1.88 | | | | 9.39 | | |
Class I | | | 5.00 | | | | 1,000.00 | | | | 1,020.43 | | | | 0.88 | | | | 4.41 | | |
First Eagle Overseas Fund | |
Class A | | | 5.00 | | | | 1,000.00 | | | | 1,019.04 | | | | 1.16 | | | | 5.81 | | |
Class C | | | 5.00 | | | | 1,000.00 | | | | 1,015.32 | | | | 1.91 | | | | 9.54 | | |
Class I | | | 5.00 | | | | 1,000.00 | | | | 1,020.28 | | | | 0.91 | | | | 4.56 | | |
First Eagle U.S. Value Fund | |
Class A | | | 5.00 | | | | 1,000.00 | | | | 1,018.89 | | | | 1.19 | | | | 5.96 | | |
Class C | | | 5.00 | | | | 1,000.00 | | | | 1,015.17 | | | | 1.94 | | | | 9.69 | | |
Class I | | | 5.00 | | | | 1,000.00 | | | | 1,020.13 | | | | 0.94 | | | | 4.71 | | |
First Eagle Gold Fund Consolidated | |
Class A | | | 5.00 | | | | 1,000.00 | | | | 1,018.74 | | | | 1.22 | | | | 6.11 | | |
Class C | | | 5.00 | | | | 1,000.00 | | | | 1,014.98 | | | | 1.97 | | | | 9.84 | | |
Class I | | | 5.00 | | | | 1,000.00 | | | | 1,019.98 | | | | 0.97 | | | | 4.86 | | |
First Eagle Global Income Builder Fund | |
Class A | | | 5.00 | | | | 1,000.00 | | | | 1,018.40 | | | | 1.29 | | | | 6.46 | | |
Class C | | | 5.00 | | | | 1,000.00 | | | | 1,014.68 | | | | 2.04 | | | | 10.19 | | |
Class I | | | 5.00 | | | | 1,000.00 | | | | 1,019.59 | | | | 1.05 | | | | 5.26 | | |
First Eagle High Yield Fund | |
Class A | | | 5.00 | | | | 1,000.00 | | | | 1,018.89 | | | | 1.19 | | | | 5.96 | | |
Class C | | | 5.00 | | | | 1,000.00 | | | | 1,015.17 | | | | 1.94 | | | | 9.69 | | |
Class I | | | 5.00 | | | | 1,000.00 | | | | 1,020.83 | | | | 0.80 | | | | 4.01 | | |
First Eagle Fund of America | |
Class A | | | 5.00 | | | | 1,000.00 | | | | 1,017.90 | | | | 1.39 | | | | 6.95 | | |
Class C | | | 5.00 | | | | 1,000.00 | | | | 1,014.18 | | | | 2.14 | | | | 10.69 | | |
Class I3 | | | 5.00 | | | | 1,000.00 | | | | 1,005.68 | | | | 1.16 | | | | 1.724 | | |
Class Y | | | 5.00 | | | | 1,000.00 | | | | 1,017.90 | | | | 1.39 | | | | 6.95 | | |
1 For the six-months ended April 30, 2013.
2 Expenses are equal to the annualized expense ratio multiplied by the average account value over the period, multiplied by 181/365 (to reflect the one-half year period).
3 First Eagle Fund of America Class I commenced investment operations on March 8, 2013.
4 Expenses are equal to the annualized expense ratio multiplied by the average account value over the period, multiplied by 54/365 (to reflect the actual days in the period).
FIRST EAGLE FUNDS | SEMI-ANNUAL REPORT | APRIL 30, 2013
201
Quarterly Form N-Q portfolio schedule
The First Eagle Funds file their complete schedule of portfolio holdings with the Securities and Exchange Commission ("SEC") for the first and third quarters of each fiscal year on Form N-Q. The Funds' Forms N-Q are available on the SEC's Web site at www.sec.gov. The Funds' Forms N-Q may be reviewed and copied at the SEC's Public Reference Room in Washington, D.C. Information on the operation of the SEC's Public Reference Room may be obtained by calling 1.800.SEC.0330. Additionally, you may obtain copies of Forms N-Q from the Funds upon request by calling 1.800.334.2143.
Proxy voting policies, procedures and record
You may obtain a description of the Funds' (1) proxy voting policies, (2) proxy voting procedures and (3) information regarding how the Funds voted any proxies related to portfolio securities during the most recent twelve-month period ended June 30 for which an SEC filing has been made, without charge, upon request by contacting the Funds directly at 1.800.334.2143 or on the EDGAR Database on the SEC's Web site at www.sec.gov.
FIRST EAGLE FUNDS | SEMI-ANNUAL REPORT | APRIL 30, 2013
202
Consideration of Investment Advisory Agreements
On December 22, 1999, the shareholders of the Global Fund, the Overseas Fund and the Gold Fund, and on August 31, 2001, the shareholders of the U.S. Value Fund approved the Advisory Agreement between the Trust and the Adviser applicable to those Funds. On December 10, 2002, the shareholders of the Fund of America approved the Advisory Agreement between the Trust and the Adviser applicable to that Fund. These various agreements are referred to in this discussion as the "Advisory Agreements." The Board of Trustees approved the Advisory Agreements most recently on December 13, 2012.
During the course of their most recent review, the Trustees covered the following, among other topics:
• The Trustees reviewed each Fund's long-standing historical relationship with the Adviser and the institutional resources available to the Adviser.
• The Trustees reviewed the performance of each Fund on both an absolute and a relative basis. Significant outperformance (over most periods reviewed) was noted for all Funds relative to the Funds' benchmarks, to the performance of peer mutual funds and to Morningstar, Lipper and similar composites. The relative results of a number of the Funds (Global Fund, Overseas Fund, U.S. Value, and Fund of America) were noted as being at or near the top of their peer groups for various periods. The Trustees commented on (and management discussed) Overseas Fund's and U.S. Value Fund's less favorable one-year relative performance results. Performance for each Fund was determined to be excellent given its returns relative to benchmarks and peers, with a focus in reaching that determination on longer-term results for Overseas Fund and U.S. Value Fund.
• The Trustees reviewed the total compensation to be received by the Adviser and the Funds' total cost for using the Adviser's services, taking into account expenses incurred by the Adviser that are passed through to the Funds. They concluded that this compensation was commensurate with the nature, extent, and quality of the services provided and therefore reasonable under the circumstances. As part of their analysis, the Trustees considered competitive prices for services comparable to those provided by the Adviser. In doing so, they considered fees charged by investment advisers to peer mutual funds and determined that the Adviser's fees were competitive, as each Fund's net management fee, except that of the Fund of America, was generally similar to or lower than its reviewed peer group average and peer group median. After noting that Fund of America's net management fee was higher than its
FIRST EAGLE FUNDS | SEMI-ANNUAL REPORT | APRIL 30, 2013
203
Consideration of Investment Advisory Agreements (continued)
reviewed peer group average and peer group median, the Trustees determined that the fee was justified by the superior service record, consistent long-term performance, and management team stability achieved. The Trustees also reviewed and approved a proposal from the Adviser to implement "breakpoints" providing for potential reductions in the Fund of America management fee over time. (A "breakpoint" refers to a reduction in the fee that is realized at a specified asset level.) The Trustees also considered the advisory fees charged to institutional clients of the Adviser, taking into consideration, among other things, the differing requirements of such clients. While analyzing the effects of indirect compensation to the Adviser, such as soft dollar and other service benefits, the Trustees considered the levels of soft dollars and absence of affiliated broker-dealer relationships.
• The Trustees reviewed the Funds' expense ratios, which were deemed reasonable both on an absolute basis and in comparison to peer funds. The Trustees discussed the impact of the advisory fee on the ratio of total expenses to total assets and noted that the Funds' expense ratios generally had decreased over time as the Funds grew, highlighting a benefit to shareholders resulting from the development of economies of scale in the operation of the Funds. The Trustees noted that expense ratios for most of the Funds had increased modestly relative to the prior year and reviewed the causes of those increases. The Trustees also considered the effect on expense ratios of Fund asset size and of particular categories of expenses, both currently and relative to prior periods. For example, increasing Fund assets in the prior year was a contributor to a falling expense ratio for U.S. Value Fund while decreasing Fund assets in the prior year was a contributor to a rising expense ratio for Gold Fund. Also for example, several of the Funds experienced increased transfer agency fees as their number of shareholder accounts increased relative to the size of the Funds. The Trustees again noted new breakpoints providing for potential reductions in the Fund of America management fee over time.
• The Trustees reviewed the Adviser's financial condition and profitability. They commented that profits appear healthy and that the Adviser has always shown the willingness to commit resources to support investment in the business. The Trustees noted the effect of particular categories of expenses, including compensation, on the Adviser's financial condition.
FIRST EAGLE FUNDS | SEMI-ANNUAL REPORT | APRIL 30, 2013
204
At the conclusion of their review, with no single factor being determinative, the Trustees determined that the Advisory Agreements serve the interests of the Funds and their shareholders and should be continued.
It separately was noted that the advisory agreements for High Yield Fund and Global Income Builder Fund were not being reviewed at this time, as they were within the period covered by their at-launch review by the Trustees. Review of those two agreements was not expected until the December 2013 meeting of the Trustees.
FIRST EAGLE FUNDS | SEMI-ANNUAL REPORT | APRIL 30, 2013
205
Trustees
Lisa Anderson
John P. Arnhold
Candace K. Beinecke (Chair)
Jean-Marie Eveillard
Jean D. Hamilton
James E. Jordan
William M. Kelly
Paul J. Lawler
Officers
John P. Arnhold
President
Robert Bruno
Senior Vice President
Joseph T. Malone
Chief Financial Officer
Mark D. Goldstein
Chief Compliance Officer
Suzan J. Afifi
Secretary & Vice President
Philip Santopadre
Treasurer
Michael Luzzatto
Vice President
Meng Lam
Assistant Treasurer
Investment Adviser
First Eagle Investment Management, LLC
1345 Avenue of the Americas
New York, NY 10105
Legal Counsel
Shearman & Sterling LLP
599 Lexington Avenue
New York, NY 10022
Custodian
State Street Bank and Trust Company
801 Pennsylvania Avenue
Kansas City, MO 64105
Shareholder Servicing Agent
DST Systems, Inc.
330 West 9th Street
Kansas City, MO 64105
800.334.2143
Underwriter
FEF Distributors, LLC
1345 Avenue of the Americas
New York, NY 10105
Independent Registered
Public Accounting Firm
PricewaterhouseCoopers LLP
300 Madison Avenue
New York, NY 10017
This report is not authorized for distribution to prospective investors unless preceded or accompanied by a currently effective prospectus of First Eagle Funds.
FIRST EAGLE FUNDS | SEMI-ANNUAL REPORT | APRIL 30, 2013
206
This page was intentionally left blank.
This page was intentionally left blank.
This page was intentionally left blank.
This page was intentionally left blank.
1345 Avenue of the Americas | New York, NY | 10105
800.334.2143 | firsteaglefunds.com

Item 2. Code of Ethics.
The Registrant has adopted a code of ethics that applies to its principal executive officer and principal financial officer. Copies of the code of ethics may be requested free of charge by calling 1-800-334-2143 (toll free).
Item 3. Audit Committee Financial Expert.
Not applicable to this semi-annual report.
Item 4. Principal Accountant Fees and Services
Not applicable to this semi-annual report.
Item 5. Audit Committee of Listed Registrants
Not applicable at this time.
Item 6. Schedule of Investments.
Please see schedule of investments contained in the Report to Stockholders included under Item 1 of this Form N-CSR.
Item 7. Disclosure of Proxy Voting Policies and Procedures for Closed-End Management Investment Companies.
Not applicable at this time.
Item 8. Portfolio Managers of Closed-End Management Investment Companies.
Not applicable at this time.
Item 9. Purchases of Equity Securities by Close-End Management Investment Company and Affiliated Purchasers.
Not applicable at this time.
Item 10. Submission of Matters to a Vote of Security Holders.
Not applicable at this time.
Item 11. Controls and Procedures.
(a) In the opinion of the principal executive officer and principal financial officer, based on their evaluation, the registrant’s disclosure controls and procedures are adequately designed and are operating effectively to ensure (i) that material information relating to the registrant, including its consolidated subsidiaries, is made known to them by others within those entities, particularly during the period in which this report is being prepared; and (ii) that information required to be disclosed by the registrant on Form N-CSR is recorded, processed, summarized and reported within the time periods specified in the Securities and Exchange Commission’s rules and forms.
(b) There were no changes in the registrant’s internal control over financial reporting that occurred during the registrant’s most recent fiscal half-year (the registrant’s second fiscal half-year in the case of an annual report) that have materially affected or are reasonably likely to materially affect, the registrant’s internal control over financial reporting.
Item 12. Exhibits.
(a)(1) Not applicable to this semi-annual report.
(a)(2) Certifications pursuant to Rule 30a-2(a) under the Investment Company Act of 1940 (17 CFR 270.30a-2(a)): Attached hereto.
(a)(3) Not applicable.
(b) Certification pursuant to Rule 30a-2(b) under the Investment Company Act of 1940 (17 CFR 270.30a-2(b)): Attached hereto.
SIGNATURES
Pursuant to the requirements of the Securities Exchange Act of 1934 and the Investment Company Act of 1940, the registrant has duly caused this report to be signed on its behalf by the undersigned, thereunto duly authorized.
(Registrant) | First Eagle Funds |
| |
By (Signature and Title)* | /s/ John P. Arnhold |
| |
| John P. Arnhold, President |
Date: July 2, 2013
Pursuant to the requirements of the Securities Exchange Act of 1934 and the Investment Company Act of 1940, this report has been signed below by the following persons on behalf of the registrant and in the capacities and on the dates indicated.
By (Signature and Title)* | /s/ John P. Arnhold |
| |
| John P. Arnhold, Principal Executive Officer |
Date: July 2, 2013
By (Signature and Title)* | /s/ Joseph T. Malone |
| |
| Joseph T. Malone, Principal Financial Officer |
Date: July 2, 2013
* Print the name and title of each signing officer under his or her signature.