UNITED STATES
SECURITIES AND EXCHANGE COMMISSION
Washington, D.C. 20549
FORM N-CSR
CERTIFIED SHAREHOLDER REPORT OF REGISTERED
MANAGEMENT INVESTMENT COMPANIES
Investment Company Act file number | 811-7762 |
|
First Eagle Funds |
(Exact name of registrant as specified in charter) |
|
1345 Avenue of the Americas New York, NY | | 10105 |
(Address of principal executive offices) | | (Zip code) |
|
Robert Bruno First Eagle Funds 1345 Avenue of the Americas New York, NY 10105 |
(Name and address of agent for service) |
|
Registrant’s telephone number, including area code: | 1-212-632-2700 | |
|
Date of fiscal year end: | October 31 | |
|
Date of reporting period: | April 30, 2012 | |
| | | | | | | | |
Form N-CSR is to be used by management investment companies to file reports with the Commission not later than 10 days after the transmission to stockholders of any report that is required to be transmitted to stockholders under Rule 30e-1 under the Investment Company Act of 1940 (17 CFR 270.30e-1). The Commission may use the information provided on Form N-CSR in its regulatory, disclosure review, inspection, and policymaking roles.
A registrant is required to disclose the information specified by Form N-CSR, and the Commission will make this information public. A registrant is not required to respond to the collection of information contained in Form N-CSR unless the Form displays a currently valid Office of Management and Budget (“OMB”) control number. Please direct comments concerning the accuracy of the information collection burden estimate and any suggestions for reducing the burden to Secretary, Securities and Exchange Commission, 450 Fifth Street, NW, Washington, DC 20549-0609. The OMB has reviewed this collection of information under the clearance requirements of 44 U.S.C. § 3507.
Semi-Annual Report
APRIL 30, 2012
Global Fund
Overseas Fund
U.S. Value Fund
Gold Fund
High Yield Fund
Fund of America
ADVISED BY FIRST EAGLE INVESTMENT MANAGEMENT, LLC

Forward-Looking Statement Disclosure
One of our most important responsibilities as mutual fund managers is to communicate with shareholders in an open and direct manner. Some of our comments in our letters to shareholders are based on current management expectations and are considered "forward-looking statements". Actual future results, however, may prove to be different from our expectations. You can identify forward-looking statements by words such as "may", "will", "believe", "attempt", "seem", "think", "ought", "try" and other similar terms. We cannot promise future returns. Our opinions are a reflection of our best judgment at the time this report is compiled, and we disclaim any obligation to update or alter forward-looking statements as a result of new information, future events, or otherwise.
Table of Contents
| Letter from the President | | | 4 | | |
|
| Letter from the Global Value Team Portfolio Managers | | | 6 | | |
|
Management's Discussion of Fund Performance: First Eagle Global,
Overseas, U.S. Value and Gold Funds | | | 11 | | |
|
| Performance Chart | | | 15 | | |
|
| First Eagle Global Fund: | |
|
| Fund Overview | | | 20 | | |
|
| Schedule of Investments | | | 22 | | |
|
| First Eagle Overseas Fund: | |
|
| Fund Overview | | | 46 | | |
|
| Schedule of Investments | | | 48 | | |
|
| First Eagle U.S. Value Fund: | |
|
| Fund Overview | | | 64 | | |
|
| Schedule of Investments | | | 66 | | |
|
| First Eagle Gold Fund: | |
|
| Fund Overview | | | 78 | | |
|
| Consolidated Schedule of Investments | | | 80 | | |
|
| First Eagle High Yield Fund: | |
|
| Letter from the High Yield Team Portfolio Managers | | | 86 | | |
|
| Management's Discussion of Fund Performance | | | 88 | | |
|
| Fund Overview | | | 92 | | |
|
| Schedule of Investments | | | 94 | | |
|
| First Eagle Fund of America: | |
|
| Management's Discussion of Fund Performance | | | 102 | | |
|
| Fund Overview | | | 104 | | |
|
| Schedule of Investments | | | 106 | | |
|
| Statements of Assets and Liabilities | | | 114 | | |
|
| Statements of Operations | | | 120 | | |
|
| Statements of Changes in Net Assets | | | 124 | | |
|
| Financial Highlights | | | 128 | | |
|
| Notes to Financial Statements | | | 140 | | |
|
| Fund Expenses | | | 170 | | |
|
| General Information | | | 174 | | |
|
| Consideration of Investment Advisory Agreements | | | 175 | | |
|
Letter from the President

John P. Arnhold
Dear Fellow Shareholders,
Since I last wrote to you in December, financial markets have experienced all the action of a roller coaster but little of the amusement. Equities rallied through March, drifted in April, and then swooned in May. In an environment of ongoing uncertainty, many countries continue to struggle to meet a variety of structural, fiscal, and demographic challenges. Leadership changes in recent and upcoming elections around the world have amplified this uncertainty.
At First Eagle, we recognize that the future is always uncertain and we seek to invest accordingly. Our primary focus remains unchanged: protecting and growing our shareholders' purchasing power over time. We believe the best method of accomplishing this is, first and foremost, attempting to avoid permanent impairments to our shareholders' capital. By targeting quality companies at attractive prices, we seek what we feel is a margin of safety that affords us a measure of downside protection. These concepts are central to the value philosophy of our firm and extend across all of our investment products.
The Global Value Team continues to seek investments in enterprise with the potential to protect and build wealth over time. In this effort, they continue to view cash as a source of deferred purchasing power and gold as a potential hedge against unforeseen events.
This year we celebrate First Eagle Fund of America's 25th anniversary. With Portfolio Manager Harold Levy of Iridian Asset Management at the helm since inception, the Fund maintains a long-term perspective and an impressive track record to match.
In my last letter I mentioned the addition of an investment team dedicated to analyzing high yield credits. We are delighted to welcome Portfolio Managers Edward Meigs and Sean Slein and their seasoned team of analysts to First Eagle Investment Management. The four senior members of the team have worked
FIRST EAGLE FUNDS | SEMI-ANNUAL REPORT | APRIL 30, 2012
4
Letter from the President (continued)
together for almost ten years, through two credit cycles. As with all of our mutual funds, the High Yield Fund's portfolio is built security-by-security through bottom-up fundamental research.
Please be assured that we remain dedicated to our goal of managing your investments in our Funds in the same prudent manner as they have been for over 30 years. Our portfolio managers and many senior executives have substantial investments alongside yours and we are grateful for your continued confidence.
Sincerely,

John P. Arnhold
President
June 2012
Past performance is no guarantee of future results. The portfolios are actively managed. The portfolios and opinions expressed herein are subject to change. All investments involve the risk of loss of principal. High yield securities involve greater risk than higher rated securities and portfolios that invest in them may be subject to greater levels of credit and liquidity risk than portfolios that do not.
FIRST EAGLE FUNDS | SEMI-ANNUAL REPORT | APRIL 30, 2012
5
Letter from the Global Value Team Portfolio Managers
Market Overview
After three years of economic turbulence, the world today feels to many as though it is returning to something closer to a normal state. Equity valuations have improved from distressed to more standard levels. Credit spreads have narrowed from extreme to more customary levels. Cyclical commodity prices look more rational than they were in the depths of the crisis. And business sentiment surveys like the Institute of Supply Management Index, which tracks the changes in the amount of manufacturing activity per month, would suggest that the dark days of 2008 are behind us.
Despite this evidence, however, we believe that we are experiencing what might be described as a collision of macroeconomic tectonic plates. One example of this disequilibrium is the shifting economic relationship between the U.S. and China. Back in 2000, the United States was the uncontested prime mover in the world economy; it was the dominant source of savings and investment activity in the world, generating approximately $1.8 trillion in gross national savings, or about 25% of global gross savings. At that time China was a distant player generating around $440 billion of gross national savings.1
Looking at the same numbers in 2011, the U.S. has essentially spent a lost decade in terms of its competitiveness. Gross national savings in 2011 were $1.9 trillion, virtually identical to where they were in 2000 in dollar terms, but this represents only 12% of global savings. On the other hand, China's gross national savings in 2011 is estimated at $3.7 trillion, nearly twice that of the United States and up eightfold since 2000.1
This reflects what we percieve to be a massive sea change in the competitive structure of the world economy — a change which can create enormous social tensions that may drag on for a generation. From a policy standpoint, there is no silver bullet. The only approach to solving an issue of this nature is realism, reinvention and even, in some cases, relocation of human capital. Governments can experiment with monetary policy to force nominal income growth on the economy, or with fiscal policy aimed at transferring income and sustaining demand, but neither action will address the root cause of a rapidly changing competitive landscape.
If the U.S. tries to avoid deflation by using accommodative policy to force nominal GDP growth, the countries on the other side of the exchange rate misalignment — specifically China and the Middle East — may ultimately experience unusually high inflation if they continue to peg their currencies to
1International Monetary Fund, World Economic Outlook Database, April 2012
FIRST EAGLE FUNDS | SEMI-ANNUAL REPORT | APRIL 30, 2012
6

From left to right: Matthew McLennan, Abhay Deshpande, T. Kimball Brooker, Jr., Rachel Benepe and Matt Lamphier
the dollar. What impact could this have on social stability in those regions? Can we even identify the key political players who will be tasked with managing these complex issues in the U.S., China, the Middle East and beyond in 2013?
Sometimes a policy attempt to immunize against social unrest in one location can cause it to spread elsewhere. Consider that the problems in Europe today are not dissimilar to the savings and investment imbalance between China and the U.S. After a decade of wage moderation, Germany has become quite competitive, running a large trade surplus compared to its peripheral neighbors who run deficits. And just as the U.S.'s desire to avoid deflation could lead to an inflationary outcome in China and the Middle East, Germany's desire to retain its fiscal prudence requires the members of the European Union to adopt a deflationary stance should their currencies remain intertwined as the Euro.
We do not yet know what the new sociopolitical-economic equilibrium will be in the next generation or what consequences policy reforms might have. All we do know is that the future remains uncertain.
Portfolio Overview
In the context of this global tectonic shift, how do we position our portfolios?
We believe that maintaining a clear goal is the most important navigational tool. At First Eagle, our goal is to attempt to preserve and grow real purchasing power, first and foremost by trying to avoid the permanent impairment of capital. We do this by investing in companies one security at a time, with what we feel is an appropriate margin of safety in price, capital structure and management temperament. In selecting these securities, we seek to identify some form of scarcity — as opposed to following the popular market trends of the day. In our view, one of the most disturbing characteristics of the investment landscape is the widespread adoption of thematic investing, where people feel the need to be heavily invested in broad sectors or geographic regions offering the promise of macro growth.
A significant portion of our portfolios is invested in equity securities that we believe embody some element of scarcity — be it a real asset, an intangible asset, or a discount to our estimate of intrinsic value — that we believe can help us
FIRST EAGLE FUNDS | SEMI-ANNUAL REPORT | APRIL 30, 2012
7
Letter from the Global Value Team Portfolio Managers (continued)
achieve our goal of seeking long-term growth of capital on behalf of our shareholders. The volatility of equities as an asset class allows us to identify scarcity and then invest when stocks trade at what we consider to be the right price.
One way that scarcity may exist is in the form of a business owning supplyconstrained real assets. If we can buy into a timberland when the acreage available for timberlands is shrinking across time, or if we can buy into a long-lived conventional oilfield at a time when the marginal barrel of oil is being extracted at a higher cost in an unconventional oilfield, we will. We seek to purchase such equities when we feel they are trading at a material discount to the liquidation value of those reserves. Weyerhaeuser Company in timberlands and ConocoPhillips in oil are examples of current supply-constrained holdings in our portfolios.
Scarcity may also exist in intangible assets. We define intangible assets as businesses with hard-to-replicate market positions. These are the royalty-like businesses that capture a narrow slice of the world economy. We own a range of securities that have dominant market positions with economies of scale, from Microsoft Corporation in software, to Nestlé SA in food products. We feel these attributes create sustainable competitive advantages that are not easy to replicate.
Finally, scarcity may also exist in price. These opportunities are typically found in "bargain" businesses that don't own a supply-constrained real asset, nor do they have a monopoly-like market position. Instead, these businesses trade at a substantial discount to our view of their intrinsic value. From holding companies like Pargesa Holding SA to heavily discounted Japanese pharmaceuticals such as Astellas Pharma, Inc. and telecom companies such as KDDI Corporation, we hold a variety of securities at what we consider a substantial discount to intrinsic value. This discount may both provide an opportunity for appreciation and help protect the investment against the fault lines in a changing world economy.
We typically maintain some part of our portfolios in cash and cash equivalents, which we are willing to hold as a residual of our disciplined investment approach. Ultimately, our goal is to find good businesses at good prices. However, during periods when we can't find investments at prices we like, we are willing to wait. We believe that we will eventually find opportunities to deploy that cash in windows of market distress. Right now, we have approximately a fifth of our portfolios in cash and short-dated sovereigns. The goal of this strategy is to enable us to both take advantage of opportunities when the market weakens, and to avoid becoming forced sellers of securities we hold in the portfolios at a time when they are undervalued in order to be able to invest in new opportunities.
FIRST EAGLE FUNDS | SEMI-ANNUAL REPORT | APRIL 30, 2012
8
Letter from the Global Value Team Portfolio Managers (continued)
Finally, about 10% of our portfolios are in gold and gold equities. We use gold as a potential hedge — as nature's currency, although volatile, gold may serve as ballast in a world where the man-made financial architecture is fraying at the edges. Going forward, we don't know what will happen to the price of gold. If policies are prudent and productivity continues on its current course, we could see a recovery in the private sector of the world economy, a recovery in real interest rates, or an improvement in the creditworthiness of sovereigns. If this occurs, gold may become less valuable in real terms. The reason we own gold is because we have no assurances that a prudent fiscal path will be taken. Instead, the world's major central banks seem to remain committed to creating money out of thin air through quantitative easing, direct long-term bank lending and other unconventional means.
Amidst all of the global competitive uncertainty, however, we still see some reasons for optimism. We live in an age where good ideas are being generated in abundance, and can be transmitted around the globe in a fraction of a second. The most important asset in the global economy is intangible human capital. This provides some shield against the severe scenarios of doomsayers, and keeps us focused on meeting our investment objective of seeking long-term growth of capital on behalf of our shareholders.
We appreciate your confidence and thank you for your support.
Sincerely,
 | |  | |
|
| Matthew McLennan | | T. Kimball Brooker, Jr. | |
|
Head of the Global Value Team
Portfolio Manager | | Portfolio Manager | |
|

Abhay Deshpande
Portfolio Manager
June 2012
FIRST EAGLE FUNDS | SEMI-ANNUAL REPORT | APRIL 30, 2012
9
Letter from the Global Value Team Portfolio Managers (continued)
1Source: Factset and MSCI
The performance data quoted herein represents past performance and does not guarantee future results. Market volatility can dramatically impact the fund's short-term performance. Current performance may be lower or higher than figures shown. The investment return and principal value will fluctuate so that an investor's shares, when redeemed, may be worth more or less than their original cost. Past performance data through the most recent month end is available at firsteaglefunds.com or by calling 800.334.2143. The average annual returns for Class A Shares "with sales charge" of First Eagle Global, Overseas, U.S. Value and Gold Funds give effect to the deduction of the maximum sales charge of 5.00%.
There are risks associated with investing in funds that invest in securities of foreign countries, such as erratic market conditions, economic and political instability and fluctuations in currency exchange rates. Investment in gold and gold related investments present certain risks, and returns on gold related investments have traditionally been more volatile than investments in broader equity or debt markets.
The commentary represents the opinion of the Global Value Team Portfolio Managers as of June 2012 and is subject to change based on market and other conditions. The opinions expressed are not necessarily those of the firm. First Eagle Investment Management, LLC (FEIM) became investment adviser to the Global Fund commencing January 1, 2000. These materials are provided for informational purpose only. These opinions are not intended to be a forecast of future events, a guarantee of future results, or investment advice. Any statistics contained herein have been obtained from sources believed to be reliable, but the accuracy of this information cannot be guaranteed. The views expressed herein may change at any time subsequent to the date of issue hereof. The information provided is not to be construed as a recommendation or an offer to buy or sell or the solicitation of an offer to buy or sell any fund or security.
FIRST EAGLE FUNDS | SEMI-ANNUAL REPORT | APRIL 30, 2012
10
Management's Discussion of Fund Performance
In the six months ending April 30, 2012, the MSCI World Index increased 7.5% while in the U.S. the S&P 500 Index increased 12.8%. In Europe, the German DAX Index rose 10.1% while the French CAC 40 Index fell 0.9% during the period. The Nikkei 225 Index increased 5.9% during the six months. Crude oil jumped 12.5% to nearly $105 a barrel, and the price of gold fell 2.9% to $1,665 an ounce on April 30th. The U.S. Dollar gained 2.1% against the Japanese Yen and it rose 4.7% against the Euro.
First Eagle Global Fund
The net asset value ("NAV") of the Fund's Class A shares increased 5.6% for the six-month period while the MSCI World Index rose 7.5%. The Fund's cash position increased from 13.1% at the end of October to 18.0% on April 30, 2012.
The five largest contributors to the performance of First Eagle Global Fund over the period were Cintas Corporation (uniform rentals, U.S.), Comcast Corporation (cable, U.S.), Shimano, Inc. (bicycle parts, Japan), Microsoft Corporation (software, U.S.) and BB&T Corporation (banks, U.S.), collectively accounting for 1.8% of this period's performance.
The five largest detractors were Gold Fields Limited (mining, South Africa), Bouygues SA (diversified industrials, France), Newcrest Mining Limited (mining, Australia), Gold bullion (commodity, U.S.) and Pargesa Holding SA (holding company, Switzerland). Their combined negative performance over the six months subtracted 1.0% from the Fund's performance.
As of April 30, 2012, the Fund was approximately 40% hedged versus the Japanese Yen and 35% hedged versus the Euro.
First Eagle Overseas Fund
The NAV of the Fund's Class A shares rose 2.8% for the six-month period while the MSCI EAFE Index increased 2.4%. The Fund's cash position increased from 11.1% at the end of October to 14.2% on April 30, 2012.
The five largest contributors to the performance of First Eagle Overseas Fund over the period were Shimano, Inc. (bicycle parts, Japan), HeidelbergCement AG (cement, Germany), Thai Beverage PCL (beverages, Thailand), Bangkok Bank PCL (banks, Thailand) and TNT Express NV (postal services, Netherlands), collectively accounting for 1.9% of this period's performance.
FIRST EAGLE FUNDS | SEMI-ANNUAL REPORT | APRIL 30, 2012
11
Management's Discussion of Fund Performance (continued)
The five largest detractors were Gold Fields Limited (mining, South Africa), Bouygues SA (diversified industrials, France), Pargesa Holding SA (holding company, Switzerland), Gold bullion (commodity, U.S.) and Société Television Francaise 1 (media, France). Their combined negative performance over the six-month period subtracted 1.3% from the Fund's performance.
As of April 30, 2012, the Fund was approximately 40% hedged versus the Japanese Yen and 35% hedged versus the Euro.
First Eagle U.S. Value Fund
The NAV of the Fund's Class A shares increased 8.0% for the six-month period while the S&P 500 Index rose 12.8%. The Fund's cash position rose from 15.9% at the beginning of the period to 20.3% on April 30, 2012.
The five largest contributors to the performance of First Eagle U.S. Value Fund over the period were Comcast Corporation (cable), Cintas Corporation (uniform rentals), Microsoft Corporation (software), BB&T Corporation (Banks) and Home Depot, Inc. (home improvement), collectively accounting for 3.0% of this period's performance.
The five largest detractors were Newmont Mining Corporation (mining), Newcrest Mining Limited (mining), Gold bullion (commodity), San Juan Basin Royalty Trust (E&P trust) and Gold Fields Limited (mining). Their combined negative performance over the six-month period subtracted 1.2% from the Fund's performance.
First Eagle Gold Fund
The NAV of the Fund's Class A shares fell 16.7% for the six-month period while the FTSE Gold Mines Index declined 22.5%. The Fund's cash position decreased from 5.2% in October to 3.4% on April 30, 2012.
The five largest contributors to the performance of First Eagle Gold Fund over the period were Industrias Peñoles S.A.B. de C.V. (Mexico), Franco-Nevada Corporation (Canada), Agnico-Eagle Mines Limited (Canada), European Goldfields Limited (Canada) and Anglo American PLC (United Kingdom), collectively accounting for 0.8% of this period's performance.
FIRST EAGLE FUNDS | SEMI-ANNUAL REPORT | APRIL 30, 2012
12
First Eagle Global, Overseas, U.S. Value and Gold Funds
The five largest detractors were IAMGOLD Corporation (Canada), Kinross Gold Corporation (Canada), Newmont Mining Corporation (U.S.), Newcrest Mining Limited (Australia) and AngloGold Ashanti Limited (South Africa). They collectively subtracted 7.4% from the Fund's performance over the six-month period.
We view gold as a hedge against "extreme outcomes," which might include such things as inflation, deflation or outright currency debasement. While we may view any of these outcomes as low probability, we believe gold can at least partially protect a portfolio against potential negative developments that these events could cause. Currently, we see the "fiat currency" system facing a number of challenges. The status of the U.S. Dollar as the world's reserve currency is suspect, the EU is facing major issues and the Euro is facing its most critical challenge in its 10-year history, and the yen also lacks appeal. Gold is currently playing the role of a substitute currency.
As always, we appreciate your confidence and thank you for your support.
 | |  | |
|
| Matthew McLennan | | Abhay Deshpande | |
|
Head of the Global Value Team
Portfolio Manager
Global, Overseas
and U.S. Value Funds | | Portfolio Manager
Global, Overseas
and U.S. Value Funds
| |
|
 | |  | |
|
| Kimball Brooker, Jr. | | Rachel Benepe | |
|
Portfolio Manager
Global, Overseas and U.S. Value Funds | | Portfolio Manager
Gold Fund | |
|
June 2012
FIRST EAGLE FUNDS | SEMI-ANNUAL REPORT | APRIL 30, 2012
13
Management's Discussion of Fund Performance (continued)
Past performance is no guarantee of future results. The portfolios are actively managed. Current and future portfolio holdings are subject to risk.
There are risks associated with investing in funds that invest in securities of foreign countries, such as erratic market conditions, economic and political instability and fluctuations in currency exchange rates. Funds whose investments are concentrated in a specific industry or sector may be subject to a higher degree of risk than funds whose investments are diversified and may not be suitable for all investors. Hedging can reduce exposure to currency exchange movements, but cannot eliminate that exposure. It is possible to lose money under a hedge. Results from hedging transactions, which for the Funds are primarily currency forward contracts, are further described in the financial statements that follow this commentary.
The commentary represents the opinion of the Global Value Team Portfolio Managers as of June 2012 and is subject to change based on market and other conditions. These materials are provided for informational purposes only. These opinions are not intended to be a forecast of future events, a guarantee of future results, or investment advice. The views expressed herein may change at any time subsequent of the date of issue hereof. The information provided is not to be construed as a recommendation or an offer to buy or sell or the solicitation of an offer to buy or sell any fund or security.
Investment in gold and gold related investments present certain risks, including political and economic risks affecting the price of gold and other precious metals like changes in U.S. or foreign tax, currency or mining laws, increased environmental costs, international monetary and political policies, economic conditions within an individual country, trade imbalances, and trade or currency restrictions between countries. The price of gold, in turn, is likely to affect the market prices of securities of companies mining or processing gold, and accordingly, the value of investments in such securities may also be affected. Gold related investments as a group have not performed as well as the stock market in general during periods when the U.S. dollar is strong, inflation is low and general economic conditions are stable. In addition, returns on gold related investments have traditionally been more volatile than investments in broader equity or debt markets.
FIRST EAGLE FUNDS | SEMI-ANNUAL REPORT | APRIL 30, 2012
14
Performance Chart1 (unaudited) Average Annual Returns as of April 30, 2012
| | | ONE-YEAR | | THREE-YEARS | | FIVE-YEARS | | TEN-YEARS | | SINCE
INCEPTION | | INCEPTION
DATE | |
| First Eagle Global Fund | |
| Class A (SGENX) | |
| without sales charge | | | -0.16 | % | | | 15.90 | % | | | 4.91 | % | | | 11.59 | % | | | 14.19 | % | | 01/01/792 | |
| with sales charge | | | -5.15 | | | | 13.93 | | | | 3.84 | | | | 11.02 | | | | 14.06 | | | 01/01/792 | |
| Class C (FESGX) | | | -1.87 | | | | 15.03 | | | | 4.12 | | | | 10.76 | | | | 11.49 | | | 06/05/00 | |
| Class I (SGIIX) | | | 0.09 | | | | 16.18 | | | | 5.17 | | | | 11.88 | | | | 12.03 | | | 07/31/98 | |
| MSCI World Index3 | | | -4.63 | | | | 15.61 | | | | -1.78 | | | | 4.96 | | | | 9.53 | | | 01/01/79 | |
| First Eagle Overseas Fund | |
| Class A (SGOVX) | |
| without sales charge | | | -4.66 | % | | | 14.87 | % | | | 2.99 | % | | | 11.80 | % | | | 11.89 | % | | 08/31/93 | |
| with sales charge | | | -9.42 | | | | 12.92 | | | | 1.94 | | | | 11.23 | | | | 11.66 | | | 08/31/93 | |
| Class C (FESOX) | | | -6.26 | | | | 14.02 | | | | 2.21 | | | | 10.97 | | | | 11.13 | | | 06/05/00 | |
| Class I (SGOIX) | | | -4.42 | | | | 15.16 | | | | 3.24 | | | | 12.08 | | | | 12.26 | | | 07/31/98 | |
| MSCI EAFE Index4 | | | -12.82 | | | | 11.78 | | | | -4.72 | | | | 5.42 | | | | 4.43 | | | 08/31/93 | |
| First Eagle U.S. Value Fund | |
| Class A (FEVAX) | |
| without sales charge | | | 4.84 | % | | | 15.03 | % | | | 5.16 | % | | | 8.00 | % | | | 9.46 | % | | 09/04/01 | |
| with sales charge | | | -0.41 | | | | 13.09 | | | | 4.09 | | | | 7.44 | | | | 8.94 | | | 09/04/01 | |
| Class C (FEVCX) | | | 3.10 | | | | 14.19 | | | | 4.37 | | | | 7.18 | | | | 8.65 | | | 09/04/01 | |
| Class I (FEVIX) | | | 5.13 | | | | 15.33 | | | | 5.42 | | | | 8.25 | | | | 9.73 | | | 09/04/01 | |
Standard & Poor's
500 Index5 | | | 4.76 | | | | 19.46 | | | | 1.01 | | | | 4.71 | | | | 3.99 | | | 09/04/01 | |
| First Eagle Gold Fund | |
| Class A (SGGDX) | |
| without sales charge | | | -21.20 | % | | | 15.27 | % | | | 9.99 | % | | | 15.63 | % | | | 9.66 | % | | 08/31/93 | |
| with sales charge | | | -25.14 | | | | 13.32 | | | | 8.87 | | | | 15.04 | | | | 9.43 | | | 08/31/93 | |
| Class C (FEGOX) | | | -22.53 | | | | 14.39 | | | | 9.17 | | | | — | | | | 14.07 | | | 05/15/03 | |
| Class I (FEGIX) | | | -21.01 | | | | 15.53 | | | | 10.25 | | | | — | | | | 15.20 | | | 05/15/03 | |
| FTSE Gold Mines Index6 | | | -26.85 | | | | 9.00 | | | | 4.81 | | | | 8.96 | | | | 2.39 | | | 08/31/93 | |
| MSCI World Index3 | | | -4.63 | | | | 15.61 | | | | -1.78 | | | | 4.96 | | | | 5.93 | | | 08/31/93 | |
Please see the following pages for important notes to this table.
FIRST EAGLE FUNDS | SEMI-ANNUAL REPORT | APRIL 30, 2012
15
Performance Chart1 (unaudited) (continued)
| | | ONE-YEAR | | THREE-YEARS | | FIVE-YEARS | | TEN-YEARS | | SINCE
INCEPTION | | INCEPTION
DATE | |
| First Eagle High Yield | |
| Class A (FEHAX) | |
| without sales charge | | | — | | | | — | | | | — | | | | — | | | | 5.86 | % | | 01/03/12 | |
| with sales charge | | | — | | | | — | | | | — | | | | — | | | | 1.13 | | | 01/03/12 | |
| Class C (FEHCX) | | | — | | | | — | | | | — | | | | — | | | | 5.47 | | | 01/03/12 | |
| Class I (FEHIX) | | | 4.86 | % | | | 21.63 | % | | | — | | | | — | | | | 13.33 | | | 11/19/077 | |
Barclays Capital U.S.
Corporate High Yield
Index8 | | | 5.92 | | | | 19.65 | | | | — | | | | — | | | | 9.79 | | | 11/19/07 | |
| First Eagle Fund of America | |
| Class A (FEFAX) | |
| without sales charge | | | 1.48 | % | | | 19.25 | % | | | 4.12 | % | | | 7.73 | % | | | 7.82 | % | | 11/20/98 | |
| with sales charge | | | -3.60 | | | | 17.24 | | | | 3.05 | | | | 7.17 | | | | 7.41 | | | 11/20/98 | |
| Class C (FEAMX) | | | -0.21 | | | | 18.36 | | | | 3.33 | | | | 6.95 | | | | 7.07 | | | 03/02/98 | |
| Class Y (FEAFX)9 | | | 1.45 | | | | 19.26 | | | | 4.10 | | | | 7.75 | | | | 11.85 | | | 04/10/87 | |
Standard & Poor's
500 Index5 | | | 4.76 | | | | 19.46 | | | | 1.01 | | | | 4.71 | | | | 8.90 | | | 04/10/87 | |
1The performance data quoted herein represents past performance and does not guarantee future results. Market volatility can dramatically impact the funds' short-term performance. Current performance may be lower or higher than figures shown. The investment return and principal value will fluctuate so that an investor's shares, when redeemed, may be worth more or less than their original cost. Past performance data through the most recent month end is available at www.firsteaglefunds.com or by calling 800.334.2143. The average annual returns shown on the prior page are historical and reflect changes in share price, reinvested dividends and are net of expenses. The average annual returns for Class A Shares "with sales charge'' of First Eagle Global Fund, First Eagle Overseas Fund, First Eagle U.S. Value Fund, First Eagle Gold Fund, First Eagle High Yield Fund and First Eagle Fund of America give effect to the deduction of the maximum sales charge of 5.00% (4.50% in the case of First Eagle High Yield Fund).
The average annual returns for Class C Shares reflect the CDSC (Contingent Deferred Sales Charge) of 1.00% which pertains to the first year or less of investment only.
*Class I Shares of First Eagle Global Fund, First Eagle Overseas Fund, First Eagle U.S. Value Fund, First Eagle Gold Fund and First Eagle High Yield Fund require $1mm minimum investment and are offered without sales charge.
Please see the following page for important notes to this table.
FIRST EAGLE FUNDS | SEMI-ANNUAL REPORT | APRIL 30, 2012
16
Average Annual Returns as of April 30, 2012
Class Y Shares of First Eagle Fund of America are offered without charge.
2Commencement of management by Jean-Marie Eveillard. Mr. Eveillard transitioned to senior adviser on March 26, 2009, a position he also held from January 2005 to March 2007, and continues to be a member of First Eagle Fund's Board of Trustees and a Senior Vice President of First Eagle Investment Management, LLC. The Fund commenced operation April 28, 1970.
3The MSCI World Index is a widely followed, unmanaged group of stocks from 23 international markets and is not available for purchase. The index provides total returns in U.S. dollars with net dividends reinvested.
4The MSCI EAFE Index is a total return index, reported in U.S. dollars, based on share prices and reinvested net dividends of approximately 1,100 companies from 21 countries and is not available for purchase.
5The Standard & Poor's 500 Index is a widely recognized unmanaged index including a representative sample of 500 leading companies in leading sectors of the U.S. economy and is not available for purchase. Although the Standard & Poor's 500 Index focuses on the large-cap segment of the market, with approximately 75% coverage of U.S. equities, it is also considered a proxy for the total market. The Standard & Poor's 500 Index includes dividends reinvested.
6The FTSE Gold Mines Index is an unmanaged index composed of approximately 19 mining companies and is only available without dividends reinvested and is not available for purchase.
7First Eagle High Yield Fund commenced operations in its present form on December 30, 2011, and is successor to another mutual fund pursuant to a reorganization on December 30, 2011. Information prior to December 30, 2011 is for the Predecessor Fund. Immediately after the reorganization, changes in net asset value of the Class I shares were partially impacted by differences in how the Fund and the Predecessor Fund price portfolio securities.
8The Barclays Capital U.S Corporate High Yield Bond Index is composed of fixed-rate, publicly issued, non-investment grade debt, is unmanaged, with dividends reinvested, and is not available for purchase. The index includes both corporate and non-corporate sectors. The corporate sectors are Industrial, Utility, and Finance, which include both U.S. and non-U.S. corporations. The index is presented here for comparison purposes only. One cannot invest directly in an index.
9As of September 1, 2005 First Eagle Fund of America Class Y is closed to new accounts.
Expense Ratios as stated in the Funds' most recent Prospectuses
Total Annual Gross Operating Expense Ratios
| | | CLASS A | | CLASS C | | CLASS I | | CLASS Y | |
| First Eagle Global Fund | | | 1.13 | % | | | 1.88 | % | | | 0.88 | % | | | — | | |
| First Eagle Overseas Fund | | | 1.14 | | | | 1.89 | | | | 0.89 | | | | — | | |
| First Eagle U.S. Value Fund | | | 1.18 | | | | 1.93 | | | | 0.93 | | | | — | | |
| First Eagle Gold Fund | | | 1.20 | | | | 1.95 | | | | 0.95 | | | | — | | |
| First Eagle Fund of America | | | 1.45 | | | | 2.20 | | | | — | | | | 1.45 | % | |
| First Eagle High Yield Fund** | | | 1.51 | | | | 2.26 | | | | 1.26 | | | | |
FIRST EAGLE FUNDS | SEMI-ANNUAL REPORT | APRIL 30, 2012
17
Performance Chart1 (unaudited) (continued)
**These are the actual fund operating expenses prior to the application of fee waivers and/or expense reimbursements. The Adviser has contractually agreed to limit operating expenses of the Fund to an annual rate of 0.80% for I Shares, 1.25% for A Shares, and 2.00% for C Shares. This limitation excludes certain expenses as described in the Fees and Expenses section of the prospectus. This limitation will continue until 2013 for I Shares, and until 2012 for A and C Shares. The expense limitation may be terminated by the Adviser in future years.
These expense ratios are presented as of October 31, 2011 and may differ from corresponding ratios shown elsewhere in this report because of differing time periods (and/or, if applicable, because these expense ratios do not include expense credits or waivers).
There are risks associated with investing in funds that invest in securities of foreign countries, such as erratic market conditions, economic and political instability and fluctuations in currency exchange rates.
Funds whose investments are concentrated in a specific industry or sector may be subject to a higher degree of risk than funds whose investments are diversified and may not be suitable for all investors.
Investment in gold and gold related investments present certain risks, including political and economic risks affecting the price of gold and other precious metals like changes in U.S. or foreign tax, currency or mining laws, increased environmental costs, international monetary and political policies, economic conditions within an individual country, trade imbalances, and trade or currency restrictions between countries. The price of gold, in turn, is likely to affect the market prices of securities of companies mining or processing gold, and accordingly, the value of investments in such securities may also be affected. Gold related investments as a group have not performed as well as the stock market in general during periods when the U.S. dollar is strong, inflation is low and general economic conditions are stable. In addition, returns on gold related investments have traditionally been more volatile than investments in broader equity or debt markets.
The event-driven investment style used by First Eagle Fund of America carries the additional risk that the event anticipated occurs later than expected, does not occur at all or does not have the desired effect on the market price of the securities.
First Eagle High Yield Fund invests in high yield securities that are non-investment grade. High yield securities are rated lower than investment-grade securities because there is a greater possibility that the issuer may be unable to make interest and principal payments on those securities. High yield securities involve greater risk than higher rated securities and portfolios that invest in them may be subject to greater levels of credit and liquidity risk than portfolios that do not.
FIRST EAGLE FUNDS | SEMI-ANNUAL REPORT | APRIL 30, 2012
18
This page was intentionally left blank.

Fund Overview | Data as of April 30, 2012 (unaudited)
INVESTMENT OBJECTIVE
The First Eagle Global Fund seeks long-term growth of capital by investing in a wide range of asset classes from markets in the United States and throughout the world. This truly global fund is managed with a highly disciplined, bottom-up, value oriented style that helps minimize risk.
| Average Annual Returns | |
| | | ONE-YEAR | | FIVE-YEARS | | TEN-YEARS | |
First Eagle Global
Fund (A Shares) | |
| without sales load | | | -0.16 | % | | | 4.91 | % | | | 11.59 | % | |
| with sales load | | | -5.15 | | | | 3.84 | | | | 11.02 | | |
| MSCI World Index | | | -4.63 | | | | -1.78 | | | | 4.96 | | |
| Consumer Price Index | | | 2.30 | | | | 2.17 | | | | 2.49 | | |
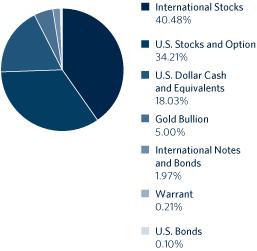
Asset Allocation*
| Countries* | |
| United States | | | 39.52 | % | |
| Japan | | | 17.03 | | |
| France | | | 4.99 | | |
| Germany | | | 2.39 | | |
| Mexico | | | 2.30 | | |
| United Kingdom | | | 2.20 | | |
| Switzerland | | | 2.01 | | |
| Canada | | | 1.65 | | |
| South Korea | | | 1.36 | | |
| Australia | | | 1.06 | | |
| South Africa | | | 0.99 | | |
| Hong Kong | | | 0.94 | | |
| Singapore | | | 0.65 | | |
| Thailand | | | 0.56 | | |
| Belgium | | | 0.55 | | |
| Netherlands | | | 0.47 | | |
| Malaysia | | | 0.47 | | |
| Sweden | | | 0.44 | | |
| Spain | | | 0.41 | | |
| Austria | | | 0.37 | | |
| Italy | | | 0.36 | | |
| Taiwan | | | 0.35 | | |
| Brazil | | | 0.27 | | |
| Bermuda | | | 0.22 | | |
| Ireland | | | 0.22 | | |
| Israel | | | 0.16 | | |
| Norway | | | 0.03 | | |
* Asset Allocation and Countries percentages are based on total investments in the portfolio. Country allocations reflect country of the issuer (not currency of issue) and exclude short term investments and options positions. Bonds of non-U.S. issuers may be U.S. dollar denominated.
The Fund's portfolio composition is subject to change at any time.
FIRST EAGLE FUNDS | SEMI-ANNUAL REPORT | APRIL 30, 2012
20
Global Fund
Growth of a $10,000 Initial Investment
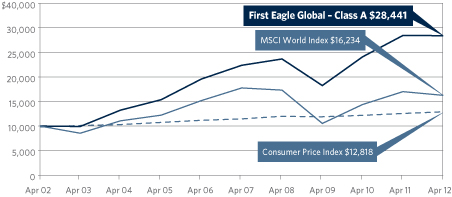
Performance data quoted herein represents past performance and should not be considered indicative of future results. Performance data quoted herein does not reflect the deduction of taxes that a shareholder would pay on Fund distributions or the sale of Fund shares. The average annual returns shown above are historical and reflect changes in share price, reinvested dividends and are net of expenses.
The average annual returns for Class A Shares give effect to the deduction of the maximum sales charge of 5.00%.
The MSCI World Index is a widely followed, unmanaged group of stocks from 23 international markets and is not available for purchase. The index provides total returns in U.S. dollars with net dividends reinvested. The Consumer Price Index (CPI) represents the change in price of all goods and services purchased for consumption by urban households.
| Top 10 Holdings* | |
| Gold Bullion (precious metal) | | | 5.00 | % | |
| Cisco Systems, Inc. (U.S. computer communications company) | | | 1.81 | | |
| Microsoft Corporation (U.S. software developer) | | | 1.59 | | |
| Secom Company Limited (Japanese security services provider) | | | 1.57 | | |
| Comcast Corporation, Class 'A' (U.S. cable/satellite television company) | | | 1.48 | | |
| Cintas Corporation (U.S. uniform designer and manufacturer) | | | 1.46 | | |
| Sysco Corporation (U.S. food services distributor) | | | 1.44 | | |
| Shimano, Inc. (Japanese bicycle parts manufacturer) | | | 1.43 | | |
| Fanuc Corporation (Japanese automated machine tools manufacturer) | | | 1.40 | | |
| American Express Company (U.S. credit card and travel services company) | | | 1.29 | | |
| Total | | | 18.47 | % | |
* Holdings in cash, commercial paper, and money market funds have been excluded. Percentages are based on total net assets.
FIRST EAGLE FUNDS | SEMI-ANNUAL REPORT | APRIL 30, 2012
21
First Eagle Global Fund
| SHARES | | DESCRIPTION | | COST (NOTE 1) | | VALUE (NOTE 1) | |
| Common Stocks — 73.88% | | | |
| U.S. Common Stocks — 34.16% | | | |
| Consumer Discretionary 2.66% | | | |
| | 17,414,912 | | | Comcast Corporation, Class 'A' | | $ | 296,976,000 | | | $ | 519,486,825 | | |
| | 6,208,490 | | | Omnicom Group, Inc. | | | 186,093,077 | | | | 318,557,622 | | |
| | 1,772,900 | | | Home Depot, Inc. | | | 38,798,585 | | | | 91,818,491 | | |
| | 2,485 | | | JG Boswell Company (a) | | | 573,840 | | | | 1,863,750 | | |
| | 184,753 | | | St. John Knits International,
Inc. (a)(b) | | | 3,174,837
| | | | 1,043,854
| | |
| | | | 525,616,339 | | | | 932,770,542 | | |
| Consumer Staples 3.10% | | | |
| | 17,479,577 | | | Sysco Corporation | | | 495,705,689 | | | | 505,159,775 | | |
| | 1,837,950 | | | Lorillard, Inc. | | | 135,716,878 | | | | 248,656,255 | | |
| | 2,132,090 | | | Colgate-Palmolive Company | | | 164,260,763 | | | | 210,948,985 | | |
| | 2,051,045 | | | Wal-Mart Stores, Inc. | | | 101,774,692 | | | | 120,827,061 | | |
| | | | 897,458,022 | | | | 1,085,592,076 | | |
| Energy 1.86% | | | |
| | 5,684,663 | | | ConocoPhillips | | | 292,995,737 | | | | 407,192,411 | | |
| | 1,442,501 | | | Apache Corporation | | | 90,693,920 | | | | 138,393,546 | | |
| | 3,908,035 | | | San Juan Basin Royalty Trust (c) | | | 138,744,050 | | | | 66,202,113 | | |
| | 806,395 | | | Helmerich & Payne, Inc. | | | 17,026,317 | | | | 41,440,639 | | |
| | | | 539,460,024 | | | | 653,228,709 | | |
| Financials 8.85% | | | |
| | 7,529,993 | | | American Express Company | | | 317,870,387 | | | | 453,380,878 | | |
| | 17,571,107 | | | Bank of New York
Mellon Corporation | | | 441,008,506
| | | | 415,556,681
| | |
| | 9,542,046 | | | Cincinnati Financial Corporation (c) | | | 244,508,555 | | | | 339,887,678 | | |
| | 2,714 | | | Berkshire Hathaway, Inc.,
Class 'A' (b) | | | 218,995,900
| | | | 327,851,200
| | |
| | 9,693,682 | | | BB&T Corporation | | | 245,863,323 | | | | 310,585,571 | | |
| | 13,816,985 | | | Weyerhaeuser Company REIT | | | 243,497,569 | | | | 281,313,815 | | |
| | 7,819,459 | | | U.S. Bancorp | | | 192,949,644 | | | | 251,551,996 | | |
| | 5,719,208 | | | Plum Creek Timber Company,
Inc., REIT | | | 212,342,604
| | | | 240,435,504
| | |
| | 4,386,051 | | | WR Berkley Corporation | | | 117,583,057 | | | | 165,178,681 | | |
| | 2,858,553 | | | Rayonier, Inc., REIT | | | 27,837,041 | | | | 129,635,379 | | |
| | 202,406 | | | Mastercard, Inc., Class 'A' | | | 40,702,513 | | | | 91,542,162 | | |
| | 743,437 | | | Visa, Inc., Class 'A' | | | 53,618,674 | | | | 91,427,882 | | |
| | 33,892 | | | Mills Music Trust (a)(c) | | | 1,015,863 | | | | 1,327,719 | | |
| | | | 2,357,793,636 | | | | 3,099,675,146 | | |
See Notes to Financial Statements.
FIRST EAGLE FUNDS | SEMI-ANNUAL REPORT | APRIL 30, 2012
22
Schedule of Investments | Six-Month Period Ended April 30, 2012 (unaudited)
| SHARES | | DESCRIPTION | | COST (NOTE 1) | | VALUE (NOTE 1) | |
| U.S. Common Stocks — 34.16% — (continued) | | | |
| Health Care 0.91% | | | |
| | 3,659,870 | | | WellPoint, Inc. | | $ | 193,780,807 | | | $ | 248,212,384 | | |
| | 1,059,980 | | | Johnson & Johnson | | | 59,610,842 | | | | 68,994,098 | | |
| | | | 253,391,649 | | | | 317,206,482 | | |
| Industrials 4.90% | | | |
| | 13,051,511 | | | Cintas Corporation (c) | | | 438,387,413 | | | | 511,227,686 | | |
| | 4,069,880 | | | 3M Company | | | 315,646,156 | | | | 363,684,477 | | |
| | 3,069,252 | | | Lockheed Martin Corporation | | | 217,057,860 | | | | 277,890,076 | | |
| | 3,867,416 | | | Northrop Grumman Corporation | | | 231,724,655 | | | | 244,730,085 | | |
| | 3,337,753 | | | Alliant Techsystems, Inc. (c) | | | 300,315,627 | | | | 177,902,235 | | |
| | 1,228,236 | | | Unifirst Corporation | | | 26,322,487 | | | | 74,627,619 | | |
| | 4,192,137 | | | Blount International, Inc. (b)(c) | | | 46,116,234 | | | | 67,786,855 | | |
| | | | 1,575,570,432 | | | | 1,717,849,033 | | |
| Information Technology 7.40% | | | |
| | 31,413,268 | | | Cisco Systems, Inc. | | | 527,420,636 | | | | 632,977,350 | | |
| | 17,364,486 | | | Microsoft Corporation | | | 428,582,776 | | | | 556,010,842 | | |
| | 12,418,960 | | | Intel Corporation | | | 210,916,626 | | | | 352,698,464 | | |
| | 8,019,789 | | | Linear Technology Corporation | | | 227,165,656 | | | | 262,327,298 | | |
| | 7,449,311 | | | Oracle Corporation | | | 212,479,421 | | | | 218,935,251 | | |
| | 6,036,580 | | | Texas Instruments, Inc. | | | 154,258,827 | | | | 192,808,365 | | |
| | 258,827 | | | Google, Inc., Class 'A' (b) | | | 135,332,180 | | | | 156,649,865 | | |
| | 2,365,411 | | | Automatic Data Processing, Inc. | | | 85,148,200 | | | | 131,564,160 | | |
| | 1,671,000 | | | KLA-Tencor Corporation (d) | | | 47,230,930 | | | | 87,142,650 | | |
| | | | 2,028,535,252 | | | | 2,591,114,245 | | |
| Materials 2.28% | | | |
| | 4,387,079 | | | Vulcan Materials Company | | | 223,679,544 | | | | 187,810,852 | | |
| | 2,733,820 | | | Ashland, Inc. | | | 142,133,813 | | | | 180,076,723 | | |
| | 1,752,640 | | | Martin Marietta Materials, Inc. | | | 155,134,877 | | | | 145,258,803 | | |
| | 2,384,222 | | | Scotts Miracle-Gro
Company, Class 'A' | | | 103,882,048
| | | | 124,933,233
| | |
| | 1,780,037 | | | Newmont Mining Corporation | | | 45,037,176 | | | | 84,818,763 | | |
| | 1,258,500 | | | Deltic Timber Corporation (c) | | | 62,903,243 | | | | 76,869,180 | | |
| | | | 732,770,701 | | | | 799,767,554 | | |
| Utilities 2.20% | | | |
| | 9,696,381 | | | FirstEnergy Corporation | | | 353,449,107 | | | | 453,984,558 | | |
| | 2,491,660 | | | Entergy Corporation | | | 164,249,120 | | | | 163,353,230 | | |
See Notes to Financial Statements.
FIRST EAGLE FUNDS | SEMI-ANNUAL REPORT | APRIL 30, 2012
23
Global Fund
| SHARES | | DESCRIPTION | | COST (NOTE 1) | | VALUE (NOTE 1) | |
| U.S. Common Stocks — 34.16% — (continued) | | | |
| Utilities 2.20% — (continued) | | | |
| | 3,760,485 | | | IDACorp, Inc. (c) | | $ | 124,066,738 | | | $ | 153,202,159 | | |
| | | | 641,764,965 | | | | 770,539,947 | | |
| Total U.S. Common Stocks | | | 9,552,361,020 | | | | 11,967,743,734 | | |
| International Common Stocks — 39.72% | | | |
| Australia 1.06% | | | |
| | 13,519,473 | | | Newcrest Mining Limited | | | 428,192,580 | | | | 370,424,690 | | |
| Austria 0.37% | | | |
| | 3,857,199 | | | OMV AG | | | 157,989,372 | | | | 130,535,803 | | |
| Belgium 0.55% | | | |
| | 2,788,865 | | | Groupe Bruxelles Lambert SA | | | 234,732,253 | | | | 193,412,086 | | |
| Bermuda 0.22% | | | |
| | 1,583,870 | | | Jardine Matheson Holdings Limited | | | 78,676,125 | | | | 78,639,145 | | |
| Brazil 0.27% | | | |
| | 4,218,336 | | | Petroleo Brasileiro SA, ADR | | | 77,523,745 | | | | 93,478,326 | | |
| Canada 1.60% | | | |
| | 4,588,522 | | | Goldcorp, Inc. | | | 179,943,343 | | | | 175,556,852 | | |
| | 9,423,645 | | | Penn West Petroleum Limited | | | 175,578,987 | | | | 161,521,275 | | |
| | 4,207,036 | | | Cenovus Energy, Inc. | | | 112,423,564 | | | | 152,505,055 | | |
| | 1,655,732 | | | Agnico-Eagle Mines Limited | | | 53,969,366 | | | | 66,152,164 | | |
| | 2,927,036 | | | Postmedia Network Canada
Corporation (a)(b)(e) | | | 18,719,012
| | | | 4,445,455
| | |
| | 29,610 | | | Nexen, Inc. | | | 560,532 | | | | 572,954 | | |
| | | | 541,194,804 | | | | 560,753,755 | | |
| France 4.80% | | | |
| | 4,179,227 | | | Sanofi | | | 323,385,924 | | | | 318,869,189 | | |
| | 3,736,582 | | | Sodexo | | | 100,240,083 | | | | 297,457,075 | | |
| | 9,287,648 | | | Bouygues SA | | | 358,271,606 | | | | 252,188,374 | | |
| | 4,702,249 | | | Total SA | | | 247,298,454 | | | | 224,436,621 | | |
| | 2,044,437 | | | Neopost SA (c) | | | 184,799,958 | | | | 117,504,775 | | |
| | 11,803,362 | | | Société Télévision Francaise 1 (c) | | | 184,371,882 | | | | 114,017,245 | | |
| | 956,044 | | | Guyenne et Gascogne SA (c) | | | 108,257,344 | | | | 102,471,916 | | |
| | 3,733,423 | | | Carrefour SA | | | 230,370,943 | | | | 74,968,333 | | |
| | 921,669 | | | Wendel SA | | | 19,716,342 | | | | 68,931,716 | | |
| | 512,523 | | | Société BIC SA | | | 23,173,120 | | | | 56,432,701 | | |
| | 157,260 | | | Robertet SA (c) | | | 20,623,058 | | | | 24,971,319 | | |
| | 42,252 | | | Robertet SA CI (a)(f)(i) | | | 800,508 | | | | 5,031,897 | | |
See Notes to Financial Statements.
FIRST EAGLE FUNDS | SEMI-ANNUAL REPORT | APRIL 30, 2012
24
Schedule of Investments | Six-Month Period Ended April 30, 2012 (unaudited)
| SHARES | | DESCRIPTION | | COST (NOTE 1) | | VALUE (NOTE 1) | |
| International Common Stocks — 39.72% — (continued) | | | |
| France 4.80% — (continued) | | | |
| | 385,000 | | | Sabeton SA (c) | | $ | 4,841,233 | | | $ | 6,826,648 | | |
| | 104,457 | | | Gaumont SA | | | 6,087,824 | | | | 6,302,957 | | |
| | 12,000,000 | | | FINEL (a)(b)(c)(f)(g)(h) | | | — | | | | 5,716,441 | | |
| | 69,500 | | | NSC Groupe (a)(b)(c) | | | 12,298,421 | | | | 5,517,953 | | |
| | | | 1,824,536,700 | | | | 1,681,645,160 | | |
| Germany 2.01% | | | |
| | 7,345,731 | | | HeidelbergCement AG | | | 415,128,999 | | | | 403,730,159 | | |
| | 4,106,813 | | | Daimler AG | | | 192,484,558 | | | | 226,965,251 | | |
| | 693,440 | | | Fraport AG | | | 20,976,007 | | | | 45,044,719 | | |
| | 773,684 | | | Hornbach Baumarkt AG | | | 21,504,161 | | | | 25,906,689 | | |
| | 28,693 | | | Pfeiffer Vacuum Technology AG | | | 1,800,763 | | | | 3,480,908 | | |
| | | | 651,894,488 | | | | 705,127,726 | | |
| Hong Kong 0.31% | | | |
| | 12,693,580 | | | Guoco Group Limited | | | 115,086,260 | | | | 106,352,500 | | |
| | 20,738,780 | | | City e-Solutions Limited (a)(b)(c) | | | 936,898 | | | | 1,911,347 | | |
| | | | 116,023,158 | | | | 108,263,847 | | |
| Ireland 0.22% | | | |
| | 3,763,310 | | | CRH PLC | | | 62,926,191 | | | | 76,073,249 | | |
| Israel 0.16% | | | |
| | 4,905,210 | | | Israel Chemicals Limited | | | 51,354,915 | | | | 56,292,286 | | |
| Italy 0.35% | | | |
| | 18,139,395 | | | Italcementi S.p.A. RSP | | | 249,186,230 | | | | 55,014,778 | | |
| | 4,682,069 | | | Italcementi S.p.A. | | | 86,201,872 | | | | 29,404,074 | | |
| | 1,734,972 | | | Italmobiliare S.p.A. RSP | | | 121,356,934 | | | | 20,432,638 | | |
| | 1,021,137 | | | Italmobiliare S.p.A. | | | 107,360,738 | | | | 19,335,954 | | |
| | | | 564,105,774 | | | | 124,187,444 | | |
| Japan 17.00% | | | |
| | 11,590,430 | | | Secom Company Limited | | | 528,330,685 | | | | 551,648,722 | | |
| | 7,609,390 | | | Shimano, Inc. (c) | | | 189,904,791 | | | | 501,320,032 | | |
| | 2,888,400 | | | Fanuc Corporation | | | 255,486,281 | | | | 491,650,250 | | |
| | 2,693,956 | | | SMC Corporation | | | 294,992,485 | | | | 452,479,333 | | |
| | 1,876,590 | | | Keyence Corporation | | | 347,482,571 | | | | 445,643,116 | | |
| | 8,977,860 | | | Astellas Pharma, Inc. | | | 362,418,345 | | | | 364,894,235 | | |
| | 55,424 | | | KDDI Corporation | | | 355,586,922 | | | | 364,448,898 | | |
| | 14,917,300 | | | NKSJ Holdings, Inc. | | | 402,645,728 | | | | 309,220,084 | | |
| | 12,811,860 | | | MISUMI Group, Inc. (c) | | | 221,342,849 | | | | 301,361,136 | | |
See Notes to Financial Statements.
FIRST EAGLE FUNDS | SEMI-ANNUAL REPORT | APRIL 30, 2012
25
Global Fund
| SHARES | | DESCRIPTION | | COST (NOTE 1) | | VALUE (NOTE 1) | |
| International Common Stocks — 39.72% — (continued) | | | |
| Japan 17.00% — (continued) | | | |
| | 5,211,900 | | | Ono Pharmaceutical | | $ | 237,044,526 | | | $ | 295,062,475 | | |
| | | | | Company Limited | | | | | | | | | |
| | 13,535,700 | | | MS&AD Insurance Group Holdings | | | 337,272,005 | | | | 251,420,880 | | |
| | 2,318,500 | | | Hirose Electric Company Limited (c) | | | 246,194,572 | | | | 244,220,754 | | |
| | 4,896,260 | | | Canon, Inc. | | | 232,564,293 | | | | 225,066,060 | | |
| | 12,493,780 | | | Mitsubishi Estate Company Limited | | | 189,561,430 | | | | 222,834,954 | | |
| | 8,271,240 | | | Hoya Corporation | | | 179,494,458 | | | | 190,619,759 | | |
| | 4,137,470 | | | Nissin Foods Holdings
Company Limited | | | 147,016,041
| | | | 155,725,167
| | |
| | 6,109,710 | | | THK Company Limited | | | 106,814,295 | | | | 122,745,176 | | |
| | 65,072 | | | NTT DoCoMo, Inc. | | | 99,072,518 | | | | 111,007,094 | | |
| | 1,569,860 | | | Shin-Etsu Chemical
Company Limited | | | 73,766,639
| | | | 91,234,349
| | |
| | 3,526,280 | | | Chofu Seisakusho
Company Limited (c) | | | 64,322,537
| | | | 84,270,319
| | |
| | 5,147,000 | | | T. Hasegawa Company Limited (c) | | | 79,849,658 | | | | 72,976,002 | | |
| | 2,251,494 | | | Meitec Corporation (c) | | | 64,892,626 | | | | 46,417,324 | | |
| | 1,725,100 | | | Ariake Japan Company Limited (c) | | | 29,754,119 | | | | 34,830,426 | | |
| | 2,002,100 | | | Seikagaku Corporation | | | 21,143,745 | | | | 21,515,554 | | |
| | 231,740 | | | Aderans Company Limited (b) | | | 5,260,612 | | | | 2,577,469 | | |
| | | | 5,072,214,731 | | | | 5,955,189,568 | | |
| Malaysia 0.47% | | | |
| | 129,693,980 | | | Genting Malaysia Berhad | | | 112,349,393 | | | | 164,581,918 | | |
| Mexico 2.29% | | | |
| | 15,044,166 | | | Grupo Televisa S.A.B., ADR | | | 289,394,928 | | | | 330,520,327 | | |
| | 6,612,311 | | | Industrias Peñoles S.A.B. de C.V. | | | 7,723,116 | | | | 310,235,235 | | |
| | 6,399,253 | | | Fresnillo PLC | | | 43,883,996 | | | | 162,086,370 | | |
| | | | 341,002,040 | | | | 802,841,932 | | |
| Netherlands 0.47% | | | |
| | 12,052,607 | | | TNT Express NV | | | 143,260,900 | | | | 146,089,306 | | |
| | 4,391,426 | | | PostNL NV | | | 46,252,787 | | | | 19,048,311 | | |
| | | | 189,513,687 | | | | 165,137,617 | | |
| Singapore 0.21% | | | |
| | 10,153,710 | | | Fraser and Neave Limited | | | 8,655,703 | | | | 57,772,665 | | |
| | 13,467,250 | | | ComfortDelgro Corporation Limited | | | 3,279,184 | | | | 16,653,110 | | |
| | | | 11,934,887 | | | | 74,425,775 | | |
See Notes to Financial Statements.
FIRST EAGLE FUNDS | SEMI-ANNUAL REPORT | APRIL 30, 2012
26
Schedule of Investments | Six-Month Period Ended April 30, 2012 (unaudited)
| SHARES | | DESCRIPTION | | COST (NOTE 1) | | VALUE (NOTE 1) | |
| International Common Stocks — 39.72% — (continued) | | | |
| South Africa 0.99% | | | |
| | 20,830,304 | | | Gold Fields Limited, ADR | | $ | 231,208,540 | | | $ | 268,086,012 | | |
| | 8,092,307 | | | Harmony Gold Mining
Company Limited, ADR | | | 69,852,451
| | | | 78,495,378
| | |
| | | | 301,060,991 | | | | 346,581,390 | | |
| South Korea 0.97% | | | |
| | 3,476,566 | | | KT&G Corporation | | | 187,647,559 | | | | 238,718,303 | | |
| | 51,900 | | | Lotte Confectionery
Company Limited | | | 21,157,499
| | | | 78,622,099
| | |
| | 39,989 | | | Namyang Dairy Products
Company Limited (c) | | | 7,325,466
| | | | 22,999,978
| | |
| | | | 216,130,524 | | | | 340,340,380 | | |
| Spain 0.41% | | | |
| | 3,295,234 | | | Red Electrica Corporation SA | | | 165,292,750 | | | | 143,414,179 | | |
| Sweden 0.44% | | | |
| | 5,939,940 | | | Investor AB, Class 'A' | | | 116,378,542 | | | | 116,606,249 | | |
| | 1,803,110 | | | Investor AB, Class 'B' | | | 35,647,923 | | | | 35,932,949 | | |
| | | | 152,026,465 | | | | 152,539,198 | | |
| Switzerland 2.01% | | | |
| | 5,091,560 | | | Nestlé SA | | | 146,056,200 | | | | 311,808,279 | | |
| | 3,783,070 | | | Pargesa Holding SA | | | 237,781,696 | | | | 253,135,260 | | |
| | 27,925 | | | Lindt & Spruengli AG PC | | | 28,106,172 | | | | 91,043,066 | | |
| | 388,803 | | | Kuehne & Nagel International AG | | | 7,503,142 | | | | 47,235,346 | | |
| | | | 419,447,210 | | | | 703,221,951 | | |
| Thailand 0.56% | | | |
| | 30,251,300 | | | Bangkok Bank PCL, NVDR | | | 98,647,613 | | | | 187,902,384 | | |
| | 577,000 | | | OHTL PCL (a) | | | 2,636,472 | | | | 9,006,829 | | |
| | | | 101,284,085 | | | | 196,909,213 | | |
| United Kingdom 1.98% | | | |
| | 9,342,277 | | | Berkeley Group
Holdings PLC (b)(c) | | | 114,104,302
| | | | 194,309,702
| | |
| | 7,387,420 | | | GlaxoSmithKline PLC | | | 140,774,624 | | | | 170,922,908 | | |
| | 3,387,940 | | | Willis Group Holdings PLC | | | 87,537,760 | | | | 123,524,292 | | |
| | 3,052,693 | | | Anglo American PLC | | | 74,109,213 | | | | 117,370,092 | | |
| | 19,378,458 | | | WM Morrison Supermarkets PLC | | | 89,832,350 | | | | 88,287,557 | | |
| | | | 506,358,249 | | | | 694,414,551 | | |
| Total International Common Stocks | | | 12,377,765,117 | | | | 13,918,431,189 | | |
| Total Common Stocks | | | 21,930,126,137 | | | | 25,886,174,923 | | |
See Notes to Financial Statements.
FIRST EAGLE FUNDS | SEMI-ANNUAL REPORT | APRIL 30, 2012
27
Global Fund
| SHARES | | DESCRIPTION | | COST (NOTE 1) | | VALUE (NOTE 1) | |
| Preferred Stocks — 0.69% | | | |
| International Preferred Stocks — 0.69% | | | |
| Germany 0.37% | | | |
| | 1,754,484 | | | Hornbach Holding AG | | $ | 63,837,360 | | | $ | 130,010,790 | | |
| South Korea 0.32% | | | |
| | 154,579 | | | Samsung Electronics
Company Limited | | | 19,335,684
| | | | 110,655,379
| | |
| Total International Preferred Stocks | | | 83,173,044 | | | | 240,666,169 | | |
| Total Preferred Stocks | | | 83,173,044 | | | | 240,666,169 | | |
| Warrant — 0.21% | | | |
| United States — 0.21% | | | |
| | 5,806,899 | | | JPMorgan Chase & Co.
Warrant expire 10/28/18 (b) | | | 75,108,859
| | | | 72,586,237
| | |
| OUNCES | | | | | | | |
| Commodity — 5.00% | | | |
| | 1,051,086 | | | Gold bullion (b) | | | 586,146,006 | | | | 1,751,034,959 | | |
| PRINCIPAL | | | | | | | |
| Notes and Bonds — 2.06% | | | |
| U.S. Corporate Bonds — 0.10% | | | |
| $ | 5,467,000 | | | Bausch & Lomb, Inc.
7.125% due 08/01/28 (a) | | | 4,760,431
| | | | 4,373,600
| | |
| | 5,000,000 | | | Pulte Group, Inc.
5.20% due 02/15/15 | | | 4,581,333
| | | | 5,175,000
| | |
| | 387,000 | | | Yankee Candle Company, Inc. Series 'B'
8.50% due 02/15/15 | | | 384,861
| | | | 397,646
| | |
| | 22,554,000 | | | Yankee Candle Company, Inc. Series 'B'
9.75% due 02/15/17 | | | 22,013,235
| | | | 23,681,700
| | |
| Total U.S. Corporate Bonds | | | 31,739,860 | | | | 33,627,946 | | |
| International Notes and Bonds — 1.96% | | | |
| International Corporate Notes and Bonds — 0.26% | | | |
| Canada 0.05% | | | |
| 28,460,000
USD | | | Catalyst Paper Corporation
11.00% due 12/15/16 (a)(j)(k) | | | 24,518,587
| | | | 15,368,400
| | |
See Notes to Financial Statements.
FIRST EAGLE FUNDS | SEMI-ANNUAL REPORT | APRIL 30, 2012
28
Schedule of Investments | Six-Month Period Ended April 30, 2012 (unaudited)
| PRINCIPAL | | DESCRIPTION | | COST (NOTE 1) | | VALUE (NOTE 1) | |
| International Corporate Notes and Bonds — 0.26% — (continued) | | | |
| France 0.18% | | | |
| 15,000,000
EUR | | | Emin Leydier SA FRN
6.01% due 07/31/16 (a)(f)(g) | | $ | 21,435,024
| | | $ | 19,848,753
| | |
| 12,000,000
EUR | | | FINEL
9.50% due 06/30/17 (a)(f)(g) | | | 14,494,344
| | | | 11,909,251
| | |
| 12,050,000
EUR | | | Wendel SA
4.375% due 08/09/17 | | | 11,809,963
| | | | 14,789,140
| | |
| 10,000,000
EUR | | | Wendel SA
4.875% due 09/21/15 (l) | | | 11,136,766
| | | | 13,232,502
| | |
| 3,500,000
EUR | | | Wendel SA
4.875% due 05/26/16 | | | 2,957,348
| | | | 4,538,748
| | |
| | | | 61,833,445 | | | | 64,318,394 | | |
| Norway 0.03% | | | |
| 5,500,000
USD | | | Den Norske Bank ASA FRN
0.938% due 08/31/12 (a)(m) | | | 3,888,750
| | | | 3,052,500
| | |
| 3,170,000
USD | | | Den Norske Creditbank FRN
0.813% due 05/31/12 (a)(m) | | | 2,059,625
| | | | 1,711,800
| | |
| 3,500,000
USD | | | Den Norske Creditbank FRN
0.963% due 08/31/12 (a)(m) | | | 2,610,000
| | | | 1,942,500
| | |
| 10,000,000
USD | | | Nordea Bank Norge ASA FRN
0.938% due 05/18/12 (a)(m) | | | 6,826,750
| | | | 4,600,000
| | |
| | | | 15,385,125 | | | | 11,306,800 | | |
| Total International Corporate Notes and Bonds | | | 101,737,157 | | | | 90,993,594 | | |
| International Government Bonds — 1.70% | | | |
| Hong Kong 0.63% | | | |
| 371,900,000
HKD | | | Hong Kong Government Bond
0.48% due 09/03/12 | | | 47,992,977
| | | | 47,998,829
| | |
| 732,250,000
HKD | | | Hong Kong Government Bond
2.66% due 12/17/12 | | | 95,885,144
| | | | 95,867,552
| | |
| 586,700,000
HKD | | | Hong Kong Government Bond
4.20% due 09/17/12 | | | 76,826,579
| | | | 76,804,989
| | |
| | | | 220,704,700 | | | | 220,671,370 | | |
| Singapore 0.43% | | | |
| 45,343,000
SGD | | | Singapore Government Bond
2.50% due 10/01/12 | | | 37,263,955
| | | | 36,989,268
| | |
| 141,626,000
SGD | | | Singapore Government Bond
3.50% due 07/01/12 | | | 116,025,005
| | | | 115,066,632
| | |
| | | | 153,288,960 | | | | 152,055,900 | | |
| South Korea 0.07% | | | |
| 25,370,100,000
KRW | | | Inflation Linked Korea Treasury Bond
2.75% due 03/10/17 (n) | | | 24,148,168
| | | | 24,415,212
| | |
See Notes to Financial Statements.
FIRST EAGLE FUNDS | SEMI-ANNUAL REPORT | APRIL 30, 2012
29
Global Fund
| PRINCIPAL | | DESCRIPTION | | COST (NOTE 1) | | VALUE (NOTE 1) | |
| International Government Bonds — 1.70% — (continued) | | | |
| Taiwan 0.35% | | | |
| 1,767,500,000
TWD | | | Taiwan Government Bond
2.00% due 07/20/12 | | $ | 54,562,858
| | | $ | 60,677,198
| | |
| 1,826,000,000
TWD | | | Taiwan Government Bond
2.375% due 01/16/13 | | | 59,349,568
| | | | 63,232,045
| | |
| | | | 113,912,426 | | | | 123,909,243 | | |
| United Kingdom 0.22% | | | |
| 46,790,000
GBP | | | United Kingdom Gilt
5.25% due 06/07/12 | | | 75,199,670
| | | | 76,328,060
| | |
| Total International Government Bonds | | | 587,253,924 | | | | 597,379,785 | | |
| Total International Notes and Bonds | | | 688,991,081 | | | | 688,373,379 | | |
| Total Notes and Bonds | | | 720,730,941 | | | | 722,001,325 | | |
| Commercial Paper — 18.00% | | | |
| International Commercial Paper — 5.77% | | | |
| Belgium 0.13% | | | |
| 20,000,000
USD | | | Anheuser Busch InBev WorldWide, Inc.
0.33% due 05/04/12 | | | 19,999,450
| | | | 19,999,450
| | |
| 25,000,000
USD | | | Anheuser Busch InBev WorldWide, Inc.
0.36% due 05/01/12 | | | 25,000,000
| | | | 25,000,000
| | |
| Canada 0.22% | | | |
| 15,990,000
USD | | | Potash Corporation of Saskatchewan
0.31% due 05/14/12 | | | 15,988,210
| | | | 15,988,210
| | |
| 15,000,000
USD | | | Potash Corporation of Saskatchewan
0.33% due 05/17/12 | | | 14,997,800
| | | | 14,997,800
| | |
| 27,206,000
USD | | | Potash Corporation of Saskatchewan
0.33% due 05/24/12 | | | 27,200,264
| | | | 27,200,264
| | |
| 18,793,000
USD | | | Potash Corporation of Saskatchewan
0.35% due 05/09/12 | | | 18,791,538
| | | | 18,791,538
| | |
| France 1.06% | | | |
| 13,824,000
USD | | | Air Liquide SA
0.19% due 06/29/12 | | | 13,819,695
| | | | 13,819,695
| | |
| 31,094,000
USD | | | EI du Pont de Nemours & Company
0.16% due 06/14/12 | | | 31,087,919
| | | | 31,087,919
| | |
| 13,641,000
USD | | | GDF Suez SA
0.20% due 05/08/12 | | | 13,640,470
| | | | 13,640,470
| | |
| 40,055,000
USD | | | GDF Suez SA
0.21% due 05/23/12 | | | 40,049,860
| | | | 40,049,860
| | |
| 36,918,000
USD | | | GDF Suez SA
0.21% due 05/25/12 | | | 36,912,831
| | | | 36,912,831
| | |
| 25,000,000
USD | | | Sanofi
0.12% due 05/10/12 | | | 24,999,250
| | | | 24,999,250
| | |
See Notes to Financial Statements.
FIRST EAGLE FUNDS | SEMI-ANNUAL REPORT | APRIL 30, 2012
30
Schedule of Investments | Six-Month Period Ended April 30, 2012 (unaudited)
| PRINCIPAL | | DESCRIPTION | | COST (NOTE 1) | | VALUE (NOTE 1) | |
| International Commercial Paper — 5.77% — (continued) | | | |
| France 1.06% — (continued) | | | |
| 130,000,000
USD | | | Sanofi
0.13% due 05/04/12 | | $ | 129,998,592
| | | $ | 129,998,592
| | |
| 25,000,000
USD | | | Sanofi
0.13% due 05/10/12 | | | 24,999,187
| | | | 24,999,187
| | |
| 25,000,000
USD | | | Total SA
0.12% due 05/25/12 | | | 24,998,000
| | | | 24,998,000
| | |
| 30,607,000
USD | | | Total SA
0.16% due 07/10/12 | | | 30,597,478
| | | | 30,585,450
| | |
| Germany 1.23% | | | |
| 50,000,000
USD | | | BASF AG
0.12% due 05/29/12 | | | 49,995,333
| | | | 49,995,333
| | |
| 50,000,000
USD | | | BASF AG
0.12% due 06/25/12 | | | 49,990,833
| | | | 49,990,833
| | |
| 22,900,000
USD | | | BMW
0.18% due 05/30/12 | | | 22,896,679
| | | | 22,896,679
| | |
| 10,000,000
USD | | | Henkel Corporation
0.12% due 05/08/12 | | | 9,999,767
| | | | 9,999,767
| | |
| 10,000,000
USD | | | Henkel Corporation
0.12% due 05/15/12 | | | 9,999,533
| | | | 9,999,533
| | |
| 5,000,000
USD | | | Henkel Corporation
0.16% due 06/12/12 | | | 4,999,067
| | | | 4,999,067
| | |
| 26,719,000
USD | | | Siemens Company
0.11% due 05/14/12 | | | 26,717,939
| | | | 26,717,939
| | |
| 85,000,000
USD | | | Siemens Company
0.12% due 05/02/12 | | | 84,999,717
| | | | 84,999,717
| | |
| 28,000,000
USD | | | Siemens Company
0.13% due 05/02/12 | | | 27,999,899
| | | | 27,999,899
| | |
| 38,353,000
USD | | | Siemens Company
0.13% due 05/07/12 | | | 38,352,169
| | | | 38,352,169
| | |
| 50,000,000
USD | | | Siemens Company
0.13% due 05/15/12 | | | 49,997,472
| | | | 49,997,472
| | |
| 56,520,000
USD | | | Siemens Company
0.13% due 06/14/12 | | | 56,511,020
| | | | 56,511,020
| | |
| Italy 0.12% | | | |
| 43,689,000
USD | | | Eni S.p.A.
0.53% due 06/11/12 | | | 43,663,126
| | | | 43,663,126
| | |
| Japan 0.38% | | | |
| 22,432,000
USD | | | Mitsubishi Company
0.37% due 05/14/12 | | | 22,429,084
| | | | 22,429,084
| | |
| 20,000,000
USD | | | Mitsui & Company, Limited
0.22% due 05/04/12 | | | 19,999,633
| | | | 19,999,633
| | |
| 40,000,000
USD | | | Panasonic Corporation
0.29% due 05/10/12 | | | 39,997,100
| | | | 39,997,100
| | |
See Notes to Financial Statements.
FIRST EAGLE FUNDS | SEMI-ANNUAL REPORT | APRIL 30, 2012
31
Global Fund
| PRINCIPAL | | DESCRIPTION | | COST (NOTE 1) | | VALUE (NOTE 1) | |
| International Commercial Paper — 5.77% — (continued) | | | |
| Japan 0.38% — (continued) | | | |
| 40,000,000
USD | | | Panasonic Corporation
0.31% due 05/15/12 | | $ | 39,995,178
| | | $ | 39,995,178
| | |
| 11,000,000
USD | | | Panasonic Corporation
0.48% due 05/21/12 | | | 10,997,128
| | | | 10,997,128
| | |
| Panama 0.18% | | | |
| 43,189,000
USD | | | Carnival Corporation
0.32% due 05/08/12 | | | 43,186,313
| | | | 43,186,313
| | |
| 19,187,000
USD | | | Carnival Corporation
0.38% due 05/22/12 | | | 19,182,859
| | | | 19,182,859
| | |
| Switzerland 1.47% | | | |
| 30,000,000
USD | | | Nestlé SA
0.08% due 05/03/12 | | | 29,999,867
| | | | 29,999,867
| | |
| 25,000,000
USD | | | Nestlé SA
0.08% due 06/01/12 | | | 24,998,278
| | | | 24,998,278
| | |
| 14,500,000
USD | | | Nestlé SA
0.10% due 05/29/12 | | | 14,498,872
| | | | 14,498,872
| | |
| 27,945,000
USD | | | Nestlé SA
0.13% due 05/29/12 | | | 27,942,174
| | | | 27,942,174
| | |
| 36,812,000
USD | | | Nestlé SA
0.13% due 06/11/12 | | | 36,806,550
| | | | 36,806,550
| | |
| 53,888,000
USD | | | Nestlé SA
0.13% due 06/12/12 | | | 53,879,827
| | | | 53,879,827
| | |
| 50,000,000
USD | | | Nestlé SA
0.15% due 06/05/12 | | | 49,992,708
| | | | 49,992,708
| | |
| 30,000,000
USD | | | Nestlé SA
0.15% due 06/08/12 | | | 29,995,250
| | | | 29,995,250
| | |
| 25,757,000
USD | | | Nestlé SA
0.15% due 07/17/12 | | | 25,748,737
| | | | 25,751,419
| | |
| 11,602,000
USD | | | Nestlé SA
0.16% due 07/16/12 | | | 11,598,081
| | | | 11,599,568
| | |
| 31,828,000
USD | | | Novartis International AG
0.12% due 05/10/12 | | | 31,827,045
| | | | 31,827,045
| | |
| 50,407,000
USD | | | Novartis International AG
0.12% due 05/15/12 | | | 50,404,648
| | | | 50,404,648
| | |
| 52,800,000
USD | | | Novartis International AG
0.18% due 06/15/12 | | | 52,788,120
| | | | 52,788,120
| | |
| 25,000,000
USD | | | Roche Holdings, Inc.
0.05% due 05/08/12 | | | 24,999,757
| | | | 24,999,757
| | |
| 25,000,000
USD | | | Roche Holdings, Inc.
0.10% due 06/15/12 | | | 24,996,875
| | | | 24,996,875
| | |
| 10,000,000
USD | | | Roche Holdings, Inc.
0.10% due 08/15/12 | | | 9,997,056
| | | | 9,994,481
| | |
| 14,000,000
USD | | | Roche Holdings, Inc.
0.11% due 07/06/12 | | | 13,997,177
| | | | 13,995,519
| | |
See Notes to Financial Statements.
FIRST EAGLE FUNDS | SEMI-ANNUAL REPORT | APRIL 30, 2012
32
Schedule of Investments | Six-Month Period Ended April 30, 2012 (unaudited)
| PRINCIPAL | | DESCRIPTION | | COST (NOTE 1) | | VALUE (NOTE 1) | |
| International Commercial Paper — 5.77% — (continued) | | | |
| United Kingdom 0.98% | | | |
| 20,000,000
USD | | | BP PLC
0.23% due 05/08/12 | | $ | 19,999,106
| | | $ | 19,999,106
| | |
| 31,161,000
USD | | | BP PLC
0.25% due 05/14/12 | | | 31,158,187
| | | | 31,158,187
| | |
| 64,000,000
USD | | | BP PLC
0.31% due 05/14/12 | | | 63,992,835
| | | | 63,992,835
| | |
| 10,249,000
USD | | | BP PLC
0.33% due 07/02/12 | | | 10,243,175
| | | | 10,247,117
| | |
| 44,555,000
USD | | | BP PLC
0.35% due 06/22/12 | | | 44,533,119
| | | | 44,533,119
| | |
| 30,000,000
USD | | | BP PLC
0.47% due 09/17/12 | | | 29,946,716
| | | | 29,976,666
| | |
| 75,000,000
USD | | | BP PLC
0.49% due 08/20/12 | | | 74,889,000
| | | | 74,959,867
| | |
| 40,000,000
USD | | | BP PLC
0.49% due 08/28/12 | | | 39,936,533
| | | | 39,976,000
| | |
| 10,015,000
USD | | | Reckitt Benckiser Group PLC
0.30% due 05/01/12 | | | 10,015,000
| | | | 10,015,000
| | |
| 17,278,000
USD | | | Reed Elsevier, Inc.
0.46% due 05/23/12 | | | 17,273,249
| | | | 17,273,249
| | |
| Total International Commercial Paper | | | 2,021,448,335 | | | | 2,021,580,469 | | |
| U.S. Commercial Paper — 12.23% | | | |
| $ | 71,800,000 | | | Abbott Laboratories
0.10% due 05/01/12 | | | 71,800,000
| | | | 71,800,000
| | |
| | 30,000,000 | | | Abbott Laboratories
0.10% due 05/08/12 | | | 29,999,417
| | | | 29,999,417
| | |
| | 26,277,000 | | | Abbott Laboratories
0.11% due 05/22/12 | | | 26,275,314
| | | | 26,275,314
| | |
| | 46,024,000 | | | Abbott Laboratories
0.11% due 06/06/12 | | | 46,018,937
| | | | 46,018,937
| | |
| | 25,000,000 | | | Abbott Laboratories
0.12% due 06/05/12 | | | 24,997,083
| | | | 24,997,083
| | |
| | 28,000,000 | | | Abbott Laboratories
0.12% due 06/12/12 | | | 27,996,080
| | | | 27,996,080
| | |
| | 45,294,000 | | | Abbott Laboratories
0.13% due 07/10/12 | | | 45,282,551
| | | | 45,286,137
| | |
| | 43,000,000 | | | Abbott Laboratories
0.14% due 06/19/12 | | | 42,991,806
| | | | 42,991,806
| | |
| | 39,320,000 | | | Abbott Laboratories
0.14% due 07/24/12 | | | 39,307,155
| | | | 39,309,604
| | |
| | 59,317,000 | | | Archer Daniels Midland Company
0.12% due 05/11/12 | | | 59,315,023
| | | | 59,315,023
| | |
See Notes to Financial Statements.
FIRST EAGLE FUNDS | SEMI-ANNUAL REPORT | APRIL 30, 2012
33
Global Fund
| PRINCIPAL | | DESCRIPTION | | COST (NOTE 1) | | VALUE (NOTE 1) | |
| U.S. Commercial Paper — 12.23% — (continued) | | | |
| $ | 63,872,000 | | | Archer Daniels Midland Company
0.12% due 05/21/12 | | $ | 63,867,742
| | | $ | 63,867,742
| | |
| | 41,752,000 | | | Archer Daniels Midland Company
0.13% due 05/02/12 | | | 41,751,849
| | | | 41,751,849
| | |
| | 30,000,000 | | | Archer Daniels Midland Company
0.13% due 05/10/12 | | | 29,999,025
| | | | 29,999,025
| | |
| | 19,797,000 | | | Arrow Electronics, Inc.
0.66% due 05/01/12 | | | 19,797,000
| | | | 19,797,000
| | |
| | 10,788,000 | | | Avery Dennison Corporation
0.41% due 05/01/12 | | | 10,788,000
| | | | 10,788,000
| | |
| | 50,000,000 | | | Campbell Soup Company
0.15% due 05/14/12 | | | 49,997,292
| | | | 49,997,292
| | |
| | 34,557,000 | | | Caterpillar Corporation
0.12% due 05/25/12 | | | 34,554,235
| | | | 34,554,235
| | |
| | 20,000,000 | | | Coca-Cola Company
0.12% due 05/04/12 | | | 19,999,800
| | | | 19,999,800
| | |
| | 24,000,000 | | | Coca-Cola Company
0.13% due 05/23/12 | | | 23,998,093
| | | | 23,998,093
| | |
| | 14,000,000 | | | Coca-Cola Company
0.14% due 05/07/12 | | | 13,999,673
| | | | 13,999,673
| | |
| | 25,000,000 | | | Coca-Cola Company
0.14% due 05/21/12 | | | 24,998,056
| | | | 24,998,056
| | |
| | 25,000,000 | | | Coca-Cola Company
0.15% due 06/06/12 | | | 24,996,250
| | | | 24,996,250
| | |
| | 10,745,000 | | | Coca-Cola Company
0.15% due 06/13/12 | | | 10,743,075
| | | | 10,743,075
| | |
| | 50,000,000 | | | Coca-Cola Company
0.16% due 05/11/12 | | | 49,997,778
| | | | 49,997,778
| | |
| | 30,000,000 | | | Coca-Cola Company
0.16% due 06/18/12 | | | 29,993,600
| | | | 29,993,600
| | |
| | 14,500,000 | | | Coca-Cola Company
0.17% due 06/21/12 | | | 14,496,508
| | | | 14,496,508
| | |
| | 40,000,000 | | | Coca-Cola Company
0.18% due 05/03/12 | | | 39,999,600
| | | | 39,999,600
| | |
| | 45,000,000 | | | Coca-Cola Company
0.21% due 08/15/12 | | | 44,972,175
| | | | 44,977,662
| | |
| | 65,533,000 | | | Coca-Cola Company
0.22% due 05/18/12 | | | 65,526,192
| | | | 65,526,192
| | |
| | 8,095,000 | | | Coca-Cola Company
0.22% due 08/02/12 | | | 8,090,399
| | | | 8,091,745
| | |
| | 47,000,000 | | | Coca-Cola Company
0.22% due 09/12/12 | | | 46,961,512
| | | | 46,965,634
| | |
| | 18,786,000 | | | Computer Sciences Corporation
0.45% due 05/09/12 | | | 18,784,163
| | | | 18,784,163
| | |
See Notes to Financial Statements.
FIRST EAGLE FUNDS | SEMI-ANNUAL REPORT | APRIL 30, 2012
34
Schedule of Investments | Six-Month Period Ended April 30, 2012 (unaudited)
| PRINCIPAL | | DESCRIPTION | | COST (NOTE 1) | | VALUE (NOTE 1) | |
| U.S. Commercial Paper — 12.23% — (continued) | | | |
| $ | 55,350,000 | | | ConocoPhillips
0.18% due 05/02/12 | | $ | 55,349,723
| | | $ | 55,349,723
| | |
| | 25,000,000 | | | ConocoPhillips
0.20% due 05/07/12 | | | 24,999,167
| | | | 24,999,167
| | |
| | 14,560,000 | | | ConocoPhillips
0.20% due 05/09/12 | | | 14,559,353
| | | | 14,559,353
| | |
| | 18,100,000 | | | ConocoPhillips
0.20% due 05/22/12 | | | 18,097,888
| | | | 18,097,888
| | |
| | 10,750,000 | | | ConocoPhillips
0.20% due 06/07/12 | | | 10,747,790
| | | | 10,747,790
| | |
| | 25,000,000 | | | ConocoPhillips
0.20% due 06/20/12 | | | 24,993,056
| | | | 24,993,056
| | |
| | 26,700,000 | | | ConocoPhillips
0.22% due 07/09/12 | | | 26,688,741
| | | | 26,693,926
| | |
| | 15,303,000 | | | ConocoPhillips
0.22% due 07/18/12 | | | 15,295,706
| | | | 15,298,567
| | |
| | 25,052,000 | | | ConocoPhillips
0.23% due 07/11/12 | | | 25,040,636
| | | | 25,045,987
| | |
| | 48,440,000 | | | ConocoPhillips
0.23% due 07/13/12 | | | 48,417,408
| | | | 48,427,754
| | |
| | 36,805,000 | | | ConocoPhillips
0.25% due 06/06/12 | | | 36,795,799
| | | | 36,795,799
| | |
| | 19,584,000 | | | Dell, Inc.
0.15% due 05/07/12 | | | 19,583,510
| | | | 19,583,510
| | |
| | 50,000,000 | | | Dell, Inc.
0.15% due 05/29/12 | | | 49,994,167
| | | | 49,994,167
| | |
| | 60,000,000 | | | Dell, Inc.
0.15% due 06/01/12 | | | 59,992,250
| | | | 59,992,250
| | |
| | 50,000,000 | | | Dell, Inc.
0.20% due 07/09/12 | | | 49,980,833
| | | | 49,984,735
| | |
| | 35,000,000 | | | Dell, Inc.
0.36% due 07/09/12 | | | 34,976,521
| | | | 34,989,314
| | |
| | 31,500,000 | | | Dell, Inc.
0.36% due 07/11/12 | | | 31,478,256
| | | | 31,490,046
| | |
| | 28,071,000 | | | Dell, Inc.
0.36% due 07/18/12 | | | 28,049,713
| | | | 28,060,959
| | |
| | 20,000,000 | | | Ebay, Inc
0.13% due 05/10/12 | | | 19,999,350
| | | | 19,999,350
| | |
| | 32,000,000 | | | Emerson Electric Company
0.13% due 05/23/12 | | | 31,997,458
| | | | 31,997,458
| | |
| | 26,064,000 | | | Emerson Electric Company
0.13% due 05/29/12 | | | 26,061,365
| | | | 26,061,365
| | |
| | 30,000,000 | | | Emerson Electric Company
0.14% due 06/07/12 | | | 29,995,683
| | | | 29,995,683
| | |
See Notes to Financial Statements.
FIRST EAGLE FUNDS | SEMI-ANNUAL REPORT | APRIL 30, 2012
35
Global Fund
| PRINCIPAL | | DESCRIPTION | | COST (NOTE 1) | | VALUE (NOTE 1) | |
| U.S. Commercial Paper — 12.23% — (continued) | | | |
| $ | 38,353,000 | | | General Electric Corporation
0.07% due 05/03/12 | | $ | 38,352,851
| | | $ | 38,352,851
| | |
| | 20,000,000 | | | Google, Inc.
0.08% due 05/11/12 | | | 19,999,556
| | | | 19,999,556
| | |
| | 44,695,000 | | | Google, Inc.
0.09% due 05/07/12 | | | 44,694,330
| | | | 44,694,330
| | |
| | 10,000,000 | | | Google, Inc.
0.09% due 05/22/12 | | | 9,999,475
| | | | 9,999,475
| | |
| | 70,000,000 | | | Google, Inc.
0.10% due 05/16/12 | | | 69,997,083
| | | | 69,997,083
| | |
| | 24,750,000 | | | Google, Inc.
0.11% due 05/24/12 | | | 24,748,261
| | | | 24,748,261
| | |
| | 24,073,000 | | | Google, Inc.
0.14% due 07/20/12 | | | 24,065,511
| | | | 24,065,364
| | |
| | 30,000,000 | | | Honeywell International, Inc.
0.12% due 06/27/12 | | | 29,994,300
| | | | 29,994,300
| | |
| | 50,000,000 | | | Honeywell International, Inc.
0.12% due 06/28/12 | | | 49,990,333
| | | | 49,990,333
| | |
| | 46,700,000 | | | Honeywell International, Inc.
0.13% due 06/26/12 | | | 46,690,556
| | | | 46,690,556
| | |
| | 25,000,000 | | | Honeywell International, Inc.
0.15% due 06/26/12 | | | 24,994,167
| | | | 24,994,167
| | |
| | 40,000,000 | | | Honeywell International, Inc.
0.20% due 09/26/12 | | | 39,967,111
| | | | 39,965,400
| | |
| | 12,000,000 | | | Honeywell International, Inc.
0.20% due 09/27/12 | | | 11,990,067
| | | | 11,989,500
| | |
| | 95,000,000 | | | Johnson & Johnson
0.05% due 05/16/12 | | | 94,998,021
| | | | 94,998,021
| | |
| | 30,000,000 | | | Johnson & Johnson
0.05% due 05/23/12 | | | 29,999,083
| | | | 29,999,083
| | |
| | 35,000,000 | | | Johnson & Johnson
0.06% due 05/02/12 | | | 34,999,942
| | | | 34,999,942
| | |
| | 29,550,000 | | | Johnson & Johnson
0.09% due 05/24/12 | | | 29,548,301
| | | | 29,548,301
| | |
| | 15,303,000 | | | Johnson & Johnson
0.10% due 07/09/12 | | | 15,300,067
| | | | 15,300,411
| | |
| | 39,354,000 | | | Johnson & Johnson
0.10% due 08/13/12 | | | 39,342,631
| | | | 39,338,506
| | |
| | 32,469,000 | | | Johnson & Johnson
0.11% due 05/01/12 | | | 32,469,000
| | | | 32,469,000
| | |
| | 28,075,000 | | | Johnson & Johnson
0.17% due 09/26/12 | | | 28,055,379
| | | | 28,054,199
| | |
| | 25,914,000 | | | Kraft Foods, Inc.
0.28% due 05/03/12 | | | 25,913,597
| | | | 25,913,597
| | |
See Notes to Financial Statements.
FIRST EAGLE FUNDS | SEMI-ANNUAL REPORT | APRIL 30, 2012
36
Schedule of Investments | Six-Month Period Ended April 30, 2012 (unaudited)
| PRINCIPAL | | DESCRIPTION | | COST (NOTE 1) | | VALUE (NOTE 1) | |
| U.S. Commercial Paper — 12.23% — (continued) | | | |
| $ | 9,000,000 | | | McDonald's Corporation
0.10% due 06/11/12 | | $ | 8,998,975
| | | $ | 8,998,975
| | |
| | 19,700,000 | | | McDonald's Corporation
0.13% due 06/27/12 | | | 19,695,945
| | | | 19,695,945
| | |
| | 28,516,000 | | | Medtronic, Inc.
0.09% due 05/17/12 | | | 28,514,859
| | | | 28,514,859
| | |
| | 14,158,000 | | | Medtronic, Inc.
0.10% due 05/08/12 | | | 14,157,725
| | | | 14,157,725
| | |
| | 44,308,000 | | | Medtronic, Inc.
0.10% due 06/21/12 | | | 44,301,723
| | | | 44,301,723
| | |
| | 50,000,000 | | | Merck & Company, Inc.
0.08% due 05/11/12 | | | 49,998,889
| | | | 49,998,889
| | |
| | 15,000,000 | | | Merck & Company, Inc.
0.08% due 05/17/12 | | | 14,999,467
| | | | 14,999,467
| | |
| | 35,000,000 | | | Merck & Company, Inc.
0.08% due 05/21/12 | | | 34,998,444
| | | | 34,998,444
| | |
| | 40,000,000 | | | Merck & Company, Inc.
0.09% due 05/10/12 | | | 39,999,100
| | | | 39,999,100
| | |
| | 51,826,000 | | | Merck & Company, Inc.
0.10% due 06/08/12 | | | 51,820,529
| | | | 51,820,529
| | |
| | 50,000,000 | | | Merck & Company, Inc.
0.12% due 05/21/12 | | | 49,996,667
| | | | 49,996,667
| | |
| | 25,000,000 | | | Merck & Company, Inc.
0.12% due 06/25/12 | | | 24,995,417
| | | | 24,995,417
| | |
| | 66,072,000 | | | Merck & Company, Inc.
0.12% due 07/03/12 | | | 66,058,125
| | | | 66,062,955
| | |
| | 24,548,000 | | | Merck & Company, Inc.
0.13% due 06/04/12 | | | 24,544,986
| | | | 24,544,986
| | |
| | 38,013,000 | | | Merck & Company, Inc.
0.13% due 07/06/12 | | | 38,003,940
| | | | 38,007,199
| | |
| | 19,790,000 | | | NYSE Euronext, Inc.
0.41% due 05/18/12 | | | 19,786,262
| | | | 19,786,262
| | |
| | 25,000,000 | | | NYSE Euronext, Inc.
0.44% due 05/17/12 | | | 24,995,222
| | | | 24,995,222
| | |
| | 6,205,000 | | | Parker-Hannifin Corporation
0.16% due 05/04/12 | | | 6,204,917
| | | | 6,204,917
| | |
| | 35,000,000 | | | Parker-Hannifin Corporation
0.16% due 05/07/12 | | | 34,999,067
| | | | 34,999,067
| | |
| | 25,000,000 | | | Parker-Hannifin Corporation
0.16% due 05/08/12 | | | 24,999,222
| | | | 24,999,222
| | |
| | 45,000,000 | | | PepsiCo, Inc.
0.12% due 05/07/12 | | | 44,999,100
| | | | 44,999,100
| | |
| | 75,000,000 | | | PepsiCo, Inc.
0.12% due 05/09/12 | | | 74,998,000
| | | | 74,998,000
| | |
See Notes to Financial Statements.
FIRST EAGLE FUNDS | SEMI-ANNUAL REPORT | APRIL 30, 2012
37
Global Fund
| PRINCIPAL | | DESCRIPTION | | COST (NOTE 1) | | VALUE (NOTE 1) | |
| U.S. Commercial Paper — 12.23% — (continued) | | | |
| $ | 30,000,000 | | | Pfizer, Inc.
0.10% due 05/17/12 | | $ | 29,998,667
| | | $ | 29,998,667
| | |
| | 38,700,000 | | | Pfizer, Inc.
0.12% due 05/17/12 | | | 38,697,936
| | | | 38,697,936
| | |
| | 25,000,000 | | | Philip Morris International, Inc.
0.06% due 05/04/12 | | | 24,999,875
| | | | 24,999,875
| | |
| | 17,000,000 | | | Philip Morris International, Inc.
0.08% due 05/02/12 | | | 16,999,962
| | | | 16,999,962
| | |
| | 23,000,000 | | | Philip Morris International, Inc.
0.08% due 05/31/12 | | | 22,998,467
| | | | 22,998,467
| | |
| | 30,000,000 | | | Philip Morris International, Inc.
0.09% due 05/22/12 | | | 29,998,425
| | | | 29,998,425
| | |
| | 17,325,000 | | | Philip Morris International, Inc.
0.15% due 06/04/12 | | | 17,322,546
| | | | 17,322,546
| | |
| | 55,991,000 | | | Philip Morris International, Inc.
0.16% due 05/09/12 | | | 55,989,009
| | | | 55,989,009
| | |
| | 60,000,000 | | | Proctor & Gamble Company
0.12% due 05/17/12 | | | 59,996,800
| | | | 59,996,800
| | |
| | 20,000,000 | | | Proctor & Gamble Company
0.12% due 05/24/12 | | | 19,998,467
| | | | 19,998,467
| | |
| | 30,000,000 | | | Proctor & Gamble Company
0.12% due 06/01/12 | | | 29,996,900
| | | | 29,996,900
| | |
| | 75,000,000 | | | Proctor & Gamble Company
0.13% due 06/13/12 | | | 74,988,354
| | | | 74,988,354
| | |
| | 5,000,000 | | | Proctor & Gamble Company
0.14% due 06/11/12 | | | 4,999,203
| | | | 4,999,203
| | |
| | 10,788,000 | | | Safeway, Inc.
0.66% due 05/01/12 | | | 10,788,000
| | | | 10,788,000
| | |
| | 4,519,000 | | | Sara Lee Corporation
0.35% due 05/01/12 | | | 4,519,000
| | | | 4,519,000
| | |
| | 15,000,000 | | | Sherwin-Williams Company
0.19% due 05/16/12 | | | 14,998,812
| | | | 14,998,812
| | |
| | 38,353,000 | | | Sysco Corporation
0.15% due 05/02/12 | | | 38,352,840
| | | | 38,352,840
| | |
| | 34,980,000 | | | Verizon Communications, Inc.
0.30% due 05/14/12 | | | 34,976,210
| | | | 34,976,210
| | |
| | 32,779,000 | | | Wal-Mart Stores, Inc.
0.09% due 05/18/12 | | | 32,777,607
| | | | 32,777,607
| | |
| | 100,000,000 | | | Walt Disney Company
0.07% due 06/05/12 | | | 99,993,194
| | | | 99,993,194
| | |
| | 65,000,000 | | | Walt Disney Company
0.07% due 06/06/12 | | | 64,995,450
| | | | 64,995,450
| | |
| | 45,000,000 | | | Walt Disney Company
0.08% due 05/03/12 | | | 44,999,800
| | | | 44,999,800
| | |
See Notes to Financial Statements.
FIRST EAGLE FUNDS | SEMI-ANNUAL REPORT | APRIL 30, 2012
38
Schedule of Investments | Six-Month Period Ended April 30, 2012 (unaudited)
| PRINCIPAL | | DESCRIPTION | | COST (NOTE 1) | | VALUE (NOTE 1) | |
| U.S. Commercial Paper — 12.23% — (continued) | | | |
| $ | 25,000,000 | | | Walt Disney Company
0.10% due 05/21/12 | | $ | 24,998,611
| | | $ | 24,998,611
| | |
| | 64,188,000 | | | Walt Disney Company
0.11% due 06/18/12 | | | 64,178,586
| | | | 64,178,586
| | |
| | 50,000,000 | | | Walt Disney Company
0.12% due 07/12/12 | | | 49,988,000
| | | | 49,983,880
| | |
| | 20,000,000 | | | WellPoint, Inc.
0.36% due 05/18/12 | | | 19,996,694
| | | | 19,996,694
| | |
| | 2,000,000 | | | WellPoint, Inc.
0.37% due 05/24/12 | | | 1,999,540
| | | | 1,999,540
| | |
| | 10,000,000 | | | WellPoint, Inc.
0.39% due 05/22/12 | | | 9,997,783
| | | | 9,997,783
| | |
| | 25,000,000 | | | WellPoint, Inc.
0.41% due 05/07/12 | | | 24,998,333
| | | | 24,998,333
| | |
| | 15,000,000 | | | WellPoint, Inc.
0.42% due 05/01/12 | | | 15,000,000
| | | | 15,000,000
| | |
| | 8,630,000 | | | Western Union Company
0.38% due 05/01/12 | | | 8,630,000
| | | | 8,630,000
| | |
| Total U.S. Commercial Paper | | | 4,286,739,030 | | | | 4,286,816,077 | | |
| Total Commercial Paper | | | 6,308,187,365 | | | | 6,308,396,546 | | |
Total Investment Portfolio
Excluding Option Written — 99.84% | | $ | 29,703,472,352 | | | $ | 34,980,860,159 | | |
| CONTRACTS | | | | STRIKE PRICE | | EXPIRATION DATE | | VALUE (NOTE 1) | |
| Covered Call Option Written — (0.01)% | |
| (Premium Received: $4,499,162) | |
| | 14,617 | | | KLA-Tencor Corporation | | $ | 55.00 | | | September 2012 | | $ | (2,923,400 | ) | |
| Total Investments — 99.83% (Cost: $29,698,973,190) | | | | | | | | | 34,977,936,759 | | |
| Other Assets in Excess of Liabilities — 0.17% | | | | | | | | | 57,477,430 | | |
| Net Assets — 100.00% | | | | | | | | $ | 35,035,414,189 | | |
(a) Security is deemed illiquid. At April 30, 2012, the value of these securities amounted to $98,672,049 or 0.28% of net assets.
(b) Non-income producing security/commodity.
(c) An affiliate of the Fund as defined by the Investment Company Act of 1940. An affiliate is defined as a company in which the Fund directly or indirectly owns, controls, or holds power to vote 5% or more of the outstanding voting securities.
(d) At April 30, 2012, all or a portion of this security was segregated to cover collateral requirement for options.
(e) Represents variable voting shares.
(f) Securities valued in accordance with fair value procedures under the supervision of the Board of Trustees, representing $42,506,342 or 0.12% of net assets.
See Notes to Financial Statements.
FIRST EAGLE FUNDS | SEMI-ANNUAL REPORT | APRIL 30, 2012
39
Global Fund
(g) Represents securities that are subject to legal or contractual restrictions on resale. At April 30, 2012, the value of these securities amounted to $37,474,445 or 0.11% of net assets.
(h) Held through Financiere Rouge, LLC, wholly owned subsidiary and disregarded entity for U.S. tax purposes.
(i) Represents non-voting class of shares.
(j) Issuer is in default.
(k) All or a portion of the security is exempt from registration under the Securities Act of 1933. Rule 144A securities may only be sold to qualified institutional buyers, pursuant to Rule 144A under the Securities Act of 1933.
(l) Represents a security registered under Regulation S. Bonds sold under Regulation S may not be offered, sold or delivered within the U.S., or for the account or benefit of, U.S. persons, except pursuant to an exemption from, or in a transaction not subject to, the registration requirements of the Securities Act of 1933.
(m) Floating rate security. Rate shown is the rate in effect at April 30, 2012.
(n) Inflation protected security.
At April 30, 2012, cost is substantially identical for both book and federal income tax purposes. Net unrealized appreciation consisted of:
| Gross unrealized appreciation | | $ | 6,895,588,227 | | |
| Gross unrealized depreciation | | | (1,616,624,658 | ) | |
| Net unrealized appreciation | | $ | 5,278,963,569 | | |
Abbreviations used in this schedule include:
ADR — American Depository Receipt
FRN — Floating Rate Note
NVDR — Non-Voting Depository Receipt
NYSE — New York Stock Exchange
PC — Participation Certificate
PCL — Public Company Limited
PLC — Public Limited Company
REIT — Real Estate Investment Trust
RSP — Represents Non-Voting Shares
Currencies
EUR — Euro
GBP — British Pound
HKD — Hong Kong Dollar
KRW — South Korean Won
SGD — Singapore Dollar
TWD — Taiwan Dollar
USD — United States Dollar
| RESTRICTED SECURITIES | | ACQUISITION
DATE | | COST | | CARRYING VALUE PER
SHARE/PRINCIPAL | |
| Emin Leydier SA FRN 6.01% due 07/31/16 | | 07/30/09 | | $ | 21,435,024 | | | $ | 1.32 | | |
| FINEL 9.50% due 06/30/17 | | 06/22/05 | | | 14,494,344 | | | | 0.99 | | |
| FINEL | | 07/30/09 | | | — | | | | 0.48 | | |
See Notes to Financial Statements.
FIRST EAGLE FUNDS | SEMI-ANNUAL REPORT | APRIL 30, 2012
40
Schedule of Investments | Six-Month Period Ended April 30, 2012 (unaudited)
Foreign Currency Exchange Contracts — Sales
SETTLEMENT
DATES
THROUGH | | FOREIGN CURRENCY
TO BE DELIVERED | | U.S. $
TO BE
RECEIVED | | U.S. $ VALUE
AT APRIL 30,
2012 | | UNREALIZED
APPRECIATION
AT APRIL 30,
2012 | | UNREALIZED
DEPRECIATION
AT APRIL 30,
2012 | |
| 07/18/12 | | | 258,529,000 | | | Euro | | $ | 346,892,304 | | | $ | 342,203,988 | | | $ | 4,688,316 | | | $ | — | | |
| 08/15/12 | | | 368,691,000 | | | Euro | | | 491,168,073 | | | | 488,055,574 | | | | 3,112,499 | | | | — | | |
| 09/12/12 | | | 240,798,000 | | | Euro | | | 315,296,085 | | | | 318,941,778 | | | | — | | | | (3,645,693 | ) | |
| 10/17/12 | | | 73,123,000 | | | Euro | | | 96,489,455 | | | | 96,889,372 | | | | — | | | | (399,917 | ) | |
| 06/13/12 | | | 59,119,825,000 | | | Japanese Yen | | | 743,429,395 | | | | 740,656,747 | | | | 2,772,648 | | | | — | | |
| 08/15/12 | | | 83,566,925,000 | | | Japanese Yen | | | 1,082,894,368 | | | | 1,047,666,592 | | | | 35,227,776 | | | | — | | |
| 09/12/12 | | | 40,696,581,000 | | | Japanese Yen | | | 507,900,692 | | | | 510,504,815 | | | | — | | | | (2,604,123 | ) | |
| 10/17/12 | | | 27,948,651,000 | | | Japanese Yen | | | 346,667,134 | | | | 350,779,270 | | | | — | | | | (4,112,136 | ) | |
| | | | | | | $ | 3,930,737,506 | | | $ | 3,895,698,136 | | | $ | 45,801,239 | | | $ | (10,761,869 | ) | |
| Foreign Currency Exchange Contracts — Purchases | |
SETTLEMENT
DATES
THROUGH | | FOREIGN CURRENCY
TO BE RECEIVED | | U.S. $
TO BE
DELIVERED | | U.S. $ VALUE
AT APRIL 30,
2012 | | UNREALIZED
APPRECIATION
AT APRIL 30,
2012 | | UNREALIZED
DEPRECIATION
AT APRIL 30,
2012 | |
| 05/16/12 | | | 54,000,000 | | | Euro | | $ | 70,405,200 | | | $ | 71,459,019 | | | $ | 1,053,819 | | | $ | — | | |
Affiliated Securities
AFFILIATED
SECURITIES | | SHARES
OCTOBER 31,
2011 | | GROSS
ADDITIONS | | GROSS
REDUCTIONS | | SHARES
APRIL 30,
2012 | | MARKET VALUE
APRIL 30,
2012 | | REALIZED
GAIN/(LOSS) | | DIVIDEND
INCOME | |
Alliant
Techsystems,
Inc. | | | 3,333,753 | | | | — | | | | — | | | | 3,337,753 | | | $ | 177,902,235 | | | $ | — | | | $ | 1,335,101 | | |
Ariake Japan
Company
Limited | | | 1,725,100 | | | | — | | | | — | | | | 1,725,100 | | | | 34,830,426 | | | | — | | | | 387,019 | | |
Berkeley
Group
Holdings PLC | | | 9,342,277 | | | | — | | | | — | | | | 9,342,277 | | | | 194,309,702 | | | | — | | | | — | | |
Blount
International,
Inc. | | | 7,574,592 | | | | — | | | | 3,382,455 | | | | 4,192,137 | | | | 67,786,855 | | | | 11,720,825 | | | | — | | |
Chofu
Seisakusho
Company
Limited | | | 3,526,280 | | | | — | | | | — | | | | 3,526,280 | | | | 84,270,319 | | | | — | | | | 630,904 | | |
Cincinnati
Financial
Corporation | | | 9,542,046 | | | | — | | | | — | | | | 9,542,046 | | | | 339,887,678 | | | | — | | | | 7,681,347 | | |
Cintas
Corporation | | | 13,051,511 | | | | — | | | | — | | | | 13,051,511 | | | | 511,227,686 | | | | — | | | | 7,047,816 | | |
City
e-Solutions
Limited | | | 20,738,780 | | | | — | | | | — | | | | 20,738,780 | | | | 1,911,347 | | | | — | | | | — | | |
See Notes to Financial Statements.
FIRST EAGLE FUNDS | SEMI-ANNUAL REPORT | APRIL 30, 2012
41
Global Fund
Affiliated Securities — (continued)
AFFILIATED
SECURITIES | | SHARES
OCTOBER 31,
2011 | | GROSS
ADDITIONS | | GROSS
REDUCTIONS | | SHARES
APRIL 30,
2012 | | MARKET VALUE
APRIL 30,
2012 | | REALIZED
GAIN/(LOSS) | | DIVIDEND
INCOME | |
Deltic
Timber
Corporation | | | 1,258,500 | | | | — | | | | — | | | | 1,258,500 | | | $ | 76,869,180 | | | $ | — | | | $ | 188,775 | | |
| FINEL | | | 12,000,000 | | | | — | | | | — | | | | 12,000,000 | | | | 5,716,441 | | | | — | | | | — | | |
Guyenne et
Gascogne SA | | | 956,044 | | | | — | | | | — | | | | 956,044 | | | | 102,471,916 | | | | — | | | | — | | |
Hirose
Electric
Company
Limited | | | 2,318,500 | | | | — | | | | — | | | | 2,318,500 | | | | 244,220,754 | | | | — | | | | 1,430,291 | | |
| IDACorp, Inc. | | | 3,760,485 | | | | — | | | | — | | | | 3,760,485 | | | | 153,202,159 | | | | — | | | | 2,369,106 | | |
Meitec
Corporation | | | 2,719,100 | | | | — | | | | 467,606 | | | | 2,251,494 | | | | 46,417,324 | | | | (4,717,732 | ) | | | 754,747 | | |
Mills Music
Trust | | | 34,924 | | | | — | | | | 1,032 | | | | 33,892 | | | | 1,327,719 | | | | 2,054 | | | | 56,088 | | |
MISUMI
Group, Inc. | | | 12,811,860 | | | | — | | | | — | | | | 12,811,860 | | | | 301,361,136 | | | | — | | | | 3,357,982 | | |
Namyang
Dairy
Products
Company
Limited | | | 39,989 | | | | — | | | | — | | | | 39,989 | | | | 22,999,978 | | | | — | | | | 28,894 | | |
| Neopost SA | | | 2,044,437 | | | | — | | | | — | | | | 2,044,437 | | | | 117,504,775 | | | | — | | | | 4,124,099 | | |
| NSC Groupe | | | 69,500 | | | | — | | | | — | | | | 69,500 | | | | 5,517,953 | | | | — | | | | — | | |
| Robertet SA | | | 157,260 | | | | — | | | | — | | | | 157,260 | | | | 24,971,319 | | | | — | | | | — | | |
| Sabeton SA | | | 385,000 | | | | — | | | | — | | | | 385,000 | | | | 6,826,648 | | | | — | | | | — | | |
San Juan
Basin Royalty
Trust | | | 3,975,644 | | | | — | | | | 67,609 | | | | 3,908,035 | | | | 66,202,113 | | | | (1,199,360 | ) | | | 2,668,541 | | |
| Shimano, Inc. | | | 7,609,390 | | | | — | | | | — | | | | 7,609,390 | | | | 501,320,032 | | | | — | | | | 2,769,314 | | |
Société
Télévision
Francaise 1 | | | 11,533,583 | | | | 342,719 | | | | 72,940 | | | | 11,803,362 | | | | 114,017,245 | | | | (633,504 | ) | | | 7,300,138 | | |
Sucrière de
Pithiviers-
Le-Vieil* | | | 63,019 | | | | — | | | | 63,019 | | | | — | | | | — | | | | 105,965,690 | | | | — | | |
T. Hasegawa
Company
Limited | | | 5,147,000 | | | | — | | | | — | | | | 5,147,000 | | | | 72,976,002 | | | | — | | | | 577,293 | | |
| Total | | | | | | | | | | $ | 3,276,048,942 | | | $ | 111,137,973 | | | $ | 42,707,455 | | |
* Represents an unaffiliated issuer as of April 30, 2012, as such, amounts represented above will not agree to balances in the Statements of Assets and Liabilities and Statements of Operations.
See Notes to Financial Statements.
FIRST EAGLE FUNDS | SEMI-ANNUAL REPORT | APRIL 30, 2012
42
Schedule of Investments | Six-Month Period Ended April 30, 2012 (unaudited)
| INDUSTRY DIVERSIFICATION FOR PORTFOLIO HOLDINGS | | PERCENT OF
NET ASSETS | |
| U.S. Common Stocks | |
| Consumer Discretionary | | | 2.66 | % | |
| Consumer Staples | | | 3.10 | | |
| Energy | | | 1.86 | | |
| Financials | | | 8.85 | | |
| Health Care | | | 0.91 | | |
| Industrials | | | 4.90 | | |
| Information Technology | | | 7.40 | | |
| Materials | | | 2.28 | | |
| Utilities | | | 2.20 | | |
| Total U.S. Common Stocks | | | 34.16 | | |
| International Common Stocks | |
| Consumer Discretionary | | | 5.59 | | |
| Consumer Staples | | | 3.45 | | |
| Energy | | | 2.18 | | |
| Financials | | | 5.36 | | |
| Health Care | | | 3.34 | | |
| Industrials | | | 7.69 | | |
| Information Technology | | | 3.48 | | |
| Materials | | | 6.86 | | |
| Telecommunication Services | | | 1.36 | | |
| Utilities | | | 0.41 | | |
| Total International Common Stocks | | | 39.72 | | |
| International Preferred Stocks | |
| Consumer Discretionary | | | 0.37 | | |
| Information Technology | | | 0.32 | | |
| Total International Preferred Stocks | | | 0.69 | | |
| Warrant | | | 0.21 | | |
| Commodity | | | 5.00 | | |
See Notes to Financial Statements.
FIRST EAGLE FUNDS | SEMI-ANNUAL REPORT | APRIL 30, 2012
43
Global Fund
| INDUSTRY DIVERSIFICATION FOR PORTFOLIO HOLDINGS — (CONTINUED) | | PERCENT OF
NET ASSETS | |
| U.S. Corporate Bonds | |
| Consumer Discretionary | | | 0.10 | % | |
| Total U.S. Corporate Bonds | | | 0.10 | | |
| International Notes and Bonds | |
| Financials | | | 0.15 | | |
| Government Issues | | | 1.70 | | |
| Materials | | | 0.11 | | |
| Total International Notes and Bonds | | | 1.96 | | |
| Commercial Paper | |
| International Commercial Paper | | | 5.77 | | |
| U.S. Commercial Paper | | | 12.23 | | |
| Total Commercial Paper | | | 18.00 | | |
| Covered Call Option Written | | | (0.01) | | |
| Total Investments | | | 99.83 | % | |
See Notes to Financial Statements.
FIRST EAGLE FUNDS | SEMI-ANNUAL REPORT | APRIL 30, 2012
44
This page was intentionally left blank.

Fund Overview | Data as of April 30, 2012 (unaudited)
INVESTMENT OBJECTIVE
The First Eagle Overseas Fund seeks long-term growth of capital by investing primarily in equities issued by non-U.S. corporations. Management's research-driven process seeks to minimize risk by focusing on undervalued securities.
| Average Annual Returns | |
| | | ONE-YEAR | | FIVE-YEARS | | TEN-YEARS | |
First Eagle Overseas
Fund (A Shares) | |
| without sales load | | | -4.66 | % | | | 2.99 | % | | | 11.80 | % | |
| with sales load | | | -9.42 | | | | 1.94 | | | | 11.23 | | |
| MSCI EAFE Index | | | -12.82 | | | | -4.72 | | | | 5.42 | | |
| Consumer Price Index | | | 2.30 | | | | 2.17 | | | | 2.49 | | |
Asset Allocation*

| Countries* | |
| Japan | | | 30.18 | % | |
| France | | | 8.76 | | |
| United States | | | 7.28 | | |
| Germany | | | 5.53 | | |
| Switzerland | | | 3.77 | | |
| Singapore | | | 3.46 | | |
| Canada | | | 3.22 | | |
| United Kingdom | | | 2.88 | | |
| South Korea | | | 2.74 | | |
| Mexico | | | 2.66 | | |
| Thailand | | | 2.15 | | |
| Hong Kong | | | 2.15 | | |
| Netherlands | | | 1.44 | | |
| Austria | | | 1.31 | | |
| South Africa | | | 1.26 | | |
| Australia | | | 1.20 | | |
| Taiwan | | | 0.77 | | |
| Spain | | | 0.70 | | |
| Sweden | | | 0.68 | | |
| Malaysia | | | 0.68 | | |
| Bermuda | | | 0.47 | | |
| Brazil | | | 0.47 | | |
| Greece | | | 0.45 | | |
| Ireland | | | 0.38 | | |
| Italy | | | 0.37 | | |
| Belgium | | | 0.28 | | |
| Israel | | | 0.25 | | |
| Turkey | | | 0.21 | | |
| Norway | | | 0.13 | | |
* Asset Allocation and Countries percentages are based on total investments in the portfolio. Country allocations reflect country of the issuer (not currency of issue) and exclude short term investments. Bonds of non-U.S. issuers may be U.S. dollar denominated.
The Fund's portfolio composition is subject to change at any time.
FIRST EAGLE FUNDS | SEMI-ANNUAL REPORT | APRIL 30, 2012
46
Overseas Fund
Growth of a $10,000 Initial Investment
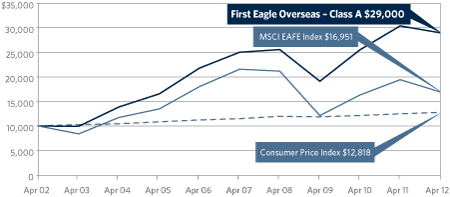
Performance data quoted herein represents past performance and should not be considered indicative of future results. Performance data quoted herein does not reflect the deduction of taxes that a shareholder would pay on Fund distributions or the sale of Fund shares. The average annual returns shown above are historical and reflect changes in share price, reinvested dividends and are net of expenses.
The average annual returns for Class A Shares give effect to the deduction of the maximum sales charge of 5.00%.
The MSCI EAFE Index is a total return index, reported in U.S. Dollars, based on share prices and reinvested net dividends of approximately 1,100 companies from 21 countries and is not available for purchase. The Consumer Price Index (CPI) represents the change in price of all goods and services purchased for consumption by urban households.
| Top 10 Holdings* | |
| Gold Bullion (precious metal) | | | 6.90 | % | |
| Shimano, Inc. (Japanese bicycle parts manufacturer) | | | 2.97 | | |
| Fanuc Corporation (Japanese automated machine tools manufacturer) | | | 2.09 | | |
| SMC Corporation (Japanese automated control devices manufacturer) | | | 1.88 | | |
| HeidelbergCement AG (German building materials manufacturer) | | | 1.87 | | |
| Secom Company Limited (Japanese security services provider) | | | 1.86 | | |
| Grupo Televisa S.A.B., ADR (Mexican media company) | | | 1.65 | | |
| Keyence Corporation (Japanese sensors manufacturer) | | | 1.50 | | |
| Nestlé SA (Swiss food product manufacturer) | | | 1.50 | | |
| NKSJ Holdings, Inc. (Japanese insurance provider) | | | 1.42 | | |
| Total | | | 23.64 | % | |
* Holdings in cash, commercial paper, and money market funds have been excluded. Percentages are based on total net assets.
FIRST EAGLE FUNDS | SEMI-ANNUAL REPORT | APRIL 30, 2012
47
First Eagle Overseas Fund
| SHARES | | DESCRIPTION | | COST (NOTE 1) | | VALUE (NOTE 1) | |
| Common Stocks — 73.01% | | | |
| International Common Stocks — 72.70% | | | |
| Australia 1.19% | | | |
| | 3,089,899 | | | Newcrest Mining Limited | | $ | 101,305,087 | | | $ | 84,661,205 | | |
| | 15,791,758 | | | Spotless Group Limited (a) | | | 38,417,424 | | | | 42,116,751 | | |
| | | | 139,722,511 | | | | 126,777,956 | | |
| Austria 1.30% | | | |
| | 2,047,932 | | | OMV AG | | | 83,876,284 | | | | 69,306,367 | | |
| | 5,915,786 | | | Wienerberger AG (a) | | | 88,605,267 | | | | 68,863,486 | | |
| | | | 172,481,551 | | | | 138,169,853 | | |
| Belgium 0.28% | | | |
| | 366,943 | | | Groupe Bruxelles Lambert SA | | | 27,696,696 | | | | 25,448,063 | | |
| | 57,420 | | | Sofina SA | | | 4,474,251 | | | | 4,607,489 | | |
| | | | 32,170,947 | | | | 30,055,552 | | |
| Bermuda 0.46% | | | |
| | 994,200 | | | Jardine Matheson Holdings Limited | | | 29,348,034 | | | | 49,362,030 | | |
| Brazil 0.46% | | | |
| | 2,218,940 | | | Petroleo Brasileiro SA, ADR | | | 25,903,065 | | | | 49,171,710 | | |
| Canada 3.00% | | | |
| | 3,000,311 | | | Agnico-Eagle Mines Limited | | | 105,249,766 | | | | 119,872,700 | | |
| | 4,773,441 | | | Penn West Petroleum Limited | | | 91,218,197 | | | | 81,816,779 | | |
| | 1,914,012 | | | Cenovus Energy, Inc. | | | 38,341,076 | | | | 69,382,935 | | |
| | 485,215 | | | Cogeco Cable, Inc. | | | 21,284,295 | | | | 24,072,834 | | |
| | 1,100,050 | | | EnCana Corporation | | | 14,298,775 | | | | 23,035,047 | | |
| | 875,938 | | | Postmedia Network Canada
Corporation (b)(c)(d) | | | 5,591,396
| | | | 1,330,337
| | |
| | 13,660 | | | Nexen, Inc. | | | 258,591 | | | | 264,321 | | |
| | | | 276,242,096 | | | | 319,774,953 | | |
| France 8.24% | | | |
| | 1,660,899 | | | Sodexo | | | 46,115,630 | | | | 132,218,738 | | |
| | 1,660,633 | | | Sanofi | | | 135,351,026 | | | | 126,703,981 | | |
| | 4,285,607 | | | Bouygues SA | | | 168,464,325 | | | | 116,367,487 | | |
| | 1,883,280 | | | Total SA | | | 106,841,885 | | | | 89,888,264 | | |
| | 5,931,165 | | | Société Télévision Francaise 1 | | | 93,465,134 | | | | 57,293,430 | | |
| | 558,938 | | | Laurent-Perrier (a) | | | 19,851,603 | | | | 56,388,232 | | |
| | 827,900 | | | Neopost SA | | | 44,073,366 | | | | 47,583,860 | | |
| | 505,501 | | | Wendel SA | | | 10,862,584 | | | | 37,806,470 | | |
| | 235,837 | | | Robertet SA (a) | | | 20,591,064 | | | | 37,448,562 | | |
See Notes to Financial Statements.
FIRST EAGLE FUNDS | SEMI-ANNUAL REPORT | APRIL 30, 2012
48
Schedule of Investments | Six-Month Period Ended April 30, 2012 (unaudited)
| SHARES | | DESCRIPTION | | COST (NOTE 1) | | VALUE (NOTE 1) | |
| International Common Stocks — 72.70% — (continued) | | | |
| France 8.24% — (continued) | | | |
| | 51,500 | | | Robertet SA CI (c)(e)(f) | | $ | 2,151,628 | | | $ | 6,133,265 | | |
| | 348,206 | | | Guyenne et Gascogne SA | | | 40,270,290 | | | | 37,321,855 | | |
| | 1,608,488 | | | Carrefour SA | | | 69,265,330 | | | | 32,298,956 | | |
| | 212,794 | | | Société BIC SA | | | 7,748,681 | | | | 23,430,247 | | |
| | 364,373 | | | Gaumont SA | | | 21,698,753 | | | | 21,986,342 | | |
| | 896,416 | | | Fregate (a)(c)(e)(g) | | | 23,119,325 | | | | 21,790,175 | | |
| | 442,830 | | | Société Foncière Financière et
de Participations | | | 29,139,582
| | | | 17,283,329
| | |
| | 118,996 | | | BioMerieux | | | 9,311,020 | | | | 9,756,313 | | |
| | 11,593,581 | | | FINEL (a)(b)(c)(e)(g)(h) | | | 9,165,470 | | | | 5,522,835 | | |
| | 100,000 | | | Sabeton SA | | | 1,463,142 | | | | 1,773,155 | | |
| | | | 858,949,838 | | | | 878,995,496 | | |
| Germany 4.58% | | | |
| | 3,619,240 | | | HeidelbergCement AG | | | 200,929,134 | | | | 198,917,758 | | |
| | 8,023,163 | | | Deutsche Wohnen AG (a) | | | 87,465,090 | | | | 117,897,918 | | |
| | 1,811,605 | | | Daimler AG | | | 86,510,108 | | | | 100,119,334 | | |
| | 1,523,903 | | | Hamburger Hafen und Logistik AG | | | 53,961,357 | | | | 50,513,448 | | |
| | 296,503 | | | Fraport AG | | | 8,930,449 | | | | 19,260,346 | | |
| | 10,320 | | | Pfeiffer Vacuum Technology AG | | | 262,791 | | | | 1,251,977 | | |
| | | | 438,058,929 | | | | 487,960,781 | | |
| Greece 0.44% | | | |
| | 9,753,438 | | | Jumbo SA (a) | | | 59,290,510 | | | | 47,365,895 | | |
| Hong Kong 0.83% | | | |
| | 7,806,340 | | | Guoco Group Limited | | | 57,283,838 | | | | 65,405,014 | | |
| | 8,166,100 | | | Hopewell Holdings Limited | | | 11,153,124 | | | | 21,946,789 | | |
| | 10,851,720 | | | City e-Solutions Limited (b)(c) | | | 323,358 | | | | 1,000,126 | | |
| | | | 68,760,320 | | | | 88,351,929 | | |
| Ireland 0.37% | | | |
| | 1,970,920 | | | CRH PLC | | | 32,976,584 | | | | 39,841,067 | | |
| Israel 0.25% | | | |
| | 2,302,220 | | | Israel Chemicals Limited | | | 24,102,992 | | | | 26,420,322 | | |
| Italy 0.37% | | | |
| | 7,315,306 | | | Italcementi S.p.A. RSP | | | 87,341,485 | | | | 22,186,514 | | |
| | 1,197,736 | | | Italmobiliare S.p.A. RSP | | | 50,324,929 | | | | 14,105,649 | | |
| | 168,142 | | | Italmobiliare S.p.A. | | | 19,250,153 | | | | 3,183,888 | | |
| | | | 156,916,567 | | | | 39,476,051 | | |
See Notes to Financial Statements.
FIRST EAGLE FUNDS | SEMI-ANNUAL REPORT | APRIL 30, 2012
49
Overseas Fund
| SHARES | | DESCRIPTION | | COST (NOTE 1) | | VALUE (NOTE 1) | |
| International Common Stocks — 72.70% — (continued) | | | |
| Japan 29.87% | | | |
| | 4,810,170 | | | Shimano, Inc. (a) | | $ | 79,407,045 | | | $ | 316,902,482 | | |
| | 1,309,840 | | | Fanuc Corporation | | | 119,983,748 | | | | 222,954,980 | | |
| | 1,193,590 | | | SMC Corporation | | | 153,637,312 | | | | 200,476,477 | | |
| | 4,170,700 | | | Secom Company Limited | | | 178,984,614 | | | | 198,505,261 | | |
| | 671,300 | | | Keyence Corporation | | | 120,027,879 | | | | 159,416,934 | | |
| | 7,316,700 | | | NKSJ Holdings, Inc. | | | 201,780,857 | | | | 151,667,566 | | |
| | 21,057 | | | KDDI Corporation | | | 134,141,915 | | | | 138,463,490 | | |
| | 7,175,100 | | | MS&AD Insurance Group Holdings | | | 169,497,975 | | | | 133,274,966 | | |
| | 3,260,440 | | | Astellas Pharma, Inc. | | | 133,084,592 | | | | 132,516,631 | | |
| | 2,253,100 | | | Ono Pharmaceutical Company Limited | | | 90,166,908 | | | | 127,555,261 | | |
| | 1,050,800 | | | Hirose Electric Company Limited | | | 115,774,722 | | | | 110,686,723 | | |
| | 4,092,170 | | | MISUMI Group, Inc. | | | 70,195,915 | | | | 96,256,203 | | |
| | 2,035,070 | | | Canon, Inc. | | | 97,083,761 | | | | 93,545,928 | | |
| | 3,910,930 | | | Hoya Corporation | | | 84,971,495 | | | | 90,131,653 | | |
| | 7,627,430 | | | Kansai Paint Company Limited | | | 60,795,887 | | | | 82,350,259 | | |
| | 3,498,960 | | | Nomura Research Institute Limited | | | 68,063,992 | | | | 80,856,478 | | |
| | 2,107,490 | | | Nissin Foods Holdings
Company Limited | | | 74,661,603
| | | | 79,321,236
| | |
| | 4,400,050 | | | Mitsubishi Estate Company Limited | | | 65,929,737 | | | | 78,477,846 | | |
| | 2,657,590 | | | Nitto Kohki Company Limited (a) | | | 46,435,145 | | | | 59,416,310 | | |
| | 2,485,480 | | | Daiichikosho Company Limited | | | 27,081,143 | | | | 50,120,526 | | |
| | 6,577,300 | | | Japan Wool Textile
Company Limited (a) | | | 49,871,284
| | | | 49,510,988
| | |
| | 2,023,800 | | | Chofu Seisakusho
Company Limited (a) | | | 33,120,144
| | | | 48,364,359
| | |
| | 793,980 | | | Shin-Etsu Chemical Company Limited | | | 37,295,453 | | | | 46,143,126 | | |
| | 3,206,911 | | | T. Hasegawa Company Limited (a) | | | 43,073,853 | | | | 45,468,728 | | |
| | 2,252,610 | | | THK Company Limited | | | 36,188,958 | | | | 45,255,341 | | |
| | 24,034 | | | NTT DoCoMo, Inc. | | | 36,485,166 | | | | 40,999,885 | | |
| | 1,570,700 | | | Ariake Japan Company Limited | | | 32,942,453 | | | | 31,713,031 | | |
| | 2,013,324 | | | Nagaileben Company Limited (a) | | | 19,961,972 | | | | 31,016,890 | | |
| | 1,286,140 | | | As One Corporation (a) | | | 26,246,127 | | | | 28,319,566 | | |
| | 1,549,790 | | | OSG Corporation | | | 17,248,953 | | | | 24,632,810 | | |
| | 2,068,330 | | | Maezawa Kasei Industries
Company Limited (a) | | | 31,939,631
| | | | 24,429,298
| | |
| | 2,535,900 | | | Yomeishu Seizo Company Limited (a) | | | 22,847,623 | | | | 24,329,902 | | |
| | 2,184,600 | | | Seikagaku Corporation | | | 17,648,500 | | | | 23,476,789 | | |
See Notes to Financial Statements.
FIRST EAGLE FUNDS | SEMI-ANNUAL REPORT | APRIL 30, 2012
50
Schedule of Investments | Six-Month Period Ended April 30, 2012 (unaudited)
| SHARES | | DESCRIPTION | | COST (NOTE 1) | | VALUE (NOTE 1) | |
| International Common Stocks — 72.70% — (continued) | | | |
| Japan 29.87% — (continued) | | | |
| | 1,058,246 | | | Matsumoto Yushi-Seiyaku
Company Limited (a)(c) | | $ | 25,950,562
| | | $ | 22,923,803
| | |
| | 508,106 | | | SK Kaken Company Limited | | | 9,470,131 | | | | 20,492,251 | | |
| | 793,336 | | | Meitec Corporation | | | 22,791,025 | | | | 16,355,599 | | |
| | 493,250 | | | Mandom Corporation | | | 6,249,764 | | | | 12,485,700 | | |
| | 2,387,843 | | | TOMONY Holdings, Inc. | | | 16,083,861 | | | | 10,946,274 | | |
| | 453,900 | | | Fuji Seal International, Inc. | | | 8,026,006 | | | | 8,743,715 | | |
| | 806,280 | | | Chudenko Corporation | | | 12,295,496 | | | | 8,179,945 | | |
| | 1,424,100 | | | Shingakukai Company Limited (a) | | | 10,266,277 | | | | 5,422,425 | | |
| | 832,570 | | | Sansei Yusoki Company Limited | | | 6,238,288 | | | | 4,171,192 | | |
| | 141,550 | | | Icom, Inc. | | | 2,901,480 | | | | 3,556,479 | | |
| | 486,400 | | | Asahi Broadcasting Corporation | | | 2,159,939 | | | | 2,717,114 | | |
| | 420,440 | | | Okumura Corporation | | | 1,988,349 | | | | 1,542,947 | | |
| | | | 2,620,997,540 | | | | 3,184,095,367 | | |
| Malaysia 0.67% | | | |
| | 56,223,130 | | | Genting Malaysia Berhad | | | 48,368,781 | | | | 71,347,263 | | |
| Mexico 2.63% | | | |
| | 7,987,622 | | | Grupo Televisa S.A.B., ADR | | | 158,160,868 | | | | 175,488,055 | | |
| | 2,246,692 | | | Industrias Peñoles S.A.B. de C.V. | | | 1,833,690 | | | | 105,409,897 | | |
| | | | 159,994,558 | | | | 280,897,952 | | |
| Netherlands 1.43% | | | |
| | 6,299,709 | | | TNT Express NV | | | 74,730,217 | | | | 76,358,594 | | |
| | 539,055 | | | HAL Trust | | | 18,095,972 | | | | 65,945,012 | | |
| | 2,340,827 | | | PostNL NV | | | 24,654,872 | | | | 10,153,604 | | |
| | | | 117,481,061 | | | | 152,457,210 | | |
| Norway 0.13% | | | |
| | 1,845,269 | | | Orkla ASA | | | 13,682,658 | | | | 13,549,882 | | |
| Singapore 2.51% | | | |
| | 23,192,830 | | | Haw Par Corporation Limited (a) | | | 76,875,317 | | | | 113,967,838 | | |
| | 70,167,015 | | | ComfortDelgro Corporation Limited | | | 68,385,814 | | | | 86,765,969 | | |
| | 16,373,450 | | | Singapore Airport Terminal
Services Limited | | | 18,528,182
| | | | 34,538,677
| | |
| | 5,640,520 | | | Fraser and Neave Limited | | | 6,680,505 | | | | 32,093,478 | | |
| | | | 170,469,818 | | | | 267,365,962 | | |
| South Africa 1.25% | | | |
| | 7,868,291 | | | Gold Fields Limited, ADR | | | 99,463,345 | | | | 101,264,905 | | |
| | 3,275,059 | | | Harmony Gold Mining
Company Limited, ADR | | | 30,822,097
| | | | 31,768,073
| | |
| | | | 130,285,442 | | | | 133,032,978 | | |
See Notes to Financial Statements.
FIRST EAGLE FUNDS | SEMI-ANNUAL REPORT | APRIL 30, 2012
51
Overseas Fund
| SHARES | | DESCRIPTION | | COST (NOTE 1) | | VALUE (NOTE 1) | |
| International Common Stocks — 72.70% — (continued) | | | |
| South Korea 2.14% | | | |
| | 1,318,522 | | | KT&G Corporation | | $ | 70,025,885 | | | $ | 90,536,275 | | |
| | 35,325 | | | Lotte Confectionery Company Limited | | | 12,445,892 | | | | 53,513,019 | | |
| | 186,884 | | | Nong Shim Company Limited | | | 43,886,371 | | | | 37,455,349 | | |
| | 872,463 | | | Fursys, Inc. (a) | | | 10,110,165 | | | | 23,546,175 | | |
| | 22,950 | | | Namyang Dairy Products
Company Limited | | | 4,912,653
| | | | 13,199,867
| | |
| | 784,738 | | | Dong Ah Tire & Rubber Company Limited | | | 2,731,347 | | | | 7,777,074 | | |
| | 139,510 | | | Teems, Inc. (a) | | | 1,095,526 | | | | 1,227,058 | | |
| | 3,675 | | | Amorepacific Group | | | 481,060 | | | | 925,152 | | |
| | | | 145,688,899 | | | | 228,179,969 | | |
| Spain 0.69% | | | |
| | 1,688,700 | | | Red Electrica Corporation SA | | | 84,248,760 | | | | 73,495,091 | | |
| Sweden 0.68% | | | |
| | 3,013,030 | | | Investor AB, Class 'A' | | | 59,333,861 | | | | 59,148,430 | | |
| | 654,517 | | | Investor AB, Class 'B' | | | 12,947,662 | | | | 13,043,423 | | |
| | | | 72,281,523 | | | | 72,191,853 | | |
| Switzerland 3.73% | | | |
| | 2,610,500 | | | Nestlé SA | | | 79,226,015 | | | | 159,867,606 | | |
| | 2,196,591 | | | Pargesa Holding SA | | | 115,479,876 | | | | 146,979,737 | | |
| | 193,016 | | | Rieter Holding AG | | | 26,177,079 | | | | 33,590,184 | | |
| | 707 | | | Lindt & Spruengli AG | | | 4,541,472 | | | | 27,691,288 | | |
| | 137,452 | | | Kuehne & Nagel International AG | | | 1,733,811 | | | | 16,698,927 | | |
| | 225,026 | | | Autoneum Holding AG (b) | | | 12,062,900 | | | | 12,417,450 | | |
| | | | 239,221,153 | | | | 397,245,192 | | |
| Taiwan 0.39% | | | |
| | 20,184,980 | | | Taiwan Secom Company Limited | | | 32,105,415 | | | | 41,463,916 | | |
| Thailand 2.13% | | | |
| | 465,099,885 | | | Thai Beverage PCL | | | 82,585,978 | | | | 124,046,684 | | |
| | 15,979,859 | | | Bangkok Bank PCL, NVDR | | | 56,870,621 | | | | 99,257,010 | | |
| | 250,000 | | | OHTL PCL (c) | | | 1,152,073 | | | | 3,902,439 | | |
| | | | 140,608,672 | | | | 227,206,133 | | |
| Turkey 0.21% | | | |
| | 3,205,889 | | | Yazicilar Holding AS | | | 21,541,251 | | | | 22,066,817 | | |
| United Kingdom 2.47% | | | |
| | 3,995,640 | | | GlaxoSmithKline PLC | | | 76,140,895 | | | | 92,447,215 | | |
| | 3,378,628 | | | Berkeley Group Holdings PLC (b) | | | 41,275,902 | | | | 70,271,969 | | |
| | 11,272,065 | | | WM Morrison Supermarkets PLC | | | 52,576,658 | | | | 51,355,123 | | |
| | 1,295,388 | | | Anglo American PLC | | | 32,786,526 | | | | 49,805,142 | | |
| | | | 202,779,981 | | | | 263,879,449 | | |
| Total International Common Stocks | | | 6,514,679,456 | | | | 7,750,198,629 | | |
See Notes to Financial Statements.
FIRST EAGLE FUNDS | SEMI-ANNUAL REPORT | APRIL 30, 2012
52
Schedule of Investments | Six-Month Period Ended April 30, 2012 (unaudited)
| SHARES | | DESCRIPTION | | COST (NOTE 1) | | VALUE (NOTE 1) | |
| U.S. Common Stock — 0.31% | | | |
| Materials 0.31% | | | |
| | 691,883 | | | Newmont Mining Corporation | | $ | 17,601,872 | | | $ | 32,968,225 | | |
| Total Common Stocks | | | 6,532,281,328 | | | | 7,783,166,854 | | |
| International Preferred Stocks — 1.38% | | | |
| Germany 0.81% | | | |
| | 1,160,182 | | | Hornbach Holding AG | | | 39,421,559 | | | | 85,971,817 | | |
| South Korea 0.57% | | | |
| | 75,023 | | | Samsung Electronics Company Limited | | | 9,052,295 | | | | 53,705,216 | | |
| | 27,183 | | | Namyang Dairy Products
Company Limited | | | 387,445
| | | | 7,167,821
| | |
| | | | 9,439,740 | | | | 60,873,037 | | |
| Total International Preferred Stocks | | | 48,861,299 | | | | 146,844,854 | | |
| OUNCES | | | | | | | |
| Commodity — 6.90% | | | |
| | 441,517 | | | Gold bullion (b) | | | 217,894,842 | | | | 735,536,841 | | |
| PRINCIPAL | | | | | | | |
| Term Loans — 0.08% | | | |
| Germany 0.08% | | | |
| 1,976,466
EUR | | | Pfleiderer AG Term Facility 1A
due 06/30/17 (b) | | | 1,973,783
| | | | 823,838
| | |
| 2,488,890
CAD | | | Pfleiderer AG Term Facility 2A
due 06/30/17 (b) | | | 1,843,818
| | | | 1,037,428
| | |
| 10,000,000
EUR | | | Pfleiderer AG Term Loan
due 01/07/13 | | | 10,395,510
| | | | 4,168,238
| | |
| 1,299,726
USD | | | Pfleiderer AG Revolving Credit Facility 1A
due 06/30/17 (b) | | | 946,291
| | | | 541,757
| | |
| 701,307
EUR | | | Pfleiderer AG Revolving Credit Facility 1A
due 06/30/17 (b) | | | 731,169
| | | | 292,321
| | |
| 218,754
CAD | | | Pfleiderer AG Revolving Credit Facility 1A
due 06/30/17 (b) | | | 162,057
| | | | 91,182
| | |
| 1,076,176
USD | | | Pfleiderer AG Revolving Credit Facility 2A
due 06/30/17 (b) | | | 783,531
| | | | 448,576
| | |
| 250,160
CAD | | | Pfleiderer AG Revolving Credit Facility 2A
due 06/30/12 (b) | | | 185,323
| | | | 104,273
| | |
| 168,813
EUR | | | Pfleiderer AG Revolving Credit Facility 2A
due 06/30/17 (b) | | | 171,701
| | | | 70,365
| | |
| 1,292,659
EUR | | | Pfleiderer AG Term Loan B
4.415% due 05/12/18 (c)(i) | | | 1,804,582
| | | | 1,479,593
| | |
| Total Term Loans | | | 18,997,765 | | | | 9,057,571 | | |
See Notes to Financial Statements.
FIRST EAGLE FUNDS | SEMI-ANNUAL REPORT | APRIL 30, 2012
53
Overseas Fund
| PRINCIPAL | | DESCRIPTION | | COST (NOTE 1) | | VALUE (NOTE 1) | |
| International Bonds — 3.57% | | | |
| International Corporate Bonds — 0.41% | | | |
| Canada 0.19% | | | |
| 33,554,000
USD | | | Catalyst Paper Corporation
7.375% due 03/01/14 (c)(j) | | $ | 24,961,832
| | | $ | 1,342,160
| | |
| 34,110,000
USD | | | Catalyst Paper Corporation
11.00% due 12/15/16 (c)(j)(k) | | | 30,320,584
| | | | 18,419,400
| | |
| | | | 55,282,416 | | | | 19,761,560 | | |
| France 0.22% | | | |
| 10,000,000
EUR | | | Emin Leydier SA FRN
6.01% due 07/31/16 (c)(e)(g)(i) | | | 14,284,902
| | | | 13,232,501
| | |
| 8,000,000
EUR | | | FINEL
9.50% due 06/30/17 (c)(e)(g) | | | 9,658,805
| | | | 7,939,501
| | |
| 1,950,000
EUR | | | Wendel SA
4.875% due 09/21/15 (l) | | | 1,775,397
| | | | 2,580,338
| | |
| | | | 25,719,104 | | | | 23,752,340 | | |
| Total International Corporate Bonds | | | 81,001,520 | | | | 43,513,900 | | |
| International Government Bonds — 3.16% | | | |
| France 0.21% | | | |
| 16,185,495
EUR | | | France Government Bond OAT
3.00% due 07/25/12 (m) | | | 19,499,262
| | | | 21,919,442
| | |
| Hong Kong 1.30% | | | |
| 137,300,000
HKD | | | Hong Kong Government Bond
0.48% due 09/03/12 | | | 17,718,300
| | | | 17,720,460
| | |
| 415,700,000
HKD | | | Hong Kong Government Bond
2.66% due 12/17/12 | | | 54,317,409
| | | | 54,424,229
| | |
| 359,500,000
HKD | | | Hong Kong Government Bond
4.20% due 09/17/12 | | | 46,972,163
| | | | 47,062,202
| | |
| 145,500,000
HKD | | | Hong Kong Government Bond
4.49% due 11/26/12 | | | 19,095,497
| | | | 19,220,347
| | |
| | | | 138,103,369 | | | | 138,427,238 | | |
| Singapore 0.91% | | | |
| 120,000,000
SGD | | | Singapore Government Bond
3.50% due 07/01/12 | | | 94,272,244
| | | | 97,496,193
| | |
| Taiwan 0.37% | | | |
| 582,300,000
TWD | | | Taiwan Government Bond
2.00% due 07/20/12 | | | 18,040,595
| | | | 19,990,004
| | |
| 574,500,000
TWD | | | Taiwan Government Bond
2.375% due 01/16/13 | | | 18,127,922
| | | | 19,894,200
| | |
| | | | 36,168,517 | | | | 39,884,204 | | |
| United Kingdom 0.37% | | | |
| 24,448,000
GBP | | | United Kingdom Gilt
5.25% due 06/07/12 | | | 39,292,189
| | | | 39,881,779
| | |
| Total International Government Bonds | | | 327,335,581 | | | | 337,608,856 | | |
| Total International Bonds | | | 408,337,101 | | | | 381,122,756 | | |
See Notes to Financial Statements.
FIRST EAGLE FUNDS | SEMI-ANNUAL REPORT | APRIL 30, 2012
54
Schedule of Investments | Six-Month Period Ended April 30, 2012 (unaudited)
| PRINCIPAL | | DESCRIPTION | | COST (NOTE 1) | | VALUE (NOTE 1) | |
| Commercial Paper — 14.02% | | | |
| International Commercial Paper — 8.90% | | | |
| Belgium 0.28% | | | |
| 30,000,000
USD | | | Anheuser Busch InBev WorldWide, Inc.
0.33% due 05/04/12 | | $ | 29,999,175
| | | $ | 29,999,175
| | |
| Canada 0.17% | | | |
| 6,832,000
USD | | | Potash Corporation of Saskatchewan
0.31% due 05/14/12 | | | 6,831,235
| | | | 6,831,235
| | |
| 7,179,000
USD | | | Potash Corporation of Saskatchewan
0.33% due 05/24/12 | | | 7,177,486
| | | | 7,177,486
| | |
| 4,348,000
USD | | | Potash Corporation of Saskatchewan
0.35% due 05/09/12 | | | 4,347,662
| | | | 4,347,662
| | |
| France 2.11% | | | |
| 5,089,000
USD | | | Air Liquide SA
0.19% due 06/29/12 | | | 5,087,415
| | | | 5,087,415
| | |
| 8,204,000
USD | | | EI du Pont de Nemours & Company
0.16% due 06/14/12 | | | 8,202,396
| | | | 8,202,396
| | |
| 3,156,000
USD | | | GDF Suez SA
0.20% due 05/08/12 | | | 3,155,877
| | | | 3,155,877
| | |
| 17,115,000
USD | | | GDF Suez SA
0.21% due 05/23/12 | | | 17,112,804
| | | | 17,112,804
| | |
| 9,742,000
USD | | | GDF Suez SA
0.21% due 05/25/12 | | | 9,740,636
| | | | 9,740,636
| | |
| 13,000,000
USD | | | Sanofi
0.10% due 05/04/12 | | | 12,999,892
| | | | 12,999,892
| | |
| 50,000,000
USD | | | Sanofi
0.12% due 05/10/12 | | | 49,998,500
| | | | 49,998,500
| | |
| 20,000,000
USD | | | Sanofi
0.13% due 05/04/12 | | | 19,999,783
| | | | 19,999,783
| | |
| 23,000,000
USD | | | Sanofi
0.13% due 05/10/12 | | | 22,999,252
| | | | 22,999,252
| | |
| 24,000,000
USD | | | Total SA
0.12% due 05/25/12 | | | 23,998,080
| | | | 23,998,080
| | |
| 35,000,000
USD | | | Total SA
0.13% due 05/25/12 | | | 34,996,967
| | | | 34,996,967
| | |
| 16,821,000
USD | | | Total SA
0.16% due 07/10/12 | | | 16,815,767
| | | | 16,809,156
| | |
| Germany 1.55% | | | |
| 30,000,000
USD | | | BASF AG
0.12% due 06/27/12 | | | 29,994,300
| | | | 29,994,300
| | |
| 55,000,000
USD | | | BASF AG
0.13% due 06/25/12 | | | 54,989,076
| | | | 54,989,076
| | |
| 8,432,000
USD | | | BMW
0.18% due 05/30/12 | | | 8,430,777
| | | | 8,430,777
| | |
See Notes to Financial Statements.
FIRST EAGLE FUNDS | SEMI-ANNUAL REPORT | APRIL 30, 2012
55
Overseas Fund
| PRINCIPAL | | DESCRIPTION | | COST (NOTE 1) | | VALUE (NOTE 1) | |
| International Commercial Paper — 8.90% — (continued) | | | |
| Germany 1.55% — (continued) | | | |
| 10,000,000
USD | | | Henkel Corporation
0.14% due 06/05/12 | | $ | 9,998,639
| | | $ | 9,998,639
| | |
| 5,000,000
USD | | | Henkel Corporation
0.16% due 06/12/12 | | | 4,999,067
| | | | 4,999,067
| | |
| 14,685,000
USD | | | Siemens Company
0.11% due 05/14/12 | | | 14,684,417
| | | | 14,684,417
| | |
| 15,000,000
USD | | | Siemens Company
0.12% due 05/02/12 | | | 14,999,950
| | | | 14,999,950
| | |
| 18,000,000
USD | | | Siemens Company
0.13% due 05/02/12 | | | 17,999,935
| | | | 17,999,935
| | |
| 8,874,000
USD | | | Siemens Company
0.13% due 05/07/12 | | | 8,873,808
| | | | 8,873,808
| | |
| Italy 0.20% | | | |
| 21,120,000
USD | | | Eni S.p.A.
0.71% due 08/15/12 | | | 21,076,470
| | | | 21,087,484
| | |
| Japan 0.61% | | | |
| 19,216,000
USD | | | Panasonic Corporation
0.32% due 05/11/12 | | | 19,214,292
| | | | 19,214,292
| | |
| 17,000,000
USD | | | Panasonic Corporation
0.33% due 05/07/12 | | | 16,999,065
| | | | 16,999,065
| | |
| 19,527,000
USD | | | Panasonic Corporation
0.33% due 05/18/12 | | | 19,523,957
| | | | 19,523,957
| | |
| 9,000,000
USD | | | Panasonic Corporation
0.48% due 05/21/12 | | | 8,997,650
| | | | 8,997,650
| | |
| Panama 0.12% | | | |
| 4,709,000
USD | | | Carnival Corporation
0.32% due 05/08/12 | | | 4,708,707
| | | | 4,708,707
| | |
| 8,199,000
USD | | | Carnival Corporation
0.38% due 05/22/12 | | | 8,197,230
| | | | 8,197,230
| | |
| Switzerland 2.56% | | | |
| 20,000,000
USD | | | Nestlé SA
0.08% due 05/03/12 | | | 19,999,911
| | | | 19,999,911
| | |
| 22,055,000
USD | | | Nestlé SA
0.13% due 05/29/12 | | | 22,052,770
| | | | 22,052,770
| | |
| 13,188,000
USD | | | Nestlé SA
0.13% due 06/11/12 | | | 13,186,047
| | | | 13,186,047
| | |
| 20,000,000
USD | | | Novartis International AG
0.12% due 05/11/12 | | | 19,999,333
| | | | 19,999,333
| | |
| 44,593,000
USD | | | Novartis International AG
0.12% due 05/15/12 | | | 44,590,919
| | | | 44,590,919
| | |
| 30,000,000
USD | | | Novartis International AG
0.18% due 06/11/12 | | | 29,993,850
| | | | 29,993,850
| | |
See Notes to Financial Statements.
FIRST EAGLE FUNDS | SEMI-ANNUAL REPORT | APRIL 30, 2012
56
Schedule of Investments | Six-Month Period Ended April 30, 2012 (unaudited)
| PRINCIPAL | | DESCRIPTION | | COST (NOTE 1) | | VALUE (NOTE 1) | |
| International Commercial Paper — 8.90% — (continued) | | | |
| Switzerland 2.56% — (continued) | | | |
| 18,000,000
USD | | | Novartis International AG
0.19% due 08/08/12 | | $ | 17,990,595
| | | $ | 17,977,000
| | |
| 20,000,000
USD | | | Roche Holdings, Inc.
0.06% due 06/13/12 | | | 19,998,567
| | | | 19,998,567
| | |
| 25,000,000
USD | | | Roche Holdings, Inc.
0.07% due 05/15/12 | | | 24,999,319
| | | | 24,999,319
| | |
| 25,000,000
USD | | | Roche Holdings, Inc.
0.08% due 06/14/12 | | | 24,997,556
| | | | 24,997,556
| | |
| 25,000,000
USD | | | Roche Holdings, Inc.
0.09% due 07/10/12 | | | 24,995,625
| | | | 24,991,420
| | |
| 10,000,000
USD | | | Roche Holdings, Inc.
0.10% due 08/15/12 | | | 9,997,056
| | | | 9,994,481
| | |
| United Kingdom 1.30% | | | |
| 30,000,000
USD | | | BP PLC
0.23% due 05/08/12 | | | 29,998,658
| | | | 29,998,658
| | |
| 10,000,000
USD | | | BP PLC
0.25% due 05/14/12 | | | 9,999,097
| | | | 9,999,097
| | |
| 7,000,000
USD | | | BP PLC
0.31% due 05/14/12 | | | 6,999,217
| | | | 6,999,217
| | |
| 14,751,000
USD | | | BP PLC
0.33% due 07/02/12 | | | 14,742,616
| | | | 14,748,290
| | |
| 5,445,000
USD | | | BP PLC
0.35% due 06/22/12 | | | 5,442,326
| | | | 5,442,326
| | |
| 10,000,000
USD | | | BP PLC
0.47% due 09/17/12 | | | 9,982,239
| | | | 9,992,222
| | |
| 20,000,000
USD | | | BP PLC
0.49% due 08/20/12 | | | 19,970,400
| | | | 19,989,298
| | |
| 10,000,000
USD | | | Reckitt Benckiser Group PLC
0.59% due 06/06/12 | | | 9,994,200
| | | | 9,994,200
| | |
| 25,000,000
USD | | | Reed Elsevier, Inc.
0.45% due 05/24/12 | | | 24,992,972
| | | | 24,992,972
| | |
| 6,362,000
USD | | | Reed Elsevier, Inc.
0.46% due 05/23/12 | | | 6,360,251
| | | | 6,360,251
| | |
| Total International Commercial Paper | | | 948,433,791 | | | | 948,452,374 | | |
| U.S. Commercial Paper — 5.12% | | | |
| $ | 20,000,000 | | | Abbott Laboratories
0.11% due 05/22/12 | | | 19,998,717
| | | | 19,998,717
| | |
| | 10,648,000 | | | Abbott Laboratories
0.11% due 06/06/12 | | | 10,646,829
| | | | 10,646,829
| | |
| | 9,706,000 | | | Abbott Laboratories
0.13% due 07/10/12 | | | 9,703,546
| | | | 9,704,315
| | |
| | 4,683,000 | | | Archer Daniels Midland Company
0.12% due 05/11/12 | | | 4,682,844
| | | | 4,682,844
| | |
See Notes to Financial Statements.
FIRST EAGLE FUNDS | SEMI-ANNUAL REPORT | APRIL 30, 2012
57
Overseas Fund
| PRINCIPAL | | DESCRIPTION | | COST (NOTE 1) | | VALUE (NOTE 1) | |
| U.S. Commercial Paper — 5.12% — (continued) | | | |
| $ | 6,964,000 | | | Archer Daniels Midland Company
0.12% due 05/21/12 | | $ | 6,963,536
| | | $ | 6,963,536
| | |
| | 25,000,000 | | | Archer Daniels Midland Company
0.13% due 05/02/12 | | | 24,999,910
| | | | 24,999,910
| | |
| | 36,587,000 | | | Arrow Electronics, Inc.
0.66% due 05/01/12 | | | 36,587,000
| | | | 36,587,000
| | |
| | 19,936,000 | | | Avery Dennison Corporation
0.41% due 05/01/12 | | | 19,936,000
| | | | 19,936,000
| | |
| | 12,724,000 | | | Caterpillar Corporation
0.12% due 05/25/12 | | | 12,722,982
| | | | 12,722,982
| | |
| | 8,411,000 | | | ConocoPhillips
0.22% due 07/18/12 | | | 8,406,991
| | | | 8,408,563
| | |
| | 8,617,000 | | | ConocoPhillips
0.23% due 05/07/12 | | | 8,616,670
| | | | 8,616,670
| | |
| | 5,368,000 | | | ConocoPhillips
0.23% due 07/11/12 | | | 5,365,565
| | | | 5,366,712
| | |
| | 5,416,000 | | | Dell, Inc.
0.15% due 05/07/12 | | | 5,415,865
| | | | 5,415,865
| | |
| | 5,000,000 | | | Dell, Inc.
0.15% due 05/29/12 | | | 4,999,417
| | | | 4,999,417
| | |
| | 8,874,000 | | | General Electric Corporation
0.07% due 05/03/12 | | | 8,873,965
| | | | 8,873,965
| | |
| | 20,000,000 | | | Google, Inc.
0.08% due 05/11/12 | | | 19,999,555
| | | | 19,999,555
| | |
| | 7,000,000 | | | Honeywell International, Inc.
0.12% due 06/27/12 | | | 6,998,670
| | | | 6,998,670
| | |
| | 12,000,000 | | | Honeywell International, Inc.
0.12% due 06/28/12 | | | 11,997,680
| | | | 11,997,680
| | |
| | 5,000,000 | | | Honeywell International, Inc.
0.13% due 06/26/12 | | | 4,998,989
| | | | 4,998,989
| | |
| | 10,000,000 | | | Honeywell International, Inc.
0.20% due 09/26/12 | | | 9,991,778
| | | | 9,991,350
| | |
| | 20,000,000 | | | Johnson & Johnson
0.09% due 05/24/12 | | | 19,998,850
| | | | 19,998,850
| | |
| | 8,411,000 | | | Johnson & Johnson
0.10% due 07/09/12 | | | 8,409,388
| | | | 8,409,577
| | |
| | 10,646,000 | | | Johnson & Johnson
0.10% due 08/13/12 | | | 10,642,924
| | | | 10,641,809
| | |
| | 2,825,000 | | | Kraft Foods, Inc.
0.28% due 05/03/12 | | | 2,824,956
| | | | 2,824,956
| | |
| | 6,108,000 | | | Medtronic, Inc.
0.09% due 05/17/12 | | | 6,107,756
| | | | 6,107,756
| | |
| | 5,168,000 | | | Medtronic, Inc.
0.10% due 05/08/12 | | | 5,167,899
| | | | 5,167,899
| | |
See Notes to Financial Statements.
FIRST EAGLE FUNDS | SEMI-ANNUAL REPORT | APRIL 30, 2012
58
Schedule of Investments | Six-Month Period Ended April 30, 2012 (unaudited)
| PRINCIPAL | | DESCRIPTION | | COST (NOTE 1) | | VALUE (NOTE 1) | |
| U.S. Commercial Paper — 5.12% — (continued) | | | |
| $ | 11,691,000 | | | Medtronic, Inc.
0.10% due 06/21/12 | | $ | 11,689,344
| | | $ | 11,689,344
| | |
| | 35,000,000 | | | Merck & Company, Inc.
0.08% due 05/11/12 | | | 34,999,222
| | | | 34,999,222
| | |
| | 10,000,000 | | | Merck & Company, Inc.
0.08% due 05/17/12 | | | 9,999,644
| | | | 9,999,644
| | |
| | 15,000,000 | | | Merck & Company, Inc.
0.08% due 05/21/12 | | | 14,999,333
| | | | 14,999,333
| | |
| | 5,651,000 | | | Merck & Company, Inc.
0.10% due 06/08/12 | | | 5,650,403
| | | | 5,650,403
| | |
| | 19,250,000 | | | Merck & Company, Inc.
0.12% due 05/21/12 | | | 19,248,717
| | | | 19,248,717
| | |
| | 17,435,000 | | | Merck & Company, Inc.
0.12% due 07/03/12 | | | 17,431,339
| | | | 17,432,613
| | |
| | 13,996,000 | | | Merck & Company, Inc.
0.13% due 07/06/12 | | | 13,992,664
| | | | 13,993,864
| | |
| | 4,579,000 | | | NYSE Euronext, Inc.
0.40% due 05/18/12 | | | 4,578,135
| | | | 4,578,135
| | |
| | 7,295,000 | | | Parker-Hannifin Corporation
0.16% due 05/04/12 | | | 7,294,903
| | | | 7,294,903
| | |
| | 4,009,000 | | | Philip Morris International, Inc.
0.16% due 05/09/12 | | | 4,008,857
| | | | 4,008,857
| | |
| | 25,000,000 | | | Proctor & Gamble Company
0.13% due 06/13/12 | | | 24,996,118
| | | | 24,996,118
| | |
| | 19,936,000 | | | Safeway, Inc.
0.66% due 05/01/12 | | | 19,936,000
| | | | 19,936,000
| | |
| | 8,874,000 | | | Sysco Corporation
0.15% due 05/02/12 | | | 8,873,963
| | | | 8,873,963
| | |
| | 9,230,000 | | | Verizon Communications, Inc.
0.30% due 05/14/12 | | | 9,229,000
| | | | 9,229,000
| | |
| | 14,006,000 | | | Wal-Mart Stores, Inc.
0.09% due 05/18/12 | | | 14,005,405
| | | | 14,005,405
| | |
| | 14,148,000 | | | Walt Disney Company
0.11% due 06/18/12 | | | 14,145,925
| | | | 14,145,925
| | |
| | 15,949,000 | | | Western Union Company
0.38% due 05/01/12 | | | 15,949,000
| | | | 15,949,000
| | |
| Total U.S. Commercial Paper | | | 546,086,254 | | | | 546,090,862 | | |
| Total Commercial Paper | | | 1,494,520,045 | | | | 1,494,543,236 | | |
| Total Investments — 98.96% | | $ | 8,720,892,380 | | | | 10,550,272,112 | | |
| Other Assets in Excess of Liabilities — 1.04% | | | | | 110,655,629 | | |
| Net Assets — 100.00% | | | | $ | 10,660,927,741 | | |
See Notes to Financial Statements.
FIRST EAGLE FUNDS | SEMI-ANNUAL REPORT | APRIL 30, 2012
59
Overseas Fund
(a) An affiliate of the Fund as defined by the Investment Company Act of 1940. An affiliate is defined as a company in which the Fund directly or indirectly owns, controls, or holds power to vote 5% or more of the outstanding voting securities.
(b) Non-income producing security/commodity.
(c) Security is deemed illiquid. At April 30, 2012, the value of these securities amounted to $105,016,135 or 0.99% of net assets.
(d) Represents variable voting shares.
(e) Securities valued in accordance with fair value procedures under the supervision of the Board of Trustees, representing $54,618,277 or 0.51% of net assets.
(f) Represents non-voting class of shares.
(g) Represents securities that are subject to legal or contractual restrictions on resale. At April 30, 2012, the value of these securities amounted to $48,485,012 or 0.45% of net assets.
(h) Held through Financiere Bleue, LLC, wholly owned subsidiary and disregarded entity for U.S. tax purposes.
(i) Floating rate security. Rate shown is the rate in effect at April 30, 2012.
(j) Issuer is in default.
(k) All or a portion of the security is exempt from registration under the Securities Act of 1933. Rule 144A securities may only be sold to qualified institutional buyers, pursuant to Rule 144A under the Securities Act of 1933.
(l) Represents a security registered under Regulation S. Bonds sold under Regulation S may not be offered, sold or delivered within the U.S., or for the account or benefit of, U.S. persons, except pursuant to an exemption from, or in a transaction not subject to, the registration requirements of the Securities Act of 1933.
(m) Inflation protected security.
At April 30, 2012, cost is substantially identical for both book and federal income tax purposes. Net unrealized appreciation consisted of:
| Gross unrealized appreciation | | $ | 2,413,871,695 | | |
| Gross unrealized depreciation | | | (584,491,963 | ) | |
| Net unrealized appreciation | | $ | 1,829,379,732 | | |
Abbreviations used in this schedule include:
ADR — American Depository Receipt
FRN — Floating Rate Note
NVDR — Non-Voting Depository Receipt
NYSE — New York Stock Exchange
OAT — French Treasury Obligation
PCL — Public Company Limited
PLC — Public Limited Company
RSP — Represents Non-Voting Shares
Currencies
CAD — Canadian Dollar
EUR — Euro
GBP — British Pound
HKD — Hong Kong Dollar
SGD — Singapore Dollar
TWD — Taiwan Dollar
USD — United States Dollar
See Notes to Financial Statements.
FIRST EAGLE FUNDS | SEMI-ANNUAL REPORT | APRIL 30, 2012
60
Schedule of Investments | Six-Month Period Ended April 30, 2012 (unaudited)
| RESTRICTED SECURITIES | | ACQUISITION
DATE | | COST | | CARRYING VALUE PER
SHARE/PRINCIPAL | |
| Emin Leydier SA FRN 6.01% due 07/31/16 | | 07/30/09 | | $ | 14,284,902 | | | $ | 1.32 | | |
| FINEL 9.50% due 06/30/17 | | 06/22/05 | | | 9,658,805 | | | | 0.99 | | |
| FINEL | | 07/14/99 | | | 9,165,470 | | | | 0.48 | | |
| Fregate | | 04/30/04 | | | 23,119,325 | | | | 24.31 | | |
Foreign Currency Exchange Contracts — Sales
SETTLEMENT
DATES
THROUGH | | FOREIGN CURRENCY
TO BE DELIVERED | | U.S. $
TO BE
RECEIVED | | U.S. $ VALUE
AT APRIL 30,
2012 | | UNREALIZED
APPRECIATION
AT APRIL 30,
2012 | | UNREALIZED
DEPRECIATION
AT APRIL 30,
2012 | |
| 07/18/12 | | | 167,687,000 | | | Euro | | $ | 223,865,114 | | | $ | 221,960,487 | | | $ | 1,904,627 | | | $ | — | | |
| 08/15/12 | | | 213,244,000 | | | Euro | | | 284,885,708 | | | | 282,269,610 | | | | 2,616,098 | | | | — | | |
| 09/12/12 | | | 129,656,000 | | | Euro | | | 169,768,973 | | | | 171,731,971 | | | | — | | | | (1,962,998 | ) | |
| 10/17/12 | | | 50,575,000 | | | Euro | | | 66,736,241 | | | | 67,012,841 | | | | — | | | | (276,600 | ) | |
| 06/13/12 | | | 28,549,187,000 | | | Japanese Yen | | | 368,807,622 | | | | 357,662,368 | | | | 11,145,254 | | | | — | | |
| 08/15/12 | | | 46,344,017,000 | | | Japanese Yen | | | 595,039,079 | | | | 580,991,937 | | | | 14,047,142 | | | | — | | |
| 09/12/12 | | | 24,920,285,000 | | | Japanese Yen | | | 309,663,209 | | | | 312,604,282 | | | | — | | | | (2,941,073 | ) | |
| 10/17/12 | | | 13,316,567,000 | | | Japanese Yen | | | 165,174,917 | | | | 167,134,208 | | | | — | | | | (1,959,291 | ) | |
| | | | | | | $ | 2,183,940,863 | | | $ | 2,161,367,704 | | | $ | 29,713,121 | | | $ | (7,139,962 | ) | |
Foreign Currency Exchange Contracts — Purchases
SETTLEMENT
DATES
THROUGH | | FOREIGN CURRENCY
TO BE RECEIVED | | U.S. $
TO BE
DELIVERED | | U.S. $ VALUE
AT APRIL 30,
2012 | | UNREALIZED
APPRECIATION
AT APRIL 30,
2012 | | UNREALIZED
DEPRECIATION
AT APRIL 30,
2012 | |
| 05/16/12 | | | 35,400,000 | | | Euro | | $ | 46,154,520 | | | $ | 46,845,357 | | | $ | 690,837 | | | $ | — | | |
| Affiliated Securities | |
AFFILIATED
SECURITIES | | SHARES
OCTOBER 31,
2011 | | GROSS
ADDITIONS | | GROSS
REDUCTIONS | | SHARES
APRIL 30,
2012 | | MARKET VALUE
APRIL 30,
2012 | | REALIZED
GAIN/(LOSS) | | DIVIDEND
INCOME | |
As One
Corporation | | | 1,286,140 | | | | — | | | | — | | | | 1,286,140 | | | $ | 28,319,566 | | | $ | — | | | $ | 659,276 | | |
Chofu
Seisakusho
Company
Limited | | | 2,023,800 | | | | — | | | | — | | | | 2,023,800 | | | | 48,364,359 | | | | — | | | | 362,088 | | |
Deutsche
Wohnen AG | | | 6,418,531 | | | | 1,604,632 | | | | — | | | | 8,023,163 | | | | 117,897,918 | | | | — | | | | — | | |
| FINEL | | | 11,593,581 | | | | — | | | | — | | | | 11,593,581 | | | | 5,522,835 | | | | — | | | | — | | |
| Fregate | | | 895,904 | | | | 512 | | | | — | | | | 896,416 | | | | 21,790,175 | | | | — | | | | 13,724,302 | | |
| Fursys, Inc. | | | 872,463 | | | | — | | | | — | | | | 872,463 | | | | 23,546,175 | | | | — | | | | 441,271 | | |
Haw Par
Corporation
Limited | | | 23,192,830 | | | | — | | | | — | | | | 23,192,830 | | | | 113,967,838 | | | | — | | | | — | | |
| Icom, Inc.* | | | 815,690 | | | | — | | | | 674,140 | | | | 141,550 | | | | 3,556,479 | | | | (1,421,876 | ) | | | 26,720 | | |
See Notes to Financial Statements.
FIRST EAGLE FUNDS | SEMI-ANNUAL REPORT | APRIL 30, 2012
61
Overseas Fund
| Affiliated Securities — (continued) | |
AFFILIATED
SECURITIES | | SHARES
OCTOBER 31,
2011 | | GROSS
ADDITIONS | | GROSS
REDUCTIONS | | SHARES
APRIL 30,
2012 | | MARKET VALUE
APRIL 30,
2012 | | REALIZED
GAIN/(LOSS) | | DIVIDEND
INCOME | |
Japan Wool
Textile
Company
Limited | | | 6,577,300 | | | | — | | | | — | | | | 6,577,300 | | | $ | 49,510,988 | | | $ | — | | | $ | 784,518 | | |
| Jumbo SA | | | 7,182,037 | | | | 2,571,401 | | | | — | | | | 9,753,438 | | | | 47,365,895 | | | | — | | | | 2,074,071 | | |
Laurent-
Perrier | | | 558,938 | | | | — | | | | — | | | | 558,938 | | | | 56,388,232 | | | | — | | | | — | | |
Maezawa
Kasei
Industries
Company
Limited | | | 2,068,330 | | | | — | | | | — | | | | 2,068,330 | | | | 24,429,298 | | | | — | | | | 290,014 | | |
Matsumoto
Yushi-Seiyaku
Company
Limited | | | 1,058,246 | | | | — | | | | — | | | | 1,058,246 | | | | 22,923,803 | | | | — | | | | 593,660 | | |
Nagaileben
Company
Limited | | | 2,013,324 | | | | — | | | | — | | | | 2,013,324 | | | | 31,016,890 | | | | — | | | | — | | |
Nitto Kohki
Company
Limited | | | 2,657,590 | | | | — | | | | — | | | | 2,657,590 | | | | 59,416,310 | | | | — | | | | 476,976 | | |
| Robertet SA | | | 235,837 | | | | — | | | | — | | | | 235,837 | | | | 37,448,562 | | | | — | | | | — | | |
Sansei Yusoki
Company
Limited* | | | 1,215,770 | | | | — | | | | 383,200 | | | | 832,570 | | | | 4,171,192 | | | | (2,039,385 | ) | | | 70,361 | | |
| Shimano, Inc. | | | 4,886,870 | | | | — | | | | 76,700 | | | | 4,810,170 | | | | 316,902,482 | | | | 3,180,938 | | | | 1,778,497 | | |
Shingakukai
Company
Limited | | | 1,424,100 | | | | — | | | | — | | | | 1,424,100 | | | | 5,422,425 | | | | — | | | | 159,780 | | |
Spotless
Group
Limited | | | 15,791,758 | | | | — | | | | — | | | | 15,791,758 | | | | 42,116,751 | | | | — | | | | 847,070 | | |
Sucrière de
Pithiviers-
Le-Vieil* | | | 39,143 | | | | — | | | | 39,143 | | | | — | | | | — | | | | 72,548,333 | | | | — | | |
T. Hasegawa
Company
Limited | | | 3,206,911 | | | | — | | | | — | | | | 3,206,911 | | | | 45,468,728 | | | | — | | | | 359,688 | | |
| Teems, Inc. | | | 146,969 | | | | — | | | | 7,459 | | | | 139,510 | | | | 1,227,058 | | | | (106,523 | ) | | | 21,238 | | |
Wienerberger
AG | | | 5,294,031 | | | | 621,755 | | | | — | | | | 5,915,786 | | | | 68,863,486 | | | | — | | | | — | | |
Yomeishu
Seizo
Company
Limited | | | 2,535,900 | | | | — | | | | — | | | | 2,535,900 | | | | 24,329,902 | | | | — | | | | 512,136 | | |
| Total | | | | | | | | | | $ | 1,199,967,347 | | | $ | 72,161,487 | | | $ | 23,181,666 | | |
* Represents an unaffiliated issuer as of April 30, 2012, as such, amounts represented above will not agree to balances in the Statements of Assets and Liabilities and Statements of Operations.
See Notes to Financial Statements.
FIRST EAGLE FUNDS | SEMI-ANNUAL REPORT | APRIL 30, 2012
62
Schedule of Investments | Six-Month Period Ended April 30, 2012 (unaudited)
| INDUSTRY DIVERSIFICATION FOR PORTFOLIO HOLDINGS | | PERCENT OF
NET ASSETS | |
| International Common Stocks | |
| Consumer Discretionary | | | 11.41 | % | |
| Consumer Staples | | | 7.83 | | |
| Energy | | | 3.59 | | |
| Financials | | | 9.72 | | |
| Health Care | | | 5.36 | | |
| Industrials | | | 16.89 | | |
| Information Technology | | | 5.51 | | |
| Materials | | | 10.01 | | |
| Telecommunication Services | | | 1.69 | | |
| Utilities | | | 0.69 | | |
| Total International Common Stocks | | | 72.70 | | |
| U.S. Common Stock | |
| Materials | | | 0.31 | | |
| Total U.S. Common Stock | | | 0.31 | | |
| International Preferred Stocks | |
| Consumer Discretionary | | | 0.81 | | |
| Consumer Staples | | | 0.07 | | |
| Information Technology | | | 0.50 | | |
| Total International Preferred Stocks | | | 1.38 | | |
| Commodity | | | 6.90 | | |
| Term Loans | | | 0.08 | | |
| International Bonds | |
| Financials | | | 0.10 | | |
| Government Issues | | | 3.16 | | |
| Materials | | | 0.31 | | |
| Total International Bonds | | | 3.57 | | |
| Commercial Paper | |
| International Commercial Paper | | | 8.90 | | |
| U.S. Commercial Paper | | | 5.12 | | |
| Total Commercial Paper | | | 14.02 | | |
| Total Investments | | | 98.96 | % | |
See Notes to Financial Statements.
FIRST EAGLE FUNDS | SEMI-ANNUAL REPORT | APRIL 30, 2012
63

Fund Overview | Data as of April 30, 2012 (unaudited)
INVESTMENT OBJECTIVE
The First Eagle U.S. Value Fund seeks long-term growth of capital by investing, under normal market conditions, at least 80% of its assets in domestic equity and debt securities. Management utilizes a highly disciplined, bottom-up, value-oriented approach in achieving its investment objective.
| Average Annual Returns | |
| | | ONE-YEAR | | FIVE-YEARS | | TEN-YEARS | |
First Eagle U.S. Value
Fund (A Shares) | |
| without sales charge | | | 4.84 | % | | | 5.16 | % | | | 8.00 | % | |
| with sales charge | | | –0.41 | | | | 4.09 | | | | 7.44 | | |
Standard & Poor's
500 Index | | | 4.76 | | | | 1.01 | | | | 4.71 | | |
| Consumer Price Index | | | 2.30 | | | | 2.17 | | | | 2.49 | | |
Asset Allocation*
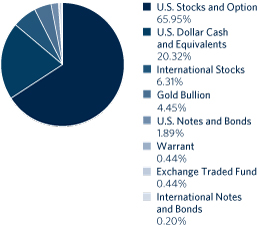
| Sector/Industry* | |
| Financials | | | 17.51 | % | |
| Information Technology | | | 14.58 | | |
| Materials | | | 13.10 | | |
| Industrials | | | 9.51 | | |
| Consumer Discretionary | | | 6.02 | | |
| Consumer Staples | | | 5.91 | | |
| Energy | | | 5.69 | | |
| Utilities | | | 3.29 | | |
| Health Care | | | 3.21 | | |
| Warrant | | | 0.44 | | |
| Exchange Traded Fund | | | 0.44 | | |
* Asset Allocation and Sector/Industry percentages are based on total investments in the portfolio. Sector/Industry allocations exclude short term investments and options positions.
The Fund's portfolio composition is subject to change at any time.
FIRST EAGLE FUNDS | SEMI-ANNUAL REPORT | APRIL 30, 2012
64
U.S. Value Fund
Growth of a $10,000 Initial Investment
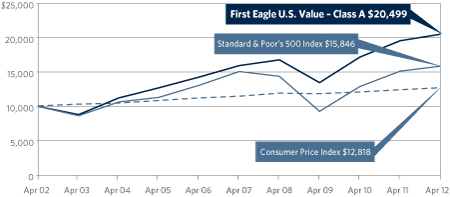
Performance data quoted herein represents past performance and should not be considered indicative of future results. Performance data quoted herein does not reflect the deduction of taxes that a shareholder would pay on Fund distributions or the sale of Fund shares. The average annual returns shown above are historical and reflect changes in share price, reinvested dividends and are net of expenses.
The average annual returns for Class A Shares with a sales charge gives effect to the deduction of the maximum sales charge of 5.00%.
The Standard & Poor's 500 Index is a widely recognized unmanaged index including a representative sample of 500 leading companies in leading sectors of the U.S. economy and is not available for purchase. Although the Standard & Poor's 500 Index focuses on the large-cap segment of the market, with approximately 75% coverage of U.S. equities, it is also considered a proxy for the total market. The Consumer Price Index (CPI) represents the change in price of all goods and services purchased for consumption by urban households.
| Top 10 Holdings* | |
| Gold Bullion (precious metal) | | | 4.43 | % | |
| Cisco Systems, Inc. (U.S. computer communications company) | | | 2.91 | | |
| Microsoft Corporation (U.S. software developer) | | | 2.79 | | |
| Comcast Corporation, Class 'A' (U.S. cable/satellite television company) | | | 2.69 | | |
| Sysco Corporation (U.S. food services distributor) | | | 2.61 | | |
| Bank of New York Mellon Corporation (U.S. financial services company) | | | 2.30 | | |
| ConocoPhillips (U.S. energy company) | | | 2.30 | | |
| FirstEnergy Corporation (U.S. diversified energy company) | | | 2.05 | | |
| 3M Company (U.S. industrial conglomerate) | | | 2.00 | | |
| Cintas Corporation (U.S. uniform designer and manufacturer) | | | 1.77 | | |
| Total | | | 25.85 | % | |
* Holdings in cash, commercial paper, money market funds and other short term cash equivalents have been excluded. Percentages are based on total net assets.
FIRST EAGLE FUNDS | SEMI-ANNUAL REPORT | APRIL 30, 2012
65
First Eagle U.S. Value Fund
| SHARES | | DESCRIPTION | | COST (NOTE 1) | | VALUE (NOTE 1) | |
| Common Stocks — 71.81% | | | |
| U.S. Common Stocks — 65.52% | | | |
| Consumer Discretionary 5.28% | | | |
| | 2,438,946 | | | Comcast Corporation, Class 'A' | | $ | 44,510,095 | | | $ | 72,753,759 | | |
| | 865,380 | | | Omnicom Group, Inc. | | | 29,142,116 | | | | 44,402,648 | | |
| | 265,270 | | | Home Depot, Inc. | | | 6,637,007 | | | | 13,738,333 | | |
| | 441,276 | | | International Speedway
Corporation, Class 'A' | | | 13,039,953
| | | | 11,777,656
| | |
| | 590 | | | St. John Knits International, Inc. (a)(b) | | | 18,290 | | | | 3,334 | | |
| | | | 93,347,461 | | | | 142,675,730 | | |
| Consumer Staples 5.74% | | | |
| | 2,440,500 | �� | | Sysco Corporation | | | 69,941,483 | | | | 70,530,450 | | |
| | 230,910 | | | Lorillard, Inc. | | | 18,274,767 | | | | 31,239,814 | | |
| | 310,470 | | | Colgate-Palmolive Company | | | 24,884,464 | | | | 30,717,902 | | |
| | 384,634 | | | Wal-Mart Stores, Inc. | | | 18,668,026 | | | | 22,658,789 | | |
| | | | 131,768,740 | | | | 155,146,955 | | |
| Energy 3.72% | | | |
| | 866,408 | | | ConocoPhillips | | | 50,515,022 | | | | 62,060,805 | | |
| | 182,753 | | | Apache Corporation | | | 12,681,438 | | | | 17,533,323 | | |
| | 109,071 | | | SEACOR Holdings, Inc. (a) | | | 8,291,938 | | | | 10,135,968 | | |
| | 350,718 | | | San Juan Basin Royalty Trust | | | 10,175,122 | | | | 5,941,163 | | |
| | 94,454 | | | Helmerich & Payne, Inc. | | | 1,871,008 | | | | 4,853,991 | | |
| | | | 83,534,528 | | | | 100,525,250 | | |
| Financials 16.90% | | | |
| | 2,634,204 | | | Bank of New York Mellon Corporation | | | 64,331,532 | | | | 62,298,925 | | |
| | 1,322,150 | | | Cincinnati Financial Corporation | | | 35,979,608 | | | | 47,094,983 | | |
| | 767,090 | | | American Express Company | | | 24,587,690 | | | | 46,186,489 | | |
| | 1,388,386 | | | BB&T Corporation | | | 34,964,656 | | | | 44,483,888 | | |
| | 350 | | | Berkshire Hathaway, Inc., Class 'A' (a) | | | 34,177,989 | | | | 42,280,000 | | |
| | 117,066 | | | Alleghany Corporation (a) | | | 34,293,700 | | | | 40,141,931 | | |
| | 1,802,569 | | | Weyerhaeuser Company REIT | | | 29,787,045 | | | | 36,700,305 | | |
| | 1,133,543 | | | U.S. Bancorp | | | 28,174,022 | | | | 36,466,078 | | |
| | 753,107 | | | Plum Creek Timber Company, Inc., REIT | | | 26,873,535 | | | | 31,660,618 | | |
| | 671,735 | | | WR Berkley Corporation | | | 18,780,775 | | | | 25,297,540 | | |
| | 370,729 | | | Rayonier, Inc., REIT | | | 8,796,435 | | | | 16,812,560 | | |
| | 30,859 | | | Mastercard, Inc., Class 'A' | | | 7,849,654 | | | | 13,956,600 | | |
| | 111,272 | | | Visa, Inc., Class 'A' | | | 8,072,605 | | | | 13,684,231 | | |
| | | | 356,669,246 | | | | 457,064,148 | | |
See Notes to Financial Statements.
FIRST EAGLE FUNDS | SEMI-ANNUAL REPORT | APRIL 30, 2012
66
Schedule of Investments | Six-Month Period Ended April 30, 2012 (unaudited)
| SHARES | | DESCRIPTION | | COST (NOTE 1) | | VALUE (NOTE 1) | |
| U.S. Common Stocks — 65.52% — (continued) | | | |
| Health Care 2.05% | | | |
| | 551,680 | | | WellPoint, Inc. | | $ | 30,538,715 | | | $ | 37,414,938 | | |
| | 276,970 | | | Johnson & Johnson | | | 16,704,054 | | | | 18,027,977 | | |
| | | | 47,242,769 | | | | 55,442,915 | | |
| Industrials 9.23% | | | |
| | 606,440 | | | 3M Company | | | 44,995,065 | | | | 54,191,478 | | |
| | 1,219,970 | | | Cintas Corporation | | | 36,915,327 | | | | 47,786,225 | | |
| | 655,085 | | | Northrop Grumman Corporation | | | 38,909,740 | | | | 41,453,779 | | |
| | 749,475 | | | Alliant Techsystems, Inc. | | | 51,821,140 | | | | 39,947,018 | | |
| | 439,695 | | | Lockheed Martin Corporation | | | 31,929,898 | | | | 39,809,985 | | |
| | 887,051 | | | Insteel Industries, Inc. (c) | | | 9,879,258 | | | | 10,085,770 | | |
| | 513,899 | | | Blount International, Inc. (a) | | | 4,856,281 | | | | 8,309,747 | | |
| | 132,850 | | | Unifirst Corporation | | | 3,833,192 | | | | 8,071,966 | | |
| | | | 223,139,901 | | | | 249,655,968 | | |
| Information Technology 14.51% | | | |
| | 3,908,302 | | | Cisco Systems, Inc. | | | 68,009,148 | | | | 78,752,285 | | |
| | 2,351,954 | | | Microsoft Corporation | | | 58,927,317 | | | | 75,309,567 | | |
| | 1,676,994 | | | Intel Corporation | | | 32,150,578 | | | | 47,626,630 | | |
| | 1,642,310 | | | Rofin-Sinar Technologies, Inc. (a)(c) | | | 38,127,421 | | | | 41,386,212 | | |
| | 1,172,960 | | | Linear Technology Corporation | | | 31,631,584 | | | | 38,367,522 | | |
| | 1,144,341 | | | Oracle Corporation | | | 32,654,268 | | | | 33,632,182 | | |
| | 863,730 | | | Texas Instruments, Inc. | | | 23,090,716 | | | | 27,587,536 | | |
| | 38,850 | | | Google, Inc., Class 'A' (a) | | | 21,034,673 | | | | 23,513,185 | | |
| | 353,471 | | | Automatic Data Processing, Inc. | | | 13,637,378 | | | | 19,660,057 | | |
| | 125,300 | | | KLA-Tencor Corporation (d) | | | 4,277,599 | | | | 6,534,395 | | |
| | | | 323,540,682 | | | | 392,369,571 | | |
| Materials 4.81% | | | |
| | 598,612 | | | Newmont Mining Corporation | | | 29,016,804 | | | | 28,523,862 | | |
| | 419,714 | | | Ashland, Inc. | | | 22,291,570 | | | | 27,646,561 | | |
| | 624,872 | | | Vulcan Materials Company | | | 27,379,122 | | | | 26,750,770 | | |
| | 255,880 | | | Martin Marietta Materials, Inc. | | | 22,000,503 | | | | 21,207,334 | | |
| | 329,352 | | | Scotts Miracle-Gro Company, Class 'A' | | | 14,442,294 | | | | 17,258,045 | | |
| | 142,850 | | | Deltic Timber Corporation | | | 7,367,015 | | | | 8,725,278 | | |
| | | | 122,497,308 | | | | 130,111,850 | | |
See Notes to Financial Statements.
FIRST EAGLE FUNDS | SEMI-ANNUAL REPORT | APRIL 30, 2012
67
U.S. Value Fund
| SHARES | | DESCRIPTION | | COST (NOTE 1) | | VALUE (NOTE 1) | |
| U.S. Common Stocks — 65.52% — (continued) | | | |
| Utilities 3.28% | | | |
| | 1,184,103 | | | FirstEnergy Corporation | | $ | 45,783,800 | | | $ | 55,439,703 | | |
| | 371,420 | | | Entergy Corporation | | | 24,857,694 | | | | 24,350,295 | | |
| | 216,687 | | | IDACorp, Inc. | | | 6,780,723 | | | | 8,827,828 | | |
| | | | 77,422,217 | | | | 88,617,826 | | |
| Total U.S. Common Stocks | | | 1,459,162,852 | | | | 1,771,610,213 | | |
| International Common Stocks — 6.29% | | | |
| Australia 1.24% | | | |
| | 1,225,614 | | | Newcrest Mining Limited | | | 41,726,094 | | | | 33,581,020 | | |
| Canada 2.16% | | | |
| | 774,300 | | | Agnico-Eagle Mines Limited | | | 36,656,269 | | | | 30,935,937 | | |
| | 1,594,102 | | | Penn West Petroleum Limited | | | 28,883,329 | | | | 27,322,908 | | |
| | | | 65,539,598 | | | | 58,258,845 | | |
| France 1.14% | | | |
| | 808,762 | | | Sanofi, ADR | | | 30,754,162 | | | | 30,878,533 | | |
| Mexico 0.50% | | | |
| | 532,000 | | | Fresnillo PLC | | | 14,750,494 | | | | 13,475,002 | | |
| South Africa 0.72% | | | |
| | 1,511,400 | | | Gold Fields Limited, ADR | | | 23,059,859 | | | | 19,451,718 | | |
| United Kingdom 0.53% | | | |
| | 392,763 | | | Willis Group Holdings PLC | | | 9,953,607 | | | | 14,320,139 | | |
| Total International Common Stocks | | | 185,783,814 | | | | 169,965,257 | | |
| Total Common Stocks | | | 1,644,946,666 | | | | 1,941,575,470 | | |
| U.S. Preferred Stock — 0.15% | | | |
| Consumer Staples 0.14% | | | |
| | 168,915 | | | Seneca Foods Corporation,
Series '2003' (a)(b)(e)(f) | | | 2,542,171
| | | | 3,934,030
| | |
| Exchange Traded Fund — 0.42% | | | |
| | 430,360 | | | PowerShares DB Agriculture
Fund, ETF (a) | | | 11,134,920
| | | | 11,744,524
| | |
See Notes to Financial Statements.
FIRST EAGLE FUNDS | SEMI-ANNUAL REPORT | APRIL 30, 2012
68
Schedule of Investments | Six-Month Period Ended April 30, 2012 (unaudited)
| SHARES | | DESCRIPTION | | COST (NOTE 1) | | VALUE (NOTE 1) | |
| Warrant — 0.43% | | | |
| United States — 0.43% | | | |
| | 939,766 | | | JPMorgan Chase & Co.
Warrant expire 10/28/18 (a) | | $ | 11,329,284
| | | $ | 11,747,075
| | |
| OUNCES | | | | | | | |
| Commodity — 4.43% | | | |
| | 71,835 | | | Gold bullion (a) | | | 72,521,699 | | | | 119,672,002 | | |
| PRINCIPAL | | | | | | | |
| Bonds — 2.09% | | | |
| International Corporate Bond — 0.20% | | | |
| Canada 0.20% | | | |
| | 10,000,000 | | | Catalyst Paper Corporation
USD11.00% due 12/15/16 (b)(g)(h) | | | 8,615,105
| | | | 5,400,000
| | |
| U.S. Corporate Bonds — 1.89% | | | |
| $ | 600,000 | | | Bausch & Lomb, Inc.
7.125% due 08/01/28 (b) | | | 518,806
| | | | 480,000
| | |
| | 22,411,000 | | | Citgo Petroleum Corporation
11.50% due 07/01/17 (g) | | | 24,998,698
| | | | 25,324,430
| | |
| | 5,975,000 | | | Mueller Water Products, Inc.
7.375% due 06/01/17 | | | 4,930,228
| | | | 6,019,813
| | |
| | 2,000,000 | | | PulteGroup, Inc.
6.25% due 02/15/13 | | | 1,957,894
| | | | 2,050,000
| | |
| | 167,000 | | | Sanmina-SCI Corporation
8.125% due 03/01/16 | | | 154,246
| | | | 173,054
| | |
| | 10,169,000 | | | Sealy Mattress Company
8.25% due 06/15/14 | | | 8,452,919
| | | | 10,169,000
| | |
| | 599,000 | | | Yankee Candle Company, Inc.
Series 'B' 8.50% due 02/15/15 | | | 609,112
| | | | 615,478
| | |
| | 5,877,000 | | | Yankee Candle Company, Inc.
Series 'B' 9.75% due 02/15/17 | | | 5,872,531
| | | | 6,170,850
| | |
| Total U.S. Corporate Bonds | | | 47,494,434 | | | | 51,002,625 | | |
| Total Bonds | | | 56,109,539 | | | | 56,402,625 | | |
| U.S. Treasury Bills — 5.55% | | | |
| | 30,000,000 | | | U.S. Treasury Bill
0.07% due 05/17/12 | | | 29,999,067
| | | | 29,999,067
| | |
| | 20,000,000 | | | U.S. Treasury Bill
0.08% due 06/21/12 | | | 19,997,677
| | | | 19,997,677
| | |
See Notes to Financial Statements.
FIRST EAGLE FUNDS | SEMI-ANNUAL REPORT | APRIL 30, 2012
69
U.S. Value Fund
| PRINCIPAL | | DESCRIPTION | | COST (NOTE 1) | | VALUE (NOTE 1) | |
| U.S. Treasury Bills — 5.55% — (continued) | | | |
| $ | 15,000,000 | | | U.S. Treasury Bill
0.09% due 06/21/12 | | $ | 14,998,087
| | | $ | 14,998,087
| | |
| | 20,000,000 | | | U.S. Treasury Bill
0.09% due 07/19/12 | | | 19,996,269
| | | | 19,996,380
| | |
| | 20,000,000 | | | U.S. Treasury Bill
0.10% due 07/19/12 | | | 19,995,831
| | | | 19,996,380
| | |
| | 15,000,000 | | | U.S. Treasury Bill
0.13% due 08/23/12 | | | 14,993,825
| | | | 14,995,020
| | |
| | 30,000,000 | | | U.S. Treasury Bill
0.14% due 08/23/12 | | | 29,987,175
| | | | 29,990,040
| | |
| Total U.S. Treasury Bills | | | 149,967,931 | | | | 149,972,651 | | |
| Commercial Paper — 14.68% | | | |
| International Commercial Paper — 0.97% | | | |
| Canada 0.12% | | | |
| 2,178,000
USD | | | Potash Corporation of Saskatchewan
0.31% due 05/14/12 | | | 2,177,756
| | | | 2,177,756
| | |
| 615,000
USD | | | Potash Corporation of Saskatchewan
0.33% due 05/24/12 | | | 614,870
| | | | 614,870
| | |
| 362,000
USD | | | Potash Corporation of Saskatchewan
0.35% due 05/09/12 | | | 361,972
| | | | 361,972
| | |
| France 0.34% | | | |
| 263,000
USD | | | GDF Suez SA
0.20% due 05/08/12 | | | 262,990
| | | | 262,990
| | |
| 5,457,000
USD | | | GDF Suez SA
0.21% due 05/23/12 | | | 5,456,300
| | | | 5,456,300
| | |
| 834,000
USD | | | GDF Suez SA
0.21% due 05/25/12 | | | 833,883
| | | | 833,883
| | |
| 2,572,000
USD | | | Total SA
0.16% due 07/10/12 | | | 2,571,200
| | | | 2,570,189
| | |
| Germany 0.11% | | | |
| 2,246,000
USD | | | Siemens Company
0.11% due 05/14/12 | | | 2,245,911
| | | | 2,245,911
| | |
| 739,000
USD | | | Siemens Company
0.13% due 05/07/12 | | | 738,984
| | | | 738,984
| | |
| Italy 0.23% | | | |
| 6,311,000
USD | | | Eni S.p.A.
0.53% due 06/11/12 | | | 6,307,262
| | | | 6,307,262
| | |
See Notes to Financial Statements.
FIRST EAGLE FUNDS | SEMI-ANNUAL REPORT | APRIL 30, 2012
70
Schedule of Investments | Six-Month Period Ended April 30, 2012 (unaudited)
| PRINCIPAL | | DESCRIPTION | | COST (NOTE 1) | | VALUE (NOTE 1) | |
| International Commercial Paper — 0.97% — (continued) | | | |
| Panama 0.17% | | | |
| 2,102,000
USD | | | Carnival Corporation
0.32% due 05/08/12 | | $ | 2,101,869
| | | $ | 2,101,869
| | |
| 2,614,000
USD | | | Carnival Corporation
0.38% due 05/22/12 | | | 2,613,436
| | | | 2,613,436
| | |
| Total International Commercial Paper | | | 26,286,433 | | | | 26,285,422 | | |
| U.S. Commercial Paper — 13.71% | | | |
| $ | 20,000,000 | | | Abbot Laboratories
0.10% due 05/01/12 | | | 20,000,000
| | | | 20,000,000
| | |
| | 887,000 | | | Abbot Laboratories
0.11% due 06/06/12 | | | 886,903
| | | | 886,903
| | |
| | 5,680,000 | | | Abbot Laboratories
0.14% due 07/24/12 | | | 5,678,145
| | | | 5,678,498
| | |
| | 3,109,000 | | | Archer Daniels Midland Company
0.12% due 05/21/12 | | | 3,108,793
| | | | 3,108,793
| | |
| | 10,248,000 | | | Archer Daniels Midland Company
0.13% due 05/02/12 | | | 10,247,963
| | | | 10,247,963
| | |
| | 5,939,000 | | | Arrow Electronics, Inc.
0.66% due 05/01/12 | | | 5,939,000
| | | | 5,939,000
| | |
| | 3,236,000 | | | Avery Dennison Corporation
0.41% due 05/01/12 | | | 3,236,000
| | | | 3,236,000
| | |
| | 6,000,000 | | | Coca-Cola Company
0.14% due 05/07/12 | | | 5,999,860
| | | | 5,999,860
| | |
| | 4,500,000 | | | Coca-Cola Company
0.17% due 06/21/12 | | | 4,498,916
| | | | 4,498,916
| | |
| | 10,000,000 | | | Coca-Cola Company
0.18% due 05/03/12 | | | 9,999,900
| | | | 9,999,900
| | |
| | 9,467,000 | | | Coca-Cola Company
0.22% due 05/18/12 | | | 9,466,017
| | | | 9,466,017
| | |
| | 6,000,000 | | | Coca-Cola Company
0.22% due 08/02/12 | | | 5,996,590
| | | | 5,997,587
| | |
| | 3,000,000 | | | Coca-Cola Company
0.22% due 09/12/12 | | | 2,997,543
| | | | 2,997,806
| | |
| | 2,714,000 | | | Computer Sciences Corporation
0.45% due 05/09/12 | | | 2,713,735
| | | | 2,713,735
| | |
| | 10,000,000 | | | ConocoPhillips
0.20% due 06/20/12 | | | 9,997,222
| | | | 9,997,222
| | |
| | 1,286,000 | | | ConocoPhillips
0.22% due 07/18/12 | | | 1,285,387
| | | | 1,285,628
| | |
| | 5,000,000 | | | ConocoPhillips
0.25% due 06/06/12 | | | 4,998,750
| | | | 4,998,750
| | |
| | 10,000,000 | | | Dell, Inc.
0.15% due 06/01/12 | | | 9,998,708
| | | | 9,998,708
| | |
See Notes to Financial Statements.
FIRST EAGLE FUNDS | SEMI-ANNUAL REPORT | APRIL 30, 2012
71
U.S. Value Fund
| PRINCIPAL | | DESCRIPTION | | COST (NOTE 1) | | VALUE (NOTE 1) | |
| U.S. Commercial Paper — 13.71% — (continued) | | | |
| $ | 10,000,000 | | | Dell, Inc.
0.36% due 07/11/12 | | $ | 9,993,097
| | | $ | 9,996,840
| | |
| | 10,000,000 | | | Ebay, Inc
0.13% due 05/10/12 | | | 9,999,675
| | | | 9,999,675
| | |
| | 702,000 | | | EI du Pont de Nemours & Company
0.16% due 06/14/12 | | | 701,863
| | | | 701,863
| | |
| | 3,936,000 | | | Emerson Electric Company
0.13% due 05/29/12 | | | 3,935,602
| | | | 3,935,602
| | |
| | 739,000 | | | General Electric Corporation
0.07% due 05/03/12 | | | 738,997
| | | | 738,997
| | |
| | 5,000,000 | | | Google, Inc.
0.09% due 05/07/12 | | | 4,999,925
| | | | 4,999,925
| | |
| | 10,000,000 | | | Google, Inc.
0.09% due 05/22/12 | | | 9,999,475
| | | | 9,999,475
| | |
| | 13,927,000 | | | Google, Inc.
0.14% due 07/20/12 | | | 13,922,667
| | | | 13,922,582
| | |
| | 8,000,000 | | | Honeywell International, Inc.
0.12% due 06/28/12 | | | 7,998,453
| | | | 7,998,453
| | |
| | 18,000,000 | | | Honeywell International, Inc.
0.20% due 09/27/12 | | | 17,985,100
| | | | 17,984,250
| | |
| | 5,000,000 | | | Johnson & Johnson
0.05% due 05/16/12 | | | 4,999,896
| | | | 4,999,896
| | |
| | 5,000,000 | | | Johnson & Johnson
0.05% due 05/23/12 | | | 4,999,847
| | | | 4,999,847
| | |
| | 5,000,000 | | | Johnson & Johnson
0.06% due 05/02/12 | | | 4,999,992
| | | | 4,999,992
| | |
| | 1,286,000 | | | Johnson & Johnson
0.10% due 07/09/12 | | | 1,285,753
| | | | 1,285,782
| | |
| | 10,000,000 | | | Johnson & Johnson
0.11% due 05/01/12 | | | 10,000,000
| | | | 10,000,000
| | |
| | 1,261,000 | | | Kraft Foods, Inc.
0.28% due 05/03/12 | | | 1,260,980
| | | | 1,260,980
| | |
| | 5,300,000 | | | McDonald's Corporation
0.13% due 06/27/12 | | | 5,298,909
| | | | 5,298,909
| | |
| | 1,001,000 | | | Medtronic, Inc.
0.10% due 06/21/12 | | | 1,000,858
| | | | 1,000,858
| | |
| | 10,000,000 | | | Merck & Company, Inc.
0.09% due 05/10/12 | | | 9,999,775
| | | | 9,999,775
| | |
| | 2,523,000 | | | Merck & Company, Inc.
0.10% due 06/08/12 | | | 2,522,734
| | | | 2,522,734
| | |
| | 4,500,000 | | | Merck & Company, Inc.
0.12% due 06/25/12 | | | 4,499,175
| | | | 4,499,175
| | |
See Notes to Financial Statements.
FIRST EAGLE FUNDS | SEMI-ANNUAL REPORT | APRIL 30, 2012
72
Schedule of Investments | Six-Month Period Ended April 30, 2012 (unaudited)
| PRINCIPAL | | DESCRIPTION | | COST (NOTE 1) | | VALUE (NOTE 1) | |
| U.S. Commercial Paper — 13.71% — (continued) | | | |
| $ | 1,493,000 | | | Merck & Company, Inc.
0.12% due 07/03/12 | | $ | 1,492,686
| | | $ | 1,492,796
| | |
| | 382,000 | | | NYSE Euronext, Inc.
0.41% due 05/18/12 | | | 381,928
| | | | 381,928
| | |
| | 15,000,000 | | | PepsiCo, Inc.
0.12% due 05/09/12 | | | 14,999,600
| | | | 14,999,600
| | |
| | 5,000,000 | | | Pfizer, Inc.
0.10% due 05/17/12 | | | 4,999,778
| | | | 4,999,778
| | |
| | 8,000,000 | | | Philip Morris International, Inc.
0.08% due 05/02/12 | | | 7,999,982
| | | | 7,999,982
| | |
| | 2,000,000 | | | Philip Morris International, Inc.
0.08% due 05/31/12 | | | 1,999,867
| | | | 1,999,867
| | |
| | 15,000,000 | | | Proctor & Gamble Company
0.07% due 05/04/12 | | | 14,999,913
| | | | 14,999,913
| | |
| | 9,600,000 | | | Proctor & Gamble Company
0.14% due 06/11/12 | | | 9,598,469
| | | | 9,598,469
| | |
| | 3,236,000 | | | Safeway, Inc.
0.66% due 05/01/12 | | | 3,236,000
| | | | 3,236,000
| | |
| | 652,000 | | | Sara Lee Corporation
0.35% due 05/01/12 | | | 652,000
| | | | 652,000
| | |
| | 20,000,000 | | | Sherwin-Williams Company
0.20% due 05/09/12 | | | 19,999,111
| | | | 19,999,111
| | |
| | 739,000 | | | Sysco Corporation
0.15% due 05/02/12 | | | 738,997
| | | | 738,997
| | |
| | 790,000 | | | Verizon Communications, Inc.
0.30% due 05/14/12 | | | 789,914
| | | | 789,914
| | |
| | 4,465,000 | | | Wal-Mart Stores, Inc.
0.09% due 05/18/12 | | | 4,464,810
| | | | 4,464,810
| | |
| | 25,000,000 | | | Walt Disney Company
0.07% due 06/05/12 | | | 24,998,299
| | | | 24,998,299
| | |
| | 444,000 | | | Walt Disney Company
0.11% due 06/18/12 | | | 443,935
| | | | 443,935
| | |
| | 8,000,000 | | | WellPoint, Inc.
0.37% due 05/24/12 | | | 7,998,160
| | | | 7,998,160
| | |
| | 2,589,000 | | | Western Union Company
0.38% due 05/01/12 | | | 2,589,000
| | | | 2,589,000
| | |
| Total U.S. Commercial Paper | | | 370,574,654 | | | | 370,579,455 | | |
| Total Commercial Paper | | | 396,861,087 | | | | 396,864,877 | | |
Total Investment Portfolio
Excluding Option Written — 99.56% | | $ | 2,345,413,297 | | | $ | 2,691,913,254 | | |
See Notes to Financial Statements.
FIRST EAGLE FUNDS | SEMI-ANNUAL REPORT | APRIL 30, 2012
73
U.S. Value Fund
| CONTRACTS | | | | STRIKE PRICE | | EXPIRATION DATE | | VALUE (NOTE 1) | |
| Covered Call Option Written — (0.01)% | |
| (Premium Received: $375,887) | |
| | 1,253 | | | KLA-Tencor Corporation | | $ | 55.00 | | | September 2012 | | $ | (250,600 | ) | |
| Total Investments — 99.55% (Cost: $2,345,037,410) | | | | | | | | | 2,691,662,654 | | |
| Other Assets in Excess of Liabilities — 0.45% | | | | | | | | | 12,193,498 | | |
| Net Assets — 100.00% | | | | | | | | $ | 2,703,856,152 | | |
(a) Non-income producing security/commodity.
(b) Security is deemed illiquid. At April 30, 2012, the value of these securities amounted to $9,817,364 or 0.36% of net assets.
(c) An affiliate of the Fund as defined by the Investment Company Act of 1940. An affiliate is defined as a company in which the Fund directly or indirectly owns, controls, or holds power to vote 5% or more of the outstanding voting securities.
(d) At April 30, 2012, all or a portion of this security was segregated to cover collateral requirement for options.
(e) Securities valued in accordance with fair value procedures under the supervision of the Board of Trustees, representing $3,934,030 or 0.15% of net assets.
(f) This security is convertible until December 31, 2049.
(g) All or a portion of the security is exempt from registration under the Securities Act of 1933. Rule 144A securities may only be sold to qualified institutional buyers, pursuant to Rule 144A under the Securities Act of 1933.
(h) Issuer is in default.
At April 30, 2012, cost is substantially identical for both book and federal income tax purposes. Net unrealized appreciation consisted of:
| Gross unrealized appreciation | | $ | 392,030,364 | | |
| Gross unrealized depreciation | | | (45,405,120 | ) | |
| Net unrealized appreciation | | $ | 346,625,244 | | |
Abbreviations used in this schedule include:
ADR — American Depository Receipt
ETF — Exchange Traded Fund
NYSE — New York Stock Exchange
PLC — Public Limited Company
REIT — Real Estate Investment Trust
Currencies
USD — United States Dollar
See Notes to Financial Statements.
FIRST EAGLE FUNDS | SEMI-ANNUAL REPORT | APRIL 30, 2012
74
Schedule of Investments | Six-Month Period Ended April 30, 2012 (unaudited)
| Affiliated Securities | |
AFFILIATED
SECURITIES | | SHARES
OCTOBER 31,
2011 | | GROSS
ADDITIONS | | GROSS
REDUCTIONS | | SHARES
APRIL 30,
2012 | | MARKET
VALUE
APRIL 30,
2012 | | REALIZED
GAIN/(LOSS) | | DIVIDEND
INCOME | |
Insteel
Industries,
Inc. | | | 816,751 | | | | 70,300 | | | | — | | | | 887,051 | | | $ | 10,085,770 | | | $ | — | | | $ | 52,383 | | |
Rofin-Sinar
Technologies,
Inc. | | | 1,187,010 | | | | 455,300 | | | | — | | | | 1,642,310 | | | | 41,386,212 | | | | — | | | | — | | |
| Total | | | | | | | | | | $ | 51,471,982 | | | $ | — | | | $ | 52,383 | | |
| INDUSTRY DIVERSIFICATION FOR PORTFOLIO HOLDINGS | | PERCENT OF
NET ASSETS | |
| U.S. Common Stocks | |
| Consumer Discretionary | | | 5.28 | % | |
| Consumer Staples | | | 5.74 | | |
| Energy | | | 3.72 | | |
| Financials | | | 16.90 | | |
| Health Care | | | 2.05 | | |
| Industrials | | | 9.23 | | |
| Information Technology | | | 14.51 | | |
| Materials | | | 4.81 | | |
| Utilities | | | 3.28 | | |
| Total U.S. Common Stocks | | | 65.52 | | |
| International Common Stocks | |
| Energy | | | 1.01 | | |
| Financials | | | 0.53 | | |
| Health Care | | | 1.14 | | |
| Materials | | | 3.61 | | |
| Total International Common Stocks | | | 6.29 | | |
| U.S. Preferred Stock | |
| Consumer Staples | | | 0.15 | | |
| Total U.S. Preferred Stock | | | 0.15 | | |
| Exchange Traded Fund | | | 0.42 | | |
| Warrant | | | 0.43 | | |
See Notes to Financial Statements.
FIRST EAGLE FUNDS | SEMI-ANNUAL REPORT | APRIL 30, 2012
75
U.S. Value Fund
| INDUSTRY DIVERSIFICATION FOR PORTFOLIO HOLDINGS — (CONTINUED) | | PERCENT OF
NET ASSETS | |
| Commodity | | | 4.43% | | |
| U.S. Corporate Bonds | |
| Consumer Discretionary | | | 0.72 | | |
| Energy | | | 0.94 | | |
| Industrials | | | 0.23 | | |
| Total U.S. Corporate Bonds | | | 1.89 | | |
| International Corporate Bond | |
| Materials | | | 0.20 | | |
| Total International Corporate Bond | | | 0.20 | | |
| U.S. Treasury Bills | | | 5.55 | | |
| Commercial Paper | |
| International Commercial Paper | | | 0.97 | | |
| U.S. Commercial Paper | | | 13.71 | | |
| Total Commercial Paper | | | 14.68 | | |
| Covered Call Option Written | | | (0.01) | | |
| Total Investments | | | 99.55 | % | |
See Notes to Financial Statements.
FIRST EAGLE FUNDS | SEMI-ANNUAL REPORT | APRIL 30, 2012
76
This page was intentionally left blank.

Fund Overview | Data as of April 30, 2012 (unaudited)
INVESTMENT OBJECTIVE
The First Eagle Gold Fund seeks to provide investors the opportunity to participate in the investment characteristics of gold (and to a limited extent other precious metals) for a portion of their overall investment portfolio. In seeking to achieve its objective, the Fund invests primarily in gold, gold related securities and issuers principally engaged in the gold industry.
| Average Annual Returns | |
| | | ONE-YEAR | | FIVE-YEARS | | TEN-YEARS | |
First Eagle Gold
Fund (A Shares) | |
| without sales load | | | -21.20 | % | | | 9.99 | % | | | 15.63 | % | |
| with sales load | | | -25.14 | | | | 8.87 | | | | 15.04 | | |
| FTSE Gold Mines Index | | | -26.85 | | | | 4.81 | | | | 8.96 | | |
| MSCI World Index | | | -4.63 | | | | -1.78 | | | | 4.96 | | |
| Consumer Price Index | | | 2.30 | | | | 2.17 | | | | 2.49 | | |
Asset Allocation*
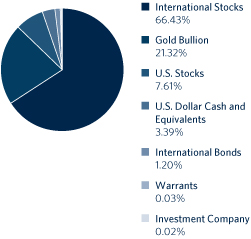
| Countries* | |
| Canada | | | 34.78 | % | |
| United States | | | 28.95 | | |
| South Africa | | | 12.16 | | |
| Australia | | | 8.50 | | |
| Mexico | | | 7.35 | | |
| Africa | | | 4.54 | | |
| United Kingdom | | | 0.33 | | |
* Asset Allocation and Countries percentages are based on total investments in the portfolio. Country allocations reflect country of the issuer (not currency of issue) and exclude short term investments. Bonds of non-U.S. issuers may be U.S. dollar denominated.
The Fund's portfolio composition is subject to change at any time.
FIRST EAGLE FUNDS | SEMI-ANNUAL REPORT | APRIL 30, 2012
78
Gold Fund
Growth of a $10,000 Initial Investment
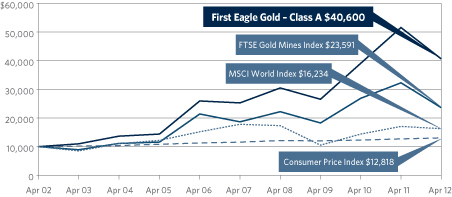
Performance data quoted herein represents past performance and should not be considered indicative of future results. Performance data quoted herein does not reflect the deduction of taxes that a shareholder would pay on Fund distributions or the sale of Fund shares. The average annual returns shown above are historical and reflect changes in share price, reinvested dividends and are net of expenses.
The average annual returns for Class A Shares with a sales charge give effect to the deduction of the maximum sales charge of 5.00%.
The MSCI World Index is a widely followed, unmanaged group of stocks from 23 international markets and is not available for purchase. The index provides total returns in U.S. dollars with net dividends reinvested. The FTSE Gold Mines Index is an unmanaged index composed of approximately 19 mining companies and is only available without dividends reinvested and is not available for purchase. The Consumer Price Index (CPI) represents the change in price of all goods and services purchased for consumption by urban households.
| Top 10 Holdings* | |
| Gold Bullion (United States) | | | 21.27 | % | |
| Agnico-Eagle Mines Limited (Canada) | | | 7.15 | | |
| Newcrest Mining Limited (Australia) | | | 5.23 | | |
| AngloGold Ashanti Limited, ADR (South Africa) | | | 5.05 | | |
| Goldcorp, Inc. (Canada) | | | 4.88 | | |
| Randgold Resources Limited, ADR (Africa) | | | 4.53 | | |
| Kinross Gold Corporation (Canada) | | | 4.19 | | |
| Newmont Mining Corporation (United States) | | | 4.15 | | |
| Fresnillo PLC (Mexico) | | | 3.97 | | |
| Barrick Gold Corporation (Canada) | | | 3.66 | | |
| Total | | | 64.08 | % | |
* Holdings in cash, commercial paper and money market funds have been excluded. Percentages are based on total net assets.
FIRST EAGLE FUNDS | SEMI-ANNUAL REPORT | APRIL 30, 2012
79
First Eagle Gold Fund
| SHARES | | DESCRIPTION | | COST (NOTE 1) | | VALUE (NOTE 1) | |
| Common Stocks — 73.68% | | | |
| International Common Stocks — 66.08% | | | |
| Africa 4.53% | | | |
| | 1,358,136 | | | Randgold Resources Limited, ADR | | $ | 32,800,641 | | | $ | 121,077,824 | | |
| Australia 8.48% | | | |
| | 5,106,092 | | | Newcrest Mining Limited | | | 155,393,729 | | | | 139,903,571 | | |
| | 4,118,481 | | | Kingsgate Consolidated Limited | | | 18,612,918 | | | | 26,601,931 | | |
| | 10,790,230 | | | CGA Mining Limited (a)(b) | | | 21,440,353 | | | | 23,489,085 | | |
| | 21,555,420 | | | Intrepid Mines Limited (a) | | | 30,285,506 | | | | 19,312,538 | | |
| | 2,613,520 | | | Medusa Mining Limited | | | 12,846,050 | | | | 15,683,129 | | |
| | 9,288,115 | | | St. Augustine Gold and Copper
Limited (a)(c) | | | 9,748,196
| | | | 1,880,852
| | |
| | | | 248,326,752 | | | | 226,871,106 | | |
| Canada 33.54% | | | |
| | 4,789,048 | | | Agnico-Eagle Mines Limited | | | 238,260,795 | | | | 191,338,869 | | |
| | 3,409,920 | | | Goldcorp, Inc. | | | 113,227,762 | | | | 130,463,539 | | |
| | 12,521,872 | | | Kinross Gold Corporation | | | 174,230,763 | | | | 112,070,754 | | |
| | 2,423,434 | | | Barrick Gold Corporation | | | 83,566,368 | | | | 97,979,437 | | |
| | 6,901,692 | | | IAMGOLD Corporation | | | 43,187,558 | | | | 85,602,923 | | |
| | 6,550,531 | | | New Gold, Inc. (a) | | | 12,024,078 | | | | 59,691,975 | | |
| | 1,030,033 | | | Franco-Nevada Corporation | | | 18,008,630 | | | | 46,211,474 | | |
| | 3,264,140 | | | Osisko Mining Corporation (a)(b) | | | 26,566,593 | | | | 33,611,405 | | |
| | 3,315,100 | | | Alacer Gold Corporation (a) | | | 16,304,405 | | | | 26,852,428 | | |
| | 2,419,196 | | | Dundee Precious Metals, Inc. (a)(b) | | | 4,875,920 | | | | 18,836,245 | | |
| | 1,326,157 | | | Eldorado Gold Corporation | | | 8,837,781 | | | | 18,798,358 | | |
| | 744,260 | | | Detour Gold Corporation (a)(b) | | | 16,953,437 | | | | 18,371,952 | | |
| | 17,648,120 | | | Lake Shore Gold Corporation (a) | | | 54,589,416 | | | | 17,154,048 | | |
| | 5,451,680 | | | Gabriel Resources Limited (a) | | | 32,031,903 | | | | 14,406,809 | | |
| | 2,462,250 | | | Aurizon Mines Limited (a) | | | 2,520,734 | | | | 13,312,828 | | |
| | 3,811,270 | | | Orezone Gold Corporation (a)(b) | | | 14,409,429 | | | | 6,598,766 | | |
| | 747,000 | | | SEMAFO, Inc. | | | 3,562,694 | | | | 3,796,831 | | |
| | 835,903 | | | Guyana Goldfields, Inc. (a) | | | 7,312,352 | | | | 2,319,014 | | |
| | | | 870,470,618 | | | | 897,417,655 | | |
| Mexico 7.33% | | | |
| | 4,197,841 | | | Fresnillo PLC | | | 16,620,435 | | | | 106,326,912 | | |
| | 1,915,577 | | | Industrias Peñoles S.A.B. de C.V. | | | 6,673,612 | | | | 89,874,702 | | |
| | | | 23,294,047 | | | | 196,201,614 | | |
See Notes to Financial Statements.
FIRST EAGLE FUNDS | SEMI-ANNUAL REPORT | APRIL 30, 2012
80
Consolidated Schedule of Investments | Six-Month Period Ended April 30, 2012 (unaudited)
| SHARES | | DESCRIPTION | | COST (NOTE 1) | | VALUE (NOTE 1) | |
| International Common Stocks — 66.08% — (continued) | | | |
| South Africa 11.87% | | | |
| | 3,931,189 | | | AngloGold Ashanti Limited, ADR | | $ | 144,762,375 | | | $ | 135,154,278 | | |
| | 6,921,044 | | | Gold Fields Limited, ADR | | | 93,344,394 | | | | 89,073,836 | | |
| | 8,064,515 | | | Harmony Gold Mining Company
Limited, ADR | | | 81,951,256
| | | | 78,225,795
| | |
| | 21,514,730 | | | Great Basin Gold Limited (a) | | | 20,176,335 | | | | 15,030,794 | | |
| | | | 340,234,360 | | | | 317,484,703 | | |
| United Kingdom 0.33% | | | |
| | 1,053,579 | | | Bumi PLC (a) | | | 15,853,835 | | | | 8,869,691 | | |
| Total International Common Stocks | | | 1,530,980,253 | | | | 1,767,922,593 | | |
| U.S. Common Stocks — 7.60% | | | |
| Materials 7.60% | | | |
| | 2,330,777 | | | Newmont Mining Corporation | | | 101,476,523 | | | | 111,061,524 | | |
| | 934,401 | | | Royal Gold, Inc. | | | 16,757,726 | | | | 57,895,486 | | |
| | 1,816,440 | | | Tahoe Resources, Inc. (a)(b) | | | 24,750,023 | | | | 34,189,865 | | |
| Total U.S. Common Stocks | | | 142,984,272 | | | | 203,146,875 | | |
| Total Common Stocks | | | 1,673,964,525 | | | | 1,971,069,468 | | |
| International Preferred Stock — 0.19% | | | |
| South Africa 0.19% | | | |
| | 120,000 | | | AngloGold Ashanti Holdings | | | 6,000,000 | | | | 4,956,000 | | |
| | | | | Finance PLC 6.00% (d) | | | | | | | | | |
| Investment Company — 0.02% | | | |
| | 520,558 | | | State Street Institutional
U.S. Government Money Market
Fund, Institutional Class | | | 520,558
| | | | 520,558
| | |
| Warrants — 0.03% | | | |
| Canada — 0.03% | | | |
| | 5,500,000 | | | Great Basin Gold Limited Warrant
expire 03/30/14 (a) | | | 664,820
| | | | 668,253
| | |
| | 666,680 | | | Primero Mining Corporation Warrant
expire 07/15/20 (a)(b) | | | 558,606
| | | | 172,129
| | |
| | 500,000 | | | St. Augustine Gold & Copper Warrant
expire 11/17/12 (a)(c)(e)(h) | | | 0
| | | | 0
| | |
| Total Warrants | | | 1,223,426 | | | | 840,382 | | |
See Notes to Financial Statements.
FIRST EAGLE FUNDS | SEMI-ANNUAL REPORT | APRIL 30, 2012
81
Gold Fund
| OUNCES | | DESCRIPTION | | COST (NOTE 1) | | VALUE (NOTE 1) | |
| Commodity — 21.27% | | | |
| | 341,566 | | | Gold bullion (a) | | $ | 185,268,444 | | | $ | 569,025,451 | | |
| PRINCIPAL | | | | | | | |
| International Convertible Bonds — 1.19% | | | |
| Canada 1.12% | | | |
| $ | 30,000,000
USD | | | Detour Gold Corporation
5.50% due 11/30/17 (e)(f)(h) | | | 30,000,000
| | | | 30,000,000
| | |
| South Africa 0.07% | | | |
| 2,000,000
CAD | | | Great Basin Gold Limited
8.00% due 11/30/14 (b)(g) | | | 1,900,057
| | | | 1,973,371
| | |
| Total International Convertible Bonds | | | 31,900,057 | | | | 31,973,371 | | |
| Commercial Paper — 3.38% | | | |
| International Commercial Paper — 0.52% | | | |
| Canada 0.03% | | | |
| 725,000
USD | | | Potash Corporation of Saskatchewan
0.35% due 05/09/12 | | | 724,944
| | | | 724,944
| | |
| France 0.04% | | | |
| 652,000
USD | | | Air Liquide SA
0.19% due 06/29/12 | | | 651,797
| | | | 651,797
| | |
| 526,000
USD | | | GDF Suez SA
0.20% due 05/08/12 | | | 525,979
| | | | 525,979
| | |
| Germany 0.09% | | | |
| 1,081,000
USD | | | BMW
0.18% due 05/30/12 | | | 1,080,843
| | | | 1,080,843
| | |
| 1,479,000
USD | | | Siemens Company
0.13% due 05/07/12 | | | 1,478,968
| | | | 1,478,968
| | |
| Japan 0.22% | | | |
| 5,784,000
USD | | | Panasonic Corporation
0.32% due 05/11/12 | | | 5,783,486
| | | | 5,783,486
| | |
| United Kingdom 0.14% | | | |
| 3,000,000
USD | | | BP PLC
0.31% due 05/14/12 | | | 2,999,664
| | | | 2,999,664
| | |
| 816,000
USD | | | Reed Elsevier, Inc.
0.46% due 05/23/12 | | | 815,776
| | | | 815,776
| | |
| Total International Commercial Paper | | | 14,061,457 | | | | 14,061,457 | | |
See Notes to Financial Statements.
FIRST EAGLE FUNDS | SEMI-ANNUAL REPORT | APRIL 30, 2012
82
Consolidated Schedule of Investments | Six-Month Period Ended April 30, 2012 (unaudited)
| PRINCIPAL | | DESCRIPTION | | COST (NOTE 1) | | VALUE (NOTE 1) | |
| U.S. Commercial Paper — 2.86% | | | |
| $ | 1,775,000 | | | Abbott Laboratories
0.11% due 06/06/12 | | $ | 1,774,805
| | | $ | 1,774,805
| | |
| | 5,000,000 | | | Archer Daniels Midland Company
0.13% due 05/02/12 | | | 4,999,982
| | | | 4,999,982
| | |
| | 13,111,000 | | | Arrow Electronics, Inc.
0.66% due 05/01/12 | | | 13,111,000
| | | | 13,111,000
| | |
| | 7,144,000 | | | Avery Dennison Corporation
0.41% due 05/01/12 | | | 7,144,000
| | | | 7,144,000
| | |
| | 1,631,000 | | | Caterpillar Corporation
0.12% due 05/25/12 | | | 1,630,870
| | | | 1,630,870
| | |
| | 6,000,000 | | | Coca-Cola Company
0.17% due 06/21/12 | | | 5,998,555
| | | | 5,998,555
| | |
| | 1,479,000 | | | General Electric Corporation
0.07% due 05/03/12 | | | 1,478,994
| | | | 1,478,994
| | |
| | 5,000,000 | | | Honeywell International, Inc.
0.13% due 06/26/12 | | | 4,998,989
| | | | 4,998,989
| | |
| | 1,794,000 | | | Merck & Company, Inc.
0.13% due 07/06/12 | | | 1,793,572
| | | | 1,793,726
| | |
| | 763,000 | | | NYSE Euronext, Inc.
0.41% due 05/18/12 | | | 762,856
| | | | 762,856
| | |
| | 5,000,000 | | | Parker-Hannifin Corporation
0.16% due 05/04/12 | | | 4,999,933
| | | | 4,999,933
| | |
| | 7,144,000 | | | Safeway, Inc.
0.66% due 05/01/12 | | | 7,144,000
| | | | 7,144,000
| | |
| | 12,500,000 | | | Sherwin-Williams Company
0.20% due 05/09/12 | | | 12,499,444
| | | | 12,499,444
| | |
| | 1,479,000 | | | Sysco Corporation
0.15% due 05/02/12 | | | 1,478,994
| | | | 1,478,994
| | |
| | 887,000 | | | Walt Disney Company
0.11% due 06/18/12 | | | 886,870
| | | | 886,870
| | |
| | 5,715,000 | | | Western Union Company
0.38% due 05/01/12 | | | 5,715,000
| | | | 5,715,000
| | |
| Total U.S. Commercial Paper | | | 76,417,864 | | | | 76,418,018 | | |
| Total Commercial Paper | | | 90,479,321 | | | | 90,479,475 | | |
| Total Investments — 99.76% | | $ | 1,989,356,331 | | | | 2,668,864,705 | | |
| Other Assets in Excess of Liabilities — 0.24% | | | | | 6,473,845 | | |
| Net Assets — 100.00% | | | | $ | 2,675,338,550 | | |
See Notes to Financial Statements.
FIRST EAGLE FUNDS | SEMI-ANNUAL REPORT | APRIL 30, 2012
83
Gold Fund
(a) Non-income producing security/commodity.
(b) All or a portion of the security is exempt from registration under the Securities Act of 1933. Rule 144A securities may only be sold to qualified institutional buyers, pursuant to Rule 144A under the Securities Act of 1933.
(c) Represents a security registered under Regulation D. Regulation D provides exemptions for small companies to offer and sell their securities without having to register the securities under the Securities Act of 1933.
(d) This security is convertible until August 9, 2013.
(e) Securities valued in accordance with fair value procedures under the supervision of the Board of Trustees, representing $30,000,000 or 1.12% of net assets.
(f) This security is convertible until November 30, 2017.
(g) This security is convertible until November 30, 2014.
(h) Security is deemed illiquid. At April 30, 2012, the value of these securities amounted to $30,000,000 or 1.12% of net assets.
At April 30, 2012, cost is substantially identical for both book and federal tax purposes. Net unrealized appreciation consisted of:
| Gross unrealized appreciation | | $ | 921,949,520 | | |
| Gross unrealized depreciation | | | (242,441,146 | ) | |
| Net unrealized appreciation | | $ | 679,508,374 | | |
Abbreviations used in this schedule include:
ADR — American Depository Receipt
NYSE — New York Stock Exchange
PLC — Public Limited Company
Currencies
CAD — Canadian Dollar
USD — United States Dollar
| INDUSTRY DIVERSIFICATION FOR PORTFOLIO HOLDINGS | | PERCENT OF
NET ASSETS | |
| International Common Stocks | |
| Energy | | | 0.33 | % | |
| Materials | | | 65.75 | | |
| Total International Common Stocks | | | 66.08 | | |
| U.S. Common Stocks | |
| Materials | | | 7.60 | | |
| Total U.S. Common Stocks | | | 7.60 | | |
| Investment Company | | | 0.02 | | |
| International Preferred Stock | |
| Materials | | | 0.19 | | |
| Total International Preferred Stock | | | 0.19 | | |
See Notes to Financial Statements.
FIRST EAGLE FUNDS | SEMI-ANNUAL REPORT | APRIL 30, 2012
84
Consolidated Schedule of Investments | Six-Month Period Ended April 30, 2012 (unaudited)
| INDUSTRY DIVERSIFICATION FOR PORTFOLIO HOLDINGS — (CONTINUED) | | PERCENT OF
NET ASSETS | |
| Warrants | | | 0.03% | | |
| Commodity | | | 21.27 | | |
| International Convertible Bonds | |
| Materials | | | 1.19 | | |
| Total International Convertible Bonds | | | 1.19 | | |
| Commercial Paper | |
| International Commercial Paper | | | 0.52 | | |
| U.S. Commercial Paper | | | 2.86 | | |
| Total Commercial Paper | | | 3.38 | | |
| Total Investments | | | 99.76 | % | |
See Notes to Financial Statements.
FIRST EAGLE FUNDS | SEMI-ANNUAL REPORT | APRIL 30, 2012
85
Letter from the High Yield Team Portfolio Managers
Over the past six months ending April 30, 2012, the focus of the high yield market returned to sound corporate fundamentals benefited by improving economic numbers. Risk appetite resumed as a healthy primary market and stable investor interest forged a constructive credit environment.
Primary market activity has continued to gain momentum, with new issuance already exceeding $100 billion so far this year, surpassing the entire second half of 2011. Deal quality has remained above average and continues to be dominated by refinancing activity. Certainly, issuance tends to be pro-cyclical as investor demand is a key driver.
We expect conditions to remain constructive for the leveraged credit markets, given where we are in the credit cycle. Virtually every company throughout the credit spectrum enjoys access to the primary market and many have taken advantage of this by terming out shorter maturities. Refinancing has provided the ability to extend the optionality of the enterprise as well as reduce debt servicing costs. Many companies remain chastened by near death experiences in 2008 and are actively reducing cost structures as they manage balance sheet exposure. Consequently, refinancing activity is generally lowering default risk.
We expect default activity to remain well below historical averages and approximate 2% or lower over the coming year. Given our expectations of a continuing benign default environment, we believe high yield is positioned to perform well relative to other asset classes in the coming quarters. Several factors point to attractive risk-adjusted opportunities for leveraged credit. The Federal Reserve remains committed to an accommodative monetary policy for the foreseeable future. Easier Fed policy provides a tangible incentive to move down the credit spectrum to pick up incremental yield in a steady to improving economic environment. Moreover, refinancing activity continues to be the dominant form of issuance and serves to lower overall market risk through the extension of maturities. Lastly, given our expectations for low default activity, market spreads remain attractive at around 580 basis points1 — factoring in default levels that are well above current and expected levels.
As a result, we remain optimistic as market conditions today appear stable. In contrast to years when defaults were elevated, many companies today are delevering, cutting costs, and have consequently boosted productivity. Moreover, equity friendly corporate activity remains lower than average as a share of primary issuance. Lower market leverage and accommodative Federal Reserve
1Barclays Capital U.S. Corporate High Yield Index option-adjusted spread as of April 30, 2012.
FIRST EAGLE FUNDS | SEMI-ANNUAL REPORT | APRIL 30, 2012
86
Letter from the High Yield Team Portfolio Managers (continued)
policy supports today's healthier market conditions. All of these factors collectively paint a positive fundamental picture for high yield and, in our view, should underpin the asset class even in a tepid growth environment.
We appreciate your confidence and thank you for your support.
Sincerely,
 | |  | |
|
| Edward Meigs | | Sean Slein | |
|
| Portfolio Manager | | Portfolio Manager | |
|
June 2012
FIRST EAGLE FUNDS | SEMI-ANNUAL REPORT | APRIL 30, 2012
87
Management's Discussion of Fund Performance
For the six-months ended April 30, 2012, the high yield market posted positive returns. The net asset value ("NAV") of First Eagle High Yield Fund Class I Shares* rose 7.26% for the six-month period, while the Barclays Capital U.S. Corporate High Yield Index increased 6.91%.
Over this time, the Fund remained significantly overweight single-B rated issues and underweight triple-C rated issues. We believe that high yield spreads are attractive in the current environment and maintain a high concentration in the single-B credit tier. This tier tends to be more credit-sensitive than the double-B credit tier. That said, we believe that our portfolio of securities is levered to an improving economy and somewhat insulated from an increase in Treasury yields. The Fund is concentrated in the consumer cyclical, energy, and industrial sectors and less invested in the financial, utilities, and healthcare sectors.
The five largest contributors to the performance of the Fund for the year were Alliance One International, Inc. (tobacco merchant), Bon-Ton Department Stores, Inc. (retail apparel and furniture chain operator), Shea Homes L.P. (homebuilding construction firm), Bi-Lo (Southeastern domestic supermarket chain), and CommScope, Inc. (network infrastructure provider), collectively accounting for 1.28 percentage points of the period's performance.
The five largest detractors were Midwest Vanadium Pty Limited (Western Australian iron ore and vanadium producer), HeidelbergCement Finance BV (industrial cement and concrete manufacturer), FCC Holdings, Inc. (commercial financial services firm), Viridian Group FundCo II (Irish energy utility company), and Cloud Peak Energy Resources (coal producer).Their combined negative performance over the six month period subtracted 0.63 percentage points from the Fund's performance.
As of April 30, 2012 the Fund was nearly 100% hedged against the Euro, which is the Fund's only foreign currency exposure. The Fund has always been involved to varying degrees in Yankee issuance of primarily western European and NAFTA companies. European banks have traditionally been the major intermediaries of credit, but balance sheet weakness and solvency concerns along the periphery have led to the continued development of the European capital markets. Accordingly, there has been greater European issuance in the high yield market in both U.S. Dollar and Euro terms. As a result, the Fund
1Barclays Capital U.S. Corporate High Yield Index option-adjusted spread as of April 30, 2012.
FIRST EAGLE FUNDS | SEMI-ANNUAL REPORT | APRIL 30, 2012
88
Management's Discussion of Fund Performance (continued)
participated in several U.S. Dollar and Euro issues, which in many cases have come with what we consider to be attractive price and/or structural concessions. The Fund is expected to remain involved as the European capital markets continue to evolve.
We appreciate your confidence and thank you for your support.
Sincerely,
 | |  | |
|
| Edward Meigs | | Sean Slein | |
|
| Portfolio Manager | | Portfolio Manager | |
|
June 2012
The performance data quoted herein represents past performance and does not guarantee future results. Market volatility can dramatically impact the Fund's short-term performance. Current performance may be lower or higher than figures shown. The investment return and principal value will fluctuate so that an investor's shares, when redeemed, may be worth more or less than their original cost. Past performance data through the most recent month end is available at firsteaglefunds.com or by calling 800.334.2143.
*Class I Shares require $1mm minimum investment, and are offered without sales charge. Had fees not been waived and/or expenses reimbursed, the performance would have been lower. The Adviser has contractually agreed to limit operating expenses of the Fund to an annual rate of 0.80% for I Shares, 1.25% for A Shares, and 2.00% for C Shares, with gross operating expenses of 1.26%, 1.51%, and 2.26% respectively. Gross operating expenses are the actual fund operating expenses prior to the application of fee waivers and/or expense reimbursements. This limitation excludes certain expenses as described in the Fees and Expenses section of the prospectus. This limitation will continue until 2013 for I-Shares, and until 2012 for A and C Shares. The expense limitation may be terminated by the Adviser in future years.
The Fund commenced operations in its present form on or about December 30, 2011, and is successor to another mutual fund pursuant to a reorganization on December 30, 2011. Information prior to December 30, 2011 is for the predecessor fund. Immediately after the reorganization, changes in net asset value of the Class I shares were partially impacted by differences in how the Fund and the predecessor fund price portfolio securities.
FIRST EAGLE FUNDS | SEMI-ANNUAL REPORT | APRIL 30, 2012
89
Management's Discussion of Fund Performance (continued)
The Fund invests in high yield, fixed income securities that, at the time of purchase, are non-investment grade. High yield, lower rated securities involve greater price volatility and present greater risks than high rated fixed income securities. High yield securities are rated lower than investment-grade securities because there is a greater possibility that the issuer may be unable to make interest and principal payments on those securities. High yield securities involve greater risk than higher rated securities and portfolios that invest in them may be subject to greater levels of credit and liquidity risk than portfolios that do not.
There are risks associated with investing in securities of non-U.S. countries such as erratic market conditions, economic and political instability and fluctuations in currency exchange rates.
The Fund's investment strategies may result in high turnover rates. This may increase the Fund's brokerage commission costs, which would reduce performance. Rapid portfolio turnover also exposes shareholders to a higher current realization of short-term gains.
All investments involve the risk of loss.
Hedging can reduce exposure to currency exchange movements, but cannot eliminate that exposure. It is possible to lose money under a hedge. Results from hedging transactions, which for the Fund is primarily currency forward contracts, are further described in the financial statements that follow this commentary.
The portfolio is actively managed. The portfolio and opinions expressed herein are subject to change. Current and future portfolio holdings are subject to risk.
The Barclays Capital U.S. Corporate High Yield Bond Index is composed of fixed-rate, publicly issued, non-investment grade debt, is unmanaged, with dividends reinvested, and is not available for purchase. The index includes both corporate and non-corporate sectors. The corporate sectors are Industrial, Utility, and Finance, which include both U.S. and non-U.S. corporations. The index is presented here for comparison purposes only. One cannot invest directly in an index.
The commentary represents the opinion of the First Eagle High Yield Fund Portfolio Managers as of June 2012 and is subject to change based on market and other conditions. The opinions expressed are not necessarily those of the firm. These materials are provided for informational purpose only. These opinions are not intended to be a forecast of future events, a guarantee of future results, or investment advice. Any statistics contained herein have been obtained from sources believed to be reliable, but the accuracy of this information cannot be guaranteed. The views expressed herein may change at any time subsequent to the date of issue hereof. The information provided is not to be construed as a recommendation or an offer to buy or sell or the solicitation of an offer to buy or sell any fund or security.
FIRST EAGLE FUNDS | SEMI-ANNUAL REPORT | APRIL 30, 2012
90
This page was intentionally left blank.

Fund Overview | Data as of April 30, 2012 (unaudited)
INVESTMENT OBJECTIVE
First Eagle High Yield Fund seeks to provide investors with a high level of current income by investing at least 80% of its net assets in high yield, below investment-grade instruments, or other instruments.
| Average Annual Returns* | |
| | | ONE-YEAR | | THREE-YEARS | | SINCE
INCEPTION
(11/19/07) | |
First Eagle
High Yield Fund I Shares | | | 4.86 | % | | | 21.63 | % | | | 13.33 | % | |
Barclays Capital
U.S. Corporate | |
| High Yield Bond Index | | | 5.92 | | | | 19.65 | | | | 9.79 | | |
Asset Allocation**
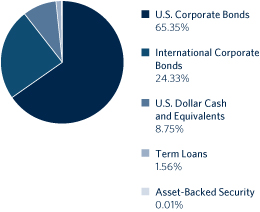
| Countries** | |
| United States | | | 66.92 | % | |
| United Kingdom | | | 4.44 | | |
| Netherlands | | | 3.13 | | |
| Ireland | | | 3.12 | | |
| Canada | | | 2.57 | | |
| Cayman Islands | | | 2.53 | | |
| France | | | 1.81 | | |
| Bermuda | | | 1.25 | | |
| Australia | | | 1.21 | | |
| Norway | | | 0.94 | | |
| Austria | | | 0.89 | | |
| Sweden | | | 0.86 | | |
| Luxembourg | | | 0.79 | | |
| Malaysia | | | 0.78 | | |
* If the Adviser had not waived fees, returns would have been lower.
** Asset Allocation and Countries percentages are based on total investments in the portfolio. Country allocations reflect country of the issuer (not currency of issue) and exclude short term investments. Bonds of non-U.S. issuers may be U.S. dollar denominated.
The Fund's portfolio composition is subject to change at any time.
FIRST EAGLE FUNDS | SEMI-ANNUAL REPORT | APRIL 30, 2012
92
High Yield Fund
Growth of a $10,000 Initial Investment
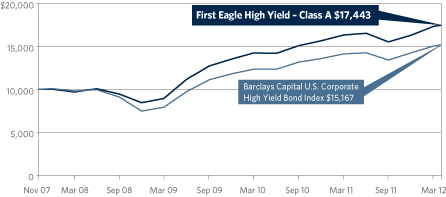
Performance data quoted herein represents past performance and should not be considered indicative of future results. Performance data quoted herein does not reflect the deduction of taxes that a shareholder would pay on Fund distributions or the sale of Fund shares. The average annual returns shown above are historical and reflect changes in share price, reinvested dividends and are net of expenses. The average annual returns for Class I Shares do not give effect to the deduction of a maximum sales charge. The Fund commenced operations in its present form on December 30, 2011 and is the successor to the Old Mutual High Yield Fund (the "Predecessor Fund") pursuant to reorganization on the same date. The Predecessor Fund had similar investment objectives and strategies as the Fund, but was managed by another investment adviser. Information prior to December 30, 2011 is for the Predecessor Fund. The chart above illustrates a hypothetical investment in Class I shares without the effect of sales charges and assumes all distributions have been reinvested and if a sales charge was included values would be lower. Had fees not been waived and/or expenses reimbursed, the performance would have been lower. Class I Shares require $1mm minimum investment, and are offered without sales charge. Class A and C Shares have maximum sales charges of 4.50% and 1.00% respectively, and 12b-1 fees, which reduce performance.
The Barclays Capital U.S. Corporate High Yield Bond Index is composed of fixed-rate, publicly issued, non-investment grade debt, is unmanaged, with dividends reinvested, and is not available for purchase. The index includes both corporate and non-corporate sectors. The corporate sectors are Industrial, Utility, and Finance, which include both U.S. and non-U.S. corporations. The index is presented here for comparison purposes only. One cannot invest directly in an index.
| Top 10 Holdings* | |
| HeidelbergCement Finance BV | |
| (German building materials manufacturer) | | | 1.95 | % | |
| Cleaver-Brooks, Inc. (U.S. manufacturer and distributor of thermal machinery) | | | 1.69 | | |
| Allied Irish Banks PLC (Irish retail and commercial banking) | | | 1.62 | | |
| Citgo Petroleum Corporation (U.S. refiner and marketer of transportation fuels) | | | 1.57 | | |
| Appleton Papers, Inc. (U.S. paper and related production manufacturer) | | | 1.48 | | |
| Ardagh Packaging Finance (Irish manufacturer of glass packaging) | | | 1.35 | | |
| Landry's Restaurants, Inc. (U.S. restaurants and hospitality) | | | 1.34 | | |
| Quality Distribution (U.S. trucking transportation) | | | 1.33 | | |
| CCO Holdings (U.S. cable and satellite television provider) | | | 1.33 | | |
| Ineos Finance PLC (British manufacturer and distributor of chemicals) | | | 1.30 | | |
| Total | | | 14.96 | % | |
* Holdings in cash and commercial paper have been excluded. Percentages are based on total net assets.
FIRST EAGLE FUNDS | SEMI-ANNUAL REPORT | APRIL 30, 2012
93
First Eagle High Yield Fund
| PRINCIPAL | | DESCRIPTION | | COST (NOTE 1) | | VALUE (NOTE 1) | |
| Bonds — 85.20% | | | |
| U.S. Corporate Bonds — 62.09% | | | |
| $ | 945,000 | | | Accuride Corporation
9.50% due 08/01/18 | | $ | 962,743
| | | $ | 1,008,788
| | |
| | 1,847,000 | | | Air Lease Corporation
5.625% due 04/01/17 (a) | | | 1,845,775
| | | | 1,810,060
| | |
| | 2,800,000 | | | AK Steel Corporation
8.375% due 04/01/22 | | | 2,811,338
| | | | 2,716,000
| | |
| | 3,456,000 | | | Alliance One International, Inc.
10.00% due 07/15/16 | | | 3,412,854
| | | | 3,507,840
| | |
| | 500,000 | | | Alpha Natural Resources, Inc.
6.00% due 06/01/19 | | | 492,751
| | | | 470,000
| | |
| | 400,000 | | | Alpha Natural Resources, Inc.
6.25% due 06/01/21 | | | 354,182
| | | | 375,000
| | |
| | 3,150,000 | | | AM Castle & Company
12.75% due 12/15/16 (a) | | | 3,323,756
| | | | 3,433,500
| | |
| | 2,249,000 | | | American Axle & Manufacturing, Inc.
7.875% due 03/01/17 | | | 2,330,129
| | | | 2,333,337
| | |
| | 2,100,000 | | | AMGH Merger Sub, Inc.
9.25% due 11/01/18 (a) | | | 2,261,789
| | | | 2,173,500
| | |
| | 3,975,000 | | | Appleton Papers, Inc.
10.50% due 06/15/15 (a) | | | 4,096,577
| | | | 4,173,750
| | |
| | 2,950,000 | | | Atwood Oceanics, Inc.
6.50% due 02/01/20 | | | 3,097,990
| | | | 3,119,625
| | |
| | 2,406,000 | | | Basic Energy Services, Inc.
7.125% due 04/15/16 | | | 2,444,151
| | | | 2,454,120
| | |
| | 688,000 | | | Basic Energy Services, Inc.
7.75% due 02/15/19 | | | 699,815
| | | | 705,200
| | |
| | 1,200,000 | | | Berry Petroleum Company
6.375% due 09/15/22 | | | 1,200,555
| | | | 1,251,000
| | |
| | 2,725,000 | | | Bi-Lo
9.25% due 02/15/19 (a) | | | 2,872,795
| | | | 2,953,219
| | |
| | 3,910,000 | | | Bon-Ton Department Stores, Inc.
10.25% due 03/15/14 | | | 2,756,255
| | | | 3,235,525
| | |
| | 1,625,000 | | | Brickman Group Holdings, Inc.
9.125% due 11/01/18 (a) | | | 1,576,509
| | | | 1,608,750
| | |
| | 75,000 | | | Briggs & Stratton Corporation
6.875% due 12/15/20 | | | 75,000
| | | | 79,688
| | |
| | 500,000 | | | Carrizo Oil & Gas, Inc.
8.625% due 10/15/18 | | | 502,667
| | | | 532,500
| | |
| | 441,000 | | | CCO Holdings
6.625% due 01/31/22 | | | 458,435
| | | | 463,601
| | |
| | 3,400,000 | | | CCO Holdings
7.375% due 06/01/20 | | | 3,667,551
| | | | 3,727,250
| | |
See Notes to Financial Statements.
FIRST EAGLE FUNDS | SEMI-ANNUAL REPORT | APRIL 30, 2012
94
Schedule of Investments | One-Month Period Ended April 30, 2012 (unaudited)
| PRINCIPAL | | DESCRIPTION | | COST (NOTE 1) | | VALUE (NOTE 1) | |
| U.S. Corporate Bonds — 62.09% — (continued) | | | |
| $ | 3,700,000 | | | Chesapeake Energy Corporation
6.775% due 03/15/19 | | $ | 3,667,444
| | | $ | 3,602,875
| | |
| | 485,500 | | | Chesapeake Midstream Partners L.P.
6.125% due 07/15/22 | | | 485,500
| | | | 469,721
| | |
| | 3,904,000 | | | Citgo Petroleum Corporation
11.50% due 07/01/17 (a) | | | 4,362,811
| | | | 4,411,520
| | |
| | 3,200,000 | | | Clear Channel Worldwide Holdings, Inc.
Series B 9.25% due 12/15/17 | | | 3,478,504
| | | | 3,524,000
| | |
| | 4,464,000 | | | Cleaver-Brooks, Inc.
12.25% due 05/01/16 (a) | | | 4,673,976
| | | | 4,759,740
| | |
| | 2,150,000 | | | Cloud Peak Energy Resources
8.25% due 12/15/17 | | | 2,302,784
| | | | 2,182,250
| | |
| | 110,000 | | | Cloud Peak Energy Resources
8.50% due 12/15/19 | | | 110,897
| | | | 112,475
| | |
| | 2,678,000 | | | CommScope, Inc.
8.25% due 01/15/19 (a) | | | 2,794,902
| | | | 2,872,155
| | |
| | 1,950,000 | | | DriveTime Automotive Group, Inc.
12.625% due 06/15/17 | | | 2,108,261
| | | | 2,149,875
| | |
| | 2,800,000 | | | E*Trade Financial Corporation
6.75% due 06/01/16 | | | 2,833,182
| | | | 2,877,000
| | |
| | 2,671,000 | | | Equinox Holdings, Inc.
9.50% due 02/01/16 (a) | | | 2,832,711
| | | | 2,881,341
| | |
| | 200,000 | | | Everest Acquisition
6.875% due 05/01/19 (a) | | | 200,000
| | | | 210,250
| | |
| | 2,500,000 | | | Everest Acquisition
9.375% due 05/01/20 (a) | | | 2,507,482
| | | | 2,665,625
| | |
| | 77,000 | | | FCC Holdings, Inc.
13.00% due 12/15/15 (a) | | | 78,286
| | | | 65,643
| | |
| | 224,000 | | | FGI Operating Company, Inc.
7.875% due 05/01/20 (a) | | | 224,000
| | | | 231,280
| | |
| | 1,550,000 | | | Fiesta Restaurant Group
8.875% due 08/15/16 (a) | | | 1,613,252
| | | | 1,643,000
| | |
| | 2,050,000 | | | Frontier Communications Corporation
8.50% due 04/15/20 | | | 2,158,244
| | | | 2,142,250
| | |
| | 2,650,000 | | | Goodman Networks, Inc.
12.125% due 07/01/18 (a) | | | 2,663,970
| | | | 2,656,625
| | |
| | 1,970,000 | | | Headwaters, Inc.
7.625% due 04/01/19 | | | 1,888,291
| | | | 1,935,525
| | |
| | 1,550,000 | | | Hughes Satellite Systems Corporation
6.50% due 06/15/19 | | | 1,609,633
| | | | 1,666,250
| | |
| | 3,287,000 | | | Huntington Ingalls Industries, Inc.
7.125% due 03/15/21 | | | 3,466,842
| | | | 3,496,546
| | |
See Notes to Financial Statements.
FIRST EAGLE FUNDS | SEMI-ANNUAL REPORT | APRIL 30, 2012
95
High Yield Fund
| PRINCIPAL | | DESCRIPTION | | COST (NOTE 1) | | VALUE (NOTE 1) | |
| U.S. Corporate Bonds — 62.09% — (continued) | | | |
| $ | 2,505,000 | | | Interface, Inc.
7.625% due 12/01/18 | | $ | 2,722,899
| | | $ | 2,717,925
| | |
| | 2,260,000 | | | International Lease Finance Corporation
6.25% due 05/15/19 | | | 2,241,629
| | | | 2,282,864
| | |
| | 2,000,000 | | | International Lease Finance Corporation
8.625% due 09/15/15 | | | 2,183,908
| | | | 2,222,500
| | |
| | 2,385,000 | | | JMC Steel Group
8.25% due 03/15/18 (a) | | | 2,471,313
| | | | 2,480,400
| | |
| | 2,554,000 | | | Kemet Corporation
10.50% due 05/01/18 (a) | | | 2,695,283
| | | | 2,745,550
| | |
| | 2,946,000 | | | Kraton Polymers
6.75% due 03/01/19 | | | 3,018,253
| | | | 3,078,570
| | |
| | 1,500,000 | | | Landry's, Inc.
9.375% due 05/01/20 | | | 1,500,000
| | | | 1,535,625
| | |
| | 2,300,000 | | | Linn Energy
6.25% due 11/01/19 (a) | | | 2,255,258
| | | | 2,268,375
| | |
| | 2,970,000 | | | Manitowoc Company, Inc.
9.50% due 02/15/18 | | | 3,276,936
| | | | 3,322,687
| | |
| | 700,000 | | | Mashantucket Western Pequot Tribe
8.50% due 11/15/15 (a)(b) | | | 508,046
| | | | 67,375
| | |
| | 1,900,000 | | | Mcron Finance Corporation
8.375% due 05/15/19 | | | 1,920,363
| | | | 1,940,375
| | |
| | 3,000,000 | | | Midwest Gaming Borrower
11.625% due 04/15/16 (a) | | | 3,340,995
| | | | 3,348,750
| | |
| | 900,000 | | | Monaco SpinCo, Inc.
6.75% due 04/30/20 | | | 900,000
| | | | 931,500
| | |
| | 2,684,000 | | | Navistar International Corporation
8.25% due 11/01/21 | | | 2,881,495
| | | | 2,912,140
| | |
| | 311,000 | | | Omega Healthcare Investors, Inc.
6.75% due 10/15/22 | | | 309,753
| | | | 328,105
| | |
| | 2,500,000 | | | Omega Healthcare Investors, Inc.
7.50% due 02/15/20 | | | 2,703,437
| | | | 2,681,250
| | |
| | 1,765,000 | | | OSI Restaurant Partners
10.00% due 06/15/15 | | | 1,818,833
| | | | 1,831,188
| | |
| | 2,300,000 | | | Parker Drilling Company
9.125% due 04/01/18 (a) | | | 2,408,455
| | | | 2,449,500
| | |
| | 750,000 | | | PBF Holding Company
8.25% due 02/15/20 (a) | | | 739,455
| | | | 780,000
| | |
| | 2,544,000 | | | PHH Corporation
9.25% due 03/01/16 | | | 2,552,531
| | | | 2,607,600
| | |
| | 1,600,000 | | | Polypore International, Inc.
7.50% due 11/15/17 | | | 1,672,587
| | | | 1,688,000
| | |
See Notes to Financial Statements.
FIRST EAGLE FUNDS | SEMI-ANNUAL REPORT | APRIL 30, 2012
96
Schedule of Investments | One-Month Period Ended April 30, 2012 (unaudited)
| PRINCIPAL | | DESCRIPTION | | COST (NOTE 1) | | VALUE (NOTE 1) | |
| U.S. Corporate Bonds — 62.09% — (continued) | | | |
| $ | 2,750,000 | | | Post Holdings, Inc.
7.375% due 02/15/22 (a) | | $ | 2,845,445
| | | $ | 2,866,875
| | |
| | 600,000 | | | PVH Corporation
7.375% due 05/15/20 | | | 654,365
| | | | 666,000
| | |
| | 3,400,000 | | | Quality Distribution
9.875% due 11/01/18 | | | 3,715,922
| | | | 3,740,000
| | |
| | 2,950,000 | | | Samson Investment Company
9.75% due 02/15/20 (a) | | | 3,036,861
| | | | 3,082,750
| | |
| | 2,690,000 | | | Shea Homes L.P.
8.625% due 05/15/19 | | | 2,727,763
| | | | 2,817,775
| | |
| | 1,118,518 | | | Sheridan Group, Inc.
12.50% due 04/15/14 | | | 991,755
| | | | 950,740
| | |
| | 2,332,000 | | | STHI Holding Corporation
8.00% due 03/15/18 (a) | | | 2,482,016
| | | | 2,495,240
| | |
| | 3,017,000 | | | Sugarhouse HSP Gaming Prop Mezz
8.625% due 04/15/16 (a) | | | 3,179,637
| | | | 3,224,419
| | |
| | 2,560,000 | | | Taminco Global Chemical Corporation
9.75% due 03/31/20 (a) | | | 2,649,081
| | | | 2,688,000
| | |
| | 3,176,000 | | | Taylor Morrison
7.75% due 04/15/20 (a) | | | 3,223,586
| | | | 3,279,220
| | |
| | 2,553,000 | | | Tower Automotive Holdings USA
10.625% due 09/01/17 (a) | | | 2,709,765
| | | | 2,754,049
| | |
| | 1,910,000 | | | Toys R Us Property Company I
10.75% due 07/15/17 | | | 2,095,821
| | | | 2,110,550
| | |
| | 1,200,000 | | | Toys R Us Property Company II
8.50% due 12/01/17 | | | 1,269,059
| | | | 1,254,000
| | |
| | 1,350,000 | | | Toys R Us, Inc.
7.375% due 10/15/18 | | | 1,196,423
| | | | 1,181,250
| | |
| | 45,175 | | | United Air Lines, Inc.
12.75% due 07/15/12 | | | 44,809
| | | | 46,079
| | |
| | 1,907,000 | | | United Maritime Group
11.75% due 06/15/15 | | | 1,982,712
| | | | 2,016,653
| | |
| | 500,000 | | | United Rentals North America, Inc.
10.875% due 06/15/16 | | | 555,249
| | | | 568,125
| | |
| | 2,650,000 | | | UR Financing Escrow Corporation
7.375% due 05/15/20 (a) | | | 2,692,903
| | | | 2,789,125
| | |
| | 200,000 | | | UR Financing Escrow Corporation
7.625% due 04/15/22 (a) | | | 200,000
| | | | 212,000
| | |
| | 2,839,000 | | | YCC Holdings
10.25% due 02/15/16 | | | 2,819,794
| | | | 2,917,072
| | |
| Total U.S. Corporate Bonds | | | 172,498,984 | | | | 174,568,400 | | |
See Notes to Financial Statements.
FIRST EAGLE FUNDS | SEMI-ANNUAL REPORT | APRIL 30, 2012
97
High Yield Fund
| PRINCIPAL | | DESCRIPTION | | COST (NOTE 1) | | VALUE (NOTE 1) | |
| International Corporate Bonds — 23.11% | | | |
| Australia 1.15% | | | |
| 2,700,000
USD | | | FMG Resources
8.25% due 11/01/19 (a) | | $ | 2,938,920
| | | $ | 2,936,250
| | |
| 450,000
USD | | | Midwest Vanadium Pty Limited
11.50% due 02/15/18 (a) | | | 386,780
| | | | 303,750
| | |
| | | | 3,325,700 | | | | 3,240,000 | | |
| Austria 0.85% | | | |
| 2,326,000
USD | | | OGX Austria GmbH
8.375% due 04/01/22 (a) | | | 2,322,988
| | | | 2,378,335
| | |
| Bermuda 1.19% | | | |
| 2,000,000
USD | | | Aircastle Limited
7.625% due 04/15/20 (a) | | | 2,014,897
| | | | 2,040,000
| | |
| 729,000
USD | | | Aircastle Limited
9.75% due 08/01/18 | | | 805,254
| | | | 807,367
| | |
| 451,000
USD | | | Aircastle Limited
9.75% due 08/01/18 (a) | | | 484,535
| | | | 497,228
| | |
| | | | 3,304,686 | | | | 3,344,595 | | |
| Canada 2.44% | | | |
| 1,800,000
USD | | | Lone Pine Resources Canada Limited
10.375% due 02/15/17 (a) | | | 1,831,666
| | | | 1,854,000
| | |
| 2,792,000
USD | | | New Gold, Inc.
7.00% due 04/15/20 (a) | | | 2,832,958
| | | | 2,861,800
| | |
| 560,000
USD | | | Novelis, Inc.
8.75% due 12/15/20 | | | 595,299
| | | | 620,200
| | |
| 600,000
USD | | | Precision Drilling Corporation
6.50% due 12/15/21 | | | 608,092
| | | | 627,000
| | |
| 1,050,000
USD | | | Thompson Creek Metals Company, Inc.
7.375% due 06/01/18 | | | 1,004,069
| | | | 903,000
| | |
| | | | 6,872,084 | | | | 6,866,000 | | |
| Cayman Islands 2.41% | | | |
| 3,925,000
USD | | | Marfrig Overseas Limited
9.50% due 05/04/20 (a) | | | 3,518,523
| | | | 3,444,187
| | |
| 3,010,000
USD | | | RDS Ultra-Deepwater Limited
11.875% due 03/15/17 (a) | | | 3,301,424
| | | | 3,322,288
| | |
| | | | 6,819,947 | | | | 6,766,475 | | |
| France 1.72% | | | |
| 2,430,000
USD | | | CMA CGM SA
8.50% due 04/15/17 (a) | | | 1,475,388
| | | | 1,543,050
| | |
| 3,240,000
USD | | | Rexel SA
6.125% due 12/15/19 (a) | | | 3,261,994
| | | | 3,300,750
| | |
| | | | 4,737,382 | | | | 4,843,800 | | |
See Notes to Financial Statements.
FIRST EAGLE FUNDS | SEMI-ANNUAL REPORT | APRIL 30, 2012
98
Schedule of Investments | One-Month Period Ended April 30, 2012 (unaudited)
| PRINCIPAL | | DESCRIPTION | | COST (NOTE 1) | | VALUE (NOTE 1) | |
| International Corporate Bonds — 23.11% — (continued) | | | |
| Ireland 2.97% | | | |
| 3,500,000
EUR | | | Allied Irish Banks PLC
4.50% due 10/01/12 | | $ | 4,529,501
| | | $ | 4,550,327
| | |
| 3,550,000
USD | | | Ardagh Packaging Finance PLC
9.125% due 10/15/20 (a) | | | 3,677,070
| | | | 3,789,625
| | |
| | | | 8,206,571 | | | | 8,339,952 | | |
| Luxembourg 0.75% | | | |
| 1,990,000
USD | | | Dematic SA
8.75% due 05/01/16 (a) | | | 2,081,065
| | | | 2,101,937
| | |
| Malaysia 0.74% | | | |
| 2,000,000
USD | | | MMI International Limited
8.00% due 03/01/17 (a) | | | 2,055,576
| | | | 2,085,000
| | |
| Netherlands 2.97% | | | |
| 3,700,000
EUR | | | HeidelbergCement Finance BV
8.50% due 10/31/19 | | | 5,533,341
| | | | 5,472,288
| | |
| 188,000
USD | | | Schaeffler Finance BV
8.50% due 02/15/19 (a) | | | 188,000
| | | | 202,570
| | |
| 1,900,000
EUR | | | Schaeffler Finance BV
8.75% due 02/15/19 (a) | | | 2,616,917
| | | | 2,677,848
| | |
| | | | 8,338,258 | | | | 8,352,706 | | |
| Norway 0.90% | | | |
| 2,800,000
USD | | | Eksportfinans ASA
2.00% due 09/15/15 | | | 2,469,742
| | | | 2,522,408
| | |
| Sweden 0.81% | | | |
| 600,000
USD | | | Eileme 1 AB
14.25% due 08/15/20 (a) | | | 570,373
| | | | 544,925
| | |
| 1,300,000
EUR | | | Eileme 2 AB
11.75% due 01/31/20 (a) | | | 1,752,646
| | | | 1,746,029
| | |
| | | | 2,323,019 | | | | 2,290,954 | | |
| United Kingdom 4.21% | | | |
| 3,400,000
USD | | | Ineos Finance PLC
8.375% due 02/15/19 (a) | | | 3,558,020
| | | | 3,655,000
| | |
| 1,722,000
USD | | | Inmarsat Finance PLC
7.375% due 12/01/17 (a) | | | 1,834,989
| | | | 1,859,760
| | |
| 3,100,000
USD | | | Jaguar Land Rover PLC
8.125% due 05/15/21 (a) | | | 3,154,790
| | | | 3,255,000
| | |
| 2,700,000
USD | | | Viridian Group FundCo II
11.125% due 04/01/17 (a) | | | 2,641,243
| | | | 2,470,500
| | |
| 500,000
EUR | | | Viridian Group Fund Co II
11.125% due 04/01/17 (a) | | | 589,254
| | | | 608,695
| | |
| | | | 11,778,296 | | | | 11,848,955 | | |
| Total International Corporate Bonds | | | 64,635,314 | | | | 64,981,117 | | |
| Total Bonds | | | 237,134,298 | | | | 239,549,517 | | |
See Notes to Financial Statements.
FIRST EAGLE FUNDS | SEMI-ANNUAL REPORT | APRIL 30, 2012
99
High Yield Fund
| PRINCIPAL | | DESCRIPTION | | COST (NOTE 1) | | VALUE (NOTE 1) | |
| Term Loans — 1.48% | | | |
| $ | 3,750,000 | | | Landry's Restaurants, Inc.
Term Loan B due 04/26/18 | | $ | 3,693,750
| | | $ | 3,755,272
| | |
| | 400,000 | | | Roundy's Supermarkets, Inc.
Term Loan B due 02/13/19 | | | 394,000
| | | | 404,100
| | |
| Total Term Loans | | | 4,087,750 | | | | 4,159,372 | | |
| Asset-Backed Security — 0.01% | | | |
| | 244,860 | | | Countrywide Asset-Backed Certificates
Series 2003-2, Class M2
2.714% due 03/26/33 | | | 242,398
| | | | 23,623
| | |
| U.S. Commercial Paper — 8.32% | | | |
| | 9,261,000 | | | Arrow Electronics, Inc.
0.66% due 05/01/12 | | | 9,261,000
| | | | 9,261,000
| | |
| | 5,047,000 | | | Avery Dennison Corporation
0.41% due 05/01/12 | | | 5,047,000
| | | | 5,047,000
| | |
| | 5,046,000 | | | Safeway, Inc.
0.66% due 05/01/12 | | | 5,046,000
| | | | 5,046,000
| | |
| | 4,037,000 | | | Western Union Company
0.38% due 05/01/12 | | | 4,037,000
| | | | 4,037,000
| | |
| Total U.S. Commercial Paper | | | 23,391,000 | | | | 23,391,000 | | |
| Total Investments — 95.01% | | $ | 264,855,446 | | | | 267,123,512 | | |
| Other Assets in Excess of Liabilities — 4.99% | | | | | 14,054,714 | | |
| Net Assets — 100.00% | | | | $ | 281,178,226 | | |
(a) All or a portion of the security is exempt from registration under the Securities Act of 1933. Rule 144A securities may only be sold to qualified institutional buyers, pursuant to Rule 144A under the Securities Act of 1933.
(b) Issuer is in default.
At April 30, 2012, cost is substantially identical for both book and federal income tax purposes. Net unrealized appreciation consisted of:
| Gross unrealized appreciation | | $ | 4,029,843 | | |
| Gross unrealized depreciation | | | (1,761,777 | ) | |
| Net unrealized appreciation | | $ | 2,268,066 | | |
Abbreviations used in this schedule include:
PLC — Public Limited Company
PTY — Proprietary Limited Company
Currencies
EUR — Euro
USD — United States Dollar
See Notes to Financial Statements.
FIRST EAGLE FUNDS | SEMI-ANNUAL REPORT | APRIL 30, 2012
100
Schedule of Investments | One-Month Period Ended April 30, 2012 (unaudited)
| Foreign Currency Exchange Contracts — Sales | |
SETTLEMENT
DATES
THROUGH | | FOREIGN CURRENCY
TO BE DELIVERED | | U.S. $
TO BE
RECEIVED | | U.S. $ VALUE
AT APRIL 30,
2012 | | UNREALIZED
APPRECIATION
AT APRIL 30,
2012 | | UNREALIZED
DEPRECIATION
AT APRIL 30,
2012 | |
| 10/09/12 | | | 1,000,000 | | | Euro | | $ | 1,314,620 | | | $ | 1,324,905 | | | $ | — | | | $ | (10,285 | ) | |
| 10/09/12 | | | 9,900,000 | | | Euro | | | 13,102,290 | | | | 13,116,559 | | | | — | | | | (14,269 | ) | |
| | | | | | | $ | 14,416,910 | | | $ | 14,441,464 | | | $ | — | | | $ | (24,554 | ) | |
| INDUSTRY DIVERSIFICATION FOR PORTFOLIO HOLDINGS | | PERCENT OF
NET ASSETS | |
| U.S. Corporate Bonds | |
| Consumer Discretionary | | | 14.64 | % | |
| Consumer Staples | | | 4.55 | | |
| Energy | | | 10.81 | | |
| Financials | | | 5.38 | | |
| Health Care | | | 0.89 | | |
| Industrials | | | 13.36 | | |
| Materials | | | 6.41 | | |
| Telecommunication Services | | | 6.05 | | |
| Total U.S. Corporate Bonds | | | 62.09 | | |
| International Corporate Bonds | |
| Consumer Discretionary | | | 1.16 | | |
| Energy | | | 2.91 | | |
| Financials | | | 4.45 | | |
| Industrials | | | 4.72 | | |
| Materials | | | 7.31 | | |
| Telecommunication Services | | | 1.47 | | |
| Utilities | | | 1.09 | | |
| Total International Corporate Bonds | | | 23.11 | | |
| Term Loans | | | 1.48 | | |
| Asset-Backed Security | | | 0.01 | | |
| U.S. Commercial Paper | | | 8.32 | | |
| Total Investments | | | 95.01 | % | |
See Notes to Financial Statements.
FIRST EAGLE FUNDS | SEMI-ANNUAL REPORT | APRIL 30, 2012
101
Management's Discussion of Fund Performance

Harold Levy
First Eagle Fund of America Class Y increased 14.5% for the six months ended April 30, 2012 versus 12.8% for the S&P 500 index. The five largest contributors to the performance were Valeant Pharmaceuticals International, Inc., Eastman Chemical Company, Dresser-Rand Group, Inc., Devon Energy Corporation and Rockwood Holdings, Inc., which collectively contributed 10.92% to the Fund's performance. The five greatest detractors were AOL, Inc., Exterran Holdings, Inc., Amgen, Inc., PDL BioPharma, Inc. and Covanta Holding Corporation, which collectively subtracted .75% from the Fund's performance.
We find ourselves in a world that feels not significantly changed from October 2011, which was the last writing of this letter. At that time we said that we believed markets were predominantly influenced by extraordinarily complex forces that resided outside the U.S. This continues to be the case.
On the macro front, the contractionary forces of government deleveraging in the developed world as a result of high debt levels and the necessity to shrink government debt/GDP ratios, are fighting the inflationary forces of virtually all significant central banks' printing money. At this point it looks like both forces have come to a temporary standstill, although longer term we believe money printing is likely to prevail. Greece is still a daily news event and Spain is running a close second. The Euro zone may be on the verge of breaking up — or maybe it isn't. China's growth has slowed, but it may still be growing enough to keep world-wide growth positive. The U.S. economy seemed to be growing again earlier in the year; now that growth appears to have slowed. In sum, the current uncertain state of the world is very similar to where we were in October 2011. As investors, we just have to accept that these macro issues may take a while to unfold.
Yet U.S. stock prices in general, and more specifically the value of First Eagle Fund of America shares, appreciated during the period, even after the significant correction in May. The earnings and cash generation of the companies we own have, in general, been healthy and we believe the outlook is promising. We continue to stress balance sheet conservatism, strong free cash flow and
FIRST EAGLE FUNDS | SEMI-ANNUAL REPORT | APRIL 30, 2012
102
Management's Discussion of Fund Performance (continued)
management teams that are determined to create value for owners. In addition, we look to invest only in essential goods and services though we readily admit our definition of "essential" may be unique to our approach.
We are grateful for the trust our shareholders have placed in us and strive to earn it every day by continuing to adhere to the same philosophy we have practiced for now more than 25 years (as of April 10, 2012).

Harold Levy
Portfolio Manager
June 2012
The performance data quoted herein represents past performance and does not guarantee future results. Market volatility can dramatically impact the fund's short-term performance. Current performance may be lower or higher than figures shown. The investment return and principal value will fluctuate so that an investor's shares, when redeemed, may be worth more or less than their original cost. Past performance data through the most recent month end is available at firsteaglefunds.com or by calling 800.334.2143.
*As of September 1, 2005, Class Y Shares are closed to new investors. Class Y shares are offered without sales charge. If sales charge was included returns would be lower. The portfolio is actively managed and holdings can change at any time. Current and future portfolio holdings are subject to risk.
FIRST EAGLE FUNDS | SEMI-ANNUAL REPORT | APRIL 30, 2012
103

Fund Overview | Data as of April 30, 2012 (unaudited)
INVESTMENT OBJECTIVE
The First Eagle Fund of America seeks capital appreciation by investing primarily in domestic stocks and to a lesser extent in debt and foreign equity securities. The Fund has a unique event-driven bias that focuses on identifying companies poised to benefit from change that the market has not yet recognized.
| Average Annual Returns | |
| | | ONE-YEAR | | FIVE-YEARS | | TEN-YEARS | |
First Eagle Fund
of America
(Y Shares) | | | 1.45 | % | | | 4.10 | % | | | 7.75 | % | |
Standard & Poor's
500 Index | | | 4.76 | | | | 1.01 | | | | 4.71 | | |
Asset Allocation*
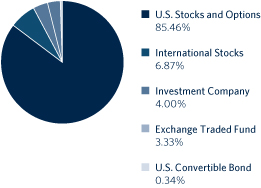
| Sector/Industry* | |
| Materials | | | 32.49 | % | |
| Health Care | | | 26.10 | | |
| Industrials | | | 10.74 | | |
| Energy | | | 9.03 | | |
| Information Technology | | | 8.82 | | |
| Consumer Discretionary | | | 8.19 | | |
| Exchange Traded Fund | | | 3.33 | | |
* Asset Allocation and Sector/Industry percentages are based on total investments in the portfolio. Sector/Industry allocations exclude short term investments and options positions.
The Fund's portfolio composition is subject to change at any time.
FIRST EAGLE FUNDS | SEMI-ANNUAL REPORT | APRIL 30, 2012
104
Fund of America
Growth of a $10,000 Initial Investment
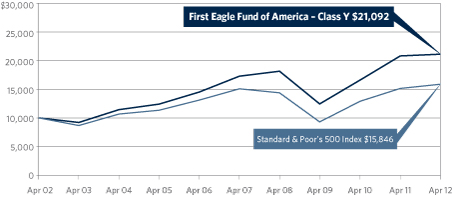
Performance data quoted herein represents past performance and should not be considered indicative of future results. Performance data quoted herein does not reflect the deduction of taxes that a shareholder would pay on Fund distributions or the sale of Fund shares. The Fund's average annual returns shown above are historical and reflect changes in share price, reinvested dividends and is net of expenses.
The Standard & Poor's 500 Index is a widely recognized unmanaged index including a representative sample of 500 leading companies in leading sectors of the U.S. economy and is not available for purchase. Although the Standard & Poor's 500 Index focuses on the large-cap segment of the market, with approximately 75% coverage of U.S. equities, it is also considered a proxy for the total market.
| Top 10 Holdings* | |
| Wyndham Worldwide Corporation (hotel and resorts) | | | 6.50 | % | |
| Rockwood Holdings, Inc. (specialty chemicals manufacturer) | | | 6.16 | | |
| Eastman Chemical Company (chemicals company) | | | 6.14 | | |
| Tyco International Limited (industrial conglomerate) | | | 5.90 | | |
| Pfizer, Inc. (biopharmaceutical company) | | | 5.81 | | |
| Occidental Petroleum Corporation (oil exploration and production company) | | | 5.00 | | |
| Seagate Technology PLC (computers memory devices company) | | | 4.90 | | |
| Valeant Pharmaceuticals International, Inc. (pharmaceuticals company) | | | 4.85 | | |
| Omnicare, Inc. (pharmaceutical company) | | | 4.47 | | |
| Baxter International, Inc. (health technology company) | | | 4.30 | | |
| Total | | | 54.03 | % | |
* Holdings in cash and repurchase agreements have been excluded. Percentages are based on total net assets.
FIRST EAGLE FUNDS | SEMI-ANNUAL REPORT | APRIL 30, 2012
105
First Eagle Fund of America
| SHARES | | DESCRIPTION | | COST (NOTE 1) | | VALUE (NOTE 1) | |
| Common Stocks — 95.06% | | | |
| U.S. Common Stocks — 88.19% | | | |
| Consumer Discretionary 8.20% | | | |
| | 2,012,800 | | | Wyndham Worldwide Corporation (a) | | $ | 65,062,294 | | | $ | 101,324,352 | | |
| | 571,600 | | | Viacom, Inc., Class B (a) | | | 27,674,004 | | | | 26,516,524 | | |
| | | | 92,736,298 | | | | 127,840,876 | | |
| Energy 9.03% | | | |
| | 854,500 | | | Occidental Petroleum Corporation (a) | | | 82,557,113 | | | | 77,947,490 | | |
| | 931,200 | | | Atlas Energy L.P. (a) | | | 19,989,155 | | | | 36,149,184 | | |
| | 508,290 | | | Dresser-Rand Group, Inc. (a)(b) | | | 19,555,134 | | | | 24,743,557 | | |
| | 74,621 | | | Atlas Resource Partners L.P. | | | 1,401,804 | | | | 1,971,487 | | |
| | 20 | | | Devon Energy Corporation | | | 1,530 | | | | 1,397 | | |
| | | | 123,504,736 | | | | 140,813,115 | | |
| Health Care 24.80% | | | |
| | 3,950,400 | | | Pfizer, Inc. (a) | | | 79,796,638 | | | | 90,582,672 | | |
| | 1,358,242 | | | Valeant Pharmaceuticals International,
Inc. (a)(b) | | | 35,065,606
| | | | 75,559,002
| | |
| | 2,001,000 | | | Omnicare, Inc. (a) | | | 54,507,251 | | | | 69,714,840 | | |
| | 1,211,400 | | | Baxter International, Inc. (a) | | | 64,275,560 | | | | 67,123,674 | | |
| | 1,518,760 | | | Health Net, Inc. (a)(b) | | | 40,301,045 | | | | 54,083,044 | | |
| | 509,710 | | | Theravance, Inc. (a)(b) | | | 9,863,054 | | | | 11,030,124 | | |
| | 272,200 | | | Merck & Co., Inc. (a) | | | 9,797,890 | | | | 10,681,128 | | |
| | 1,182,252 | | | Enzon Pharmaceuticals, Inc. (b) | | | 9,944,690 | | | | 7,365,430 | | |
| | 70,950 | | | Universal American Corporation | | | 769,644 | | | | 651,321 | | |
| | 80 | | | Amgen, Inc. | | | 4,310 | | | | 5,689 | | |
| | | | 304,325,688 | | | | 386,796,924 | | |
| Industrials 4.84% | | | |
| | 791,490 | | | General Dynamics Corporation (a) | | | 50,725,321 | | | | 53,425,575 | | |
| | 481,000 | | | Mueller Industries, Inc. (a) | | | 21,921,376 | | | | 21,986,510 | | |
| | | | 72,646,697 | | | | 75,412,085 | | |
| Information Technology 8.82% | | | |
| | 2,483,420 | | | Seagate Technology PLC (a) | | | 61,499,118 | | | | 76,389,999 | | |
| | 799,800 | | | Analog Devices, Inc. (a) | | | 28,407,677 | | | | 31,176,204 | | |
| | 891,040 | | | AOL, Inc. (a)(b) | | | 22,194,529 | | | | 22,311,642 | | |
| | 539,000 | | | Corning, Inc. (a) | | | 7,458,835 | | | | 7,734,650 | | |
| | | | 119,560,159 | | | | 137,612,495 | | |
See Notes to Financial Statements.
FIRST EAGLE FUNDS | SEMI-ANNUAL REPORT | APRIL 30, 2012
106
Schedule of Investments | Six-Month Period Ended April 30, 2012 (unaudited)
| SHARES | | DESCRIPTION | | COST (NOTE 1) | | VALUE (NOTE 1) | |
| U.S. Common Stocks — 88.19% — (continued) | | | |
| Materials 32.50% | | | |
| | 1,735,270 | | | Rockwood Holdings, Inc. (a)(b) | | $ | 77,413,022 | | | $ | 96,029,842 | | |
| | 1,772,900 | | | Eastman Chemical Company (a) | | | 57,093,501 | | | | 95,683,413 | | |
| | 1,573,560 | | | Ball Corporation (a) | | | 35,929,837 | | | | 65,711,866 | | |
| | 2,124,100 | | | Packaging Corporation of America (a) | | | 52,905,047 | | | | 62,002,479 | | |
| | 1,346,270 | | | Crown Holdings, Inc. (a)(b) | | | 30,666,070 | | | | 49,785,065 | | |
| | 914,650 | | | Valspar Corporation | | | 22,122,082 | | | | 46,784,347 | | |
| | 763,000 | | | WR Grace & Co. (a)(b) | | | 42,257,963 | | | | 45,482,430 | | |
| | 415,300 | | | Walter Energy, Inc. (a) | | | 31,618,913 | | | | 27,538,543 | | |
| | 161,900 | | | FMC Corporation (a) | | | 16,712,047 | | | | 17,881,855 | | |
| | | | 366,718,482 | | | | 506,899,840 | | |
| Total U.S. Common Stocks | | | 1,079,492,060 | | | | 1,375,375,335 | | |
| International Common Stocks — 6.87% | | | |
| Switzerland 5.90% | | | |
| | 1,639,850 | | | Tyco International Limited (a) | | | 76,357,219 | | | | 92,044,780 | | |
| United Kingdom 0.97% | | | |
| | 325,200 | | | GlaxoSmithKline PLC, ADR (a) | | | 14,501,423 | | | | 15,033,996 | | |
| Total International Common Stocks | | | 90,858,642 | | | | 107,078,776 | | |
| Total Common Stocks | | | 1,170,350,702 | | | | 1,482,454,111 | | |
| Exchange Traded Fund — 3.33% | | | |
| | 321,180 | | | SPDR Gold Trust (a)(b) | | | 52,703,972 | | | | 51,992,618 | | |
| Investment Company — 4.00% | | | |
| | 62,392,716 | | | State Street Institutional
U.S. Government Money Market
Fund, Institutional Class | | | 62,392,716
| | | | 62,392,716
| | |
| PRINCIPAL | | | | | | | |
| Bond — 0.34% | | | |
| U.S. Convertible Bond 0.34% | | | |
| $ | 3,730,000 | | | Omnicare, Inc.
3.75% due 12/15/25 (c) | | | 3,730,000
| | | | 5,338,563
| | |
See Notes to Financial Statements.
FIRST EAGLE FUNDS | SEMI-ANNUAL REPORT | APRIL 30, 2012
107
Fund of America
| CONTRACTS | | | | STRIKE PRICE | | EXPIRATION DATE | | VALUE (NOTE 1) | |
| Call Options Purchased — 0.19% | | | |
| | 5,000 | | | AOL, Inc. | | $ | 20.00 | | | July 2012 | | $ | 2,675,000 | | |
| | 500 | | | AOL, Inc. | | | 21.00 | | | July 2012 | | | 230,000 | | |
| Total Call Options Purchased (Cost: $480,150) | | | | | | | | | 2,905,000 | | |
Total Investment Portfolio
Excluding Options Written — 102.92% (Cost: $1,289,657,540) | | | | | | | | | 1,605,083,008 | | |
| Covered Call Options Written — (2.89)% | | | |
| | 1,192 | | | Analog Devices, Inc. | | $ | 38.00 | | | June 2012 | | | (190,720 | ) | |
| | 3,809 | | | Analog Devices, Inc. | | | 39.00 | | | June 2012 | | | (399,945 | ) | |
| | 436 | | | Analog Devices, Inc. | | | 40.00 | | | June 2012 | | | (23,980 | ) | |
| | 296 | | | AOL, Inc. | | | 25.00 | | | July 2012 | | | (51,800 | ) | |
| | 1,000 | | | AOL, Inc. | | | 26.00 | | | May 2012 | | | (55,000 | ) | |
| | 310 | | | AOL, Inc. | | | 26.00 | | | June 2012 | | | (24,647 | ) | |
| | 287 | | | AOL, Inc. | | | 26.00 | | | July 2012 | | | (35,875 | ) | |
| | 287 | | | AOL, Inc. | | | 27.00 | | | July 2012 | | | (25,830 | ) | |
| | 880 | | | Atlas Energy L.P. | | | 35.00 | | | May 2012 | | | (343,200 | ) | |
| | 643 | | | Atlas Energy L.P. | | | 36.00 | | | July 2012 | | | (276,490 | ) | |
| | 4,000 | | | Atlas Energy L.P. | | | 37.00 | | | July 2012 | | | (1,320,000 | ) | |
| | 600 | | | Atlas Energy L.P. | | | 38.00 | | | July 2012 | | | (157,500 | ) | |
| | 1,729 | | | Ball Corporation | | | 35.00 | | | May 2012 | | | (1,184,365 | ) | |
| | 553 | | | Baxter International, Inc. | | | 52.50 | | | May 2012 | | | (168,665 | ) | |
| | 1,872 | | | Baxter International, Inc. | | | 55.00 | | | May 2012 | | | (183,456 | ) | |
| | 564 | | | Corning, Inc. | | | 14.00 | | | May 2012 | | | (28,200 | ) | |
| | 4,826 | | | Corning, Inc. | | | 15.00 | | | May 2012 | | | (28,956 | ) | |
| | 3,403 | | | Crown Holdings, Inc. | | | 38.00 | | | July 2012 | | | (323,285 | ) | |
| | 827 | | | Dresser-Rand Group, Inc. | | | 45.00 | | | June 2012 | | | (384,555 | ) | |
| | 1,565 | | | Dresser-Rand Group, Inc. | | | 50.00 | | | June 2012 | | | (266,050 | ) | |
| | 957 | | | Dresser-Rand Group, Inc. | | | 50.00 | | | September 2012 | | | (344,520 | ) | |
| | 1,054 | | | Eastman Chemical Company | | | 50.00 | | | June 2012 | | | (505,920 | ) | |
| | 5,355 | | | Eastman Chemical Company | | | 52.50 | | | June 2012 | | | (1,392,300 | ) | |
| | 1,469 | | | Eastman Chemical Company | | | 55.00 | | | June 2012 | | | (227,695 | ) | |
| | 76 | | | FMC Corporation | | | 100.00 | | | July 2012 | | | (91,960 | ) | |
| | 73 | | | FMC Corporation | | | 105.00 | | | May 2012 | | | (45,990 | ) | |
| | 1,470 | | | FMC Corporation | | | 105.00 | | | July 2012 | | | (1,161,300 | ) | |
| | 433 | | | General Dynamics Corporation | | | 67.50 | | | May 2012 | | | (45,465 | ) | |
| | 285 | | | General Dynamics Corporation | | | 67.50 | | | June 2012 | | | (47,729 | ) | |
| | 1,286 | | | GlaxoSmithKline PLC | | | 43.84 | | | May 2012 | | | (308,640 | ) | |
| | 1,324 | | | GlaxoSmithKline PLC | | | 44.84 | | | May 2012 | | | (219,784 | ) | |
| | 314 | | | GlaxoSmithKline PLC | | | 45.84 | | | May 2012 | | | (23,550 | ) | |
See Notes to Financial Statements.
FIRST EAGLE FUNDS | SEMI-ANNUAL REPORT | APRIL 30, 2012
108
Schedule of Investments | Six-Month Period Ended April 30, 2012 (unaudited)
| CONTRACTS | | | | STRIKE PRICE | | EXPIRATION DATE | | VALUE (NOTE 1) | |
| Covered Call Options Written — (2.89)% — (continued) | | | |
| | 169 | | | GlaxoSmithKline PLC | | $ | 46.84 | | | August 2012 | | $ | (17,745 | ) | |
| | 584 | | | Health Net, Inc. | | | 37.50 | | | May 2012 | | | (30,660 | ) | |
| | 87 | | | Health Net, Inc. | | | 37.50 | | | June 2012 | | | (8,047 | ) | |
| | 2,878 | | | Health Net, Inc. | | | 40.00 | | | July 2012 | | | (172,680 | ) | |
| | 364 | | | Health Net, Inc. | | | 42.50 | | | July 2012 | | | (10,010 | ) | |
| | 443 | | | Merck & Co., Inc. | | | 38.00 | | | July 2012 | | | (77,968 | ) | |
| | 680 | | | Merck & Co., Inc. | | | 39.00 | | | June 2012 | | | (55,062 | ) | |
| | 235 | | | Merck & Co., Inc. | | | 39.00 | | | July 2012 | | | (25,615 | ) | |
| | 4,490 | | | Mueller Industries, Inc. | | | 45.00 | | | June 2012 | | | (942,900 | ) | |
| | 320 | | | Mueller Industries, Inc. | | | 50.00 | | | June 2012 | | | (105,600 | ) | |
| | 769 | | | Occidental Petroleum Corporation | | | 90.00 | | | May 2012 | | | (204,554 | ) | |
| | 131 | | | Occidental Petroleum Corporation | | | 90.00 | | | June 2012 | | | (51,090 | ) | |
| | 255 | | | Occidental Petroleum Corporation | | | 92.50 | | | June 2012 | | | (64,770 | ) | |
| | 753 | | | Omnicare, Inc. | | | 34.00 | | | June 2012 | | | (112,950 | ) | |
| | 3,656 | | | Omnicare, Inc. | | | 35.00 | | | June 2012 | | | (411,300 | ) | |
| | 1,947 | | | Omnicare, Inc. | | | 36.00 | | | June 2012 | | | (141,158 | ) | |
| | 3,382 | | | Packaging Corporation of America | | | 30.00 | | | July 2012 | | | (253,650 | ) | |
| | 10,980 | | | Pfizer, Inc. | | | 21.00 | | | May 2012 | | | (2,097,180 | ) | |
| | 2,269 | | | Pfizer, Inc. | | | 22.00 | | | May 2012 | | | (213,286 | ) | |
| | 4,609 | | | Pfizer, Inc. | | | 22.00 | | | June 2012 | | | (470,118 | ) | |
| | 1,015 | | | Pfizer, Inc. | | | 23.00 | | | July 2012 | | | (58,870 | ) | |
| | 3,352 | | | Pfizer, Inc. | | | 23.00 | | | August 2012 | | | (231,288 | ) | |
| | 690 | | | Rockwood Holdings, Inc. | | | 40.00 | | | May 2012 | | | (1,038,450 | ) | |
| | 311 | | | Rockwood Holdings, Inc. | | | 45.00 | | | May 2012 | | | (320,330 | ) | |
| | 955 | | | Rockwood Holdings, Inc. | | | 50.00 | | | August 2012 | | | (706,700 | ) | |
| | 66 | | | Seagate Technology | | | 26.00 | | | May 2012 | | | (33,000 | ) | |
| | 3,217 | | | Seagate Technology | | | 26.00 | | | June 2012 | | | (1,705,010 | ) | |
| | 868 | | | Seagate Technology | | | 27.00 | | | May 2012 | | | (338,520 | ) | |
| | 5,535 | | | Seagate Technology | | | 27.00 | | | June 2012 | | | (2,380,050 | ) | |
| | 4,332 | | | Seagate Technology | | | 28.00 | | | June 2012 | | | (1,494,540 | ) | |
| | 3,371 | | | Seagate Technology | | | 29.00 | | | June 2012 | | | (967,477 | ) | |
| | 1,521 | | | Seagate Technology | | | 30.00 | | | June 2012 | | | (337,662 | ) | |
| | 754 | | | Seagate Technology | | | 31.00 | | | June 2012 | | | (128,934 | ) | |
| | 60 | | | SPDR Gold Trust | | | 164.00 | | | May 2012 | | | (6,840 | ) | |
| | 33 | | | SPDR Gold Trust | | | 164.00 | | | June 2012 | | | (7,986 | ) | |
| | 41 | | | SPDR Gold Trust | | | 165.00 | | | May 2012 | | | (3,690 | ) | |
| | 836 | | | Theravance, Inc. | | | 20.00 | | | September 2012 | | | (330,220 | ) | |
| | 994 | | | Theravance, Inc. | | | 22.50 | | | June 2012 | | | (114,310 | ) | |
| | 286 | | | Tyco International Limited | | | 52.50 | | | July 2012 | | | (129,415 | ) | |
See Notes to Financial Statements.
FIRST EAGLE FUNDS | SEMI-ANNUAL REPORT | APRIL 30, 2012
109
Fund of America
| CONTRACTS | | | | STRIKE PRICE | | EXPIRATION DATE | | VALUE (NOTE 1) | |
| Covered Call Options Written — (2.89)% — (continued) | | | |
| | 643 | | | Tyco International Limited | | $ | 55.00 | | | May 2012 | | $ | (106,095 | ) | |
| | 7,850 | | | Tyco International Limited | | | 55.00 | | | July 2012 | | | (2,276,500 | ) | |
| | 822 | | | Tyco International Limited | | | 57.50 | | | July 2012 | | | (111,792 | ) | |
| | 2,000 | | | Valeant Pharmaceuticals
International, Inc. | | | 50.00 | | | July 2012 | | | (1,490,000 | ) | |
| | 1,756 | | | Valeant Pharmaceuticals
International, Inc. | | | 52.50 | | | May 2012 | | | (755,080 | ) | |
| | 3,500 | | | Valeant Pharmaceuticals
International, Inc. | | | 52.50 | | | July 2012 | | | (1,977,500 | ) | |
| | 5,882 | | | Valeant Pharmaceuticals
International, Inc. | | | 55.00 | | | July 2012 | | | (2,352,800 | ) | |
| | 360 | | | Viacom, Inc. | | | 48.00 | | | June 2012 | | | (31,500 | ) | |
| | 1,254 | | | Viacom, Inc. | | | 49.00 | | | June 2012 | | | (87,780 | ) | |
| | 2,879 | | | Viacom, Inc. | | | 50.00 | | | June 2012 | | | (86,370 | ) | |
| | 96 | | | Walter Energy, Inc. | | | 60.00 | | | May 2012 | | | (70,800 | ) | |
| | 33 | | | Walter Energy, Inc. | | | 60.00 | | | June 2012 | | | (26,697 | ) | |
| | 208 | | | Walter Energy, Inc. | | | 65.00 | | | May 2012 | | | (85,280 | ) | |
| | 742 | | | Walter Energy, Inc. | | | 65.00 | | | June 2012 | | | (434,070 | ) | |
| | 781 | | | Walter Energy, Inc. | | | 67.50 | | | June 2012 | | | (359,260 | ) | |
| | 565 | | | Walter Energy, Inc. | | | 70.00 | | | June 2012 | | | (209,050 | ) | |
| | 276 | | | WR Grace & Co. | | | 55.00 | | | May 2012 | | | (131,100 | ) | |
| | 916 | | | WR Grace & Co. | | | 55.00 | | | June 2012 | | | (485,480 | ) | |
| | 4,506 | | | WR Grace & Co. | | | 57.50 | | | June 2012 | | | (1,532,040 | ) | |
| | 529 | | | WR Grace & Co. | | | 60.00 | | | September 2012 | | | (232,760 | ) | |
| | 406 | | | Wyndham Worldwide Corporation | | | 39.00 | | | May 2012 | | | (450,660 | ) | |
| | 2,191 | | | Wyndham Worldwide Corporation | | | 43.00 | | | May 2012 | | | (1,577,520 | ) | |
| | 5,322 | | | Wyndham Worldwide Corporation | | | 44.00 | | | May 2012 | | | (3,326,250 | ) | |
| | 1,097 | | | Wyndham Worldwide Corporation | | | 45.00 | | | May 2012 | | | (562,761 | ) | |
| | 850 | | | Wyndham Worldwide Corporation | | | 46.00 | | | May 2012 | | | (363,800 | ) | |
| | 800 | | | Wyndham Worldwide Corporation | | | 50.00 | | | August 2012 | | | (225,975 | ) | |
| | | | | Total Covered Call Options Written (Premiums Received: $35,277,199) | | | | | | | (45,035,927 | ) | |
| Put Options Written — (0.00)% | | | |
| | 2,000 | | | AOL, Inc. | | | 16.00 | | | July 2012 | | | (20,000 | ) | |
| | 500 | | | AOL, Inc. | | | 17.00 | | | July 2012 | | | (7,500 | ) | |
| | 1,000 | | | AOL, Inc. | | | 18.00 | | | July 2012 | | | (10,000 | ) | |
| Total Put Options Written (Premiums Received: $257,920) | | | | | | | | | (37,500 | ) | |
| Total Investments — 100.03% (Cost: $1,254,122,421) | | | | | | | | | 1,560,009,581 | | |
| Liabilities in Excess of Other Assets — (0.03)% | | | | | | | | | (495,934 | ) | |
| Net Assets — 100.00% | | | | | | | | $ | 1,559,513,647 | | |
See Notes to Financial Statements.
FIRST EAGLE FUNDS | SEMI-ANNUAL REPORT | APRIL 30, 2012
110
Schedule of Investments | Six-Month Period Ended April 30, 2012 (unaudited)
(a) At April 30, 2012, all or a portion of this security was segregated to cover collateral requirement for options.
(b) Non-income producing security/commodity.
(c) This security is convertible until December 15, 2025.
At April 30, 2012, cost is substantially identical for both book and federal income tax purposes. Net unrealized appreciation consisted of:
| Gross unrealized appreciation | | $ | 333,574,988 | | |
| Gross unrealized depreciation | | | (27,687,828 | ) | |
| Net unrealized appreciation | | $ | 305,887,160 | | |
Abbreviations used in this schedule include:
ADR — American Depository Receipt
PLC — Public Limited Company
SPDR — Standard & Poor's Depository Receipts
| INDUSTRY DIVERSIFICATION FOR PORTFOLIO HOLDINGS | | PERCENT OF
NET ASSETS | |
| U.S. Common Stocks | |
| Consumer Discretionary | | | 8.20 | % | |
| Energy | | | 9.03 | | |
| Health Care | | | 24.80 | | |
| Industrials | | | 4.84 | | |
| Information Technology | | | 8.82 | | |
| Materials | | | 32.50 | | |
| Total U.S. Common Stocks | | | 88.19 | | |
| International Common Stocks | |
| Health Care | | | 0.97 | | |
| Industrials | | | 5.90 | | |
| Total International Common Stocks | | | 6.87 | | |
| Exchange Traded Fund | | | 3.33 | | |
| Investment Company | | | 4.00 | | |
| U.S. Convertible Bond | |
| Health Care | | | 0.34 | | |
| Total U.S. Convertible Bond | | | 0.34 | | |
See Notes to Financial Statements.
FIRST EAGLE FUNDS | SEMI-ANNUAL REPORT | APRIL 30, 2012
111
Fund of America
| INDUSTRY DIVERSIFICATION FOR PORTFOLIO HOLDINGS — (CONTINUED) | | PERCENT OF
NET ASSETS | |
| Call Options Purchased | | | 0.19 | % | |
| Covered Call Options Written | | | (2.89 | ) | |
| Put Options Written | | | (0.00 | ) | |
| Total Investments | | | 100.03 | % | |
See Notes to Financial Statements.
FIRST EAGLE FUNDS | SEMI-ANNUAL REPORT | APRIL 30, 2012
112
This page was intentionally left blank.
Statements of Assets and Liabilities
| | | FIRST EAGLE
GLOBAL FUND | | FIRST EAGLE
OVERSEAS FUND | |
| Assets | |
| Investments, at Cost (Note 1) | |
| Unaffiliated issuers | | $ | 26,227,448,909 | | | $ | 7,679,291,114 | | |
| Affiliated issuers | | | 2,889,877,437 | | | | 823,706,424 | | |
| Gold bullion | | | 586,146,006 | | | | 217,894,842 | | |
| Foreign currency | | | — | | | | — | | |
| Total Investments, at Cost | | | 29,703,472,352 | | | | 8,720,892,380 | | |
| Investments, at Value (Note 1) | |
| Unaffiliated issuers | | | 29,953,776,258 | | | | 8,622,495,595 | | |
| Affiliated issuers | | | 3,276,048,942 | | | | 1,192,239,676 | | |
| Gold bullion | | | 1,751,034,959 | | | | 735,536,841 | | |
| Foreign currency | | | — | | | | — | | |
| Total Investments, at Value | | | 34,980,860,159 | | | | 10,550,272,112 | | |
| Cash | | | 341 | | | | 2,421 | | |
| Due from broker | | | — | | | | 2,925,263 | | |
| Receivable for forward currency contracts held, at value (Note 1) | | | 46,855,058 | | | | 30,403,958 | | |
| Receivable for investment securities sold | | | 22,269,452 | | | | 8,406,816 | | |
| Receivable for Fund shares sold | | | 114,057,848 | | | | 25,237,088 | | |
| Accrued interest and dividends receivable | | | 159,850,916 | | | | 80,335,296 | | |
| Investment for trustee deferred compensation plan (Note 2) | | | 1,631,584 | | | | 1,605,307 | | |
| Other assets | | | 485,798 | | | | 156,720 | | |
| Total Assets | | | 35,326,011,156 | | | | 10,699,344,981 | | |
| Liabilities | |
Option contracts written, at value (premiums received $4,499,162,
$0, $375,887 and $0, respectively) (Note 1) | | | 2,923,400 | | | | — | | |
| Payable for Fund shares redeemed | | | 31,717,260 | | | | 11,320,988 | | |
| Payable for investment securities purchased | | | 192,443,246 | | | | 2,236,595 | | |
| Payable for forward currency contracts held, at value (Note 1) | | | 10,761,869 | | | | 7,139,962 | | |
| Investment advisory fees payable (Note 2) | | | 21,308,450 | | | | 6,517,878 | | |
| Distribution fees payable (Note 3) | | | 8,801,720 | | | | 1,676,416 | | |
| Services fees payable (Note 3) | | | 1,874,197 | | | | 208,592 | | |
| Trustee deferred compensation plan (Note 2) | | | 1,631,584 | | | | 1,605,307 | | |
| Administrative fees payable (Note 2) | | | 1,094,649 | | | | 399,007 | | |
| Due to custodian | | | 1,511,619 | | | | 19,428 | | |
| Trustee fees payable | | | 64,533 | | | | 12,132 | | |
| Accrued expenses and other liabilities | | | 16,464,440 | | | | 7,280,935 | | |
| Total Liabilities | | | 290,596,967 | | | | 38,417,240 | | |
| Net Assets | | $ | 35,035,414,189 | | | $ | 10,660,927,741 | | |
* First Eagle Gold Fund financial statements are shown on a consolidated basis and includes the balances of the First Eagle Gold Cayman Fund, Ltd.
See Notes to Financial Statements.
FIRST EAGLE FUNDS | SEMI-ANNUAL REPORT | APRIL 30, 2012
114
April 30, 2012 (unaudited)
| | | FIRST EAGLE
U.S. VALUE FUND | | FIRST EAGLE
GOLD FUND* | |
| Assets | |
| Investments, at Cost (Note 1) | |
| Unaffiliated issuers | | $ | 2,224,884,919 | | | $ | 1,804,087,887 | | |
| Affiliated issuers | | | 48,006,679 | | | | — | | |
| Gold bullion | | | 72,521,699 | | | | 185,268,444 | | |
| Foreign currency | | | 19 | | | | 105 | | |
| Total Investments, at Cost | | | 2,345,413,316 | | | | 1,989,356,436 | | |
| Investments, at Value (Note 1) | |
| Unaffiliated issuers | | | 2,520,769,270 | | | | 2,099,839,254 | | |
| Affiliated issuers | | | 51,471,982 | | | | — | | |
| Gold bullion | | | 119,672,002 | | | | 569,025,451 | | |
| Foreign currency | | | 19 | | | | 105 | | |
| Total Investments, at Value | | | 2,691,913,273 | | | | 2,668,864,810 | | |
| Cash | | | 729 | | | | 1,745 | | |
| Due from broker | | | — | | | | — | | |
| Receivable for forward currency contracts held, at value (Note 1) | | | — | | | | — | | |
| Receivable for investment securities sold | | | 364,669 | | | | 6,683,502 | | |
| Receivable for Fund shares sold | | | 14,204,924 | | | | 7,160,202 | | |
| Accrued interest and dividends receivable | | | 3,505,351 | | | | 2,439,310 | | |
| Investment for trustee deferred compensation plan (Note 2) | | | 1,192,904 | | | | 173,672 | | |
| Other assets | | | 45,607 | | | | 56,861 | | |
| Total Assets | | | 2,711,227,457 | | | | 2,685,380,102 | | |
| Liabilities | |
Option contracts written, at value (premiums received $4,499,162,
$0, $375,887 and $0, respectively) (Note 1) | | | 250,600 | | | | — | | |
| Payable for Fund shares redeemed | | | 1,989,375 | | | | 6,276,045 | | |
| Payable for investment securities purchased | | | 1,265,763 | | | | — | | |
| Payable for forward currency contracts held, at value (Note 1) | | | — | | | | — | | |
| Investment advisory fees payable (Note 2) | | | 1,634,750 | | | | 1,650,440 | | |
| Distribution fees payable (Note 3) | | | 604,899 | | | | 633,080 | | |
| Services fees payable (Note 3) | | | 113,041 | | | | 114,227 | | |
| Trustee deferred compensation plan (Note 2) | | | 1,192,904 | | | | 173,672 | | |
| Administrative fees payable (Note 2) | | | 52,646 | | | | 153,674 | | |
| Due to custodian | | | — | | | | — | | |
| Trustee fees payable | | | 2,844 | | | | 37,049 | | |
| Accrued expenses and other liabilities | | | 264,483 | | | | 1,003,365 | | |
| Total Liabilities | | | 7,371,305 | | | | 10,041,552 | | |
| Net Assets | | $ | 2,703,856,152 | | | $ | 2,675,338,550 | | |
FIRST EAGLE FUNDS | SEMI-ANNUAL REPORT | APRIL 30, 2012
115
Statements of Assets and Liabilities (continued)
| | | FIRST EAGLE
GLOBAL FUND | | FIRST EAGLE
OVERSEAS FUND | |
| Net Assets Consist of | |
| Capital stock (par value, $0.001 per share) | | $ | 728,354 | | | $ | 487,878 | | |
| Capital surplus | | | 29,189,170,311 | | | | 8,857,378,387 | | |
| Net unrealized appreciation on: | |
Investments (net of $11,440,203, $5,411,129, $0, and $0
deferred capital gain country tax, respectively) | | | 5,265,947,604 | | | | 1,823,968,603 | | |
| Foreign currency and forward contract related translation | | | 40,049,919 | | | | 24,973,843 | | |
| Written options | | | 1,575,762 | | | | — | | |
| Undistributed net realized gains on investments | | | 712,460,992 | | | | 241,872,904 | | |
| Undistributed net investment income (loss) | | | (174,518,753 | ) | | | (287,753,874 | ) | |
| Net Assets | | $ | 35,035,414,189 | | | $ | 10,660,927,741 | | |
| Class A | |
| Net assets | | $ | 15,619,464,977 | | | $ | 5,155,405,074 | | |
| Shares outstanding | | | 323,524,347 | | | | 236,846,205 | | |
| Net asset value per share and redemption proceeds per share | | $ | 48.28 | | | $ | 21.77 | | |
| Offering price per share (NAV per share plus maximum sales charge) | | $ | 50.821 | | | $ | 22.921 | | |
| Class C | |
| Net assets | | $ | 9,224,612,746 | | | $ | 1,022,124,821 | | |
| Shares outstanding | | | 194,607,421 | | | | 48,150,765 | | |
| Net asset value per share | | $ | 47.40 | | | $ | 21.23 | | |
Redemption proceeds per share (NAV per share less maximum
contingent deferred sale charge)2 | | $ | 46.93 | | | $ | 21.02 | | |
| Class I | |
| Net assets | | $ | 10,191,336,466 | | | $ | 4,483,397,846 | | |
| Shares outstanding | | | 210,222,288 | | | | 202,881,419 | | |
| Net asset value per share and redemption proceeds per share | | $ | 48.48 | | | $ | 22.10 | | |
* First Eagle Gold Fund financial statements are shown on a consolidated basis and includes the balances of the First Eagle Gold Cayman Fund, Ltd.
1 The maximum sales charge is 5.00% for Class A shares. Classes C, I and Y have no front-end sales charges.
2 The maximum CDSC (Contingent Deferred Sales Charge) is 1.00% for Class C shares, which is charged on the lesser of the offering price or the net asset value at the time of sale by shareholder. This pertains to investments of one year or less.
See Notes to Financial Statements.
FIRST EAGLE FUNDS | SEMI-ANNUAL REPORT | APRIL 30, 2012
116
April 30, 2012 (unaudited)
| | | FIRST EAGLE
U.S. VALUE FUND | | FIRST EAGLE
GOLD FUND* | |
| Net Assets Consist of | |
| Capital stock (par value, $0.001 per share) | | $ | 151,348 | | | $ | 99,096 | | |
| Capital surplus | | | 2,313,066,633 | | | | 2,091,783,353 | | |
| Net unrealized appreciation on: | |
Investments (net of $11,440,203, $5,411,129, $0, and $0
deferred capital gain country tax, respectively) | | | 346,499,957 | | | | 679,508,374 | | |
| Foreign currency and forward contract related translation | | | — | | | | 1,141 | | |
| Written options | | | 125,287 | | | | — | | |
| Undistributed net realized gains on investments | | | 36,151,520 | | | | 25,996,665 | | |
| Undistributed net investment income (loss) | | | 7,861,407 | | | | (122,050,079 | ) | |
| Net Assets | | $ | 2,703,856,152 | | | $ | 2,675,338,550 | | |
| Class A | |
| Net assets | | $ | 1,323,373,973 | | | $ | 1,417,211,728 | | |
| Shares outstanding | | | 74,187,529 | | | | 52,315,316 | | |
| Net asset value per share and redemption proceeds per share | | $ | 17.84 | | | $ | 27.09 | | |
| Offering price per share (NAV per share plus maximum sales charge) | | $ | 18.781 | | | $ | 28.521 | | |
| Class C | |
| Net assets | | $ | 561,046,787 | | | $ | 555,333,096 | | |
| Shares outstanding | | | 31,758,903 | | | | 21,142,881 | | |
| Net asset value per share | | $ | 17.67 | | | $ | 26.27 | | |
Redemption proceeds per share (NAV per share less maximum
contingent deferred sale charge)2 | | $ | 17.49 | | | $ | 26.01 | | |
| Class I | |
| Net assets | | $ | 819,435,392 | | | $ | 702,793,726 | | |
| Shares outstanding | | | 45,401,840 | | | | 25,638,240 | | |
| Net asset value per share and redemption proceeds per share | | $ | 18.05 | | | $ | 27.41 | | |
FIRST EAGLE FUNDS | SEMI-ANNUAL REPORT | APRIL 30, 2012
117
Statements of Assets and Liabilities (continued)
| | | FIRST EAGLE
HIGH YIELD FUND | | FIRST EAGLE
FUND OF AMERICA | |
| Assets | |
| Investments, at Cost (Note 1) | |
| Unaffiliated issuers | | $ | 264,855,446 | | | $ | 1,289,657,540 | | |
| Foreign currency | | | 208,503 | | | | — | | |
| Total Investments, at Cost | | | 265,063,949 | | | | 1,289,657,540 | | |
| Investments, at Value (Note 1) | |
| Unaffiliated issuers | | | 267,123,512 | | | | 1,605,083,008 | | |
| Foreign currency | | | 208,094 | | | | — | | |
| Total Investments, at Value | | | 267,331,606 | | | | 1,605,083,008 | | |
| Cash | | | 874 | | | | — | | |
| Restricted cash | | | — | | | | 6,142,500 | ** | |
| Receivable for Fund shares sold | | | 9,708,552 | | | | 3,245,699 | | |
| Accrued interest and dividends receivable | | | 5,106,101 | | | | 1,444,499 | | |
| Receivable for investment securities sold | | | 776,911 | | | | 3,668,548 | | |
| Receivable for premiums for written options | | | — | | | | 673,388 | | |
Investment for trustee deferred compensation
plan (Note 2) | | | — | | | | 661,719 | | |
| Prepaid expenses and other assets | | | 138,572 | | | | 26,625 | | |
| Total Assets | | | 283,062,616 | | | | 1,620,945,986 | | |
| Liabilities | |
Option contracts written, at value (premiums
received $0 and $35,535,119, respectively) (Note 1) | | | — | | | | 45,073,427 | | |
| Payable for investment securities purchased | | | 1,294,169 | | | | 11,711,799 | | |
| Payable for Fund shares redeemed | | | 213,928 | | | | 1,886,490 | | |
| Investment advisory fees payable (Note 2) | | | 89,863 | | | | 1,259,924 | | |
| Trustee deferred compensation plan (Note 2) | | | — | | | | 661,719 | | |
| Distribution fees payable (Note 3) | | | 36,664 | | | | 407,836 | | |
| Payable for dividends to shareholders | | | 174,002 | | | | — | | |
| Services fees payable (Note 3) | | | 6,852 | | | | 46,427 | | |
| Administrative fees payable (Note 2) | | | — | | | | 51,021 | | |
Payable for forward currency contracts held,
at value (Note 1) | | | 24,554 | | | | — | | |
| Trustee fees payable | | | 420 | | | | 340 | | |
| Accrued expenses and other liabilities | | | 43,938 | | | | 333,356 | | |
| Total Liabilities | | | 1,884,390 | | | | 61,432,339 | | |
| Net Assets | | $ | 281,178,226 | | | $ | 1,559,513,647 | | |
** The amount of $6,142,500 represents restricted cash used as collateral for covered call options.
See Notes to Financial Statements.
FIRST EAGLE FUNDS | SEMI-ANNUAL REPORT | APRIL 30, 2012
118
April 30, 2012 (unaudited)
| | | FIRST EAGLE
HIGH YIELD FUND | | FIRST EAGLE
FUND OF AMERICA | |
| Net Assets Consist of | |
| Capital stock (par value, $0.001 per share) | | $ | 28,772 | | | $ | 59,897 | | |
| Capital surplus | | | 278,623,110 | | | | 1,296,733,897 | | |
| Net unrealized appreciation (depreciation) on: | |
| Investments | | | 2,268,066 | | | | 320,371,599 | | |
Foreign currency and forward contract
related translation | | | (18,801 | ) | | | — | | |
| Written options | | | — | | | | (9,538,308 | ) | |
Undistributed net realized gains (losses)
on investments | | | 252,830 | | | | (47,431,091 | ) | |
| Undistributed net investment income (loss) | | | 24,249 | | | | (682,347 | ) | |
| Net Assets | | $ | 281,178,226 | | | $ | 1,559,513,647 | | |
| Class A | |
| Net assets | | $ | 100,118,794 | | | $ | 642,435,967 | | |
| Shares outstanding | | | 10,241,791 | | | | 24,332,674 | | |
Net asset value per share and redemption proceeds
per share | | $ | 9.78 | | | $ | 26.40 | | |
Offering price per share (NAV per share plus
maximum sales charge) | | $ | 10.241 | | | $ | 27.792 | | |
| Class C | |
| Net assets | | $ | 41,813,123 | | | $ | 230,704,884 | | |
| Shares outstanding | | | 4,281,877 | | | | 10,037,986 | | |
| Net asset value per share | | $ | 9.77 | | | $ | 22.98 | | |
Redemption proceeds per share (NAV per share
less maximum contingent deferred sale charge)3 | | $ | 9.67 | | | $ | 22.75 | | |
| Class I | |
| Net assets | | $ | 139,246,309 | | | | — | | |
| Shares outstanding | | | 14,247,856 | | | | — | | |
Net asset value per share and redemption proceeds
per share | | $ | 9.77 | | | | — | | |
| Class Y | |
| Net assets | | | — | | | $ | 686,372,796 | | |
| Shares outstanding | | | — | | | | 25,526,586 | | |
Net asset value per share and redemption proceeds
per share | | | — | | | $ | 26.89 | | |
1 The maximum sales charge is 4.50% for Class A shares. Classes C, I and Y have no front-end sales charges.
2 The maximum sales charge is 5.00% for Class A shares. Classes C, I and Y have no front-end sales charges.
3 The maximum CDSC (Contingent Deferred Sales Charge) is 1.00% for Class C shares, which is charged on the lesser of the offering price or the net asset value at the time of sale by shareholder. This pertains to investments of one year or less.
See Notes to Financial Statements.
FIRST EAGLE FUNDS | SEMI-ANNUAL REPORT | APRIL 30, 2012
119
Statements of Operations
* First Eagle Gold Fund financial statements are shown on a consolidated basis and includes the balances of the First Eagle Gold Cayman Fund, Ltd.
| | | FIRST EAGLE
GLOBAL FUND | | FIRST EAGLE
OVERSEAS FUND | |
| Investment Income | |
Interest (net of $196,846, $63,242, $0, and $0, foreign taxes
withheld, respectively) | | $ | 13,152,200 | | | $ | 3,961,895 | | |
Dividends from: (net of $22,315,655, $12,034,952, $96,140,
and $934,367, foreign taxes withheld, respectively) | |
| Unaffiliated issuers | | | 308,118,638 | | | | 98,486,787 | | |
| Affiliated issuers | | | 42,707,455 | | | | 23,181,666 | | |
| Other Income | | | 47,519 | | | | 46,301 | | |
| Total Income | | | 364,025,812 | | | | 125,676,649 | | |
| Expenses | |
| Investment advisory fees (Note 2) | | | 122,383,426 | | | | 38,201,301 | | |
| Administrative costs (Note 2) | | | 2,569,164 | | | | 865,148 | | |
| Distribution fees (Note 3) | |
| Class A | | | 18,494,991 | | | | 6,235,916 | | |
| Class C | | | 32,604,276 | | | | 3,766,687 | | |
| Service fees - Class C (Note 3) | | | 10,868,092 | | | | 1,255,562 | | |
| Shareholder servicing agent fees | | | 14,360,763 | | | | 5,718,127 | | |
| Custodian and accounting fees | | | 2,179,653 | | | | 1,246,901 | | |
| Shareholder reporting fees | | | 1,279,946 | | | | 347,899 | | |
| Trustees' fees | | | 338,950 | | | | 114,158 | | |
| Registration and filing fees | | | 632,273 | | | | 211,141 | | |
| Professional fees | | | 228,228 | | | | 127,852 | | |
| Other Expenses | | | 366,201 | | | | 135,509 | | |
| Total Expenses | | | 206,305,963 | | | | 58,226,201 | | |
| Expense reductions due to earnings credits (Note 1) | | | (1,625 | ) | | | (488 | ) | |
| Net Expenses | | | 206,304,338 | | | | 58,225,713 | | |
| Net Investment Income (Loss) (Note 1) | | | 157,721,474 | | | | 67,450,936 | | |
Realized and Unrealized Gains (Losses) on Investments, Foreign
Currency Related Transactions and Written Options (Note 1) | |
| Net realized gains (losses) from: | |
| Investment transactions of unaffiliated issuers | | | 641,728,159 | | | | 202,588,509 | | |
| Investment transactions of affiliated issuers | | | 5,172,283 | | | | 3,074,415 | | |
| Foreign currency and forward contract related transactions | | | 92,294,489 | | | | 49,792,206 | | |
| Written options | | | 2,030,334 | | | | — | | |
| | | | 741,225,265 | | | | 255,455,130 | | |
| Changes in unrealized appreciation (depreciation) of: | |
Investment transactions (net of increase in deferred capital gain country
tax accruals of $5,556,564, $2,932,926, $0, and $0, respectively) | | | 814,228,335 | | | | (72,161,443 | ) | |
| Foreign currency and forward contract related translation | | | 38,043,017 | | | | 25,279,296 | | |
| Written options | | | 1,914,178 | | | | — | | |
| | | | 854,185,530 | | | | (46,882,147 | ) | |
Net realized and unrealized gains (losses) on investments, foreign
currency and forward contract related transactions and written options | | | 1,595,410,795 | | | | 208,572,983 | | |
| Net Increase (Decrease) in Net Assets Resulting from Operations | | $ | 1,753,132,269 | | | $ | 276,023,919 | | |
See Notes to Financial Statements.
FIRST EAGLE FUNDS | SEMI-ANNUAL REPORT | APRIL 30, 2012
120
Six-Months Ended April 30, 2012 (unaudited)
| | | FIRST EAGLE
U.S. VALUE FUND | | FIRST EAGLE
GOLD FUND* | |
| Investment Income | |
Interest (net of $196,846, $63,242, $0, and $0, foreign taxes
withheld, respectively) | | $ | 3,058,075 | | | $ | 1,160,218 | | |
Dividends from: (net of $22,315,655, $12,034,952, $96,140,
and $934,367, foreign taxes withheld, respectively) | |
| Unaffiliated issuers | | | 20,069,144 | | | | 17,254,400 | | |
| Affiliated issuers | | | 52,383 | | | | — | | |
| Other Income | | | 299 | | | | — | | |
| Total Income | | | 23,179,901 | | | | 18,414,618 | | |
| Expenses | |
| Investment advisory fees (Note 2) | | | 8,677,049 | | | | 12,025,529 | | |
| Administrative costs (Note 2) | | | 154,082 | | | | 312,752 | | |
| Distribution fees (Note 3) | |
| Class A | | | 1,434,489 | | | | 2,032,643 | | |
| Class C | | | 1,813,145 | | | | 2,347,398 | | |
| Service fees - Class C (Note 3) | | | 604,382 | | | | 782,466 | | |
| Shareholder servicing agent fees | | | 1,031,349 | | | | 2,039,263 | | |
| Custodian and accounting fees | | | 92,553 | | | | 347,200 | | |
| Shareholder reporting fees | | | 119,740 | | | | 154,820 | | |
| Trustees' fees | | | 20,058 | | | | 46,353 | | |
| Registration and filing fees | | | 136,836 | | | | 120,952 | | |
| Professional fees | | | 54,152 | | | | 82,288 | | |
| Other Expenses | | | 29,524 | | | | 53,311 | | |
| Total Expenses | | | 14,167,359 | | | | 20,344,975 | | |
| Expense reductions due to earnings credits (Note 1) | | | (175 | ) | | | (215 | ) | |
| Net Expenses | | | 14,167,184 | | | | 20,344,760 | | |
| Net Investment Income (Loss) (Note 1) | | | 9,012,717 | | | | (1,930,142 | ) | |
Realized and Unrealized Gains (Losses) on Investments, Foreign
Currency Related Transactions and Written Options (Note 1) | |
| Net realized gains (losses) from: | |
| Investment transactions of unaffiliated issuers | | | 38,521,930 | | | | 27,356,922 | | |
| Investment transactions of affiliated issuers | | | — | | | | — | | |
| Foreign currency and forward contract related transactions | | | (8,301 | ) | | | (8,205 | ) | |
| Written options | | | 341,309 | | | | — | | |
| | | | 38,854,938 | | | | 27,348,717 | | |
| Changes in unrealized appreciation (depreciation) of: | |
Investment transactions (net of increase in deferred capital gain country
tax accruals of $5,556,564, $2,932,926, $0, and $0, respectively) | | | 130,416,142 | | | | (613,206,328 | ) | |
| Foreign currency and forward contract related translation | | | — | | | | 1,751 | | |
| Written options | | | 112,728 | | | | — | | |
| | | | 130,528,870 | | | | (613,204,577 | ) | |
Net realized and unrealized gains (losses) on investments, foreign
currency and forward contract related transactions and written options | | | 169,383,808 | | | | (585,855,860 | ) | |
| Net Increase (Decrease) in Net Assets Resulting from Operations | | $ | 178,396,525 | | | $ | (587,786,002 | ) | |
FIRST EAGLE FUNDS | SEMI-ANNUAL REPORT | APRIL 30, 2012
121
Statements of Operations (continued)
| | | FIRST EAGLE
HIGH YIELD FUND** | | FIRST EAGLE
HIGH YIELD FUND*** | |
| Investment Income | |
| Interest | | $ | 1,403,776 | | | $ | 2,321,034 | | |
Dividends from: (net of $0, $0 and $8,820, foreign taxes
withheld, respectively) | |
| Unaffiliated issuers | | | — | | | | — | | |
| Other Income | | | 57,244 | | | | 20,880 | | |
| Total Income | | | 1,461,020 | | | | 2,341,914 | | |
| Expenses | |
| Investment advisory fees (Note 2) | | | 135,445 | | | | 216,063 | | |
| Administrative costs (Note 2) | | | — | | | | — | | |
| Distribution fees (Note 3) | |
| Class A | | | 16,107 | | | | 12,552 | | |
| Class C | | | 20,557 | | | | 17,067 | | |
| Class Y | | | — | | | | — | | |
| Service fees - Class C (Note 3) | | | 6,852 | | | | 5,689 | | |
| Shareholder servicing agent fees | | | 3,811 | | | | 4,477 | | |
| Custodian and accounting fees | | | 7,155 | | | | 4,103 | | |
| Shareholder reporting fees | | | 6,410 | | | | 18,531 | | |
| Trustees' fees | | | 329 | | | | 2,036 | | |
| Registration and filing fees | | | 9,804 | | | | 30,060 | | |
| Professional fees | | | 13,729 | | | | 30,135 | | |
| Other Expenses | | | 6,980 | | | | 13,944 | | |
| Total Expenses | | | 227,179 | | | | 354,657 | | |
| Investment Advisory Fee Waiver | | | (31,283 | ) | | | (72,599 | ) | |
| Expense reductions due to earnings credits (Note 1) | | | — | | | | — | | |
| Net Expenses | | | 195,896 | | | | 282,058 | | |
| Net Investment Income (Loss) (Note 1) | | | 1,265,124 | | | | 2,059,856 | | |
Realized and Unrealized Gains (Losses) on Investments, Foreign
Currency Related Transactions and Written Options (Note 1) | |
| Net realized gains (losses) from: | |
| Investment transactions of unaffiliated issuers | | | 138,603 | | | | 369,783 | | |
| Foreign currency and forward contract related transactions | | | 789 | | | | (49,154 | ) | |
| Written options | | | — | | | | — | | |
| | | | 139,392 | | | | 320,629 | | |
| Changes in unrealized appreciation (depreciation) of: | |
| Investment transactions | | | 795,328 | | | | 1,573,567 | | |
| Foreign currency and forward contract related translation | | | (3,810 | ) | | | (14,991 | ) | |
| Written options | | | — | | | | — | | |
| | | | 791,518 | | | | 1,558,576 | | |
Net realized and unrealized gains on investments, foreign currency
and forward contract related transactions and written options | | | 930,910 | | | | 1,879,205 | | |
| Net Increase in Net Assets Resulting from Operations | | $ | 2,196,034 | | | $ | 3,939,061 | | |
** For the period from April 1, 2012 to April 30, 2012.
*** For the fiscal year ended March 31, 2012.
See Notes to Financial Statements.
FIRST EAGLE FUNDS | SEMI-ANNUAL REPORT | APRIL 30, 2012
122
Six-Months Ended April 30, 2012 (unaudited)
| | | FIRST EAGLE
FUND OF AMERICA | |
| Investment Income | |
| Interest | | $ | 76,830 | | |
Dividends from: (net of $0, $0 and $8,820, foreign taxes
withheld, respectively) | |
| Unaffiliated issuers | | | 10,495,150 | | |
| Other Income | | | — | | |
| Total Income | | | 10,571,980 | | |
| Expenses | |
| Investment advisory fees (Note 2) | | | 7,188,042 | | |
| Administrative costs (Note 2) | | | 116,338 | | |
| Distribution fees (Note 3) | |
| Class A | | | 727,643 | | |
| Class C | | | 776,993 | | |
| Class Y | | | 810,369 | | |
| Service fees - Class C (Note 3) | | | 258,998 | | |
| Shareholder servicing agent fees | | | 865,591 | | |
| Custodian and accounting fees | | | 95,155 | | |
| Shareholder reporting fees | | | 77,708 | | |
| Trustees' fees | | | 15,489 | | |
| Registration and filing fees | | | 109,738 | | |
| Professional fees | | | 61,482 | | |
| Other Expenses | | | 24,928 | | |
| Total Expenses | | | 11,128,474 | | |
| Investment Advisory Fee Waiver | | | — | | |
| Expense reductions due to earnings credits (Note 1) | | | (109 | ) | |
| Net Expenses | | | 11,128,365 | | |
| Net Investment Income (Loss) (Note 1) | | | (556,385 | ) | |
Realized and Unrealized Gains (Losses) on Investments, Foreign
Currency Related Transactions and Written Options (Note 1) | |
| Net realized gains (losses) from: | |
| Investment transactions of unaffiliated issuers | | | (18,427,450 | ) | |
| Foreign currency and forward contract related transactions | | | — | | |
| Written options | | | (13,919,582 | ) | |
| | | | (32,347,032 | ) | |
| Changes in unrealized appreciation (depreciation) of: | |
| Investment transactions | | | 227,156,867 | | |
| Foreign currency and forward contract related translation | | | — | | |
| Written options | | | 74,639 | | |
| | | | 227,231,506 | | |
Net realized and unrealized gains on investments, foreign currency
and forward contract related transactions and written options | | | 194,884,474 | | |
| Net Increase in Net Assets Resulting from Operations | | $ | 194,328,089 | | |
FIRST EAGLE FUNDS | SEMI-ANNUAL REPORT | APRIL 30, 2012
123
Statements of Changes in Net Assets
| | | FIRST EAGLE
GLOBAL FUND | | FIRST EAGLE
OVERSEAS FUND | |
| | | SIX-MONTHS
ENDED
APRIL 30, 2012
(unaudited) | | YEAR ENDED
OCTOBER 31,
2011 | | SIX-MONTHS
ENDED
APRIL 30, 2012
(unaudited) | | YEAR ENDED
OCTOBER 31,
2011 | |
| Operations | |
| Net investment income (loss) | | $ | 157,721,474 | | | $ | 195,358,527 | | | $ | 67,450,936 | | | $ | 82,538,430 | | |
Net realized gain from investments, foreign currency and
forward contract related transactions and written options | | | 741,225,265 | | | | 690,306,873 | | | | 255,455,130 | | | | 239,416,900 | | |
Change in unrealized appreciation (depreciation) of investments,
foreign currency and forward contract related transactions and
written options | | | 854,185,530 | | | | 798,845,665 | | | | (46,882,147 | ) | | | 26,703,063 | | |
| Net increase (decrease) in net assets resulting from operations | | | 1,753,132,269 | | | | 1,684,511,065 | | | | 276,023,919 | | | | 348,658,393 | | |
| Distribution to Shareholders | |
| Dividends paid from net investment income | |
| Class A | | | (161,659,347 | ) | | | (179,125,248 | ) | | | (87,147,378 | ) | | | (68,667,242 | ) | |
| Class C | | | (37,795,689 | ) | | | (53,722,987 | ) | | | (9,351,396 | ) | | | (7,990,749 | ) | |
| Class I | | | (117,693,838 | ) | | | (94,957,034 | ) | | | (83,348,638 | ) | | | (56,678,049 | ) | |
| Class Y | | | — | | | | — | | | | — | | | | — | | |
Distributions paid from net realized gains from
investment transactions | |
| Class A | | | (187,416,480 | ) | | | — | | | | (144,484,153 | ) | | | (44,782,633 | ) | |
| Class C | | | (112,464,797 | ) | | | — | | | | (30,206,608 | ) | | | (9,220,791 | ) | |
| Class I | | | (111,887,923 | ) | | | — | | | | (117,992,781 | ) | | | (31,995,749 | ) | |
| Class Y | | | — | | | | — | | | | — | | | | — | | |
| Decrease in net assets resulting from distributions | | | (728,918,074 | ) | | | (327,805,269 | ) | | | (472,530,954 | ) | | | (219,335,213 | ) | |
| Fund Share Transactions (Note 6) | |
| Net proceeds from shares sold | | | 4,861,571,406 | | | | 10,549,879,443 | | | | 1,672,849,503 | | | | 3,711,007,723 | | |
Net asset value of shares issued for reinvested dividends and
distributions | | | 575,706,733 | | | | 261,507,604 | | | | 394,213,422 | | | | 184,257,838 | | |
| Cost of shares redeemed | | | (2,618,604,732 | ) | | | (5,041,087,367 | ) | | | (1,395,302,636 | ) | | | (2,714,178,454 | ) | |
| Redemption fees | | | 417,685 | | | | 1,147,493 | | | | 157,933 | | | | 583,929 | | |
| Increase (decrease) in net assets from Fund share transactions | | | 2,819,091,092 | | | | 5,771,447,173 | | | | 671,918,222 | | | | 1,181,671,036 | | |
| Net increase (decrease) in net assets | | | 3,843,305,287 | | | | 7,128,152,969 | | | | 475,411,187 | | | | 1,310,994,216 | | |
| Net Assets (Note 1) | |
| Beginning of period | | | 31,192,108,902 | | | | 24,063,955,933 | | | | 10,185,516,554 | | | | 8,874,522,338 | | |
| End of period | | $ | 35,035,414,189 | | | $ | 31,192,108,902 | | | $ | 10,660,927,741 | | | $ | 10,185,516,554 | | |
| Undistributed net investment income (loss) | | $ | (174,518,753 | ) | | $ | (15,091,353 | ) | | $ | (287,753,874 | ) | | $ | (175,357,398 | ) | |
* First Eagle Gold Fund financial statements are shown on a consolidated basis and includes the balances of the First Eagle Gold Cayman Fund, Ltd.
See Notes to Financial Statements.
FIRST EAGLE FUNDS | SEMI-ANNUAL REPORT | APRIL 30, 2012
124
| | | FIRST EAGLE
U.S. VALUE FUND | | FIRST EAGLE
GOLD FUND* | |
| | | SIX-MONTHS
ENDED
APRIL 30, 2012
(unaudited) | | YEAR ENDED
OCTOBER 31,
2011 | | SIX-MONTHS
ENDED
APRIL 30, 2012
(unaudited) | | YEAR ENDED
OCTOBER 31,
2011 | |
| Operations | |
| Net investment income (loss) | | $ | 9,012,717 | | | $ | 14,284,155 | | | $ | (1,930,142 | ) | | $ | (21,503,086 | ) | |
Net realized gain from investments, foreign currency and
forward contract related transactions and written options | | | 38,854,938 | | | | 68,932,963 | | | | 27,348,717 | | | | 166,627,775 | | |
Change in unrealized appreciation (depreciation) of investments,
foreign currency and forward contract related transactions and
written options | | | 130,528,870 | | | | 50,108,672 | | | | (613,204,577 | ) | | | 85,417,459 | | |
| Net increase (decrease) in net assets resulting from operations | | | 178,396,525 | | | | 133,325,790 | | | | (587,786,002 | ) | | | 230,542,148 | | |
| Distribution to Shareholders | |
| Dividends paid from net investment income | |
| Class A | | | (8,668,560 | ) | | | (14,601,729 | ) | | | (21,160,789 | ) | | | (41,372,108 | ) | |
| Class C | | | (761,790 | ) | | | (4,588,209 | ) | | | (3,321,956 | ) | | | (10,828,155 | ) | |
| Class I | | | (5,904,350 | ) | | | (7,711,426 | ) | | | (14,147,644 | ) | | | (16,752,495 | ) | |
| Class Y | | | — | | | | — | | | | — | | | | — | | |
Distributions paid from net realized gains from
investment transactions | |
| Class A | | | (27,270,843 | ) | | | — | | | | (48,611,807 | ) | | | (68,368,215 | ) | |
| Class C | | | (11,485,203 | ) | | | — | | | | (18,719,722 | ) | | | (23,482,892 | ) | |
| Class I | | | (14,754,342 | ) | | | — | | | | (26,628,986 | ) | | | (25,391,355 | ) | |
| Class Y | | | — | | | | — | | | | — | | | | — | | |
| Decrease in net assets resulting from distributions | | | (68,845,088 | ) | | | (26,901,364 | ) | | | (132,590,904 | ) | | | (186,195,220 | ) | |
| Fund Share Transactions (Note 6) | |
| Net proceeds from shares sold | | | 854,998,750 | | | | 842,143,081 | | | | 647,074,657 | | | | 1,302,888,135 | | |
Net asset value of shares issued for reinvested dividends and
distributions | | | 57,064,121 | | | | 21,330,710 | | | | 92,471,313 | | | | 137,426,605 | | |
| Cost of shares redeemed | | | (230,276,546 | ) | | | (385,318,959 | ) | | | (863,886,461 | ) | | | (1,175,616,542 | ) | |
| Redemption fees | | | — | | | | — | | | | 137,125 | | | | 385,738 | | |
| Increase (decrease) in net assets from Fund share transactions | | | 681,786,325 | | | | 478,154,832 | | | | (124,203,366 | ) | | | 265,083,936 | | |
| Net increase (decrease) in net assets | | | 791,337,762 | | | | 584,579,258 | | | | (844,580,272 | ) | | | 309,430,864 | | |
| Net Assets (Note 1) | |
| Beginning of period | | | 1,912,518,390 | | | | 1,327,939,132 | | | | 3,519,918,822 | | | | 3,210,487,958 | | |
| End of period | | $ | 2,703,856,152 | | | $ | 1,912,518,390 | | | $ | 2,675,338,550 | | | $ | 3,519,918,822 | | |
| Undistributed net investment income (loss) | | $ | 7,861,407 | | | $ | 14,183,390 | | | $ | (122,050,079 | ) | | $ | (81,489,548 | ) | |
FIRST EAGLE FUNDS | SEMI-ANNUAL REPORT | APRIL 30, 2012
125
Statements of Changes in Net Assets (continued)
See Notes to Financial Statements.
| | | FIRST EAGLE
HIGH YIELD FUND | |
| | | PERIOD FROM
APRIL 1, 2012 TO
APRIL 30, 2012
(unaudited) | | YEAR ENDED
MARCH 31,
2012 | | YEAR ENDED
MARCH 31,
2011 | |
| Operations | |
| Net investment income (loss) | | $ | 1,265,124 | | | $ | 2,059,856 | | | $ | 917,373 | | |
Net realized gain (loss) from investments,
foreign currency and forward contract related
transactions and written options | | | 139,392 | | | | 320,629 | | | | 631,187 | | |
Change in unrealized appreciation (depreciation)
of investments, foreign currency and forward
contract related transactions and written options | | | 791,518 | | | | 1,558,576 | | | | (179,372 | ) | |
Net increase (decrease) in net assets resulting
from operations | | | 2,196,034 | | | | 3,939,061 | | | | 1,369,188 | | |
| Distribution to Shareholders | |
| Dividends paid from net investment income | |
| Class A | | | (396,067 | ) | | | (277,672 | ) | | | — | | |
| Class C | | | (148,651 | ) | | | (107,973 | ) | | | — | | |
| Class I | | | (676,545 | ) | | | (1,664,694 | ) | | | (914,365 | ) | |
| Class Y | | | — | | | | — | | | | — | | |
Distributions paid from net realized gains from
investment transactions | |
| Class A | | | — | | | | — | | | | — | | |
| Class C | | | — | | | | — | | | | — | | |
| Class I | | | — | | | | (579,534 | ) | | | (754,658 | ) | |
| Class Y | | | — | | | | — | | | | — | | |
| Decrease in net assets resulting from distributions | | | (1,221,263 | ) | | | (2,629,873 | ) | | | (1,669,023 | ) | |
| Fund Share Transactions (Note 6) | |
| Net proceeds from shares sold | | | 78,548,626 | | | | 202,495,554 | | | | 2,265,250 | | |
Net asset value of shares issued for reinvested
dividends and distributions | | | 1,046,797 | | | | 2,480,994 | | | | 1,669,125 | | |
| Cost of shares redeemed | | | (2,272,554 | ) | | | (14,567,403 | ) | | | (2,472,677 | ) | |
| Redemption fees | | | — | | | | — | | | | — | | |
Increase (decrease) in net assets from
Fund share transactions | | | 77,322,869 | | | | 190,409,145 | | | | 1,461,698 | | |
| Net increase (decrease) in net assets | | | 78,297,640 | | | | 191,718,333 | | | | 1,161,863 | | |
| Net Assets (Note 1) | |
| Beginning of period | | | 202,880,586 | | | | 11,162,253 | | | | 10,000,390 | | |
| End of period | | $ | 281,178,226 | | | $ | 202,880,586 | | | $ | 11,162,253 | | |
| Undistributed net investment income (loss) | | $ | 24,249 | | | $ | (19,612 | ) | | $ | 20,120 | | |
FIRST EAGLE FUNDS | SEMI-ANNUAL REPORT | APRIL 30, 2012
126
| | | FIRST EAGLE
FUND OF AMERICA | |
| | | SIX-MONTHS
ENDED
APRIL 30, 2012
(unaudited) | | YEAR ENDED
OCTOBER 31,
2011 | |
| Operations | |
| Net investment income (loss) | | $ | (556,385 | ) | | $ | (5,611,267 | ) | |
Net realized gain (loss) from investments,
foreign currency and forward contract related
transactions and written options | | | (32,347,032 | ) | | | 116,260,451 | | |
Change in unrealized appreciation (depreciation)
of investments, foreign currency and forward
contract related transactions and written options | | | 227,231,506 | | | | (86,849,116 | ) | |
Net increase (decrease) in net assets resulting
from operations | | | 194,328,089 | | | | 23,800,068 | | |
| Distribution to Shareholders | |
| Dividends paid from net investment income | |
| Class A | | | — | | | | (2,737,506 | ) | |
| Class C | | | — | | | | (253,288 | ) | |
| Class I | | | — | | | | — | | |
| Class Y | | | — | | | | (3,991,165 | ) | |
Distributions paid from net realized gains from
investment transactions | |
| Class A | | | (39,934,206 | ) | | | — | | |
| Class C | | | (15,978,381 | ) | | | — | | |
| Class I | | | — | | | | — | | |
| Class Y | | | (44,697,643 | ) | | | — | | |
| Decrease in net assets resulting from distributions | | | (100,610,230 | ) | | | (6,981,959 | ) | |
| Fund Share Transactions (Note 6) | |
| Net proceeds from shares sold | | | 157,597,307 | | | | 512,908,266 | | |
Net asset value of shares issued for reinvested
dividends and distributions | | | 88,825,155 | | | | 6,163,174 | | |
| Cost of shares redeemed | | | (156,372,098 | ) | | | (259,451,806 | ) | |
| Redemption fees | | | — | | | | — | | |
Increase (decrease) in net assets from
Fund share transactions | | | 90,050,364 | | | | 259,619,634 | | |
| Net increase (decrease) in net assets | | | 183,768,223 | | | | 276,437,743 | | |
| Net Assets (Note 1) | |
| Beginning of period | | | 1,375,745,424 | | | | 1,099,307,681 | | |
| End of period | | $ | 1,559,513,647 | | | $ | 1,375,745,424 | | |
| Undistributed net investment income (loss) | | $ | (682,347 | ) | | $ | (125,962 | ) | |
FIRST EAGLE FUNDS | SEMI-ANNUAL REPORT | APRIL 30, 2012
127

Financial Highlights
| | | SIX-MONTHS ENDED | | YEAR ENDED OCTOBER 31, | |
| | | APRIL 30, 2012 (unaudited) | | 2011 | |
| | | CLASS A | | CLASS C | | CLASS I | | CLASS A | | CLASS C | | CLASS I | |
| Selected data for a share of beneficial interest outstanding throughout | |
| each period is presented below:* | |
Net asset value,
beginning of period ($) | | | 46.90 | | | | 45.91 | | | | 47.15 | | | | 44.36 | | | | 43.47 | | | | 44.59 | | |
| Income from investment operations: | |
| Net investment income ($) | | | 0.26 | | | | 0.08 | | | | 0.32 | | | | 0.39 | | | | 0.04 | | | | 0.51 | | |
Net realized and unrealized
gains (losses) on investments | | | 2.26 | | | | 2.23 | | | | 2.26 | | | | 2.79 | | | | 2.75 | | | | 2.81 | | |
Total income (loss) from
investment operations | | | 2.52 | | | | 2.31 | | | | 2.58 | | | | 3.18 | | | | 2.79 | | | | 3.32 | | |
| Less distributions: | |
Distributions from net
investment income ($) | | | -0.53 | | | | -0.21 | | | | -0.64 | | | | -0.64 | | | | -0.35 | | | | -0.76 | | |
Distributions from
capital gains | | | -0.61 | | | | -0.61 | | | | -0.61 | | | | — | | | | — | | | | — | | |
| Total distributions | | | -1.14 | | | | -0.82 | | | | -1.25 | | | | -0.64 | | | | -0.35 | | | | -0.76 | | |
Net asset value,
end of period ($) | | | 48.28 | | | | 47.40 | | | | 48.48 | | | | 46.90 | | | | 45.91 | | | | 47.15 | | |
| Total return(c) (%) | | | 5.55 | (a) | | | 5.14 | (a) | | | 5.68 | (a) | | | 7.23 | | | | 6.45 | | | | 7.52 | | |
| Ratios and supplemental data | |
Net assets, end of period
(millions) ($) | | | 15,619 | | | | 9,225 | | | | 10,191 | | | | 14,352 | | | | 8,385 | | | | 8,455 | | |
Ratio of operating expenses
to average net assets
including earnings credits (%) | | | 1.13 | (b) | | | 1.88 | (b) | | | 0.88 | (b) | | | 1.13 | | | | 1.88 | | | | 0.88 | | |
Ratio of operating expenses
to average net assets
excluding earnings credits (%) | | | 1.13 | (b) | | | 1.88 | (b) | | | 0.88 | (b) | | | 1.13 | | | | 1.88 | | | | 0.88 | | |
Ratio of net investment
income to average net assets
including earnings credits (%) | | | 1.09 | (b) | | | 0.34 | (b) | | | 1.36 | (b) | | | 0.83 | | | | 0.08 | | | | 1.07 | | |
Ratio of net investment
income to average net assets
excluding earnings credits (%) | | | 1.09 | (b) | | | 0.34 | (b) | | | 1.36 | (b) | | | 0.83 | | | | 0.08 | | | | 1.07 | | |
| Portfolio turnover rate (%) | | | 6.52 | (a) | | | 6.52 | (a) | | | 6.52 | (a) | | | 11.57 | | | | 11.57 | | | | 11.57 | | |
* Per share amounts have been calculated using the average shares method.
** Amount represents less than $0.01 per share.
(a) Not Annualized
(b) Annualized
(c) Does not take into account the sales charge of 5.00% for Class A shares and the CDSC (Contingent Deferred Sales Charge) of 1.00% for Class C shares.
See Notes to Financial Statements.
FIRST EAGLE FUNDS | SEMI-ANNUAL REPORT | APRIL 30, 2012
128
Global Fund
| | | YEAR ENDED OCTOBER 31, | |
| | | 2010 | | 2009 | | 2008 | | 2007 | |
| | | CLASS A | | CLASS C | | CLASS I | | CLASS A | | CLASS C | | CLASS I | | CLASS A | | CLASS C | | CLASS I | | CLASS A | | CLASS C | | CLASS I | |
| Selected data for a share of beneficial interest outstanding throughout | |
| each period is presented below:* | |
Net asset value,
beginning of period ($) | | | 38.74 | | | | 38.07 | | | | 38.92 | | | | 34.45 | | | | 33.99 | | | | 34.62 | | | | 51.09 | | | | 50.46 | | | | 51.32 | | | | 48.36 | | | | 47.83 | | | | 48.56 | | |
| Income from investment operations: | |
| Net investment income ($) | | | 0.56 | | | | 0.26 | | | | 0.69 | | | | 0.39 | | | | 0.13 | | | | 0.47 | | | | 0.64 | | | | 0.31 | | | | 0.76 | | | | 0.67 | | | | 0.31 | | | | 0.79 | | |
Net realized and unrealized
gains (losses) on investments | | | 5.63 | | | | 5.51 | | | | 5.63 | | | | 6.35 | | | | 6.26 | | | | 6.39 | | | | -11.82 | | | | -11.69 | | | | -11.88 | | | | 6.91 | | | | 6.84 | | | | 6.94 | | |
Total income (loss) from
investment operations | | | 6.19 | | | | 5.77 | | | | 6.32 | | | | 6.74 | | | | 6.39 | | | | 6.86 | | | | -11.18 | | | | -11.38 | | | | -11.12 | | | | 7.58 | | | | 7.15 | | | | 7.73 | | |
| Less distributions: | |
Distributions from net
investment income ($) | | | -0.57 | | | | -0.37 | | | | -0.65 | | | | -0.14 | | | | -0.00 | ** | | | -0.25 | | | | -1.07 | | | | -0.70 | | | | -1.19 | | | | -1.22 | | | | -0.89 | | | | -1.34 | | |
Distributions from
capital gains | | | — | | | | — | | | | — | | | | -2.31 | | | | -2.31 | | | | -2.31 | | | | -4.39 | | | | -4.39 | | | | -4.39 | | | | -3.63 | | | | -3.63 | | | | -3.63 | | |
| Total distributions | | | -0.57 | | | | -0.37 | | | | -0.65 | | | | -2.45 | | | | -2.31 | | | | -2.56 | | | | -5.46 | | | | -5.09 | | | | -5.58 | | | | -4.85 | | | | -4.52 | | | | -4.97 | | |
Net asset value,
end of period ($) | | | 44.36 | | | | 43.47 | | | | 44.59 | | | | 38.74 | | | | 38.07 | | | | 38.92 | | | | 34.45 | | | | 33.99 | | | | 34.62 | | | | 51.09 | | | | 50.46 | | | | 51.32 | | |
| Total return(c) (%) | | | 16.13 | | | | 15.23 | | | | 16.40 | | | | 20.81 | | | | 19.93 | | | | 21.13 | | | | -24.41 | | | | -24.99 | | | | -24.21 | | | | 16.91 | | | | 16.03 | | | | 17.19 | | |
| Ratios and supplemental data | |
Net assets, end of period
(millions) ($) | | | 12,195 | | | | 6,524 | | | | 5,345 | | | | 10,562 | | | | 5,158 | | | | 3,338 | | | | 9,784 | | | | 4,623 | | | | 2,898 | | | | 13,451 | | | | 5,593 | | | | 3,193 | | |
Ratio of operating expenses
to average net assets
including earnings credits (%) | | | 1.16 | | | | 1.91 | | | | 0.91 | | | | 1.19 | | | | 1.94 | | | | 0.94 | | | | 1.14 | | | | 1.89 | | | | 0.89 | | | | 1.12 | | | | 1.87 | | | | 0.87 | | |
Ratio of operating expenses
to average net assets
excluding earnings credits (%) | | | 1.16 | | | | 1.91 | | | | 0.91 | | | | 1.19 | | | | 1.94 | | | | 0.94 | | | | 1.14 | | | | 1.89 | | | | 0.89 | | | | 1.12 | | | | 1.87 | | | | 0.87 | | |
Ratio of net investment
income to average net assets
including earnings credits (%) | | | 1.36 | | | | 0.63 | | | | 1.68 | | | | 1.14 | | | | 0.38 | | | | 1.37 | | | | 1.48 | | | | 0.73 | | | | 1.74 | | | | 1.40 | | | | 0.65 | | | | 1.64 | | |
Ratio of net investment
income to average net assets
excluding earnings credits (%) | | | 1.36 | | | | 0.63 | | | | 1.68 | | | | 1.14 | | | | 0.38 | | | | 1.37 | | | | 1.48 | | | | 0.73 | | | | 1.74 | | | | 1.39 | | | | 0.64 | | | | 1.64 | | |
| Portfolio turnover rate (%) | | | 17.37 | | | | 17.37 | | | | 17.37 | | | | 12.52 | | | | 12.52 | | | | 12.52 | | | | 29.69 | | | | 29.69 | | | | 29.69 | | | | 37.58 | | | | 37.58 | | | | 37.58 | | |
FIRST EAGLE FUNDS | SEMI-ANNUAL REPORT | APRIL 30, 2012
129

Financial Highlights
| | | SIX-MONTHS ENDED | | YEAR ENDED OCTOBER 31, | |
| | | APRIL 30, 2012 (unaudited) | | 2011 | |
| | | CLASS A | | CLASS C | | CLASS I | | CLASS A | | CLASS C | | CLASS I | |
| Selected data for a share of beneficial interest outstanding throughout | |
| each period is presented below:* | |
Net asset value,
beginning of period ($) | | | 22.25 | | | | 21.61 | | | | 22.61 | | | | 21.86 | | | | 21.26 | | | | 22.20 | | |
| Income from investment operations: | |
| Net investment income ($) | | | 0.14 | | | | 0.05 | | | | 0.17 | | | | 0.18 | | | | 0.01 | | | | 0.24 | | |
Net realized and unrealized
gains (losses) on investments | | | 0.41 | | | | 0.41 | | | | 0.41 | | | | 0.74 | | | | 0.73 | | | | 0.75 | | |
Total income (loss) from
investment operations | | | 0.55 | | | | 0.46 | | | | 0.58 | | | | 0.92 | | | | 0.74 | | | | 0.99 | | |
| Less distributions: | |
Distributions from net
investment income ($) | | | -0.39 | | | | -0.20 | | | | -0.45 | | | | -0.32 | | | | -0.18 | | | | -0.37 | | |
Distributions from
capital gains | | | -0.64 | | | | -0.64 | | | | -0.64 | | | | -0.21 | | | | -0.21 | | | | -0.21 | | |
| Total distributions | | | -1.03 | | | | -0.84 | | | | -1.09 | | | | -0.53 | | | | -0.39 | | | | -0.58 | | |
Net asset value,
end of period ($) | | | 21.77 | | | | 21.23 | | | | 22.10 | | | | 22.25 | | | | 21.61 | | | | 22.61 | | |
| Total return(c) (%) | | | 2.75 | (a) | | | 2.40 | (a) | | | 2.89 | (a) | | | 4.27 | | | | 3.48 | | | | 4.52 | | |
| Ratios and supplemental data | |
Net assets, end of period
(millions) ($) | | | 5,155 | | | | 1,022 | | | | 4,483 | | | | 5,023 | | | | 1,027 | | | | 4,136 | | |
Ratio of operating expenses
to average net assets
including earnings credits (%) | | | 1.17 | (b) | | | 1.92 | (b) | | | 0.92 | (b) | | | 1.14 | | | | 1.89 | | | | 0.89 | | |
Ratio of operating expenses
to average net assets
excluding earnings credits (%) | | | 1.17 | (b) | | | 1.92 | (b) | | | 0.92 | (b) | | | 1.14 | | | | 1.89 | | | | 0.89 | | |
Ratio of net investment
income to average net assets
including earnings credits (%) | | | 1.29 | (b) | | | 0.52 | (b) | | | 1.56 | (b) | | | 0.78 | | | | 0.04 | | | | 1.06 | | |
Ratio of net investment
income to average net assets
excluding earnings credits (%) | | | 1.29 | (b) | | | 0.52 | (b) | | | 1.56 | (b) | | | 0.78 | | | | 0.04 | | | | 1.06 | | |
| Portfolio turnover rate (%) | | | 5.80 | (a) | | | 5.80 | (a) | | | 5.80 | (a) | | | 12.22 | | | | 12.22 | | | | 12.22 | | |
* Per share amounts have been calculated using the average shares method.
** Amount represents less than $0.01 per share.
(a) Not Annualized
(b) Annualized
(c) Does not take into account the sales charge of 5.00% for Class A shares and the CDSC (Contingent Deferred Sales Charge) of 1.00% for Class C shares.
See Notes to Financial Statements.
FIRST EAGLE FUNDS | SEMI-ANNUAL REPORT | APRIL 30, 2012
130
Overseas Fund
| | | YEAR ENDED OCTOBER 31, | |
| | | 2010 | | 2009 | | 2008 | | 2007 | |
| | | CLASS A | | CLASS C | | CLASS I | | CLASS A | | CLASS C | | CLASS I | | CLASS A | | CLASS C | | CLASS I | | CLASS A | | CLASS C | | CLASS I | |
| Selected data for a share of beneficial interest outstanding throughout | |
| each period is presented below:* | |
Net asset value,
beginning of period ($) | | | 19.51 | | | | 19.03 | | | | 19.80 | | | | 17.21 | | | | 16.93 | | | | 17.41 | | | | 28.09 | | | | 27.66 | | | | 28.38 | | | | 26.70 | | | | 26.33 | | | | 26.94 | | |
| Income from investment operations: | |
| Net investment income ($) | | | 0.15 | | | | 0.00 | ** | | | 0.21 | | | | 0.26 | | | | 0.13 | | | | 0.30 | | | | 0.35 | | | | 0.18 | | | | 0.40 | | | | 0.41 | | | | 0.21 | | | | 0.48 | | |
Net realized and unrealized
gains (losses) on investments | | | 2.80 | | | | 2.72 | | | | 2.82 | | | | 3.72 | | | | 3.63 | | | | 3.78 | | | | -7.21 | | | | -7.10 | | | | -7.28 | | | | 4.05 | | | | 4.00 | | | | 4.10 | | |
Total income (loss) from
investment operations | | | 2.95 | | | | 2.72 | | | | 3.03 | | | | 3.98 | | | | 3.76 | | | | 4.08 | | | | -6.86 | | | | -6.92 | | | | -6.88 | | | | 4.46 | | | | 4.21 | | | | 4.58 | | |
| Less distributions: | |
Distributions from net
investment income ($) | | | -0.60 | | | | -0.49 | | | | -0.63 | | | | -0.02 | | | | 0.00 | ** | | | -0.03 | | | | -0.87 | | | | -0.66 | | | | -0.94 | | | | -0.87 | | | | -0.68 | | | | -0.94 | | |
Distributions from
capital gains | | | — | | | | — | | | | — | | | | -1.66 | | | | -1.66 | | | | -1.66 | | | | -3.15 | | | | -3.15 | | | | -3.15 | | | | -2.20 | | | | -2.20 | | | | -2.20 | | |
| Total distributions | | | -0.60 | | | | -0.49 | | | | -0.63 | | | | -1.68 | | | | -1.66 | | | | -1.69 | | | | -4.02 | | | | -3.81 | | | | -4.09 | | | | -3.07 | | | | -2.88 | | | | -3.14 | | |
Net asset value,
end of period ($) | | | 21.86 | | | | 21.26 | | | | 22.20 | | | | 19.51 | | | | 19.03 | | | | 19.80 | | | | 17.21 | | | | 16.93 | | | | 17.41 | | | | 28.09 | | | | 27.66 | | | | 28.38 | | |
| Total return(c) (%) | | | 15.45 | | | | 14.55 | | | | 15.68 | | | | 24.95 | | | | 23.96 | | | | 25.26 | | | | -28.15 | | | | -28.67 | | | | -27.97 | | | | 18.20 | | | | 17.31 | | | | 18.52 | | |
| Ratios and supplemental data | |
Net assets, end of period
(millions) ($) | | | 4,676 | | | | 914 | | | | 3,284 | | | | 4,024 | | | | 792 | | | | 2,211 | | | | 3,518 | | | | 737 | | | | 1,968 | | | | 5,974 | | | | 1,203 | | | | 3,942 | | |
Ratio of operating expenses
to average net assets
including earnings credits (%) | | | 1.17 | | | | 1.92 | | | | 0.92 | | | | 1.20 | | | | 1.95 | | | | 0.95 | | | | 1.15 | | | | 1.90 | | | | 0.90 | | | | 1.12 | | | | 1.87 | | | | 0.87 | | |
Ratio of operating expenses
to average net assets
excluding earnings credits (%) | | | 1.17 | | | | 1.92 | | | | 0.92 | | | | 1.20 | | | | 1.95 | | | | 0.95 | | | | 1.15 | | | | 1.90 | | | | 0.90 | | | | 1.12 | | | | 1.87 | | | | 0.87 | | |
Ratio of net investment
income to average net assets
including earnings credits (%) | | | 0.76 | | | | 0.01 | | | | 1.03 | | | | 1.51 | | | | 0.76 | | | | 1.75 | | | | 1.57 | | | | 0.82 | | | | 1.76 | | | | 1.54 | | | | 0.79 | | | | 1.80 | | |
Ratio of net investment
income to average net assets
excluding earnings credits (%) | | | 0.76 | | | | 0.01 | | | | 1.03 | | | | 1.51 | | | | 0.76 | | | | 1.75 | | | | 1.57 | | | | 0.82 | | | | 1.76 | | | | 1.54 | | | | 0.78 | | | | 1.79 | | |
| Portfolio turnover rate (%) | | | 15.53 | | | | 15.53 | | | | 15.53 | | | | 8.65 | | | | 8.65 | | | | 8.65 | | | | 15.72 | | | | 15.72 | | | | 15.72 | | | | 34.29 | | | | 34.29 | | | | 34.29 | | |
FIRST EAGLE FUNDS | SEMI-ANNUAL REPORT | APRIL 30, 2012
131

Financial Highlights
| | | SIX-MONTHS ENDED | | YEAR ENDED OCTOBER 31, | |
| | | APRIL 30, 2012 (unaudited) | | 2011 | |
| | | CLASS A | | CLASS C | | CLASS I | | CLASS A | | CLASS C | | CLASS I | |
| Selected data for a share of beneficial interest outstanding throughout | |
| each period is presented below:* | |
Net asset value,
beginning of period ($) | | | 17.12 | | | | 16.91 | | | | 17.33 | | | | 15.94 | | | | 15.75 | | | | 16.12 | | |
| Income from investment operations: | |
| Net investment income ($) | | | 0.07 | | | | 0.01 | | | | 0.10 | | | | 0.17 | | | | 0.04 | | | | 0.21 | | |
Net realized and unrealized
gains (losses) on investments | | | 1.24 | | | | 1.23 | | | | 1.25 | | | | 1.34 | | | | 1.34 | | | | 1.37 | | |
Total income (loss) from
investment operations | | | 1.31 | | | | 1.24 | | | | 1.35 | | | | 1.51 | | | | 1.38 | | | | 1.58 | | |
| Less distributions: | |
Distributions from net
investment income ($) | | | -0.14 | | | | -0.03 | | | | -0.18 | | | | -0.33 | | | | -0.22 | | | | -0.37 | | |
Distributions from
capital gains | | | -0.45 | | | | -0.45 | | | | -0.45 | | | | — | | | | — | | | | — | | |
| Total distributions | | | -0.59 | | | | -0.48 | | | | -0.63 | | | | -0.33 | | | | -0.22 | | | | -0.37 | | |
Net asset value,
end of period ($) | | | 17.84 | | | �� | 17.67 | | | | 18.05 | | | | 17.12 | | | | 16.91 | | | | 17.33 | | |
| Total return(c) (%) | | | 8.02 | (a) | | | 7.61 | (a) | | | 8.16 | (a) | | | 9.60 | | | | 8.85 | | | | 9.92 | | |
| Ratios and supplemental data | |
Net assets, end of period
(millions) ($) | | | 1,323 | | | | 561 | | | | 819 | | | | 967 | | | | 408 | | | | 538 | | |
Ratio of operating expenses
to average net assets
including earnings credits (%) | | | 1.14 | (b) | | | 1.89 | (b) | | | 0.89 | (b) | | | 1.18 | | | | 1.93 | | | | 0.93 | | |
Ratio of operating expenses
to average net assets
excluding earnings credits (%) | | | 1.14 | (b) | | | 1.89 | (b) | | | 0.89 | (b) | | | 1.18 | | | | 1.93 | | | | 0.93 | | |
Ratio of net investment
income to average net assets
including earnings credits (%) | | | 0.87 | (b) | | | 0.12 | (b) | | | 1.10 | (b) | | | 0.98 | | | | 0.24 | | | | 1.23 | | |
Ratio of net investment
income to average net assets
excluding earnings credits (%) | | | 0.87 | (b) | | | 0.12 | (b) | | | 1.10 | (b) | | | 0.98 | | | | 0.24 | | | | 1.23 | | |
| Portfolio turnover rate (%) | | | 11.66 | (a) | | | 11.66 | (a) | | | 11.66 | (a) | | | 18.54 | | | | 18.54 | | | | 18.54 | | |
* Per share amounts have been calculated using the average shares method.
(a) Not Annualized
(b) Annualized
(c) Does not take into account the sales charge of 5.00% for Class A shares and the CDSC (Contingent Deferred Sales Charge) of 1.00% for Class C shares.
See Notes to Financial Statements.
FIRST EAGLE FUNDS | SEMI-ANNUAL REPORT | APRIL 30, 2012
132
U.S. Value Fund
| | | YEAR ENDED OCTOBER 31, | |
| | | 2010 | | 2009 | | 2008 | | 2007 | |
| | | CLASS A | | CLASS C | | CLASS I | | CLASS A | | CLASS C | | CLASS I | | CLASS A | | CLASS C | | CLASS I | | CLASS A | | CLASS C | | CLASS I | |
| Selected data for a share of beneficial interest outstanding throughout | |
| each period is presented below:* | |
Net asset value,
beginning of period ($) | | | 14.21 | | | | 14.06 | | | | 14.37 | | | | 12.75 | | | | 12.63 | | | | 12.89 | | | | 17.01 | | | | 16.87 | | | | 17.19 | | | | 16.19 | | | | 16.08 | | | | 16.34 | | |
| Income from investment operations: | |
| Net investment income ($) | | | 0.32 | | | | 0.21 | | | | 0.38 | | | | 0.21 | | | | 0.12 | | | | 0.24 | | | | 0.36 | | | | 0.24 | | | | 0.40 | | | | 0.33 | | | | 0.21 | | | | 0.38 | | |
Net realized and unrealized
gains (losses) on investments | | | 1.60 | | | | 1.58 | | | | 1.59 | | | | 1.58 | | | | 1.56 | | | | 1.60 | | | | -3.65 | | | | -3.63 | | | | -3.69 | | | | 1.45 | | | | 1.44 | | | | 1.46 | | |
Total income (loss) from
investment operations | | | 1.92 | | | | 1.79 | | | | 1.97 | | | | 1.79 | | | | 1.68 | | | | 1.84 | | | | -3.29 | | | | -3.39 | | | | -3.29 | | | | 1.78 | | | | 1.65 | | | | 1.84 | | |
| Less distributions: | |
Distributions from net
investment income ($) | | | -0.19 | | | | -0.10 | | | | -0.22 | | | | -0.22 | | | | -0.14 | | | | -0.25 | | | | -0.31 | | | | -0.19 | | | | -0.35 | | | | -0.30 | | | | -0.20 | | | | -0.33 | | |
Distributions from
capital gains | | | — | | | | — | | | | — | | | | -0.11 | | | | -0.11 | | | | -0.11 | | | | -0.66 | | | | -0.66 | | | | -0.66 | | | | -0.66 | | | | -0.66 | | | | -0.66 | | |
| Total distributions | | | -0.19 | | | | -0.10 | | | | -0.22 | | | | -0.33 | | | | -0.25 | | | | -0.36 | | | | -0.97 | | | | -0.85 | | | | -1.01 | | | | -0.96 | | | | -0.86 | | | | -0.99 | | |
Net asset value,
end of period ($) | | | 15.94 | | | | 15.75 | | | | 16.12 | | | | 14.21 | | | | 14.06 | | | | 14.37 | | | | 12.75 | | | | 12.63 | | | | 12.89 | | | | 17.01 | | | | 16.87 | | | | 17.19 | | |
| Total return(c) (%) | | | 13.64 | | | | 12.75 | | | | 13.84 | | | | 14.52 | | | | 13.63 | | | | 14.78 | | | | -20.56 | | | | -21.17 | | | | -20.36 | | | | 11.47 | | | | 10.65 | | | | 11.78 | | |
| Ratios and supplemental data | |
Net assets, end of period
(millions) ($) | | | 680 | | | | 320 | | | | 328 | | | | 547 | | | | 263 | | | | 199 | | | | 271 | | | | 167 | | | | 104 | | | | 324 | | | | 233 | | | | 104 | | |
Ratio of operating expenses
to average net assets
including earnings credits (%) | | | 1.23 | | | | 1.98 | | | | 0.99 | | | | 1.26 | | | | 2.00 | | | | 1.01 | | | | 1.20 | | | | 1.96 | | | | 0.95 | | | | 1.20 | | | | 1.95 | | | | 0.95 | | |
Ratio of operating expenses
to average net assets
excluding earnings credits (%) | | | 1.23 | | | | 1.98 | | | | 0.99 | | | | 1.26 | | | | 2.00 | | | | 1.01 | | | | 1.21 | | | | 1.96 | | | | 0.96 | | | | 1.20 | | | | 1.95 | | | | 0.96 | | |
Ratio of net investment
income to average net assets
including earnings credits (%) | | | 2.15 | | | | 1.41 | | | | 2.46 | | | | 1.63 | | | | 0.93 | | | | 1.90 | | | | 2.28 | | | | 1.53 | | | | 2.53 | | | | 2.04 | | | | 1.29 | | | | 2.32 | | |
Ratio of net investment
income to average net assets
excluding earnings credits (%) | | | 2.15 | | | | 1.41 | | | | 2.46 | | | | 1.63 | | | | 0.93 | | | | 1.90 | | | | 2.28 | | | | 1.52 | | | | 2.53 | | | | 2.04 | | | | 1.28 | | | | 2.32 | | |
| Portfolio turnover rate (%) | | | 12.23 | | | | 12.23 | | | | 12.23 | | | | 14.88 | | | | 14.88 | | | | 14.88 | | | | 21.75 | | | | 21.75 | | | | 21.75 | | | | 32.54 | | | | 32.54 | | | | 32.54 | | |
FIRST EAGLE FUNDS | SEMI-ANNUAL REPORT | APRIL 30, 2012
133

Financial Highlights
| | | SIX-MONTHS ENDED | | YEAR ENDED OCTOBER 31, | |
| | | APRIL 30, 2012 (unaudited) | | 2011 | |
| | | CLASS A | | CLASS C | | CLASS I | | CLASS A | | CLASS C | | CLASS I | |
| Selected data for a share of beneficial interest outstanding throughout | |
| each period is presented below:* | |
Net asset value,
beginning of period ($) | | | 33.89 | | | | 32.78 | | | | 34.33 | | | | 33.42 | | | | 32.44 | | | | 33.81 | | |
| Income from investment operations: | |
| Net investment income (loss) ($) | | | -0.01 | | | | -0.12 | | | | 0.03 | | | | -0.19 | | | | -0.42 | | | | -0.10 | | |
Net realized and unrealized
gains (losses) on investments | | | -5.50 | | | | -5.01 | | | | -5.89 | | | | 2.60 | | | | 2.53 | | | | 2.63 | | |
Total income (loss) from
investment operations | | | -5.51 | | | | -5.13 | | | | -5.86 | | | | 2.41 | | | | 2.11 | | | | 2.53 | | |
| Less distributions: | |
Distributions from net
investment income ($) | | | -0.39 | | | | -0.48 | | | | -0.16 | | | | -0.73 | | | | -0.56 | | | | -0.80 | | |
Distributions from
capital gains | | | -0.90 | | | | -0.90 | | | | -0.90 | | | | -1.21 | | | | -1.21 | | | | -1.21 | | |
| Total distributions | | | -1.29 | | | | -1.38 | | | | -1.06 | | | | -1.94 | | | | -1.77 | | | | -2.01 | | |
Net asset value,
end of period ($) | | | 27.09 | | | | 26.27 | | | | 27.41 | | | | 33.89 | | | | 32.78 | | | | 34.33 | | |
| Total return(c) (%) | | | -16.66 | (a) | | | -16.98 | (a) | | | -16.57 | (a) | | | 7.38 | | | | 6.61 | | | | 7.66 | | |
| Ratios and supplemental data | |
Net assets, end of period
(millions) ($) | | | 1,417 | | | | 555 | | | | 703 | | | | 1,834 | | | | 683 | | | | 1,003 | | |
Ratio of operating expenses
to average net assets
including earnings credits (%) | | | 1.20 | (b) | | | 1.95 | (b) | | | 0.95 | (b) | | | 1.20 | | | | 1.95 | | | | 0.95 | | |
Ratio of operating expenses
to average net assets
excluding earnings credits (%) | | | 1.20 | (b) | | | 1.95 | (b) | | | 0.95 | (b) | | | 1.20 | | | | 1.95 | | | | 0.95 | | |
Ratio of net investment
income (loss) to average net assets
including earnings credits (%) | | | -0.05 | (b) | | | -0.81 | (b) | | | 0.21 | (b) | | | -0.56 | | | | -1.30 | | | | -0.30 | | |
Ratio of net investment
income (loss) to average net assets
excluding earnings credits (%) | | | -0.05 | (b) | | | -0.81 | (b) | | | 0.21 | (b) | | | -0.56 | | | | -1.30 | | | | -0.30 | | |
| Portfolio turnover rate (%) | | | 4.74 | (a) | | | 4.74 | (a) | | | 4.74 | (a) | | | 13.26 | | | | 13.26 | | | | 13.26 | | |
* Per share amounts have been calculated using the average shares method.
(a) Not Annualized
(b) Annualized
(c) Does not take into account the sales charge of 5.00% for Class A shares and the CDSC (Contingent Deferred Sales Charge) of 1.00% for Class C shares.
See Notes to Financial Statements.
FIRST EAGLE FUNDS | SEMI-ANNUAL REPORT | APRIL 30, 2012
134
Gold Fund
| | | YEAR ENDED OCTOBER 31, | |
| | | 2010 | | 2009 | | 2008 | | 2007 | |
| | | CLASS A | | CLASS C | | CLASS I | | CLASS A | | CLASS C | | CLASS I | | CLASS A | | CLASS C | | CLASS I | | CLASS A | | CLASS C | | CLASS I | |
| Selected data for a share of beneficial interest outstanding throughout | |
| each period is presented below:* | |
Net asset value,
beginning of period ($) | | | 25.15 | | | | 24.52 | | | | 25.43 | | | | 14.85 | | | | 14.60 | | | | 14.98 | | | | 27.28 | | | | 26.86 | | | | 27.48 | | | | 23.48 | | | | 23.17 | | | | 23.62 | | |
| Income from investment operations: | |
| Net investment income (loss) ($) | | | -0.17 | | | | -0.38 | | | | -0.11 | | | | -0.14 | | | | -0.30 | | | | -0.09 | | | | -0.09 | | | | -0.27 | | | | -0.05 | | | | -0.12 | | | | -0.28 | | | | -0.07 | | |
Net realized and unrealized
gains (losses) on investments | | | 8.82 | | | | 8.58 | | | | 8.92 | | | | 11.50 | | | | 11.28 | | | | 11.60 | | | | -10.61 | | | | -10.43 | | | | -10.66 | | | | 7.72 | | | | 7.61 | | | | 7.78 | | |
Total income (loss) from
investment operations | | | 8.65 | | | | 8.20 | | | | 8.81 | | | | 11.36 | | | | 10.98 | | | | 11.51 | | | | -10.70 | | | | -10.70 | | | | -10.71 | | | | 7.60 | | | | 7.33 | | | | 7.71 | | |
| Less distributions: | |
Distributions from net
investment income ($) | | | -0.38 | | | | -0.28 | | | | -0.43 | | | | — | | | | — | | | | — | | | | -0.78 | | | | -0.61 | | | | -0.84 | | | | -0.74 | | | | -0.58 | | | | -0.79 | | |
Distributions from
capital gains | | | — | | | | — | | | | — | | | | -1.06 | | | | -1.06 | | | | -1.06 | | | | -0.95 | | | | -0.95 | | | | -0.95 | | | | -3.06 | | | | -3.06 | | | | -3.06 | | |
| Total distributions | | | -0.38 | | | | -0.28 | | | | -0.43 | | | | -1.06 | | | | -1.06 | | | | -1.06 | | | | -1.73 | | | | -1.56 | | | | -1.79 | | | | -3.80 | | | | -3.64 | | | | -3.85 | | |
Net asset value,
end of period ($) | | | 33.42 | | | | 32.44 | | | | 33.81 | | | | 25.15 | | | | 24.52 | | | | 25.43 | | | | 14.85 | | | | 14.60 | | | | 14.98 | | | | 27.28 | | | | 26.86 | | | | 27.48 | | |
| Total return(c) (%) | | | 34.73 | | | | 33.66 | | | | 35.01 | | | | 78.93 | | | | 77.62 | | | | 79.27 | | | | -41.56 | | | | -41.99 | | | | -41.36 | | | | 37.57 | | | | 36.55 | | | | 37.93 | | |
| Ratios and supplemental data | |
Net assets, end of period
(millions) ($) | | | 1,900 | | | | 616 | | | | 695 | | | | 1,325 | | | | 362 | | | | 165 | | | | 480 | | | | 109 | | | | 71 | | | | 890 | | | | 196 | | | | 166 | | |
Ratio of operating expenses
to average net assets
including earnings credits (%) | | | 1.22 | | | | 1.97 | | | | 0.97 | | | | 1.26 | | | | 2.01 | | | | 1.01 | | | | 1.21 | | | | 1.96 | | | | 0.95 | | | | 1.20 | | | | 1.95 | | | | 0.95 | | |
Ratio of operating expenses
to average net assets
excluding earnings credits (%) | | | 1.22 | | | | 1.97 | | | | 0.97 | | | | 1.26 | | | | 2.01 | | | | 1.01 | | | | 1.21 | | | | 1.96 | | | | 0.96 | | | | 1.20 | | | | 1.95 | | | | 0.95 | | |
Ratio of net investment
income (loss) to average net assets
including earnings credits (%) | | | -0.60 | | | | -1.35 | | | | -0.36 | | | | -0.65 | | | | -1.40 | | | | -0.40 | | | | -0.38 | | | | -1.13 | | | | -0.20 | | | | -0.55 | | | | -1.30 | | | | -0.30 | | |
Ratio of net investment
income (loss) to average net assets
excluding earnings credits (%) | | | -0.60 | | | | -1.35 | | | | -0.36 | | | | -0.65 | | | | -1.40 | | | | -0.40 | | | | -0.38 | | | | -1.14 | | | | -0.20 | | | | -0.56 | | | | -1.31 | | | | -0.31 | | |
| Portfolio turnover rate (%) | | | 5.50 | | | | 5.50 | | | | 5.50 | | | | 3.00 | | | | 3.00 | | | | 3.00 | | | | 8.74 | | | | 8.74 | | | | 8.74 | | | | 16.37 | | | | 16.37 | | | | 16.37 | | |
FIRST EAGLE FUNDS | SEMI-ANNUAL REPORT | APRIL 30, 2012
135

Financial Highlights
| | | PERIOD FROM APRIL 1, 2012 TO | | YEAR ENDED MARCH 31, | |
| | | APRIL 30, 2012 (unaudited) | | 2012^ | |
| | | CLASS A | | CLASS C | | CLASS I | | CLASS A^^^ | | CLASS C^^^ | | CLASS I | |
| Selected data for a share of beneficial interest outstanding throughout | |
| each period is presented below:* | |
Net asset value,
beginning of period ($) | | | 9.75 | | | | 9.74 | | | | 9.75 | | | | 9.40 | | | | 9.40 | | | | 10.29 | | |
| Income from investment operations: | |
| Net investment income ($) | | | 0.05 | | | | 0.04 | | | | 0.05 | | | | 0.13 | | | | 0.11 | | | | 0.68 | | |
Net realized and unrealized
gains (losses) on investments | | | 0.03 | | | | 0.03 | | | | 0.02 | | | | 0.35 | | | | 0.34 | | | | -0.11 | | |
Total income (loss) from
investment operations | | | 0.08 | | | | 0.07 | | | | 0.07 | | | | 0.48 | | | | 0.45 | | | | 0.57 | | |
| Less distributions: | |
Distributions from net
investment income ($) | | | -0.05 | | | | -0.04 | | | | -0.05 | | | | -0.13 | | | | -0.11 | | | | -0.83 | | |
Distributions from
capital gains | | | — | | | | — | | | | — | | | | — | | | | — | | | | -0.28 | | |
| Total distributions | | | -0.05 | | | | -0.04 | | | | -0.05 | | | | -0.13 | | | | -0.11 | | | | -1.11 | | |
Net asset value,
end of period ($) | | | 9.78 | | | | 9.77 | | | | 9.77 | | | | 9.75 | | | | 9.74 | | | | 9.75 | | |
| Total return(c) (%) | | | 0.72 | (a) | | | 0.66 | (a) | | | 0.75 | (a) | | | 5.11 | | | | 4.78 | | | | 6.11 | | |
| Ratios and supplemental data | |
Net assets, end of period
(millions) ($) | | | 100 | | | | 42 | | | | 139 | | | | 60 | | | | 28 | | | | 115 | | |
Ratio of operating expenses to
average net assets including fee
waivers and reimbursements (%) | | | 1.01 | (b) | | | 1.76 | (b) | | | 0.80 | (b) | | | 0.95 | (b) | | | 1.66 | (b) | | | 0.80 | | |
Ratio of operating expenses to
average net assets excluding fee
waivers and reimbursements (%) | | | 1.17 | (b) | | | 1.92 | (b) | | | 0.96 | (b) | | | 1.12 | (b) | | | 1.83 | (b) | | | 1.05 | | |
Ratio of net investment income to
average net assets including fee
waivers and reimbursements (%) | | | 6.34 | (b) | | | 5.64 | (b) | | | 6.80 | (b) | | | 5.48 | (b) | | | 4.74 | (b) | | | 6.98 | | |
Ratio of net investment income to
average net assets excluding fee
waivers and reimbursements (%) | | | 6.18 | (b) | | | 5.48 | (b) | | | 6.64 | (b) | | | 5.31 | (b) | | | 4.57 | (b) | | | 6.73 | | |
| Portfolio turnover rate (%) | | | 4.51 | (a) | | | 4.51 | (a) | | | 4.51 | (a) | | | 45.21 | | | | 45.21 | | | | 45.21 | | |
^ The Fund commenced operations in its present form on December 30, 2011.
^^ The predecessor Fund, Old Mutual High Yield Fund, commenced operations on November 19, 2007.
^^^ Class A and Class C commenced investment operations on January 3, 2012.
* Per share amounts have been calculated using the average shares method.
(a) Not Annualized
(b) Annualized
(c) Does not take into account the sales charge of 4.50% for Class A and the CDSC (Contingent Deferred Sales Charge) of 1.00% for Class C shares.
See Notes to Financial Statements.
FIRST EAGLE FUNDS | SEMI-ANNUAL REPORT | APRIL 30, 2012
136
High Yield Fund
| | | YEAR ENDED MARCH 31, | |
| | | 2011 | | 2010 | | 2009 | | 2008^^ | |
| | | CLASS I | | CLASS I | | CLASS I | | CLASS I | |
| Selected data for a share of beneficial interest outstanding throughout | |
| each period is presented below:* | |
Net asset value,
beginning of period ($) | | | 10.67 | | | | 7.72 | | | | 9.29 | | | | 10.00 | | |
| Income from investment operations: | |
| Net investment income ($) | | | 0.98 | | | | 1.31 | | | | 0.85 | | | | 0.36 | | |
Net realized and unrealized
gains (losses) on investments | | | 0.47 | | | | 3.07 | | | | -1.55 | | | | -0.69 | | |
Total income (loss) from
investment operations | | | 1.45 | | | | 4.38 | | | | -0.70 | | | | -0.33 | | |
| Less distributions: | |
Distributions from net
investment income ($) | | | -0.98 | | | | -1.28 | | | | -0.87 | | | | -0.38 | | |
Distributions from
capital gains | | | -0.85 | | | | -0.15 | | | | — | | | | — | | |
| Total distributions | | | -1.83 | | | | -1.43 | | | | -0.87 | | | | -0.38 | | |
Net asset value,
end of period ($) | | | 10.29 | | | | 10.67 | | | | 7.72 | | | | 9.29 | | |
| Total return(c) (%) | | | 14.81 | | | | 59.30 | | | | -7.78 | | | | -3.39 | | |
| Ratios and supplemental data | |
Net assets, end of period
(millions) ($) | | | 11 | | | | 10 | | | | 9 | | | | 9 | | |
Ratio of operating expenses to
average net assets including fee
waivers and reimbursements (%) | | | 0.80 | | | | 0.80 | | | | 0.80 | | | | 0.80 | (b) | |
Ratio of operating expenses to
average net assets excluding fee
waivers and reimbursements (%) | | | 1.21 | | | | 1.04 | | | | 1.05 | | | | 1.86 | (b) | |
Ratio of net investment income to
average net assets including fee
waivers and reimbursements (%) | | | 9.33 | | | | 13.34 | | | | 10.04 | | | | 10.90 | (b) | |
Ratio of net investment income to
average net assets excluding fee
waivers and reimbursements (%) | | | 8.92 | | | | 13.10 | | | | 9.79 | | | | 9.84 | | |
| Portfolio turnover rate (%) | | | 145.96 | | | | 292.11 | | | | 74.19 | | | | 10.78 | | |
FIRST EAGLE FUNDS | SEMI-ANNUAL REPORT | APRIL 30, 2012
137

Financial Highlights
| | | SIX-MONTHS ENDED | | YEAR ENDED OCTOBER 31, | |
| | | APRIL 30, 2012 (unaudited) | | 2011 | |
| | | CLASS A | | CLASS C | | CLASS Y | | CLASS A | | CLASS C | | CLASS Y | |
| Selected data for a share of beneficial interest outstanding throughout | |
| each period is presented below:* | |
Net asset value,
beginning of period ($) | | | 24.91 | | | | 22.01 | | | | 25.35 | | | | 24.06 | | | | 21.32 | | | | 24.47 | | |
| Income from investment operations: | |
| Net investment income (loss) ($) | | | 0.00 | ** | | | -0.08 | | | | 0.00 | ** | | | -0.09 | | | | -0.25 | | | | -0.08 | | |
Net realized and unrealized
gains (losses) on investments | | | 3.31 | | | | 2.87 | | | | 3.36 | | | | 1.11 | | | | 0.98 | | | | 1.12 | | |
Total income (loss) from
investment operations | | | 3.31 | | | | 2.79 | | | | 3.36 | | | | 1.02 | | | | 0.73 | | | | 1.04 | | |
| Less distributions: | |
Distributions from net
investment income ($) | | | — | | | | — | | | | — | | | | -0.17 | | | | -0.04 | | | | -0.16 | | |
Distributions from
capital gains | | | -1.82 | | | | -1.82 | | | | -1.82 | | | | — | | | | — | | | | — | | |
| Total distributions | | | -1.82 | | | | -1.82 | | | | -1.82 | | | | -0.17 | | | | -0.04 | | | | -0.16 | | |
Net asset value,
end of period ($) | | | 26.40 | | | | 22.98 | | | | 26.89 | | | | 24.91 | | | | 22.01 | | | | 25.35 | | |
| Total return(c) (%) | | | 14.51 | (a) | | | 14.08 | (a) | | | 14.54 | (a) | | | 4.22 | | | | 3.43 | | | | 4.20 | | |
| Ratios and supplemental data | |
Net assets, end of period
(millions) ($) | | | 642 | | | | 231 | | | | 686 | | | | 549 | | | | 194 | | | | 633 | | |
Ratio of operating expenses
to average net assets
including earnings credits (%) | | | 1.44 | (b) | | | 2.19 | (b) | | | 1.44 | (b) | | | 1.43 | | | | 2.18 | | | | 1.43 | | |
Ratio of operating expenses
to average net assets
excluding earnings credits (%) | | | 1.44 | (b) | | | 2.19 | (b) | | | 1.44 | (b) | | | 1.43 | | | | 2.18 | | | | 1.43 | | |
Ratio of net investment
income (loss) to average net assets
including earnings credits (%) | | | 0.03 | (b) | | | -0.72 | (b) | | | 0.03 | (b) | | | -0.33 | | | | -1.08 | | | | -0.31 | | |
Ratio of net investment
income (loss) to average net assets
excluding earnings credits (%) | | | 0.03 | (b) | | | -0.72 | (b) | | | 0.03 | (b) | | | -0.33 | | | | -1.08 | | | | -0.31 | | |
| Portfolio turnover rate (%) | | | 40.42 | (a) | | | 40.42 | (a) | | | 40.42 | (a) | | | 67.61 | | | | 67.61 | | | | 67.61 | | |
* Per share amounts have been calculated using the average shares method.
** Amount represents less than $0.01 per share.
(a) Not Annualized
(b) Annualized
(c) Does not take into account the sales charge of 5.00% for Class A shares and the CDSC (Contingent Deferred Sales Charge) of 1.00% for Class C shares.
(d) Investment income (loss) per share reflects special dividends received in Class A, C and Y which amounts to $0.13, $0.12, and $0.13 per share. Excluding the special dividend, the ratio of net investment income (loss) to average net assets both with and without the effect of earnings credits in Class A, C and Y would have been -0.31%, -1.00%, and -0.22%.
See Notes to Financial Statements.
FIRST EAGLE FUNDS | SEMI-ANNUAL REPORT | APRIL 30, 2012
138
Fund of America
| | | YEAR ENDED OCTOBER 31, | |
| | | 2010 | | 2009 | | 2008 | | 2007 | |
| | | CLASS A | | CLASS C | | CLASS Y | | CLASS A | | CLASS C | | CLASS Y | | CLASS A | | CLASS C | | CLASS Y | | CLASS A | | CLASS C | | CLASS Y | |
| Selected data for a share of beneficial interest outstanding throughout | |
| each period is presented below:* | |
Net asset value,
beginning of period ($) | | | 19.32 | | | | 17.25 | | | | 19.66 | | | | 18.92 | | | | 17.14 | | | | 19.23 | | | | 29.79 | | | | 27.39 | | | | 30.22 | | | | 27.92 | | | | 26.12 | | | | 28.28 | | |
| Income from investment operations: | |
| Net investment income (loss) ($) | | | 0.13 | | | | -0.03 | | | | 0.14 | | | | -0.06 | | | | -0.18 | | | | -0.07 | | | | -0.06 | | | | -0.20 | | | | -0.01 | | | | 0.05 | (d) | | | -0.13 | (d) | | | 0.07 | (d) | |
Net realized and unrealized
gains (losses) on investments | | | 4.61 | | | | 4.10 | | | | 4.67 | | | | 1.61 | | | | 1.44 | | | | 1.65 | | | | -7.85 | | | | -7.16 | | | | -8.03 | | | | 5.30 | | | | 4.88 | | | | 5.35 | | |
Total income (loss) from
investment operations | | | 4.74 | | | | 4.07 | | | | 4.81 | | | | 1.55 | | | | 1.26 | | | | 1.58 | | | | -7.91 | | | | -7.36 | | | | -8.04 | | | | 5.35 | | | | 4.75 | | | | 5.42 | | |
| Less distributions: | |
Distributions from net
investment income ($) | | | — | | | | — | | | | — | | | | — | | | | — | | | | — | | | | -0.07 | | | | — | | | | -0.06 | | | | — | | | | — | | | | — | | |
Distributions from
capital gains | | | — | | | | — | | | | — | | | | -1.15 | | | | -1.15 | | | | -1.15 | | | | -2.89 | | | | -2.89 | | | | -2.89 | | | | -3.48 | | | | -3.48 | | | | -3.48 | | |
| Total distributions | | | — | | | | — | | | | — | | | | -1.15 | | | | -1.15 | | | | -1.15 | | | | -2.96 | | | | -2.89 | | | | -2.95 | | | | -3.48 | | | | -3.48 | | | | -3.48 | | |
Net asset value,
end of period ($) | | | 24.06 | | | | 21.32 | | | | 24.47 | | | | 19.32 | | | | 17.25 | | | | 19.66 | | | | 18.92 | | | | 17.14 | | | | 19.23 | | | | 29.79 | | | | 27.39 | | | | 30.22 | | |
| Total return(c) (%) | | | 24.53 | | | | 23.59 | | | | 24.47 | | | | 9.13 | | | | 8.34 | | | | 9.14 | | | | -29.20 | | | | -29.74 | | | | -29.23 | | | | 21.28 | | | | 20.34 | | | | 21.25 | | |
| Ratios and supplemental data | |
Net assets, end of period
(millions) ($) | | | 379 | | | | 122 | | | | 599 | | | | 276 | | | | 90 | | | | 503 | | | | 127 | | | | 61 | | | | 501 | | | | 82 | | | | 65 | | | | 756 | | |
Ratio of operating expenses
to average net assets
including earnings credits (%) | | | 1.47 | | | | 2.22 | | | | 1.47 | | | | 1.50 | | | | 2.25 | | | | 1.50 | | | | 1.41 | | | | 2.16 | | | | 1.41 | | | | 1.40 | | | | 2.15 | | | | 1.40 | | |
Ratio of operating expenses
to average net assets
excluding earnings credits (%) | | | 1.47 | | | | 2.22 | | | | 1.47 | | | | 1.50 | | | | 2.25 | | | | 1.50 | | | | 1.42 | | | | 2.17 | | | | 1.42 | | | | 1.41 | | | | 2.16 | | | | 1.41 | | |
Ratio of net investment
income (loss) to average net assets
including earnings credits (%) | | | 0.61 | | | | -0.14 | | | | 0.62 | | | | -0.34 | | | | -1.10 | | | | -0.37 | | | | -0.23 | | | | -0.87 | | | | -0.06 | | | | 0.18 | (d) | | | -0.51 | (d) | | | 0.26 | (d) | |
Ratio of net investment
income (loss) to average net assets
excluding earnings credits (%) | | | 0.61 | | | | -0.14 | | | | 0.62 | | | | -0.34 | | | | -1.10 | | | | -0.37 | | | | -0.24 | | | | -0.88 | | | | -0.07 | | | | 0.17 | (d) | | | -0.52 | (d) | | | 0.25 | (d) | |
| Portfolio turnover rate (%) | | | 40.00 | | | | 40.00 | | | | 40.00 | | | | 40.41 | | | | 40.41 | | | | 40.41 | | | | 63.97 | | | | 63.97 | | | | 63.97 | | | | 50.26 | | | | 50.26 | | | | 50.26 | | |
FIRST EAGLE FUNDS | SEMI-ANNUAL REPORT | APRIL 30, 2012
139
Notes to Financial Statements (unaudited)
Note 1 — Significant Accounting Policies
First Eagle Funds (the "Trust"), is an open-end management investment company registered under the Investment Company Act of 1940, as amended ("1940 Act"). The Trust consists of seven separate portfolios, First Eagle Global Fund, First Eagle Overseas Fund, First Eagle U.S. Value Fund, First Eagle Gold Fund, First Eagle High Yield Fund, First Eagle Global Income Builder Fund and First Eagle Fund of America (each individually a "Fund" or collectively the "Funds"). All the Funds are diversified mutual funds except for First Eagle Gold Fund and First Eagle Fund of America, which are non-diversified. The Trust is a Delaware statutory trust. The First Eagle Global Fund seeks long-term growth of capital by investing in a range of asset classes from markets in the United States and throughout the world. The First Eagle Overseas Fund seeks long-term growth of capital by investing primarily in equities issued by non-U.S. corporations. The First Eagle U.S. Value Fund seeks long-term growth of capital by investing, under normal market conditions, at least 80% of its assets in domestic equity and debt securities. The First Eagle Gold Fund seeks to provide investors the opportunity to participate in the investment characteristics of gold (and to a limited extent other precious metals) for a portion of their overall investment portfolio. The First Eagle High Yield Fund seeks to provide investors with a high level of current income. The First Eagle Global Income Builder Fund (which is newly organized and had no financial results to report as of the date of these financial statements) seeks current income generation and long-term growth of capital. The First Eagle Fund of America seeks capital appreciation by investing primarily in domestic stocks and, to a lesser extent, in debt and international equity securities.
The First Eagle Global Income Builder Fund commenced its operation on May 1, 2012.
The following is a summary of significant accounting policies adhered to by the Funds and are in conformity with U.S. generally accepted accounting principles ("GAAP").
a) Investment in Subsidiary — The First Eagle Gold Fund (the "Gold Fund") may invest in certain precious metals through its investment in the First Eagle Gold Cayman Fund, Ltd., a wholly owned subsidiary (the "Subsidiary"). The Gold Fund may invest up to 25% of its total assets in shares of the Subsidiary. The Subsidiary has the ability to invest in commodities and securities consistent with the investment objective of the Gold Fund.
FIRST EAGLE FUNDS | SEMI-ANNUAL REPORT | APRIL 30, 2012
140
(continued)
The Subsidiary, established on May 28, 2010, is an exempted company under the laws of the Cayman Islands. The consolidated financial statements include the accounts of the Gold Fund and the Subsidiary. All intercompany transactions and balances have been eliminated. As of April 30, 2012, the Subsidiary has $63,754,244 in net assets, representing 2.38% of the Gold Fund's net assets.
b) Investment valuation — Each Fund computes its net asset value once daily as of the close of trading on each day the New York Stock Exchange ("NYSE") is open for trading. The net asset value per share is computed by dividing the total current value of the assets of a Fund, less its liabilities, by the total number of shares outstanding at the time of such computation.
A portfolio security (including an option), other than a bond, which is traded on a U.S. national securities exchange or a securities exchange abroad is normally valued at the price of the last sale on the exchange as of the close of business on the date on which assets are valued. If there are no sales on such date, such portfolio investment will be valued at the mean between the closing bid and asked prices (and if there is only a bid or only an asked price on such date, valuation will be at such bid or asked price for long or short positions, respectively). Securities, other than bonds, traded in the over-the-counter market are valued at the mean between the last bid and asked prices prior to the time of valuation (and if there is only a bid or only an asked price on such date, valuation will be at such bid or asked price for long or short positions, respectively), except if such unlisted security traded on the NASDAQ, in which case it is valued at its last sale price (or, if available, the NASDAQ Official Closing Price).
Commodities (such as physical metals) are valued at the spot price at the time trading on the New York Stock Exchange closes (normally 4:00 p.m. E.S.T.).
Forward contracts are valued as the current cost of covering or offsetting such contracts.
All bonds, whether listed on an exchange or traded in the over-the-counter market (and except for short-term investments as described in the next sentence), for which market quotations are readily available are valued at the mean between the last bid and asked prices received from dealers in the over-the-counter market in the United States or abroad, except that when no asked price is available, bonds are valued at the last bid price alone. Broker-Dealers or pricing services use multiple valuation techniques to
FIRST EAGLE FUNDS | SEMI-ANNUAL REPORT | APRIL 30, 2012
141
Notes to Financial Statements (unaudited)
determine value. In instances where sufficient market activity exists, dealers or pricing services may utilize a market-based approach through which quotes from market makers are used to determine fair value. In instances where sufficient market activity may not exist or is limited, the dealers or pricing services also utilize proprietary valuation models which may consider market transactions in comparable securities and the various relationships between securities in determining value and/or market characteristics such as benchmark yield curves, option-adjusted spreads, credit spreads, estimated default rates, coupon-rates, anticipated timing of principal repayments, underlying collateral, and other unique security features in order to estimate the relevant cash flows, which are then discounted to calculate the fair values. Short-term investments maturing in sixty days or less are valued at cost plus interest earned (or discount amortized, as the case may be), which is deemed to approximate value.
The 2:00 p.m. E.S.T. exchange rates typically are used to convert foreign security prices into U.S. dollars. Any security that is listed or traded on more than one exchange (or traded in multiple markets) is valued at the relevant quotation on the exchange or market deemed to be the primary trading venue for that security. In the absence of such a quotation, a quotation from the exchange or market deemed by the Adviser to be the secondary trading venue for the particular security shall be used. The Funds use pricing services to identify the market prices of publicly traded securities in their portfolios. When market prices are determined to be "stale" as a result of limited market activity for a particular holding, or in other circumstances when market prices are unavailable, such as for private placements, or determined to be unreliable for a particular holding, such holdings may be "fair valued" in accordance with procedures approved by the Board of Trustees ("Board"). Additionally, with respect to foreign holdings, specifically in circumstances leading the Adviser to believe that significant events occurring after the close of a foreign market have materially affected the value of a Fund's holdings in that market, such holdings may be fair valued to reflect the events in accordance with procedures approved by the Board. The determination of whether a particular foreign investment should be fair valued will be based on review of a number of factors, including developments in foreign markets, the performance of U.S. securities markets and security-specific events. The values assigned to a Fund's holdings therefore may differ on occasion from reported market values.
FIRST EAGLE FUNDS | SEMI-ANNUAL REPORT | APRIL 30, 2012
142
(continued)
Certain Funds with non-U.S. holdings have adopted procedures under which movements in the prices for U.S. securities (beyond specified thresholds) occurring after the close of a foreign market may require fair valuation of securities traded in that foreign market. The values assigned to a Fund's foreign holdings therefore may differ on occasion from reported market values. The Trust and the Adviser believe relying on the procedures as just described will result in prices that are more reflective of the actual market value of portfolio securities held by the Funds as of 4:00 p.m. E.S.T.
The Funds adopted provisions surrounding fair value measurements and disclosures that define fair value, establishes a framework for measuring fair value in GAAP and expands disclosures about fair value measurements. This applies to fair value measurements that are already required or permitted by other accounting standards and is intended to increase consistency of those measurements and applies broadly to securities and other types of assets and liabilities.
The Funds disclose the fair value of their investments in a hierarchy that prioritizes the inputs or assumptions to valuation techniques used to measure fair value. These inputs are used in determining the value of the Funds' investments and are summarized in the following fair value hierarchy:
Level 1 — Quoted prices in active markets for identical securities.
Level 2 — Other significant observable inputs (including quoted prices for similar securities, interest rates, prepayment speeds, credit risk, etc.).
Level 3 — Other significant unobservable inputs (including Fund's own assumption in determining the fair value of investments).
FIRST EAGLE FUNDS | SEMI-ANNUAL REPORT | APRIL 30, 2012
143
Notes to Financial Statements (unaudited)
The following is a summary of the Funds' inputs used to value the Funds' investments as of April 30, 2012:
| First Eagle Global Fund | |
| DESCRIPTION | | LEVEL 1 | | LEVEL 2(a) | | LEVEL 3(b) | | TOTAL | |
| Assets: † | |
U.S. Common
Stocks | | $ | 11,963,508,411 | | | $ | 4,235,323 | | | $ | — | | | $ | 11,967,743,734 | | |
International
Common Stocks | | | 13,886,801,267 | | | | 20,881,584 | | | | 10,748,338 | | | | 13,918,431,189 | | |
International
Preferred Stocks | | | 240,666,169 | | | | — | | | | — | | | | 240,666,169 | | |
| Warrant | | | 72,586,237 | | | | — | | | | — | | | | 72,586,237 | | |
| Commodity* | | | 1,751,034,959 | | | | — | | | | — | | | | 1,751,034,959 | | |
| U.S. Corporate Bonds | | | — | | | | 33,627,946 | | | | — | | | | 33,627,946 | | |
International
Corporate Notes
and Bonds | | | — | | | | 59,235,590 | | | | 31,758,004 | | | | 90,993,594 | | |
International
Government Bonds | | | — | | | | 597,379,785 | | | | — | | | | 597,379,785 | | |
International
Commercial Paper | | | — | | | | 2,021,580,469 | | | | — | | | | 2,021,580,469 | | |
| U.S. Commercial Paper | | | — | | | | 4,286,816,077 | | | | — | | | | 4,286,816,077 | | |
Foreign Currency
Contracts** | | | — | | | | 46,855,058 | | | | — | | | | 46,855,058 | | |
| Total | | $ | 27,914,597,043 | | | $ | 7,070,611,832 | | | $ | 42,506,342 | | | $ | 35,027,715,217 | | |
| Liabilities: | |
Covered Call
Option Written | | $ | 2,923,400 | | | $ | — | | | $ | — | | | $ | 2,923,400 | | |
Foreign Currency
Contracts** | | | — | | | | 10,761,869 | | | | — | | | | 10,761,869 | | |
| Total | | $ | 2,923,400 | | | $ | 10,761,869 | | | $ | — | | | $ | 13,685,269 | | |
(a) Transfer into/out of Level 2 represent value as of the beginning of the period.
International common stocks and international preferred stocks valued at $11,068,876,707 and $323,100,978 were transferred from Level 2 to Level 1 during the six-month period ended April 30, 2012. At October 31, 2011, these securities were valued based on fair value adjustment factors; at April 30, 2012, these securities were valued using quoted market prices in active markets. There were no transfers from Level 1 to Level 2 as of six-month period ended April 30, 2012.
(b) Level 3 securities are identified in the Schedule of Investments with footnote (f).
† See Schedule of Investments for additional detailed categorizations.
* Represents gold bullion.
** Foreign currency contracts are valued at net unrealized appreciation (depreciation) on the investment.
FIRST EAGLE FUNDS | SEMI-ANNUAL REPORT | APRIL 30, 2012
144
(continued)
Fair Value Level 3 activity for the period ended April 30, 2012 was as follows:
| First Eagle Global Fund — (continued) | |
| | | INTERNATIONAL | | INTERNATIONAL | | | |
| | | COMMON STOCKS | | CORPORATE BONDS | | TOTAL VALUE | |
| Beginning Balance — market value | | $ | 11,064,479 | | | $ | 33,466,782 | | | $ | 44,531,261 | | |
| Purchases | | | — | | | | 44,873 | | | | 44,873 | | |
| Sales | | | — | | | | — | | | | — | | |
| Transfer In — Level 3 | | | — | | | | — | | | | — | | |
| Transfer Out — Level 3 | | | — | | | | — | | | | — | | |
| Accrued Amortization | | | — | | | | — | | | | — | | |
| Realized Gains (Losses) | | | — | | | | — | | | | — | | |
Change in Unrealized Appreciation
(Depreciation) | | | (316,141 | ) | | | (1,753,651 | ) | | | (2,069,792 | ) | |
| Ending Balance — market value | | $ | 10,748,338 | | | $ | 31,758,004 | | | $ | 42,506,342 | | |
Change in unrealized gains or (losses)
relating to assets still held at reporting date | | $ | (316,141 | ) | | $ | (1,753,651 | ) | | $ | (2,069,792 | ) | |
FIRST EAGLE FUNDS | SEMI-ANNUAL REPORT | APRIL 30, 2012
145
Notes to Financial Statements (unaudited)
| First Eagle Overseas Fund | |
| DESCRIPTION | | LEVEL 1 | | LEVEL 2(a) | | LEVEL 3(b) | | TOTAL | |
| Assets: † | |
International
Common Stocks | | $ | 7,687,595,649 | | | $ | 29,156,705 | | | $ | 33,446,275 | | | $ | 7,750,198,629 | | |
| U.S. Common Stock | | | 32,968,225 | | | | — | | | | — | | | | 32,968,225 | | |
International
Preferred Stocks | | | 146,844,854 | | | | — | | | | — | | | | 146,844,854 | | |
| Commodity* | | | 735,536,841 | | | | — | | | | — | | | | 735,536,841 | | |
| Term Loans | | | — | | | | 9,057,571 | | | | — | | | | 9,057,571 | | |
International
Corporate Bonds | | | — | | | | 22,341,898 | | | | 21,172,002 | | | | 43,513,900 | | |
International
Government Bonds | | | — | | | | 337,608,856 | | | | — | | | | 337,608,856 | | |
International
Commercial Paper | | | — | | | | 948,452,374 | | | | — | | | | 948,452,374 | | |
| U.S. Commercial Paper | | | — | | | | 546,090,862 | | | | — | | | | 546,090,862 | | |
Foreign Currency
Contracts** | | | — | | | | 30,403,958 | | | | — | | | | 30,403,958 | | |
| Total | | $ | 8,602,945,569 | | | $ | 1,923,112,224 | | | $ | 54,618,277 | | | $ | 10,580,676,070 | | |
| Liabilities: | |
Foreign Currency
Contracts** | | $ | — | | | $ | 7,139,962 | | | $ | — | | | $ | 7,139,962 | | |
| Total | | $ | — | | | $ | 7,139,962 | | | $ | — | | | $ | 7,139,962 | | |
(a) Transfer into/out of Level 2 represent value as of the beginning of the period.
International common stocks and international preferred stocks valued at $6,563,256,750 and $199,154,572 were transferred from Level 2 to Level 1 during the six-month period ended April 30, 2012. At October 31, 2011, these securities were valued based on fair value adjustment factors; at April 30, 2012, these securities were valued using quoted market prices in active markets. There were no transfers from Level 1 to Level 2 as of six-month period ended April 30, 2012.
(b) Level 3 securities are identified in the Schedule of Investments with footnote (e).
† See Schedule of Investments for additional detailed categorizations.
* Represents gold bullion.
** Foreign currency contracts are valued at net unrealized appreciation (depreciation) on the investment.
FIRST EAGLE FUNDS | SEMI-ANNUAL REPORT | APRIL 30, 2012
146
(continued)
Fair Value Level 3 activity for the period ended April 30, 2012 was as follows:
| First Eagle Overseas Fund — (continued) | |
| | | INTERNATIONAL | | INTERNATIONAL | | | | | |
| | | COMMON STOCKS | | CORPORATE BONDS | | TERM LOANS | | TOTAL VALUE | |
Beginning Balance —
market value | | $ | 49,904,715 | | | $ | 22,311,188 | | | $ | 633,621 | | | $ | 72,849,524 | | |
| Purchases | | | 30,673 | | | | 20,711 | | | | — | | | | 51,384 | | |
| Sales | | | — | | | | — | | | | (642,503 | ) | | | (642,503 | ) | |
| Transfer In — Level 3 | | | — | | | | — | | | | — | | | | — | | |
| Transfer Out — Level 3 | | | — | | | | — | | | | — | | | | — | | |
| Accrued Amortization | | | — | | | | — | | | | (214 | ) | | | (214 | ) | |
| Realized Gains (Losses) | | | — | | | | — | | | | (1,768 | ) | | | (1,768 | ) | |
Change in Unrealized
Appreciation
(Depreciation) | | | (16,489,113 | ) | | | (1,159,897 | ) | | | 10,864 | | | | (17,638,146 | ) | |
Ending Balance —
market value | | $ | 33,446,275 | | | $ | 21,172,002 | | | $ | — | | | $ | 54,618,277 | | |
Change in unrealized
gains or (losses) relating
to assets still held at
reporting date | | $ | (16,489,113 | ) | | $ | (1,159,897 | ) | | $ | — | | | $ | (17,649,010 | ) | |
FIRST EAGLE FUNDS | SEMI-ANNUAL REPORT | APRIL 30, 2012
147
Notes to Financial Statements (unaudited)
| First Eagle U.S. Value Fund | |
| DESCRIPTION | | LEVEL 1 | | LEVEL 2 | | LEVEL 3(a) | | TOTAL | |
| Assets: † | |
| U.S. Common Stocks | | $ | 1,771,606,879 | | | $ | 3,334 | | | $ | — | | | $ | 1,771,610,213 | | |
International
Common Stocks | | | 169,965,257 | | | | — | | | | — | | | | 169,965,257 | | |
| U.S. Preferred Stock | | | — | | | | — | | | | 3,934,030 | | | | 3,934,030 | | |
| Exchange Traded Fund | | | 11,744,524 | | | | — | | | | — | | | | 11,744,524 | | |
| Warrant | | | 11,747,075 | | | | — | | | | — | | | | 11,747,075 | | |
| Commodity* | | | 119,672,002 | | | | — | | | | — | | | | 119,672,002 | | |
International
Corporate Bond | | | — | | | | 5,400,000 | | | | — | | | | 5,400,000 | | |
| U.S. Corporate Bonds | | | — | | | | 51,002,625 | | | | — | | | | 51,002,625 | | |
| U.S. Treasury Bills | | | — | | | | 149,972,651 | | | | — | | | | 149,972,651 | | |
International
Commercial Paper | | | — | | | | 26,285,422 | | | | — | | | | 26,285,422 | | |
| U.S. Commercial Paper | | | — | | | | 370,579,455 | | | | — | | | | 370,579,455 | | |
| Total | | $ | 2,084,735,737 | | | $ | 603,243,487 | | | $ | 3,934,030 | | | $ | 2,691,913,254 | | |
| Liabilities: | |
Covered Call
Option Written | | $ | 250,600 | | | $ | — | | | $ | — | | | $ | 250,600 | | |
| Total | | $ | 250,600 | | | $ | — | | | $ | — | | | $ | 250,600 | | |
(a) Level 3 securities are identified in the Schedule of Investments with footnote (e).
† See Schedule of Investments for additional detailed categorizations.
* Represents gold bullion.
For the six-month period ended April 30, 2012, there was no security transfer activity from Level 1 to Level 2 and no security transfer activity from Level 2 to Level 1.
FIRST EAGLE FUNDS | SEMI-ANNUAL REPORT | APRIL 30, 2012
148
(continued)
Fair Value Level 3 activity for the period ended April 30, 2012 was as follows:
| First Eagle U.S. Value Fund — (continued) | |
| | | U.S. PREFERED STOCK | |
| Beginning Balance — market value | | $ | 3,555,661 | | |
| Purchases | | | — | | |
| Sales | | | — | | |
| Transfer In — Level 3 | | | — | | |
| Transfer Out — Level 3 | | | — | | |
| Accrued Amortization | | | — | | |
| Realized Gains (Losses) | | | — | | |
| Change in Unrealized Appreciation (Depreciation) | | | 378,369 | | |
| Ending Balance — market value | | $ | 3,934,030 | | |
Change in unrealized gains or (losses) relating to assets still held at
reporting date | | $ | 378,369 | | |
| First Eagle Gold Fund | |
| DESCRIPTION | | LEVEL 1 | | LEVEL 2 | | LEVEL 3(a) | | TOTAL | |
| Assets: † | |
International
Common Stocks | | $ | 1,767,922,593 | | | $ | — | | | $ | — | | | $ | 1,767,922,593 | | |
| U.S. Common Stocks | | | 203,146,875 | | | | — | | | | — | | | | 203,146,875 | | |
International
Preferred Stock | | | 4,956,000 | | | | — | | | | — | | | | 4,956,000 | | |
| Investment Company | | | 520,558 | | | | — | | | | — | | | | 520,558 | | |
| Warrants | | | 840,382 | | | | — | | | | 0 | | | | 840,382 | | |
| Commodity* | | | 569,025,451 | | | | — | | | | — | | | | 569,025,451 | | |
International
Convertible Bonds | | | — | | | | 1,973,371 | | | | 30,000,000 | | | | 31,973,371 | | |
International
Commercial Paper | | | — | | | | 14,061,457 | | | | — | | | | 14,061,457 | | |
| U.S. Commercial Paper | | | — | | | | 76,418,018 | | | | — | | | | 76,418,018 | | |
| Total | | $ | 2,546,411,859 | | | $ | 92,452,846 | | | $ | 30,000,000 | | | $ | 2,668,864,705 | | |
(a) Level 3 securities are identified in the Schedule of Investments with footnote (e).
† See Consolidated Schedule of Investments for additional detailed categorizations.
* Represents gold bullion.
For the six-month period ended April 30, 2012, there was no security transfer activity from Level 1 to Level 2 and no security transfer activity from Level 2 to Level 1.
FIRST EAGLE FUNDS | SEMI-ANNUAL REPORT | APRIL 30, 2012
149
Notes to Financial Statements (unaudited)
Fair Value Level 3 activity for the period ended April 30, 2012 was as follows:
| First Eagle Gold Fund — (continued) | |
| | | INTERNATIONAL | | | | | |
| | | CONVERTIBLE BONDS | | WARRANTS | | TOTAL VALUE | |
| Beginning Balance — market value | | $ | 30,000,000 | | | $ | — | | | $ | 30,000,000 | | |
| Purchases | | | — | | | | 0 | | | | 0 | | |
| Sales | | | — | | | | — | | | | — | | |
| Transfer In — Level 3 | | | — | | | | — | | | | — | | |
| Transfer Out — Level 3 | | | — | | | | — | | | | — | | |
| Accrued Amortization | | | — | | | | — | | | | — | | |
| Realized Gains (Losses) | | | — | | | | — | | | | — | | |
Change in Unrealized Appreciation
(Depreciation) | | | — | | | | 0 | | | | 0 | | |
| Ending Balance — market value | | $ | 30,000,000 | | | $ | 0 | | | $ | 30,000,000 | | |
Change in unrealized gains or (losses)
relating to assets still held at reporting date | | $ | — | | | $ | 0 | | | $ | 0 | | |
| First Eagle High Yield Fund | |
| DESCRIPTION | | LEVEL 1 | | LEVEL 2 | | LEVEL 3 | | TOTAL | |
| Assets: | |
| U.S. Corporate Bonds | | $ | — | | | $ | 174,568,400 | | | $ | — | | | $ | 174,568,400 | | |
| International Corporate Bonds | | | — | | | | 64,981,117 | | | | — | | | | 64,981,117 | | |
| Term Loans | | | — | | | | 4,159,372 | | | | — | | | | 4,159,372 | | |
| Asset-Backed Security | | | — | | | | 23,623 | | | | — | | | | 23,623 | | |
| U.S. Commercial Paper | | | — | | | | 23,391,000 | | | | — | | | | 23,391,000 | | |
| Total | | $ | — | | | $ | 267,123,512 | | | $ | — | | | $ | 267,123,512 | | |
| Liabilities: | |
| Foreign Currency Contracts** | | $ | — | | | $ | 24,554 | | | $ | — | | | $ | 24,554 | | |
| Total | | $ | — | | | $ | 24,554 | | | $ | — | | | $ | 24,554 | | |
** Foreign currency contracts are valued at net unrealized appreciation (depreciation) on the investment.
For the one-month period ended April 30, 2012, there was no security transfer activity from Level 1 to Level 2 and no security transfer activity from Level 2 to Level 1.
FIRST EAGLE FUNDS | SEMI-ANNUAL REPORT | APRIL 30, 2012
150
(continued)
| First Eagle Fund of America | |
| DESCRIPTION | | LEVEL 1 | | LEVEL 2 | | LEVEL 3 | | TOTAL | |
| Assets: † | |
U.S. Common
Stocks | | $ | 1,375,375,335 | | | $ | — | | | $ | — | | | $ | 1,375,375,335 | | |
International
Common Stocks | | | 107,078,776 | | | | — | | | | — | | | | 107,078,776 | | |
| Exchange Traded Fund | | | 51,992,618 | | | | — | | | | — | | | | 51,992,618 | | |
| Investment Company | | | 62,392,716 | | | | — | | | | — | | | | 62,392,716 | | |
| U.S. Convertible Bond | | | — | | | | 5,338,563 | | | | — | | | | 5,338,563 | | |
| Call Options Purchased | | | 2,905,000 | | | | — | | | | — | | | | 2,905,000 | | |
| Total | | $ | 1,599,744,445 | | | $ | 5,338,563 | | | $ | — | | | $ | 1,605,083,008 | | |
| Liabilities: | |
Covered Call
Options Written | | $ | 45,035,927 | | | $ | — | | | $ | — | | | $ | 45,035,927 | | |
| Put Options Written | | | 37,500 | | | | — | | | | — | | | | 37,500 | | |
| Total | | $ | 45,073,427 | | | $ | — | | | $ | — | | | $ | 45,073,427 | | |
c) Investment transactions and income — Investment transactions are accounted for on a trade date basis. The specific identification method is used in determining realized gains and losses from investment transactions. Dividend income is recorded on the ex-dividend date. Interest income is recorded daily on the accrual basis. In computing investment income, each Fund accretes discounts and amortizes premiums on debt obligations using the effective yield method. Investment income is allocated to each Fund's share class in proportion to its relative net assets. Payments received from certain investments held by the Funds may be comprised of dividends, capital gains and return of capital. The Funds originally estimate the expected classification of such payments. The amounts may subsequently be reclassified upon receipt of information from the issuer.
d) Expenses — Expenses arising in connection with a Fund are charged directly to that Fund. Expenses common to all Funds are generally allocated to each Fund in proportion to its relative net assets. Certain expenses are shared with the First Eagle Variable Funds, an affiliated fund group. Such costs are
† See Schedule of Investments for additional detailed categorizations.
For the six-month period ended April 30, 2012, there was no security transfer activity from Level 1 to Level 2 and no security transfer activity from Level 2 to Level 1.
FIRST EAGLE FUNDS | SEMI-ANNUAL REPORT | APRIL 30, 2012
151
Notes to Financial Statements (unaudited)
generally allocated using the ratio of the Fund's average daily net assets relative to the total average daily net assets of the First Eagle Variable Funds. Earnings credits may reduce shareholder servicing agent fees by the amount of interest earned on balances with such service provider.
e) Foreign currency translation — The books and records of the Funds are maintained in U.S. dollars. The market values of securities which are not traded in U.S. currency are recorded in the financial statements after translation to U.S. dollars based on the applicable exchange rates at the end of the period. The costs of such securities are translated at exchange rates prevailing when acquired. Related interest, dividends and withholding taxes are accrued at the rates of exchange prevailing on the respective dates of such transactions.
The net assets of each of the Funds are presented at the foreign exchange rates and market values at the close of the period. The Funds do not isolate that portion of gains and losses on investments which is due to changes in foreign exchange rates from that which is due to changes in market prices of the securities. However, for federal income tax purposes each Fund does isolate the effect of changes in foreign exchange rates from the changes in market prices for realized gains and losses on debt obligations.
f) Forward currency contracts — In connection with portfolio purchases and sales of securities denominated in foreign currencies, each Fund may enter into forward currency contracts. The First Eagle Global, Overseas, and High Yield Funds enter into foreign exchange contracts primarily to manage and/or gain exposure to certain foreign currencies. The Funds' currency transactions include portfolio hedging on portfolio positions. Portfolio hedging is the use of a forward contract (or other cash management position) with respect to one or more portfolio security positions denominated or quoted in a particular currency. Currency exchange transactions involve currencies of different countries that the Funds invest in and serve as hedges against possible variations in the exchange rates between these currencies and the U.S. dollar. Each Fund may engage in portfolio hedging with respect to the currency of a particular country in amounts approximating actual or anticipated positions in securities denominated in that currency. Hedging can reduce exposure to currency exchange movements, but cannot eliminate that exposure. It is possible to lose money under a hedge.
FIRST EAGLE FUNDS | SEMI-ANNUAL REPORT | APRIL 30, 2012
152
(continued)
Funds' investing in foreign exchange contracts are exposed to risk if the value of the currency changes unfavorably, if the counterparties to the contracts are unable to meet the terms of their contracts or if the Fund is unable to enter into a closing position. Forward currency contracts outstanding at period end, if any, are listed after the Fund's portfolio. Outstanding contracts at period-end are indicative of the volume of activity during the period.
The Funds adopted provisions surrounding disclosures and derivative instruments and hedging activities which require qualitative disclosures about objectives and strategies for using derivatives, quantitative disclosures about fair value amounts of gains and losses on derivative instruments, and disclosures about currency-risk-related contingent features in derivative agreements.
At April 30, 2012, the Funds had the following foreign forward currency contracts grouped into appropriate risk categories illustrated below:
| First Eagle Global Fund | |
| | | | | | | GAIN OR (LOSS) ON
DERIVATIVES RECOGNIZED
IN INCOME | |
| RISK TYPE | | ASSET DERIVATIVE
FAIR VALUE1 | | LIABILITY DERIVATIVE
FAIR VALUE2 | | REALIZED
GAIN3 | | CHANGE IN
APPRECIATION4 | |
| Foreign Currency | | $ | 46,855,058 | | | $ | 10,761,869 | | | $ | 94,097,975 | | | $ | 35,640,408 | | |
| First Eagle Overseas Fund | |
| | | | | | | GAIN OR (LOSS) ON
DERIVATIVES RECOGNIZED
IN INCOME | |
| RISK TYPE | | ASSET DERIVATIVE
FAIR VALUE1 | | LIABILITY DERIVATIVE
FAIR VALUE2 | | REALIZED
GAIN3 | | CHANGE IN
APPRECIATION4 | |
| Foreign Currency | | $ | 30,403,958 | | | $ | 7,139,962 | | | $ | 51,525,410 | | | $ | 24,011,750 | | |
| First Eagle High Yield Fund | |
| | | | | GAIN OR (LOSS) ON
DERIVATIVES RECOGNIZED
IN INCOME | |
| RISK TYPE | | LIABILITY DERIVATIVE
FAIR VALUE2 | | REALIZED
GAIN (LOSS)3 | | CHANGE IN
APPRECIATION4 | |
| Foreign Currency | | $ | 24,554 | | | $ | — | | | $ | 47,192 | | |
1 Statements of Assets and Liabilities location: Receivable for forward currency contracts held, at value.
2 Statements of Assets and Liabilities location: Payable for forward currency contracts held, at value.
3 Statements of Operations location: Net realized gains (losses) from: foreign currency and forward contract related transactions.
4 Statements of Operations location: Changes in unrealized appreciation (depreciation) of: foreign currency and forward contract related translation.
FIRST EAGLE FUNDS | SEMI-ANNUAL REPORT | APRIL 30, 2012
153
Notes to Financial Statements (unaudited)
g) Options — In order to produce incremental earnings or protect against declines in the value of portfolio securities, First Eagle Global Fund, First Eagle U.S. Value Fund and First Eagle Fund of America write covered call options on portfolio securities. The Funds may also use options for speculative purposes, although it generally does not employ options for this purpose.
Options contracts are valued daily based upon the last sale price on the principal exchange on which the option is traded and unrealized appreciation/depreciation is recorded. If there is no sale on such day, the mean between the last bid and asked prices is used. When an option is exercised, the proceeds on the sale of a written call option is adjusted by the amount of premium received or paid. When a written option expires, the Funds will realize a gain equal to the amount of the premium received. When the Funds enter into a closing purchase transaction, the Funds will realize a gain (or loss, if the cost of the closing purchase transaction exceeds the premium received when the option was written) without regard to any unrealized gain or loss on the underlying security and the liability related to such option is eliminated.
The Funds will earmark assets to cover its obligations under option contracts. A call option is covered if the Funds holds, on a share-for-share basis, either the underlying shares or a call on the same security as the call written where the exercise price of the call held is equal to or less than the exercise price of the call written (or greater than the exercise price of the call written if the difference is maintained by the Funds in cash, Treasury bills or other high grade short-term obligations in a segregated account with its custodian). One reason for writing options is to attempt to realize, through the receipt of premiums, a greater return than would be realized on the securities alone. Another reason for writing options is to hedge against a moderate decline in the value of securities owned by the Funds in the case of a call option. If an increase occurs in the underlying security or stock index sufficient to result in the exercise of a call written by the Funds, it may be required to deliver securities or cash and may thereby forego some or all of the gain that otherwise may have been realized on the securities underlying the call option. This "opportunity cost" may be partially or wholly offset by the premium received for the covered call written by the Funds. The risk in writing a covered call option is that the Funds give up the opportunity for
FIRST EAGLE FUNDS | SEMI-ANNUAL REPORT | APRIL 30, 2012
154
(continued)
profit if the market price of the underlying security increases and the option is exercised. The Funds also have the additional risk of not being able to enter into a closing transaction if a liquid secondary market does not exist.
The Funds may also write over-the-counter options where the completion of the obligation is dependent upon the credit standing of the counterparty.
For the six-month period ended April 30, 2012, First Eagle Global Fund, First Eagle U.S. Value Fund and First Eagle Fund of America had the following options transactions.
| First Eagle Global Fund | |
| WRITTEN OPTIONS | | NUMBER
OF CONTRACTS | | PREMIUMS
RECEIVED | |
| Options outstanding at October 31, 2011 | | | 17,550 | | | $ | 2,030,334 | | |
| Options written | | | 14,617 | | | | 4,499,162 | | |
| Options assigned | | | — | | | | — | | |
| Options expired/closed | | | (17,550 | ) | | | (2,030,334 | ) | |
| Options outstanding at April 30, 2012 | | | 14,617 | | | $ | 4,499,162 | | |
As of April 30, 2012, portfolio securities valued at $76,227,655 were segregated to cover collateral requirements for written options.
| First Eagle U.S. Value Fund | |
| WRITTEN OPTIONS | | NUMBER
OF CONTRACTS | | PREMIUMS
RECEIVED | |
| Options outstanding at October 31, 2011 | | | 3,160 | | | $ | 341,309 | | |
| Options written | | | 1,253 | | | | 375,887 | | |
| Options assigned | | | — | | | | — | | |
| Options expired/closed | | | (3,160 | ) | | | (341,309 | ) | |
| Options outstanding at April 30, 2012 | | | 1,253 | | | $ | 375,887 | | |
As of April 30, 2012, portfolio securities valued at $6,534,395 were segregated to cover collateral requirements for written options.
| First Eagle Fund of America | |
| WRITTEN OPTIONS | | NUMBER
OF CONTRACTS | | PREMIUMS
RECEIVED | |
| Options outstanding at October 31, 2011 | | | 92,105 | | | $ | 20,894,677 | | |
| Options written | | | 456,061 | | | | 117,957,713 | | |
| Options assigned | | | (47,890 | ) | | | (10,017,577 | ) | |
| Options expired/closed | | | (340,099 | ) | | | (93,299,694 | ) | |
| Options outstanding at April 30, 2012 | | | 160,177 | | | $ | 35,535,119 | | |
FIRST EAGLE FUNDS | SEMI-ANNUAL REPORT | APRIL 30, 2012
155
Notes to Financial Statements (unaudited)
| First Eagle Fund of America — (continued) | |
| PURCHASED OPTIONS | | NUMBER
OF CONTRACTS | | COST | |
| Options outstanding at October 31, 2011 | | | 2,799 | | | $ | 1,113,812 | | |
| Options purchased | | | 7,500 | | | | 1,102,040 | | |
| Options closed | | | (4,799 | ) | | | (1,735,702 | ) | |
| Options outstanding at April 30, 2012 | | | 5,500 | | | $ | 480,150 | | |
As of April 30, 2012, portfolio securities valued at $654,161,668 were segregated to cover collateral requirements for written options.
Outstanding contracts at period-end are indicative of the volume of activity during the period.
At April 30, 2012, the Funds had the following options grouped into appropriate risk categories illustrated below:
| First Eagle Global Fund | |
| | | | | GAIN OR (LOSS) ON
DERIVATIVES RECOGNIZED
IN INCOME | |
| RISK TYPE | | LIABILITY DERIVATIVE
FAIR VALUE2 | | REALIZED
GAIN3 | | CHANGE IN
APPRECIATION4 | |
| Equity — Written options | | $ | 2,923,400 | | | $ | 2,030,334 | | | $ | 1,914,178 | | |
| First Eagle U.S. Value Fund | |
| | | | | GAIN OR (LOSS) ON
DERIVATIVES RECOGNIZED
IN INCOME | |
| RISK TYPE | | LIABILITY DERIVATIVE
FAIR VALUE2 | | REALIZED
GAIN3 | | CHANGE IN
APPRECIATION4 | |
| Equity — Written options | | $ | 250,600 | | | $ | 341,309 | | | $ | 112,728 | | |
| First Eagle Fund of America | |
| | | | | | | GAIN OR (LOSS) ON
DERIVATIVES RECOGNIZED
IN INCOME | |
| RISK TYPE | | ASSET DERIVATIVE
FAIR VALUE1 | | LIABILITY DERIVATIVE
FAIR VALUE2 | | REALIZED
LOSS3 | | CHANGE IN
APPRECIATION4 | |
Equity — Written
options | | $ | — | | | $ | 45,073,427 | | | $ | (13,919,582 | ) | | $ | 74,639 | | |
Equity — Purchased
options | | $ | 2,905,000 | | | $ | — | | | $ | (483,237 | ) | | $ | 2,377,077 | | |
1 Statements of Assets and Liabilities location: Investments, at value, Unaffiliated issuers.
2 Statements of Assets and Liabilities location: Option contracts written, at value.
3 Statements of Operations location: Net realized gains (losses) from: Written options & Investment transactions of unaffiliated issuers.
4 Statements of Operations location: Changes in unrealized appreciation (depreciation) of: Written options & Investment transactions.
FIRST EAGLE FUNDS | SEMI-ANNUAL REPORT | APRIL 30, 2012
156
(continued)
h) Repurchase agreements — The Funds may enter into repurchase agreement transactions with institutions that meet the adviser's credit guidelines. Each repurchase agreement is valued at amortized cost. The Funds require that the collateral received in a repurchase agreement transaction be transferred to a custodian in a manner sufficient to enable the Funds to obtain collateral in the event of a counterparty default. If the counterparty defaults and the fair value of the collateral declines, realization of the collateral by the Funds may be delayed or limited.
i) Term Loans — A Fund may invest in term loans, which usually take the form of loan participations and assignments. Loan participations and assignments are agreements to make money available to U.S. or foreign corporations, partnerships or other business entities (the "Borrower") in a specified amount, at a specified rate and within a specified time. A loan is typically originated, negotiated and structured by a U.S. or foreign bank, insurance company or other financial institution (the "Agent") for a group of loan investors ("Loan Investors"). The Agent typically administers and enforces the loan on behalf of the other Loan Investors in the syndicate and may hold any collateral on behalf of the Loan Investors. Such loan participations and assignments are typically senior, secured and collateralized in nature. A Fund records an investment when the Borrower withdraws money and records interest as earned. The Fund generally has no right to enforce compliance with the terms of the loan agreement with the Borrower. As a result, the Fund assumes the credit risk of the Borrower, the selling participant and any intermediary between the Fund and the Borrower ("Intermediate Participants"). In the event that the Borrower, selling participant or Intermediate Participants become insolvent or enters into bankruptcy, each Fund may incur certain costs and delays in realizing payment or may suffer a loss of principal and/or interest.
j) Treasury Inflation-Protected Securities — The Funds invest in Treasury Inflation-Protected Securities ("TIPS") which are specially structured bonds in which the principal amount is adjusted to keep pace with inflation. The inflation (deflation) adjustment is applied to the principal of each bond on a monthly basis and is accounted for as interest income on the Statements of Operations. TIPS are subject to interest rate risk.
k) Restricted Securities — The Funds may invest in securities that are subject to legal or contractual restrictions on resale. These securities generally may be resold in transactions exempt from registration or to the public if the securities
FIRST EAGLE FUNDS | SEMI-ANNUAL REPORT | APRIL 30, 2012
157
Notes to Financial Statements (unaudited)
are registered. Disposal of these securities may involve time-consuming negotiations and expenses, and prompt sale at an acceptable price may be difficult. Information regarding restricted securities, if any, is included at the end of each Fund's Schedule of Investments.
l) United States income taxes — No provision has been made for U.S. federal income taxes since it is the intention of each Fund to distribute to shareholders all taxable net investment income and net realized gains on investments, if any, within the allowable time limit, and to comply with the provisions of the Code for a Regulated Investment Company. The Funds declare and pay such income dividends and capital gains distributions on an annual basis except for those of the First Eagle High Yield Fund which are declared daily and paid monthly. Distributions from net realized capital gains are made annually, if available.
The Funds adopted provisions surrounding income taxes, which require the tax effects of certain tax positions to be recognized. These tax positions must meet a "more likely than not" standard that based on their technical merits, have a more than 50% likelihood of being sustained upon examination. Management of the Trust has analyzed the Funds' tax positions taken on federal and state income tax returns for all open tax years (the current and the prior three tax years) and has concluded that no provision for income tax is required in the Funds' financial statements.
m) Class Accounting — Investment income, common expenses and realized/unrealized gain or loss on investments are allocated to the various classes of the Fund on the basis of daily net assets of each class. Fees relating to a specific class are charged directly to that class.
n) Use of estimates — The preparation of financial statements in conformity with GAAP requires management to make estimates and assumptions that affect the reported amounts of assets and liabilities at the date of the financial statements and the reported amounts of revenues and expenses during the reporting period. Actual results could differ from those estimates.
o) Redemption Fee — A redemption fee of 2% will be applied to the First Eagle Global Fund, First Eagle Overseas Fund and First Eagle Gold Fund for the sale or exchange within 60 days of the purchase of such shares.
p) Foreign Taxes — The Funds may be subject to foreign taxes on income, gains on investments or currency purchases/repatriation, a portion of which
FIRST EAGLE FUNDS | SEMI-ANNUAL REPORT | APRIL 30, 2012
158
(continued)
may be recoverable. The Funds will accrue such taxes and recoveries as applicable, based upon their current interpretation of tax rules and regulations that exist in the markets in which they invest.
Note 2 — Investment Advisory, Custody and Administration Agreements; Transactions with Related Persons
First Eagle Investment Management, LLC (the "Adviser"), a subsidiary of Arnhold and S. Bleichroeder Holdings, Inc. ("ASB Holdings"), manages the Funds. For its services, the Adviser receives, pursuant to an Investment Advisory Agreement between the Funds and the Adviser (the "Advisory Agreement") an annual advisory fee as follows: First Eagle Global Fund, First Eagle Overseas Fund, First Eagle U.S. Value Fund and First Eagle Gold Fund at 0.75% of each Fund's average daily net assets, First Eagle High Yield Fund at 0.70% of the Fund's average daily net assets and First Eagle Fund of America at 1% of the Fund's average daily net assets.
Pursuant to a subadvisory agreement, dated December 10, 2002 (agreement was amended and restated most recently in September 2009) ("Subadvisory Agreement") Iridian Asset Management LLC ("Iridian") manages the investments of the First Eagle Fund of America. The fees paid to Iridian by the Adviser under the Subadvisory Agreement are based on a reference amount equal to 50% of the combined (i) fees received by the Adviser for advisory services on behalf of the Fund and (ii) the fees received by the Fund's distributor for its shareholder liaison services on behalf of the Fund. These amounts are reduced by certain direct marketing costs borne by the Adviser in connection with the Fund and are further reduced by the amount paid by the Adviser for certain administrative expenses incurred in providing services to the Fund.
The Adviser has contractually agreed to waive its management fee and/or reimburse expenses for the First Eagle High Yield Fund, as allowed by law, so that the total annual operating expenses (excluding certain items) of Class A and Class C shares do not exceed 1.25% and 2.00%, respectively, through December 31, 2012, and those of Class I shares do not exceed 0.80% through December 31, 2013.
The Adviser also performs certain administrative, accounting, operations, compliance and other services on behalf of the Funds, and in accordance with its agreement with them, the Funds reimburse the Adviser for costs (including
FIRST EAGLE FUNDS | SEMI-ANNUAL REPORT | APRIL 30, 2012
159
Notes to Financial Statements (unaudited)
personnel, related overhead and other costs) related to those services. For the six-month period ended April 30, 2012, the Funds reimbursed and had payable to the Adviser amounts shown below:
| FUND | | PAID TO ADVISER | | PAYABLE TO ADVISER | |
| First Eagle Global Fund | | $ | 1,851,677 | | | $ | 1,094,649 | | |
| First Eagle Overseas Fund | | | 603,655 | | | | 399,007 | | |
| First Eagle U.S. Value Fund | | | 122,277 | | | | 52,646 | | |
| First Eagle Gold Fund | | | 200,402 | | | | 153,674 | | |
| First Eagle High Yield Fund | | | — | | | | — | | |
| First Eagle Fund of America | | | 82,771 | | | | 51,021 | | |
The Adviser may seek reimbursement for fees waived and other expenses paid by the Adviser pursuant to the Fee Waiver and Expense Reimbursement Agreement ("Agreement"). A repayment should be payable only to the extent it can be made during the thirty-six months following the applicable period during which the Adviser waived fees or reimbursed operating expenses under the Agreement. As of March 31, 2012, the Adviser may seek reimbursement of previously waived and reimbursed fees as follows:
| EXPIRATION | | AMOUNT | |
| March 31, 2013 | | $ | 33,000 | | |
| March 31, 2014 | | | 38,000 | | |
| March 31, 2015 | | | 72,599 | | |
The Adviser also performs certain administrative, accounting, operations, compliance and other services on behalf of the First Eagle High Yield Fund, and in accordance with the agreement between them, the Fund reimburses the Adviser for costs (including personnel, related overhead and other costs) related to those services. In accordance with the plan of reorganization, those reimbursements may not exceed an annual rate of 0.05% of the value of the Fund's average daily net assets. After December 31, 2013, the Fund will no longer reimburse these costs and instead will pay a fixed administrative services fee to the Adviser at an annual rate of 0.05% of the value of the Fund's average daily net assets.
The Funds have entered into Custody Agreements with State Street Bank and Trust ("SSB"). The Custody Agreements provide for an annual fee based on the amount of assets under custody plus transaction charges. SSB serves as custodian of the Funds' portfolio securities and other assets. SSB has directly entered
FIRST EAGLE FUNDS | SEMI-ANNUAL REPORT | APRIL 30, 2012
160
(continued)
into sub-custodial agreements to maintain the custody of gold bullion in the Funds. Under the terms of the Custody Agreement between the Funds and SSB, SSB maintains and deposits in separate accounts, cash, securities and other assets of the Funds. SSB is also required, upon the order of the Funds, to deliver securities held by SSB and the sub-custodian, and to make payments for securities purchased by the Funds. SSB has also entered into sub-custodian agreements with a number of foreign banks and clearing agencies, pursuant to which portfolio securities purchased outside the United States are maintained in the custody of these entities.
The Funds have also entered into an Administration Agreement with SSB, pursuant to which SSB provides certain tax-related and other administrative services. SSB, as the Funds' Administrator, receives annual fees separate from and in addition to the fees it receives for its services as the Funds' custodian.
FEF Distributors, LLC, a wholly owned subsidiary of the Advisor, serves as the Funds' principal underwriter. For the six-month period ended April 30, 2012, FEF Distributors, LLC realized $1,320,349, $162,403, $227,226, $140,221, $26,590* and $53,721, pertaining to the sales of shares of First Eagle Global Fund, First Eagle Overseas Fund, First Eagle U.S. Value Fund, First Eagle Gold Fund, First Eagle High Yield Fund and First Eagle Fund of America, respectively.
The Trust (except for First Eagle High Yield Fund) adopted a Trustee Deferred Compensation Plan, which allows the independent Trustees to defer the receipt of all or a portion of compensation related to performance of their duties as a Trustee. The deferred fees are invested in various First Eagle Funds until distribution in accordance with the Trustee Deferred Compensation Plan. As of April 30, 2012, balances to the Plan are recorded on the Statements of Assets and Liabilities.
Note 3 — Plans of Distribution
Under the terms of the Distribution Plans and Agreements ("the Plans") with FEF Distributors, LLC ("the Distributor"), pursuant to the provisions of Rule 12b-1 under the 1940 Act, the First Eagle Global Fund, First Eagle Overseas Fund, First Eagle U.S. Value Fund, First Eagle Gold Fund and First Eagle High Yield Fund pay the Distributor monthly, a distribution fee with respect to Class A and Class C shares at an annual rate of up to 0.25% and 0.75%, respectively, of each Fund's average daily net assets. In the case of
* Period from April 1, 2012 to April 30, 2012.
FIRST EAGLE FUNDS | SEMI-ANNUAL REPORT | APRIL 30, 2012
161
Notes to Financial Statements (unaudited)
First Eagle Fund of America, it pays the Distributor monthly, a distribution fee with respect to Class A, Class C and Class Y shares at an annual rate of up to 0.25%, 0.75% and 0.25%, respectively of the average daily net assets. Under the Plans, the Distributor is obligated to use the amounts received under the Plans for payments to qualifying dealers for their assistance in the distribution of a Fund's shares and the provision of shareholder services and for other expenses such as advertising costs and the payment for the printing and distribution of prospectuses to prospective investors.
The Distributor bears distribution costs of a Fund to the extent they exceed payments received under the Plan. For the six-month period ended April 30, 2012, the distribution fees incurred by the Funds are disclosed in the Statements of Operations.
The Distributor receives an annual service fee with respect to Class C at the annual rate of 0.25% of each Fund's average daily net assets, payable monthly to cover expenses incurred by the Distributor for providing shareholder liaison services, including assistance with subscriptions, redemptions and other shareholder questions. For the six-month period ended April 30, 2012, the services fees incurred by the Funds are disclosed in the Statements of Operations.
Note 4 — Purchases and Sales of Securities
During the six-month period ended April 30, 2012, the cost of purchases of investments, excluding U.S. Government and short-term securities, totaled $2,160,777,678, $524,211,809, $613,293,974, $144,265,718, $64,424,613* and $801,323,934 for First Eagle Global Fund, First Eagle Overseas Fund, First Eagle U.S. Value Fund, First Eagle Gold Fund, First Eagle High Yield Fund and First Eagle Fund of America, respectively. Proceeds from sales of investments, excluding U.S. government securities and short-term securities, totaled $1,813,974,439, $579,074,899, $221,284,740, $284,673,883, $9,727,258* and $535,407,606 for First Eagle Global Fund, First Eagle Overseas Fund, First Eagle U.S. Value Fund, First Eagle Gold Fund, First Eagle High Yield Fund and First Eagle Fund of America, respectively.
There were no purchases or sales of U.S. Government securities, excluding short-term securities, for First Eagle Global Fund, First Eagle Overseas Fund, First Eagle U.S. Value Fund, First Eagle Gold Fund, First Eagle High Yield Fund and First Eagle Fund of America.
* Period from April 1, 2012 to April 30, 2012.
FIRST EAGLE FUNDS | SEMI-ANNUAL REPORT | APRIL 30, 2012
162
(continued)
Note 5 — Line of Credit
As of October 4, 2011, the Board of Trustees approved continuing a $300 million committed, unsecured line of credit ("Credit Facility") with State Street Bank and Trust Company for the Funds, to be utilized for temporarily financing the purchase or sale of securities for prompt delivery in the ordinary course of business or for temporarily financing the redemption of shares of each Fund at the request of shareholders and other temporary or emergency purposes. Under the Credit Facility arrangement, each Fund has agreed to pay an annual commitment fee on the unused balance, allocated pro rata, based on the relative asset size of the Funds. Commitment fees related to the line of credit are paid by the Funds and are included in miscellaneous expenses in the Statements of Operations. During the six-month period ended April 30, 2012, the Funds had no borrowings under the agreement.
Note 6 — Capital Stock
At April 30, 2012, the Funds have an unlimited number of shares authorized for issuance. The Funds have the ability to issue multiple classes of shares.
FIRST EAGLE FUNDS | SEMI-ANNUAL REPORT | APRIL 30, 2012
163
Notes to Financial Statements (unaudited)
Transactions in shares of capital stock were as follows:
| | | SIX-MONTH PERIOD ENDED APRIL 30, 2012 | |
| | | FIRST EAGLE GLOBAL FUND | |
| | | CLASS A | | CLASS C | | CLASS I | |
| Shares sold | | | 36,181,138 | | | | 21,640,873 | | | | 45,530,331 | | |
Shares issued for reinvested
dividends and distributions | | | 6,802,133 | | | | 2,393,382 | | | | 3,768,498 | | |
| Shares redeemed | | | (25,440,641 | ) | | | (12,062,802 | ) | | | (18,383,657 | ) | |
| Net increase | | | 17,542,630 | | | | 11,971,453 | | | | 30,915,172 | | |
| | | YEAR ENDED OCTOBER 31, 2011 | |
| | | FIRST EAGLE GLOBAL FUND | |
| | | CLASS A | | CLASS C | | CLASS I | |
| Shares sold | | | 82,403,930 | | | | 52,534,770 | | | | 90,765,616 | | |
Shares issued for reinvested
dividends and distributions | | | 3,377,141 | | | | 815,954 | | | | 1,528,605 | | |
| Shares redeemed | | | (54,727,128 | ) | | | (20,788,828 | ) | | | (32,853,816 | ) | |
| Net increase | | | 31,053,943 | | | | 32,561,896 | | | | 59,440,405 | | |
| | | SIX-MONTH PERIOD ENDED APRIL 30, 2012 | |
| | | FIRST EAGLE GOLD FUND | |
| | | CLASS A | | CLASS C | | CLASS I | |
| Shares sold | | | 8,788,215 | | | | 2,225,776 | | | | 10,330,222 | | |
Shares issued for reinvested
dividends and distributions | | | 1,926,163 | | | | 553,127 | | | | 592,600 | | |
| Shares redeemed | | | (12,508,161 | ) | | | (2,471,803 | ) | | | (14,500,228 | ) | |
| Net increase (decrease) | | | (1,793,783 | ) | | | 307,100 | | | | (3,577,406 | ) | |
| | | YEAR ENDED OCTOBER 31, 2011 | |
| | | FIRST EAGLE GOLD FUND | |
| | | CLASS A | | CLASS C | | CLASS I | |
| Shares sold | | | 17,323,860 | | | | 5,525,002 | | | | 15,889,989 | | |
Shares issued for reinvested
dividends and distributions | | | 2,866,928 | | | | 787,656 | | | | 535,343 | | |
| Shares redeemed | | | (22,945,298 | ) | | | (4,454,411 | ) | | | (7,752,658 | ) | |
| Net increase (decrease) | | | (2,754,510 | ) | | | 1,858,247 | | | | 8,672,674 | | |
* Represents the period from April 1, 2012 to April 30, 2012.
** For the year ended March 31, 2012.
FIRST EAGLE FUNDS | SEMI-ANNUAL REPORT | APRIL 30, 2012
164
(continued)
| | | SIX-MONTH PERIOD ENDED APRIL 30, 2012 | |
| | | FIRST EAGLE OVERSEAS FUND | | FIRST EAGLE U.S. VALUE FUND | |
| | | CLASS A | | CLASS C | | CLASS I | | CLASS A | | CLASS C | | CLASS I | |
| Shares sold | | | 32,260,226 | | | | 4,001,086 | | | | 41,188,998 | | | | 22,231,566 | | | | 8,856,480 | | | | 18,376,474 | | |
Shares issued for reinvested
dividends and distributions | | | 10,323,750 | | | | 1,491,162 | | | | 7,558,176 | | | | 1,938,704 | | | | 561,949 | | | | 995,161 | | |
| Shares redeemed | | | (31,482,196 | ) | | | (4,859,007 | ) | | | (28,753,249 | ) | | | (6,430,846 | ) | | | (1,772,640 | ) | | | (5,022,640 | ) | |
| Net increase | | | 11,101,780 | | | | 633,241 | | | | 19,993,925 | | | | 17,739,424 | | | | 7,645,789 | | | | 14,348,995 | | |
| | | YEAR ENDED OCTOBER 31, 2011 | |
| | | FIRST EAGLE OVERSEAS FUND | | FIRST EAGLE U.S. VALUE FUND | |
| | | CLASS A | | CLASS C | | CLASS I | | CLASS A | | CLASS C | | CLASS I | |
| Shares sold | | | 75,564,814 | | | | 11,307,075 | | | | 75,710,003 | | | | 25,183,381 | | | | 7,044,675 | | | | 17,859,980 | | |
Shares issued for reinvested
dividends and distributions | | | 4,608,501 | | | | 588,534 | | | | 3,075,256 | | | | 770,417 | | | | 204,916 | | | | 335,285 | | |
| Shares redeemed | | | (68,356,763 | ) | | | (7,372,637 | ) | | | (43,825,884 | ) | | | (12,196,811 | ) | | | (3,452,371 | ) | | | (7,453,323 | ) | |
| Net increase | | | 11,816,552 | | | | 4,522,972 | | | | 34,959,375 | | | | 13,756,987 | | | | 3,797,220 | | | | 10,741,942 | | |
| | | SIX-MONTH PERIOD ENDED APRIL 30, 2012 | |
| | | FIRST EAGLE HIGH YIELD FUND* | | FIRST EAGLE FUND OF AMERICA | |
| | | CLASS A | | CLASS C | | CLASS I | | CLASS A | | CLASS C | | CLASS Y | |
| Shares sold | | | 4,136,107 | | | | 1,438,043 | | | | 2,513,877 | | | | 3,900,296 | | | | 1,502,267 | | | | 1,083,834 | | |
Shares issued for reinvested
dividends and distributions | | | 35,299 | | | | 11,993 | | | | 59,864 | | | | 1,591,288 | | | | 631,705 | | | | 1,733,825 | | |
| Shares redeemed | | | (127,320 | ) | | | (8,710 | ) | | | (97,836 | ) | | | (3,202,051 | ) | | | (894,256 | ) | | | (2,265,531 | ) | |
| Net increase (decrease) | | | 4,044,086 | | | | 1,441,326 | | | | 2,475,905 | | | | 2,289,533 | | | | 1,239,716 | | | | 552,128 | | |
| | | YEAR ENDED OCTOBER 31, 2011 | |
| | | FIRST EAGLE HIGH YIELD FUND** | | FIRST EAGLE FUND OF AMERICA | |
| | | CLASS A | | CLASS C | | CLASS I | | CLASS A | | CLASS C | | CLASS Y | |
| Shares sold | | | 6,568,153 | | | | 2,846,517 | | | | 11,573,817 | | | | 11,550,839 | | | | 4,179,170 | | | | 4,218,795 | | |
Shares issued for reinvested
dividends and distributions | | | 25,393 | | | | 9,640 | | | | 222,218 | | | | 91,034 | | | | 8,600 | | | | 142,915 | | |
| Shares redeemed | | | (395,841 | ) | | | (15,606 | ) | | | (1,108,713 | ) | | | (5,339,481 | ) | | | (1,096,383 | ) | | | (3,858,781 | ) | |
| Net increase (decrease) | | | 6,197,705 | | | | 2,840,551 | | | | 10,687,322 | | | | 6,302,392 | | | | 3,091,387 | | | | 502,929 | | |
FIRST EAGLE FUNDS | SEMI-ANNUAL REPORT | APRIL 30, 2012
165
Notes to Financial Statements (unaudited)
Transactions in dollars of capital stock were as follows:
| | | SIX-MONTH PERIOD ENDED APRIL 30, 2012 | |
| | | FIRST EAGLE GLOBAL FUND | |
| | | CLASS A | | CLASS C | | CLASS I | |
| Shares sold | | $ | 1,705,680,390 | | | $ | 1,002,226,289 | | | $ | 2,153,664,727 | | |
Shares issued for reinvested
dividends and distributions | | | 302,626,928 | | | | 104,854,067 | | | | 168,225,738 | | |
| Shares redeemed | | | (1,195,649,510 | ) | | | (557,903,639 | ) | | | (864,633,898 | ) | |
| Net increase | | $ | 812,657,808 | | | $ | 549,176,717 | | | $ | 1,457,256,567 | | |
| | | YEAR ENDED OCTOBER 31, 2011 | |
| | | FIRST EAGLE GLOBAL FUND | |
| | | CLASS A | | CLASS C | | CLASS I | |
| Shares sold | | $ | 3,869,277,750 | | | $ | 2,425,639,817 | | | $ | 4,254,961,876 | | |
Shares issued for reinvested
dividends and distributions | | | 154,537,968 | | | | 36,791,366 | | | | 70,178,270 | | |
| Shares redeemed | | | (2,551,569,341 | ) | | | (955,493,361 | ) | | | (1,532,877,172 | ) | |
| Net increase | | $ | 1,472,246,377 | | | $ | 1,506,937,822 | | | $ | 2,792,262,974 | | |
| | | SIX-MONTH PERIOD ENDED APRIL 30, 2012 | |
| | | FIRST EAGLE U.S. VALUE FUND | |
| | | CLASS A | | CLASS C | | CLASS I | |
| Shares sold | | $ | 383,895,479 | | | $ | 151,347,849 | | | $ | 319,755,422 | | |
Shares issued for reinvested
dividends and distributions | | | 31,581,487 | | | | 9,092,330 | | | | 16,390,304 | | |
| Shares redeemed | | | (111,771,838 | ) | | | (30,498,173 | ) | | | (88,006,535 | ) | |
| Net increase (decrease) | | $ | 303,705,128 | | | $ | 129,942,006 | | | $ | 248,139,191 | | |
| | | YEAR ENDED OCTOBER 31, 2011 | |
| | | FIRST EAGLE U.S. VALUE FUND | |
| | | CLASS A | | CLASS C | | CLASS I | |
| Shares sold | | $ | 422,499,567 | | | $ | 117,098,665 | | | $ | 302,544,849 | | |
Shares issued for reinvested
dividends and distributions | | | 12,519,282 | | | | 3,309,400 | | | | 5,502,028 | | |
| Shares redeemed | | | (203,499,149 | ) | | | (57,256,894 | ) | | | (124,562,916 | ) | |
| Net increase (decrease) | | $ | 231,519,700 | | | $ | 63,151,171 | | | $ | 183,483,961 | | |
* Represents the period from April 1, 2012 to April 30, 2012.
** For the year ended March 31, 2012.
FIRST EAGLE FUNDS | SEMI-ANNUAL REPORT | APRIL 30, 2012
166
(continued)
| | | SIX-MONTH PERIOD ENDED APRIL 30, 2012 | |
| | | FIRST EAGLE OVERSEAS FUND | |
| | | CLASS A | | CLASS C | | CLASS I | |
| Shares sold | | $ | 692,386,651 | | | $ | 83,441,789 | | | $ | 897,021,063 | | |
Shares issued for reinvested
dividends and distributions | | | 209,262,506 | | | | 29,554,809 | | | | 155,396,107 | | |
| Shares redeemed | | | (673,330,443 | ) | | | (101,360,105 | ) | | | (620,454,155 | ) | |
| Net increase | | $ | 228,318,714 | | | $ | 11,636,493 | | | $ | 431,963,015 | | |
| | | YEAR ENDED OCTOBER 31, 2011 | |
| | | FIRST EAGLE OVERSEAS FUND | |
| | | CLASS A | | CLASS C | | CLASS I | |
| Shares sold | | $ | 1,715,966,975 | | | $ | 250,653,639 | | | $ | 1,744,387,109 | | |
Shares issued for reinvested
dividends and distributions | | | 102,262,633 | | | | 12,771,196 | | | | 69,224,009 | | |
| Shares redeemed | | | (1,545,390,214 | ) | | | (162,706,611 | ) | | | (1,005,497,700 | ) | |
| Net increase | | $ | 272,839,394 | | | $ | 100,718,224 | | | $ | 808,113,418 | | |
| | | SIX-MONTH PERIOD ENDED APRIL 30, 2012 | |
| | | FIRST EAGLE GOLD FUND | | FIRST EAGLE HIGH YIELD FUND* | |
| | | CLASS A | | CLASS C | | CLASS I | | CLASS A | | CLASS C | | CLASS I | |
| Shares sold | | $ | 269,398,143 | | | $ | 66,094,908 | | | $ | 311,581,606 | | | $ | 40,159,389 | | | $ | 13,962,214 | | | $ | 24,427,023 | | |
Shares issued for reinvested
dividends and distributions | | | 58,150,878 | | | | 16,234,284 | | | | 18,086,151 | | | | 344,874 | | | | 117,051 | | | | 584,872 | | |
| Shares redeemed | | | (372,402,428 | ) | | | (71,682,427 | ) | | | (419,664,481 | ) | | | (1,237,256 | ) | | | (84,464 | ) | | | (950,834 | ) | |
| Net increase (decrease) | | $ | (44,853,407 | ) | | $ | 10,646,765 | | | $ | (89,996,724 | ) | | $ | 39,267,007 | | | $ | 13,994,801 | | | $ | 24,061,061 | | |
| | | YEAR ENDED OCTOBER 31, 2011 | |
| | | FIRST EAGLE GOLD FUND | | FIRST EAGLE HIGH YIELD FUND** | |
| | | CLASS A | | CLASS C | | CLASS I | | CLASS A | | CLASS C | | CLASS I | |
| Shares sold | | $ | 584,552,778 | | | $ | 181,475,181 | | | $ | 536,860,176 | | | $ | 63,546,710 | | | $ | 27,547,011 | | | $ | 111,401,833 | | |
Shares issued for reinvested
dividends and distributions | | | 94,379,255 | | | | 25,236,503 | | | | 17,810,847 | | | | 247,405 | | | | 93,837 | | | | 2,139,752 | | |
| Shares redeemed | | | (765,827,714 | ) | | | (143,628,830 | ) | | | (265,774,260 | ) | | | (3,817,412 | ) | | | (151,895 | ) | | | (10,598,096 | ) | |
| Net increase (decrease) | | $ | (86,895,681 | ) | | $ | 63,082,854 | | | $ | 288,896,763 | | | $ | 59,976,703 | | | $ | 27,488,953 | | | $ | 102,943,489 | | |
FIRST EAGLE FUNDS | SEMI-ANNUAL REPORT | APRIL 30, 2012
167
Notes to Financial Statements (unaudited)
| | | SIX-MONTH PERIOD ENDED APRIL 30, 2012 | |
| | | FIRST EAGLE FUND OF AMERICA | |
| | | CLASS A | | CLASS C | | CLASS Y | |
| Shares sold | | $ | 97,387,333 | | | $ | 32,594,298 | | | $ | 27,615,676 | | |
Shares issued for reinvested
dividends and distributions | | | 36,154,068 | | | | 12,533,028 | | | | 40,138,059 | | |
| Shares redeemed | | | (79,454,388 | ) | | | (19,398,538 | ) | | | (57,519,172 | ) | |
| Net increase | | $ | 54,087,013 | | | $ | 25,728,788 | | | $ | 10,234,563 | | |
| | | YEAR ENDED OCTOBER 31, 2011 | |
| | | FIRST EAGLE FUND OF AMERICA | |
| | | CLASS A | | CLASS C | | CLASS Y | |
| Shares sold | | $ | 302,143,282 | | | $ | 97,792,197 | | | $ | 112,972,787 | | |
Shares issued for reinvested
dividends and distributions | | | 2,298,611 | | | | 193,070 | | | | 3,671,493 | | |
| Shares redeemed | | | (135,242,015 | ) | | | (24,843,434 | ) | | | (99,366,357 | ) | |
| Net increase | | $ | 169,199,878 | | | $ | 73,141,833 | | | $ | 17,277,923 | | |
Note 7 — Indemnification and Investment Risk
In the normal course of business, the Funds enter into contracts that contain a variety of representations which provide general indemnifications. Each Fund's maximum exposure under these arrangements is unknown, as this would involve future claims that may be made against each Fund that have not yet occurred. However, based on experience, the Funds expect the risk of loss to be remote. The Funds may have elements of risk not typically associated with investments in the United States of America due to their investments in foreign countries or regions. Such foreign investments may subject the Funds to additional risks resulting from political or economic conditions in such countries or regions and the possible imposition of adverse governmental laws or currency exchange restrictions could cause the securities and their markets to be less liquid and their prices to be more volatile than those of comparable U.S. securities. The securities markets in many emerging-market countries are substantially smaller, less developed, less liquid and more volatile than the securities markets of developed countries.
The First Eagle High Yield Fund invests in high yield securities which may be subject to greater levels of interest rate, credit and liquidity risk than investment
FIRST EAGLE FUNDS | SEMI-ANNUAL REPORT | APRIL 30, 2012
168
(continued)
grade securities. These high yield securities may be considered speculative with respect to the issuer's continuing ability to make principal and interest payments and may be subject to significant price fluctuations.
The Funds are subject to interest rate and credit risk. The value of debt securities may decline as interest rates increase. The Funds could lose money if the issuer of a fixed income security is unable to pay interest or repay principal when it is due. The ability of the issuers of debt to meet their obligations may be affected by the economic and political developments in a specific industry or region.
The Funds enter into derivatives which may represent off-balance sheet risk. Off-balance sheet risk exists when the maximum potential loss on a particular investment is greater than the value of such investment as reflected in the statement of assets and liabilities.
Note 8 — Redemption In-Kind Transactions
The redemption in-kind policy for all of the Funds reserves the right of the Funds to pay redemptions in-kind (i.e., payments in the form of marketable securities or, as needed, other traded assets, rather than cash) if the redemption request is large enough to affect a Fund's operations (for example, if it represents more than $250,000 or 1% of the Fund's assets). When receiving assets distributed in-kind, the recipient will bear applicable commissions or other costs on their sale. There were no redemptions in-kind as of April 30, 2012.
Note 9 — Subsequent Events
In accordance with the provision surrounding Subsequent Events adopted by the Funds, management has evaluated the possibility of subsequent events existing in the Funds' financial statements. Management has determined that there are no material events that would require disclosures in the Funds' financial statements.
FIRST EAGLE FUNDS | SEMI-ANNUAL REPORT | APRIL 30, 2012
169
Fund Expenses (unaudited)
Example
As a shareholder of the First Eagle Funds, you may incur two types of costs: (1) transaction costs, including front-end and contingent deferred sales charges (loads), and (2) ongoing costs, including advisory fees; distribution fees (12b-1) and/or service fees; and other Fund expenses. This Example is intended to help you understand your ongoing costs (in dollars) of investing in the Funds and to compare these costs with the ongoing costs of investing in other mutual funds.
This Example is based on an investment of $1,000 invested on November 1, 2011 and held for the six-months ended April 30, 2012.
Actual Expenses
The table below titled "Based on Actual Total Return" provides information about actual account values and actual expenses. You may use the information provided in this table, together with the amount you invested, to estimate the expenses that you paid over the period. To estimate the expenses you paid on your account, divide your ending account value by $1,000 (for example, an $8,600 ending account value divided by $1,000 = 8.6), then multiply the result by the number under the heading entitled "Expenses Paid During the Period".
FIRST EAGLE FUNDS | SEMI-ANNUAL REPORT | APRIL 30, 2012
170
(continued)
Based on Actual Total Return1
| | | ACTUAL TOTAL
RETURN
WITHOUT
SALES CHARGES2 | | BEGINNING
ACCOUNT
VALUE | | ENDING
ACCOUNT
VALUE | | ANNUALIZED
EXPENSE
RATIO | | EXPENSES
PAID
DURING THE
PERIOD3 | |
| First Eagle Global Fund | |
| Class A | | | 5.55 | % | | $ | 1,000.00 | | | $ | 1,055.50 | | | | 1.13 | % | | $ | 5.78 | | |
| Class C | | | 5.14 | | | | 1,000.00 | | | | 1,051.40 | | | | 1.88 | | | | 9.59 | | |
| Class I | | | 5.68 | | | | 1,000.00 | | | | 1,056.80 | | | | 0.88 | | | | 4.50 | | |
| First Eagle Overseas Fund | |
| Class A | | | 2.75 | | | | 1,000.00 | | | | 1,027.50 | | | | 1.17 | | | | 5.90 | | |
| Class C | | | 2.40 | | | | 1,000.00 | | | | 1,024.00 | | | | 1.92 | | | | 9.66 | | |
| Class I | | | 2.89 | | | | 1,000.00 | | | | 1,028.90 | | | | 0.92 | | | | 4.64 | | |
| First Eagle U.S. Value Fund | |
| Class A | | | 8.02 | | | | 1,000.00 | | | | 1,080.20 | | | | 1.14 | | | | 5.90 | | |
| Class C | | | 7.61 | | | | 1,000.00 | | | | 1,076.10 | | | | 1.89 | | | | 9.76 | | |
| Class I | | | 8.16 | | | | 1,000.00 | | | | 1,081.60 | | | | 0.89 | | | | 4.61 | | |
| First Eagle Gold Fund Consolidated | |
| Class A | | | –16.66 | | | | 1,000.00 | | | | 833.40 | | | | 1.20 | | | | 5.47 | | |
| Class C | | | –16.98 | | | | 1,000.00 | | | | 830.20 | | | | 1.95 | | | | 8.87 | | |
| Class I | | | –16.57 | | | | 1,000.00 | | | | 834.30 | | | | 0.95 | | | | 4.33 | | |
| First Eagle High Yield Fund | |
| Class A | | | 0.72 | | | | 1,000.00 | | | | 1,007.20 | | | | 1.01 | | | | 0.834 | | |
| Class C | | | 0.66 | | | | 1,000.00 | | | | 1,006.60 | | | | 1.76 | | | | 1.454 | | |
| Class I | | | 0.75 | | | | 1,000.00 | | | | 1,007.50 | | | | 0.80 | | | | 0.664 | | |
| First Eagle Fund of America | |
| Class A | | | 14.51 | | | | 1,000.00 | | | | 1,145.10 | | | | 1.44 | | | | 7.68 | | |
| Class C | | | 14.08 | | | | 1,000.00 | | | | 1,140.80 | | | | 2.19 | | | | 11.66 | | |
| Class Y | | | 14.54 | | | | 1,000.00 | | | | 1,145.40 | | | | 1.44 | | | | 7.68 | | |
1 For the six-months ended April 30, 2012.
2 Past performance does not guarantee future results. Assumes reinvestment of all dividends and capital gain distributions, if any, at net asset value and does not reflect the deduction of the applicable sales charge, exchange fees or redemption fees. Had the effect of sales charges been reflected, expenses would have been higher and returns lower. Total return is not annualized, as it may not be representative of the total return for the year.
3 Expenses are equal to the annualized expense ratio multiplied by the average account value over the period, multiplied by 182/366 (to reflect the one-half year period).
4 Expenses are equal to the annualized expense ratio multiplied by the average account value over the period, multiplied by 30/366 (to reflect the actual days in the period).
FIRST EAGLE FUNDS | SEMI-ANNUAL REPORT | APRIL 30, 2012
171
Fund Expenses (unaudited)
Hypothetical Example for Comparison Purposes
The table below titled "Based on Hypothetical Total Return" provides information about hypothetical account values and hypothetical expenses based on the actual expense ratios and an assumed rate of return of 5% per year before expenses, which is not the First Eagle Funds' actual return. The hypothetical account values and expenses may not be used to estimate the actual ending account balance or expenses you paid for the period. You may use the information provided in this table to compare the ongoing costs of investing in the Funds and other funds. To do so, compare the 5% hypothetical example relating to the Funds with the 5% hypothetical examples that appear in the shareholder reports of other funds.
This Example is based on an investment of $1,000 invested on November 1, 2011 and held for the six-months ended April 30, 2012.
Please note that the expenses shown in the table below are meant to highlight your ongoing costs only and do not reflect any transactional costs, such as front-end or back-end sales charges (loads). Therefore, the table is useful in comparing ongoing costs only, and will not help you determine the relative total costs of owning different funds. In addition, if these transaction costs were included, your costs would have been higher.
FIRST EAGLE FUNDS | SEMI-ANNUAL REPORT | APRIL 30, 2012
172
(continued)
Based on Hypothetical Total Return1
| | | HYPOTHETICAL
ANNUALIZED
TOTAL
RETURN | | BEGINNING
ACCOUNT
VALUE | | ENDING
ACCOUNT
VALUE | | ANNUALIZED
EXPENSE
RATIO | | EXPENSES
PAID
DURING THE
PERIOD2 | |
| First Eagle Global Fund | |
| Class A | | | 5.00 | % | | $ | 1,000.00 | | | $ | 1,019.24 | | | | 1.13 | % | | $ | 5.67 | | |
| Class C | | | 5.00 | | | | 1,000.00 | | | | 1,015.51 | | | | 1.88 | | | | 9.42 | | |
| Class I | | | 5.00 | | | | 1,000.00 | | | | 1,020.49 | | | | 0.88 | | | | 4.42 | | |
| First Eagle Overseas Fund | |
| Class A | | | 5.00 | | | | 1,000.00 | | | | 1,019.05 | | | | 1.17 | | | | 5.87 | | |
| Class C | | | 5.00 | | | | 1,000.00 | | | | 1,015.32 | | | | 1.92 | | | | 9.62 | | |
| Class I | | | 5.00 | | | | 1,000.00 | | | | 1,020.29 | | | | 0.92 | | | | 4.62 | | |
| First Eagle U.S. Value Fund | |
| Class A | | | 5.00 | | | | 1,000.00 | | | | 1,019.19 | | | | 1.14 | | | | 5.72 | | |
| Class C | | | 5.00 | | | | 1,000.00 | | | | 1,015.47 | | | | 1.89 | | | | 9.47 | | |
| Class I | | | 5.00 | | | | 1,000.00 | | | | 1,020.44 | | | | 0.89 | | | | 4.47 | | |
| First Eagle Gold Fund Consolidated | |
| Class A | | | 5.00 | | | | 1,000.00 | | | | 1,018.90 | | | | 1.20 | | | | 6.02 | | |
| Class C | | | 5.00 | | | | 1,000.00 | | | | 1,015.17 | | | | 1.95 | | | | 9.77 | | |
| Class I | | | 5.00 | | | | 1,000.00 | | | | 1,020.14 | | | | 0.95 | | | | 4.77 | | |
| First Eagle High Yield Fund | |
| Class A | | | 5.00 | | | | 1,000.00 | | | | 1,003.27 | | | | 1.01 | | | | 0.833 | | |
| Class C | | | 5.00 | | | | 1,000.00 | | | | 1,002.66 | | | | 1.76 | | | | 1.443 | | |
| Class I | | | 5.00 | | | | 1,000.00 | | | | 1,003.44 | | | | 0.80 | | | | 0.663 | | |
| First Eagle Fund of America | |
| Class A | | | 5.00 | | | | 1,000.00 | | | | 1,017.70 | | | | 1.44 | | | | 7.22 | | |
| Class C | | | 5.00 | | | | 1,000.00 | | | | 1,013.97 | | | | 2.19 | | | | 10.97 | | |
| Class Y | | | 5.00 | | | | 1,000.00 | | | | 1,017.70 | | | | 1.44 | | | | 7.22 | | |
1 For the six-months ended April 30, 2012.
2 Expenses are equal to the annualized expense ratio multiplied by the average account value over the period, multiplied by 182/366 (to reflect the one-half year period).
3 Expenses are equal to the annualized expense ratio multiplied by the average account value over the period, multiplied by 30/366 (to reflect the actual days in the period).
FIRST EAGLE FUNDS | SEMI-ANNUAL REPORT | APRIL 30, 2012
173
General Information
Quarterly Form N-Q portfolio schedule
The First Eagle Funds file their complete schedule of portfolio holdings with the Securities and Exchange Commission ("SEC") for the first and third quarters of each fiscal year on Form N-Q. The Funds' Forms N-Q are available on the SEC's Web site at www.sec.gov. The Funds' Forms N-Q may be reviewed and copied at the SEC's Public Reference Room in Washington, D.C. Information on the operation of the SEC's Public Reference Room may be obtained by calling 1.800.SEC.0330. Additionally, you may obtain copies of Forms N-Q from the Funds upon request by calling 1.800.334.2143.
Proxy voting policies, procedures and record
You may obtain a description of the Funds' (1) proxy voting policies, (2) proxy voting procedures and (3) information regarding how the Funds voted any proxies related to portfolio securities during the most recent twelve-month period ended June 30 for which an SEC filing has been made, without charge, upon request by contacting the Funds directly at 1.800.334.2143 or on the EDGAR Database on the SEC's Web site at www.sec.gov.
FIRST EAGLE FUNDS | SEMI-ANNUAL REPORT | APRIL 30, 2012
174
Consideration of Investment Advisory Agreements
On December 22, 1999, the shareholders of the Global Fund, the Overseas Fund and the Gold Fund, and on August 31, 2001, the shareholders of the U.S. Value Fund approved the Advisory Agreement between the Trust and the Adviser applicable to those Funds. On December 10, 2002, the shareholders of the Fund of America approved the Advisory Agreement between the Trust and the Adviser applicable to that Fund. The Board of Trustees approved these Advisory Agreements most recently on December 13, 2011.
During the course of their most recent review, the Trustees covered the following, among other topics:
• The Trustees reviewed each Fund's long-standing historical relationship with the Adviser and the institutional resources available to the Adviser.
• The Trustees reviewed the performance of each Fund on both an absolute and a relative basis. Significant short-term and long-term outperformance (over most periods reviewed) was noted for all Funds relative to the Funds' benchmarks, to the performance of peer mutual funds and to Morningstar, Lipper and similar composites. Performance for each Fund was determined to be excellent given its returns relative to benchmarks and peers (looking to medium- and longer-term returns only in the case of Fund of America).
• The Trustees reviewed the total compensation to be received by the Adviser and the Funds' total cost for using the Adviser's services, taking into account expenses incurred by the Adviser that are passed through to the Funds. They concluded that this compensation was commensurate with the nature, extent, and quality of the services provided and therefore reasonable under the circumstances. As part of their analysis, the Trustees considered competitive prices for services comparable to those provided by the Adviser. In doing so, they considered fees charged by investment advisers to peer mutual funds and determined that the Adviser's fees were competitive, as each Fund's net management fee, except that of the Fund of America, was generally similar to or lower than its reviewed peer group average and peer group median. After noting that Fund of America's net management fee was higher than any of its reviewed peers, the Trustees determined that the fee was justified by the superior service record, consistent long-term performance, and management team stability achieved. The Trustees also considered the advisory fees charged to institutional clients of the Adviser, taking into consideration the differing requirements of such clients. While analyzing the effects of indirect
FIRST EAGLE FUNDS | SEMI-ANNUAL REPORT | APRIL 30, 2012
175
Consideration of Investment Advisory Agreements (continued)
compensation to the Adviser, such as soft dollar and other service benefits, the Trustees noted the generally low levels of soft dollars and absence of affiliated broker-dealer relationships.
• The Trustees' reviewed the Funds' expense ratios, which were deemed reasonable both on an absolute basis and in comparison to peer funds. The Trustees discussed the impact of the advisory fee on the ratio of total expenses to total assets and noted that the Funds' expense ratios decreased over several years as the Funds grew, highlighting a benefit to shareholders resulting from the development of economies of scale in the operation of the Funds. The Trustees also noted however, that expense ratios for each of the Funds had decreased over the prior fiscal year, after generally experiencing increases over the last two years. All changes in the expense ratios during those two periods were viewed as modest. The Trustees also considered the effect on expense ratios of Fund asset size and of particular categories of expenses, both currently and relative to prior periods.
• The Trustees' reviewed the Adviser's financial condition and profitability. They commented that profits appear healthy and that the Adviser has always shown the willingness to commit resources to support investment in the business. The Trustees noted the effect of particular categories of expenses, including compensation, on the Adviser's financial condition.
At the conclusion of their review, with no single factor being determinative, the Trustees determined that the Advisory Agreements serve the interests of the Funds and their shareholders and should be continued.
FIRST EAGLE FUNDS | SEMI-ANNUAL REPORT | APRIL 30, 2012
176
First Eagle Funds
Trustees
Lisa Anderson
John P. Arnhold
Candace K. Beinecke (Chair)
Jean-Marie Eveillard
Jean D. Hamilton
James E. Jordan
William M. Kelly
Paul J. Lawler
Officers
John P. Arnhold
President
Robert Bruno
Senior Vice President
Joseph T. Malone
Chief Financial Officer
Mark D. Goldstein
Chief Compliance Officer
Suzan J. Afifi
Secretary & Vice President
Philip Santopadre
Treasurer
Michael Luzzatto
Vice President
Meng Lam
Assistant Treasurer
Investment Adviser
First Eagle Investment Management, LLC
1345 Avenue of the Americas
New York, NY 10105
Legal Counsel
Shearman & Sterling LLP
599 Lexington Avenue
New York, NY 10022
Custodian
State Street Bank and Trust Company
801 Pennsylvania Avenue
Kansas City, MO 64105
Shareholder Servicing Agent
DST Systems, Inc.
330 West 9th Street
Kansas City, MO 64105
800.334.2143
Underwriter
FEF Distributors, LLC
1345 Avenue of the Americas
New York, NY 10105
Independent Registered
Public Accounting Firm
PricewaterhouseCoopers LLP
300 Madison Avenue
New York, NY 10017
This report is not authorized for distribution to prospective investors unless preceded or accompanied by a currently effective prospectus of First Eagle Funds.
FIRST EAGLE FUNDS | SEMI-ANNUAL REPORT | APRIL 30, 2012
177
This page was intentionally left blank.
1345 Avenue of the Americas | New York, NY | 10105
800.334.2143 | firsteaglefunds.com

Item 2. Code of Ethics.
The Registrant has adopted a code of ethics that applies to its principal executive officer and principal financial officer. Copies of the code of ethics may be requested free of charge by calling 1-800-334-2143 (toll free).
Item 3. Audit Committee Financial Expert.
Not applicable to this semi-annual report.
Item 4. Principal Accountant Fees and Services
Not applicable to this semi-annual report.
Item 5. Audit Committee of Listed Registrants
Not applicable at this time.
Item 6. Schedule of Investments.
Please see schedule of investments contained in the Report to Stockholders included under Item 1 of this Form N-CSR.
Item 7. Disclosure of Proxy Voting Policies and Procedures for Closed-End Management Investment Companies.
Not applicable at this time.
Item 8. Portfolio Managers of Closed-End Management Investment Companies.
Not applicable at this time.
Item 9. Purchases of Equity Securities by Close-End Management Investment Company and Affiliated Purchasers.
Not applicable at this time.
Item 10. Submission of Matters to a Vote of Security Holders.
Not applicable at this time.
Item 11. Controls and Procedures.
(a) In the opinion of the principal executive officer and principal financial officer, based on their evaluation, the registrant’s disclosure controls and procedures are adequately designed and are operating effectively to ensure (i) that material information relating to the registrant, including its consolidated subsidiaries, is made known to them by others within those entities, particularly during the period in which this report is being prepared; and (ii) that
information required to be disclosed by the registrant on Form N-CSR is recorded, processed, summarized and reported within the time periods specified in the Securities and Exchange Commission’s rules and forms.
(b) There were no changes in the registrant’s internal control over financial reporting that occurred during the registrant’s most recent fiscal half-year (the registrant’s second fiscal half-year in the case of an annual report) that have materially affected or are reasonably likely to materially affect, the registrant’s internal control over financial reporting.
Item 12. Exhibits.
(a)(1) Not applicable to this semi-annual report.
(a)(2) Certifications pursuant to Rule 30a-2(a) under the Investment Company Act of 1940 (17 CFR 270.30a-2(a)): Attached hereto.
(a)(3) Not applicable.
(b) Certification pursuant to Rule 30a-2(b) under the Investment Company Act of 1940 (17 CFR 270.30a-2(b)): Attached hereto.
SIGNATURES
Pursuant to the requirements of the Securities Exchange Act of 1934 and the Investment Company Act of 1940, the registrant has duly caused this report to be signed on its behalf by the undersigned, thereunto duly authorized.
(Registrant) | First Eagle Funds |
| |
By (Signature and Title)* | /s/ John P. Arnhold |
| |
| John P. Arnhold, President |
Date: July 3, 2012
Pursuant to the requirements of the Securities Exchange Act of 1934 and the Investment Company Act of 1940, this report has been signed below by the following persons on behalf of the registrant and in the capacities and on the dates indicated.
By (Signature and Title)* | /s/ John P. Arnhold |
| |
| John P. Arnhold, Principal Executive Officer |
Date: July 3, 2012
By (Signature and Title)* | /s/ Joseph T. Malone |
| |
| Joseph T. Malone, Principal Financial Officer |
Date: July 3, 2012
* Print the name and title of each signing officer under his or her signature.