UNITED STATES
SECURITIES AND EXCHANGE COMMISSION
Washington, D.C. 20549
FORM N-CSR
CERTIFIED SHAREHOLDER REPORT OF REGISTERED
MANAGEMENT INVESTMENT COMPANIES
|
| | | | | | |
| Investment Company Act file number | 811-07820 |
| | |
| AMERICAN CENTURY CAPITAL PORTFOLIOS, INC. |
| (Exact name of registrant as specified in charter) |
| | |
| 4500 MAIN STREET, KANSAS CITY, MISSOURI | 64111 |
| (Address of principal executive offices) | (Zip Code) |
| | |
CHARLES A. ETHERINGTON 4500 MAIN STREET, KANSAS CITY, MISSOURI 64111 |
| (Name and address of agent for service) |
| | |
| Registrant’s telephone number, including area code: | 816-531-5575 |
| | |
| Date of fiscal year end: | 03-31 |
| | |
| Date of reporting period: | 03-31-2014 |
ITEM 1. REPORTS TO STOCKHOLDERS.
|
| |
ANNUAL REPORT | MARCH 31, 2014 |
Equity Income Fund
|
| |
| President’s Letter | |
| Performance | |
| Portfolio Commentary | |
| Fund Characteristics | |
| Shareholder Fee Example | |
| Schedule of Investments | |
| Statement of Assets and Liabilities | |
| Statement of Operations | |
| Statement of Changes in Net Assets | |
| Notes to Financial Statements | |
| Financial Highlights | |
| Report of Independent Registered Public Accounting Firm | |
| Management | |
| Additional Information | |
Any opinions expressed in this report reflect those of the author as of the date of the report, and do not necessarily represent the opinions of American Century Investments® or any other person in the American Century Investments organization. Any such opinions are subject to change at any time based upon market or other conditions and American Century Investments disclaims any responsibility to update such opinions. These opinions may not be relied upon as investment advice and, because investment decisions made by American Century Investments funds are based on numerous factors, may not be relied upon as an indication of trading intent on behalf of any American Century Investments fund. Security examples are used for representational purposes only and are not intended as recommendations to purchase or sell securities. Performance information for comparative indices and securities is provided to American Century Investments by third party vendors. To the best of American Century Investments’ knowledge, such information is accurate at the time of printing.
|
| |
| Dear Investor:
Thank you for reviewing this annual report for the 12 months ended March 31, 2014. It provides investment performance, market analysis, and portfolio information, presented with the expert perspective of our portfolio management team.
Annual reports remain important vehicles for conveying information about fund returns, including key factors that affected fund performance. For additional, updated investment and market insights, we encourage you to visit our website, americancentury.com.
|
| Jonathan Thomas |
Monetary Policy-Driven, Mostly “Risk-On” Results in the U.S. and Europe
Stimulative monetary policies and expectations of economic improvement helped drive financial market returns during the reporting period. We believe the combination of optimism about the economy, low costs of capital in the money markets, and central bank purchases of longer-maturity fixed income securities (quantitative easing, or QE) helped persuade investors to seek risk and yield, especially in the U.S. and Europe. Stock index returns were strong in these markets, particularly at the smaller capitalization end of the company size spectrum. The MSCI Europe and S&P 500 Indices advanced 24.50% and 21.86%, respectively, and their smaller capitalization counterparts performed even better. In the U.S., growth stocks generally outperformed value stocks.
Some of the same growth and optimism factors that drove stocks higher, plus hints that QE tapering would begin in the U.S., hampered U.S. government bond returns, which dipped into negative territory for the reporting period. On the other hand, U.S. corporate bonds, especially high-yield corporates, posted mostly positive returns because of their higher yields, declining spreads (yield differences between corporate and similar-maturity U.S. Treasury securities), and relatively low default rates. At the other end of the U.S. bond spectrum, Treasury inflation-protected securities (TIPS) underperformed, hurt by the combination of rising yields and low inflation.
Looking ahead, we see further signs of economic improvement for the U.S. in 2014, but headwinds persist. Interest rates could normalize further, and economic growth and U.S. employment levels remain subpar compared with past post-recession periods. In this environment, we continue to believe in a disciplined, diversified, long-term investment approach, using professionally managed stock and bond portfolios—as appropriate—for meeting financial goals. We appreciate your continued trust in us.
Sincerely,
Jonathan Thomas
President and Chief Executive Officer
American Century Investments
|
| | | | | | |
| Total Returns as of March 31, 2014 |
| | | | Average Annual Returns | |
| | Ticker Symbol | 1 year | 5 years | 10 years | Since Inception | Inception Date |
| Investor Class | TWEIX | 13.64% | 14.88% | 7.22% | 10.84% | 8/1/94 |
| Russell 3000 Value Index | – | 21.65% | 21.87% | 7.61% | 10.07%(1) | – |
| S&P 500 Index | – | 21.86% | 21.14% | 7.41% | 9.50%(1) | – |
| Institutional Class | ACIIX | 13.85% | 15.13% | 7.43% | 8.44% | 7/8/98 |
A Class(2) | TWEAX | | | | | 3/7/97 |
| No sales charge* | | 13.36% | 14.59% | 6.95% | 9.02% | |
| With sales charge* | | 6.80% | 13.24% | 6.32% | 8.64% | |
| B Class | AEKBX | | | | | 9/28/07 |
| No sales charge* | | 12.51% | 13.76% | – | 4.16% | |
| With sales charge* | | 8.51% | 13.64% | – | 4.16% | |
| C Class | AEYIX | 12.53% | 13.74% | 6.15% | 6.51% | 7/13/01 |
| R Class | AEURX | 13.12% | 14.30% | 6.67% | 7.45% | 8/29/03 |
| R6 Class | AEUDX | – | – | – | 7.41%(3) | 7/26/13 |
| |
| * | Sales charges include initial sales charges and contingent deferred sales charges (CDSCs), as applicable. A Class shares have a 5.75% maximum initial sales charge and may be subject to a maximum CDSC of 1.00%. B Class shares redeemed within six years of purchase are subject to a CDSC that declines from 5.00% during the first year to 0.00% after the sixth year. C Class shares redeemed within 12 months of purchase are subject to a maximum CDSC of 1.00%. The SEC requires that mutual funds provide performance information net of maximum sales charges in all cases where charges could be applied. |
| |
| (1) | Since 7/31/94, the date nearest the Investor Class’s inception for which data are available. |
| |
| (2) | Prior to September 4, 2007, the A Class was referred to as the Advisor Class and did not have a front-end sales charge. Performance prior to that date has been adjusted to reflect this charge. |
| |
| (3) | Total returns for periods less than one year are not annualized. |
Data presented reflect past performance. Past performance is no guarantee of future results. Current performance may be higher or lower than the performance shown. Investment return and principal value will fluctuate, and redemption value may be more or less than original cost. To obtain performance data current to the most recent month end, please call 1-800-345-2021 or visit americancentury.com.
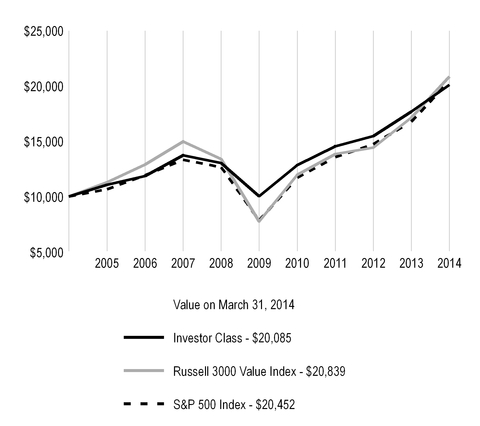
Unless otherwise indicated, performance reflects Investor Class shares; performance for other share classes will vary due to differences in fee structure. For information about other share classes available, please consult the prospectus. Data assumes reinvestment of dividends and capital gains, and none of the charts reflect the deduction of taxes that a shareholder would pay on fund distributions or the redemption of fund shares. Returns for the indices are provided for comparison. The fund’s total returns include operating expenses (such as transaction costs and management fees) that reduce returns, while the total returns of the indices do not.
|
|
| Growth of $10,000 Over 10 Years |
$10,000 investment made March 31, 2004 |
|
| | | | | | |
| Total Annual Fund Operating Expenses | | |
| Investor Class | Institutional Class | A Class | B Class | C Class | R Class | R6 Class |
| 0.94% | 0.74% | 1.19% | 1.94% | 1.94% | 1.44% | 0.59% |
The total annual fund operating expenses shown is as stated in the fund’s prospectus current as of the date of this report. The prospectus may vary from the expense ratio shown elsewhere in this report because it is based on a different time period, includes acquired fund fees and expenses, and, if applicable, does not include fee waivers or expense reimbursements.
Data presented reflect past performance. Past performance is no guarantee of future results. Current performance may be higher or lower than the performance shown. Investment return and principal value will fluctuate, and redemption value may be more or less than original cost. To obtain performance data current to the most recent month end, please call 1-800-345-2021 or visit americancentury.com.
Unless otherwise indicated, performance reflects Investor Class shares; performance for other share classes will vary due to differences in fee structure. For information about other share classes available, please consult the prospectus. Data assumes reinvestment of dividends and capital gains, and none of the charts reflect the deduction of taxes that a shareholder would pay on fund distributions or the redemption of fund shares. Returns for the indices are provided for comparison. The fund’s total returns include operating expenses (such as transaction costs and management fees) that reduce returns, while the total returns of the indices do not.
Portfolio Managers: Phil Davidson, Kevin Toney, and Michael Liss
Performance Summary
Equity Income returned 13.64%* for the 12 months ended March 31, 2014. By comparison, its benchmark, the Russell 3000 Value Index, returned 21.65%. The broader market, as measured by the S&P 500 Index, returned 21.86%. The portfolio’s return reflects operating expenses, while the indices’ returns do not.
The U.S. stock market generated strong gains during the one-year reporting period. When the period began, riskier asset classes led the market, as the Federal Reserve’s (Fed) bond-buying programs continued. Market leadership changed after the Fed suggested it might start tapering its asset purchases if economic conditions improved. Higher-quality stocks came into favor and as interest rates rose, higher-yielding stocks, such as real estate investment trusts (REITs) and utilities, declined. As the Fed sought to calm fears about eventual tapering, riskier stocks posted gains, but they reversed direction in mid-August on positive economic data, which suggested the Fed might announce tapering as soon as September. After the Fed surprised the markets by making no changes to its stimulus programs, lower-quality, riskier stocks rallied and continued to outperform through the end of 2013. In December, the U.S. economy showed new signs of strength and the Fed announced it would begin modestly scaling back its asset purchases in January 2014. As interest rates trended down in the last three months of the reporting period, yield-oriented securities, including utilities and REITs, rallied. For the reporting period overall, riskier, lower-yielding, and lower-quality stocks outperformed. Though value stocks recorded significant gains, they underperformed growth stocks. Large-cap value stocks underperformed mid-cap value stocks and small-cap value stocks.
Equity Income’s higher-quality, income-producing securities performed well in absolute terms, generating positive absolute results in nine of the 10 sectors in which it was invested. Many of the companies owned by the portfolio have strong balance sheets and competitive positions, which allowed them to continue paying dividends and, in some cases, increase their dividend payouts. Equity Income underperformed on a relative basis, primarily because of its conservative positioning in the financials, industrials, and consumer discretionary sectors. An underweight position relative to the benchmark and security selection in the energy sector, as well as specific investments in the information technology and financials sectors, added to relative performance.
Equity Income is carefully managed with the goal of providing solid long-term performance. Since its inception on August 1, 1994, Equity Income has produced an average annual return of 10.84%, topping the returns of the Russell 3000 Value Index and the S&P 500 Index for the same period (see performance information on pages 3 and 4).
Positioning in Convertible Securities Detracted From Relative Performance
Rising interest rates put pressure on the portfolio’s complement of convertible securities. In financials, the portfolio was constrained by its investment in a Wells Fargo convertible security, which underperformed. In the industrials sector, an investment in a Stanley Black & Decker convertible security detracted from returns after the company lowered guidance for organic revenue growth and 2014 earnings. The consumer discretionary sector was the source of an International Game Technology convertible security, which declined after the company provided disappointing guidance.
*All fund returns referenced in this commentary are for Investor Class shares.
Industrials and Utilities Sectors Provided Notable Detractors
In industrials, an overweight position in ADT detracted. The security monitoring company has experienced an increase in subscriber-acquisition costs and associated lower-than-expected account growth as a result of competitors' aggressive tactics, a situation we consider largely transitory. We also believe the company’s Pulse home automation and security offering will continue to have a positive influence on the business.
In the utilities sector, the portfolio was overweight Consolidated Edison, which declined on news of a gas pipeline explosion in New York City. Concern about regulatory oversight also weighed on the stock.
Energy Sector Contributed Positively
An underweight in the energy sector added to relative returns. The portfolio also benefited from security selection, including investments in Total SA and Halliburton. Total performed well on projected lower capital spending and improving free-cash flow. Halliburton announced it would repurchase $3.3 billion of its stock through a Dutch auction, which aided the oil-field services company’s shares.
Information Technology Sector Supplied Top Contributors
Holdings in the information technology sector enhanced relative returns. The portfolio owned Molex, a manufacturer of electronic and fiber-optic interconnection products and systems. Its share price rose on news that Koch Industries would acquire it for a significant premium. The portfolio also benefited from an overweight position in Applied Materials, which reported solid results and provided better-than-expected guidance, driven by strength in core semiconductor capital equipment orders.
Financials Sector Provided Notable Contributors
Although the portfolio’s conservative positioning in financials limited its performance, the sector was also the source of a number of notable contributors. An overweight position in PNC Financial Services Group added to results after the diversified financial services company reported positive fourth-quarter earnings. Its share price also rose on expectations of higher short-term interest rates. The portfolio also benefited from an overweight position in Marsh & McLennan. The insurance company reported strong results on revenue growth in its risk and insurance business, strict expense control that led to operating margin improvement, and market share gains. Marsh also expanded its share buyback program and raised its quarterly dividend.
Outlook
We will continue to follow our disciplined, bottom-up investment process, selecting companies one at a time for the portfolio. As of March 31, 2014, the team saw attractive opportunities in consumer staples, health care, industrials, and utilities, as reflected by the portfolio’s overweight positions in these sectors. Conversely, smaller relative weightings were given to consumer discretionary, information technology, energy, financials, and materials stocks, relying on fundamental analysis to identify strong, financially sound businesses whose securities provide attractive yields.
|
| |
| MARCH 31, 2014 |
| Top Ten Holdings | % of net assets |
| Johnson & Johnson | 4.9% |
| Wells Fargo & Co. (Convertible) | 4.6% |
| Exxon Mobil Corp. | 4.2% |
| Bank of America Corp. (Convertible) | 3.2% |
| PNC Financial Services Group, Inc. (The) | 2.9% |
| Northern Trust Corp. | 2.5% |
| Occidental Petroleum Corp. | 2.5% |
| PepsiCo, Inc. | 2.4% |
| Procter & Gamble Co. (The) | 2.4% |
| Stanley Black & Decker, Inc. (Convertible) | 2.3% |
| | |
| Top Five Industries | % of net assets |
| Commercial Banks | 15.1% |
| Oil, Gas and Consumable Fuels | 12.2% |
| Pharmaceuticals | 9.4% |
| Semiconductors and Semiconductor Equipment | 6.0% |
| Insurance | 4.0% |
| | |
| Types of Investments in Portfolio | % of net assets |
| Common Stocks | 71.9% |
| Convertible Preferred Stocks | 11.8% |
| Convertible Bonds | 9.6% |
| Preferred Stocks | 3.7% |
| Total Equity Exposure | 97.0% |
| Temporary Cash Investments | 2.7% |
| Other Assets and Liabilities | 0.3% |
Fund shareholders may incur two types of costs: (1) transaction costs, including sales charges (loads) on purchase payments and redemption/exchange fees; and (2) ongoing costs, including management fees; distribution and service (12b-1) fees; and other fund expenses. This example is intended to help you understand your ongoing costs (in dollars) of investing in your fund and to compare these costs with the ongoing cost of investing in other mutual funds.
The example is based on an investment of $1,000 made at the beginning of the period and held for the entire period from October 1, 2013 to March 31, 2014.
Actual Expenses
The table provides information about actual account values and actual expenses for each class. You may use the information, together with the amount you invested, to estimate the expenses that you paid over the period. First, identify the share class you own. Then simply divide your account value by $1,000 (for example, an $8,600 account value divided by $1,000 = 8.6), then multiply the result by the number under the heading “Expenses Paid During Period” to estimate the expenses you paid on your account during this period.
If you hold Investor Class shares of any American Century Investments fund, or Institutional Class shares of the American Century Diversified Bond Fund, in an American Century Investments account (i.e., not a financial intermediary or retirement plan account), American Century Investments may charge you a $12.50 semiannual account maintenance fee if the value of those shares is less than $10,000. We will redeem shares automatically in one of your accounts to pay the $12.50 fee. In determining your total eligible investment amount, we will include your investments in all personal accounts (including American Century Investments Brokerage accounts) registered under your Social Security number. Personal accounts include individual accounts, joint accounts, UGMA/UTMA accounts, personal trusts, Coverdell Education Savings Accounts and IRAs (including traditional, Roth, Rollover, SEP-, SARSEP- and SIMPLE-IRAs), and certain other retirement accounts. If you have only business, business retirement, employer-sponsored or American Century Investments Brokerage accounts, you are currently not subject to this fee. If you are subject to the Account Maintenance Fee, your account value could be reduced by the fee amount.
Hypothetical Example for Comparison Purposes
The table also provides information about hypothetical account values and hypothetical expenses based on the actual expense ratio of each class of your fund and an assumed rate of return of 5% per year before expenses, which is not the actual return of a fund’s share class. The hypothetical account values and expenses may not be used to estimate the actual ending account balance or expenses you paid for the period. You may use this information to compare the ongoing costs of investing in your fund and other funds. To do so, compare this 5% hypothetical example with the 5% hypothetical examples that appear in the shareholder reports of the other funds.
Please note that the expenses shown in the table are meant to highlight your ongoing costs only and do not reflect any transactional costs, such as sales charges (loads) or redemption/exchange fees. Therefore, the table is useful in comparing ongoing costs only, and will not help you determine the relative total costs of owning different funds. In addition, if these transactional costs were included, your costs would have been higher.
|
| | | | | | | | |
| | | Beginning
Account Value
10/1/13 | | Ending
Account Value
3/31/14 | | Expenses Paid
During Period(1)
10/1/13 - 3/31/14 | | Annualized
Expense Ratio(1) |
| Actual | | | | | | | | |
| Investor Class | | $1,000 | | $1,090.90 | | $4.80 | | 0.92% |
| Institutional Class | | $1,000 | | $1,093.10 | | $3.76 | | 0.72% |
| A Class | | $1,000 | | $1,089.60 | | $6.10 | | 1.17% |
| B Class | | $1,000 | | $1,085.50 | | $9.98 | | 1.92% |
| C Class | | $1,000 | | $1,085.60 | | $9.98 | | 1.92% |
| R Class | | $1,000 | | $1,088.50 | | $7.39 | | 1.42% |
| R6 Class | | $1,000 | | $1,092.70 | | $2.97 | | 0.57% |
| Hypothetical | | | | | | | | |
| Investor Class | | $1,000 | | $1,020.34 | | $4.63 | | 0.92% |
| Institutional Class | | $1,000 | | $1,021.34 | | $3.63 | | 0.72% |
| A Class | | $1,000 | | $1,019.10 | | $5.89 | | 1.17% |
| B Class | | $1,000 | | $1,015.36 | | $9.65 | | 1.92% |
| C Class | | $1,000 | | $1,015.36 | | $9.65 | | 1.92% |
| R Class | | $1,000 | | $1,017.85 | | $7.14 | | 1.42% |
| R6 Class | | $1,000 | | $1,022.09 | | $2.87 | | 0.57% |
| |
| (1) | Expenses are equal to the class's annualized expense ratio listed in the table above, multiplied by the average account value over the period, multiplied by 182, the number of days in the most recent fiscal half-year, divided by 365, to reflect the one-half year period. |
MARCH 31, 2014
|
| | | | |
| | Shares/Principal Amount | Value |
| COMMON STOCKS — 71.9% |
| AEROSPACE AND DEFENSE — 0.9% |
| BAE Systems plc | 4,990,900 | $ | 34,463,841 |
|
| Rockwell Collins, Inc. | 686,756 | 54,713,850 |
|
| | | 89,177,691 |
|
| AIR FREIGHT AND LOGISTICS — 2.0% |
| United Parcel Service, Inc., Class B | 2,089,395 | 203,465,285 |
|
| AUTOMOBILES — 0.2% |
| Honda Motor Co., Ltd. | 616,800 | 21,716,332 |
|
| BEVERAGES — 2.4% |
| PepsiCo, Inc. | 2,998,265 | 250,355,128 |
|
| CAPITAL MARKETS — 2.9% |
| Goldman Sachs Group, Inc. (The) | 212,781 | 34,864,167 |
|
| Northern Trust Corp. | 3,963,583 | 259,852,501 |
|
| | | 294,716,668 |
|
| CHEMICALS — 1.3% |
| Air Products & Chemicals, Inc. | 448,200 | 53,353,728 |
|
| Potash Corp. of Saskatchewan, Inc. | 2,344,000 | 84,899,680 |
|
| | | 138,253,408 |
|
| COMMERCIAL BANKS — 6.7% |
| Comerica, Inc. | 769,662 | 39,868,492 |
|
| Commerce Bancshares, Inc. | 2,398,427 | 111,334,981 |
|
| JPMorgan Chase & Co. | 1,599,767 | 97,121,854 |
|
| KeyCorp | 7,399,000 | 105,361,760 |
|
| PNC Financial Services Group, Inc. (The) | 3,388,559 | 294,804,633 |
|
| SunTrust Banks, Inc. | 999,777 | 39,781,127 |
|
| | | 688,272,847 |
|
| COMMERCIAL SERVICES AND SUPPLIES — 3.2% |
| ADT Corp. (The) | 2,625,341 | 78,628,963 |
|
|
| | | | | | |
| | Shares/Principal Amount | Value |
| Republic Services, Inc. | 3,373,541 |
| $ | 115,240,160 |
|
| Tyco International Ltd. | 1,899,282 |
| 80,529,557 |
|
| Waste Management, Inc. | 1,299,238 |
| 54,658,943 |
|
| | | 329,057,623 |
|
| COMMUNICATIONS EQUIPMENT — 0.4% |
| Cisco Systems, Inc. | 1,799,700 |
| 40,331,277 |
|
| DIVERSIFIED TELECOMMUNICATION SERVICES — 1.9% |
| AT&T, Inc. | 2,999,346 |
| 105,187,064 |
|
| CenturyLink, Inc. | 2,857,855 |
| 93,851,958 |
|
| | | 199,039,022 |
|
| ELECTRIC UTILITIES — 0.2% |
| Westar Energy, Inc. | 698,000 |
| 24,541,680 |
|
| ELECTRICAL EQUIPMENT — 0.5% |
| ABB Ltd. | 2,140,278 |
| 55,198,618 |
|
| FOOD AND STAPLES RETAILING — 2.7% |
| Sysco Corp. | 4,056,148 |
| 146,548,627 |
|
| Wal-Mart Stores, Inc. | 1,698,878 |
| 129,845,246 |
|
| | | 276,393,873 |
|
| FOOD PRODUCTS — 2.9% |
| Campbell Soup Co. | 2,099,348 |
| 94,218,738 |
|
| General Mills, Inc. | 2,498,200 |
| 129,456,724 |
|
| Hillshire Brands Co. | 1,999,700 |
| 74,508,822 |
|
| | | 298,184,284 |
|
| GAS UTILITIES — 3.5% |
| AGL Resources, Inc. | 977,338 |
| 47,850,469 |
|
ONE Gas, Inc.(1)(2) | 2,396,071 |
| 86,090,831 |
|
| Piedmont Natural Gas Co., Inc. | 2,997,359 |
| 106,076,535 |
|
WGL Holdings, Inc.(1) | 2,998,417 |
| 120,116,585 |
|
| | | 360,134,420 |
|
|
| | | | | | |
| | Shares/Principal Amount | Value |
| HEALTH CARE EQUIPMENT AND SUPPLIES — 1.7% |
| Becton Dickinson and Co. | 1,481,200 |
| $ | 173,418,896 |
|
| HEALTH CARE PROVIDERS AND SERVICES — 1.6% |
| Quest Diagnostics, Inc. | 2,756,300 |
| 159,644,896 |
|
| HOUSEHOLD PRODUCTS — 2.4% |
| Procter & Gamble Co. (The) | 3,089,790 |
| 249,037,074 |
|
| INDUSTRIAL CONGLOMERATES — 2.1% |
| 3M Co. | 597,600 |
| 81,070,416 |
|
| General Electric Co. | 5,092,200 |
| 131,837,058 |
|
| | | 212,907,474 |
|
| INSURANCE — 3.6% |
| Allstate Corp. (The) | 999,052 |
| 56,526,362 |
|
| Chubb Corp. (The) | 1,298,835 |
| 115,985,966 |
|
| Marsh & McLennan Cos., Inc. | 3,999,880 |
| 197,194,084 |
|
| | | 369,706,412 |
|
| METALS AND MINING — 0.5% |
| Goldcorp, Inc. New York Shares | 995,500 |
| 24,369,840 |
|
| Nucor Corp. | 464,900 |
| 23,496,046 |
|
| | | 47,865,886 |
|
| MULTI-UTILITIES — 2.9% |
| Consolidated Edison, Inc. | 2,577,678 |
| 138,292,425 |
|
| PG&E Corp. | 2,817,110 |
| 121,699,152 |
|
| Wisconsin Energy Corp. | 799,500 |
| 37,216,725 |
|
| | | 297,208,302 |
|
| OIL, GAS AND CONSUMABLE FUELS — 12.2% |
| Chevron Corp. | 1,723,392 |
| 204,928,543 |
|
| El Paso Pipeline Partners LP | 1,728,342 |
| 52,524,313 |
|
| Exxon Mobil Corp. | 4,447,482 |
| 434,430,042 |
|
| Occidental Petroleum Corp. | 2,698,300 |
| 257,121,007 |
|
| Spectra Energy Partners LP | 2,224,869 |
| 108,907,337 |
|
| Total SA | 2,989,525 |
| 196,041,448 |
|
| | | 1,253,952,690 |
|
| PHARMACEUTICALS — 9.4% |
| Eli Lilly & Co. | 1,571,688 |
| 92,509,556 |
|
|
| | | | | | |
| | Shares/Principal Amount | Value |
| Johnson & Johnson | 5,088,880 |
| $ | 499,880,682 |
|
| Merck & Co., Inc. | 3,179,731 |
| 180,513,329 |
|
| Pfizer, Inc. | 4,992,179 |
| 160,348,790 |
|
| Teva Pharmaceutical Industries Ltd. ADR | 539,200 |
| 28,491,328 |
|
| | | 961,743,685 |
|
| REAL ESTATE INVESTMENT TRUSTS (REITs) — 0.2% |
| Annaly Capital Management, Inc. | 1,998,500 |
| 21,923,545 |
|
| SEMICONDUCTORS AND SEMICONDUCTOR EQUIPMENT — 2.6% |
| Applied Materials, Inc. | 9,449,302 |
| 192,954,747 |
|
| Intel Corp. | 2,999,300 |
| 77,411,933 |
|
| | | 270,366,680 |
|
| THRIFTS AND MORTGAGE FINANCE — 1.0% |
Capitol Federal Financial, Inc.(1) | 7,999,069 |
| 100,388,316 |
|
TOTAL COMMON STOCKS (Cost $5,636,810,386) | 7,387,002,012 |
|
| CONVERTIBLE PREFERRED STOCKS — 11.8% |
| COMMERCIAL BANKS — 7.8% |
| Bank of America Corp., 7.25% | 289,977 |
| 331,794,583 |
|
| Wells Fargo & Co., 7.50% | 404,949 |
| 475,005,177 |
|
| | | 806,799,760 |
|
| ELECTRIC UTILITIES — 0.5% |
| NextEra Energy, Inc., 5.80%, 9/1/16 | 980,126 |
| 52,946,407 |
|
| INSURANCE — 0.4% |
| MetLife, Inc., 5.00%, 10/8/14 | 1,299,161 |
| 40,014,159 |
|
| MACHINERY — 2.3% |
| Stanley Black & Decker, Inc., 4.75%, 11/17/15 | 1,843,885 |
| 235,058,460 |
|
| REAL ESTATE INVESTMENT TRUSTS (REITs) — 0.8% |
| Health Care REIT, Inc., 6.50% | 1,399,893 |
| 77,736,058 |
|
TOTAL CONVERTIBLE PREFERRED STOCKS (Cost $1,111,657,488) | 1,212,554,844 |
|
|
| | | | | | |
| | Shares/Principal Amount | Value |
| CONVERTIBLE BONDS — 9.6% |
| AEROSPACE AND DEFENSE — 0.9% |
| L-3 Communications Holdings, Inc., 3.00%, 8/1/35 | $ | 69,973,000 |
| $ | 93,501,421 |
|
| CAPITAL MARKETS — 0.8% |
| Janus Capital Group, Inc., 3.25%, 7/15/14 | 25,448,000 |
| 25,543,430 |
|
| Janus Capital Group, Inc., 0.75%, 7/15/18 | 41,539,000 |
| 49,976,609 |
|
| | | 75,520,039 |
|
| FOOD AND STAPLES RETAILING — 0.4% |
Credit Suisse AG, (convertible into Wal-Mart Stores, Inc.), 4.10%, 6/5/14(4) | 580,000 |
| 44,286,480 |
|
| HEALTH CARE PROVIDERS AND SERVICES — 1.7% |
| LifePoint Hospitals, Inc., 3.50%, 5/15/14 | 167,586,000 |
| 178,269,608 |
|
| HOTELS, RESTAURANTS AND LEISURE — 2.0% |
| International Game Technology, 3.25%, 5/1/14 | 199,567,000 |
| 200,065,918 |
|
| MULTILINE RETAIL — 0.4% |
Bank of America Corp., (convertible into Target Corp.), 3.07%, 5/29/14(3)(4) | 693,000 |
| 41,791,365 |
|
| SEMICONDUCTORS AND SEMICONDUCTOR EQUIPMENT — 3.4% |
| Intel Corp., 2.95%, 12/15/35 | 195,489,000 |
| 230,554,839 |
|
| Microchip Technology, Inc., 2.125%, 12/15/37 | 63,974,000 |
| 118,991,640 |
|
| | | 349,546,479 |
|
TOTAL CONVERTIBLE BONDS(Cost $901,763,685) | 982,981,310 |
|
| PREFERRED STOCKS — 3.7% |
| COMMERCIAL BANKS — 0.6% |
| U.S. Bancorp, 6.00% | 2,315,421 |
| 63,558,306 |
|
|
| | | | |
| | Shares/Principal Amount | Value |
| DIVERSIFIED FINANCIAL SERVICES — 3.1% |
| Citigroup, Inc., 5.95% | 179,858,000 | $ | 176,036,017 |
|
| General Electric Capital Corp., 6.25% | 129,900,000 | 139,587,163 |
|
| | | 315,623,180 |
|
TOTAL PREFERRED STOCKS (Cost $376,781,454) | 379,181,486 |
|
| TEMPORARY CASH INVESTMENTS — 2.7% |
| Repurchase Agreement, Bank of America Merrill Lynch, (collateralized by various U.S. Treasury obligations, 0.75% - 1.375%, 10/31/17 - 6/30/18, valued at $54,644,416), in a joint trading account at 0.03%, dated 3/31/14, due 4/1/14 (Delivery value $53,539,779) | 53,539,734 |
|
| Repurchase Agreement, Goldman Sachs & Co., (collateralized by various U.S. Treasury obligations, 4.25%, 8/15/15, valued at $48,061,739), in a joint trading account at 0.03%, dated 3/31/14, due 4/1/14 (Delivery value $47,115,004) | 47,114,965 |
|
| SSgA U.S. Government Money Market Fund | 181,521,360 | 181,521,360 |
|
TOTAL TEMPORARY CASH INVESTMENTS (Cost $282,176,059) | 282,176,059 |
|
TOTAL INVESTMENT SECURITIES — 99.7% (Cost $8,309,189,072) | 10,243,895,711 |
|
| OTHER ASSETS AND LIABILITIES — 0.3% | 33,162,992 |
|
| TOTAL NET ASSETS — 100.0% | $ | 10,277,058,703 |
|
|
| | | | | | | | | | |
| FORWARD FOREIGN CURRENCY EXCHANGE CONTRACTS |
| Currency Purchased | Currency Sold | Counterparty | Settlement Date | Unrealized Appreciation (Depreciation) |
| USD | 44,274,623 |
| CHF | 39,073,241 |
| Credit Suisse AG | 4/30/14 | $ | 66,823 |
|
| USD | 1,564,790 |
| CHF | 1,386,575 |
| Credit Suisse AG | 4/30/14 | (3,992 | ) |
| USD | 162,897,715 |
| EUR | 118,118,856 |
| UBS AG | 4/30/14 | 181,246 |
|
| USD | 4,098,036 |
| EUR | 2,982,928 |
| UBS AG | 4/30/14 | (11,143 | ) |
| USD | 22,528,012 |
| GBP | 13,617,358 |
| Credit Suisse AG | 4/30/14 | (169,338 | ) |
| USD | 1,577,689 |
| GBP | 948,167 |
| Credit Suisse AG | 4/30/14 | (2,712 | ) |
| USD | 2,836,107 |
| GBP | 1,700,816 |
| Credit Suisse AG | 4/30/14 | 1,195 |
|
| USD | 17,926,908 |
| JPY | 1,832,882,880 |
| Credit Suisse AG | 4/30/14 | 166,273 |
|
| | | | | | | $ | 228,352 |
|
|
| | |
| Notes to Schedule of Investments |
| ADR | - | American Depositary Receipt |
| CHF | - | Swiss Franc |
| EUR | - | Euro |
| GBP | - | British Pound |
| JPY | - | Japanese Yen |
| USD | - | United States Dollar |
| (1) | Affiliated Company: the fund’s holding represents ownership of 5% or more of the voting securities of the company; therefore, the company is affiliated as defined in the Investment Company Act of 1940. |
| (2) | Non-income producing. |
| (3) | Restricted security exempt from registration pursuant to Rule 144A under the Securities Act of 1933. These securities may be sold without restriction to qualified institutional investors and have been deemed liquid under policies approved by the Board of Directors. The aggregate value of these securities at the period end was $41,791,365, which represented 0.4% of total net assets. |
| (4) | Equity-linked debt security. The aggregated value of these securities at the period end was $86,077,845, which represented 0.8% of total net assets. |
See Notes to Financial Statements.
|
|
| Statement of Assets and Liabilities |
|
| | | |
| MARCH 31, 2014 | |
| Assets | |
| Investment securities - unaffiliated, at value (cost of $8,048,491,543) | $ | 9,937,299,979 |
|
| Investment securities - affiliated, at value (cost of $260,697,529) | 306,595,732 |
|
| Total investment securities, at value (cost of $8,309,189,072) | 10,243,895,711 |
|
| Foreign currency holdings, at value (cost of $6,014,600) | 5,896,847 |
|
| Receivable for investments sold | 54,964,019 |
|
| Receivable for capital shares sold | 6,022,932 |
|
| Unrealized appreciation on forward foreign currency exchange contracts | 415,537 |
|
| Dividends and interest receivable | 32,598,582 |
|
| | 10,343,793,628 |
|
| | |
| Liabilities | |
| Payable for investments purchased | 40,045,714 |
|
| Payable for capital shares redeemed | 17,639,492 |
|
| Unrealized depreciation on forward foreign currency exchange contracts | 187,185 |
|
| Accrued management fees | 7,770,877 |
|
| Distribution and service fees payable | 1,091,657 |
|
| | 66,734,925 |
|
| | |
| Net Assets | $ | 10,277,058,703 |
|
| | |
| Net Assets Consist of: | |
| Capital (par value and paid-in surplus) | $ | 8,196,157,135 |
|
| Undistributed net investment income | 30,478,380 |
|
| Undistributed net realized gain | 115,592,388 |
|
| Net unrealized appreciation | 1,934,830,800 |
|
| | $ | 10,277,058,703 |
|
|
| | | | | |
| | Net Assets | Shares Outstanding | Net Asset Value Per Share |
| Investor Class, $0.01 Par Value |
| $5,406,361,675 |
| 611,358,843 | $8.84 |
| Institutional Class, $0.01 Par Value |
| $1,422,724,960 |
| 160,801,780 | $8.85 |
| A Class, $0.01 Par Value |
| $2,722,730,936 |
| 307,894,310 | $8.84* |
| B Class, $0.01 Par Value |
| $7,151,019 |
| 807,691 | $8.85 |
| C Class, $0.01 Par Value |
| $521,688,421 |
| 58,993,058 | $8.84 |
| R Class, $0.01 Par Value |
| $169,851,506 |
| 19,254,703 | $8.82 |
| R6 Class, $0.01 Par Value |
| $26,550,186 |
| 2,999,395 | $8.85 |
*Maximum offering price $9.38 (net asset value divided by 0.9425).
See Notes to Financial Statements.
|
| | | |
| YEAR ENDED MARCH 31, 2014 | |
| Investment Income (Loss) | |
| Income: | |
| Dividends (including $13,295,137 from affiliates and net of foreign taxes withheld of $1,514,917) | $ | 302,393,240 |
|
| Interest | 37,306,569 |
|
| | 339,699,809 |
|
| | |
| Expenses: | |
| Management fees | 93,797,918 |
|
| Distribution and service fees: | |
| A Class | 6,863,759 |
|
| B Class | 72,704 |
|
| C Class | 5,004,121 |
|
| R Class | 887,152 |
|
| Directors' fees and expenses | 255,142 |
|
| Other expenses | 204 |
|
| | 106,881,000 |
|
| | |
| Net investment income (loss) | 232,818,809 |
|
| | |
| Realized and Unrealized Gain (Loss) | |
| Net realized gain (loss) on: | |
| Investment transactions (including $5,302,399 from affiliates) | 712,243,100 |
|
| Foreign currency transactions | (12,622,958 | ) |
| | 699,620,142 |
|
| | |
| Change in net unrealized appreciation (depreciation) on: | |
| Investments | 392,563,773 |
|
| Translation of assets and liabilities in foreign currencies | (1,476,818 | ) |
| | 391,086,955 |
|
| | |
| Net realized and unrealized gain (loss) | 1,090,707,097 |
|
| | |
| Net Increase (Decrease) in Net Assets Resulting from Operations | $ | 1,323,525,906 |
|
See Notes to Financial Statements.
|
|
| Statement of Changes in Net Assets |
|
| | | | | | |
| YEARS ENDED MARCH 31, 2014 AND MARCH 31, 2013 |
| Increase (Decrease) in Net Assets | March 31, 2014 | March 31, 2013 |
| Operations | | |
| Net investment income (loss) | $ | 232,818,809 |
| $ | 248,585,110 |
|
| Net realized gain (loss) | 699,620,142 |
| 611,716,511 |
|
| Change in net unrealized appreciation (depreciation) | 391,086,955 |
| 460,422,440 |
|
| Net increase (decrease) in net assets resulting from operations | 1,323,525,906 |
| 1,320,724,061 |
|
| | | |
| Distributions to Shareholders | | |
| From net investment income: | | |
| Investor Class | (124,129,537) |
| (141,411,242) |
|
| Institutional Class | (37,307,135) |
| (39,268,857) |
|
| A Class | (55,188,935) |
| (60,626,082) |
|
| B Class | (91,296) |
| (125,779) |
|
| C Class | (6,327,715) |
| (7,713,146) |
|
| R Class | (3,122,822) |
| (3,904,523) |
|
| R6 Class | (115,999) |
| — |
|
| From net realized gains: | | |
| Investor Class | (335,350,023) |
| (54,375,647) |
|
| Institutional Class | (92,742,391) |
| (14,101,988) |
|
| A Class | (171,064,581) |
| (25,558,607) |
|
| B Class | (440,329) |
| (75,975) |
|
| C Class | (31,338,388) |
| (4,635,644) |
|
| R Class | (10,633,123) |
| (1,808,569) |
|
| R6 Class | (94,089) |
| — |
|
| Decrease in net assets from distributions | (867,946,363) |
| (353,606,059) |
|
| | | |
| Capital Share Transactions | | |
| Net increase (decrease) in net assets from capital share transactions | (497,411,893) |
| (495,740,206) |
|
| | | |
| Net increase (decrease) in net assets | (41,832,350) |
| 471,377,796 |
|
| | | |
| Net Assets | | |
| Beginning of period | 10,318,891,053 |
| 9,847,513,257 |
|
| End of period | $ | 10,277,058,703 |
| $ | 10,318,891,053 |
|
| | | |
| Undistributed net investment income | $ | 30,478,380 |
| $ | 7,820,981 |
|
See Notes to Financial Statements.
|
|
| Notes to Financial Statements |
MARCH 31, 2014
1. Organization
American Century Capital Portfolios, Inc. (the corporation) is registered under the Investment Company Act of 1940, as amended (the 1940 Act), as an open-end management investment company and is organized as a Maryland corporation. Equity Income Fund (the fund) is one fund in a series issued by the corporation. The fund is diversified as defined under the 1940 Act. The fund’s investment objective is to seek current income. Capital appreciation is a secondary objective.
The fund offers the Investor Class, the Institutional Class, the A Class, the B Class, the C Class, the R Class and the R6 Class. The A Class may incur an initial sales charge. The A Class, B Class and C Class may be subject to a contingent deferred sales charge. The share classes differ principally in their respective sales charges and distribution and shareholder servicing expenses and arrangements. The Institutional Class and R6 Class shareholders do not require the same level of shareholder and administrative services from American Century Investment Management, Inc. (ACIM) (the investment advisor) as shareholders of other classes. In addition, financial intermediaries do not receive any service, distribution or administrative fees for the R6 Class. As a result, the Institutional Class and R6 Class are charged lower unified management fees. Sale of the R6 Class commenced on July 26, 2013.
2. Significant Accounting Policies
The following is a summary of significant accounting policies consistently followed by the fund in preparation of its financial statements. The financial statements are prepared in conformity with accounting principles generally accepted in the United States of America, which may require management to make certain estimates and assumptions at the date of the financial statements. Actual results could differ from these estimates.
Investment Valuations — The fund determines the fair value of its investments and computes its net asset value per share at the close of regular trading (usually 4 p.m. Eastern time) on the New York Stock Exchange (NYSE) on each day the NYSE is open. The Board of Directors has adopted valuation policies and procedures to guide the investment advisor in the fund’s investment valuation process and to provide methodologies for the oversight of the fund’s pricing function.
Equity securities that are listed or traded on a domestic securities exchange are valued at the last reported sales price or at the official closing price as provided by the exchange. Equity securities traded on foreign securities exchanges are generally valued at the closing price of such securities on the exchange where primarily traded or at the close of the NYSE, if that is earlier. If no last sales price is reported, or if local convention or regulation so provides, the mean of the latest bid and asked prices may be used. Securities traded over-the-counter are valued at the mean of the latest bid and asked prices, the last sales price, or the official closing price. Equity securities initially expressed in local currencies are translated into U.S. dollars at the mean of the appropriate currency exchange rate at the close of the NYSE as provided by an independent pricing service.
Fixed income securities maturing in greater than 60 days at the time of purchase are valued at the evaluated mean as provided by independent pricing services or at the mean of the most recent bid and asked prices as provided by investment dealers. Fixed income securities maturing within 60 days at the time of purchase may be valued at cost, plus or minus any amortized discount or premium or at the evaluated mean as provided by an independent pricing service. Evaluated mean prices are commonly derived through utilization of market models, which may consider, among other factors: trade data, quotations from dealers and active market makers, relevant yield curve and spread data, related sector levels, creditworthiness, trade data or market information on comparable securities, and other relevant security specific information.
Open-end management investment companies are valued at the reported net asset value per share. Repurchase agreements are valued at cost, which approximates fair value. Forward foreign currency exchange contracts are valued at the mean of the appropriate forward exchange rate at the close of the NYSE as provided by an independent pricing service.
If the fund determines that the market price for an investment is not readily available or the valuation methods mentioned above do not reflect an investment’s fair value, such investment is valued as determined in good faith by the Board of Directors or its delegate, in accordance with policies and procedures adopted by the
Board of Directors. In its determination of fair value, the fund may review several factors including, but not limited to, market information regarding the specific investment or comparable investments and correlation with other investment types, futures indices or general market indicators. Circumstances that may cause the fund to use these procedures to value an investment include, but are not limited to: an investment has been declared in default or is distressed; trading in a security has been suspended during the trading day or a security is not actively trading on its principal exchange; prices received from a regular pricing source are deemed unreliable; or there is a foreign market holiday and no trading occurred.
The fund monitors for significant events occurring after the close of an investment’s primary exchange but before the fund’s net asset value per share is determined. Significant events may include, but are not limited to: corporate announcements and transactions; governmental action and political unrest that could impact a specific investment or an investment sector; or armed conflicts, natural disasters and similar events that could affect investments in a specific country or region. The fund also monitors for significant fluctuations between domestic and foreign markets, as evidenced by the U.S. market or such other indicators that the Board of Directors, or its delegate, deems appropriate. If significant fluctuations in foreign markets are identified, the fund may apply a model-derived factor to the closing price of equity securities traded on foreign securities exchanges. The factor is based on observable market data as provided by an independent pricing service.
Security Transactions — Security transactions are accounted for as of the trade date. Net realized gains and losses are determined on the identified cost basis, which is also used for federal income tax purposes.
Investment Income — Dividend income less foreign taxes withheld, if any, is recorded as of the ex-dividend date. Distributions received on securities that represent a return of capital or long-term capital gain are recorded as a reduction of cost of investments and/or as a realized gain. The fund may estimate the components of distributions received that may be considered nontaxable distributions or long-term capital gain distributions for income tax purposes. Interest income is recorded on the accrual basis and includes accretion of discounts and amortization of premiums.
Equity-Linked Debt and Linked-Equity Securities — The fund may invest in hybrid equity securities, which usually convert into common stock at a date predetermined by the issuer. These securities generally offer a higher dividend yield than that of the common stock to which the security is linked. These instruments are issued by a company other than the one to which the security is linked and carry the credit of the issuer, not that of the underlying common stock. The securities’ appreciation is limited based on a predetermined final cap price at the date of the conversion. Risks of investing in these securities include, but are not limited to, a set time to capture the yield advantage, limited appreciation potential, decline in value of the underlying stock, and failure of the issuer to pay dividends or to deliver common stock at maturity.
Foreign Currency Translations — All assets and liabilities initially expressed in foreign currencies are translated into U.S. dollars at prevailing exchange rates at period end. The fund may enter into spot foreign currency exchange contracts to facilitate transactions denominated in a foreign currency. Purchases and sales of investment securities, dividend and interest income, spot foreign currency exchange contracts, and expenses are translated at the rates of exchange prevailing on the respective dates of such transactions. Net realized and unrealized foreign currency exchange gains or losses related to investment securities are a component of net realized gain (loss) on investment transactions and change in net unrealized appreciation (depreciation) on investments, respectively.
Repurchase Agreements — The fund may enter into repurchase agreements with institutions that ACIM has determined are creditworthy pursuant to criteria adopted by the Board of Directors. The fund requires that the collateral, represented by securities, received in a repurchase transaction be transferred to the custodian in a manner sufficient to enable the fund to obtain those securities in the event of a default under the repurchase agreement. ACIM monitors, on a daily basis, the securities transferred to ensure the value, including accrued interest, of the securities under each repurchase agreement is equal to or greater than amounts owed to the fund under each repurchase agreement.
Joint Trading Account — Pursuant to an Exemptive Order issued by the Securities and Exchange Commission, the fund, along with certain other funds in the American Century Investments family of funds, may transfer uninvested cash balances into a joint trading account. These balances are invested in one or more repurchase agreements that are collateralized by U.S. Treasury or Agency obligations.
Income Tax Status — It is the fund’s policy to distribute substantially all net investment income and net realized gains to shareholders and to otherwise qualify as a regulated investment company under provisions of the Internal Revenue Code. Accordingly, no provision has been made for income taxes. The fund files U.S. federal, state, local and non-U.S. tax returns as applicable. The fund's tax returns are subject to examination
by the relevant taxing authority until expiration of the applicable statute of limitations, which is generally three years from the date of filing but can be longer in certain jurisdictions. At this time, management believes there are no uncertain tax positions which, based on their technical merit, would not be sustained upon examination and for which it is reasonably possible that the total amounts of unrecognized tax benefits will significantly change in the next twelve months.
Multiple Class — All shares of the fund represent an equal pro rata interest in the net assets of the class to which such shares belong, and have identical voting, dividend, liquidation and other rights and the same terms and conditions, except for class specific expenses and exclusive rights to vote on matters affecting only individual classes. Income, non-class specific expenses, and realized and unrealized capital gains and losses of the fund are allocated to each class of shares based on their relative net assets.
Distributions to Shareholders — Distributions from net investment income, if any, are generally declared and paid quarterly. Distributions from net realized gains, if any, are generally declared and paid annually.
Indemnifications — Under the corporation’s organizational documents, its officers and directors are indemnified against certain liabilities arising out of the performance of their duties to the fund. In addition, in the normal course of business, the fund enters into contracts that provide general indemnifications. The maximum exposure under these arrangements is unknown as this would involve future claims that may be made against a fund. The risk of material loss from such claims is considered by management to be remote.
3. Fees and Transactions with Related Parties
Certain officers and directors of the corporation are also officers and/or directors of American Century Companies, Inc. (ACC). The corporation’s investment advisor, ACIM, the corporation's distributor, American Century Investment Services, Inc. (ACIS), and the corporation’s transfer agent, American Century Services, LLC, are wholly owned, directly or indirectly, by ACC.
Management Fees — The corporation has entered into a management agreement with ACIM, under which ACIM provides the fund with investment advisory and management services in exchange for a single, unified management fee (the fee) per class. The agreement provides that all expenses of managing and operating the fund, except distribution and service fees, brokerage expenses, taxes, interest, fees and expenses of the independent directors (including legal counsel fees), and extraordinary expenses, will be paid by ACIM. The fee is computed and accrued daily based on each class’s daily net assets and paid monthly in arrears. The rate of the fee is determined by applying a fee rate calculation formula. This formula takes into account the fund’s assets as well as certain assets, if any, of other clients of the investment advisor outside the American Century Investments family of funds (such as subadvised funds and separate accounts) that have very similar investment teams and investment strategies (strategy assets). The annual management fee schedule ranges from 0.80% to 1.00% for the Investor Class, A Class, B Class, C Class and R Class. The annual management fee schedule ranges from 0.60% to 0.80% for the Institutional Class and 0.45% to 0.65% for the R6 Class. The effective annual management fee for each class for the period ended March 31, 2014 was 0.93% for the Investor Class, A Class, B Class, C Class and R Class, 0.73% for the Institutional Class and 0.58% for the R6 Class.
Distribution and Service Fees — The Board of Directors has adopted a separate Master Distribution and Individual Shareholder Services Plan for each of the A Class, B Class, C Class and R Class (collectively the plans), pursuant to Rule 12b-1 of the 1940 Act. The plans provide that the A Class will pay ACIS an annual distribution and service fee of 0.25%. The plans provide that the B Class and C Class will each pay ACIS an annual distribution and service fee of 1.00%, of which 0.25% is paid for individual shareholder services and 0.75% is paid for distribution services. The plans provide that the R Class will pay ACIS an annual distribution and service fee of 0.50%. The fees are computed and accrued daily based on each class’s daily net assets and paid monthly in arrears. The fees are used to pay financial intermediaries for distribution and individual shareholder services. Fees incurred under the plans during the year ended March 31, 2014 are detailed in the Statement of Operations.
Directors' Fees and Expenses — The Board of Directors is responsible for overseeing the investment advisor's management and operations of the fund. The directors receive detailed information about the fund and its investment advisor regularly throughout the year, and meet at least quarterly with management of the investment advisor to review reports about fund operations. Fees and expenses incurred in conjunction with the directors during the year ended March 31, 2014 are detailed in the Statement of Operations. The fund’s officers do not receive compensation from the fund.
4. Investment Transactions
Purchases and sales of investment securities, excluding short-term investments, for the year ended March 31, 2014 were $5,761,126,443 and $6,918,311,832, respectively.
5. Capital Share Transactions
Transactions in shares of the fund were as follows:
|
| | | | | | | | |
| | Year ended March 31, 2014(1) | Year ended March 31, 2013 |
| | Shares | Amount | Shares | Amount |
| Investor Class/Shares Authorized | 3,000,000,000 | | 3,000,000,000 | |
| Sold | 82,204,397 | $ | 715,805,817 |
| 76,024,391 | $ | 597,947,028 |
|
| Issued in reinvestment of distributions | 49,378,415 | 421,725,022 |
| 22,338,077 | 174,877,435 |
|
| Redeemed | (169,995,596) | (1,478,399,801 | ) | (146,334,035) | (1,151,473,579) |
|
| | (38,412,784) | (340,868,962) |
| (47,971,567) | (378,649,116) |
|
| Institutional Class/Shares Authorized | 800,000,000 | | 800,000,000 | |
| Sold | 28,301,561 | 246,512,129 |
| 46,181,538 | 363,530,803 |
|
| Issued in reinvestment of distributions | 14,457,971 | 123,615,426 |
| 6,053,770 | 47,472,340 |
|
| Redeemed | (62,221,978) | (541,196,330) |
| (43,198,213) | (341,038,687) |
|
| | (19,462,446) | (171,068,775) |
| 9,037,095 | 69,964,456 |
|
| A Class/Shares Authorized | 1,000,000,000 | | 1,000,000,000 | |
| Sold | 62,955,986 | 549,347,268 |
| 46,885,114 | 369,627,808 |
|
| Issued in reinvestment of distributions | 25,765,702 | 219,970,225 |
| 10,511,256 | 82,265,889 |
|
| Redeemed | (91,493,432) | (794,721,903) |
| (73,599,329) | (577,844,321) |
|
| | (2,771,744) | (25,404,410) |
| (16,202,959) | (125,950,624) |
|
| B Class/Shares Authorized | 10,000,000 | | 10,000,000 | |
| Sold | 45,117 | 392,939 |
| 20,835 | 162,686 |
|
| Issued in reinvestment of distributions | 54,870 | 467,653 |
| 21,391 | 167,245 |
|
| Redeemed | (153,401) | (1,335,182) |
| (183,461) | (1,448,864) |
|
| | (53,414) | (474,590) |
| (141,235) | (1,118,933) |
|
| C Class/Shares Authorized | 250,000,000 | | 250,000,000 | |
| Sold | 9,618,153 | 83,806,631 |
| 2,928,355 | 23,068,339 |
|
| Issued in reinvestment of distributions | 3,555,455 | 30,263,365 |
| 1,199,209 | 9,371,585 |
|
| Redeemed | (9,406,833) | (81,707,044) |
| (9,937,584) | (78,010,192) |
|
| | 3,766,775 | 32,362,952 |
| (5,810,020) | (45,570,268) |
|
| R Class/Shares Authorized | 100,000,000 | | 100,000,000 | |
| Sold | 3,316,604 | 28,799,908 |
| 3,519,932 | 27,523,237 |
|
| Issued in reinvestment of distributions | 1,563,652 | 13,303,933 |
| 709,461 | 5,535,436 |
|
| Redeemed | (6,905,105) | (60,041,105) |
| (6,031,434) | (47,474,394) |
|
| | (2,024,849) | (17,937,264) |
| (1,802,041) | (14,415,721) |
|
| R6 Class/Shares Authorized | 50,000,000 | | N/A | |
| Sold | 3,038,963 | 26,326,976 |
| | |
| Issued in reinvestment of distributions | 24,425 | 210,088 |
| | |
| Redeemed | (63,993) | (557,908) |
| | |
| | 2,999,395 | 25,979,156 |
| | |
| Net increase (decrease) | (55,959,067) | $ | (497,411,893 | ) | (62,890,727) | $ | (495,740,206 | ) |
| | | | | |
| (1) July 26, 2013 (commencement of sale) through March 31, 2014 for the R6 Class. |
6. Affiliated Company Transactions
If a fund's holding represents ownership of 5% or more of the voting securities of a company, the company is affiliated as defined in the 1940 Act. A summary of transactions for each company which is or was an affiliate at or during the year ended March 31, 2014 follows:
|
| | | | | | | | | | | | | | | | | | |
| March 31, 2013 | | | | March 31, 2014 |
| Company | Share
Balance | Purchase
Cost | Sales Cost | Realized
Gain (Loss) | Dividend
Income | Share
Balance | Market
Value |
| Capitol Federal Financial, Inc. | 9,582,659 |
| $ | 14,555,263 |
| $ | 33,279,203 |
| $ | 1,012,986 |
| $ | 5,337,808 |
| 7,999,069 | $ | 100,388,316 |
|
ONE Gas, Inc.(1) | — |
| 80,244,176 |
| — |
| — |
| — |
| 2,396,071 | 86,090,831 |
|
Piedmont Natural Gas Co., Inc.(2) | 3,799,512 |
| 25,001,785 |
| 50,058,664 |
| 3,902,305 |
| 3,591,946 |
| 2,997,359 | (2) |
|
| WGL Holdings, Inc. | 2,580,517 |
| 20,268,526 |
| 3,859,655 |
| 387,108 |
| 4,365,383 |
| 2,998,417 | 120,116,585 |
|
| | | $ | 140,069,750 |
| $ | 87,197,522 |
| $ | 5,302,399 |
| $ | 13,295,137 |
| | $ | 306,595,732 |
|
| |
| (2) | Company was not an affiliate March 31, 2014. |
7. Fair Value Measurements
The fund’s investments valuation process is based on several considerations and may use multiple inputs to determine the fair value of the investments held by the fund. In conformity with accounting principles generally accepted in the United States of America, the inputs used to determine a valuation are classified into three broad levels.
| |
| • | Level 1 valuation inputs consist of unadjusted quoted prices in an active market for identical investments. |
| |
| • | Level 2 valuation inputs consist of direct or indirect observable market data (including quoted prices for comparable investments, evaluations of subsequent market events, interest rates, prepayment speeds, credit risk, etc.). These inputs also consist of quoted prices for identical investments initially expressed in local currencies that are adjusted through translation into U.S. dollars. |
| |
| • | Level 3 valuation inputs consist of unobservable data (including a fund’s own assumptions). |
The level classification is based on the lowest level input that is significant to the fair valuation measurement. The valuation inputs are not necessarily an indication of the risks associated with investing in these securities or other financial instruments.
The following is a summary of the level classifications as of period end. The Schedule of Investments provides additional information on the fund’s portfolio holdings.
|
| | | | | | | | |
| | Level 1 | Level 2 | Level 3 |
| Assets | | | |
| Investment Securities | | | |
| Common Stocks | $ | 7,079,581,773 |
| $ | 307,420,239 |
| — |
|
| Convertible Preferred Stocks | — |
| 1,212,554,844 |
| — |
|
| Convertible Bonds | — |
| 982,981,310 |
| — |
|
| Preferred Stocks | — |
| 379,181,486 |
| — |
|
| Temporary Cash Investments | 181,521,360 |
| 100,654,699 |
| — |
|
| | $ | 7,261,103,133 |
| $ | 2,982,792,578 |
| — |
|
| Other Financial Instruments | | | |
| Forward Foreign Currency Exchange Contracts | — |
| $ | 415,537 |
| — |
|
| | | | |
| Liabilities | | | |
| Other Financial Instruments | | | |
| Forward Foreign Currency Exchange Contracts | — |
| $ | (187,185 | ) | — |
|
8. Derivative Instruments
Foreign Currency Risk — The fund is subject to foreign currency exchange rate risk in the normal course of pursuing its investment objectives. The value of foreign investments held by a fund may be significantly affected by changes in foreign currency exchange rates. The dollar value of a foreign security generally decreases when the value of the dollar rises against the foreign currency in which the security is denominated and tends to increase when the value of the dollar declines against such foreign currency. A fund may enter into forward foreign currency exchange contracts to reduce a fund's exposure to foreign currency exchange rate fluctuations. The net U.S. dollar value of foreign currency underlying all contractual commitments held by a fund and the resulting unrealized appreciation or depreciation are determined daily. Realized gain or loss is recorded upon the termination of the contract. Net realized and unrealized gains or losses occurring during the holding period of forward foreign currency exchange contracts are a component of net realized gain (loss) on foreign currency transactions and change in net unrealized appreciation (depreciation) on translation of assets and liabilities in foreign currencies, respectively. A fund bears the risk of an unfavorable change in the foreign currency exchange rate underlying the forward contract. Additionally, losses, up to the fair value, may arise if the counterparties do not perform under the contract terms. The foreign currency risk derivative instruments held at period end as disclosed on the Schedule of Investments are indicative of the fund's typical volume during the period.
The value of foreign currency risk derivative instruments as of March 31, 2014, is disclosed on the Statement of Assets and Liabilities as an asset of $415,537 in unrealized appreciation on forward foreign currency exchange contracts and a liability of $187,185 in unrealized depreciation on forward foreign currency exchange contracts. For the year ended March 31, 2014, the effect of foreign currency risk derivative instruments on the Statement of Operations was $(12,593,390) in net realized gain (loss) on foreign currency transactions and $(1,439,298) in change in net unrealized appreciation (depreciation) on translation of assets and liabilities in foreign currencies.
9. Federal Tax Information
The tax character of distributions paid during the years ended March 31, 2014 and March 31, 2013 were as follows:
|
| | | | | | |
| | 2014 | 2013 |
| Distributions Paid From | | |
| Ordinary income | $ | 349,262,012 |
| $ | 253,049,629 |
|
| Long-term capital gains | $ | 518,684,351 |
| $ | 100,556,430 |
|
The book-basis character of distributions made during the year from net investment income or net realized gains may differ from their ultimate characterization for federal income tax purposes. These differences reflect the differing character of certain income items and net realized gains and losses for financial statement and tax purposes, and may result in reclassification among certain capital accounts on the financial statements.
As of March 31, 2014, the federal tax cost of investments and the components of distributable earnings on a tax-basis were as follows:
|
| | | |
| Federal tax cost of investments | $ | 8,414,071,144 |
|
| Gross tax appreciation of investments | $ | 1,884,207,961 |
|
| Gross tax depreciation of investments | (54,383,394 | ) |
| Net tax appreciation (depreciation) of investments | $ | 1,829,824,567 |
|
| Net tax appreciation (depreciation) on derivatives and translation of assets and liabilities in foreign currencies | $ | (106,202 | ) |
| Net tax appreciation (depreciation) | $ | 1,829,718,365 |
|
| Undistributed ordinary income | $ | 88,955,318 |
|
| Accumulated long-term gains | $ | 162,227,885 |
|
The difference between book-basis and tax-basis unrealized appreciation (depreciation) is attributable primarily to the tax deferral of losses on wash sales.
|
| | | | | | | | | | | | | | | |
| For a Share Outstanding Throughout the Years Ended March 31 (except as noted) | | | | |
| Per-Share Data | | | | | | | Ratios and Supplemental Data |
| | | Income From Investment Operations: | Distributions From: | | | Ratio to Average Net Assets of: | | |
| | Net Asset
Value,
Beginning
of Period | Net
Investment
Income
(Loss)(1) | Net
Realized
and
Unrealized
Gain (Loss) | Total From
Investment
Operations | Net
Investment
Income | Net
Realized
Gains | Total
Distributions | Net Asset
Value,
End
of Period | Total
Return(2) | Operating
Expenses | Net
Investment
Income
(Loss) | Portfolio
Turnover
Rate | Net
Assets,
End of
Period
(in thousands) |
| Investor Class | | | | | | | | | | | | | |
| 2014 | $8.47 | 0.20 | 0.92 | 1.12 | (0.20) | (0.55) | (0.75) | $8.84 | 13.64% | 0.93% | 2.31% | 57% |
| $5,406,362 |
|
| 2013 | $7.69 | 0.21 | 0.86 | 1.07 | (0.21) | (0.08) | (0.29) | $8.47 | 14.33% | 0.93% | 2.63% | 83% |
| $5,504,359 |
|
| 2012 | $7.43 | 0.20 | 0.25 | 0.45 | (0.19) | – | (0.19) | $7.69 | 6.24% | 0.95% | 2.69% | 115% |
| $5,363,783 |
|
| 2011 | $6.76 | 0.21 | 0.67 | 0.88 | (0.21) | – | (0.21) | $7.43 | 13.23% | 0.96% | 3.09% | 146% |
| $5,123,937 |
|
| 2010 | $5.42 | 0.18 | 1.33 | 1.51 | (0.17) | – | (0.17) | $6.76 | 28.04% | 0.97% | 2.93% | 105% |
| $3,829,492 |
|
| Institutional Class | | | | | | | | | | | | |
| 2014 | $8.47 | 0.22 | 0.92 | 1.14 | (0.21) | (0.55) | (0.76) | $8.85 | 13.85% | 0.73% | 2.51% | 57% |
| $1,422,725 |
|
| 2013 | $7.69 | 0.22 | 0.87 | 1.09 | (0.23) | (0.08) | (0.31) | $8.47 | 14.69% | 0.73% | 2.83% | 83% |
| $1,527,723 |
|
| 2012 | $7.44 | 0.21 | 0.24 | 0.45 | (0.20) | – | (0.20) | $7.69 | 6.31% | 0.75% | 2.89% | 115% |
| $1,316,758 |
|
| 2011 | $6.77 | 0.23 | 0.66 | 0.89 | (0.22) | – | (0.22) | $7.44 | 13.60% | 0.76% | 3.29% | 146% |
| $894,544 |
|
| 2010 | $5.42 | 0.19 | 1.34 | 1.53 | (0.18) | – | (0.18) | $6.77 | 28.30% | 0.77% | 3.13% | 105% |
| $792,024 |
|
| A Class | | | | | | | | | | | | | |
| 2014 | $8.47 | 0.18 | 0.91 | 1.09 | (0.17) | (0.55) | (0.72) | $8.84 | 13.36% | 1.18% | 2.06% | 57% |
| $2,722,731 |
|
| 2013 | $7.69 | 0.19 | 0.86 | 1.05 | (0.19) | (0.08) | (0.27) | $8.47 | 14.05% | 1.18% | 2.38% | 83% |
| $2,631,737 |
|
| 2012 | $7.43 | 0.18 | 0.25 | 0.43 | (0.17) | – | (0.17) | $7.69 | 5.98% | 1.20% | 2.44% | 115% |
| $2,512,840 |
|
| 2011 | $6.76 | 0.20 | 0.66 | 0.86 | (0.19) | – | (0.19) | $7.43 | 12.95% | 1.21% | 2.84% | 146% |
| $2,188,714 |
|
| 2010 | $5.42 | 0.17 | 1.32 | 1.49 | (0.15) | – | (0.15) | $6.76 | 27.71% | 1.22% | 2.68% | 105% |
| $1,385,436 |
|
|
| | | | | | | | | | | | | | | |
| For a Share Outstanding Throughout the Years Ended March 31 (except as noted) | | | | |
| Per-Share Data | | | | | | | Ratios and Supplemental Data |
| | | Income From Investment Operations: | Distributions From: | | | Ratio to Average Net Assets of: | | |
| | Net Asset
Value,
Beginning
of Period | Net
Investment
Income
(Loss)(1) | Net
Realized
and
Unrealized
Gain (Loss) | Total From
Investment
Operations | Net
Investment
Income | Net
Realized
Gains | Total
Distributions | Net Asset
Value,
End
of Period | Total
Return(2) | Operating
Expenses | Net
Investment
Income
(Loss) | Portfolio
Turnover
Rate | Net
Assets,
End of
Period
(in thousands) |
| B Class | | | | | | | | | | | | | |
| 2014 | $8.48 | 0.11 | 0.92 | 1.03 | (0.11) | (0.55) | (0.66) | $8.85 | 12.51% | 1.93% | 1.31% | 57% |
| $7,151 |
|
| 2013 | $7.70 | 0.13 | 0.86 | 0.99 | (0.13) | (0.08) | (0.21) | $8.48 | 13.20% | 1.93% | 1.63% | 83% |
| $7,304 |
|
| 2012 | $7.44 | 0.12 | 0.26 | 0.38 | (0.12) | – | (0.12) | $7.70 | 5.18% | 1.95% | 1.69% | 115% |
| $7,716 |
|
| 2011 | $6.77 | 0.15 | 0.66 | 0.81 | (0.14) | – | (0.14) | $7.44 | 12.08% | 1.96% | 2.09% | 146% |
| $8,102 |
|
| 2010 | $5.42 | 0.12 | 1.33 | 1.45 | (0.10) | – | (0.10) | $6.77 | 26.92% | 1.97% | 1.93% | 105% |
| $7,383 |
|
| C Class | | | | | | | | | | | | | |
| 2014 | $8.47 | 0.12 | 0.91 | 1.03 | (0.11) | (0.55) | (0.66) | $8.84 | 12.53% | 1.93% | 1.31% | 57% |
| $521,688 |
|
| 2013 | $7.69 | 0.13 | 0.86 | 0.99 | (0.13) | (0.08) | (0.21) | $8.47 | 13.21% | 1.93% | 1.63% | 83% |
| $467,913 |
|
| 2012 | $7.44 | 0.12 | 0.25 | 0.37 | (0.12) | – | (0.12) | $7.69 | 5.05% | 1.95% | 1.69% | 115% |
| $469,355 |
|
| 2011 | $6.77 | 0.15 | 0.66 | 0.81 | (0.14) | – | (0.14) | $7.44 | 12.25% | 1.96% | 2.09% | 146% |
| $384,918 |
|
| 2010 | $5.42 | 0.12 | 1.33 | 1.45 | (0.10) | – | (0.10) | $6.77 | 26.74% | 1.97% | 1.93% | 105% |
| $193,776 |
|
| R Class | | | | | | | | | | | | | |
| 2014 | $8.45 | 0.16 | 0.91 | 1.07 | (0.15) | (0.55) | (0.70) | $8.82 | 13.12% | 1.43% | 1.81% | 57% |
| $169,852 |
|
| 2013 | $7.67 | 0.17 | 0.86 | 1.03 | (0.17) | (0.08) | (0.25) | $8.45 | 13.81% | 1.43% | 2.13% | 83% |
| $179,855 |
|
| 2012 | $7.42 | 0.16 | 0.24 | 0.40 | (0.15) | – | (0.15) | $7.67 | 5.59% | 1.45% | 2.19% | 115% |
| $177,061 |
|
| 2011 | $6.75 | 0.18 | 0.66 | 0.84 | (0.17) | – | (0.17) | $7.42 | 12.68% | 1.46% | 2.59% | 146% |
| $141,693 |
|
| 2010 | $5.41 | 0.15 | 1.32 | 1.47 | (0.13) | – | (0.13) | $6.75 | 27.44% | 1.47% | 2.43% | 105% |
| $92,239 |
|
| R6 Class | | | | | | | | | | | | | |
2014(3) | $8.94 | 0.17 | 0.46 | 0.63 | (0.17) | (0.55) | (0.72) | $8.85 | 7.41% | 0.58%(4) | 2.93%(4) | 57%(5) |
| $26,550 |
|
|
| | | | |
| Notes to Financial Highlights | | |
| |
| (1) | Computed using average shares outstanding throughout the period. |
| |
| (2) | Total returns are calculated based on the net asset value of the last business day and do not reflect applicable sales charges, if any. Total returns for periods less than one year are not annualized. |
| |
| (3) | July 26, 2013 (commencement of sale) through March 31, 2014. |
| |
| (5) | Portfolio turnover is calculated at the fund level. Percentage indicated was calculated for the year ended March 31, 2014. |
See Notes to Financial Statements.
|
|
| Report of Independent Registered Public Accounting Firm |
To the Board of Directors and Shareholders of
American Century Capital Portfolios, Inc.:
We have audited the accompanying statement of assets and liabilities, including the schedule of investments, of Equity Income Fund (the “Fund”), one of the funds constituting American Century Capital Portfolios, Inc., as of March 31, 2014, and the related statement of operations for the year then ended, the statements of changes in net assets for each of the two years in the period then ended, and the financial highlights for each of the periods presented. These financial statements and financial highlights are the responsibility of the Fund's management. Our responsibility is to express an opinion on these financial statements and financial highlights based on our audits.
We conducted our audits in accordance with the standards of the Public Company Accounting Oversight Board (United States). Those standards require that we plan and perform the audit to obtain reasonable assurance about whether the financial statements and financial highlights are free of material misstatement. The Fund is not required to have, nor were we engaged to perform, an audit of its internal control over financial reporting. Our audits included consideration of internal control over financial reporting as a basis for designing audit procedures that are appropriate in the circumstances, but not for the purpose of expressing an opinion on the effectiveness of the Fund's internal control over financial reporting. Accordingly, we express no such opinion. An audit also includes examining, on a test basis, evidence supporting the amounts and disclosures in the financial statements, assessing the accounting principles used and significant estimates made by management, as well as evaluating the overall financial statement presentation. Our procedures included confirmation of securities owned as of March 31, 2014, by correspondence with the custodian and brokers; where replies were not received from brokers, we performed other auditing procedures. We believe that our audits provide a reasonable basis for our opinion.
In our opinion, the financial statements and financial highlights referred to above present fairly, in all material respects, the financial position of Equity Income Fund of American Century Capital Portfolios, Inc. as of March 31, 2014, the results of its operations for the year then ended, the changes in its net assets for each of the two years in the period then ended, and the financial highlights for each of the periods presented, in conformity with accounting principles generally accepted in the United States of America.
Deloitte & Touche LLP
Kansas City, Missouri
May 16, 2014
The Board of Directors
The individuals listed below serve as directors of the funds. Each director will continue to serve in this capacity until death, retirement, resignation or removal from office. The board has adopted a mandatory retirement age for directors who are not “interested persons,” as that term is defined in the Investment Company Act (independent directors). Independent directors shall retire by December 31 of the year in which they reach their 75th birthday.
Mr. Thomas is an “interested person” because he currently serves as President and Chief Executive Officer of American Century Companies, Inc. (ACC), the parent company of American Century Investment Management, Inc. (ACIM or the advisor). Mr. Fink is treated as an “interested person” because of his recent employment with ACC and American Century Services, LLC (ACS). The other directors (more than three-fourths of the total number) are independent. They are not employees, directors or officers of, and have no financial interest in, ACC or any of its wholly owned, direct or indirect, subsidiaries, including ACIM, American Century Investment Services, Inc. (ACIS) and ACS, and do not have any other affiliations, positions, or relationships that would cause them to be considered “interested persons” under the Investment Company Act. The directors serve in this capacity for seven (in the case of Mr. Thomas, 15) registered investment companies in the American Century Investments family of funds.
The following table presents additional information about the directors. The mailing address for each director is 4500 Main Street, Kansas City, Missouri 64111.
|
| | | | | |
Name (Year of Birth) | Position(s) Held with Funds | Length of Time Served | Principal Occupation(s) During Past 5 Years | Number of American Century Portfolios Overseen by Director | Other Directorships Held During Past
5 Years |
| Independent Directors |
Thomas A. Brown
(1940) | Director | Since 1980 | Managing Member, Associated Investments, LLC (real estate investment company); Brown Cascade Properties, LLC (real estate investment company) (2001 to 2009) | 73 | None |
Andrea C. Hall
(1945) | Director | Since 1997 | Retired | 73 | None |
Jan M. Lewis
(1957) | Director | Since 2011 | Retired; President and Chief Executive Officer, Catholic Charities of Northeast Kansas (human services organization) (2006 to 2013) | 73 | None |
James A. Olson
(1942) | Director and Chairman of the Board | Since 2007 (Chairman since 2014) | Member, Plaza Belmont LLC (private equity fund manager) | 73 | Saia, Inc. (2002 to 2012) and EPR Properties (2003 to 2013) |
|
| | | | | |
Name (Year of Birth) | Position(s) Held with Funds | Length of Time Served | Principal Occupation(s) During Past 5 Years | Number of American Century Portfolios Overseen by Director | Other Directorships Held During Past
5 Years |
| Independent Directors |
M. Jeannine Strandjord
(1945) | Director | Since 1994 | Retired | 73 | Euronet Worldwide Inc.; Charming Shoppes, Inc. (2006 to 2010); and DST Systems Inc. (1996 to 2012) |
John R. Whitten
(1946) | Director | Since 2008 | Retired | 73 | Rudolph Technologies, Inc. |
Stephen E. Yates
(1948) | Director | Since 2012 | Retired; Executive Vice President, Technology & Operations, KeyCorp. (computer services) (2004 to 2010) | 73 | Applied Industrial Technologies, Inc. (2001 to 2010) |
| Interested Directors | | | | |
Barry Fink
(1955) | Director | Since 2012 | Retired; Executive Vice President, ACC (September 2007 to February 2013); President, ACS (October 2007 to February 2013); Chief Operating Officer, ACC (September 2007 to November 2012) | 73 | None |
Jonathan S. Thomas
(1963) | Director and President | Since 2007 | President and Chief Executive Officer, ACC (March 2007 to present). Also serves as Chief Executive Officer and Manager, ACS; Executive Vice President, ACIM; Director, ACC, ACIM and other ACC subsidiaries | 115 | None |
Officers
The following table presents certain information about the executive officers of the funds. Each officer serves as an officer for each of the 15 investment companies in the American Century family of funds, unless otherwise noted. No officer is compensated for his or her service as an officer of the funds. The listed officers are interested persons of the funds and are appointed or re-appointed on an annual basis. The mailing address for each officer listed below is 4500 Main Street, Kansas City, Missouri 64111.
|
| | |
Name (Year of Birth) | Offices with
the Funds | Principal Occupation(s) During the Past Five Years |
Jonathan S.
Thomas
(1963) | Director and
President
since 2007 | President and Chief Executive Officer, ACC (March 2007 to present). Also serves as Chief Executive Officer and Manager, ACS; Executive Vice President, ACIM; Director, ACC, ACIM and other ACC subsidiaries |
Amy D. Shelton
(1964) | Chief Compliance
Officer since 2014 | Chief Compliance Officer, American Century funds, (March 2014 to present); Chief Compliance Officer, ACIM (February 2014 to present); Chief Compliance Officer, ACIS (October 2009 to present); Vice President, Client Interactions and Marketing, ACIS (February 2013 to January 2014); Director, Client Interactions and Marketing, ACIS (June 2007 to January 2013). Also serves as Vice President, ACIS |
Charles A.
Etherington
(1957) | General Counsel
since 2007 and
Senior Vice
President since 2006 | Attorney, ACC (February 1994 to present); Vice President, ACC (November 2005 to present); General Counsel, ACC (March 2007 to present). Also serves as General Counsel, ACIM, ACS, ACIS and other ACC subsidiaries; and Senior Vice President, ACIM and ACS |
C. Jean Wade
(1964) | Vice President,
Treasurer and
Chief Financial
Officer since 2012 | Vice President, ACS (February 2000 to present) |
Robert J.
Leach
(1966) | Vice President
since 2006 and
Assistant Treasurer
since 2012 | Vice President, ACS (February 2000 to present) |
David H.
Reinmiller
(1963) | Vice President
since 2000 | Attorney, ACC (January 1994 to present); Associate General Counsel, ACC (January 2001 to present). Also serves as Vice President, ACIM and ACS |
Ward D.
Stauffer
(1960) | Secretary
since 2005 | Attorney, ACC (June 2003 to present) |
The Statement of Additional Information has additional information about the fund's directors and is available without charge, upon request, by calling 1-800-345-2021.
Retirement Account Information
As required by law, distributions you receive from certain IRAs are subject to federal income tax withholding, unless you elect not to have withholding apply. Tax will be withheld on the total amount withdrawn even though you may be receiving amounts that are not subject to withholding, such as nondeductible contributions. In such case, excess amounts of withholding could occur. You may adjust your withholding election so that a greater or lesser amount will be withheld.
If you don’t want us to withhold on this amount, you must notify us to not withhold the federal income tax. You may notify us in writing or in certain situations by telephone or through other electronic means. For systematic withdrawals, your withholding election will remain in effect until revoked or changed by filing a new election. You have the right to revoke your election at any time.
Remember, even if you elect not to have income tax withheld, you are liable for paying income tax on the taxable portion of your withdrawal. If you elect not to have income tax withheld or you don’t have enough income tax withheld, you may be responsible for payment of estimated tax. You may incur penalties under the estimated tax rules if your withholding and estimated tax payments are not sufficient. You can reduce or defer the income tax on a distribution by directly or indirectly rolling such distribution over to another IRA or eligible plan. You should consult your tax advisor for additional information.
State tax will be withheld if, at the time of your distribution, your address is within one of the mandatory withholding states and you have federal income tax withheld (or as otherwise required by state law). State taxes will be withheld from your distribution in accordance with the respective state rules.
Distributions you receive from 403(b), 457 and qualified plans are subject to special tax and withholding rules. Your plan administrator or plan sponsor is required to provide you with a special tax notice explaining those rules at the time you request a distribution. If applicable, federal and/or state taxes may be withheld from your distribution amount.
Proxy Voting Policies
A description of the policies that the fund's investment advisor uses in exercising the voting rights associated with the securities purchased and/or held by the fund is available without charge, upon request, by calling 1-800-345-2021. It is also available on the "About Us" page of American Century Investments’ website at americancentury.com and on the Securities and Exchange Commission’s website at sec.gov. Information regarding how the investment advisor voted proxies relating to portfolio securities during the most recent 12-month period ended June 30 is available on the "About Us" page at americancentury.com. It is also available at sec.gov.
Quarterly Portfolio Disclosure
The fund files its complete schedule of portfolio holdings with the Securities and Exchange Commission (SEC) for the first and third quarters of each fiscal year on Form N-Q. The fund’s Forms N-Q are available on the SEC’s website at sec.gov, and may be reviewed and copied at the SEC’s Public Reference Room in Washington, DC. Information on the operation of the Public Reference Room may be obtained by calling 1-800-SEC-0330. The fund also makes its complete schedule of portfolio holdings for the most recent quarter of its fiscal year available on its
website at americancentury.com and, upon request, by calling 1-800-345-2021.
Other Tax Information
The following information is provided pursuant to provisions of the Internal Revenue Code.
The fund hereby designates up to the maximum amount allowable as qualified dividend income for the fiscal year ended March 31, 2014.
For corporate taxpayers, the fund hereby designates $283,280,551, or up to the maximum amount allowable, of ordinary income distributions paid during the fiscal year ended March 31, 2014 as qualified for the corporate dividends received deduction.
The fund hereby designates $122,978,573 as qualified short-term capital gain distributions for purposes of Internal Revenue Code Section 871.
The fund hereby designates $518,684,351, or up to the maximum amount allowable, as long-term capital gain distributions for the fiscal year ended March 31, 2014.
|
| | |
| |
| | | |
| Contact Us | americancentury.com | |
| Automated Information Line | 1-800-345-8765 | |
| Investor Services Representative | 1-800-345-2021 or 816-531-5575 | |
| Investors Using Advisors | 1-800-378-9878 | |
| Business, Not-For-Profit, Employer-Sponsored Retirement Plans | 1-800-345-3533 | |
| Banks and Trust Companies, Broker-Dealers, Financial Professionals, Insurance Companies | 1-800-345-6488 | |
| Telecommunications Relay Service for the Deaf | 711 | |
| | | |
| American Century Capital Portfolios, Inc. | |
| | | |
Investment Advisor: American Century Investment Management, Inc. Kansas City, Missouri | |
| | | |
| This report and the statements it contains are submitted for the general information of our shareholders. The report is not authorized for distribution to prospective investors unless preceded or accompanied by an effective prospectus. | |
| | | |
©2014 American Century Proprietary Holdings, Inc. All rights reserved.
CL-ANN-82092 1405
| |
|
| |
ANNUAL REPORT | MARCH 31, 2014 |
Large Company Value Fund
|
| |
| President’s Letter | |
| Performance | |
| Portfolio Commentary | |
| Fund Characteristics | |
| Shareholder Fee Example | |
| Schedule of Investments | |
| Statement of Assets and Liabilities | |
| Statement of Operations | |
| Statement of Changes in Net Assets | |
| Notes to Financial Statements | |
| Financial Highlights | |
| Report of Independent Registered Public Accounting Firm | |
| Management | |
| Additional Information | |
Any opinions expressed in this report reflect those of the author as of the date of the report, and do not necessarily represent the opinions of American Century Investments® or any other person in the American Century Investments organization. Any such opinions are subject to change at any time based upon market or other conditions and American Century Investments disclaims any responsibility to update such opinions. These opinions may not be relied upon as investment advice and, because investment decisions made by American Century Investments funds are based on numerous factors, may not be relied upon as an indication of trading intent on behalf of any American Century Investments fund. Security examples are used for representational purposes only and are not intended as recommendations to purchase or sell securities. Performance information for comparative indices and securities is provided to American Century Investments by third party vendors. To the best of American Century Investments’ knowledge, such information is accurate at the time of printing.
|
| |
| Dear Investor:
Thank you for reviewing this annual report for the 12 months ended March 31, 2014. It provides investment performance, market analysis, and portfolio information, presented with the expert perspective of our portfolio management team.
Annual reports remain important vehicles for conveying information about fund returns, including key factors that affected fund performance. For additional, updated investment and market insights, we encourage you to visit our website, americancentury.com.
|
| Jonathan Thomas |
Monetary Policy-Driven, Mostly “Risk-On” Results in the U.S. and Europe
Stimulative monetary policies and expectations of economic improvement helped drive financial market returns during the reporting period. We believe the combination of optimism about the economy, low costs of capital in the money markets, and central bank purchases of longer-maturity fixed income securities (quantitative easing, or QE) helped persuade investors to seek risk and yield, especially in the U.S. and Europe. Stock index returns were strong in these markets, particularly at the smaller capitalization end of the company size spectrum. The MSCI Europe and S&P 500 Indices advanced 24.50% and 21.86%, respectively, and their smaller capitalization counterparts performed even better. In the U.S., growth stocks generally outperformed value stocks.
Some of the same growth and optimism factors that drove stocks higher, plus hints that QE tapering would begin in the U.S., hampered U.S. government bond returns, which dipped into negative territory for the reporting period. On the other hand, U.S. corporate bonds, especially high-yield corporates, posted mostly positive returns because of their higher yields, declining spreads (yield differences between corporate and similar-maturity U.S. Treasury securities), and relatively low default rates. At the other end of the U.S. bond spectrum, Treasury inflation-protected securities (TIPS) underperformed, hurt by the combination of rising yields and low inflation.
Looking ahead, we see further signs of economic improvement for the U.S. in 2014, but headwinds persist. Interest rates could normalize further, and economic growth and U.S. employment levels remain subpar compared with past post-recession periods. In this environment, we continue to believe in a disciplined, diversified, long-term investment approach, using professionally managed stock and bond portfolios—as appropriate—for meeting financial goals. We appreciate your continued trust in us.
Sincerely,
Jonathan Thomas
President and Chief Executive Officer
American Century Investments
|
| | | | | | |
| Total Returns as of March 31, 2014 | | | |
| | | | Average Annual Returns | |
| | Ticker Symbol | 1 Year | 5 Years | 10 Years | Since Inception | Inception Date |
| Investor Class | ALVIX | 21.57% | 19.93% | 6.30% | 5.92% | 7/30/99 |
| Russell 1000 Value Index | – | 21.57% | 21.74% | 7.58% | 5.92% | – |
| S&P 500 Index | – | 21.86% | 21.14% | 7.41% | 4.30% | – |
| Institutional Class | ALVSX | 21.78% | 20.19% | 6.52% | 6.16% | 8/10/01 |
A Class(1) | ALPAX | | | | | 10/26/00 |
| No sales charge* | | 21.27% | 19.63% | 6.04% | 6.57% | |
| With sales charge* | | 14.33% | 18.23% | 5.41% | 6.10% | |
| B Class | ALBVX | | | | | 1/31/03 |
| No sales charge* | | 20.45% | 18.75% | 5.24% | 7.42% | |
| With sales charge* | | 16.45% | 18.65% | 5.24% | 7.42% | |
| C Class | ALPCX | 20.36% | 18.74% | 5.25% | 5.47% | 11/7/01 |
| R Class | ALVRX | 20.96% | 19.33% | 5.77% | 6.81% | 8/29/03 |
| R6 Class | ALVDX | – | – | – | 9.90%(2) | 7/26/13 |
| |
| * | Sales charges include initial sales charges and contingent deferred sales charges (CDSCs), as applicable. A Class shares have a 5.75% maximum initial sales charge and may be subject to a maximum CDSC of 1.00%. B Class shares redeemed within six years of purchase are subject to a CDSC that declines from 5.00% during the first year to 0.00% after the sixth year. C Class shares redeemed within 12 months of purchase are subject to a maximum CDSC of 1.00%. The SEC requires that mutual funds provide performance information net of maximum sales charges in all cases where charges could be applied. |
| |
| (1) | Prior to December 3, 2007, the A Class was referred to as the Advisor Class and did not have a front-end sales charge. Performance prior to that date has been adjusted to reflect this charge. |
| |
| (2) | Total returns for periods less than one year are not annualized. |
Data presented reflect past performance. Past performance is no guarantee of future results. Current performance may be higher or lower than the performance shown. Investment return and principal value will fluctuate, and redemption value may be more or less than original cost. To obtain performance data current to the most recent month end, please call 1-800-345-2021 or visit americancentury.com.
Unless otherwise indicated, performance reflects Investor Class shares; performance for other share classes will vary due to differences in fee structure. For information about other share classes available, please consult the prospectus. Data assumes reinvestment of dividends and capital gains, and none of the charts reflect the deduction of taxes that a shareholder would pay on fund distributions or the redemption of fund shares. Returns for the indices are provided for comparison. The fund’s total returns include operating expenses (such as transaction costs and management fees) that reduce returns, while the total returns of the indices do not.
|
|
| Growth of $10,000 Over 10 Years |
| $10,000 investment made March 31, 2004 |
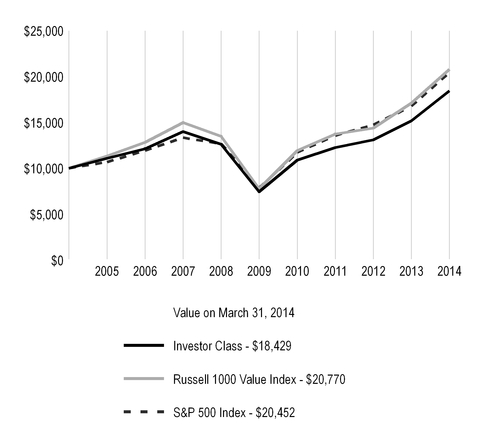
|
| | | | | | |
| Total Annual Fund Operating Expenses |
| Investor Class | Institutional Class | A Class | B Class | C Class | R Class | R6 Class |
| 0.87% | 0.67% | 1.12% | 1.87% | 1.87% | 1.37% | 0.52% |
The total annual fund operating expenses shown is as stated in the fund’s prospectus current as of the date of this report. The prospectus may vary from the expense ratio shown elsewhere in this report because it is based on a different time period, includes acquired fund fees and expenses, and, if applicable, does not include fee waivers or expense reimbursements.
Data presented reflect past performance. Past performance is no guarantee of future results. Current performance may be higher or lower than the performance shown. Investment return and principal value will fluctuate, and redemption value may be more or less than original cost. To obtain performance data current to the most recent month end, please call 1-800-345-2021 or visit americancentury.com.
Unless otherwise indicated, performance reflects Investor Class shares; performance for other share classes will vary due to differences in fee structure. For information about other share classes available, please consult the prospectus. Data assumes reinvestment of dividends and capital gains, and none of the charts reflect the deduction of taxes that a shareholder would pay on fund distributions or the redemption of fund shares. Returns for the indices are provided for comparison. The fund’s total returns include operating expenses (such as transaction costs and management fees) that reduce returns, while the total returns of the indices do not.
Portfolio Managers: Brendan Healy and Matt Titus
Performance Summary
Large Company Value returned 21.57%* for the 12 months ended March 31, 2014. By comparison, its benchmark, the Russell 1000 Value Index, returned 21.57%. The broader market, as measured by the S&P 500 Index, returned 21.86%. The portfolio’s return reflects operating expenses, while the indices’ returns do not.
The U.S. stock market generated strong gains during the one-year reporting period. When the period began, riskier asset classes led the market, as the Federal Reserve’s (Fed) bond-buying programs continued. Market leadership changed after the Fed suggested it might start tapering its asset purchases if economic conditions improved. Higher-quality stocks came into favor and as interest rates rose, higher-yielding stocks, such as real estate investment trusts (REITs) and utilities, declined. As the Fed sought to calm fears about eventual tapering, riskier stocks posted gains, but they reversed direction in mid-August on positive economic data, which suggested the Fed might announce tapering as soon as September. After the Fed surprised the markets by making no changes to its stimulus programs, lower-quality, riskier stocks rallied and continued to outperform through the end of 2013. In December, the U.S. economy showed new signs of strength and the Fed announced it would begin modestly scaling back its asset purchases in January 2014. As interest rates trended down in the last three months of the reporting period, yield-oriented securities, including utilities and REITs, rallied. For the reporting period overall, riskier, lower-yielding, and lower-quality stocks outperformed. Though value stocks recorded significant gains, they underperformed growth stocks. Large-cap value stocks underperformed both mid-cap value stocks and small-cap value stocks. In this environment, the portfolio received positive results in absolute terms from all 10 of the sectors in which it was invested. It also matched the performance of its benchmark.
Financials Added Most to Relative Returns
In financials, advantageous subsector allocation and security selection added to relative performance. The portfolio was significantly underweight REITs, which we have considered generally overvalued for some time. REITs underperformed as interest rates increased. Within capital markets, the portfolio had an overweight position relative to the benchmark in Ameriprise Financial. The company, which has a solid return on capital, benefited from the strength of the equity market. At the end of the reporting period, we still considered its valuation attractive. In the insurance industry, the portfolio benefited from an overweight position in MetLife. The company, which announced a dividend increase, gained some clarity on the regulatory front and is likely to earn a higher yield on its investible assets resulting from higher interest rates.
Underweight Position in Utilities Contributed Positively
An underweight position in utilities added to relative returns, as interest rates began to increase during the reporting period and utilities—which are sensitive to changes in rates—posted the second-weakest performance in the benchmark. For some time, we have considered many of these stocks overvalued.
Energy Generated Positive Returns
Security selection in the energy sector, especially in the energy equipment and services industry, contributed positively. Among large integrated energy companies, the portfolio benefited from an investment in Total SA. The French oil and gas company outperformed its European peers. Conversely, the portfolio was hampered by an overweight position in Chevron, which trailed some of its peers, including Exxon Mobil.
*All fund returns referenced in this commentary are for Investor Class shares.
Information Technology Provided Notable Contributors
In the information technology sector, a top contributor was Microsoft, which announced solid earnings against low expectations. Microsoft’s enterprise software division has continued to perform well and at the end of the reporting period, we still considered the stock undervalued. An overweight position in Applied Materials was also advantageous. The company is benefiting as its customers increase capital equipment spending on new technology, such as 3D memory. Applied Materials is widely expected to see strong profit margin improvement and earnings growth as a result of its proposed acquisition of Tokyo Electron.
Consumer Discretionary Detracted from Results
Security selection in the consumer discretionary sector dampened results. The portfolio was overweight Target, which reported weak comparable-store sales. Target also had weaker-than-expected sales from its expansion into the Canadian market.
Telecommunication Services and Health Care Slowed Relative Performance
The portfolio was hampered by its lack of exposure to wireless telecommunication services, an industry segment that generated strong gains in the benchmark.
Although the portfolio benefited from an overweight position in health care, it was hindered by security selection. It did not hold any stocks in the life sciences tools and services industry, which performed well in the benchmark.
Industrials Supplied Top Detractor
In the industrials sector, which added to relative performance overall, an overweight position in ADT detracted. The stock declined on concerns about the security monitoring company’s growth, which has slowed because of a drop in new subscribers and higher-than-anticipated customer churn. Investors may also be reacting to the favorable treatment of a shareholder activist, who liquidated a large position in late 2013. We still view ADT as undervalued.
Outlook
We continue to be bottom-up investment managers, evaluating each company individually and building the portfolio one stock at a time. As of March 31, 2014, we saw attractive opportunities in energy, information technology, and consumer discretionary, as reflected by the portfolio’s overweight positions in these sectors. Conversely, smaller relative weightings were given to the utilities and telecommunication services sectors. We are still finding greater value opportunities among mega-cap stocks and have maintained the portfolio’s bias toward them.
|
| |
| MARCH 31, 2014 |
| Top Ten Holdings | % of net assets |
| Chevron Corp. | 4.2% |
| JPMorgan Chase & Co. | 3.9% |
| Johnson & Johnson | 3.6% |
| Wells Fargo & Co. | 3.2% |
| Exxon Mobil Corp. | 3.0% |
| Pfizer, Inc. | 2.5% |
| General Electric Co. | 2.3% |
| Merck & Co., Inc. | 2.3% |
| Citigroup, Inc. | 2.1% |
| U.S. Bancorp | 2.1% |
| | |
| Top Five Industries | % of net assets |
| Commercial Banks | 14.9% |
| Oil, Gas and Consumable Fuels | 12.7% |
| Pharmaceuticals | 8.4% |
| Insurance | 6.0% |
| Capital Markets | 4.5% |
| | |
| Types of Investments in Portfolio | % of net assets |
| Common Stocks | 98.9% |
| Temporary Cash Investments | 1.0% |
| Other Assets and Liabilities | 0.1% |
Fund shareholders may incur two types of costs: (1) transaction costs, including sales charges (loads) on purchase payments and redemption/exchange fees; and (2) ongoing costs, including management fees; distribution and service (12b-1) fees; and other fund expenses. This example is intended to help you understand your ongoing costs (in dollars) of investing in your fund and to compare these costs with the ongoing cost of investing in other mutual funds.
The example is based on an investment of $1,000 made at the beginning of the period and held for the entire period from October 1, 2013 to March 31, 2014.
Actual Expenses
The table provides information about actual account values and actual expenses for each class. You may use the information, together with the amount you invested, to estimate the expenses that you paid over the period. First, identify the share class you own. Then simply divide your account value by $1,000 (for example, an $8,600 account value divided by $1,000 = 8.6), then multiply the result by the number under the heading “Expenses Paid During Period” to estimate the expenses you paid on your account during this period.
If you hold Investor Class shares of any American Century Investments fund, or Institutional Class shares of the American Century Diversified Bond Fund, in an American Century Investments account (i.e., not a financial intermediary or retirement plan account), American Century Investments may charge you a $12.50 semiannual account maintenance fee if the value of those shares is less than $10,000. We will redeem shares automatically in one of your accounts to pay the $12.50 fee. In determining your total eligible investment amount, we will include your investments in all personal accounts (including American Century Investments Brokerage accounts) registered under your Social Security number. Personal accounts include individual accounts, joint accounts, UGMA/UTMA accounts, personal trusts, Coverdell Education Savings Accounts and IRAs (including traditional, Roth, Rollover, SEP-, SARSEP- and SIMPLE-IRAs), and certain other retirement accounts. If you have only business, business retirement, employer-sponsored or American Century Investments Brokerage accounts, you are currently not subject to this fee. If you are subject to the Account Maintenance Fee, your account value could be reduced by the fee amount.
Hypothetical Example for Comparison Purposes
The table also provides information about hypothetical account values and hypothetical expenses based on the actual expense ratio of each class of your fund and an assumed rate of return of 5% per year before expenses, which is not the actual return of a fund’s share class. The hypothetical account values and expenses may not be used to estimate the actual ending account balance or expenses you paid for the period. You may use this information to compare the ongoing costs of investing in your fund and other funds. To do so, compare this 5% hypothetical example with the 5% hypothetical examples that appear in the shareholder reports of the other funds.
Please note that the expenses shown in the table are meant to highlight your ongoing costs only and do not reflect any transactional costs, such as sales charges (loads) or redemption/exchange fees. Therefore, the table is useful in comparing ongoing costs only, and will not help you determine the relative total costs of owning different funds. In addition, if these transactional costs were included, your costs would have been higher.
|
| | | | |
| | Beginning
Account Value
10/1/13 | Ending
Account Value
3/31/14 | Expenses Paid
During Period(1)10/1/13 - 3/31/14 | Annualized
Expense Ratio(1) |
| Actual | | | | |
| Investor Class | $1,000 | $1,120.70 | $4.44 | 0.84% |
| Institutional Class | $1,000 | $1,123.20 | $3.39 | 0.64% |
| A Class | $1,000 | $1,120.80 | $5.76 | 1.09% |
| B Class | $1,000 | $1,116.10 | $9.71 | 1.84% |
| C Class | $1,000 | $1,115.10 | $9.70 | 1.84% |
| R Class | $1,000 | $1,117.90 | $7.08 | 1.34% |
| R6 Class | $1,000 | $1,124.00 | $2.59 | 0.49% |
| Hypothetical | | | | |
| Investor Class | $1,000 | $1,020.74 | $4.23 | 0.84% |
| Institutional Class | $1,000 | $1,021.74 | $3.23 | 0.64% |
| A Class | $1,000 | $1,019.50 | $5.49 | 1.09% |
| B Class | $1,000 | $1,015.76 | $9.25 | 1.84% |
| C Class | $1,000 | $1,015.76 | $9.25 | 1.84% |
| R Class | $1,000 | $1,018.25 | $6.74 | 1.34% |
| R6 Class | $1,000 | $1,022.49 | $2.47 | 0.49% |
| |
| (1) | Expenses are equal to the class's annualized expense ratio listed in the table above, multiplied by the average account value over the period, multiplied by 182, the number of days in the most recent fiscal half-year, divided by 365, to reflect the one-half year period. |
MARCH 31, 2014
|
| | | | |
| | Shares | Value |
| COMMON STOCKS — 98.9% |
| AEROSPACE AND DEFENSE — 2.9% |
| General Dynamics Corp. | 62,700 | $ | 6,829,284 |
|
| Honeywell International, Inc. | 62,500 | 5,797,500 |
|
| Raytheon Co. | 43,700 | 4,317,123 |
|
| Textron, Inc. | 124,800 | 4,903,392 |
|
| | | 21,847,299 |
|
| AIRLINES — 0.4% | | |
| Southwest Airlines Co. | 116,400 | 2,748,204 |
|
| AUTOMOBILES — 1.2% |
| Ford Motor Co. | 555,300 | 8,662,680 |
|
| BEVERAGES — 0.6% |
| PepsiCo, Inc. | 57,600 | 4,809,600 |
|
| BIOTECHNOLOGY — 0.6% |
| Amgen, Inc. | 21,700 | 2,676,478 |
|
Gilead Sciences, Inc.(1) | 20,700 | 1,466,802 |
|
| | | 4,143,280 |
|
| BUILDING PRODUCTS — 0.5% |
| Masco Corp. | 168,000 | 3,731,280 |
|
| CAPITAL MARKETS — 4.5% |
| Ameriprise Financial, Inc. | 70,200 | 7,726,914 |
|
| Bank of New York Mellon Corp. (The) | 143,700 | 5,071,173 |
|
| BlackRock, Inc. | 22,600 | 7,107,248 |
|
| Goldman Sachs Group, Inc. (The) | 62,500 | 10,240,625 |
|
| Morgan Stanley | 119,500 | 3,724,815 |
|
| | | 33,870,775 |
|
| CHEMICALS — 1.2% |
| E.I. du Pont de Nemours & Co. | 55,500 | 3,724,050 |
|
LyondellBasell Industries NV, Class A | 56,800 | 5,051,792 |
|
| | | 8,775,842 |
|
| COMMERCIAL BANKS — 14.9% |
| Bank of America Corp. | 590,700 | 10,160,040 |
|
| Citigroup, Inc. | 329,600 | 15,688,960 |
|
|
| | | | |
| | Shares | Value |
| JPMorgan Chase & Co. | 485,700 | $ | 29,486,847 |
|
| KeyCorp | 264,700 | 3,769,328 |
|
| PNC Financial Services Group, Inc. (The) | 151,700 | 13,197,900 |
|
| U.S. Bancorp | 363,300 | 15,571,038 |
|
| Wells Fargo & Co. | 479,300 | 23,840,382 |
|
| | | 111,714,495 |
|
| COMMERCIAL SERVICES AND SUPPLIES — 0.6% |
| ADT Corp. (The) | 77,700 | 2,327,115 |
|
| Tyco International Ltd. | 58,600 | 2,484,640 |
|
| | | 4,811,755 |
|
| COMMUNICATIONS EQUIPMENT — 2.5% |
| Cisco Systems, Inc. | 350,100 | 7,845,741 |
|
F5 Networks, Inc.(1) | 12,600 | 1,343,538 |
|
| QUALCOMM, Inc. | 120,900 | 9,534,174 |
|
| | | 18,723,453 |
|
| COMPUTERS AND PERIPHERALS — 1.2% |
| Apple, Inc. | 7,500 | 4,025,550 |
|
| NetApp, Inc. | 143,900 | 5,309,910 |
|
| | | 9,335,460 |
|
| CONSUMER FINANCE — 1.0% |
| Capital One Financial Corp. | 95,000 | 7,330,200 |
|
| DIVERSIFIED FINANCIAL SERVICES — 2.0% |
Berkshire Hathaway, Inc., Class B(1) | 119,300 | 14,908,921 |
|
| DIVERSIFIED TELECOMMUNICATION SERVICES — 1.3% |
| AT&T, Inc. | 139,200 | 4,881,744 |
|
| CenturyLink, Inc. | 140,500 | 4,614,020 |
|
| | | 9,495,764 |
|
| ELECTRIC UTILITIES — 3.6% |
| American Electric Power Co., Inc. | 118,700 | 6,013,342 |
|
| Pinnacle West Capital Corp. | 87,700 | 4,793,682 |
|
| PPL Corp. | 163,300 | 5,411,762 |
|
| Westar Energy, Inc. | 137,900 | 4,848,564 |
|
| Xcel Energy, Inc. | 184,400 | 5,598,384 |
|
| | | 26,665,734 |
|
| ELECTRICAL EQUIPMENT — 1.4% |
| Eaton Corp. plc | 138,900 | 10,434,168 |
|
|
| | | | |
| | Shares | Value |
| ENERGY EQUIPMENT AND SERVICES — 2.9% |
| Halliburton Co. | 145,100 | $ | 8,544,939 |
|
| National Oilwell Varco, Inc. | 80,200 | 6,245,174 |
|
| Schlumberger Ltd. | 69,200 | 6,747,000 |
|
| | | 21,537,113 |
|
| FOOD AND STAPLES RETAILING — 1.9% |
| CVS Caremark Corp. | 140,600 | 10,525,316 |
|
| Kroger Co. (The) | 92,500 | 4,037,625 |
|
| | | 14,562,941 |
|
| HEALTH CARE EQUIPMENT AND SUPPLIES — 3.3% |
| Abbott Laboratories | 259,000 | 9,974,090 |
|
| Medtronic, Inc. | 234,400 | 14,424,976 |
|
| | | 24,399,066 |
|
| HEALTH CARE PROVIDERS AND SERVICES — 1.9% |
| Aetna, Inc. | 81,400 | 6,102,558 |
|
| Quest Diagnostics, Inc. | 43,900 | 2,542,688 |
|
| WellPoint, Inc. | 58,200 | 5,793,810 |
|
| | | 14,439,056 |
|
| HOTELS, RESTAURANTS AND LEISURE — 0.6% |
| Carnival Corp. | 78,200 | 2,960,652 |
|
Hilton Worldwide Holdings, Inc.(1) | 61,100 | 1,358,864 |
|
| Marriott International, Inc. Class A | 8,000 | 448,160 |
|
| | | 4,767,676 |
|
| HOUSEHOLD PRODUCTS — 2.0% |
| Procter & Gamble Co. (The) | 182,600 | 14,717,560 |
|
| INDUSTRIAL CONGLOMERATES — 2.3% |
| General Electric Co. | 664,700 | 17,209,083 |
|
| INSURANCE — 6.0% |
| Allstate Corp. (The) | 148,500 | 8,402,130 |
|
| American International Group, Inc. | 144,800 | 7,241,448 |
|
| Chubb Corp. (The) | 38,000 | 3,393,400 |
|
| MetLife, Inc. | 179,400 | 9,472,320 |
|
| Principal Financial Group, Inc. | 54,000 | 2,483,460 |
|
| Prudential Financial, Inc. | 76,900 | 6,509,585 |
|
| Travelers Cos., Inc. (The) | 89,600 | 7,624,960 |
|
| | | 45,127,303 |
|
|
| | | | |
| | Shares | Value |
| MACHINERY — 1.5% |
| Ingersoll-Rand plc | 87,100 | $ | 4,985,604 |
|
| PACCAR, Inc. | 94,000 | 6,339,360 |
|
| | | 11,324,964 |
|
| MEDIA — 2.9% | | |
| CBS Corp., Class B | 26,000 | 1,606,800 |
|
CBS Outdoor Americas, Inc.(1) | 17,511 | 512,197 |
|
| Comcast Corp., Class A | 138,700 | 6,937,774 |
|
| Time Warner Cable, Inc. | 22,100 | 3,031,678 |
|
| Time Warner, Inc. | 148,900 | 9,727,637 |
|
| | | 21,816,086 |
|
| METALS AND MINING — 1.0% |
| Freeport-McMoRan Copper & Gold, Inc. | 229,700 | 7,596,179 |
|
| MULTILINE RETAIL — 2.2% |
| Macy's, Inc. | 131,800 | 7,814,422 |
|
| Nordstrom, Inc. | 30,000 | 1,873,500 |
|
| Target Corp. | 113,300 | 6,855,783 |
|
| | | 16,543,705 |
|
| OIL, GAS AND CONSUMABLE FUELS — 12.7% |
| Apache Corp. | 57,000 | 4,728,150 |
|
| Chevron Corp. | 262,800 | 31,249,548 |
|
| Exxon Mobil Corp. | 231,000 | 22,564,080 |
|
| Imperial Oil Ltd. | 48,500 | 2,258,507 |
|
| Marathon Petroleum Corp. | 48,700 | 4,238,848 |
|
Oasis Petroleum, Inc.(1) | 97,900 | 4,085,367 |
|
| Occidental Petroleum Corp. | 148,500 | 14,150,565 |
|
| Total SA ADR | 172,400 | 11,309,440 |
|
| | | 94,584,505 |
|
| PAPER AND FOREST PRODUCTS — 0.6% |
| International Paper Co. | 101,500 | 4,656,820 |
|
| PHARMACEUTICALS — 8.4% |
| Johnson & Johnson | 270,400 | 26,561,392 |
|
| Merck & Co., Inc. | 301,900 | 17,138,863 |
|
| Pfizer, Inc. | 592,400 | 19,027,888 |
|
| | | 62,728,143 |
|
| REAL ESTATE INVESTMENT TRUSTS (REITs) — 0.7% |
| Brixmor Property Group, Inc. | 124,400 | 2,653,452 |
|
| Camden Property Trust | 35,100 | 2,363,634 |
|
| | | 5,017,086 |
|
|
| | | | |
| | Shares | Value |
| SEMICONDUCTORS AND SEMICONDUCTOR EQUIPMENT — 2.6% |
| Applied Materials, Inc. | 417,400 | $ | 8,523,308 |
|
| Intel Corp. | 123,700 | 3,192,697 |
|
| Microchip Technology, Inc. | 164,400 | 7,851,744 |
|
| | | 19,567,749 |
|
| SOFTWARE — 3.7% |
Electronic Arts, Inc.(1) | 199,000 | 5,772,990 |
|
| Microsoft Corp. | 282,700 | 11,587,873 |
|
| Oracle Corp. | 244,200 | 9,990,222 |
|
| | | 27,351,085 |
|
| SPECIALTY RETAIL — 0.5% |
| Lowe's Cos., Inc. | 69,500 | 3,398,550 |
|
| TOBACCO — 0.6% |
| Altria Group, Inc. | 110,700 | 4,143,501 |
|
| TRADING COMPANIES AND DISTRIBUTORS — 0.2% |
United Rentals, Inc.(1) | 19,500 | 1,851,330 |
|
TOTAL COMMON STOCKS (Cost $480,289,406) | 739,348,411 |
|
TEMPORARY CASH INVESTMENTS — 1.0% |
| Repurchase Agreement, Bank of America Merrill Lynch, (collateralized by various U.S. Treasury obligations, 0.75% - 1.375%, 10/31/17 - 6/30/18, valued at $1,389,626), in a joint trading account at 0.03%, dated 3/31/14, due 4/1/14 (Delivery value $1,361,534) | 1,361,533 |
|
|
| | | | |
| | Shares | Value |
| Repurchase Agreement, Goldman Sachs & Co., (collateralized by various U.S. Treasury obligations, 4.25%, 8/15/15, valued at $1,222,226), in a joint trading account at 0.03%, dated 3/31/14, due 4/1/14 (Delivery value $1,198,150) | $ | 1,198,149 |
|
| SSgA U.S. Government Money Market Fund | 4,616,182 | 4,616,182 |
|
TOTAL TEMPORARY CASH INVESTMENTS (Cost $7,175,864) | 7,175,864 |
|
TOTAL INVESTMENT SECURITIES — 99.9% (Cost $487,465,270) | 746,524,275 |
|
| OTHER ASSETS AND LIABILITIES — 0.1% | 1,091,457 |
|
| TOTAL NET ASSETS — 100.0% | $ | 747,615,732 |
|
|
| | | | | | | | |
| FORWARD FOREIGN CURRENCY EXCHANGE CONTRACTS |
| Currency Purchased | Currency Sold | Counterparty | Settlement Date | Unrealized Appreciation
(Depreciation) |
| USD | 890,326 | CAD | 994,939 | JPMorgan Chase Bank N.A. | 4/30/14 | $ | (9,059 | ) |
| USD | 298,940 | CAD | 331,906 | JPMorgan Chase Bank N.A. | 4/30/14 | (1,089 | ) |
| USD | 292,369 | CAD | 323,611 | JPMorgan Chase Bank N.A. | 4/30/14 | (162 | ) |
| USD | 295,555 | CAD | 326,016 | JPMorgan Chase Bank N.A. | 4/30/14 | 850 |
|
| USD | 9,922,956 | EUR | 7,195,241 | UBS AG | 4/30/14 | 11,041 |
|
| USD | 274,612 | EUR | 199,729 | UBS AG | 4/30/14 | (529 | ) |
| | | | | | | $ | 1,052 |
|
|
| | |
| Notes to Schedule of Investments |
| ADR | - | American Depositary Receipt |
| CAD | - | Canadian Dollar |
| EUR | - | Euro |
| USD | - | United States Dollar |
See Notes to Financial Statements.
|
| | | | |
| Statement of Assets and Liabilities |
|
| | | |
| MARCH 31, 2014 | |
| Assets | |
| Investment securities, at value (cost of $487,465,270) | $ | 746,524,275 |
|
| Foreign currency holdings, at value (cost of $103,793) | 105,243 |
|
| Receivable for investments sold | 1,405,024 |
|
| Receivable for capital shares sold | 1,798,524 |
|
| Unrealized appreciation on forward foreign currency exchange contracts | 11,891 |
|
| Dividends and interest receivable | 1,029,670 |
|
| | 750,874,627 |
|
| | |
| Liabilities | |
| Payable for investments purchased | 1,903,069 |
|
| Payable for capital shares redeemed | 803,841 |
|
| Unrealized depreciation on forward foreign currency exchange contracts | 10,839 |
|
| Accrued management fees | 513,518 |
|
| Distribution and service fees payable | 27,628 |
|
| | 3,258,895 |
|
| | |
| Net Assets | $ | 747,615,732 |
|
| | |
| | |
| Net Assets Consist of: | |
| Capital (par value and paid-in surplus) | $ | 818,550,160 |
|
| Undistributed net investment income | 831,519 |
|
| Accumulated net realized loss | (330,827,695) |
|
| Net unrealized appreciation | 259,061,748 |
|
| | $ | 747,615,732 |
|
|
| | | | | |
| | Net Assets | Shares Outstanding | Net Asset Value Per Share |
| Investor Class, $0.01 Par Value |
| $574,366,739 |
| 69,353,760 | $8.28 |
| Institutional Class, $0.01 Par Value |
| $81,195,265 |
| 9,798,929 | $8.29 |
| A Class, $0.01 Par Value |
| $74,862,725 |
| 9,045,240 | $8.28* |
| B Class, $0.01 Par Value |
| $927,616 |
| 111,668 | $8.31 |
| C Class, $0.01 Par Value |
| $10,101,411 |
| 1,220,055 | $8.28 |
| R Class, $0.01 Par Value |
| $6,134,507 |
| 740,630 | $8.28 |
| R6 Class, $0.01 Par Value |
| $27,469 |
| 3,314 | $8.29 |
| *Maximum offering price $8.79 (net asset value divided by 0.9425). |
See Notes to Financial Statements.
|
| | | |
| YEAR ENDED MARCH 31, 2014 |
| Investment Income (Loss) |
| Income: |
| Dividends (net of foreign taxes withheld of $75,190) | $ | 17,090,895 |
|
| Interest | 1,407 |
|
| | 17,092,302 |
|
| | |
| Expenses: |
| Management fees | 5,708,082 |
|
| Distribution and service fees: |
| A Class | 181,857 |
|
| B Class | 10,604 |
|
| C Class | 96,639 |
|
| R Class | 30,264 |
|
| Directors' fees and expenses | 6,439 |
|
| | 6,033,885 |
|
| |
| Net investment income (loss) | 11,058,417 |
|
| |
| Realized and Unrealized Gain (Loss) |
| Net realized gain (loss) on: |
| Investment transactions | 63,169,661 |
|
| Foreign currency transactions | (627,006) |
|
| | 62,542,655 |
|
| |
| Change in net unrealized appreciation (depreciation) on: |
| Investments | 60,270,604 |
|
| Translation of assets and liabilities in foreign currencies | (45,477 | ) |
| | 60,225,127 |
|
| |
| Net realized and unrealized gain (loss) | 122,767,782 |
|
| | |
| Net Increase (Decrease) in Net Assets Resulting from Operations | $ | 133,826,199 |
|
See Notes to Financial Statements.
|
| | | | |
| Statement of Changes in Net Assets |
|
| | | | | | |
| YEARS ENDED MARCH 31, 2014 AND MARCH 31, 2013 |
| Increase (Decrease) in Net Assets | March 31, 2014 | March 31, 2013 |
| Operations |
| Net investment income (loss) | $ | 11,058,417 |
| $ | 10,842,484 |
|
| Net realized gain (loss) | 62,542,655 |
| 59,176,143 |
|
| Change in net unrealized appreciation (depreciation) | 60,225,127 |
| 15,079,455 |
|
| Net increase (decrease) in net assets resulting from operations | 133,826,199 |
| 85,098,082 |
|
| |
| Distributions to Shareholders |
| From net investment income: |
| Investor Class | (8,420,022) |
| (8,590,787) |
|
| Institutional Class | (1,264,882) |
| (1,149,076) |
|
| A Class | (981,617) |
| (1,141,948) |
|
| B Class | (6,213) |
| (17,721) |
|
| C Class | (57,173) |
| (81,259) |
|
| R Class | (65,933) |
| (79,284) |
|
| R6 Class | (362) |
| — |
|
| Decrease in net assets from distributions | (10,796,202) |
| (11,060,075) |
|
| |
| Capital Share Transactions |
| Net increase (decrease) in net assets from capital share transactions | (5,327,220) |
| (169,707,552) |
|
| |
| |
| Net increase (decrease) in net assets | 117,702,777 |
| (95,669,545) |
|
| |
| Net Assets |
| Beginning of period | 629,912,955 |
| 725,582,500 |
|
| End of period | $ | 747,615,732 |
| $ | 629,912,955 |
|
| |
| Undistributed net investment income | $ | 831,519 |
| $ | 536,989 |
|
See Notes to Financial Statements.
|
|
| Notes to Financial Statements |
MARCH 31, 2014
1. Organization
American Century Capital Portfolios, Inc. (the corporation) is registered under the Investment Company Act of 1940, as amended (the 1940 Act), as an open-end management investment company and is organized as a Maryland corporation. Large Company Value Fund (the fund) is one fund in a series issued by the corporation. The fund is diversified as defined under the 1940 Act. The fund’s investment objective is to seek long-term capital growth. Income is a secondary objective.
The fund offers the Investor Class, the Institutional Class, the A Class, the B Class, the C Class, the R Class and the R6 Class. The A Class may incur an initial sales charge. The A Class, B Class and C Class may be subject to a contingent deferred sales charge. The share classes differ principally in their respective sales charges and distribution and shareholder servicing expenses and arrangements. The Institutional Class and R6 Class shareholders do not require the same level of shareholder and administrative services from American Century Investment Management, Inc. (ACIM) (the investment advisor) as shareholders of other classes. In addition, financial intermediaries do not receive any service, distribution or administrative fees for the R6 Class. As a result, the Institutional Class and R6 Class are charged lower unified management fees. Sale of the R6 Class commenced on July 26, 2013.
2. Significant Accounting Policies
The following is a summary of significant accounting policies consistently followed by the fund in preparation of its financial statements. The financial statements are prepared in conformity with accounting principles generally accepted in the United States of America, which may require management to make certain estimates and assumptions at the date of the financial statements. Actual results could differ from these estimates.
Investment Valuations — The fund determines the fair value of its investments and computes its net asset value per share at the close of regular trading (usually 4 p.m. Eastern time) on the New York Stock Exchange (NYSE) on each day the NYSE is open. The Board of Directors has adopted valuation policies and procedures to guide the investment advisor in the fund’s investment valuation process and to provide methodologies for the oversight of the fund’s pricing function.
Equity securities that are listed or traded on a domestic securities exchange are valued at the last reported sales price or at the official closing price as provided by the exchange. Equity securities traded on foreign securities exchanges are generally valued at the closing price of such securities on the exchange where primarily traded or at the close of the NYSE, if that is earlier. If no last sales price is reported, or if local convention or regulation so provides, the mean of the latest bid and asked prices may be used. Securities traded over-the-counter are valued at the mean of the latest bid and asked prices, the last sales price, or the official closing price. Equity securities initially expressed in local currencies are translated into U.S. dollars at the mean of the appropriate currency exchange rate at the close of the NYSE as provided by an independent pricing service.
Fixed income securities maturing within 60 days at the time of purchase may be valued at cost, plus or minus any amortized discount or premium or at the evaluated mean as provided by an independent pricing service. Evaluated mean prices are commonly derived through utilization of market models, which may consider, among other factors: trade data, quotations from dealers and active market makers, relevant yield curve and spread data, related sector levels, creditworthiness, trade data or market information on comparable securities, and other relevant security specific information.
Open-end management investment companies are valued at the reported net asset value per share. Repurchase agreements are valued at cost, which approximates fair value. Forward foreign currency exchange contracts are valued at the mean of the appropriate forward exchange rate at the close of the NYSE as provided by an independent pricing service.
If the fund determines that the market price for an investment is not readily available or the valuation methods mentioned above do not reflect an investment’s fair value, such investment is valued as determined in good faith by the Board of Directors or its delegate, in accordance with policies and procedures adopted by the Board of Directors. In its determination of fair value, the fund may review several factors including, but not
limited to, market information regarding the specific investment or comparable investments and correlation with other investment types, futures indices or general market indicators. Circumstances that may cause the fund to use these procedures to value an investment include, but are not limited to: an investment has been declared in default or is distressed; trading in a security has been suspended during the trading day or a security is not actively trading on its principal exchange; prices received from a regular pricing source are deemed unreliable; or there is a foreign market holiday and no trading occurred.
The fund monitors for significant events occurring after the close of an investment’s primary exchange but before the fund’s net asset value per share is determined. Significant events may include, but are not limited to: corporate announcements and transactions; governmental action and political unrest that could impact a specific investment or an investment sector; or armed conflicts, natural disasters and similar events that could affect investments in a specific country or region. The fund also monitors for significant fluctuations between domestic and foreign markets, as evidenced by the U.S. market or such other indicators that the Board of Directors, or its delegate, deems appropriate. If significant fluctuations in foreign markets are identified, the fund may apply a model-derived factor to the closing price of equity securities traded on foreign securities exchanges. The factor is based on observable market data as provided by an independent pricing service.
Security Transactions — Security transactions are accounted for as of the trade date. Net realized gains and losses are determined on the identified cost basis, which is also used for federal income tax purposes.
Investment Income — Dividend income less foreign taxes withheld, if any, is recorded as of the ex-dividend date. Distributions received on securities that represent a return of capital or long-term capital gain are recorded as a reduction of cost of investments and/or as a realized gain. The fund may estimate the components of distributions received that may be considered nontaxable distributions or long-term capital gain distributions for income tax purposes. Interest income is recorded on the accrual basis and includes accretion of discounts and amortization of premiums.
Foreign Currency Translations — All assets and liabilities initially expressed in foreign currencies are translated into U.S. dollars at prevailing exchange rates at period end. The fund may enter into spot foreign currency exchange contracts to facilitate transactions denominated in a foreign currency. Purchases and sales of investment securities, dividend and interest income, spot foreign currency exchange contracts, and expenses are translated at the rates of exchange prevailing on the respective dates of such transactions. Net realized and unrealized foreign currency exchange gains or losses related to investment securities are a component of net realized gain (loss) on investment transactions and change in net unrealized appreciation (depreciation) on investments, respectively.
Repurchase Agreements — The fund may enter into repurchase agreements with institutions that ACIM has determined are creditworthy pursuant to criteria adopted by the Board of Directors. The fund requires that the collateral, represented by securities, received in a repurchase transaction be transferred to the custodian in a manner sufficient to enable the fund to obtain those securities in the event of a default under the repurchase agreement. ACIM monitors, on a daily basis, the securities transferred to ensure the value, including accrued interest, of the securities under each repurchase agreement is equal to or greater than amounts owed to the fund under each repurchase agreement.
Joint Trading Account — Pursuant to an Exemptive Order issued by the Securities and Exchange Commission, the fund, along with certain other funds in the American Century Investments family of funds, may transfer uninvested cash balances into a joint trading account. These balances are invested in one or more repurchase agreements that are collateralized by U.S. Treasury or Agency obligations.
Income Tax Status — It is the fund’s policy to distribute substantially all net investment income and net realized gains to shareholders and to otherwise qualify as a regulated investment company under provisions of the Internal Revenue Code. Accordingly, no provision has been made for income taxes. The fund files U.S. federal, state, local and non-U.S. tax returns as applicable. The fund's tax returns are subject to examination by the relevant taxing authority until expiration of the applicable statute of limitations, which is generally three years from the date of filing but can be longer in certain jurisdictions. At this time, management believes there are no uncertain tax positions which, based on their technical merit, would not be sustained upon examination and for which it is reasonably possible that the total amounts of unrecognized tax benefits will significantly change in the next twelve months.
Multiple Class — All shares of the fund represent an equal pro rata interest in the net assets of the class to which such shares belong, and have identical voting, dividend, liquidation and other rights and the same terms and conditions, except for class specific expenses and exclusive rights to vote on matters affecting only
individual classes. Income, non-class specific expenses, and realized and unrealized capital gains and losses of the fund are allocated to each class of shares based on their relative net assets.
Distributions to Shareholders — Distributions from net investment income, if any, are generally declared and paid quarterly. Distributions from net realized gains, if any, are generally declared and paid annually.
Indemnifications — Under the corporation’s organizational documents, its officers and directors are indemnified against certain liabilities arising out of the performance of their duties to the fund. In addition, in the normal course of business, the fund enters into contracts that provide general indemnifications. The maximum exposure under these arrangements is unknown as this would involve future claims that may be made against a fund. The risk of material loss from such claims is considered by management to be remote.
3. Fees and Transactions with Related Parties
Certain officers and directors of the corporation are also officers and/or directors of American Century Companies, Inc. (ACC). The corporation’s investment advisor, ACIM, the corporation's distributor, American Century Investment Services, Inc. (ACIS), and the corporation’s transfer agent, American Century Services, LLC, are wholly owned, directly or indirectly, by ACC. Various funds issued by American Century Asset Allocation Portfolios, Inc. and American Century Strategic Asset Allocations, Inc. own, in aggregate, 44% of the shares of the fund. Related parties do not invest in the fund for the purpose of exercising management or control.
Management Fees — The corporation has entered into a management agreement with ACIM, under which ACIM provides the fund with investment advisory and management services in exchange for a single, unified management fee (the fee) per class. The agreement provides that all expenses of managing and operating the fund, except distribution and service fees, brokerage expenses, taxes, interest, fees and expenses of the independent directors (including legal counsel fees), and extraordinary expenses, will be paid by ACIM. The fee is computed and accrued daily based on each class’s daily net assets and paid monthly in arrears. The rate of the fee is determined by applying a fee rate calculation formula. This formula takes into account the fund’s assets as well as certain assets, if any, of other clients of the investment advisor outside the American Century Investments family of funds (such as subadvised funds and separate accounts) that have very similar investment teams and investment strategies (strategy assets). The strategy assets of the fund also include the assets of NT Large Company Value Fund, one fund in a series issued by the corporation. The annual management fee schedule ranges from 0.70% to 0.90% for the Investor Class, A Class, B Class, C Class and R Class. The annual management fee schedule ranges from 0.50% to 0.70% for the Institutional Class and 0.35% to 0.55% for the R6 Class. The effective annual management fee for each class for the period ended March 31, 2014 was 0.85% for the Investor Class, A Class, B Class, C Class and R Class, 0.65% for the Institutional Class and 0.50% for the R6 Class.
Distribution and Service Fees — The Board of Directors has adopted a separate Master Distribution and Individual Shareholder Services Plan for each of the A Class, B Class, C Class and R Class (collectively the plans), pursuant to Rule 12b-1 of the 1940 Act. The plans provide that the A Class will pay ACIS an annual distribution and service fee of 0.25%. The plans provide that the B Class and C Class will each pay ACIS an annual distribution and service fee of 1.00%, of which 0.25% is paid for individual shareholder services and 0.75% is paid for distribution services. The plans provide that the R Class will pay ACIS an annual distribution and service fee of 0.50%. The fees are computed and accrued daily based on each class’s daily net assets and paid monthly in arrears. The fees are used to pay financial intermediaries for distribution and individual shareholder services. Fees incurred under the plans during the year ended March 31, 2014 are detailed in the Statement of Operations.
Directors' Fees and Expenses — The Board of Directors is responsible for overseeing the investment advisor's management and operations of the fund. The directors receive detailed information about the fund and its investment advisor regularly throughout the year, and meet at least quarterly with management of the investment advisor to review reports about fund operations. Fees and expenses incurred in conjunction with the directors during the year ended March 31, 2014 are detailed in the Statement of Operations. The fund’s officers do not receive compensation from the fund.
4. Investment Transactions
Purchases and sales of investment securities, excluding short-term investments, for the year ended March 31, 2014 were $237,549,850 and $243,776,714, respectively.
5. Capital Share Transactions
Transactions in shares of the fund were as follows: |
| | | | | | | | |
| | Year ended March 31, 2014(1) | Year ended March 31, 2013 |
| | Shares | Amount | Shares | Amount |
| Investor Class/Shares Authorized | 600,000,000 | | 600,000,000 | |
| Sold | 8,572,597 | $ | 65,373,014 |
| 17,796,988 | $ | 107,954,199 |
|
| Issued in reinvestment of distributions | 1,080,636 | 8,305,675 |
| 1,360,766 | 8,440,559 |
|
| Redeemed | (10,681,224) | (81,601,170) |
| (39,663,157) | (239,958,023) |
|
| | (1,027,991) | (7,922,481) |
| (20,505,403) | (123,563,265) |
|
| Institutional Class/Shares Authorized | 200,000,000 | | 200,000,000 | |
| Sold | 3,748,963 | 29,020,725 |
| 1,860,479 | 11,285,205 |
|
| Issued in reinvestment of distributions | 162,902 | 1,258,090 |
| 183,862 | 1,139,231 |
|
| Redeemed | (2,390,739) | (18,331,164) |
| (6,511,040) | (39,753,880) |
|
| | 1,521,126 | 11,947,651 |
| (4,466,699) | (27,329,444) |
|
| A Class/Shares Authorized | 100,000,000 | | 100,000,000 | |
| Sold | 1,445,959 | 10,972,471 |
| 1,604,715 | 9,988,929 |
|
| Issued in reinvestment of distributions | 122,765 | 941,752 |
| 173,666 | 1,072,692 |
|
| Redeemed | (2,537,130) | (19,307,507) |
| (4,162,961) | (25,682,192) |
|
| | (968,406) | (7,393,284) |
| (2,384,580) | (14,620,571) |
|
| B Class/Shares Authorized | 5,000,000 | | 5,000,000 | |
| Sold | 6,995 | 53,300 |
| 2,377 | 15,039 |
|
| Issued in reinvestment of distributions | 669 | 5,085 |
| 2,622 | 15,943 |
|
| Redeemed | (98,135) | (725,360) |
| (253,285) | (1,560,479) |
|
| | (90,471) | (666,975) |
| (248,286) | (1,529,497) |
|
| C Class/Shares Authorized | 20,000,000 | | 20,000,000 | |
| Sold | 132,343 | 1,000,238 |
| 74,159 | 474,622 |
|
| Issued in reinvestment of distributions | 4,147 | 31,601 |
| 6,805 | 41,763 |
|
| Redeemed | (211,438) | (1,608,523) |
| (300,903) | (1,870,403) |
|
| | (74,948) | (576,684) |
| (219,939) | (1,354,018) |
|
| R Class/Shares Authorized | 10,000,000 | | 10,000,000 | |
| Sold | 153,911 | 1,163,119 |
| 146,869 | 930,011 |
|
| Issued in reinvestment of distributions | 7,467 | 57,118 |
| 11,416 | 70,262 |
|
| Redeemed | (257,441) | (1,961,046) |
| (380,427) | (2,311,030) |
|
| | (96,063) | (740,809) |
| (222,142) | (1,310,757) |
|
| R6 Class/Shares Authorized | 40,000,000 | | N/A | |
| Sold | 3,268 | 25,000 |
| | |
| Issued in reinvestment of distributions | 46 | 362 |
| | |
| | 3,314 | 25,362 |
| | |
| Net increase (decrease) | (733,439) | $ | (5,327,220 | ) | (28,047,049) | $ | (169,707,552 | ) |
| | | | | |
| (1) July 26, 2013 (commencement of sale) through March 31, 2014 for the R6 Class. |
6. Fair Value Measurements
The fund’s investments valuation process is based on several considerations and may use multiple inputs to determine the fair value of the investments held by the fund. In conformity with accounting principles generally accepted in the United States of America, the inputs used to determine a valuation are classified into three broad levels.
| |
| • | Level 1 valuation inputs consist of unadjusted quoted prices in an active market for identical investments. |
| |
| • | Level 2 valuation inputs consist of direct or indirect observable market data (including quoted prices for comparable investments, evaluations of subsequent market events, interest rates, prepayment speeds, credit risk, etc.). These inputs also consist of quoted prices for identical investments initially expressed in local currencies that are adjusted through translation into U.S. dollars. |
| |
| • | Level 3 valuation inputs consist of unobservable data (including a fund’s own assumptions). |
The level classification is based on the lowest level input that is significant to the fair valuation measurement. The valuation inputs are not necessarily an indication of the risks associated with investing in these securities or other financial instruments.
The following is a summary of the level classifications as of period end. The Schedule of Investments provides additional information on the fund’s portfolio holdings.
|
| | | | | | | | |
| | Level 1 | Level 2 | Level 3 |
| Assets | | | |
| Investment Securities | | | |
| Common Stocks | $ | 737,089,904 |
| $ | 2,258,507 |
| — |
|
| Temporary Cash Investments | 4,616,182 |
| 2,559,682 |
| — |
|
| | $ | 741,706,086 |
| $ | 4,818,189 |
| — |
|
| Other Financial Instruments | | | |
| Forward Foreign Currency Exchange Contracts | — |
| $ | 11,891 |
| — |
|
| | | | |
| Liabilities | | | |
| Other Financial Instruments | | | |
| Forward Foreign Currency Exchange Contracts | — |
| $ | (10,839 | ) | — |
|
7. Derivative Instruments
Foreign Currency Risk — The fund is subject to foreign currency exchange rate risk in the normal course of pursuing its investment objectives. The value of foreign investments held by a fund may be significantly affected by changes in foreign currency exchange rates. The dollar value of a foreign security generally decreases when the value of the dollar rises against the foreign currency in which the security is denominated and tends to increase when the value of the dollar declines against such foreign currency. A fund may enter into forward foreign currency exchange contracts to reduce a fund's exposure to foreign currency exchange rate fluctuations. The net U.S. dollar value of foreign currency underlying all contractual commitments held by a fund and the resulting unrealized appreciation or depreciation are determined daily. Realized gain or loss is recorded upon the termination of the contract. Net realized and unrealized gains or losses occurring during the holding period of forward foreign currency exchange contracts are a component of net realized gain (loss) on foreign currency transactions and change in net unrealized appreciation (depreciation) on translation of assets and liabilities in foreign currencies, respectively. A fund bears the risk of an unfavorable change in the foreign currency exchange rate underlying the forward contract. Additionally, losses, up to the fair value, may arise if the counterparties do not perform under the contract terms. The foreign currency risk derivative instruments held at period end as disclosed on the Schedule of Investments are indicative of the fund's typical volume during the period.
The value of foreign currency risk derivative instruments as of March 31, 2014, is disclosed on the Statement of Assets and Liabilities as an asset of $11,891 in unrealized appreciation on forward foreign currency exchange contracts and a liability of $10,839 in unrealized depreciation on forward foreign currency exchange contracts. For the year ended March 31, 2014, the effect of foreign currency risk derivative instruments on the Statement of Operations was $(629,848) in net realized gain (loss) on foreign currency transactions and $(46,609) in change in net unrealized appreciation (depreciation) on translation of assets and liabilities in foreign currencies.
8. Federal Tax Information
The tax character of distributions paid during the years ended March 31, 2014 and March 31, 2013 were as follows:
|
| | | | | | |
| | 2014 | 2013 |
| Distributions Paid From | | |
| Ordinary income | $ | 10,796,202 |
| $ | 11,060,075 |
|
| Long-term capital gains | — |
| — |
|
The book-basis character of distributions made during the year from net investment income or net realized gains may differ from their ultimate characterization for federal income tax purposes. These differences reflect the differing character of certain income items and net realized gains and losses for financial statement and tax purposes, and may result in reclassification among certain capital accounts on the financial statements.
As of March 31, 2014, the federal tax cost of investments and the components of distributable earnings on a tax-basis were as follows:
|
| | | |
| Federal tax cost of investments | $ | 511,320,004 |
|
| Gross tax appreciation of investments | $ | 236,005,426 |
|
| Gross tax depreciation of investments | (801,155 | ) |
| Net tax appreciation (depreciation) of investments | $ | 235,204,271 |
|
| Net tax appreciation (depreciation) on derivatives and translation of assets and liabilities in foreign currencies | $ | 1,691 |
|
| Net tax appreciation (depreciation) | $ | 235,205,962 |
|
| Undistributed ordinary income | $ | 831,519 |
|
| Accumulated short-term capital losses | $ | (306,971,909 | ) |
The difference between book-basis and tax-basis unrealized appreciation (depreciation) is attributable primarily to the tax deferral of losses on wash sales.
Accumulated capital losses represent net capital loss carryovers that may be used to offset future realized capital gains for federal income tax purposes. Future capital loss carryover utilization in any given year may be subject to Internal Revenue Code limitations. Capital loss carryovers of $(4,894,809) and $(302,077,100) expire in 2017 and 2018, respectively.
|
| | | | | | | | | | | | | |
| For a Share Outstanding Throughout the Years Ended March 31 (except as noted) |
| Per-Share Data | | | | | Ratios and Supplemental Data | |
| | | Income From Investment Operations: | | | Ratio to Average Net Assets of: | | |
| | Net Asset
Value,
Beginning
of Period | Net
Investment
Income
(Loss)(1) | Net
Realized
and
Unrealized
Gain (Loss) | Total From
Investment
Operations | Distributions From Net
Investment
Income | Net Asset
Value,
End
of Period | Total
Return(2) | Operating
Expenses | Net
Investment
Income
(Loss) | Portfolio
Turnover
Rate | Net
Assets,
End of
Period
(in thousands) |
| Investor Class | | | | | | | | | | | |
| 2014 | $6.92 | 0.12 | 1.36 | 1.48 | (0.12) | $8.28 | 21.57% | 0.85% | 1.64% | 35% |
| $574,367 |
|
| 2013 | $6.09 | 0.12 | 0.83 | 0.95 | (0.12) | $6.92 | 15.85% | 0.87% | 1.87% | 33% |
| $487,161 |
|
| 2012 | $5.80 | 0.10 | 0.29 | 0.39 | (0.10) | $6.09 | 6.91% | 0.87% | 1.84% | 56% |
| $553,916 |
|
| 2011 | $5.24 | 0.08 | 0.56 | 0.64 | (0.08) | $5.80 | 12.39% | 0.87% | 1.58% | 38% |
| $629,706 |
|
| 2010 | $3.64 | 0.09 | 1.60 | 1.69 | (0.09) | $5.24 | 46.68% | 0.85% | 1.87% | 25% |
| $786,992 |
|
| Institutional Class | | | | | | | | | | | |
| 2014 | $6.93 | 0.14 | 1.36 | 1.50 | (0.14) | $8.29 | 21.78% | 0.65% | 1.84% | 35% |
| $81,195 |
|
| 2013 | $6.10 | 0.13 | 0.83 | 0.96 | (0.13) | $6.93 | 16.05% | 0.67% | 2.07% | 33% |
| $57,325 |
|
| 2012 | $5.80 | 0.11 | 0.30 | 0.41 | (0.11) | $6.10 | 7.29% | 0.67% | 2.04% | 56% |
| $77,706 |
|
| 2011 | $5.24 | 0.09 | 0.56 | 0.65 | (0.09) | $5.80 | 12.61% | 0.67% | 1.78% | 38% |
| $230,853 |
|
| 2010 | $3.64 | 0.10 | 1.60 | 1.70 | (0.10) | $5.24 | 46.97% | 0.65% | 2.07% | 25% |
| $243,190 |
|
|
| | | | | | | | | | | | | |
| For a Share Outstanding Throughout the Years Ended March 31 (except as noted) |
| Per-Share Data | | | | | Ratios and Supplemental Data | |
| | | Income From Investment Operations: | | | Ratio to Average Net Assets of: | | |
| | Net Asset
Value,
Beginning
of Period | Net
Investment
Income
(Loss)(1) | Net
Realized
and
Unrealized
Gain (Loss) | Total From
Investment
Operations | Distributions From Net
Investment
Income | Net Asset
Value,
End
of Period | Total
Return(2) | Operating
Expenses | Net
Investment
Income
(Loss) | Portfolio
Turnover
Rate | Net
Assets,
End of
Period
(in thousands) |
| A Class | | | | | | | | | | | |
| 2014 | $6.92 | 0.11 | 1.35 | 1.46 | (0.10) | $8.28 | 21.27% | 1.10% | 1.39% | 35% |
| $74,863 |
|
| 2013 | $6.09 | 0.10 | 0.84 | 0.94 | (0.11) | $6.92 | 15.57% | 1.12% | 1.62% | 33% |
| $69,270 |
|
| 2012 | $5.79 | 0.09 | 0.30 | 0.39 | (0.09) | $6.09 | 6.83% | 1.12% | 1.59% | 56% |
| $75,521 |
|
| 2011 | $5.24 | 0.07 | 0.55 | 0.62 | (0.07) | $5.79 | 11.92% | 1.12% | 1.33% | 38% |
| $94,159 |
|
| 2010 | $3.64 | 0.08 | 1.60 | 1.68 | (0.08) | $5.24 | 46.31% | 1.10% | 1.62% | 25% |
| $200,408 |
|
| B Class | | | | | | | | | | | |
| 2014 | $6.94 | 0.05 | 1.36 | 1.41 | (0.04) | $8.31 | 20.45% | 1.85% | 0.64% | 35% |
| $928 |
|
| 2013 | $6.11 | 0.05 | 0.84 | 0.89 | (0.06) | $6.94 | 14.67% | 1.87% | 0.87% | 33% |
| $1,404 |
|
| 2012 | $5.81 | 0.05 | 0.29 | 0.34 | (0.04) | $6.11 | 6.01% | 1.87% | 0.84% | 56% |
| $2,753 |
|
| 2011 | $5.26 | 0.03 | 0.55 | 0.58 | (0.03) | $5.81 | 11.04% | 1.87% | 0.58% | 38% |
| $4,743 |
|
| 2010 | $3.65 | 0.04 | 1.61 | 1.65 | (0.04) | $5.26 | 45.34% | 1.85% | 0.87% | 25% |
| $5,662 |
|
| C Class | | | | | | | | | | | |
| 2014 | $6.92 | 0.05 | 1.35 | 1.40 | (0.04) | $8.28 | 20.36% | 1.85% | 0.64% | 35% |
| $10,101 |
|
| 2013 | $6.09 | 0.05 | 0.84 | 0.89 | (0.06) | $6.92 | 14.72% | 1.87% | 0.87% | 33% |
| $8,961 |
|
| 2012 | $5.80 | 0.05 | 0.28 | 0.33 | (0.04) | $6.09 | 5.85% | 1.87% | 0.84% | 56% |
| $9,232 |
|
| 2011 | $5.24 | 0.03 | 0.56 | 0.59 | (0.03) | $5.80 | 11.27% | 1.87% | 0.58% | 38% |
| $10,885 |
|
| 2010 | $3.64 | 0.04 | 1.60 | 1.64 | (0.04) | $5.24 | 45.19% | 1.85% | 0.87% | 25% |
| $17,211 |
|
|
| | | | | | | | | | | | | |
| For a Share Outstanding Throughout the Years Ended March 31 (except as noted) |
| Per-Share Data | | | | | Ratios and Supplemental Data | |
| | | Income From Investment Operations: | | | Ratio to Average Net Assets of: | | |
| | Net Asset
Value,
Beginning
of Period | Net
Investment
Income
(Loss)(1) | Net
Realized
and
Unrealized
Gain (Loss) | Total From
Investment
Operations | Distributions From Net
Investment
Income | Net Asset
Value,
End
of Period | Total
Return(2) | Operating
Expenses | Net
Investment
Income
(Loss) | Portfolio
Turnover
Rate | Net
Assets,
End of
Period
(in thousands) |
| R Class | | | | | | | | | | | |
| 2014 | $6.92 | 0.09 | 1.35 | 1.44 | (0.08) | $8.28 | 20.96% | 1.35% | 1.14% | 35% |
| $6,135 |
|
| 2013 | $6.10 | 0.08 | 0.83 | 0.91 | (0.09) | $6.92 | 15.10% | 1.37% | 1.37% | 33% |
| $5,792 |
|
| 2012 | $5.80 | 0.07 | 0.30 | 0.37 | (0.07) | $6.10 | 6.55% | 1.37% | 1.34% | 56% |
| $6,454 |
|
| 2011 | $5.24 | 0.05 | 0.56 | 0.61 | (0.05) | $5.80 | 11.83% | 1.37% | 1.08% | 38% |
| $7,058 |
|
| 2010 | $3.64 | 0.06 | 1.61 | 1.67 | (0.07) | $5.24 | 45.93% | 1.35% | 1.37% | 25% |
| $14,699 |
|
| R6 Class | | | | | | | | | | | |
2014(3) | $7.65 | 0.10 | 0.65 | 0.75 | (0.11) | $8.29 | 9.90% | 0.50%(4) | 1.98%(4) | 35%(5) |
| $27 |
|
|
| | | | |
| Notes to Financial Highlights | | |
| |
| (1) | Computed using average shares outstanding throughout the period. |
| |
| (2) | Total returns are calculated based on the net asset value of the last business day and do not reflect applicable sales charges, if any. Total returns for periods less than one year are not annualized. |
| |
| (3) | July 26, 2013 (commencement of sale) through March 31, 2014. |
| |
| (5) | Portfolio turnover is calculated at the fund level. Percentage indicated was calculated for the year ended March 31, 2014. |
See Notes to Financial Statements.
|
|
| Report of Independent Registered Public Accounting Firm |
To the Board of Directors and Shareholders of
American Century Capital Portfolios, Inc.:
We have audited the accompanying statement of assets and liabilities, including the schedule of investments, of Large Company Value Fund (the “Fund”), one of the funds constituting American Century Capital Portfolios, Inc., as of March 31, 2014, and the related statement of operations for the year then ended, the statements of changes in net assets for each of the two years in the period then ended, and the financial highlights for each of the periods presented. These financial statements and financial highlights are the responsibility of the Fund's management. Our responsibility is to express an opinion on these financial statements and financial highlights based on our audits.
We conducted our audits in accordance with the standards of the Public Company Accounting Oversight Board (United States). Those standards require that we plan and perform the audit to obtain reasonable assurance about whether the financial statements and financial highlights are free of material misstatement. The Fund is not required to have, nor were we engaged to perform, an audit of its internal control over financial reporting. Our audits included consideration of internal control over financial reporting as a basis for designing audit procedures that are appropriate in the circumstances, but not for the purpose of expressing an opinion on the effectiveness of the Fund's internal control over financial reporting. Accordingly, we express no such opinion. An audit also includes examining, on a test basis, evidence supporting the amounts and disclosures in the financial statements, assessing the accounting principles used and significant estimates made by management, as well as evaluating the overall financial statement presentation. Our procedures included confirmation of securities owned as of March 31, 2014, by correspondence with the custodian and brokers; where replies were not received from brokers, we performed other auditing procedures. We believe that our audits provide a reasonable basis for our opinion.
In our opinion, the financial statements and financial highlights referred to above present fairly, in all material respects, the financial position of Large Company Value Fund of American Century Capital Portfolios, Inc. as of March 31, 2014, the results of its operations for the year then ended, the changes in its net assets for each of the two years in the period then ended, and the financial highlights for each of the periods presented, in conformity with accounting principles generally accepted in the United States of America.
Deloitte & Touche LLP
Kansas City, Missouri
May 16, 2014
The Board of Directors
The individuals listed below serve as directors of the funds. Each director will continue to serve in this capacity until death, retirement, resignation or removal from office. The board has adopted a mandatory retirement age for directors who are not “interested persons,” as that term is defined in the Investment Company Act (independent directors). Independent directors shall retire by December 31 of the year in which they reach their 75th birthday.
Mr. Thomas is an “interested person” because he currently serves as President and Chief Executive Officer of American Century Companies, Inc. (ACC), the parent company of American Century Investment Management, Inc. (ACIM or the advisor). Mr. Fink is treated as an “interested person” because of his recent employment with ACC and American Century Services, LLC (ACS). The other directors (more than three-fourths of the total number) are independent. They are not employees, directors or officers of, and have no financial interest in, ACC or any of its wholly owned, direct or indirect, subsidiaries, including ACIM, American Century Investment Services, Inc. (ACIS) and ACS, and do not have any other affiliations, positions, or relationships that would cause them to be considered “interested persons” under the Investment Company Act. The directors serve in this capacity for seven (in the case of Mr. Thomas, 15) registered investment companies in the American Century Investments family of funds.
The following table presents additional information about the directors. The mailing address for each director is 4500 Main Street, Kansas City, Missouri 64111.
|
| | | | | |
Name (Year of Birth) | Position(s) Held with Funds | Length of Time Served | Principal Occupation(s) During Past 5 Years | Number of American Century Portfolios Overseen by Director | Other Directorships Held During Past
5 Years |
| Independent Directors |
Thomas A. Brown
(1940) | Director | Since 1980 | Managing Member, Associated Investments, LLC (real estate investment company); Brown Cascade Properties, LLC (real estate investment company) (2001 to 2009) | 73 | None |
Andrea C. Hall
(1945) | Director | Since 1997 | Retired | 73 | None |
Jan M. Lewis
(1957) | Director | Since 2011 | Retired; President and Chief Executive Officer, Catholic Charities of Northeast Kansas (human services organization) (2006 to 2013) | 73 | None |
James A. Olson
(1942) | Director and Chairman of the Board | Since 2007 (Chairman since 2014) | Member, Plaza Belmont LLC (private equity fund manager) | 73 | Saia, Inc. (2002 to 2012) and EPR Properties (2003 to 2013) |
|
| | | | | |
Name (Year of Birth) | Position(s) Held with Funds | Length of Time Served | Principal Occupation(s) During Past 5 Years | Number of American Century Portfolios Overseen by Director | Other Directorships Held During Past
5 Years |
| Independent Directors |
M. Jeannine Strandjord
(1945) | Director | Since 1994 | Retired | 73 | Euronet Worldwide Inc.; Charming Shoppes, Inc. (2006 to 2010); and DST Systems Inc. (1996 to 2012) |
John R. Whitten
(1946) | Director | Since 2008 | Retired | 73 | Rudolph Technologies, Inc. |
Stephen E. Yates
(1948) | Director | Since 2012 | Retired; Executive Vice President, Technology & Operations, KeyCorp. (computer services) (2004 to 2010) | 73 | Applied Industrial Technologies, Inc. (2001 to 2010) |
| Interested Directors | | | | |
Barry Fink
(1955) | Director | Since 2012 | Retired; Executive Vice President, ACC (September 2007 to February 2013); President, ACS (October 2007 to February 2013); Chief Operating Officer, ACC (September 2007 to November 2012) | 73 | None |
Jonathan S. Thomas
(1963) | Director and President | Since 2007 | President and Chief Executive Officer, ACC (March 2007 to present). Also serves as Chief Executive Officer and Manager, ACS; Executive Vice President, ACIM; Director, ACC, ACIM and other ACC subsidiaries | 115 | None |
Officers
The following table presents certain information about the executive officers of the funds. Each officer serves as an officer for each of the 15 investment companies in the American Century family of funds, unless otherwise noted. No officer is compensated for his or her service as an officer of the funds. The listed officers are interested persons of the funds and are appointed or re-appointed on an annual basis. The mailing address for each officer listed below is 4500 Main Street, Kansas City, Missouri 64111.
|
| | |
Name (Year of Birth) | Offices with
the Funds | Principal Occupation(s) During the Past Five Years |
Jonathan S.
Thomas
(1963) | Director and
President
since 2007 | President and Chief Executive Officer, ACC (March 2007 to present). Also serves as Chief Executive Officer and Manager, ACS; Executive Vice President, ACIM; Director, ACC, ACIM and other ACC subsidiaries |
Amy D. Shelton
(1964) | Chief Compliance
Officer since 2014 | Chief Compliance Officer, American Century funds, (March 2014 to present); Chief Compliance Officer, ACIM (February 2014 to present); Chief Compliance Officer, ACIS (October 2009 to present); Vice President, Client Interactions and Marketing, ACIS (February 2013 to January 2014); Director, Client Interactions and Marketing, ACIS (June 2007 to January 2013). Also serves as Vice President, ACIS |
Charles A.
Etherington
(1957) | General Counsel
since 2007 and
Senior Vice
President since 2006 | Attorney, ACC (February 1994 to present); Vice President, ACC (November 2005 to present); General Counsel, ACC (March 2007 to present). Also serves as General Counsel, ACIM, ACS, ACIS and other ACC subsidiaries; and Senior Vice President, ACIM and ACS |
C. Jean Wade
(1964) | Vice President,
Treasurer and
Chief Financial
Officer since 2012 | Vice President, ACS (February 2000 to present) |
Robert J.
Leach
(1966) | Vice President
since 2006 and
Assistant Treasurer
since 2012 | Vice President, ACS (February 2000 to present) |
David H.
Reinmiller
(1963) | Vice President
since 2000 | Attorney, ACC (January 1994 to present); Associate General Counsel, ACC (January 2001 to present). Also serves as Vice President, ACIM and ACS |
Ward D.
Stauffer
(1960) | Secretary
since 2005 | Attorney, ACC (June 2003 to present) |
The Statement of Additional Information has additional information about the fund's directors and is available without charge, upon request, by calling 1-800-345-2021.
Retirement Account Information
As required by law, distributions you receive from certain IRAs are subject to federal income tax withholding, unless you elect not to have withholding apply. Tax will be withheld on the total amount withdrawn even though you may be receiving amounts that are not subject to withholding, such as nondeductible contributions. In such case, excess amounts of withholding could occur. You may adjust your withholding election so that a greater or lesser amount will be withheld.
If you don’t want us to withhold on this amount, you must notify us to not withhold the federal income tax. You may notify us in writing or in certain situations by telephone or through other electronic means. For systematic withdrawals, your withholding election will remain in effect until revoked or changed by filing a new election. You have the right to revoke your election at any time.
Remember, even if you elect not to have income tax withheld, you are liable for paying income tax on the taxable portion of your withdrawal. If you elect not to have income tax withheld or you don’t have enough income tax withheld, you may be responsible for payment of estimated tax. You may incur penalties under the estimated tax rules if your withholding and estimated tax payments are not sufficient. You can reduce or defer the income tax on a distribution by directly or indirectly rolling such distribution over to another IRA or eligible plan. You should consult your tax advisor for additional information.
State tax will be withheld if, at the time of your distribution, your address is within one of the mandatory withholding states and you have federal income tax withheld (or as otherwise required by state law). State taxes will be withheld from your distribution in accordance with the respective state rules.
Distributions you receive from 403(b), 457 and qualified plans are subject to special tax and withholding rules. Your plan administrator or plan sponsor is required to provide you with a special tax notice explaining those rules at the time you request a distribution. If applicable, federal and/or state taxes may be withheld from your distribution amount.
Proxy Voting Policies
A description of the policies that the fund's investment advisor uses in exercising the voting rights associated with the securities purchased and/or held by the fund is available without charge, upon request, by calling 1-800-345-2021. It is also available on the "About Us" page of American Century Investments’ website at americancentury.com and on the Securities and Exchange Commission’s website at sec.gov. Information regarding how the investment advisor voted proxies relating to portfolio securities during the most recent 12-month period ended June 30 is available on the "About Us" page at americancentury.com. It is also available at sec.gov.
Quarterly Portfolio Disclosure
The fund files its complete schedule of portfolio holdings with the Securities and Exchange Commission (SEC) for the first and third quarters of each fiscal year on Form N-Q. The fund’s Forms N-Q are available on the SEC’s website at sec.gov, and may be reviewed and copied at the SEC’s Public Reference Room in Washington, DC. Information on the operation of the Public Reference Room may be obtained by calling 1-800-SEC-0330. The fund also makes its complete schedule of portfolio holdings for the most recent quarter of its fiscal year available on its
website at americancentury.com and, upon request, by calling 1-800-345-2021.
Other Tax Information
The following information is provided pursuant to provisions of the Internal Revenue Code.
The fund hereby designates up to the maximum amount allowable as qualified dividend income for the fiscal year ended March 31, 2014.
For corporate taxpayers, the fund hereby designates $10,796,202, or up to the maximum amount allowable, of ordinary income distributions paid during the fiscal year ended March 31, 2014 as qualified for the corporate dividends received deduction.
|
| | |
| |
| | | |
| Contact Us | americancentury.com | |
| Automated Information Line | 1-800-345-8765 | |
| Investor Services Representative | 1-800-345-2021 or 816-531-5575 | |
| Investors Using Advisors | 1-800-378-9878 | |
| Business, Not-For-Profit, Employer-Sponsored Retirement Plans | 1-800-345-3533 | |
| Banks and Trust Companies, Broker-Dealers, Financial Professionals, Insurance Companies | 1-800-345-6488 | |
| Telecommunications Relay Service for the Deaf | 711 | |
| | | |
| American Century Capital Portfolios, Inc. | |
| | | |
Investment Advisor: American Century Investment Management, Inc. Kansas City, Missouri | |
| | | |
| This report and the statements it contains are submitted for the general information of our shareholders. The report is not authorized for distribution to prospective investors unless preceded or accompanied by an effective prospectus. | |
| | | |
©2014 American Century Proprietary Holdings, Inc. All rights reserved.
CL-ANN-82093 1405
| |
|
| |
ANNUAL REPORT | MARCH 31, 2014 |
Market Neutral Value Fund
|
| | |
| President’s Letter | |
|
| Performance | |
|
| Portfolio Commentary | |
|
| Fund Characteristics | |
|
| Shareholder Fee Example | |
|
| Schedule of Investments | 10 |
|
| Statement of Assets and Liabilities | |
|
| Statement of Operations | |
|
| Statement of Changes in Net Assets | |
|
| Notes to Financial Statements | |
|
| Financial Highlights | |
|
| Report of Independent Registered Public Accounting Firm | |
|
| Management | |
|
| Additional Information | |
|
Any opinions expressed in this report reflect those of the author as of the date of the report, and do not necessarily represent the opinions of American Century Investments® or any other person in the American Century Investments organization. Any such opinions are subject to change at any time based upon market or other conditions and American Century Investments disclaims any responsibility to update such opinions. These opinions may not be relied upon as investment advice and, because investment decisions made by American Century Investments funds are based on numerous factors, may not be relied upon as an indication of trading intent on behalf of any American Century Investments fund. Security examples are used for representational purposes only and are not intended as recommendations to purchase or sell securities. Performance information for comparative indices and securities is provided to American Century Investments by third party vendors. To the best of American Century Investments’ knowledge, such information is accurate at the time of printing.
|
| |
| Dear Investor:
Thank you for reviewing this annual report for the 12 months ended March 31, 2014. It provides investment performance, market analysis, and portfolio information, presented with the expert perspective of our portfolio management team.
Annual reports remain important vehicles for conveying information about fund returns, including key factors that affected fund performance. For additional, updated investment and market insights, we encourage you to visit our website, americancentury.com.
|
| Jonathan Thomas |
Monetary Policy-Driven, Mostly “Risk-On” Results in the U.S. and Europe
Stimulative monetary policies and expectations of economic improvement helped drive financial market returns during the reporting period. We believe the combination of optimism about the economy, low costs of capital in the money markets, and central bank purchases of longer-maturity fixed income securities (quantitative easing, or QE) helped persuade investors to seek risk and yield, especially in the U.S. and Europe. Stock index returns were strong in these markets, particularly at the smaller capitalization end of the company size spectrum. The MSCI Europe and S&P 500 Indices advanced 24.50% and 21.86%, respectively, and their smaller capitalization counterparts performed even better. In the U.S., growth stocks generally outperformed value stocks.
Some of the same growth and optimism factors that drove stocks higher, plus hints that QE tapering would begin in the U.S., hampered U.S. government bond returns, which dipped into negative territory for the reporting period. On the other hand, U.S. corporate bonds, especially high-yield corporates, posted mostly positive returns because of their higher yields, declining spreads (yield differences between corporate and similar-maturity U.S. Treasury securities), and relatively low default rates. At the other end of the U.S. bond spectrum, Treasury inflation-protected securities (TIPS) underperformed, hurt by the combination of rising yields and low inflation.
Looking ahead, we see further signs of economic improvement for the U.S. in 2014, but headwinds persist. Interest rates could normalize further, and economic growth and U.S. employment levels remain subpar compared with past post-recession periods. In this environment, we continue to believe in a disciplined, diversified, long-term investment approach, using professionally managed stock and bond portfolios—as appropriate—for meeting financial goals. We appreciate your continued trust in us.
Sincerely,
Jonathan Thomas
President and Chief Executive Officer
American Century Investments
|
| | | | |
| Total Returns as of March 31, 2014 |
| | | | Average Annual Returns | |
| | Ticker Symbol | 1 year | Since Inception | Inception Date |
Investor Class(1) | ACVVX | 1.69% | 3.11% | 10/31/11 |
| Barclays U.S. 1-3 Month Treasury Bill Index | – | 0.04% | 0.06% | – |
Institutional Class(1) | ACVKX | 1.98% | 3.35% | 10/31/11 |
A Class(1) | ACVQX | | | 10/31/11 |
| No sales charge* | | 1.50% | 2.87% | |
| With sales charge* | | -4.31% | 0.38% | |
C Class(1) | ACVHX | 0.72% | 2.09% | 10/31/11 |
R Class(1) | ACVWX | 1.21% | 2.63% | 10/31/11 |
| |
| * | Sales charges include initial sales charges and contingent deferred sales charges (CDSCs), as applicable. A Class shares have a 5.75% maximum initial sales charge and may be subject to a maximum CDSC of 1.00%. C Class shares redeemed within 12 months of purchase are subject to a maximum CDSC of 1.00%. The SEC requires that mutual funds provide performance information net of maximum sales charges in all cases where charges could be applied. |
| |
| (1) | Returns would have been lower if a portion of the management fee had not been waived. |
Data presented reflect past performance. Past performance is no guarantee of future results. Current performance may be higher or lower than the performance shown. Investment return and principal value will fluctuate, and redemption value may be more or less than original cost. To obtain performance data current to the most recent month end, please call 1-800-345-2021 or visit americancentury.com. The fund’s investment process may result in high portfolio turnover, which could mean high transaction costs, affecting both performance and capital gains tax liabilities to investors. In addition, its investment approach may involve higher price volatility and short sales risk. International investing involves special risks, such as political instability and currency fluctuations.
Unless otherwise indicated, performance reflects Investor Class shares; performance for other share classes will vary due to differences in fee structure. For information about other share classes available, please consult the prospectus. Data assumes reinvestment of dividends and capital gains, and none of the charts reflect the deduction of taxes that a shareholder would pay on fund distributions or the redemption of fund shares. Returns for the index are provided for comparison. The fund’s total returns include operating expenses (such as transaction costs and management fees) that reduce returns, while the total returns of the index do not.
|
|
| Growth of $10,000 Over Life of Class |
$10,000 investment made October 31, 2011 |
* From 10/31/11, the Investor Class's inception date. Not annualized.
** Ending value would have been lower if a portion of the management fee had not been waived. |
| | | | |
| Total Annual Fund Operating Expenses |
| Investor Class | Institutional Class | A Class | C Class | R Class |
| 5.06% | 4.86% | 5.31% | 6.06% | 5.56% |
The total annual fund operating expenses shown is as stated in the fund’s prospectus current as of the date of this report. The prospectus may vary from the expense ratio shown elsewhere in this report because it is based on a different time period, includes acquired fund fees and expenses, and, if applicable, does not include fee waivers or expense reimbursements.
Data presented reflect past performance. Past performance is no guarantee of future results. Current performance may be higher or lower than the performance shown. Investment return and principal value will fluctuate, and redemption value may be more or less than original cost. To obtain performance data current to the most recent month end, please call 1-800-345-2021 or visit americancentury.com. The fund’s investment process may result in high portfolio turnover, which could mean high transaction costs, affecting both performance and capital gains tax liabilities to investors. In addition, its investment approach may involve higher price volatility and short sales risk. International investing involves special risks, such as political instability and currency fluctuations.
Unless otherwise indicated, performance reflects Investor Class shares; performance for other share classes will vary due to differences in fee structure. For information about other share classes available, please consult the prospectus. Data assumes reinvestment of dividends and capital gains, and none of the charts reflect the deduction of taxes that a shareholder would pay on fund distributions or the redemption of fund shares. Returns for the index are provided for comparison. The fund’s total returns include operating expenses (such as transaction costs and management fees) that reduce returns, while the total returns of the index do not.
Portfolio Managers: Phil Davidson, Michael Liss, Kevin Toney, and Brian Woglom
Performance Summary
Market Neutral Value returned 1.69%* (including operating expenses) for the 12 months ended March 31, 2014. This compares to the 0.04% return of its benchmark, the Barclays U.S. 1-3 Month Treasury Bill Index.
The U.S. stock market generated strong gains during the one-year reporting period. When the period began, riskier asset classes led the market, as the Federal Reserve’s (Fed) bond-buying programs continued. Market leadership changed after the Fed suggested it might start tapering its asset purchases if economic conditions improved. Higher-quality stocks came into favor and as interest rates rose, higher-yielding stocks, such as real estate investment trusts (REITs) and utilities, declined. As the Fed sought to calm fears about eventual tapering, riskier stocks posted gains, but they reversed direction in mid-August on positive economic data, which suggested the Fed might announce tapering as soon as September. After the Fed surprised the markets by making no changes to its stimulus programs, lower-quality, riskier stocks rallied and continued to outperform through the end of 2013. In December, the U.S. economy showed new signs of strength and the Fed announced it would begin modestly scaling back its asset purchases in January 2014. As interest rates trended down in the last three months of the reporting period, yield-oriented securities, including utilities and REITs, rallied. For the reporting period overall, riskier, lower-yielding, and lower-quality stocks outperformed. Though value stocks recorded significant gains, they underperformed growth stocks. Large-cap value stocks underperformed both mid-cap value stocks and small-cap value stocks.
Market Neutral Value is a natural extension of our existing capabilities. The heart of the strategy is to pair stocks of highly correlated business models—going long the more undervalued company and short the overvalued company. We believe this helps reduce some of the risks associated with shorting.
Positions in Energy and Information Technology Contributed Positively
The portfolio benefited from its stance in the energy and information technology sectors. In energy, the portfolio was long Valero LP, a master limited partnership (MLP). The portfolio was short an MLP exchanged-traded fund (ETF) and shares of Plains All American Pipelines LP. Valero LP was formed by oil refiner Valero Energy to own, operate, develop, and acquire crude oil and refined petroleum products pipelines, terminals, and other transportation and logistics assets.
In information technology, the portfolio was long the Class A shares of Molex, a manufacturer of electronic and fiber-optic interconnection products and systems, and it was short Molex’s common stock. As the spread (difference in price) between the two share classes was eliminated on news that Molex would be acquired by Koch Industries, the portfolio’s positioning contributed positively to performance.
A Position in Consumer Discretionary Added Value
Although the portfolio’s stance in consumer discretionary detracted from performance overall, the sector provided a contributing position. The portfolio was long Hasbro and short Mattel. We believed Hasbro was more attractively valued and could potentially be acquired. This positioning added value during the reporting period as Hasbro’s stock appreciated and Mattel’s stock declined.
| |
| * | All fund returns referenced in this commentary are for Investor Class shares. Returns would have been lower if a portion of the management fee had not been waived. |
Position in Industrials Detracted from Relative Results
In the industrials sector, the portfolio’s performance was hampered by a long position in security monitoring company ADT, which was paired on the short side with an industrials ETF. In our opinion, ADT was undervalued by the market and was also a potential takeover candidate. However, ADT’s stock declined on news of the chief financial officer’s departure and the significant reduction of a stake held by an activist shareholder. The stock was also pressured by an increase in subscriber-acquisition costs and associated lower-than-expected account growth as a result of competitors’ aggressive tactics, a situation we consider largely transitory.
Outlook
Market Neutral Value is designed to address several secular financial planning trends, including the need for an alternative to cash in this low interest rate environment, diversification resulting from not being correlated to equity markets, low market volatility exposure, and a hedge against a rise in inflation and/or interest rates.
|
| |
| MARCH 31, 2014 | |
| Top Ten Long Holdings | % of net assets |
| Royal Dutch Shell plc, Class A ADR | 4.92% |
| Hubbell, Inc., Class A | 4.77% |
| HEICO Corp., Class A | 4.77% |
| iShares Russell 1000 Value Index Fund | 4.71% |
| Unilever NV ADR | 3.35% |
| Republic Services, Inc. | 1.90% |
| PNC Financial Services Group, Inc. (The) | 1.83% |
| Occidental Petroleum Corp. | 1.66% |
| ONE Gas, Inc. | 1.60% |
| Westar Energy, Inc. | 1.54% |
| | |
| Top Ten Short Holdings | % of net assets |
| Royal Dutch Shell plc, Class B ADR | (4.92)% |
| HEICO Corp. | (4.79)% |
| Hubbell, Inc., Class B | (4.70)% |
| iShares Russell 1000 Growth Index Fund | (4.23)% |
| Unilever plc ADR | (3.77)% |
| Utilities Select Sector SPDR Fund | (3.15)% |
| Consumer Discretionary Select Sector SPDR Fund | (2.76)% |
| Waste Management, Inc. | (1.91)% |
| Duke Energy Corp. | (1.90)% |
| ConocoPhillips | (1.68)% |
| | |
| Types of Investments in Portfolio | % of net assets |
| Domestic Common Stocks | 61.5% |
| Foreign Common Stocks* | 13.6% |
| Exchange-Traded Funds | 5.0% |
| Convertible Bonds | 0.6% |
| Convertible Preferred Stocks | 0.4% |
| Domestic Common Stocks Sold Short | (56.1)% |
| Foreign Common Stocks Sold Short* | (10.1)% |
| Exchange-Traded Funds Sold Short | (15.0)% |
| Temporary Cash Investments | 19.8% |
| Other Assets and Liabilities** | 80.3% |
*Includes depositary shares, dual listed securities and foreign ordinary shares.
**Amount relates primarily to deposits with broker for securities sold short at period end.
Fund shareholders may incur two types of costs: (1) transaction costs, including sales charges (loads) on purchase payments and redemption/exchange fees; and (2) ongoing costs, including management fees; distribution and service (12b-1) fees; and other fund expenses. This example is intended to help you understand your ongoing costs (in dollars) of investing in your fund and to compare these costs with the ongoing cost of investing in other mutual funds.
The example is based on an investment of $1,000 made at the beginning of the period and held for the entire period from October 1, 2013 to March 31, 2014.
Actual Expenses
The table provides information about actual account values and actual expenses for each class. You may use the information, together with the amount you invested, to estimate the expenses that you paid over the period. First, identify the share class you own. Then simply divide your account value by $1,000 (for example, an $8,600 account value divided by $1,000 = 8.6), then multiply the result by the number under the heading “Expenses Paid During Period” to estimate the expenses you paid on your account during this period.
If you hold Investor Class shares of any American Century Investments fund, or Institutional Class shares of the American Century Diversified Bond Fund, in an American Century Investments account (i.e., not a financial intermediary or retirement plan account), American Century Investments may charge you a $12.50 semiannual account maintenance fee if the value of those shares is less than $10,000. We will redeem shares automatically in one of your accounts to pay the $12.50 fee. In determining your total eligible investment amount, we will include your investments in all personal accounts (including American Century Investments Brokerage accounts) registered under your Social Security number. Personal accounts include individual accounts, joint accounts, UGMA/UTMA accounts, personal trusts, Coverdell Education Savings Accounts and IRAs (including traditional, Roth, Rollover, SEP-, SARSEP- and SIMPLE-IRAs), and certain other retirement accounts. If you have only business, business retirement, employer-sponsored or American Century Investments Brokerage accounts, you are currently not subject to this fee. If you are subject to the Account Maintenance Fee, your account value could be reduced by the fee amount.
Hypothetical Example for Comparison Purposes
The table also provides information about hypothetical account values and hypothetical expenses based on the actual expense ratio of each class of your fund and an assumed rate of return of 5% per year before expenses, which is not the actual return of a fund’s share class. The hypothetical account values and expenses may not be used to estimate the actual ending account balance or expenses you paid for the period. You may use this information to compare the ongoing costs of investing in your fund and other funds. To do so, compare this 5% hypothetical example with the 5% hypothetical examples that appear in the shareholder reports of the other funds.
Please note that the expenses shown in the table are meant to highlight your ongoing costs only and do not reflect any transactional costs, such as sales charges (loads) or redemption/exchange fees. Therefore, the table is useful in comparing ongoing costs only, and will not help you determine the relative total costs of owning different funds. In addition, if these transactional costs were included, your costs would have been higher.
|
| | | | |
| Beginning Account Value 10/1/13 | Ending Account Value 3/31/14 | Expenses Paid During Period(1) 10/1/13 - 3/31/14 |
Annualized Expense Ratio(1) |
| Actual | | | | |
| Investor Class (after waiver) | $1,000 | $997.40 | $19.72 | 3.96% |
| Investor Class (before waiver) | $1,000 | $997.40(2) | $21.21 | 4.26% |
| Institutional Class (after waiver) | $1,000 | $999.40 | $18.74 | 3.76% |
| Institutional Class (before waiver) | $1,000 | $999.40(2) | $20.24 | 4.06% |
| A Class (after waiver) | $1,000 | $996.40 | $20.95 | 4.21% |
| A Class (before waiver) | $1,000 | $996.40(2) | $22.45 | 4.51% |
| C Class (after waiver) | $1,000 | $992.40 | $24.64 | 4.96% |
| C Class (before waiver) | $1,000 | $992.40(2) | $26.13 | 5.26% |
| R Class (after waiver) | $1,000 | $995.40 | $22.19 | 4.46% |
| R Class (before waiver) | $1,000 | $995.40(2) | $23.68 | 4.76% |
| Hypothetical | | | | |
| Investor Class (after waiver) | $1,000 | $1,005.19 | $19.80 | 3.96% |
| Investor Class (before waiver) | $1,000 | $1,003.69 | $21.28 | 4.26% |
| Institutional Class (after waiver) | $1,000 | $1,006.18 | $18.81 | 3.76% |
| Institutional Class (before waiver) | $1,000 | $1,004.69 | $20.29 | 4.06% |
| A Class (after waiver) | $1,000 | $1,003.94 | $21.03 | 4.21% |
| A Class (before waiver) | $1,000 | $1,002.44 | $22.52 | 4.51% |
| C Class (after waiver) | $1,000 | $1,000.20 | $24.73 | 4.96% |
| C Class (before waiver) | $1,000 | $998.70 | $26.21 | 5.26% |
| R Class (after waiver) | $1,000 | $1,002.69 | $22.27 | 4.46% |
| R Class (before waiver) | $1,000 | $1,001.20 | $23.75 | 4.76% |
| |
| (1) | Expenses are equal to the class's annualized expense ratio listed in the table above, multiplied by the average account value over the period, multiplied by 182, the number of days in the most recent fiscal half-year, divided by 365, to reflect the one-half year period. |
| |
| (2) | Ending account value assumes the return earned after waiver and would have been lower if a portion of the management fee had not been waived. |
MARCH 31, 2014
|
| | | | | |
| | Shares | Value |
| COMMON STOCKS - 75.1% |
| AEROSPACE AND DEFENSE - 7.6% |
BAE Systems plc ADR(1) | 17,150 |
| $ | 480,714 |
|
General Dynamics Corp.(1) | 4,961 |
| 540,352 |
|
HEICO Corp., Class A(1) | 83,766 |
| 3,636,282 |
|
| Northrop Grumman Corp. | 2,690 |
| 331,892 |
|
Raytheon Co.(1) | 3,290 |
| 325,019 |
|
Rockwell Collins, Inc.(1) | 1,922 |
| 153,126 |
|
Textron, Inc.(1) | 8,640 |
| 339,466 |
|
| | | 5,806,851 |
|
| AIR FREIGHT AND LOGISTICS - 1.3% |
United Parcel Service, Inc., Class B(1) | 10,096 |
| 983,149 |
|
| AUTOMOBILES - 0.5% |
Honda Motor Co. Ltd. ADR(1) | 6,978 |
| 246,603 |
|
Toyota Motor Corp. ADR(1) | 1,415 |
| 159,753 |
|
| | | 406,356 |
|
| BEVERAGES - 1.3% | | |
PepsiCo, Inc.(1) | 11,750 |
| 981,125 |
|
| BUILDING PRODUCTS - 0.6% |
Norcraft Cos., Inc.(1)(2) | 27,069 |
| 458,278 |
|
| CAPITAL MARKETS - 1.5% |
Franklin Resources, Inc.(1) | 6,610 |
| 358,130 |
|
Northern Trust Corp.(1) | 10,192 |
| 668,187 |
|
T. Rowe Price Group, Inc.(1) | 1,460 |
| 120,231 |
|
| | | 1,146,548 |
|
| CHEMICALS - 0.7% | | |
Potash Corp. of Saskatchewan, Inc.(1) | 15,680 |
| 567,930 |
|
| COMMERCIAL BANKS - 2.6% |
M&T Bank Corp.(1) | 4,790 |
| 581,027 |
|
PNC Financial Services Group, Inc. (The)(1) | 16,019 |
| 1,393,653 |
|
| | | 1,974,680 |
|
| COMMERCIAL SERVICES AND SUPPLIES - 3.4% |
ADT Corp. (The)(1) | 37,692 |
| 1,128,875 |
|
|
| | | | |
| | Shares | Value |
Republic Services, Inc.(1) | 42,403 | $ | 1,448,487 |
|
| | | 2,577,362 |
|
| CONTAINERS AND PACKAGING - 0.9% |
Bemis Co., Inc.(1) | 17,571 | 689,486 |
|
| DIVERSIFIED TELECOMMUNICATION SERVICES - 0.3% |
| AT&T, Inc. | 6,960 | 244,087 |
|
| ELECTRIC UTILITIES - 2.7% |
Great Plains Energy, Inc.(1) | 1,300 | 35,152 |
|
Westar Energy, Inc.(1) | 33,428 | 1,175,328 |
|
Xcel Energy, Inc.(1) | 27,463 | 833,777 |
|
| | | 2,044,257 |
|
| ELECTRICAL EQUIPMENT - 6.2% |
ABB Ltd. ADR(1) | 29,015 | 748,297 |
|
Brady Corp., Class A(1) | 12,883 | 349,773 |
|
Hubbell, Inc., Class A(1) | 32,711 | 3,637,136 |
|
| | | 4,735,206 |
|
| FOOD AND STAPLES RETAILING - 1.2% |
Sysco Corp.(1) | 16,760 | 605,539 |
|
Wal-Mart Stores, Inc.(1) | 4,400 | 336,292 |
|
| | | 941,831 |
|
| FOOD PRODUCTS - 6.0% |
Campbell Soup Co.(1) | 11,490 | 515,671 |
|
General Mills, Inc.(1) | 8,885 | 460,421 |
|
Hillshire Brands Co.(1) | 27,530 | 1,025,768 |
|
Unilever NV ADR(1) | 62,146 | 2,555,443 |
|
| | | 4,557,303 |
|
| GAS UTILITIES - 3.8% |
Atmos Energy Corp.(1) | 8,068 | 380,245 |
|
Laclede Group, Inc. (The)(1) | 17,779 | 838,280 |
|
ONE Gas, Inc.(1)(2) | 33,880 | 1,217,308 |
|
WGL Holdings, Inc.(1) | 10,980 | 439,859 |
|
| | | 2,875,692 |
|
| HEALTH CARE EQUIPMENT AND SUPPLIES - 0.9% |
CareFusion Corp.(1)(2) | 11,840 | 476,205 |
|
Stryker Corp.(1) | 2,263 | 184,366 |
|
| | | 660,571 |
|
|
| | | | |
| | Shares | Value |
| HEALTH CARE PROVIDERS AND SERVICES - 1.9% |
LifePoint Hospitals, Inc.(1)(2) | 9,600 | $ | 523,680 |
|
Quest Diagnostics, Inc.(1) | 16,604 | 961,704 |
|
| | | 1,485,384 |
|
| HOTELS, RESTAURANTS AND LEISURE - 1.2% |
Carnival Corp.(1) | 10,293 | 389,693 |
|
International Game Technology(1) | 36,440 | 512,346 |
|
| | | 902,039 |
|
| HOUSEHOLD DURABLES - 0.8% |
Lennar Corp., Class B(1) | 18,935 | 618,038 |
|
| HOUSEHOLD PRODUCTS - 0.8% |
Procter & Gamble Co. (The)(1) | 7,767 | 626,020 |
|
| INDUSTRIAL CONGLOMERATES - 0.4% |
| Koninklijke Philips Electronics NV | 7,810 | 274,600 |
|
| INSURANCE - 4.7% | | |
Chubb Corp. (The)(1) | 12,655 | 1,130,092 |
|
Crawford & Co., Class A(1) | 62,348 | 582,330 |
|
Marsh & McLennan Cos., Inc.(1) | 13,430 | 662,099 |
|
MetLife, Inc.(1) | 11,021 | 581,909 |
|
Reinsurance Group of America, Inc.(1) | 7,910 | 629,873 |
|
| | | 3,586,303 |
|
| LIFE SCIENCES TOOLS AND SERVICES - 1.0% |
Agilent Technologies, Inc.(1) | 1,087 | 60,785 |
|
Waters Corp.(1)(2) | 6,350 | 688,404 |
|
| | | 749,189 |
|
| MACHINERY - 1.2% | | |
Stanley Black & Decker, Inc.(1) | 4,470 | 363,143 |
|
Woodward, Inc.(1) | 14,034 | 582,832 |
|
| | | 945,975 |
|
| METALS AND MINING - 2.3% |
Constellium NV, Class A(1)(2) | 25,659 | 753,092 |
|
Nucor Corp.(1) | 20,240 | 1,022,929 |
|
| | | 1,776,021 |
|
| MULTI-UTILITIES - 0.7% |
PG&E Corp.(1) | 13,015 | 562,248 |
|
| MULTILINE RETAIL - 0.3% |
Target Corp.(1) | 4,080 | 246,881 |
|
|
| | | | |
| | Shares | Value |
| OIL, GAS AND CONSUMABLE FUELS - 8.6% |
El Paso Pipeline Partners LP(1) | 22,810 | $ | 693,196 |
|
Imperial Oil Ltd.(1) | 11,860 | 552,083 |
|
Occidental Petroleum Corp.(1) | 13,317 | 1,268,977 |
|
Royal Dutch Shell plc, Class A ADR(1) | 51,420 | 3,756,745 |
|
| Williams Partners LP | 5,240 | 266,926 |
|
| | | 6,537,927 |
|
| PHARMACEUTICALS - 1.9% |
Johnson & Johnson(1) | 5,699 | 559,813 |
|
| Pfizer, Inc. | 18,670 | 599,680 |
|
| Teva Pharmaceutical Industries Ltd. ADR | 5,790 | 305,944 |
|
| | | 1,465,437 |
|
| REAL ESTATE INVESTMENT TRUSTS (REITs) - 1.4% |
Annaly Capital Management, Inc.(1) | 32,620 | 357,841 |
|
Corrections Corp. of America(1) | 8,838 | 276,806 |
|
Piedmont Office Realty Trust, Inc., Class A(1) | 24,390 | 418,289 |
|
| | | 1,052,936 |
|
| ROAD AND RAIL - 1.0% |
Union Pacific Corp.(1) | 4,120 | 773,159 |
|
| SEMICONDUCTORS AND SEMICONDUCTOR EQUIPMENT - 1.5% |
Applied Materials, Inc.(1) | 52,030 | 1,062,452 |
|
Teradyne, Inc.(1)(2) | 2,120 | 42,167 |
|
| | | 1,104,619 |
|
| SOFTWARE - 0.8% | | |
A10 Networks, Inc.(2) | 40,000 | 601,600 |
|
| SPECIALTY RETAIL - 1.1% |
Bed Bath & Beyond, Inc.(1)(2) | 3,857 | 265,362 |
|
CST Brands, Inc.(1) | 17,134 | 535,266 |
|
| | | 800,628 |
|
| TRADING COMPANIES AND DISTRIBUTORS - 0.7% |
Rush Enterprises, Inc., Class B(1)(2) | 19,104 | 539,115 |
|
| WIRELESS TELECOMMUNICATION SERVICES - 1.3% |
Telephone & Data Systems, Inc.(1) | 37,810 | 991,000 |
|
TOTAL COMMON STOCKS (Cost $52,350,000) | 57,289,831 |
|
|
| | | | | | |
| | Shares/Principal Amount | Value |
| EXCHANGE-TRADED FUNDS - 5.0% |
iShares Russell 1000 Value Index Fund(1) | 37,249 |
| $ | 3,594,529 |
|
Market Vectors Gold Miners(1) | 10,360 |
| 244,496 |
|
TOTAL EXCHANGE-TRADED FUNDS (Cost $3,445,507) | 3,839,025 |
|
| CONVERTIBLE BONDS - 0.6% |
| PAPER AND FOREST PRODUCTS - 0.6% |
Rayonier TRS Holdings, Inc., 4.50%, 8/15/15(1) (Cost $529,382) | $ | 330,000 |
| 480,975 |
|
| CONVERTIBLE PREFERRED STOCKS - 0.4% |
| ELECTRIC UTILITIES - 0.4% |
NextEra Energy, Inc., 5.80%, 9/1/16(1) (Cost $257,208) | 5,281 |
| 285,280 |
|
| TEMPORARY CASH INVESTMENTS - 19.8% |
| Repurchase Agreement, Bank of America Merrill Lynch, (collateralized by various U.S. Treasury obligations, 0.75% - 1.375%, 10/31/17 - 6/30/18, valued at $2,929,460), in a joint trading account at 0.03%, dated 3/31/14, due 4/1/14 (Delivery value $2,870,240) | 2,870,238 |
|
| Repurchase Agreement, Goldman Sachs & Co., (collateralized by various U.S. Treasury obligations, 4.25%, 8/15/15, valued at $2,576,566), in a joint trading account at 0.03%, dated 3/31/14, due 4/1/14 (Delivery value $2,525,812) | 2,525,810 |
|
| SSgA U.S. Government Money Market Fund | 9,731,231 |
| 9,731,231 |
|
TOTAL TEMPORARY CASH INVESTMENTS (Cost $15,127,279) | 15,127,279 |
|
TOTAL INVESTMENT SECURITIES BEFORE SECURITIES SOLD SHORT - 100.9% (Cost $71,709,376) | 77,022,390 |
|
| SECURITIES SOLD SHORT - (81.2)% |
| COMMON STOCKS SOLD SHORT - (66.2)% |
| AEROSPACE AND DEFENSE - (7.2)% |
| HEICO Corp. | (60,685 | ) | (3,650,809 | ) |
| Honeywell International, Inc. | (7,543 | ) | (699,689 | ) |
| Lockheed Martin Corp. | (7,050 | ) | (1,150,842 | ) |
| | | (5,501,340 | ) |
|
| | | | | | |
| | Shares | Value |
| AIR FREIGHT AND LOGISTICS - (0.8)% |
| FedEx Corp. | (4,700 | ) | $ | (623,032 | ) |
| AUTOMOBILES - (0.5)% |
| General Motors Co. | (11,660 | ) | (401,337 | ) |
| BEVERAGES - (1.3)% |
| Coca-Cola Co. (The) | (25,335 | ) | (979,451 | ) |
| BIOTECHNOLOGY - (0.6)% |
| Amgen, Inc. | (3,661 | ) | (451,548 | ) |
| CAPITAL MARKETS - (1.5)% |
| Ameriprise Financial, Inc. | (3,240 | ) | (356,627 | ) |
| Bank of New York Mellon Corp. (The) | (18,861 | ) | (665,605 | ) |
| BlackRock, Inc. | (420 | ) | (132,081 | ) |
| | | (1,154,313 | ) |
| COMMERCIAL BANKS - (2.6)% |
| Fifth Third Bancorp. | (44,752 | ) | (1,027,058 | ) |
| JPMorgan Chase & Co. | (15,650 | ) | (950,112 | ) |
| | | (1,977,170 | ) |
| COMMERCIAL SERVICES AND SUPPLIES - (1.9)% |
| Waste Management, Inc. | (34,580 | ) | (1,454,781 | ) |
| COMMUNICATIONS EQUIPMENT - (0.8)% |
| Cisco Systems, Inc. | (26,650 | ) | (597,227 | ) |
| COMPUTERS AND PERIPHERALS - (1.4)% |
| Hewlett-Packard Co. | (33,070 | ) | (1,070,145 | ) |
| DIVERSIFIED FINANCIAL SERVICES - (0.5)% |
| Berkshire Hathaway, Inc., Class B | (3,004 | ) | (375,410 | ) |
| DIVERSIFIED TELECOMMUNICATION SERVICES - (0.3)% |
| Verizon Communications, Inc. | (5,070 | ) | (241,180 | ) |
| ELECTRIC UTILITIES - (3.8)% |
| American Electric Power Co., Inc. | (11,140 | ) | (564,352 | ) |
| Duke Energy Corp. | (20,397 | ) | (1,452,674 | ) |
| Southern Co. (The) | (20,222 | ) | (888,555 | ) |
| | | (2,905,581 | ) |
| ELECTRICAL EQUIPMENT - (5.5)% |
| Eaton Corp. plc | (7,735 | ) | (581,053 | ) |
| Hubbell, Inc., Class B | (29,926 | ) | (3,587,230 | ) |
| | | (4,168,283 | ) |
| FOOD PRODUCTS - (5.7)% |
| Kellogg Co. | (7,421 | ) | (465,371 | ) |
| Tyson Foods, Inc., Class A | (23,720 | ) | (1,043,917 | ) |
|
| | | | | | |
| | Shares | Value |
| Unilever plc ADR | (67,169 | ) | $ | (2,873,490 | ) |
| | | (4,382,778 | ) |
| GAS UTILITIES - (0.6)% |
| AGL Resources, Inc. | (8,970 | ) | (439,171 | ) |
| HEALTH CARE EQUIPMENT AND SUPPLIES - (0.6)% |
| Covidien plc | (6,390 | ) | (470,687 | ) |
| HEALTH CARE PROVIDERS AND SERVICES - (2.0)% |
| HCA Holdings, Inc. | (10,121 | ) | (531,352 | ) |
| Laboratory Corp. of America Holdings | (9,799 | ) | (962,360 | ) |
| | | (1,493,712 | ) |
| HOTELS, RESTAURANTS AND LEISURE - (1.3)% |
| McDonald's Corp. | (6,180 | ) | (605,825 | ) |
| Royal Caribbean Cruises Ltd. | (7,175 | ) | (391,468 | ) |
| | | (997,293 | ) |
| HOUSEHOLD DURABLES - (0.8)% |
Lennar Corp., Class A | (15,530 | ) | (615,299 | ) |
| HOUSEHOLD PRODUCTS - (0.4)% |
| Kimberly-Clark Corp. | (2,787 | ) | (307,267 | ) |
| INSURANCE - (4.2)% |
| Aon plc | (7,930 | ) | (668,340 | ) |
| Crawford & Co., Class B | (53,600 | ) | (584,776 | ) |
| Prudential Financial, Inc. | (14,443 | ) | (1,222,600 | ) |
| Travelers Cos., Inc. (The) | (8,840 | ) | (752,284 | ) |
| | | (3,228,000 | ) |
| LIFE SCIENCES TOOLS AND SERVICES - (1.0)% |
| Thermo Fisher Scientific, Inc. | (6,212 | ) | (746,931 | ) |
| MACHINERY - (3.1)% |
| Caterpillar, Inc. | (11,039 | ) | (1,096,946 | ) |
| Deere & Co. | (10,095 | ) | (916,626 | ) |
| Snap-on, Inc. | (3,190 | ) | (362,001 | ) |
| | | (2,375,573 | ) |
| METALS AND MINING - (1.3)% |
| BHP Billiton Ltd. ADR | (15,140 | ) | (1,026,038 | ) |
| MULTILINE RETAIL - (1.1)% |
| Kohl's Corp. | (4,350 | ) | (247,080 | ) |
| Macy's, Inc. | (4,577 | ) | (271,370 | ) |
| Sears Holdings Corp. | (7,115 | ) | (339,813 | ) |
| | | (858,263 | ) |
|
| | | | | | |
| | Shares | Value |
| OIL, GAS AND CONSUMABLE FUELS - (8.6)% |
| ConocoPhillips | (18,183 | ) | $ | (1,279,174 | ) |
| Exxon Mobil Corp. | (5,630 | ) | (549,938 | ) |
| Kinder Morgan Energy Partners LP | (5,490 | ) | (405,985 | ) |
| Kinder Morgan Management LLC | (7,862 | ) | (563,470 | ) |
| Royal Dutch Shell plc, Class B ADR | (48,054 | ) | (3,753,498 | ) |
| | | (6,552,065 | ) |
| PAPER AND FOREST PRODUCTS - (0.9)% |
| International Paper Co. | (15,007 | ) | (688,521 | ) |
| PHARMACEUTICALS - (1.2)% |
| Actavis plc | (820 | ) | (168,797 | ) |
| Merck & Co., Inc. | (10,610 | ) | (602,330 | ) |
| Valeant Pharmaceuticals International, Inc. | (1,060 | ) | (139,740 | ) |
| | | (910,867 | ) |
| REAL ESTATE INVESTMENT TRUSTS (REITs) - (1.2)% |
| Boston Properties, Inc. | (3,640 | ) | (416,889 | ) |
| Rayonier, Inc. | (10,557 | ) | (484,672 | ) |
| | | (901,561 | ) |
| ROAD AND RAIL - (1.5)% |
| CSX Corp. | (12,405 | ) | (359,373 | ) |
| Norfolk Southern Corp. | (5,250 | ) | (510,142 | ) |
| Werner Enterprises, Inc. | (10,580 | ) | (269,896 | ) |
| | | (1,139,411 | ) |
| TRADING COMPANIES AND DISTRIBUTORS - (0.7)% |
| Rush Enterprises, Inc., Class A | (16,230 | ) | (527,150 | ) |
| WIRELESS TELECOMMUNICATION SERVICES - (1.3)% |
| United States Cellular Corp. | (24,014 | ) | (984,814 | ) |
TOTAL COMMON STOCKS SOLD SHORT (Proceeds $46,781,694) | $ | (50,546,199 | ) |
| EXCHANGE-TRADED FUNDS SOLD SHORT - (15.0)% |
| Consumer Discretionary Select Sector SPDR Fund | (32,480 | ) | (2,102,106 | ) |
| Consumer Staples Select Sector SPDR Fund | (12,080 | ) | (520,165 | ) |
| DNP Select Income Fund, Inc. | (3,930 | ) | (38,514 | ) |
|
| | | | | | |
| | Shares | Value |
| Industrial Select Sector SPDR Fund | (10,493 | ) | $ | (549,099 | ) |
| iShares Dow Jones US Medical Devices Index Fund | (3,011 | ) | (297,517 | ) |
| iShares PHLX Semiconductor ETF | (620 | ) | (49,408 | ) |
| iShares Russell 1000 Growth Index Fund | (37,301 | ) | (3,228,028 | ) |
| iShares U.S. Basic Materials ETF | (9,060 | ) | (754,426 | ) |
| SPDR Gold Shares | (1,970 | ) | (243,512 | ) |
| SPDR S&P Homebuilders ETF | (13,790 | ) | (448,864 | ) |
| Utilities Select Sector SPDR Fund | (57,870 | ) | (2,399,290 | ) |
|
| | | | | |
| | Shares | Value |
| Vanguard REIT ETF | (11,303 | ) | $ | (798,218 | ) |
TOTAL EXCHANGE-TRADED FUNDS SOLD SHORT (Proceeds $10,964,621) | (11,429,147 | ) |
TOTAL SECURITIES SOLD SHORT - (81.2)% (Proceeds $57,746,315) | (61,975,346 | ) |
OTHER ASSETS AND LIABILITIES(3) - 80.3% | 61,242,718 |
|
| TOTAL NET ASSETS - 100.0% | $ | 76,289,762 |
|
|
| | | | | | | | |
| FORWARD FOREIGN CURRENCY EXCHANGE CONTRACTS |
| Currency Purchased | Currency Sold | Counterparty | Settlement Date | Unrealized Appreciation (Depreciation) |
| USD | 482,082 | CAD | 538,727 | JPMorgan Chase Bank N.A. | 4/30/14 | $ | (4,905 | ) |
| USD | 676,070 | CHF | 596,645 | Credit Suisse AG | 4/30/14 | 1,020 |
|
| USD | 2,369,174 | EUR | 1,717,913 | UBS AG | 4/30/14 | 2,636 |
|
| USD | 65,973 | EUR | 48,021 | UBS AG | 4/30/14 | (179 | ) |
| USD | 109,849 | EUR | 79,733 | UBS AG | 4/30/14 | 12 |
|
| USD | 360,111 | JPY | 36,818,447 | Credit Suisse AG | 4/30/14 | 3,340 |
|
| USD | 11,234 | JPY | 1,156,640 | Credit Suisse AG | 4/30/14 | 27 |
|
| | | | | | | $ | 1,951 |
|
|
| | |
| Notes to Schedule of Investments |
| ADR | - | American Depositary Receipt |
| CAD | - | Canadian Dollar |
| CHF | - | Swiss Franc |
| EUR | - | Euro |
| JPY | - | Japanese Yen |
| USD | - | United States Dollar |
| |
| (1) | Security, or a portion thereof, has been pledged at the custodian bank or with a broker for collateral requirements on securities sold short. At the period end, the aggregate value of securities pledged was $51,172,224. |
| |
| (3) | Amount relates primarily to deposits with broker for securities sold short at period end. |
See Notes to Financial Statements.
|
|
| Statement of Assets and Liabilities |
|
| | | |
| MARCH 31, 2014 | |
| Assets | |
| Investment securities, at value (cost of $71,709,376) | $ | 77,022,390 |
|
| Cash | 19 |
|
| Deposits with broker for securities sold short | 61,313,590 |
|
| Receivable for investments sold | 1,703,102 |
|
| Receivable for capital shares sold | 85,355 |
|
| Unrealized appreciation on forward foreign currency exchange contracts | 7,035 |
|
| Dividends and interest receivable | 109,953 |
|
| | 140,241,444 |
|
| | |
| Liabilities | |
| Securities sold short, at value (proceeds of $57,746,315) | 61,975,346 |
|
| Payable for investments purchased | 1,804,545 |
|
| Payable for capital shares redeemed | 19,468 |
|
| Unrealized depreciation on forward foreign currency exchange contracts | 5,084 |
|
| Accrued management fees | 100,606 |
|
| Distribution and service fees payable | 8,833 |
|
| Dividend expense payable on securities sold short | 37,800 |
|
| | 63,951,682 |
|
| | |
| Net Assets | $ | 76,289,762 |
|
| | |
| Net Assets Consist of: | |
| Capital (par value and paid-in surplus) | $ | 77,132,953 |
|
| Accumulated net investment loss | (9,711 | ) |
| Accumulated net realized loss | (1,919,415 | ) |
| Net unrealized appreciation | 1,085,935 |
|
| | $ | 76,289,762 |
|
|
| | | |
| | Net Assets | Shares Outstanding | Net Asset Value Per Share |
| Investor Class, $0.01 Par Value | $49,664,575 | 4,859,602 | $10.22 |
| Institutional Class, $0.01 Par Value | $5,714,391 | 556,107 | $10.28 |
| A Class, $0.01 Par Value | $13,639,530 | 1,342,223 | $10.16* |
| C Class, $0.01 Par Value | $6,844,488 | 686,599 | $9.97 |
| R Class, $0.01 Par Value | $426,778 | 42,275 | $10.10 |
* Maximum offering price $10.78 (net asset value divided by 0.9425)
See Notes to Financial Statements.
|
| | | |
| YEAR ENDED MARCH 31, 2014 | |
| Investment Income (Loss) | |
| Income: | |
| Dividends (net of foreign taxes withheld of $18,433) | $ | 1,530,277 |
|
| Interest | 8,421 |
|
| | 1,538,698 |
|
| | |
| Expenses: | |
| Dividend expense on securities sold short | 886,076 |
|
| Broker fees and charges on securities sold short | 138,801 |
|
| Management fees | 778,240 |
|
| Distribution and service fees: | |
| A Class | 18,939 |
|
| C Class | 39,836 |
|
| R Class | 2,121 |
|
| Directors' fees and expenses | 1,528 |
|
| Other expenses | 73 |
|
| | 1,865,614 |
|
| Fees waived | (123,470 | ) |
| | 1,742,144 |
|
| | |
| Net investment income (loss) | (203,446 | ) |
| | |
| Realized and Unrealized Gain (Loss) | |
| Net realized gain (loss) on: | |
| Investment transactions | 2,018,166 |
|
| Securities sold short transactions | (2,421,692 | ) |
| Foreign currency transactions | (47,822 | ) |
| | (451,348 | ) |
| | |
| Change in net unrealized appreciation (depreciation) on: | |
| Investments | 4,495,271 |
|
| Securities sold short | (3,602,975 | ) |
| Translation of assets and liabilities in foreign currencies | 708 |
|
| | 893,004 |
|
| | |
| Net realized and unrealized gain (loss) | 441,656 |
|
| | |
| Net Increase (Decrease) in Net Assets Resulting from Operations | $ | 238,210 |
|
See Notes to Financial Statements.
|
|
| Statement of Changes in Net Assets |
|
| | | | | | |
| YEARS ENDED MARCH 31, 2014 AND MARCH 31, 2013 |
| Increase (Decrease) in Net Assets | March 31, 2014 | March 31, 2013 |
| Operations | | |
| Net investment income (loss) | $ | (203,446 | ) | $ | (177,519 | ) |
| Net realized gain (loss) | (451,348 | ) | 241,090 |
|
| Change in net unrealized appreciation (depreciation) | 893,004 |
| 94,900 |
|
| Net increase (decrease) in net assets resulting from operations | 238,210 |
| 158,471 |
|
| | | |
| Distributions to Shareholders | | |
| From net realized gains: | | |
| Investor Class | (782,602 | ) | (156,486 | ) |
| Institutional Class | (42,231 | ) | (13,536 | ) |
| A Class | (193,962 | ) | (30,858 | ) |
| C Class | (106,904 | ) | (18,244 | ) |
| R Class | (8,353 | ) | (13,536 | ) |
| Decrease in net assets from distributions | (1,134,052 | ) | (232,660 | ) |
| | | |
| Capital Share Transactions | | |
| Net increase (decrease) in net assets from capital share transactions | 64,749,898 |
| 7,723,594 |
|
| | | |
| Net increase (decrease) in net assets | 63,854,056 |
| 7,649,405 |
|
| | | |
| Net Assets | | |
| Beginning of period | 12,435,706 |
| 4,786,301 |
|
| End of period | $ | 76,289,762 |
| $ | 12,435,706 |
|
| | | |
| Accumulated net investment loss | $ | (9,711 | ) | $ | (306 | ) |
See Notes to Financial Statements.
|
|
| Notes to Financial Statements |
MARCH 31, 2014
1. Organization
American Century Capital Portfolios, Inc. (the corporation) is registered under the Investment Company Act of 1940, as amended (the 1940 Act), as an open-end management investment company and is organized as a Maryland corporation. Market Neutral Value Fund (the fund) is one fund in a series issued by the corporation. The fund is diversified as defined under the 1940 Act. The fund’s investment objective is to seek long-term capital growth, independent of equity market conditions.
The fund offers the Investor Class, the Institutional Class, the A Class, the C Class and the R Class. The A Class may incur an initial sales charge. The A Class and C Class may be subject to a contingent deferred sales charge. The share classes differ principally in their respective sales charges and distribution and shareholder servicing expenses and arrangements. The Institutional Class is made available to institutional shareholders or through financial intermediaries whose clients do not require the same level of shareholder and administrative services as shareholders of other classes. As a result, the Institutional Class is charged a lower unified management fee.
2. Significant Accounting Policies
The following is a summary of significant accounting policies consistently followed by the fund in preparation of its financial statements. The financial statements are prepared in conformity with accounting principles generally accepted in the United States of America, which may require management to make certain estimates and assumptions at the date of the financial statements. Actual results could differ from these estimates.
Investment Valuations - The fund determines the fair value of its investments and computes its net asset value per share at the close of regular trading (usually 4 p.m. Eastern time) on the New York Stock Exchange (NYSE) on each day the NYSE is open. The Board of Directors has adopted valuation policies and procedures to guide the investment advisor in the fund’s investment valuation process and to provide methodologies for the oversight of the fund’s pricing function.
Equity securities that are listed or traded on a domestic securities exchange are valued at the last reported sales price or at the official closing price as provided by the exchange. Equity securities traded on foreign securities exchanges are generally valued at the closing price of such securities on the exchange where primarily traded or at the close of the NYSE, if that is earlier. If no last sales price is reported, or if local convention or regulation so provides, the mean of the latest bid and asked prices may be used. Securities traded over-the-counter are valued at the mean of the latest bid and asked prices, the last sales price, or the official closing price. Equity securities initially expressed in local currencies are translated into U.S. dollars at the mean of the appropriate currency exchange rate at the close of the NYSE as provided by an independent pricing service.
Fixed income securities maturing in greater than 60 days at the time of purchase are valued at the evaluated mean as provided by independent pricing services or at the mean of the most recent bid and asked prices as provided by investment dealers. Fixed income securities maturing within 60 days at the time of purchase may be valued at cost, plus or minus any amortized discount or premium or at the evaluated mean as provided by an independent pricing service. Evaluated mean prices are commonly derived through utilization of market models, which may consider, among other factors: trade data, quotations from dealers and active market makers, relevant yield curve and spread data, related sector levels, creditworthiness, trade data or market information on comparable securities, and other relevant security specific information.
Open-end management investment companies are valued at the reported net asset value per share. Repurchase agreements are valued at cost, which approximates fair value. Forward foreign currency exchange contracts are valued at the mean of the appropriate forward exchange rate at the close of the NYSE as provided by an independent pricing service.
If the fund determines that the market price for an investment is not readily available or the valuation methods mentioned above do not reflect an investment’s fair value, such investment is valued as determined in good faith by the Board of Directors or its delegate, in accordance with policies and procedures adopted by the Board of Directors. In its determination of fair value, the fund may review several factors including, but not
limited to, market information regarding the specific investment or comparable investments and correlation with other investment types, futures indices or general market indicators. Circumstances that may cause the fund to use these procedures to value an investment include, but are not limited to: an investment has been declared in default or is distressed; trading in a security has been suspended during the trading day or a security is not actively trading on its principal exchange; prices received from a regular pricing source are deemed unreliable; or there is a foreign market holiday and no trading occurred.
The fund monitors for significant events occurring after the close of an investment’s primary exchange but before the fund’s net asset value per share is determined. Significant events may include, but are not limited to: corporate announcements and transactions; governmental action and political unrest that could impact a specific investment or an investment sector; or armed conflicts, natural disasters and similar events that could affect investments in a specific country or region. The fund also monitors for significant fluctuations between domestic and foreign markets, as evidenced by the U.S. market or such other indicators that the Board of Directors, or its delegate, deems appropriate. If significant fluctuations in foreign markets are identified, the fund may apply a model-derived factor to the closing price of equity securities traded on foreign securities exchanges. The factor is based on observable market data as provided by an independent pricing service.
Security Transactions - Security transactions are accounted for as of the trade date. Net realized gains and losses are determined on the identified cost basis, which is also used for federal income tax purposes.
Investment Income - Dividend income less foreign taxes withheld, if any, is recorded as of the ex-dividend date. Distributions received on securities that represent a return of capital or long-term capital gain are recorded as a reduction of cost of investments and/or as a realized gain. The fund may estimate the components of distributions received that may be considered nontaxable distributions or long-term capital gain distributions for income tax purposes. Interest income is recorded on the accrual basis and includes accretion of discounts and amortization of premiums.
Securities Sold Short - The fund enters into short sales, which is selling securities it does not own, as part of its normal investment activities. Upon selling a security short, the fund will segregate cash, cash equivalents or other appropriate liquid securities in at least an amount equal to the current market value of the securities sold short until the fund replaces the borrowed security. Interest earned on segregated cash for securities sold short is reflected as interest income. The fund is required to pay any dividends or interest due on securities sold short. Such dividends and interest are recorded as an expense. The fund may pay fees or charges on the assets borrowed for securities sold short. Liabilities for securities sold short are valued daily and changes in value are recorded as change in net unrealized appreciation (depreciation) on securities sold short. The fund records realized gain (loss) on a security sold short when it is terminated by the fund and includes as a component of net realized gain (loss) on securities sold short transactions.
Foreign Currency Translations - All assets and liabilities initially expressed in foreign currencies are translated into U.S. dollars at prevailing exchange rates at period end. The fund may enter into spot foreign currency exchange contracts to facilitate transactions denominated in a foreign currency. Purchases and sales of investment securities, dividend and interest income, spot foreign currency exchange contracts, and expenses are translated at the rates of exchange prevailing on the respective dates of such transactions. Net realized and unrealized foreign currency exchange gains or losses related to investment securities are a component of net realized gain (loss) on investment transactions and change in net unrealized appreciation (depreciation) on investments, respectively. Net realized and unrealized foreign currency exchange gains or losses related to securities sold short are a component of net realized gain (loss) on securities sold short transactions and change in net unrealized appreciation (depreciation) on securities sold short, respectively.
Segregated Assets - In accordance with the 1940 Act, the fund segregates assets on its books and records to cover certain types of investments, including, but not limited to, futures contracts and short sales. American Century Investment Management, Inc. (ACIM) (the investment advisor) monitors, on a daily basis, the securities segregated to ensure the fund designates a sufficient amount of liquid assets, marked-to-market daily. The fund may also receive assets or be required to pledge assets at the custodian bank or with a broker for margin requirements on futures contracts and short sales.
Repurchase Agreements - The fund may enter into repurchase agreements with institutions that ACIM has determined are creditworthy pursuant to criteria adopted by the Board of Directors. The fund requires that the collateral, represented by securities, received in a repurchase transaction be transferred to the custodian in a manner sufficient to enable the fund to obtain those securities in the event of a default under the repurchase agreement. ACIM monitors, on a daily basis, the securities transferred to ensure the value, including accrued interest, of the securities under each repurchase agreement is equal to or greater than amounts owed to the fund under each repurchase agreement.
Joint Trading Account - Pursuant to an Exemptive Order issued by the Securities and Exchange Commission, the fund, along with certain other funds in the American Century Investments family of funds, may transfer uninvested cash balances into a joint trading account. These balances are invested in one or more repurchase agreements that are collateralized by U.S. Treasury or Agency obligations.
Income Tax Status - It is the fund’s policy to distribute substantially all net investment income and net realized gains to shareholders and to otherwise qualify as a regulated investment company under provisions of the Internal Revenue Code. Accordingly, no provision has been made for income taxes. The fund files U.S. federal, state, local and non-U.S. tax returns as applicable. The fund's tax returns are subject to examination by the relevant taxing authority until expiration of the applicable statute of limitations, which is generally three years from the date of filing but can be longer in certain jurisdictions. At this time, management believes there are no uncertain tax positions which, based on their technical merit, would not be sustained upon examination and for which it is reasonably possible that the total amounts of unrecognized tax benefits will significantly change in the next twelve months.
Multiple Class - All shares of the fund represent an equal pro rata interest in the net assets of the class to which such shares belong, and have identical voting, dividend, liquidation and other rights and the same terms and conditions, except for class specific expenses and exclusive rights to vote on matters affecting only individual classes. Income, non-class specific expenses, and realized and unrealized capital gains and losses of the fund are allocated to each class of shares based on their relative net assets.
Distributions to Shareholders - Distributions from net investment income, if any, are generally declared and paid quarterly. Distributions from net realized gains, if any, are generally declared and paid annually.
Indemnifications - Under the corporation’s organizational documents, its officers and directors are indemnified against certain liabilities arising out of the performance of their duties to the fund. In addition, in the normal course of business, the fund enters into contracts that provide general indemnifications. The maximum exposure under these arrangements is unknown as this would involve future claims that may be made against a fund. The risk of material loss from such claims is considered by management to be remote.
3. Fees and Transactions with Related Parties
Certain officers and directors of the corporation are also officers and/or directors of American Century Companies, Inc. (ACC). The corporation’s investment advisor, ACIM, the corporation's distributor, American Century Investment Services, Inc. (ACIS), and the corporation’s transfer agent, American Century Services, LLC, are wholly owned, directly or indirectly, by ACC.
Management Fees - The corporation has entered into a management agreement with ACIM, under which ACIM provides the fund with investment advisory and management services in exchange for a single, unified management fee (the fee) per class. The agreement provides that all expenses of managing and operating the fund, except distribution and service fees, expenses on securities sold short, brokerage expenses, taxes, interest, fees and expenses of the independent directors (including legal counsel fees), and extraordinary expenses, will be paid by ACIM. The fee is computed and accrued daily based on each class’s daily net assets and paid monthly in arrears. The annual management fee is 1.90% for the Investor Class, A Class, C Class and R Class and 1.70% for the Institutional Class. During the year ended March 31, 2014, the investment advisor voluntarily agreed to waive 0.30% of its management fee. The investment advisor expects the fee waiver to continue through July 31, 2014, and cannot terminate it without the approval of the Board of Directors. The total amount of the waiver for each class for the year ended March 31, 2014 was $81,919, $5,601, $22,727, $11,950 and $1,273 for the Investor Class, Institutional Class, A Class, C Class and R Class, respectively. The effective annual management fee after waiver for each class for the year ended March 31, 2014 was 1.60% for the Investor Class, A Class, C Class and R Class and 1.40% for the Institutional Class.
Distribution and Service Fees - The Board of Directors has adopted a separate Master Distribution and Individual Shareholder Services Plan for each of the A Class, C Class and R Class (collectively the plans), pursuant to Rule 12b-1 of the 1940 Act. The plans provide that the A Class will pay ACIS an annual distribution and service fee of 0.25%. The plans provide that the C Class will pay ACIS an annual distribution and service fee of 1.00%, of which 0.25% is paid for individual shareholder services and 0.75% is paid for distribution services. The plans provide that the R Class will pay ACIS an annual distribution and service fee of 0.50%. The fees are computed and accrued daily based on each class’s daily net assets and paid monthly in arrears. The fees are used to pay financial intermediaries for distribution and individual shareholder services. Fees incurred under the plans during the year ended March 31, 2014 are detailed in the Statement of Operations.
Directors' Fees and Expenses - The Board of Directors is responsible for overseeing the investment manager's management and operations of the fund. The directors receive detailed information about the fund and its investment advisor regularly throughout the year, and meet at least quarterly with management of the investment advisor to review reports about fund operations. Fees and expenses incurred in conjunction with the directors during the year ended March 31, 2014 are detailed in the Statement of Operations. The fund’s officers do not receive compensation from the fund.
Acquired Fund Fees and Expenses - The fund may invest in mutual funds, exchange-traded funds, and business development companies (the acquired funds). The fund will indirectly realize its pro rata share of the fees and expenses of the acquired funds in which it invests. These indirect fees and expenses are not paid out of the fund's assets but are reflected in the return realized by the fund on its investment in the acquired funds.
4. Investment Transactions
Purchases and sales of investment securities and securities sold short, excluding short-term investments, for the year ended March 31, 2014 were $171,302,819 and $172,305,989, respectively.
5. Capital Share Transactions
Transactions in shares of the fund were as follows:
|
| | | | | | | | | |
| | Year ended March 31, 2014 | Year ended March 31, 2013 |
| | Shares | Amount | Shares | Amount |
| Investor Class/Shares Authorized | 50,000,000 | | 100,000,000 |
| |
| Sold | 4,886,464 | $ | 50,619,324 |
| 611,135 |
| $ | 6,294,241 |
|
| Issued in reinvestment of distributions | 72,775 | 740,120 |
| 10,002 |
| 102,124 |
|
| Redeemed | (901,252) | (9,271,962 | ) | (121,705) |
| (1,250,450 | ) |
| | 4,057,987 | 42,087,482 |
| 499,432 |
| 5,145,915 |
|
| Institutional Class/Shares Authorized | 5,000,000 | | 50,000,000 |
| |
| Sold | 533,027 | 5,520,111 |
| — |
| — |
|
| Issued in reinvestment of distributions | 4,132 | 42,231 |
| 1,323 |
| 13,536 |
|
| Redeemed | (22,375) | (230,568 | ) | — |
| — |
|
| | 514,784 | 5,331,774 |
| 1,323 |
| 13,536 |
|
| A Class/Shares Authorized | 5,000,000 | | 50,000,000 |
| |
| Sold | 1,602,009 | 16,420,288 |
| 188,275 |
| 1,926,247 |
|
| Issued in reinvestment of distributions | 19,126 | 193,552 |
| 3,031 |
| 30,858 |
|
| Redeemed | (500,696) | (5,127,461 | ) | (11,438) |
| (116,976 | ) |
| | 1,120,439 | 11,486,379 |
| 179,868 |
| 1,840,129 |
|
| C Class/Shares Authorized | 5,000,000 | | 50,000,000 |
| |
| Sold | 667,229 | 6,756,372 |
| 68,167 |
| 692,234 |
|
| Issued in reinvestment of distributions | 10,612 | 105,591 |
| 1,808 |
| 18,244 |
|
| Redeemed | (101,217) | (1,027,179 | ) | — |
| — |
|
| | 576,624 | 5,834,784 |
| 69,975 |
| 710,478 |
|
| R Class/Shares Authorized | 5,000,000 | | 50,000,000 |
| |
| Sold | 111 | 1,126 |
| — |
| — |
|
| Issued in reinvestment of distributions | 831 | 8,353 |
| 1,333 |
| 13,536 |
|
| | 942 | 9,479 |
| 1,333 |
| 13,536 |
|
| Net increase (decrease) | 6,270,776 | $ | 64,749,898 |
| 751,931 |
| $ | 7,723,594 |
|
6. Fair Value Measurements
The fund’s investments valuation process is based on several considerations and may use multiple inputs to determine the fair value of the investments held by the fund. In conformity with accounting principles generally accepted in the United States of America, the inputs used to determine a valuation are classified into three broad levels.
| |
| • | Level 1 valuation inputs consist of unadjusted quoted prices in an active market for identical investments. |
| |
| • | Level 2 valuation inputs consist of direct or indirect observable market data (including quoted prices for comparable investments, evaluations of subsequent market events, interest rates, prepayment speeds, credit risk, etc.). These inputs also consist of quoted prices for identical investments initially expressed in local currencies that are adjusted through translation into U.S. dollars. |
| |
| • | Level 3 valuation inputs consist of unobservable data (including a fund’s own assumptions). |
The level classification is based on the lowest level input that is significant to the fair valuation measurement. The valuation inputs are not necessarily an indication of the risks associated with investing in these securities or other financial instruments.
The following is a summary of the level classifications as of period end. The Schedule of Investments provides additional information on the fund’s portfolio holdings.
|
| | | | | | | | |
| | Level 1 | Level 2 | Level 3 |
| Assets | | | |
| Investment Securities | | | |
| Common Stocks | $ | 57,289,831 |
| — |
| — |
|
| Exchange-Traded Funds | 3,839,025 |
| — |
| — |
|
| Convertible Bonds | — |
| $ | 480,975 |
| — |
|
| Convertible Preferred Stocks | — |
| 285,280 |
| — |
|
| Temporary Cash Investments | 9,731,231 |
| 5,396,048 |
| — |
|
| | $ | 70,860,087 |
| $ | 6,162,303 |
| — |
|
| Other Financial Instruments | | | |
| Forward Foreign Currency Exchange Contracts | — |
| $ | 7,035 |
| — |
|
| | | | |
| Liabilities | | | |
| Securities Sold Short | | | |
| Common Stocks | $ | (50,546,199 | ) | — |
| — |
|
| Exchange-Traded Funds | (11,429,147 | ) | — |
| — |
|
| | $ | (61,975,346 | ) | — |
| — |
|
| Other Financial Instruments | | | |
| Forward Foreign Currency Exchange Contracts | — |
| $ | (5,084 | ) | — |
|
7. Derivative Instruments
Foreign Currency Risk - The fund is subject to foreign currency exchange rate risk in the normal course of pursuing its investment objectives. The value of foreign investments held by a fund may be significantly affected by changes in foreign currency exchange rates. The dollar value of a foreign security generally decreases when the value of the dollar rises against the foreign currency in which the security is denominated and tends to increase when the value of the dollar declines against such foreign currency. A fund may enter into forward foreign currency exchange contracts to reduce a fund's exposure to foreign currency exchange rate fluctuations. The net U.S. dollar value of foreign currency underlying all contractual commitments held by a fund and the resulting unrealized appreciation or depreciation are determined daily. Realized gain or loss is recorded upon the termination of the contract. Net realized and unrealized gains or losses occurring during the holding period of forward foreign currency exchange contracts are a component of net realized gain (loss) on foreign currency transactions and change in net unrealized appreciation (depreciation) on translation of assets and liabilities in foreign currencies, respectively. A fund bears the risk of an unfavorable change in the foreign
currency exchange rate underlying the forward contract. Additionally, losses, up to the fair value, may arise if the counterparties do not perform under the contract terms. The foreign currency risk derivative instruments held at period end as disclosed on the Schedule of Investments are indicative of the fund's typical volume during the period.
The value of foreign currency risk derivative instruments as of March 31, 2014, is disclosed on the Statement of Assets and Liabilities as an asset of $7,035 in unrealized appreciation on forward foreign currency exchange contracts and a liability of $5,084 in unrealized depreciation on forward foreign currency exchange contracts. For the year ended March 31, 2014, the effect of foreign currency risk derivative instruments on the Statement of Operations was $(47,822) in net realized gain (loss) on foreign currency transactions and $707 in change in net unrealized appreciation (depreciation) on translation of assets and liabilities in foreign currencies.
8. Risk Factors
The fund’s investment process may result in high portfolio turnover, which could mean high transaction costs, affecting both performance and capital gains tax liabilities to investors.
The fund is subject to short sales risk. If the market price of a security increases after the fund borrows the security, the fund may suffer a loss when it replaces the borrowed security at the higher price. Any loss will be increased by the amount of compensation, interest or dividends, and transaction costs the fund must pay to the lender of the borrowed security.
There are certain risks involved in investing in foreign securities. These risks include those resulting from future adverse political, social and economic developments, fluctuations in currency exchange rates, the possible imposition of exchange controls, and other foreign laws or restrictions.
9. Federal Tax Information
The tax character of distributions paid during the years ended March 31, 2014 and March 31, 2013 were as follows:
|
| | | | | | |
| | 2014 | 2013 |
| Distributions Paid From | | |
| Ordinary income | $ | 749,114 |
| $ | 232,660 |
|
| Long-term capital gains | $ | 384,938 |
| — |
|
The book-basis character of distributions made during the year from net investment income or net realized gains may differ from their ultimate characterization for federal income tax purposes. These differences reflect the differing character of certain income items and net realized gains and losses for financial statement and tax purposes, and may result in reclassification among certain capital accounts on the financial statements.
As of March 31, 2014, the federal tax cost of investments and the components of distributable earnings on a tax-basis were as follows:
|
| | | |
| Federal tax cost of investments | $ | 72,910,110 |
|
| Gross tax appreciation of investments | $ | 4,665,402 |
|
| Gross tax depreciation of investments | (553,122 | ) |
| Net tax appreciation (depreciation) of investments | $ | 4,112,280 |
|
| Net tax appreciation (depreciation) on securities sold short | $ | (6,056,722 | ) |
| Net tax appreciation (depreciation) | $ | (1,944,442 | ) |
| Undistributed ordinary income | $ | 1,031,240 |
|
| Accumulated long-term gains | $ | 70,011 |
|
The difference between book-basis and tax-basis unrealized appreciation (depreciation) is attributable primarily to the tax deferral of losses on wash sales.
|
| | | | | | | | | | | | | | |
| For a Share Outstanding Throughout the Years Ended March 31 (except as noted) | | | | | |
| Per-Share Data | | | | | | Ratios and Supplemental Data | | |
| | | Income From Investment Operations: | | | | Ratio to Average Net Assets of: | | |
| | Net Asset Value, Beginning of Period | Net Investment Income (Loss)(1) | Net Realized and Unrealized Gain (Loss) | Total From Investment Operations | Distributions From Net Realized Gains | Net Asset Value, End of Period | Total Return(2) | Operating Expenses(3) | Operating Expenses (before expense waiver)(3) | Operating Expenses (excluding expenses on securities sold short)(3) | Net Investment Income (Loss) | Net Investment Income (Loss) (before expense waiver) | Portfolio Turnover Rate | Net Assets, End of Period (in thousands) |
| Investor Class | | | | | | | | | | | | | |
| 2014 | $10.25 | (0.04) | 0.21 | 0.17 | (0.20) | $10.22 | 1.69% | 4.09% | 4.39% | 1.60% | (0.35)% | (0.65)% | 521% | $49,665 |
| 2013 | $10.32 | (0.25) | 0.52 | 0.27 | (0.34) | $10.25 | 2.61% | 4.74% | 5.04% | 1.60% | (2.46)% | (2.76)% | 588% | $8,214 |
2012(4) | $10.00 | (0.11) | 0.43 | 0.32 | — | $10.32 | 3.20% | 4.92%(5) | 5.22%(5) | 1.61%(5) | (2.49)%(5) | (2.79)%(5) | 292% | $3,118 |
| Institutional Class | | | | | | | | | | | | | |
| 2014 | $10.28 | 0.11 | 0.09 | 0.20 | (0.20) | $10.28 | 1.98% | 3.89% | 4.19% | 1.40% | (0.15)% | (0.45)% | 521% | $5,714 |
| 2013 | $10.33 | (0.24) | 0.53 | 0.29 | (0.34) | $10.28 | 2.81% | 4.54% | 4.84% | 1.40% | (2.26)% | (2.56)% | 588% | $425 |
2012(4) | $10.00 | (0.09) | 0.42 | 0.33 | — | $10.33 | 3.30% | 4.72%(5) | 5.02%(5) | 1.41%(5) | (2.29)%(5) | (2.59)%(5) | 292% | $413 |
| A Class | | | | | | | | | | | | | | |
| 2014 | $10.21 | (0.07) | 0.22 | 0.15 | (0.20) | $10.16 | 1.50% | 4.34% | 4.64% | 1.85% | (0.60)% | (0.90)% | 521% | $13,640 |
| 2013 | $10.31 | (0.28) | 0.52 | 0.24 | (0.34) | $10.21 | 2.32% | 4.99% | 5.29% | 1.85% | (2.71)% | (3.01)% | 588% | $2,265 |
2012(4) | $10.00 | (0.11) | 0.42 | 0.31 | — | $10.31 | 3.10% | 5.17%(5) | 5.47%(5) | 1.86%(5) | (2.74)%(5) | (3.04)%(5) | 292% | $432 |
|
| | | | | | | | | | | | | | |
| For a Share Outstanding Throughout the Years Ended March 31 (except as noted) | | | | | |
| Per-Share Data | | | | | | Ratios and Supplemental Data | | |
| | | Income From Investment Operations: | | | | Ratio to Average Net Assets of: | | |
| | Net Asset Value, Beginning of Period | Net Investment Income (Loss)(1) | Net Realized and Unrealized Gain (Loss) | Total From Investment Operations | Distributions From Net Realized Gains | Net Asset Value, End of Period | Total Return(2) | Operating Expenses(3) | Operating Expenses (before expense waiver)(3) | Operating Expenses (excluding expenses on securities sold short)(3) | Net Investment Income (Loss) | Net Investment Income (Loss) (before expense waiver) | Portfolio Turnover Rate | Net Assets, End of Period (in thousands) |
| C Class | | | | | | | | | | | | | | |
| 2014 | $10.10 | (0.14) | 0.21 | 0.07 | (0.20) | $9.97 | 0.72% | 5.09% | 5.39% | 2.60% | (1.35)% | (1.65)% | 521% | $6,844 |
| 2013 | $10.28 | (0.35) | 0.51 | 0.16 | (0.34) | $10.10 | 1.54% | 5.74% | 6.04% | 2.60% | (3.46)% | (3.76)% | 588% | $1,111 |
2012(4) | $10.00 | (0.14) | 0.42 | 0.28 | — | $10.28 | 2.80% | 5.92%(5) | 6.22%(5) | 2.61%(5) | (3.49)%(5) | (3.79)%(5) | 292% | $411 |
| R Class | | | | | | | | | | | | | | |
| 2014 | $10.17 | (0.18) | 0.31 | 0.13 | (0.20) | $10.10 | 1.21% | 4.59% | 4.89% | 2.10% | (0.85)% | (1.15)% | 521% | $427 |
| 2013 | $10.30 | (0.31) | 0.52 | 0.21 | (0.34) | $10.17 | 2.13% | 5.24% | 5.54% | 2.10% | (2.96)% | (3.26)% | 588% | $421 |
2012(4) | $10.00 | (0.12) | 0.42 | 0.30 | — | $10.30 | 3.00% | 5.42%(5) | 5.72%(5) | 2.11%(5) | (2.99)%(5) | (3.29)%(5) | 292% | $412 |
|
|
| Notes to Financial Highlights |
| |
| (1) | Computed using average shares outstanding throughout the period. |
| |
| (2) | Total returns are calculated based on the net asset value of the last business day and do not reflect applicable sales charges, if any. Total returns for periods less than one year are not annualized. |
| |
| (3) | Ratio of operating expenses to average net assets does not include any fees and expenses of the acquired funds. |
| |
| (4) | October 31, 2011 (fund inception) through March 31, 2012. |
See Notes to Financial Statements.
|
|
| Report of Independent Registered Public Accounting Firm |
To the Board of Directors and Shareholders of
American Century Capital Portfolios, Inc.:
We have audited the accompanying statement of assets and liabilities, including the schedule of investments, of Market Neutral Value Fund (the “Fund”), one of the funds constituting American Century Capital Portfolios, Inc., as of March 31, 2014, and the related statement of operations for the year then ended, the statements of changes in net assets for each of the two years in the period then ended, and the financial highlights for each of the periods presented. These financial statements and financial highlights are the responsibility of the Fund's management. Our responsibility is to express an opinion on these financial statements and financial highlights based on our audits.
We conducted our audits in accordance with the standards of the Public Company Accounting Oversight Board (United States). Those standards require that we plan and perform the audit to obtain reasonable assurance about whether the financial statements and financial highlights are free of material misstatement. The Fund is not required to have, nor were we engaged to perform, an audit of its internal control over financial reporting. Our audits included consideration of internal control over financial reporting as a basis for designing audit procedures that are appropriate in the circumstances, but not for the purpose of expressing an opinion on the effectiveness of the Fund's internal control over financial reporting. Accordingly, we express no such opinion. An audit also includes examining, on a test basis, evidence supporting the amounts and disclosures in the financial statements, assessing the accounting principles used and significant estimates made by management, as well as evaluating the overall financial statement presentation. Our procedures included confirmation of securities owned as of March 31, 2014, by correspondence with the custodian and brokers; where replies were not received from brokers, we performed other auditing procedures. We believe that our audits provide a reasonable basis for our opinion.
In our opinion, the financial statements and financial highlights referred to above present fairly, in all material respects, the financial position of Market Neutral Value Fund of American Century Capital Portfolios, Inc. as of March 31, 2014, the results of its operations for the year then ended, the changes in its net assets for each of the two years in the period then ended, and the financial highlights for each of the periods presented, in conformity with accounting principles generally accepted in the United States of America.
Deloitte & Touche LLP
Kansas City, Missouri
May 16, 2014
The Board of Directors
The individuals listed below serve as directors of the funds. Each director will continue to serve in this capacity until death, retirement, resignation or removal from office. The board has adopted a mandatory retirement age for directors who are not “interested persons,” as that term is defined in the Investment Company Act (independent directors). Independent directors shall retire by December 31 of the year in which they reach their 75th birthday.
Mr. Thomas is an “interested person” because he currently serves as President and Chief Executive Officer of American Century Companies, Inc. (ACC), the parent company of American Century Investment Management, Inc. (ACIM or the advisor). Mr. Fink is treated as an “interested person” because of his recent employment with ACC and American Century Services, LLC (ACS). The other directors (more than three-fourths of the total number) are independent. They are not employees, directors or officers of, and have no financial interest in, ACC or any of its wholly owned, direct or indirect, subsidiaries, including ACIM, American Century Investment Services, Inc. (ACIS) and ACS, and do not have any other affiliations, positions, or relationships that would cause them to be considered “interested persons” under the Investment Company Act. The directors serve in this capacity for seven (in the case of Mr. Thomas, 15) registered investment companies in the American Century Investments family of funds.
The following table presents additional information about the directors. The mailing address for each director is 4500 Main Street, Kansas City, Missouri 64111.
|
| | | | | |
Name (Year of Birth) | Position(s) Held with Funds | Length of Time Served | Principal Occupation(s) During Past 5 Years | Number of American Century Portfolios Overseen by Director | Other Directorships Held During Past
5 Years |
| Independent Directors |
Thomas A. Brown
(1940) | Director | Since 1980 | Managing Member, Associated Investments, LLC (real estate investment company); Brown Cascade Properties, LLC (real estate investment company) (2001 to 2009) | 73 | None |
Andrea C. Hall
(1945) | Director | Since 1997 | Retired | 73 | None |
Jan M. Lewis
(1957) | Director | Since 2011 | Retired; President and Chief Executive Officer, Catholic Charities of Northeast Kansas (human services organization) (2006 to 2013) | 73 | None |
James A. Olson
(1942) | Director and Chairman of the Board | Since 2007 (Chairman since 2014) | Member, Plaza Belmont LLC (private equity fund manager) | 73 | Saia, Inc. (2002 to 2012) and EPR Properties (2003 to 2013) |
|
| | | | | |
Name (Year of Birth) | Position(s) Held with Funds | Length of Time Served | Principal Occupation(s) During Past 5 Years | Number of American Century Portfolios Overseen by Director | Other Directorships Held During Past
5 Years |
| Independent Directors |
M. Jeannine Strandjord
(1945) | Director | Since 1994 | Retired | 73 | Euronet Worldwide Inc.; Charming Shoppes, Inc. (2006 to 2010); and DST Systems Inc. (1996 to 2012) |
John R. Whitten
(1946) | Director | Since 2008 | Retired | 73 | Rudolph Technologies, Inc. |
Stephen E. Yates
(1948) | Director | Since 2012 | Retired; Executive Vice President, Technology & Operations, KeyCorp. (computer services) (2004 to 2010) | 73 | Applied Industrial Technologies, Inc. (2001 to 2010) |
| Interested Directors | | | | |
Barry Fink
(1955) | Director | Since 2012 | Retired; Executive Vice President, ACC (September 2007 to February 2013); President, ACS (October 2007 to February 2013); Chief Operating Officer, ACC (September 2007 to November 2012) | 73 | None |
Jonathan S. Thomas
(1963) | Director and President | Since 2007 | President and Chief Executive Officer, ACC (March 2007 to present). Also serves as Chief Executive Officer and Manager, ACS; Executive Vice President, ACIM; Director, ACC, ACIM and other ACC subsidiaries | 115 | None |
Officers
The following table presents certain information about the executive officers of the funds. Each officer serves as an officer for each of the 15 investment companies in the American Century family of funds, unless otherwise noted. No officer is compensated for his or her service as an officer of the funds. The listed officers are interested persons of the funds and are appointed or re-appointed on an annual basis. The mailing address for each officer listed below is 4500 Main Street, Kansas City, Missouri 64111.
|
| | |
Name (Year of Birth) | Offices with
the Funds | Principal Occupation(s) During the Past Five Years |
Jonathan S.
Thomas
(1963) | Director and
President
since 2007 | President and Chief Executive Officer, ACC (March 2007 to present). Also serves as Chief Executive Officer and Manager, ACS; Executive Vice President, ACIM; Director, ACC, ACIM and other ACC subsidiaries |
Amy D. Shelton
(1964) | Chief Compliance
Officer since 2014 | Chief Compliance Officer, American Century funds, (March 2014 to present); Chief Compliance Officer, ACIM (February 2014 to present); Chief Compliance Officer, ACIS (October 2009 to present); Vice President, Client Interactions and Marketing, ACIS (February 2013 to January 2014); Director, Client Interactions and Marketing, ACIS (June 2007 to January 2013). Also serves as Vice President, ACIS |
Charles A.
Etherington
(1957) | General Counsel
since 2007 and
Senior Vice
President since 2006 | Attorney, ACC (February 1994 to present); Vice President, ACC (November 2005 to present); General Counsel, ACC (March 2007 to present). Also serves as General Counsel, ACIM, ACS, ACIS and other ACC subsidiaries; and Senior Vice President, ACIM and ACS |
C. Jean Wade
(1964) | Vice President,
Treasurer and
Chief Financial
Officer since 2012 | Vice President, ACS (February 2000 to present) |
Robert J.
Leach
(1966) | Vice President
since 2006 and
Assistant Treasurer
since 2012 | Vice President, ACS (February 2000 to present) |
David H.
Reinmiller
(1963) | Vice President
since 2000 | Attorney, ACC (January 1994 to present); Associate General Counsel, ACC (January 2001 to present). Also serves as Vice President, ACIM and ACS |
Ward D.
Stauffer
(1960) | Secretary
since 2005 | Attorney, ACC (June 2003 to present) |
The Statement of Additional Information has additional information about the fund's directors and is available without charge, upon request, by calling 1-800-345-2021.
Retirement Account Information
As required by law, distributions you receive from certain IRAs are subject to federal income tax withholding, unless you elect not to have withholding apply. Tax will be withheld on the total amount withdrawn even though you may be receiving amounts that are not subject to withholding, such as nondeductible contributions. In such case, excess amounts of withholding could occur. You may adjust your withholding election so that a greater or lesser amount will be withheld.
If you don’t want us to withhold on this amount, you must notify us to not withhold the federal income tax. You may notify us in writing or in certain situations by telephone or through other electronic means. For systematic withdrawals, your withholding election will remain in effect until revoked or changed by filing a new election. You have the right to revoke your election at any time.
Remember, even if you elect not to have income tax withheld, you are liable for paying income tax on the taxable portion of your withdrawal. If you elect not to have income tax withheld or you don’t have enough income tax withheld, you may be responsible for payment of estimated tax. You may incur penalties under the estimated tax rules if your withholding and estimated tax payments are not sufficient. You can reduce or defer the income tax on a distribution by directly or indirectly rolling such distribution over to another IRA or eligible plan. You should consult your tax advisor for additional information.
State tax will be withheld if, at the time of your distribution, your address is within one of the mandatory withholding states and you have federal income tax withheld (or as otherwise required by state law). State taxes will be withheld from your distribution in accordance with the respective state rules.
Distributions you receive from 403(b), 457 and qualified plans are subject to special tax and withholding rules. Your plan administrator or plan sponsor is required to provide you with a special tax notice explaining those rules at the time you request a distribution. If applicable, federal and/or state taxes may be withheld from your distribution amount.
Proxy Voting Policies
A description of the policies that the fund's investment advisor uses in exercising the voting rights associated with the securities purchased and/or held by the fund is available without charge, upon request, by calling 1-800-345-2021. It is also available on the "About Us" page of American Century Investments’ website at americancentury.com and on the Securities and Exchange Commission’s website at sec.gov. Information regarding how the investment advisor voted proxies relating to portfolio securities during the most recent 12-month period ended June 30 is available on the "About Us" page at americancentury.com. It is also available at sec.gov.
Quarterly Portfolio Disclosure
The fund files its complete schedule of portfolio holdings with the Securities and Exchange Commission (SEC) for the first and third quarters of each fiscal year on Form N-Q. The fund’s Forms N-Q are available on the SEC’s website at sec.gov, and may be reviewed and copied at the SEC’s Public Reference Room in Washington, DC. Information on the operation of the Public Reference Room may be obtained by calling 1-800-SEC-0330. The fund also makes its complete schedule of portfolio holdings for the most recent quarter of its fiscal year available on its
website at americancentury.com and, upon request, by calling 1-800-345-2021.
Other Tax Information
The following information is provided pursuant to provisions of the Internal Revenue Code.
The fund hereby designates up to the maximum amount allowable as qualified dividend income for the fiscal year ended March 31, 2014.
For corporate taxpayers, the fund hereby designates $522,476, or up to the maximum amount allowable, of ordinary income distributions paid during the fiscal year ended March 31, 2014 as qualified for the corporate dividends received deduction.
The fund hereby designates $749,114 as qualified short-term capital gain distributions for purposes of Internal Revenue Code Section 871.
The fund hereby designates $384,938, or up to the maximum amount allowable, as long-term capital gain distributions for the fiscal year ended March 31, 2014.
|
| | |
| |
| | | |
| Contact Us | americancentury.com | |
| Automated Information Line | 1-800-345-8765 | |
| Investor Services Representative | 1-800-345-2021 or 816-531-5575 | |
| Investors Using Advisors | 1-800-378-9878 | |
| Business, Not-For-Profit, Employer-Sponsored Retirement Plans | 1-800-345-3533 | |
| Banks and Trust Companies, Broker-Dealers, Financial Professionals, Insurance Companies | 1-800-345-6488 | |
| Telecommunications Relay Service for the Deaf | 711 | |
| | | |
| American Century Capital Portfolios, Inc. | |
| | | |
Investment Advisor: American Century Investment Management, Inc. Kansas City, Missouri | |
| | | |
| This report and the statements it contains are submitted for the general information of our shareholders. The report is not authorized for distribution to prospective investors unless preceded or accompanied by an effective prospectus. | |
| | | |
©2014 American Century Proprietary Holdings, Inc. All rights reserved.
CL-ANN-82094 1405
| |
|
| |
ANNUAL REPORT | MARCH 31, 2014 |
Mid Cap Value Fund
|
| |
| President’s Letter | |
| Performance | |
| Portfolio Commentary | |
| Fund Characteristics | |
| Shareholder Fee Example | |
| Schedule of Investments | |
| Statement of Assets and Liabilities | |
| Statement of Operations | |
| Statement of Changes in Net Assets | |
| Notes to Financial Statements | |
| Financial Highlights | |
| Report of Independent Registered Public Accounting Firm | |
| Management | |
| Additional Information | |
Any opinions expressed in this report reflect those of the author as of the date of the report, and do not necessarily represent the opinions of American Century Investments® or any other person in the American Century Investments organization. Any such opinions are subject to change at any time based upon market or other conditions and American Century Investments disclaims any responsibility to update such opinions. These opinions may not be relied upon as investment advice and, because investment decisions made by American Century Investments funds are based on numerous factors, may not be relied upon as an indication of trading intent on behalf of any American Century Investments fund. Security examples are used for representational purposes only and are not intended as recommendations to purchase or sell securities. Performance information for comparative indices and securities is provided to American Century Investments by third party vendors. To the best of American Century Investments’ knowledge, such information is accurate at the time of printing.
|
| |
| Dear Investor:
Thank you for reviewing this annual report for the 12 months ended March 31, 2014. It provides investment performance, market analysis, and portfolio information, presented with the expert perspective of our portfolio management team.
Annual reports remain important vehicles for conveying information about fund returns, including key factors that affected fund performance. For additional, updated investment and market insights, we encourage you to visit our website, americancentury.com.
|
| Jonathan Thomas |
Monetary Policy-Driven, Mostly “Risk-On” Results in the U.S. and Europe
Stimulative monetary policies and expectations of economic improvement helped drive financial market returns during the reporting period. We believe the combination of optimism about the economy, low costs of capital in the money markets, and central bank purchases of longer-maturity fixed income securities (quantitative easing, or QE) helped persuade investors to seek risk and yield, especially in the U.S. and Europe. Stock index returns were strong in these markets, particularly at the smaller capitalization end of the company size spectrum. The MSCI Europe and S&P 500 Indices advanced 24.50% and 21.86%, respectively, and their smaller capitalization counterparts performed even better. In the U.S., growth stocks generally outperformed value stocks.
Some of the same growth and optimism factors that drove stocks higher, plus hints that QE tapering would begin in the U.S., hampered U.S. government bond returns, which dipped into negative territory for the reporting period. On the other hand, U.S. corporate bonds, especially high-yield corporates, posted mostly positive returns because of their higher yields, declining spreads (yield differences between corporate and similar-maturity U.S. Treasury securities), and relatively low default rates. At the other end of the U.S. bond spectrum, Treasury inflation-protected securities (TIPS) underperformed, hurt by the combination of rising yields and low inflation.
Looking ahead, we see further signs of economic improvement for the U.S. in 2014, but headwinds persist. Interest rates could normalize further, and economic growth and U.S. employment levels remain subpar compared with past post-recession periods. In this environment, we continue to believe in a disciplined, diversified, long-term investment approach, using professionally managed stock and bond portfolios—as appropriate—for meeting financial goals. We appreciate your continued trust in us.
Sincerely,
Jonathan Thomas
President and Chief Executive Officer
American Century Investments
|
| | | | | | | |
| Total Returns as of March 31, 2014 |
| | | | Average Annual Returns | |
| | Ticker Symbol | 1 year | 5 years | 10 Years | Since Inception | Inception Date |
| Investor Class | ACMVX | 21.02% | 22.53% | 10.77% | 10.77 | % | 3/31/04 |
| Russell Midcap Value Index | – | 22.95% | 26.33% | 10.24% | 10.28 | % | – |
| Institutional Class | AVUAX | 21.33% | 22.78% | – | 11.29 | % | 8/2/04 |
A Class(1) | ACLAX | | | | | 1/13/05 |
| No sales charge* | | 20.71% | 22.21% | – | 9.99 | % | |
| With sales charge* | | 13.74% | 20.77% | – | 9.28 | % | |
| C Class | ACCLX | 19.75% | – | – | 14.73 | % | 3/1/10 |
| R Class | AMVRX | 20.41% | 21.91% | – | 8.92 | % | 7/29/05 |
| R6 Class | AMDVX | – | – | – | 12.01%(2) | 7/26/13 |
| |
| * | Sales charges include initial sales charges and contingent deferred sales charges (CDSCs), as applicable. A Class shares have a 5.75% maximum initial sales charge and may be subject to a maximum CDSC of 1.00%. C Class shares redeemed within 12 months of purchase are subject to a maximum CDSC of 1.00%. The SEC requires that mutual funds provide performance information net of maximum sales charges in all cases where charges could be applied. |
| |
| (1) | Prior to March 1, 2010, the A Class was referred to as the Advisor Class and did not have a front-end sales charge. Performance prior to that date has been adjusted to reflect this charge. |
| |
| (2) | Total returns for periods less than one year are not annualized. |
Data presented reflect past performance. Past performance is no guarantee of future results. Current performance may be higher or lower than the performance shown. Investment return and principal value will fluctuate, and redemption value may be more or less than original cost. To obtain performance data current to the most recent month end, please call 1-800-345-2021 or visit americancentury.com. International investing involves special risks, such as political instability and currency fluctuations.
Unless otherwise indicated, performance reflects Investor Class shares; performance for other share classes will vary due to differences in fee structure. For information about other share classes available, please consult the prospectus. Data assumes reinvestment of dividends and capital gains, and none of the charts reflect the deduction of taxes that a shareholder would pay on fund distributions or the redemption of fund shares. Returns for the index are provided for comparison. The fund’s total returns include operating expenses (such as transaction costs and management fees) that reduce returns, while the total returns of the index do not.
|
|
| Growth of $10,000 Over 10 Years |
| $10,000 investment made March 31, 2004 |
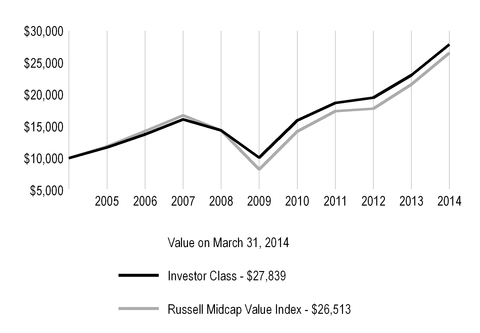
|
| | | | | |
| Total Annual Fund Operating Expenses |
| Investor Class | Institutional Class | A Class | C Class | R Class | R6 Class |
| 1.01% | 0.81% | 1.26% | 2.01% | 1.51% | 0.66% |
The total annual fund operating expenses shown is as stated in the fund’s prospectus current as of the date of this report. The prospectus may vary from the expense ratio shown elsewhere in this report because it is based on a different time period, includes acquired fund fees and expenses, and, if applicable, does not include fee waivers or expense reimbursements.
Data presented reflect past performance. Past performance is no guarantee of future results. Current performance may be higher or lower than the performance shown. Investment return and principal value will fluctuate, and redemption value may be more or less than original cost. To obtain performance data current to the most recent month end, please call 1-800-345-2021 or visit americancentury.com. International investing involves special risks, such as political instability and currency fluctuations.
Unless otherwise indicated, performance reflects Investor Class shares; performance for other share classes will vary due to differences in fee structure. For information about other share classes available, please consult the prospectus. Data assumes reinvestment of dividends and capital gains, and none of the charts reflect the deduction of taxes that a shareholder would pay on fund distributions or the redemption of fund shares. Returns for the index are provided for comparison. The fund’s total returns include operating expenses (such as transaction costs and management fees) that reduce returns, while the total returns of the index do not.
Portfolio Managers: Kevin Toney, Michael Liss, Phil Davidson, and Brian Woglom
Performance Summary
Mid Cap Value returned 21.02%* for the 12 months ended March 31, 2014. By comparison, its benchmark, the Russell Midcap Value Index, returned 22.95%. The portfolio’s return reflects operating expenses, while the index’s return does not.
The U.S. stock market generated strong gains during the one-year reporting period. When the period began, riskier asset classes led the market, as the Federal Reserve’s (Fed) bond-buying programs continued. Market leadership changed after the Fed suggested it might start tapering its asset purchases if economic conditions improved. Higher-quality stocks came into favor and as interest rates rose, higher-yielding stocks, such as real estate investment trusts (REITs) and utilities, declined. As the Fed sought to calm fears about eventual tapering, riskier stocks posted gains, but they reversed direction in mid-August on positive economic data, which suggested the Fed might announce tapering as soon as September. After the Fed surprised the markets by making no changes to its stimulus programs, lower-quality, riskier stocks rallied and continued to outperform through the end of 2013. In December, the U.S. economy showed new signs of strength and the Fed announced it would begin modestly scaling back its asset purchases in January 2014. As interest rates trended down in the last three months of the reporting period, yield-oriented securities, including utilities and REITs, rallied. For the reporting period overall, riskier, lower-yielding, and lower-quality stocks outperformed. Though value stocks recorded significant gains, they underperformed growth stocks. Mid-cap value stocks outperformed small-cap value stocks and large-cap value stocks.
In this environment, the portfolio’s investment approach, which emphasizes higher-quality businesses with sound balance sheets, provided positive absolute results in nine of the 10 sectors in which it was invested. On a relative basis, it underperformed the benchmark, as investors gravitated to lower-quality, riskier securities.
We carefully manage this portfolio for long-term results. Since its inception on March 31, 2004, Mid Cap Value has produced an average annual return of 10.77%, topping the return for that period of the Russell Midcap Value Index (see the performance information on pages 3 and 4).
Materials Detracted From Relative Performance
Although an underweight position relative to the benchmark in the materials sector added to results, the portfolio was hindered by security selection, especially in the metals and mining industry. An overweight position in gold producer Newmont Mining detracted. A sharp drop in gold prices during 2013 seemed likely to negatively impact Newmont’s profitability and free cash flow.
Telecommunication Services Was a Source of Weakness
An overweight position in telecommunication services—the strongest-performing sector in the benchmark—contributed positively, but the portfolio was hampered by security selection. An investment in CenturyLink detracted. This high-yielding security underperformed, as lower-yielding assets outperformed. CenturyLink reported weaker-than-expected results, as its growth business is not ramping up as fast as expected, and its legacy businesses have contracted more quickly than expected.
*All fund returns referenced in this commentary are for Investor Class shares.
Security Selection in Consumer Staples Dampened Results
During the reporting period, consumers appeared to be focusing their purchases on big-ticket items, such as cars and houses, instead of smaller-ticket items. In our opinion, this hurt the profit margins of many companies in the food products industry, including portfolio holdings Kellogg, ConAgra Foods, and General Mills—all of which underperformed. Weak consumer demand also negatively affected food service companies, such as Sysco. The global food distributor reported weak restaurant sales and has had continuing difficulties in integrating a new technology system designed to improve the efficiency of its operations and sales process.
Financials Enhanced Relative Performance
In financials, an underweight position in REITs added to relative returns. In general, valuation of REITs has appeared unattractive. REITs have benefited from the low interest-rate and credit-spread environment, but the industry underperformed during the reporting period as interest rates increased. Within capital markets, an investment in Charles Schwab was advantageous. As interest rates increased, it seemed likely that Charles Schwab would regain earning power as its net interest margin expands over time.
Information Technology Contributed Positively
An underweight position in information technology, which posted strong returns in the benchmark, dampened relative returns, but effective security selection boosted absolute performance. The portfolio owned Molex, a manufacturer of electronic and fiber-optic interconnection products and systems. Its share price rose on news that Koch Industries would acquire it for a significant premium. The portfolio also benefited from an overweight position in Applied Materials, which reported solid results and provided better-than-expected guidance, driven by strength in core semiconductor capital equipment orders.
Positioning in Energy and Utilities Added to Relative Results
In energy, the portfolio benefited from an underweight position in oil refiners, such as its lack of exposure to Marathon Petroleum and Valero Energy. We believe current refining margins are unsustainable and will revert to long-term averages over time.
An underweight position in utilities added to relative returns, as interest rates began to increase during the reporting period and utilities—which are sensitive to changes in rates—posted the weakest performance in the benchmark. For some time, we have considered many of these stocks overvalued.
Outlook
We continue to follow our disciplined, bottom-up process, selecting companies one at a time for the portfolio. As of March 31, 2014, we saw attractive opportunities in consumer staples, health care, industrials, and energy, as reflected by the portfolio’s overweight positions in these sectors. Conversely, smaller relative weightings were given to financials, consumer discretionary, materials, and information technology stocks.
|
| | |
| MARCH 31, 2014 |
| Top Ten Holdings | % of net assets |
| Republic Services, Inc. | 3.3% |
| Northern Trust Corp. | 2.8% |
| Imperial Oil Ltd. | 2.8% |
| ADT Corp. (The) | 2.0% |
| Applied Materials, Inc. | 1.9% |
| iShares Russell Midcap Value Index Fund | 1.7% |
| Westar Energy, Inc. | 1.6% |
| Sysco Corp. | 1.6% |
| Apache Corp. | 1.5% |
| Lowe's Cos., Inc. | 1.5% |
| | |
| Top Five Industries | % of net assets |
| Insurance | 7.9% |
| Oil, Gas and Consumable Fuels | 7.8% |
| Commercial Banks | 7.3% |
| Commercial Services and Supplies | 6.6% |
| Electric Utilities | 6.2% |
| | |
| Types of Investments in Portfolio | % of net assets |
| Domestic Common Stocks | 89.6 | % |
| Foreign Common Stocks* | 6.4 | % |
| Exchange-Traded Funds | 1.7 | % |
| Total Equity Exposure | 97.7 | % |
| Temporary Cash Investments | 2.3 | % |
| Other Assets and Liabilities | —** |
|
| |
| * | Includes depositary shares, dual listed securities and foreign ordinary shares. |
| |
| ** | Category is less than 0.05% of total net assets. |
Fund shareholders may incur two types of costs: (1) transaction costs, including sales charges (loads) on purchase payments and redemption/exchange fees; and (2) ongoing costs, including management fees; distribution and service (12b-1) fees; and other fund expenses. This example is intended to help you understand your ongoing costs (in dollars) of investing in your fund and to compare these costs with the ongoing cost of investing in other mutual funds.
The example is based on an investment of $1,000 made at the beginning of the period and held for the entire period from October 1, 2013 to March 31, 2014.
Actual Expenses
The table provides information about actual account values and actual expenses for each class. You may use the information, together with the amount you invested, to estimate the expenses that you paid over the period. First, identify the share class you own. Then simply divide your account value by $1,000 (for example, an $8,600 account value divided by $1,000 = 8.6), then multiply the result by the number under the heading “Expenses Paid During Period” to estimate the expenses you paid on your account during this period.
If you hold Investor Class shares of any American Century Investments fund, or Institutional Class shares of the American Century Diversified Bond Fund, in an American Century Investments account (i.e., not a financial intermediary or retirement plan account), American Century Investments may charge you a $12.50 semiannual account maintenance fee if the value of those shares is less than $10,000. We will redeem shares automatically in one of your accounts to pay the $12.50 fee. In determining your total eligible investment amount, we will include your investments in all personal accounts (including American Century Investments Brokerage accounts) registered under your Social Security number. Personal accounts include individual accounts, joint accounts, UGMA/UTMA accounts, personal trusts, Coverdell Education Savings Accounts and IRAs (including traditional, Roth, Rollover, SEP-, SARSEP- and SIMPLE-IRAs), and certain other retirement accounts. If you have only business, business retirement, employer-sponsored or American Century Investments Brokerage accounts, you are currently not subject to this fee. If you are subject to the Account Maintenance Fee, your account value could be reduced by the fee amount.
Hypothetical Example for Comparison Purposes
The table also provides information about hypothetical account values and hypothetical expenses based on the actual expense ratio of each class of your fund and an assumed rate of return of 5% per year before expenses, which is not the actual return of a fund’s share class. The hypothetical account values and expenses may not be used to estimate the actual ending account balance or expenses you paid for the period. You may use this information to compare the ongoing costs of investing in your fund and other funds. To do so, compare this 5% hypothetical example with the 5% hypothetical examples that appear in the shareholder reports of the other funds.
Please note that the expenses shown in the table are meant to highlight your ongoing costs only and do not reflect any transactional costs, such as sales charges (loads) or redemption/exchange fees. Therefore, the table is useful in comparing ongoing costs only, and will not help you determine the relative total costs of owning different funds. In addition, if these transactional costs were included, your costs would have been higher.
|
| | | | | | |
| | Beginning
Account Value
10/1/13 | Ending
Account Value
3/31/14 | Expenses Paid
During Period(1) 10/1/13 - 3/31/14 | Annualized
Expense Ratio(1) |
| Actual | | | | |
| Investor Class | $1,000 | $1,121.70 |
| $5.29 |
| 1.00% |
| Institutional Class | $1,000 | $1,123.50 |
| $4.24 |
| 0.80% |
| A Class | $1,000 | $1,120.20 |
| $6.61 |
| 1.25% |
| C Class | $1,000 | $1,116.00 |
| $10.55 |
| 2.00% |
| R Class | $1,000 | $1,118.80 |
| $7.92 |
| 1.50% |
| R6 Class | $1,000 | $1,123.60 |
| $3.44 |
| 0.65% |
| Hypothetical | | | | |
| Investor Class | $1,000 | $1,019.95 |
| $5.04 |
| 1.00% |
| Institutional Class | $1,000 | $1,020.94 |
| $4.03 |
| 0.80% |
| A Class | $1,000 | $1,018.70 |
| $6.29 |
| 1.25% |
| C Class | $1,000 | $1,014.96 |
| $10.05 |
| 2.00% |
| R Class | $1,000 | $1,017.45 |
| $7.54 |
| 1.50% |
| R6 Class | $1,000 | $1,021.69 |
| $3.28 |
| 0.65% |
| |
| (1) | Expenses are equal to the class's annualized expense ratio listed in the table above, multiplied by the average account value over the period, multiplied by 182, the number of days in the most recent fiscal half-year, divided by 365, to reflect the one-half year period. |
MARCH 31, 2014
|
| | | | |
| | Shares | Value |
| COMMON STOCKS — 96.0% |
| AEROSPACE AND DEFENSE — 2.7% |
| BAE Systems plc | 3,713,540 | $ | 25,643,241 |
|
| General Dynamics Corp. | 350,465 | 38,172,648 |
|
| Northrop Grumman Corp. | 131,536 | 16,228,912 |
|
| Rockwell Collins, Inc. | 310,140 | 24,708,854 |
|
| Textron, Inc. | 794,243 | 31,205,807 |
|
| | | 135,959,462 |
|
| AIRLINES — 0.7% | | |
| Southwest Airlines Co. | 1,489,580 | 35,168,984 |
|
| AUTO COMPONENTS — 0.4% |
| Autoliv, Inc. | 183,726 | 18,436,904 |
|
| BEVERAGES — 0.5% |
| Dr Pepper Snapple Group, Inc. | 444,959 | 24,232,467 |
|
| CAPITAL MARKETS — 4.0% |
| Charles Schwab Corp. (The) | 280,833 | 7,675,166 |
|
| Franklin Resources, Inc. | 708,324 | 38,376,994 |
|
| Northern Trust Corp. | 2,162,413 | 141,767,796 |
|
| State Street Corp. | 220,877 | 15,361,996 |
|
| | | 203,181,952 |
|
| COMMERCIAL BANKS — 7.3% |
| BOK Financial Corp. | 330,816 | 22,842,845 |
|
| Comerica, Inc. | 596,932 | 30,921,078 |
|
| Commerce Bancshares, Inc. | 1,317,250 | 61,146,745 |
|
| Cullen/Frost Bankers, Inc. | 524,082 | 40,632,077 |
|
| KeyCorp | 1,091,359 | 15,540,952 |
|
| M&T Bank Corp. | 520,510 | 63,137,863 |
|
| PNC Financial Services Group, Inc. (The) | 687,654 | 59,825,898 |
|
| SunTrust Banks, Inc. | 957,857 | 38,113,130 |
|
| Westamerica Bancorp. | 729,559 | 39,454,551 |
|
| | | 371,615,139 |
|
| COMMERCIAL SERVICES AND SUPPLIES — 6.6% |
| ADT Corp. (The) | 3,423,520 | 102,534,424 |
|
| Republic Services, Inc. | 4,871,182 | 166,399,577 |
|
|
| | | | | |
| | Shares | Value |
| Tyco International Ltd. | 1,084,399 | $ | 45,978,518 |
|
| Waste Management, Inc. | 579,673 | 24,386,843 |
|
| | | 339,299,362 |
|
| COMMUNICATIONS EQUIPMENT — 0.3% |
| Harris Corp. | 201,668 | 14,754,031 |
|
| COMPUTERS AND PERIPHERALS — 2.4% |
| SanDisk Corp. | 591,323 | 48,009,514 |
|
| Western Digital Corp. | 794,035 | 72,908,294 |
|
| | | 120,917,808 |
|
| CONTAINERS AND PACKAGING — 1.2% |
| Bemis Co., Inc. | 898,815 | 35,269,500 |
|
| Sonoco Products Co. | 627,290 | 25,731,436 |
|
| | | 61,000,936 |
|
| DIVERSIFIED TELECOMMUNICATION SERVICES — 1.0% |
| CenturyLink, Inc. | 1,557,299 | 51,141,699 |
|
| ELECTRIC UTILITIES — 6.2% |
| Empire District Electric Co. (The) | 596,414 | 14,504,788 |
|
| Great Plains Energy, Inc. | 2,551,748 | 68,999,266 |
|
| Northeast Utilities | 673,532 | 30,645,706 |
|
| Portland General Electric Co. | 816,814 | 26,415,765 |
|
| Southern Co. (The) | 852,837 | 37,473,658 |
|
| Westar Energy, Inc. | 2,337,331 | 82,180,558 |
|
| Xcel Energy, Inc. | 1,952,605 | 59,281,088 |
|
| | | 319,500,829 |
|
| ELECTRICAL EQUIPMENT — 0.7% |
| Brady Corp., Class A | 570,896 | 15,499,826 |
|
| Regal-Beloit Corp. | 277,412 | 20,170,627 |
|
| | | 35,670,453 |
|
| ELECTRONIC EQUIPMENT, INSTRUMENTS AND COMPONENTS — 0.7% |
| TE Connectivity Ltd. | 618,450 | 37,236,874 |
|
| ENERGY EQUIPMENT AND SERVICES — 0.5% |
Cameron International Corp.(1) | 403,176 | 24,904,182 |
|
| FOOD AND STAPLES RETAILING — 1.6% |
| Sysco Corp. | 2,241,556 | 80,987,418 |
|
| FOOD PRODUCTS — 5.2% |
| Campbell Soup Co. | 498,100 | 22,354,728 |
|
| ConAgra Foods, Inc. | 988,138 | 30,661,922 |
|
|
| | | | | |
| | Shares | Value |
| Danone SA | 337,740 | $ | 23,883,200 |
|
| General Mills, Inc. | 633,328 | 32,819,057 |
|
| Hillshire Brands Co. | 1,624,234 | 60,518,959 |
|
| Kellogg Co. | 440,379 | 27,616,167 |
|
| Kraft Foods Group, Inc. | 591,230 | 33,168,003 |
|
| Mondelez International, Inc., Class A | 1,046,561 | 36,158,683 |
|
| | | 267,180,719 |
|
| GAS UTILITIES — 2.4% |
| AGL Resources, Inc. | 357,294 | 17,493,114 |
|
| Atmos Energy Corp. | 182,990 | 8,624,319 |
|
| Laclede Group, Inc. (The) | 1,312,037 | 61,862,544 |
|
| Southwest Gas Corp. | 157,719 | 8,430,081 |
|
| WGL Holdings, Inc. | 688,391 | 27,576,943 |
|
| | | 123,987,001 |
|
| HEALTH CARE EQUIPMENT AND SUPPLIES — 5.4% |
| Becton Dickinson and Co. | 205,036 | 24,005,615 |
|
Boston Scientific Corp.(1) | 2,419,421 | 32,710,572 |
|
CareFusion Corp.(1) | 1,529,918 | 61,533,302 |
|
| Medtronic, Inc. | 905,820 | 55,744,163 |
|
| STERIS Corp. | 498,985 | 23,826,533 |
|
| Stryker Corp. | 490,102 | 39,928,610 |
|
| Zimmer Holdings, Inc. | 403,572 | 38,169,840 |
|
| | | 275,918,635 |
|
| HEALTH CARE PROVIDERS AND SERVICES — 3.3% |
| Cigna Corp. | 245,644 | 20,567,772 |
|
LifePoint Hospitals, Inc.(1) | 1,060,601 | 57,855,785 |
|
| Patterson Cos., Inc. | 830,161 | 34,667,523 |
|
| Quest Diagnostics, Inc. | 1,002,583 | 58,069,607 |
|
| | | 171,160,687 |
|
| HOTELS, RESTAURANTS AND LEISURE — 1.3% |
| Carnival Corp. | 1,054,287 | 39,915,306 |
|
| International Game Technology | 1,987,757 | 27,947,863 |
|
| | | 67,863,169 |
|
| HOUSEHOLD PRODUCTS — 0.2% |
| Energizer Holdings, Inc. | 115,710 | 11,656,625 |
|
| INDUSTRIAL CONGLOMERATES — 1.1% |
| Koninklijke Philips Electronics NV | 1,534,404 | 53,914,280 |
|
|
| | | | | |
| | Shares | Value |
| INSURANCE — 7.9% |
| ACE Ltd. | 540,742 | $ | 53,565,902 |
|
| Aflac, Inc. | 359,910 | 22,688,726 |
|
| Allstate Corp. (The) | 548,760 | 31,048,841 |
|
| Arthur J Gallagher & Co. | 619,880 | 29,493,890 |
|
| Chubb Corp. (The) | 488,767 | 43,646,893 |
|
| HCC Insurance Holdings, Inc. | 1,113,236 | 50,641,106 |
|
| Marsh & McLennan Cos., Inc. | 433,173 | 21,355,429 |
|
| MetLife, Inc. | 418,930 | 22,119,504 |
|
| Reinsurance Group of America, Inc. | 699,992 | 55,740,363 |
|
| Symetra Financial Corp. | 743,685 | 14,739,837 |
|
| Travelers Cos., Inc. (The) | 318,370 | 27,093,287 |
|
| Unum Group | 850,331 | 30,025,188 |
|
| | | 402,158,966 |
|
| LIFE SCIENCES TOOLS AND SERVICES — 1.1% |
| Agilent Technologies, Inc. | 590,052 | 32,995,708 |
|
Bio-Rad Laboratories, Inc., Class A(1) | 200,183 | 25,647,446 |
|
| | | 58,643,154 |
|
| MACHINERY — 0.7% |
| Stanley Black & Decker, Inc. | 413,880 | 33,623,611 |
|
| METALS AND MINING — 1.7% |
Constellium NV, Class A(1) | 926,497 | 27,192,687 |
|
| Newmont Mining Corp. | 893,873 | 20,952,383 |
|
| Nucor Corp. | 780,316 | 39,437,171 |
|
| | | 87,582,241 |
|
| MULTI-UTILITIES — 3.3% |
| Ameren Corp. | 805,810 | 33,199,372 |
|
| Consolidated Edison, Inc. | 1,053,830 | 56,537,979 |
|
| NorthWestern Corp. | 542,260 | 25,719,392 |
|
| PG&E Corp. | 1,203,521 | 51,992,107 |
|
| | | 167,448,850 |
|
| MULTILINE RETAIL — 1.3% |
| Family Dollar Stores, Inc. | 292,430 | 16,963,864 |
|
| Target Corp. | 812,321 | 49,153,544 |
|
| | | 66,117,408 |
|
| OIL, GAS AND CONSUMABLE FUELS — 7.8% |
| Apache Corp. | 908,112 | 75,327,891 |
|
| Devon Energy Corp. | 759,062 | 50,804,020 |
|
|
| | | | | |
| | Shares | Value |
| Imperial Oil Ltd. | 3,043,793 | $ | 141,740,808 |
|
| Murphy Oil Corp. | 682,991 | 42,932,814 |
|
Southwestern Energy Co.(1) | 1,048,134 | 48,224,645 |
|
| Williams Partners LP | 798,941 | 40,698,055 |
|
| | | 399,728,233 |
|
| PHARMACEUTICALS — 1.0% |
Hospira, Inc.(1) | 1,159,410 | 50,144,482 |
|
| REAL ESTATE INVESTMENT TRUSTS (REITs) — 4.1% |
| Annaly Capital Management, Inc. | 4,003,204 | 43,915,148 |
|
| Capstead Mortgage Corp. | 1,100,930 | 13,937,774 |
|
| Corrections Corp. of America | 1,608,654 | 50,383,043 |
|
| Empire State Realty Trust, Inc. | 1,668,472 | 25,210,612 |
|
| Federal Realty Investment Trust | 164,865 | 18,913,313 |
|
| Piedmont Office Realty Trust, Inc., Class A | 3,260,979 | 55,925,790 |
|
| | | 208,285,680 |
|
| ROAD AND RAIL — 0.7% |
| Heartland Express, Inc. | 658,394 | 14,938,960 |
|
| Werner Enterprises, Inc. | 821,215 | 20,949,194 |
|
| | | 35,888,154 |
|
| SEMICONDUCTORS AND SEMICONDUCTOR EQUIPMENT — 6.1% |
| Analog Devices, Inc. | 304,109 | 16,160,352 |
|
| Applied Materials, Inc. | 4,813,812 | 98,298,041 |
|
| KLA-Tencor Corp. | 508,124 | 35,131,693 |
|
| Maxim Integrated Products, Inc. | 1,119,936 | 37,092,280 |
|
| Microchip Technology, Inc. | 520,369 | 24,852,824 |
|
Micron Technology, Inc.(1) | 1,864,640 | 44,117,383 |
|
Teradyne, Inc.(1) | 2,926,645 | 58,210,969 |
|
| | | 313,863,542 |
|
| SPECIALTY RETAIL — 2.3% |
Bed Bath & Beyond, Inc.(1) | 222,542 | 15,310,890 |
|
| CST Brands, Inc. | 860,917 | 26,895,047 |
|
|
| | | | | |
| | Shares | Value |
| Lowe's Cos., Inc. | 1,531,700 | $ | 74,900,130 |
|
| | | 117,106,067 |
|
| TEXTILES, APPAREL AND LUXURY GOODS — 0.3% |
| Coach, Inc. | 310,110 | 15,400,063 |
|
| THRIFTS AND MORTGAGE FINANCE — 1.4% |
| Capitol Federal Financial, Inc. | 934,258 | 11,724,938 |
|
| People's United Financial, Inc. | 4,061,095 | 60,388,483 |
|
| | | 72,113,421 |
|
| WIRELESS TELECOMMUNICATION SERVICES — 0.6% |
| Rogers Communications, Inc., Class B | 796,071 | 32,987,800 |
|
TOTAL COMMON STOCKS (Cost $4,046,111,559) | 4,906,781,288 |
|
| EXCHANGE-TRADED FUNDS — 1.7% |
iShares Russell Midcap Value Index Fund
(Cost $59,019,066) | 1,244,841 | 85,557,922 |
|
| TEMPORARY CASH INVESTMENTS — 2.3% |
| Repurchase Agreement, Bank of America Merrill Lynch, (collateralized by various U.S. Treasury obligations, 0.75% - 1.375%, 10/31/17 - 6/30/18, valued at $23,460,829), in a joint trading account at 0.03%, dated 3/31/14, due 4/1/14 (Delivery value $22,986,568) | 22,986,549 |
|
| Repurchase Agreement, Goldman Sachs & Co., (collateralized by various U.S. Treasury obligations, 4.25%, 8/15/15, valued at $20,634,647), in a joint trading account at 0.03%, dated 3/31/14, due 4/1/14 (Delivery value $20,228,180) | 20,228,163 |
|
| SSgA U.S. Government Money Market Fund | 77,933,541 | 77,933,541 |
|
TOTAL TEMPORARY CASH INVESTMENTS (Cost $121,148,253) | 121,148,253 |
|
TOTAL INVESTMENT SECURITIES — 100.0% (Cost $4,226,278,878) | 5,113,487,463 |
|
OTHER ASSETS AND LIABILITIES† | | (857,952) |
|
| TOTAL NET ASSETS — 100.0% | $ | 5,112,629,511 | |
|
| | | | | | | | |
| FORWARD FOREIGN CURRENCY EXCHANGE CONTRACTS |
| Currency Purchased | Currency Sold | Counterparty | Settlement Date | Unrealized Appreciation
(Depreciation) |
| USD | 146,916,391 | CAD | 164,179,066 | JPMorgan Chase Bank N.A. | 4/30/14 | $ | (1,494,825 | ) |
| USD | 62,257,012 | EUR | 45,143,218 | UBS AG | 4/30/14 | 69,269 |
|
| USD | 2,145,704 | EUR | 1,561,841 | UBS AG | 4/30/14 | (5,834) |
|
| USD | 2,746,960 | EUR | 1,993,845 | UBS AG | 4/30/14 | 308 |
|
| USD | 10,725,753 | GBP | 6,483,324 | Credit Suisse AG | 4/30/14 | (80,623) |
|
| USD | 1,552,519 | GBP | 936,946 | Credit Suisse AG | 4/30/14 | (9,178) |
|
| USD | 2,710,774 | GBP | 1,631,487 | Credit Suisse AG | 4/30/14 | (8,581) |
|
| USD | 2,179,040 | GBP | 1,309,571 | Credit Suisse AG | 4/30/14 | (3,746) |
|
| USD | 4,165,893 | GBP | 2,498,290 | Credit Suisse AG | 4/30/14 | 1,755 |
|
| | | | | | | $ | (1,531,455 | ) |
|
| | |
| Notes to Schedule of Investments |
| CAD | - | Canadian Dollar |
| EUR | - | Euro |
| GBP | - | British Pound |
| USD | - | United States Dollar |
| |
| † | Category is less than 0.05% of total net assets. |
See Notes to Financial Statements.
|
|
| Statement of Assets and Liabilities |
|
| | | |
| MARCH 31, 2014 |
| Assets | |
| Investment securities, at value (cost of $4,226,278,878) | $ | 5,113,487,463 |
|
| Receivable for investments sold | 61,805,822 |
|
| Receivable for capital shares sold | 4,108,241 |
|
| Unrealized appreciation on forward foreign currency exchange contracts | 71,332 |
|
| Dividends and interest receivable | 10,577,163 |
|
| | 5,190,050,021 |
|
| | |
| Liabilities | |
| Payable for investments purchased | 58,282,668 |
|
| Payable for capital shares redeemed | 13,146,308 |
|
| Unrealized depreciation on forward foreign currency exchange contracts | 1,602,787 |
|
| Accrued management fees | 4,125,108 |
|
| Distribution and service fees payable | 263,639 |
|
| | 77,420,510 |
|
| | |
| Net Assets | $ | 5,112,629,511 |
|
| | |
| Net Assets Consist of: | |
| Capital (par value and paid-in surplus) | $ | 4,049,720,608 |
|
| Undistributed net investment income | 8,044,680 |
|
| Undistributed net realized gain | 169,186,590 |
|
| Net unrealized appreciation | 885,677,633 |
|
| | $ | 5,112,629,511 |
|
|
| | | | | |
| | Net Assets | Shares Outstanding | Net Asset Value Per Share |
| Investor Class, $0.01 Par Value |
| $3,252,176,625 |
| 198,915,115 | $16.35 |
| Institutional Class, $0.01 Par Value |
| $812,520,880 |
| 49,679,720 | $16.36 |
| A Class, $0.01 Par Value |
| $802,479,618 |
| 49,127,165 | $16.33* |
| C Class, $0.01 Par Value |
| $60,442,965 |
| 3,716,430 | $16.26 |
| R Class, $0.01 Par Value |
| $110,439,913 |
| 6,770,403 | $16.31 |
| R6 Class, $0.01 Par Value |
| $74,569,510 |
| 4,560,183 | $16.35 |
| * Maximum offering price $17.33 (net asset value divided by 0.9425). |
See Notes to Financial Statements.
|
| | | |
| YEAR ENDED MARCH 31, 2014 | |
| Investment Income (Loss) | |
| Income: | |
| Dividends (net of foreign taxes withheld of $329,851) | $ | 103,426,120 |
|
| Interest | 16,780 |
|
| | 103,442,900 |
|
| | |
| Expenses: | |
| Management fees | 42,946,962 |
|
| Distribution and service fees: | |
| A Class | 1,647,788 |
|
| C Class | 489,220 |
|
| R Class | 474,044 |
|
| Directors' fees and expenses | 128,911 |
|
| Other expenses | 72 |
|
| | 45,686,997 |
|
| | |
| Net investment income (loss) | 57,755,903 |
|
| | |
| Realized and Unrealized Gain (Loss) | |
| Net realized gain (loss) on: | |
| Investment transactions | 423,701,276 |
|
| Foreign currency transactions | 6,215,978 |
|
| | 429,917,254 |
|
| | |
| Change in net unrealized appreciation (depreciation) on: | |
| Investments | 359,873,057 |
|
| Translation of assets and liabilities in foreign currencies | (1,125,703) |
|
| | 358,747,354 |
|
| | |
| Net realized and unrealized gain (loss) | 788,664,608 |
|
| | |
| Net Increase (Decrease) in Net Assets Resulting from Operations | $ | 846,420,511 |
|
See Notes to Financial Statements.
|
|
| Statement of Changes in Net Assets |
|
| | | | | | |
| YEARS ENDED MARCH 31, 2014 AND MARCH 31, 2013 |
| Increase (Decrease) in Net Assets | March 31, 2014 | March 31, 2013 |
| Operations | | |
| Net investment income (loss) | $ | 57,755,903 |
| $ | 43,424,108 |
|
| Net realized gain (loss) | 429,917,254 |
| 85,580,417 |
|
| Change in net unrealized appreciation (depreciation) | 358,747,354 |
| 364,765,746 |
|
| Net increase (decrease) in net assets resulting from operations | 846,420,511 |
| 493,770,271 |
|
| | | |
| Distributions to Shareholders | | |
| From net investment income: | | |
| Investor Class | (37,722,594) |
| (34,962,608) |
|
| Institutional Class | (8,905,673) |
| (6,611,740) |
|
| A Class | (6,942,017) |
| (6,056,843) |
|
| C Class | (223,273) |
| (200,163) |
|
| R Class | (818,214) |
| (807,304) |
|
| R6 Class | (343,394) |
| — |
|
| From net realized gains: | | |
| Investor Class | (186,469,876) |
| (46,600,724) |
|
| Institutional Class | (41,066,685) |
| (8,214,430) |
|
| A Class | (43,513,075) |
| (9,216,413) |
|
| C Class | (3,355,561) |
| (526,325) |
|
| R Class | (6,113,861) |
| (1,403,611) |
|
| R6 Class | (2,630,900) |
| — |
|
| Decrease in net assets from distributions | (338,105,123) |
| (114,600,161) |
|
| | | |
| Capital Share Transactions | | |
| Net increase (decrease) in net assets from capital share transactions | 1,130,163,371 |
| 835,399,876 |
|
| | | |
| | | |
| Net increase (decrease) in net assets | 1,638,478,759 |
| 1,214,569,986 |
|
| | | |
| Net Assets | | |
| Beginning of period | 3,474,150,752 |
| 2,259,580,766 |
|
| End of period | $ | 5,112,629,511 |
| $ | 3,474,150,752 |
|
| | | |
| Undistributed net investment income | $ | 8,044,680 |
| $ | 6,449,316 |
|
See Notes to Financial Statements.
|
|
Notes to Financial Statements |
MARCH 31, 2014
1. Organization
American Century Capital Portfolios, Inc. (the corporation) is registered under the Investment Company Act of 1940, as amended (the 1940 Act), as an open-end management investment company and is organized as a Maryland corporation. Mid Cap Value Fund (the fund) is one fund in a series issued by the corporation. The fund is diversified as defined under the 1940 Act. The fund’s investment objective is to seek long-term capital growth. Income is a secondary objective.
The fund offers the Investor Class, the Institutional Class, the A Class, the C Class, the R Class and the R6 Class. The A Class may incur an initial sales charge. The A Class and C Class may be subject to a contingent deferred sales charge. The share classes differ principally in their respective sales charges and distribution and shareholder servicing expenses and arrangements. The Institutional Class and R6 Class shareholders do not require the same level of shareholder and administrative services from American Century Investment Management, Inc. (ACIM) (the investment advisor) as shareholders of other classes. In addition, financial intermediaries do not receive any service, distribution or administrative fees for the R6 Class. As a result, the Institutional Class and R6 Class are charged lower unified management fees. Sale of the R6 Class commenced on July 26, 2013.
2. Significant Accounting Policies
The following is a summary of significant accounting policies consistently followed by the fund in preparation of its financial statements. The financial statements are prepared in conformity with accounting principles generally accepted in the United States of America, which may require management to make certain estimates and assumptions at the date of the financial statements. Actual results could differ from these estimates.
Investment Valuations — The fund determines the fair value of its investments and computes its net asset value per share at the close of regular trading (usually 4 p.m. Eastern time) on the New York Stock Exchange (NYSE) on each day the NYSE is open. The Board of Directors has adopted valuation policies and procedures to guide the investment advisor in the fund’s investment valuation process and to provide methodologies for the oversight of the fund’s pricing function.
Equity securities that are listed or traded on a domestic securities exchange are valued at the last reported sales price or at the official closing price as provided by the exchange. Equity securities traded on foreign securities exchanges are generally valued at the closing price of such securities on the exchange where primarily traded or at the close of the NYSE, if that is earlier. If no last sales price is reported, or if local convention or regulation so provides, the mean of the latest bid and asked prices may be used. Securities traded over-the-counter are valued at the mean of the latest bid and asked prices, the last sales price, or the official closing price. Equity securities initially expressed in local currencies are translated into U.S. dollars at the mean of the appropriate currency exchange rate at the close of the NYSE as provided by an independent pricing service.
Fixed income securities maturing within 60 days at the time of purchase may be valued at cost, plus or minus any amortized discount or premium or at the evaluated mean as provided by an independent pricing service. Evaluated mean prices are commonly derived through utilization of market models, which may consider, among other factors: trade data, quotations from dealers and active market makers, relevant yield curve and spread data, related sector levels, creditworthiness, trade data or market information on comparable securities, and other relevant security specific information.
Open-end management investment companies are valued at the reported net asset value per share. Repurchase agreements are valued at cost, which approximates fair value. Forward foreign currency exchange contracts are valued at the mean of the appropriate forward exchange rate at the close of the NYSE as provided by an independent pricing service.
If the fund determines that the market price for an investment is not readily available or the valuation methods mentioned above do not reflect an investment’s fair value, such investment is valued as determined in good faith by the Board of Directors or its delegate, in accordance with policies and procedures adopted by the Board of Directors. In its determination of fair value, the fund may review several factors including, but not
limited to, market information regarding the specific investment or comparable investments and correlation with other investment types, futures indices or general market indicators. Circumstances that may cause the fund to use these procedures to value an investment include, but are not limited to: an investment has been declared in default or is distressed; trading in a security has been suspended during the trading day or a security is not actively trading on its principal exchange; prices received from a regular pricing source are deemed unreliable; or there is a foreign market holiday and no trading occurred.
The fund monitors for significant events occurring after the close of an investment’s primary exchange but before the fund’s net asset value per share is determined. Significant events may include, but are not limited to: corporate announcements and transactions; governmental action and political unrest that could impact a specific investment or an investment sector; or armed conflicts, natural disasters and similar events that could affect investments in a specific country or region. The fund also monitors for significant fluctuations between domestic and foreign markets, as evidenced by the U.S. market or such other indicators that the Board of Directors, or its delegate, deems appropriate. If significant fluctuations in foreign markets are identified, the fund may apply a model-derived factor to the closing price of equity securities traded on foreign securities exchanges. The factor is based on observable market data as provided by an independent pricing service.
Security Transactions — Security transactions are accounted for as of the trade date. Net realized gains and losses are determined on the identified cost basis, which is also used for federal income tax purposes.
Investment Income — Dividend income less foreign taxes withheld, if any, is recorded as of the ex-dividend date. Distributions received on securities that represent a return of capital or long-term capital gain are recorded as a reduction of cost of investments and/or as a realized gain. The fund may estimate the components of distributions received that may be considered nontaxable distributions or long-term capital gain distributions for income tax purposes. Interest income is recorded on the accrual basis and includes accretion of discounts and amortization of premiums.
Foreign Currency Translations — All assets and liabilities initially expressed in foreign currencies are translated into U.S. dollars at prevailing exchange rates at period end. The fund may enter into spot foreign currency exchange contracts to facilitate transactions denominated in a foreign currency. Purchases and sales of investment securities, dividend and interest income, spot foreign currency exchange contracts, and expenses are translated at the rates of exchange prevailing on the respective dates of such transactions. Net realized and unrealized foreign currency exchange gains or losses related to investment securities are a component of net realized gain (loss) on investment transactions and change in net unrealized appreciation (depreciation) on investments, respectively.
Repurchase Agreements — The fund may enter into repurchase agreements with institutions that ACIM has determined are creditworthy pursuant to criteria adopted by the Board of Directors. The fund requires that the collateral, represented by securities, received in a repurchase transaction be transferred to the custodian in a manner sufficient to enable the fund to obtain those securities in the event of a default under the repurchase agreement. ACIM monitors, on a daily basis, the securities transferred to ensure the value, including accrued interest, of the securities under each repurchase agreement is equal to or greater than amounts owed to the fund under each repurchase agreement.
Joint Trading Account — Pursuant to an Exemptive Order issued by the Securities and Exchange Commission, the fund, along with certain other funds in the American Century Investments family of funds, may transfer uninvested cash balances into a joint trading account. These balances are invested in one or more repurchase agreements that are collateralized by U.S. Treasury or Agency obligations.
Income Tax Status — It is the fund’s policy to distribute substantially all net investment income and net realized gains to shareholders and to otherwise qualify as a regulated investment company under provisions of the Internal Revenue Code. Accordingly, no provision has been made for income taxes. The fund files U.S. federal, state, local and non-U.S. tax returns as applicable. The fund's tax returns are subject to examination by the relevant taxing authority until expiration of the applicable statute of limitations, which is generally three years from the date of filing but can be longer in certain jurisdictions. At this time, management believes there are no uncertain tax positions which, based on their technical merit, would not be sustained upon examination and for which it is reasonably possible that the total amounts of unrecognized tax benefits will significantly change in the next twelve months.
Multiple Class — All shares of the fund represent an equal pro rata interest in the net assets of the class to which such shares belong, and have identical voting, dividend, liquidation and other rights and the same terms and conditions, except for class specific expenses and exclusive rights to vote on matters affecting only
individual classes. Income, non-class specific expenses, and realized and unrealized capital gains and losses of the fund are allocated to each class of shares based on their relative net assets.
Distributions to Shareholders — Distributions from net investment income, if any, are generally declared and paid quarterly. Distributions from net realized gains, if any, are generally declared and paid annually.
Indemnifications — Under the corporation’s organizational documents, its officers and directors are indemnified against certain liabilities arising out of the performance of their duties to the fund. In addition, in the normal course of business, the fund enters into contracts that provide general indemnifications. The maximum exposure under these arrangements is unknown as this would involve future claims that may be made against a fund. The risk of material loss from such claims is considered by management to be remote.
3. Fees and Transactions with Related Parties
Certain officers and directors of the corporation are also officers and/or directors of American Century Companies, Inc. (ACC). The corporation’s investment advisor, ACIM, the corporation's distributor, American Century Investment Services, Inc. (ACIS), and the corporation’s transfer agent, American Century Services, LLC, are wholly owned, directly or indirectly, by ACC.
Management Fees — The corporation has entered into a management agreement with ACIM, under which ACIM provides the fund with investment advisory and management services in exchange for a single, unified management fee (the fee) per class. The agreement provides that all expenses of managing and operating the fund, except distribution and service fees, brokerage expenses, taxes, interest, fees and expenses of the independent directors (including legal counsel fees), and extraordinary expenses, will be paid by ACIM. The fee is computed and accrued daily based on each class’s daily net assets and paid monthly in arrears. The annual management fee is 1.00% for the Investor Class, A Class, C Class and R Class, 0.80% for the Institutional Class and 0.65% for the R6 Class.
Distribution and Service Fees — The Board of Directors has adopted a separate Master Distribution and Individual Shareholder Services Plan for each of the A Class, C Class and R Class (collectively the plans), pursuant to Rule 12b-1 of the 1940 Act. The plans provide that the A Class will pay ACIS an annual distribution and service fee of 0.25%. The plans provide that the C Class will pay ACIS an annual distribution and service fee of 1.00%, of which 0.25% is paid for individual shareholder services and 0.75% is paid for distribution services. The plans provide that the R Class will pay ACIS an annual distribution and service fee of 0.50%. The fees are computed and accrued daily based on each class’s daily net assets and paid monthly in arrears. The fees are used to pay financial intermediaries for distribution and individual shareholder services. Fees incurred under the plans during the year ended March 31, 2014 are detailed in the Statement of Operations.
Directors' Fees and Expenses — The Board of Directors is responsible for overseeing the investment advisor's management and operations of the fund. The directors receive detailed information about the fund and its investment advisor regularly throughout the year, and meet at least quarterly with management of the investment advisor to review reports about fund operations. Fees and expenses incurred in conjunction with the directors during the year ended March 31, 2014 are detailed in the Statement of Operations. The fund’s officers do not receive compensation from the fund.
4. Investment Transactions
Purchases and sales of investment securities, excluding short-term investments, for the year ended March 31, 2014 were $3,746,439,372 and $2,898,123,126, respectively.
5. Capital Share Transactions
Transactions in shares of the fund were as follows:
|
| | | | | | | | |
| | Year ended March 31, 2014(1) | Year ended March 31, 2013 |
| | Shares | Amount | Shares | Amount |
| Investor Class/Shares Authorized | 555,000,000 | | 500,000,000 | |
| Sold | 67,128,088 | $ | 1,032,685,581 |
| 67,480,262 | $ | 888,777,355 |
|
| Issued in reinvestment of distributions | 14,102,921 | 218,577,078 |
| 6,187,913 | 79,352,207 |
|
| Redeemed | (51,576,358) | (804,506,459) |
| (30,017,729) | (392,179,745) |
|
| | 29,654,651 | 446,756,200 |
| 43,650,446 | 575,949,817 |
|
| Institutional Class/Shares Authorized | 150,000,000 | | 100,000,000 | |
| Sold | 27,072,352 | 420,529,813 |
| 12,919,904 | 168,871,444 |
|
| Issued in reinvestment of distributions | 2,610,543 | 40,501,980 |
| 933,914 | 12,000,298 |
|
| Redeemed | (9,029,546) | (140,904,950) |
| (5,198,351) | (68,083,664) |
|
| | 20,653,349 | 320,126,843 |
| 8,655,467 | 112,788,078 |
|
| A Class/Shares Authorized | 150,000,000 | | 100,000,000 | |
| Sold | 25,453,960 | 394,239,784 |
| 16,033,412 | 210,717,951 |
|
| Issued in reinvestment of distributions | 3,152,530 | 48,853,425 |
| 1,153,941 | 14,768,108 |
|
| Redeemed | (13,112,900) | (203,392,609) |
| (8,174,174) | (106,477,452) |
|
| | 15,493,590 | 239,700,600 |
| 9,013,179 | 119,008,607 |
|
| C Class/Shares Authorized | 15,000,000 | | 10,000,000 | |
| Sold | 1,787,493 | 27,382,385 |
| 1,172,247 | 15,546,220 |
|
| Issued in reinvestment of distributions | 200,686 | 3,098,474 |
| 47,511 | 607,390 |
|
| Redeemed | (439,763) | (6,786,136) |
| (238,735) | (3,101,170) |
|
| | 1,548,416 | 23,694,723 |
| 981,023 | 13,052,440 |
|
| R Class/Shares Authorized | 25,000,000 | | 15,000,000 | |
| Sold | 3,002,841 | 46,350,942 |
| 2,141,562 | 28,095,307 |
|
| Issued in reinvestment of distributions | 443,429 | 6,863,337 |
| 172,787 | 2,208,311 |
|
| Redeemed | (1,707,674) | (26,599,771) |
| (1,208,392) | (15,702,684) |
|
| | 1,738,596 | 26,614,508 |
| 1,105,957 | 14,600,934 |
|
| R6 Class/Shares Authorized | 50,000,000 | | N/A | |
| Sold | 4,717,648 | 75,828,189 |
| | |
| Issued in reinvestment of distributions | 191,117 | 2,974,294 |
| | |
| Redeemed | (348,582) | (5,531,986) |
| | |
| | 4,560,183 | 73,270,497 |
| | |
| Net increase (decrease) | 73,648,785 | $ | 1,130,163,371 |
| 63,406,072 | $ | 835,399,876 |
|
(1) July 26, 2013 (commencement of sale) through March 31, 2014 for the R6 Class. |
6. Fair Value Measurements
The fund’s investments valuation process is based on several considerations and may use multiple inputs to determine the fair value of the investments held by the fund. In conformity with accounting principles generally accepted in the United States of America, the inputs used to determine a valuation are classified into three broad levels.
| |
| • | Level 1 valuation inputs consist of unadjusted quoted prices in an active market for identical investments. |
| |
| • | Level 2 valuation inputs consist of direct or indirect observable market data (including quoted prices for comparable investments, evaluations of subsequent market events, interest rates, prepayment speeds, credit risk, etc.). These inputs also consist of quoted prices for identical investments initially expressed in local currencies that are adjusted through translation into U.S. dollars. |
| |
| • | Level 3 valuation inputs consist of unobservable data (including a fund’s own assumptions). |
The level classification is based on the lowest level input that is significant to the fair valuation measurement. The valuation inputs are not necessarily an indication of the risks associated with investing in these securities or other financial instruments.
The following is a summary of the level classifications as of period end. The Schedule of Investments provides additional information on the fund’s portfolio holdings.
|
| | | | | | | | |
| | Level 1 | Level 2 | Level 3 |
| Assets | | | |
| Investment Securities | | | |
| Common Stocks | $ | 4,628,611,959 |
| $ | 278,169,329 |
| — |
|
| Exchange-Traded Funds | 85,557,922 |
| — |
| — |
|
| Temporary Cash Investments | 77,933,541 |
| 43,214,712 |
| — |
|
| | $ | 4,792,103,422 |
| $ | 321,384,041 |
| — |
|
| Other Financial Instruments | | | |
| Forward Foreign Currency Exchange Contracts | — |
| $ | 71,332 |
| — |
|
| | | | |
| Liabilities | | | |
| Other Financial Instruments | | | |
| Forward Foreign Currency Exchange Contracts | — |
| $ | (1,602,787 | ) | — |
|
7. Derivative Instruments
Foreign Currency Risk — The fund is subject to foreign currency exchange rate risk in the normal course of pursuing its investment objectives. The value of foreign investments held by a fund may be significantly affected by changes in foreign currency exchange rates. The dollar value of a foreign security generally decreases when the value of the dollar rises against the foreign currency in which the security is denominated and tends to increase when the value of the dollar declines against such foreign currency. A fund may enter into forward foreign currency exchange contracts to reduce a fund's exposure to foreign currency exchange rate fluctuations. The net U.S. dollar value of foreign currency underlying all contractual commitments held by a fund and the resulting unrealized appreciation or depreciation are determined daily. Realized gain or loss is recorded upon the termination of the contract. Net realized and unrealized gains or losses occurring during the holding period of forward foreign currency exchange contracts are a component of net realized gain (loss) on foreign currency transactions and change in net unrealized appreciation (depreciation) on translation of assets and liabilities in foreign currencies, respectively. A fund bears the risk of an unfavorable change in the foreign currency exchange rate underlying the forward contract. Additionally, losses, up to the fair value, may arise if the counterparties do not perform under the contract terms. The foreign currency risk derivative instruments held at period end as disclosed on the Schedule of Investments are indicative of the fund's typical volume during the period.
The value of foreign currency risk derivative instruments as of March 31, 2014, is disclosed on the Statement of Assets and Liabilities as an asset of $71,332 in unrealized appreciation on forward foreign currency exchange contracts and a liability of $1,602,787 in unrealized depreciation on forward foreign currency exchange contracts. For the year ended March 31, 2014, the effect of foreign currency risk derivative instruments on the Statement of Operations was $6,027,284 in net realized gain (loss) on foreign currency transactions and $(1,122,472) in change in net unrealized appreciation (depreciation) on translation of assets and liabilities in foreign currencies.
8. Risk Factors
There are certain risks involved in investing in foreign securities. These risks include those resulting from future adverse political, social and economic developments, fluctuations in currency exchange rates, the possible imposition of exchange controls, and other foreign laws or restrictions.
9. Federal Tax Information
The tax character of distributions paid during the years ended March 31, 2014 and March 31, 2013 were as follows:
|
| | | | | | |
| | 2014 | 2013 |
| Distributions Paid From | | |
| Ordinary income | $ | 173,872,245 |
| $ | 88,592,941 |
|
| Long-term capital gains | $ | 164,232,878 |
| $ | 26,007,220 |
|
The book-basis character of distributions made during the year from net investment income or net realized gains may differ from their ultimate characterization for federal income tax purposes. These differences reflect the differing character of certain income items and net realized gains and losses for financial statement and tax purposes, and may result in reclassification among certain capital accounts on the financial statements.
As of March 31, 2014, the federal tax cost of investments and the components of distributable earnings on a tax-basis were as follows:
|
| | | |
| Federal tax cost of investments | $ | 4,277,203,585 |
|
| Gross tax appreciation of investments | $ | 886,363,156 |
|
| Gross tax depreciation of investments | (50,079,278 | ) |
| Net tax appreciation (depreciation) of investments | $ | 836,283,878 |
|
| Net tax appreciation (depreciation) on derivatives and translation of assets and liabilities in foreign currencies | $ | (15,069 | ) |
| Net tax appreciation (depreciation) | $ | 836,268,809 |
|
| Undistributed ordinary income | $ | 112,523,460 |
|
| Accumulated long-term gains | $ | 114,116,634 |
|
The difference between book-basis and tax-basis unrealized appreciation (depreciation) is attributable primarily to the tax deferral of losses on wash sales.
|
| | | | | | | | | | | | | | | | | | |
| For a Share Outstanding Throughout the Years Ended March 31 (except as noted) |
| Per-Share Data | | | | | | | | Ratios and Supplemental Data | |
| | | Income From Investment Operations: | Distributions From: | | | Ratio to Average Net Assets of: | | |
| | Net Asset
Value,
Beginning
of Period | Net
Investment
Income
(Loss)(1) | Net
Realized
and
Unrealized
Gain (Loss) | Total From
Investment
Operations | Net
Investment
Income | Net
Realized
Gains | Total
Distributions | Net Asset
Value,
End
of Period | Total
Return(2) | Operating
Expenses | Net
Investment
Income
(Loss) | Portfolio
Turnover
Rate | Net
Assets,
End of
Period
(in thousands) |
| Investor Class | | | | | | | | | | | | |
| 2014 |
| $14.53 |
| 0.21 | 2.77 | 2.98 | (0.20) | (0.96) | (1.16) | $16.35 | 21.02 | % | 1.00% | 1.34% | 67% |
| $3,252,177 |
|
| 2013 |
| $12.86 |
| 0.22 | 2.02 | 2.24 | (0.25) | (0.32) | (0.57) | $14.53 | 18.11 | % | 1.00% | 1.69% | 61% |
| $2,459,353 |
|
| 2012 |
| $13.13 |
| 0.22 | 0.28 | 0.50 | (0.16) | (0.61) | (0.77) | $12.86 | 4.48 | % | 1.01% | 1.80% | 82% |
| $1,615,365 |
|
| 2011 |
| $11.41 |
| 0.25 | 1.70 | 1.95 | (0.23) | – | (0.23) | $13.13 | 17.34 | % | 1.01% | 2.07% | 71% |
| $1,334,230 |
|
| 2010 |
| $7.34 |
| 0.18 | 4.03 | 4.21 | (0.14) | – | (0.14) | $11.41 | 57.68 | % | 1.00% | 1.79% | 126% |
| $478,796 |
|
| Institutional Class | | | | | | | | | | | | |
| 2014 |
| $14.53 |
| 0.24 | 2.78 | 3.02 | (0.23) | (0.96) | (1.19) | $16.36 | 21.33 | % | 0.80% | 1.54% | 67% |
| $812,521 |
|
| 2013 |
| $12.86 |
| 0.25 | 2.02 | 2.27 | (0.28) | (0.32) | (0.60) | $14.53 | 18.34 | % | 0.80% | 1.89% | 61% |
| $421,877 |
|
| 2012 |
| $13.14 |
| 0.25 | 0.27 | 0.52 | (0.19) | (0.61) | (0.80) | $12.86 | 4.60 | % | 0.81% | 2.00% | 82% |
| $262,032 |
|
| 2011 |
| $11.41 |
| 0.28 | 1.70 | 1.98 | (0.25) | – | (0.25) | $13.14 | 17.66 | % | 0.81% | 2.27% | 71% |
| $170,182 |
|
| 2010 |
| $7.34 |
| 0.20 | 4.03 | 4.23 | (0.16) | – | (0.16) | $11.41 | 58.00 | % | 0.80% | 1.99% | 126% |
| $68,487 |
|
A Class(3) | | | | | | | | | | | | | |
| 2014 |
| $14.52 |
| 0.17 | 2.76 | 2.93 | (0.16) | (0.96) | (1.12) | $16.33 | 20.71 | % | 1.25% | 1.09% | 67% |
| $802,480 |
|
| 2013 |
| $12.86 |
| 0.19 | 2.01 | 2.20 | (0.22) | (0.32) | (0.54) | $14.52 | 17.83 | % | 1.25% | 1.44% | 61% |
| $488,491 |
|
| 2012 |
| $13.13 |
| 0.19 | 0.29 | 0.48 | (0.14) | (0.61) | (0.75) | $12.86 | 4.19 | % | 1.26% | 1.55% | 82% |
| $316,497 |
|
| 2011 |
| $11.41 |
| 0.21 | 1.71 | 1.92 | (0.20) | – | (0.20) | $13.13 | 17.05 | % | 1.26% | 1.82% | 71% |
| $215,813 |
|
| 2010 |
| $7.34 |
| 0.15 | 4.04 | 4.19 | (0.12) | – | (0.12) | $11.41 | 57.28 | % | 1.25% | 1.54% | 126% |
| $75,435 |
|
|
| | | | | | | | | | | | | | | | | | |
| For a Share Outstanding Throughout the Years Ended March 31 (except as noted) |
| Per-Share Data | | | | | | | | Ratios and Supplemental Data | |
| | | Income From Investment Operations: | Distributions From: | | | Ratio to Average Net Assets of: | | |
| | Net Asset
Value,
Beginning
of Period | Net
Investment
Income
(Loss)(1) | Net
Realized
and
Unrealized
Gain (Loss) | Total From
Investment
Operations | Net
Investment
Income | Net
Realized
Gains | Total
Distributions | Net Asset
Value,
End
of Period | Total
Return(2) | Operating
Expenses | Net
Investment
Income
(Loss) | Portfolio
Turnover
Rate | Net
Assets,
End of
Period
(in thousands) |
| C Class | | | | | | | | | | | | | |
| 2014 |
| $14.49 |
| 0.05 | 2.75 | 2.80 | (0.07) | (0.96) | (1.03) | $16.26 | 19.75 | % | 2.00% | 0.34% | 67% |
| $60,443 |
|
| 2013 |
| $12.84 |
| 0.09 | 2.02 | 2.11 | (0.14) | (0.32) | (0.46) | $14.49 | 16.96 | % | 2.00% | 0.69% | 61% |
| $31,407 |
|
| 2012 |
| $13.14 |
| 0.11 | 0.27 | 0.38 | (0.07) | (0.61) | (0.68) | $12.84 | 3.41 | % | 2.01% | 0.80% | 82% |
| $15,242 |
|
| 2011 |
| $11.42 |
| 0.13 | 1.71 | 1.84 | (0.12) | – | (0.12) | $13.14 | 16.24 | % | 2.01% | 1.07% | 71% |
| $5,989 |
|
2010(4) |
| $10.97 |
| 0.02 | 0.43 | 0.45 | – | – | – | $11.42 | 4.10 | % | 2.00%(5) | 2.07%(5) | 126%(6) |
| $51 |
|
| R Class | | | | | | | | | | | | | |
| 2014 |
| $14.51 |
| 0.13 | 2.76 | 2.89 | (0.13) | (0.96) | (1.09) | $16.31 | 20.41 | % | 1.50% | 0.84% | 67% |
| $110,440 |
|
| 2013 |
| $12.85 |
| 0.15 | 2.02 | 2.17 | (0.19) | (0.32) | (0.51) | $14.51 | 17.49 | % | 1.50% | 1.19% | 61% |
| $73,023 |
|
| 2012 |
| $13.14 |
| 0.16 | 0.28 | 0.44 | (0.12) | (0.61) | (0.73) | $12.85 | 3.91 | % | 1.51% | 1.30% | 82% |
| $50,444 |
|
| 2011 |
| $11.41 |
| 0.19 | 1.71 | 1.90 | (0.17) | – | (0.17) | $13.14 | 16.85 | % | 1.51% | 1.57% | 71% |
| $40,933 |
|
| 2010 |
| $7.34 |
| 0.13 | 4.03 | 4.16 | (0.09) | – | (0.09) | $11.41 | 56.88 | % | 1.50% | 1.29% | 126% |
| $16,611 |
|
| R6 Class | | | | | | | | | | | | | |
2014(7) |
| $15.66 |
| 0.20 | 1.61 | 1.81 | (0.16) | (0.96) | (1.12) | $16.35 | 12.01 | % | 0.65%(5) | 1.83%(5) | 67%(8) |
| $74,570 |
|
|
| | | | |
| Notes to Financial Highlights | | |
| |
| (1) | Computed using average shares outstanding throughout the period. |
| |
| (2) | Total returns are calculated based on the net asset value of the last business day and do not reflect applicable sales charges, if any. Total returns for periods less than one year are not annualized. |
| |
| (3) | Prior to March 1, 2010, the A Class was referred to as the Advisor Class. |
| |
| (4) | March 1, 2010 (commencement of sale) through March 31, 2010. |
| |
| (6) | Portfolio turnover is calculated at the fund level. Percentage indicated was calculated for the year ended March 31, 2010. |
| |
| (7) | July 26, 2013 (commencement of sale) through March 31, 2014. |
| |
| (8) | Portfolio turnover is calculated at the fund level. Percentage indicated was calculated for the year ended March 31, 2014. |
See Notes to Financial Statements.
|
|
| Report of Independent Registered Public Accounting Firm |
To the Board of Directors and Shareholders of
American Century Capital Portfolios, Inc.:
We have audited the accompanying statement of assets and liabilities, including the schedule of investments, of Mid Cap Value Fund (the “Fund”), one of the funds constituting American Century Capital Portfolios, Inc., as of March 31, 2014, and the related statement of operations for the year then ended, the statements of changes in net assets for each of the two years in the period then ended, and the financial highlights for each of the periods presented. These financial statements and financial highlights are the responsibility of the Fund's management. Our responsibility is to express an opinion on these financial statements and financial highlights based on our audits.
We conducted our audits in accordance with the standards of the Public Company Accounting Oversight Board (United States). Those standards require that we plan and perform the audit to obtain reasonable assurance about whether the financial statements and financial highlights are free of material misstatement. The Fund is not required to have, nor were we engaged to perform, an audit of its internal control over financial reporting. Our audits included consideration of internal control over financial reporting as a basis for designing audit procedures that are appropriate in the circumstances, but not for the purpose of expressing an opinion on the effectiveness of the Fund's internal control over financial reporting. Accordingly, we express no such opinion. An audit also includes examining, on a test basis, evidence supporting the amounts and disclosures in the financial statements, assessing the accounting principles used and significant estimates made by management, as well as evaluating the overall financial statement presentation. Our procedures included confirmation of securities owned as of March 31, 2014, by correspondence with the custodian and brokers; where replies were not received from brokers, we performed other auditing procedures. We believe that our audits provide a reasonable basis for our opinion.
In our opinion, the financial statements and financial highlights referred to above present fairly, in all material respects, the financial position of Mid Cap Value Fund of American Century Capital Portfolios, Inc. as of March 31, 2014, the results of its operations for the year then ended, the changes in its net assets for each of the two years in the period then ended, and the financial highlights for each of the periods presented, in conformity with accounting principles generally accepted in the United States of America.
Deloitte & Touche LLP
Kansas City, Missouri
May 16, 2014
The Board of Directors
The individuals listed below serve as directors of the funds. Each director will continue to serve in this capacity until death, retirement, resignation or removal from office. The board has adopted a mandatory retirement age for directors who are not “interested persons,” as that term is defined in the Investment Company Act (independent directors). Independent directors shall retire by December 31 of the year in which they reach their 75th birthday.
Mr. Thomas is an “interested person” because he currently serves as President and Chief Executive Officer of American Century Companies, Inc. (ACC), the parent company of American Century Investment Management, Inc. (ACIM or the advisor). Mr. Fink is treated as an “interested person” because of his recent employment with ACC and American Century Services, LLC (ACS). The other directors (more than three-fourths of the total number) are independent. They are not employees, directors or officers of, and have no financial interest in, ACC or any of its wholly owned, direct or indirect, subsidiaries, including ACIM, American Century Investment Services, Inc. (ACIS) and ACS, and do not have any other affiliations, positions, or relationships that would cause them to be considered “interested persons” under the Investment Company Act. The directors serve in this capacity for seven (in the case of Mr. Thomas, 15) registered investment companies in the American Century Investments family of funds.
The following table presents additional information about the directors. The mailing address for each director is 4500 Main Street, Kansas City, Missouri 64111.
|
| | | | | |
Name (Year of Birth) | Position(s) Held with Funds | Length of Time Served | Principal Occupation(s) During Past 5 Years | Number of American Century Portfolios Overseen by Director | Other Directorships Held During Past
5 Years |
| Independent Directors |
Thomas A. Brown
(1940) | Director | Since 1980 | Managing Member, Associated Investments, LLC (real estate investment company); Brown Cascade Properties, LLC (real estate investment company) (2001 to 2009) | 73 | None |
Andrea C. Hall
(1945) | Director | Since 1997 | Retired | 73 | None |
Jan M. Lewis
(1957) | Director | Since 2011 | Retired; President and Chief Executive Officer, Catholic Charities of Northeast Kansas (human services organization) (2006 to 2013) | 73 | None |
James A. Olson
(1942) | Director and Chairman of the Board | Since 2007 (Chairman since 2014) | Member, Plaza Belmont LLC (private equity fund manager) | 73 | Saia, Inc. (2002 to 2012) and EPR Properties (2003 to 2013) |
|
| | | | | |
Name (Year of Birth) | Position(s) Held with Funds | Length of Time Served | Principal Occupation(s) During Past 5 Years | Number of American Century Portfolios Overseen by Director | Other Directorships Held During Past
5 Years |
| Independent Directors |
M. Jeannine Strandjord
(1945) | Director | Since 1994 | Retired | 73 | Euronet Worldwide Inc.; Charming Shoppes, Inc. (2006 to 2010); and DST Systems Inc. (1996 to 2012) |
John R. Whitten
(1946) | Director | Since 2008 | Retired | 73 | Rudolph Technologies, Inc. |
Stephen E. Yates
(1948) | Director | Since 2012 | Retired; Executive Vice President, Technology & Operations, KeyCorp. (computer services) (2004 to 2010) | 73 | Applied Industrial Technologies, Inc. (2001 to 2010) |
| Interested Directors | | | | |
Barry Fink
(1955) | Director | Since 2012 | Retired; Executive Vice President, ACC (September 2007 to February 2013); President, ACS (October 2007 to February 2013); Chief Operating Officer, ACC (September 2007 to November 2012) | 73 | None |
Jonathan S. Thomas
(1963) | Director and President | Since 2007 | President and Chief Executive Officer, ACC (March 2007 to present). Also serves as Chief Executive Officer and Manager, ACS; Executive Vice President, ACIM; Director, ACC, ACIM and other ACC subsidiaries | 115 | None |
Officers
The following table presents certain information about the executive officers of the funds. Each officer serves as an officer for each of the 15 investment companies in the American Century family of funds, unless otherwise noted. No officer is compensated for his or her service as an officer of the funds. The listed officers are interested persons of the funds and are appointed or re-appointed on an annual basis. The mailing address for each officer listed below is 4500 Main Street, Kansas City, Missouri 64111.
|
| | |
Name (Year of Birth) | Offices with
the Funds | Principal Occupation(s) During the Past Five Years |
Jonathan S.
Thomas
(1963) | Director and
President
since 2007 | President and Chief Executive Officer, ACC (March 2007 to present). Also serves as Chief Executive Officer and Manager, ACS; Executive Vice President, ACIM; Director, ACC, ACIM and other ACC subsidiaries |
Amy D. Shelton
(1964) | Chief Compliance
Officer since 2014 | Chief Compliance Officer, American Century funds, (March 2014 to present); Chief Compliance Officer, ACIM (February 2014 to present); Chief Compliance Officer, ACIS (October 2009 to present); Vice President, Client Interactions and Marketing, ACIS (February 2013 to January 2014); Director, Client Interactions and Marketing, ACIS (June 2007 to January 2013). Also serves as Vice President, ACIS |
Charles A.
Etherington
(1957) | General Counsel
since 2007 and
Senior Vice
President since 2006 | Attorney, ACC (February 1994 to present); Vice President, ACC (November 2005 to present); General Counsel, ACC (March 2007 to present). Also serves as General Counsel, ACIM, ACS, ACIS and other ACC subsidiaries; and Senior Vice President, ACIM and ACS |
C. Jean Wade
(1964) | Vice President,
Treasurer and
Chief Financial
Officer since 2012 | Vice President, ACS (February 2000 to present) |
Robert J.
Leach
(1966) | Vice President
since 2006 and
Assistant Treasurer
since 2012 | Vice President, ACS (February 2000 to present) |
David H.
Reinmiller
(1963) | Vice President
since 2000 | Attorney, ACC (January 1994 to present); Associate General Counsel, ACC (January 2001 to present). Also serves as Vice President, ACIM and ACS |
Ward D.
Stauffer
(1960) | Secretary
since 2005 | Attorney, ACC (June 2003 to present) |
The Statement of Additional Information has additional information about the fund's directors and is available without charge, upon request, by calling 1-800-345-2021.
Retirement Account Information
As required by law, distributions you receive from certain IRAs are subject to federal income tax withholding, unless you elect not to have withholding apply. Tax will be withheld on the total amount withdrawn even though you may be receiving amounts that are not subject to withholding, such as nondeductible contributions. In such case, excess amounts of withholding could occur. You may adjust your withholding election so that a greater or lesser amount will be withheld.
If you don’t want us to withhold on this amount, you must notify us to not withhold the federal income tax. You may notify us in writing or in certain situations by telephone or through other electronic means. For systematic withdrawals, your withholding election will remain in effect until revoked or changed by filing a new election. You have the right to revoke your election at any time.
Remember, even if you elect not to have income tax withheld, you are liable for paying income tax on the taxable portion of your withdrawal. If you elect not to have income tax withheld or you don’t have enough income tax withheld, you may be responsible for payment of estimated tax. You may incur penalties under the estimated tax rules if your withholding and estimated tax payments are not sufficient. You can reduce or defer the income tax on a distribution by directly or indirectly rolling such distribution over to another IRA or eligible plan. You should consult your tax advisor for additional information.
State tax will be withheld if, at the time of your distribution, your address is within one of the mandatory withholding states and you have federal income tax withheld (or as otherwise required by state law). State taxes will be withheld from your distribution in accordance with the respective state rules.
Distributions you receive from 403(b), 457 and qualified plans are subject to special tax and withholding rules. Your plan administrator or plan sponsor is required to provide you with a special tax notice explaining those rules at the time you request a distribution. If applicable, federal and/or state taxes may be withheld from your distribution amount.
Proxy Voting Policies
A description of the policies that the fund's investment advisor uses in exercising the voting rights associated with the securities purchased and/or held by the fund is available without charge, upon request, by calling 1-800-345-2021. It is also available on the "About Us" page of American Century Investments’ website at americancentury.com and on the Securities and Exchange Commission’s website at sec.gov. Information regarding how the investment advisor voted proxies relating to portfolio securities during the most recent 12-month period ended June 30 is available on the "About Us" page at americancentury.com. It is also available at sec.gov.
Quarterly Portfolio Disclosure
The fund files its complete schedule of portfolio holdings with the Securities and Exchange Commission (SEC) for the first and third quarters of each fiscal year on Form N-Q. The fund’s Forms N-Q are available on the SEC’s website at sec.gov, and may be reviewed and copied at the SEC’s Public Reference Room in Washington, DC. Information on the operation of the Public Reference Room may be obtained by calling 1-800-SEC-0330. The fund also makes its complete schedule of portfolio holdings for the most recent quarter of its fiscal year available on its
website at americancentury.com and, upon request, by calling 1-800-345-2021.
Other Tax Information
The following information is provided pursuant to provisions of the Internal Revenue Code.
The fund hereby designates up to the maximum amount allowable as qualified dividend income for the fiscal year ended March 31, 2014.
For corporate taxpayers, the fund hereby designates $79,141,255, or up to the maximum amount allowable, of ordinary income distributions paid during the fiscal year ended March 31, 2014 as qualified for the corporate dividends received deduction.
The fund hereby designates $118,917,080 as qualified short-term capital gain distributions for purposes of Internal Revenue Code Section 871.
The fund hereby designates $164,232,878, or up to the maximum amount allowable, as long-term capital gain distributions for the fiscal year ended March 31, 2014.
|
| | |
| |
| | | |
| Contact Us | americancentury.com | |
| Automated Information Line | 1-800-345-8765 | |
| Investor Services Representative | 1-800-345-2021 or 816-531-5575 | |
| Investors Using Advisors | 1-800-378-9878 | |
| Business, Not-For-Profit, Employer-Sponsored Retirement Plans | 1-800-345-3533 | |
| Banks and Trust Companies, Broker-Dealers, Financial Professionals, Insurance Companies | 1-800-345-6488 | |
| Telecommunications Relay Service for the Deaf | 711 | |
| | | |
| American Century Capital Portfolios, Inc. | |
| | | |
Investment Advisor: American Century Investment Management, Inc. Kansas City, Missouri | |
| | | |
| This report and the statements it contains are submitted for the general information of our shareholders. The report is not authorized for distribution to prospective investors unless preceded or accompanied by an effective prospectus. | |
| | | |
©2014 American Century Proprietary Holdings, Inc. All rights reserved.
CL-ANN-82095 1405
| |
|
| |
ANNUAL REPORT | MARCH 31, 2014 |
NT Large Company Value Fund
|
| |
| President’s Letter | |
| Performance | |
| Portfolio Commentary | |
| Fund Characteristics | |
| Shareholder Fee Example | |
| Schedule of Investments | |
| Statement of Assets and Liabilities | |
| Statement of Operations | |
| Statement of Changes in Net Assets | |
| Notes to Financial Statements | |
| Financial Highlights | |
| Report of Independent Registered Public Accounting Firm | |
| Management | |
| Additional Information | |
Any opinions expressed in this report reflect those of the author as of the date of the report, and do not necessarily represent the opinions of American Century Investments® or any other person in the American Century Investments organization. Any such opinions are subject to change at any time based upon market or other conditions and American Century Investments disclaims any responsibility to update such opinions. These opinions may not be relied upon as investment advice and, because investment decisions made by American Century Investments funds are based on numerous factors, may not be relied upon as an indication of trading intent on behalf of any American Century Investments fund. Security examples are used for representational purposes only and are not intended as recommendations to purchase or sell securities. Performance information for comparative indices and securities is provided to American Century Investments by third party vendors. To the best of American Century Investments’ knowledge, such information is accurate at the time of printing.
|
| |
| Dear Investor:
Thank you for reviewing this annual report for the 12 months ended March 31, 2014. It provides investment performance, market analysis, and portfolio information, presented with the expert perspective of our portfolio management team.
Annual reports remain important vehicles for conveying information about fund returns, including key factors that affected fund performance. For additional, updated investment and market insights, we encourage you to visit our website, americancentury.com.
|
| Jonathan Thomas |
Monetary Policy-Driven, Mostly “Risk-On” Results in the U.S. and Europe
Stimulative monetary policies and expectations of economic improvement helped drive financial market returns during the reporting period. We believe the combination of optimism about the economy, low costs of capital in the money markets, and central bank purchases of longer-maturity fixed income securities (quantitative easing, or QE) helped persuade investors to seek risk and yield, especially in the U.S. and Europe. Stock index returns were strong in these markets, particularly at the smaller capitalization end of the company size spectrum. The MSCI Europe and S&P 500 Indices advanced 24.50% and 21.86%, respectively, and their smaller capitalization counterparts performed even better. In the U.S., growth stocks generally outperformed value stocks.
Some of the same growth and optimism factors that drove stocks higher, plus hints that QE tapering would begin in the U.S., hampered U.S. government bond returns, which dipped into negative territory for the reporting period. On the other hand, U.S. corporate bonds, especially high-yield corporates, posted mostly positive returns because of their higher yields, declining spreads (yield differences between corporate and similar-maturity U.S. Treasury securities), and relatively low default rates. At the other end of the U.S. bond spectrum, Treasury inflation-protected securities (TIPS) underperformed, hurt by the combination of rising yields and low inflation.
Looking ahead, we see further signs of economic improvement for the U.S. in 2014, but headwinds persist. Interest rates could normalize further, and economic growth and U.S. employment levels remain subpar compared with past post-recession periods. In this environment, we continue to believe in a disciplined, diversified, long-term investment approach, using professionally managed stock and bond portfolios—as appropriate—for meeting financial goals. We appreciate your continued trust in us.
Sincerely,
Jonathan Thomas
President and Chief Executive Officer
American Century Investments
|
| | | | | |
| Total Returns as of March 31, 2014 |
| | | | Average Annual Returns | |
| | Ticker Symbol | 1 year | 5 years | Since Inception | Inception Date |
| Institutional Class | ACLLX | 21.75% | 20.07% | 5.25% | 5/12/06 |
| Russell 1000 Value Index | — | 21.57% | 21.74% | 6.12% | — |
| S&P 500 Index | — | 21.86% | 21.14% | 7.09% | — |
| R6 Class | ACDLX | — | — | 9.83%(1) | 7/26/13 |
| |
| (1) | Total returns for periods less than one year are not annualized. |
Data presented reflect past performance. Past performance is no guarantee of future results. Current performance may be higher or lower than the performance shown. Investment return and principal value will fluctuate, and redemption value may be more or less than original cost. To obtain performance data current to the most recent month end, please call 1-800-345-2021 or visit americancentury.com.
Unless otherwise indicated, performance reflects Institutional Class shares; performance for other share classes will vary due to differences in fee structure. For information about other share classes available, please consult the prospectus. Data assumes reinvestment of dividends and capital gains, and none of the charts reflect the deduction of taxes that a shareholder would pay on fund distributions or the redemption of fund shares. Returns for the indices are provided for comparison. The fund’s total returns include operating expenses (such as transaction costs and management fees) that reduce returns, while the total returns of the indices do not.
|
|
| Growth of $10,000 Over Life of Class |
| $10,000 investment made May 12, 2006 |
| |
| * | From 5/12/06, the Institutional Class's inception date. Not annualized. |
|
| | |
| Total Annual Fund Operating Expenses |
| Institutional Class | | R6 Class |
| 0.67% | | 0.52% |
The total annual fund operating expenses shown is as stated in the fund’s prospectus current as of the date of this report. The prospectus may vary from the expense ratio shown elsewhere in this report because it is based on a different time period, includes acquired fund fees and expenses, and, if applicable, does not include fee waivers or expense reimbursements.
Data presented reflect past performance. Past performance is no guarantee of future results. Current performance may be higher or lower than the performance shown. Investment return and principal value will fluctuate, and redemption value may be more or less than original cost. To obtain performance data current to the most recent month end, please call 1-800-345-2021 or visit americancentury.com.
Unless otherwise indicated, performance reflects Institutional Class shares; performance for other share classes will vary due to differences in fee structure. For information about other share classes available, please consult the prospectus. Data assumes reinvestment of dividends and capital gains, and none of the charts reflect the deduction of taxes that a shareholder would pay on fund distributions or the redemption of fund shares. Returns for the indices are provided for comparison. The fund’s total returns include operating expenses (such as transaction costs and management fees) that reduce returns, while the total returns of the indices do not.
Portfolio Managers: Brendan Healy and Matt Titus
Performance Summary
NT Large Company Value returned 21.75%* for the 12 months ended March 31, 2014. By comparison, its benchmark, the Russell 1000 Value Index, returned 21.57%. The broader market, as measured by the S&P 500 Index, returned 21.86%. The portfolio’s return reflects operating expenses, while the indices’ returns do not.
The U.S. stock market generated strong gains during the one-year reporting period. When the period began, riskier asset classes led the market, as the Federal Reserve’s (Fed) bond-buying programs continued. Market leadership changed after the Fed suggested it might start tapering its asset purchases if economic conditions improved. Higher-quality stocks came into favor and as interest rates rose, higher-yielding stocks, such as real estate investment trusts (REITs) and utilities, declined. As the Fed sought to calm fears about eventual tapering, riskier stocks posted gains, but they reversed direction in mid-August on positive economic data, which suggested the Fed might announce tapering as soon as September. After the Fed surprised the markets by making no changes to its stimulus programs, lower-quality, riskier stocks rallied and continued to outperform through the end of 2013. In December, the U.S. economy showed new signs of strength and the Fed announced it would begin modestly scaling back its asset purchases in January 2014. As interest rates trended down in the last three months of the reporting period, yield-oriented securities, including utilities and REITs, rallied. For the reporting period overall, riskier, lower-yielding, and lower-quality stocks outperformed. Though value stocks recorded significant gains, they underperformed growth stocks. Large-cap value stocks underperformed both mid-cap value stocks and small-cap value stocks. In this environment, the portfolio received positive results in absolute terms from all 10 of the sectors in which it was invested. It also outperformed its benchmark.
Financials Added Most to Relative Returns
In financials, advantageous subsector allocation and security selection added to relative performance. The portfolio was significantly underweight REITs, which we have considered generally overvalued for some time. REITs underperformed as interest rates increased. Within capital markets, the portfolio had an overweight position relative to the benchmark in Ameriprise Financial. The company, which has a solid return on capital, benefited from the strength of the equity market. At the end of the reporting period, we still considered its valuation attractive. In the insurance industry, the portfolio benefited from an overweight position in MetLife. The company, which announced a dividend increase, gained some clarity on the regulatory front and is likely to earn a higher yield on its investible assets resulting from higher interest rates.
Underweight Position in Utilities Contributed Positively
An underweight position in utilities added to relative returns, as interest rates began to increase during the reporting period and utilities—which are sensitive to changes in rates—posted the second-weakest performance in the benchmark. For some time, we have considered many of these stocks overvalued.
*All fund returns referenced in this commentary are for Institutional Class shares.
Energy Generated Positive Returns
Security selection in the energy sector, especially in the energy equipment and services industry, contributed positively. Among large integrated energy companies, the portfolio benefited from an investment in Total SA. The French oil and gas company outperformed its European peers. Conversely, the portfolio was hampered by an overweight position in Chevron, which trailed some of its peers, including Exxon Mobil.
Information Technology Provided Notable Contributors
In the information technology sector, a top contributor was Microsoft, which announced solid earnings against low expectations. Microsoft’s enterprise software division has continued to perform well and at the end of the reporting period, we still considered the stock undervalued. An overweight position in Applied Materials was also advantageous. The company is benefiting as its customers increase capital equipment spending on new technology, such as 3D memory. Applied Materials is widely expected to see strong profit margin improvement and earnings growth as a result of its proposed acquisition of Tokyo Electron.
Consumer Discretionary Detracted from Results
Security selection in the consumer discretionary sector dampened results. The portfolio was overweight Target, which reported weak comparable-store sales. Target also had weaker-than-expected sales from its expansion into the Canadian market.
Telecommunication Services and Health Care Slowed Relative Performance
The portfolio was hampered by its lack of exposure to wireless telecommunication services, an industry segment that generated strong gains in the benchmark.
Although the portfolio benefited from an overweight position in health care, it was hindered by security selection. It did not hold any stocks in the life sciences tools and services industry, which performed well in the benchmark.
Industrials Supplied Top Detractor
In the industrials sector, which added to relative performance overall, an overweight position in ADT detracted. The stock declined on concerns about the security monitoring company’s growth, which has slowed because of a drop in new subscribers and higher-than-anticipated customer churn. Investors may also be reacting to the favorable treatment of a shareholder activist, who liquidated a large position in late 2013. We still view ADT as undervalued.
Outlook
We continue to be bottom-up investment managers, evaluating each company individually and building the portfolio one stock at a time. As of March 31, 2014, we saw attractive opportunities in energy, information technology, and consumer discretionary, as reflected by the portfolio’s overweight positions in these sectors. Conversely, smaller relative weightings were given to the utilities and telecommunication services sectors. We are still finding greater value opportunities among mega-cap stocks and have maintained the portfolio’s bias toward them.
|
| |
| MARCH 31, 2014 |
| Top Ten Holdings | % of net assets |
| Chevron Corp. | 4.2% |
| JPMorgan Chase & Co. | 4.0% |
| Johnson & Johnson | 3.6% |
| Wells Fargo & Co. | 3.2% |
| Exxon Mobil Corp. | 3.0% |
| Pfizer, Inc. | 2.5% |
| General Electric Co. | 2.3% |
| Merck & Co., Inc. | 2.3% |
| Citigroup, Inc. | 2.1% |
| U.S. Bancorp | 2.1% |
| | |
| Top Five Industries | % of net assets |
| Commercial Banks | 15.1% |
| Oil, Gas and Consumable Fuels | 12.7% |
| Pharmaceuticals | 8.4% |
| Insurance | 6.1% |
| Capital Markets | 4.6% |
| | |
| Types of Investments in Portfolio | % of net assets |
| Common Stocks | 99.0% |
| Exchange-Traded Funds | 0.5% |
| Total Equity Exposure | 99.5% |
| Temporary Cash Investments | 0.7% |
| Other Assets and Liabilities | (0.2)% |
Fund shareholders may incur two types of costs: (1) transaction costs, including sales charges (loads) on purchase payments and redemption/exchange fees; and (2) ongoing costs, including management fees; distribution and service (12b-1) fees; and other fund expenses. This example is intended to help you understand your ongoing costs (in dollars) of investing in your fund and to compare these costs with the ongoing cost of investing in other mutual funds.
The example is based on an investment of $1,000 made at the beginning of the period and held for the entire period from October 1, 2013 to March 31, 2014.
Actual Expenses
The table provides information about actual account values and actual expenses for each class. You may use the information, together with the amount you invested, to estimate the expenses that you paid over the period. First, identify the share class you own. Then simply divide your account value by $1,000 (for example, an $8,600 account value divided by $1,000 = 8.6), then multiply the result by the number under the heading “Expenses Paid During Period” to estimate the expenses you paid on your account during this period.
If you hold Investor Class shares of any American Century Investments fund, or Institutional Class shares of the American Century Diversified Bond Fund, in an American Century Investments account (i.e., not a financial intermediary or retirement plan account), American Century Investments may charge you a $12.50 semiannual account maintenance fee if the value of those shares is less than $10,000. We will redeem shares automatically in one of your accounts to pay the $12.50 fee. In determining your total eligible investment amount, we will include your investments in all personal accounts (including American Century Investments Brokerage accounts) registered under your Social Security number. Personal accounts include individual accounts, joint accounts, UGMA/UTMA accounts, personal trusts, Coverdell Education Savings Accounts and IRAs (including traditional, Roth, Rollover, SEP-, SARSEP- and SIMPLE-IRAs), and certain other retirement accounts. If you have only business, business retirement, employer-sponsored or American Century Investments Brokerage accounts, you are currently not subject to this fee. If you are subject to the Account Maintenance Fee, your account value could be reduced by the fee amount.
Hypothetical Example for Comparison Purposes
The table also provides information about hypothetical account values and hypothetical expenses based on the actual expense ratio of each class of your fund and an assumed rate of return of 5% per year before expenses, which is not the actual return of a fund’s share class. The hypothetical account values and expenses may not be used to estimate the actual ending account balance or expenses you paid for the period. You may use this information to compare the ongoing costs of investing in your fund and other funds. To do so, compare this 5% hypothetical example with the 5% hypothetical examples that appear in the shareholder reports of the other funds.
Please note that the expenses shown in the table are meant to highlight your ongoing costs only and do not reflect any transactional costs, such as sales charges (loads) or redemption/exchange fees. Therefore, the table is useful in comparing ongoing costs only, and will not help you determine the relative total costs of owning different funds. In addition, if these transactional costs were included, your costs would have been higher.
|
| | | | |
| | Beginning
Account Value
10/1/13 | Ending
Account Value
3/31/14 | Expenses Paid
During Period(1)
10/1/13 - 3/31/14 | Annualized
Expense Ratio(1) |
| Actual | | | | |
| Institutional Class | $1,000 | $1,122.00 | $3.44 | 0.65% |
| R6 Class | $1,000 | $1,122.90 | $2.65 | 0.50% |
| Hypothetical | | | | |
| Institutional Class | $1,000 | $1,021.69 | $3.28 | 0.65% |
| R6 Class | $1,000 | $1,022.44 | $2.52 | 0.50% |
| |
| (1) | Expenses are equal to the class's annualized expense ratio listed in the table above, multiplied by the average account value over the period, multiplied by 182, the number of days in the most recent fiscal half-year, divided by 365, to reflect the one-half year period. |
MARCH 31, 2014
|
| | | | |
| | Shares | Value |
| COMMON STOCKS — 99.0% |
| AEROSPACE AND DEFENSE — 2.9% |
| General Dynamics Corp. | 112,900 | $ | 12,297,068 |
|
| Honeywell International, Inc. | 113,000 | 10,481,880 |
|
| Raytheon Co. | 78,900 | 7,794,531 |
|
| Textron, Inc. | 224,700 | 8,828,463 |
|
| | | 39,401,942 |
|
| AIRLINES — 0.4% | |
| Southwest Airlines Co. | 209,800 | 4,953,378 |
|
| AUTOMOBILES — 1.2% | |
| Ford Motor Co. | 1,003,600 | 15,656,160 |
|
| BEVERAGES — 0.6% | |
| PepsiCo, Inc. | 104,100 | 8,692,350 |
|
| BIOTECHNOLOGY — 0.6% | |
| Amgen, Inc. | 39,300 | 4,847,262 |
|
Gilead Sciences, Inc.(1) | 37,500 | 2,657,250 |
|
| | | 7,504,512 |
|
| BUILDING PRODUCTS — 0.5% |
| Masco Corp. | 304,400 | 6,760,724 |
|
| CAPITAL MARKETS — 4.6% |
| Ameriprise Financial, Inc. | 126,800 | 13,956,876 |
|
| Bank of New York Mellon Corp. (The) | 260,300 | 9,185,987 |
|
| BlackRock, Inc. | 40,800 | 12,830,784 |
|
| Goldman Sachs Group, Inc. (The) | 113,000 | 18,515,050 |
|
| Morgan Stanley | 216,000 | 6,732,720 |
|
| | | 61,221,417 |
|
| CHEMICALS — 1.2% |
| E.I. du Pont de Nemours & Co. | 100,300 | 6,730,130 |
|
LyondellBasell Industries NV, Class A | 102,600 | 9,125,244 |
|
| | | 15,855,374 |
|
| COMMERCIAL BANKS — 15.1% |
| Bank of America Corp. | 1,066,800 | 18,348,960 |
|
| Citigroup, Inc. | 595,700 | 28,355,320 |
|
| JPMorgan Chase & Co. | 877,800 | 53,291,238 |
|
| KeyCorp | 479,500 | 6,828,080 |
|
|
| | | | |
| | Shares | Value |
| PNC Financial Services Group, Inc. (The) | 274,200 | $ | 23,855,400 |
|
| U.S. Bancorp | 656,600 | 28,141,876 |
|
| Wells Fargo & Co. | 867,800 | 43,164,372 |
|
| | | 201,985,246 |
|
| COMMERCIAL SERVICES AND SUPPLIES — 0.6% |
| ADT Corp. (The) | 140,400 | 4,204,980 |
|
| Tyco International Ltd. | 105,700 | 4,481,680 |
|
| | | 8,686,660 |
|
| COMMUNICATIONS EQUIPMENT — 2.5% |
| Cisco Systems, Inc. | 634,000 | 14,207,940 |
|
F5 Networks, Inc.(1) | 22,700 | 2,420,501 |
|
| QUALCOMM, Inc. | 218,500 | 17,230,910 |
|
| | | 33,859,351 |
|
| COMPUTERS AND PERIPHERALS — 1.3% |
| Apple, Inc. | 13,500 | 7,245,990 |
|
| NetApp, Inc. | 260,600 | 9,616,140 |
|
| | | 16,862,130 |
|
| CONSUMER FINANCE — 1.0% |
| Capital One Financial Corp. | 171,700 | 13,248,372 |
|
| DIVERSIFIED FINANCIAL SERVICES — 2.0% |
Berkshire Hathaway, Inc., Class B(1) | 216,000 | 26,993,520 |
|
| DIVERSIFIED TELECOMMUNICATION SERVICES — 1.3% |
| AT&T, Inc. | 251,600 | 8,823,612 |
|
| CenturyLink, Inc. | 252,900 | 8,305,236 |
|
| | | 17,128,848 |
|
| ELECTRIC UTILITIES — 3.6% |
| American Electric Power Co., Inc. | 214,000 | 10,841,240 |
|
| Pinnacle West Capital Corp. | 157,900 | 8,630,814 |
|
| PPL Corp. | 293,500 | 9,726,590 |
|
| Westar Energy, Inc. | 248,200 | 8,726,712 |
|
| Xcel Energy, Inc. | 331,900 | 10,076,484 |
|
| | | 48,001,840 |
|
| ELECTRICAL EQUIPMENT — 1.4% |
| Eaton Corp. plc | 251,000 | 18,855,120 |
|
| ENERGY EQUIPMENT AND SERVICES — 2.9% |
| Halliburton Co. | 262,100 | 15,435,069 |
|
|
| | | | |
| | Shares | Value |
| National Oilwell Varco, Inc. | 144,900 | $ | 11,283,363 |
|
| Schlumberger Ltd. | 125,100 | 12,197,250 |
|
| | | 38,915,682 |
|
| FOOD AND STAPLES RETAILING — 2.0% |
| CVS Caremark Corp. | 252,800 | 18,924,608 |
|
| Kroger Co. (The) | 167,200 | 7,298,280 |
|
| | | 26,222,888 |
|
| HEALTH CARE EQUIPMENT AND SUPPLIES — 3.3% |
| Abbott Laboratories | 467,300 | 17,995,723 |
|
| Medtronic, Inc. | 423,600 | 26,068,344 |
|
| | | 44,064,067 |
|
| HEALTH CARE PROVIDERS AND SERVICES — 1.9% |
| Aetna, Inc. | 146,900 | 11,013,093 |
|
| Quest Diagnostics, Inc. | 79,300 | 4,593,056 |
|
| WellPoint, Inc. | 104,600 | 10,412,930 |
|
| | | 26,019,079 |
|
| HOTELS, RESTAURANTS AND LEISURE — 0.6% |
| Carnival Corp. | 140,100 | 5,304,186 |
|
Hilton Worldwide Holdings, Inc.(1) | 110,100 | 2,448,624 |
|
| Marriott International, Inc., Class A | 14,400 | 806,688 |
|
| | | 8,559,498 |
|
| HOUSEHOLD PRODUCTS — 2.0% |
| Procter & Gamble Co. (The) | 330,000 | 26,598,000 |
|
| INDUSTRIAL CONGLOMERATES — 2.3% |
| General Electric Co. | 1,201,400 | 31,104,246 |
|
| INSURANCE — 6.1% |
| Allstate Corp. (The) | 267,000 | 15,106,860 |
|
| American International Group, Inc. | 262,200 | 13,112,622 |
|
| Chubb Corp. (The) | 67,700 | 6,045,610 |
|
| MetLife, Inc. | 322,500 | 17,028,000 |
|
| Principal Financial Group, Inc. | 97,600 | 4,488,624 |
|
| Prudential Financial, Inc. | 139,000 | 11,766,350 |
|
| Travelers Cos., Inc. (The) | 162,700 | 13,845,770 |
|
| | | 81,393,836 |
|
| MACHINERY — 1.5% |
| Ingersoll-Rand plc | 157,700 | 9,026,748 |
|
| PACCAR, Inc. | 170,200 | 11,478,288 |
|
| | | 20,505,036 |
|
|
| | | | |
| | Shares | Value |
| MEDIA — 2.9% | | |
| CBS Corp., Class B | 46,900 | $ | 2,898,420 |
|
CBS Outdoor Americas, Inc.(1) | 31,707 | 927,430 |
|
Comcast Corp., Class A | 251,200 | 12,565,024 |
|
| Time Warner Cable, Inc. | 40,000 | 5,487,200 |
|
| Time Warner, Inc. | 269,100 | 17,580,303 |
|
| | | 39,458,377 |
|
| METALS AND MINING — 1.0% |
| Freeport-McMoRan Copper & Gold, Inc. | 415,100 | 13,727,357 |
|
| MULTILINE RETAIL — 2.2% |
| Macy's, Inc. | 238,200 | 14,122,878 |
|
| Nordstrom, Inc. | 52,600 | 3,284,870 |
|
| Target Corp. | 204,800 | 12,392,448 |
|
| | | 29,800,196 |
|
| OIL, GAS AND CONSUMABLE FUELS — 12.7% |
| Apache Corp. | 102,900 | 8,535,555 |
|
| Chevron Corp. | 474,700 | 56,446,577 |
|
| Exxon Mobil Corp. | 418,300 | 40,859,544 |
|
| Imperial Oil Ltd. | 87,800 | 4,088,597 |
|
| Marathon Petroleum Corp. | 88,000 | 7,659,520 |
|
Oasis Petroleum, Inc.(1) | 176,800 | 7,377,864 |
|
| Occidental Petroleum Corp. | 269,000 | 25,633,010 |
|
| Total SA ADR | 311,400 | 20,427,840 |
|
| | | 171,028,507 |
|
| PAPER AND FOREST PRODUCTS — 0.6% |
| International Paper Co. | 182,700 | 8,382,276 |
|
| PHARMACEUTICALS — 8.4% |
| Johnson & Johnson | 488,400 | 47,975,532 |
|
| Merck & Co., Inc. | 545,300 | 30,956,681 |
|
| Pfizer, Inc. | 1,070,600 | 34,387,672 |
|
| | | 113,319,885 |
|
| REAL ESTATE INVESTMENT TRUSTS (REITs) — 0.7% |
| Brixmor Property Group, Inc. | 224,500 | 4,788,585 |
|
| Camden Property Trust | 63,400 | 4,269,356 |
|
| | | 9,057,941 |
|
| SEMICONDUCTORS AND SEMICONDUCTOR EQUIPMENT — 2.6% |
| Applied Materials, Inc. | 753,200 | 15,380,344 |
|
| Intel Corp. | 223,800 | 5,776,278 |
|
|
| | | | |
| | Shares | Value |
| Microchip Technology, Inc. | 297,400 | $ | 14,203,824 |
|
| | | 35,360,446 |
|
| SOFTWARE — 3.7% |
Electronic Arts, Inc.(1) | 360,000 | 10,443,600 |
|
| Microsoft Corp. | 510,300 | 20,917,197 |
|
| Oracle Corp. | 442,200 | 18,090,402 |
|
| | | 49,451,199 |
|
| SPECIALTY RETAIL — 0.5% |
| Lowe's Cos., Inc. | 125,600 | 6,141,840 |
|
| TRADING COMPANIES AND DISTRIBUTORS — 0.3% |
United Rentals, Inc.(1) | 36,100 | 3,427,334 |
|
TOTAL COMMON STOCKS (Cost $978,917,616) | 1,328,204,634 |
|
| EXCHANGE-TRADED FUNDS — 0.5% |
SPDR S&P 500 ETF Trust
(Cost $5,477,182) | 38,900 | 7,275,856 |
|
| TEMPORARY CASH INVESTMENTS — 0.7% |
| Repurchase Agreement, Bank of America Merrill Lynch, (collateralized by various U.S. Treasury obligations, 0.75% - 1.375%, 10/31/17 - 6/30/18, valued at $1,817,259), in a joint trading account at 0.03%, dated 3/31/14, due 4/1/14 (Delivery value $1,780,522) | 1,780,521 |
|
|
| | | | |
| | Shares | Value |
| Repurchase Agreement, Goldman Sachs & Co., (collateralized by various U.S. Treasury obligations, 4.25%, 8/15/15, valued at $1,598,345), in a joint trading account at 0.03%, dated 3/31/14, due 4/1/14 (Delivery value $1,566,860) | $ | 1,566,859 |
|
| SSgA U.S. Government Money Market Fund | 6,036,731 | 6,036,731 |
|
TOTAL TEMPORARY CASH INVESTMENTS (Cost $9,384,111) | 9,384,111 |
|
TOTAL INVESTMENT SECURITIES — 100.2% (Cost $993,778,909) | 1,344,864,601 |
|
| OTHER ASSETS AND LIABILITIES — (0.2)% | (3,141,436 | ) |
| TOTAL NET ASSETS — 100.0% | | $ | 1,341,723,165 |
|
|
| | | | | | | | | | |
| FORWARD FOREIGN CURRENCY EXCHANGE CONTRACTS |
| Currency Purchased | Currency Sold | Counterparty | Settlement Date | Unrealized Appreciation
(Depreciation) |
| USD | 1,612,113 |
| CAD | 1,801,536 |
| JPMorgan Chase Bank N.A. | 4/30/14 | $ | (16,403 | ) |
| USD | 542,520 |
| CAD | 602,346 |
| JPMorgan Chase Bank N.A. | 4/30/14 | (1,977 | ) |
| USD | 526,932 |
| CAD | 583,239 |
| JPMorgan Chase Bank N.A. | 4/30/14 | (292 | ) |
| USD | 535,694 |
| CAD | 590,904 |
| JPMorgan Chase Bank N.A. | 4/30/14 | 1,541 |
|
| USD | 17,923,484 |
| EUR | 12,996,508 |
| UBS AG | 4/30/14 | 19,942 |
|
| USD | 496,022 |
| EUR | 360,764 |
| UBS AG | 4/30/14 | (954 | ) |
| | | | | | | $ | 1,857 |
|
|
| | |
| Notes to Schedule of Investments |
| ADR | - | American Depositary Receipt |
| CAD | - | Canadian Dollar |
| EUR | - | Euro |
| USD | - | United States Dollar |
See Notes to Financial Statements.
|
|
| Statement of Assets and Liabilities |
|
| | | |
| MARCH 31, 2014 | |
| Assets | |
| Investment securities, at value (cost of $993,778,909) | $ | 1,344,864,601 |
|
| Foreign currency holdings, at value (cost of $66,881) | 67,347 |
|
| Receivable for investments sold | 2,694,624 |
|
| Receivable for capital shares sold | 78,168 |
|
| Unrealized appreciation on forward foreign currency exchange contracts | 21,483 |
|
| Dividends and interest receivable | 1,811,374 |
|
| | 1,349,537,597 |
|
| | |
| Liabilities | |
| Payable for investments purchased | 3,461,483 |
|
| Payable for capital shares redeemed | 3,608,536 |
|
| Unrealized depreciation on forward foreign currency exchange contracts | 19,626 |
|
| Accrued management fees | 724,787 |
|
| | 7,814,432 |
|
| | |
| Net Assets | $ | 1,341,723,165 |
|
| | |
| | |
| Net Assets Consist of: | |
| Capital (par value and paid-in surplus) | $ | 983,662,356 |
|
| Undistributed net investment income | 1,616,272
|
|
| Undistributed net realized gain | 5,356,084
|
|
| Net unrealized appreciation | 351,088,453 |
|
| | $ | 1,341,723,165 |
|
|
| | | | | | |
| | Net Assets | Shares Outstanding | Net Asset Value Per Share |
| Institutional Class, $0.01 Par Value |
| $1,324,950,963 |
| 108,810,560 |
| $12.18 |
| R6 Class, $0.01 Par Value |
| $16,772,202 |
| 1,377,130 |
| $12.18 |
See Notes to Financial Statements.
|
| | | |
| YEAR ENDED MARCH 31, 2014 | |
| Investment Income (Loss) | |
| Income: | |
| Dividends (net of foreign taxes withheld of $126,614) | $ | 27,696,921 |
|
| Interest | 3,149 |
|
| | 27,700,070 |
|
| | |
| Expenses: | |
| Management fees | 7,312,172 |
|
| Directors' fees and expenses | 27,122 |
|
| Other expenses | 584 |
|
| | 7,339,878 |
|
| | |
| Net investment income (loss) | 20,360,192 |
|
| | |
| Realized and Unrealized Gain (Loss) | |
| Net realized gain (loss) on: | |
| Investment transactions | 55,738,407 |
|
| Foreign currency transactions | (982,899) |
|
| | 54,755,508 |
|
| | |
| Change in net unrealized appreciation (depreciation) on: | |
| Investments | 146,272,924 |
|
| Translation of assets and liabilities in foreign currencies | (68,547) |
|
| | 146,204,377 |
|
| | |
| Net realized and unrealized gain (loss) | 200,959,885 |
|
| | |
| Net Increase (Decrease) in Net Assets Resulting from Operations | $ | 221,320,077 |
|
See Notes to Financial Statements.
|
|
| Statement of Changes in Net Assets |
|
| | | | | | |
| YEARS ENDED MARCH 31, 2014 AND MARCH 31, 2013 |
| Increase (Decrease) in Net Assets | March 31, 2014 | March 31, 2013 |
| Operations | | |
| Net investment income (loss) | $ | 20,360,192 |
| $ | 15,385,480 |
|
| Net realized gain (loss) | 54,755,508 |
| 14,161,871 |
|
| Change in net unrealized appreciation (depreciation) | 146,204,377 |
| 93,549,748 |
|
| Net increase (decrease) in net assets resulting from operations | 221,320,077 |
| 123,097,099 |
|
| | | |
| Distributions to Shareholders | | |
| From net investment income: | | |
| Institutional Class | (19,576,005) |
| (15,210,513) |
|
| R6 Class | (107,447) |
| — |
|
| From net realized gains: | | |
| Institutional Class | (31,180,355) |
| (9,326,338) |
|
| R6 Class | (265,443) |
| — |
|
| Decrease in net assets from distributions | (51,129,250) |
| (24,536,851) |
|
| | | |
| Capital Share Transactions | | |
Net increase (decrease) in net assets from capital share transactions | 229,631,692 |
| 174,696,501 |
|
| | | |
| Net increase (decrease) in net assets | 399,822,519 |
| 273,256,749 |
|
| | | |
| Net Assets | | |
| Beginning of period | 941,900,646 |
| 668,643,897 |
|
| End of period | $ | 1,341,723,165 |
| $ | 941,900,646 |
|
| | | |
| Undistributed net investment income | $ | 1,616,272 |
| $ | 905,312 |
|
See Notes to Financial Statements.
|
|
| Notes to Financial Statements |
MARCH 31, 2014
1. Organization
American Century Capital Portfolios, Inc. (the corporation) is registered under the Investment Company Act of 1940, as amended (the 1940 Act), as an open-end management investment company and is organized as a Maryland corporation. NT Large Company Value Fund (the fund) is one fund in a series issued by the corporation. The fund is diversified as defined under the 1940 Act. The fund’s investment objective is to seek long-term capital growth. Income is a secondary objective. The fund is not permitted to invest in securities issued by companies assigned the Global Industry Classification Standard for the tobacco industry.
The fund offers the Institutional Class and the R6 Class, which have different fees and expenses. The difference in the fee structures between the classes is not the result of any difference in advisory or custodial fees or other expenses related to management of the fund’s assets, which do not vary by class. The fund’s R6 Class shares are available for purchase exclusively by certain American Century Investments funds of funds that are offered only through employer-sponsored retirement plans where a financial intermediary provides retirement recordkeeping services to plan participants. Because financial intermediaries do not receive any service, distribution or administrative fees for offering such funds of funds, American Century Investment Management, Inc. (ACIM) (the investment advisor) is able to charge the R6 Class a lower unified management fee. Sale of the R6 Class commenced on July 26, 2013.
2. Significant Accounting Policies
The following is a summary of significant accounting policies consistently followed by the fund in preparation of its financial statements. The financial statements are prepared in conformity with accounting principles generally accepted in the United States of America, which may require management to make certain estimates and assumptions at the date of the financial statements. Actual results could differ from these estimates.
Investment Valuations — The fund determines the fair value of its investments and computes its net asset value per share at the close of regular trading (usually 4 p.m. Eastern time) on the New York Stock Exchange (NYSE) on each day the NYSE is open. The Board of Directors has adopted valuation policies and procedures to guide the investment advisor in the fund’s investment valuation process and to provide methodologies for the oversight of the fund’s pricing function.
Equity securities that are listed or traded on a domestic securities exchange are valued at the last reported sales price or at the official closing price as provided by the exchange. Equity securities traded on foreign securities exchanges are generally valued at the closing price of such securities on the exchange where primarily traded or at the close of the NYSE, if that is earlier. If no last sales price is reported, or if local convention or regulation so provides, the mean of the latest bid and asked prices may be used. Securities traded over-the-counter are valued at the mean of the latest bid and asked prices, the last sales price, or the official closing price. Equity securities initially expressed in local currencies are translated into U.S. dollars at the mean of the appropriate currency exchange rate at the close of the NYSE as provided by an independent pricing service.
Fixed income securities maturing within 60 days at the time of purchase may be valued at cost, plus or minus any amortized discount or premium or at the evaluated mean as provided by an independent pricing service. Evaluated mean prices are commonly derived through utilization of market models, which may consider, among other factors: trade data, quotations from dealers and active market makers, relevant yield curve and spread data, related sector levels, creditworthiness, trade data or market information on comparable securities, and other relevant security specific information.
Open-end management investment companies are valued at the reported net asset value per share. Repurchase agreements are valued at cost, which approximates fair value. Forward foreign currency exchange contracts are valued at the mean of the appropriate forward exchange rate at the close of the NYSE as provided by an independent pricing service.
If the fund determines that the market price for an investment is not readily available or the valuation methods mentioned above do not reflect an investment’s fair value, such investment is valued as determined in good faith by the Board of Directors or its delegate, in accordance with policies and procedures adopted by the
Board of Directors. In its determination of fair value, the fund may review several factors including, but not limited to, market information regarding the specific investment or comparable investments and correlation with other investment types, futures indices or general market indicators. Circumstances that may cause the fund to use these procedures to value an investment include, but are not limited to: an investment has been declared in default or is distressed; trading in a security has been suspended during the trading day or a security is not actively trading on its principal exchange; prices received from a regular pricing source are deemed unreliable; or there is a foreign market holiday and no trading occurred.
The fund monitors for significant events occurring after the close of an investment’s primary exchange but before the fund’s net asset value per share is determined. Significant events may include, but are not limited to: corporate announcements and transactions; governmental action and political unrest that could impact a specific investment or an investment sector; or armed conflicts, natural disasters and similar events that could affect investments in a specific country or region. The fund also monitors for significant fluctuations between domestic and foreign markets, as evidenced by the U.S. market or such other indicators that the Board of Directors, or its delegate, deems appropriate. If significant fluctuations in foreign markets are identified, the fund may apply a model-derived factor to the closing price of equity securities traded on foreign securities exchanges. The factor is based on observable market data as provided by an independent pricing service.
Security Transactions — Security transactions are accounted for as of the trade date. Net realized gains and losses are determined on the identified cost basis, which is also used for federal income tax purposes.
Investment Income — Dividend income less foreign taxes withheld, if any, is recorded as of the ex-dividend date. Distributions received on securities that represent a return of capital or long-term capital gain are recorded as a reduction of cost of investments and/or as a realized gain. The fund may estimate the components of distributions received that may be considered nontaxable distributions or long-term capital gain distributions for income tax purposes. Interest income is recorded on the accrual basis and includes accretion of discounts and amortization of premiums.
Foreign Currency Translations — All assets and liabilities initially expressed in foreign currencies are translated into U.S. dollars at prevailing exchange rates at period end. The fund may enter into spot foreign currency exchange contracts to facilitate transactions denominated in a foreign currency. Purchases and sales of investment securities, dividend and interest income, spot foreign currency exchange contracts, and expenses are translated at the rates of exchange prevailing on the respective dates of such transactions. Net realized and unrealized foreign currency exchange gains or losses related to investment securities are a component of net realized gain (loss) on investment transactions and change in net unrealized appreciation (depreciation) on investments, respectively.
Repurchase Agreements — The fund may enter into repurchase agreements with institutions that ACIM has determined are creditworthy pursuant to criteria adopted by the Board of Directors. The fund requires that the collateral, represented by securities, received in a repurchase transaction be transferred to the custodian in a manner sufficient to enable the fund to obtain those securities in the event of a default under the repurchase agreement. ACIM monitors, on a daily basis, the securities transferred to ensure the value, including accrued interest, of the securities under each repurchase agreement is equal to or greater than amounts owed to the fund under each repurchase agreement.
Joint Trading Account — Pursuant to an Exemptive Order issued by the Securities and Exchange Commission, the fund, along with certain other funds in the American Century Investments family of funds, may transfer uninvested cash balances into a joint trading account. These balances are invested in one or more repurchase agreements that are collateralized by U.S. Treasury or Agency obligations.
Income Tax Status — It is the fund’s policy to distribute substantially all net investment income and net realized gains to shareholders and to otherwise qualify as a regulated investment company under provisions of the Internal Revenue Code. Accordingly, no provision has been made for income taxes. The fund files U.S. federal, state, local and non-U.S. tax returns as applicable. The fund's tax returns are subject to examination by the relevant taxing authority until expiration of the applicable statute of limitations, which is generally three years from the date of filing but can be longer in certain jurisdictions. At this time, management believes there are no uncertain tax positions which, based on their technical merit, would not be sustained upon examination and for which it is reasonably possible that the total amounts of unrecognized tax benefits will significantly change in the next twelve months.
Multiple Class — All shares of the fund represent an equal pro rata interest in the net assets of the class to which such shares belong, and have identical voting, dividend, liquidation and other rights and the same terms and conditions, except for class specific expenses and exclusive rights to vote on matters affecting only individual classes. Income, non-class specific expenses, and realized and unrealized capital gains and losses of the fund are allocated to each class of shares based on their relative net assets.
Distributions to Shareholders — Distributions from net investment income, if any, are generally declared and paid quarterly. Distributions from net realized gains, if any, are generally declared and paid annually.
Indemnifications — Under the corporation’s organizational documents, its officers and directors are indemnified against certain liabilities arising out of the performance of their duties to the fund. In addition, in the normal course of business, the fund enters into contracts that provide general indemnifications. The maximum exposure under these arrangements is unknown as this would involve future claims that may be made against a fund. The risk of material loss from such claims is considered by management to be remote.
3. Fees and Transactions with Related Parties
Certain officers and directors of the corporation are also officers and/or directors of American Century Companies, Inc. (ACC). The corporation’s investment advisor, ACIM, the corporation's distributor, American Century Investment Services, Inc. (ACIS), and the corporation’s transfer agent, American Century Services, LLC, are wholly owned, directly or indirectly, by ACC. Various funds issued by American Century Asset Allocation Portfolios, Inc. own, in aggregate, 100% of the shares of the fund. Related parties do not invest in the fund for the purpose of exercising management or control.
Management Fees — The corporation has entered into a management agreement with ACIM, under which ACIM provides the fund with investment advisory and management services in exchange for a single, unified management fee (the fee) per class. The agreement provides that all expenses of managing and operating the fund, except distribution and service fees, brokerage expenses, taxes, interest, fees and expenses of the independent directors (including legal counsel fees), and extraordinary expenses, will be paid by ACIM. The fee is computed and accrued daily based on each class's daily net assets and paid monthly in arrears. The rate of the fee is determined by applying a fee rate calculation formula. This formula takes into account the fund’s assets as well as certain assets, if any, of other clients of the investment advisor outside the American Century Investments family of funds (such as subadvised funds and separate accounts) that have very similar investment teams and investment strategies (strategy assets). The strategy assets of the fund also include the assets of Large Company Value Fund, one fund in a series issued by the corporation. The annual management fee schedule ranges from 0.50% to 0.70% for the Institutional Class and 0.35% to 0.55% for the R6 Class. The effective annual management fee for each class for the period ended March 31, 2014 was 0.65% for the Institutional Class and 0.50% for the R6 Class.
Directors' Fees and Expenses — The Board of Directors is responsible for overseeing the investment advisor's management and operations of the fund. The directors receive detailed information about the fund and its investment advisor regularly throughout the year, and meet at least quarterly with management of the investment advisor to review reports about fund operations. Fees and expenses incurred in conjunction with the directors during the year ended March 31, 2014 are detailed in the Statement of Operations. The fund’s officers do not receive compensation from the fund.
4. Investment Transactions
Purchases and sales of investment securities, excluding short-term investments, for the year ended March 31, 2014 were $587,439,942 and $385,383,243, respectively.
5. Capital Share Transactions
Transactions in shares of the fund were as follows:
|
| | | | | | | | | | | | |
| | | Year ended March 31, 2014(1) | | Year ended March 31, 2013 |
| | | Shares | | Amount | | Shares | | Amount |
| Institutional Class/Shares Authorized | | 500,000,000 | | | | 205,000,000 | | |
| Sold | | 19,951,815 | | $ | 228,131,063 |
| | 26,521,184 | | $ | 250,774,299 |
|
| Issued in reinvestment of distributions | | 4,366,191 | | 50,756,360 |
| | 2,590,318 | | 24,536,851 |
|
| Redeemed | | (5,660,866) | | (65,321,164) |
| | (10,797,729) | | (100,614,649) |
|
| | | 18,657,140 | | 213,566,259 |
| | 18,313,773 | | 174,696,501 |
|
| R6 Class/Shares Authorized | | 50,000,000 | | | | N/A | | |
| Sold | | 1,551,103 | | 18,125,854 |
| | | | |
| Issued in reinvestment of distributions | | 31,722 | | 372,890 |
| | | | |
| Redeemed | | (205,695) | | (2,433,311) |
| | | | |
| | | 1,377,130 | | 16,065,433 |
| | | | |
| Net increase (decrease) | | 20,034,270 | | $ | 229,631,692 |
| | 18,313,773 | | $ | 174,696,501 |
|
| | | | | | | | | |
| (1) July 26, 2013 (commencement of sale) through March 31, 2014 for the R6 Class. |
6. Fair Value Measurements
The fund’s investments valuation process is based on several considerations and may use multiple inputs to determine the fair value of the investments held by the fund. In conformity with accounting principles generally accepted in the United States of America, the inputs used to determine a valuation are classified into three broad levels.
| |
| • | Level 1 valuation inputs consist of unadjusted quoted prices in an active market for identical investments. |
| |
| • | Level 2 valuation inputs consist of direct or indirect observable market data (including quoted prices for comparable investments, evaluations of subsequent market events, interest rates, prepayment speeds, credit risk, etc.). These inputs also consist of quoted prices for identical investments initially expressed in local currencies that are adjusted through translation into U.S. dollars. |
| |
| • | Level 3 valuation inputs consist of unobservable data (including a fund’s own assumptions). |
The level classification is based on the lowest level input that is significant to the fair valuation measurement. The valuation inputs are not necessarily an indication of the risks associated with investing in these securities or other financial instruments.
The following is a summary of the level classifications as of period end. The Schedule of Investments provides additional information on the fund’s portfolio holdings.
|
| | | | | | | | |
| | Level 1 | Level 2 | Level 3 |
| Assets | | | |
| Investment Securities | | | |
| Common Stocks | $ | 1,324,116,037 |
| $ | 4,088,597 |
| — |
|
| Exchange-Traded Funds | 7,275,856 |
| — |
| — |
|
| Temporary Cash Investments | 6,036,731 |
| 3,347,380 |
| — |
|
| | $ | 1,337,428,624 |
| $ | 7,435,977 |
| — |
|
| Other Financial Instruments | | | |
| Forward Foreign Currency Exchange Contracts | — |
| $ | 21,483 |
| — |
|
| | | | |
| Liabilities | | | |
| Other Financial Instruments | | | |
| Forward Foreign Currency Exchange Contracts | — |
| $ | (19,626 | ) | — |
|
7. Derivative Instruments
Foreign Currency Risk — The fund is subject to foreign currency exchange rate risk in the normal course of pursuing its investment objectives. The value of foreign investments held by a fund may be significantly affected by changes in foreign currency exchange rates. The dollar value of a foreign security generally decreases when the value of the dollar rises against the foreign currency in which the security is denominated and tends to increase when the value of the dollar declines against such foreign currency. A fund may enter into forward foreign currency exchange contracts to reduce a fund's exposure to foreign currency exchange rate fluctuations. The net U.S. dollar value of foreign currency underlying all contractual commitments held by a fund and the resulting unrealized appreciation or depreciation are determined daily. Realized gain or loss is recorded upon the termination of the contract. Net realized and unrealized gains or losses occurring during the holding period of forward foreign currency exchange contracts are a component of net realized gain (loss) on foreign currency transactions and change in net unrealized appreciation (depreciation) on translation of assets and liabilities in foreign currencies, respectively. A fund bears the risk of an unfavorable change in the foreign currency exchange rate underlying the forward contract. Additionally, losses, up to the fair value, may arise if the counterparties do not perform under the contract terms. The foreign currency risk derivative instruments held at period end as disclosed on the Schedule of Investments are indicative of the fund's typical volume during the period.
The value of foreign currency risk derivative instruments as of March 31, 2014, is disclosed on the Statement of Assets and Liabilities as an asset of $21,483 in unrealized appreciation on forward foreign currency exchange contracts and a liability of $19,626 in unrealized depreciation on forward foreign currency exchange contracts. For the year ended March 31, 2014, the effect of foreign currency risk derivative instruments on the Statement of Operations was $(987,956) in net realized gain (loss) on foreign currency transactions and $(68,646) in change in net unrealized appreciation (depreciation) on translation of assets and liabilities in foreign currencies.
8. Federal Tax Information
The tax character of distributions paid during the years ended March 31, 2014 and March 31, 2013 were as follows:
|
| | | | | | |
| | 2014 | 2013 |
| Distributions Paid From | | |
| Ordinary income | $ | 26,258,574 |
| $ | 15,210,513 |
|
| Long-term capital gains | $ | 24,870,676 |
| $ | 9,326,338 |
|
The book-basis character of distributions made during the year from net investment income or net realized gains may differ from their ultimate characterization for federal income tax purposes. These differences reflect the differing character of certain income items and net realized gains and losses for financial statement and tax purposes, and may result in reclassification among certain capital accounts on the financial statements.
As of March 31, 2014, the federal tax cost of investments and the components of distributable earnings on a tax-basis were as follows:
|
| | | |
| Federal tax cost of investments | $ | 1,012,368,951 |
|
| Gross tax appreciation of investments | $ | 334,464,398 |
|
| Gross tax depreciation of investments | (1,968,748 | ) |
| Net tax appreciation (depreciation) of investments | $ | 332,495,650 |
|
| Net tax appreciation (depreciation) on derivatives and translation of assets and liabilities in foreign currencies | $ | 904 |
|
| Net tax appreciation (depreciation) | $ | 332,496,554 |
|
| Undistributed ordinary income | $ | 5,004,091 |
|
| Accumulated long-term gains | $ | 20,560,164 |
|
The difference between book-basis and tax-basis unrealized appreciation (depreciation) is attributable primarily to the tax deferral of losses on wash sales.
|
| | | | | | | | | | | | | | | |
| For a Share Outstanding Throughout the Years Ended March 31 (except as noted) |
| Per-Share Data | Ratios and Supplemental Data |
| | | Income From Investment Operations: | Distributions From: | | | Ratio to Average Net Assets of: | | |
| | Net Asset Value, Beginning of Period | Net Investment Income (Loss)(1) | Net Realized and Unrealized Gain (Loss) | Total From Investment Operations | Net Investment Income | Net Realized Gains | Total Distributions | Net Asset Value, End of Period | Total Return(2) | Operating Expenses | Net Investment Income (Loss) | Portfolio Turnover Rate | Net Assets, End of Period (in thousands) |
| Institutional Class | | | | | | | | | | | |
| 2014 | $10.45 | 0.21 | 2.03 | 2.24 | (0.20) | (0.31) | (0.51) | $12.18 | 21.75% | 0.65% | 1.81% | 35% |
| $1,324,951 |
|
| 2013 | $9.31 | 0.19 | 1.25 | 1.44 | (0.19) | (0.11) | (0.30) | $10.45 | 15.87% | 0.67% | 2.03% | 37% |
| $941,901 |
|
| 2012 | $8.86 | 0.17 | 0.44 | 0.61 | (0.16) | — | (0.16) | $9.31 | 7.07% | 0.67% | 2.02% | 47% |
| $668,644 |
|
| 2011 | $8.02 | 0.14 | 0.83 | 0.97 | (0.13) | — | (0.13) | $8.86 | 12.24% | 0.66% | 1.70% | 38% |
| $481,887 |
|
| 2010 | $5.55 | 0.14 | 2.47 | 2.61 | (0.14) | — | (0.14) | $8.02 | 47.28% | 0.64% | 1.99% | 23% |
| $308,035 |
|
| R6 Class | | | | | | | | | | | |
2014(4) | $11.54 | 0.15 | 0.96 | 1.11 | (0.16) | (0.31) | (0.47) | $12.18 | 9.83% | 0.50%(3) | 1.93%(3) | 35%(5) |
| $16,772 |
|
|
| | | | |
| Notes to Financial Highlights | | |
| |
| |
| (1) | Computed using average shares outstanding throughout the period. |
| |
| (2) | Total returns are calculated based on the net asset value of the last business day. Total returns for periods less than one year are not annualized. |
| |
| (4) | July 26, 2013 (commencement of sale) through March 31, 2014. |
| |
| (5) | Portfolio turnover is calculated at the fund level. Percentage indicated was calculated for the year ended March 31, 2014. |
See Notes to Financial Statements.
|
|
| Report of Independent Registered Public Accounting Firm |
To the Board of Directors and Shareholders of
American Century Capital Portfolios, Inc.:
We have audited the accompanying statement of assets and liabilities, including the schedule of investments, of NT Large Company Value Fund (the “Fund”), one of the funds constituting American Century Capital Portfolios, Inc., as of March 31, 2014, and the related statement of operations for the year then ended, the statements of changes in net assets for each of the two years in the period then ended, and the financial highlights for each of the periods presented. These financial statements and financial highlights are the responsibility of the Fund's management. Our responsibility is to express an opinion on these financial statements and financial highlights based on our audits.
We conducted our audits in accordance with the standards of the Public Company Accounting Oversight Board (United States). Those standards require that we plan and perform the audit to obtain reasonable assurance about whether the financial statements and financial highlights are free of material misstatement. The Fund is not required to have, nor were we engaged to perform, an audit of its internal control over financial reporting. Our audits included consideration of internal control over financial reporting as a basis for designing audit procedures that are appropriate in the circumstances, but not for the purpose of expressing an opinion on the effectiveness of the Fund's internal control over financial reporting. Accordingly, we express no such opinion. An audit also includes examining, on a test basis, evidence supporting the amounts and disclosures in the financial statements, assessing the accounting principles used and significant estimates made by management, as well as evaluating the overall financial statement presentation. Our procedures included confirmation of securities owned as of March 31, 2014, by correspondence with the custodian and brokers; where replies were not received from brokers, we performed other auditing procedures. We believe that our audits provide a reasonable basis for our opinion.
In our opinion, the financial statements and financial highlights referred to above present fairly, in all material respects, the financial position of NT Large Company Value Fund of American Century Capital Portfolios, Inc. as of March 31, 2014, the results of its operations for the year then ended, the changes in its net assets for each of the two years in the period then ended, and the financial highlights for each of the periods presented, in conformity with accounting principles generally accepted in the United States of America.
Deloitte & Touche LLP
Kansas City, Missouri
May 16, 2014
The Board of Directors
The individuals listed below serve as directors of the funds. Each director will continue to serve in this capacity until death, retirement, resignation or removal from office. The board has adopted a mandatory retirement age for directors who are not “interested persons,” as that term is defined in the Investment Company Act (independent directors). Independent directors shall retire by December 31 of the year in which they reach their 75th birthday.
Mr. Thomas is an “interested person” because he currently serves as President and Chief Executive Officer of American Century Companies, Inc. (ACC), the parent company of American Century Investment Management, Inc. (ACIM or the advisor). Mr. Fink is treated as an “interested person” because of his recent employment with ACC and American Century Services, LLC (ACS). The other directors (more than three-fourths of the total number) are independent. They are not employees, directors or officers of, and have no financial interest in, ACC or any of its wholly owned, direct or indirect, subsidiaries, including ACIM, American Century Investment Services, Inc. (ACIS) and ACS, and do not have any other affiliations, positions, or relationships that would cause them to be considered “interested persons” under the Investment Company Act. The directors serve in this capacity for seven (in the case of Mr. Thomas, 15) registered investment companies in the American Century Investments family of funds.
The following table presents additional information about the directors. The mailing address for each director is 4500 Main Street, Kansas City, Missouri 64111.
|
| | | | | |
Name (Year of Birth) | Position(s) Held with Funds | Length of Time Served | Principal Occupation(s) During Past 5 Years | Number of American Century Portfolios Overseen by Director | Other Directorships Held During Past
5 Years |
| Independent Directors |
Thomas A. Brown
(1940) | Director | Since 1980 | Managing Member, Associated Investments, LLC (real estate investment company); Brown Cascade Properties, LLC (real estate investment company) (2001 to 2009) | 73 | None |
Andrea C. Hall
(1945) | Director | Since 1997 | Retired | 73 | None |
Jan M. Lewis
(1957) | Director | Since 2011 | Retired; President and Chief Executive Officer, Catholic Charities of Northeast Kansas (human services organization) (2006 to 2013) | 73 | None |
James A. Olson
(1942) | Director and Chairman of the Board | Since 2007 (Chairman since 2014) | Member, Plaza Belmont LLC (private equity fund manager) | 73 | Saia, Inc. (2002 to 2012) and EPR Properties (2003 to 2013) |
|
| | | | | |
Name (Year of Birth) | Position(s) Held with Funds | Length of Time Served | Principal Occupation(s) During Past 5 Years | Number of American Century Portfolios Overseen by Director | Other Directorships Held During Past
5 Years |
| Independent Directors |
M. Jeannine Strandjord
(1945) | Director | Since 1994 | Retired | 73 | Euronet Worldwide Inc.; Charming Shoppes, Inc. (2006 to 2010); and DST Systems Inc. (1996 to 2012) |
John R. Whitten
(1946) | Director | Since 2008 | Retired | 73 | Rudolph Technologies, Inc. |
Stephen E. Yates
(1948) | Director | Since 2012 | Retired; Executive Vice President, Technology & Operations, KeyCorp. (computer services) (2004 to 2010) | 73 | Applied Industrial Technologies, Inc. (2001 to 2010) |
| Interested Directors | | | | |
Barry Fink
(1955) | Director | Since 2012 | Retired; Executive Vice President, ACC (September 2007 to February 2013); President, ACS (October 2007 to February 2013); Chief Operating Officer, ACC (September 2007 to November 2012) | 73 | None |
Jonathan S. Thomas
(1963) | Director and President | Since 2007 | President and Chief Executive Officer, ACC (March 2007 to present). Also serves as Chief Executive Officer and Manager, ACS; Executive Vice President, ACIM; Director, ACC, ACIM and other ACC subsidiaries | 115 | None |
Officers
The following table presents certain information about the executive officers of the funds. Each officer serves as an officer for each of the 15 investment companies in the American Century family of funds, unless otherwise noted. No officer is compensated for his or her service as an officer of the funds. The listed officers are interested persons of the funds and are appointed or re-appointed on an annual basis. The mailing address for each officer listed below is 4500 Main Street, Kansas City, Missouri 64111.
|
| | |
Name (Year of Birth) | Offices with
the Funds | Principal Occupation(s) During the Past Five Years |
Jonathan S.
Thomas
(1963) | Director and
President
since 2007 | President and Chief Executive Officer, ACC (March 2007 to present). Also serves as Chief Executive Officer and Manager, ACS; Executive Vice President, ACIM; Director, ACC, ACIM and other ACC subsidiaries |
Amy D. Shelton
(1964) | Chief Compliance
Officer since 2014 | Chief Compliance Officer, American Century funds, (March 2014 to present); Chief Compliance Officer, ACIM (February 2014 to present); Chief Compliance Officer, ACIS (October 2009 to present); Vice President, Client Interactions and Marketing, ACIS (February 2013 to January 2014); Director, Client Interactions and Marketing, ACIS (June 2007 to January 2013). Also serves as Vice President, ACIS |
Charles A.
Etherington
(1957) | General Counsel
since 2007 and
Senior Vice
President since 2006 | Attorney, ACC (February 1994 to present); Vice President, ACC (November 2005 to present); General Counsel, ACC (March 2007 to present). Also serves as General Counsel, ACIM, ACS, ACIS and other ACC subsidiaries; and Senior Vice President, ACIM and ACS |
C. Jean Wade
(1964) | Vice President,
Treasurer and
Chief Financial
Officer since 2012 | Vice President, ACS (February 2000 to present) |
Robert J.
Leach
(1966) | Vice President
since 2006 and
Assistant Treasurer
since 2012 | Vice President, ACS (February 2000 to present) |
David H.
Reinmiller
(1963) | Vice President
since 2000 | Attorney, ACC (January 1994 to present); Associate General Counsel, ACC (January 2001 to present). Also serves as Vice President, ACIM and ACS |
Ward D.
Stauffer
(1960) | Secretary
since 2005 | Attorney, ACC (June 2003 to present) |
The Statement of Additional Information has additional information about the fund's directors and is available without charge, upon request, by calling 1-800-345-2021.
Retirement Account Information
As required by law, distributions you receive from certain IRAs are subject to federal income tax withholding, unless you elect not to have withholding apply. Tax will be withheld on the total amount withdrawn even though you may be receiving amounts that are not subject to withholding, such as nondeductible contributions. In such case, excess amounts of withholding could occur. You may adjust your withholding election so that a greater or lesser amount will be withheld.
If you don’t want us to withhold on this amount, you must notify us to not withhold the federal income tax. You may notify us in writing or in certain situations by telephone or through other electronic means. For systematic withdrawals, your withholding election will remain in effect until revoked or changed by filing a new election. You have the right to revoke your election at any time.
Remember, even if you elect not to have income tax withheld, you are liable for paying income tax on the taxable portion of your withdrawal. If you elect not to have income tax withheld or you don’t have enough income tax withheld, you may be responsible for payment of estimated tax. You may incur penalties under the estimated tax rules if your withholding and estimated tax payments are not sufficient. You can reduce or defer the income tax on a distribution by directly or indirectly rolling such distribution over to another IRA or eligible plan. You should consult your tax advisor for additional information.
State tax will be withheld if, at the time of your distribution, your address is within one of the mandatory withholding states and you have federal income tax withheld (or as otherwise required by state law). State taxes will be withheld from your distribution in accordance with the respective state rules.
Distributions you receive from 403(b), 457 and qualified plans are subject to special tax and withholding rules. Your plan administrator or plan sponsor is required to provide you with a special tax notice explaining those rules at the time you request a distribution. If applicable, federal and/or state taxes may be withheld from your distribution amount.
Proxy Voting Policies
A description of the policies that the fund's investment advisor uses in exercising the voting rights associated with the securities purchased and/or held by the fund is available without charge, upon request, by calling 1-800-345-2021. It is also available on the "About Us" page of American Century Investments’ website at americancentury.com and on the Securities and Exchange Commission’s website at sec.gov. Information regarding how the investment advisor voted proxies relating to portfolio securities during the most recent 12-month period ended June 30 is available on the "About Us" page at americancentury.com. It is also available at sec.gov.
Quarterly Portfolio Disclosure
The fund files its complete schedule of portfolio holdings with the Securities and Exchange Commission (SEC) for the first and third quarters of each fiscal year on Form N-Q. The fund’s Forms N-Q are available on the SEC’s website at sec.gov, and may be reviewed and copied at the SEC’s Public Reference Room in Washington, DC. Information on the operation of the Public Reference Room may be obtained by calling 1-800-SEC-0330. The fund also makes its complete schedule of portfolio holdings for the most recent quarter of its fiscal year available on its
website at americancentury.com and, upon request, by calling 1-800-345-2021.
Other Tax Information
The following information is provided pursuant to provisions of the Internal Revenue Code.
The fund hereby designates up to the maximum amount allowable as qualified dividend income for the fiscal year ended March 31, 2014.
For corporate taxpayers, the fund hereby designates $26,258,574, or up to the maximum amount allowable, of ordinary income distributions paid during the fiscal year ended March 31, 2014 as qualified for the corporate dividends received deduction.
The fund hereby designates $6,575,122 as qualified short-term capital gain distributions for purposes of Internal Revenue Code Section 871.
The fund hereby designates $24,870,676, or up to the maximum amount allowable, as long-term capital gain distributions for the fiscal year ended March 31, 2014.
|
| | |
| |
| | | |
| Contact Us | americancentury.com | |
| Automated Information Line | 1-800-345-8765 | |
| Investor Services Representative | 1-800-345-2021 or 816-531-5575 | |
| Investors Using Advisors | 1-800-378-9878 | |
| Business, Not-For-Profit, Employer-Sponsored Retirement Plans | 1-800-345-3533 | |
| Banks and Trust Companies, Broker-Dealers, Financial Professionals, Insurance Companies | 1-800-345-6488 | |
| Telecommunications Relay Service for the Deaf | 711 | |
| | | |
| American Century Capital Portfolios, Inc. | |
| | | |
Investment Advisor: American Century Investment Management, Inc. Kansas City, Missouri | |
| | | |
| This report and the statements it contains are submitted for the general information of our shareholders. The report is not authorized for distribution to prospective investors unless preceded or accompanied by an effective prospectus. | |
| | | |
©2014 American Century Proprietary Holdings, Inc. All rights reserved.
CL-ANN-82113 1405
| |
|
| |
ANNUAL REPORT | MARCH 31, 2014 |
NT Mid Cap Value Fund
|
| |
| President’s Letter | |
| Performance | |
| Portfolio Commentary | |
| Fund Characteristics | |
| Shareholder Fee Example | |
| Schedule of Investments | |
| Statement of Assets and Liabilities | |
| Statement of Operations | |
| Statement of Changes in Net Assets | |
| Notes to Financial Statements | |
| Financial Highlights | |
| Report of Independent Registered Public Accounting Firm | |
| Management | |
| Additional Information | |
Any opinions expressed in this report reflect those of the author as of the date of the report, and do not necessarily represent the opinions of American Century Investments® or any other person in the American Century Investments organization. Any such opinions are subject to change at any time based upon market or other conditions and American Century Investments disclaims any responsibility to update such opinions. These opinions may not be relied upon as investment advice and, because investment decisions made by American Century Investments funds are based on numerous factors, may not be relied upon as an indication of trading intent on behalf of any American Century Investments fund. Security examples are used for representational purposes only and are not intended as recommendations to purchase or sell securities. Performance information for comparative indices and securities is provided to American Century Investments by third party vendors. To the best of American Century Investments’ knowledge, such information is accurate at the time of printing.
|
| |
| Dear Investor:
Thank you for reviewing this annual report for the 12 months ended March 31, 2014. It provides investment performance, market analysis, and portfolio information, presented with the expert perspective of our portfolio management team.
Annual reports remain important vehicles for conveying information about fund returns, including key factors that affected fund performance. For additional, updated investment and market insights, we encourage you to visit our website, americancentury.com.
|
| Jonathan Thomas |
Monetary Policy-Driven, Mostly “Risk-On” Results in the U.S. and Europe
Stimulative monetary policies and expectations of economic improvement helped drive financial market returns during the reporting period. We believe the combination of optimism about the economy, low costs of capital in the money markets, and central bank purchases of longer-maturity fixed income securities (quantitative easing, or QE) helped persuade investors to seek risk and yield, especially in the U.S. and Europe. Stock index returns were strong in these markets, particularly at the smaller capitalization end of the company size spectrum. The MSCI Europe and S&P 500 Indices advanced 24.50% and 21.86%, respectively, and their smaller capitalization counterparts performed even better. In the U.S., growth stocks generally outperformed value stocks.
Some of the same growth and optimism factors that drove stocks higher, plus hints that QE tapering would begin in the U.S., hampered U.S. government bond returns, which dipped into negative territory for the reporting period. On the other hand, U.S. corporate bonds, especially high-yield corporates, posted mostly positive returns because of their higher yields, declining spreads (yield differences between corporate and similar-maturity U.S. Treasury securities), and relatively low default rates. At the other end of the U.S. bond spectrum, Treasury inflation-protected securities (TIPS) underperformed, hurt by the combination of rising yields and low inflation.
Looking ahead, we see further signs of economic improvement for the U.S. in 2014, but headwinds persist. Interest rates could normalize further, and economic growth and U.S. employment levels remain subpar compared with past post-recession periods. In this environment, we continue to believe in a disciplined, diversified, long-term investment approach, using professionally managed stock and bond portfolios—as appropriate—for meeting financial goals. We appreciate your continued trust in us.
Sincerely,
Jonathan Thomas
President and Chief Executive Officer
American Century Investments
|
| | | | | |
| Total Returns as of March 31, 2014 |
| | | | Average Annual Returns | |
| | Ticker Symbol | 1 year | 5 years | Since Inception | Inception Date |
| Institutional Class | ACLMX | 21.19% | 22.92% | 9.57% | 5/12/06 |
| Russell Midcap Value Index | — | 22.95% | 26.33% | 8.19% | — |
| R6 Class | ACDSX | — | — | 11.89%(1) | 7/26/13 |
| |
| (1) | Total returns for periods less than one year are not annualized. |
Data presented reflect past performance. Past performance is no guarantee of future results. Current performance may be higher or lower than the performance shown. Investment return and principal value will fluctuate, and redemption value may be more or less than original cost. To obtain performance data current to the most recent month end, please call 1-800-345-2021 or visit americancentury.com. International investing involves special risks, such as political instability and currency fluctuations.
Unless otherwise indicated, performance reflects Institutional Class shares; performance for other share classes will vary due to differences in fee structure. For information about other share classes available, please consult the prospectus. Data assumes reinvestment of dividends and capital gains, and none of the charts reflect the deduction of taxes that a shareholder would pay on fund distributions or the redemption of fund shares. Returns for the index are provided for comparison. The fund’s total returns include operating expenses (such as transaction costs and management fees) that reduce returns, while the total returns of the index do not.
|
|
| Growth of $10,000 Over Life of Class |
| $10,000 investment made May 12, 2006 |
| |
| * | From 5/12/06, the Institutional Class's inception date. Not annualized. |
|
| | |
| Total Annual Fund Operating Expenses |
| Institutional Class | | R6 Class |
| 0.81% | | 0.66% |
The total annual fund operating expenses shown is as stated in the fund’s prospectus current as of the date of this report. The prospectus may vary from the expense ratio shown elsewhere in this report because it is based on a different time period, includes acquired fund fees and expenses, and, if applicable, does not include fee waivers or expense reimbursements.
Data presented reflect past performance. Past performance is no guarantee of future results. Current performance may be higher or lower than the performance shown. Investment return and principal value will fluctuate, and redemption value may be more or less than original cost. To obtain performance data current to the most recent month end, please call 1-800-345-2021 or visit americancentury.com. International investing involves special risks, such as political instability and currency fluctuations.
Unless otherwise indicated, performance reflects Institutional Class shares; performance for other share classes will vary due to differences in fee structure. For information about other share classes available, please consult the prospectus. Data assumes reinvestment of dividends and capital gains, and none of the charts reflect the deduction of taxes that a shareholder would pay on fund distributions or the redemption of fund shares. Returns for the index are provided for comparison. The fund’s total returns include operating expenses (such as transaction costs and management fees) that reduce returns, while the total returns of the index do not.
Portfolio Managers: Kevin Toney, Michael Liss, Phil Davidson, and Brian Woglom
Performance Summary
NT Mid Cap Value returned 21.19%* for the 12 months ended March 31, 2014. By comparison, its benchmark, the Russell Midcap Value Index, returned 22.95%. The portfolio’s return reflects operating expenses, while the index’s return does not.
The U.S. stock market generated strong gains during the one-year reporting period. When the period began, riskier asset classes led the market, as the Federal Reserve’s (Fed) bond-buying programs continued. Market leadership changed after the Fed suggested it might start tapering its asset purchases if economic conditions improved. Higher-quality stocks came into favor and as interest rates rose, higher-yielding stocks, such as real estate investment trusts (REITs) and utilities, declined. As the Fed sought to calm fears about eventual tapering, riskier stocks posted gains, but they reversed direction in mid-August on positive economic data, which suggested the Fed might announce tapering as soon as September. After the Fed surprised the markets by making no changes to its stimulus programs, lower-quality, riskier stocks rallied and continued to outperform through the end of 2013. In December, the U.S. economy showed new signs of strength and the Fed announced it would begin modestly scaling back its asset purchases in January 2014. As interest rates trended down in the last three months of the reporting period, yield-oriented securities, including utilities and REITs, rallied. For the reporting period overall, riskier, lower-yielding, and lower-quality stocks outperformed. Though value stocks recorded significant gains, they underperformed growth stocks. Mid-cap value stocks outperformed small-cap value stocks and large-cap value stocks.
In this environment, the portfolio’s investment approach, which emphasizes higher-quality businesses with sound balance sheets, provided positive absolute results in nine of the 10 sectors in which it was invested. On a relative basis, it underperformed the benchmark, as investors gravitated to lower-quality, riskier securities.
We carefully manage this portfolio for long-term results. Since its inception on May 12, 2006, NT Mid Cap Value has produced an average annual return of 9.57%, topping the return for that period of the Russell Midcap Value Index (see the performance information on pages 3 and 4).
Materials Detracted From Relative Performance
Although an underweight position relative to the benchmark in the materials sector added to results, the portfolio was hindered by security selection, especially in the metals and mining industry. An overweight position in gold producer Newmont Mining detracted. A sharp drop in gold prices during 2013 seemed likely to negatively impact Newmont’s profitability and free cash flow.
Telecommunication Services Was a Source of Weakness
An overweight position in telecommunication services—the strongest-performing sector in the benchmark—contributed positively, but the portfolio was hampered by security selection. An investment in CenturyLink detracted. This high-yielding security underperformed, as lower-yielding assets outperformed. CenturyLink reported weaker-than-expected results, as its growth business is not ramping up as fast as expected, and its legacy businesses have contracted more quickly than expected.
*All fund returns referenced in this commentary are for Institutional Class shares.
Security Selection in Consumer Staples Dampened Results
During the reporting period, consumers appeared to be focusing their purchases on big-ticket items, such as cars and houses, instead of smaller-ticket items. In our opinion, this hurt the profit margins of many companies in the food products industry, including portfolio holdings Kellogg, ConAgra Foods, and General Mills—all of which underperformed. Weak consumer demand also negatively affected food service companies, such as Sysco. The global food distributor reported weak restaurant sales and has had continuing difficulties in integrating a new technology system designed to improve the efficiency of its operations and sales process.
Financials Enhanced Relative Performance
In financials, an underweight position in REITs added to relative returns. In general, valuation of REITs has appeared unattractive. REITs have benefited from the low interest-rate and credit-spread environment, but the industry underperformed during the reporting period as interest rates increased. Within capital markets, an investment in Charles Schwab was advantageous. As interest rates increased, it seemed likely that Charles Schwab would regain earning power as its net interest margin expands over time.
Information Technology Contributed Positively
An underweight position in information technology, which posted strong returns in the benchmark, dampened relative returns, but effective security selection boosted absolute performance. The portfolio owned Molex, a manufacturer of electronic and fiber-optic interconnection products and systems. Its share price rose on news that Koch Industries would acquire it for a significant premium. The portfolio also benefited from an overweight position in Applied Materials, which reported solid results and provided better-than-expected guidance, driven by strength in core semiconductor capital equipment orders.
Positioning in Energy and Utilities Added to Relative Results
In energy, the portfolio benefited from an underweight position in oil refiners, such as its lack of exposure to Marathon Petroleum and Valero Energy. We believe current refining margins are unsustainable and will revert to long-term averages over time.
An underweight position in utilities added to relative returns, as interest rates began to increase during the reporting period and utilities—which are sensitive to changes in rates—posted the weakest performance in the benchmark. For some time, we have considered many of these stocks overvalued.
Outlook
We continue to follow our disciplined, bottom-up process, selecting companies one at a time for the portfolio. As of March 31, 2014, we saw attractive opportunities in consumer staples, health care, industrials, and energy, as reflected by the portfolio’s overweight positions in these sectors. Conversely, smaller relative weightings were given to financials, consumer discretionary, materials, and information technology stocks.
|
| |
| MARCH 31, 2014 |
| Top Ten Holdings | % of net assets |
| Republic Services, Inc. | 3.3% |
| Northern Trust Corp. | 2.8% |
| Imperial Oil Ltd. | 2.8% |
| ADT Corp. (The) | 2.0% |
| Applied Materials, Inc. | 1.9% |
| iShares Russell Midcap Value Index Fund | 1.7% |
| Westar Energy, Inc. | 1.6% |
| Sysco Corp. | 1.6% |
| Apache Corp. | 1.5% |
| Lowe's Cos., Inc. | 1.5% |
| | |
| Top Five Industries | % of net assets |
| Insurance | 7.8% |
| Oil, Gas and Consumable Fuels | 7.8% |
| Commercial Banks | 7.3% |
| Commercial Services and Supplies | 6.6% |
| Electric Utilities | 6.2% |
| | |
| Types of Investments in Portfolio | % of net assets |
| Domestic Common Stocks | 89.5% |
| Foreign Common Stocks* | 6.4% |
| Exchange-Traded Funds | 1.6% |
| Total Equity Exposure | 97.5% |
| Temporary Cash Investments | 2.5% |
| Other Assets and Liabilities | –** |
| |
| * | Includes depositary shares, dual listed securities and foreign ordinary shares. |
| |
| ** | Category is less than 0.05% of total net assets. |
Fund shareholders may incur two types of costs: (1) transaction costs, including sales charges (loads) on purchase payments and redemption/exchange fees; and (2) ongoing costs, including management fees; distribution and service (12b-1) fees; and other fund expenses. This example is intended to help you understand your ongoing costs (in dollars) of investing in your fund and to compare these costs with the ongoing cost of investing in other mutual funds.
The example is based on an investment of $1,000 made at the beginning of the period and held for the entire period from October 1, 2013 to March 31, 2014.
Actual Expenses
The table provides information about actual account values and actual expenses for each class. You may use the information, together with the amount you invested, to estimate the expenses that you paid over the period. First, identify the share class you own. Then simply divide your account value by $1,000 (for example, an $8,600 account value divided by $1,000 = 8.6), then multiply the result by the number under the heading “Expenses Paid During Period” to estimate the expenses you paid on your account during this period.
If you hold Investor Class shares of any American Century Investments fund, or Institutional Class shares of the American Century Diversified Bond Fund, in an American Century Investments account (i.e., not a financial intermediary or retirement plan account), American Century Investments may charge you a $12.50 semiannual account maintenance fee if the value of those shares is less than $10,000. We will redeem shares automatically in one of your accounts to pay the $12.50 fee. In determining your total eligible investment amount, we will include your investments in all personal accounts (including American Century Investments Brokerage accounts) registered under your Social Security number. Personal accounts include individual accounts, joint accounts, UGMA/UTMA accounts, personal trusts, Coverdell Education Savings Accounts and IRAs (including traditional, Roth, Rollover, SEP-, SARSEP- and SIMPLE-IRAs), and certain other retirement accounts. If you have only business, business retirement, employer-sponsored or American Century Investments Brokerage accounts, you are currently not subject to this fee. If you are subject to the Account Maintenance Fee, your account value could be reduced by the fee amount.
Hypothetical Example for Comparison Purposes
The table also provides information about hypothetical account values and hypothetical expenses based on the actual expense ratio of each class of your fund and an assumed rate of return of 5% per year before expenses, which is not the actual return of a fund’s share class. The hypothetical account values and expenses may not be used to estimate the actual ending account balance or expenses you paid for the period. You may use this information to compare the ongoing costs of investing in your fund and other funds. To do so, compare this 5% hypothetical example with the 5% hypothetical examples that appear in the shareholder reports of the other funds.
Please note that the expenses shown in the table are meant to highlight your ongoing costs only and do not reflect any transactional costs, such as sales charges (loads) or redemption/exchange fees. Therefore, the table is useful in comparing ongoing costs only, and will not help you determine the relative total costs of owning different funds. In addition, if these transactional costs were included, your costs would have been higher.
|
| | | | | | | | |
| | | Beginning
Account Value
10/1/13 | | Ending
Account Value
3/31/14 | | Expenses Paid
During Period(1)
10/1/13 - 3/31/14 | | Annualized
Expense Ratio(1) |
| Actual | | | | | | | | |
| Institutional Class | | $1,000 | | $1,121.50 | | $4.23 | | 0.80% |
| R6 Class | | $1,000 | | $1,123.20 | | $3.44 | | 0.65% |
| Hypothetical | | | | | | | | |
| Institutional Class | | $1,000 | | $1,020.94 | | $4.03 | | 0.80% |
| R6 Class | | $1,000 | | $1,021.69 | | $3.28 | | 0.65% |
| |
| (1) | Expenses are equal to the class's annualized expense ratio listed in the table above, multiplied by the average account value over the period, multiplied by 182, the number of days in the most recent fiscal half-year, divided by 365, to reflect the one-half year period. |
MARCH 31, 2014
|
| | | | | |
| | Shares | Value |
| COMMON STOCKS — 95.9% |
| AEROSPACE AND DEFENSE — 2.7% |
| BAE Systems plc | 439,200 |
| $ | 3,032,823 |
|
| General Dynamics Corp. | 41,439 |
| 4,513,536 |
|
| Northrop Grumman Corp. | 15,552 |
| 1,918,806 |
|
| Rockwell Collins, Inc. | 37,070 |
| 2,953,367 |
|
| Textron, Inc. | 93,118 |
| 3,658,606 |
|
| | | 16,077,138 |
|
| AIRLINES — 0.7% | | |
| Southwest Airlines Co. | 176,138 |
| 4,158,618 |
|
| AUTO COMPONENTS — 0.4% |
| Autoliv, Inc. | 21,710 |
| 2,178,599 |
|
| BEVERAGES — 0.5% |
| Dr Pepper Snapple Group, Inc. | 52,575 |
| 2,863,235 |
|
| CAPITAL MARKETS — 4.0% |
| Charles Schwab Corp. (The) | 33,199 |
| 907,329 |
|
| Franklin Resources, Inc. | 83,687 |
| 4,534,162 |
|
| Northern Trust Corp. | 255,699 |
| 16,763,626 |
|
| State Street Corp. | 25,921 |
| 1,802,805 |
|
| | | 24,007,922 |
|
| COMMERCIAL BANKS — 7.3% |
| BOK Financial Corp. | 39,086 |
| 2,698,888 |
|
| Comerica, Inc. | 70,522 |
| 3,653,039 |
|
| Commerce Bancshares, Inc. | 154,240 |
| 7,159,821 |
|
| Cullen/Frost Bankers, Inc. | 61,909 |
| 4,799,805 |
|
| KeyCorp | 125,111 |
| 1,781,581 |
|
| M&T Bank Corp. | 61,490 |
| 7,458,737 |
|
| PNC Financial Services Group, Inc. (The) | 81,999 |
| 7,133,913 |
|
| SunTrust Banks, Inc. | 113,058 |
| 4,498,578 |
|
| Westamerica Bancorp. | 86,631 |
| 4,685,004 |
|
| | | 43,869,366 |
|
| COMMERCIAL SERVICES AND SUPPLIES — 6.6% |
| ADT Corp. (The) | 404,800 |
| 12,123,760 |
|
| Republic Services, Inc. | 575,902 |
| 19,672,812 |
|
|
| | | | |
| | Shares | Value |
| Tyco International Ltd. | 128,211 | $ | 5,436,146 |
|
| Waste Management, Inc. | 68,479 | 2,880,912 |
|
| | | 40,113,630 |
|
| COMMUNICATIONS EQUIPMENT — 0.3% |
| Harris Corp. | 23,800 | 1,741,208 |
|
| COMPUTERS AND PERIPHERALS — 2.4% |
| SanDisk Corp. | 69,913 | 5,676,236 |
|
| Western Digital Corp. | 93,119 | 8,550,187 |
|
| | | 14,226,423 |
|
| CONTAINERS AND PACKAGING — 1.2% |
| Bemis Co., Inc. | 106,278 | 4,170,349 |
|
| Sonoco Products Co. | 73,267 | 3,005,412 |
|
| | | 7,175,761 |
|
| DIVERSIFIED TELECOMMUNICATION SERVICES — 1.0% |
| CenturyLink, Inc. | 184,000 | 6,042,560 |
|
| ELECTRIC UTILITIES — 6.2% |
| Empire District Electric Co. (The) | 70,511 | 1,714,828 |
|
| Great Plains Energy, Inc. | 301,457 | 8,151,397 |
|
| Northeast Utilities | 80,179 | 3,648,144 |
|
| Portland General Electric Co. | 97,237 | 3,144,645 |
|
| Southern Co. (The) | 100,840 | 4,430,910 |
|
| Westar Energy, Inc. | 275,558 | 9,688,619 |
|
| Xcel Energy, Inc. | 228,631 | 6,941,237 |
|
| | | 37,719,780 |
|
| ELECTRICAL EQUIPMENT — 0.7% |
| Brady Corp., Class A | 67,989 | 1,845,901 |
|
| Regal-Beloit Corp. | 33,484 | 2,434,622 |
|
| | | 4,280,523 |
|
| ELECTRONIC EQUIPMENT, INSTRUMENTS AND COMPONENTS — 0.7% |
| TE Connectivity Ltd. | 73,035 | 4,397,437 |
|
| ENERGY EQUIPMENT AND SERVICES — 0.5% |
Cameron International Corp.(1) | 48,642 | 3,004,616 |
|
| FOOD AND STAPLES RETAILING — 1.6% |
| Sysco Corp. | 265,023 | 9,575,281 |
|
| FOOD PRODUCTS — 5.2% |
| Campbell Soup Co. | 58,820 | 2,639,841 |
|
| ConAgra Foods, Inc. | 118,489 | 3,676,714 |
|
|
| | | | |
| | Shares | Value |
| Danone SA | 39,090 | $ | 2,764,240 |
|
| General Mills, Inc. | 74,817 | 3,877,017 |
|
| Hillshire Brands Co. | 192,027 | 7,154,926 |
|
| Kellogg Co. | 52,024 | 3,262,425 |
|
| Kraft Foods Group, Inc. | 69,690 | 3,909,609 |
|
| Mondelez International, Inc., Class A | 124,243 | 4,292,596 |
|
| | | 31,577,368 |
|
| GAS UTILITIES — 2.4% |
| AGL Resources, Inc. | 43,470 | 2,128,291 |
|
| Atmos Energy Corp. | 21,603 | 1,018,149 |
|
| Laclede Group, Inc. (The) | 155,116 | 7,313,720 |
|
| Southwest Gas Corp. | 18,631 | 995,827 |
|
| WGL Holdings, Inc. | 80,601 | 3,228,876 |
|
| | | 14,684,863 |
|
| HEALTH CARE EQUIPMENT AND SUPPLIES — 5.4% |
| Becton Dickinson and Co. | 24,556 | 2,875,016 |
|
Boston Scientific Corp.(1) | 283,292 | 3,830,108 |
|
CareFusion Corp.(1) | 179,390 | 7,215,066 |
|
| Medtronic, Inc. | 107,027 | 6,586,441 |
|
| STERIS Corp. | 58,989 | 2,816,725 |
|
| Stryker Corp. | 58,679 | 4,780,578 |
|
| Zimmer Holdings, Inc. | 48,296 | 4,567,836 |
|
| | | 32,671,770 |
|
| HEALTH CARE PROVIDERS AND SERVICES — 3.3% |
| Cigna Corp. | 28,961 | 2,424,904 |
|
LifePoint Hospitals, Inc.(1) | 125,321 | 6,836,261 |
|
| Patterson Cos., Inc. | 98,160 | 4,099,162 |
|
| Quest Diagnostics, Inc. | 118,458 | 6,861,087 |
|
| | | 20,221,414 |
|
| HOTELS, RESTAURANTS AND LEISURE — 1.3% |
| Carnival Corp. | 124,650 | 4,719,249 |
|
| International Game Technology | 235,005 | 3,304,170 |
|
| | | 8,023,419 |
|
| HOUSEHOLD PRODUCTS — 0.2% |
| Energizer Holdings, Inc. | 13,680 | 1,378,123 |
|
| INDUSTRIAL CONGLOMERATES — 1.0% |
| Koninklijke Philips Electronics NV | 181,296 | 6,370,189 |
|
|
| | | | |
| | Shares | Value |
| INSURANCE — 7.8% |
| ACE Ltd. | 63,315 | $ | 6,271,984 |
|
| Aflac, Inc. | 42,510 | 2,679,830 |
|
| Allstate Corp. (The) | 64,692 | 3,660,273 |
|
| Arthur J Gallagher & Co. | 73,080 | 3,477,146 |
|
| Chubb Corp. (The) | 57,788 | 5,160,468 |
|
| HCC Insurance Holdings, Inc. | 131,392 | 5,977,022 |
|
| Marsh & McLennan Cos., Inc. | 52,099 | 2,568,481 |
|
| MetLife, Inc. | 49,160 | 2,595,648 |
|
| Reinsurance Group of America, Inc. | 82,709 | 6,586,118 |
|
| Symetra Financial Corp. | 87,873 | 1,741,643 |
|
| Travelers Cos., Inc. (The) | 37,648 | 3,203,845 |
|
| Unum Group | 99,564 | 3,515,605 |
|
| | | 47,438,063 |
|
| LIFE SCIENCES TOOLS AND SERVICES — 1.1% |
| Agilent Technologies, Inc. | 68,671 | 3,840,082 |
|
Bio-Rad Laboratories, Inc., Class A(1) | 23,170 | 2,968,541 |
|
| | | 6,808,623 |
|
| MACHINERY — 0.7% |
| Stanley Black & Decker, Inc. | 48,890 | 3,971,824 |
|
| METALS AND MINING — 1.7% |
Constellium NV, Class A(1) | 109,424 | 3,211,594 |
|
| Newmont Mining Corp. | 105,384 | 2,470,201 |
|
| Nucor Corp. | 92,268 | 4,663,225 |
|
| | | 10,345,020 |
|
| MULTI-UTILITIES — 3.3% |
| Ameren Corp. | 95,200 | 3,922,240 |
|
| Consolidated Edison, Inc. | 123,340 | 6,617,191 |
|
| NorthWestern Corp. | 63,630 | 3,017,971 |
|
| PG&E Corp. | 142,305 | 6,147,576 |
|
| | | 19,704,978 |
|
| MULTILINE RETAIL — 1.3% |
| Family Dollar Stores, Inc. | 33,550 | 1,946,236 |
|
| Target Corp. | 95,343 | 5,769,205 |
|
| | | 7,715,441 |
|
| OIL, GAS AND CONSUMABLE FUELS — 7.8% |
| Apache Corp. | 107,035 | 8,878,553 |
|
|
| | | | |
| | Shares | Value |
| Devon Energy Corp. | 89,683 | $ | 6,002,483 |
|
| Imperial Oil Ltd. | 359,892 | 16,759,150 |
|
| Murphy Oil Corp. | 79,971 | 5,026,977 |
|
Southwestern Energy Co.(1) | 123,769 | 5,694,612 |
|
| Williams Partners LP | 93,618 | 4,768,901 |
|
| | | 47,130,676 |
|
| PHARMACEUTICALS — 1.0% |
Hospira, Inc.(1) | 137,077 | 5,928,580 |
|
| REAL ESTATE INVESTMENT TRUSTS (REITs) — 4.1% |
| Annaly Capital Management, Inc. | 469,163 | 5,146,718 |
|
| Capstead Mortgage Corp. | 130,160 | 1,647,826 |
|
| Corrections Corp. of America | 190,074 | 5,953,118 |
|
| Empire State Realty Trust, Inc. | 197,282 | 2,980,931 |
|
| Federal Realty Investment Trust | 19,439 | 2,230,042 |
|
| Piedmont Office Realty Trust, Inc., Class A | 381,834 | 6,548,453 |
|
| | | 24,507,088 |
|
| ROAD AND RAIL — 0.7% |
| Heartland Express, Inc. | 77,952 | 1,768,731 |
|
| Werner Enterprises, Inc. | 97,104 | 2,477,123 |
|
| | | 4,245,854 |
|
| SEMICONDUCTORS AND SEMICONDUCTOR EQUIPMENT — 6.1% |
| Analog Devices, Inc. | 35,958 | 1,910,808 |
|
| Applied Materials, Inc. | 572,107 | 11,682,425 |
|
| KLA-Tencor Corp. | 60,340 | 4,171,908 |
|
| Maxim Integrated Products, Inc. | 132,237 | 4,379,689 |
|
| Microchip Technology, Inc. | 60,931 | 2,910,065 |
|
Micron Technology, Inc.(1) | 218,810 | 5,177,045 |
|
Teradyne, Inc.(1) | 346,015 | 6,882,238 |
|
| | | 37,114,178 |
|
| SPECIALTY RETAIL — 2.3% |
Bed Bath & Beyond, Inc.(1) | 25,421 | 1,748,965 |
|
| CST Brands, Inc. | 101,676 | 3,176,358 |
|
| Lowe's Cos., Inc. | 180,977 | 8,849,775 |
|
| | | 13,775,098 |
|
|
| | | | |
| | Shares | Value |
| TEXTILES, APPAREL AND LUXURY GOODS — 0.3% |
| Coach, Inc. | 36,487 | $ | 1,811,945 |
|
| THRIFTS AND MORTGAGE FINANCE — 1.4% |
| Capitol Federal Financial, Inc. | 107,097 | 1,344,067 |
|
| People's United Financial, Inc. | 479,469 | 7,129,704 |
|
| | | 8,473,771 |
|
| WIRELESS TELECOMMUNICATION SERVICES — 0.7% |
| Rogers Communications, Inc., Class B | 95,459 | 3,955,655 |
|
TOTAL COMMON STOCKS (Cost $474,668,741) | 579,286,037 |
|
| EXCHANGE-TRADED FUNDS — 1.6% |
iShares Russell Midcap Value Index Fund
(Cost $7,096,555) | 147,085 | 10,109,152 |
|
| TEMPORARY CASH INVESTMENTS — 2.5% |
| Repurchase Agreement, Bank of America Merrill Lynch, (collateralized by various U.S. Treasury obligations, 0.75% - 1.375%, 10/31/17 - 6/30/18, valued at $2,910,810), in a joint trading account at 0.03%, dated 3/31/14, due 4/1/14 (Delivery value $2,851,968) | 2,851,966 |
|
| Repurchase Agreement, Goldman Sachs & Co., (collateralized by various U.S. Treasury obligations, 4.25%, 8/15/15, valued at $2,560,163), in a joint trading account at 0.03%, dated 3/31/14, due 4/1/14 (Delivery value $2,509,732) | 2,509,730 |
|
| SSgA U.S. Government Money Market Fund | 9,669,387 | 9,669,387 |
|
TOTAL TEMPORARY CASH INVESTMENTS (Cost $15,031,083) | 15,031,083 |
|
TOTAL INVESTMENT SECURITIES — 100.0% (Cost $496,796,379) | 604,426,272 |
|
OTHER ASSETS AND LIABILITIES† | (226,091) |
|
| TOTAL NET ASSETS — 100.0% | $ | 604,200,181 |
|
|
| | | | | | | | |
| FORWARD FOREIGN CURRENCY EXCHANGE CONTRACTS |
| Currency Purchased | Currency Sold | Counterparty | Settlement Date | Unrealized Appreciation (Depreciation) |
| USD | 17,326,204 | CAD | 19,362,033 | JPMorgan Chase Bank N.A. | 4/30/14 | $ | (176,288 | ) |
| USD | 7,352,393 | EUR | 5,331,298 | UBS AG | 4/30/14 | 8,180 |
|
| USD | 253,414 | EUR | 184,458 | UBS AG | 4/30/14 | (689) |
|
| USD | 278,401 | EUR | 202,074 | UBS AG | 4/30/14 | 31 |
|
| USD | 1,266,789 | GBP | 765,727 | Credit Suisse AG | 4/30/14 | (9,522) |
|
| USD | 183,784 | GBP | 110,914 | Credit Suisse AG | 4/30/14 | (1,086) |
|
| USD | 321,507 | GBP | 193,500 | Credit Suisse AG | 4/30/14 | (1,018) |
|
| USD | 257,859 | GBP | 154,969 | Credit Suisse AG | 4/30/14 | (443) |
|
| USD | 493,238 | GBP | 295,795 | Credit Suisse AG | 4/30/14 | 208 |
|
| | | | | | | $ | (180,627 | ) |
|
| | |
| Notes to Schedule of Investments |
| CAD | - | Canadian Dollar |
| EUR | - | Euro |
| GBP | - | British Pound |
| USD | - | United States Dollar |
| |
| † | Category is less than 0.05% of total net assets. |
See Notes to Financial Statements.
|
|
| Statement of Assets and Liabilities |
|
| | | |
| MARCH 31, 2014 | |
| Assets | |
| Investment securities, at value (cost of $496,796,379) | $ | 604,426,272 |
|
| Receivable for investments sold | 7,150,893 |
|
| Receivable for capital shares sold | 56,098 |
|
| Unrealized appreciation on forward foreign currency exchange contracts | 8,419 |
|
| Dividends and interest receivable | 1,244,341 |
|
| | 612,886,023 |
|
| | |
| Liabilities | |
| Payable for investments purchased | 7,091,818 |
|
| Payable for capital shares redeemed | 1,001,733 |
|
| Unrealized depreciation on forward foreign currency exchange contracts | 189,046 |
|
| Accrued management fees | 403,245 |
|
| | 8,685,842 |
|
| | |
| Net Assets | $ | 604,200,181 |
|
| | |
| Net Assets Consist of: | |
| Capital (par value and paid-in surplus) | $ | 479,309,880 |
|
| Undistributed net investment income | 1,077,566
|
|
| Undistributed net realized gain | 16,363,484
|
|
| Net unrealized appreciation | 107,449,251 |
|
| | $ | 604,200,181 |
|
|
| | | | | |
| | Net Assets | Shares Outstanding | Net Asset Value Per Share |
| Institutional Class, $0.01 Par Value |
| $596,654,547 |
| 47,268,235 | $12.62 |
| R6 Class, $0.01 Par Value |
| $7,545,634 |
| 597,807 | $12.62 |
See Notes to Financial Statements.
|
| | | |
| YEAR ENDED MARCH 31, 2014 | |
| Investment Income (Loss) | |
| Income: | |
| Dividends (net of foreign taxes withheld of $37,875) | $ | 11,884,773 |
|
| Interest | 2,116 |
|
| | 11,886,889 |
|
| | |
| Expenses: | |
| Management fees | 4,036,522 |
|
| Directors' fees and expenses | 12,184 |
|
| | 4,048,706 |
|
| | |
| Net investment income (loss) | 7,838,183 |
|
| | |
| Realized and Unrealized Gain (Loss) | |
| Net realized gain (loss) on: | |
| Investment transactions | 53,667,420 |
|
| Foreign currency transactions | 722,137 |
|
| | 54,389,557 |
|
| | |
| Change in net unrealized appreciation (depreciation) on: | |
| Investments | 36,214,001 |
|
| Translation of assets and liabilities in foreign currencies | (130,593) |
|
| | 36,083,408 |
|
| | |
| Net realized and unrealized gain (loss) | 90,472,965 |
|
| | |
| Net Increase (Decrease) in Net Assets Resulting from Operations | $ | 98,311,148 |
|
See Notes to Financial Statements.
|
|
| Statement of Changes in Net Assets |
|
| | | | | | |
| YEARS ENDED MARCH 31, 2014 AND MARCH 31, 2013 | |
| Increase (Decrease) in Net Assets | March 31, 2014 |
| March 31, 2013 |
|
| Operations | | |
| Net investment income (loss) | $ | 7,838,183 |
| $ | 6,408,428 |
|
| Net realized gain (loss) | 54,389,557 |
| 12,279,259 |
|
| Change in net unrealized appreciation (depreciation) | 36,083,408 |
| 44,510,715 |
|
| Net increase (decrease) in net assets resulting from operations | 98,311,148 |
| 63,198,402 |
|
| | | |
| Distributions to Shareholders | | |
| From net investment income: | | |
| Institutional Class | (7,498,492) |
| (7,183,304) |
|
| R6 Class | (35,203) |
| — |
|
| From net realized gains: | | |
| Institutional Class | (39,749,512) |
| (10,428,032) |
|
| R6 Class | (339,798) |
| — |
|
| Decrease in net assets from distributions | (47,623,005) |
| (17,611,336) |
|
| | | |
| Capital Share Transactions | | |
| Net increase (decrease) in net assets from capital share transactions | 130,035,223 |
| 76,021,382 |
|
| | | |
| Net increase (decrease) in net assets | 180,723,366 |
| 121,608,448 |
|
| | | |
| Net Assets | | |
| Beginning of period | 423,476,815 |
| 301,868,367 |
|
| End of period | $ | 604,200,181 |
| $ | 423,476,815 |
|
| | | |
| Undistributed net investment income | $ | 1,077,566 |
| $ | 887,028 |
|
See Notes to Financial Statements.
|
|
| Notes to Financial Statements |
MARCH 31, 2014
1. Organization
American Century Capital Portfolios, Inc. (the corporation) is registered under the Investment Company Act of 1940, as amended (the 1940 Act), as an open-end management investment company and is organized as a Maryland corporation. NT Mid Cap Value Fund (the fund) is one fund in a series issued by the corporation. The fund is diversified as defined under the 1940 Act. The fund’s investment objective is to seek long-term capital growth. Income is a secondary objective. The fund is not permitted to invest in securities issued by companies assigned the Global Industry Classification Standard for the tobacco industry.
The fund offers the Institutional Class and the R6 Class, which have different fees and expenses. The difference in the fee structures between the classes is not the result of any difference in advisory or custodial fees or other expenses related to management of the fund’s assets, which do not vary by class. The fund’s R6 Class shares are available for purchase exclusively by certain American Century Investments funds of funds that are offered only through employer-sponsored retirement plans where a financial intermediary provides retirement recordkeeping services to plan participants. Because financial intermediaries do not receive any service, distribution or administrative fees for offering such funds of funds, American Century Investment Management, Inc. (ACIM) (the investment advisor) is able to charge the R6 Class a lower unified management fee. Sale of the R6 Class commenced on July 26, 2013.
2. Significant Accounting Policies
The following is a summary of significant accounting policies consistently followed by the fund in preparation of its financial statements. The financial statements are prepared in conformity with accounting principles generally accepted in the United States of America, which may require management to make certain estimates and assumptions at the date of the financial statements. Actual results could differ from these estimates.
Investment Valuations — The fund determines the fair value of its investments and computes its net asset value per share at the close of regular trading (usually 4 p.m. Eastern time) on the New York Stock Exchange (NYSE) on each day the NYSE is open. The Board of Directors has adopted valuation policies and procedures to guide the investment advisor in the fund’s investment valuation process and to provide methodologies for the oversight of the fund’s pricing function.
Equity securities that are listed or traded on a domestic securities exchange are valued at the last reported sales price or at the official closing price as provided by the exchange. Equity securities traded on foreign securities exchanges are generally valued at the closing price of such securities on the exchange where primarily traded or at the close of the NYSE, if that is earlier. If no last sales price is reported, or if local convention or regulation so provides, the mean of the latest bid and asked prices may be used. Securities traded over-the-counter are valued at the mean of the latest bid and asked prices, the last sales price, or the official closing price. Equity securities initially expressed in local currencies are translated into U.S. dollars at the mean of the appropriate currency exchange rate at the close of the NYSE as provided by an independent pricing service.
Fixed income securities maturing within 60 days at the time of purchase may be valued at cost, plus or minus any amortized discount or premium or at the evaluated mean as provided by an independent pricing service. Evaluated mean prices are commonly derived through utilization of market models, which may consider, among other factors: trade data, quotations from dealers and active market makers, relevant yield curve and spread data, related sector levels, creditworthiness, trade data or market information on comparable securities, and other relevant security specific information.
Open-end management investment companies are valued at the reported net asset value per share. Repurchase agreements are valued at cost, which approximates fair value. Forward foreign currency exchange contracts are valued at the mean of the appropriate forward exchange rate at the close of the NYSE as provided by an independent pricing service.
If the fund determines that the market price for an investment is not readily available or the valuation methods mentioned above do not reflect an investment’s fair value, such investment is valued as determined in good faith by the Board of Directors or its delegate, in accordance with policies and procedures adopted by the Board of Directors. In its determination of fair value, the fund may review several factors including, but not
limited to, market information regarding the specific investment or comparable investments and correlation with other investment types, futures indices or general market indicators. Circumstances that may cause the fund to use these procedures to value an investment include, but are not limited to: an investment has been declared in default or is distressed; trading in a security has been suspended during the trading day or a security is not actively trading on its principal exchange; prices received from a regular pricing source are deemed unreliable; or there is a foreign market holiday and no trading occurred.
The fund monitors for significant events occurring after the close of an investment’s primary exchange but before the fund’s net asset value per share is determined. Significant events may include, but are not limited to: corporate announcements and transactions; governmental action and political unrest that could impact a specific investment or an investment sector; or armed conflicts, natural disasters and similar events that could affect investments in a specific country or region. The fund also monitors for significant fluctuations between domestic and foreign markets, as evidenced by the U.S. market or such other indicators that the Board of Directors, or its delegate, deems appropriate. If significant fluctuations in foreign markets are identified, the fund may apply a model-derived factor to the closing price of equity securities traded on foreign securities exchanges. The factor is based on observable market data as provided by an independent pricing service.
Security Transactions — Security transactions are accounted for as of the trade date. Net realized gains and losses are determined on the identified cost basis, which is also used for federal income tax purposes.
Investment Income — Dividend income less foreign taxes withheld, if any, is recorded as of the ex-dividend date. Distributions received on securities that represent a return of capital or long-term capital gain are recorded as a reduction of cost of investments and/or as a realized gain. The fund may estimate the components of distributions received that may be considered nontaxable distributions or long-term capital gain distributions for income tax purposes. Interest income is recorded on the accrual basis and includes accretion of discounts and amortization of premiums.
Foreign Currency Translations — All assets and liabilities initially expressed in foreign currencies are translated into U.S. dollars at prevailing exchange rates at period end. The fund may enter into spot foreign currency exchange contracts to facilitate transactions denominated in a foreign currency. Purchases and sales of investment securities, dividend and interest income, spot foreign currency exchange contracts, and expenses are translated at the rates of exchange prevailing on the respective dates of such transactions. Net realized and unrealized foreign currency exchange gains or losses related to investment securities are a component of net realized gain (loss) on investment transactions and change in net unrealized appreciation (depreciation) on investments, respectively.
Repurchase Agreements — The fund may enter into repurchase agreements with institutions that ACIM has determined are creditworthy pursuant to criteria adopted by the Board of Directors. The fund requires that the collateral, represented by securities, received in a repurchase transaction be transferred to the custodian in a manner sufficient to enable the fund to obtain those securities in the event of a default under the repurchase agreement. ACIM monitors, on a daily basis, the securities transferred to ensure the value, including accrued interest, of the securities under each repurchase agreement is equal to or greater than amounts owed to the fund under each repurchase agreement.
Joint Trading Account — Pursuant to an Exemptive Order issued by the Securities and Exchange Commission, the fund, along with certain other funds in the American Century Investments family of funds, may transfer uninvested cash balances into a joint trading account. These balances are invested in one or more repurchase agreements that are collateralized by U.S. Treasury or Agency obligations.
Income Tax Status — It is the fund’s policy to distribute substantially all net investment income and net realized gains to shareholders and to otherwise qualify as a regulated investment company under provisions of the Internal Revenue Code. Accordingly, no provision has been made for income taxes. The fund files U.S. federal, state, local and non-U.S. tax returns as applicable. The fund's tax returns are subject to examination by the relevant taxing authority until expiration of the applicable statute of limitations, which is generally three years from the date of filing but can be longer in certain jurisdictions. At this time, management believes there are no uncertain tax positions which, based on their technical merit, would not be sustained upon examination and for which it is reasonably possible that the total amounts of unrecognized tax benefits will significantly change in the next twelve months.
Multiple Class — All shares of the fund represent an equal pro rata interest in the net assets of the class to which such shares belong, and have identical voting, dividend, liquidation and other rights and the same terms and conditions, except for class specific expenses and exclusive rights to vote on matters affecting only
individual classes. Income, non-class specific expenses, and realized and unrealized capital gains and losses of the fund are allocated to each class of shares based on their relative net assets.
Distributions to Shareholders — Distributions from net investment income, if any, are generally declared and paid quarterly. Distributions from net realized gains, if any, are generally declared and paid annually.
Indemnifications — Under the corporation’s organizational documents, its officers and directors are indemnified against certain liabilities arising out of the performance of their duties to the fund. In addition, in the normal course of business, the fund enters into contracts that provide general indemnifications. The maximum exposure under these arrangements is unknown as this would involve future claims that may be made against a fund. The risk of material loss from such claims is considered by management to be remote.
3. Fees and Transactions with Related Parties
Certain officers and directors of the corporation are also officers and/or directors of American Century Companies, Inc. (ACC). The corporation’s investment advisor, ACIM, the corporation's distributor, American Century Investment Services, Inc. (ACIS), and the corporation’s transfer agent, American Century Services, LLC, are wholly owned, directly or indirectly, by ACC. Various funds issued by American Century Asset Allocation Portfolios, Inc. own, in aggregate, 100% of the shares of the fund. Related parties do not invest in the fund for the purpose of exercising management or control.
Management Fees — The corporation has entered into a management agreement with ACIM, under which ACIM provides the fund with investment advisory and management services in exchange for a single, unified management fee (the fee) per class. The agreement provides that all expenses of managing and operating the fund, except distribution and service fees, brokerage expenses, taxes, interest, fees and expenses of the independent directors (including legal counsel fees), and extraordinary expenses, will be paid by ACIM. The fee is computed and accrued daily based on each class's daily net assets and paid monthly in arrears. The annual management fee is 0.80% for the Institutional Class and 0.65% for the R6 Class.
Directors' Fees and Expenses — The Board of Directors is responsible for overseeing the investment advisor's management and operations of the fund. The directors receive detailed information about the fund and its investment advisor regularly throughout the year, and meet at least quarterly with management of the investment advisor to review reports about fund operations. Fees and expenses incurred in conjunction with the directors during the year ended March 31, 2014 are detailed in the Statement of Operations. The fund’s officers do not receive compensation from the fund.
4. Investment Transactions
Purchases and sales of investment securities, excluding short-term investments, for the year ended March 31, 2014 were $423,367,587 and $341,513,499, respectively.
5. Capital Share Transactions
Transactions in shares of the fund were as follows:
|
| | | | | | | | | | | | | | |
| | | Year ended March 31, 2014(1) | | Year ended March 31, 2013 |
| | | Shares | | Amount | | Shares | | Amount |
| Institutional Class/Shares Authorized | | 150,000,000 |
| | | | 150,000,000 |
| | |
| Sold | | 7,247,174 |
| | $ | 87,969,606 |
| | 9,692,195 |
| | $ | 99,175,277 |
|
| Issued in reinvestment of distributions | | 3,938,799 |
| | 47,248,004 |
| | 1,745,877 |
| | 17,611,336 |
|
| Redeemed | | (1,026,905 | ) | | (12,599,377 | ) | | (4,046,853 | ) | | (40,765,231 | ) |
| | | 10,159,068 |
| | 122,618,233 |
| | 7,391,219 |
| | 76,021,382 |
|
| R6 Class/Shares Authorized | | 50,000,000 |
| | | | N/A |
| | |
| Sold | | 645,784 |
| | 8,015,039 |
| | | | |
| Issued in reinvestment of distributions | | 31,226 |
| | 375,001 |
| | | | |
| Redeemed | | (79,203 | ) | | (973,050 | ) | | | | |
| | | 597,807 |
| | 7,416,990 |
| | | | |
| Net increase (decrease) | | 10,756,875 |
| | $ | 130,035,223 |
| | 7,391,219 |
| | $ | 76,021,382 |
|
(1) July 26, 2013 (commencement of sale) through March 31, 2014 for the R6 Class.
6. Fair Value Measurements
The fund’s investments valuation process is based on several considerations and may use multiple inputs to determine the fair value of the investments held by the fund. In conformity with accounting principles generally accepted in the United States of America, the inputs used to determine a valuation are classified into three broad levels.
| |
| • | Level 1 valuation inputs consist of unadjusted quoted prices in an active market for identical investments. |
| |
| • | Level 2 valuation inputs consist of direct or indirect observable market data (including quoted prices for comparable investments, evaluations of subsequent market events, interest rates, prepayment speeds, credit risk, etc.). These inputs also consist of quoted prices for identical investments initially expressed in local currencies that are adjusted through translation into U.S. dollars. |
| |
| • | Level 3 valuation inputs consist of unobservable data (including a fund’s own assumptions). |
The level classification is based on the lowest level input that is significant to the fair valuation measurement. The valuation inputs are not necessarily an indication of the risks associated with investing in these securities or other financial instruments.
The following is a summary of the level classifications as of period end. The Schedule of Investments provides additional information on the fund’s portfolio holdings.
|
| | | | | | | | | | | |
| | | Level 1 | | Level 2 | | Level 3 |
| Assets | | | | | | |
| Investment Securities | | | | | | |
| Common Stocks | | $ | 546,403,980 |
| | $ | 32,882,057 |
| | — |
|
| Exchange-Traded Funds | | 10,109,152 |
| | — |
| | — |
|
| Temporary Cash Investments | | 9,669,387 |
| | 5,361,696 |
| | — |
|
| | | $ | 566,182,519 |
| | $ | 38,243,753 |
| | — |
|
| Other Financial Instruments | | | | | | |
| Forward Foreign Currency Exchange Contracts | | — |
| | $ | 8,419 |
| | — |
|
| | | | | | | |
| Liabilities | | | | | | |
| Other Financial Instruments | | | | | | |
| Forward Foreign Currency Exchange Contracts | | — |
| | $ | (189,046 | ) | | — |
|
7. Derivative Instruments
Foreign Currency Risk — The fund is subject to foreign currency exchange rate risk in the normal course of pursuing its investment objectives. The value of foreign investments held by a fund may be significantly affected by changes in foreign currency exchange rates. The dollar value of a foreign security generally decreases when the value of the dollar rises against the foreign currency in which the security is denominated and tends to increase when the value of the dollar declines against such foreign currency. A fund may enter into forward foreign currency exchange contracts to reduce a fund's exposure to foreign currency exchange rate fluctuations. The net U.S. dollar value of foreign currency underlying all contractual commitments held by a fund and the resulting unrealized appreciation or depreciation are determined daily. Realized gain or loss is recorded upon the termination of the contract. Net realized and unrealized gains or losses occurring during the holding period of forward foreign currency exchange contracts are a component of net realized gain (loss) on foreign currency transactions and change in net unrealized appreciation (depreciation) on translation of assets and liabilities in foreign currencies, respectively. A fund bears the risk of an unfavorable change in the foreign currency exchange rate underlying the forward contract. Additionally, losses, up to the fair value, may arise if the counterparties do not perform under the contract terms. The foreign currency risk derivative instruments held at period end as disclosed on the Schedule of Investments are indicative of the fund's typical volume during the period.
The value of foreign currency risk derivative instruments as of March 31, 2014, is disclosed on the Statement of Assets and Liabilities as an asset of $8,419 in unrealized appreciation on forward foreign currency exchange contracts and a liability of $189,046 in unrealized depreciation on forward foreign currency exchange contracts. For the year ended March 31, 2014, the effect of foreign currency risk derivative
instruments on the Statement of Operations was $703,636 in net realized gain (loss) on foreign currency transactions and $(130,141) in change in net unrealized appreciation (depreciation) on translation of assets and liabilities in foreign currencies.
8. Risk Factors
There are certain risks involved in investing in foreign securities. These risks include those resulting from future adverse political, social and economic developments, fluctuations in currency exchange rates, the possible imposition of exchange controls, and other foreign laws or restrictions.
9. Federal Tax Information
The tax character of distributions paid during the years ended March 31, 2014 and March 31, 2013 were as follows:
|
| | | | | | |
| | 2014 | 2013 |
| Distributions Paid From | | |
| Ordinary income | $ | 22,785,750 |
| $ | 13,542,267 |
|
| Long-term capital gains | $ | 24,837,255 |
| $ | 4,069,069 |
|
The book-basis character of distributions made during the year from net investment income or net realized gains may differ from their ultimate characterization for federal income tax purposes. These differences reflect the differing character of certain income items and net realized gains and losses for financial statement and tax purposes, and may result in reclassification among certain capital accounts on the financial statements.
As of March 31, 2014, the federal tax cost of investments and the components of distributable earnings on a tax-basis were as follows:
|
| | | |
| Federal tax cost of investments | $ | 503,959,941 |
|
| Gross tax appreciation of investments | $ | 106,260,229 |
|
| Gross tax depreciation of investments | (5,793,898 | ) |
| Net tax appreciation (depreciation) of investments | $ | 100,466,331 |
|
| Net tax appreciation (depreciation) on derivatives and translation of assets and liabilities in foreign currencies | $ | (1,866 | ) |
| Net tax appreciation (depreciation) | $ | 100,464,465 |
|
| Undistributed ordinary income | $ | 12,368,915 |
|
| Accumulated long-term gains | $ | 12,056,921 |
|
The difference between book-basis and tax-basis unrealized appreciation (depreciation) is attributable primarily to the tax deferral of losses on wash sales.
|
| | | | | | | | | | | | | | | |
| For a Share Outstanding Throughout the Years Ended March 31 (except as noted) |
| Per-Share Data | | | | | | | Ratios and Supplemental Data |
| | | Income From Investment Operations: | Distributions From: | | | Ratio to Average Net Assets of: | |
| | Net Asset
Value,
Beginning
of Period | Net
Investment
Income
(Loss)(1) | Net
Realized
and
Unrealized
Gain (Loss) | Total From
Investment
Operations | Net
Investment
Income | Net
Realized
Gains | Total
Distributions | Net Asset
Value,
End
of Period | Total
Return(2) | Operating
Expenses | Net
Investment
Income
(Loss) | Portfolio
Turnover
Rate | Net
Assets,
End of
Period
(in thousands) |
| Institutional Class | | | | | | | | | | | | |
| 2014 | $11.41 | 0.19 | 2.15 | 2.34 | (0.18) | (0.95) | (1.13) | $12.62 | 21.19% | 0.80% | 1.55% | 69% |
| $596,655 |
|
| 2013 | $10.16 | 0.19 | 1.59 | 1.78 | (0.22) | (0.31) | (0.53) | $11.41 | 18.32% | 0.80% | 1.89% | 71% |
| $423,477 |
|
| 2012 | $10.70 | 0.20 | 0.22 | 0.42 | (0.14) | (0.82) | (0.96) | $10.16 | 4.93% | 0.81% | 2.01% | 82% |
| $301,868 |
|
| 2011 | $9.73 | 0.23 | 1.45 | 1.68 | (0.23) | (0.48) | (0.71) | $10.70 | 17.91% | 0.80% | 2.35% | 102% |
| $216,381 |
|
| 2010 | $6.25 | 0.17 | 3.45 | 3.62 | (0.14) | — | (0.14) | $9.73 | 58.29% | 0.80% | 1.98% | 143% |
| $137,729 |
|
| R6 Class | | | | | | | | | | | | | |
2014(3) | $12.30 | 0.14 | 1.26 | 1.40 | (0.13) | (0.95) | (1.08) | $12.62 | 11.89% | 0.65%(4) | 1.70%(4) | 69%(5) |
| $7,546 |
|
|
| | | | |
| Notes to Financial Highlights | | |
| |
| |
| (1) | Computed using average shares outstanding throughout the period. |
| |
| (2) | Total returns are calculated based on the net asset value of the last business day. Total returns for periods less than one year are not annualized. |
| |
| (3) | July 26, 2013 (commencement of sale) through March 31, 2014. |
| |
| (5) | Portfolio turnover is calculated at the fund level. Percentage indicated was calculated for the year ended March 31, 2014. |
See Notes to Financial Statements.
|
|
| Report of Independent Registered Public Accounting Firm |
To the Board of Directors and Shareholders of
American Century Capital Portfolios, Inc.:
We have audited the accompanying statement of assets and liabilities, including the schedule of investments, of NT Mid Cap Value Fund (the “Fund”), one of the funds constituting American Century Capital Portfolios, Inc., as of March 31, 2014, and the related statement of operations for the year then ended, the statements of changes in net assets for each of the two years in the period then ended, and the financial highlights for each of the periods presented. These financial statements and financial highlights are the responsibility of the Fund's management. Our responsibility is to express an opinion on these financial statements and financial highlights based on our audits.
We conducted our audits in accordance with the standards of the Public Company Accounting Oversight Board (United States). Those standards require that we plan and perform the audit to obtain reasonable assurance about whether the financial statements and financial highlights are free of material misstatement. The Fund is not required to have, nor were we engaged to perform, an audit of its internal control over financial reporting. Our audits included consideration of internal control over financial reporting as a basis for designing audit procedures that are appropriate in the circumstances, but not for the purpose of expressing an opinion on the effectiveness of the Fund's internal control over financial reporting. Accordingly, we express no such opinion. An audit also includes examining, on a test basis, evidence supporting the amounts and disclosures in the financial statements, assessing the accounting principles used and significant estimates made by management, as well as evaluating the overall financial statement presentation. Our procedures included confirmation of securities owned as of March 31, 2014, by correspondence with the custodian and brokers; where replies were not received from brokers, we performed other auditing procedures. We believe that our audits provide a reasonable basis for our opinion.
In our opinion, the financial statements and financial highlights referred to above present fairly, in all material respects, the financial position of NT Mid Cap Value Fund of American Century Capital Portfolios, Inc. as of March 31, 2014, the results of its operations for the year then ended, the changes in its net assets for each of the two years in the period then ended, and the financial highlights for each of the periods presented, in conformity with accounting principles generally accepted in the United States of America.
Deloitte & Touche LLP
Kansas City, Missouri
May 16, 2014
The Board of Directors
The individuals listed below serve as directors of the funds. Each director will continue to serve in this capacity until death, retirement, resignation or removal from office. The board has adopted a mandatory retirement age for directors who are not “interested persons,” as that term is defined in the Investment Company Act (independent directors). Independent directors shall retire by December 31 of the year in which they reach their 75th birthday.
Mr. Thomas is an “interested person” because he currently serves as President and Chief Executive Officer of American Century Companies, Inc. (ACC), the parent company of American Century Investment Management, Inc. (ACIM or the advisor). Mr. Fink is treated as an “interested person” because of his recent employment with ACC and American Century Services, LLC (ACS). The other directors (more than three-fourths of the total number) are independent. They are not employees, directors or officers of, and have no financial interest in, ACC or any of its wholly owned, direct or indirect, subsidiaries, including ACIM, American Century Investment Services, Inc. (ACIS) and ACS, and do not have any other affiliations, positions, or relationships that would cause them to be considered “interested persons” under the Investment Company Act. The directors serve in this capacity for seven (in the case of Mr. Thomas, 15) registered investment companies in the American Century Investments family of funds.
The following table presents additional information about the directors. The mailing address for each director is 4500 Main Street, Kansas City, Missouri 64111.
|
| | | | | |
Name (Year of Birth) | Position(s) Held with Funds | Length of Time Served | Principal Occupation(s) During Past 5 Years | Number of American Century Portfolios Overseen by Director | Other Directorships Held During Past
5 Years |
| Independent Directors |
Thomas A. Brown
(1940) | Director | Since 1980 | Managing Member, Associated Investments, LLC (real estate investment company); Brown Cascade Properties, LLC (real estate investment company) (2001 to 2009) | 73 | None |
Andrea C. Hall
(1945) | Director | Since 1997 | Retired | 73 | None |
Jan M. Lewis
(1957) | Director | Since 2011 | Retired; President and Chief Executive Officer, Catholic Charities of Northeast Kansas (human services organization) (2006 to 2013) | 73 | None |
James A. Olson
(1942) | Director and Chairman of the Board | Since 2007 (Chairman since 2014) | Member, Plaza Belmont LLC (private equity fund manager) | 73 | Saia, Inc. (2002 to 2012) and EPR Properties (2003 to 2013) |
|
| | | | | |
Name (Year of Birth) | Position(s) Held with Funds | Length of Time Served | Principal Occupation(s) During Past 5 Years | Number of American Century Portfolios Overseen by Director | Other Directorships Held During Past
5 Years |
| Independent Directors |
M. Jeannine Strandjord
(1945) | Director | Since 1994 | Retired | 73 | Euronet Worldwide Inc.; Charming Shoppes, Inc. (2006 to 2010); and DST Systems Inc. (1996 to 2012) |
John R. Whitten
(1946) | Director | Since 2008 | Retired | 73 | Rudolph Technologies, Inc. |
Stephen E. Yates
(1948) | Director | Since 2012 | Retired; Executive Vice President, Technology & Operations, KeyCorp. (computer services) (2004 to 2010) | 73 | Applied Industrial Technologies, Inc. (2001 to 2010) |
| Interested Directors | | | | |
Barry Fink
(1955) | Director | Since 2012 | Retired; Executive Vice President, ACC (September 2007 to February 2013); President, ACS (October 2007 to February 2013); Chief Operating Officer, ACC (September 2007 to November 2012) | 73 | None |
Jonathan S. Thomas
(1963) | Director and President | Since 2007 | President and Chief Executive Officer, ACC (March 2007 to present). Also serves as Chief Executive Officer and Manager, ACS; Executive Vice President, ACIM; Director, ACC, ACIM and other ACC subsidiaries | 115 | None |
Officers
The following table presents certain information about the executive officers of the funds. Each officer serves as an officer for each of the 15 investment companies in the American Century family of funds, unless otherwise noted. No officer is compensated for his or her service as an officer of the funds. The listed officers are interested persons of the funds and are appointed or re-appointed on an annual basis. The mailing address for each officer listed below is 4500 Main Street, Kansas City, Missouri 64111.
|
| | |
Name (Year of Birth) | Offices with
the Funds | Principal Occupation(s) During the Past Five Years |
Jonathan S.
Thomas
(1963) | Director and
President
since 2007 | President and Chief Executive Officer, ACC (March 2007 to present). Also serves as Chief Executive Officer and Manager, ACS; Executive Vice President, ACIM; Director, ACC, ACIM and other ACC subsidiaries |
Amy D. Shelton
(1964) | Chief Compliance
Officer since 2014 | Chief Compliance Officer, American Century funds, (March 2014 to present); Chief Compliance Officer, ACIM (February 2014 to present); Chief Compliance Officer, ACIS (October 2009 to present); Vice President, Client Interactions and Marketing, ACIS (February 2013 to January 2014); Director, Client Interactions and Marketing, ACIS (June 2007 to January 2013). Also serves as Vice President, ACIS |
Charles A.
Etherington
(1957) | General Counsel
since 2007 and
Senior Vice
President since 2006 | Attorney, ACC (February 1994 to present); Vice President, ACC (November 2005 to present); General Counsel, ACC (March 2007 to present). Also serves as General Counsel, ACIM, ACS, ACIS and other ACC subsidiaries; and Senior Vice President, ACIM and ACS |
C. Jean Wade
(1964) | Vice President,
Treasurer and
Chief Financial
Officer since 2012 | Vice President, ACS (February 2000 to present) |
Robert J.
Leach
(1966) | Vice President
since 2006 and
Assistant Treasurer
since 2012 | Vice President, ACS (February 2000 to present) |
David H.
Reinmiller
(1963) | Vice President
since 2000 | Attorney, ACC (January 1994 to present); Associate General Counsel, ACC (January 2001 to present). Also serves as Vice President, ACIM and ACS |
Ward D.
Stauffer
(1960) | Secretary
since 2005 | Attorney, ACC (June 2003 to present) |
The Statement of Additional Information has additional information about the fund's directors and is available without charge, upon request, by calling 1-800-345-2021.
Retirement Account Information
As required by law, distributions you receive from certain IRAs are subject to federal income tax withholding, unless you elect not to have withholding apply. Tax will be withheld on the total amount withdrawn even though you may be receiving amounts that are not subject to withholding, such as nondeductible contributions. In such case, excess amounts of withholding could occur. You may adjust your withholding election so that a greater or lesser amount will be withheld.
If you don’t want us to withhold on this amount, you must notify us to not withhold the federal income tax. You may notify us in writing or in certain situations by telephone or through other electronic means. For systematic withdrawals, your withholding election will remain in effect until revoked or changed by filing a new election. You have the right to revoke your election at any time.
Remember, even if you elect not to have income tax withheld, you are liable for paying income tax on the taxable portion of your withdrawal. If you elect not to have income tax withheld or you don’t have enough income tax withheld, you may be responsible for payment of estimated tax. You may incur penalties under the estimated tax rules if your withholding and estimated tax payments are not sufficient. You can reduce or defer the income tax on a distribution by directly or indirectly rolling such distribution over to another IRA or eligible plan. You should consult your tax advisor for additional information.
State tax will be withheld if, at the time of your distribution, your address is within one of the mandatory withholding states and you have federal income tax withheld (or as otherwise required by state law). State taxes will be withheld from your distribution in accordance with the respective state rules.
Distributions you receive from 403(b), 457 and qualified plans are subject to special tax and withholding rules. Your plan administrator or plan sponsor is required to provide you with a special tax notice explaining those rules at the time you request a distribution. If applicable, federal and/or state taxes may be withheld from your distribution amount.
Proxy Voting Policies
A description of the policies that the fund's investment advisor uses in exercising the voting rights associated with the securities purchased and/or held by the fund is available without charge, upon request, by calling 1-800-345-2021. It is also available on the "About Us" page of American Century Investments’ website at americancentury.com and on the Securities and Exchange Commission’s website at sec.gov. Information regarding how the investment advisor voted proxies relating to portfolio securities during the most recent 12-month period ended June 30 is available on the "About Us" page at americancentury.com. It is also available at sec.gov.
Quarterly Portfolio Disclosure
The fund files its complete schedule of portfolio holdings with the Securities and Exchange Commission (SEC) for the first and third quarters of each fiscal year on Form N-Q. The fund’s Forms N-Q are available on the SEC’s website at sec.gov, and may be reviewed and copied at the SEC’s Public Reference Room in Washington, DC. Information on the operation of the Public Reference Room may be obtained by calling 1-800-SEC-0330. The fund also makes its complete schedule of portfolio holdings for the most recent quarter of its fiscal year available on its
website at americancentury.com and, upon request, by calling 1-800-345-2021.
Other Tax Information
The following information is provided pursuant to provisions of the Internal Revenue Code.
The fund hereby designates up to the maximum amount allowable as qualified dividend income for the fiscal year ended March 31, 2014.
For corporate taxpayers, the fund hereby designates $9,059,998, or up to the maximum amount allowable, of ordinary income distributions paid during the fiscal year ended March 31, 2014 as qualified for the corporate dividends received deduction.
The fund hereby designates $15,252,055 as qualified short-term capital gain distributions for purposes of Internal Revenue Code Section 871.
The fund hereby designates $24,837,255, or up to the maximum amount allowable, as long-term capital gain distributions for the fiscal year ended March 31, 2014.
|
| | |
| |
| | | |
| Contact Us | americancentury.com | |
| Automated Information Line | 1-800-345-8765 | |
| Investor Services Representative | 1-800-345-2021 or 816-531-5575 | |
| Investors Using Advisors | 1-800-378-9878 | |
| Business, Not-For-Profit, Employer-Sponsored Retirement Plans | 1-800-345-3533 | |
| Banks and Trust Companies, Broker-Dealers, Financial Professionals, Insurance Companies | 1-800-345-6488 | |
| Telecommunications Relay Service for the Deaf | 711 | |
| | | |
| American Century Capital Portfolios, Inc. | |
| | | |
Investment Advisor: American Century Investment Management, Inc. Kansas City, Missouri | |
| | | |
| This report and the statements it contains are submitted for the general information of our shareholders. The report is not authorized for distribution to prospective investors unless preceded or accompanied by an effective prospectus. | |
| | | |
©2014 American Century Proprietary Holdings, Inc. All rights reserved.
CL-ANN-82114 1405
| |
|
| |
ANNUAL REPORT | MARCH 31, 2014 |
Small Cap Value Fund
|
| |
| President’s Letter | |
| Performance | |
| Portfolio Commentary | |
| Fund Characteristics | |
| Shareholder Fee Example | |
| Schedule of Investments | |
| Statement of Assets and Liabilities | |
| Statement of Operations | |
| Statement of Changes in Net Assets | |
| Notes to Financial Statements | |
| Financial Highlights | |
| Report of Independent Registered Public Accounting Firm | |
| Management | |
| Additional Information | |
Any opinions expressed in this report reflect those of the author as of the date of the report, and do not necessarily represent the opinions of American Century Investments® or any other person in the American Century Investments organization. Any such opinions are subject to change at any time based upon market or other conditions and American Century Investments disclaims any responsibility to update such opinions. These opinions may not be relied upon as investment advice and, because investment decisions made by American Century Investments funds are based on numerous factors, may not be relied upon as an indication of trading intent on behalf of any American Century Investments fund. Security examples are used for representational purposes only and are not intended as recommendations to purchase or sell securities. Performance information for comparative indices and securities is provided to American Century Investments by third party vendors. To the best of American Century Investments’ knowledge, such information is accurate at the time of printing.
|
| |
| Dear Investor:
Thank you for reviewing this annual report for the 12 months ended March 31, 2014. It provides investment performance, market analysis, and portfolio information, presented with the expert perspective of our portfolio management team.
Annual reports remain important vehicles for conveying information about fund returns, including key factors that affected fund performance. For additional, updated investment and market insights, we encourage you to visit our website, americancentury.com.
|
| Jonathan Thomas |
Monetary Policy-Driven, Mostly “Risk-On” Results in the U.S. and Europe
Stimulative monetary policies and expectations of economic improvement helped drive financial market returns during the reporting period. We believe the combination of optimism about the economy, low costs of capital in the money markets, and central bank purchases of longer-maturity fixed income securities (quantitative easing, or QE) helped persuade investors to seek risk and yield, especially in the U.S. and Europe. Stock index returns were strong in these markets, particularly at the smaller capitalization end of the company size spectrum. The MSCI Europe and S&P 500 Indices advanced 24.50% and 21.86%, respectively, and their smaller capitalization counterparts performed even better. In the U.S., growth stocks generally outperformed value stocks.
Some of the same growth and optimism factors that drove stocks higher, plus hints that QE tapering would begin in the U.S., hampered U.S. government bond returns, which dipped into negative territory for the reporting period. On the other hand, U.S. corporate bonds, especially high-yield corporates, posted mostly positive returns because of their higher yields, declining spreads (yield differences between corporate and similar-maturity U.S. Treasury securities), and relatively low default rates. At the other end of the U.S. bond spectrum, Treasury inflation-protected securities (TIPS) underperformed, hurt by the combination of rising yields and low inflation.
Looking ahead, we see further signs of economic improvement for the U.S. in 2014, but headwinds persist. Interest rates could normalize further, and economic growth and U.S. employment levels remain subpar compared with past post-recession periods. In this environment, we continue to believe in a disciplined, diversified, long-term investment approach, using professionally managed stock and bond portfolios—as appropriate—for meeting financial goals. We appreciate your continued trust in us.
Sincerely,
Jonathan Thomas
President and Chief Executive Officer
American Century Investments
|
| | | | | | |
| Total Returns as of March 31, 2014 | |
| | | | Average Annual Returns | |
| | Ticker Symbol | 1 year | 5 years | 10 years | Since
Inception | Inception
Date |
| Investor Class | ASVIX | 23.27% | 24.01% | 10.04% | 12.34% | 7/31/98 |
| Russell 2000 Value Index | – | 22.65% | 23.32% | 8.07% | 9.30% | – |
| Institutional Class | ACVIX | 23.45% | 24.29% | 10.26% | 13.02% | 10/26/98 |
A Class(1) | ACSCX | | | | | 12/31/99 |
| No sales charge* | | 22.92% | 23.67% | 9.76% | 13.18% | |
| With sales charge* | | 15.89% | 22.19% | 9.11% | 12.71% | |
| C Class | ASVNX | 21.94% | – | – | 13.99% | 3/1/10 |
| R Class | ASVRX | 22.64% | – | – | 14.60% | 3/1/10 |
| R6 Class | ASVDX | – | – | – | 12.46%(2) | 7/26/13 |
| |
| * | Sales charges include initial sales charges and contingent deferred sales charges (CDSCs), as applicable. A Class shares have a 5.75% maximum initial sales charge and may be subject to a maximum CDSC of 1.00%. C Class shares redeemed within 12 months of purchase are subject to a maximum CDSC of 1.00%. The SEC requires that mutual funds provide performance information net of maximum sales charges in all cases where charges could be applied. |
| |
| (1) | Prior to March 1, 2010, the A Class was referred to as the Advisor Class and did not have a front-end sales charge. Performance prior to that date has been adjusted to reflect this charge. |
| |
| (2) | Total returns for periods less than one year are not annualized. |
Data presented reflect past performance. Past performance is no guarantee of future results. Current performance may be higher or lower than the performance shown. Investment return and principal value will fluctuate, and redemption value may be more or less than original cost. To obtain performance data current to the most recent month end, please call 1-800-345-2021 or visit americancentury.com. Historically, small company stocks have been more volatile than the stocks of larger, more established companies. The fund’s investment process may result in high portfolio turnover, which could mean high transaction costs, affecting both performance and capital gains tax liabilities to investors.
Unless otherwise indicated, performance reflects Investor Class shares; performance for other share classes will vary due to differences in fee structure. For information about other share classes available, please consult the prospectus. Data assumes reinvestment of dividends and capital gains, and none of the charts reflect the deduction of taxes that a shareholder would pay on fund distributions or the redemption of fund shares. Returns for the index are provided for comparison. The fund’s total returns include operating expenses (such as transaction costs and management fees) that reduce returns, while the total returns of the index do not.
|
|
| Growth of $10,000 Over 10 Years |
$10,000 investment made March 31, 2004 |
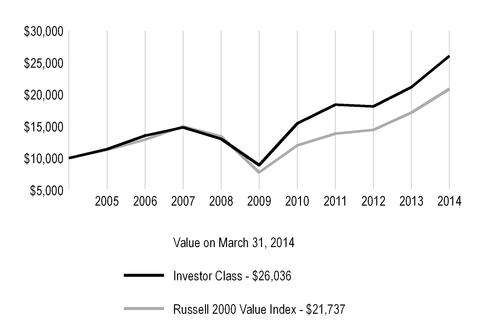
|
| | | | | |
| Total Annual Fund Operating Expenses |
| Investor Class | Institutional Class | A Class | C Class | R Class | R6 Class |
| 1.42% | 1.22% | 1.67% | 2.42% | 1.92% | 1.07% |
The total annual fund operating expenses shown is as stated in the fund’s prospectus current as of the date of this report. The prospectus may vary from the expense ratio shown elsewhere in this report because it is based on a different time period, includes acquired fund fees and expenses, and, if applicable, does not include fee waivers or expense reimbursements.
Data presented reflect past performance. Past performance is no guarantee of future results. Current performance may be higher or lower than the performance shown. Investment return and principal value will fluctuate, and redemption value may be more or less than original cost. To obtain performance data current to the most recent month end, please call 1-800-345-2021 or visit americancentury.com. Historically, small company stocks have been more volatile than the stocks of larger, more established companies. The fund’s investment process may result in high portfolio turnover, which could mean high transaction costs, affecting both performance and capital gains tax liabilities to investors.
Unless otherwise indicated, performance reflects Investor Class shares; performance for other share classes will vary due to differences in fee structure. For information about other share classes available, please consult the prospectus. Data assumes reinvestment of dividends and capital gains, and none of the charts reflect the deduction of taxes that a shareholder would pay on fund distributions or the redemption of fund shares. Returns for the index are provided for comparison. The fund’s total returns include operating expenses (such as transaction costs and management fees) that reduce returns, while the total returns of the index do not.
Portfolio Managers: Ben Giele and Jeff John
Performance Summary
Small Cap Value returned 23.27%* for the 12 months ended March 31, 2014. By comparison, its benchmark, the Russell 2000 Value Index, returned 22.65%. The portfolio’s returns reflect operating expenses, while the index’s return does not.
The U.S. stock market generated strong gains during the one-year reporting period. When the period began, riskier asset classes led the market, as the Federal Reserve’s (Fed) bond-buying programs continued. Market leadership changed after the Fed suggested it might start tapering its asset purchases if economic conditions improved. Higher-quality stocks came into favor and as interest rates rose, higher-yielding stocks, such as real estate investment trusts (REITs) and utilities, declined. As the Fed sought to calm fears about eventual tapering, riskier stocks posted gains, but they reversed direction in mid-August on positive economic data, which suggested the Fed might announce tapering as soon as September. After the Fed surprised the markets by making no changes to its stimulus programs, lower-quality, riskier stocks rallied and continued to outperform through the end of 2013. In December, the U.S. economy showed new signs of strength and the Fed announced it would begin modestly scaling back its asset purchases in January 2014. As interest rates trended down in the last three months of the reporting period, yield-oriented securities, including utilities and REITs, rallied. For the reporting period overall, riskier, lower-yielding, and lower-quality stocks outperformed. Though value stocks recorded significant gains, they underperformed growth stocks. Small-cap value stocks slightly underperformed mid-cap value stocks and outperformed large-cap value stocks. In this environment, Small Cap Value provided positive absolute results in nine of the 10 sectors in which it was invested. It also outperformed the benchmark because of security selection and its sector allocations.
We carefully manage this portfolio for long-term results. Since Small Cap Value’s inception on July 31, 1998, the portfolio has produced an average annual return of 12.34%, outpacing the returns of the Russell 2000 Value Index for the same period (see performance information on pages 3 and 4).
Consumer Discretionary Added to Results
An overweight position relative to the benchmark in consumer discretionary, one of the strongest-performing sectors in the benchmark, was advantageous. The portfolio also benefited from its overweight positions in media stocks, including Entravision, LIN Media, Nexstar Broadcasting Group, and Media General. Broadcasters have worked hard to reduce their debt burdens and are benefiting from the recovery in advertising spending, especially by automakers.
The consumer discretionary sector also provided notable detractor Conn’s, a specialty retailer that provides financing for the purchase of durable consumer products. Conn’s stock declined as delinquency rates increased and investors became concerned about the quality of the company’s credit portfolio. The stock regained some ground near the end of the reporting period, as the company’s delinquency rates improved.
*All fund returns referenced in this commentary are for Investor Class shares.
Industrials and Financials Enhanced Performance
In industrials, the portfolio owned GrafTech International, the largest producer of graphite electrodes essential to the manufacture of steel in electric arc furnaces. Management announced a 20% reduction in production capacity, which seemed likely to boost the company’s near-term profit margins.
Within financials, an underweight position in REITs added to relative returns. REITs, which are sensitive to interest rates, declined in the benchmark as interest rates increased. For some time, we have considered REITs generally overvalued and too highly levered.
Consumer Staples and Information Technology Added Value
In consumer staples, the portfolio benefited from an overweight position in Rite Aid, which appreciated on better-than-expected results—as improved expense controls drove solid margin gains. The drugstore chain also refinanced debt, which increased free-cash-flow generation.
An overweight position and security selection in the information technology sector contributed positively. The portfolio benefited from an investment in Websense, which was acquired by Vista Equity Partners at an attractive price. Websense is an example of the out-of-favor names we prefer—a company that might successfully reorganize or could potentially be acquired. In IT services, the portfolio owned VeriFone Systems, a provider of secure electronic POS solutions, which appreciated on better-than-expected quarterly earnings. As new management focuses on getting the company’s payment terminals certified for sale in foreign countries, VeriFone is regaining market share it had previously lost.
Energy, Health Care, and Materials Slowed Performance
The portfolio was hampered by its exposure to oil refiners. Many of these stocks trade in line with the spread between Brent and West Texas Intermediate oil, which narrowed during 2013 and put pressure on refiners’ profit margins. Two key detractors were PBF Energy and Alon USA Partners.
An underweight position in health care, the strongest-performing sector in the benchmark, hampered relative results. Security selection in health equipment and supplies, including an overweight position in Orthofix International, also dampened performance. The medical device company reported an unspecified revenue recognition problem and its share price declined.
In the materials sector, the portfolio was constrained by its investment in Intrepid Potash. The stock declined after a Russian competitor pulled out of a sales partnership with the nation of Belarus, abruptly ending a global cartel in the potash market and driving down prices. We eliminated the position during the reporting period.
Outlook
We continue to be bottom-up investment managers, building the portfolio one stock at a time, a process that results in exposure to market segments based on the attractiveness of individual companies in terms of their valuation and fundamentals. As of March 31, 2014, we saw attractive opportunities in materials, consumer discretionary, and information technology, as reflected by the portfolio’s overweight positions in these sectors. Conversely, smaller relative weightings were given to the financials, utilities, health care, and energy sectors.
|
| |
| MARCH 31, 2014 |
| Top Ten Holdings | % of net assets |
| BankUnited, Inc. | 1.4% |
| Multi-Color Corp. | 1.4% |
| Berry Plastics Group, Inc. | 1.3% |
| Entravision Communications Corp., Class A | 1.2% |
| Texas Capital Bancshares, Inc. | 1.1% |
| Tronox Ltd. Class A | 1.0% |
| American Science & Engineering, Inc. | 0.9% |
| Innophos Holdings, Inc. | 0.9% |
| Kulicke & Soffa Industries, Inc. | 0.9% |
| Global Brass & Copper Holdings, Inc. | 0.9% |
| | |
| Top Five Industries | % of net assets |
| Commercial Banks | 13.4% |
| Real Estate Investment Trusts (REITs) | 9.9% |
| Media | 4.5% |
| Machinery | 4.4% |
| Oil, Gas and Consumable Fuels | 4.0% |
| | |
| Types of Investments in Portfolio | % of net assets |
| Common Stocks | 98.5% |
| Convertible Preferred Stocks | 0.5% |
| Exchange-Traded Funds | 0.5% |
| Total Equity Exposure | 99.5% |
| Temporary Cash Investments | 0.6% |
| Other Assets and Liabilities | (0.1)% |
Fund shareholders may incur two types of costs: (1) transaction costs, including sales charges (loads) on purchase payments and redemption/exchange fees; and (2) ongoing costs, including management fees; distribution and service (12b-1) fees; and other fund expenses. This example is intended to help you understand your ongoing costs (in dollars) of investing in your fund and to compare these costs with the ongoing cost of investing in other mutual funds.
The example is based on an investment of $1,000 made at the beginning of the period and held for the entire period from October 1, 2013 to March 31, 2014.
Actual Expenses
The table provides information about actual account values and actual expenses for each class. You may use the information, together with the amount you invested, to estimate the expenses that you paid over the period. First, identify the share class you own. Then simply divide your account value by $1,000 (for example, an $8,600 account value divided by $1,000 = 8.6), then multiply the result by the number under the heading “Expenses Paid During Period” to estimate the expenses you paid on your account during this period.
If you hold Investor Class shares of any American Century Investments fund, or Institutional Class shares of the American Century Diversified Bond Fund, in an American Century Investments account (i.e., not a financial intermediary or retirement plan account), American Century Investments may charge you a $12.50 semiannual account maintenance fee if the value of those shares is less than $10,000. We will redeem shares automatically in one of your accounts to pay the $12.50 fee. In determining your total eligible investment amount, we will include your investments in all personal accounts (including American Century Investments Brokerage accounts) registered under your Social Security number. Personal accounts include individual accounts, joint accounts, UGMA/UTMA accounts, personal trusts, Coverdell Education Savings Accounts and IRAs (including traditional, Roth, Rollover, SEP-, SARSEP- and SIMPLE-IRAs), and certain other retirement accounts. If you have only business, business retirement, employer-sponsored or American Century Investments Brokerage accounts, you are currently not subject to this fee. If you are subject to the Account Maintenance Fee, your account value could be reduced by the fee amount.
Hypothetical Example for Comparison Purposes
The table also provides information about hypothetical account values and hypothetical expenses based on the actual expense ratio of each class of your fund and an assumed rate of return of 5% per year before expenses, which is not the actual return of a fund’s share class. The hypothetical account values and expenses may not be used to estimate the actual ending account balance or expenses you paid for the period. You may use this information to compare the ongoing costs of investing in your fund and other funds. To do so, compare this 5% hypothetical example with the 5% hypothetical examples that appear in the shareholder reports of the other funds.
Please note that the expenses shown in the table are meant to highlight your ongoing costs only and do not reflect any transactional costs, such as sales charges (loads) or redemption/exchange fees. Therefore, the table is useful in comparing ongoing costs only, and will not help you determine the relative total costs of owning different funds. In addition, if these transactional costs were included, your costs would have been higher.
|
| | | | |
| | Beginning
Account Value
10/1/13 | Ending
Account Value
3/31/14 | Expenses Paid
During Period(1)
10/1/13 - 3/31/14 | Annualized
Expense Ratio(1) |
| Actual | | | | |
| Investor Class | $1,000 | $1,123.30 | $6.41 | 1.21% |
| Institutional Class | $1,000 | $1,124.30 | $5.35 | 1.01% |
| A Class | $1,000 | $1,121.00 | $7.72 | 1.46% |
| C Class | $1,000 | $1,116.30 | $11.66 | 2.21% |
| R Class | $1,000 | $1,120.10 | $9.04 | 1.71% |
| R6 Class | $1,000 | $1,123.60 | $4.55 | 0.86% |
| Hypothetical | | | | |
| Investor Class | $1,000 | $1,018.90 | $6.09 | 1.21% |
| Institutional Class | $1,000 | $1,019.90 | $5.09 | 1.01% |
| A Class | $1,000 | $1,017.65 | $7.34 | 1.46% |
| C Class | $1,000 | $1,013.91 | $11.10 | 2.21% |
| R Class | $1,000 | $1,016.41 | $8.60 | 1.71% |
| R6 Class | $1,000 | $1,020.64 | $4.33 | 0.86% |
| |
| (1) | Expenses are equal to the class's annualized expense ratio listed in the table above, multiplied by the average account value over the period, multiplied by 182, the number of days in the most recent fiscal half-year, divided by 365, to reflect the one-half year period. |
MARCH 31, 2014
|
| | | | | |
| | Shares | Value |
| COMMON STOCKS — 98.5% |
| AEROSPACE AND DEFENSE — 1.5% |
| AAR Corp. | 220,000 |
| $ | 5,709,000 |
|
| American Science & Engineering, Inc. | 310,000 |
| 20,822,700 |
|
KEYW Holding Corp. (The)(1) | 360,000 |
| 6,735,600 |
|
| | | 33,267,300 |
|
| AIRLINES — 0.3% |
JetBlue Airways Corp.(1) | 530,000 |
| 4,605,700 |
|
Spirit Airlines, Inc.(1) | 55,000 |
| 3,267,000 |
|
| | | 7,872,700 |
|
| AUTO COMPONENTS — 1.5% |
| Dana Holding Corp. | 490,000 |
| 11,402,300 |
|
| Superior Industries International, Inc. | 455,000 |
| 9,322,950 |
|
Tower International, Inc.(1) | 510,000 |
| 13,882,200 |
|
| | | 34,607,450 |
|
| BUILDING PRODUCTS — 1.0% |
American Woodmark Corp.(1) | 225,000 |
| 7,573,500 |
|
Continental Building Products, Inc.(1) | 410,000 |
| 7,724,400 |
|
NCI Building Systems, Inc.(1) | 415,000 |
| 7,245,900 |
|
| | | 22,543,800 |
|
| CAPITAL MARKETS — 1.1% |
| Manning & Napier, Inc. | 440,000 |
| 7,378,800 |
|
| PennantPark Investment Corp. | 375,000 |
| 4,143,750 |
|
| Solar Capital Ltd. | 315,000 |
| 6,860,700 |
|
Stifel Financial Corp.(1) | 115,033 |
| 5,724,042 |
|
| | | 24,107,292 |
|
| CHEMICALS — 3.9% |
Chemtura Corp.(1) | 535,000 |
| 13,530,150 |
|
| Hawkins, Inc. | 210,000 |
| 7,715,400 |
|
| Innophos Holdings, Inc. | 365,000 |
| 20,695,500 |
|
|
| | | | | |
| | Shares | Value |
| Kronos Worldwide, Inc. | 255,000 |
| $ | 4,253,400 |
|
LSB Industries, Inc.(1) | 263,899 |
| 9,875,100 |
|
| Minerals Technologies, Inc. | 70,000 |
| 4,519,200 |
|
| Sensient Technologies Corp. | 100,000 |
| 5,641,000 |
|
Tronox Ltd. Class A | 985,000 |
| 23,413,450 |
|
| | | 89,643,200 |
|
| COMMERCIAL BANKS ��� 13.4% |
| American National Bankshares, Inc. | 321,341 |
| 7,557,940 |
|
| Bank of the Ozarks, Inc. | 65,000 |
| 4,423,900 |
|
| BankUnited, Inc. | 935,000 |
| 32,509,950 |
|
| Boston Private Financial Holdings, Inc. | 330,000 |
| 4,464,900 |
|
| Commerce Bancshares, Inc. | 140,064 |
| 6,501,771 |
|
| F.N.B. Corp. | 1,235,000 |
| 16,549,000 |
|
| First Horizon National Corp. | 1,060,000 |
| 13,080,400 |
|
| First Interstate Bancsystem, Inc. | 350,000 |
| 9,877,000 |
|
First NBC Bank Holding Co.(1) | 320,000 |
| 11,155,200 |
|
| First Niagara Financial Group, Inc. | 555,000 |
| 5,244,750 |
|
| FirstMerit Corp. | 440,000 |
| 9,165,200 |
|
| Flushing Financial Corp. | 270,000 |
| 5,688,900 |
|
| Fulton Financial Corp. | 510,000 |
| 6,415,800 |
|
| Heritage Financial Corp. | 365,000 |
| 6,175,800 |
|
| Home Bancshares, Inc. | 445,000 |
| 15,316,900 |
|
| Lakeland Financial Corp. | 165,000 |
| 6,636,300 |
|
| MB Financial, Inc. | 265,000 |
| 8,204,400 |
|
| National Bankshares, Inc. | 238,542 |
| 8,709,169 |
|
| OFG Bancorp | 1,020,000 |
| 17,533,800 |
|
| Pacific Continental Corp. | 328,687 |
| 4,522,733 |
|
|
| | | | | |
| | Shares | Value |
| Park Sterling Corp. | 1,200,000 |
| $ | 7,980,000 |
|
Popular, Inc.(1) | 445,000 |
| 13,790,550 |
|
| PrivateBancorp, Inc. | 315,000 |
| 9,610,650 |
|
| Prosperity Bancshares, Inc. | 85,000 |
| 5,622,750 |
|
| TCF Financial Corp. | 335,000 |
| 5,581,100 |
|
Texas Capital Bancshares, Inc.(1) | 370,000 |
| 24,027,800 |
|
| Valley National Bancorp | 1,665,000 |
| 17,332,650 |
|
| ViewPoint Financial Group, Inc. | 515,000 |
| 14,857,750 |
|
| Washington Banking Co. | 318,532 |
| 5,663,499 |
|
| | | 304,200,562 |
|
| COMMERCIAL SERVICES AND SUPPLIES — 1.4% |
Multi-Color Corp.(2) | 899,286 |
| 31,475,010 |
|
| COMMUNICATIONS EQUIPMENT — 1.6% |
CommScope Holding Co., Inc.(1) | 288,501 |
| 7,120,205 |
|
Polycom, Inc.(1) | 1,045,000 |
| 14,337,400 |
|
Riverbed Technology, Inc.(1) | 740,000 |
| 14,585,400 |
|
| | | 36,043,005 |
|
| COMPUTERS AND PERIPHERALS — 0.6% |
Silicon Graphics International Corp.(1) | 1,070,000 |
| 13,139,600 |
|
| CONSTRUCTION AND ENGINEERING — 1.8% |
| Granite Construction, Inc. | 255,000 |
| 10,182,150 |
|
Great Lakes Dredge & Dock Corp.(1) | 685,000 |
| 6,254,050 |
|
Northwest Pipe Co.(1) | 255,000 |
| 9,220,800 |
|
| URS Corp. | 320,000 |
| 15,059,200 |
|
| | | 40,716,200 |
|
| CONSTRUCTION MATERIALS — 0.2% |
Headwaters, Inc.(1) | 330,000 |
| 4,359,300 |
|
| CONTAINERS AND PACKAGING — 2.2% |
Berry Plastics Group, Inc.(1) | 1,310,000 |
| 30,326,500 |
|
Graphic Packaging Holding Co.(1) | 1,915,000 |
| 19,456,400 |
|
| | | 49,782,900 |
|
|
| | | | | |
| | Shares | Value |
| DIVERSIFIED CONSUMER SERVICES — 0.9% |
| Sotheby's | 130,000 |
| $ | 5,661,500 |
|
Steiner Leisure, Ltd.(1) | 325,000 |
| 15,031,250 |
|
| | | 20,692,750 |
|
| DIVERSIFIED FINANCIAL SERVICES — 0.7% |
| Compass Diversified Holdings | 390,000 |
| 7,374,900 |
|
PHH Corp.(1) | 370,000 |
| 9,560,800 |
|
| | | 16,935,700 |
|
| ELECTRIC UTILITIES — 1.1% |
| El Paso Electric Co. | 425,000 |
| 15,185,250 |
|
| Great Plains Energy, Inc. | 85,000 |
| 2,298,400 |
|
| Portland General Electric Co. | 265,000 |
| 8,570,100 |
|
| | | 26,053,750 |
|
| ELECTRICAL EQUIPMENT — 0.5% |
GrafTech International Ltd.(1) | 975,000 |
| 10,647,000 |
|
| ELECTRONIC EQUIPMENT, INSTRUMENTS AND COMPONENTS — 1.9% |
| CDW Corp. | 550,000 |
| 15,092,000 |
|
| FLIR Systems, Inc. | 315,000 |
| 11,340,000 |
|
Ingram Micro, Inc., Class A(1) | 285,000 |
| 8,424,600 |
|
TTM Technologies, Inc.(1) | 1,020,000 |
| 8,619,000 |
|
| | | 43,475,600 |
|
| ENERGY EQUIPMENT AND SERVICES — 2.3% |
| Bristow Group, Inc. | 115,000 |
| 8,684,800 |
|
Cal Dive International, Inc.(1) | 1,150,000 |
| 1,955,000 |
|
| Gulfmark Offshore, Inc., Class A | 210,000 |
| 9,437,400 |
|
Helix Energy Solutions Group, Inc.(1) | 215,000 |
| 4,940,700 |
|
Hornbeck Offshore Services, Inc.(1) | 155,000 |
| 6,480,550 |
|
Key Energy Services, Inc.(1) | 490,000 |
| 4,527,600 |
|
McDermott International, Inc.(1) | 895,000 |
| 6,998,900 |
|
|
| | | | | |
| | Shares | Value |
Tetra Technologies, Inc.(1) | 740,000 |
| $ | 9,472,000 |
|
| | | 52,496,950 |
|
| FOOD AND STAPLES RETAILING — 1.0% |
Rite Aid Corp.(1) | 1,120,041 |
| 7,022,657 |
|
| Village Super Market, Inc., Class A | 260,000 |
| 6,864,000 |
|
| Weis Markets, Inc. | 160,000 |
| 7,880,000 |
|
| | | 21,766,657 |
|
| FOOD PRODUCTS — 0.3% |
| Snyders-Lance, Inc. | 100,000 |
| 2,819,000 |
|
TreeHouse Foods, Inc.(1) | 45,000 |
| 3,239,550 |
|
| | | 6,058,550 |
|
| GAS UTILITIES — 1.2% |
| Laclede Group, Inc. (The) | 240,000 |
| 11,316,000 |
|
| South Jersey Industries, Inc. | 200,000 |
| 11,218,000 |
|
| WGL Holdings, Inc. | 140,000 |
| 5,608,400 |
|
| | | 28,142,400 |
|
| HEALTH CARE EQUIPMENT AND SUPPLIES — 1.3% |
Haemonetics Corp.(1) | 72,079 |
| 2,349,055 |
|
| Hill-Rom Holdings, Inc. | 120,000 |
| 4,624,800 |
|
Integra LifeSciences Holdings Corp.(1) | 90,000 |
| 4,139,100 |
|
Orthofix International NV(1) | 335,000 |
| 10,100,250 |
|
| Utah Medical Products, Inc. | 165,000 |
| 9,541,950 |
|
| | | 30,755,155 |
|
| HEALTH CARE PROVIDERS AND SERVICES — 1.5% |
Air Methods Corp.(1) | 125,000 |
| 6,678,750 |
|
AMN Healthcare Services, Inc.(1) | 645,000 |
| 8,862,300 |
|
Hanger, Inc.(1) | 22,780 |
| 767,230 |
|
| HealthSouth Corp. | 120,000 |
| 4,311,600 |
|
| National Healthcare Corp. | 85,000 |
| 4,740,450 |
|
PharMerica Corp.(1) | 125,000 |
| 3,497,500 |
|
WellCare Health Plans, Inc.(1) | 75,000 |
| 4,764,000 |
|
| | | 33,621,830 |
|
|
| | | | | |
| | Shares | Value |
| HEALTH CARE TECHNOLOGY — 0.2% |
MedAssets, Inc.(1) | 220,000 |
| $ | 5,436,200 |
|
| HOTELS, RESTAURANTS AND LEISURE — 1.8% |
Bally Technologies, Inc.(1) | 110,000 |
| 7,289,700 |
|
| ClubCorp Holdings, Inc. | 355,000 |
| 6,709,500 |
|
| Einstein Noah Restaurant Group, Inc. | 330,000 |
| 5,431,800 |
|
Orient-Express Hotels Ltd. Class A(1) | 425,000 |
| 6,124,250 |
|
Scientific Games Corp. Class A(1) | 940,000 |
| 12,906,200 |
|
| Town Sports International Holdings, Inc. | 300,000 |
| 2,547,000 |
|
| | | 41,008,450 |
|
| HOUSEHOLD DURABLES — 1.6% |
Cavco Industries, Inc.(1) | 185,000 |
| 14,513,250 |
|
Helen of Troy Ltd.(1) | 80,000 |
| 5,538,400 |
|
Libbey, Inc.(1) | 420,000 |
| 10,920,000 |
|
| M.D.C. Holdings, Inc. | 230,000 |
| 6,504,400 |
|
| | | 37,476,050 |
|
| HOUSEHOLD PRODUCTS — 0.8% |
Central Garden and Pet Co.(1) | 900,000 |
| 7,443,000 |
|
| Spectrum Brands Holdings, Inc. | 130,000 |
| 10,361,000 |
|
| | | 17,804,000 |
|
| INSURANCE — 4.0% |
| American Equity Investment Life Holding Co. | 195,000 |
| 4,605,900 |
|
| Argo Group International Holdings Ltd. | 170,000 |
| 7,803,000 |
|
| Aspen Insurance Holdings Ltd. | 115,000 |
| 4,565,500 |
|
| Baldwin & Lyons, Inc., Class B | 445,000 |
| 11,699,050 |
|
| CNO Financial Group, Inc. | 620,000 |
| 11,222,000 |
|
| Endurance Specialty Holdings Ltd. | 165,000 |
| 8,881,950 |
|
| Hanover Insurance Group, Inc. (The) | 95,000 |
| 5,836,800 |
|
|
| | | | | |
| | Shares | Value |
| HCC Insurance Holdings, Inc. | 175,000 |
| $ | 7,960,750 |
|
| Infinity Property & Casualty Corp. | 90,000 |
| 6,086,700 |
|
| Platinum Underwriters Holdings Ltd. | 75,000 |
| 4,507,500 |
|
| Symetra Financial Corp. | 335,000 |
| 6,639,700 |
|
| United Fire Group, Inc. | 200,465 |
| 6,084,113 |
|
| Validus Holdings Ltd. | 130,000 |
| 4,902,300 |
|
| | | 90,795,263 |
|
| INTERNET AND CATALOG RETAIL — 0.5% |
Orbitz Worldwide, Inc.(1) | 600,000 |
| 4,704,000 |
|
Shutterfly, Inc.(1) | 165,000 |
| 7,042,200 |
|
| | | 11,746,200 |
|
| INTERNET SOFTWARE AND SERVICES — 0.1% |
Everyday Health, Inc.(1) | 205,000 |
| 2,867,950 |
|
| IT SERVICES — 2.2% |
| EVERTEC, Inc. | 724,943 |
| 17,906,092 |
|
MoneyGram International, Inc.(1) | 797,487 |
| 14,075,646 |
|
SYKES Enterprises, Inc.(1) | 375,000 |
| 7,451,250 |
|
VeriFone Systems, Inc.(1) | 290,000 |
| 9,807,800 |
|
| | | 49,240,788 |
|
| LEISURE EQUIPMENT AND PRODUCTS — 0.2% |
Malibu Boats, Inc.(1) | 214,951 |
| 4,776,211 |
|
| MACHINERY — 4.4% |
| Albany International Corp., Class A | 215,000 |
| 7,641,100 |
|
| Altra Industrial Motion Corp. | 265,000 |
| 9,460,500 |
|
| Barnes Group, Inc. | 90,000 |
| 3,462,300 |
|
| Briggs & Stratton Corp. | 540,000 |
| 12,015,000 |
|
| Dynamic Materials Corp. | 540,000 |
| 10,281,600 |
|
EnPro Industries, Inc.(1) | 80,000 |
| 5,813,600 |
|
Global Brass & Copper Holdings, Inc.(2) | 1,235,000 |
| 19,475,950 |
|
| Hardinge, Inc. | 355,000 |
| 5,112,000 |
|
| Kadant, Inc. | 220,000 |
| 8,023,400 |
|
|
| | | | | |
| | Shares | Value |
| Kennametal, Inc. | 250,000 |
| $ | 11,075,000 |
|
| Mueller Water Products, Inc., Class A | 340,000 |
| 3,230,000 |
|
Rexnord Corp.(1) | 155,000 |
| 4,491,900 |
|
| | | 100,082,350 |
|
| MEDIA — 4.5% |
AMC Entertainment Holdings, Inc., Class A(1) | 285,000 |
| 6,911,250 |
|
CBS Outdoor Americas, Inc.(1) | 41,297 |
| 1,207,937 |
|
Cumulus Media, Inc., Class A(1) | 2,725,000 |
| 18,829,750 |
|
E.W. Scripps Co. (The), Class A(1) | 255,000 |
| 4,518,600 |
|
Entercom Communications Corp., Class A(1) | 1,650,000 |
| 16,615,500 |
|
Entravision Communications Corp., Class A(2) | 3,965,000 |
| 26,565,500 |
|
| Harte-Hanks, Inc. | 445,000 |
| 3,933,800 |
|
Journal Communications, Inc., Class A(1) | 800,000 |
| 7,088,000 |
|
LIN Media LLC(1) | 595,000 |
| 15,767,500 |
|
| | | 101,437,837 |
|
| METALS AND MINING — 3.2% |
| Allegheny Technologies, Inc. | 350,000 |
| 13,188,000 |
|
AM Castle & Co.(1) | 660,000 |
| 9,695,400 |
|
Century Aluminum Co.(1) | 240,000 |
| 3,170,400 |
|
| Compass Minerals International, Inc. | 205,000 |
| 16,916,600 |
|
| Haynes International, Inc. | 286,898 |
| 15,492,492 |
|
Horsehead Holding Corp.(1) | 830,000 |
| 13,960,600 |
|
| | | 72,423,492 |
|
| MULTI-UTILITIES — 1.4% |
| Avista Corp. | 470,000 |
| 14,405,500 |
|
| Black Hills Corp. | 120,000 |
| 6,918,000 |
|
| NorthWestern Corp. | 220,000 |
| 10,434,600 |
|
| | | 31,758,100 |
|
| OIL, GAS AND CONSUMABLE FUELS — 4.0% |
| Alliance Resource Partners LP | 35,054 |
| 2,949,444 |
|
|
| | | | | |
| | Shares | Value |
Alpha Natural Resources, Inc.(1) | 550,000 |
| $ | 2,337,500 |
|
| Ardmore Shipping Corp. | 810,000 |
| 10,773,000 |
|
| Delek US Holdings, Inc. | 120,000 |
| 3,484,800 |
|
| Energy XXI Bermuda Ltd. | 530,000 |
| 12,492,100 |
|
| Hugoton Royalty Trust | 580,000 |
| 4,680,600 |
|
Jones Energy, Inc.(1) | 567,210 |
| 8,587,559 |
|
| Nordic American Tanker Shipping Ltd. | 225,000 |
| 2,214,000 |
|
| Pacific Coast Oil Trust | 595,000 |
| 7,967,050 |
|
| PBF Energy, Inc., Class A | 235,000 |
| 6,063,000 |
|
PDC Energy, Inc.(1) | 85,000 |
| 5,292,100 |
|
Penn Virginia Corp.(1) | 444,945 |
| 7,782,088 |
|
| Scorpio Tankers, Inc. | 905,000 |
| 9,022,850 |
|
Vaalco Energy, Inc.(1) | 585,054 |
| 5,002,212 |
|
| Western Refining, Inc. | 85,000 |
| 3,281,000 |
|
| | | 91,929,303 |
|
| PAPER AND FOREST PRODUCTS — 1.2% |
Boise Cascade Co.(1) | 250,000 |
| 7,160,000 |
|
Clearwater Paper Corp.(1) | 185,000 |
| 11,593,950 |
|
| Wausau Paper Corp. | 605,000 |
| 7,701,650 |
|
| | | 26,455,600 |
|
| PROFESSIONAL SERVICES — 1.2% |
| CDI Corp. | 675,958 |
| 11,592,680 |
|
| Kforce, Inc. | 723,757 |
| 15,430,499 |
|
| | | 27,023,179 |
|
| REAL ESTATE INVESTMENT TRUSTS (REITs) — 9.9% |
| American Campus Communities, Inc. | 310,000 |
| 11,578,500 |
|
| Apollo Commercial Real Estate Finance, Inc. | 430,000 |
| 7,150,900 |
|
| Armada Hoffler Properties, Inc. | 605,000 |
| 6,074,200 |
|
| Associated Estates Realty Corp. | 475,000 |
| 8,046,500 |
|
|
| | | | | |
| | Shares | Value |
| Blackstone Mortgage Trust, Inc., Class A | 165,000 |
| $ | 4,743,750 |
|
| Campus Crest Communities, Inc. | 1,340,000 |
| 11,631,200 |
|
| Capstead Mortgage Corp. | 270,000 |
| 3,418,200 |
|
| CBL & Associates Properties, Inc. | 365,000 |
| 6,478,750 |
|
| Chatham Lodging Trust | 460,000 |
| 9,301,200 |
|
| Chimera Investment Corp. | 1,380,000 |
| 4,222,800 |
|
| Colony Financial, Inc. | 180,000 |
| 3,951,000 |
|
| DiamondRock Hospitality Co. | 615,000 |
| 7,226,250 |
|
| EPR Properties | 145,000 |
| 7,741,550 |
|
| Excel Trust, Inc. | 635,000 |
| 8,051,800 |
|
| Hatteras Financial Corp. | 225,000 |
| 4,241,250 |
|
| Hersha Hospitality Trust | 620,000 |
| 3,614,600 |
|
| Highwoods Properties, Inc. | 145,000 |
| 5,569,450 |
|
| LaSalle Hotel Properties | 350,000 |
| 10,958,500 |
|
| Mack-Cali Realty Corp. | 315,000 |
| 6,548,850 |
|
| Medical Properties Trust, Inc. | 440,000 |
| 5,627,600 |
|
| MFA Financial, Inc. | 1,010,000 |
| 7,827,500 |
|
| New Residential Investment Corp. | 690,000 |
| 4,464,300 |
|
| Pennsylvania Real Estate Investment Trust | 280,000 |
| 5,054,000 |
|
| PennyMac Mortgage Investment Trust | 235,000 |
| 5,616,500 |
|
| RLJ Lodging Trust | 170,000 |
| 4,545,800 |
|
| Rouse Properties, Inc. | 570,000 |
| 9,826,800 |
|
| Summit Hotel Properties, Inc. | 1,125,000 |
| 10,440,000 |
|
| Sun Communities, Inc. | 100,000 |
| 4,509,000 |
|
| Sunstone Hotel Investors, Inc. | 880,000 |
| 12,082,400 |
|
| Two Harbors Investment Corp. | 525,000 |
| 5,381,250 |
|
|
| | | | | |
| | Shares | Value |
| Urstadt Biddle Properties, Inc., Class A | 555,000 |
| $ | 11,466,300 |
|
| Washington Real Estate Investment Trust | 320,000 |
| 7,641,600 |
|
| | | 225,032,300 |
|
| ROAD AND RAIL — 1.2% |
| Celadon Group, Inc. | 410,000 |
| 9,856,400 |
|
| Heartland Express, Inc. | 225,928 |
| 5,126,306 |
|
| Marten Transport Ltd. | 577,485 |
| 12,427,477 |
|
| | | 27,410,183 |
|
| SEMICONDUCTORS AND SEMICONDUCTOR EQUIPMENT — 3.9% |
| Cypress Semiconductor Corp. | 545,000 |
| 5,597,150 |
|
Exar Corp.(1) | 928,676 |
| 11,097,678 |
|
Fairchild Semiconductor International, Inc.(1) | 865,000 |
| 11,928,350 |
|
Kulicke & Soffa Industries, Inc.(1) | 1,605,000 |
| 20,239,050 |
|
| MKS Instruments, Inc. | 325,000 |
| 9,714,250 |
|
Nanometrics, Inc.(1) | 450,000 |
| 8,086,500 |
|
Semtech Corp.(1) | 505,000 |
| 12,796,700 |
|
Spansion, Inc., Class A(1) | 580,069 |
| 10,104,802 |
|
| | | 89,564,480 |
|
| SOFTWARE — 2.5% |
AVG Technologies NV(1) | 295,000 |
| 6,183,200 |
|
BroadSoft, Inc.(1) | 445,000 |
| 11,894,850 |
|
| Compuware Corp. | 1,475,000 |
| 15,487,500 |
|
Covisint Corp.(1) | 405,000 |
| 2,968,650 |
|
| Mentor Graphics Corp. | 695,000 |
| 15,303,900 |
|
Rovi Corp.(1) | 245,000 |
| 5,581,100 |
|
| | | 57,419,200 |
|
| SPECIALTY RETAIL — 2.6% |
| American Eagle Outfitters, Inc. | 360,000 |
| 4,406,400 |
|
Asbury Automotive Group, Inc.(1) | 120,000 |
| 6,637,200 |
|
Conn's, Inc.(1) | 245,000 |
| 9,518,250 |
|
| Destination Maternity Corp. | 345,000 |
| 9,453,000 |
|
|
| | | | | |
| | Shares | Value |
| Group 1 Automotive, Inc. | 110,000 |
| $ | 7,222,600 |
|
MarineMax, Inc.(1) | 645,000 |
| 9,797,550 |
|
| Penske Automotive Group, Inc. | 265,000 |
| 11,331,400 |
|
| | | 58,366,400 |
|
| TEXTILES, APPAREL AND LUXURY GOODS — 1.2% |
Culp, Inc.(2) | 580,000 |
| 11,449,200 |
|
| Movado Group, Inc. | 350,000 |
| 15,942,500 |
|
| | | 27,391,700 |
|
| THRIFTS AND MORTGAGE FINANCE — 1.6% |
| Astoria Financial Corp. | 460,000 |
| 6,357,200 |
|
| Dime Community Bancshares, Inc. | 500,000 |
| 8,490,000 |
|
MGIC Investment Corp.(1) | 540,000 |
| 4,600,800 |
|
| Oritani Financial Corp. | 620,000 |
| 9,802,200 |
|
| Provident Financial Services, Inc. | 275,000 |
| 5,051,750 |
|
| Radian Group, Inc. | 190,000 |
| 2,855,700 |
|
| | | 37,157,650 |
|
| TRADING COMPANIES AND DISTRIBUTORS — 0.4% |
| Kaman Corp. | 200,000 |
| 8,136,000 |
|
| TRANSPORTATION INFRASTRUCTURE — 0.4% |
| Aegean Marine Petroleum Network, Inc. | 880,043 |
| 8,677,224 |
|
| WATER UTILITIES — 0.3% |
| Artesian Resources Corp., Class A | 290,000 |
| 6,513,400 |
|
TOTAL COMMON STOCKS (Cost $1,874,768,448) | 2,240,334,171 |
|
| CONVERTIBLE PREFERRED STOCKS — 0.5% |
| HOUSEHOLD DURABLES — 0.3% |
| Beazer Homes USA, Inc., 7.50%, 7/15/15 | 245,000 |
| 7,749,350 |
|
| TOBACCO — 0.2% |
| Universal Corp., 6.75% | 3,532 |
| 4,488,731 |
|
TOTAL CONVERTIBLE PREFERRED STOCKS (Cost $10,126,475) | 12,238,081 |
|
|
| | | | | |
| | Shares | Value |
| EXCHANGE-TRADED FUNDS — 0.5% |
iShares Russell 2000 Value Index Fund
(Cost $11,257,268) | 110,000 |
| $ | 11,092,400 |
|
| TEMPORARY CASH INVESTMENTS — 0.6% |
| Repurchase Agreement, Bank of America Merrill Lynch, (collateralized by various U.S. Treasury obligations, 0.75% - 1.375%, 10/31/17 - 6/30/18, valued at $2,416,815), in a joint trading account at 0.03%, dated 3/31/14, due 4/1/14 (Delivery value $2,367,959) | 2,367,957 |
|
| Repurchase Agreement, Goldman Sachs & Co., (collateralized by various U.S. Treasury obligations, 4.25%, 8/15/15, valued at $2,125,676), in a joint trading account at 0.03%, dated 3/31/14, due 4/1/14 (Delivery value $2,083,804) | 2,083,802 |
|
|
| | | | | |
| | Shares | Value |
| SSgA U.S. Government Money Market Fund | 8,028,388 |
| $ | 8,028,388 |
|
TOTAL TEMPORARY CASH INVESTMENTS (Cost $12,480,147) | 12,480,147 |
|
TOTAL INVESTMENT SECURITIES — 100.1% (Cost $1,908,632,338) | 2,276,144,799 |
|
| OTHER ASSETS AND LIABILITIES — (0.1)% | (1,425,533 | ) |
| TOTAL NET ASSETS — 100.0% | $ | 2,274,719,266 |
|
|
| | | | |
| Notes to Schedule of Investments | |
| |
| (2) | Affiliated Company: the fund’s holding represents ownership of 5% or more of the voting securities of the company; therefore, the company is affiliated as defined in the Investment Company Act of 1940. |
See Notes to Financial Statements.
|
|
| Statement of Assets and Liabilities |
|
| | | |
| MARCH 31, 2014 | |
| Assets | |
| Investment securities - unaffiliated, at value (cost of $1,845,273,743) | $ | 2,187,179,139 |
|
| Investment securities - affiliated, at value (cost of $63,358,595) | 88,965,660 |
|
| Total investment securities, at value (cost of $1,908,632,338) | 2,276,144,799 |
|
| Receivable for investments sold | 22,981,611 |
|
| Receivable for capital shares sold | 845,740 |
|
| Dividends and interest receivable | 3,797,012 |
|
| | 2,303,769,162 |
|
| | |
| Liabilities | |
| Payable for investments purchased | 24,974,454 |
|
| Payable for capital shares redeemed | 1,805,192 |
|
| Accrued management fees | 2,176,399 |
|
| Distribution and service fees payable | 93,851 |
|
| | 29,049,896 |
|
| | |
| Net Assets | $ | 2,274,719,266 |
|
| | |
| | |
| Net Assets Consist of: | |
| Capital (par value and paid-in surplus) | $ | 1,795,430,085 |
|
| Distributions in excess of net investment income | (542,540 | ) |
| Undistributed net realized gain | 112,319,260 |
|
| Net unrealized appreciation | 367,512,461 |
|
| | $ | 2,274,719,266 |
|
|
| | | | |
| | Net Assets | Shares Outstanding | Net Asset Value Per Share |
| Investor Class, $0.01 Par Value | $948,337,887 | 96,002,733 |
| $9.88 |
| Institutional Class, $0.01 Par Value | $874,414,502 | 87,980,793 |
| $9.94 |
| A Class, $0.01 Par Value | $433,905,137 | 44,208,690 |
| $9.81* |
| C Class, $0.01 Par Value | $113,837 | 11,719 |
| $9.71 |
| R Class, $0.01 Par Value | $4,517,494 | 459,742 |
| $9.83 |
| R6 Class, $0.01 Par Value | $13,430,409 | 1,350,642 |
| $9.94 |
| |
| * | Maximum offering price $10.41 (net asset value divided by 0.9425). |
See Notes to Financial Statements.
|
| | | |
| YEAR ENDED MARCH 31, 2014 | |
| Investment Income (Loss) | |
| Income: | |
| Dividends (including $1,845,328 from affiliates and net of foreign taxes withheld of $23,330) | $ | 39,549,202 |
|
| Interest | 7,365 |
|
| | 39,556,567 |
|
| | |
| Expenses: | |
| Management fees | 24,606,294 |
|
| Distribution and service fees: | |
| A Class | 1,037,661 |
|
| C Class | 880 |
|
| R Class | 19,932 |
|
| Directors' fees and expenses | 34,440 |
|
| Other expenses | 11,650 |
|
| | 25,710,857 |
|
| | |
| Net investment income (loss) | 13,845,710 |
|
| | |
| Realized and Unrealized Gain (Loss) | |
| Net realized gain (loss) on investment transactions (including $22,748,359 from affiliates) | 394,856,292 |
|
| Change in net unrealized appreciation (depreciation) on investments | 44,626,271 |
|
| | |
| Net realized and unrealized gain (loss) | 439,482,563 |
|
| | |
| Net Increase (Decrease) in Net Assets Resulting from Operations | $ | 453,328,273 |
|
See Notes to Financial Statements.
|
|
| Statement of Changes in Net Assets |
|
| | | | | | |
| YEARS ENDED MARCH 31, 2014 AND MARCH 31, 2013 |
| Increase (Decrease) in Net Assets | March 31, 2014 | March 31, 2013 |
| Operations | | |
| Net investment income (loss) | $ | 13,845,710 |
| $ | 21,897,135 |
|
| Net realized gain (loss) | 394,856,292 |
| 203,981,507 |
|
| Change in net unrealized appreciation (depreciation) | 44,626,271 |
| 48,797,395 |
|
| Net increase (decrease) in net assets resulting from operations | 453,328,273 |
| 274,676,037 |
|
| | | |
| Distributions to Shareholders | | |
| From net investment income: | | |
| Investor Class | (7,745,885 | ) | (12,033,310 | ) |
| Institutional Class | (8,111,524 | ) | (9,921,426 | ) |
| A Class | (2,702,518 | ) | (4,516,484 | ) |
| C Class | (191 | ) | (326 | ) |
| R Class | (16,987 | ) | (28,561 | ) |
| R6 Class | (3,596 | ) | — |
|
| From net realized gains: | | |
| Investor Class | (135,335,145 | ) | (35,804,910 | ) |
| Institutional Class | (127,831,380 | ) | (26,044,402 | ) |
| A Class | (62,409,071 | ) | (17,595,422 | ) |
| C Class | (13,353 | ) | (2,775 | ) |
| R Class | (622,647 | ) | (144,686 | ) |
| R6 Class | (172,517 | ) | — |
|
| Decrease in net assets from distributions | (344,964,814 | ) | (106,092,302 | ) |
| | | |
| Capital Share Transactions | | |
| Net increase (decrease) in net assets from capital share transactions | 145,484,489 |
| (206,806,719 | ) |
| | | |
| Net increase (decrease) in net assets | 253,847,948 |
| (38,222,984 | ) |
| | | |
| Net Assets | | |
| Beginning of period | 2,020,871,318 |
| 2,059,094,302 |
|
| End of period | $ | 2,274,719,266 |
| $ | 2,020,871,318 |
|
| | | |
Undistributed (distributions in excess of) net investment income
| $ | (542,540 | ) | $ | 3,253,876 |
|
See Notes to Financial Statements.
|
|
| Notes to Financial Statements |
MARCH 31, 2014
1. Organization
American Century Capital Portfolios, Inc. (the corporation) is registered under the Investment Company Act of 1940, as amended (the 1940 Act), as an open-end management investment company and is organized as a Maryland corporation. Small Cap Value Fund (the fund) is one fund in a series issued by the corporation. The fund is diversified as defined under the 1940 Act. The fund’s investment objective is to seek long-term capital growth. Income is a secondary objective.
The fund offers the Investor Class, the Institutional Class, the A Class, the C Class, the R Class and the R6 Class. The A Class may incur an initial sales charge. The A Class and C Class may be subject to a contingent deferred sales charge. The share classes differ principally in their respective sales charges and distribution and shareholder servicing expenses and arrangements. The Institutional Class and R6 Class shareholders do not require the same level of shareholder and administrative services from American Century Investment Management, Inc. (ACIM) (the investment advisor) as shareholders of other classes. In addition, financial intermediaries do not receive any service, distribution or administrative fees for the R6 Class. As a result, the Institutional Class and R6 Class are charged lower unified management fees. Sale of the R6 Class commenced on July 26, 2013.
2. Significant Accounting Policies
The following is a summary of significant accounting policies consistently followed by the fund in preparation of its financial statements. The financial statements are prepared in conformity with accounting principles generally accepted in the United States of America, which may require management to make certain estimates and assumptions at the date of the financial statements. Actual results could differ from these estimates.
Investment Valuations — The fund determines the fair value of its investments and computes its net asset value per share at the close of regular trading (usually 4 p.m. Eastern time) on the New York Stock Exchange (NYSE) on each day the NYSE is open. The Board of Directors has adopted valuation policies and procedures to guide the investment advisor in the fund’s investment valuation process and to provide methodologies for the oversight of the fund’s pricing function.
Equity securities that are listed or traded on a domestic securities exchange are valued at the last reported sales price or at the official closing price as provided by the exchange. Equity securities traded on foreign securities exchanges are generally valued at the closing price of such securities on the exchange where primarily traded or at the close of the NYSE, if that is earlier. If no last sales price is reported, or if local convention or regulation so provides, the mean of the latest bid and asked prices may be used. Securities traded over-the-counter are valued at the mean of the latest bid and asked prices, the last sales price, or the official closing price.
Fixed income securities maturing within 60 days at the time of purchase may be valued at cost, plus or minus any amortized discount or premium or at the evaluated mean as provided by an independent pricing service. Evaluated mean prices are commonly derived through utilization of market models, which may consider, among other factors: trade data, quotations from dealers and active market makers, relevant yield curve and spread data, related sector levels, creditworthiness, trade data or market information on comparable securities, and other relevant security specific information.
Open-end management investment companies are valued at the reported net asset value per share. Repurchase agreements are valued at cost, which approximates fair value.
If the fund determines that the market price for an investment is not readily available or the valuation methods mentioned above do not reflect an investment’s fair value, such investment is valued as determined in good faith by the Board of Directors or its delegate, in accordance with policies and procedures adopted by the Board of Directors. In its determination of fair value, the fund may review several factors including, but not limited to, market information regarding the specific investment or comparable investments and correlation with other investment types, futures indices or general market indicators. Circumstances that may cause the fund to use these procedures to value an investment include, but are not limited to: an investment has been declared in default or is distressed; trading in a security has been suspended during the trading day or a
security is not actively trading on its principal exchange; prices received from a regular pricing source are deemed unreliable; or there is a foreign market holiday and no trading occurred.
The fund monitors for significant events occurring after the close of an investment’s primary exchange but before the fund’s net asset value per share is determined. Significant events may include, but are not limited to: corporate announcements and transactions; governmental action and political unrest that could impact a specific investment or an investment sector; or armed conflicts, natural disasters and similar events that could affect investments in a specific country or region.
Security Transactions — Security transactions are accounted for as of the trade date. Net realized gains and losses are determined on the identified cost basis, which is also used for federal income tax purposes.
Investment Income — Dividend income less foreign taxes withheld, if any, is recorded as of the ex-dividend date. Distributions received on securities that represent a return of capital or long-term capital gain are recorded as a reduction of cost of investments and/or as a realized gain. The fund may estimate the components of distributions received that may be considered nontaxable distributions or long-term capital gain distributions for income tax purposes. Interest income is recorded on the accrual basis and includes accretion of discounts and amortization of premiums.
Repurchase Agreements — The fund may enter into repurchase agreements with institutions that ACIM has determined are creditworthy pursuant to criteria adopted by the Board of Directors. The fund requires that the collateral, represented by securities, received in a repurchase transaction be transferred to the custodian in a manner sufficient to enable the fund to obtain those securities in the event of a default under the repurchase agreement. ACIM monitors, on a daily basis, the securities transferred to ensure the value, including accrued interest, of the securities under each repurchase agreement is equal to or greater than amounts owed to the fund under each repurchase agreement.
Joint Trading Account — Pursuant to an Exemptive Order issued by the Securities and Exchange Commission, the fund, along with certain other funds in the American Century Investments family of funds, may transfer uninvested cash balances into a joint trading account. These balances are invested in one or more repurchase agreements that are collateralized by U.S. Treasury or Agency obligations.
Income Tax Status — It is the fund’s policy to distribute substantially all net investment income and net realized gains to shareholders and to otherwise qualify as a regulated investment company under provisions of the Internal Revenue Code. Accordingly, no provision has been made for income taxes. The fund files U.S. federal, state, local and non-U.S. tax returns as applicable. The fund's tax returns are subject to examination by the relevant taxing authority until expiration of the applicable statute of limitations, which is generally three years from the date of filing but can be longer in certain jurisdictions. At this time, management believes there are no uncertain tax positions which, based on their technical merit, would not be sustained upon examination and for which it is reasonably possible that the total amounts of unrecognized tax benefits will significantly change in the next twelve months.
Multiple Class — All shares of the fund represent an equal pro rata interest in the net assets of the class to which such shares belong, and have identical voting, dividend, liquidation and other rights and the same terms and conditions, except for class specific expenses and exclusive rights to vote on matters affecting only individual classes. Income, non-class specific expenses, and realized and unrealized capital gains and losses of the fund are allocated to each class of shares based on their relative net assets.
Distributions to Shareholders — Distributions from net investment income, if any, are generally declared and paid quarterly. Distributions from net realized gains, if any, are generally declared and paid annually.
Indemnifications — Under the corporation’s organizational documents, its officers and directors are indemnified against certain liabilities arising out of the performance of their duties to the fund. In addition, in the normal course of business, the fund enters into contracts that provide general indemnifications. The maximum exposure under these arrangements is unknown as this would involve future claims that may be made against a fund. The risk of material loss from such claims is considered by management to be remote.
3. Fees and Transactions with Related Parties
Certain officers and directors of the corporation are also officers and/or directors of American Century Companies, Inc. (ACC). The corporation’s investment advisor, ACIM, the corporation's distributor, American Century Investment Services, Inc. (ACIS), and the corporation’s transfer agent, American Century Services, LLC, are wholly owned, directly or indirectly, by ACC.
Management Fees — The corporation has entered into a management agreement with ACIM, under which ACIM provides the fund with investment advisory and management services in exchange for a single, unified management fee (the fee) per class. The agreement provides that all expenses of managing and operating the fund, except distribution and service fees, brokerage expenses, taxes, interest, fees and expenses of the independent directors (including legal counsel fees), and extraordinary expenses, will be paid by ACIM. The fee is computed and accrued daily based on each class’s daily net assets and paid monthly in arrears. The rate of the fee is determined by applying a fee rate calculation formula. This formula takes into account the fund’s assets as well as certain assets, if any, of other clients of the investment advisor outside the American Century Investments family of funds (such as subadvised funds and separate accounts) that have very similar investment teams and investment strategies (strategy assets). The annual management fee schedule ranges from 1.00% to 1.25% for the Investor Class, A Class, C Class and R Class. The annual management fee schedule ranges from 0.80% to 1.05% for the Institutional Class and 0.65% to 0.90% for the R6 Class. The effective annual management fee for each class for the period ended March 31, 2014 was 1.22% for the Investor Class, A Class, C Class, and R Class, 1.02% for the Institutional Class and 0.87% for the R6 Class.
Distribution and Service Fees — The Board of Directors has adopted a separate Master Distribution and Individual Shareholder Services Plan for each of the A Class, C Class and R Class (collectively the plans), pursuant to Rule 12b-1 of the 1940 Act. The plans provide that the A Class will pay ACIS an annual distribution and service fee of 0.25%. The plans provide that the C Class will pay ACIS an annual distribution and service fee of 1.00%, of which 0.25% is paid for individual shareholder services and 0.75% is paid for distribution services. The plans provide that the R Class will pay ACIS an annual distribution and service fee of 0.50%. The fees are computed and accrued daily based on each class’s daily net assets and paid monthly in arrears. The fees are used to pay financial intermediaries for distribution and individual shareholder services. Fees incurred under the plans during the year ended March 31, 2014 are detailed in the Statement of Operations.
Directors' Fees and Expenses — The Board of Directors is responsible for overseeing the investment advisor's management and operations of the fund. The directors receive detailed information about the fund and its investment advisor regularly throughout the year, and meet at least quarterly with management of the investment advisor to review reports about fund operations. Fees and expenses incurred in conjunction with the directors during the year ended March 31, 2014 are detailed in the Statement of Operations. The fund’s officers do not receive compensation from the fund.
Acquired Fund Fees and Expenses — The fund may invest in mutual funds, exchange-traded funds, and business development companies (the acquired funds). The fund will indirectly realize its pro rata share of the fees and expenses of the acquired funds in which it invests. These indirect fees and expenses are not paid out of the fund's assets but are reflected in the return realized by the fund on its investment in the acquired funds.
4. Investment Transactions
Purchases and sales of investment securities, excluding short-term investments, for the year ended March 31, 2014 were $2,354,584,472 and $2,489,067,300, respectively.
5. Capital Share Transactions
Transactions in shares of the fund were as follows:
|
| | | | | | | | |
| | Year ended March 31, 2014(1) | Year ended March 31, 2013 |
| | Shares | Amount | Shares | Amount |
| Investor Class/Shares Authorized | 420,000,000 | | 500,000,000 | |
| Sold | 13,566,550 | $ | 132,667,306 |
| 12,936,505 | $ | 113,660,206 |
|
| Issued in reinvestment of distributions | 14,255,163 | 134,652,107 |
| 5,577,883 | 46,236,783 |
|
| Redeemed | (26,442,350) | (259,108,799) |
| (26,103,130) | (225,019,354) |
|
| | 1,379,363 | 8,210,614 |
| (7,588,742) | (65,122,365) |
|
| Institutional Class/Shares Authorized | 300,000,000 | | 300,000,000 | |
| Sold | 23,381,664 | 231,675,597 |
| 26,620,339 | 232,076,201 |
|
| Issued in reinvestment of distributions | 13,252,482 | 125,996,045 |
| 3,935,752 | 32,840,785 |
|
| Redeemed | (24,646,355) | (245,750,266) |
| (40,420,554) | (340,602,277) |
|
| | 11,987,791 | 111,921,376 |
| (9,864,463) | (75,685,291) |
|
| A Class/Shares Authorized | 200,000,000 | | 200,000,000 | |
| Sold | 4,681,855 | 45,188,046 |
| 4,704,292 | 39,938,635 |
|
| Issued in reinvestment of distributions | 6,867,659 | 64,433,207 |
| 2,674,469 | 22,034,798 |
|
| Redeemed | (10,039,788) | (98,404,207) |
| (15,186,260) | (127,909,830) |
|
| | 1,509,726 | 11,217,046 |
| (7,807,499) | (65,936,397) |
|
| C Class/Shares Authorized | 5,000,000 | | 5,000,000 | |
| Sold | 6,647 | 65,974 |
| 4,892 | 41,483 |
|
| Issued in reinvestment of distributions | 1,457 | 13,544 |
| 379 | 3,101 |
|
| Redeemed | (4,934) | (48,607) |
| (5,762) | (48,469) |
|
| | 3,170 | 30,911 |
| (491) | (3,885) |
|
| R Class/Shares Authorized | 5,000,000 | | 5,000,000 | |
| Sold | 111,168 | 1,100,954 |
| 42,059 | 358,998 |
|
| Issued in reinvestment of distributions | 68,139 | 639,634 |
| 21,005 | 173,247 |
|
| Redeemed | (92,892) | (902,668) |
| (68,019) | (591,026) |
|
| | 86,415 | 837,920 |
| (4,955) | (58,781) |
|
| R6 Class/Shares Authorized | 50,000,000 | | N/A | |
| Sold | 1,377,967 | 13,535,144 |
| | |
| Issued in reinvestment of distributions | 18,530 | 176,113 |
| | |
| Redeemed | (45,855) | (444,635) |
| | |
| | 1,350,642 | 13,266,622 |
| | |
| Net increase (decrease) | 16,317,107 | $ | 145,484,489 |
| (25,266,150) | $ | (206,806,719 | ) |
| | | | | |
| (1) July 26, 2013 (commencement of sale) through March 31, 2014 for the R6 Class. |
6. Affiliated Company Transactions
If a fund's holding represents ownership of 5% or more of the voting securities of a company, the company is affiliated as defined in the 1940 Act. A summary of transactions for each company which is or was an affiliate at or during the year ended March 31, 2014 follows:
|
| | | | | | | | | | | | | | | | | | | |
| March 31, 2013 | | | | March 31, 2014 |
| Company | Share Balance | Purchase Cost | Sales Cost | Realized Gain (Loss) | Dividend Income | Share Balance | Market Value |
American Science & Engineering, Inc.(1) | 325,000 |
| $ | 8,079,888 |
| $ | 9,523,569 |
| $ | 426,921 |
| $ | 692,465 |
| 310,000 |
| (1) |
|
| Culp, Inc. | 440,000 |
| 3,565,148 |
| 1,099,174 |
| 67,626 |
| 101,459 |
| 580,000 |
| $ | 11,449,200 |
|
Dynamic Materials Corp.(1) | 495,000 |
| 4,050,561 |
| 3,507,932 |
| 497,923 |
| 88,000 |
| 540,000 |
| (1) |
|
| Entravision Communications Corp., Class A | 4,300,000 |
| 13,006,937 |
| 8,658,292 |
| 6,347,487 |
| 620,625 |
| 3,965,000 |
| 26,565,500 |
|
| Global Brass & Copper Holdings, Inc. | — |
| 20,796,795 |
| 1,944,453 |
| (8,000) |
| 69,750 |
| 1,235,000 |
| 19,475,950 |
|
| Multi-Color Corp. | — |
| 28,542,768 |
| 697,349 |
| (17,406) |
| 112,154 |
| 899,286 |
| 31,475,010 |
|
Utah Medical Products, Inc.(1) | 165,000 |
| 991,604 |
| 793,134 |
| 279,810 |
| 160,875 |
| 165,000 |
| (1) |
|
Websense, Inc.(1)(2) | 1,550,000 |
| 2,751,496 |
| 27,415,331 |
| 15,153,998 |
| — |
| — |
| — |
|
| | | $ | 81,785,197 |
| $ | 53,639,234 |
| $ | 22,748,359 |
| $ | 1,845,328 |
| | $ | 88,965,660 |
|
(1) Company was not an affiliate at March 31, 2014.
(2) Non-income producing.
7. Fair Value Measurements
The fund’s investments valuation process is based on several considerations and may use multiple inputs to determine the fair value of the investments held by the fund. In conformity with accounting principles generally accepted in the United States of America, the inputs used to determine a valuation are classified into three broad levels.
| |
| • | Level 1 valuation inputs consist of unadjusted quoted prices in an active market for identical investments. |
| |
| • | Level 2 valuation inputs consist of direct or indirect observable market data (including quoted prices for comparable investments, evaluations of subsequent market events, interest rates, prepayment speeds, credit risk, etc.). These inputs also consist of quoted prices for identical investments initially expressed in local currencies that are adjusted through translation into U.S. dollars. |
| |
| • | Level 3 valuation inputs consist of unobservable data (including a fund’s own assumptions). |
The level classification is based on the lowest level input that is significant to the fair valuation measurement. The valuation inputs are not necessarily an indication of the risks associated with investing in these securities or other financial instruments.
The following is a summary of the level classifications as of period end. The Schedule of Investments provides additional information on the fund’s portfolio holdings.
|
| | | | | | | | |
| | Level 1 | Level 2 | Level 3 |
| Assets | | | |
| Investment Securities | | | |
| Common Stocks | $ | 2,240,334,171 |
| — |
| — |
|
| Convertible Preferred Stocks | — |
| $ | 12,238,081 |
| — |
|
| Exchange-Traded Funds | 11,092,400 |
| — |
| — |
|
| Temporary Cash Investments | 8,028,388 |
| 4,451,759 |
| — |
|
| | $ | 2,259,454,959 |
| $ | 16,689,840 |
| — |
|
8. Risk Factors
The fund concentrates its investments in common stocks of small companies. Because of this, the fund may be subject to greater risk and market fluctuations than a fund investing in larger, more established companies.
The fund’s investment process may result in high portfolio turnover, which could mean high transaction costs, affecting both performance and capital gains tax liabilities to investors.
9. Federal Tax Information
The tax character of distributions paid during the years ended March 31, 2014 and March 31, 2013 were as follows:
|
| | | | | | |
| | 2014 | 2013 |
| Distributions Paid From | | |
| Ordinary income | $ | 152,989,825 |
| $ | 66,832,040 |
|
| Long-term capital gains | $ | 191,974,989 |
| $ | 39,260,262 |
|
The book-basis character of distributions made during the year from net investment income or net realized gains may differ from their ultimate characterization for federal income tax purposes. These differences reflect the differing character of certain income items and net realized gains and losses for financial statement and tax purposes, and may result in reclassification among certain capital accounts on the financial statements.
As of March 31, 2014, the federal tax cost of investments and the components of distributable earnings on a tax-basis were as follows: |
| | | |
| Federal tax cost of investments | $ | 1,930,085,079 |
|
| Gross tax appreciation of investments | $ | 382,510,658 |
|
| Gross tax depreciation of investments | (36,450,938) |
|
| Net tax appreciation (depreciation) of investments | $ | 346,059,720 |
|
| Undistributed ordinary income | $ | 70,952,514 |
|
| Accumulated long-term gains | $ | 62,276,947 |
|
The difference between book-basis and tax-basis unrealized appreciation (depreciation) is attributable primarily to the tax deferral of losses on wash sales.
|
| | | | | | | | | | | | | | | |
| For a Share Outstanding Throughout the Years Ended March 31 (except as noted) |
| Per-Share Data | Ratios and Supplemental Data |
| | | Income From Investment Operations: | Distributions From: | | | Ratio to Average Net Assets of: | | |
| | Net Asset Value, Beginning of Period | Net Investment Income (Loss)(1) | Net Realized and Unrealized Gain (Loss) | Total From Investment Operations | Net Investment Income | Net Realized Gains | Total Distributions | Net Asset Value, End of Period | Total Return(2) | Operating Expenses(3) | Net Investment Income (Loss) | Portfolio Turnover Rate | Net Assets, End of Period (in thousands) |
| Investor Class | | | | | | | | | | | |
| 2014 | $9.45 | 0.06 | 2.04 | 2.10 | (0.08) | (1.59) | (1.67) | $9.88 | 23.27% | 1.22% | 0.62% | 111% |
| $948,338 |
|
| 2013 | $8.61 | 0.10 | 1.25 | 1.35 | (0.12) | (0.39) | (0.51) | $9.45 | 16.58% | 1.25% | 1.17% | 126% |
| $894,194 |
|
| 2012 | $9.48 | 0.10 | (0.30) | (0.20) | (0.07) | (0.60) | (0.67) | $8.61 | (1.39)% | 1.24% | 1.14% | 120% |
| $880,194 |
|
| 2011 | $8.02 | 0.09 | 1.43 | 1.52 | (0.06) | – | (0.06) | $9.48 | 19.06% | 1.24% | 1.03% | 99% |
| $1,096,617 |
|
| 2010 | $4.70 | 0.11 | 3.33 | 3.44 | (0.12) | – | (0.12) | $8.02 | 73.93% | 1.25% | 1.60% | 104% |
| $885,942 |
|
| Institutional Class | | | | | | | | | | | | | |
| 2014 | $9.50 | 0.08 | 2.05 | 2.13 | (0.10) | (1.59) | (1.69) | $9.94 | 23.45% | 1.02% | 0.82% | 111% |
| $874,415 |
|
| 2013 | $8.65 | 0.12 | 1.26 | 1.38 | (0.14) | (0.39) | (0.53) | $9.50 | 16.89% | 1.05% | 1.37% | 126% |
| $721,572 |
|
| 2012 | $9.52 | 0.11 | (0.30) | (0.19) | (0.08) | (0.60) | (0.68) | $8.65 | (1.20)% | 1.04% | 1.34% | 120% |
| $742,867 |
|
| 2011 | $8.05 | 0.10 | 1.44 | 1.54 | (0.07) | – | (0.07) | $9.52 | 19.30% | 1.04% | 1.23% | 99% |
| $861,881 |
|
| 2010 | $4.71 | 0.12 | 3.35 | 3.47 | (0.13) | – | (0.13) | $8.05 | 74.47% | 1.05% | 1.80% | 104% |
| $654,738 |
|
A Class(4) | | | | | | | | | | | | | |
| 2014 | $9.40 | 0.04 | 2.02 | 2.06 | (0.06) | (1.59) | (1.65) | $9.81 | 22.92% | 1.47% | 0.37% | 111% |
| $433,905 |
|
| 2013 | $8.57 | 0.08 | 1.24 | 1.32 | (0.10) | (0.39) | (0.49) | $9.40 | 16.19% | 1.50% | 0.92% | 126% |
| $401,510 |
|
| 2012 | $9.44 | 0.08 | (0.30) | (0.22) | (0.05) | (0.60) | (0.65) | $8.57 | (1.56)% | 1.49% | 0.89% | 120% |
| $432,711 |
|
| 2011 | $8.00 | 0.06 | 1.43 | 1.49 | (0.05) | – | (0.05) | $9.44 | 18.63% | 1.49% | 0.78% | 99% |
| $516,974 |
|
| 2010 | $4.69 | 0.09 | 3.32 | 3.41 | (0.10) | – | (0.10) | $8.00 | 73.53% | 1.50% | 1.35% | 104% |
| $434,413 |
|
|
| | | | | | | | | | | | | | | |
| For a Share Outstanding Throughout the Years Ended March 31 (except as noted) |
| Per-Share Data | Ratios and Supplemental Data |
| | | Income From Investment Operations: | Distributions From: | | | Ratio to Average Net Assets of: | | |
| | Net Asset Value, Beginning of Period | Net Investment Income (Loss)(1) | Net Realized and Unrealized Gain (Loss) | Total From Investment Operations | Net Investment Income | Net Realized Gains | Total Distributions | Net Asset Value, End of Period | Total Return(2) | Operating Expenses(3) | Net Investment Income (Loss) | Portfolio Turnover Rate | Net Assets, End of Period (in thousands) |
| C Class | | | | | | | | | | | | | |
| 2014 | $9.35 | (0.04) | 2.01 | 1.97 | (0.02) | (1.59) | (1.61) | $9.71 | 21.94% | 2.22% | (0.38)% | 111% |
| $114 |
|
| 2013 | $8.53 | 0.01 | 1.24 | 1.25 | (0.04) | (0.39) | (0.43) | $9.35 | 15.35% | 2.25% | 0.17% | 126% |
| $80 |
|
| 2012 | $9.43 | 0.02 | (0.30) | (0.28) | (0.02) | (0.60) | (0.62) | $8.53 | (2.30)% | 2.24% | 0.14% | 120% |
| $77 |
|
| 2011 | $8.01 | 0.01 | 1.42 | 1.43 | (0.01) | – | (0.01) | $9.43 | 17.85% | 2.24% | 0.03% | 99% |
| $59 |
|
2010(5) | $7.60 | –(6) | 0.41 | 0.41 | – | – | – | $8.01 | 5.39% | 2.25%(7) | 0.72%(7) | 104%(8) |
| $26 |
|
| R Class | | | | | | | | | | | | | |
| 2014 | $9.42 | 0.01 | 2.03 | 2.04 | (0.04) | (1.59) | (1.63) | $9.83 | 22.64% | 1.72% | 0.12% | 111% |
| $4,517 |
|
| 2013 | $8.58 | 0.06 | 1.25 | 1.31 | (0.08) | (0.39) | (0.47) | $9.42 | 15.98% | 1.75% | 0.67% | 126% |
| $3,516 |
|
| 2012 | $9.46 | 0.05 | (0.29) | (0.24) | (0.04) | (0.60) | (0.64) | $8.58 | (1.80)% | 1.74% | 0.64% | 120% |
| $3,245 |
|
| 2011 | $8.02 | 0.06 | 1.41 | 1.47 | (0.03) | – | (0.03) | $9.46 | 18.36% | 1.73% | 0.54% | 99% |
| $4,939 |
|
2010(5) | $7.60 | 0.01 | 0.41 | 0.42 | – | – | – | $8.02 | 5.53% | 1.75%(7) | 1.22%(7) | 104%(8) |
| $26 |
|
| R6 Class | | | | | | | | | | | | | |
2014(9) | $10.38 | 0.07 | 1.14 | 1.21 | (0.06) | (1.59) | (1.65) | $9.94 | 12.46% | 0.87%(7) | 1.06%(7) | 111%(10) |
| $13,430 |
|
|
| | | | |
| Notes to Financial Highlights | | |
| |
| (1) | Computed using average shares outstanding throughout the period. |
| |
| (2) | Total returns are calculated based on the net asset value of the last business day and do not reflect applicable sales charges, if any. Total returns for periods less than one year are not annualized. |
| |
| (3) | Ratio of operating expenses to average net assets does not include any fees and expenses of the acquired funds. |
| |
| (4) | Prior to March 1, 2010, the A Class was referred to as the Advisor Class. |
| |
| (5) | March 1, 2010 (commencement of sale) through March 31, 2010. |
| |
| (6) | Per-share amount was less than $0.005. |
| |
| (8) | Portfolio turnover is calculated at the fund level. Percentage indicated was calculated for the year ended March 31, 2010. |
| |
| (9) | July 26, 2013 (commencement of sale) through March 31, 2014. |
| |
| (10) | Portfolio turnover is calculated at the fund level. Percentage indicated was calculated for the year ended March 31, 2014. |
See Notes to Financial Statements.
|
|
| Report of Independent Registered Public Accounting Firm |
To the Board of Directors and Shareholders of
American Century Capital Portfolios, Inc.:
We have audited the accompanying statement of assets and liabilities, including the schedule of investments, of Small Cap Value Fund (the “Fund”), one of the funds constituting American Century Capital Portfolios, Inc., as of March 31, 2014, and the related statement of operations for the year then ended, the statements of changes in net assets for each of the two years in the period then ended, and the financial highlights for each of the periods presented. These financial statements and financial highlights are the responsibility of the Fund's management. Our responsibility is to express an opinion on these financial statements and financial highlights based on our audits.
We conducted our audits in accordance with the standards of the Public Company Accounting Oversight Board (United States). Those standards require that we plan and perform the audit to obtain reasonable assurance about whether the financial statements and financial highlights are free of material misstatement. The Fund is not required to have, nor were we engaged to perform, an audit of its internal control over financial reporting. Our audits included consideration of internal control over financial reporting as a basis for designing audit procedures that are appropriate in the circumstances, but not for the purpose of expressing an opinion on the effectiveness of the Fund's internal control over financial reporting. Accordingly, we express no such opinion. An audit also includes examining, on a test basis, evidence supporting the amounts and disclosures in the financial statements, assessing the accounting principles used and significant estimates made by management, as well as evaluating the overall financial statement presentation. Our procedures included confirmation of securities owned as of March 31, 2014, by correspondence with the custodian and brokers; where replies were not received from brokers, we performed other auditing procedures. We believe that our audits provide a reasonable basis for our opinion.
In our opinion, the financial statements and financial highlights referred to above present fairly, in all material respects, the financial position of Small Cap Value Fund of American Century Capital Portfolios, Inc. as of March 31, 2014, the results of its operations for the year then ended, the changes in its net assets for each of the two years in the period then ended, and the financial highlights for each of the periods presented, in conformity with accounting principles generally accepted in the United States of America.
Deloitte & Touche LLP
Kansas City, Missouri
May 16, 2014
The Board of Directors
The individuals listed below serve as directors of the funds. Each director will continue to serve in this capacity until death, retirement, resignation or removal from office. The board has adopted a mandatory retirement age for directors who are not “interested persons,” as that term is defined in the Investment Company Act (independent directors). Independent directors shall retire by December 31 of the year in which they reach their 75th birthday.
Mr. Thomas is an “interested person” because he currently serves as President and Chief Executive Officer of American Century Companies, Inc. (ACC), the parent company of American Century Investment Management, Inc. (ACIM or the advisor). Mr. Fink is treated as an “interested person” because of his recent employment with ACC and American Century Services, LLC (ACS). The other directors (more than three-fourths of the total number) are independent. They are not employees, directors or officers of, and have no financial interest in, ACC or any of its wholly owned, direct or indirect, subsidiaries, including ACIM, American Century Investment Services, Inc. (ACIS) and ACS, and do not have any other affiliations, positions, or relationships that would cause them to be considered “interested persons” under the Investment Company Act. The directors serve in this capacity for seven (in the case of Mr. Thomas, 15) registered investment companies in the American Century Investments family of funds.
The following table presents additional information about the directors. The mailing address for each director is 4500 Main Street, Kansas City, Missouri 64111.
|
| | | | | |
Name (Year of Birth) | Position(s) Held with Funds | Length of Time Served | Principal Occupation(s) During Past 5 Years | Number of American Century Portfolios Overseen by Director | Other Directorships Held During Past
5 Years |
| Independent Directors |
Thomas A. Brown
(1940) | Director | Since 1980 | Managing Member, Associated Investments, LLC (real estate investment company); Brown Cascade Properties, LLC (real estate investment company) (2001 to 2009) | 73 | None |
Andrea C. Hall
(1945) | Director | Since 1997 | Retired | 73 | None |
Jan M. Lewis
(1957) | Director | Since 2011 | Retired; President and Chief Executive Officer, Catholic Charities of Northeast Kansas (human services organization) (2006 to 2013) | 73 | None |
James A. Olson
(1942) | Director and Chairman of the Board | Since 2007 (Chairman since 2014) | Member, Plaza Belmont LLC (private equity fund manager) | 73 | Saia, Inc. (2002 to 2012) and EPR Properties (2003 to 2013) |
|
| | | | | |
Name (Year of Birth) | Position(s) Held with Funds | Length of Time Served | Principal Occupation(s) During Past 5 Years | Number of American Century Portfolios Overseen by Director | Other Directorships Held During Past
5 Years |
| Independent Directors |
M. Jeannine Strandjord
(1945) | Director | Since 1994 | Retired | 73 | Euronet Worldwide Inc.; Charming Shoppes, Inc. (2006 to 2010); and DST Systems Inc. (1996 to 2012) |
John R. Whitten
(1946) | Director | Since 2008 | Retired | 73 | Rudolph Technologies, Inc. |
Stephen E. Yates
(1948) | Director | Since 2012 | Retired; Executive Vice President, Technology & Operations, KeyCorp. (computer services) (2004 to 2010) | 73 | Applied Industrial Technologies, Inc. (2001 to 2010) |
| Interested Directors | | | | |
Barry Fink
(1955) | Director | Since 2012 | Retired; Executive Vice President, ACC (September 2007 to February 2013); President, ACS (October 2007 to February 2013); Chief Operating Officer, ACC (September 2007 to November 2012) | 73 | None |
Jonathan S. Thomas
(1963) | Director and President | Since 2007 | President and Chief Executive Officer, ACC (March 2007 to present). Also serves as Chief Executive Officer and Manager, ACS; Executive Vice President, ACIM; Director, ACC, ACIM and other ACC subsidiaries | 115 | None |
Officers
The following table presents certain information about the executive officers of the funds. Each officer serves as an officer for each of the 15 investment companies in the American Century family of funds, unless otherwise noted. No officer is compensated for his or her service as an officer of the funds. The listed officers are interested persons of the funds and are appointed or re-appointed on an annual basis. The mailing address for each officer listed below is 4500 Main Street, Kansas City, Missouri 64111.
|
| | |
Name (Year of Birth) | Offices with
the Funds | Principal Occupation(s) During the Past Five Years |
Jonathan S.
Thomas
(1963) | Director and
President
since 2007 | President and Chief Executive Officer, ACC (March 2007 to present). Also serves as Chief Executive Officer and Manager, ACS; Executive Vice President, ACIM; Director, ACC, ACIM and other ACC subsidiaries |
Amy D. Shelton
(1964) | Chief Compliance
Officer since 2014 | Chief Compliance Officer, American Century funds, (March 2014 to present); Chief Compliance Officer, ACIM (February 2014 to present); Chief Compliance Officer, ACIS (October 2009 to present); Vice President, Client Interactions and Marketing, ACIS (February 2013 to January 2014); Director, Client Interactions and Marketing, ACIS (June 2007 to January 2013). Also serves as Vice President, ACIS |
Charles A.
Etherington
(1957) | General Counsel
since 2007 and
Senior Vice
President since 2006 | Attorney, ACC (February 1994 to present); Vice President, ACC (November 2005 to present); General Counsel, ACC (March 2007 to present). Also serves as General Counsel, ACIM, ACS, ACIS and other ACC subsidiaries; and Senior Vice President, ACIM and ACS |
C. Jean Wade
(1964) | Vice President,
Treasurer and
Chief Financial
Officer since 2012 | Vice President, ACS (February 2000 to present) |
Robert J.
Leach
(1966) | Vice President
since 2006 and
Assistant Treasurer
since 2012 | Vice President, ACS (February 2000 to present) |
David H.
Reinmiller
(1963) | Vice President
since 2000 | Attorney, ACC (January 1994 to present); Associate General Counsel, ACC (January 2001 to present). Also serves as Vice President, ACIM and ACS |
Ward D.
Stauffer
(1960) | Secretary
since 2005 | Attorney, ACC (June 2003 to present) |
The Statement of Additional Information has additional information about the fund's directors and is available without charge, upon request, by calling 1-800-345-2021.
Retirement Account Information
As required by law, distributions you receive from certain IRAs are subject to federal income tax withholding, unless you elect not to have withholding apply. Tax will be withheld on the total amount withdrawn even though you may be receiving amounts that are not subject to withholding, such as nondeductible contributions. In such case, excess amounts of withholding could occur. You may adjust your withholding election so that a greater or lesser amount will be withheld.
If you don’t want us to withhold on this amount, you must notify us to not withhold the federal income tax. You may notify us in writing or in certain situations by telephone or through other electronic means. For systematic withdrawals, your withholding election will remain in effect until revoked or changed by filing a new election. You have the right to revoke your election at any time.
Remember, even if you elect not to have income tax withheld, you are liable for paying income tax on the taxable portion of your withdrawal. If you elect not to have income tax withheld or you don’t have enough income tax withheld, you may be responsible for payment of estimated tax. You may incur penalties under the estimated tax rules if your withholding and estimated tax payments are not sufficient. You can reduce or defer the income tax on a distribution by directly or indirectly rolling such distribution over to another IRA or eligible plan. You should consult your tax advisor for additional information.
State tax will be withheld if, at the time of your distribution, your address is within one of the mandatory withholding states and you have federal income tax withheld (or as otherwise required by state law). State taxes will be withheld from your distribution in accordance with the respective state rules.
Distributions you receive from 403(b), 457 and qualified plans are subject to special tax and withholding rules. Your plan administrator or plan sponsor is required to provide you with a special tax notice explaining those rules at the time you request a distribution. If applicable, federal and/or state taxes may be withheld from your distribution amount.
Proxy Voting Policies
A description of the policies that the fund's investment advisor uses in exercising the voting rights associated with the securities purchased and/or held by the fund is available without charge, upon request, by calling 1-800-345-2021. It is also available on the "About Us" page of American Century Investments’ website at americancentury.com and on the Securities and Exchange Commission’s website at sec.gov. Information regarding how the investment advisor voted proxies relating to portfolio securities during the most recent 12-month period ended June 30 is available on the "About Us" page at americancentury.com. It is also available at sec.gov.
Quarterly Portfolio Disclosure
The fund files its complete schedule of portfolio holdings with the Securities and Exchange Commission (SEC) for the first and third quarters of each fiscal year on Form N-Q. The fund’s Forms N-Q are available on the SEC’s website at sec.gov, and may be reviewed and copied at the SEC’s Public Reference Room in Washington, DC. Information on the operation of the Public Reference Room may be obtained by calling 1-800-SEC-0330. The fund also makes its complete schedule of portfolio holdings for the most recent quarter of its fiscal year available on its
website at americancentury.com and, upon request, by calling 1-800-345-2021.
Other Tax Information
The following information is provided pursuant to provisions of the Internal Revenue Code.
The fund hereby designates up to the maximum amount allowable as qualified dividend income for the fiscal year ended March 31, 2014.
For corporate taxpayers, the fund hereby designates $26,764,056, or up to the maximum amount allowable, of ordinary income distributions paid during the fiscal year ended March 31, 2014 as qualified for the corporate dividends received deduction.
The fund hereby designates $143,565,149 as qualified short-term capital gain distributions for purposes of Internal Revenue Code Section 871.
The fund hereby designates $202,983,373, or up to the maximum amount allowable, as long-term capital gain distributions for the fiscal year ended March 31, 2014.
The fund utilized earnings and profits of $20,888,520 distributed to shareholders on redemption of shares as part of the dividends paid deduction (tax equalization).
|
| | |
| |
| | | |
| Contact Us | americancentury.com | |
| Automated Information Line | 1-800-345-8765 | |
| Investor Services Representative | 1-800-345-2021 or 816-531-5575 | |
| Investors Using Advisors | 1-800-378-9878 | |
| Business, Not-For-Profit, Employer-Sponsored Retirement Plans | 1-800-345-3533 | |
| Banks and Trust Companies, Broker-Dealers, Financial Professionals, Insurance Companies | 1-800-345-6488 | |
| Telecommunications Relay Service for the Deaf | 711 | |
| | | |
| American Century Capital Portfolios, Inc. | |
| | | |
Investment Advisor: American Century Investment Management, Inc. Kansas City, Missouri | |
| | | |
| This report and the statements it contains are submitted for the general information of our shareholders. The report is not authorized for distribution to prospective investors unless preceded or accompanied by an effective prospectus. | |
| | | |
©2014 American Century Proprietary Holdings, Inc. All rights reserved.
CL-ANN-82096 1405
| |
|
| |
ANNUAL REPORT | MARCH 31, 2014 |
Value Fund
|
| |
| President’s Letter | |
| Performance | |
| Portfolio Commentary | |
| Fund Characteristics | |
| Shareholder Fee Example | |
| Schedule of Investments | |
| Statement of Assets and Liabilities | |
| Statement of Operations | |
| Statement of Changes in Net Assets | |
| Notes to Financial Statements | |
| Financial Highlights | |
| Report of Independent Registered Public Accounting Firm | |
| Management | |
| Additional Information | |
Any opinions expressed in this report reflect those of the author as of the date of the report, and do not necessarily represent the opinions of American Century Investments® or any other person in the American Century Investments organization. Any such opinions are subject to change at any time based upon market or other conditions and American Century Investments disclaims any responsibility to update such opinions. These opinions may not be relied upon as investment advice and, because investment decisions made by American Century Investments funds are based on numerous factors, may not be relied upon as an indication of trading intent on behalf of any American Century Investments fund. Security examples are used for representational purposes only and are not intended as recommendations to purchase or sell securities. Performance information for comparative indices and securities is provided to American Century Investments by third party vendors. To the best of American Century Investments’ knowledge, such information is accurate at the time of printing.
|
| |
| Dear Investor:
Thank you for reviewing this annual report for the 12 months ended March 31, 2014. It provides investment performance, market analysis, and portfolio information, presented with the expert perspective of our portfolio management team.
Annual reports remain important vehicles for conveying information about fund returns, including key factors that affected fund performance. For additional, updated investment and market insights, we encourage you to visit our website, americancentury.com.
|
| Jonathan Thomas |
Monetary Policy-Driven, Mostly “Risk-On” Results in the U.S. and Europe
Stimulative monetary policies and expectations of economic improvement helped drive financial market returns during the reporting period. We believe the combination of optimism about the economy, low costs of capital in the money markets, and central bank purchases of longer-maturity fixed income securities (quantitative easing, or QE) helped persuade investors to seek risk and yield, especially in the U.S. and Europe. Stock index returns were strong in these markets, particularly at the smaller capitalization end of the company size spectrum. The MSCI Europe and S&P 500 Indices advanced 24.50% and 21.86%, respectively, and their smaller capitalization counterparts performed even better. In the U.S., growth stocks generally outperformed value stocks.
Some of the same growth and optimism factors that drove stocks higher, plus hints that QE tapering would begin in the U.S., hampered U.S. government bond returns, which dipped into negative territory for the reporting period. On the other hand, U.S. corporate bonds, especially high-yield corporates, posted mostly positive returns because of their higher yields, declining spreads (yield differences between corporate and similar-maturity U.S. Treasury securities), and relatively low default rates. At the other end of the U.S. bond spectrum, Treasury inflation-protected securities (TIPS) underperformed, hurt by the combination of rising yields and low inflation.
Looking ahead, we see further signs of economic improvement for the U.S. in 2014, but headwinds persist. Interest rates could normalize further, and economic growth and U.S. employment levels remain subpar compared with past post-recession periods. In this environment, we continue to believe in a disciplined, diversified, long-term investment approach, using professionally managed stock and bond portfolios—as appropriate—for meeting financial goals. We appreciate your continued trust in us.
Sincerely,
Jonathan Thomas
President and Chief Executive Officer
American Century Investments
|
| | | | | | |
| Total Returns as of March 31, 2014 | | | |
| | | | Average Annual Returns | |
| | Ticker Symbol | 1 Year | 5 Years | 10 Years | Since Inception | Inception Date |
| Investor Class | TWVLX | 20.82% | 19.47% | 7.30% | 10.12% | 9/1/93 |
| Russell 3000 Value Index | – | 21.65% | 21.87% | 7.61% | 9.62%(1) | – |
| S&P 500 Index | – | 21.86% | 21.14% | 7.41% | 9.12%(1) | – |
Russell 1000 Value Index(2) | – | 21.57% | 21.74% | 7.58% | 9.57%(1) | – |
| Institutional Class | AVLIX | 21.03% | 19.67% | 7.51% | 7.89% | 7/31/97 |
A Class(3) | TWADX | | | | | 10/2/96 |
| No sales charge* | | 20.55% | 19.14% | 7.02% | 8.61% | |
| With sales charge* | | 13.66% | 17.75% | 6.39% | 8.25% | |
| B Class | ACBVX | | | | | 1/31/03 |
| No sales charge* | | 19.65% | 18.27% | 6.24% | 8.51% | |
| With sales charge* | | 15.65% | 18.16% | 6.24% | 8.51% | |
| C Class | ACLCX | 19.64% | 18.29% | 6.24% | 6.16% | 6/4/01 |
| R Class | AVURX | 20.39% | 18.88% | – | 6.24% | 7/29/05 |
| R6 Class | AVUDX | – | – | – | 10.41%(4) | 7/26/13 |
| |
| * | Sales charges include initial sales charges and contingent deferred sales charges (CDSCs), as applicable. A Class shares have a 5.75% maximum initial sales charge and may be subject to a maximum CDSC of 1.00%. B Class shares redeemed within six years of purchase are subject to a CDSC that declines from 5.00% during the first year to 0.00% after the sixth year. C Class shares redeemed within 12 months of purchase are subject to a maximum CDSC of 1.00%. The SEC requires that mutual funds provide performance information net of maximum sales charges in all cases where charges could be applied. |
| |
| (1) | Since 8/31/93, the date nearest the Investor Class’s inception for which data are available. |
| |
| (2) | Effective May 2014, the fund’s benchmark changed from the Russell 3000 Value Index to the Russell 1000 Value Index. The fund’s investment advisor believes that the Russell 1000 Value Index aligns better with the fund’s strategy. The fund’s investment process did not change. |
| |
| (3) | Prior to September 4, 2007, the A Class was referred to as the Advisor Class and did not have a front-end sales charge. Performance prior to that date has been adjusted to reflect this charge. |
| |
| (4) | Total returns for periods less than one year are not annualized. |
Data presented reflect past performance. Past performance is no guarantee of future results. Current performance may be higher or lower than the performance shown. Investment return and principal value will fluctuate, and redemption value may be more or less than original cost. To obtain performance data current to the most recent month end, please call 1-800-345-2021 or visit americancentury.com. International investing involves special risks, such as political instability and currency fluctuations.
Unless otherwise indicated, performance reflects Investor Class shares; performance for other share classes will vary due to differences in fee structure. For information about other share classes available, please consult the prospectus. Data assumes reinvestment of dividends and capital gains, and none of the charts reflect the deduction of taxes that a shareholder would pay on fund distributions or the redemption of fund shares. Returns for the indices are provided for comparison. The fund’s total returns include operating expenses (such as transaction costs and management fees) that reduce returns, while the total returns of the indices do not.
|
|
| Growth of $10,000 Over 10 Years |
| $10,000 investment made March 31, 2004 |
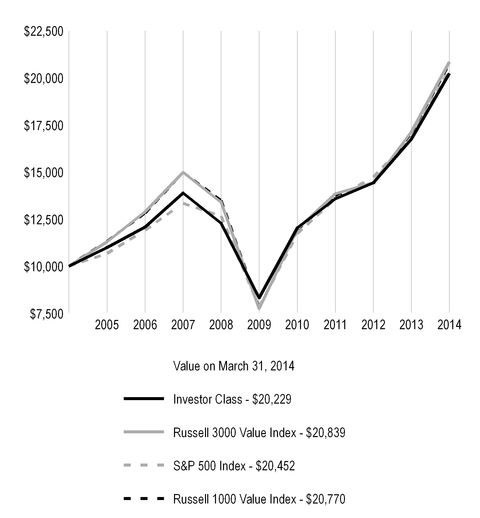
|
| | | | | | |
| Total Annual Fund Operating Expenses |
| Investor Class | Institutional Class | A Class | B Class | C Class | R Class | R6 Class |
| 1.00% | 0.80% | 1.25% | 2.00% | 2.00% | 1.50% | 0.65% |
The total annual fund operating expenses shown is as stated in the fund’s prospectus current as of the date of this report. The prospectus may vary from the expense ratio shown elsewhere in this report because it is based on a different time period, includes acquired fund fees and expenses, and, if applicable, does not include fee waivers or expense reimbursements.
Data presented reflect past performance. Past performance is no guarantee of future results. Current performance may be higher or lower than the performance shown. Investment return and principal value will fluctuate, and redemption value may be more or less than original cost. To obtain performance data current to the most recent month end, please call 1-800-345-2021 or visit americancentury.com. International investing involves special risks, such as political instability and currency fluctuations.
Unless otherwise indicated, performance reflects Investor Class shares; performance for other share classes will vary due to differences in fee structure. For information about other share classes available, please consult the prospectus. Data assumes reinvestment of dividends and capital gains, and none of the charts reflect the deduction of taxes that a shareholder would pay on fund distributions or the redemption of fund shares. Returns for the indices are provided for comparison. The fund’s total returns include operating expenses (such as transaction costs and management fees) that reduce returns, while the total returns of the indices do not.
Portfolio Managers: Michael Liss, Kevin Toney, Phil Davidson, and Brian Woglom
Performance Summary
Value returned 20.82%* for the 12 months ended March 31, 2014. By comparison, its benchmark, the Russell 3000 Value Index, returned 21.65%. The broader market, as measured by the S&P 500 Index, returned 21.86%. The portfolio’s return reflects operating expenses, while the indices’ returns do not.
The U.S. stock market generated strong gains during the one-year reporting period. When the period began, riskier asset classes led the market, as the Federal Reserve’s (Fed) bond-buying programs continued. Market leadership changed after the Fed suggested it might start tapering its asset purchases if economic conditions improved. Higher-quality stocks came into favor and as interest rates rose, higher-yielding stocks, such as real estate investment trusts (REITs) and utilities, declined. As the Fed sought to calm fears about eventual tapering, riskier stocks posted gains, but they reversed direction in mid-August on positive economic data, which suggested the Fed might announce tapering as soon as September. After the Fed surprised the markets by making no changes to its stimulus programs, lower-quality, riskier stocks rallied and continued to outperform through the end of 2013. In December, the U.S. economy showed new signs of strength and the Fed announced it would begin modestly scaling back its asset purchases in January 2014. As interest rates trended down in the last three months of the reporting period, yield-oriented securities, including utilities and REITs, rallied. For the reporting period overall, riskier, lower-yielding, and lower-quality stocks outperformed. Though value stocks recorded significant gains, they underperformed growth stocks. Large-cap value stocks underperformed both mid-cap value stocks and small-cap value stocks.
In this environment, the portfolio’s investment approach, which emphasizes higher-quality businesses with sound balance sheets, provided positive absolute results in eight of the 10 sectors in which it was invested. On a relative basis, it underperformed the benchmark, as investors gravitated to lower-quality, riskier securities.
We carefully manage this portfolio for long-term results. Since Value’s inception on September 1, 1993, the portfolio has produced an average annual return of 10.12%, topping the returns for that period of the Russell 3000 Value Index and the S&P 500 Index (see the performance information on pages 3 and 4).
Consumer Discretionary Detracted from Relative Performance
In consumer discretionary, an underweight position relative to the benchmark and security selection dampened relative results. The portfolio was hampered by an overweight position in International Game Technology, which declined on weak demand for new slot machines and competition in the company’s higher-margin businesses.
Security Selection in Materials and Consumer Staples Dampened Returns
In the materials sector, the portfolio was hindered by its selection of metals and mining stocks, including an investment in Barrick Gold. A sharp drop in gold prices during 2013 seemed likely to negatively impact the gold producer’s profitability and free-cash flow.
In consumer staples, security selection in the food products industry and, more specifically, food and staples retailers, detracted from results. During the reporting period, consumers appeared to be focusing their purchases on big-ticket items, such as cars and houses, instead of smaller-ticket items. In our opinion, this hurt the profit margins of many companies in the food products industry, including portfolio holdings Kellogg and ConAgra Foods—which underperformed. Weak consumer demand also negatively affected food service companies, such as Sysco.
*All fund returns referenced in this commentary are for Investor Class shares.
Industrials Sector Supplied Both Detractors and Contributors
In industrials, the portfolio was hampered by its overweight position in ADT. The security monitoring company has experienced an increase in subscriber-acquisition costs and associated lower-than-expected account growth as a result of competitors’ aggressive tactics, a situation we consider largely transitory. In addition, an overweight position in Republic Services was a drag on performance. Although the waste management company reported better-than-expected 2013 results, it faces a number of challenges in 2014, including flat pricing—many of its contracts with municipalities link pricing to inflation, which has been muted—and higher cash taxes if bonus depreciation benefits expire.
The industrials sector also provided notable contributors. The portfolio was overweight Heartland Express, which announced the acquisition of Gordon Trucking—a deal that we believe could boost earnings and the company’s stock price. An overweight position in Southwest Airlines also added to returns on the company’s improving profitability and better free-cash flow.
Financials and Energy Contributed Positively
In financials, an underweight position in REITs added to relative returns. In general, valuation of REITs has appeared unattractive. REITs have benefited from the low interest-rate and credit-spread environment, but the industry underperformed during the reporting period as interest rates increased.
Security selection in the oil, gas, and consumable fuels industry enhanced results. The portfolio benefited from an investment in Total SA, which outperformed after the company confirmed it would lower capital expenditures, thereby bolstering free-cash flow. We consider Total undervalued relative to other integrated oil and gas companies, with a solid global asset base.
Information Technology and Health Care Added to Results
In information technology, the portfolio benefited from an overweight position in Applied Materials, which reported solid results and provided better-than-expected guidance, driven by strength in core semiconductor capital equipment orders.
In health care, the portfolio was overweight health care equipment companies, largely because we expect utilization rates to increase as the U.S. economy improves and the Affordable Care Act is fully implemented. Many of these names, including portfolio holding Boston Scientific, performed well on improved earnings.
Outlook
We continue to follow our disciplined, bottom-up process, selecting companies one at a time for the portfolio. As of March 31, 2014, we saw attractive opportunities in energy, consumer staples, and health care, as reflected by the portfolio’s overweight positions in these sectors. Conversely, smaller relative weightings were given to financials, materials, and consumer discretionary stocks.
|
| |
| MARCH 31, 2014 |
| Top Ten Holdings | % of net assets |
| Exxon Mobil Corp. | 3.8% |
| Chevron Corp. | 3.2% |
| Wells Fargo & Co. | 3.0% |
| General Electric Co. | 3.0% |
| Pfizer, Inc. | 2.8% |
| Procter & Gamble Co. (The) | 2.7% |
| JPMorgan Chase & Co. | 2.4% |
| Republic Services, Inc. | 2.2% |
| AT&T, Inc. | 2.1% |
| Northern Trust Corp. | 2.1% |
| | |
| Top Five Industries | % of net assets |
| Oil, Gas and Consumable Fuels | 16.6% |
| Commercial Banks | 10.6% |
| Pharmaceuticals | 7.3% |
| Insurance | 4.7% |
| Commercial Services and Supplies | 4.6% |
| | |
| Types of Investments in Portfolio | % of net assets |
| Domestic Common Stocks | 89.2% |
| Foreign Common Stocks* | 7.6% |
| Total Common Stocks | 96.8% |
| Temporary Cash Investments | 3.0% |
| Other Assets and Liabilities | 0.2% |
*Includes depositary shares, dual listed securities and foreign ordinary shares.
Fund shareholders may incur two types of costs: (1) transaction costs, including sales charges (loads) on purchase payments and redemption/exchange fees; and (2) ongoing costs, including management fees; distribution and service (12b-1) fees; and other fund expenses. This example is intended to help you understand your ongoing costs (in dollars) of investing in your fund and to compare these costs with the ongoing cost of investing in other mutual funds.
The example is based on an investment of $1,000 made at the beginning of the period and held for the entire period from October 1, 2013 to March 31, 2014.
Actual Expenses
The table provides information about actual account values and actual expenses for each class. You may use the information, together with the amount you invested, to estimate the expenses that you paid over the period. First, identify the share class you own. Then simply divide your account value by $1,000 (for example, an $8,600 account value divided by $1,000 = 8.6), then multiply the result by the number under the heading “Expenses Paid During Period” to estimate the expenses you paid on your account during this period.
If you hold Investor Class shares of any American Century Investments fund, or Institutional Class shares of the American Century Diversified Bond Fund, in an American Century Investments account (i.e., not a financial intermediary or retirement plan account), American Century Investments may charge you a $12.50 semiannual account maintenance fee if the value of those shares is less than $10,000. We will redeem shares automatically in one of your accounts to pay the $12.50 fee. In determining your total eligible investment amount, we will include your investments in all personal accounts (including American Century Investments Brokerage accounts) registered under your Social Security number. Personal accounts include individual accounts, joint accounts, UGMA/UTMA accounts, personal trusts, Coverdell Education Savings Accounts and IRAs (including traditional, Roth, Rollover, SEP-, SARSEP- and SIMPLE-IRAs), and certain other retirement accounts. If you have only business, business retirement, employer-sponsored or American Century Investments Brokerage accounts, you are currently not subject to this fee. If you are subject to the Account Maintenance Fee, your account value could be reduced by the fee amount.
Hypothetical Example for Comparison Purposes
The table also provides information about hypothetical account values and hypothetical expenses based on the actual expense ratio of each class of your fund and an assumed rate of return of 5% per year before expenses, which is not the actual return of a fund’s share class. The hypothetical account values and expenses may not be used to estimate the actual ending account balance or expenses you paid for the period. You may use this information to compare the ongoing costs of investing in your fund and other funds. To do so, compare this 5% hypothetical example with the 5% hypothetical examples that appear in the shareholder reports of the other funds.
Please note that the expenses shown in the table are meant to highlight your ongoing costs only and do not reflect any transactional costs, such as sales charges (loads) or redemption/exchange fees. Therefore, the table is useful in comparing ongoing costs only, and will not help you determine the relative total costs of owning different funds. In addition, if these transactional costs were included, your costs would have been higher.
|
| | | | | | | | |
| | Beginning Account Value 10/1/13 | | Ending Account Value 3/31/14 | | Expenses Paid During Period(1) 10/1/13 - 3/31/14 | |
Annualized Expense Ratio(1) |
| Actual | | | | | | | | |
| Investor Class | | $1,000 | | $1,121.90 | | $5.13 | | 0.97% |
| Institutional Class | | $1,000 | | $1,122.80 | | $4.08 | | 0.77% |
| A Class | | $1,000 | | $1,119.20 | | $6.45 | | 1.22% |
| B Class | | $1,000 | | $1,116.20 | | $10.39 | | 1.97% |
| C Class | | $1,000 | | $1,117.10 | | $10.40 | | 1.97% |
| R Class | | $1,000 | | $1,119.10 | | $7.77 | | 1.47% |
| R6 Class | | $1,000 | | $1,123.70 | | $3.28 | | 0.62% |
| Hypothetical | | | | | | | | |
| Investor Class | | $1,000 | | $1,020.10 | | $4.89 | | 0.97% |
| Institutional Class | | $1,000 | | $1,021.09 | | $3.88 | | 0.77% |
| A Class | | $1,000 | | $1,018.85 | | $6.14 | | 1.22% |
| B Class | | $1,000 | | $1,015.11 | | $9.90 | | 1.97% |
| C Class | | $1,000 | | $1,015.11 | | $9.90 | | 1.97% |
| R Class | | $1,000 | | $1,017.60 | | $7.39 | | 1.47% |
| R6 Class | | $1,000 | | $1,021.84 | | $3.13 | | 0.62% |
| |
| (1) | Expenses are equal to the class's annualized expense ratio listed in the table above, multiplied by the average account value over the period, multiplied by 182, the number of days in the most recent fiscal half-year, divided by 365, to reflect the one-half year period. |
MARCH 31, 2014
|
| | | | | |
| | Shares | Value |
| COMMON STOCKS - 96.8% |
| AEROSPACE AND DEFENSE - 1.0% |
| BAE Systems plc | 1,039,120 |
| $ | 7,175,473 |
|
| Boeing Co. (The) | 72,704 |
| 9,123,625 |
|
| General Dynamics Corp. | 81,217 |
| 8,846,156 |
|
| Textron, Inc. | 254,660 |
| 10,005,591 |
|
| | | 35,150,845 |
|
| AIR FREIGHT AND LOGISTICS - 0.3% |
United Parcel Service, Inc., Class B | 110,432 |
| 10,753,868 |
|
| AIRLINES - 0.6% |
| Japan Airlines Co. Ltd. | 250,006 |
| 12,304,708 |
|
| Southwest Airlines Co. | 332,388 |
| 7,847,681 |
|
| | | 20,152,389 |
|
| AUTOMOBILES - 1.0% |
| General Motors Co. | 628,576 |
| 21,635,586 |
|
| Honda Motor Co., Ltd. | 441,300 |
| 15,537,317 |
|
| | | 37,172,903 |
|
| BEVERAGES - 0.3% |
| PepsiCo, Inc. | 131,680 |
| 10,995,280 |
|
| CAPITAL MARKETS - 3.3% |
| Charles Schwab Corp. (The) | 211,915 |
| 5,791,637 |
|
| Franklin Resources, Inc. | 198,820 |
| 10,772,068 |
|
| Goldman Sachs Group, Inc. (The) | 59,374 |
| 9,728,430 |
|
| Northern Trust Corp. | 1,150,134 |
| 75,402,785 |
|
| State Street Corp. | 214,575 |
| 14,923,691 |
|
| | | 116,618,611 |
|
| COMMERCIAL BANKS - 10.6% |
| BOK Financial Corp. | 209,488 |
| 14,465,146 |
|
| Commerce Bancshares, Inc. | 500,789 |
| 23,246,625 |
|
| Cullen/Frost Bankers, Inc. | 256,616 |
| 19,895,438 |
|
| JPMorgan Chase & Co. | 1,419,781 |
| 86,194,905 |
|
| M&T Bank Corp. | 212,330 |
| 25,755,629 |
|
| PNC Financial Services Group, Inc. (The) | 538,943 |
| 46,888,041 |
|
| U.S. Bancorp | 1,273,452 |
| 54,580,153 |
|
|
| | | | | | |
| | Shares | Value |
| Wells Fargo & Co. | 2,178,628 |
| $ | 108,364,957 |
|
| | | 379,390,894 |
|
| COMMERCIAL SERVICES AND SUPPLIES - 4.6% |
| ADT Corp. (The) | 1,183,402 |
| 35,442,890 |
|
| Republic Services, Inc. | 2,358,547 |
| 80,567,965 |
|
| Tyco International Ltd. | 609,812 |
| 25,856,029 |
|
| Waste Management, Inc. | 567,901 |
| 23,891,595 |
|
| | | 165,758,479 |
|
| COMMUNICATIONS EQUIPMENT - 2.0% |
| Cisco Systems, Inc. | 2,611,769 |
| 58,529,743 |
|
| QUALCOMM, Inc. | 150,270 |
| 11,850,292 |
|
| | | 70,380,035 |
|
| COMPUTERS AND PERIPHERALS - 3.9% |
| Apple, Inc. | 92,290 |
| 49,535,735 |
|
| Diebold, Inc. | 128,685 |
| 5,133,245 |
|
| EMC Corp. | 669,535 |
| 18,351,954 |
|
| Hewlett-Packard Co. | 533,225 |
| 17,255,161 |
|
| NetApp, Inc. | 272,110 |
| 10,040,859 |
|
QLogic Corp.(1) | 550,328 |
| 7,016,682 |
|
| SanDisk Corp. | 172,700 |
| 14,021,513 |
|
| Western Digital Corp. | 205,360 |
| 18,856,155 |
|
| | | 140,211,304 |
|
| CONTAINERS AND PACKAGING - 0.6% |
| Bemis Co., Inc. | 325,768 |
| 12,783,136 |
|
| Sonoco Products Co. | 196,380 |
| 8,055,508 |
|
| | | 20,838,644 |
|
| DIVERSIFIED FINANCIAL SERVICES - 1.6% |
Berkshire Hathaway, Inc., Class A(1) | 209 |
| 39,156,160 |
|
Berkshire Hathaway, Inc., Class B(1) | 142,050 |
| 17,751,989 |
|
| | | 56,908,149 |
|
| DIVERSIFIED TELECOMMUNICATION SERVICES - 2.8% |
| AT&T, Inc. | 2,189,952 |
| 76,801,617 |
|
| CenturyLink, Inc. | 746,969 |
| 24,530,462 |
|
| | | 101,332,079 |
|
| ELECTRIC UTILITIES - 2.9% |
| Great Plains Energy, Inc. | 1,009,296 |
| 27,291,364 |
|
| Southern Co. (The) | 320,598 |
| 14,087,076 |
|
| Westar Energy, Inc. | 796,618 |
| 28,009,089 |
|
|
| | | | | | |
| | Shares | Value |
| Xcel Energy, Inc. | 1,180,765 |
| $ | 35,848,025 |
|
| | | 105,235,554 |
|
| FOOD AND STAPLES RETAILING - 1.9% |
| CVS Caremark Corp. | 149,019 |
| 11,155,562 |
|
| Sysco Corp. | 663,993 |
| 23,990,067 |
|
| Wal-Mart Stores, Inc. | 426,051 |
| 32,563,078 |
|
| | | 67,708,707 |
|
| FOOD PRODUCTS - 3.2% |
| ConAgra Foods, Inc. | 492,290 |
| 15,275,759 |
|
| Danone SA | 202,230 |
| 14,300,644 |
|
| General Mills, Inc. | 236,340 |
| 12,247,139 |
|
| Hillshire Brands Co. | 450,781 |
| 16,796,100 |
|
| Kellogg Co. | 241,028 |
| 15,114,866 |
|
| Mondelez International, Inc., Class A | 789,396 |
| 27,273,632 |
|
| Unilever CVA | 359,250 |
| 14,765,956 |
|
| | | 115,774,096 |
|
| GAS UTILITIES - 0.4% |
| Laclede Group, Inc. (The) | 299,960 |
| 14,143,114 |
|
| HEALTH CARE EQUIPMENT AND SUPPLIES - 4.2% |
| Becton Dickinson and Co. | 96,603 |
| 11,310,279 |
|
Boston Scientific Corp.(1) | 1,034,756 |
| 13,989,901 |
|
CareFusion Corp.(1) | 1,083,686 |
| 43,585,851 |
|
| Medtronic, Inc. | 650,635 |
| 40,040,078 |
|
| Stryker Corp. | 322,270 |
| 26,255,337 |
|
| Zimmer Holdings, Inc. | 149,562 |
| 14,145,574 |
|
| | | 149,327,020 |
|
| HEALTH CARE PROVIDERS AND SERVICES - 2.1% |
LifePoint Hospitals, Inc.(1) | 442,468 |
| 24,136,629 |
|
| Quest Diagnostics, Inc. | 180,980 |
| 10,482,362 |
|
| UnitedHealth Group, Inc. | 414,655 |
| 33,997,563 |
|
| WellPoint, Inc. | 75,640 |
| 7,529,962 |
|
| | | 76,146,516 |
|
| HOTELS, RESTAURANTS AND LEISURE - 1.5% |
| Carnival Corp. | 365,003 |
| 13,819,013 |
|
| International Game Technology | 1,037,630 |
| 14,589,078 |
|
| International Speedway Corp., Class A | 477,233 |
| 16,221,150 |
|
|
| | | | | | |
| | Shares | Value |
| Speedway Motorsports, Inc. | 428,253 |
| $ | 8,021,179 |
|
| | | 52,650,420 |
|
| HOUSEHOLD PRODUCTS - 2.7% |
| Procter & Gamble Co. (The) | 1,223,690 |
| 98,629,414 |
|
| INDUSTRIAL CONGLOMERATES - 3.7% |
| General Electric Co. | 4,112,327 |
| 106,468,146 |
|
| Koninklijke Philips Electronics NV | 750,480 |
| 26,369,580 |
|
| | | 132,837,726 |
|
| INSURANCE - 4.7% |
| ACE Ltd. | 287,981 |
| 28,527,398 |
|
| Aflac, Inc. | 281,023 |
| 17,715,690 |
|
| Chubb Corp. (The) | 271,804 |
| 24,272,097 |
|
| HCC Insurance Holdings, Inc. | 505,169 |
| 22,980,138 |
|
| Marsh & McLennan Cos., Inc. | 290,745 |
| 14,333,728 |
|
| MetLife, Inc. | 430,888 |
| 22,750,886 |
|
| Reinsurance Group of America, Inc. | 260,403 |
| 20,735,891 |
|
| Travelers Cos., Inc. (The) | 205,887 |
| 17,520,984 |
|
| | | 168,836,812 |
|
| MEDIA - 0.3% |
| Walt Disney Co. (The) | 127,246 |
| 10,188,587 |
|
| METALS AND MINING - 0.9% |
Constellium NV, Class A(1) | 337,049 |
| 9,892,388 |
|
| Freeport-McMoRan Copper & Gold, Inc. | 456,488 |
| 15,096,058 |
|
| Newmont Mining Corp. | 307,505 |
| 7,207,918 |
|
| | | 32,196,364 |
|
| MULTI-UTILITIES - 1.5% |
| Consolidated Edison, Inc. | 242,880 |
| 13,030,512 |
|
| PG&E Corp. | 980,770 |
| 42,369,264 |
|
| | | 55,399,776 |
|
| MULTILINE RETAIL - 0.6% |
| Target Corp. | 360,773 |
| 21,830,374 |
|
| OIL, GAS AND CONSUMABLE FUELS - 16.6% |
| Apache Corp. | 425,982 |
| 35,335,207 |
|
| Chevron Corp. | 967,137 |
| 115,002,261 |
|
| Devon Energy Corp. | 283,838 |
| 18,997,277 |
|
| El Paso Pipeline Partners LP | 305,840 |
| 9,294,478 |
|
| Exxon Mobil Corp. | 1,404,696 |
| 137,210,705 |
|
| Imperial Oil Ltd. | 1,479,526 |
| 68,897,330 |
|
|
| | | | | | |
| | Shares | Value |
| Occidental Petroleum Corp. | 663,133 |
| $ | 63,189,944 |
|
| Peabody Energy Corp. | 635,367 |
| 10,381,897 |
|
| Royal Dutch Shell plc, Class A | 241,990 |
| 8,841,169 |
|
Southwestern Energy Co.(1) | 491,885 |
| 22,631,629 |
|
| Total SA | 1,104,631 |
| 72,437,414 |
|
Ultra Petroleum Corp.(1) | 585,154 |
| 15,734,791 |
|
| Williams Partners LP | 352,047 |
| 17,933,274 |
|
| | | 595,887,376 |
|
| PHARMACEUTICALS - 7.3% |
| Eli Lilly & Co. | 179,057 |
| 10,539,295 |
|
Hospira, Inc.(1) | 396,948 |
| 17,168,001 |
|
| Johnson & Johnson | 721,779 |
| 70,900,351 |
|
| Merck & Co., Inc. | 1,091,227 |
| 61,948,957 |
|
| Pfizer, Inc. | 3,097,653 |
| 99,496,614 |
|
| | | 260,053,218 |
|
| REAL ESTATE INVESTMENT TRUSTS (REITs) - 2.7% |
| Annaly Capital Management, Inc. | 1,876,428 |
| 20,584,415 |
|
| Capstead Mortgage Corp. | 907,480 |
| 11,488,697 |
|
| Corrections Corp. of America | 861,149 |
| 26,971,186 |
|
| Empire State Realty Trust, Inc. | 931,379 |
| 14,073,137 |
|
| Piedmont Office Realty Trust, Inc., Class A | 1,408,105 |
| 24,149,001 |
|
| | | 97,266,436 |
|
| ROAD AND RAIL - 0.7% |
| Heartland Express, Inc. | 396,765 |
| 9,002,598 |
|
| Werner Enterprises, Inc. | 576,188 |
| 14,698,556 |
|
| | | 23,701,154 |
|
| SEMICONDUCTORS AND SEMICONDUCTOR EQUIPMENT - 2.9% |
| Applied Materials, Inc. | 1,466,444 |
| 29,944,786 |
|
| Intel Corp. | 2,000,417 |
| 51,630,763 |
|
| KLA-Tencor Corp. | 80,240 |
| 5,547,794 |
|
| Maxim Integrated Products, Inc. | 165,030 |
| 5,465,794 |
|
Teradyne, Inc.(1) | 550,190 |
| 10,943,279 |
|
| | | 103,532,416 |
|
|
| | | | | | |
| | Shares | Value |
| SOFTWARE - 1.0% |
| Microsoft Corp. | 318,012 |
| $ | 13,035,312 |
|
| NICE Systems Ltd. ADR | 304,319 |
| 13,590,887 |
|
| Oracle Corp. | 244,239 |
| 9,991,817 |
|
| | | 36,618,016 |
|
| SPECIALTY RETAIL - 1.5% |
Bed Bath & Beyond, Inc.(1) | 135,475 |
| 9,320,680 |
|
| CST Brands, Inc. | 523,350 |
| 16,349,454 |
|
| Lowe's Cos., Inc. | 570,044 |
| 27,875,152 |
|
| | | 53,545,286 |
|
| TEXTILES, APPAREL AND LUXURY GOODS - 0.2% |
| Coach, Inc. | 178,788 |
| 8,878,612 |
|
| THRIFTS AND MORTGAGE FINANCE - 0.5% |
| People's United Financial, Inc. | 1,179,820 |
| 17,543,923 |
|
| WIRELESS TELECOMMUNICATION SERVICES - 0.2% |
| Rogers Communications, Inc., Class B | 177,850 |
| 7,369,795 |
|
TOTAL COMMON STOCKS (Cost $2,709,076,136) | 3,470,964,192 |
|
| TEMPORARY CASH INVESTMENTS - 3.0% |
| Repurchase Agreement, Bank of America Merrill Lynch, (collateralized by various U.S. Treasury obligations, 0.75% - 1.375%, 10/31/17 - 6/30/18, valued at $20,639,257), in a joint trading account at 0.03%, dated 3/31/14, due 4/1/14 (Delivery value $20,222,034) | 20,222,017 |
|
| Repurchase Agreement, Goldman Sachs & Co., (collateralized by various U.S. Treasury obligations, 4.25%, 8/15/15, valued at $18,152,972), in a joint trading account at 0.03%, dated 3/31/14, due 4/1/14 (Delivery value $17,795,390) | 17,795,375 |
|
| SSgA U.S. Government Money Market Fund | 68,561,461 |
| 68,561,461 |
|
TOTAL TEMPORARY CASH INVESTMENTS (Cost $106,578,853) | 106,578,853 |
|
TOTAL INVESTMENT SECURITIES — 99.8% (Cost $2,815,654,989) | 3,577,543,045 |
|
| OTHER ASSETS AND LIABILITIES — 0.2% | 7,871,693 |
|
| TOTAL NET ASSETS — 100.0% | $ | 3,585,414,738 | |
|
| | | | | | | | |
| FORWARD FOREIGN CURRENCY EXCHANGE CONTRACTS |
| Currency Purchased | Currency Sold | Counterparty | Settlement Date | Unrealized Appreciation (Depreciation) |
| USD | 56,094,854 | CAD | 62,685,999 | JPMorgan Chase Bank N.A. | 4/30/14 | $ | (570,746 | ) |
| USD | 98,179,663 | EUR | 71,191,113 | UBS AG | 4/30/14 | 109,238 |
|
| USD | 2,747,194 | EUR | 1,999,661 | UBS AG | 4/30/14 | (7,470) |
|
| USD | 4,421,046 | GBP | 2,672,360 | Credit Suisse AG | 4/30/14 | (33,232) |
|
| USD | 242,193 | GBP | 146,164 | Credit Suisse AG | 4/30/14 | (1,432) |
|
| USD | 373,049 | GBP | 224,520 | Credit Suisse AG | 4/30/14 | (1,181) |
|
| USD | 220,088 | GBP | 131,987 | Credit Suisse AG | 4/30/14 | 93 |
|
| USD | 20,046,654 | JPY | 2,049,610,020 | Credit Suisse AG | 4/30/14 | 185,934 |
|
| USD | 614,442 | JPY | 63,260,108 | Credit Suisse AG | 4/30/14 | 1,452 |
|
| | | | | | | $ | (317,344 | ) |
|
| | |
| Notes to Schedule of Investments |
| ADR | - | American Depositary Receipt |
| CAD | - | Canadian Dollar |
| CVA | - | Certificaten Van Aandelen |
| EUR | - | Euro |
| GBP | - | British Pound |
| JPY | - | Japanese Yen |
| USD | - | United States Dollar |
(1) Non-income producing.
See Notes to Financial Statements.
|
|
| Statement of Assets and Liabilities |
|
| | | |
| MARCH 31, 2014 | |
| Assets | |
| Investment securities, at value (cost of $2,815,654,989) | $ | 3,577,543,045 |
|
| Foreign currency holdings, at value (cost of $855,478) | 855,105 |
|
| Receivable for investments sold | 15,220,210 |
|
| Receivable for capital shares sold | 5,918,488 |
|
| Unrealized appreciation on forward foreign currency exchange contracts | 296,717 |
|
| Dividends and interest receivable | 7,620,381 |
|
| | 3,607,453,946 |
|
| | |
| Liabilities | |
| Payable for investments purchased | 16,657,803 |
|
| Payable for capital shares redeemed | 1,905,542 |
|
| Unrealized depreciation on forward foreign currency exchange contracts | 614,061 |
|
| Accrued management fees | 2,748,838 |
|
| Distribution and service fees payable | 112,964 |
|
| | 22,039,208 |
|
| | |
| Net Assets | $ | 3,585,414,738 |
|
| | |
| | |
| Net Assets Consist of: | |
| Capital (par value and paid-in surplus) | $ | 2,856,960,324 |
|
| Undistributed net investment income | 7,059,685 |
|
| Accumulated net realized loss | (40,173,064 | ) |
| Net unrealized appreciation | 761,567,793 |
|
| | $ | 3,585,414,738 |
|
|
| | | |
| | Net Assets | Shares Outstanding | Net Asset Value Per Share |
| Investor Class, $0.01 Par Value | $2,406,138,580 | 284,427,835 | $8.46 |
| Institutional Class, $0.01 Par Value | $749,867,856 | 88,530,530 | $8.47 |
| A Class, $0.01 Par Value | $362,438,715 | 42,869,108 | $8.45* |
| B Class, $0.01 Par Value | $884,373 | 104,985 | $8.42 |
| C Class, $0.01 Par Value | $25,868,802 | 3,096,009 | $8.36 |
| R Class, $0.01 Par Value | $37,076,240 | 4,383,696 | $8.46 |
| R6 Class, $0.01 Par Value | $3,140,172 | 370,591 | $8.47 |
* Maximum offering price $8.97 (net asset value divided by 0.9425).
See Notes to Financial Statements.
|
| | | |
| YEAR ENDED MARCH 31, 2014 | |
| Investment Income (Loss) | |
| Income: | |
| Dividends (net of foreign taxes withheld of $842,239) | $ | 79,439,944 |
|
| Interest | 14,231 |
|
| | 79,454,175 |
|
| | |
| Expenses: | |
| Management fees | 28,983,301 |
|
| Distribution and service fees: | |
| A Class | 828,305 |
|
| B Class | 11,225 |
|
| C Class | 221,238 |
|
| R Class | 151,745 |
|
| Directors' fees and expenses | 68,072 |
|
| Other expenses | 43 |
|
| | 30,263,929 |
|
| | |
| Net investment income (loss) | 49,190,246 |
|
| | |
| Realized and Unrealized Gain (Loss) | |
| Net realized gain (loss) on: | |
| Investment transactions | 272,624,205 |
|
| Foreign currency transactions | 1,040,794 |
|
| | 273,664,999 |
|
| | |
| Change in net unrealized appreciation (depreciation) on: | |
| Investments | 262,227,550 |
|
| Translation of assets and liabilities in foreign currencies | (344,001) |
|
| | 261,883,549 |
|
| | |
| Net realized and unrealized gain (loss) | 535,548,548 |
|
| | |
| Net Increase (Decrease) in Net Assets Resulting from Operations | $ | 584,738,794 |
|
See Notes to Financial Statements.
|
|
| Statement of Changes in Net Assets |
|
| | | | | | |
| YEARS ENDED MARCH 31, 2014 AND MARCH 31, 2013 | | |
| Increase (Decrease) in Net Assets | March 31, 2014 | March 31, 2013 |
| Operations | | |
| Net investment income (loss) | $ | 49,190,246 |
| $ | 36,055,327 |
|
| Net realized gain (loss) | 273,664,999 |
| 64,516,677 |
|
| Change in net unrealized appreciation (depreciation) | 261,883,549 |
| 242,102,942 |
|
| Net increase (decrease) in net assets resulting from operations | 584,738,794 |
| 342,674,946 |
|
| | | |
| Distributions to Shareholders | | |
| From net investment income: | | |
| Investor Class | (33,537,749 | ) | (30,144,837 | ) |
| Institutional Class | (8,872,623 | ) | (2,541,734 | ) |
| A Class | (4,262,707 | ) | (3,675,451 | ) |
| B Class | (7,029 | ) | (12,400 | ) |
| C Class | (133,176 | ) | (92,780 | ) |
| R Class | (326,809 | ) | (270,012 | ) |
| R6 Class | (5,956 | ) | — |
|
| Decrease in net assets from distributions | (47,146,049 | ) | (36,737,214 | ) |
| | | |
| Capital Share Transactions | | |
| Net increase (decrease) in net assets from capital share transactions | 575,732,658 |
| (62,140,160 | ) |
| | | |
| Net increase (decrease) in net assets | 1,113,325,403 |
| 243,797,572 |
|
| | | |
| Net Assets | | |
| Beginning of period | 2,472,089,335 |
| 2,228,291,763 |
|
| End of period | $ | 3,585,414,738 |
| $ | 2,472,089,335 |
|
| | | |
| Undistributed net investment income | $ | 7,059,685 |
| $ | 4,168,879 |
|
See Notes to Financial Statements.
|
|
| Notes to Financial Statements |
MARCH 31, 2014
1. Organization
American Century Capital Portfolios, Inc. (the corporation) is registered under the Investment Company Act of 1940, as amended (the 1940 Act), as an open-end management investment company and is organized as a Maryland corporation. Value Fund (the fund) is one fund in a series issued by the corporation. The fund is diversified as defined under the 1940 Act. The fund’s investment objective is to seek long-term capital growth. Income is a secondary objective.
The fund offers the Investor Class, the Institutional Class, the A Class, the B Class, the C Class, the R Class and the R6 Class. The A Class may incur an initial sales charge. The A Class, B Class and C Class may be subject to a contingent deferred sales charge. The share classes differ principally in their respective sales charges and distribution and shareholder servicing expenses and arrangements. The Institutional Class and R6 Class shareholders do not require the same level of shareholder and administrative services from American Century Investment Management, Inc. (ACIM) (the investment advisor) as shareholders of other classes. In addition, financial intermediaries do not receive any service, distribution or administrative fees for the R6 Class. As a result, the Institutional Class and R6 Class are charged lower unified management fees. Sale of the R6 Class commenced on July 26, 2013.
2. Significant Accounting Policies
The following is a summary of significant accounting policies consistently followed by the fund in preparation of its financial statements. The financial statements are prepared in conformity with accounting principles generally accepted in the United States of America, which may require management to make certain estimates and assumptions at the date of the financial statements. Actual results could differ from these estimates.
Investment Valuations - The fund determines the fair value of its investments and computes its net asset value per share at the close of regular trading (usually 4 p.m. Eastern time) on the New York Stock Exchange (NYSE) on each day the NYSE is open. The Board of Directors has adopted valuation policies and procedures to guide the investment advisor in the fund’s investment valuation process and to provide methodologies for the oversight of the fund’s pricing function.
Equity securities that are listed or traded on a domestic securities exchange are valued at the last reported sales price or at the official closing price as provided by the exchange. Equity securities traded on foreign securities exchanges are generally valued at the closing price of such securities on the exchange where primarily traded or at the close of the NYSE, if that is earlier. If no last sales price is reported, or if local convention or regulation so provides, the mean of the latest bid and asked prices may be used. Securities traded over-the-counter are valued at the mean of the latest bid and asked prices, the last sales price, or the official closing price. Equity securities initially expressed in local currencies are translated into U.S. dollars at the mean of the appropriate currency exchange rate at the close of the NYSE as provided by an independent pricing service.
Fixed income securities maturing within 60 days at the time of purchase may be valued at cost, plus or minus any amortized discount or premium or at the evaluated mean as provided by an independent pricing service. Evaluated mean prices are commonly derived through utilization of market models, which may consider, among other factors: trade data, quotations from dealers and active market makers, relevant yield curve and spread data, related sector levels, creditworthiness, trade data or market information on comparable securities, and other relevant security specific information.
Open-end management investment companies are valued at the reported net asset value per share. Repurchase agreements are valued at cost, which approximates fair value. Forward foreign currency exchange contracts are valued at the mean of the appropriate forward exchange rate at the close of the NYSE as provided by an independent pricing service.
If the fund determines that the market price for an investment is not readily available or the valuation methods mentioned above do not reflect an investment’s fair value, such investment is valued as determined in good faith by the Board of Directors or its delegate, in accordance with policies and procedures adopted by the Board of Directors. In its determination of fair value, the fund may review
several factors including, but not limited to, market information regarding the specific investment or comparable investments and correlation with other investment types, futures indices or general market indicators. Circumstances that may cause the fund to use these procedures to value an investment include, but are not limited to: an investment has been declared in default or is distressed; trading in a security has been suspended during the trading day or a security is not actively trading on its principal exchange; prices received from a regular pricing source are deemed unreliable; or there is a foreign market holiday and no trading occurred.
The fund monitors for significant events occurring after the close of an investment’s primary exchange but before the fund’s net asset value per share is determined. Significant events may include, but are not limited to: corporate announcements and transactions; governmental action and political unrest that could impact a specific investment or an investment sector; or armed conflicts, natural disasters and similar events that could affect investments in a specific country or region. The fund also monitors for significant fluctuations between domestic and foreign markets, as evidenced by the U.S. market or such other indicators that the Board of Directors, or its delegate, deems appropriate. If significant fluctuations in foreign markets are identified, the fund may apply a model-derived factor to the closing price of equity securities traded on foreign securities exchanges. The factor is based on observable market data as provided by an independent pricing service.
Security Transactions - Security transactions are accounted for as of the trade date. Net realized gains and losses are determined on the identified cost basis, which is also used for federal income tax purposes.
Investment Income - Dividend income less foreign taxes withheld, if any, is recorded as of the ex-dividend date. Distributions received on securities that represent a return of capital or long-term capital gain are recorded as a reduction of cost of investments and/or as a realized gain. The fund may estimate the components of distributions received that may be considered nontaxable distributions or long-term capital gain distributions for income tax purposes. Interest income is recorded on the accrual basis and includes accretion of discounts and amortization of premiums.
Foreign Currency Translations - All assets and liabilities initially expressed in foreign currencies are translated into U.S. dollars at prevailing exchange rates at period end. The fund may enter into spot foreign currency exchange contracts to facilitate transactions denominated in a foreign currency. Purchases and sales of investment securities, dividend and interest income, spot foreign currency exchange contracts, and expenses are translated at the rates of exchange prevailing on the respective dates of such transactions. Net realized and unrealized foreign currency exchange gains or losses related to investment securities are a component of net realized gain (loss) on investment transactions and change in net unrealized appreciation (depreciation) on investments, respectively.
Repurchase Agreements - The fund may enter into repurchase agreements with institutions that ACIM has determined are creditworthy pursuant to criteria adopted by the Board of Directors. The fund requires that the collateral, represented by securities, received in a repurchase transaction be transferred to the custodian in a manner sufficient to enable the fund to obtain those securities in the event of a default under the repurchase agreement. ACIM monitors, on a daily basis, the securities transferred to ensure the value, including accrued interest, of the securities under each repurchase agreement is equal to or greater than amounts owed to the fund under each repurchase agreement.
Joint Trading Account - Pursuant to an Exemptive Order issued by the Securities and Exchange Commission, the fund, along with certain other funds in the American Century Investments family of funds, may transfer uninvested cash balances into a joint trading account. These balances are invested in one or more repurchase agreements that are collateralized by U.S. Treasury or Agency obligations.
Income Tax Status - It is the fund’s policy to distribute substantially all net investment income and net realized gains to shareholders and to otherwise qualify as a regulated investment company under provisions of the Internal Revenue Code. Accordingly, no provision has been made for income taxes. The fund files U.S. federal, state, local and non-U.S. tax returns as applicable. The fund's tax returns are subject to examination by the relevant taxing authority until expiration of the applicable statute of limitations, which is generally three years from the date of filing but can be longer in certain jurisdictions. At this time, management believes there are no uncertain tax positions which, based on their technical merit, would not be sustained upon examination and for which it is reasonably possible that the total amounts of unrecognized tax benefits will significantly change in the next twelve months.
Multiple Class - All shares of the fund represent an equal pro rata interest in the net assets of the class to which such shares belong, and have identical voting, dividend, liquidation and other rights and the same terms and conditions, except for class specific expenses and exclusive rights to vote on matters affecting only individual classes. Income, non-class specific expenses, and realized and unrealized capital gains and losses of the fund are allocated to each class of shares based on their relative net assets.
Distributions to Shareholders - Distributions from net investment income, if any, are generally declared and paid quarterly. Distributions from net realized gains, if any, are generally declared and paid annually.
Indemnifications - Under the corporation’s organizational documents, its officers and directors are indemnified against certain liabilities arising out of the performance of their duties to the fund. In addition, in the normal course of business, the fund enters into contracts that provide general indemnifications. The maximum exposure under these arrangements is unknown as this would involve future claims that may be made against a fund. The risk of material loss from such claims is considered by management to be remote.
3. Fees and Transactions with Related Parties
Certain officers and directors of the corporation are also officers and/or directors of American Century Companies, Inc. (ACC). The corporation’s investment advisor, ACIM, the corporation's distributor, American Century Investment Services, Inc. (ACIS), and the corporation’s transfer agent, American Century Services, LLC, are wholly owned, directly or indirectly, by ACC.
Management Fees - The corporation has entered into a management agreement with ACIM, under which ACIM provides the fund with investment advisory and management services in exchange for a single, unified management fee (the fee) per class. The agreement provides that all expenses of managing and operating the fund, except distribution and service fees, brokerage expenses, taxes, interest, fees and expenses of the independent directors (including legal counsel fees), and extraordinary expenses, will be paid by ACIM. The fee is computed and accrued daily based on each class’s daily net assets and paid monthly in arrears. The rate of the fee is determined by applying a fee rate calculation formula. This formula takes into account the fund’s assets as well as certain assets, if any, of other clients of the investment advisor outside the American Century Investments family of funds (such as subadvised funds and separate accounts) that have very similar investment teams and investment strategies (strategy assets). The annual management fee schedule ranges from 0.85% to 1.00% for the Investor Class, A Class, B Class, C Class and R Class. The annual management fee schedule ranges from 0.65% to 0.80% for the Institutional Class and 0.50% to 0.65% for the R6 Class. The effective annual management fee for each class for the period ended March 31, 2014 was 0.97% for the Investor Class, A Class, B Class, C Class and R Class, 0.77% for the Institutional Class and 0.62% for the R6 Class.
Distribution and Service Fees - The Board of Directors has adopted a separate Master Distribution and Individual Shareholder Services Plan for each of the A Class, B Class, C Class and R Class (collectively the plans), pursuant to Rule 12b-1 of the 1940 Act. The plans provide that the A Class will pay ACIS an annual distribution and service fee of 0.25%. The plans provide that the B Class and C Class will each pay ACIS an annual distribution and service fee of 1.00%, of which 0.25% is paid for individual shareholder services and 0.75% is paid for distribution services. The plans provide that the R Class will pay ACIS an annual distribution and service fee of 0.50%. The fees are computed and accrued daily based on each class’s daily net assets and paid monthly in arrears. The fees are used to pay financial intermediaries for distribution and individual shareholder services. Fees incurred under the plans during the year ended March 31, 2014 are detailed in the Statement of Operations.
Directors' Fees and Expenses - The Board of Directors is responsible for overseeing the investment advisor's management and operations of the fund. The directors receive detailed information about the fund and its investment advisor regularly throughout the year, and meet at least quarterly with management of the investment advisor to review reports about fund operations. Fees and expenses incurred in conjunction with the directors during the year ended March 31, 2014 are detailed in the Statement of Operations. The fund’s officers do not receive compensation from the fund.
4. Investment Transactions
Purchases and sales of investment securities, excluding short-term investments, for the year ended March 31, 2014 were $2,000,255,506 and $1,469,275,147, respectively.
5. Capital Share Transactions
Transactions in shares of the fund were as follows:
|
| | | | | | | | |
| | Year ended March 31, 2014(1) | Year ended March 31, 2013 |
| | Shares | Amount | Shares | Amount |
| Investor Class/Shares Authorized | 1,100,000,000 | | 1,100,000,000 | |
| Sold | 65,420,517 | $ | 508,106,147 |
| 45,160,547 | $ | 286,129,344 |
|
| Issued in reinvestment of distributions | 4,054,379 | 31,621,188 |
| 4,183,505 | 26,164,018 |
|
| Redeemed | (60,161,565) | (468,850,009) |
| (65,081,757) | (413,245,166) |
|
| | 9,313,331 | 70,877,326 |
| (15,737,705) | (100,951,804) |
|
| Institutional Class/Shares Authorized | 250,000,000 | | 200,000,000 | |
| Sold | 79,698,575 | 607,014,116 |
| 8,355,624 | 53,741,297 |
|
| Issued in reinvestment of distributions | 1,130,497 | 8,848,720 |
| 401,091 | 2,530,758 |
|
| Redeemed | (16,591,337) | (129,765,540) |
| (4,682,274) | (29,793,368) |
|
| | 64,237,735 | 486,097,296 |
| 4,074,441 | 26,478,687 |
|
| A Class/Shares Authorized | 200,000,000 | | 200,000,000 | |
| Sold | 8,830,565 | 67,895,383 |
| 8,794,969 | 55,446,285 |
|
| Issued in reinvestment of distributions | 524,384 | 4,071,308 |
| 559,708 | 3,499,387 |
|
| Redeemed | (8,023,845) | (62,285,375) |
| (8,899,559) | (54,893,712) |
|
| | 1,331,104 | 9,681,316 |
| 455,118 | 4,051,960 |
|
| B Class/Shares Authorized | 5,000,000 | | 5,000,000 | |
| Sold | 15,226 | 116,591 |
| 19,606 | 126,608 |
|
| Issued in reinvestment of distributions | 790 | 6,041 |
| 1,804 | 10,971 |
|
| Redeemed | (126,045) | (952,867) |
| (174,133) | (1,075,777) |
|
| | (110,029) | (830,235) |
| (152,723) | (938,198) |
|
| C Class/Shares Authorized | 15,000,000 | | 15,000,000 | |
| Sold | 1,174,748 | 8,905,205 |
| 907,282 | 5,658,849 |
|
| Issued in reinvestment of distributions | 14,559 | 111,658 |
| 11,902 | 72,522 |
|
| Redeemed | (478,817) | (3,711,656) |
| (351,171) | (2,176,508) |
|
| | 710,490 | 5,305,207 |
| 568,013 | 3,554,863 |
|
| R Class/Shares Authorized | 15,000,000 | | 15,000,000 | |
| Sold | 2,640,094 | 20,325,381 |
| 1,387,484 | 9,039,989 |
|
| Issued in reinvestment of distributions | 42,315 | 326,809 |
| 43,254 | 270,012 |
|
| Redeemed | (2,562,556) | (18,944,713) |
| (578,273) | (3,645,669) |
|
| | 119,853 | 1,707,477 |
| 852,465 | 5,664,332 |
|
| R6 Class/Shares Authorized | 50,000,000 | | N/A | |
| Sold | 371,909 | 2,905,068 |
| | |
| Issued in reinvestment of distributions | 721 | 5,956 |
| | |
| Redeemed | (2,039) | (16,753 | ) | | |
| | 370,591 | 2,894,271 |
| | |
| Net increase (decrease) | 75,973,075 | $ | 575,732,658 |
| (9,940,391) | $ | (62,140,160 | ) |
| |
| (1) | July 26, 2013 (commencement of sale) through March 31, 2014 for the R6 Class. |
6. Fair Value Measurements
The fund’s investments valuation process is based on several considerations and may use multiple inputs to determine the fair value of the investments held by the fund. In conformity with accounting principles generally accepted in the United States of America, the inputs used to determine a valuation are classified into three broad levels.
| |
| • | Level 1 valuation inputs consist of unadjusted quoted prices in an active market for identical investments. |
| |
| • | Level 2 valuation inputs consist of direct or indirect observable market data (including quoted prices for comparable investments, evaluations of subsequent market events, interest rates, prepayment speeds, credit risk, etc.). These inputs also consist of quoted prices for identical investments initially expressed in local currencies that are adjusted through translation into U.S. dollars. |
| |
| • | Level 3 valuation inputs consist of unobservable data (including a fund’s own assumptions). |
The level classification is based on the lowest level input that is significant to the fair valuation measurement. The valuation inputs are not necessarily an indication of the risks associated with investing in these securities or other financial instruments.
The following is a summary of the level classifications as of period end. The Schedule of Investments provides additional information on the fund’s portfolio holdings.
|
| | | | | | | | |
| | Level 1 | Level 2 | Level 3 |
| Assets | | | |
| Investment Securities | | | |
| Common Stocks | $ | 3,222,964,806 |
| $ | 247,999,386 |
| — |
|
| Temporary Cash Investments | 68,561,461 |
| 38,017,392 |
| — |
|
| | $ | 3,291,526,267 |
| $ | 286,016,778 |
| — |
|
| Other Financial Instruments | | | |
| Forward Foreign Currency Exchange Contracts | — |
| $ | 296,717 |
| — |
|
| | | | |
| Liabilities | | | |
| Other Financial Instruments | | | |
| Forward Foreign Currency Exchange Contracts | — |
| $ | (614,061 | ) | — |
|
7. Derivative Instruments
Foreign Currency Risk - The fund is subject to foreign currency exchange rate risk in the normal course of pursuing its investment objectives. The value of foreign investments held by a fund may be significantly affected by changes in foreign currency exchange rates. The dollar value of a foreign security generally decreases when the value of the dollar rises against the foreign currency in which the security is denominated and tends to increase when the value of the dollar declines against such foreign currency. A fund may enter into forward foreign currency exchange contracts to reduce a fund's exposure to foreign currency exchange rate fluctuations. The net U.S. dollar value of foreign currency underlying all contractual commitments held by a fund and the resulting unrealized appreciation or depreciation are determined daily. Realized gain or loss is recorded upon the termination of the contract. Net realized and unrealized gains or losses occurring during the holding period of forward foreign currency exchange contracts are a component of net realized gain (loss) on foreign currency transactions and change in net unrealized appreciation (depreciation) on translation of assets and liabilities in foreign currencies, respectively. A fund bears the risk of an unfavorable change in the foreign currency exchange rate underlying the forward contract. Additionally, losses, up to the fair value, may arise if the counterparties do not perform under the contract terms. The foreign currency risk derivative instruments held at period end as disclosed on the Schedule of Investments are indicative of the fund's typical volume during the period.
The value of foreign currency risk derivative instruments as of March 31, 2014, is disclosed on the Statement of Assets and Liabilities as an asset of $296,717 in unrealized appreciation on forward foreign currency exchange contracts and a liability of $614,061 in unrealized depreciation on forward foreign
currency exchange contracts. For the year ended March 31, 2014, the effect of foreign currency risk derivative instruments on the Statement of Operations was $1,037,462 in net realized gain (loss) on foreign currency transactions and $(356,679) in change in net unrealized appreciation (depreciation) on translation of assets and liabilities in foreign currencies.
8. Risk Factors
There are certain risks involved in investing in foreign securities. These risks include those resulting from future adverse political, social and economic developments, fluctuations in currency exchange rates, the possible imposition of exchange controls, and other foreign laws or restrictions.
9. Federal Tax Information
The tax character of distributions paid during the years ended March 31, 2014 and March 31, 2013 were as follows:
|
| | | | | | |
| | 2014 | 2013 |
| Distributions Paid From | | |
| Ordinary income | $ | 47,146,049 |
| $ | 36,737,214 |
|
| Long-term capital gains | — |
| — |
|
The book-basis character of distributions made during the year from net investment income or net realized gains may differ from their ultimate characterization for federal income tax purposes. These differences reflect the differing character of certain income items and net realized gains and losses for financial statement and tax purposes, and may result in reclassification among certain capital accounts on the financial statements.
As of March 31, 2014, the federal tax cost of investments and the components of distributable earnings on a tax-basis were as follows:
|
| | | |
| Federal tax cost of investments | $ | 2,876,457,579 |
|
| Gross tax appreciation of investments | $ | 732,919,590 |
|
| Gross tax depreciation of investments | (31,834,124 | ) |
| Net tax appreciation (depreciation) of investments | $ | 701,085,466 |
|
| Net tax appreciation (depreciation) on derivatives and translation of assets and liabilities in foreign currencies | $ | (2,707 | ) |
| Net tax appreciation (depreciation) | $ | 701,082,759 |
|
| Undistributed ordinary income | $ | 7,635,349 |
|
| Accumulated long-term gains | $ | 19,736,306 |
|
The difference between book-basis and tax-basis unrealized appreciation (depreciation) is attributable primarily to the tax deferral of losses on wash sales.
|
| | | | | | | | | | | |
| For a Share Outstanding Throughout the Years Ended March 31 (except as noted) | | | | | |
| Per-Share Data | | | | | | | Ratios and Supplemental Data |
| | | Income From Investment Operations: | | | | Ratio to Average Net Assets of: | |
| | Net Asset Value, Beginning of Period | Net Investment Income (Loss)(1) | Net
Realized
and
Unrealized
Gain (Loss) | Total From Investment Operations | Distributions From Net Investment Income | Net Asset Value, End of Period | Total Return(2) | Operating Expenses | Net Investment Income (Loss) | Portfolio Turnover Rate | Net Assets, End of Period (in thousands) |
| Investor Class | | | | | | | | | | | |
| 2014 | $7.11 | 0.13 | 1.34 | 1.47 | (0.12) | $8.46 | 20.82% | 0.98% | 1.60% | 49% | $2,406,139 |
| 2013 | $6.23 | 0.10 | 0.89 | 0.99 | (0.11) | $7.11 | 16.08% | 1.00% | 1.65% | 48% | $1,955,536 |
| 2012 | $5.97 | 0.10 | 0.26 | 0.36 | (0.10) | $6.23 | 6.22% | 1.01% | 1.70% | 62% | $1,811,710 |
| 2011 | $5.40 | 0.11 | 0.57 | 0.68 | (0.11) | $5.97 | 12.84% | 1.01% | 2.05% | 76% | $1,668,403 |
| 2010 | $3.80 | 0.09 | 1.60 | 1.69 | (0.09) | $5.40 | 44.84% | 1.00% | 1.97% | 62% | $1,274,063 |
| Institutional Class | | | | | | | | | | |
| 2014 | $7.12 | 0.14 | 1.34 | 1.48 | (0.13) | $8.47 | 21.03% | 0.78% | 1.80% | 49% | $749,868 |
| 2013 | $6.24 | 0.12 | 0.88 | 1.00 | (0.12) | $7.12 | 16.29% | 0.80% | 1.85% | 48% | $172,891 |
| 2012 | $5.98 | 0.11 | 0.26 | 0.37 | (0.11) | $6.24 | 6.42% | 0.81% | 1.90% | 62% | $126,086 |
| 2011 | $5.41 | 0.12 | 0.57 | 0.69 | (0.12) | $5.98 | 13.05% | 0.81% | 2.25% | 76% | $225,950 |
| 2010 | $3.81 | 0.10 | 1.60 | 1.70 | (0.10) | $5.41 | 45.01% | 0.80% | 2.17% | 62% | $214,112 |
| A Class | | | | | | | | | | | |
| 2014 | $7.10 | 0.11 | 1.34 | 1.45 | (0.10) | $8.45 | 20.55% | 1.23% | 1.35% | 49% | $362,439 |
| 2013 | $6.23 | 0.09 | 0.87 | 0.96 | (0.09) | $7.10 | 15.64% | 1.25% | 1.40% | 48% | $295,085 |
| 2012 | $5.97 | 0.08 | 0.27 | 0.35 | (0.09) | $6.23 | 5.95% | 1.26% | 1.45% | 62% | $255,777 |
| 2011 | $5.40 | 0.10 | 0.57 | 0.67 | (0.10) | $5.97 | 12.57% | 1.26% | 1.80% | 76% | $214,896 |
| 2010 | $3.80 | 0.08 | 1.60 | 1.68 | (0.08) | $5.40 | 44.47% | 1.25% | 1.72% | 62% | $119,363 |
|
| | | | | | | | | | | |
| For a Share Outstanding Throughout the Years Ended March 31 (except as noted) | | | | | |
| Per-Share Data | | | | | | | Ratios and Supplemental Data |
| | | Income From Investment Operations: | | | | Ratio to Average Net Assets of: | |
| | Net Asset Value, Beginning of Period | Net Investment Income (Loss)(1) | Net
Realized
and
Unrealized
Gain (Loss) | Total From Investment Operations | Distributions From Net Investment Income | Net Asset Value, End of Period | Total Return(2) | Operating Expenses | Net Investment Income (Loss) | Portfolio Turnover Rate | Net Assets, End of Period (in thousands) |
| B Class | | | | | | | | | | | |
| 2014 | $7.08 | 0.05 | 1.34 | 1.39 | (0.05) | $8.42 | 19.65% | 1.98% | 0.60% | 49% | $884 |
| 2013 | $6.21 | 0.04 | 0.88 | 0.92 | (0.05) | $7.08 | 14.86% | 2.00% | 0.65% | 48% | $1,523 |
| 2012 | $5.96 | 0.04 | 0.26 | 0.30 | (0.05) | $6.21 | 5.14% | 2.01% | 0.70% | 62% | $2,283 |
| 2011 | $5.39 | 0.06 | 0.57 | 0.63 | (0.06) | $5.96 | 11.87% | 2.01% | 1.05% | 76% | $2,916 |
| 2010 | $3.80 | 0.05 | 1.59 | 1.64 | (0.05) | $5.39 | 43.21% | 2.00% | 0.97% | 62% | $3,182 |
| C Class | | | | | | | | | | | |
| 2014 | $7.03 | 0.05 | 1.33 | 1.38 | (0.05) | $8.36 | 19.64% | 1.98% | 0.60% | 49% | $25,869 |
| 2013 | $6.16 | 0.04 | 0.88 | 0.92 | (0.05) | $7.03 | 14.98% | 2.00% | 0.65% | 48% | $16,761 |
| 2012 | $5.92 | 0.04 | 0.25 | 0.29 | (0.05) | $6.16 | 5.01% | 2.01% | 0.70% | 62% | $11,194 |
| 2011 | $5.35 | 0.06 | 0.57 | 0.63 | (0.06) | $5.92 | 11.96% | 2.01% | 1.05% | 76% | $7,659 |
| 2010 | $3.77 | 0.05 | 1.58 | 1.63 | (0.05) | $5.35 | 43.29% | 2.00% | 0.97% | 62% | $7,294 |
| R Class | | | | | | | | | | | |
| 2014 | $7.10 | 0.09 | 1.35 | 1.44 | (0.08) | $8.46 | 20.39% | 1.48% | 1.10% | 49% | $37,076 |
| 2013 | $6.23 | 0.07 | 0.88 | 0.95 | (0.08) | $7.10 | 15.35% | 1.50% | 1.15% | 48% | $30,293 |
| 2012 | $5.97 | 0.07 | 0.26 | 0.33 | (0.07) | $6.23 | 5.72% | 1.51% | 1.20% | 62% | $21,241 |
| 2011 | $5.40 | 0.07 | 0.58 | 0.65 | (0.08) | $5.97 | 12.29% | 1.51% | 1.55% | 76% | $17,470 |
| 2010 | $3.80 | 0.07 | 1.60 | 1.67 | (0.07) | $5.40 | 44.10% | 1.50% | 1.47% | 62% | $4,527 |
|
| | | | | | | | | | | |
| For a Share Outstanding Throughout the Years Ended March 31 (except as noted) | | | | | |
| Per-Share Data | | | | | | | Ratios and Supplemental Data |
| | | Income From Investment Operations: | | | | Ratio to Average Net Assets of: | |
| | Net Asset Value, Beginning of Period | Net Investment Income (Loss)(1) | Net
Realized
and
Unrealized
Gain (Loss) | Total From Investment Operations | Distributions From Net Investment Income | Net Asset Value, End of Period | Total Return(2) | Operating Expenses | Net Investment Income (Loss) | Portfolio Turnover Rate | Net Assets, End of Period (in thousands) |
| R6 Class | | | | | | | | | | | |
2014(3) | $7.77 | 0.14 | 0.66 | 0.80 | (0.10) | $8.47 | 10.41% | 0.62%(4) | 2.58%(4) | 49%(5) | $3,140 |
|
| | | | |
| Notes to Financial Highlights | | |
| |
| (1) | Computed using average shares outstanding throughout the period. |
| |
| (2) | Total returns are calculated based on the net asset value of the last business day and do not reflect applicable sales charges, if any. Total returns for periods less than one year are not annualized. |
| |
| (3) | July 26, 2013 (commencement of sale) through March 31, 2014. |
| |
| (5) | Portfolio turnover is calculated at the fund level. Percentage indicated was calculated for the year ended March 31, 2014. |
See Notes to Financial Statements.
|
|
| Report of Independent Registered Public Accounting Firm |
To the Board of Directors and Shareholders of
American Century Capital Portfolios, Inc.:
We have audited the accompanying statement of assets and liabilities, including the schedule of investments, of Value Fund (the “Fund”), one of the funds constituting American Century Capital Portfolios, Inc., as of March 31, 2014, and the related statement of operations for the year then ended, the statements of changes in net assets for each of the two years in the period then ended, and the financial highlights for each of the periods presented. These financial statements and financial highlights are the responsibility of the Fund's management. Our responsibility is to express an opinion on these financial statements and financial highlights based on our audits.
We conducted our audits in accordance with the standards of the Public Company Accounting Oversight Board (United States). Those standards require that we plan and perform the audit to obtain reasonable assurance about whether the financial statements and financial highlights are free of material misstatement. The Fund is not required to have, nor were we engaged to perform, an audit of its internal control over financial reporting. Our audits included consideration of internal control over financial reporting as a basis for designing audit procedures that are appropriate in the circumstances, but not for the purpose of expressing an opinion on the effectiveness of the Fund's internal control over financial reporting. Accordingly, we express no such opinion. An audit also includes examining, on a test basis, evidence supporting the amounts and disclosures in the financial statements, assessing the accounting principles used and significant estimates made by management, as well as evaluating the overall financial statement presentation. Our procedures included confirmation of securities owned as of March 31, 2014, by correspondence with the custodian and brokers; where replies were not received from brokers, we performed other auditing procedures. We believe that our audits provide a reasonable basis for our opinion.
In our opinion, the financial statements and financial highlights referred to above present fairly, in all material respects, the financial position of Value Fund of American Century Capital Portfolios, Inc. as of March 31, 2014, the results of its operations for the year then ended, the changes in its net assets for each of the two years in the period then ended, and the financial highlights for each of the periods presented, in conformity with accounting principles generally accepted in the United States of America.
Deloitte & Touche LLP
Kansas City, Missouri
May 16, 2014
The Board of Directors
The individuals listed below serve as directors of the funds. Each director will continue to serve in this capacity until death, retirement, resignation or removal from office. The board has adopted a mandatory retirement age for directors who are not “interested persons,” as that term is defined in the Investment Company Act (independent directors). Independent directors shall retire by December 31 of the year in which they reach their 75th birthday.
Mr. Thomas is an “interested person” because he currently serves as President and Chief Executive Officer of American Century Companies, Inc. (ACC), the parent company of American Century Investment Management, Inc. (ACIM or the advisor). Mr. Fink is treated as an “interested person” because of his recent employment with ACC and American Century Services, LLC (ACS). The other directors (more than three-fourths of the total number) are independent. They are not employees, directors or officers of, and have no financial interest in, ACC or any of its wholly owned, direct or indirect, subsidiaries, including ACIM, American Century Investment Services, Inc. (ACIS) and ACS, and do not have any other affiliations, positions, or relationships that would cause them to be considered “interested persons” under the Investment Company Act. The directors serve in this capacity for seven (in the case of Mr. Thomas, 15) registered investment companies in the American Century Investments family of funds.
The following table presents additional information about the directors. The mailing address for each director is 4500 Main Street, Kansas City, Missouri 64111.
|
| | | | | |
Name (Year of Birth) | Position(s) Held with Funds | Length of Time Served | Principal Occupation(s) During Past 5 Years | Number of American Century Portfolios Overseen by Director | Other Directorships Held During Past
5 Years |
| Independent Directors |
Thomas A. Brown
(1940) | Director | Since 1980 | Managing Member, Associated Investments, LLC (real estate investment company); Brown Cascade Properties, LLC (real estate investment company) (2001 to 2009) | 73 | None |
Andrea C. Hall
(1945) | Director | Since 1997 | Retired | 73 | None |
Jan M. Lewis
(1957) | Director | Since 2011 | Retired; President and Chief Executive Officer, Catholic Charities of Northeast Kansas (human services organization) (2006 to 2013) | 73 | None |
James A. Olson
(1942) | Director and Chairman of the Board | Since 2007 (Chairman since 2014) | Member, Plaza Belmont LLC (private equity fund manager) | 73 | Saia, Inc. (2002 to 2012) and EPR Properties (2003 to 2013) |
|
| | | | | |
Name (Year of Birth) | Position(s) Held with Funds | Length of Time Served | Principal Occupation(s) During Past 5 Years | Number of American Century Portfolios Overseen by Director | Other Directorships Held During Past
5 Years |
| Independent Directors |
M. Jeannine Strandjord
(1945) | Director | Since 1994 | Retired | 73 | Euronet Worldwide Inc.; Charming Shoppes, Inc. (2006 to 2010); and DST Systems Inc. (1996 to 2012) |
John R. Whitten
(1946) | Director | Since 2008 | Retired | 73 | Rudolph Technologies, Inc. |
Stephen E. Yates
(1948) | Director | Since 2012 | Retired; Executive Vice President, Technology & Operations, KeyCorp. (computer services) (2004 to 2010) | 73 | Applied Industrial Technologies, Inc. (2001 to 2010) |
| Interested Directors | | | | |
Barry Fink
(1955) | Director | Since 2012 | Retired; Executive Vice President, ACC (September 2007 to February 2013); President, ACS (October 2007 to February 2013); Chief Operating Officer, ACC (September 2007 to November 2012) | 73 | None |
Jonathan S. Thomas
(1963) | Director and President | Since 2007 | President and Chief Executive Officer, ACC (March 2007 to present). Also serves as Chief Executive Officer and Manager, ACS; Executive Vice President, ACIM; Director, ACC, ACIM and other ACC subsidiaries | 115 | None |
Officers
The following table presents certain information about the executive officers of the funds. Each officer serves as an officer for each of the 15 investment companies in the American Century family of funds, unless otherwise noted. No officer is compensated for his or her service as an officer of the funds. The listed officers are interested persons of the funds and are appointed or re-appointed on an annual basis. The mailing address for each officer listed below is 4500 Main Street, Kansas City, Missouri 64111.
|
| | |
Name (Year of Birth) | Offices with
the Funds | Principal Occupation(s) During the Past Five Years |
Jonathan S.
Thomas
(1963) | Director and
President
since 2007 | President and Chief Executive Officer, ACC (March 2007 to present). Also serves as Chief Executive Officer and Manager, ACS; Executive Vice President, ACIM; Director, ACC, ACIM and other ACC subsidiaries |
Amy D. Shelton
(1964) | Chief Compliance
Officer since 2014 | Chief Compliance Officer, American Century funds, (March 2014 to present); Chief Compliance Officer, ACIM (February 2014 to present); Chief Compliance Officer, ACIS (October 2009 to present); Vice President, Client Interactions and Marketing, ACIS (February 2013 to January 2014); Director, Client Interactions and Marketing, ACIS (June 2007 to January 2013). Also serves as Vice President, ACIS |
Charles A.
Etherington
(1957) | General Counsel
since 2007 and
Senior Vice
President since 2006 | Attorney, ACC (February 1994 to present); Vice President, ACC (November 2005 to present); General Counsel, ACC (March 2007 to present). Also serves as General Counsel, ACIM, ACS, ACIS and other ACC subsidiaries; and Senior Vice President, ACIM and ACS |
C. Jean Wade
(1964) | Vice President,
Treasurer and
Chief Financial
Officer since 2012 | Vice President, ACS (February 2000 to present) |
Robert J.
Leach
(1966) | Vice President
since 2006 and
Assistant Treasurer
since 2012 | Vice President, ACS (February 2000 to present) |
David H.
Reinmiller
(1963) | Vice President
since 2000 | Attorney, ACC (January 1994 to present); Associate General Counsel, ACC (January 2001 to present). Also serves as Vice President, ACIM and ACS |
Ward D.
Stauffer
(1960) | Secretary
since 2005 | Attorney, ACC (June 2003 to present) |
The Statement of Additional Information has additional information about the fund's directors and is available without charge, upon request, by calling 1-800-345-2021.
Retirement Account Information
As required by law, distributions you receive from certain IRAs are subject to federal income tax withholding, unless you elect not to have withholding apply. Tax will be withheld on the total amount withdrawn even though you may be receiving amounts that are not subject to withholding, such as nondeductible contributions. In such case, excess amounts of withholding could occur. You may adjust your withholding election so that a greater or lesser amount will be withheld.
If you don’t want us to withhold on this amount, you must notify us to not withhold the federal income tax. You may notify us in writing or in certain situations by telephone or through other electronic means. For systematic withdrawals, your withholding election will remain in effect until revoked or changed by filing a new election. You have the right to revoke your election at any time.
Remember, even if you elect not to have income tax withheld, you are liable for paying income tax on the taxable portion of your withdrawal. If you elect not to have income tax withheld or you don’t have enough income tax withheld, you may be responsible for payment of estimated tax. You may incur penalties under the estimated tax rules if your withholding and estimated tax payments are not sufficient. You can reduce or defer the income tax on a distribution by directly or indirectly rolling such distribution over to another IRA or eligible plan. You should consult your tax advisor for additional information.
State tax will be withheld if, at the time of your distribution, your address is within one of the mandatory withholding states and you have federal income tax withheld (or as otherwise required by state law). State taxes will be withheld from your distribution in accordance with the respective state rules.
Distributions you receive from 403(b), 457 and qualified plans are subject to special tax and withholding rules. Your plan administrator or plan sponsor is required to provide you with a special tax notice explaining those rules at the time you request a distribution. If applicable, federal and/or state taxes may be withheld from your distribution amount.
Proxy Voting Policies
A description of the policies that the fund's investment advisor uses in exercising the voting rights associated with the securities purchased and/or held by the fund is available without charge, upon request, by calling 1-800-345-2021. It is also available on the "About Us" page of American Century Investments’ website at americancentury.com and on the Securities and Exchange Commission’s website at sec.gov. Information regarding how the investment advisor voted proxies relating to portfolio securities during the most recent 12-month period ended June 30 is available on the "About Us" page at americancentury.com. It is also available at sec.gov.
Quarterly Portfolio Disclosure
The fund files its complete schedule of portfolio holdings with the Securities and Exchange Commission (SEC) for the first and third quarters of each fiscal year on Form N-Q. The fund’s Forms N-Q are available on the SEC’s website at sec.gov, and may be reviewed and copied at the SEC’s Public Reference Room in Washington, DC. Information on the operation of the Public Reference Room may be obtained by calling 1-800-SEC-0330. The fund also makes its complete schedule of portfolio holdings for the most recent quarter of its fiscal year available on its
website at americancentury.com and, upon request, by calling 1-800-345-2021.
Other Tax Information
The following information is provided pursuant to provisions of the Internal Revenue Code.
The fund hereby designates up to the maximum amount allowable as qualified dividend income for the fiscal year ended March 31, 2014.
For corporate taxpayers, the fund hereby designates $47,146,049, or up to the maximum amount allowable, of ordinary income distributions paid during the fiscal year ended March 31, 2014 as qualified for the corporate dividends received deduction.
|
| | |
| |
| | | |
| Contact Us | americancentury.com | |
| Automated Information Line | 1-800-345-8765 | |
| Investor Services Representative | 1-800-345-2021 or 816-531-5575 | |
| Investors Using Advisors | 1-800-378-9878 | |
| Business, Not-For-Profit, Employer-Sponsored Retirement Plans | 1-800-345-3533 | |
| Banks and Trust Companies, Broker-Dealers, Financial Professionals, Insurance Companies | 1-800-345-6488 | |
| Telecommunications Relay Service for the Deaf | 711 | |
| | | |
| American Century Capital Portfolios, Inc. | |
| | | |
Investment Advisor: American Century Investment Management, Inc. Kansas City, Missouri | |
| | | |
| This report and the statements it contains are submitted for the general information of our shareholders. The report is not authorized for distribution to prospective investors unless preceded or accompanied by an effective prospectus. | |
| | | |
©2014 American Century Proprietary Holdings, Inc. All rights reserved.
CL-ANN-82097 1405
| |
ITEM 2. CODE OF ETHICS.
| |
| (a) | The registrant has adopted a Code of Ethics for Senior Financial Officers that applies to the registrant’s principal executive officer, principal financial officer, principal accounting officer, and persons performing similar functions. |
| |
| (f) | The registrant’s Code of Ethics for Senior Financial Officers was filed as Exhibit 12 (a)(1) to American Century Asset Allocation Portfolios, Inc.’s Annual Certified Shareholder Report on Form N-CSR, File No. 811-21591, on September 29, 2005, and is incorporated herein by reference. |
ITEM 3. AUDIT COMMITTEE FINANCIAL EXPERT.
| |
| (a)(1) | The registrant’s board has determined that the registrant has at least one audit committee financial expert serving on its audit committee. |
| |
| (a)(2) | M. Jeannine Strandjord and Stephen E. Yates are the registrant’s designated audit committee financial experts. They are “independent” as defined in Item 3 of Form N-CSR. |
ITEM 4. PRINCIPAL ACCOUNTANT FEES AND SERVICES.
The aggregate fees billed for each of the last two fiscal years for professional services rendered by the principal accountant for the audit of the registrant’s annual financial statements or services that are normally provided by the accountant in connection with statutory and regulatory filings or engagements for those fiscal years were as follows:
FY 2013: $195,560
FY 2014: $163,400
The aggregate fees billed in each of the last two fiscal years for assurance and related services by the principal accountant that are reasonably related to the performance of the audit of the registrant’s financial statements and are not reported under paragraph (a) of this Item were as follows:
For services rendered to the registrant:
FY 2013:$0
FY 2014:$0
Fees required to be approved pursuant to paragraph (c)(7)(ii) of Rule 2-01 of Regulation S-X (relating to certain engagements for non-audit services with the registrant’s investment adviser and its affiliates):
FY 2013:$0
FY 2014:$0
The aggregate fees billed in each of the last two fiscal years for professional services rendered by the principal accountant for tax compliance, tax advice, and tax planning were as follows:
For services rendered to the registrant:
FY 2013: $0
FY 2014: $0
Fees required to be approved pursuant to paragraph (c)(7)(ii) of Rule 2-01 of Regulation S-X (relating to certain engagements for non-audit services with the registrant’s investment adviser and its affiliates):
FY 2013: $0
FY 2014: $0
The aggregate fees billed in each of the last two fiscal years for products and services provided by the principal accountant, other than the services reported in paragraphs (a) through (c) of this Item were as follows:
For services rendered to the registrant:
FY 2013: $0
FY 2014: $0
Fees required to be approved pursuant to paragraph (c)(7)(ii) of Rule 2-01 of Regulation S-X (relating to certain engagements for non-audit services with the registrant’s investment adviser and its affiliates):
FY 2013: $0
FY 2014: $0
| |
| (e)(1) | In accordance with paragraph (c)(7)(i)(A) of Rule 2-01 of Regulation S-X, before the accountant is engaged by the registrant to render audit or non-audit services, the engagement is approved by the registrant’s audit committee. Pursuant to paragraph (c)(7)(ii) of Rule 2-01 of Regulation S-X, the registrant’s audit committee also pre-approves its accountant’s engagements for non-audit services with the registrant’s investment adviser, its parent company, and any entity controlled by, or under common control with the investment adviser that provides ongoing services to the registrant, if the engagement relates directly to the operations and financial reporting of the registrant. |
| |
| (e)(2) | All services described in each of paragraphs (b) through (d) of this Item were pre-approved before the engagement by the registrant’s audit committee pursuant to paragraph (c)(7)(i)(A) of Rule 2-01 of Regulation S-X. Consequently, none of such services were required to be approved by the audit committee pursuant to paragraph (c)(7)(i)(C). |
| |
| (f) | The percentage of hours expended on the principal accountant’s engagement to audit the registrant’s financial statements for the most recent fiscal year that were attributed to work performed by persons other than the principal accountant’s full-time, permanent employees was less than 50%. |
| |
| (g) | The aggregate non-audit fees billed by the registrant’s accountant for services rendered to the registrant, and rendered to the registrant’s investment adviser (not including any sub-adviser whose role is primarily portfolio management and is subcontracted with or overseen by another investment adviser), and any entity controlling, controlled by, or under common control with the adviser that provides ongoing services to the registrant for each of the last two fiscal years of the registrant were as follows: |
FY 2013: $135,439
FY 2014: $ 15,000
| |
| (h) | The registrant’s investment adviser and accountant have notified the registrant’s audit committee of all non-audit services that were rendered by the registrant’s accountant to the registrant’s investment adviser, its parent company, and any entity controlled by, or under common control with the investment adviser that provides services to the registrant, which services were not required to be pre-approved pursuant to paragraph (c)(7)(ii) of Rule 2-01 of Regulation S-X. The notification provided to the registrant’s audit committee included sufficient details regarding such services to allow the registrant’s audit committee to consider the continuing independence of its principal accountant. |
ITEM 5. AUDIT COMMITTEE OF LISTED REGISTRANTS.
Not applicable.
ITEM 6. INVESTMENTS.
| |
| (a) | The schedule of investments is included as part of the report to stockholders filed under Item 1 of this Form. |
ITEM 7. DISCLOSURE OF PROXY VOTING POLICIES AND PROCEDURES FOR CLOSED-END MANAGEMENT INVESTMENT COMPANIES.
Not applicable.
ITEM 8. PORTFOLIO MANAGERS OF CLOSED-END MANAGEMENT INVESTMENT COMPANIES.
Not applicable.
ITEM 9. PURCHASES OF EQUITY SECURITIES BY CLOSED-END MANAGEMENT INVESTMENT COMPANY AND AFFILIATED PURCHASERS.
Not applicable.
ITEM 10. SUBMISSION OF MATTERS TO A VOTE OF SECURITY HOLDERS.
During the reporting period, there were no material changes to the procedures by which shareholders may recommend nominees to the registrant’s board.
ITEM 11. CONTROLS AND PROCEDURES.
| |
| (a) | The registrant's principal executive officer and principal financial officer have concluded that the registrant's disclosure controls and procedures (as defined in Rule 30a-3(c) under the Investment Company Act of 1940) are effective based on their evaluation of these controls and procedures as of a date within 90 days of the filing date of this report. |
| |
| (b) | There were no changes in the registrant's internal control over financial reporting (as defined in Rule 30a-3(d) under the Investment Company Act of 1940) that occurred during the registrant's second fiscal quarter of the period covered by this report that have materially affected, or are reasonably likely to materially affect, the registrant's internal control over financial reporting. |
ITEM 12. EXHIBITS.
| |
| (a)(1) | Registrant’s Code of Ethics for Senior Financial Officers, which is the subject of the disclosure required by Item 2 of Form N-CSR, was filed as Exhibit 12(a)(1) to American Century Asset Allocation Portfolios, Inc.’s Certified Shareholder Report on Form N-CSR, File No. 811-21591, on September 29, 2005. |
| |
| (a)(2) | Separate certifications by the registrant’s principal executive officer and principal financial officer, pursuant to Section 302 of the Sarbanes-Oxley Act of 2002 and Rule 30a-2(a) under the Investment Company Act of 1940, are filed and attached hereto as EX-99.CERT. |
| |
| (b) | A certification by the registrant’s chief executive officer and chief financial officer, pursuant to Section 906 of the Sarbanes-Oxley Act of 2002, is furnished and attached hereto as EX-99.906CERT. |
SIGNATURES
Pursuant to the requirements of the Securities Exchange Act of 1934 and the Investment Company Act of 1940, the registrant has duly caused this report to be signed on its behalf by the undersigned, thereunto duly authorized.
|
| | | |
| Registrant: | American Century Capital Portfolios, Inc. |
| | | |
| By: | /s/ Jonathan S. Thomas |
| | Name: | Jonathan S. Thomas |
| | Title: | President |
| | | |
| Date: | 5/30/2014 |
Pursuant to the requirements of the Securities Exchange Act of 1934 and the Investment Company Act of 1940, this report has been signed below by the following persons on behalf of the registrant and in the capacities and on the dates indicated.
|
| | |
| By: | /s/ Jonathan S. Thomas |
| | Name: | Jonathan S. Thomas |
| | Title: | President |
| | | (principal executive officer) |
| | | |
| Date: | 5/30/2014 |
|
| | |
| By: | /s/ C. Jean Wade |
| | Name: | C. Jean Wade |
| | Title: | Vice President, Treasurer, and |
| | | Chief Financial Officer |
| | | (principal financial officer) |
| | | |
| Date: | 5/30/2014 |