UNITED STATES
SECURITIES AND EXCHANGE COMMISSION
Washington, D.C. 20549
FORM N-CSR
CERTIFIED SHAREHOLDER REPORT OF REGISTERED
MANAGEMENT INVESTMENT COMPANIES
Investment Company Act file number | 811-07820 |
| | |
| | |
| | |
AMERICAN CENTURY CAPITAL PORTFOLIOS, INC. |
(Exact name of registrant as specified in charter) |
| | |
| | |
| | |
4500 MAIN STREET, KANSAS CITY, MISSOURI | 64111 |
(Address of principal executive offices) | (Zip Code) |
| | |
| | |
| | |
CHARLES A. ETHERINGTON 4500 MAIN STREET, KANSAS CITY, MISSOURI 64111 |
(Name and address of agent for service) |
| | |
| | |
Registrant’s telephone number, including area code: | 816-531-5575 |
| | |
| | |
Date of fiscal year end: | 10-31 |
| | |
| | |
Date of reporting period: | 10-31-2013 |
ITEM 1. REPORTS TO STOCKHOLDERS.
ANNUAL REPORT | OCTOBER 31, 2013


Global Real Estate Fund
President’s Letter | 2 |
Independent Chairman’s Letter | 3 |
Market Perspective | 4 |
Performance | 5 |
Portfolio Commentary | 7 |
Fund Characteristics | 9 |
Shareholder Fee Example | 10 |
Schedule of Investments | 12 |
Statement of Assets and Liabilities | 14 |
Statement of Operations | 15 |
Statement of Changes in Net Assets | 16 |
Notes to Financial Statements | 17 |
Financial Highlights | 23 |
Report of Independent Registered Public Accounting Firm | 25 |
Management | 26 |
Approval of Management Agreement | 29 |
Additional Information | 34 |
Any opinions expressed in this report reflect those of the author as of the date of the report, and do not necessarily represent the opinions of American Century Investments® or any other person in the American Century Investments organization. Any such opinions are subject to change at any time based upon market or other conditions and American Century Investments disclaims any responsibility to update such opinions. These opinions may not be relied upon as investment advice and, because investment decisions made by American Century Investments funds are based on numerous factors, may not be relied upon as an indication of trading intent on behalf of any American Century Investments fund. Security examples are used for representational purposes only and are not intended as recommendations to purchase or sell securities. Performance information for comparative indices and securities is provided to American Century Investments by third party vendors. To the best of American Century Investments’ knowledge, such information is accurate at the time of printing.

Jonathan Thomas
Dear Investor:
Thank you for reviewing this annual report for the 12 months ended October 31, 2013. It provides investment performance, market analysis, and portfolio information, presented with the expert perspective of our portfolio management team.
Annual reports remain important vehicles for conveying information about fund returns, including key factors that affected fund performance. For additional, updated investment and market insights, we encourage you to visit our website, americancentury.com.
Federal Reserve (Fed) Policy-Driven Financial Markets
U.S. stock indices and government bond yields traced similar upward tracks during most of the reporting period, driven by Fed policy and the perceived path of future Fed policy decisions. In September 2012, the Fed announced its third round of quantitative easing (QE3) since the 2008 Financial Crisis, consisting of $85 billion of monthly purchases of U.S. Treasury and mortgage-backed securities. We believe QE3, like its predecessors, helped stimulate the U.S. stock market. Encouraging signs also emerged in the long-depressed U.S. housing and job markets, which supported stocks. The S&P 500 Index advanced 27.18%, a modest gain compared with U.S. mid- and small-cap indices, which posted returns in the 33% to 40% range.
The U.S. stock rally surmounted many obstacles, including the year-end 2012 fiscal cliff, the 2013 fiscal sequester, Congressional discord (over the Affordable Care Act, the federal budget, and the federal debt ceiling), the resulting partial government shutdown, and higher long-term interest rates. Indications of sustainable economic growth and hints from the Fed that it might taper QE3 sent bond yields soaring from May to September. The 10-year Treasury yield reached 3.00% before retreating to finish the reporting period at 2.55%, still well above where it began (at 1.69%). Bond yields declined in September and October on softer economic data, the Fed’s announcement that it would delay tapering, and uncertainty caused by the government shutdown.
A full economic recovery from 2008 remains elusive—economic growth is still subpar compared with past recoveries. In this environment, we continue to believe in a disciplined, diversified, long-term investment approach, using professionally managed stock and bond portfolios—as appropriate—for meeting financial goals. We appreciate your continued trust in us under these challenging conditions.
Sincerely,

Jonathan Thomas
President and Chief Executive Officer
American Century Investments
Independent Chairman’s Letter |

Don Pratt
Dear Fellow Shareholders,
This is my last letter to shareholders as the funds’ Chairman, as I will retire at the end of 2013.
My personal thanks go to the independent directors that elected me to the Board and subsequently to the Chairman position, and with whom I have worked to reorganize the Board’s committee structure and annually improve our governance processes. Throughout my tenure, the Board has addressed its responsibilities to shareholders diligently in committee work, the annual contract review, and the execution of our oversight responsibilities. I expect that it will continue to do so well into the future.
Thanks also to the American Century Investments management team led by Jonathan Thomas. Its transparency, candor, and open communication with the Board is most appreciated. I have served on more than 20 boards and this is the most productive and enjoyable relationship with management I have experienced.
Finally, thanks to the many shareholders who have written with questions, comments, and suggestions. Each was heard and addressed and enabled the Board to better represent your interests. Keep communicating with us so that the Board can continue to be aware of your interests, concerns, and questions. My best wishes to Jim Olson, my successor as Chairman, and the other independent directors who continue to serve on your behalf.
And remember, as the firm’s founder Jim Stowers, Jr. so often observed, “The best is yet to be.”
Best regards,

Don Pratt

By Phil Davidson, Chief Investment Officer, U.S. Value Equity
Global Stocks Rallied to Post Double-Digit Gains
Stock market performance remained robust during the 12-month period ended October 31, 2013, with most major market indices posting double-digit gains. Despite persistent concerns about weak global growth and a slowdown in China, investors largely focused on central bank stimulus measures, marginally improving U.S. and European economic data, and relatively healthy corporate earnings, which fueled stock market optimism.
Prior to the reporting period, the U.S. Federal Reserve (the Fed) announced its third quantitative easing program (QE3). This effort, combined with similar large-scale stimulus measures from the European Central Bank and the Bank of Japan and favorable corporate earnings reports, generally helped keep stocks in favor. Additionally, housing market gains in the U.S., U.K., and Australia and an improving economic backdrop in Japan aided global real estate investments.
Overall, developed market stocks outperformed their emerging market counterparts. We believe this primarily was due to slower growth in China. In addition, rising inflation and currency weakness weighed on many developing nations.
Fed Policy Challenging for Real Estate Stocks
Although most major stock market sectors advanced during the 12-month period, interest-rate-sensitive segments, including real estate investment trusts (REITs), generally underperformed the broad market averages. This primarily stemmed from uncertainty surrounding future Fed policy, which dominated the market backdrop in the second half of the period.
Beginning in spring 2013, modest economic gains led to fears the Fed would end QE3 sooner than expected. The Fed helped fuel those fears, indicating it may start tapering its monthly bond purchases later in the year. In response, global interest rates increased as investors expected the Fed to begin tapering after its September policy meeting. But Fed policymakers changed course, announcing they would continue the current pace of bond buying until economic gains appear sustainable.
This news sparked a turnaround among global REITs and other interest-rate-sensitive stocks, but the late-period gains weren’t sufficient to offset previous underperformance. In addition, the preference for riskier assets generally prevailed throughout the period, which put further pressure on higher-quality, yield-generating securities.
Global Equity Total Returns |
For the 12 months ended October 31, 2013 (in U.S. dollars) |
MSCI World Index | 25.77% | | MSCI Europe Index | 27.70% |
MSCI U.S. Broad Market (Gross) Index | 28.98% | | MSCI Pacific ex-Japan Index | 14.49% |
MSCI Japan Index | 34.00% | | MSCI Emerging Markets Index | 6.53% |
Total Returns as of October 31, 2013 |
| | | | Average
Annual Returns | |
| | Ticker Symbol | 1 year | Since Inception | Inception Date |
Investor Class | ARYVX | 11.99% | 8.64% | 4/29/11 |
MSCI All Country World
IMI Real Estate Index | — | 11.43% | 6.74% | — |
FTSE EPRA/NAREIT Global Index(1) | — | 11.52% | 6.32% | — |
MSCI All Country World Index | — | 23.29% | 6.76% | — |
Institutional Class | ARYNX | 12.30% | 8.89% | 4/29/11 |
A Class No sales charge* With sales charge* | ARYMX | 11.72% 5.34% | 8.38% 5.86% | 4/29/11 |
C Class | ARYTX | 10.94% | 7.59% | 4/29/11 |
R Class | ARYWX | 11.55% | 8.13% | 4/29/11 |
R6 Class | ARYDX | — | 3.49%(2) | 7/26/13 |
*Sales charges include initial sales charges and contingent deferred sales charges (CDSCs), as applicable. A Class shares have a 5.75% maximum initial sales charge and may be subject to a maximum CDSC of 1.00%. C Class shares redeemed within 12 months of purchase are subject to a maximum CDSC of 1.00%. The SEC requires that mutual funds provide performance information net of maximum sales charges in all cases where charges could be applied.
(1) | Effective January 2014, the fund’s benchmark will change from the MSCI All Country World IMI Real Estate Index to the FTSE EPRA/NAREIT Global Index. The fund’s investment advisor believes that the FTSE EPRA/NAREIT Global Index aligns better with the fund’s strategy. The fund’s investment process will not change. |
(2) | Total returns for periods less than one year are not annualized. |
Data presented reflect past performance. Past performance is no guarantee of future results. Current performance may be higher or lower than the performance shown. Investment return and principal value will fluctuate, and redemption value may be more or less than original cost. To obtain performance data current to the most recent month end, please call 1-800-345-2021 or visit americancentury.com. The fund may be subject to certain risks similar to those associated with direct investment in real estate. International investing involves special risks, such as political instability and currency fluctuations. Investing in emerging markets may accentuate these risks. The fund’s investment process may result in high portfolio turnover, which could mean high transaction costs, affecting both performance and capital gains tax liabilities to investors.
Unless otherwise indicated, performance reflects Investor Class shares; performance for other share classes will vary due to differences in fee structure. For information about other share classes available, please consult the prospectus. Data assumes reinvestment of dividends and capital gains, and none of the charts reflect the deduction of taxes that a shareholder would pay on fund distributions or the redemption of fund shares. Returns for the indices are provided for comparison. The fund’s total returns include operating expenses (such as transaction costs and management fees) that reduce returns, while the total returns of the indices do not.
Growth of $10,000 Over Life of Class |
$10,000 investment made April 29, 2011 |
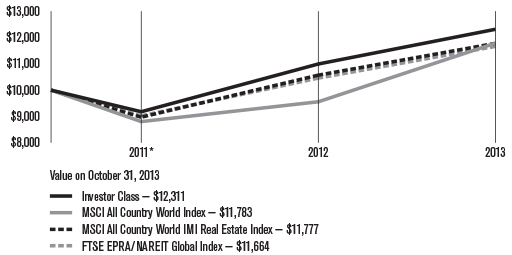
*From 4/29/11, the Investor Class’s inception date. Not annualized.
Total Annual Fund Operating Expenses |
Investor
Class | Institutional Class | A Class | C Class | R Class | R6 Class |
1.21% | 1.01% | 1.46% | 2.21% | 1.71% | 0.86% |
The total annual fund operating expenses shown is as stated in the fund’s prospectus current as of the date of this report. The prospectus may vary from the expense ratio shown elsewhere in this report because it is based on a different time period, includes acquired fund fees and expenses, and, if applicable, does not include fee waivers or expense reimbursements.
Data presented reflect past performance. Past performance is no guarantee of future results. Current performance may be higher or lower than the performance shown. Investment return and principal value will fluctuate, and redemption value may be more or less than original cost. To obtain performance data current to the most recent month end, please call 1-800-345-2021 or visit americancentury.com. The fund may be subject to certain risks similar to those associated with direct investment in real estate. International investing involves special risks, such as political instability and currency fluctuations. Investing in emerging markets may accentuate these risks. The fund’s investment process may result in high portfolio turnover, which could mean high transaction costs, affecting both performance and capital gains tax liabilities to investors.
Unless otherwise indicated, performance reflects Investor Class shares; performance for other share classes will vary due to differences in fee structure. For information about other share classes available, please consult the prospectus. Data assumes reinvestment of dividends and capital gains, and none of the charts reflect the deduction of taxes that a shareholder would pay on fund distributions or the redemption of fund shares. Returns for the indices are provided for comparison. The fund’s total returns include operating expenses (such as transaction costs and management fees) that reduce returns, while the total returns of the indices do not.
Portfolio Managers: Steven Brown and Steven Rodriguez
Performance Summary
Global Real Estate returned 11.99%* for the fiscal year ended October 31, 2013. By comparison, the MSCI All Country World IMI Real Estate Index (the fund’s benchmark) returned 11.43%, while the MSCI All Country World Index (a broad global stock market measure) returned 23.29%. (See pages 5 and 6 for additional performance comparisons.)
Global Real Estate Market Overview
Global property stocks generated double-digit gains for the reporting period but trailed the performance of the broad global equity markets (see page 4 for more details). Real estate stocks rallied sharply during the first half of the period thanks to better economic conditions in the U.S., continued strength in emerging Asian and Latin American economies, and more economic stimulus from the world’s central banks. The latter included expanded quantitative easing measures by the Federal Reserve (Fed) in late 2012.
In May 2013, however, the Fed announced that it planned to taper its quantitative easing activity before year-end, which pushed bond yields higher around the globe and sparked a sell-off in income-oriented investments, including global real estate stocks. Global property stocks ended the period on a positive note, rebounding over the last six weeks after the Fed decided to delay its tapering plans.
From a regional perspective, Japanese property stocks were among the best performers, benefiting from a rapid increase in condominium sales and the selection of Tokyo to host the Summer Olympic Games in 2020. Property markets in Europe also fared well as the economic environment gradually stabilized. In particular, the housing market in the U.K. showed meaningful signs of recovery, providing a lift to the country’s property stocks. On the downside, real estate stocks in emerging markets underperformed amid slowing economic growth, depreciating currencies, and higher interest rates as central banks attempted to counter rising inflation and currency weakness.
Stock Selection in U.S. and Hong Kong Added Value
The fund’s outperformance of its benchmark for the 12-month period resulted primarily from stock selection, particularly in the U.S. and Hong Kong. An overweight position in U.K. property stocks also contributed positively to results versus the benchmark.
The leading individual performance contributors in the portfolio included two initial public offerings in early 2013—U.K. residential brokerage firm Countrywide and Japanese industrial real estate company Nippon Prologis. Countrywide benefited from signs of strength in the U.K. housing market as a government lend-to-buy program helped home sales volumes and prices accelerate. Nippon Prologis, a spin-off of the Japanese operations of U.S. industrial real estate company Prologis, benefited from strong occupancy levels.
*All fund returns referenced in this commentary are for Investor Class shares.
Other notable performance contributors included U.S. mortgage investment company Newcastle Investment and Hong Kong casino operator Sands China. Newcastle benefited from acquisitions of highly profitable mortgage servicing rights (MSRs). During the second quarter, Newcastle spun off its MSR unit into another company, New Residential Investment, which should benefit from higher interest rates and rising home values. Sands China enjoyed better-than-expected gaming trends in Macau, a Chinese territory whose economy is driven largely by gaming and tourism.
Emerging Markets Weighed on Results
On the downside, stock selection in Japan, along with holdings in emerging markets such as China and Thailand, detracted from relative results. Notable detractors among the fund’s holdings in emerging markets included Brazilian shopping mall operator Aliansce Shopping Centers and Chinese property developer China Resources Land. Aliansce continued to execute well, but a meaningful slowdown in the Brazilian economy and rising interest rates weighed on the stock, and we chose to eliminate it from the portfolio. The fund held an underweight position compared with the benchmark in China Resources Land early in the reporting period, when the stock enjoyed a strong return amid signs of improving economic activity in China.
Two of the most significant detractors in the portfolio were U.S. companies—office property owner Boston Properties and wireless tower operator American Tower. Timing led to the underperformance in Boston Properties—the fund held an overweight position early in the period, when the stock lagged, and an underweight position when the stock rebounded later in the period. American Tower declined as the market failed to reward the company’s strong growth given its high valuation and relatively low dividend yield.
Outlook
We remain confident in European property stocks, especially in the U.K., where government efforts to stimulate the housing market should continue to boost overall economic activity. We are also optimistic on prospects for Australia’s housing market, which has shown clear signs of recovery—price growth is evident in Sydney and Melbourne due to lower interest rates, strong domestic and foreign demand, and reduced supply. Accommodative fiscal and monetary policy in Japan should continue to support the case for asset price inflation, thereby supporting real estate valuations.
In the U.S., real estate stocks appear attractively valued after nearly a year of underperformance versus the broad stock market. A combination of reasonable valuations, improving commercial real estate fundamentals, and continued growth in per-share dividends should be a tailwind for U.S. property stocks in the coming year.
We are cautious about emerging markets, especially in Asia, where monetary and fiscal policy are tightening. Furthermore, countries such as Indonesia, India, Malaysia, and Taiwan are looking to implement tighter controls in their respective property markets. In Hong Kong and Singapore, we are concerned about restrictive measures in the property market continuing to suppress demand for real estate.
OCTOBER 31, 2013 |
Top Ten Holdings | % of net assets |
Simon Property Group, Inc. | 5.2% |
Ventas, Inc. | 3.3% |
Prologis, Inc. | 3.3% |
Mitsui Fudosan Co. Ltd. | 3.1% |
General Growth Properties, Inc. | 2.7% |
Macerich Co. (The) | 2.6% |
Unibail-Rodamco SE | 2.5% |
DDR Corp. | 2.3% |
Kilroy Realty Corp. | 2.3% |
Brookfield Asset Management, Inc. Class A | 2.3% |
| | |
Types of Investments in Portfolio | % of net assets |
Foreign Common Stocks | 51.2% |
Domestic Common Stocks | 46.9% |
Total Common Stocks | 98.1% |
Temporary Cash Investments | 1.8% |
Other Assets and Liabilities | 0.1% |
| | |
Investments by Country | % of net assets |
United States | 46.9% |
Japan | 12.9% |
United Kingdom | 7.9% |
Hong Kong | 6.5% |
Australia | 6.1% |
Canada | 3.6% |
Singapore | 3.5% |
France | 3.4% |
China | 3.0% |
Other Countries | 4.3% |
Cash and Equivalents* | 1.9% |
*Includes temporary cash investments and other assets and liabilities. |
Fund shareholders may incur two types of costs: (1) transaction costs, including sales charges (loads) on purchase payments and redemption/exchange fees; and (2) ongoing costs, including management fees; distribution and service (12b-1) fees; and other fund expenses. This example is intended to help you understand your ongoing costs (in dollars) of investing in your fund and to compare these costs with the ongoing cost of investing in other mutual funds.
The example is based on an investment of $1,000 made at the beginning of the period and held for the entire period from May 1, 2013 to October 31, 2013 (except as noted).
Actual Expenses
The table provides information about actual account values and actual expenses for each class. You may use the information, together with the amount you invested, to estimate the expenses that you paid over the period. First, identify the share class you own. Then simply divide your account value by $1,000 (for example, an $8,600 account value divided by $1,000 = 8.6), then multiply the result by the number under the heading “Expenses Paid During Period” to estimate the expenses you paid on your account during this period.
If you hold Investor Class shares of any American Century Investments fund, or Institutional Class shares of the American Century Diversified Bond Fund, in an American Century Investments account (i.e., not a financial intermediary or retirement plan account), American Century Investments may charge you a $12.50 semiannual account maintenance fee if the value of those shares is less than $10,000. We will redeem shares automatically in one of your accounts to pay the $12.50 fee. In determining your total eligible investment amount, we will include your investments in all personal accounts (including American Century Investments Brokerage accounts) registered under your Social Security number. Personal accounts include individual accounts, joint accounts, UGMA/UTMA accounts, personal trusts, Coverdell Education Savings Accounts and IRAs (including traditional, Roth, Rollover, SEP-, SARSEP- and SIMPLE-IRAs), and certain other retirement accounts. If you have only business, business retirement, employer-sponsored or American Century Investments Brokerage accounts, you are currently not subject to this fee. If you are subject to the Account Maintenance Fee, your account value could be reduced by the fee amount.
Hypothetical Example for Comparison Purposes
The table also provides information about hypothetical account values and hypothetical expenses based on the actual expense ratio of each class of your fund and an assumed rate of return of 5% per year before expenses, which is not the actual return of a fund’s share class. The hypothetical account values and expenses may not be used to estimate the actual ending account balance or expenses you paid for the period. You may use this information to compare the ongoing costs of investing in your fund and other funds. To do so, compare this 5% hypothetical example with the 5% hypothetical examples that appear in the shareholder reports of the other funds.
Please note that the expenses shown in the table are meant to highlight your ongoing costs only and do not reflect any transactional costs, such as sales charges (loads) or redemption/exchange fees. Therefore, the table is useful in comparing ongoing costs only, and will not help you determine the relative total costs of owning different funds. In addition, if these transactional costs were included, your costs would have been higher.
| | Beginning
Account Value 5/1/13 | Ending
Account Value 10/31/13 | Expenses Paid During Period(1) 5/1/13 - 10/31/13 | Annualized
Expense Ratio(1) |
Actual |
Investor Class | $1,000 | $960.10 | $5.93 | 1.20% |
Institutional Class | $1,000 | $961.70 | $4.94 | 1.00% |
A Class | $1,000 | $959.20 | $7.16 | 1.45% |
C Class | $1,000 | $955.80 | $10.85 | 2.20% |
R Class | $1,000 | $958.40 | $8.39 | 1.70% |
R6 Class | $1,000 | $1,034.90(2) | $2.32(3) | 0.85% |
Hypothetical |
Investor Class | $1,000 | $1,019.16 | $6.11 | 1.20% |
Institutional Class | $1,000 | $1,020.16 | $5.09 | 1.00% |
A Class | $1,000 | $1,017.90 | $7.38 | 1.45% |
C Class | $1,000 | $1,014.12 | $11.17 | 2.20% |
R Class | $1,000 | $1,016.64 | $8.64 | 1.70% |
R6 Class | $1,000 | $1,020.92(4) | $4.33(4) | 0.85% |
(1) | Expenses are equal to the class’s annualized expense ratio listed in the table above, multiplied by the average account value over the period, multiplied by 184, the number of days in the most recent fiscal half-year, divided by 365, to reflect the one-half year period. |
(2) | Ending account value based on actual return from July 26, 2013 (commencement of sale) through October 31, 2013. |
(3) | Expenses are equal to the class’s annualized expense ratio listed in the table above, multiplied by the average account value over the period, multiplied by 98, the number of days in the period from July 26, 2013 (commencement of sale) through October 31, 2013, divided by 365, to reflect the period. Had the class been available for the full period, the expenses paid during the period would have been higher. |
(4) | Ending account value and expenses paid during the period assumes the class had been available throughout the entire period and are calculated using the class’s annualized expense ratio listed in the table above. |
OCTOBER 31, 2013
| | | Shares | | | Value | |
Common Stocks — 98.1% | |
AUSTRALIA — 6.1% | |
Goodman Group | | 230,706 | | | $ 1,103,342 | |
Lend Lease Group | | 96,347 | | | 1,038,111 | |
Mirvac Group | | 675,907 | | | 1,111,570 | |
Peet Ltd.(1) | | 183,174 | | | 242,378 | |
Stockland | | 115,259 | | | 436,838 | |
Westfield Group | | 59,675 | | | 610,268 | |
| | | | | | 4,542,507 | |
BRAZIL — 0.7% | |
BR Malls Participacoes SA | | 55,500 | | | 537,608 | |
CANADA — 3.6% | |
Allied Properties Real Estate Investment Trust | | 29,566 | | | 951,364 | |
Brookfield Asset Management, Inc. Class A | | 42,564 | | | 1,684,683 | |
| | | | | | 2,636,047 | |
CHINA — 3.0% | |
China Overseas Land & Investment Ltd. | | 292,000 | | | 903,908 | |
China Resources Land Ltd. | | 112,000 | | | 324,313 | |
Country Garden Holdings Co. | | 759,000 | | | 518,858 | |
Shimao Property Holdings Ltd. | | 199,500 | | | 502,288 | |
| | | | | | 2,249,367 | |
FRANCE — 3.4% | |
Klepierre | | 13,720 | | | 616,225 | |
Unibail-Rodamco SE | | 7,126 | | | 1,867,337 | |
| | | | | | 2,483,562 | |
HONG KONG — 6.5% | |
Cheung Kong Holdings Ltd. | | 92,000 | | | 1,438,205 | |
Galaxy Entertainment Group Ltd.(1) | | 11,000 | | | 82,078 | |
Link Real Estate Investment Trust (The) | | 224,500 | | | 1,132,200 | |
Sands China Ltd. | | 19,600 | | | 139,296 | |
Sun Hung Kai Properties Ltd. | | 50,000 | | | 655,230 | |
Wharf Holdings Ltd. | | 161,000 | | | 1,356,030 | |
| | | | | | 4,803,039 | |
JAPAN — 12.9% | |
Daiwa House Industry Co. Ltd. | | 58,000 | | | 1,156,697 | |
GLP J-REIT | | 948 | | | 984,346 | |
Hulic Co. Ltd. | | 12,900 | | | 204,133 | |
Mitsubishi Estate Co. Ltd. | | 50,000 | | | 1,422,252 | |
Mitsui Fudosan Co. Ltd. | | 70,000 | | | 2,302,959 | |
Nippon Building Fund, Inc. | | 95 | | | 1,175,786 | |
Orix JREIT, Inc. | | 501 | | | 625,167 | |
Sumitomo Realty & Development Co. Ltd. | | 26,000 | | | 1,222,923 | |
Tokyo Tatemono Co. Ltd. | | 47,000 | | | 438,310 | |
| | | | | | 9,532,573 | |
MEXICO — 0.9% | |
Corp. Inmobiliaria Vesta SAB de CV | | 226,514 | | | 434,026 | |
Fibra Uno Administracion SA de CV | | 65,049 | | | 201,420 | |
| | | | | | 635,446 | |
NETHERLANDS — 0.5% | |
Corio NV | | 8,551 | | | 373,091 | |
PHILIPPINES — 0.9% | |
Ayala Land, Inc. | | 950,500 | | | 647,818 | |
SINGAPORE — 3.5% | |
CapitaMalls Asia Ltd. | | 383,000 | | | 622,814 | |
Global Logistic Properties Ltd. | | 440,000 | | | 1,094,510 | |
Keppel Land Ltd. | | 120,000 | | | 358,396 | |
Suntec Real Estate Investment Trust | | 373,000 | | | 514,970 | |
| | | | | | 2,590,690 | |
SOUTH AFRICA — 0.9% | |
Growthpoint Properties Ltd. | | 247,096 | | | 627,663 | |
THAILAND — 0.4% | |
Central Pattana PCL | | 98,400 | | | 151,749 | |
Quality Houses PCL | | 1,417,600 | | | 138,458 | |
| | | | | | 290,207 | |
UNITED KINGDOM — 7.9% | |
Big Yellow Group plc | | 107,591 | | | 806,145 | |
Countrywide plc | | 117,505 | | | 1,051,314 | |
Derwent London plc | | 9,231 | | | 370,617 | |
Great Portland Estates plc | | 38,156 | | | 350,557 | |
Londonmetric Property plc | | 269,267 | | | 556,948 | |
Quintain Estates & Development plc(1) | | 306,168 | | | 476,182 | |
Segro plc | | 128,876 | | | 675,299 | |
Taylor Wimpey plc | | 286,061 | | | 505,454 | |
Unite Group plc | | 97,339 | | | 618,050 | |
Workspace Group plc | | 57,730 | | | 453,009 | |
| | | | | | 5,863,575 | |
UNITED STATES — 46.9% | |
BRE Properties, Inc. | | 30,338 | | | 1,656,758 | |
CubeSmart | | 67,826 | | | 1,239,181 | |
DCT Industrial Trust, Inc. | | 198,861 | | | 1,541,173 | |
DDR Corp. | | 102,053 | | | 1,729,798 | |
Douglas Emmett, Inc. | | 65,987 | | | 1,645,056 | |
Equity One, Inc. | | 35,778 | | | 862,608 | |
Essex Property Trust, Inc. | | 10,413 | | | 1,676,493 | |
| | | | | | | |
| | | Shares | | | Value | |
First Industrial Realty Trust, Inc. | | 77,047 | | | $ 1,392,239 | |
Forest City Enterprises, Inc. Class A(1) | | 78,675 | | | 1,593,955 | |
General Growth Properties, Inc. | | 92,836 | | | 1,970,908 | |
Kilroy Realty Corp. | | 32,181 | | | 1,710,742 | |
Macerich Co. (The) | | 32,057 | | | 1,898,095 | |
National Retail Properties, Inc. | | 43,077 | | | 1,481,849 | |
Parkway Properties, Inc. | | 80,816 | | | 1,463,578 | |
Prologis, Inc. | | 60,664 | | | 2,423,527 | |
RLJ Lodging Trust | | 61,244 | | | 1,547,023 | |
Simon Property Group, Inc. | | 24,865 | | | 3,842,886 | |
Starwood Hotels & Resorts Worldwide, Inc. | | 17,282 | | | 1,272,301 | |
Ventas, Inc. | | 37,325 | | | 2,435,083 | |
Wyndham Worldwide Corp. | | 19,558 | | | 1,298,651 | |
| | | | | | 34,681,904 | |
TOTAL COMMON STOCKS (Cost $67,417,389) | | | 72,495,097 | |
Temporary Cash Investments — 1.8% | |
Repurchase Agreement, Bank of America Merrill Lynch, (collateralized by various U.S. Treasury obligations, 1.25%, 10/31/18, valued at $271,666), in a joint trading account at 0.07%, dated 10/31/13, due 11/1/13 (Delivery value $266,651) | | | 266,650 | |
Repurchase Agreement, Credit Suisse First Boston, Inc., (collateralized by various U.S. Treasury obligations, 2.75%, 11/15/42, valued at $326,678), in a joint trading account at 0.03%, dated 10/31/13, due 11/1/13 (Delivery value $319,980) | | | 319,980 | |
Repurchase Agreement, Goldman Sachs & Co., (collateralized by various U.S. Treasury obligations, 1.625%, 8/15/22, valued at $326,616), in a joint trading account at 0.05%, dated 10/31/13, due 11/1/13 (Delivery value $319,980) | | | 319,980 | |
Repurchase Agreement, Goldman Sachs & Co., (collateralized by various U.S. Treasury obligations, 1.75%, 5/15/22, valued at $326,614), in a joint trading account at 0.02%, dated 10/31/13, due 11/1/13 (Delivery value $319,980) | | | $ 319,980 | |
SSgA U.S. Government Money Market Fund | | 88,855 | | | 88,855 | |
TOTAL TEMPORARY CASH INVESTMENTS (Cost $1,315,445) | | | 1,315,445 | |
TOTAL INVESTMENT SECURITIES — 99.9% (Cost $68,732,834) | | | 73,810,542 | |
OTHER ASSETS AND LIABILITIES — 0.1% | | | 88,040 | |
TOTAL NET ASSETS — 100.0% | | | $73,898,582 | |
Sub-Industry Allocation |
(as a % of net assets) |
Retail REITs | 22.2% |
Diversified Real Estate Activities | 17.6% |
Office REITs | 11.8% |
Industrial REITs | 11.0% |
Specialized REITs | 8.2% |
Real Estate Operating Companies | 7.0% |
Real Estate Development | 6.6% |
Diversified REITs | 4.8% |
Residential REITs | 4.5% |
Hotels, Resorts and Cruise Lines | 3.4% |
Homebuilding | 0.7% |
Casinos and Gaming | 0.3% |
Cash and Equivalents* | 1.9% |
*Includes temporary cash investments and other assets and liabilities. |
Notes to Schedule of Investments
See Notes to Financial Statements.
Statement of Assets and Liabilities |
OCTOBER 31, 2013 | |
Assets | |
Investment securities, at value (cost of $68,732,834) | | $73,810,542 | |
Foreign currency holdings, at value (cost of $2,594) | | 2,573 | |
Receivable for investments sold | | 5,094,581 | |
Receivable for capital shares sold | | 54,256 | |
Dividends and interest receivable | | 64,166 | |
Other assets | | 2,882 | |
| | | 79,029,000 | |
| | | | |
Liabilities | |
Payable for investments purchased | | 4,995,044 | |
Payable for capital shares redeemed | | 56,191 | |
Accrued management fees | | 72,649 | |
Distribution and service fees payable | | 6,534 | |
| | | 5,130,418 | |
| | | | |
Net Assets | | $73,898,582 | |
| | | | |
Net Assets Consist of: | |
Capital (par value and paid-in surplus) | | $67,677,264 | |
Undistributed net investment income | | 1,338,877 | |
Accumulated net realized loss | | (201,334 | ) |
Net unrealized appreciation | | 5,083,775 | |
| | | $73,898,582 | |
| | | | | | | | | | |
| | | Net assets | | Shares outstanding | | Net asset value per share |
Investor Class, $0.01 Par Value | | $43,926,761 | | | 3,804,871 | | | $11.54 | |
Institutional Class, $0.01 Par Value | | $7,916,388 | | | 684,984 | | | $11.56 | |
A Class, $0.01 Par Value | | $18,926,006 | | | 1,641,633 | | | $11.53 | * |
C Class, $0.01 Par Value | | $2,614,385 | | | 227,981 | | | $11.47 | |
R Class, $0.01 Par Value | | $489,179 | | | 42,473 | | | $11.52 | |
R6 Class, $0.01 Par Value | | $25,863 | | | 2,236 | | | $11.57 | |
*Maximum offering price $12.23 (net asset value divided by 0.9425). | |
See Notes to Financial Statements.
YEAR ENDED OCTOBER 31, 2013 | |
Investment Income (Loss) | |
Income: | | | |
Dividends (net of foreign taxes withheld of $64,401) | | $1,324,718 | |
Interest | | 114 | |
| | | 1,324,832 | |
| | | | |
Expenses: | | | |
Management fees | | 661,048 | |
Distribution and service fees: | | | |
A Class | | 26,580 | |
C Class | | 15,322 | |
R Class | | 2,396 | |
Directors’ fees and expenses | | 2,457 | |
Other expenses | | 352 | |
| | | 708,155 | |
| | | | |
Net investment income (loss) | | 616,677 | |
| | | | |
Realized and Unrealized Gain (Loss) | |
Net realized gain (loss) on: | | | |
Investment transactions (net of foreign tax expenses paid (refunded) of $1,019) | | 1,561,862 | |
Foreign currency transactions | | (53,950 | ) |
| | | 1,507,912 | |
| | | | |
Change in net unrealized appreciation (depreciation) on: | | | |
Investments (includes (increase) decrease in accrued foreign taxes of $2,596) | | 3,041,650 | |
Translation of assets and liabilities in foreign currencies | | 6,465 | |
| | | 3,048,115 | |
| | | | |
Net realized and unrealized gain (loss) | | 4,556,027 | |
| | | | |
Net Increase (Decrease) in Net Assets Resulting from Operations | | $5,172,704 | |
See Notes to Financial Statements.
Statement of Changes in Net Assets |
YEAR ENDED OCTOBER 31, 2013 AND PERIODS ENDED OCTOBER 31, 2012 AND MARCH 31, 2012 | |
Increase (Decrease) in Net Assets | October 31, 2013 | October 31, 2012(1) | March 31, 2012(2) |
Operations | |
Net investment income (loss) | | $ 616,677 | | | $ 113,929 | | | $ 66,282 | |
Net realized gain (loss) | | 1,507,912 | | | 923,562 | | | (77,654 | ) |
Change in net unrealized appreciation (depreciation) | | 3,048,115 | | | 1,226,713 | | | 808,947 | |
Net increase (decrease) in net assets resulting from operations | | 5,172,704 | | | 2,264,204 | | | 797,575 | |
| | | | | | | | | | |
Distributions to Shareholders | |
From net investment income: | | | | | | | | | |
Investor Class | | (860,795 | ) | | — | | | (44,826 | ) |
Institutional Class | | (166,138 | ) | | — | | | (3,528 | ) |
A Class | | (99,374 | ) | | — | | | (2,013 | ) |
C Class | | (14,950 | ) | | — | | | — | |
R Class | | (12,279 | ) | | — | | | (1,140 | ) |
From net realized gains: | | | | | | | | | |
Investor Class | | (600,706 | ) | | — | | | — | |
Institutional Class | | (109,402 | ) | | — | | | — | |
A Class | | (74,980 | ) | | — | | | — | |
C Class | | (14,908 | ) | | — | | | — | |
R Class | | (10,084 | ) | | — | | | — | |
Decrease in net assets from distributions | | (1,963,616 | ) | | — | | | (51,507 | ) |
| | | | | | | | | | |
Capital Share Transactions | |
Net increase (decrease) in net assets from capital share transactions | | 41,326,091 | | | 17,080,037 | | | 9,273,094 | |
| | | | | | | | | | |
Net increase (decrease) in net assets | | 44,535,179 | | | 19,344,241 | | | 10,019,162 | |
| | | | | | | | | | |
Net Assets | |
Beginning of period | | 29,363,403 | | | 10,019,162 | | | — | |
End of period | | $73,898,582 | | | $29,363,403 | | | $10,019,162 | |
| | | | | | | | | | |
Undistributed net investment income | | $1,338,877 | | | $400,900 | | | $87,749 | |
(1) | April 1, 2012 through October 31, 2012. The fund’s fiscal year end was changed from March 31 to October 31, resulting in a seven-month annual reporting period. |
(2) | April 29, 2011 (fund inception) through March 31, 2012. |
See Notes to Financial Statements.
Notes to Financial Statements |
OCTOBER 31, 2013
1. Organization
American Century Capital Portfolios, Inc. (the corporation) is registered under the Investment Company Act of 1940, as amended (the 1940 Act), as an open-end management investment company and is organized as a Maryland corporation. Global Real Estate Fund (the fund) is one fund in a series issued by the corporation. The fund is nondiversified as defined under the 1940 Act. The fund’s investment objective is to seek high total investment return through a combination of capital appreciation and current income.
The fund offers the Investor Class, the Institutional Class, the A Class, the C Class, the R Class and the R6 Class. The A Class may incur an initial sales charge. The A Class and C Class may be subject to a contingent deferred sales charge. The share classes differ principally in their respective sales charges and distribution and shareholder servicing expenses and arrangements. The Institutional Class and R6 Class shareholders do not require the same level of shareholder and administrative services from American Century Investment Management, Inc. (ACIM) (the investment advisor) as shareholders of other classes. In addition, financial intermediaries do not receive any service, distribution or administrative fees for the R6 Class. As a result, the Institutional Class and R6 Class are charged lower unified management fees. The fund incepted on April 29, 2011 with the commencement of sale of the Investor Class, Institutional Class, A Class, C Class and R Class. Sale of the R6 Class commenced on July 26, 2013.
2. Significant Accounting Policies
The following is a summary of significant accounting policies consistently followed by the fund in preparation of its financial statements. The financial statements are prepared in conformity with accounting principles generally accepted in the United States of America, which may require management to make certain estimates and assumptions at the date of the financial statements. Actual results could differ from these estimates.
Investment Valuations — The fund determines the fair value of its investments and computes its net asset value per share as of the close of regular trading (usually 4 p.m. Eastern time) on the New York Stock Exchange (NYSE) on each day the NYSE is open.
Equity securities that are listed or traded on a domestic securities exchange are valued at the last reported sales price or at the official closing price as provided by the exchange. Equity securities traded on foreign securities exchanges are typically valued at the closing price on the exchange where primarily traded or as of the close of the NYSE, if that is earlier. If no last sales price is reported, or if local convention or regulation so provides, the mean of the latest bid and asked prices is used. Depending on local convention or regulation, securities traded over-the-counter are valued at the mean of the latest bid and asked prices, the last sales price, or the official closing price. In its determination of fair value, the fund may review several factors including: market information specific to a security; news developments in U.S. and foreign markets; the performance of particular U.S. and foreign securities, indices, comparable securities, American Depositary Receipts, Exchange-Traded Funds, and other relevant market indicators.
Debt securities maturing within 60 days at the time of purchase may be valued at cost, plus or minus any amortized discount or premium or at the evaluated mean as provided by an independent pricing service. Evaluated mean prices are commonly derived through utilization of market models, which may consider, among other factors, trade data, quotations from dealers and active market makers, relevant yield curve and spread data, related sector levels, creditworthiness, and other relevant market information on the same or comparable securities.
Investments in open-end management investment companies are valued at the reported net asset value per share. Repurchase agreements are valued at cost.
The value of investments initially expressed in foreign currencies is translated into U.S. dollars at prevailing exchange rates.
If the fund determines that the market price for a portfolio security is not readily available or the valuation methods mentioned above do not reflect a security’s fair value, such security is valued as determined in good faith by the Board of Directors or its designee, in accordance with procedures adopted by the Board of Directors. Circumstances that may cause the fund to use these procedures to value a security include, but are not limited to: a security has been declared in default; trading in a security has been halted during the trading day; there is a foreign market holiday and no trading occurred; or an event occurred between the close of a foreign exchange and the NYSE that may affect the value of a security.
Security Transactions — Security transactions are accounted for as of the trade date. Net realized gains and losses are determined on the identified cost basis, which is also used for federal income tax purposes. Certain countries impose taxes on realized gains on the sale of securities registered in their country. The fund records the foreign tax expense, if any, on an accrual basis. The foreign tax expense on realized gains and unrealized appreciation reduces the net realized gain (loss) on investment transactions and net unrealized appreciation (depreciation) on investments, respectively.
Investment Income — Dividend income less foreign taxes withheld, if any, is recorded as of the ex-dividend date. Distributions received on securities that represent a return of capital or long-term capital gain are recorded as a reduction of cost of investments and/or as a realized gain. The fund may estimate the components of distributions received that may be considered nontaxable distributions or long-term capital gain distributions for income tax purposes. Interest income is recorded on the accrual basis and includes accretion of discounts and amortization of premiums.
Foreign Currency Translations — All assets and liabilities initially expressed in foreign currencies are translated into U.S. dollars at prevailing exchange rates at period end. The fund may enter into spot foreign currency exchange contracts to facilitate transactions denominated in a foreign currency. Purchases and sales of investment securities, dividend and interest income, spot foreign currency exchange contracts, and expenses are translated at the rates of exchange prevailing on the respective dates of such transactions. Net realized and unrealized foreign currency exchange gains or losses related to investment securities are a component of net realized gain (loss) on investment transactions and change in net unrealized appreciation (depreciation) on investments, respectively.
Repurchase Agreements — The fund may enter into repurchase agreements with institutions that ACIM has determined are creditworthy pursuant to criteria adopted by the Board of Directors. The fund requires that the collateral, represented by securities, received in a repurchase transaction be transferred to the custodian in a manner sufficient to enable the fund to obtain those securities in the event of a default under the repurchase agreement. ACIM monitors, on a daily basis, the securities transferred to ensure the value, including accrued interest, of the securities under each repurchase agreement is equal to or greater than amounts owed to the fund under each repurchase agreement.
Joint Trading Account — Pursuant to an Exemptive Order issued by the Securities and Exchange Commission, the fund, along with certain other funds in the American Century Investments family of funds, may transfer uninvested cash balances into a joint trading account. These balances are invested in one or more repurchase agreements that are collateralized by U.S. Treasury or Agency obligations.
Income Tax Status — It is the fund’s policy to distribute substantially all net investment income and net realized gains to shareholders and to otherwise qualify as a regulated investment company under provisions of the Internal Revenue Code. Accordingly, no provision has been made for income taxes. The fund files U.S. federal, state, local and non-U.S. tax returns as applicable. The fund’s tax returns are subject to examination by the relevant taxing authority until expiration of the applicable statute of limitations, which is generally three years from the date of filing but can be longer in certain jurisdictions. At this time, management believes there are no uncertain tax positions which, based on their technical merit, would not be sustained upon examination and for which it is reasonably possible that the total amounts of unrecognized tax benefits will significantly change in the next twelve months.
Multiple Class — All shares of the fund represent an equal pro rata interest in the net assets of the class to which such shares belong, and have identical voting, dividend, liquidation and other rights and the same terms and conditions, except for class specific expenses and exclusive rights to vote on matters affecting only individual classes. Income, non-class specific expenses, and realized and unrealized capital gains and losses of the fund are allocated to each class of shares based on their relative net assets.
Distributions to Shareholders — Distributions from net investment income and net realized gains, if any, are generally declared and paid annually.
Indemnifications — Under the corporation’s organizational documents, its officers and directors are indemnified against certain liabilities arising out of the performance of their duties to the fund. In addition, in the normal course of business, the fund enters into contracts that provide general indemnifications. The maximum exposure under these arrangements is unknown as this would involve future claims that may be made against a fund. The risk of material loss from such claims is considered by management to be remote.
3. Fees and Transactions with Related Parties
Management Fees — The corporation has entered into a management agreement with ACIM, under which ACIM provides the fund with investment advisory and management services in exchange for a single, unified management fee (the fee) per class. The agreement provides that all expenses of managing and operating the fund, except distribution and service fees, brokerage expenses, taxes, interest, fees and expenses of the independent directors (including legal counsel fees), and extraordinary expenses, will be paid by ACIM. The fee is computed and accrued daily based on each class’s daily net assets and paid monthly in arrears. The annual management fee is 1.20% for the Investor Class, A Class, C Class and R Class, 1.00% for the Institutional Class and 0.85% for the R6 Class.
Distribution and Service Fees — The Board of Directors has adopted a separate Master Distribution and Individual Shareholder Services Plan for each of the A Class, C Class and R Class (collectively the plans), pursuant to Rule 12b-1 of the 1940 Act. The plans provide that the A Class will pay American Century Investment Services, Inc. (ACIS) an annual distribution and service fee of 0.25%. The plans provide that the C Class will pay ACIS an annual distribution and service fee of 1.00%, of which 0.25% is paid for individual shareholder services and 0.75% is paid for distribution services. The plans provide that the R Class will pay ACIS an annual distribution and service fee of 0.50%. The fees are computed and accrued daily based on each class’s daily net assets and paid monthly in arrears. The fees are used to pay financial intermediaries for distribution and individual shareholder services. Fees incurred under the plans during the year ended October 31, 2013 are detailed in the Statement of Operations.
Related Parties — Certain officers and directors of the corporation are also officers and/or directors of American Century Companies, Inc. (ACC). The corporation’s investment advisor, ACIM, the corporation’s distributor, ACIS, and the corporation’s transfer agent, American Century Services, LLC, are wholly owned, directly or indirectly, by ACC. Various funds issued by American Century Strategic Asset Allocations, Inc. own, in aggregate, 11% of the shares of the fund.
4. Investment Transactions
Purchases and sales of investment securities, excluding short-term investments, for the year ended October 31, 2013 were $254,322,952 and $214,688,676, respectively.
5. Capital Share Transactions
Transactions in shares of the fund were as follows:
| | | | | | | | | | |
| | | Year ended
October 31, 2013(1) | | | Period ended
October 31, 2012(2) | | | Period ended
March 31, 2012(3) | |
| | | Shares | | | Amount | | | Shares | | | Amount | | | Shares | | | Amount | |
Investor Class/Shares Authorized | | 20,000,000 | | | | | | 100,000,000 | | | | | | 100,000,000 | | | | |
Sold | | 3,332,860 | | | $ 37,141,323 | | | 1,727,891 | | | $17,709,157 | | | 854,623 | | | $ 7,552,260 | |
Issued in reinvestment of distributions | | 137,802 | | | 1,449,682 | | | — | | | — | | | 5,108 | | | 42,702 | |
Redeemed | | (1,789,370 | ) | | (19,737,036 | ) | | (354,983 | ) | | (3,686,706 | ) | | (109,060 | ) | | (1,017,719 | ) |
| | | 1,681,292 | | | 18,853,969 | | | 1,372,908 | | | 14,022,451 | | | 750,671 | | | 6,577,243 | |
Institutional Class/Shares Authorized | | 10,000,000 | | | | | | 50,000,000 | | | | | | 50,000,000 | | | | |
Sold | | 712,774 | | | 7,805,365 | | | 145,550 | | | 1,552,183 | | | 124,215 | | | 1,185,652 | |
Issued in reinvestment of distributions | | 26,217 | | | 275,540 | | | — | | | — | | | 422 | | | 3,528 | |
Redeemed | | (302,537 | ) | | (3,526,087 | ) | | (21,136 | ) | | (215,464 | ) | | (521 | ) | | (5,041 | ) |
| | | 436,454 | | | 4,554,818 | | | 124,414 | | | 1,336,719 | | | 124,116 | | | 1,184,139 | |
A Class/Shares Authorized | | 10,000,000 | | | | | | 50,000,000 | | | | | | 50,000,000 | | | | |
Sold | | 1,866,540 | | | 20,870,754 | | | 157,703 | | | 1,596,549 | | | 71,516 | | | 703,821 | |
Issued in reinvestment of distributions | | 16,558 | | | 174,354 | | | — | | | — | | | 240 | | | 2,013 | |
Redeemed | | (467,439 | ) | | (5,077,420 | ) | | (3,485 | ) | | (35,928 | ) | | — | | | — | |
| | | 1,415,659 | | | 15,967,688 | | | 154,218 | | | 1,560,621 | | | 71,756 | | | 705,834 | |
C Class/Shares Authorized | | 10,000,000 | | | | | | 50,000,000 | | | | | | 50,000,000 | | | | |
Sold | | 219,227 | | | 2,457,570 | | | 16,180 | | | 162,080 | | | 40,466 | | | 403,814 | |
Issued in reinvestment of distributions | | 2,833 | | | 29,858 | | | — | | | — | | | — | | | — | |
Redeemed | | (50,429 | ) | | (585,339 | ) | | (296 | ) | | (2,755 | ) | | — | | | — | |
| | | 171,631 | | | 1,902,089 | | | 15,884 | | | 159,325 | | | 40,466 | | | 403,814 | |
R Class/Shares Authorized | | 10,000,000 | | | | | | 50,000,000 | | | | | | 50,000,000 | | | | |
Sold | | 1,975 | | | 22,034 | | | 92 | | | 921 | | | 40,106 | | | 400,924 | |
Issued in reinvestment of distributions | | 2,122 | | | 22,363 | | | — | | | — | | | 136 | | | 1,140 | |
Redeemed | | (1,958 | ) | | (21,870 | ) | | — | | | — | | | — | | | — | |
| | | 2,139 | | | 22,527 | | | 92 | | | 921 | | | 40,242 | | | 402,064 | |
R6 Class/Shares Authorized | | 50,000,000 | | | | | | N/A | | | | | | N/A | | | | |
Sold | | 2,236 | | | 25,000 | | | | | | | | | | | | | |
Net increase (decrease) | | 3,709,411 | | | $ 41,326,091 | | | 1,667,516 | | | $17,080,037 | | | 1,027,251 | | | $ 9,273,094 | |
(1) | July 26, 2013 (commencement of sale) through October 31, 2013 for the R6 Class. |
(2) | April 1, 2012 through October 31, 2012. The fund’s fiscal year end was changed from March 31 to October 31, resulting in a seven-month annual reporting period. |
(3) | April 29, 2011 (fund inception) through March 31, 2012. |
6. Fair Value Measurements
The fund’s securities valuation process is based on several considerations and may use multiple inputs to determine the fair value of the positions held by the fund. In conformity with accounting principles generally accepted in the United States of America, the inputs used to determine a valuation are classified into three broad levels as follows:
• | Level 1 valuation inputs consist of unadjusted quoted prices in an active market for identical securities; |
• | Level 2 valuation inputs consist of direct or indirect observable market data (including quoted prices for similar securities, evaluations of subsequent market events, interest rates, prepayment speeds, credit risk, etc.); or |
• | Level 3 valuation inputs consist of unobservable data (including a fund’s own assumptions). |
The level classification is based on the lowest level input that is significant to the fair valuation measurement. The valuation inputs are not necessarily an indication of the risks associated with investing in these securities or other financial instruments.
The following is a summary of the level classifications as of period end. The Schedule of Investments provides additional information on the fund’s portfolio holdings.
| | | | | | | | | | |
| | | Level 1 | | | Level 2 | | | Level 3 | |
Investment Securities | |
Foreign Common Stocks | | $ 1,684,683 | | | $36,128,510 | | | — | |
Domestic Common Stocks | | 34,681,904 | | | — | | | — | |
Temporary Cash Investments | | 88,855 | | | 1,226,590 | | | — | |
Total Value of Investment Securities | | $36,455,442 | | | $37,355,100 | | | — | |
7. Risk Factors
The fund concentrates its investments in a narrow segment of the total market. Because of this, the fund is subject to certain additional risks as compared to investing in a more diversified portfolio of investments. The fund may be subject to certain risks similar to those associated with direct investment in real estate including but not limited to: local or regional economic conditions, changes in zoning laws, changes in property values, property tax increases, overbuilding, increased competition, environmental contamination, natural disasters, and interest rate risk.
There are certain risks involved in investing in foreign securities. These risks include those resulting from future adverse political, social and economic developments, fluctuations in currency exchange rates, the possible imposition of exchange controls, and other foreign laws or restrictions. Investing in emerging markets may accentuate these risks.
The fund’s investment process may result in high portfolio turnover, which could mean high transaction costs, affecting both performance and capital gains tax liabilities to investors.
8. Federal Tax Information
On December 10, 2013, the fund declared and paid a per-share distribution from net realized gains to shareholders of record on December 9, 2013 of $0.1456 for the Investor Class, Institutional Class, A Class, B Class, C Class, R Class and R6 Class.
On December 10, 2013, the fund declared and paid the following per-share distributions from net investment income to shareholders of record on December 9, 2013:
| | | | | | |
Investor | Institutional | A | C | R | R6 |
$0.3686 | $0.3909 | $0.3407 | $0.2571 | $0.3129 | $0.4076 |
The tax character of distributions paid during the year ended October 31, 2013 and the periods ended October 31, 2012 and March 31, 2012 were as follows:
| | | | | | | | | | |
| | | October 31, 2013 | | | October 31, 2012(1) | | | March 31, 2012(2) | |
Distributions Paid From | |
Ordinary income | | $1,954,818 | | | — | | | $51,507 | |
Long-term capital gains | | $8,798 | | | — | | | — | |
(1) | April 1, 2012 through October 31, 2012. The fund’s fiscal year end was changed from March 31 to October 31, resulting in a seven-month annual reporting period. |
(2) | April 29, 2011 (fund inception) through March 31, 2012. |
The book-basis character of distributions made during the year from net investment income or net realized gains may differ from their ultimate characterization for federal income tax purposes. These differences reflect the differing character of certain income items and net realized gains and losses for financial statement and tax purposes, and may result in reclassification among certain capital accounts on the financial statements.
The reclassifications, which are primarily due to gains on investments in passive foreign investment companies, were made to undistributed net investment income $1,474,836 and accumulated net realized loss $(1,474,836).
As of October 31, 2013, the federal tax cost of investments and the components of distributable earnings on a tax-basis were as follows:
| | | | |
Federal tax cost of investments | | $70,601,812 | |
Gross tax appreciation of investments | | $3,892,838 | |
Gross tax depreciation of investments | | (684,108 | ) |
Net tax appreciation (depreciation) of investments | | $3,208,730 | |
Net tax appreciation (depreciation) on translation of assets and liabilities in foreign currencies | | $5,606 | |
Net tax appreciation (depreciation) | | $3,214,336 | |
Undistributed ordinary income | | $2,713,447 | |
Accumulated long-term gains | | $293,535 | |
The difference between book-basis and tax-basis unrealized appreciation (depreciation) is attributable primarily to the tax deferral of losses on wash sales.
| |
For a Share Outstanding Throughout the Years Ended October 31 (except as noted) |
Per-Share Data | | Ratios and Supplemental Data | |
| | | | | | Income From Investment Operations: | | | Distributions From: | | | | | | | | | Ratio to Average Net Assets of: | | | | | | | |
| | | Net Asset Value, Beginning of Period | | Net
Investment Income
(Loss)(1) | | Net Realized and Unrealized Gain (Loss) | | Total From Investment Operations | | Net
Investment Income | | Net
Realized
Gains | | Total Distributions | | Net Asset Value, End
of Period | | Total
Return(2) | | Operating Expenses | | Net
Investment Income
(Loss) | | Portfolio Turnover
Rate | | Net Assets,
End of Period (in thousands) | |
Investor Class |
2013 | | $10.90 | | | 0.13 | | | 1.12 | | | 1.25 | | | (0.36 | ) | | (0.25 | ) | | (0.61 | ) | | $11.54 | | | 11.99 | % | | 1.20% | | | 1.15% | | | 392 | % | | $43,927 | |
| 2012(3) | | $9.75 | | | 0.07 | | | 1.08 | | | 1.15 | | | — | | | — | | | — | | | $10.90 | | | 11.68 | % | | 1.20% | (4) | | 1.15% | (4) | | 264 | % | | $23,143 | |
| 2012(5) | | $10.00 | | | 0.14 | | | (0.32 | )(6) | | (0.18 | ) | | (0.07 | ) | | — | | | (0.07 | ) | | $9.75 | | | (1.57 | )% | | 1.21% | (4) | | 1.63% | (4) | | 462 | % | | $7,322 | |
Institutional Class |
2013 | | $10.91 | | | 0.15 | | | 1.13 | | | 1.28 | | | (0.38 | ) | | (0.25 | ) | | (0.63 | ) | | $11.56 | | | 12.30 | % | | 1.00% | | | 1.35% | | | 392 | % | | $7,916 | |
| 2012(3) | | $9.75 | | | 0.08 | | | 1.08 | | | 1.16 | | | — | | | — | | | — | | | $10.91 | | | 11.90 | % | | 1.00% | (4) | | 1.35% | (4) | | 264 | % | | $2,711 | |
| 2012(5) | | $10.00 | | | 0.17 | | | (0.33 | )(6) | | (0.16 | ) | | (0.09 | ) | | — | | | (0.09 | ) | | $9.75 | | | (1.47 | )% | | 1.01% | (4) | | 1.83% | (4) | | 462 | % | | $1,210 | |
A Class |
2013 | | $10.89 | | | 0.10 | | | 1.12 | | | 1.22 | | | (0.33 | ) | | (0.25 | ) | | (0.58 | ) | | $11.53 | | | 11.72 | % | | 1.45% | | | 0.90% | | | 392 | % | | $18,926 | |
| 2012(3) | | $9.76 | | | 0.06 | | | 1.07 | | | 1.13 | | | — | | | — | | | — | | | $10.89 | | | 11.58 | % | | 1.45% | (4) | | 0.90% | (4) | | 264 | % | | $2,460 | |
| 2012(5) | | $10.00 | | | 0.12 | | | (0.31 | )(6) | | (0.19 | ) | | (0.05 | ) | | — | | | (0.05 | ) | | $9.76 | | | (1.82 | )% | | 1.46% | (4) | | 1.38% | (4) | | 462 | % | | $700 | |
C Class |
2013 | | $10.83 | | | — | (7) | | 1.14 | | | 1.14 | | | (0.25 | ) | | (0.25 | ) | | (0.50 | ) | | $11.47 | | | 10.94 | % | | 2.20% | | | 0.15% | | | 392 | % | | $2,614 | |
| 2012(3) | | $9.75 | | | 0.02 | | | 1.06 | | | 1.08 | | | — | | | — | | | — | | | $10.83 | | | 11.08 | % | | 2.20% | (4) | | 0.15% | (4) | | 264 | % | | $610 | |
| 2012(5) | | $10.00 | | | 0.05 | | | (0.30 | )(6) | | (0.25 | ) | | — | | | — | | | — | | | $9.75 | | | (2.50 | )% | | 2.21% | (4) | | 0.63% | (4) | | 462 | % | | $394 | |
| |
For a Share Outstanding Throughout the Years Ended October 31 (except as noted) |
Per-Share Data | | Ratios and Supplemental Data | |
| | | | | | Income From Investment Operations: | | | Distributions From: | | | | | | | | | Ratio to Average Net Assets of: | | | | | | | |
| | | Net Asset Value, Beginning of Period | | Net
Investment Income
(Loss)(1) | | Net Realized and Unrealized Gain (Loss) | | Total From Investment Operations | | Net
Investment Income | | Net
Realized
Gains | | Total Distributions | | Net Asset Value, End
of Period | | Total
Return(2) | | Operating Expenses | | Net
Investment Income
(Loss) | | Portfolio Turnover
Rate | | Net Assets,
End of Period (in thousands) | |
R Class |
2013 | | $10.87 | | | 0.08 | | | 1.12 | | | 1.20 | | | (0.30 | ) | | (0.25 | ) | | (0.55 | ) | | $11.52 | | | 11.55 | % | | 1.70% | | | 0.65% | | | 392% | | | $489 | |
| 2012(3) | | $9.76 | | | 0.05 | | | 1.06 | | | 1.11 | | | — | | | — | | | — | | | $10.87 | | | 11.37 | % | | 1.70% | (4) | | 0.65% | (4) | | 264% | | | $439 | |
| 2012(5) | | $10.00 | | | 0.09 | | | (0.30 | )(6) | | (0.21 | ) | | (0.03 | ) | | — | | | (0.03 | ) | | $9.76 | | | (2.07 | )% | | 1.71% | (4) | | 1.13% | (4) | | 462% | | | $393 | |
R6 Class |
| 2013(8) | | $11.18 | | | 0.03 | | | 0.36 | | | 0.39 | | | — | | | — | | | — | | | $11.57 | | | 3.49 | % | | 0.85% | (4) | | 1.07% | (4) | | 392% | (9) | | $26 | |
Notes to Financial Highlights
(1) | Computed using average shares outstanding throughout the period. |
(2) | Total returns are calculated based on the net asset value of the last business day and do not reflect applicable sales charges, if any. Total returns for periods less than one year are not annualized. |
(3) | April 1, 2012 through October 31, 2012. The fund’s fiscal year end was changed from March 31 to October 31, resulting in a seven-month annual reporting period. |
(5) | April 29, 2011 (fund inception) through March 31, 2012. |
(6) | Per-share amount was not in accord with the net realized and unrealized gain (loss) for the period because of the timing of transactions in shares of the fund and the amount and timing of per-share net realized and unrealized gain (loss) on such shares. |
(7) | Per-share amount was less than $0.005. |
(8) | July 26, 2013 (commencement of sale) through October 31, 2013. |
(9) | Portfolio turnover is calculated at the fund level. Percentage indicated was calculated for the year ended October 31, 2013. |
See Notes to Financial Statements.
Report of Independent Registered Public Accounting Firm |
To the Board of Directors and Shareholders of
American Century Capital Portfolios, Inc.:
We have audited the accompanying statement of assets and liabilities, including the schedule of investments, of Global Real Estate Fund (the “Fund”), one of the funds constituting American Century Capital Portfolios, Inc., as of October 31, 2013, and the related statement of operations for the year then ended, the statements of changes in net assets for the year then ended and for the periods from April 1, 2012 through October 31, 2012 and April 29, 2011 (fund inception) through March 31, 2012, and the financial highlights for each of the periods presented. These financial statements and financial highlights are the responsibility of the Fund’s management. Our responsibility is to express an opinion on these financial statements and financial highlights based on our audits.
We conducted our audits in accordance with the standards of the Public Company Accounting Oversight Board (United States). Those standards require that we plan and perform the audit to obtain reasonable assurance about whether the financial statements and financial highlights are free of material misstatement. The Fund is not required to have, nor were we engaged to perform, an audit of its internal control over financial reporting. Our audits included consideration of internal control over financial reporting as a basis for designing audit procedures that are appropriate in the circumstances, but not for the purpose of expressing an opinion on the effectiveness of the Fund’s internal control over financial reporting. Accordingly, we express no such opinion. An audit also includes examining, on a test basis, evidence supporting the amounts and disclosures in the financial statements, assessing the accounting principles used and significant estimates made by management, as well as evaluating the overall financial statement presentation. Our procedures included confirmation of securities owned as of October 31, 2013, by correspondence with the custodian and brokers; where replies were not received from brokers, we performed other auditing procedures. We believe that our audits provide a reasonable basis for our opinion.
In our opinion, the financial statements and financial highlights referred to above present fairly, in all material respects, the financial position of Global Real Estate Fund of American Century Capital Portfolios, Inc. as of October 31, 2013, the results of its operations for the year then ended, the changes in its net assets for the year then ended and for the periods from April 1, 2012 through October 31, 2012 and April 29, 2011 (fund inception) through March 31, 2012, and the financial highlights for each of the periods presented, in conformity with accounting principles generally accepted in the United States of America.
Deloitte & Touche LLP
Kansas City, Missouri
December 19, 2013
The Board of Directors
The individuals listed below serve as directors of the funds. Each director will continue to serve in this capacity until death, retirement, resignation or removal from office. The board has adopted a mandatory retirement age for directors who are not “interested persons,” as that term is defined in the Investment Company Act (independent directors). Independent directors shall retire by December 31 of the year in which they reach their 75th birthday. Mr. Pratt may serve until December 31 of the year in which he reaches his 76th birthday based on an extension granted under previous retirement guidelines.
Mr. Thomas is an “interested person” because he currently serves as President and Chief Executive Officer of American Century Companies, Inc. (ACC), the parent company of American Century Investment Management, Inc. (ACIM or the advisor). Mr. Fink is treated as an “interested person” because of his recent employment with ACC and American Century Services, LLC (ACS). The other directors (more than three-fourths of the total number) are independent. They are not employees, directors or officers of, and have no financial interest in, ACC or any of its wholly owned, direct or indirect, subsidiaries, including ACIM, American Century Investment Services, Inc. (ACIS) and ACS, and do not have any other affiliations, positions, or relationships that would cause them to be considered “interested persons” under the Investment Company Act. The directors serve in this capacity for seven (in the case of Mr. Thomas, 15) registered investment companies in the American Century Investments family of funds.
The following table presents additional information about the directors. The mailing address for each director is 4500 Main Street, Kansas City, Missouri 64111.
| | | | | | | |
Name
(Year of Birth) | Position(s) Held with Funds | Length
of Time Served | Principal Occupation(s) During Past 5 Years | | Number of American Century Portfolios Overseen
by Director | Other Directorships Held During Past 5 Years |
Independent Directors |
Thomas A. Brown
(1940) | Director | Since 1980 | Managing Member, Associated Investments, LLC (real estate investment company); Brown Cascade Properties, LLC (real estate investment company) (2001 to 2009) | | 75 | None |
Andrea C. Hall
(1945) | Director | Since 1997 | Retired | | 75 | None |
Jan M. Lewis
(1957) | Director | Since 2011 | President and Chief Executive Officer, Catholic Charities of Northeast Kansas (human services organization) | | 75 | None |
James A. Olson
(1942) | Director | Since 2007 | Member, Plaza Belmont LLC (private equity fund manager) | | 75 | Saia, Inc. (2002 to 2012) and
EPR Properties (2003 to 2013) |
Donald H. Pratt
(1937) | Director and Chairman of the Board | Since 1995 (Chairman since 2005) | Chairman and Chief Executive Officer, Western Investments, Inc. (real estate company) | | 75 | None |
| | | | | | | |
Name
(Year of Birth) | Position(s) Held with Funds | Length
of Time Served | Principal Occupation(s) During Past 5 Years | | Number of American Century Portfolios Overseen
by Director | Other Directorships Held During Past 5 Years |
Independent Directors |
M. Jeannine Strandjord
(1945) | Director | Since 1994 | Retired | | 75 | Euronet Worldwide Inc.; Charming Shoppes, Inc. (2006 to 2010); and DST Systems Inc. (1996 to 2012) |
John R. Whitten
(1946) | Director | Since 2008 | Retired | | 75 | Rudolph Technologies, Inc. |
Stephen E. Yates
(1948) | Director | Since 2012 | Retired; Executive Vice President, Technology & Operations, KeyCorp. (computer services) (2004 to 2010) | | 75 | Applied Industrial Technologies, Inc. (2001 to 2010) |
| | | | | | | |
Interested Directors |
Barry Fink
(1955) | Director | Since 2012 | Retired; Executive Vice President, ACC (September 2007 to February 2013); President, ACS (October
2007 to February 2013);
Chief Operating Officer,
ACC (September 2007 to November 2012) | | 75 | None |
Jonathan S.
Thomas
(1963) | Director and President | Since 2007 | President and Chief Executive Officer, ACC (March 2007 to present). Also serves as Chief Executive Officer and Manager, ACS; Executive Vice President, ACIM; Director, ACC, ACIM and other ACC subsidiaries | | 117 | None |
Officers
The following table presents certain information about the executive officers of the funds. Each officer serves as an officer for each of the 15 investment companies in the American Century family of funds, unless otherwise noted. No officer is compensated for his or her service as an officer of the funds. The listed officers are interested persons of the funds and are appointed or re-appointed on an annual basis. The mailing address for each officer listed below is 4500 Main Street, Kansas City, Missouri 64111.
| | | | |
Name
(Year of Birth) | Offices with the Funds | | Principal Occupation(s) During the Past Five Years |
Jonathan S.
Thomas
(1963) | Director and President since 2007 | | President and Chief Executive Officer, ACC (March 2007 to present). Also serves as Chief Executive Officer and Manager, ACS; Executive Vice President, ACIM; Director, ACC, ACIM and other ACC subsidiaries |
Maryanne L.
Roepke
(1956) | Chief Compliance Officer since 2006 and Senior Vice President since 2000 | | Chief Compliance Officer, American Century funds, ACIM and ACS (August 2006 to present). Also serves as Senior Vice President, ACS |
Charles A.
Etherington
(1957) | General Counsel since 2007 and Senior Vice President since 2006 | | Attorney, ACC (February 1994 to present); Vice President, ACC (November 2005 to present); General Counsel, ACC (March 2007 to present). Also serves as General Counsel, ACIM, ACS, ACIS and other ACC subsidiaries; and Senior Vice President, ACIM and ACS |
C. Jean Wade
(1964) | Vice President, Treasurer and Chief Financial Officer since 2012 | | Vice President, ACS (February 2000 to present) |
Robert J. Leach
(1966) | Vice President since 2006 and Assistant Treasurer since 2012 | | Vice President, ACS (February 2000 to present) |
David H. Reinmiller
(1963) | Vice President since 2000 | | Attorney, ACC (January 1994 to present); Associate General Counsel, ACC (January 2001 to present). Also serves as Vice President, ACIM and ACS |
Ward D. Stauffer
(1960) | Secretary since 2005 | | Attorney, ACC (June 2003 to present) |
The Statement of Additional Information has additional information about the fund’s directors and is available without charge, upon request, by calling 1-800-345-2021.
Approval of Management Agreement |
At a meeting held on June 20, 2013, the Fund’s Board of Directors unanimously approved the renewal of the management agreement pursuant to which American Century Investment Management, Inc. (the “Advisor”) acts as the investment advisor for the Fund. Under Section 15(c) of the Investment Company Act, contracts for investment advisory services are required to be reviewed, evaluated, and approved by a majority of a fund’s directors (the “Directors”), including a majority of the independent Directors, each year.
Prior to its consideration of the renewal of the management agreement, the Board requested and reviewed extensive data and information compiled by the Advisor and certain independent providers of evaluation data concerning the Fund and the services provided to the Fund by the Advisor. This review was in addition to the oversight and evaluation undertaken by the Board and its committees on a continuous basis throughout the year.
In connection with its consideration of the renewal of the management agreement, the Board’s review and evaluation of the services provided by the Advisor included, but was not limited to, the following:
• | the nature, extent, and quality of investment management, shareholder services, and other services provided by the Advisor to the Fund; |
• | the wide range of other programs and services the Advisor provides to the Fund and its shareholders on a routine and non-routine basis; |
• | the investment performance of the Fund, including data comparing the Fund’s performance to appropriate benchmarks and/or a peer group of other mutual funds with similar investment objectives and strategies; |
• | data comparing the cost of owning the Fund to the cost of owning similar funds; |
• | the Advisor’s compliance policies, procedures, and regulatory experience; |
• | financial data showing the cost of services provided to the Fund, the profitability of the Fund to the Advisor, and the overall profitability of the Advisor; |
• | possible economies of scale associated with the Advisor’s management of the Fund and other accounts under its management; |
• | data comparing services provided and charges to other investment management clients of the Advisor; and |
• | consideration of collateral benefits derived by the Advisor from the management of the Fund. |
In keeping with its practice, the Board held two in-person meetings and one telephonic meeting to review and discuss the information provided. The Directors also had the benefit of the advice of independent counsel throughout the period.
Factors Considered
The Directors considered all of the information provided by the Advisor, the independent data providers, and independent counsel, and evaluated such information for the Fund. In connection with their review, the Directors did not identify any single factor as being all-important or controlling, and each Director may have attributed different levels of importance to different factors. In deciding to renew the management agreement, the Board based its decision on a number of factors, including the following:
Nature, Extent and Quality of Services — Generally. Under the management agreement, the Advisor is responsible for providing or arranging for all services necessary for the operation of the Fund. The Board noted that under the management agreement, the Advisor provides or arranges at its own expense a wide variety of services including:
• | constructing and designing the Fund |
• | portfolio research and security selection |
• | initial capitalization/funding |
• | daily valuation of the Fund’s portfolio |
• | shareholder servicing and transfer agency, including shareholder confirmations, recordkeeping, and communications |
• | regulatory and portfolio compliance |
• | marketing and distribution |
The Board noted that many of these services have expanded over time both in terms of quantity and complexity in response to shareholder demands, competition in the industry, changing distribution channels, and the changing regulatory environment.
Investment Management Services. The nature of the investment management services provided to the Fund is quite complex and allows Fund shareholders access to professional money management, instant diversification of their investments within an asset class, the opportunity to easily diversify among asset classes by investing in or exchanging among various American Century Investments funds, and liquidity. In evaluating investment performance, the Board expects the Advisor to manage the Fund in accordance with its investment objectives and
approved strategies. Further, the Directors recognize that the Advisor has an obligation to monitor trading activities, and in particular to seek the best execution of fund trades, and to evaluate the use of and payment for research. In providing these services, the Advisor utilizes teams of investment professionals (portfolio managers, analysts, research assistants, and securities traders) who require extensive information technology, research, training, compliance and other systems to conduct their business. The Board, directly and through its Fund Performance Review Committee, regularly reviews investment performance information for the Fund, together with comparative information for appropriate benchmarks and/or peer groups of similarly-managed funds, over different time horizons. The Directors also review detailed performance information during the management agreement approval process. If performance concerns are identified, the Fund receives special reviews until performance improves, during which the Board discusses with the Advisor the reasons for such results (e.g., market conditions, security selection) and any efforts being undertaken to improve performance. Taking all these factors into consideration, the Board found the investment management services provided by the Advisor to the Fund to meet or exceed industry standards. More detailed information about the Fund’s performance can be found in the Performance and Portfolio Commentary sections of this report.
Shareholder and Other Services. Under the management agreement, the Advisor provides the Fund with a comprehensive package of transfer agency, shareholder, and other services. The Board, directly and through various committees of the Board, regularly reviews reports and evaluations of such services at its regular meetings. These reports include, but are not limited to, information regarding the operational efficiency and accuracy of the shareholder and transfer agency services provided, staffing levels, shareholder satisfaction (as measured by external as well as internal sources), technology support, new products and services offered to Fund shareholders, securities trading activities, portfolio valuation services, auditing services, and legal and operational compliance activities. Certain aspects of shareholder and transfer agency service level efficiency and the quality of securities trading activities are measured by independent third party providers and are presented in comparison to other fund groups not managed by the Advisor. The Board found the services provided by the Advisor to the Fund under the management agreement to be competitive and of high quality.
Costs of Services and Profitability. The Advisor provides detailed information concerning its cost of providing various services to the Fund, its profitability in managing the Fund, its overall profitability, and its financial condition. The Directors have reviewed with the Advisor the methodology used to prepare this financial information. The financial information regarding the Advisor is considered in evaluating the Advisor’s financial condition, its ability to continue to provide services under the management agreement, and the reasonableness of the current management fee. The Board concluded that the Advisor’s profits were reasonable in light of the services provided to the Fund.
Ethics. The Board generally considers the Advisor’s commitment to providing quality services to shareholders and to conducting its business ethically. They noted that the Advisor’s practices generally meet or exceed industry best practices.
Economies of Scale. The Board also reviewed information provided by the Advisor regarding the possible existence of economies of scale in connection with the management of the Fund. The Board concluded that economies of scale are difficult to measure and predict with precision, especially on a fund-by-fund basis. The Board concluded that the Advisor is appropriately sharing economies of scale through its competitive fee structure, offering competitive fees from fund inception, and through reinvestment in its business to provide shareholders additional content and services.
Comparison to Other Funds’ Fees. The management agreement provides that the Fund pay the Advisor a single, all-inclusive (or unified) management fee for providing all services necessary for the management and operation of the Fund, other than brokerage expenses, taxes, interest, extraordinary expenses, and the fees and expenses of the Fund’s independent directors (including their independent legal counsel) and expenses incurred in connection with the provision of shareholder services and distribution services under a plan adopted pursuant to Rule 12b-1 under the 1940 Act. Under the unified fee structure, the Advisor is responsible for providing all investment advisory, custody, audit, administrative, compliance, recordkeeping, marketing and shareholder services, or arranging and supervising third parties to provide such services. By contrast, most other funds are charged a variety of fees, including an investment advisory fee, a transfer agency fee, an administrative fee, distribution charges and other expenses. Other than their investment advisory fees and any applicable Rule 12b-1 distribution fees, all other components of the total fees charged by these other funds may be increased without shareholder approval. The Board believes the unified fee structure is a benefit to Fund shareholders because it clearly discloses to shareholders the cost of owning Fund shares, and, since the unified fee cannot be increased without a vote of Fund shareholders, it shifts to the Advisor the risk of increased costs of operating the Fund and provides a direct incentive to minimize administrative inefficiencies. Part of the Board’s analysis of fee levels involves reviewing certain evaluative data compiled by an independent provider and comparing the Fund’s unified fee to the total expense ratio of other funds in the Fund’s peer group. The Board concluded that the management fee paid by the Fund to the Advisor under the management agreement is reasonable in light of the services provided to the Fund.
Comparison to Fees and Services Provided to Other Clients of the Advisor. The Board also requested and received information from the Advisor concerning the nature of the services, fees, costs and profitability of its advisory services to advisory clients other than the Fund. They observed that these varying types of client accounts require different services and involve different regulatory and entrepreneurial risks than the management of the Fund. The Board analyzed this information and concluded that the fees charged and services provided to the Fund were reasonable by comparison.
Collateral or “Fall-Out” Benefits Derived by the Advisor. The Board considered the existence of collateral benefits the Advisor may receive as a result of its relationship with the Fund. They concluded that the Advisor’s primary business is managing mutual funds and it generally does not use fund or shareholder information to generate profits in other lines of business, and therefore does not derive any significant collateral benefits from them. The Board noted that the Advisor receives proprietary research from broker-dealers that execute fund portfolio transactions and concluded that this research is likely to benefit Fund
shareholders. The Board also determined that the Advisor is able to provide investment management services to certain clients other than the Fund, at least in part, due to its existing infrastructure built to serve the fund complex. The Board concluded, however, that the assets of those other clients are not material to the analysis and, where applicable, may be included with the assets of the Fund to determine breakpoints in the management fee schedule.
Existing Relationship. The Board also considered whether there was any reason for not continuing the existing arrangement with the Advisor. In this regard, the Board was mindful of the potential disruptions of the Fund’s operations and various risks, uncertainties, and other effects that could occur as a result of a decision not to continue such relationship. In particular, the Board recognized that most shareholders have invested in the Fund on the strength of the Advisor’s industry standing and reputation and in the expectation that the Advisor will have a continuing role in providing advisory services to the Fund.
Conclusion of the Directors. As a result of this process, the Board, including all of the independent directors, taking into account all of the factors discussed above and the information provided by the Advisor and others, concluded that the management agreement between the Fund and the Advisor is fair and reasonable in light of the services provided and should be renewed.
Retirement Account Information
As required by law, distributions you receive from certain IRAs are subject to federal income tax withholding, unless you elect not to have withholding apply. Tax will be withheld on the total amount withdrawn even though you may be receiving amounts that are not subject to withholding, such as nondeductible contributions. In such case, excess amounts of withholding could occur. You may adjust your withholding election so that a greater or lesser amount will be withheld.
If you don’t want us to withhold on this amount, you must notify us to not withhold the federal income tax. You may notify us in writing or in certain situations by telephone or through other electronic means. For systematic withdrawals, your withholding election will remain in effect until revoked or changed by filing a new election. You have the right to revoke your election at any time.
Remember, even if you elect not to have income tax withheld, you are liable for paying income tax on the taxable portion of your withdrawal. If you elect not to have income tax withheld or you don’t have enough income tax withheld, you may be responsible for payment of estimated tax. You may incur penalties under the estimated tax rules if your withholding and estimated tax payments are not sufficient. You can reduce or defer the income tax on a distribution by directly or indirectly rolling such distribution over to another IRA or eligible plan. You should consult your tax advisor for additional information.
State tax will be withheld if, at the time of your distribution, your address is within one of the mandatory withholding states and you have federal income tax withheld (or as otherwise required by state law). State taxes will be withheld from your distribution in accordance with the respective state rules.
Distributions you receive from 403(b), 457 and qualified plans are subject to special tax and withholding rules. Your plan administrator or plan sponsor is required to provide you with a special tax notice explaining those rules at the time you request a distribution. If applicable, federal and/or state taxes may be withheld from your distribution amount.
Proxy Voting Policies
A description of the policies that the fund’s investment advisor uses in exercising the voting rights associated with the securities purchased and/or held by the fund is available without charge, upon request, by calling 1-800-345-2021. It is also available on the “About Us” page of American Century Investments’ website at americancentury.com and on the Securities and Exchange Commission’s website at sec.gov. Information regarding how the investment advisor voted proxies relating to portfolio securities during the most recent 12-month period ended June 30 is available on the “About Us” page at americancentury.com. It is also available at sec.gov.
Quarterly Portfolio Disclosure
The fund files its complete schedule of portfolio holdings with the Securities and Exchange Commission (SEC) for the first and third quarters of each fiscal year on Form N-Q. The fund’s Forms N-Q are available on the SEC’s website at sec.gov, and may be reviewed and copied at the SEC’s Public Reference Room in Washington, DC. Information on the operation of the Public Reference Room may be obtained by calling 1-800-SEC-0330. The fund also makes its complete schedule of portfolio holdings for the most recent quarter of its fiscal year available on its website at americancentury.com and, upon request, by calling 1-800-345-2021.
Other Tax Information
The following information is provided pursuant to provisions of the Internal Revenue Code.
The fund hereby designates up to the maximum amount allowable as qualified dividend income for the fiscal year ended October 31, 2013.
For corporate taxpayers, the fund hereby designates $28,367, or up to the maximum amount allowable, of ordinary income distributions paid during the fiscal year ended October 31, 2013 as qualified for the corporate dividends received deduction.
The fund hereby designates $8,798, or up to the maximum amount allowable, as long-term capital gain distributions for the fiscal year ended October 31, 2013.
The fund hereby designates $802,903 as qualified short-term capital gain distributions for purposes of Internal Revenue Code Section 871.
Contact Us | americancentury.com |
Automated Information Line | 1-800-345-8765 |
Investor Services Representative | 1-800-345-2021
or 816-531-5575 |
Investors Using Advisors | 1-800-378-9878 |
Business, Not-For-Profit, Employer-Sponsored Retirement Plans | 1-800-345-3533 |
Banks and Trust Companies, Broker-Dealers, Financial Professionals, Insurance Companies | 1-800-345-6488 |
Telecommunications Device for the Deaf | 1-800-634-4113 |
American Century Capital Portfolios, Inc.
Investment Advisor:
American Century Investment Management, Inc.
Kansas City, Missouri
This report and the statements it contains are submitted for the general information of our shareholders. The report is not authorized for distribution to prospective investors unless preceded or accompanied by an effective prospectus.
©2013 American Century Proprietary Holdings, Inc. All rights reserved.
CL-ANN-80474 1312
ANNUAL REPORT | OCTOBER 31, 2013
Real Estate Fund
President’s Letter | 2 |
Independent Chairman’s Letter | 3 |
Market Perspective | 4 |
Performance | 5 |
Portfolio Commentary | 7 |
Fund Characteristics | 9 |
Shareholder Fee Example | 10 |
Schedule of Investments | 12 |
Statement of Assets and Liabilities | 14 |
Statement of Operations | 15 |
Statement of Changes in Net Assets | 16 |
Notes to Financial Statements | 17 |
Financial Highlights | 23 |
Report of Independent Registered Public Accounting Firm | 26 |
Management | 27 |
Approval of Management Agreement | 30 |
Additional Information | 35 |
Any opinions expressed in this report reflect those of the author as of the date of the report, and do not necessarily represent the opinions of American Century Investments® or any other person in the American Century Investments organization. Any such opinions are subject to change at any time based upon market or other conditions and American Century Investments disclaims any responsibility to update such opinions. These opinions may not be relied upon as investment advice and, because investment decisions made by American Century Investments funds are based on numerous factors, may not be relied upon as an indication of trading intent on behalf of any American Century Investments fund. Security examples are used for representational purposes only and are not intended as recommendations to purchase or sell securities. Performance information for comparative indices and securities is provided to American Century Investments by third party vendors. To the best of American Century Investments’ knowledge, such information is accurate at the time of printing.
Jonathan Thomas
Dear Investor:
Thank you for reviewing this annual report for the 12 months ended October 31, 2013. It provides investment performance, market analysis, and portfolio information, presented with the expert perspective of our portfolio management team.
Annual reports remain important vehicles for conveying information about fund returns, including key factors that affected fund performance. For additional, updated investment and market insights, we encourage you to visit our website, americancentury.com.
Federal Reserve (Fed) Policy-Driven Financial Markets
U.S. stock indices and government bond yields traced similar upward tracks during most of the reporting period, driven by Fed policy and the perceived path of future Fed policy decisions. In September 2012, the Fed announced its third round of quantitative easing (QE3) since the 2008 Financial Crisis, consisting of $85 billion of monthly purchases of U.S. Treasury and mortgage-backed securities. We believe QE3, like its predecessors, helped stimulate the U.S. stock market. Encouraging signs also emerged in the long-depressed U.S. housing and job markets, which supported stocks. The S&P 500 Index advanced 27.18%, a modest gain compared with U.S. mid- and small-cap indices, which posted returns in the 33% to 40% range.
The U.S. stock rally surmounted many obstacles, including the year-end 2012 fiscal cliff, the 2013 fiscal sequester, Congressional discord (over the Affordable Care Act, the federal budget, and the federal debt ceiling), the resulting partial government shutdown, and higher long-term interest rates. Indications of sustainable economic growth and hints from the Fed that it might taper QE3 sent bond yields soaring from May to September. The 10-year Treasury yield reached 3.00% before retreating to finish the reporting period at 2.55%, still well above where it began (at 1.69%). Bond yields declined in September and October on softer economic data, the Fed’s announcement that it would delay tapering, and uncertainty caused by the government shutdown.
A full economic recovery from 2008 remains elusive—economic growth is still subpar compared with past recoveries. In this environment, we continue to believe in a disciplined, diversified, long-term investment approach, using professionally managed stock and bond portfolios—as appropriate—for meeting financial goals. We appreciate your continued trust in us under these challenging conditions.
Sincerely,
Jonathan Thomas
President and Chief Executive Officer
American Century Investments
Independent Chairman’s Letter |
Don Pratt
Dear Fellow Shareholders,
This is my last letter to shareholders as the funds’ Chairman, as I will retire at the end of 2013.
My personal thanks go to the independent directors that elected me to the Board and subsequently to the Chairman position, and with whom I have worked to reorganize the Board’s committee structure and annually improve our governance processes. Throughout my tenure, the Board has addressed its responsibilities to shareholders diligently in committee work, the annual contract review, and the execution of our oversight responsibilities. I expect that it will continue to do so well into the future.
Thanks also to the American Century Investments management team led by Jonathan Thomas. Its transparency, candor, and open communication with the Board is most appreciated. I have served on more than 20 boards and this is the most productive and enjoyable relationship with management I have experienced.
Finally, thanks to the many shareholders who have written with questions, comments, and suggestions. Each was heard and addressed and enabled the Board to better represent your interests. Keep communicating with us so that the Board can continue to be aware of your interests, concerns, and questions. My best wishes to Jim Olson, my successor as Chairman, and the other independent directors who continue to serve on your behalf.
And remember, as the firm’s founder Jim Stowers, Jr. so often observed, “The best is yet to be.”
Best regards,
Don Pratt
By Phil Davidson, Chief Investment Officer, U.S. Value Equity
U.S. Stocks Rallied to Post Double-Digit Gains
Stock market performance remained robust during the 12-month period ended October 31, 2013, with all major market indices posting strong double-digit gains. Despite persistent concerns about weak global growth and U.S. fiscal policy, investors largely focused on central bank stimulus measures, marginally improving U.S. economic data, and relatively healthy corporate earnings, which fueled stock market optimism.
Prior to the reporting period, the Federal Reserve (the Fed) announced its third quantitative easing program (QE3), which ultimately became an $85 billion, open-ended monthly bond-buying effort. This unprecedented program, combined with largely favorable corporate earnings, significant housing market gains, and modest improvements in the labor market, generally helped keep stocks and other riskier assets in favor.
Overall, small-cap stocks outperformed their mid- and large-cap counterparts. We believe this reflected the market’s risk preferences and greater optimism in U.S. economic growth prospects versus the broad global economy.
Fed Policy Challenging for Rate-Sensitive Sectors
Although all major sectors of the domestic stock market advanced during the 12-month period, interest-rate-sensitive segments, including real estate investment trusts (REITs), utilities, and telecommunication services, generally underperformed the broad market averages. This primarily was due to uncertainty surrounding future Fed policy, which dominated the market backdrop, particularly in the second half of the period.
Beginning in spring 2013, modest economic gains led to fears the Fed would end QE3 sooner than expected. The Fed helped fuel those fears, indicating it may start tapering its monthly bond purchases later in the year. In response, interest rates soared as investors expected the Fed to begin tapering after its September policy meeting. But Fed policymakers quickly backed down, announcing they would continue the current pace of bond buying until economic gains appear sustainable.
This news sparked a turnaround among REITs and other interest-rate-sensitive stocks, but the late-period gains weren’t sufficient to offset previous underperformance. In addition, the preference for riskier assets generally prevailed throughout the period, which put further pressure on higher-quality, yield-generating securities.
U.S. Stock Index Returns | | | | |
For the 12 months ended October 31, 2013 |
Russell 1000 Index (Large-Cap) | 28.40% | | Russell 2000 Index (Small-Cap) | 36.28% |
Russell 1000 Growth Index | 28.30% | | Russell 2000 Growth Index | 39.84% |
Russell 1000 Value Index | 28.29% | | Russell 2000 Value Index | 32.83% |
Russell Midcap Index | 33.79% | | | |
Russell Midcap Growth Index | 33.93% | | | |
Russell Midcap Value Index | 33.45% | | | |
Total Returns as of October 31, 2013 |
| | | | Average Annual Returns | |
| | Ticker Symbol | 1 year | 5 years | 10 years | Since Inception | Inception Date |
Investor Class | REACX | 9.04% | 14.38% | 8.92% | 11.09% | 9/21/95(1) |
MSCI U.S. REIT Index | — | 11.42% | 15.29% | 9.76% | 10.79% | — |
S&P 500 Index | — | 27.18% | 15.16% | 7.45% | 8.22% | — |
Institutional Class | REAIX | 9.23% | 14.61% | 9.14% | 9.51% | 6/16/97 |
A Class(2) No sales charge* With sales charge* | AREEX | 8.77% 2.50% | 14.09% 12.76% | 8.66% 8.02% | 10.61% 10.17% | 10/6/98 |
C Class | ARYCX | 7.93% | 13.25% | — | 0.85% | 9/28/07 |
R Class | AREWX | 8.50% | 13.80% | — | 1.35% | 9/28/07 |
R6 Class | AREDX | — | — | — | -1.77%(3) | 7/26/13 |
*Sales charges include initial sales charges and contingent deferred sales charges (CDSCs), as applicable. A Class shares have a 5.75% maximum initial sales charge and may be subject to a maximum CDSC of 1.00%. C Class shares redeemed within 12 months of purchase are subject to a maximum CDSC of 1.00%. The SEC requires that mutual funds provide performance information net of maximum sales charges in all cases where charges could be applied.
(1) | The inception date for RREEF Real Estate Securities Fund, Real Estate’s predecessor. That fund merged with Real Estate on 6/13/97 and Real Estate was first offered to the public on 6/16/97. |
(2) | Prior to September 4, 2007, the A Class was referred to as the Advisor Class and did not have a front-end sales charge. Performance prior to that date has been adjusted to reflect this charge. |
(3) | Total returns for periods less than one year are not annualized. |
Data presented reflect past performance. Past performance is no guarantee of future results. Current performance may be higher or lower than the performance shown. Investment return and principal value will fluctuate, and redemption value may be more or less than original cost. To obtain performance data current to the most recent month end, please call 1-800-345-2021 or visit americancentury.com. The fund may be subject to certain risks similar to those associated with direct investment in real estate. The fund’s investment process may result in high portfolio turnover, which could mean high transaction costs, affecting both performance and capital gains tax liabilities to investors.
Unless otherwise indicated, performance reflects Investor Class shares; performance for other share classes will vary due to differences in fee structure. For information about other share classes available, please consult the prospectus. Data assumes reinvestment of dividends and capital gains, and none of the charts reflect the deduction of taxes that a shareholder would pay on fund distributions or the redemption of fund shares. Returns for the indices are provided for comparison. The fund’s total returns include operating expenses (such as transaction costs and management fees) that reduce returns, while the total returns of the indices do not.
Growth of $10,000 Over 10 Years |
$10,000 investment made October 31, 2003 |
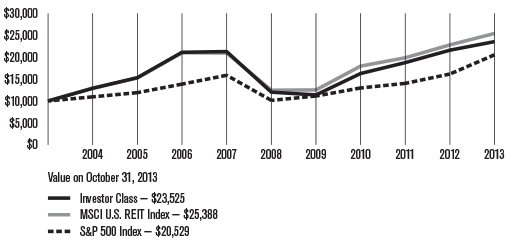
Total Annual Fund Operating Expenses | |
Investor Class | Institutional Class | A Class | C Class | R Class | R6 Class |
1.15% | 0.95% | 1.40% | 2.15% | 1.65% | 0.80% |
The total annual fund operating expenses shown is as stated in the fund’s prospectus current as of the date of this report. The prospectus may vary from the expense ratio shown elsewhere in this report because it is based on a different time period, includes acquired fund fees and expenses, and, if applicable, does not include fee waivers or expense reimbursements.
Data presented reflect past performance. Past performance is no guarantee of future results. Current performance may be higher or lower than the performance shown. Investment return and principal value will fluctuate, and redemption value may be more or less than original cost. To obtain performance data current to the most recent month end, please call 1-800-345-2021 or visit americancentury.com. The fund may be subject to certain risks similar to those associated with direct investment in real estate. The fund’s investment process may result in high portfolio turnover, which could mean high transaction costs, affecting both performance and capital gains tax liabilities to investors.
Unless otherwise indicated, performance reflects Investor Class shares; performance for other share classes will vary due to differences in fee structure. For information about other share classes available, please consult the prospectus. Data assumes reinvestment of dividends and capital gains, and none of the charts reflect the deduction of taxes that a shareholder would pay on fund distributions or the redemption of fund shares. Returns for the indices are provided for comparison. The fund’s total returns include operating expenses (such as transaction costs and management fees) that reduce returns, while the total returns of the indices do not.
Portfolio Managers: Steven Brown and Steven Rodriguez
Performance Summary
Real Estate returned 9.04%* for the fiscal year ended October 31, 2013. By comparison, the MSCI U.S. REIT Index (the fund’s benchmark) returned 11.42%, while the S&P 500 Index (a broad stock market measure) returned 27.18%. (See pages 5 and 6 for additional performance comparisons.)
REIT Market Overview
Real estate investment trusts (REITs) posted solid gains for the reporting period, but they trailed the performance of the broad equity market indices (see page 4 for more details). REITs rallied sharply during the first half of the period as strong demand for yield provided a lift to income-oriented segments of the stock market, including REITs. Improving economic conditions and efforts by the Federal Reserve (Fed) to stimulate the economy—including expanding its quantitative easing activity in late 2012—also provided a favorable backdrop for the commercial property sector.
However, REITs gave back some gains over the last half of the period. In May 2013, the Fed announced that it planned to taper its quantitative easing measures before year-end, which pushed bond yields higher and sparked a sell-off in income-oriented investments (including REITs) throughout the summer months. The REIT market finished the period on a positive note, rebounding over the last six weeks of the period after the Fed decided to delay its tapering plans until better economic conditions resumed.
From a sector perspective, the top performers in the REIT market included hotel, self-storage, and industrial REITs, each of which posted returns of more than 20% for the 12-month period. Hotel REITs, which have the highest correlation with improving economic conditions and the shortest lease durations, generated the best returns. Self-storage REITs benefited from favorable supply-and-demand characteristics, while growing demand for warehouse space provided a lift to the industrial sector.
Laggards in the REIT market included apartment REITs, which faced an increase in supply of rental units, as well as concerns that a recovery in the single-family housing market would lead to lower demand for apartments. Retail REITs underperformed after a very strong advance in 2012 as tenant sales growth decelerated.
Health Care and Retail REITs Detracted
The fund’s underperformance of its benchmark was driven largely by stock selection among health care and retail REITs. One of the most significant individual detractors in the portfolio was Taubman Centers, which owns regional shopping malls in major metropolitan areas. Taubman reported lower-than-expected earnings in mid-2013, which led to a decline in the stock. We reduced the fund’s holdings of the stock late in the period, but it remained a small position in the portfolio as of the end of the period.
*All fund returns referenced in this commentary are for Investor Class shares.
In the health care sector, one of the biggest detractors was a missed opportunity—Omega Healthcare Investors, a stock represented in the index but not held in the portfolio for much of the period. Omega, which owns long-term care facilities, gained more than 50% for the reporting period as the company delivered strong earnings growth and an attractive dividend yield. We added the stock to the portfolio in the last few weeks of the period.
Another significant individual detractor in the portfolio was office REIT Boston Properties, which owns high-quality properties in the central business districts of major cities along the East Coast and in Northern California. Timing led to the underperformance in Boston Properties—the fund held an overweight position in the first half of the period, when weaker occupancy levels in the company’s core markets led to lagging results, and an underweight position when the stock rebounded later in the period thanks to increased demand for higher-quality REITs with less interest-rate sensitivity.
Mortgage and Hotel REITs Added Value
The fund’s exposure to mortgage REITs, which are not represented in the benchmark, and an overweight position in hotel REITs contributed positively to relative results. One of the leading individual performance contributors was mortgage REIT Newcastle Investment, which benefited from acquisitions of highly profitable mortgage servicing rights (MSRs). During the second quarter, Newcastle spun off its MSR unit into another mortgage REIT, New Residential Investment, which the fund kept while eliminating its position in Newcastle. We believe the spin-off company will benefit from higher interest rates and rising home values.
The top contributors in the hotel sector included casino operator Las Vegas Sands and hotel chain Wyndham Worldwide. Las Vegas Sands enjoyed better-than-expected gaming trends in Macau, a Chinese territory whose economy is driven mainly by gaming and tourism. Wyndham benefited from a recovery in its lodging business and strong free cash flow generation from its vacation ownership and exchange businesses.
Outlook
After underperforming the broad stock market for much of the past year, REITs appear attractively valued. We expect the combination of reasonable valuations, improving commercial real estate fundamentals, and continued growth in per-share dividends to be a tailwind for REIT performance over the next 12 months. Although economic growth has been moderate, the economy is still growing at a faster rate than new supply, which is expected to hover around 1% in most commercial property markets over the next 12 months. In this environment, we expect occupancy levels to increase and REITs to have pricing power that is greater than the inflation rate.
Given this outlook, the fund holds overweight positions in cyclical property sectors, as well as sectors with the most favorable fundamental characteristics. These include the regional mall, lodging, and industrial sectors. In contrast, the portfolio holds underweight positions in the most defensive sectors of the REIT market, such as health care and triple-net lease.
OCTOBER 31, 2013 | |
Top Ten Holdings | % of net assets |
Simon Property Group, Inc. | 10.2% |
Ventas, Inc. | 5.0% |
Prologis, Inc. | 4.9% |
Health Care REIT, Inc. | 4.5% |
Public Storage | 3.7% |
Boston Properties, Inc. | 3.2% |
General Growth Properties, Inc. | 3.1% |
Vornado Realty Trust | 3.1% |
HCP, Inc. | 3.1% |
Equity Residential | 2.6% |
| | |
Sub-Industry Allocation | % of net assets |
Retail REITs | 29.9% |
Specialized REITs | 24.7% |
Office REITs | 12.9% |
Residential REITs | 11.5% |
Industrial REITs | 8.0% |
Diversified REITs | 6.7% |
Hotels, Resorts and Cruise Lines | 2.0% |
Real Estate Operating Companies | 1.6% |
Casinos and Gaming | 0.7% |
Asset Management and Custody Banks | 0.7% |
Mortgage REITs | 0.5% |
Diversified Real Estate Activities | 0.2% |
Cash and Equivalents* | 0.6% |
*Includes temporary cash investments and other assets and liabilities. |
| | |
Types of Investments in Portfolio | % of net assets |
Common Stocks | 99.4% |
Temporary Cash Investments | 1.4% |
Other Assets and Liabilities | (0.8)% |
Fund shareholders may incur two types of costs: (1) transaction costs, including sales charges (loads) on purchase payments and redemption/exchange fees; and (2) ongoing costs, including management fees; distribution and service (12b-1) fees; and other fund expenses. This example is intended to help you understand your ongoing costs (in dollars) of investing in your fund and to compare these costs with the ongoing cost of investing in other mutual funds.
The example is based on an investment of $1,000 made at the beginning of the period and held for the entire period from May 1, 2013 to October 31, 2013 (except as noted).
Actual Expenses
The table provides information about actual account values and actual expenses for each class. You may use the information, together with the amount you invested, to estimate the expenses that you paid over the period. First, identify the share class you own. Then simply divide your account value by $1,000 (for example, an $8,600 account value divided by $1,000 = 8.6), then multiply the result by the number under the heading “Expenses Paid During Period” to estimate the expenses you paid on your account during this period.
If you hold Investor Class shares of any American Century Investments fund, or Institutional Class shares of the American Century Diversified Bond Fund, in an American Century Investments account (i.e., not a financial intermediary or retirement plan account), American Century Investments may charge you a $12.50 semiannual account maintenance fee if the value of those shares is less than $10,000. We will redeem shares automatically in one of your accounts to pay the $12.50 fee. In determining your total eligible investment amount, we will include your investments in all personal accounts (including American Century Investments Brokerage accounts) registered under your Social Security number. Personal accounts include individual accounts, joint accounts, UGMA/UTMA accounts, personal trusts, Coverdell Education Savings Accounts and IRAs (including traditional, Roth, Rollover, SEP-, SARSEP- and SIMPLE-IRAs), and certain other retirement accounts. If you have only business, business retirement, employer-sponsored or American Century Investments Brokerage accounts, you are currently not subject to this fee. If you are subject to the Account Maintenance Fee, your account value could be reduced by the fee amount.
Hypothetical Example for Comparison Purposes
The table also provides information about hypothetical account values and hypothetical expenses based on the actual expense ratio of each class of your fund and an assumed rate of return of 5% per year before expenses, which is not the actual return of a fund’s share class. The hypothetical account values and expenses may not be used to estimate the actual ending account balance or expenses you paid for the period. You may use this information to compare the ongoing costs of investing in your fund and other funds. To do so, compare this 5% hypothetical example with the 5% hypothetical examples that appear in the shareholder reports of the other funds.
Please note that the expenses shown in the table are meant to highlight your ongoing costs only and do not reflect any transactional costs, such as sales charges (loads) or redemption/exchange fees. Therefore, the table is useful in comparing ongoing costs only, and will not help you determine the relative total costs of owning different funds. In addition, if these transactional costs were included, your costs would have been higher.
| | Beginning
Account Value 5/1/13 | Ending
Account Value 10/31/13 | Expenses Paid During Period(1) 5/1/13 — 10/31/13 | Annualized
Expense Ratio(1) |
Actual | | | | |
Investor Class | $1,000 | $939.50 | $5.57 | 1.14% |
Institutional Class | $1,000 | $940.20 | $4.60 | 0.94% |
A Class | $1,000 | $938.30 | $6.79 | 1.39% |
C Class | $1,000 | $934.60 | $10.44 | 2.14% |
R Class | $1,000 | $937.30 | $8.01 | 1.64% |
R6 Class | $1,000 | $982.30(2) | $2.10(3) | 0.79% |
Hypothetical | | | | |
Investor Class | $1,000 | $1,019.46 | $5.80 | 1.14% |
Institutional Class | $1,000 | $1,020.47 | $4.79 | 0.94% |
A Class | $1,000 | $1,018.20 | $7.07 | 1.39% |
C Class | $1,000 | $1,014.42 | $10.87 | 2.14% |
R Class | $1,000 | $1,016.94 | $8.34 | 1.64% |
R6 Class | $1,000 | $1,021.22(4) | $4.02(4) | 0.79% |
(1) | Expenses are equal to the class’s annualized expense ratio listed in the table above, multiplied by the average account value over the period, multiplied by 184, the number of days in the most recent fiscal half-year, divided by 365, to reflect the one-half year period. |
(2) | Ending account value based on actual return from July 26, 2013 (commencement of sale) through October 31, 2013. |
(3) | Expenses are equal to the class’s annualized expense ratio listed in the table above, multiplied by the average account value over the period, multiplied by 98, the number of days in the period from July 26, 2013 (commencement of sale) through October 31, 2013, divided by 365, to reflect the period. Had the class been available for the full period, the expenses paid during the period would have been higher. |
(4) | Ending account value and expenses paid during the period assumes the class had been available throughout the entire period and are calculated using the class’s annualized expense ratio listed in the table above. |
OCTOBER 31, 2013
| | | | | | | |
| | | Shares | | | Value | |
Common Stocks — 99.4% | |
ASSET MANAGEMENT AND CUSTODY BANKS — 0.7% | |
Blackstone Group LP | | 397,100 | | | $ 10,435,788 | |
CASINOS AND GAMING — 0.7% | |
Las Vegas Sands Corp. | | 157,400 | | | 11,052,628 | |
DIVERSIFIED REAL ESTATE ACTIVITIES — 0.2% | |
Countrywide plc | | 396,517 | | | 3,547,624 | |
DIVERSIFIED REITs — 6.7% | |
Cousins Properties, Inc. | | 1,564,400 | | | 17,724,652 | |
Empire State Realty Trust, Inc.(1) | | 711,700 | | | 10,070,555 | |
Spirit Realty Capital, Inc. | | 2,398,300 | | | 25,086,218 | |
Vornado Realty Trust | | 520,700 | | | 46,373,542 | |
| | | | | | 99,254,967 | |
HOTELS, RESORTS AND CRUISE LINES — 2.0% | |
Starwood Hotels & Resorts Worldwide, Inc. | | 202,200 | | | 14,885,964 | |
Wyndham Worldwide Corp. | | 226,400 | | | 15,032,960 | |
| | | | | | 29,918,924 | |
INDUSTRIAL REITs — 8.0% | |
DCT Industrial Trust, Inc. | | 3,621,600 | | | 28,067,400 | |
First Industrial Realty Trust, Inc. | | 993,900 | | | 17,959,773 | |
Prologis, Inc. | | 1,834,100 | | | 73,272,295 | |
| | | | | | 119,299,468 | |
MORTGAGE REITs — 0.5% | |
New Residential Investment Corp. | | 1,094,800 | | | 7,236,628 | |
OFFICE REITs — 12.9% | | | | | | |
Boston Properties, Inc. | | 456,300 | | | 47,227,050 | |
Digital Realty Trust, Inc. | | 376,274 | | | 17,933,219 | |
Douglas Emmett, Inc. | | 987,700 | | | 24,623,361 | |
Duke Realty Corp. | | 1,210,900 | | | 20,064,613 | |
Hudson Pacific Properties, Inc. | | 182,900 | | | 3,784,201 | |
Kilroy Realty Corp. | | 686,000 | | | 36,467,760 | |
Parkway Properties, Inc. | | 937,600 | | | 16,979,936 | |
SL Green Realty Corp. | | 255,400 | | | 24,153,178 | |
| | | | | | 191,233,318 | |
REAL ESTATE OPERATING COMPANIES — 1.6% | |
Forest City Enterprises, Inc. Class A(1) | | 1,158,700 | | | 23,475,262 | |
RESIDENTIAL REITs — 11.5% | |
Apartment Investment & Management Co., Class A | | 719,300 | | | 20,126,014 | |
AvalonBay Communities, Inc. | | 254,800 | | | 31,862,740 | |
BRE Properties, Inc. | | 455,200 | | | 24,858,472 | |
Equity Residential | | 745,600 | | | 39,039,616 | |
Essex Property Trust, Inc. | | 201,000 | | | 32,361,000 | |
Post Properties, Inc. | | 292,500 | | | 13,378,950 | |
UDR, Inc. | | 357,300 | | | 8,864,613 | |
| | | | | | 170,491,405 | |
RETAIL REITs — 29.9% | | | | | | |
Acadia Realty Trust | | 431,700 | | | 11,513,439 | |
Brixmor Property Group, Inc.(1) | | 73,492 | | | 1,517,610 | |
CBL & Associates Properties, Inc. | | 599,400 | | | 11,874,114 | |
DDR Corp. | | 1,924,200 | | | 32,615,190 | |
Equity One, Inc. | | 690,700 | | | 16,652,777 | |
Federal Realty Investment Trust | | 277,600 | | | 28,759,360 | |
General Growth Properties, Inc. | | 2,207,100 | | | 46,856,733 | |
Kimco Realty Corp. | | 1,226,600 | | | 26,347,368 | |
Macerich Co. (The) | | 656,600 | | | 38,877,286 | |
National Retail Properties, Inc. | | 768,800 | | | 26,446,720 | |
Realty Income Corp. | | 352,200 | | | 14,669,130 | |
Regency Centers Corp. | | 270,400 | | | 13,968,864 | |
Simon Property Group, Inc. | | 980,600 | | | 151,551,730 | |
Taubman Centers, Inc. | | 79,700 | | | 5,243,463 | |
Weingarten Realty Investors | | 567,500 | | | 18,006,775 | |
| | | | | | 444,900,559 | |
SPECIALIZED REITs — 24.7% | |
CubeSmart | | 935,700 | | | 17,095,239 | |
Extra Space Storage, Inc. | | 490,300 | | | 22,548,897 | |
HCP, Inc. | | 1,097,700 | | | 45,554,550 | |
Health Care REIT, Inc. | | 1,036,900 | | | 67,242,965 | |
Host Hotels & Resorts, Inc. | | 1,621,300 | | | 30,075,115 | |
Omega Healthcare Investors, Inc. | | 223,100 | | | 7,415,844 | |
Pebblebrook Hotel Trust | | 471,600 | | | 14,242,320 | |
Public Storage | | 328,200 | | | 54,799,554 | |
RLJ Lodging Trust | | 876,900 | | | 22,150,494 | |
Sunstone Hotel Investors, Inc. | | 976,300 | | | 12,935,975 | |
Ventas, Inc. | | 1,137,000 | | | 74,177,880 | |
| | | | | | 368,238,833 | |
TOTAL COMMON STOCKS (Cost $1,103,359,888) | | | 1,479,085,404 | |
| | | | | |
| | | | Value | |
Temporary Cash Investments — 1.4% | |
Repurchase Agreement, Bank of America Merrill Lynch, (collateralized by various U.S. Treasury obligations, 1.25%, 10/31/18, valued at $4,327,145), in a joint trading account at 0.07%, dated 10/31/13, due 11/1/13 (Delivery value $4,247,263) | | $ 4,247,255 | |
Repurchase Agreement, Credit Suisse First Boston, Inc., (collateralized by various U.S. Treasury obligations, 2.75%, 11/15/42, valued at $5,203,389), in a joint trading account at 0.03%, dated 10/31/13, due 11/1/13 (Delivery value $5,096,709) | | 5,096,705 | |
Repurchase Agreement, Goldman Sachs & Co., (collateralized by various U.S. Treasury obligations, 1.75%, 5/15/22, valued at $5,202,379), in a joint trading account at 0.02%, dated 10/31/13, due 11/1/13 (Delivery value $5,096,709) | | 5,096,706 | |
Repurchase Agreement, Goldman Sachs & Co., (collateralized by various U.S. Treasury obligations, 1.625%, 8/15/22, valued at $5,202,405), in a joint trading account at 0.05%, dated 10/31/13, due 11/1/13 (Delivery value $5,096,713) | | 5,096,706 | |
| | | | | | | |
| | | Shares | | | Value | |
SSgA U.S. Government Money Market Fund | | 1,415,016 | | | $ 1,415,016 | |
TOTAL TEMPORARY CASH INVESTMENTS (Cost $20,952,388) | | | 20,952,388 | |
TOTAL INVESTMENT SECURITIES — 100.8% (Cost $1,124,312,276) | | | 1,500,037,792 | |
OTHER ASSETS AND LIABILITIES — (0.8)% | | | | | (12,478,694 | ) |
TOTAL NET ASSETS — 100.0% | | | $1,487,559,098 | |
Notes to Schedule of Investments
See Notes to Financial Statements.
Statement of Assets and Liabilities |
OCTOBER 31, 2013 | |
Assets | |
Investment securities, at value (cost of $1,124,312,276) | | $1,500,037,792 | |
Receivable for investments sold | | 54,576,745 | |
Receivable for capital shares sold | | 1,592,687 | |
Dividends and interest receivable | | 866,249 | |
| | | 1,557,073,473 | |
| | | | |
Liabilities | | | |
Payable for investments purchased | | 65,569,398 | |
Payable for capital shares redeemed | | 2,549,403 | |
Accrued management fees | | 1,336,876 | |
Distribution and service fees payable | | 58,698 | |
| | | 69,514,375 | |
| | | | |
Net Assets | | $1,487,559,098 | |
| | | | |
Net Assets Consist of: | | | |
Capital (par value and paid-in surplus) | | $1,545,174,969 | |
Accumulated net realized loss | | (433,341,387 | ) |
Net unrealized appreciation | | 375,725,516 | |
| | | $1,487,559,098 | |
| | | | | | | |
| | | Net assets | | Shares outstanding | | Net asset value per share |
Investor Class, $0.01 Par Value | | $847,977,099 | | | 34,531,888 | | | $24.56 | |
Institutional Class, $0.01 Par Value | | $413,623,048 | | | 16,806,624 | | | $24.61 | |
A Class, $0.01 Par Value | | $201,659,690 | | | 8,212,650 | | | $24.55 | * |
C Class, $0.01 Par Value | | $17,057,058 | | | 705,322 | | | $24.18 | |
R Class, $0.01 Par Value | | $5,865,527 | | | 239,948 | | | $24.44 | |
R6 Class, $0.01 Par Value | | $1,376,676 | | | 55,948 | | | $24.61 | |
*Maximum offering price $26.05 (net asset value divided by 0.9425).
See Notes to Financial Statements.
YEAR ENDED OCTOBER 31, 2013 | |
Investment Income (Loss) | |
Income: | | | |
Dividends | | $ 38,253,656 | |
Interest | | 10,357 | |
| | | 38,264,013 | |
| | | | |
Expenses: | | | |
Management fees | | 15,828,342 | |
Distribution and service fees: | | | |
A Class | | 489,557 | |
C Class | | 122,219 | |
R Class | | 25,922 | |
Directors’ fees and expenses | | 59,782 | |
Other expenses | | 31,316 | |
| | | 16,557,138 | |
| | | | |
Net investment income (loss) | | 21,706,875 | |
| | | | |
Realized and Unrealized Gain (Loss) | | | |
Net realized gain (loss) on: | | | |
Investment transactions | | 52,418,506 | |
Foreign currency transactions | | 6,549 | |
| | | 52,425,055 | |
| | | | |
Change in net unrealized appreciation (depreciation) on investments | | 26,725,869 | |
| | | | |
Net realized and unrealized gain (loss) | | 79,150,924 | |
| | | | |
Net Increase (Decrease) in Net Assets Resulting from Operations | | $100,857,799 | |
See Notes to Financial Statements.
Statement of Changes in Net Assets |
YEAR ENDED OCTOBER 31, 2013, SEVEN MONTHS ENDED OCTOBER 31, 2012
AND YEAR ENDED MARCH 31, 2012 | |
Increase (Decrease) in Net Assets | October 31, 2013 | October 31, 2012(1) | March 31, 2012 |
Operations | | | | | | | | | |
Net investment income (loss) | | $ 21,706,875 | | | $ 4,728,133 | | | $ 8,705,182 | |
Net realized gain (loss) | | 52,425,055 | | | 55,348,950 | | | 66,741,271 | |
Change in net unrealized appreciation (depreciation) | | 26,725,869 | | | (21,761,266 | ) | | 66,043,274 | |
Net increase (decrease) in net assets resulting from operations | | 100,857,799 | | | 38,315,817 | | | 141,489,727 | |
| | | | | | | | | | |
Distributions to Shareholders | | | | | | | | | |
From net investment income: | | | | | | | | | |
Investor Class | | (19,845,912 | ) | | (1,508,856 | ) | | (7,773,868 | ) |
Institutional Class | | (9,445,470 | ) | | (1,024,086 | ) | | (3,905,445 | ) |
A Class | | (3,931,324 | ) | | (130,415 | ) | | (1,436,579 | ) |
C Class | | (168,462 | ) | | — | | | (15,776 | ) |
R Class | | (91,457 | ) | | (255 | ) | | (18,401 | ) |
R6 Class | | (184 | ) | | — | | | — | |
Decrease in net assets from distributions | | (33,482,809 | ) | | (2,663,612 | ) | | (13,150,069 | ) |
| | | | | | | | | | |
Capital Share Transactions | | | | | | | | | |
Net increase (decrease) in net assets from capital share transactions | | 161,013,069 | | | 80,720,171 | | | (33,113,657 | ) |
| | | | | | | | | | |
Net increase (decrease) in net assets | | 228,388,059 | | | 116,372,376 | | | 95,226,001 | |
| | | | | | | | | | |
Net Assets | | | | | | | | | |
Beginning of period | | 1,259,171,039 | | | 1,142,798,663 | | | 1,047,572,662 | |
End of period | | $1,487,559,098 | | | $1,259,171,039 | | | $1,142,798,663 | |
| | | | | | | | | | |
Undistributed net investment income | | — | | | $2,064,521 | | | — | |
(1) | The fund’s fiscal year end was changed from March 31 to October 31, resulting in a seven-month annual reporting period. |
See Notes to Financial Statements.
Notes to Financial Statements |
October 31, 2013
1. Organization
American Century Capital Portfolios, Inc. (the corporation) is registered under the Investment Company Act of 1940, as amended (the 1940 Act), as an open-end management investment company and is organized as a Maryland corporation. Real Estate Fund (the fund) is one fund in a series issued by the corporation. The fund is nondiversified as defined under the 1940 Act. The fund’s investment objective is to seek high total investment return through a combination of capital appreciation and current income.
The fund offers the Investor Class, the Institutional Class, the A Class, the C Class, the R Class and the R6 Class. The A Class may incur an initial sales charge. The A Class and C Class may be subject to a contingent deferred sales charge. The share classes differ principally in their respective sales charges and distribution and shareholder servicing expenses and arrangements. The Institutional Class and R6 Class shareholders do not require the same level of shareholder and administrative services from American Century Investment Management, Inc. (ACIM) (the investment advisor) as shareholders of other classes. In addition, financial intermediaries do not receive any service, distribution or administrative fees for the R6 Class. As a result, the Institutional Class and R6 Class are charged lower unified management fees. On October 21, 2011, all outstanding B Class shares were converted to A Class shares and the fund discontinued offering the B Class. Sale of the R6 Class commenced on July 26, 2013.
2. Significant Accounting Policies
The following is a summary of significant accounting policies consistently followed by the fund in preparation of its financial statements. The financial statements are prepared in conformity with accounting principles generally accepted in the United States of America, which may require management to make certain estimates and assumptions at the date of the financial statements. Actual results could differ from these estimates.
Investment Valuations — The fund determines the fair value of its investments and computes its net asset value per share as of the close of regular trading (usually 4 p.m. Eastern time) on the New York Stock Exchange (NYSE) on each day the NYSE is open.
Equity securities that are listed or traded on a domestic securities exchange are valued at the last reported sales price or at the official closing price as provided by the exchange. Equity securities traded on foreign securities exchanges are typically valued at the closing price on the exchange where primarily traded or as of the close of the NYSE, if that is earlier. If no last sales price is reported, or if local convention or regulation so provides, the mean of the latest bid and asked prices is used. Depending on local convention or regulation, securities traded over-the-counter are valued at the mean of the latest bid and asked prices, the last sales price, or the official closing price. In its determination of fair value, the fund may review several factors including: market information specific to a security; news developments in U.S. and foreign markets; the performance of particular U.S. and foreign securities, indices, comparable securities, American Depositary Receipts, Exchange-Traded Funds, and other relevant market indicators.
Debt securities maturing within 60 days at the time of purchase may be valued at cost, plus or minus any amortized discount or premium or at the evaluated mean as provided by an independent pricing service. Evaluated mean prices are commonly derived through utilization of market models, which may consider, among other factors, trade data, quotations from dealers and active market makers, relevant yield curve and spread data, related sector levels, creditworthiness, and other relevant market information on the same or comparable securities.
Investments in open-end management investment companies are valued at the reported net asset value per share. Repurchase agreements are valued at cost.
The value of investments initially expressed in foreign currencies is translated into U.S. dollars at prevailing exchange rates.
If the fund determines that the market price for a portfolio security is not readily available or the valuation methods mentioned above do not reflect a security’s fair value, such security is valued as determined in good faith by the Board of Directors or its designee, in accordance with procedures adopted by the Board of Directors. Circumstances that may cause the fund to use these procedures to value a security include, but are not limited to: a security has been declared in default; trading in a security has been halted during the trading day; there is a foreign market holiday and no trading occurred; or an event occurred between the close of a foreign exchange and the NYSE that may affect the value of a security.
Security Transactions — Security transactions are accounted for as of the trade date. Net realized gains and losses are determined on the identified cost basis, which is also used for federal income tax purposes.
Investment Income — Dividend income less foreign taxes withheld, if any, is recorded as of the ex-dividend date. Distributions received on securities that represent a return of capital or long-term capital gain are recorded as a reduction of cost of investments and/or as a realized gain. The fund may estimate the components of distributions received that may be considered nontaxable distributions or long-term capital gain distributions for income tax purposes. Interest income is recorded on the accrual basis and includes accretion of discounts and amortization of premiums.
Foreign Currency Translations — All assets and liabilities initially expressed in foreign currencies are translated into U.S. dollars at prevailing exchange rates at period end. The fund may enter into spot foreign currency exchange contracts to facilitate transactions denominated in a foreign currency. Purchases and sales of investment securities, dividend and interest income, spot foreign currency exchange contracts, and expenses are translated at the rates of exchange prevailing on the respective dates of such transactions. Net realized and unrealized foreign currency exchange gains or losses related to investment securities are a component of net realized gain (loss) on investment transactions and change in net unrealized appreciation (depreciation) on investments, respectively.
Repurchase Agreements — The fund may enter into repurchase agreements with institutions that ACIM has determined are creditworthy pursuant to criteria adopted by the Board of Directors. The fund requires that the collateral, represented by securities, received in a repurchase transaction be transferred to the custodian in a manner sufficient to enable the fund to obtain those securities in the event of a default under the repurchase agreement. ACIM monitors, on a daily basis, the securities transferred to ensure the value, including accrued interest, of the securities under each repurchase agreement is equal to or greater than amounts owed to the fund under each repurchase agreement.
Joint Trading Account — Pursuant to an Exemptive Order issued by the Securities and Exchange Commission, the fund, along with certain other funds in the American Century Investments family of funds, may transfer uninvested cash balances into a joint trading account. These balances are invested in one or more repurchase agreements that are collateralized by U.S. Treasury or Agency obligations.
Income Tax Status — It is the fund’s policy to distribute substantially all net investment income and net realized gains to shareholders and to otherwise qualify as a regulated investment company under provisions of the Internal Revenue Code. Accordingly, no provision has been made for income taxes. The fund files U.S. federal, state, local and non-U.S. tax returns as applicable. The fund’s tax returns are subject to examination by the relevant taxing authority until expiration of the applicable statute of limitations, which is generally three years from the date of filing but can be longer in certain jurisdictions. At this time, management believes there are no uncertain tax positions which, based on their technical merit, would not be sustained upon examination and for which it is reasonably possible that the total amounts of unrecognized tax benefits will significantly change in the next twelve months.
Multiple Class — All shares of the fund represent an equal pro rata interest in the net assets of the class to which such shares belong, and have identical voting, dividend, liquidation and other rights and the same terms and conditions, except for class specific expenses and exclusive rights to vote on matters affecting only individual classes. Income, non-class specific expenses, and realized and unrealized capital gains and losses of the fund are allocated to each class of shares based on their relative net assets.
Distributions to Shareholders — Distributions from net investment income, if any, are generally declared and paid quarterly. Distributions from net realized gains, if any, are generally declared and paid annually.
Indemnifications — Under the corporation’s organizational documents, its officers and directors are indemnified against certain liabilities arising out of the performance of their duties to the fund. In addition, in the normal course of business, the fund enters into contracts that provide general indemnifications. The maximum exposure under these arrangements is unknown as this would involve future claims that may be made against a fund. The risk of material loss from such claims is considered by management to be remote.
3. Fees and Transactions with Related Parties
Management Fees — The corporation has entered into a management agreement with ACIM, under which ACIM provides the fund with investment advisory and management services in exchange for a single, unified management fee (the fee) per class. The agreement provides that all expenses of managing and operating the fund, except distribution and service fees, brokerage expenses, taxes, interest, fees and expenses of the independent directors (including legal counsel fees), and extraordinary expenses, will be paid by ACIM. The fee is computed and accrued daily based on each class’s daily net assets and paid monthly in arrears. The rate of the fee is determined by applying a fee rate calculation formula. This formula takes into account the fund’s assets as well as certain assets, if any, of other clients of the investment advisor outside the American Century Investments family of funds (such as subadvised funds and separate accounts) that have very similar investment teams and investment strategies (strategy assets). The annual management fee schedule ranges from 1.00% to 1.20% for the Investor Class, A Class, C Class and R Class. The annual management fee schedule ranges from 0.80% to 1.00% for the Institutional Class and 0.65% to 0.85% for the R6 Class. The effective annual management fee for each class for the period ended October 31, 2013 was 1.14% for the Investor Class, A Class, C Class and R Class, 0.94% for the Institutional Class and 0.79% for the R6 Class.
Distribution and Service Fees — The Board of Directors has adopted a separate Master Distribution and Individual Shareholder Services Plan for each of the A Class, C Class and R Class (collectively the plans), pursuant to Rule 12b-1 of the 1940 Act. The plans provide that the A Class will pay American Century Investment Services, Inc. (ACIS) an annual distribution and service fee of 0.25%. The plans provide that the C Class will pay ACIS an annual distribution and service fee of 1.00%, of which 0.25% is paid for individual shareholder services and 0.75% is paid for distribution services. The plans provide that the R Class will pay ACIS an annual distribution and service fee of 0.50%. The fees are computed and accrued daily based on each class’s daily net assets and paid monthly in arrears. The fees are used to pay financial intermediaries for distribution and individual shareholder services. Fees incurred under the plans during the year ended October 31, 2013 are detailed in the Statement of Operations.
Related Parties — Certain officers and directors of the corporation are also officers and/or directors of American Century Companies, Inc. (ACC). The corporation’s investment advisor, ACIM, the corporation’s distributor, ACIS, and the corporation’s transfer agent, American Century Services, LLC, are wholly owned, directly or indirectly, by ACC. Various funds issued by American Century Asset Allocation Portfolios, Inc. own, in aggregate, 16% of the shares of the fund.
4. Investment Transactions
Purchases and sales of investment securities, excluding short-term investments, for the year ended October 31, 2013 were $2,615,295,031 and $2,440,915,605, respectively.
For the year ended October 31, 2013, the fund incurred net realized gains of $9,374,622 from redemptions in kind. A redemption in kind occurs when a fund delivers securities from its portfolio in lieu of cash as payment to a redeeming shareholder.
5. Capital Share Transactions
Transactions in shares of the fund were as follows:
| | | | | | | | | | |
| | | Year ended
October 31, 2013(1) | | | Seven months ended
October 31, 2012(2) | | | Year ended
March 31, 2012 | |
| | | Shares | | | Amount | | | Shares | | | Amount | | | Shares | | | Amount | |
Investor Class/Shares Authorized | | 150,000,000 | | | | | | 150,000,000 | | | | | | 150,000,000 | | | | |
Sold | | 20,986,785 | | | $529,535,235 | | | 7,708,880 | | | $177,520,406 | | | 10,880,030 | | | $221,561,441 | |
Issued in reinvestment of distributions | | 746,347 | | | 17,703,645 | | | 62,487 | | | 1,473,809 | | | 376,842 | | | 7,595,460 | |
Redeemed | | (20,142,549 | ) | | (494,183,730 | ) | | (5,988,471 | ) | | (137,976,791 | ) | | (11,017,255 | ) | | (217,677,225 | ) |
| | | 1,590,583 | | | 53,055,150 | | | 1,782,896 | | | 41,017,424 | | | 239,617 | | | 11,479,676 | |
Institutional Class/Shares Authorized | | 75,000,000 | | | | | | 75,000,000 | | | | | | 75,000,000 | | | | |
Sold | | 5,539,791 | | | 135,781,064 | | | 2,518,040 | | | 58,501,052 | | | 3,184,340 | | | 64,220,181 | |
Issued in reinvestment of distributions | | 381,876 | | | 9,081,608 | | | 43,277 | | | 1,007,793 | | | 191,040 | | | 3,846,085 | |
Redeemed | | (3,153,857 | ) | | (76,359,209 | ) | | (1,494,712 | ) | | (34,482,678 | ) | | (5,577,862 | ) | | (107,633,958 | ) |
| | | 2,767,810 | | | 68,503,463 | | | 1,066,605 | | | 25,026,167 | | | (2,202,482 | ) | | (39,567,692 | ) |
A Class/Shares Authorized | | 40,000,000 | | | | | | 40,000,000 | | | | | | 40,000,000 | | | | |
Sold | | 5,075,211 | | | 124,387,169 | | | 1,929,093 | | | 44,350,398 | | | 2,997,190 | | | 61,932,215 | |
Issued in reinvestment of distributions | | 160,825 | | | 3,815,151 | | | 5,281 | | | 127,218 | | | 69,670 | | | 1,411,296 | |
Redeemed | | (4,246,516 | ) | | (103,647,800 | ) | | (1,475,587 | ) | | (33,972,461 | ) | | (3,508,480 | ) | | (69,618,846 | ) |
| | | 989,520 | | | 24,554,520 | | | 458,787 | | | 10,505,155 | | | (441,620 | ) | | (6,275,335 | ) |
B Class/Shares Authorized | | N/A | | | | | | N/A | | | | | | 5,000,000 | | | | |
Redeemed | | | | | | | | | | | | | | (4,495 | ) | | (85,823 | ) |
C Class/Shares Authorized | | 5,000,000 | | | | | | 5,000,000 | | | | | | 5,000,000 | | | | |
Sold | | 548,871 | | | 13,506,042 | | | 146,482 | | | 3,347,592 | | | 59,962 | | | 1,222,030 | |
Issued in reinvestment of distributions | | 4,478 | | | 104,740 | | | — | | | — | | | 657 | | | 13,257 | |
Redeemed | | (95,471 | ) | | (2,282,448 | ) | | (15,422 | ) | | (348,901 | ) | | (26,132 | ) | | (503,556 | ) |
| | | 457,878 | | | 11,328,334 | | | 131,060 | | | 2,998,691 | | | 34,487 | | | 731,731 | |
R Class/Shares Authorized | | 5,000,000 | | | | | | 5,000,000 | | | | | | 5,000,000 | | | | |
Sold | | 152,832 | | | 3,735,873 | | | 64,149 | | | 1,470,751 | | | 62,654 | | | 1,256,865 | |
Issued in reinvestment of distributions | | 3,785 | | | 89,433 | | | 10 | | | 250 | | | 901 | | | 18,313 | |
Redeemed | | (67,672 | ) | | (1,648,113 | ) | | (13,013 | ) | | (298,267 | ) | | (33,454 | ) | | (671,392 | ) |
| | | 88,945 | | | 2,177,193 | | | 51,146 | | | 1,172,734 | | | 30,101 | | | 603,786 | |
R6 Class/Shares Authorized | | 50,000,000 | | | | | | N/A | | | | | | N/A | | | | |
Sold | | 56,172 | | | $1,399,865 | | | | | | | | | | | | | |
Issued in reinvestment of distributions | | 8 | | | 184 | | | | | | | | | | | | | |
Redeemed | | (232 | ) | | (5,640 | ) | | | | | | | | | | | | |
| | | 55,948 | | | 1,394,409 | | | | | | | | | | | | | |
Net increase (decrease) | | 5,950,684 | | | $161,013,069 | | | 3,490,494 | | | $80,720,171 | | | (2,344,392 | ) | | $(33,113,657 | ) |
(1) | July 26, 2013 (commencement of sale) through October 31, 2013 for the R6 Class. |
(2) | The fund’s fiscal year end was changed from March 31 to October 31, resulting in a seven-month annual reporting period. |
6. Fair Value Measurements
The fund’s securities valuation process is based on several considerations and may use multiple inputs to determine the fair value of the positions held by the fund. In conformity with accounting principles generally accepted in the United States of America, the inputs used to determine a valuation are classified into three broad levels as follows:
• | Level 1 valuation inputs consist of unadjusted quoted prices in an active market for identical securities; |
• | Level 2 valuation inputs consist of direct or indirect observable market data (including quoted prices for similar securities, evaluations of subsequent market events, interest rates, prepayment speeds, credit risk, etc.); or |
• | Level 3 valuation inputs consist of unobservable data (including a fund’s own assumptions). |
The level classification is based on the lowest level input that is significant to the fair valuation measurement. The valuation inputs are not necessarily an indication of the risks associated with investing in these securities or other financial instruments.
The following is a summary of the level classifications as of period end. The Schedule of Investments provides additional information on the fund’s portfolio holdings.
| | | | | | | | | | |
| | | Level 1 | | | Level 2 | | | Level 3 | |
Investment Securities | | | | | | | | | |
Common Stocks | | $1,475,537,780 | | | $3,547,624 | | | — | |
Temporary Cash Investments | | 1,415,016 | | | 19,537,372 | | | — | |
Total Value of Investment Securities | | $1,476,952,796 | | | $23,084,996 | | | — | |
7. Risk Factors
The fund concentrates its investments in a narrow segment of the total market. Because of this, the fund is subject to certain additional risks as compared to investing in a more diversified portfolio of investments. The fund may be subject to certain risks similar to those associated with direct investment in real estate including but not limited to: local or regional economic conditions, changes in zoning laws, changes in property values, property tax increases, overbuilding, increased competition, environmental contamination, natural disasters, and interest rate risk.
The fund’s investment process may result in high portfolio turnover, which could mean high transaction costs, affecting both performance and capital gains tax liabilities to investors.
8. Federal Tax Information
The tax character of distributions paid during the year ended October 31, 2013, seven months ended October 31, 2012 and year ended March 31, 2012 were as follows:
| | | | | | | | | | |
| | | October 31, 2013 | | | October 31, 2012(1) | | | March 31, 2012 | |
Distributions Paid From | | | | | | | | | |
Ordinary income | | $33,482,809 | | | $2,663,612 | | | $13,150,069 | |
Long-term capital gains | | — | | | — | | | — | |
(1) | The fund’s fiscal year end was changed from March 31 to October 31, resulting in a seven-month annual reporting period. |
The book-basis character of distributions made during the year from net investment income or net realized gains may differ from their ultimate characterization for federal income tax purposes. These differences reflect the differing character of certain income items and net realized gains and losses for financial statement and tax purposes, and may result in reclassification among certain capital accounts on the financial statements.
As of October 31, 2013, the federal tax cost of investments and the components of distributable earnings on a tax-basis were as follows:
| | | | |
Federal tax cost of investments | | $1,194,290,373 | |
Gross tax appreciation of investments | | $307,623,705 | |
Gross tax depreciation of investments | | (1,876,286 | ) |
Net tax appreciation (depreciation) of investments | | $305,747,419 | |
Undistributed ordinary income | | — | |
Accumulated short-term capital losses | | $(363,363,290 | ) |
The difference between book-basis and tax-basis unrealized appreciation (depreciation) is attributable primarily to the tax deferral of losses on wash sales.
Accumulated capital losses represent net capital loss carryovers that may be used to offset future realized capital gains for federal income tax purposes. Future capital loss carryover utilization in any given year may be subject to Internal Revenue Code limitations. Capital loss carryovers expire in 2017.
For a Share Outstanding Throughout the Years Ended October 31 (except as noted) |
Per-Share Data | | Ratios and Supplemental Data | |
| | | | | | Income From Investment Operations: | | | | | | | | | | | Ratio to Average Net Assets of: | | | | | | |
| | | Net Asset
Value,
Beginning
of Period | | Net
Investment Income
(Loss)(1) | | Net
Realized and Unrealized
Gain (Loss) | | Total From Investment Operations | | Distributions From Net Investment Income | | Net Asset
Value,
End of Period | | Total Return(2) | | Operating Expenses | | Net
Investment Income
(Loss) | | Portfolio
Turnover
Rate | | Net Assets,
End of Period
(in thousands) | |
Investor Class |
2013 | | $23.05 | | | 0.36 | | | 1.70 | | | 2.06 | | | (0.55 | ) | | $24.56 | | | 9.04 | % | | 1.14 | % | | 1.48 | % | | 170 | % | | $847,977 | |
| 2012(3) | | $22.35 | | | 0.09 | | | 0.66 | | | 0.75 | | | (0.05 | ) | | $23.05 | | | 3.38 | % | | 1.15% | (4) | | 0.64% | (4) | | 86 | % | | $759,303 | |
2012 | | $19.58 | | | 0.17 | | | 2.87 | | | 3.04 | | | (0.27 | ) | | $22.35 | | | 15.62 | % | | 1.16 | % | | 0.83 | % | | 168 | % | | $696,245 | |
2011 | | $15.79 | | | 0.13 | | | 3.83 | | | 3.96 | | | (0.17 | ) | | $19.58 | | | 25.19 | % | | 1.16 | % | | 0.76 | % | | 238 | % | | $605,529 | |
2010 | | $7.80 | | | 0.28 | | | 8.01 | | | 8.29 | | | (0.30 | ) | | $15.79 | | | 107.30 | % | | 1.16 | % | | 2.24 | % | | 236 | % | | $565,463 | |
2009 | | $21.67 | | | 0.46 | | | (13.91 | ) | | (13.45 | ) | | (0.42 | ) | | $7.80 | | | (62.80 | )% | | 1.15 | % | | 2.87 | % | | 109 | % | | $361,510 | |
Institutional Class | | | | | | | | | | | | | | | | | | | | | | | | | | | | | | | |
2013 | | $23.10 | | | 0.41 | | | 1.70 | | | 2.11 | | | (0.60 | ) | | $24.61 | | | 9.23 | % | | 0.94 | % | | 1.68 | % | | 170 | % | | $413,623 | |
| 2012(3) | | $22.40 | | | 0.11 | | | 0.67 | | | 0.78 | | | (0.08 | ) | | $23.10 | | | 3.47 | % | | 0.95% | (4) | | 0.84% | (4) | | 86 | % | | $324,283 | |
2012 | | $19.62 | | | 0.21 | | | 2.87 | | | 3.08 | | | (0.30 | ) | | $22.40 | | | 15.86 | % | | 0.96 | % | | 1.03 | % | | 168 | % | | $290,557 | |
2011 | | $15.81 | | | 0.17 | | | 3.84 | | | 4.01 | | | (0.20 | ) | | $19.62 | | | 25.48 | % | | 0.96 | % | | 0.96 | % | | 238 | % | | $297,740 | |
2010 | | $7.81 | | | 0.30 | | | 8.03 | | | 8.33 | | | (0.33 | ) | | $15.81 | | | 107.71 | % | | 0.96 | % | | 2.44 | % | | 236 | % | | $230,109 | |
2009 | | $21.71 | | | 0.50 | | | (13.94 | ) | | (13.44 | ) | | (0.46 | ) | | $7.81 | | | (62.73 | )% | | 0.95 | % | | 3.07 | % | | 109 | % | | $104,565 | |
A Class | | | | | | | | | | | | | | | | | | | | | | | | | | | | | | | | | |
2013 | | $23.05 | | | 0.30 | | | 1.69 | | | 1.99 | | | (0.49 | ) | | $24.55 | | | 8.77 | % | | 1.39 | % | | 1.23 | % | | 170 | % | | $201,660 | |
| 2012(3) | | $22.35 | | | 0.05 | | | 0.67 | | | 0.72 | | | (0.02 | ) | | $23.05 | | | 3.21 | % | | 1.40% | (4) | | 0.39% | (4) | | 86 | % | | $166,497 | |
2012 | | $19.60 | | | 0.11 | | | 2.87 | | | 2.98 | | | (0.23 | ) | | $22.35 | | | 15.33 | % | | 1.41 | % | | 0.58 | % | | 168 | % | | $151,198 | |
2011 | | $15.81 | | | 0.09 | | | 3.83 | | | 3.92 | | | (0.13 | ) | | $19.60 | | | 24.92 | % | | 1.41 | % | | 0.51 | % | | 238 | % | | $141,257 | |
2010 | | $7.81 | | | 0.24 | | | 8.02 | | | 8.26 | | | (0.26 | ) | | $15.81 | | | 106.76 | % | | 1.41 | % | | 1.99 | % | | 236 | % | | $138,037 | |
2009 | | $21.69 | | | 0.42 | | | (13.94 | ) | | (13.52 | ) | | (0.36 | ) | | $7.81 | | | (62.88 | )% | | 1.40 | % | | 2.62 | % | | 109 | % | | $84,568 | |
For a Share Outstanding Throughout the Years Ended October 31 (except as noted) |
Per-Share Data | | Ratios and Supplemental Data | |
| | | | | | Income From Investment Operations: | | | | | | | | | | | Ratio to Average Net Assets of: | | | | | | |
| | | Net Asset
Value,
Beginning
of Period | | Net
Investment Income
(Loss)(1) | | Net
Realized and Unrealized
Gain (Loss) | | Total From Investment Operations | | Distributions From Net Investment Income | | Net Asset
Value,
End of Period | | Total Return(2) | | Operating Expenses | | Net
Investment Income
(Loss) | | Portfolio
Turnover
Rate | | Net Assets,
End of Period
(in thousands) | |
C Class | | | | | | | | | | | | | | | | | | | | | | | | | | | | | | | | | |
2013 | | $22.72 | | | 0.12 | | | 1.67 | | | 1.79 | | | (0.33 | ) | | $24.18 | | | 7.93 | % | | 2.14 | % | | 0.48 | % | | 170 | % | | $17,057 | |
| 2012(3) | | $22.11 | | | (0.05 | ) | | 0.66 | | | 0.61 | | | — | | | $22.72 | | | 2.76 | % | | 2.15% | (4) | | (0.36 | )%(4) | | 86 | % | | $5,622 | |
2012 | | $19.48 | | | (0.02 | ) | | 2.82 | | | 2.80 | | | (0.17 | ) | | $22.11 | | | 14.44 | % | | 2.16 | % | | (0.17 | )% | | 168 | % | | $2,574 | |
2011 | | $15.75 | | | (0.04 | ) | | 3.82 | | | 3.78 | | | (0.05 | ) | | $19.48 | | | 24.00 | % | | 2.16 | % | | (0.24 | )% | | 238 | % | | $1,595 | |
2010 | | $7.78 | | | 0.14 | | | 7.99 | | | 8.13 | | | (0.16 | ) | | $15.75 | | | 105.21 | % | | 2.16 | % | | 1.24 | % | | 236 | % | | $983 | |
2009 | | $21.62 | | | 0.35 | | | (13.90 | ) | | (13.55 | ) | | (0.29 | ) | | $7.78 | | | (63.12 | )% | | 2.15 | % | | 1.87 | % | | 109 | % | | $334 | |
R Class | | | | | | | | | | | | | | | | | | | | | | | | | | | | | | | | | |
2013 | | $22.95 | | | 0.24 | | | 1.68 | | | 1.92 | | | (0.43 | ) | | $24.44 | | | 8.50 | % | | 1.64 | % | | 0.98 | % | | 170 | % | | $5,866 | |
| 2012(3) | | $22.27 | | | 0.02 | | | 0.66 | | | 0.68 | | | — | (5) | | $22.95 | | | 3.06 | % | | 1.65% | (4) | | 0.14% | (4) | | 86 | % | | $3,466 | |
2012 | | $19.55 | | | 0.08 | | | 2.84 | | | 2.92 | | | (0.20 | ) | | $22.27 | | | 15.01 | % | | 1.66 | % | | 0.33 | % | | 168 | % | | $2,224 | |
2011 | | $15.78 | | | 0.06 | | | 3.81 | | | 3.87 | | | (0.10 | ) | | $19.55 | | | 24.60 | % | | 1.66 | % | | 0.26 | % | | 238 | % | | $1,364 | |
2010 | | $7.79 | | | 0.21 | | | 8.01 | | | 8.22 | | | (0.23 | ) | | $15.78 | | | 106.38 | % | | 1.66 | % | | 1.74 | % | | 236 | % | | $444 | |
2009 | | $21.65 | | | 0.44 | | | (13.96 | ) | | (13.52 | ) | | (0.34 | ) | | $7.79 | | | (62.98 | )% | | 1.65 | % | | 2.37 | % | | 109 | % | | $127 | |
R6 Class | | | | | | | | | | | | | | | | | | | | | | | | | | | | | | | | | |
| 2013(6) | | $25.22 | | | 0.07 | | | (0.53 | ) | | (0.46 | ) | | (0.15 | ) | | $24.61 | | | (1.77 | )% | | 0.79% | (4) | | 1.04% | (4) | | 170% | (7) | | $1,377 | |
Notes to Financial Highlights
(1) | Computed using average shares outstanding throughout the period. |
(2) | Total returns are calculated based on the net asset value of the last business day and do not reflect applicable sales charges, if any. Total returns for periods less than one year are not annualized. |
(3) | April 1, 2012 through October 31, 2012. The fund’s fiscal year end was changed from March 31 to October 31, resulting in a seven-month annual reporting period. For the years before October 31, 2012, the fund’s fiscal year end was March 31. |
(5) | Per-share amount was less than $0.005. |
(6) | July 26, 2013 (commencement of sale) through October 31, 2013. |
(7) | Portfolio turnover is calculated at the fund level. Percentage indicated was calculated for the year ended October 31, 2013. |
See Notes to Financial Statements.
Report of Independent Registered Public Accounting Firm |
To the Board of Directors and Shareholders of
American Century Capital Portfolios, Inc.:
We have audited the accompanying statement of assets and liabilities, including the schedule of investments, of Real Estate Fund (the “Fund”), one of the funds constituting American Century Capital Portfolios, Inc., as of October 31, 2013, and the related statement of operations for the year then ended, the statements of changes in net assets for the year then ended and for the periods from April 1, 2012 through October 31, 2012 and for the year ended March 31, 2012, and the financial highlights for each of the periods presented. These financial statements and financial highlights are the responsibility of the Fund’s management. Our responsibility is to express an opinion on these financial statements and financial highlights based on our audits.
We conducted our audits in accordance with the standards of the Public Company Accounting Oversight Board (United States). Those standards require that we plan and perform the audit to obtain reasonable assurance about whether the financial statements and financial highlights are free of material misstatement. The Fund is not required to have, nor were we engaged to perform, an audit of its internal control over financial reporting. Our audits included consideration of internal control over financial reporting as a basis for designing audit procedures that are appropriate in the circumstances, but not for the purpose of expressing an opinion on the effectiveness of the Fund’s internal control over financial reporting. Accordingly, we express no such opinion. An audit also includes examining, on a test basis, evidence supporting the amounts and disclosures in the financial statements, assessing the accounting principles used and significant estimates made by management, as well as evaluating the overall financial statement presentation. Our procedures included confirmation of securities owned as of October 31, 2013, by correspondence with the custodian and brokers; where replies were not received from brokers, we performed other auditing procedures. We believe that our audits provide a reasonable basis for our opinion.
In our opinion, the financial statements and financial highlights referred to above present fairly, in all material respects, the financial position of Real Estate Fund of American Century Capital Portfolios, Inc. as of October 31, 2013, the results of its operations for the year then ended, the changes in its net assets for the year then ended and for the periods from April 1, 2012 through October 31, 2012 and for the year ended March 31, 2012, and the financial highlights for each of the periods presented, in conformity with accounting principles generally accepted in the United States of America.
Deloitte & Touche LLP
Kansas City, Missouri
December 19, 2013
The Board of Directors
The individuals listed below serve as directors of the funds. Each director will continue to serve in this capacity until death, retirement, resignation or removal from office. The board has adopted a mandatory retirement age for directors who are not “interested persons,” as that term is defined in the Investment Company Act (independent directors). Independent directors shall retire by December 31 of the year in which they reach their 75th birthday. Mr. Pratt may serve until December 31 of the year in which he reaches his 76th birthday based on an extension granted under previous retirement guidelines.
Mr. Thomas is an “interested person” because he currently serves as President and Chief Executive Officer of American Century Companies, Inc. (ACC), the parent company of American Century Investment Management, Inc. (ACIM or the advisor). Mr. Fink is treated as an “interested person” because of his recent employment with ACC and American Century Services, LLC (ACS). The other directors (more than three-fourths of the total number) are independent. They are not employees, directors or officers of, and have no financial interest in, ACC or any of its wholly owned, direct or indirect, subsidiaries, including ACIM, American Century Investment Services, Inc. (ACIS) and ACS, and do not have any other affiliations, positions, or relationships that would cause them to be considered “interested persons” under the Investment Company Act. The directors serve in this capacity for seven (in the case of Mr. Thomas, 15) registered investment companies in the American Century Investments family of funds.
The following table presents additional information about the directors. The mailing address for each director is 4500 Main Street, Kansas City, Missouri 64111.
| | | | | | | |
Name
(Year of Birth) | Position(s) Held with Funds | Length of Time Served | Principal Occupation(s) During Past 5 Years | | Number of American Century Portfolios Overseen by Director | Other Directorships Held During Past 5 Years |
Independent Directors |
Thomas A. Brown (1940) | Director | Since 1980 | Managing Member, Associated Investments, LLC (real estate investment company); Brown Cascade Properties, LLC (real estate investment company) (2001 to 2009) | | 75 | None |
Andrea C. Hall (1945) | Director | Since 1997 | Retired | | 75 | None |
Jan M. Lewis (1957) | Director | Since 2011 | President and Chief Executive Officer, Catholic Charities of Northeast Kansas (human services organization) | | 75 | None |
James A. Olson (1942) | Director | Since 2007 | Member, Plaza Belmont LLC (private equity fund manager) | | 75 | Saia, Inc. (2002 to 2012) and EPR Properties (2003 to 2013) |
Donald H. Pratt (1937) | Director and Chairman of the Board | Since 1995 (Chairman since 2005) | Chairman and Chief Executive Officer, Western Investments, Inc. (real estate company) | | 75 | None |
| | | | | | | |
Name
(Year of Birth) | Position(s) Held with Funds | Length of Time Served | Principal Occupation(s) During Past 5 Years | | Number of American Century Portfolios Overseen by Director | Other Directorships Held During Past 5 Years |
Independent Directors |
M. Jeannine Strandjord
(1945) | Director | Since 1994 | Retired | | 75 | Euronet Worldwide Inc.; Charming Shoppes, Inc. (2006 to 2010); and DST Systems Inc. (1996 to 2012) |
John R. Whitten (1946) | Director | Since 2008 | Retired | | 75 | Rudolph Technologies, Inc. |
Stephen E. Yates (1948) | Director | Since 2012 | Retired; Executive Vice President, Technology & Operations, KeyCorp. (computer services)(2004 to 2010) | | 75 | Applied Industrial Technologies, Inc. (2001 to 2010) |
| | | | | | | |
Interested Directors |
Barry Fink
(1955) | Director | Since 2012 | Retired; Executive Vice President, ACC (September 2007 to February 2013); President, ACS (October 2007 to February 2013); Chief Operating Officer,
ACC (September 2007 to November 2012) | | 75 | None |
Jonathan S. Thomas
(1963) | Director and President | Since 2007 | President and Chief Executive Officer, ACC (March 2007 to present). Also serves as Chief Executive Officer and Manager, ACS; Executive Vice President, ACIM; Director, ACC, ACIM and other ACC subsidiaries | | 117 | None |
Officers
The following table presents certain information about the executive officers of the funds. Each officer serves as an officer for each of the 15 investment companies in the American Century family of funds, unless otherwise noted. No officer is compensated for his or her service as an officer of the funds. The listed officers are interested persons of the funds and are appointed or re-appointed on an annual basis. The mailing address for each officer listed below is 4500 Main Street, Kansas City, Missouri 64111.
| | | | |
Name
(Year of Birth) | Offices with the Funds | | Principal Occupation(s) During the Past Five Years |
Jonathan S. Thomas
(1963) | Director and President since 2007 | | President and Chief Executive Officer, ACC (March 2007 to present). Also serves as Chief Executive Officer and Manager, ACS; Executive Vice President, ACIM; Director, ACC, ACIM and other ACC subsidiaries |
Maryanne L. Roepke
(1956) | Chief Compliance Officer since 2006 and Senior Vice President since 2000 | | Chief Compliance Officer, American Century funds, ACIM and ACS (August 2006 to present). Also serves as Senior Vice President, ACS |
Charles A. Etherington (1957) | General Counsel since 2007 and Senior Vice President since 2006 | | Attorney, ACC (February 1994 to present); Vice President, ACC (November 2005 to present); General Counsel, ACC (March 2007 to present). Also serves as General Counsel, ACIM, ACS, ACIS and other ACC subsidiaries; and Senior Vice President, ACIM and ACS |
C. Jean Wade (1964) | Vice President,Treasurer and Chief Financial Officer since 2012 | | Vice President, ACS (February 2000 to present) |
Robert J. Leach (1966) | Vice President since 2006 and Assistant Treasurer since 2012 | | Vice President, ACS (February 2000 to present) |
David H. Reinmiller (1963) | Vice President since 2000 | | Attorney, ACC (January 1994 to present); Associate General Counsel, ACC (January 2001 to present). Also serves as Vice President, ACIM and ACS |
Ward D. Stauffer (1960) | Secretary since 2005 | | Attorney, ACC (June 2003 to present) |
The Statement of Additional Information has additional information about the fund’s directors and is available without charge, upon request, by calling 1-800-345-2021.
Approval of Management Agreement |
At a meeting held on June 20, 2013, the Fund’s Board of Directors unanimously approved the renewal of the management agreement pursuant to which American Century Investment Management, Inc. (the “Advisor”) acts as the investment advisor for the Fund. Under Section 15(c) of the Investment Company Act, contracts for investment advisory services are required to be reviewed, evaluated, and approved by a majority of a fund’s directors (the “Directors”), including a majority of the independent Directors, each year.
Prior to its consideration of the renewal of the management agreement, the Board requested and reviewed extensive data and information compiled by the Advisor and certain independent providers of evaluation data concerning the Fund and the services provided to the Fund by the Advisor. This review was in addition to the oversight and evaluation undertaken by the Board and its committees on a continuous basis throughout the year.
In connection with its consideration of the renewal of the management agreement, the Board’s review and evaluation of the services provided by the Advisor included, but was not limited to, the following:
• | the nature, extent, and quality of investment management, shareholder services, and other services provided by the Advisor to the Fund; |
• | the wide range of other programs and services the Advisor provides to the Fund and its shareholders on a routine and non-routine basis; |
• | the investment performance of the Fund, including data comparing the Fund’s performance to appropriate benchmarks and/or a peer group of other mutual funds with similar investment objectives and strategies; |
• | data comparing the cost of owning the Fund to the cost of owning similar funds; |
• | the Advisor’s compliance policies, procedures, and regulatory experience; |
• | financial data showing the cost of services provided to the Fund, the profitability of the Fund to the Advisor, and the overall profitability of the Advisor; |
• | possible economies of scale associated with the Advisor’s management of the Fund and other accounts under its management; |
• | data comparing services provided and charges to other investment management clients of the Advisor; and |
• | consideration of collateral benefits derived by the Advisor from the management of the Fund. |
In keeping with its practice, the Board held two in-person meetings and one telephonic meeting to review and discuss the information provided. The Directors also had the benefit of the advice of independent counsel throughout the period.
Factors Considered
The Directors considered all of the information provided by the Advisor, the independent data providers, and independent counsel, and evaluated such information for the Fund. In connection with their review, the Directors did not identify any single factor as being all-important or controlling, and each Director may have attributed different levels of importance to different factors. In deciding to renew the management agreement, the Board based its decision on a number of factors, including the following:
Nature, Extent and Quality of Services - Generally. Under the management agreement, the Advisor is responsible for providing or arranging for all services necessary for the operation of the Fund. The Board noted that under the management agreement, the Advisor provides or arranges at its own expense a wide variety of services including:
• | constructing and designing the Fund |
• | portfolio research and security selection |
• | initial capitalization/funding |
• | daily valuation of the Fund’s portfolio |
• | shareholder servicing and transfer agency, including shareholder confirmations, recordkeeping, and communications |
• | regulatory and portfolio compliance |
• | marketing and distribution |
The Board noted that many of these services have expanded over time both in terms of quantity and complexity in response to shareholder demands, competition in the industry, changing distribution channels, and the changing regulatory environment.
Investment Management Services. The nature of the investment management services provided to the Fund is quite complex and allows Fund shareholders access to professional money management, instant diversification of their investments within an asset class, the opportunity to easily diversify among asset classes by investing in or exchanging among various American Century Investments funds, and liquidity. In evaluating investment performance, the Board expects the Advisor to manage the Fund in accordance with its investment objectives and approved strategies. Further, the Directors recognize that the Advisor has an obligation to monitor trading activities, and in particular to seek the best execution of fund trades, and to evaluate the use of and payment for research. In providing these services, the Advisor utilizes teams of investment professionals (portfolio managers, analysts, research assistants, and securities traders) who require extensive information technology, research, training, compliance and other systems to conduct their business. The Board, directly and through its Fund Performance Review Committee, regularly reviews investment performance information for the Fund, together with comparative information for appropriate benchmarks and/or peer groups of similarly-managed funds, over different time horizons. The Directors also review detailed performance information during the management agreement approval process. If performance concerns are identified, the Fund receives special reviews until performance improves, during which the Board discusses with the Advisor the reasons for such results (e.g., market conditions, security selection) and any efforts being undertaken to improve performance. Taking all these factors into consideration, the Board found the investment management services provided by the Advisor to the Fund to meet or exceed industry standards. More detailed information about the Fund’s performance can be found in the Performance and Portfolio Commentary sections of this report.
Shareholder and Other Services. Under the management agreement, the Advisor provides the Fund with a comprehensive package of transfer agency, shareholder, and other services. The Board, directly and through various committees of the Board, regularly reviews reports and evaluations of such services at its regular meetings. These reports include, but are not limited to, information regarding the operational efficiency and accuracy of the shareholder and transfer agency services provided, staffing levels, shareholder satisfaction (as measured by external as well as internal sources), technology support, new products and services offered to Fund shareholders, securities trading activities, portfolio valuation services, auditing services, and legal and operational compliance activities. Certain aspects of shareholder and transfer agency service level efficiency and the quality of securities trading activities are measured by independent third party providers and are presented in comparison to other fund groups not managed by the Advisor. The Board found the services provided by the Advisor to the Fund under the management agreement to be competitive and of high quality.
Costs of Services and Profitability. The Advisor provides detailed information concerning its cost of providing various services to the Fund, its profitability in managing the Fund, its overall profitability, and its financial condition. The Directors have reviewed with the Advisor the methodology used to prepare this financial information. The financial information regarding the Advisor is considered in evaluating the Advisor’s financial condition, its ability to continue to provide services under the management agreement, and the reasonableness of the current management fee. The Board concluded that the Advisor’s profits were reasonable in light of the services provided to the Fund.
Ethics. The Board generally considers the Advisor’s commitment to providing quality services to shareholders and to conducting its business ethically. They noted that the Advisor’s practices generally meet or exceed industry best practices.
Economies of Scale. The Board also reviewed information provided by the Advisor regarding the possible existence of economies of scale in connection with the management of the Fund. The Board concluded that economies of scale are difficult to measure and predict with precision, especially on a fund-by-fund basis. The Board concluded that the Advisor is appropriately sharing economies of scale through its competitive fee structure, offering competitive fees from fund inception, and through reinvestment in its business to provide shareholders additional content and services.
Comparison to Other Funds’ Fees. The management agreement provides that the Fund pay the Advisor a single, all-inclusive (or unified) management fee for providing all services necessary for the management and operation of the Fund, other than brokerage expenses, taxes, interest, extraordinary expenses, and the fees and expenses of the Fund’s independent directors (including their independent legal counsel) and expenses incurred in connection with the provision of shareholder services and distribution services under a plan adopted pursuant to Rule 12b-1 under the 1940 Act. Under the unified fee structure, the Advisor is responsible for providing all investment advisory, custody, audit, administrative, compliance, recordkeeping, marketing and shareholder services, or arranging and supervising third parties to provide such services. By contrast, most other funds are charged a variety of fees, including an investment advisory fee, a transfer agency fee, an administrative fee, distribution charges and other expenses. Other than their investment advisory fees and any applicable Rule 12b-1 distribution fees, all other components of the total fees charged by these other funds may be increased without shareholder approval. The Board believes the unified fee structure is a benefit to Fund shareholders because it clearly discloses to shareholders the cost of owning Fund shares, and, since the unified fee cannot be increased without a vote of Fund shareholders, it shifts to the Advisor the risk of increased costs of operating the Fund and provides a direct incentive to minimize administrative inefficiencies. Part of the Board’s analysis of fee levels involves reviewing certain evaluative data compiled by an independent provider and comparing the Fund’s unified fee to the total expense ratio of other funds in the Fund’s peer group. The Board concluded that the management fee paid by the Fund to the Advisor under the management agreement is reasonable in light of the services provided to the Fund.
Comparison to Fees and Services Provided to Other Clients of the Advisor. The Board also requested and received information from the Advisor concerning the nature of the services, fees, costs and profitability of its advisory services to advisory clients other than the Fund. They observed that these varying types of client accounts require different services and involve different regulatory and entrepreneurial risks than the management of the Fund. The Board analyzed this information and concluded that the fees charged and services provided to the Fund were reasonable by comparison.
Collateral or “Fall-Out” Benefits Derived by the Advisor. The Board considered the existence of collateral benefits the Advisor may receive as a result of its relationship with the Fund. They concluded that the Advisor’s primary business is managing mutual funds and it generally does not use fund or shareholder information to generate profits in other lines of business, and therefore does not derive any significant collateral benefits from them. The Board noted that the Advisor receives proprietary research from broker-dealers that execute fund portfolio transactions and concluded that this research is likely to benefit Fund shareholders. The Board also determined that the Advisor is able to provide investment management services to certain clients other than the Fund, at least in part, due to its existing infrastructure built to serve the fund complex. The Board concluded, however, that the assets of those other clients are not material to the analysis and, where applicable, may be included with the assets of the Fund to determine breakpoints in the management fee schedule.
Existing Relationship. The Board also considered whether there was any reason for not continuing the existing arrangement with the Advisor. In this regard, the Board was mindful of the potential disruptions of the Fund’s operations and various risks, uncertainties, and other effects that could occur as a result of a decision not to continue such relationship. In particular, the Board recognized that most shareholders have invested in the Fund on the strength of the Advisor’s industry standing and reputation and in the expectation that the Advisor will have a continuing role in providing advisory services to the Fund.
Conclusion of the Directors. As a result of this process, the Board, including all of the independent directors, taking into account all of the factors discussed above and the information provided by the Advisor and others, concluded that the management agreement between the Fund and the Advisor is fair and reasonable in light of the services provided and should be renewed.
Retirement Account Information
As required by law, distributions you receive from certain IRAs are subject to federal income tax withholding, unless you elect not to have withholding apply. Tax will be withheld on the total amount withdrawn even though you may be receiving amounts that are not subject to withholding, such as nondeductible contributions. In such case, excess amounts of withholding could occur. You may adjust your withholding election so that a greater or lesser amount will be withheld.
If you don’t want us to withhold on this amount, you must notify us to not withhold the federal income tax. You may notify us in writing or in certain situations by telephone or through other electronic means. For systematic withdrawals, your withholding election will remain in effect until revoked or changed by filing a new election. You have the right to revoke your election at any time.
Remember, even if you elect not to have income tax withheld, you are liable for paying income tax on the taxable portion of your withdrawal. If you elect not to have income tax withheld or you don’t have enough income tax withheld, you may be responsible for payment of estimated tax. You may incur penalties under the estimated tax rules if your withholding and estimated tax payments are not sufficient. You can reduce or defer the income tax on a distribution by directly or indirectly rolling such distribution over to another IRA or eligible plan. You should consult your tax advisor for additional information.
State tax will be withheld if, at the time of your distribution, your address is within one of the mandatory withholding states and you have federal income tax withheld (or as otherwise required by state law). State taxes will be withheld from your distribution in accordance with the respective state rules.
Distributions you receive from 403(b), 457 and qualified plans are subject to special tax and withholding rules. Your plan administrator or plan sponsor is required to provide you with a special tax notice explaining those rules at the time you request a distribution. If applicable, federal and/or state taxes may be withheld from your distribution amount.
Proxy Voting Policies
A description of the policies that the fund’s investment advisor uses in exercising the voting rights associated with the securities purchased and/or held by the fund is available without charge, upon request, by calling 1-800-345-2021. It is also available on the “About Us” page of American Century Investments’ website at americancentury.com and on the Securities and Exchange Commission’s website at sec.gov. Information regarding how the investment advisor voted proxies relating to portfolio securities during the most recent 12-month period ended June 30 is available on the “About Us” page at americancentury.com. It is also available at sec.gov.
Quarterly Portfolio Disclosure
The fund files its complete schedule of portfolio holdings with the Securities and Exchange Commission (SEC) for the first and third quarters of each fiscal year on Form N-Q. The fund’s Forms N-Q are available on the SEC’s website at sec.gov, and may be reviewed and copied at the SEC’s Public Reference Room in Washington, DC. Information on the operation of the Public Reference Room may be obtained by calling 1-800-SEC-0330. The fund also makes its complete schedule of portfolio holdings for the most recent quarter of its fiscal year available on its website at americancentury.com and, upon request, by calling 1-800-345-2021.
Other Tax Information
The following information is provided pursuant to provisions of the Internal Revenue Code.
The fund hereby designates up to the maximum amount allowable as qualified dividend income for the fiscal year ended October 31, 2013.
For corporate taxpayers, the fund hereby designates $1,022,962, or up to the maximum amount allowable, of ordinary income distributions paid during the fiscal year ended October 31, 2013 as qualified for the corporate dividends received deduction.
Contact Us | americancentury.com |
Automated Information Line | 1-800-345-8765 |
Investor Services Representative | 1-800-345-2021
or 816-531-5575 |
Investors Using Advisors | 1-800-378-9878 |
Business, Not-For-Profit, Employer-Sponsored Retirement Plans | 1-800-345-3533 |
Banks and Trust Companies, Broker-Dealers, Financial Professionals, Insurance Companies | 1-800-345-6488 |
Telecommunications Device for the Deaf | 1-800-634-4113 |
American Century Capital Portfolios, Inc.
Investment Advisor:
American Century Investment Management, Inc.
Kansas City, Missouri
This report and the statements it contains are submitted for the general information of our shareholders. The report is not authorized for distribution to prospective investors unless preceded or accompanied by an effective prospectus.
©2013 American Century Proprietary Holdings, Inc. All rights reserved.
CL-ANN-80473 1312
ITEM 2. CODE OF ETHICS.
(a) | The registrant has adopted a Code of Ethics for Senior Financial Officers that applies to the registrant’s principal executive officer, principal financial officer, principal accounting officer, and persons performing similar functions. |
(f) | The registrant’s Code of Ethics for Senior Financial Officers was filed as Exhibit 12 (a)(1) to American Century Asset Allocation Portfolios, Inc.’s Annual Certified Shareholder Report on Form N-CSR, File No. 811-21591, on September 29, 2005, and is incorporated herein by reference. |
ITEM 3. AUDIT COMMITTEE FINANCIAL EXPERT.
(a)(1) | The registrant’s board has determined that the registrant has at least one audit committee financial expert serving on its audit committee. |
(a)(2) | M. Jeannine Strandjord and Stephen E. Yates are the registrant’s designated audit committee financial experts. They are “independent” as defined in Item 3 of Form N-CSR. |
ITEM 4. PRINCIPAL ACCOUNTANT FEES AND SERVICES.
The aggregate fees billed for each of the last two fiscal years for professional services rendered by the principal accountant for the audit of the registrant’s annual financial statements or services that are normally provided by the accountant in connection with statutory and regulatory filings or engagements for those fiscal years were as follows:
FY 2012: $34,511
FY 2013: $50,900
The aggregate fees billed in each of the last two fiscal years for assurance and related services by the principal accountant that are reasonably related to the performance of the audit of the registrant’s financial statements and are not reported under paragraph (a) of this Item were as follows:
For services rendered to the registrant:
Fees required to be approved pursuant to paragraph (c)(7)(ii) of Rule 2-01 of Regulation S-X (relating to certain engagements for non-audit services with the registrant’s investment adviser and its affiliates):
The aggregate fees billed in each of the last two fiscal years for professional services rendered by the principal accountant for tax compliance, tax advice, and tax planning were as follows:
For services rendered to the registrant:
FY 2012: $0
FY 2013: $0
Fees required to be approved pursuant to paragraph (c)(7)(ii) of Rule 2-01 of Regulation S-X (relating to certain engagements for non-audit services with the registrant’s investment adviser and its affiliates):
FY 2012: $0
FY 2013: $0
The aggregate fees billed in each of the last two fiscal years for products and services provided by the principal accountant, other than the services reported in paragraphs (a) through (c) of this Item were as follows:
For services rendered to the registrant:
Fees required to be approved pursuant to paragraph (c)(7)(ii) of Rule 2-01 of Regulation S-X (relating to certain engagements for non-audit services with the registrant’s investment adviser and its affiliates):
(e)(1) | In accordance with paragraph (c)(7)(i)(A) of Rule 2-01 of Regulation S-X, before the accountant is engaged by the registrant to render audit or non-audit services, the engagement is approved by the registrant’s audit committee. Pursuant to paragraph (c)(7)(ii) of Rule 2-01 of Regulation S-X, the registrant’s audit committee also pre-approves its accountant’s engagements for non-audit services with the registrant’s investment adviser, its parent company, and any entity controlled by, or under common control with the investment adviser that provides ongoing services to the registrant, if the engagement relates directly to the operations and financial reporting of the registrant. |
(e)(2) | All services described in each of paragraphs (b) through (d) of this Item were pre-approved before the engagement by the registrant’s audit committee pursuant to paragraph (c)(7)(i)(A) of Rule 2-01 of Regulation S-X. Consequently, none of such services were required to be approved by the audit committee pursuant to paragraph (c)(7)(i)(C). |
(f) | The percentage of hours expended on the principal accountant’s engagement to audit the registrant’s financial statements for the most recent fiscal year that were attributed to work performed by persons other than the principal accountant’s full-time, permanent employees was less than 50%. |
(g) | The aggregate non-audit fees billed by the registrant’s accountant for services rendered to the registrant, and rendered to the registrant’s investment adviser (not including any sub-adviser whose role is primarily portfolio management and is subcontracted with or overseen by another investment adviser), and any entity controlling, controlled by, or under common control with the adviser that provides ongoing services to the registrant for each of the last two fiscal years of the registrant were as follows: |
FY 2012: $ 68,768
FY 2013: $101,621
(h) | The registrant’s investment adviser and accountant have notified the registrant’s audit committee of all non-audit services that were rendered by the registrant’s accountant to the registrant’s investment adviser, its parent company, and any entity controlled by, or under common control with the investment adviser that provides services to the registrant, which services were not required to be pre-approved pursuant to paragraph (c)(7)(ii) of Rule 2-01 of Regulation S-X. The notification provided to the registrant’s audit committee included sufficient details regarding such services to allow the registrant’s audit committee to consider the continuing independence of its principal accountant. |
ITEM 5. AUDIT COMMITTEE OF LISTED REGISTRANTS.
Not applicable.
ITEM 6. INVESTMENTS.
(a) | The schedule of investments is included as part of the report to stockholders filed under Item 1 of this Form. |
ITEM 7. DISCLOSURE OF PROXY VOTING POLICIES AND PROCEDURES FOR CLOSED-END MANAGEMENT INVESTMENT COMPANIES.
Not applicable.
ITEM 8. PORTFOLIO MANAGERS OF CLOSED-END MANAGEMENT INVESTMENT COMPANIES.
Not applicable.
ITEM 9. PURCHASES OF EQUITY SECURITIES BY CLOSED-END MANAGEMENT INVESTMENT COMPANY AND AFFILIATED PURCHASERS.
Not applicable.
ITEM 10. SUBMISSION OF MATTERS TO A VOTE OF SECURITY HOLDERS.
During the reporting period, there were no material changes to the procedures by which shareholders may recommend nominees to the registrant’s board.
ITEM 11. CONTROLS AND PROCEDURES.
(a) | The registrant's principal executive officer and principal financial officer have concluded that the registrant's disclosure controls and procedures (as defined in Rule 30a-3(c) under the Investment Company Act of 1940) are effective based on their evaluation of these controls and procedures as of a date within 90 days of the filing date of this report. |
(b) | There were no changes in the registrant's internal control over financial reporting (as defined in Rule 30a-3(d) under the Investment Company Act of 1940) that occurred during the registrant's second fiscal quarter of the period covered by this report that have materially affected, or are reasonably likely to materially affect, the registrant's internal control over financial reporting. |
ITEM 12. EXHIBITS.
(a)(1) | Registrant’s Code of Ethics for Senior Financial Officers, which is the subject of the disclosure required by Item 2 of Form N-CSR, was filed as Exhibit 12(a)(1) to American Century Asset Allocation Portfolios, Inc.’s Certified Shareholder Report on Form N-CSR, File No. 811-21591, on September 29, 2005. |
(a)(2) | Separate certifications by the registrant’s principal executive officer and principal financial officer, pursuant to Section 302 of the Sarbanes-Oxley Act of 2002 and Rule 30a-2(a) under the Investment Company Act of 1940, are filed and attached hereto as EX-99.CERT. |
(b) | A certification by the registrant’s chief executive officer and chief financial officer, pursuant to Section 906 of the Sarbanes-Oxley Act of 2002, is furnished and attached hereto as EX-99.906CERT. |
SIGNATURES
Pursuant to the requirements of the Securities Exchange Act of 1934 and the Investment Company Act of 1940, the registrant has duly caused this report to be signed on its behalf by the undersigned, thereunto duly authorized.
Registrant: | American Century Capital Portfolios, Inc. | |
| | | | |
| | | | |
By: | /s/ Jonathan S. Thomas | |
| | Name: | Jonathan S. Thomas | |
| | Title: | President | |
| | | | |
Date: | December 30, 2013 | |
| | | |
Pursuant to the requirements of the Securities Exchange Act of 1934 and the Investment Company Act of 1940, this report has been signed below by the following persons on behalf of the registrant and in the capacities and on the dates indicated.
By: | /s/ Jonathan S. Thomas | |
| | Name: | Jonathan S. Thomas | |
| | Title: | President | |
| | | (principal executive officer) | |
| | | | |
| | | | |
Date: | December 30, 2013 | |
By: | /s/ C. Jean Wade | |
| | Name: | C. Jean Wade | |
| | Title: | Vice President, Treasurer, and | |
| | | Chief Financial Officer | |
| | | (principal financial officer) | |
| | | | |
Date: | December 30, 2013 | |