UNITED STATES
SECURITIES AND EXCHANGE COMMISSION
Washington, D.C. 20549
FORM N-CSR
CERTIFIED SHAREHOLDER REPORT OF REGISTERED
MANAGEMENT INVESTMENT COMPANIES
| Investment Company Act file number | 811-07820 | |||||
| AMERICAN CENTURY CAPITAL PORTFOLIOS, INC. | ||||||
| (Exact name of registrant as specified in charter) | ||||||
| 4500 MAIN STREET, KANSAS CITY, MISSOURI | 64111 | |||||
| (Address of principal executive offices) | (Zip Code) | |||||
CHARLES A. ETHERINGTON 4500 MAIN STREET, KANSAS CITY, MISSOURI 64111 | ||||||
| (Name and address of agent for service) | ||||||
| Registrant’s telephone number, including area code: | 816-531-5575 | |||||
| Date of fiscal year end: | 3-31 | |||||
| Date of reporting period: | 3-31-2012 | |||||
ITEM 1. REPORTS TO STOCKHOLDERS.
ANNUAL REPORT MARCH 31, 2012


| Equity Income Fund |
| President’s Letter | 2 |
| Independent Chairman’s Letter | 3 |
| Market Perspective | 4 |
| Performance | 5 |
| Portfolio Commentary | 7 |
| Fund Characteristics | 9 |
| Shareholder Fee Example | 10 |
| Schedule of Investments | 12 |
| Statement of Assets and Liabilities | 16 |
| Statement of Operations | 17 |
| Statement of Changes in Net Assets | 18 |
| Notes to Financial Statements | 19 |
| Financial Highlights | 26 |
| Report of Independent Registered Public Accounting Firm | 29 |
| Management | 30 |
| Additional Information | 33 |
Any opinions expressed in this report reflect those of the author as of the date of the report, and do not necessarily represent the opinions of American Century Investments® or any other person in the American Century Investments organization. Any such opinions are subject to change at any time based upon market or other conditions and American Century Investments disclaims any responsibility to update such opinions. These opinions may not be relied upon as investment advice and, because investment decisions made by American Century Investments funds are based on numerous factors, may not be relied upon as an indication of trading intent on behalf of any American Century Investments fund. Security examples are used for representational purposes only and are not intended as recommendations to purchase or sell securities. Performance information for comparative indices and securities is provided to American Century Investments by third party vendors. To the best of American Century Investments’ knowledge, such information is accurate at the time of printing.

Dear Investor:
Thank you for reviewing this annual report for the period ended March 31, 2012. Our report offers investment performance and portfolio information, presented with the expert perspective of our portfolio management team.
This report remains one of our most important vehicles for conveying information about fund returns, as well as market factors and strategies that affected fund performance. For additional, updated information, we encourage you to visit our website, americancentury.com. Click on the “Fund Performance” and “Insights & News” headings at the top of our Individual Investors site.
Mostly Positive U.S. Returns Belie the Period’s Volatility
U.S. market performance for the 12 months ended March 31, 2012 appeared more benign than it really was. Broadly speaking, U.S. stocks and bonds returned roughly 7-9% for the period, as indicated by the S&P 500 Index and the Barclays U.S. Aggregate Bond Index. But those solid returns masked the roller-coaster ride required to achieve them.
The reporting period began, in April 2011, with stock indices and U.S. Treasury yields at some of their highest levels since 2008, prior to the Financial Crisis plunge. These elevated levels reflected increased risk-taking as the markets priced in improving global economic growth, strong corporate earnings, and higher inflation.
This “risk-on” investing attitude switched to “risk-off” during the summer of 2011, transformed by high fuel prices, federal budget management concerns in the U.S., and the worsening sovereign debt crisis in Europe. Recessionary expectations pulled Treasury yields to record lows by September, and stock indices suffered double-digit declines from their peaks.
Sentiment switched again in the fourth quarter of 2011, as concerns about the European sovereign debt crisis and the U.S. economy eased. Renewed “risk-on” investing carried into the first quarter of 2012, boosting growth stocks and high-yield bonds in particular. But the financial markets remain subject to potentially high volatility as they continue to wrestle with uncertainties regarding Europe, the Middle East, economic strength, government budget deficits, and the U.S. presidential election. We believe strongly in adhering to a disciplined, diversified, long-term investment approach during volatile periods, and we appreciate your continued trust in us during these unsettled times.
Sincerely,

Jonathan Thomas
President and Chief Executive Officer
American Century Investments
2

The assets under management in American Century Investments’ funds grow through investors placing new assets in the funds and through market appreciation. Asset growth has been at near record levels over the past two years as market movements have been generally upward, the funds’ relative returns have been favorable, and the distribution strategies implemented by fund management have been successful.
The board reviews fund performance and distribution strategies on a regular basis. Several years ago, the fund’s management team discussed with the board its plans to grow fund assets in the intermediary, institutional and international distribution channels. These distribution strategies have produced strong positive growth. The growth in the intermediary channel recognizes the funds’ strong relative investment performance and the desire of many shareholders to seek financial guidance. Investors in both the institutional and international channels appear to find the funds’ risk-based investment strategies attractive. The board continues to support fund management’s strategies to increase fund assets and will continue to work to provide the benefits of these gains to fund shareholders.
We continue to receive a steady flow of very thoughtful questions from shareholders. If there are issues that you would like the board to address please email me at dhpratt@fundboardchair.com. Thank you for your continued investment in American Century Investments funds.
Best regards,

Don Pratt
3

Chief Investment Officer,
U.S. Value Equity
U.S. Stocks Advanced
Despite some meaningful market volatility, U.S. stocks generated positive performance for the one-year period ended March 31, 2012. The overall advance was driven by a robust equity market rally over the last six months of the period as economic conditions improved.
After rallying throughout much of April 2011, the stock market declined sharply from May through September amid weaker economic conditions in the U.S. and an increasingly challenging sovereign debt crisis in Europe. Public debt issues in the U.S. also weighed on the market as the government wrestled with the federal debt ceiling and a major credit rating agency downgraded the credit rating of U.S. debt from AAA to AA+ in August—the first such downgrade in the country’s history.
Market sentiment shifted markedly over the last six months of the period as evidence of improving economic growth helped ease concerns about a possible recession. Most notably, employment growth showed signs of life, helping push the unemployment rate down to a three-year low. Consumer spending and manufacturing activity also picked up, and mild winter weather provided a lift to the construction industry. The situation in Europe also improved as liquidity injections from the European Central Bank and a debt restructuring agreement in Greece helped provide some stability to the Continent’s debt markets and banking sector. The end result was a steady and substantial market rally over the last six months.
Value Stocks Lagged
As the table below illustrates, large-cap stocks and growth issues led the market’s overall advance. Growth stocks benefited the most from the improving economic environment over the last half of the period, along with investors’ greater appetite for risk. Sector performance also favored growth shares over value during the period. The top-performing sectors in the S&P 500 Index included information technology and consumer discretionary, two growth-oriented sectors of the market. In contrast, the financials sector, which is the largest sector weighting in most value indices, declined for the reporting period.
| U.S. Stock Index Returns | ||||
| For the 12 months ended March 31, 2012 | ||||
| Russell 1000 Index (Large-Cap) | 7.86% | Russell 2000 Index (Small-Cap) | -0.18% | |
| Russell 1000 Growth Index | 11.02% | Russell 2000 Growth Index | 0.68% | |
| Russell 1000 Value Index | 4.79% | Russell 2000 Value Index | -1.07% | |
| Russell Midcap Index | 3.31% | |||
| Russell Midcap Growth Index | 4.43% | |||
| Russell Midcap Value Index | 2.28% | |||
4
| Total Returns as of March 31, 2012 | ||||||
| Average Annual Returns | ||||||
Ticker Symbol | 1 year | 5 years | 10 years | Since Inception | Inception Date | |
| Investor Class | TWEIX | 6.24% | 2.38% | 5.96% | 10.49% | 8/1/94 |
| Russell 3000 Value Index | — | 4.30% | -0.75% | 4.73% | 8.98%(1) | — |
| S&P 500 Index | — | 8.54% | 2.01% | 4.12% | 8.59%(1) | — |
| Institutional Class | ACIIX | 6.31% | 2.58% | 6.17% | 7.61% | 7/8/98 |
A Class(2) No sales charge* With sales charge* | TWEAX | 5.98% -0.07% | 2.12% 0.92% | 5.69% 5.07% | 8.41% 7.98% | 3/7/97 |
B Class No sales charge* With sales charge* | AEKBX | 5.18% 1.18% | — — | — — | 0.52% 0.08% | 9/28/07 |
| C Class | AEYIX | 5.05% | 1.36% | 4.91% | 5.37% | 7/13/01 |
| R Class | AEURX | 5.59% | 1.87% | — | 6.10% | 8/29/03 |
| * | Sales charges include initial sales charges and contingent deferred sales charges (CDSCs), as applicable. A Class shares have a 5.75% maximum initial sales charge and may be subject to a maximum CDSC of 1.00%. B Class shares redeemed within six years of purchase are subject to a CDSC that declines from 5.00% during the first year after purchase to 0.00% the sixth year after purchase. C Class shares redeemed within 12 months of purchase are subject to a maximum CDSC of 1.00%. The SEC requires that mutual funds provide performance information net of maximum sales charges in all cases where charges could be applied. |
| (1) | Since 7/31/94, the date nearest the Investor Class’s inception for which data are available. |
| (2) | Prior to September 4, 2007, the A Class was referred to as the Advisor Class and did not have a front-end sales charge. Performance prior to that date has been adjusted to reflect this charge. |
Data presented reflect past performance. Past performance is no guarantee of future results. Current performance may be higher or lower than the performance shown. Investment return and principal value will fluctuate, and redemption value may be more or less than original cost. To obtain performance data current to the most recent month end, please call 1-800-345-2021 or visit americancentury.com. International investing involves special risks, such as political instability and currency fluctuations. The fund’s investment process may result in high portfolio turnover, which could mean high transaction costs, affecting both performance and capital gains tax liabilities to investors.
Unless otherwise indicated, performance reflects Investor Class shares; performance for other share classes will vary due to differences in fee structure. For information about other share classes available, please consult the prospectus. Data assumes reinvestment of dividends and capital gains, and none of the charts reflect the deduction of taxes that a shareholder would pay on fund distributions or the redemption of fund shares. Returns for the indices are provided for comparison. The fund’s total returns include operating expenses (such as transaction costs and management fees) that reduce returns, while the total returns of the indices do not.
5
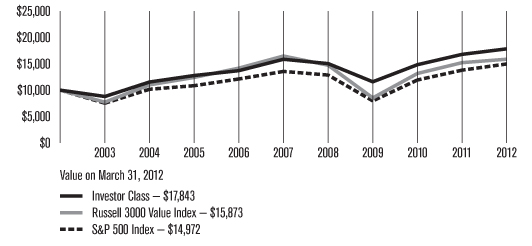
| Growth of $10,000 Over 10 Years |
| $10,000 investment made March 31, 2002 |
| Total Annual Fund Operating Expenses | |||||
| Investor Class | Institutional Class | A Class | B Class | C Class | R Class |
| 0.96% | 0.76% | 1.21% | 1.96% | 1.96% | 1.46% |
The total annual fund operating expenses shown is as stated in the fund’s prospectus current as of the date of this report. The prospectus may vary from the expense ratio shown elsewhere in this report because it is based on a different time period, includes acquired fund fees and expenses, and, if applicable, does not include fee waivers or expense reimbursements.
Data presented reflect past performance. Past performance is no guarantee of future results. Current performance may be higher or lower than the performance shown. Investment return and principal value will fluctuate, and redemption value may be more or less than original cost. To obtain performance data current to the most recent month end, please call 1-800-345-2021 or visit americancentury.com. International investing involves special risks, such as political instability and currency fluctuations. The fund’s investment process may result in high portfolio turnover, which could mean high transaction costs, affecting both performance and capital gains tax liabilities to investors.
Unless otherwise indicated, performance reflects Investor Class shares; performance for other share classes will vary due to differences in fee structure. For information about other share classes available, please consult the prospectus. Data assumes reinvestment of dividends and capital gains, and none of the charts reflect the deduction of taxes that a shareholder would pay on fund distributions or the redemption of fund shares. Returns for the indices are provided for comparison. The fund’s total returns include operating expenses (such as transaction costs and management fees) that reduce returns, while the total returns of the indices do not.
6
Portfolio Managers: Phil Davidson, Kevin Toney, and Michael Liss
Performance Summary
Equity Income returned 6.24%* for the 12 months ended March 31, 2012. By comparison, its benchmark, the Russell 3000 Value Index, returned 4.30%. The broader market, as measured by the S&P 500 Index, returned 8.54%. The average return for Morningstar’s Large Cap Value category** (its performance, like Equity Income’s, reflects operating expenses) was 3.93%. The portfolio’s return reflects operating expenses, while the indices’ returns do not.
The U.S. stock market posted a gain during the one-year reporting period, largely as a result of its strong performance during the first quarter of 2012. For most of the 12-month period, investors were preoccupied with Europe’s financial woes, which threatened to spread from Greece to other nations and seemed likely to cause problems for European banks. Lackluster U.S. economic growth and the downgrade of U.S. debt by Standard & Poor’s Ratings also dampened market sentiment. Investor risk appetite improved near the end of 2011 when the U.S. economy, proving surprisingly resilient, returned to its slow-growth path. Employers added new jobs, and corporate earnings remained solid. Investors also grew more optimistic as the European Central Bank provided inexpensive loans to European banks and the financial crisis eased. In this environment, growth stocks outperformed value stocks across the capitalization spectrum. For the reporting period, Equity Income’s higher-quality, income-producing securities performed well in both relative and absolute terms. Many of the companies owned by the portfolio have strong balance sheets and competitive positions, which allowed them to continue paying dividends and, in some cases, increase their dividend payouts. Investments in the financials, energy, and consumer staples sector enhanced relative performance. The portfolio was hampered by positions in the health care and information technology sectors.
Equity Income is carefully managed to provide solid long-term performance. Since its inception on August 1, 1994, Equity Income has produced an average annual return of 10.49%, topping the returns for Morningstar’s Large Cap Value category average, the Russell 3000 Value Index, and the S&P 500 Index for the same period (see performance information on pages 5–6 or in the footnotes below).
Financials Enhanced Results
In financials, which posted negative results in the Russell 3000 Value Index, Equity Income’s conservative stance was advantageous. The portfolio did not own Bank of America’s common stock, which declined nearly 28% in the benchmark. It did own the bank’s less-risky convertible preferred stock, which appreciated in value. Equity Income also had minimal exposure to some of the sector’s notable underperformers. For example, it did not hold Citigroup and was significantly underweight Goldman Sachs Group.
| * | All fund returns referenced in this commentary are for Investor Class shares. |
** | The average returns for the Morningstar’s Large Cap Value category were -0.24% and 4.09% for the five- and ten-year periods ended March 31, 2012, respectively, and 7.68% from September 1, 1994, the date nearest the Investor Class’s inception for which data are available through March 31, 2012. ©2012 Morningstar, Inc. All Rights Reserved. The information contained herein: (1) is proprietary to Morningstar and/or its content providers; (2) may not be copied or distributed; and (3) is not warranted to be accurate, complete or timely. Neither Morningstar nor its content providers are responsible for any damages or losses arising from any use of this information. |
7
Elsewhere in the sector, the portfolio’s investments were concentrated in the less-volatile names in the insurance industry. Equity Income was overweight shares of Marsh & McLennan Companies. Despite a difficult pricing environment and low interest rates, the company posted attractive returns on capital.
Energy Boosted Performance
Within the energy sector, the portfolio benefited from an underweight position in energy equipment and services. Specifically, it did not have exposure to some of the riskier names in the oil services industry and among exploration and production stocks. It did not own Baker Hughes, an oilfield services company with exposure to the shale gas industry. As natural gas prices declined, Baker Hughes struggled with operational issues and was impacted by weaker pricing.
The energy sector was also the source of a top detractor, a Peabody Energy convertible security. Peabody, a high-quality coal mining company, lagged as the mild winter hurt earnings. Investors were also concerned about the impact on demand of future government regulation and slowing global economic growth. In addition, natural gas and coal prices tend to move in tandem; as natural gas prices fell during the quarter, so did the price of coal.
Consumer Staples Contributed
An overweight in consumer staples, which posted the second-strongest sector performance in the benchmark, added value as investors gravitated to more defensive stocks. A leading contributor was General Mills. The food maker has gained market share and mitigated higher commodities costs by hiking prices and improving cost efficiencies.
Health Care Hurt Results
Though an overweight in health care, the benchmark’s strongest performing sector, contributed to relative performance, Equity Income was hindered by its conservative bias. An investment in a Lincare Holdings convertible security detracted. Lincare provides in-home respiratory therapy services.
Information Technology Detracted
The portfolio’s underweight in the information technology sector was a drag on relative results. Equity Income did not own computer networking company Cisco Systems, which outperformed in the benchmark. Although the portfolio benefited in absolute terms from a position in an Intel convertible security, it was underweight the chipmaker’s common stock, which appreciated significantly during the reporting period.
Outlook
We will continue to follow our disciplined, bottom-up investment process, selecting companies one at a time for the portfolio. As of March 31, 2012, we see attractive opportunities in health care, industrials, consumer staples, and telecommunication services, reflected by our overweight positions in these sectors. We continue to be selective in our holdings of information technology, consumer discretionary, financials, and utilities companies, relying on fundamental analysis to identify strong, financially-sound businesses whose securities provide attractive yields.
8
| MARCH 31, 2012 | |
| Top Ten Holdings | % of net assets |
| Wells Fargo & Co. (Convertible) | 5.0% |
| Procter & Gamble Co. (The) | 2.7% |
| Johnson & Johnson | 2.7% |
| Marsh & McLennan Cos., Inc. | 2.7% |
| Exxon Mobil Corp. | 2.6% |
| AT&T, Inc. | 2.5% |
| Pfizer, Inc. | 2.5% |
| Merck & Co., Inc. | 2.3% |
| Stanley Black & Decker, Inc. (Convertible) | 2.3% |
| Total S.A. | 2.1% |
| Top Five Industries | % of net assets |
| Oil, Gas and Consumable Fuels | 10.6% |
| Pharmaceuticals | 9.0% |
| Commercial Banks | 7.2% |
| Insurance | 6.5% |
| Household Products | 5.5% |
| Types of Investments in Portfolio | % of net assets |
| Domestic Common Stocks | 63.6% |
| Foreign Common Stocks* | 6.5% |
| Convertible Bonds | 15.6% |
| Convertible Preferred Stocks | 9.7% |
| Exchange-Traded Funds | 2.8% |
| Total Equity Exposure | 98.2% |
| Temporary Cash Investments | 1.7% |
| Other Assets and Liabilities | 0.1% |
*Includes depositary shares, dual listed securities and foreign ordinary shares.
9
Fund shareholders may incur two types of costs: (1) transaction costs, including sales charges (loads) on purchase payments and redemption/exchange fees; and (2) ongoing costs, including management fees; distribution and service (12b-1) fees; and other fund expenses. This example is intended to help you understand your ongoing costs (in dollars) of investing in your fund and to compare these costs with the ongoing cost of investing in other mutual funds.
The example is based on an investment of $1,000 made at the beginning of the period and held for the entire period from October 1, 2011 to March 31, 2012.
Actual Expenses
The table provides information about actual account values and actual expenses for each class. You may use the information, together with the amount you invested, to estimate the expenses that you paid over the period. First, identify the share class you own. Then simply divide your account value by $1,000 (for example, an $8,600 account value divided by $1,000 = 8.6), then multiply the result by the number under the heading “Expenses Paid During Period” to estimate the expenses you paid on your account during this period.
If you hold Investor Class shares of any American Century Investments fund, or Institutional Class shares of the American Century Diversified Bond Fund, in an American Century Investments account (i.e., not a financial intermediary or retirement plan account), American Century Investments may charge you a $12.50 semiannual account maintenance fee if the value of those shares is less than $10,000. We will redeem shares automatically in one of your accounts to pay the $12.50 fee. In determining your total eligible investment amount, we will include your investments in all personal accounts (including American Century Investments Brokerage accounts) registered under your Social Security number. Personal accounts include individual accounts, joint accounts, UGMA/UTMA accounts, personal trusts, Coverdell Education Savings Accounts and IRAs (including traditional, Roth, Rollover, SEP-, SARSEP- and SIMPLE-IRAs), and certain other retirement accounts. If you have only business, business retirement, employer-sponsored or American Century Investments Brokerage accounts, you are currently not subject to this fee. If you are subject to the Account Maintenance Fee, your account value could be reduced by the fee amount.
Hypothetical Example for Comparison Purposes
The table also provides information about hypothetical account values and hypothetical expenses based on the actual expense ratio of each class of your fund and an assumed rate of return of 5% per year before expenses, which is not the actual return of a fund’s share class. The hypothetical account values and expenses may not be used to estimate the actual ending account balance or expenses you paid for the period. You may use this information to compare the ongoing costs of investing in your fund and other funds. To do so, compare this 5% hypothetical example with the 5% hypothetical examples that appear in the shareholder reports of the other funds.
10
Please note that the expenses shown in the table are meant to highlight your ongoing costs only and do not reflect any transactional costs, such as sales charges (loads) or redemption/exchange fees. Therefore, the table is useful in comparing ongoing costs only, and will not help you determine the relative total costs of owning different funds. In addition, if these transactional costs were included, your costs would have been higher.
Beginning Account Value 10/1/11 | Ending Account Value 3/31/12 | Expenses Paid During Period(1) 10/1/11 – 3/31/12 | Annualized Expense Ratio(1) | |
| Actual | ||||
| Investor Class | $1,000 | $1,173.70 | $5.11 | 0.94% |
| Institutional Class | $1,000 | $1,173.00 | $4.02 | 0.74% |
| A Class | $1,000 | $1,172.30 | $6.46 | 1.19% |
| B Class | $1,000 | $1,167.80 | $10.51 | 1.94% |
| C Class | $1,000 | $1,166.30 | $10.51 | 1.94% |
| R Class | $1,000 | $1,169.60 | $7.81 | 1.44% |
| Hypothetical | ||||
| Investor Class | $1,000 | $1,020.30 | $4.75 | 0.94% |
| Institutional Class | $1,000 | $1,021.30 | $3.74 | 0.74% |
| A Class | $1,000 | $1,019.05 | $6.01 | 1.19% |
| B Class | $1,000 | $1,015.30 | $9.77 | 1.94% |
| C Class | $1,000 | $1,015.30 | $9.77 | 1.94% |
| R Class | $1,000 | $1,017.80 | $7.26 | 1.44% |
| (1) | Expenses are equal to the class’s annualized expense ratio listed in the table above, multiplied by the average account value over the period, multiplied by 183, the number of days in the most recent fiscal half-year, divided by 366, to reflect the one-half year period. |
11
Shares/ Principal Amount | Value | |||||||
| Common Stocks — 70.1% | ||||||||
| AEROSPACE AND DEFENSE — 0.6% | ||||||||
| Raytheon Co. | 1,196,672 | $63,160,348 | ||||||
| AIR FREIGHT AND LOGISTICS — 1.5% | ||||||||
| United Parcel Service, Inc., Class B | 1,889,895 | 152,552,324 | ||||||
| AUTOMOBILES — 0.3% | ||||||||
| Honda Motor Co., Ltd. | 694,900 | 26,404,017 | ||||||
| BEVERAGES — 1.2% | ||||||||
| Dr Pepper Snapple Group, Inc. | 2,989,571 | 120,210,650 | ||||||
| CAPITAL MARKETS — 2.3% | ||||||||
| Goldman Sachs Group, Inc. (The) | 171,981 | 21,389,277 | ||||||
| Northern Trust Corp. | 3,999,383 | 189,770,723 | ||||||
| T. Rowe Price Group, Inc. | 190,000 | 12,407,000 | ||||||
| 223,567,000 | ||||||||
| CHEMICALS — 2.7% | ||||||||
| Air Products & Chemicals, Inc. | 999,000 | 91,708,200 | ||||||
| E.I. du Pont de Nemours & Co. | 3,299,742 | 174,556,352 | ||||||
| 266,264,552 | ||||||||
| COMMERCIAL BANKS — 2.2% | ||||||||
| Comerica, Inc. | 492,562 | 15,939,306 | ||||||
| Commerce Bancshares, Inc. | 1,899,062 | 76,949,992 | ||||||
| PNC Financial Services Group, Inc. | 1,589,836 | 102,528,524 | ||||||
| SunTrust Banks, Inc. | 998,177 | 24,125,938 | ||||||
| 219,543,760 | ||||||||
| COMMERCIAL SERVICES AND SUPPLIES — 2.9% | ||||||||
| Republic Services, Inc. | 3,589,174 | 109,685,157 | ||||||
| Waste Management, Inc. | 4,998,938 | 174,762,873 | ||||||
| 284,448,030 | ||||||||
| DISTRIBUTORS — 0.6% | ||||||||
| Genuine Parts Co. | 999,309 | 62,706,640 | ||||||
| DIVERSIFIED FINANCIAL SERVICES — 1.9% | ||||||||
| JPMorgan Chase & Co. | 3,998,767 | 183,863,307 | ||||||
| DIVERSIFIED TELECOMMUNICATION SERVICES — 4.3% | ||||||||
| AT&T, Inc. | 7,995,646 | 249,704,024 | ||||||
| CenturyLink, Inc. | 4,399,755 | 170,050,531 | ||||||
| 419,754,555 | ||||||||
| ELECTRIC UTILITIES — 0.4% | ||||||||
| Portland General Electric Co. | 1,542,666 | 38,535,797 | ||||||
| ELECTRICAL EQUIPMENT — 1.0% | ||||||||
ABB Ltd.(1) | 489,278 | 10,038,140 | ||||||
| Emerson Electric Co. | 979,400 | 51,105,092 | ||||||
| Rockwell Automation, Inc. | 429,489 | 34,230,273 | ||||||
| 95,373,505 | ||||||||
| ELECTRONIC EQUIPMENT, INSTRUMENTS AND COMPONENTS — 0.7% | ||||||||
| Molex, Inc., Class A | 2,892,258 | 67,823,450 | ||||||
| FOOD AND STAPLES RETAILING — 2.0% | ||||||||
| SYSCO Corp. | 3,298,548 | 98,494,643 | ||||||
| Wal-Mart Stores, Inc. | 1,690,078 | 103,432,774 | ||||||
| 201,927,417 | ||||||||
| FOOD PRODUCTS — 0.7% | ||||||||
| Campbell Soup Co. | 998,400 | 33,795,840 | ||||||
| General Mills, Inc. | 998,900 | 39,406,605 | ||||||
| 73,202,445 | ||||||||
| GAS UTILITIES — 3.0% | ||||||||
| AGL Resources, Inc. | 3,999,467 | 156,859,096 | ||||||
| Piedmont Natural Gas Co., Inc. | 1,097,902 | 34,111,815 | ||||||
WGL Holdings, Inc.(2) | 2,568,917 | 104,554,922 | ||||||
| 295,525,833 | ||||||||
| HEALTH CARE EQUIPMENT AND SUPPLIES — 0.4% | ||||||||
| Becton, Dickinson and Co. | 498,215 | 38,686,395 | ||||||
| HOTELS, RESTAURANTS AND LEISURE — 0.3% | ||||||||
| Carnival Corp. | 997,900 | 32,012,632 | ||||||
| HOUSEHOLD DURABLES — 0.2% | ||||||||
| Whirlpool Corp. | 298,200 | 22,919,652 | ||||||
| HOUSEHOLD PRODUCTS — 5.5% | ||||||||
| Clorox Co. | 1,798,146 | 123,622,538 | ||||||
| Kimberly-Clark Corp. | 1,999,214 | 147,721,922 | ||||||
| Procter & Gamble Co. (The) | 3,998,590 | 268,745,234 | ||||||
| 540,089,694 | ||||||||
| INDUSTRIAL CONGLOMERATES — 3.3% | ||||||||
| General Electric Co. | 2,998,200 | 60,173,874 | ||||||
| Koninklijke Philips Electronics NV | 1,597,635 | 32,387,632 | ||||||
| Siemens AG | 599,200 | 60,407,962 | ||||||
| Tyco International Ltd. | 2,990,082 | 167,982,807 | ||||||
| 320,952,275 | ||||||||
| INSURANCE — 5.4% | ||||||||
| ACE Ltd. | 499,481 | 36,562,009 | ||||||
| Allstate Corp. (The) | 2,795,352 | 92,022,988 | ||||||
| Chubb Corp. (The) | 1,999,235 | 138,167,131 | ||||||
| Marsh & McLennan Cos., Inc. | 7,989,080 | 261,961,933 | ||||||
| 528,714,061 | ||||||||
12
Shares/ Principal Amount | Value | |||||||
| IT SERVICES — 0.1% | ||||||||
| Paychex, Inc. | 496,002 | $15,371,102 | ||||||
| MACHINERY — 0.2% | ||||||||
| Atlas Copco AB B Shares | 857,665 | 18,486,506 | ||||||
| MEDIA — 0.3% | ||||||||
| Omnicom Group, Inc. | 499,023 | 25,275,515 | ||||||
| METALS AND MINING — 0.7% | ||||||||
| Freeport-McMoRan Copper & Gold, Inc. | 377,948 | 14,377,142 | ||||||
| Newmont Mining Corp. | 998,700 | 51,203,349 | ||||||
| 65,580,491 | ||||||||
| MULTI-UTILITIES — 2.2% | ||||||||
| Consolidated Edison, Inc. | 2,598,478 | 151,803,085 | ||||||
| PG&E Corp. | 1,399,900 | 60,769,659 | ||||||
| 212,572,744 | ||||||||
| MULTILINE RETAIL — 0.2% | ||||||||
| Target Corp. | 389,900 | 22,719,473 | ||||||
| OIL, GAS AND CONSUMABLE FUELS — 7.8% | ||||||||
| Chevron Corp. | 1,498,492 | 160,698,282 | ||||||
| El Paso Pipeline Partners LP | 2,599,442 | 90,694,531 | ||||||
| Exxon Mobil Corp. | 2,989,282 | 259,260,428 | ||||||
| Spectra Energy Partners LP | 1,699,480 | 54,298,386 | ||||||
| Total S.A. | 3,998,725 | 203,937,674 | ||||||
| 768,889,301 | ||||||||
| PHARMACEUTICALS — 9.0% | ||||||||
| Abbott Laboratories | 966,953 | 59,264,549 | ||||||
| Bristol-Myers Squibb Co. | 1,998,529 | 67,450,354 | ||||||
| Eli Lilly & Co. | 499,288 | 20,106,328 | ||||||
| Johnson & Johnson | 3,999,280 | 263,792,509 | ||||||
| Merck & Co., Inc. | 5,988,531 | 229,959,590 | ||||||
| Pfizer, Inc. | 10,999,779 | 249,254,992 | ||||||
| 889,828,322 | ||||||||
| REAL ESTATE INVESTMENT TRUSTS (REITs) — 0.2% | ||||||||
| American Tower Corp. | 296,900 | 18,710,638 | ||||||
| SEMICONDUCTORS AND SEMICONDUCTOR EQUIPMENT — 1.3% | ||||||||
| Applied Materials, Inc. | 9,998,202 | 124,377,633 | ||||||
| SOFTWARE — 0.3% | ||||||||
| Microsoft Corp. | 898,714 | 28,983,526 | ||||||
| SPECIALTY RETAIL — 1.6% | ||||||||
| Lowe’s Cos., Inc. | 4,995,002 | 156,743,163 | ||||||
| THRIFTS AND MORTGAGE FINANCE — 2.0% | ||||||||
Capitol Federal Financial, Inc.(2) | 8,798,659 | 104,352,096 | ||||||
| People’s United Financial, Inc. | 6,988,706 | 92,530,467 | ||||||
| 196,882,563 | ||||||||
| WIRELESS TELECOMMUNICATION SERVICES — 0.8% | ||||||||
| Vodafone Group plc | 9,997,776 | 27,537,281 | ||||||
| Vodafone Group plc ADR | 1,998,000 | 55,284,660 | ||||||
| 82,821,941 | ||||||||
TOTAL COMMON STOCKS (Cost $5,892,733,352) | 6,905,481,257 | |||||||
| Convertible Bonds — 15.6% | ||||||||
| CAPITAL MARKETS — 1.1% | ||||||||
Credit Suisse Securities USA LLC, (convertible into Goldman Sachs Group, Inc. (The)), 14.90%, 4/20/12(3)(4) | $179,400 | 19,656,140 | ||||||
Deutsche Bank AG, (convertible into Charles Schwab Corp. (The)), 12.98%, 6/19/12(3)(4) | 1,930,000 | 24,108,595 | ||||||
Goldman Sachs Group, Inc. (The), (convertible into Charles Schwab Corp. (The)), 12.45%, 6/11/12(3)(4) | 1,000,000 | 13,365,000 | ||||||
| Janus Capital Group, Inc., 3.25%, 7/15/14 | 49,198,000 | 52,518,865 | ||||||
| 109,648,600 | ||||||||
| ENERGY EQUIPMENT AND SERVICES — 0.1% | ||||||||
UBS AG, (convertible into Schlumberger Ltd.), 18.75%, 4/11/12(3)(4) | 188,700 | 12,591,951 | ||||||
| FOOD PRODUCTS — 0.2% | ||||||||
Goldman Sachs Group, Inc. (The), (convertible into Ralcorp Holdings, Inc.), 2.05%, 9/26/12(3)(4) | 176,900 | 12,881,150 | ||||||
| HEALTH CARE EQUIPMENT AND SUPPLIES — 0.7% | ||||||||
Hologic, Inc., 2.00%, 12/15/13(5) | 69,962,000 | 69,874,548 | ||||||
| HEALTH CARE PROVIDERS AND SERVICES — 4.5% | ||||||||
| LifePoint Hospitals, Inc., 3.25%, 8/15/25 | 155,285,000 | 156,643,744 | ||||||
| LifePoint Hospitals, Inc., 3.50%, 5/15/14 | 118,944,000 | 124,891,200 | ||||||
| Lincare Holdings, Inc., Series A, 2.75%, 11/1/37 | 155,846,000 | 159,936,957 | ||||||
| 441,471,901 | ||||||||
| HOTELS, RESTAURANTS AND LEISURE — 1.4% | ||||||||
| International Game Technology, 3.25%, 5/1/14 | 119,415,000 | 135,983,831 | ||||||
| MEDIA — 0.6% | ||||||||
| tw telecom, inc., 2.375%, 4/1/26 | 44,537,000 | 55,392,894 | ||||||
13
Shares/ Principal Amount | Value | |||||||
| OIL, GAS AND CONSUMABLE FUELS — 2.0% | ||||||||
| Peabody Energy Corp., 4.75%, 12/15/41 | $202,040,000 | $192,948,200 | ||||||
| PAPER AND FOREST PRODUCTS — 0.7% | ||||||||
| Rayonier TRS Holdings, Inc., 3.75%, 10/15/12 | 58,190,000 | 71,137,275 | ||||||
| REAL ESTATE INVESTMENT TRUSTS (REITs) — 3.1% | ||||||||
| Annaly Capital Management, Inc., 4.00%, 2/15/15 | 25,988,000 | 30,340,990 | ||||||
Host Hotels & Resorts LP, 3.25%, 4/15/24(3) | 127,724,000 | 142,731,570 | ||||||
Host Hotels & Resorts LP, 2.625%, 4/15/27(3) | 131,558,000 | 132,051,343 | ||||||
| 305,123,903 | ||||||||
| SEMICONDUCTORS AND SEMICONDUCTOR EQUIPMENT — 1.2% | ||||||||
| Intel Corp., 2.95%, 12/15/35 | 69,989,000 | 80,837,295 | ||||||
| Microchip Technology, Inc., 2.125%, 12/15/37 | 29,937,000 | 41,462,745 | ||||||
| 122,300,040 | ||||||||
TOTAL CONVERTIBLE BONDS(Cost $1,511,074,870) | 1,529,354,293 | |||||||
| Convertible Preferred Stocks — 9.7% | ||||||||
| COMMERCIAL BANKS — 5.0% | ||||||||
| Wells Fargo & Co., 7.50% | 437,099 | 488,108,453 | ||||||
| DIVERSIFIED FINANCIAL SERVICES — 0.3% | ||||||||
| Bank of America Corp., 7.25% | 27,919 | 27,329,909 | ||||||
| INSURANCE — 1.1% | ||||||||
| MetLife, Inc., 5.00% | 1,588,961 | 112,371,322 | ||||||
| MACHINERY — 2.3% | ||||||||
| Stanley Black & Decker, Inc., 4.75% | 1,853,585 | 225,544,223 | ||||||
| OIL, GAS AND CONSUMABLE FUELS — 0.8% | ||||||||
| Apache Corp., 6.00% | 1,498,213 | 83,210,750 | ||||||
| REAL ESTATE INVESTMENT TRUSTS (REITs) — 0.2% | ||||||||
| Health Care REIT, Inc., 6.50% | 370,493 | 19,369,374 | ||||||
TOTAL CONVERTIBLE PREFERRED STOCKS (Cost $935,988,771) | 955,934,031 | |||||||
| Exchange-Traded Funds — 2.8% | ||||||||
| iShares Russell 1000 Value Index Fund | 1,988,900 | 139,362,223 | ||||||
| SPDR S&P 500 ETF Trust | 989,100 | 139,186,152 | ||||||
TOTAL EXCHANGE-TRADED FUNDS (Cost $244,868,962) | 278,548,375 | |||||||
| Temporary Cash Investments — 1.7% | ||||||||
Federal Home Loan Bank, 0.01%, 4/2/12(6) | $70,000,000 | 70,000,000 | ||||||
Repurchase Agreement, Bank America Merrill Lynch, (collateralized by various U.S. Treasury obligations, 6.125%, 11/15/27, valued at $26,753,200), in a joint trading account at 0.01%, dated 3/30/12, due 4/2/12 (Delivery value $26,202,722) | 26,202,700 | |||||||
Repurchase Agreement, Credit Suisse First Boston, Inc., (collateralized by various U.S. Treasury obligations, 4.375%, 5/15/41, valued at $16,683,064), in a joint trading account at 0.03%, dated 3/30/12, due 4/2/12 (Delivery value $16,376,728) | 16,376,687 | |||||||
Repurchase Agreement, Goldman Sachs & Co., (collateralized by various U.S. Treasury obligations, 4.50%, 5/15/38, valued at $20,084,368), in a joint trading account at 0.03%, dated 3/30/12, due 4/2/12 (Delivery value $19,652,074) | 19,652,025 | |||||||
| SSgA U.S. Government Money Market Fund | 37,198,873 | 37,198,873 | ||||||
TOTAL TEMPORARY CASH INVESTMENTS (Cost $169,430,283) | 169,430,285 | |||||||
TOTAL INVESTMENT SECURITIES — 99.9% (Cost $8,754,096,238) | 9,838,748,241 | |||||||
| OTHER ASSETS AND LIABILITIES — 0.1% | 8,765,016 | |||||||
| TOTAL NET ASSETS — 100.0% | $9,847,513,257 | |||||||
14
| Forward Foreign Currency Exchange Contracts | |||||||||||||
| Contracts to Buy | Counterparty | Settlement Date | Value | Unrealized Gain (Loss) | |||||||||
| 180,054 | CHF for USD | Credit Suisse AG | 4/30/12 | $199,522 | $45 | ||||||||
| 59,413,950 | JPY for USD | Credit Suisse AG | 4/27/12 | 717,961 | 182 | ||||||||
| 3,262,044 | SEK for USD | Credit Suisse AG | 4/30/12 | 492,523 | 4,836 | ||||||||
| 3,043,434 | SEK for USD | Credit Suisse AG | 4/30/12 | 459,515 | (400 | ) | |||||||
| $1,869,521 | $4,663 | ||||||||||||
(Value on Settlement Date $1,864,858)
| Contracts to Sell | Counterparty | Settlement Date | Value | Unrealized Gain (Loss) | |||||||||
| 7,272,628 | CHF for USD | Credit Suisse AG | 4/30/12 | $8,058,939 | $(36,448 | ) | |||||||
| 149,202,089 | EUR for USD | UBS AG | 4/30/12 | 199,013,603 | (483,811 | ) | |||||||
| 28,513,388 | EUR for USD | UBS AG | 4/30/12 | 38,032,659 | (195,107 | ) | |||||||
| 41,916,902 | GBP for USD | Credit Suisse AG | 4/30/12 | 67,034,429 | (447,335 | ) | |||||||
| 2,045,090,700 | JPY for USD | Credit Suisse AG | 4/27/12 | 24,712,994 | (80,767 | ) | |||||||
| 101,609,213 | SEK for USD | Credit Suisse AG | 4/30/12 | 15,341,558 | (117,380 | ) | |||||||
| $352,194,182 | $(1,360,848 | ) | |||||||||||
(Value on Settlement Date $350,833,334)
Notes to Schedule of Investments
ADR = American Depositary Receipt
CHF = Swiss Franc
ETF = Exchange-Traded Fund
EUR = Euro
GBP = British Pound
JPY = Japanese Yen
SEK = Swedish Krona
SPDR = Standard & Poor’s Depositary Receipts
USD = United States Dollar
| (1) | Non-income producing. |
| (2) | Affiliated Company: the fund’s holding represents ownership of 5% or more of the voting securities of the company; therefore, the company is affiliated as defined in the Investment Company Act of 1940. |
| (3) | Security was purchased under Rule 144A of the Securities Act of 1933 or is a private placement and, unless registered under the Act or exempted from registration, may only be sold to qualified institutional investors. The aggregate value of these securities at the period end was $357,385,749, which represented 3.6% of total net assets. |
| (4) | Equity-linked debt security. The aggregated value of these securities at the period end was $82,602,836, which represented 0.8% of total net assets. |
| (5) | Step-coupon security. These securities are issued with a zero coupon and become interest bearing at a predetermined rate and date and are issued at a substantial discount from their value at maturity. Interest reset or final maturity date is indicated, as applicable. |
| (6) | The rate indicated is the yield to maturity at purchase. |
See Notes to Financial Statements.
15
| MARCH 31, 2012 | ||||
| Assets | ||||
| Investment securities — unaffiliated, at value (cost of $8,580,919,271) | $9,629,841,223 | |||
| Investment securities — affiliated, at value (cost of $173,176,967) | 208,907,018 | |||
| Total investment securities, at value (cost of $8,754,096,238) | 9,838,748,241 | |||
| Foreign currency holdings, at value (cost of $758,740) | 745,348 | |||
| Receivable for investments sold | 69,785,266 | |||
| Receivable for capital shares sold | 10,728,017 | |||
| Unrealized gain on forward foreign currency exchange contracts | 5,063 | |||
| Dividends and interest receivable | 29,098,383 | |||
| Other assets | 3,428,893 | |||
| 9,952,539,211 | ||||
| Liabilities | ||||
| Payable for investments purchased | 80,497,553 | |||
| Payable for capital shares redeemed | 14,654,111 | |||
| Unrealized loss on forward foreign currency exchange contracts | 1,361,248 | |||
| Accrued management fees | 7,506,509 | |||
| Distribution and service fees payable | 1,006,533 | |||
| 105,025,954 | ||||
| Net Assets | $9,847,513,257 | |||
| Net Assets Consist of: | ||||
| Capital (par value and paid-in surplus) | $9,189,397,848 | |||
| Undistributed net investment income | 22,053,982 | |||
| Accumulated net realized loss | (447,259,978 | ) | ||
| Net unrealized appreciation | 1,083,321,405 | |||
| $9,847,513,257 | ||||
| Net assets | Shares outstanding | Net asset value per share | |
| Investor Class, $0.01 Par Value | $5,363,783,283 | 697,743,194 | $7.69 |
| Institutional Class, $0.01 Par Value | $1,316,757,951 | 171,227,131 | $7.69 |
| A Class, $0.01 Par Value | $2,512,840,106 | 326,869,013 | $7.69* |
| B Class, $0.01 Par Value | $7,715,592 | 1,002,340 | $7.70 |
| C Class, $0.01 Par Value | $469,354,865 | 61,036,303 | $7.69 |
| R Class, $0.01 Par Value | $177,061,460 | 23,081,593 | $7.67 |
*Maximum offering price $8.16 (net asset value divided by 0.9425).
See Notes to Financial Statements.
16
| YEAR ENDED MARCH 31, 2012 | ||||
| Investment Income (Loss) | ||||
| Income: | ||||
| Dividends (including $10,015,634 from affiliates and net of foreign taxes withheld of $2,928,238) | $290,603,097 | |||
| Interest | 41,695,804 | |||
| 332,298,901 | ||||
| Expenses: | ||||
| Management fees | 83,715,024 | |||
| Distribution and service fees: | ||||
| A Class | 5,871,442 | |||
| B Class | 77,409 | |||
| C Class | 4,284,673 | |||
| R Class | 775,856 | |||
| Directors’ fees and expenses | 463,613 | |||
| Other expenses | 14,500 | |||
| 95,202,517 | ||||
| Net investment income (loss) | 237,096,384 | |||
| Realized and Unrealized Gain (Loss) | ||||
| Net realized gain (loss) on: | ||||
| Investment transactions (including $27,494,739 from affiliates) | 177,223,192 | |||
| Foreign currency transactions | 9,136,806 | |||
| 186,359,998 | ||||
| Change in net unrealized appreciation (depreciation) on: | ||||
| Investments | 143,940,841 | |||
| Translation of assets and liabilities in foreign currencies | (305,185 | ) | ||
| 143,635,656 | ||||
| Net realized and unrealized gain (loss) | 329,995,654 | |||
| Net Increase (Decrease) in Net Assets Resulting from Operations | $567,092,038 | |||
See Notes to Financial Statements.
17
| YEARS ENDED MARCH 31, 2012 AND MARCH 31, 2011 | |||||||
| Increase (Decrease) in Net Assets | March 31, 2012 | March 31, 2011 | |||||
| Operations | |||||||
| Net investment income (loss) | $237,096,384 | $213,149,787 | |||||
| Net realized gain (loss) | 186,359,998 | 571,410,835 | |||||
| Change in net unrealized appreciation (depreciation) | 143,635,656 | 146,847,882 | |||||
| Net increase (decrease) in net assets resulting from operations | 567,092,038 | 931,408,504 | |||||
| Distributions to Shareholders | |||||||
| From net investment income: | |||||||
| Investor Class | (133,934,423 | ) | (127,239,350 | ) | |||
| Institutional Class | (30,375,519 | ) | (25,131,472 | ) | |||
| A Class | (55,609,804 | ) | (45,917,774 | ) | |||
| B Class | (124,278 | ) | (144,442 | ) | |||
| C Class | (6,952,203 | ) | (5,156,476 | ) | |||
| R Class | (3,266,917 | ) | (2,708,042 | ) | |||
| Decrease in net assets from distributions | (230,263,144 | ) | (206,297,556 | ) | |||
| Capital Share Transactions | |||||||
| Net increase (decrease) in net assets from capital share transactions | 768,776,664 | 1,716,446,204 | |||||
| Net increase (decrease) in net assets | 1,105,605,558 | 2,441,557,152 | |||||
| Net Assets | |||||||
| Beginning of period | 8,741,907,699 | 6,300,350,547 | |||||
| End of period | $9,847,513,257 | $8,741,907,699 | |||||
| Undistributed net investment income | $22,053,982 | $19,129,600 | |||||
See Notes to Financial Statements.
18
MARCH 31, 2012
1. Organization
American Century Capital Portfolios, Inc. (the corporation) is registered under the Investment Company Act of 1940, as amended (the 1940 Act), as an open-end management investment company and is organized as a Maryland corporation. Equity Income Fund (the fund) is one fund in a series issued by the corporation. The fund is diversified as defined under the 1940 Act. The fund’s investment objective is to seek current income. Capital appreciation is a secondary objective. The fund pursues its objectives by investing in securities of companies with a favorable income-paying history that have prospects for income payments to continue or increase.
The fund is authorized to issue the Investor Class, the Institutional Class, the A Class, the B Class, the C Class and the R Class. The A Class may incur an initial sales charge. The A Class, B Class and C Class may be subject to a contingent deferred sales charge. The share classes differ principally in their respective sales charges and distribution and shareholder servicing expenses and arrangements. The Institutional Class is made available to institutional shareholders or through financial intermediaries whose clients do not require the same level of shareholder and administrative services as shareholders of other classes. As a result, the Institutional Class is charged a lower unified management fee.
2. Significant Accounting Policies
The following is a summary of significant accounting policies consistently followed by the fund in preparation of its financial statements. The financial statements are prepared in conformity with accounting principles generally accepted in the United States of America, which may require management to make certain estimates and assumptions at the date of the financial statements. Actual results could differ from these estimates.
Investment Valuations — The fund determines the fair value of its investments and computes its net asset value per share as of the close of regular trading (usually 4 p.m. Eastern time) on the New York Stock Exchange (NYSE) on each day the NYSE is open.
Equity securities that are listed or traded on a domestic securities exchange are valued at the last reported sales price or at the official closing price as provided by the exchange. Equity securities traded on foreign securities exchanges are typically valued at the closing price on the exchange where primarily traded or as of the close of the NYSE, if that is earlier. If no last sales price is reported, or if local convention or regulation so provides, the mean of the latest bid and asked prices is used. Depending on local convention or regulation, securities traded over-the-counter are valued at the mean of the latest bid and asked prices, the last sales price, or the official closing price. In its determination of fair value, the fund may review several factors including: market information specific to a security; news developments in U.S. and foreign markets; the performance of particular U.S. and foreign securities, indices, comparable securities, American Depositary Receipts, Exchange-Traded Funds, and other relevant market indicators.
Debt securities maturing in greater than 60 days at the time of purchase are valued at the evaluated mean as provided by independent pricing services or at the mean of the most recent bid and asked prices as provided by investment dealers. Debt securities maturing within 60 days at the time of purchase may be valued at cost, plus or minus any amortized discount or premium or at the evaluated mean as provided by an independent pricing service. Evaluated mean prices are commonly derived through utilization of market models, which may consider, among other factors, trade data, quotations from dealers and active market makers, relevant yield curve and spread data, related sector levels, creditworthiness, and other relevant market information on the same or comparable securities.
Investments in open-end management investment companies are valued at the reported net asset value per share. Repurchase agreements are valued at cost. Forward foreign currency exchange contracts are valued at the mean of the latest bid and asked prices of the forward currency rates as provided by an independent pricing service.
19
The value of investments initially expressed in foreign currencies is translated into U.S. dollars at prevailing exchange rates.
If the fund determines that the market price for a portfolio security is not readily available or the valuation methods mentioned above do not reflect a security’s fair value, such security is valued as determined in good faith by the Board of Directors or its designee, in accordance with procedures adopted by the Board of Directors. Circumstances that may cause the fund to use these procedures to value a security include, but are not limited to: a security has been declared in default; trading in a security has been halted during the trading day; there is a foreign market holiday and no trading occurred; or an event occurred between the close of a foreign exchange and the NYSE that may affect the value of a security.
Security Transactions — Security transactions are accounted for as of the trade date. Net realized gains and losses are determined on the identified cost basis, which is also used for federal income tax purposes.
Investment Income — Dividend income less foreign taxes withheld, if any, is recorded as of the ex-dividend date. Interest income is recorded on the accrual basis and includes accretion of discounts and amortization of premiums.
Equity-Linked Debt and Linked-Equity Securities — The fund may invest in hybrid equity securities, which usually convert into common stock at a date predetermined by the issuer. These securities generally offer a higher dividend yield than that of the common stock to which the security is linked. These instruments are issued by a company other than the one to which the security is linked and carry the credit of the issuer, not that of the underlying common stock. The securities’ appreciation is limited based on a predetermined final cap price at the date of the conversion. Risks of investing in these securities include, but are not limited to, a set time to capture the yield advantage, limited appreciation potential, decline in value of the underlying stock, and failure of the issuer to pay dividends or to deliver common stock at maturity.
Foreign Currency Translations — All assets and liabilities initially expressed in foreign currencies are translated into U.S. dollars at prevailing exchange rates at period end. The fund may enter into spot foreign currency exchange contracts to facilitate transactions denominated in a foreign currency. Purchases and sales of investment securities, dividend and interest income, spot foreign currency exchange contracts, and expenses are translated at the rates of exchange prevailing on the respective dates of such transactions. Net realized and unrealized foreign currency exchange gains or losses related to investment securities are a component of net realized gain (loss) on investment transactions and change in net unrealized appreciation (depreciation) on investments, respectively.
Repurchase Agreements — The fund may enter into repurchase agreements with institutions that American Century Investment Management, Inc. (ACIM) (the investment advisor) has determined are creditworthy pursuant to criteria adopted by the Board of Directors. The fund requires that the collateral, represented by securities, received in a repurchase transaction be transferred to the custodian in a manner sufficient to enable the fund to obtain those securities in the event of a default under the repurchase agreement. ACIM monitors, on a daily basis, the securities transferred to ensure the value, including accrued interest, of the securities under each repurchase agreement is equal to or greater than amounts owed to the fund under each repurchase agreement.
Joint Trading Account — Pursuant to an Exemptive Order issued by the Securities and Exchange Commission, the fund, along with certain other funds in the American Century Investments family of funds, may transfer uninvested cash balances into a joint trading account. These balances are invested in one or more repurchase agreements that are collateralized by U.S. Treasury or Agency obligations.
20
Income Tax Status — It is the fund’s policy to distribute substantially all net investment income and net realized gains to shareholders and to otherwise qualify as a regulated investment company under provisions of the Internal Revenue Code. The fund is no longer subject to examination by tax authorities for years prior to 2009. At this time, management believes there are no uncertain tax positions which, based on their technical merit, would not be sustained upon examination and for which it is reasonably possible that the total amounts of unrecognized tax benefits will significantly change in the next twelve months. Accordingly, no provision has been made for federal or state income taxes.
Multiple Class — All shares of the fund represent an equal pro rata interest in the net assets of the class to which such shares belong, and have identical voting, dividend, liquidation and other rights and the same terms and conditions, except for class specific expenses and exclusive rights to vote on matters affecting only individual classes. Income, non-class specific expenses, and realized and unrealized capital gains and losses of the fund are allocated to each class of shares based on their relative net assets.
Distributions to Shareholders — Distributions from net investment income, if any, are generally declared and paid quarterly. Distributions from net realized gains, if any, are generally declared and paid annually.
Indemnifications — Under the corporation’s organizational documents, its officers and directors are indemnified against certain liabilities arising out of the performance of their duties to the fund. In addition, in the normal course of business, the fund enters into contracts that provide general indemnifications. The maximum exposure under these arrangements is unknown as this would involve future claims that may be made against
a fund. The risk of material loss from such claims is considered by management to
be remote.
3. Fees and Transactions with Related Parties
Management Fees — The corporation has entered into a management agreement with ACIM, under which ACIM provides the fund with investment advisory and management services in exchange for a single, unified management fee (the fee) per class. The agreement provides that all expenses of managing and operating the fund, except distribution and service fees, brokerage expenses, taxes, interest, fees and expenses of the independent directors (including legal counsel fees), and extraordinary expenses, will be paid by ACIM. The fee is computed and accrued daily based on each class’s daily net assets and paid monthly in arrears. The rate of the fee is determined by applying a fee rate calculation formula. This formula takes into account the fund’s assets as well as certain assets, if any, of other clients of the investment advisor outside the American Century Investments family of funds (such as subadvised funds and separate accounts) that have very similar investment teams and investment strategies (strategy assets). The annual management fee schedule ranges from 0.80% to 1.00% for the Investor Class, A Class, B Class, C Class and R Class. The Institutional Class is 0.20% less at each point within the range. The effective annual management fee for each class for the year ended March 31, 2012 was 0.94% for the Investor Class, A Class, B Class, C Class and R Class and 0.74% for the Institutional Class.
Distribution and Service Fees — The Board of Directors has adopted a separate Master Distribution and Individual Shareholder Services Plan for each of the A Class, B Class, C Class and R Class (collectively the plans), pursuant to Rule 12b-1 of the 1940 Act. The plans provide that the A Class will pay American Century Investment Services, Inc. (ACIS) an annual distribution and service fee of 0.25%. The plans provide that the B Class and C Class will each pay ACIS an annual distribution and service fee of 1.00%, of which 0.25% is paid for individual shareholder services and 0.75% is paid for distribution services. The plans provide that the R Class will pay ACIS an annual distribution and service fee of 0.50%. The fees are computed and accrued daily based on each class’s daily net assets and paid monthly in arrears. The fees are used to pay financial intermediaries for distribution and individual shareholder services. Fees incurred under the plans during the year ended March 31, 2012 are detailed in the Statement of Operations.
Related Parties — Certain officers and directors of the corporation are also officers and/or directors of American Century Companies, Inc. (ACC), the parent of the corporation’s investment advisor, ACIM, the distributor of the corporation, ACIS, and the corporation’s transfer agent, American Century Services, LLC.
21
The fund was eligible to invest in a money market fund for temporary purposes, which is managed by J.P. Morgan Investment Management, Inc. (JPMIM). The fund had a securities lending agreement with JPMorgan Chase Bank (JPMCB) and a mutual funds services agreement with J.P. Morgan Investor Services Co. (JPMIS). JPMCB was a custodian of the fund. JPMIM, JPMIS and JPMCB are wholly owned subsidiaries of JPMorgan Chase & Co. (JPM). Prior to August 31, 2011, JPM was an equity investor in ACC. The services provided to the fund by JPMIM, JPMIS and JPMCB terminated on July 31, 2011.
4. Investment Transactions
Purchases and sales of investment securities, excluding short-term investments, for the year ended March 31, 2012 were $11,223,357,582 and $10,321,375,419, respectively.
For the year ended March 31, 2012, the fund incurred net realized gains of $502,147 from redemptions in kind. A redemption in kind occurs when a fund delivers securities from its portfolio in lieu of cash as payment to a redeeming shareholder.
5. Capital Share Transactions
Transactions in shares of the fund were as follows:
| Year ended March 31, 2012 | Year ended March 31, 2011 | ||||||||||||||
| Shares | Amount | Shares | Amount | ||||||||||||
| Investor Class/Shares Authorized | 3,000,000,000 | 2,000,000,000 | |||||||||||||
| Sold | 183,611,985 | $1,328,983,224 | 231,643,115 | $1,618,310,410 | |||||||||||
| Issued in reinvestment of distributions | 16,255,997 | 117,446,250 | 16,106,262 | 111,703,824 | |||||||||||
| Redeemed | (191,356,471 | ) | (1,379,718,214 | ) | (124,629,876 | ) | (863,182,079 | ) | |||||||
| 8,511,511 | 66,711,260 | 123,119,501 | 866,832,155 | ||||||||||||
| Institutional Class/Shares Authorized | 800,000,000 | 500,000,000 | |||||||||||||
| Sold | 90,462,897 | 657,681,992 | 51,792,333 | 361,926,134 | |||||||||||
| Issued in reinvestment of distributions | 3,572,766 | 25,861,458 | 3,171,612 | 21,930,455 | |||||||||||
| Redeemed | (43,099,659 | ) | (313,129,646 | ) | (51,710,777 | ) | (364,060,285 | ) | |||||||
| 50,936,004 | 370,413,804 | 3,253,168 | 19,796,304 | ||||||||||||
| A Class/Shares Authorized | 1,000,000,000 | 800,000,000 | |||||||||||||
| Sold | 110,972,956 | 804,010,632 | 140,580,589 | 980,178,252 | |||||||||||
| Issued in reinvestment of distributions | 7,323,855 | 52,884,615 | 6,295,025 | 43,714,333 | |||||||||||
| Redeemed | (85,824,922 | ) | (620,855,697 | ) | (57,277,580 | ) | (395,435,348 | ) | |||||||
| 32,471,889 | 236,039,550 | 89,598,034 | 628,457,237 | ||||||||||||
| B Class/Shares Authorized | 10,000,000 | 5,000,000 | |||||||||||||
| Sold | 52,583 | 387,057 | 128,636 | 917,990 | |||||||||||
| Issued in reinvestment of distributions | 14,050 | 101,328 | 17,390 | 120,156 | |||||||||||
| Redeemed | (152,563 | ) | (1,094,195 | ) | (147,707 | ) | (1,017,495 | ) | |||||||
| (85,930 | ) | (605,810 | ) | (1,681 | ) | 20,651 | |||||||||
| C Class/Shares Authorized | 250,000,000 | 150,000,000 | |||||||||||||
| Sold | 18,520,092 | 133,849,226 | 28,320,019 | 198,971,103 | |||||||||||
| Issued in reinvestment of distributions | 708,012 | 5,101,099 | 585,054 | 4,056,721 | |||||||||||
| Redeemed | (9,947,512 | ) | (71,634,668 | ) | (5,784,209 | ) | (39,889,794 | ) | |||||||
| 9,280,592 | 67,315,657 | 23,120,864 | 163,138,030 | ||||||||||||
| R Class/Shares Authorized | 100,000,000 | 50,000,000 | |||||||||||||
| Sold | 9,064,988 | 65,728,820 | 8,627,866 | 60,331,760 | |||||||||||
| Issued in reinvestment of distributions | 436,959 | 3,147,406 | 378,382 | 2,619,109 | |||||||||||
| Redeemed | (5,518,101 | ) | (39,974,023 | ) | (3,570,063 | ) | (24,749,042 | ) | |||||||
| 3,983,846 | 28,902,203 | 5,436,185 | 38,201,827 | ||||||||||||
| Net increase (decrease) | 105,097,912 | $768,776,664 | 244,526,071 | $1,716,446,204 | |||||||||||
22
6. Affiliated Company Transactions
If a fund’s holding represents ownership of 5% or more of the voting securities of a company, the company is affiliated as defined in the 1940 Act. A summary of transactions for each company which is or was an affiliate at or during the year ended March 31, 2012 follows:
| March 31, 2011 | March 31, 2012 | ||||||
| Company | Share Balance | Purchase Cost | Sales Cost | Realized Gain (Loss) | Dividend Income | Share Balance | Market Value |
| Capitol Federal Financial, Inc. | 7,089,005 | $23,075,762 | $ 3,974,784 | $ (442,875) | $ 3,219,718 | 8,798,659 | $104,352,096 |
Nicor, Inc.(1) | 2,125,440 | 8,173,709 | 95,753,545 | 27,660,782 | 2,831,826 | — | — |
| WGL Holdings, Inc. | 2,552,888 | 3,133,698 | 2,130,130 | 276,832 | 3,964,090 | 2,568,917 | 104,554,922 |
| $34,383,169 | $101,858,459 | $27,494,739 | $10,015,634 | $208,907,018 | |||
| (1) | Company was not an affiliate at March 31, 2012. |
7. Fair Value Measurements
The fund’s securities valuation process is based on several considerations and may use multiple inputs to determine the fair value of the positions held by the fund. In conformity with accounting principles generally accepted in the United States of America, the inputs used to determine a valuation are classified into three broad levels as follows:
| • | Level 1 valuation inputs consist of unadjusted quoted prices in an active market for identical securities; |
| • | Level 2 valuation inputs consist of direct or indirect observable market data (including quoted prices for similar securities, evaluations of subsequent market events, interest rates, prepayment speeds, credit risk, etc.); or |
| • | Level 3 valuation inputs consist of unobservable data (including a fund’s own assumptions). |
The level classification is based on the lowest level input that is significant to the fair valuation measurement. The valuation inputs are not necessarily an indication of the risks associated with investing in these securities or other financial instruments.
The following is a summary of the level classifications as of period end. The Schedule of Investments provides additional information on the fund’s portfolio holdings.
| Level 1 | Level 2 | Level 3 | |
| Investment Securities | |||
| Domestic Common Stocks | $6,266,452,569 | — | — |
| Foreign Common Stocks | 259,829,476 | $ 379,199,212 | — |
| Convertible Bonds | — | 1,529,354,293 | — |
| Convertible Preferred Stocks | — | 955,934,031 | — |
| Exchange-Traded Funds | 278,548,375 | — | — |
| Temporary Cash Investments | 37,198,873 | 132,231,412 | — |
| Total Value of Investment Securities | $6,842,029,293 | $2,996,718,948 | — |
| Other Financial Instruments | |||
Total Unrealized Gain (Loss) on Forward Foreign Currency Exchange Contracts | — | $(1,356,185) | — |
23
8. Derivative Instruments
Foreign Currency Risk — The fund is subject to foreign currency exchange rate risk in the normal course of pursuing its investment objectives. The value of foreign investments held by a fund may be significantly affected by changes in foreign currency exchange rates. The dollar value of a foreign security generally decreases when the value of the dollar rises against the foreign currency in which the security is denominated and tends to increase when the value of the dollar declines against such foreign currency. A fund may enter into forward foreign currency exchange contracts to reduce a fund’s exposure to foreign currency exchange rate fluctuations. The net U.S. dollar value of foreign currency underlying all contractual commitments held by a fund and the resulting unrealized appreciation or depreciation are determined daily. Realized gain or loss is recorded upon the termination of the contract. Net realized and unrealized gains or losses occurring during the holding period of forward foreign currency exchange contracts are a component of net realized gain (loss) on foreign currency transactions and change in net unrealized appreciation (depreciation) on translation of assets and liabilities in foreign currencies, respectively. A fund bears the risk of an unfavorable change in the foreign currency exchange rate underlying the forward contract. Additionally, losses, up to the fair value, may arise if the counterparties do not perform under the contract terms. The foreign currency risk derivative instruments held at period end as disclosed on the Schedule of Investments are indicative of the fund’s typical volume during the period.
The value of foreign currency risk derivative instruments as of March 31, 2012, is disclosed on the Statement of Assets and Liabilities as an asset of $5,063 in unrealized gain on forward foreign currency exchange contracts and a liability of $1,361,248 in unrealized loss on forward foreign currency exchange contracts. For the year ended March 31, 2012, the effect of foreign currency risk derivative instruments on the Statement of Operations was $8,642,864 in net realized gain (loss) on foreign currency transactions and $(332,745) in change in net unrealized appreciation (depreciation) on translation of assets and liabilities in foreign currencies.
9. Risk Factors
There are certain risks involved in investing in foreign securities. These risks include those resulting from future adverse political, social and economic developments, fluctuations in currency exchange rates, the possible imposition of exchange controls, and other foreign laws or restrictions.
The fund’s investment process may result in high portfolio turnover, which could mean high transaction costs, affecting both performance and capital gains tax liabilities to investors.
24
10. Federal Tax Information
The tax character of distributions paid during the years ended March 31, 2012 and March 31, 2011 were as follows:
| 2012 | 2011 | |
| Distributions Paid From | ||
| Ordinary income | $230,263,144 | $206,297,556 |
| Long-term capital gains | — | — |
The book-basis character of distributions made during the year from net investment income or net realized gains may differ from their ultimate characterization for federal income tax purposes. These differences reflect the differing character of certain income items and net realized gains and losses for financial statement and tax purposes, and may result in reclassification among certain capital accounts on the financial statements.
As of March 31, 2012, the federal tax cost of investments and the components of distributable earnings on a tax-basis were as follows:
| Federal tax cost of investments | $8,957,053,851 | ||
| Gross tax appreciation of investments | $988,784,830 | ||
| Gross tax depreciation of investments | (107,090,440 | ) | |
| Net tax appreciation (depreciation) of investments | $881,694,390 | ||
| Net tax appreciation (depreciation) on derivatives and translation of assets and liabilities in foreign currencies | $(225,299 | ) | |
| Net tax appreciation (depreciation) | $881,469,091 | ||
| Undistributed ordinary income | $22,304,865 | ||
| Accumulated capital losses | $(245,658,547 | ) |
The difference between book-basis and tax-basis cost and unrealized appreciation (depreciation) is attributable primarily to the tax deferral of losses on wash sales and the realization for tax purposes of unrealized gains (losses) on certain foreign currency exchange contracts.
The accumulated capital losses represent net capital loss carryovers that may be used to offset future realized capital gains for federal income tax purposes. Future capital loss carryover utilization in any given year may be subject to Internal Revenue Code limitations. Capital loss carryovers expire in 2018. The Regulated Investment Company Modernization Act of 2010 allows the fund to carry forward capital losses incurred in future taxable years for an unlimited period. Any losses incurred during future taxable years will be required to be utilized prior to the losses which carry an expiration date. As a result, capital loss carryforwards may be more likely to expire unused.
25
| For a Share Outstanding Throughout the Years Ended March 31 (except as noted) | |||||||||||||
| Per-Share Data | Ratios and Supplemental Data | ||||||||||||
| Income From Investment Operations: | Distributions From: | Ratio to Average Net Assets of: | |||||||||||
Net Asset Value, Beginning of Period | Net Investment Income (Loss)(1) | Net Realized and Unrealized Gain (Loss) | Total From Investment Operations | Net Investment Income | Net Realized Gains | Total Distributions | Net Asset Value, End of Period | Total Return(2) | Operating Expenses | Net Investment Income (Loss) | Portfolio Turnover Rate | Net Assets, End of Period (in thousands) | |
| Investor Class | |||||||||||||
| 2012 | $7.43 | 0.20 | 0.25 | 0.45 | (0.19) | — | (0.19) | $7.69 | 6.24% | 0.95% | 2.69% | 115% | $5,363,783 |
| 2011 | $6.76 | 0.21 | 0.67 | 0.88 | (0.21) | — | (0.21) | $7.43 | 13.23% | 0.96% | 3.09% | 146% | $5,123,937 |
| 2010 | $5.42 | 0.18 | 1.33 | 1.51 | (0.17) | — | (0.17) | $6.76 | 28.04% | 0.97% | 2.93% | 105% | $3,829,492 |
| 2009 | $7.30 | 0.22 | (1.87) | (1.65) | (0.23) | — | (0.23) | $5.42 | (22.98)% | 0.98% | 3.36% | 296% | $2,913,351 |
| 2008 | $8.65 | 0.23 | (0.62) | (0.39) | (0.23) | (0.73) | (0.96) | $7.30 | (5.17)% | 0.97% | 2.68% | 165% | $3,719,757 |
| Institutional Class | |||||||||||||
| 2012 | $7.44 | 0.21 | 0.24 | 0.45 | (0.20) | — | (0.20) | $7.69 | 6.31% | 0.75% | 2.89% | 115% | $1,316,758 |
| 2011 | $6.77 | 0.23 | 0.66 | 0.89 | (0.22) | — | (0.22) | $7.44 | 13.60% | 0.76% | 3.29% | 146% | $894,544 |
| 2010 | $5.42 | 0.19 | 1.34 | 1.53 | (0.18) | — | (0.18) | $6.77 | 28.30% | 0.77% | 3.13% | 105% | $792,024 |
| 2009 | $7.31 | 0.23 | (1.88) | (1.65) | (0.24) | — | (0.24) | $5.42 | (22.94)% | 0.78% | 3.56% | 296% | $502,435 |
| 2008 | $8.65 | 0.25 | (0.61) | (0.36) | (0.25) | (0.73) | (0.98) | $7.31 | (4.85)% | 0.77% | 2.88% | 165% | $496,033 |
A Class(6) | |||||||||||||
| 2012 | $7.43 | 0.18 | 0.25 | 0.43 | (0.17) | — | (0.17) | $7.69 | 5.98% | 1.20% | 2.44% | 115% | $2,512,840 |
| 2011 | $6.76 | 0.20 | 0.66 | 0.86 | (0.19) | — | (0.19) | $7.43 | 12.95% | 1.21% | 2.84% | 146% | $2,188,714 |
| 2010 | $5.42 | 0.17 | 1.32 | 1.49 | (0.15) | — | (0.15) | $6.76 | 27.71% | 1.22% | 2.68% | 105% | $1,385,436 |
| 2009 | $7.30 | 0.20 | (1.86) | (1.66) | (0.22) | — | (0.22) | $5.42 | (23.18)% | 1.23% | 3.11% | 296% | $794,323 |
| 2008 | $8.65 | 0.20 | (0.61) | (0.41) | (0.21) | (0.73) | (0.94) | $7.30 | (5.40)% | 1.22% | 2.43% | 165% | $933,600 |
26
| For a Share Outstanding Throughout the Years Ended March 31 (except as noted) | |||||||||||||
| Per-Share Data | Ratios and Supplemental Data | ||||||||||||
| Income From Investment Operations: | Distributions From: | Ratio to Average Net Assets of: | |||||||||||
Net Asset Value, Beginning of Period | Net Investment Income (Loss)(1) | Net Realized and Unrealized Gain (Loss) | Total From Investment Operations | Net Investment Income | Net Realized Gains | Total Distributions | Net Asset Value, End of Period | Total Return(2) | Operating Expenses | Net Investment Income (Loss) | Portfolio Turnover Rate | Net Assets, End of Period (in thousands) | |
| B Class | |||||||||||||
| 2012 | $7.44 | 0.12 | 0.26 | 0.38 | (0.12) | — | (0.12) | $7.70 | 5.18% | 1.95% | 1.69% | 115% | $7,716 |
| 2011 | $6.77 | 0.15 | 0.66 | 0.81 | (0.14) | — | (0.14) | $7.44 | 12.08% | 1.96% | 2.09% | 146% | $8,102 |
| 2010 | $5.42 | 0.12 | 1.33 | 1.45 | (0.10) | — | (0.10) | $6.77 | 26.92% | 1.97% | 1.93% | 105% | $7,383 |
| 2009 | $7.30 | 0.15 | (1.86) | (1.71) | (0.17) | — | (0.17) | $5.42 | (23.75)% | 1.98% | 2.36% | 296% | $2,392 |
2008(3) | $8.99 | 0.08 | (0.95) | (0.87) | (0.09) | (0.73) | (0.82) | $7.30 | (10.28)% | 1.97%(4) | 2.11%(4) | 165%(5) | $235 |
| C Class | |||||||||||||
| 2012 | $7.44 | 0.12 | 0.25 | 0.37 | (0.12) | — | (0.12) | $7.69 | 5.05% | 1.95% | 1.69% | 115% | $469,355 |
| 2011 | $6.77 | 0.15 | 0.66 | 0.81 | (0.14) | — | (0.14) | $7.44 | 12.25% | 1.96% | 2.09% | 146% | $384,918 |
| 2010 | $5.42 | 0.12 | 1.33 | 1.45 | (0.10) | — | (0.10) | $6.77 | 26.74% | 1.97% | 1.93% | 105% | $193,776 |
| 2009 | $7.30 | 0.15 | (1.86) | (1.71) | (0.17) | — | (0.17) | $5.42 | (23.75)% | 1.98% | 2.36% | 296% | $96,930 |
| 2008 | $8.65 | 0.14 | (0.61) | (0.47) | (0.15) | (0.73) | (0.88) | $7.30 | (6.10)% | 1.97% | 1.68% | 165% | $116,985 |
| R Class | |||||||||||||
| 2012 | $7.42 | 0.16 | 0.24 | 0.40 | (0.15) | — | (0.15) | $7.67 | 5.59% | 1.45% | 2.19% | 115% | $177,061 |
| 2011 | $6.75 | 0.18 | 0.66 | 0.84 | (0.17) | — | (0.17) | $7.42 | 12.68% | 1.46% | 2.59% | 146% | $141,693 |
| 2010 | $5.41 | 0.15 | 1.32 | 1.47 | (0.13) | — | (0.13) | $6.75 | 27.44% | 1.47% | 2.43% | 105% | $92,239 |
| 2009 | $7.29 | 0.18 | (1.86) | (1.68) | (0.20) | — | (0.20) | $5.41 | (23.40)% | 1.48% | 2.86% | 296% | $35,588 |
| 2008 | $8.63 | 0.18 | (0.60) | (0.42) | (0.19) | (0.73) | (0.92) | $7.29 | (5.53)% | 1.47% | 2.18% | 165% | $42,720 |
27
Notes to Financial Highlights
| (1) | Computed using average shares outstanding throughout the period. |
| (2) | Total returns are calculated based on the net asset value of the last business day and do not reflect applicable sales charges, if any. Total returns for periods less than one year are not annualized. |
| (3) | September 28, 2007 (commencement of sale) through March 31, 2008. |
| (4) | Annualized. |
| (5) | Portfolio turnover is calculated at the fund level. Percentage indicated was calculated for the year ended March 31, 2008. |
| (6) | Prior to September 4, 2007, the A Class was referred to as the Advisor Class. |
See Notes to Financial Statements.
28
To the Board of Directors and Shareholders of
American Century Capital Portfolios, Inc.:
We have audited the accompanying statement of assets and liabilities, including the schedule of investments, of Equity Income Fund, one of the funds constituting American Century Capital Portfolios, Inc. (the “Corporation”) as of March 31, 2012, and the related statement of operations for the year then ended, the statements of changes in net assets for each of the two years in the period then ended, and the financial highlights for each of the five years in the period then ended. These financial statements and financial highlights are the responsibility of the Corporation’s management. Our responsibility is to express an opinion on these financial statements and financial highlights based on our audits.
We conducted our audits in accordance with the standards of the Public Company Accounting Oversight Board (United States). Those standards require that we plan and perform the audit to obtain reasonable assurance about whether the financial statements and financial highlights are free of material misstatement. The Corporation is not required to have, nor were we engaged to perform, an audit of its internal control over financial reporting. Our audits included consideration of internal control over financial reporting as a basis for designing audit procedures that are appropriate in the circumstances, but not for the purpose of expressing an opinion on the effectiveness of the Corporation’s internal control over financial reporting. Accordingly, we express no such opinion. An audit also includes examining, on a test basis, evidence supporting the amounts and disclosures in the financial statements, assessing the accounting principles used and significant estimates made by management, as well as evaluating the overall financial statement presentation. Our procedures included confirmation of securities owned as of March 31, 2012, by correspondence with the custodian and brokers; where replies were not received from brokers, we performed other auditing procedures. We believe that our audits provide a reasonable basis for our opinion.
In our opinion, such financial statements and financial highlights referred to above present fairly, in all material respects, the financial position of Equity Income Fund of American Century Capital Portfolios, Inc., as of March 31, 2012, the results of its operations for the year then ended, the changes in its net assets for each of the two years in the period then ended, and the financial highlights for each of the five years in the period then ended, in conformity with accounting principles generally accepted in the United States of America.
Deloitte & Touche LLP
Kansas City, Missouri
May 16, 2012
29
The Board of Directors
The individuals listed below serve as directors of the funds. Each director will continue to serve in this capacity until death, retirement, resignation or removal from office. The mandatory retirement age for directors who are not “interested persons,” as that term is defined in the Investment Company Act (independent directors), is 72. However, the mandatory retirement age for an individual director may be extended with the approval of the remaining independent directors.
Mr. Thomas is an “interested person” because he currently serves as President and Chief Executive Officer of American Century Companies, Inc. (ACC), the parent company of American Century Investment Management, Inc. (ACIM or the advisor). Mr. Fink is an “interested person” because he currently serves as Executive Vice President and Chief Operating Officer of ACC.
The other directors (more than three-fourths of the total number) are independent; that is, they have never been employees, directors or officers of, and have no financial interest in, ACC or any of its wholly owned, direct or indirect, subsidiaries, including ACIM, American Century Investment Services, Inc. (ACIS) and American Century Services, LLC (ACS). The directors serve in this capacity for seven (in the case of Mr. Thomas, 15) registered investment companies in the American Century Investments family of funds.
The following table presents additional information about the directors. The mailing address for each director is 4500 Main Street, Kansas City, Missouri 64111.
Name (Year of Birth) | Position(s) Held with Funds | Length of Time Served | Principal Occupation(s) During Past 5 Years | Number of American Century Portfolios Overseen by Director | Other Directorships Held During Past 5 Years | |
| Independent Directors | ||||||
Thomas A. Brown (1940) | Director | Since 1980 | Managing Member, Associated Investments, LLC (real estate investment company); Brown Cascade Properties, LLC (real estate investment company) (2001 to 2009) | 66 | None | |
Andrea C. Hall (1945) | Director | Since 1997 | Retired | 66 | None | |
Jan M. Lewis (1957) | Director | Since 2011 | President and Chief Executive Officer, Catholic Charities of Northeast Kansas (human services organization) (2006 to present) | 66 | None | |
James A. Olson (1942) | Director | Since 2007 | Member, Plaza Belmont LLC (private equity fund manager) | 66 | Saia, Inc. (2002 to 2012) and Entertainment Properties Trust | |
Donald H. Pratt (1937) | Director and Chairman of the Board | Since 1995 (Chairman since 2005) | Chairman and Chief Executive Officer, Western Investments, Inc. (real estate company) | 66 | None | |
30
Name (Year of Birth) | Position(s) Held with Funds | Length of Time Served | Principal Occupation(s) During Past 5 Years | Number of American Century Portfolios Overseen by Director | Other Directorships Held During Past 5 Years | |
| Independent Directors | ||||||
M. Jeannine Strandjord (1945) | Director | Since 1994 | Retired | 66 | DST Systems Inc., Euronet Worldwide Inc., and Charming Shoppes, Inc. (2006 to 2010) | |
John R. Whitten (1946) | Director | Since 2008 | Project Consultant, Celanese Corp. (industrial chemical company) | 66 | Rudolph Technologies, Inc. | |
Stephen E. Yates (1948) | Director | Since 2012 | Retired; Executive Vice President, Technology & Operations, KeyCorp. (computer services) (2004 to 2010) | 66 | Applied Industrial Technology (2001 to 2010) | |
| Interested Directors | ||||||
Barry Fink (1955) | Director and Executive Vice President | Since 2012 (Executive Vice President since 2007) | Chief Operating Officer and Executive Vice President, ACC (September 2007 to present); President, ACS (October 2007 to present); Managing Director, Morgan Stanley (2000 to 2007). Also serves as Manager, ACS and Director, ACC and certain ACC subsidiaries | 66 | None | |
Jonathan S. Thomas (1963) | Director and President | Since 2007 | President and Chief Executive Officer, ACC (March 2007 to present); Chief Administrative Officer, ACC (February 2006 to February 2007); Executive Vice President, ACC (November 2005 to February 2007). Also serves as Chief Executive Officer and Manager, ACS; Executive Vice President, ACIM; Director, ACC, ACIM and other ACC subsidiaries | 108 | None | |
31
Officers
The following table presents certain information about the executive officers of the funds. Each officer serves as an officer for each of the 15 investment companies in the American Century family of funds, unless otherwise noted. No officer is compensated for his or her service as an officer of the funds. The listed officers are interested persons of the funds and are appointed or re-appointed on an annual basis. The mailing address for each officer listed below is 4500 Main Street, Kansas City, Missouri 64111.
Name (Year of Birth) | Offices with the Funds | Principal Occupation(s) During the Past Five Years | |
Jonathan S. Thomas (1963) | Director and President since 2007 | President and Chief Executive Officer, ACC (March 2007 to present); Chief Administrative Officer, ACC (February 2006 to February 2007); Executive Vice President, ACC (November 2005 to February 2007). Also serves as Chief Executive Officer and Manager, ACS; Executive Vice President, ACIM; Director, ACC, ACIM and other ACC subsidiaries | |
Barry Fink (1955) | Director since 2012 and Executive Vice President since 2007 | Chief Operating Officer and Executive Vice President, ACC (September 2007 to present); President, ACS (October 2007 to present); Managing Director, Morgan Stanley (2000 to 2007). Also serves as Manager, ACS and Director, ACC and certain ACC subsidiaries | |
Maryanne L. Roepke (1956) | Chief Compliance Officer since 2006 and Senior Vice President since 2000 | Chief Compliance Officer, American Century funds, ACIM and ACS (August 2006 to present). Also serves as Senior Vice President, ACS | |
Charles A. Etherington (1957) | General Counsel since 2007 and Senior Vice President since 2006 | Attorney, ACC (February 1994 to present); Vice President, ACC (November 2005 to present), General Counsel, ACC (March 2007 to present); Also serves as General Counsel, ACIM, ACS, ACIS and other ACC subsidiaries; and Senior Vice President, ACIM and ACS | |
C. Jean Wade (1964) | Vice President, Treasurer and Chief Financial Officer since 2012 | Vice President, ACS (February 2000 to present) | |
Robert J. Leach (1966) | Vice President since 2006 and Assistant Treasurer since 2012 | Vice President, ACS (February 2000 to present) | |
David H. Reinmiller (1963) | Vice President since 2000 | Attorney, ACC (January 1994 to present); Associate General Counsel, ACC (January 2001 to present). Also serves as Vice President, ACIM and ACS | |
Ward D. Stauffer (1960) | Secretary since 2005 | Attorney, ACC (June 2003 to present) |
The Statement of Additional Information has additional information about the fund’s directors and is available without charge, upon request, by calling 1-800-345-2021.
32
Retirement Account Information
As required by law, distributions you receive from certain IRAs, or 403(b), 457 and qualified plans are subject to federal income tax withholding, unless you elect not to have withholding apply. Tax will be withheld on the total amount withdrawn even though you may be receiving amounts that are not subject to withholding, such as nondeductible contributions. In such case, excess amounts of withholding could occur. You may adjust your withholding election so that a greater or lesser amount will be withheld.
If you don’t want us to withhold on this amount, you must notify us to not withhold the federal income tax. You may notify us in writing or in certain situations by telephone or through other electronic means. You have the right to revoke your withholding election at any time and any election you make may remain in effect until revoked by filing a new election.
Remember, even if you elect not to have income tax withheld, you are liable for paying income tax on the taxable portion of your withdrawal. If you elect not to have income tax withheld or you don’t have enough income tax withheld, you may be responsible for payment of estimated tax. You may incur penalties under the estimated tax rules if your withholding and estimated tax payments are not sufficient. You can reduce or defer the income tax on a distribution by directly or indirectly rolling such distribution over to another IRA or eligible plan. You should consult your tax advisor for additional information.
State tax will be withheld if, at the time of your distribution, your address is within one of the mandatory withholding states and you have federal income tax withheld. State taxes will be withheld from your distribution in accordance with the respective state rules.
Proxy Voting Guidelines
American Century Investment Management, Inc., the fund’s investment advisor, is responsible for exercising the voting rights associated with the securities purchased and/or held by the fund. A description of the policies and procedures the advisor uses in fulfilling this responsibility is available without charge, upon request, by calling 1-800-345-2021. It is also available on American Century Investments’ website at americancentury.com and on the Securities and Exchange Commission’s website at sec.gov. Information regarding how the investment advisor voted proxies relating to portfolio securities during the most recent 12-month period ended June 30 is available on the “About Us” page at americancentury.com. It is also available at sec.gov.
Quarterly Portfolio Disclosure
The fund files its complete schedule of portfolio holdings with the Securities and Exchange Commission (SEC) for the first and third quarters of each fiscal year on Form N-Q. The fund’s Forms N-Q are available on the SEC’s website at sec.gov, and may be reviewed and copied at the SEC’s Public Reference Room in Washington, DC. Information on the operation of the Public Reference Room may be obtained by calling 1-800-SEC-0330. The fund also makes its complete schedule of portfolio holdings for the most recent quarter of its fiscal year available on its website at americancentury.com and, upon request, by calling 1-800-345-2021.
33
Other Tax Information
The following information is provided pursuant to provisions of the Internal Revenue Code.
The fund hereby designates up to the maximum amount allowable as qualified dividend income for the fiscal year ended March 31, 2012.
For corporate taxpayers, the fund hereby designates $228,732,776, or up to the maximum amount allowable, of ordinary income distributions paid during the fiscal year ended March 31, 2012 as qualified for the corporate dividends received deduction.
34
35
36
| Contact Us | americancentury.com |
| Automated Information Line | 1-800-345-8765 |
| Investor Services Representative | 1-800-345-2021 or 816-531-5575 |
| Investors Using Advisors | 1-800-378-9878 |
Business, Not-For-Profit, Employer-Sponsored Retirement Plans | 1-800-345-3533 |
Banks and Trust Companies, Broker-Dealers, Financial Professionals, Insurance Companies | 1-800-345-6488 |
| Telecommunications Device for the Deaf | 1-800-634-4113 |
American Century Capital Portfolios, Inc.
Investment Advisor:
American Century Investment Management, Inc.
Kansas City, Missouri
This report and the statements it contains are submitted for the general information of our shareholders. The report is not authorized for distribution to prospective investors unless preceded or accompanied by an effective prospectus.
©2012 American Century Proprietary Holdings, Inc. All rights reserved.
CL-ANN-75027 1205
ANNUAL REPORT MARCH 31, 2012
| Global Real Estate Fund |
| President’s Letter | 2 |
| Independent Chairman’s Letter | 3 |
| Market Perspective | 4 |
| Performance | 5 |
| Portfolio Commentary | 7 |
| Fund Characteristics | 9 |
| Shareholder Fee Example | 10 |
| Schedule of Investments | 12 |
| Statement of Assets and Liabilities | 14 |
| Statement of Operations | 15 |
| Statement of Changes in Net Assets | 16 |
| Notes to Financial Statements | 17 |
| Financial Highlights | 23 |
| Report of Independent Registered Public Accounting Firm | 24 |
| Management | 25 |
| Additional Information | 28 |
Any opinions expressed in this report reflect those of the author as of the date of the report, and do not necessarily represent the opinions of American Century Investments® or any other person in the American Century Investments organization. Any such opinions are subject to change at any time based upon market or other conditions and American Century Investments disclaims any responsibility to update such opinions. These opinions may not be relied upon as investment advice and, because investment decisions made by American Century Investments funds are based on numerous factors, may not be relied upon as an indication of trading intent on behalf of any American Century Investments fund. Security examples are used for representational purposes only and are not intended as recommendations to purchase or sell securities. Performance information for comparative indices and securities is provided to American Century Investments by third party vendors. To the best of American Century Investments’ knowledge, such information is accurate at the time of printing.
Dear Investor:
Thank you for reviewing this annual report for the reporting period from the fund’s inception date to March 31, 2012. Our report offers investment performance and portfolio information, presented with the expert perspective of our portfolio management team.
This report remains one of our most important vehicles for conveying information about fund returns, as well as market factors and strategies that affected fund performance. For additional, updated information, we encourage you to visit our website, americancentury.com. Click on the “Fund Performance” and “Insights & News” headings at the top of our Individual Investors site.
Mostly Positive U.S. Stock Index Returns Belie the Period’s Volatility;
Non-U.S. Equities Lagged
Broad U.S. equity market returns made the reporting period appear more benign than it really was; global equity index returns reflected more of the turmoil and uncertainty. Broad U.S. stock indices gained roughly 4-8% while their global counterparts suffered double-digit declines.
The reporting period began in May 2011 on a positive note, with stock indices at some of their highest levels since 2008, prior to the Financial Crisis plunge. These elevated levels reflected increased risk-taking as the markets priced in improving global economic growth, strong corporate earnings, and higher inflation.
That “risk-on” investing attitude switched to “risk-off” during the summer of 2011, however, transformed by high fuel prices, federal budget management concerns in the U.S., and the worsening sovereign debt crisis in Europe. Stock indices suffered double-digit declines from their peaks. Sentiment switched again in the fourth quarter of 2011, as concerns about the European sovereign debt crisis and the U.S. economy eased. Renewed “risk-on” investing carried into the first quarter of 2012.
But global equity markets didn’t rebound as much as their U.S. counterparts, keeping broad global equity index returns largely negative for the reporting period. The financial markets in general remain subject to potentially high volatility as they continue to wrestle with uncertainties regarding Europe, the Middle East, and economic strength. We believe strongly in adhering to a disciplined, diversified, long-term investment approach during volatile periods, and we appreciate your continued trust in us during these unsettled times.
Sincerely,
Jonathan Thomas
President and Chief Executive Officer
American Century Investments
2
Dear Fellow Shareholders,
The assets under management in American Century Investments’ funds grow through investors placing new assets in the funds and through market appreciation. Asset growth has been at near record levels over the past two calendar years as market movements were upward, the funds’ relative returns were generally favorable, and the distribution strategies implemented by fund management have been successful.
The board reviews fund performance and distribution strategies on a regular basis. Several years ago, the fund’s management team discussed with the board its plans to grow fund assets in the intermediary, institutional and international distribution channels. These distribution strategies have produced strong positive growth. The growth in the intermediary channel recognizes the funds’ strong relative investment performance and the desire of many shareholders to seek financial guidance. Investors in both the institutional and international channels appear to find the funds’ risk-based investment strategies attractive. The board continues to support fund management’s strategies to increase fund assets and will continue to work to provide the benefits of these gains to fund shareholders.
We continue to receive a steady flow of very thoughtful questions from shareholders. If there are issues that you would like the board to address please email me at dhpratt@fundboardchair.com. Thank you for your continued investment in American Century Investments funds.
Best regards,
Don Pratt
3

By Enrique Chang,
Chief Investment Officer,
American Century Investments
Global Stocks Mixed but Generally Lower
The global equity markets faced significant volatility from April 29, 2011 (fund inception), through March 31, 2012, but posted negative overall returns. Global stocks began the period on a down note, declining broadly throughout the spring and summer of 2011 amid concerns that evidence of an economic slowdown in many regions of the world could lead to a worldwide recession. In addition, a worsening sovereign debt crisis in Europe and fiscal challenges in the U.S.—including an unprecedented credit rating downgrade of U.S. debt—weighed on investor confidence.
However, global stock markets bottomed in early October and then reversed course, enjoying a substantial rebound over the last six months of the period. Investors grew more optimistic as signs of improving economic activity, particularly in the U.S. and U.K., quashed recession fears. Another positive factor was better news out of Europe—the European Central Bank provided long-term financing to the debt markets and support for the Continent’s troubled banking sector, while Greece reached an agreement on a sovereign debt restructuring.
U.S., Japan Held Up Best
For the full reporting period, the broad global equity indices declined by 3–4%. As the table below shows, the U.S. and Japanese stock markets posted the best returns. The U.S. equity market was one of the few around the world to deliver positive performance, thanks primarily to a strong rally over the last six months as economic conditions improved. In contrast, Japanese stocks held up best during the global market decline in the first five months of the period and ended up largely unchanged overall.
On the downside, stock markets in the Europe and Asia/Pacific regions declined the most during the reporting period. European stocks were hit hardest by the Continent’s sovereign debt crisis and troubled banking sector, while a slowdown in some of the faster-growing emerging economies in Asia weighed on equity markets in the region. Emerging markets underperformed their counterparts in the developed world as some of the larger emerging economies slowed and investors shied away from riskier investments.
| Global Equity Total Returns | ||||
| From April 29, 2011 (fund inception) through March 31, 2012* (in U.S. dollars) | ||||
| MSCI World Index | -3.54% | MSCI Japan Index | -0.11% | |
| MSCI U.S. Broad Market (Gross) Index | 4.23% | MSCI Pacific ex-Japan Index | -10.15% | |
| MSCI Europe Index | -14.39% | MSCI Emerging Markets Index | -11.55% | |
*Total returns for periods less than one year are not annualized.
4
| Total Returns as of March 31, 2012 | |||
| Ticker Symbol | Since Inception(1) | Inception Date | |
| Investor Class | ARYVX | -1.57% | 4/29/11 |
MSCI All Country World IMI Real Estate Index | — | -3.47% | — |
| MSCI All Country World Index | — | -4.63% | — |
| Institutional Class | ARYNX | -1.47% | 4/29/11 |
A Class No sales charge* With sales charge* | ARYMX | -1.82% -7.46% | 4/29/11 |
C Class No sales charge* With sales charge* | ARYTX | -2.50% -3.48% | 4/29/11 |
| R Class | ARYWX | -2.07% | 4/29/11 |
| * | Sales charges include initial sales charges and contingent deferred sales charges (CDSCs), as applicable. A Class shares have a 5.75% maximum initial sales charge and may be subject to a maximum CDSC of 1.00%. C Class shares redeemed within 12 months of purchase are subject to a maximum CDSC of 1.00%. The SEC requires that mutual funds provide performance information net of maximum sales charges in all cases where charges could be applied. |
| (1) | Total returns for periods less than one year are not annualized. |
Data presented reflect past performance. Past performance is no guarantee of future results. Current performance may be higher or lower than the performance shown. Investment return and principal value will fluctuate, and redemption value may be more or less than original cost. To obtain performance data current to the most recent month end, please call 1-800-345-2021 or visit americancentury.com. The fund may be subject to certain risks similar to those associated with direct investment in real estate including but not limited to: local or regional economic conditions, changes in zoning laws, changes in property values, property tax increases, overbuilding, increased competition, environmental contamination, natural disasters and interest rate risk. International investing involves special risks, such as political instability and currency fluctuations. Investing in emerging markets may accentuate these risks. The fund’s investment process may result in high portfolio turnover, which could mean high transaction costs, affecting both performance and capital gains tax liabilities to investors.
Unless otherwise indicated, performance reflects Investor Class shares; performance for other share classes will vary due to differences in fee structure. For information about other share classes available, please consult the prospectus. Data assumes reinvestment of dividends and capital gains, and none of the charts reflect the deduction of taxes that a shareholder would pay on fund distributions or the redemption of fund shares. Returns for the indices are provided for comparison. The fund’s total returns include operating expenses (such as transaction costs and management fees) that reduce returns, while the total returns of the indices do not.
5
| Growth of $10,000 Over Life of Class |
| $10,000 investment made April 29, 2011 |
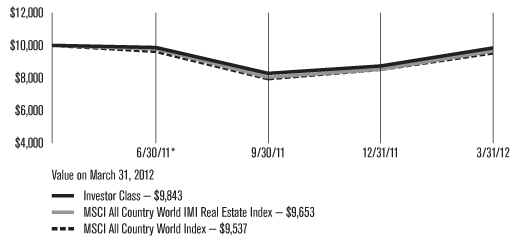
*From 4/29/11, the Investor Class’s inception date. Not annualized.
| Total Annual Fund Operating Expenses | ||||
| Investor Class | Institutional Class | A Class | C Class | R Class |
| 1.20% | 1.00% | 1.45% | 2.20% | 1.70% |
The total annual fund operating expenses shown is as stated in the fund’s prospectus current as of the date of this report. The prospectus may vary from the expense ratio shown elsewhere in this report because it is based on a different time period, includes acquired fund fees and expenses, and, if applicable, does not include fee waivers or expense reimbursements.
Data presented reflect past performance. Past performance is no guarantee of future results. Current performance may be higher or lower than the performance shown. Investment return and principal value will fluctuate, and redemption value may be more or less than original cost. To obtain performance data current to the most recent month end, please call 1-800-345-2021 or visit americancentury.com. The fund may be subject to certain risks similar to those associated with direct investment in real estate including but not limited to: local or regional economic conditions, changes in zoning laws, changes in property values, property tax increases, overbuilding, increased competition, environmental contamination, natural disasters and interest rate risk. International investing involves special risks, such as political instability and currency fluctuations. Investing in emerging markets may accentuate these risks. The fund’s investment process may result in high portfolio turnover, which could mean high transaction costs, affecting both performance and capital gains tax liabilities to investors.
Unless otherwise indicated, performance reflects Investor Class shares; performance for other share classes will vary due to differences in fee structure. For information about other share classes available, please consult the prospectus. Data assumes reinvestment of dividends and capital gains, and none of the charts reflect the deduction of taxes that a shareholder would pay on fund distributions or the redemption of fund shares. Returns for the indices are provided for comparison. The fund’s total returns include operating expenses (such as transaction costs and management fees) that reduce returns, while the total returns of the indices do not.
6
Portfolio Manager: Steven Brown
Performance Summary
Global Real Estate posted a total return of –1.57%* from its inception on April 29, 2011, through March 31, 2012. By comparison, the MSCI All Country World IMI Real Estate Index (the fund’s benchmark) returned –3.47%, while the MSCI All Country World Index (a broad global stock market measure) returned –4.63%.
Global Real Estate Market Overview
Global real estate stocks declined for the reporting period in a volatile market environment, but they held up better than the broad global equity indices. Global property stocks declined early in the period as a series of headwinds to global growth—including a widening European debt crisis, a stalemate regarding the federal debt ceiling in the U.S., and more restrictive monetary policy in Asia—led to concerns about a potential worldwide recession.
Market conditions changed over the last half of the period as some of these headwinds abated. Signs of improving economic activity in the U.S. helped alleviate recession fears. In addition, central bank activity around the world—liquidity injections by the European Central Bank, asset purchases by the Bank of Japan, lower reserve requirements in China and India, and interest rate cuts in Brazil and the Philippines—provided a favorable backdrop for the global equity markets. In this environment, global real estate stocks rebounded smartly but could not recover all of the ground lost during the first half of the period.
From a regional perspective, real estate stocks in the U.S., Japan, and selected countries in Asia (including the Philippines and Indonesia) were among the few to post positive returns for the reporting period. Property stocks in Brazil also generated solid gains. On the downside, real estate stocks in many European countries produced sizable declines as the financial environment deteriorated. The most noteworthy of these included Spain, Italy, and the Netherlands.
Country Weightings Added Value
The fund’s outperformance of its benchmark index during the reporting period was driven in part by favorable country weightings. Early in the period, we positioned the portfolio with overweight positions relative to the index in the U.S., Canada, Japan, and Singapore. Within Europe, the fund also held an overweight position in Switzerland, where property stocks tend to be less cyclical than elsewhere in Europe. At the same time, the fund had underweight positions in many emerging markets, as well as countries with exposure to southern Europe, where the sovereign debt crisis was most acute.
As economic conditions began to improve during the second half of the period, we shifted the focus of the portfolio toward greater cyclicality. As a result, the fund added overweight positions in Brazil and other emerging economies in Asia, including the Philippines, China, and Hong Kong.
*All fund returns referenced in this commentary are for Investor Class shares. Total returns for periods less than one year are not annualized.
7
Stock Selection Also Contributed to Outperformance
Individual stock selection also contributed to the fund’s outperformance of its benchmark index. Approximately 45% of the portfolio was invested in U.S. real estate stocks, and several of the top contributors were U.S.-based companies. One of these was Taubman Centers, which owns a high-quality portfolio of regional mall properties throughout the United States. Taubman had the most productive portfolio in the mall industry in 2011. Self-storage company Extra Space Storage and student housing developer American Campus Communities were also among the best contributors.
Outside of the U.S., strong contributors included two retail property owners, BR Malls Participacoes and Link Real Estate Investment Trust (REIT). BR Malls, which owns shopping malls across Brazil, reported strong earnings during the last half of the reporting period as better consumer spending patterns led to greater retail demand in the company’s property portfolio. Link REIT, a Hong Kong retail landlord, focuses on staples such as grocery stores, drug stores, and restaurants. Thanks to its defensive nature, as well as a relatively high dividend yield and a strong balance sheet, Link REIT held up well during the downturn in the first half of the period.
Individual Detractors
Among individual holdings, Chinese real estate developer Evergrande Real Estate Group had the biggest negative impact on performance versus the benchmark. Although the company delivered strong sales and earnings growth, it failed to meet its own internal targets, and the stock fell sharply in response.
Other notable detractors included German office REIT Alstria and Australian industrial property owner Goodman Group. Alstria raised capital twice during the reporting period by issuing equity and reported weaker-than-expected leasing velocity in its office portfolio, while Goodman underperformed meaningfully during the sell-off early in the period.
Outlook
We have a positive outlook for the U.S. and selected property markets in Asia. The U.S. should benefit from continued improvement on the economic front given low interest rates and stimulative government policies. We also favor Asian markets such as Indonesia, Singapore, and the Philippines because of low interest rates, strong earnings growth, accommodative monetary policy, and support for increased mortgage lending. We have a cautious outlook for Europe, where the benefits from the European Central Bank’s funding and liquidity efforts are expected to subside over the remainder of the year, resulting in fairly flat economic growth in the region.
8
| MARCH 31, 2012 | |
| Top Ten Holdings | % of net assets |
| Simon Property Group, Inc. | 5.5% |
| Equity Residential | 3.7% |
| Unibail-Rodamco SE | 3.6% |
| ProLogis, Inc. | 3.5% |
| Host Hotels & Resorts, Inc. | 3.0% |
| Westfield Group | 2.6% |
| Macerich Co. (The) | 2.6% |
| SL Green Realty Corp. | 2.5% |
| Essex Property Trust, Inc. | 2.5% |
| Taubman Centers, Inc. | 2.4% |
| Types of Investments in Portfolio | % of net assets |
Foreign Common Stocks(1) | 51.7% |
| Domestic Common Stocks | 46.0% |
| Total Equity Exposure | 97.7% |
| Temporary Cash Investments | 1.5% |
| Other Assets and Liabilities | 0.8% |
(1)Includes depositary shares, dual listed securities and foreign ordinary shares. | |
| Investments by Country | % of net assets |
| United States | 46.0% |
| Hong Kong | 11.2% |
| Japan | 9.7% |
| France | 5.5% |
| Australia | 4.9% |
| United Kingdom | 4.7% |
| Singapore | 4.2% |
| Brazil | 2.3% |
| Canada | 2.2% |
| Other Countries | 7.0% |
Cash and Equivalents(2) | 2.3% |
(2)Includes temporary cash investments and other assets and liabilities. | |
9
Fund shareholders may incur two types of costs: (1) transaction costs, including sales charges (loads) on purchase payments and redemption/exchange fees; and (2) ongoing costs, including management fees; distribution and service (12b-1) fees; and other fund expenses. This example is intended to help you understand your ongoing costs (in dollars) of investing in your fund and to compare these costs with the ongoing cost of investing in other mutual funds.
The example is based on an investment of $1,000 made at the beginning of the period and held for the entire period from October 1, 2011 to March 31, 2012.
Actual Expenses
The table provides information about actual account values and actual expenses for each class. You may use the information, together with the amount you invested, to estimate the expenses that you paid over the period. First, identify the share class you own. Then simply divide your account value by $1,000 (for example, an $8,600 account value divided by $1,000 = 8.6), then multiply the result by the number under the heading “Expenses Paid During Period” to estimate the expenses you paid on your account during this period.
If you hold Investor Class shares of any American Century Investments fund, or Institutional Class shares of the American Century Diversified Bond Fund, in an American Century Investments account (i.e., not a financial intermediary or retirement plan account), American Century Investments may charge you a $12.50 semiannual account maintenance fee if the value of those shares is less than $10,000. We will redeem shares automatically in one of your accounts to pay the $12.50 fee. In determining your total eligible investment amount, we will include your investments in all personal accounts (including American Century Investments Brokerage accounts) registered under your Social Security number. Personal accounts include individual accounts, joint accounts, UGMA/UTMA accounts, personal trusts, Coverdell Education Savings Accounts and IRAs (including traditional, Roth, Rollover, SEP-, SARSEP- and SIMPLE-IRAs), and certain other retirement accounts. If you have only business, business retirement, employer-sponsored or American Century Investments Brokerage accounts, you are currently not subject to this fee. If you are subject to the Account Maintenance Fee, your account value could be reduced by the fee amount.
Hypothetical Example for Comparison Purposes
The table also provides information about hypothetical account values and hypothetical expenses based on the actual expense ratio of each class of your fund and an assumed rate of return of 5% per year before expenses, which is not the actual return of a fund’s share class. The hypothetical account values and expenses may not be used to estimate the actual ending account balance or expenses you paid for the period. You may use this information to compare the ongoing costs of investing in your fund and other funds. To do so, compare this 5% hypothetical example with the 5% hypothetical examples that appear in the shareholder reports of the other funds.
10
Please note that the expenses shown in the table are meant to highlight your ongoing costs only and do not reflect any transactional costs, such as sales charges (loads) or redemption/exchange fees. Therefore, the table is useful in comparing ongoing costs only, and will not help you determine the relative total costs of owning different funds. In addition, if these transactional costs were included, your costs would have been higher.
Beginning Account Value 10/1/11 | Ending Account Value 3/31/12 | Expenses Paid During Period(1) 10/1/11 – 3/31/12 | Annualized Expense Ratio(1) | |
| Actual | ||||
| Investor Class | $1,000 | $1,188.80 | $6.62 | 1.21% |
| Institutional Class | $1,000 | $1,188.50 | $5.53 | 1.01% |
| A Class | $1,000 | $1,187.20 | $7.98 | 1.46% |
| C Class | $1,000 | $1,183.30 | $12.06 | 2.21% |
| R Class | $1,000 | $1,185.60 | $9.34 | 1.71% |
| Hypothetical | ||||
| Investor Class | $1,000 | $1,018.95 | $6.11 | 1.21% |
| Institutional Class | $1,000 | $1,019.95 | $5.10 | 1.01% |
| A Class | $1,000 | $1,017.70 | $7.36 | 1.46% |
| C Class | $1,000 | $1,013.95 | $11.13 | 2.21% |
| R Class | $1,000 | $1,016.45 | $8.62 | 1.71% |
| (1) | Expenses are equal to the class’s annualized expense ratio listed in the table above, multiplied by the average account value over the period, multiplied by 183, the number of days in the most recent fiscal half-year, divided by 366, to reflect the one-half year period. |
11
MARCH 31, 2012
| Shares | Value | |||||||
| Common Stocks — 97.7% | ||||||||
| AUSTRALIA — 4.9% | ||||||||
| Dexus Property Group | 74,307 | $66,965 | ||||||
| Goodman Group | 135,508 | 96,852 | ||||||
| Investa Office Fund | 98,898 | 65,052 | ||||||
| Westfield Group | 28,736 | 262,835 | ||||||
| 491,704 | ||||||||
| BRAZIL — 2.3% | ||||||||
| BR Malls Participacoes SA | 17,500 | 226,246 | ||||||
| CANADA — 2.2% | ||||||||
| Brookfield Asset Management, Inc. Class A | 7,016 | 221,358 | ||||||
| FRANCE — 5.5% | ||||||||
| Gecina SA | 1,828 | 190,993 | ||||||
| Unibail-Rodamco SE | 1,785 | 356,979 | ||||||
| 547,972 | ||||||||
| HONG KONG — 11.2% | ||||||||
| Cheung Kong Holdings Ltd. | 15,000 | 193,740 | ||||||
| China Overseas Land & Investment Ltd. | 66,000 | 125,446 | ||||||
| China Resources Land Ltd. | 46,000 | 79,495 | ||||||
| Hang Lung Properties Ltd. | 53,000 | 194,172 | ||||||
| Kerry Properties Ltd. | 30,000 | 135,019 | ||||||
| New World Development Co. Ltd. | 86,000 | 103,326 | ||||||
| Sino Land Co. Ltd. | 84,000 | 134,131 | ||||||
| Sun Hung Kai Properties Ltd. | 13,000 | 161,547 | ||||||
| 1,126,876 | ||||||||
| INDIA — 0.3% | ||||||||
| Indiabulls Real Estate Ltd. | 12,249 | 15,352 | ||||||
| Sobha Developers Ltd. | 3,088 | 20,193 | ||||||
| 35,545 | ||||||||
| INDONESIA — 1.3% | ||||||||
| PT Alam Sutera Realty Tbk | 804,000 | 54,514 | ||||||
| PT Ciputra Development Tbk | 372,500 | 29,331 | ||||||
| PT Lippo Karawaci Tbk | 518,000 | 45,319 | ||||||
| 129,164 | ||||||||
| JAPAN — 9.7% | ||||||||
| Daito Trust Construction Co. Ltd. | 1,000 | 89,767 | ||||||
| Daiwa House Industry Co. Ltd. | 6,000 | 79,304 | ||||||
| Japan Real Estate Investment Corp. | 9 | 79,268 | ||||||
| Japan Retail Fund Investment Corp. | 40 | 59,393 | ||||||
| Mitsubishi Estate Co. Ltd. | 13,000 | 231,823 | ||||||
| Mitsui Fudosan Co. Ltd. | 9,000 | 172,127 | ||||||
| Nippon Building Fund, Inc. | 9 | 85,466 | ||||||
| Sumitomo Realty & Development Co. Ltd. | 5,000 | 120,515 | ||||||
| United Urban Investment Corp. | 50 | 57,086 | ||||||
| 974,749 | ||||||||
| PEOPLE’S REPUBLIC OF CHINA — 1.6% | ||||||||
| Evergrande Real Estate Group Ltd. | 181,000 | 96,962 | ||||||
| Longfor Properties Co. Ltd. | 42,500 | 59,545 | ||||||
| 156,507 | ||||||||
| PHILIPPINES — 1.5% | ||||||||
| Ayala Land, Inc. | 116,700 | 56,400 | ||||||
| Robinsons Land Corp. | 79,600 | 30,590 | ||||||
| SM Prime Holdings, Inc. | 153,000 | 60,224 | ||||||
| 147,214 | ||||||||
| SINGAPORE — 4.2% | ||||||||
| CapitaMalls Asia Ltd. | 83,000 | 107,955 | ||||||
Global Logistic Properties Ltd.(1) | 106,000 | 185,513 | ||||||
| Keppel Land Ltd. | 48,000 | 132,501 | ||||||
| 425,969 | ||||||||
| SOUTH AFRICA — 1.2% | ||||||||
| Capital Property Fund | 41,101 | 49,025 | ||||||
| Growthpoint Properties Ltd. | 28,004 | 73,013 | ||||||
| 122,038 | ||||||||
| TAIWAN (REPUBLIC OF CHINA) — 1.1% | ||||||||
| Chong Hong Construction Co. | 26,000 | 59,286 | ||||||
| Huaku Development Co. Ltd. | 19,000 | 48,217 | ||||||
| 107,503 | ||||||||
| UNITED KINGDOM — 4.7% | ||||||||
| Derwent London plc | 4,345 | 121,275 | ||||||
| Hammerson plc | 31,244 | 207,695 | ||||||
| Unite Group plc | 44,040 | 138,771 | ||||||
| 467,741 | ||||||||
| UNITED STATES — 46.0% | ||||||||
| American Tower Corp. | 1,099 | 69,259 | ||||||
| Apartment Investment & Management Co., Class A | 8,487 | 224,142 | ||||||
CBRE Group, Inc.(1) | 8,949 | 178,622 | ||||||
| DDR Corp. | 15,013 | 219,190 | ||||||
| Douglas Emmett, Inc. | 9,925 | 226,389 | ||||||
| Duke Realty Corp. | 16,140 | 231,448 | ||||||
| Equity Residential | 5,853 | 366,515 | ||||||
| Essex Property Trust, Inc. | 1,626 | 246,355 | ||||||
Forest City Enterprises, Inc. Class A(1) | 14,228 | 222,811 | ||||||
| Host Hotels & Resorts, Inc. | 18,274 | 300,059 | ||||||
| Kilroy Realty Corp. | 4,999 | 233,003 | ||||||
12
| Shares | Value | |||||||
| LaSalle Hotel Properties | 3,083 | $86,756 | ||||||
| Macerich Co. (The) | 4,533 | 261,781 | ||||||
| Newcastle Investment Corp. | 24,205 | 152,008 | ||||||
| ProLogis, Inc. | 9,768 | 351,843 | ||||||
| Simon Property Group, Inc. | 3,768 | 548,922 | ||||||
| SL Green Realty Corp. | 3,237 | 251,029 | ||||||
| Starwood Hotels & Resorts Worldwide, Inc. | 3,554 | 200,481 | ||||||
| Taubman Centers, Inc. | 3,293 | 240,224 | ||||||
| 4,610,837 | ||||||||
TOTAL COMMON STOCKS (Cost $8,982,452) | 9,791,423 | |||||||
| Temporary Cash Investments — 1.5% | ||||||||
| SSgA U.S. Government Money Market Fund (Cost $144,827) | 144,827 | 144,827 | ||||||
TOTAL INVESTMENT SECURITIES — 99.2% (Cost $9,127,279) | 9,936,250 | |||||||
| OTHER ASSETS AND LIABILITIES — 0.8% | 82,912 | |||||||
| NET ASSETS — 100.0% | $10,019,162 | |||||||
| Sub-Industry Allocation | ||||
| (as a % of net assets) | ||||
| Retail REITs | 21.6 | % | ||
| Diversified Real Estate Activities | 17.6 | % | ||
| Office REITs | 12.8 | % | ||
| Real Estate Operating Companies | 10.1 | % | ||
| Real Estate Development | 9.2 | % | ||
| Residential REITs | 8.3 | % | ||
| Specialized REITs | 4.6 | % | ||
| Industrial REITs | 4.5 | % | ||
| Diversified REITs | 3.7 | % | ||
| Hotels, Resorts and Cruise Lines | 2.0 | % | ||
| Real Estate Services | 1.8 | % | ||
| Mortgage REITs | 1.5 | % | ||
| Cash and Equivalents* | 2.3 | % | ||
| *Includes temporary cash investments and other assets and liabilities. | ||||
Notes to Schedule of Investments
REIT = Real Estate Investment Trust
| (1) | Non-income producing. |
See Notes to Financial Statements.
13
| MARCH 31, 2012 | ||||
| Assets | ||||
| Investment securities, at value (cost of $9,127,279) | $9,936,250 | |||
| Receivable for investments sold | 286,407 | |||
| Receivable for capital shares sold | 2,405 | |||
| Dividends receivable | 31,459 | |||
| 10,256,521 | ||||
| Liabilities | ||||
| Payable for investments purchased | 226,877 | |||
| Payable for capital shares redeemed | 39 | |||
| Accrued management fees | 9,819 | |||
| Distribution and service fees payable | 624 | |||
| 237,359 | ||||
| Net Assets | $10,019,162 | |||
| Net Assets Consist of: | ||||
| Capital (par value and paid-in surplus) | $9,271,374 | |||
| Undistributed net investment income | 87,749 | |||
| Accumulated net realized loss | (148,908 | ) | ||
| Net unrealized appreciation | 808,947 | |||
| $10,019,162 | ||||
| Net assets | Shares outstanding | Net asset value per share | |
| Investor Class, $0.01 Par Value | $7,321,515 | 750,671 | $9.75 |
| Institutional Class, $0.01 Par Value | $1,210,393 | 124,116 | $9.75 |
| A Class, $0.01 Par Value | $700,076 | 71,756 | $9.76* |
| C Class, $0.01 Par Value | $394,448 | 40,466 | $9.75 |
| R Class, $0.01 Par Value | $392,730 | 40,242 | $9.76 |
| *Maximum offering price $10.36 (net asset value divided by 0.9425). | |||
See Notes to Financial Statements.
14
FOR THE PERIOD ENDED MARCH 31, 2012(1) | ||||
| Investment Income (Loss) | ||||
| Income: | ||||
| Dividends (net of foreign taxes withheld of $4,296) | $123,794 | |||
| Expenses: | ||||
| Management fees | 51,234 | |||
| Distribution and service fees: | ||||
| A Class | 907 | |||
| C Class | 3,412 | |||
| R Class | 1,701 | |||
| Directors’ fees and expenses | 169 | |||
| Other expenses | 89 | |||
| 57,512 | ||||
| Net investment income (loss) | 66,282 | |||
| Realized and Unrealized Gain (Loss) | ||||
| Net realized gain (loss) on: | ||||
| Investment transactions (net of foreign tax expenses paid (refunded) of $1,105) | (79,683 | ) | ||
| Foreign currency transactions (net of foreign tax expenses paid (refunded) of $3,999) | 2,029 | |||
| (77,654 | ) | |||
| Change in net unrealized appreciation (depreciation) on: | ||||
| Investments | 808,971 | |||
| Translation of assets and liabilities in foreign currencies | (24 | ) | ||
| 808,947 | ||||
| Net realized and unrealized gain (loss) | 731,293 | |||
| Net Increase (Decrease) in Net Assets Resulting from Operations | $797,575 | |||
| (1) | April 29, 2011 (fund inception) through March 31, 2012. |
See Notes to Financial Statements.
15
PERIOD ENDED MARCH 31, 2012(1) | ||||
| Increase (Decrease) in Net Assets | ||||
| Operations | ||||
| Net investment income (loss) | $66,282 | |||
| Net realized gain (loss) | (77,654 | ) | ||
| Change in net unrealized appreciation (depreciation) | 808,947 | |||
| Net increase (decrease) in net assets resulting from operations | 797,575 | |||
| Distributions to Shareholders | ||||
| From net investment income: | ||||
| Investor Class | (44,826 | ) | ||
| Institutional Class | (3,528 | ) | ||
| A Class | (2,013 | ) | ||
| R Class | (1,140 | ) | ||
| Decrease in net assets from distributions | (51,507 | ) | ||
| Capital Share Transactions | ||||
| Net increase (decrease) in net assets from capital share transactions | 9,273,094 | |||
| Net increase (decrease) in net assets | 10,019,162 | |||
| Net Assets | ||||
| End of period | $10,019,162 | |||
| Undistributed net investment income | $87,749 | |||
| (1) | April 29, 2011 (fund inception) through March 31, 2012. |
See Notes to Financial Statements.
16
MARCH 31, 2012
1. Organization
American Century Capital Portfolios, Inc. (the corporation) is registered under the Investment Company Act of 1940, as amended (the 1940 Act), as an open-end management investment company and is organized as a Maryland corporation. Global Real Estate Fund (the fund) is one fund in a series issued by the corporation. The fund is nondiversified as defined under the 1940 Act. The fund’s investment objective is to seek high total investment return through a combination of capital appreciation and current income. The fund pursues its objective by investing primarily in equity securities issued by real estate investment trusts and companies engaged in the real estate industry. The fund invests primarily in companies located in developed countries world-wide (including the United States) but may also invest in companies located in emerging markets.
The fund is authorized to issue the Investor Class, the Institutional Class, the A Class, the C Class and the R Class. The A Class may incur an initial sales charge. The A Class and C Class may be subject to a contingent deferred sales charge. The share classes differ principally in their respective sales charges and distribution and shareholder servicing expenses and arrangements. The Institutional Class is made available to institutional shareholders or through financial intermediaries whose clients do not require the same level of shareholder and administrative services as shareholders of other classes. As a result, the Institutional Class is charged a lower unified management fee. All classes of the fund commenced sale on April 29, 2011, the fund’s inception date.
2. Significant Accounting Policies
The following is a summary of significant accounting policies consistently followed by the fund in preparation of its financial statements. The financial statements are prepared in conformity with accounting principles generally accepted in the United States of America, which may require management to make certain estimates and assumptions at the date of the financial statements. Actual results could differ from these estimates.
Investment Valuations — The fund determines the fair value of its investments and computes its net asset value per share as of the close of regular trading (usually 4 p.m. Eastern time) on the New York Stock Exchange (NYSE) on each day the NYSE is open.
Equity securities that are listed or traded on a domestic securities exchange are valued at the last reported sales price or at the official closing price as provided by the exchange. Equity securities traded on foreign securities exchanges are typically valued at the closing price on the exchange where primarily traded or as of the close of the NYSE, if that is earlier. If no last sales price is reported, or if local convention or regulation so provides, the mean of the latest bid and asked prices is used. Depending on local convention or regulation, securities traded over-the-counter are valued at the mean of the latest bid and asked prices, the last sales price, or the official closing price. In its determination of fair value, the fund may review several factors including: market information specific to a security; news developments in U.S. and foreign markets; the performance of particular U.S. and foreign securities, indices, comparable securities, American Depositary Receipts, Exchange-Traded Funds, and other relevant market indicators.
Debt securities maturing within 60 days at the time of purchase may be valued at cost, plus or minus any amortized discount or premium or at the evaluated mean as provided by an independent pricing service. Evaluated mean prices are commonly derived through utilization of market models, which may consider, among other factors, trade data, quotations from dealers and active market makers, relevant yield curve and spread data, related sector levels, creditworthiness, and other relevant market information on the same or comparable securities.
Investments in open-end management investment companies are valued at the reported net asset value per share. The value of investments initially expressed in foreign currencies is translated into U.S. dollars at prevailing exchange rates.
17
If the fund determines that the market price for a portfolio security is not readily available or the valuation methods mentioned above do not reflect a security’s fair value, such security is valued as determined in good faith by the Board of Directors or its designee, in accordance with procedures adopted by the Board of Directors. Circumstances that may cause the fund to use these procedures to value a security include, but are not limited to: a security has been declared in default; trading in a security has been halted during the trading day; there is a foreign market holiday and no trading occurred; or an event occurred between the close of a foreign exchange and the NYSE that may affect the value of a security.
Security Transactions — Security transactions are accounted for as of the trade date. Net realized gains and losses are determined on the identified cost basis, which is also used for federal income tax purposes. Certain countries impose taxes on realized gains on the sale of securities registered in their country. The fund records the foreign tax expense, if any, on an accrual basis. The foreign tax expense on realized gains and unrealized appreciation reduces the net realized gain (loss) on investment transactions and net unrealized appreciation (depreciation) on investments, respectively.
Investment Income — Dividend income less foreign taxes withheld, if any, is recorded as of the ex-dividend date. Distributions received on securities that represent a return of capital or capital gain are recorded as a reduction of cost of investments and/or as a realized gain. The fund estimates the components of distributions received that may be considered nontaxable distributions or capital gain distributions for income tax purposes.
Foreign Currency Translations — All assets and liabilities initially expressed in foreign currencies are translated into U.S. dollars at prevailing exchange rates at period end. The fund may enter into spot foreign currency exchange contracts to facilitate transactions denominated in a foreign currency. Purchases and sales of investment securities, dividend and interest income, spot foreign currency exchange contracts, and expenses are translated at the rates of exchange prevailing on the respective dates of such transactions. Net realized and unrealized foreign currency exchange gains or losses related to investment securities are a component of net realized gain (loss) on investment transactions and change in net unrealized appreciation (depreciation) on investments, respectively. Certain countries impose taxes on the contract amount of purchases and sales of foreign currency contracts in their currency. The fund records the foreign tax expense, if any, as a reduction to the net realized gain (loss) on foreign currency transactions.
Income Tax Status — It is the fund’s policy to distribute substantially all net investment income and net realized gains to shareholders and to otherwise qualify as a regulated investment company under provisions of the Internal Revenue Code. All tax years for the fund remain subject to examination by tax authorities. Additionally, non-U.S. tax returns filed by the fund due to investments in certain foreign securities remain subject to examination by the relevant taxing authority for seven years from the date of filing. At this time, management believes there are no uncertain tax positions which, based on their technical merit, would not be sustained upon examination and for which it is reasonably possible that the total amounts of unrecognized tax benefits will significantly change in the next twelve months. Accordingly, no provision has been made for federal or state income taxes.
Multiple Class — All shares of the fund represent an equal pro rata interest in the net assets of the class to which such shares belong, and have identical voting, dividend, liquidation and other rights and the same terms and conditions, except for class specific expenses and exclusive rights to vote on matters affecting only individual classes. Income, non-class specific expenses, and realized and unrealized capital gains and losses of the fund are allocated to each class of shares based on their relative net assets.
Distributions to Shareholders — Distributions from net investment income and net realized gains, if any, are generally declared and paid annually.
18
Indemnifications — Under the corporation’s organizational documents, its officers and directors are indemnified against certain liabilities arising out of the performance of their duties to the fund. In addition, in the normal course of business, the fund enters into contracts that provide general indemnifications. The maximum exposure under these arrangements is unknown as this would involve future claims that may be made against a fund. The risk of material loss from such claims is considered by management to be remote.
3. Fees and Transactions with Related Parties
Management Fees — The corporation has entered into a management agreement with American Century Investment Management, Inc. (ACIM) (the investment advisor), under which ACIM provides the fund with investment advisory and management services in exchange for a single, unified management fee (the fee) per class. The agreement provides that all expenses of managing and operating the fund, except distribution and service fees, brokerage expenses, taxes, interest, fees and expenses of the independent directors (including legal counsel fees), and extraordinary expenses, will be paid by ACIM. The fee is computed and accrued daily based on each class’s daily net assets and paid monthly in arrears. The annual management fee is 1.20% for the Investor Class, A Class, C Class and R Class and 1.00% for the Institutional Class.
Distribution and Service Fees — The Board of Directors has adopted a separate Master Distribution and Individual Shareholder Services Plan for each of the A Class, C Class and R Class (collectively the plans), pursuant to Rule 12b-1 of the 1940 Act. The plans provide that the A Class will pay American Century Investment Services, Inc. (ACIS) an annual distribution and service fee of 0.25%. The plans provide that the C Class will pay ACIS an annual distribution and service fee of 1.00%, of which 0.25% is paid for individual shareholder services and 0.75% is paid for distribution services. The plans provide that the R Class will pay ACIS an annual distribution and service fee of 0.50%. The fees are computed and accrued daily based on each class’s daily net assets and paid monthly in arrears. The fees are used to pay financial intermediaries for distribution and individual shareholder services. Fees incurred under the plans during the period April 29, 2011 (fund inception) through March 31, 2012 are detailed in the Statement of Operations.
Related Parties — Certain officers and directors of the corporation are also officers and/or directors of American Century Companies, Inc. (ACC), the parent of the corporation’s investment advisor, ACIM, the distributor of the corporation, ACIS, and the corporation’s transfer agent, American Century Services, LLC. ACIM owns 16% of the outstanding shares of the fund.
The fund was eligible to invest in a money market fund for temporary purposes, which is managed by J.P. Morgan Investment Management, Inc. (JPMIM). The fund had a mutual funds services agreement with J.P. Morgan Investor Services Co. (JPMIS). JPMorgan Chase Bank (JPMCB) was a custodian of the fund. JPMIM, JPMIS and JPMCB are wholly owned subsidiaries of JPMorgan Chase & Co. (JPM). Prior to August 31, 2011, JPM was an equity investor in ACC. The services provided to the fund by JPMIM, JPMIS and JPMCB terminated on July 31, 2011.
4. Investment Transactions
Purchases and sales of investment securities, excluding short-term investments, for the period April 29, 2011 (fund inception) through March 31, 2012 were $30,946,852 and $21,862,271, respectively.
19
5. Capital Share Transactions
Transactions in shares of the fund were as follows:
Period ended March 31, 2012(1) | |||||||
| Shares | Amount | ||||||
| Investor Class/Shares Authorized | 100,000,000 | ||||||
| Sold | 854,623 | $7,552,260 | |||||
| Issued in reinvestment of distributions | 5,108 | 42,702 | |||||
| Redeemed | (109,060 | ) | (1,017,719 | ) | |||
| 750,671 | 6,577,243 | ||||||
| Institutional Class/Shares Authorized | 50,000,000 | ||||||
| Sold | 124,215 | 1,185,652 | |||||
| Issued in reinvestment of distributions | 422 | 3,528 | |||||
| Redeemed | (521 | ) | (5,041 | ) | |||
| 124,116 | 1,184,139 | ||||||
| A Class/Shares Authorized | 50,000,000 | ||||||
| Sold | 71,516 | 703,821 | |||||
| Issued in reinvestment of distributions | 240 | 2,013 | |||||
| 71,756 | 705,834 | ||||||
| C Class/Shares Authorized | 50,000,000 | ||||||
| Sold | 40,466 | 403,814 | |||||
| R Class/Shares Authorized | 50,000,000 | ||||||
| Sold | 40,106 | 400,924 | |||||
| Issued in reinvestment of distributions | 136 | 1,140 | |||||
| 40,242 | 402,064 | ||||||
| Net increase (decrease) | 1,027,251 | $9,273,094 | |||||
| (1) | April 29, 2011 (fund inception) through March 31, 2012. |
6. Fair Value Measurements
The fund’s securities valuation process is based on several considerations and may use multiple inputs to determine the fair value of the positions held by the fund. In conformity with accounting principles generally accepted in the United States of America, the inputs used to determine a valuation are classified into three broad levels as follows:
| • | Level 1 valuation inputs consist of unadjusted quoted prices in an active market for identical securities; |
| • | Level 2 valuation inputs consist of direct or indirect observable market data (including quoted prices for similar securities, evaluations of subsequent market events, interest rates, prepayment speeds, credit risk, etc.); or |
| • | Level 3 valuation inputs consist of unobservable data (including a fund’s own assumptions). |
The level classification is based on the lowest level input that is significant to the fair valuation measurement. The valuation inputs are not necessarily an indication of the risks associated with investing in these securities or other financial instruments.
20
The following is a summary of the level classifications as of period end. The Schedule of Investments provides additional information on the fund’s portfolio holdings.
| Level 1 | Level 2 | Level 3 | |
| Investment Securities | |||
| Foreign Common Stocks | — | $5,180,586 | — |
| Domestic Common Stocks | $4,610,837 | — | — |
| Temporary Cash Investments | 144,827 | — | — |
| Total Value of Investment Securities | $4,755,664 | $5,180,586 | — |
7. Risk Factors
The fund concentrates its investments in a narrow segment of the total market. Because of this, the fund is subject to certain additional risks as compared to investing in a more diversified portfolio of investments. The fund may be subject to certain risks similar to those associated with direct investment in real estate including but not limited to: local or regional economic conditions, changes in zoning laws, changes in property values, property tax increases, overbuilding, increased competition, environmental contamination, natural disasters, and interest rate risk.
There are certain risks involved in investing in foreign securities. These risks include those resulting from future adverse political, social, and economic developments, fluctuations in currency exchange rates, the possible imposition of exchange controls, and other foreign laws or restrictions. Investing in emerging markets may accentuate these risks.
The fund’s investment process may result in high portfolio turnover, which could mean high transaction costs, affecting both performance and capital gains tax liabilities to investors.
8. Federal Tax Information
The tax character of distributions paid during the period April 29, 2011 (fund inception) through March 31, 2012 was as follows:
| 2012 | |
| Distributions Paid From | |
| Ordinary income | $51,507 |
| Long-term capital gains | — |
The book-basis character of distributions made during the year from net investment income or net realized gains may differ from their ultimate characterization for federal income tax purposes. These differences reflect the differing character of certain income items and net realized gains and losses for financial statement and tax purposes, and may result in reclassification among certain capital accounts on the financial statements.
21
As of March 31, 2012, the federal tax cost of investments and the components of distributable earnings on a tax-basis were as follows:
| Federal tax cost of investments | $9,379,644 | |||
| Gross tax appreciation of investments | $580,473 | |||
| Gross tax depreciation of investments | (23,867 | ) | ||
| Net tax appreciation (depreciation) of investments | $556,606 | |||
Net tax appreciation (depreciation) on translation of assets and liabilities in foreign currencies | $(141 | ) | ||
| Net tax appreciation (depreciation) | $556,465 | |||
| Undistributed ordinary income | $196,878 | |||
| Accumulated capital losses | $(5,555 | ) |
The difference between book-basis and tax-basis cost and unrealized appreciation (depreciation) is attributable primarily to the tax deferral of losses on wash sales and the realization for tax purposes of unrealized gains (losses) on certain foreign currency exchange contracts and investments in passive foreign investment companies.
The accumulated capital losses represent net capital loss carryovers that may be used to offset future realized capital gains for federal income tax purposes. The capital loss carryovers may be carried forward for an unlimited period. Future capital loss carryover utilization in any given year may be subject to Internal Revenue Code limitations.
22
| For a Share Outstanding Throughout the Period Indicated | |||||||||||
| Per-Share Data | Ratios and Supplemental Data | ||||||||||
| Income From Investment Operations: | Ratio to Average Net Assets of: | ||||||||||
Net Asset Value, Beginning of Period | Net Investment Income (Loss)(1) | Net Realized and Unrealized Gain (Loss) | Total From Investment Operations | Distributions From Net Investment Income | Net Asset Value, End of Period | Total Return(2) | Operating Expenses | Net Investment Income (Loss) | Portfolio Turnover Rate | Net Assets, End of Period (in thousands) | |
| Investor Class | |||||||||||
2012(3) | $10.00 | 0.14 | (0.32)(5) | (0.18) | (0.07) | $9.75 | (1.57)% | 1.21%(4) | 1.63%(4) | 462% | $7,322 |
| Institutional Class | |||||||||||
2012(3) | $10.00 | 0.17 | (0.33)(5) | (0.16) | (0.09) | $9.75 | (1.47)% | 1.01%(4) | 1.83%(4) | 462% | $1,210 |
| A Class | |||||||||||
2012(3) | $10.00 | 0.12 | (0.31)(5) | (0.19) | (0.05) | $9.76 | (1.82)% | 1.46%(4) | 1.38%(4) | 462% | $700 |
| C Class | |||||||||||
2012(3) | $10.00 | 0.05 | (0.30)(5) | (0.25) | — | $9.75 | (2.50)% | 2.21%(4) | 0.63%(4) | 462% | $394 |
| R Class | |||||||||||
2012(3) | $10.00 | 0.09 | (0.30)(5) | (0.21) | (0.03) | $9.76 | (2.07)% | 1.71%(4) | 1.13%(4) | 462% | $393 |
Notes to Financial Highlights
| (1) | Computed using average shares outstanding throughout the period. |
| (2) | Total returns are calculated based on the net asset value of the last business day and do not reflect applicable sales charges, if any. Total returns for periods less than one year are not annualized. |
| (3) | April 29, 2011 (fund inception) through March 31, 2012. |
| (4) | Annualized. |
| (5) | Per-share amount was not in accord with the net realized and unrealized gain (loss) for the period because of the timing of transactions in shares of the fund and the amount and timing of per-share net realized and unrealized gain (loss) on such shares. |
See Notes to Financial Statements.
23
To the Board of Directors and Shareholders of
American Century Capital Portfolios, Inc.:
We have audited the accompanying statement of assets and liabilities, including the schedule of investments, of Global Real Estate Fund, one of the funds constituting American Century Capital Portfolios, Inc. (the “Corporation”) as of March 31, 2012, and the related statement of operations, the statement of changes in net assets, and the financial highlights for the period April 29, 2011 (fund inception) through March 31, 2012. These financial statements and financial highlights are the responsibility of the Corporation’s management. Our responsibility is to express an opinion on these financial statements and financial highlights based on our audit.
We conducted our audit in accordance with the standards of the Public Company Accounting Oversight Board (United States). Those standards require that we plan and perform the audit to obtain reasonable assurance about whether the financial statements and financial highlights are free of material misstatement. The Corporation is not required to have, nor were we engaged to perform, an audit of its internal control over financial reporting. Our audit included consideration of internal control over financial reporting as a basis for designing audit procedures that are appropriate in the circumstances, but not for the purpose of expressing an opinion on the effectiveness of the Corporation’s internal control over financial reporting. Accordingly, we express no such opinion. An audit also includes examining, on a test basis, evidence supporting the amounts and disclosures in the financial statements, assessing the accounting principles used and significant estimates made by management, as well as evaluating the overall financial statement presentation. Our procedures included confirmation of securities owned as of March 31, 2012, by correspondence with the custodian and brokers; where replies were not received from brokers, we performed other auditing procedures. We believe that our audit provides a reasonable basis for our opinion.
In our opinion, such financial statements and financial highlights referred to above present fairly, in all material respects, the financial position of Global Real Estate Fund of American Century Capital Portfolios, Inc., as of March 31, 2012, the results of its operations, the changes in its net assets, and the financial highlights for the period April 29, 2011 (fund inception) through March 31, 2012, in conformity with accounting principles generally accepted in the United States of America.
Deloitte & Touche LLP
Kansas City, Missouri
May 16, 2012
24
The Board of Directors
The individuals listed below serve as directors of the funds. Each director will continue to serve in this capacity until death, retirement, resignation or removal from office. The mandatory retirement age for directors who are not “interested persons,” as that term is defined in the Investment Company Act (independent directors), is 72. However, the mandatory retirement age for an individual director may be extended with the approval of the remaining independent directors.
Mr. Thomas is an “interested person” because he currently serves as President and Chief Executive Officer of American Century Companies, Inc. (ACC), the parent company of American Century Investment Management, Inc. (ACIM or the advisor). Mr. Fink is an “interested person” because he currently serves as Executive Vice President and Chief Operating Officer of ACC.
The other directors (more than three-fourths of the total number) are independent; that is, they have never been employees, directors or officers of, and have no financial interest in, ACC or any of its wholly owned, direct or indirect, subsidiaries, including ACIM, American Century Investment Services, Inc. (ACIS) and American Century Services, LLC (ACS). The directors serve in this capacity for seven (in the case of Mr. Thomas, 15) registered investment companies in the American Century Investments family of funds.
The following table presents additional information about the directors. The mailing address for each director is 4500 Main Street, Kansas City, Missouri 64111.
Name (Year of Birth) | Position(s) Held with Funds | Length of Time Served | Principal Occupation(s) During Past 5 Years | Number of American Century Portfolios Overseen by Director | Other Directorships Held During Past 5 Years | |
| Independent Directors | ||||||
Thomas A. Brown (1940) | Director | Since 1980 | Managing Member, Associated Investments, LLC (real estate investment company); Brown Cascade Properties, LLC (real estate investment company) (2001 to 2009) | 66 | None | |
Andrea C. Hall (1945) | Director | Since 1997 | Retired | 66 | None | |
Jan M. Lewis (1957) | Director | Since 2011 | President and Chief Executive Officer, Catholic Charities of Northeast Kansas (human services organization) (2006 to present) | 66 | None | |
James A. Olson (1942) | Director | Since 2007 | Member, Plaza Belmont LLC (private equity fund manager) | 66 | Saia, Inc. (2002 to 2012) and Entertainment Properties Trust | |
Donald H. Pratt (1937) | Director and Chairman of the Board | Since 1995 (Chairman since 2005) | Chairman and Chief Executive Officer, Western Investments, Inc. (real estate company) | 66 | None | |
25
Name (Year of Birth) | Position(s) Held with Funds | Length of Time Served | Principal Occupation(s) During Past 5 Years | Number of American Century Portfolios Overseen by Director | Other Directorships Held During Past 5 Years | |
| Independent Directors | ||||||
M. Jeannine Strandjord (1945) | Director | Since 1994 | Retired | 66 | DST Systems Inc., Euronet Worldwide Inc., and Charming Shoppes, Inc. (2006 to 2010) | |
John R. Whitten (1946) | Director | Since 2008 | Project Consultant, Celanese Corp. (industrial chemical company) | 66 | Rudolph Technologies, Inc. | |
Stephen E. Yates (1948) | Director | Since 2012 | Retired; Executive Vice President, Technology & Operations, KeyCorp. (computer services) (2004 to 2010) | 66 | Applied Industrial Technology (2001 to 2010) | |
| Interested Directors | ||||||
Barry Fink (1955) | Director and Executive Vice President | Since 2012 (Executive Vice President since 2007) | Chief Operating Officer and Executive Vice President, ACC (September 2007 to present); President, ACS (October 2007 to present); Managing Director, Morgan Stanley (2000 to 2007). Also serves as Manager, ACS and Director, ACC and certain ACC subsidiaries | 66 | None | |
Jonathan S. Thomas (1963) | Director and President | Since 2007 | President and Chief Executive Officer, ACC (March 2007 to present); Chief Administrative Officer, ACC (February 2006 to February 2007); Executive Vice President, ACC (November 2005 to February 2007). Also serves as Chief Executive Officer and Manager, ACS; Executive Vice President, ACIM; Director, ACC, ACIM and other ACC subsidiaries | 108 | None | |
26
Officers
The following table presents certain information about the executive officers of the funds. Each officer serves as an officer for each of the 15 investment companies in the American Century family of funds, unless otherwise noted. No officer is compensated for his or her service as an officer of the funds. The listed officers are interested persons of the funds and are appointed or re-appointed on an annual basis. The mailing address for each officer listed below is 4500 Main Street, Kansas City, Missouri 64111.
Name (Year of Birth) | Offices with the Funds | Principal Occupation(s) During the Past Five Years | |
Jonathan S. Thomas (1963) | Director and President since 2007 | President and Chief Executive Officer, ACC (March 2007 to present); Chief Administrative Officer, ACC (February 2006 to February 2007); Executive Vice President, ACC (November 2005 to February 2007). Also serves as Chief Executive Officer and Manager, ACS; Executive Vice President, ACIM; Director, ACC, ACIM and other ACC subsidiaries | |
Barry Fink (1955) | Director since 2012 and Executive Vice President since 2007 | Chief Operating Officer and Executive Vice President, ACC (September 2007 to present); President, ACS (October 2007 to present); Managing Director, Morgan Stanley (2000 to 2007). Also serves as Manager, ACS and Director, ACC and certain ACC subsidiaries | |
Maryanne L. Roepke (1956) | Chief Compliance Officer since 2006 and Senior Vice President since 2000 | Chief Compliance Officer, American Century funds, ACIM and ACS (August 2006 to present). Also serves as Senior Vice President, ACS | |
Charles A. Etherington (1957) | General Counsel since 2007 and Senior Vice President since 2006 | Attorney, ACC (February 1994 to present); Vice President, ACC (November 2005 to present), General Counsel, ACC (March 2007 to present); Also serves as General Counsel, ACIM, ACS, ACIS and other ACC subsidiaries; and Senior Vice President, ACIM and ACS | |
C. Jean Wade (1964) | Vice President, Treasurer and Chief Financial Officer since 2012 | Vice President, ACS (February 2000 to present) | |
Robert J. Leach (1966) | Vice President since 2006 and Assistant Treasurer since 2012 | Vice President, ACS (February 2000 to present) | |
David H. Reinmiller (1963) | Vice President since 2000 | Attorney, ACC (January 1994 to present); Associate General Counsel, ACC (January 2001 to present). Also serves as Vice President, ACIM and ACS | |
Ward D. Stauffer (1960) | Secretary since 2005 | Attorney, ACC (June 2003 to present) |
The Statement of Additional Information has additional information about the fund’s directors and is available without charge, upon request, by calling 1-800-345-2021.
27
Retirement Account Information
As required by law, distributions you receive from certain IRAs, or 403(b), 457 and qualified plans are subject to federal income tax withholding, unless you elect not to have withholding apply. Tax will be withheld on the total amount withdrawn even though you may be receiving amounts that are not subject to withholding, such as nondeductible contributions. In such case, excess amounts of withholding could occur. You may adjust your withholding election so that a greater or lesser amount will be withheld.
If you don’t want us to withhold on this amount, you must notify us to not withhold the federal income tax. You may notify us in writing or in certain situations by telephone or through other electronic means. You have the right to revoke your withholding election at any time and any election you make may remain in effect until revoked by filing a new election.
Remember, even if you elect not to have income tax withheld, you are liable for paying income tax on the taxable portion of your withdrawal. If you elect not to have income tax withheld or you don’t have enough income tax withheld, you may be responsible for payment of estimated tax. You may incur penalties under the estimated tax rules if your withholding and estimated tax payments are not sufficient. You can reduce or defer the income tax on a distribution by directly or indirectly rolling such distribution over to another IRA or eligible plan. You should consult your tax advisor for additional information.
State tax will be withheld if, at the time of your distribution, your address is within one of the mandatory withholding states and you have federal income tax withheld. State taxes will be withheld from your distribution in accordance with the respective state rules.
Proxy Voting Guidelines
American Century Investment Management, Inc., the fund’s investment advisor, is responsible for exercising the voting rights associated with the securities purchased and/or held by the fund. A description of the policies and procedures the advisor uses in fulfilling this responsibility is available without charge, upon request, by calling 1-800-345-2021. It is also available on American Century Investments’ website at americancentury.com and on the Securities and Exchange Commission’s website at sec.gov. Information regarding how the investment advisor voted proxies relating to portfolio securities during the most recent 12-month period ended June 30 is available on the “About Us” page at americancentury.com. It is also available at sec.gov.
Quarterly Portfolio Disclosure
The fund files its complete schedule of portfolio holdings with the Securities and Exchange Commission (SEC) for the first and third quarters of each fiscal year on Form N-Q. The fund’s Forms N-Q are available on the SEC’s website at sec.gov, and may be reviewed and copied at the SEC’s Public Reference Room in Washington, DC. Information on the operation of the Public Reference Room may be obtained by calling 1-800-SEC-0330. The fund also makes its complete schedule of portfolio holdings for the most recent quarter of its fiscal year available on its website at americancentury.com and, upon request, by calling 1-800-345-2021.
28
Other Tax Information
The following information is provided pursuant to provisions of the Internal Revenue Code.
The fund hereby designates up to the maximum amount allowable as qualified dividend income for the fiscal year ended March 31, 2012.
For corporate taxpayers, the fund hereby designates $776, or up to the maximum amount allowable, of ordinary income distributions paid during the fiscal year ended March 31, 2012 as qualified for the corporate dividends received deduction.
29
30
31
32
| Contact Us | americancentury.com |
| Automated Information Line | 1-800-345-8765 |
| Investor Services Representative | 1-800-345-2021 or 816-531-5575 |
| Investors Using Advisors | 1-800-378-9878 |
Business, Not-For-Profit, Employer-Sponsored Retirement Plans | 1-800-345-3533 |
Banks and Trust Companies, Broker-Dealers, Financial Professionals, Insurance Companies | 1-800-345-6488 |
| Telecommunications Device for the Deaf | 1-800-634-4113 |
American Century Capital Portfolios, Inc.
Investment Advisor:
American Century Investment Management, Inc.
Kansas City, Missouri
This report and the statements it contains are submitted for the general information of our shareholders. The report is not authorized for distribution to prospective investors unless preceded or accompanied by an effective prospectus.
©2012 American Century Proprietary Holdings, Inc. All rights reserved.
CL-ANN-75029 1205
ANNUAL REPORT MARCH 31, 2012
| Equity Index Fund |
| President’s Letter | 2 |
| Independent Chairman’s Letter | 3 |
| Market Perspective | 4 |
| Performance | 5 |
| Portfolio Commentary | 6 |
| Fund Characteristics | 8 |
| Shareholder Fee Example | 9 |
| Schedule of Investments | 11 |
| Statement of Assets and Liabilities | 19 |
| Statement of Operations | 20 |
| Statement of Changes in Net Assets | 21 |
| Notes to Financial Statements | 22 |
| Financial Highlights | 28 |
| Report of Independent Registered Public Accounting Firm | 30 |
| Management | 31 |
| Additional Information | 34 |
Any opinions expressed in this report reflect those of the author as of the date of the report, and do not necessarily represent the opinions of American Century Investments® or any other person in the American Century Investments organization. Any such opinions are subject to change at any time based upon market or other conditions and American Century Investments disclaims any responsibility to update such opinions. These opinions may not be relied upon as investment advice and, because investment decisions made by American Century Investments funds are based on numerous factors, may not be relied upon as an indication of trading intent on behalf of any American Century Investments fund. Security examples are used for representational purposes only and are not intended as recommendations to purchase or sell securities. Performance information for comparative indices and securities is provided to American Century Investments by third party vendors. To the best of American Century Investments’ knowledge, such information is accurate at the time of printing.
Dear Investor:
Thank you for reviewing this annual report for the period ended March 31, 2012. Our report offers investment performance and portfolio information, presented with the expert perspective of our portfolio management team.
This report remains one of our most important vehicles for conveying information about fund returns, as well as market factors and strategies that affected fund performance. For additional, updated information, we encourage you to visit our website, americancentury.com. Click on the “Fund Performance” and “Insights & News” headings at the top of our Individual Investors site.
Mostly Positive U.S. Returns Belie the Period’s Volatility
U.S. market performance for the 12 months ended March 31, 2012 appeared more benign than it really was. Broadly speaking, U.S. stocks and bonds returned roughly 7-9% for the period, as indicated by the S&P 500 Index and the Barclays U.S. Aggregate Bond Index. But those solid returns masked the roller-coaster ride required to achieve them.
The reporting period began, in April 2011, with stock indices and U.S. Treasury yields at some of their highest levels since 2008, prior to the Financial Crisis plunge. These elevated levels reflected increased risk-taking as the markets priced in improving global economic growth, strong corporate earnings, and higher inflation.
This “risk-on” investing attitude switched to “risk-off” during the summer of 2011, transformed by high fuel prices, federal budget management concerns in the U.S., and the worsening sovereign debt crisis in Europe. Recessionary expectations pulled Treasury yields to record lows by September, and stock indices suffered double-digit declines from their peaks.
Sentiment switched again in the fourth quarter of 2011, as concerns about the European sovereign debt crisis and the U.S. economy eased. Renewed “risk-on” investing carried into the first quarter of 2012, boosting growth stocks and high-yield bonds in particular. But the financial markets remain subject to potentially high volatility as they continue to wrestle with uncertainties regarding Europe, the Middle East, economic strength, government budget deficits, and the U.S. presidential election. We believe strongly in adhering to a disciplined, diversified, long-term investment approach during volatile periods, and we appreciate your continued trust in us during these unsettled times.
Sincerely,
Jonathan Thomas
President and Chief Executive Officer
American Century Investments
2
Dear Fellow Shareholders,
The assets under management in American Century Investments’ funds grow through investors placing new assets in the funds and through market appreciation. Asset growth has been at near record levels over the past two calendar years as market movements were upward, the funds’ relative returns were generally favorable, and the distribution strategies implemented by fund management have been successful.
The board reviews fund performance and distribution strategies on a regular basis. Several years ago, the fund’s management team discussed with the board its plans to grow fund assets in the intermediary, institutional and international distribution channels. These distribution strategies have produced strong positive growth. The growth in the intermediary channel recognizes the funds’ strong relative investment performance and the desire of many shareholders to seek financial guidance. Investors in both the institutional and international channels appear to find the funds’ risk-based investment strategies attractive. The board continues to support fund management’s strategies to increase fund assets and will continue to work to provide the benefits of these gains to fund shareholders.
We continue to receive a steady flow of very thoughtful questions from shareholders. If there are issues that you would like the board to address please email me at dhpratt@fundboardchair.com. Thank you for your continued investment in American Century Investments funds.
Best regards,
Don Pratt
3
By Enrique Chang,
Chief Investment Officer,
American Century Investments
U.S. Stocks Mixed but Generally Higher
The U.S. stock market faced significant volatility during the 12 months ended March 31, 2012, but ultimately posted positive overall returns. As the reporting period began, stocks were in the midst of an eight-month rally driven by improving economic data and better-than-expected corporate profits. After peaking in late April, however, stocks reversed course as evidence of a slowdown in U.S. economic activity and a worsening sovereign debt crisis in Europe put downward pressure on the equity market. In addition, government wrangling over the federal debt ceiling and an unprecedented credit rating downgrade of U.S. debt from AAA to AA+ during the summer weighed on investor confidence.
Recession fears and fiscal uncertainty led to an accelerating market decline in the third quarter of the year as stocks suffered their largest quarterly decline since the height of the credit crisis in late 2008. However, the equity market bottomed in early October and experienced another reversal, enjoying a substantial rebound over the last six months of the period. Investors grew more optimistic as signs of improving economic activity quashed recession fears; in particular, job growth consistently exceeded expectations, driving the unemployment rate down to its lowest level in three years. Another positive factor was better news out of Europe—the European Central Bank provided long-term financing to the debt markets and support for the Continent’s troubled banking sector, while Greece reached an agreement on a sovereign debt restructuring.
Large-Cap and Growth Stocks Fared Best
For the full reporting period, the broad equity indices (as represented by the S&P 500 Index and Russell 3000 Index) rose by 7–8%. As the table below illustrates, large-cap stocks posted the best returns, while small-cap issues declined modestly. Growth stocks outperformed value shares across all market capitalizations.
From a sector perspective, the best-performing sectors included information technology and consumer discretionary, both of which benefited from improving economic conditions in the latter half of the period. Two defensive sectors of the market, health care and consumer staples, also generated double-digit gains for the reporting period. On the downside, the commodity-driven energy and materials sectors fell the most, reflecting a broad decline in commodity prices.
| U.S. Stock Index Returns | ||||
| For the 12 months ended March 31, 2012 | ||||
| Russell 1000 Index (Large-Cap) | 7.86% | Russell 2000 Index (Small-Cap) | -0.18% | |
| Russell 1000 Growth Index | 11.02% | Russell 2000 Growth Index | 0.68% | |
| Russell 1000 Value Index | 4.79% | Russell 2000 Value Index | -1.07% | |
| Russell Midcap Index | 3.31% | |||
| Russell Midcap Growth Index | 4.43% | |||
| Russell Midcap Value Index | 2.28% | |||
4
| Total Returns as of March 31, 2012 | ||||||
| Average Annual Returns | ||||||
Ticker Symbol | 1 year | 5 years | 10 years | Since Inception | Inception Date | |
| Investor Class | ACIVX | 8.07% | 1.60% | 3.65% | 2.37% | 2/26/99 |
| S&P 500 Index | — | 8.54% | 2.01% | 4.12% | 2.84% | — |
| Institutional Class | ACQIX | 8.24% | 1.79% | 3.86% | 2.57% | 2/26/99 |
| Growth of $10,000 Over 10 Years |
| $10,000 investment made March 31, 2002 |
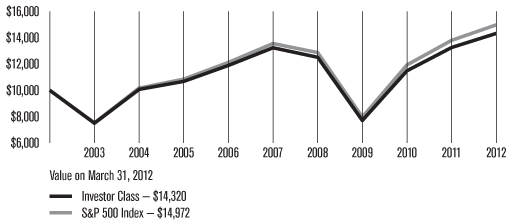
| Total Annual Fund Operating Expenses | |
| Investor Class | Institutional Class |
| 0.50% | 0.30% |
The total annual fund operating expenses shown is as stated in the fund’s prospectus current as of the date of this report. The prospectus may vary from the expense ratio shown elsewhere in this report because it is based on a different time period, includes acquired fund fees and expenses, and, if applicable, does not include fee waivers or expense reimbursements.
Data presented reflect past performance. Past performance is no guarantee of future results. Current performance may be higher or lower than the performance shown. Investment return and principal value will fluctuate, and redemption value may be more or less than original cost. To obtain performance data current to the most recent month end, please call 1-800-345-2021 or visit americancentury.com.
Unless otherwise indicated, performance reflects Investor Class shares; performance for other share classes will vary due to differences in fee structure. For information about other share classes available, please consult the prospectus. Data assumes reinvestment of dividends and capital gains, and none of the charts reflect the deduction of taxes that a shareholder would pay on fund distributions or the redemption of fund shares. Returns for the index are provided for comparison. The fund’s total returns include operating expenses (such as transaction costs and management fees) that reduce returns, while the total returns of the index do not.
5
Subadvisor: Northern Trust Investments, N.A.
Performance Summary
Equity Index returned 8.07%* for the fiscal year ended March 31, 2012, compared with the 8.54% return of its benchmark, the S&P 500 Index. The portfolio’s results reflected operating expenses, whereas the index return did not.
The fund posted a solid gain for the one-year period, driven by a sharp rally over the last six months as economic conditions improved. Five of the 10 sectors within the fund posted double-digit gains for the 12 months, led by information technology and consumer discretionary. Just three sectors declined during the period—energy, financials, and materials.
Technology and Consumer Discretionary Led the Way
The fund’s holdings in the information technology sector—the largest sector weighting in the portfolio—generated the best returns, gaining more than 20% for the one-year period. The strong performance of the information technology sector resulted primarily from robust returns among computer hardware makers and IT services providers. Four of the top five performance contributors in the portfolio were information technology stocks, led by consumer electronics maker Apple, which was also the fund’s largest holding during the period. Apple returned more than 70% for the 12 months thanks to robust sales of its iPhone and iPad mobile devices. Other top contributors in this sector included technology services provider International Business Machines, software maker Microsoft, and semiconductor manufacturer Intel.
The fund’s consumer discretionary stocks also performed well during the 12-month period. Specialty retailers and restaurants led the advance in this sector, benefiting from better consumer spending patterns. Fast-food chain McDonald’s was the best performance contributor in this sector, gaining more than 30% amid improving sales domestically and strong growth internationally. Home improvement retailer Home Depot was also a top contributor as pent-up demand for home renovation projects and mild winter weather led to stronger sales and earnings.
Defensive Sectors Also Fared Well
Two defensive sectors, consumer staples and health care, were also among the best-performing segments of the portfolio for the one-year period. These sectors held up best during the market downturn over the first half of the period. Tobacco companies and food and staples retailers delivered the best results in the consumer staples sector. The leading individual contributors included tobacco products maker Philip Morris International and discount retailer Wal-Mart. Philip Morris reported solid earnings growth resulting from healthy sales internationally and price increases in many markets, while Wal-Mart enjoyed positive same-store sales growth and exceeded earnings expectations.
*All fund returns referenced in this commentary are for Investor Class shares.
6
In the health care sector, pharmaceutical companies and biotechnology firms produced the highest returns. Drug makers Pfizer and Johnson & Johnson were among the top ten performance contributors in the portfolio. Both stocks overcame some challenges—Pfizer posted solid growth despite an expiring patent on one of its biggest-selling drugs, while Johnson & Johnson reported better-than-expected earnings while dealing with a series of product recalls.
Financials Struggled
The financials sector of the portfolio was one of just three sectors to decline overall for the reporting period. Financial services companies and other investment firms continued to struggle with the lingering fallout from the financial crisis of 2008. Three of the five most significant individual detractors in the portfolio came from the financials sector, led by financial services giant Bank of America. The company reported flat earnings for 2011 as narrow net interest margins and problematic mortgages stemming from its acquisition of Countrywide Financial several years ago weighed on profitability.
Other notable decliners in the financials sector included diversified financial services firm Citigroup and investment bank Goldman Sachs. Citigroup faced concerns about its overseas exposure and failed the most recent federal “stress test” of major financial institutions, while Goldman Sachs missed earnings expectations in consecutive quarters amid weakness in its investment banking unit.
Commodity-Based Sectors Lagged
Besides financials, the other two declining sectors in the portfolio were energy and materials. Declining commodity prices, particularly during the first half of the reporting period, contributed to the weakness in these two sectors. Among energy stocks, equipment and services providers fell the most as weaker energy prices led to concerns about reduced demand for these companies’ products and services. The most significant decliners included Schlumberger, Halliburton, and Baker Hughes.
Metals and mining companies had the biggest negative impact in the materials sector. The most notable detractor in this sector was mining company Freeport-McMoRan Copper & Gold, which fell sharply amid lower metals prices, higher production costs, and labor troubles at some of its mines.
Outlook
The U.S. economy has experienced gradual but consistent improvement over the last two quarters. Promising signs of a pick-up in employment, bank lending, and consumer spending suggest a potentially longer, stronger recovery going forward. That said, risk factors continue to lurk in the background, including consumer deleveraging, a weak housing market, and an uncertain outcome to the European debt crisis. From an equity market perspective, corporate earnings growth has slowed recently, and valuations have become less compelling after the broad rally of the past six months.
7
| MARCH 31, 2012 | |
| Top Ten Holdings | % of net assets |
| Apple, Inc. | 4.3% |
| Exxon Mobil Corp. | 3.1% |
| International Business Machines Corp. | 1.9% |
| Microsoft Corp. | 1.9% |
| General Electric Co. | 1.6% |
| Chevron Corp. | 1.6% |
| AT&T, Inc. | 1.4% |
| Procter & Gamble Co. (The) | 1.4% |
| Johnson & Johnson | 1.4% |
| Wells Fargo & Co. | 1.4% |
| Top Five Industries | % of net assets |
| Oil, Gas and Consumable Fuels | 9.2% |
| Pharmaceuticals | 5.7% |
| Computers and Peripherals | 5.6% |
| IT Services | 3.8% |
| Software | 3.8% |
| Types of Investments in Portfolio | % of net assets |
| Common Stocks | 98.0% |
| Temporary Cash Investments | 1.9% |
| Other Assets and Liabilities | 0.1% |
8
Fund shareholders may incur two types of costs: (1) transaction costs, including sales charges (loads) on purchase payments and redemption/exchange fees; and (2) ongoing costs, including management fees; distribution and service (12b-1) fees; and other fund expenses. This example is intended to help you understand your ongoing costs (in dollars) of investing in your fund and to compare these costs with the ongoing cost of investing in other mutual funds.
The example is based on an investment of $1,000 made at the beginning of the period and held for the entire period from October 1, 2011 to March 31, 2012.
Actual Expenses
The table provides information about actual account values and actual expenses for each class. You may use the information, together with the amount you invested, to estimate the expenses that you paid over the period. First, identify the share class you own. Then simply divide your account value by $1,000 (for example, an $8,600 account value divided by $1,000 = 8.6), then multiply the result by the number under the heading “Expenses Paid During Period” to estimate the expenses you paid on your account during this period.
If you hold Investor Class shares of any American Century Investments fund, or Institutional Class shares of the American Century Diversified Bond Fund, in an American Century Investments account (i.e., not a financial intermediary or retirement plan account), American Century Investments may charge you a $12.50 semiannual account maintenance fee if the value of those shares is less than $10,000. We will redeem shares automatically in one of your accounts to pay the $12.50 fee. In determining your total eligible investment amount, we will include your investments in all personal accounts (including American Century Investments Brokerage accounts) registered under your Social Security number. Personal accounts include individual accounts, joint accounts, UGMA/UTMA accounts, personal trusts, Coverdell Education Savings Accounts and IRAs (including traditional, Roth, Rollover, SEP-, SARSEP- and SIMPLE-IRAs), and certain other retirement accounts. If you have only business, business retirement, employer-sponsored or American Century Investments Brokerage accounts, you are currently not subject to this fee. If you are subject to the Account Maintenance Fee, your account value could be reduced by the fee amount.
Hypothetical Example for Comparison Purposes
The table also provides information about hypothetical account values and hypothetical expenses based on the actual expense ratio of each class of your fund and an assumed rate of return of 5% per year before expenses, which is not the actual return of a fund’s share class. The hypothetical account values and expenses may not be used to estimate the actual ending account balance or expenses you paid for the period. You may use this information to compare the ongoing costs of investing in your fund and other funds. To do so, compare this 5% hypothetical example with the 5% hypothetical examples that appear in the shareholder reports of the other funds.
9
Please note that the expenses shown in the table are meant to highlight your ongoing costs only and do not reflect any transactional costs, such as sales charges (loads) or redemption/exchange fees. Therefore, the table is useful in comparing ongoing costs only, and will not help you determine the relative total costs of owning different funds. In addition, if these transactional costs were included, your costs would have been higher.
Beginning Account Value 10/1/11 | Ending Account Value 3/31/12 | Expenses Paid During Period(1) 10/1/11 – 3/31/12 | Annualized Expense Ratio(1) | |
| Actual | ||||
| Investor Class | $1,000 | $1,255.60 | $2.76 | 0.49% |
| Institutional Class | $1,000 | $1,256.30 | $1.64 | 0.29% |
| Hypothetical | ||||
| Investor Class | $1,000 | $1,022.55 | $2.48 | 0.49% |
| Institutional Class | $1,000 | $1,023.55 | $1.47 | 0.29% |
| (1) | Expenses are equal to the class’s annualized expense ratio listed in the table above, multiplied by the average account value over the period, multiplied by 183, the number of days in the most recent fiscal half-year, divided by 366, to reflect the one-half year period. |
10
| Shares | Value | |||||||
| Common Stocks — 98.0% | ||||||||
| AEROSPACE AND DEFENSE — 2.5% | ||||||||
| Boeing Co. (The) | 15,094 | $1,122,541 | ||||||
| General Dynamics Corp. | 7,233 | 530,757 | ||||||
| Goodrich Corp. | 2,575 | 323,008 | ||||||
| Honeywell International, Inc. | 15,776 | 963,125 | ||||||
| L-3 Communications Holdings, Inc. | 2,078 | 147,060 | ||||||
| Lockheed Martin Corp. | 5,315 | 477,606 | ||||||
| Northrop Grumman Corp. | 5,042 | 307,965 | ||||||
| Precision Castparts Corp. | 2,929 | 506,424 | ||||||
| Raytheon Co. | 6,942 | 366,399 | ||||||
| Rockwell Collins, Inc. | 3,012 | 173,371 | ||||||
| Textron, Inc. | 5,506 | 153,232 | ||||||
| United Technologies Corp. | 18,418 | 1,527,589 | ||||||
| 6,599,077 | ||||||||
| AIR FREIGHT AND LOGISTICS — 1.0% | ||||||||
| CH Robinson Worldwide, Inc. | 3,287 | 215,266 | ||||||
| Expeditors International of Washington, Inc. | 4,491 | 208,876 | ||||||
| FedEx Corp. | 6,280 | 577,509 | ||||||
| United Parcel Service, Inc., Class B | 19,530 | 1,576,461 | ||||||
| 2,578,112 | ||||||||
AIRLINES† | ||||||||
| Southwest Airlines Co. | 15,329 | 126,311 | ||||||
| AUTO COMPONENTS — 0.3% | ||||||||
BorgWarner, Inc.(1) | 2,201 | 185,632 | ||||||
Goodyear Tire & Rubber Co. (The)(1) | 5,318 | 59,668 | ||||||
| Johnson Controls, Inc. | 13,979 | 454,038 | ||||||
| 699,338 | ||||||||
| AUTOMOBILES — 0.5% | ||||||||
| Ford Motor Co. | 77,045 | 962,292 | ||||||
| Harley-Davidson, Inc. | 4,622 | 226,848 | ||||||
| 1,189,140 | ||||||||
| BEVERAGES — 2.4% | ||||||||
| Beam, Inc. | 3,209 | 187,951 | ||||||
| Brown-Forman Corp., Class B | 2,074 | 172,951 | ||||||
| Coca-Cola Co. (The) | 45,824 | 3,391,434 | ||||||
| Coca-Cola Enterprises, Inc. | 6,290 | 179,894 | ||||||
Constellation Brands, Inc., Class A(1) | 3,600 | 84,924 | ||||||
| Dr Pepper Snapple Group, Inc. | 4,372 | 175,798 | ||||||
| Molson Coors Brewing Co., Class B | 3,161 | 143,035 | ||||||
| PepsiCo, Inc. | 31,707 | 2,103,760 | ||||||
| 6,439,747 | ||||||||
| BIOTECHNOLOGY — 1.2% | ||||||||
| Amgen, Inc. | 16,159 | 1,098,650 | ||||||
Biogen Idec, Inc.(1) | 4,902 | 617,505 | ||||||
Celgene Corp.(1) | 8,955 | 694,192 | ||||||
Gilead Sciences, Inc.(1) | 15,223 | 743,643 | ||||||
| 3,153,990 | ||||||||
BUILDING PRODUCTS† | ||||||||
| Masco Corp. | 7,799 | 104,273 | ||||||
| CAPITAL MARKETS — 2.0% | ||||||||
| Ameriprise Financial, Inc. | 4,574 | 261,313 | ||||||
| Bank of New York Mellon Corp. (The) | 24,233 | 584,742 | ||||||
| BlackRock, Inc. | 2,032 | 416,357 | ||||||
| Charles Schwab Corp. (The) | 21,898 | 314,674 | ||||||
E*Trade Financial Corp.(1) | 5,684 | 62,240 | ||||||
| Federated Investors, Inc. Class B | 1,860 | 41,683 | ||||||
| Franklin Resources, Inc. | 2,915 | 361,548 | ||||||
| Goldman Sachs Group, Inc. (The) | 9,990 | 1,242,456 | ||||||
| Invesco Ltd. | 9,120 | 243,230 | ||||||
| Legg Mason, Inc. | 2,397 | 66,948 | ||||||
| Morgan Stanley | 31,085 | 610,509 | ||||||
| Northern Trust Corp. | 5,478 | 259,931 | ||||||
| State Street Corp. | 9,962 | 453,271 | ||||||
| T. Rowe Price Group, Inc. | 5,070 | 331,071 | ||||||
| 5,249,973 | ||||||||
| CHEMICALS — 2.2% | ||||||||
| Air Products & Chemicals, Inc. | 4,315 | 396,117 | ||||||
| Airgas, Inc. | 1,375 | 122,334 | ||||||
| CF Industries Holdings, Inc. | 1,369 | 250,048 | ||||||
| Dow Chemical Co. (The) | 24,242 | 839,743 | ||||||
| E.I. du Pont de Nemours & Co. | 19,041 | 1,007,269 | ||||||
| Eastman Chemical Co. | 2,695 | 139,305 | ||||||
| Ecolab, Inc. | 5,780 | 356,742 | ||||||
| FMC Corp. | 1,440 | 152,438 | ||||||
| International Flavors & Fragrances, Inc. | 1,730 | 101,378 | ||||||
| Monsanto Co. | 10,862 | 866,353 | ||||||
| Mosaic Co. (The) | 5,957 | 329,362 | ||||||
| PPG Industries, Inc. | 3,128 | 299,662 | ||||||
11
| Shares | Value | |||||||
| Praxair, Inc. | 6,053 | $693,916 | ||||||
| Sherwin-Williams Co. (The) | 1,696 | 184,304 | ||||||
| Sigma-Aldrich Corp. | 2,536 | 185,280 | ||||||
| 5,924,251 | ||||||||
| COMMERCIAL BANKS — 2.8% | ||||||||
| BB&T Corp. | 13,884 | 435,819 | ||||||
| Comerica, Inc. | 3,834 | 124,068 | ||||||
| Fifth Third Bancorp | 18,275 | 256,764 | ||||||
| First Horizon National Corp. | 5,373 | 55,772 | ||||||
| Huntington Bancshares, Inc. | 16,435 | 106,006 | ||||||
| KeyCorp | 18,597 | 158,074 | ||||||
| M&T Bank Corp. | 2,663 | 231,361 | ||||||
| PNC Financial Services Group, Inc. | 10,710 | 690,688 | ||||||
| Regions Financial Corp. | 28,646 | 188,777 | ||||||
| SunTrust Banks, Inc. | 10,527 | 254,438 | ||||||
| U.S. Bancorp | 38,853 | 1,230,863 | ||||||
| Wells Fargo & Co. | 107,081 | 3,655,745 | ||||||
| Zions BanCorp. | 3,969 | 85,175 | ||||||
| 7,473,550 | ||||||||
| COMMERCIAL SERVICES AND SUPPLIES — 0.4% | ||||||||
| Avery Dennison Corp. | 2,438 | 73,457 | ||||||
| Cintas Corp. | 2,105 | 82,348 | ||||||
| Iron Mountain, Inc. | 3,346 | 96,365 | ||||||
| Pitney Bowes, Inc. | 3,828 | 67,296 | ||||||
| Republic Services, Inc. | 6,482 | 198,090 | ||||||
| RR Donnelley & Sons Co. | 4,129 | 51,158 | ||||||
Stericycle, Inc.(1) | 1,759 | 147,123 | ||||||
| Waste Management, Inc. | 9,439 | 329,987 | ||||||
| 1,045,824 | ||||||||
| COMMUNICATIONS EQUIPMENT — 2.2% | ||||||||
| Cisco Systems, Inc. | 109,103 | 2,307,528 | ||||||
F5 Networks, Inc.(1) | 1,569 | 211,752 | ||||||
| Harris Corp. | 2,170 | 97,824 | ||||||
JDS Uniphase Corp.(1) | 4,479 | 64,901 | ||||||
Juniper Networks, Inc.(1) | 10,719 | 245,251 | ||||||
Motorola Mobility Holdings, Inc.(1) | 5,201 | 204,087 | ||||||
| Motorola Solutions, Inc. | 5,842 | 296,949 | ||||||
| QUALCOMM, Inc. | 34,371 | 2,337,915 | ||||||
| 5,766,207 | ||||||||
| COMPUTERS AND PERIPHERALS — 5.6% | ||||||||
Apple, Inc.(1) | 18,905 | 11,332,980 | ||||||
Dell, Inc.(1) | 30,753 | 510,500 | ||||||
EMC Corp.(1) | 41,439 | 1,238,197 | ||||||
| Hewlett-Packard Co. | 40,311 | 960,611 | ||||||
| Lexmark International, Inc., Class A | 1,357 | 45,107 | ||||||
NetApp, Inc.(1) | 7,266 | 325,299 | ||||||
SanDisk Corp.(1) | 5,013 | 248,595 | ||||||
Western Digital Corp.(1) | 4,692 | 194,202 | ||||||
| 14,855,491 | ||||||||
| CONSTRUCTION AND ENGINEERING — 0.2% | ||||||||
| Fluor Corp. | 3,453 | 207,318 | ||||||
Jacobs Engineering Group, Inc.(1) | 2,507 | 111,236 | ||||||
Quanta Services, Inc.(1) | 4,092 | 85,523 | ||||||
| 404,077 | ||||||||
CONSTRUCTION MATERIALS† | ||||||||
| Vulcan Materials Co. | 2,502 | 106,910 | ||||||
| CONSUMER FINANCE — 0.9% | ||||||||
| American Express Co. | 20,420 | 1,181,501 | ||||||
| Capital One Financial Corp. | 11,230 | 625,960 | ||||||
| Discover Financial Services | 10,609 | 353,704 | ||||||
| SLM Corp. | 10,577 | 166,694 | ||||||
| 2,327,859 | ||||||||
| CONTAINERS AND PACKAGING — 0.1% | ||||||||
| Ball Corp. | 3,219 | 138,031 | ||||||
| Bemis Co., Inc. | 1,971 | 63,643 | ||||||
Owens-Illinois, Inc.(1) | 3,121 | 72,844 | ||||||
| Sealed Air Corp. | 4,109 | 79,345 | ||||||
| 353,863 | ||||||||
| DISTRIBUTORS — 0.1% | ||||||||
| Genuine Parts Co. | 3,291 | 206,510 | ||||||
| DIVERSIFIED CONSUMER SERVICES — 0.1% | ||||||||
Apollo Group, Inc., Class A(1) | 2,262 | 87,404 | ||||||
| DeVry, Inc. | 1,053 | 35,665 | ||||||
| H&R Block, Inc. | 5,913 | 97,387 | ||||||
| 220,456 | ||||||||
| DIVERSIFIED FINANCIAL SERVICES — 3.5% | ||||||||
| Bank of America Corp. | 217,708 | 2,083,466 | ||||||
| Citigroup, Inc. | 59,326 | 2,168,365 | ||||||
| CME Group, Inc. | 1,349 | 390,306 | ||||||
IntercontinentalExchange, Inc.(1) | 1,426 | 195,961 | ||||||
| JPMorgan Chase & Co. | 77,511 | 3,563,956 | ||||||
| Leucadia National Corp. | 3,861 | 100,772 | ||||||
| McGraw-Hill Cos., Inc. (The) | 5,544 | 268,718 | ||||||
| Moody’s Corp. | 3,834 | 161,411 | ||||||
NASDAQ OMX Group, Inc. (The)(1) | 2,729 | 70,681 | ||||||
| NYSE Euronext | 5,473 | 164,245 | ||||||
| 9,167,881 | ||||||||
| DIVERSIFIED TELECOMMUNICATION SERVICES — 2.5% | ||||||||
| AT&T, Inc. | 120,122 | 3,751,410 | ||||||
| CenturyLink, Inc. | 12,536 | 484,517 | ||||||
| Frontier Communications Corp. | 20,660 | 86,152 | ||||||
12
| Shares | Value | |||||||
| Verizon Communications, Inc. | 57,332 | $2,191,802 | ||||||
| Windstream Corp. | 12,280 | 143,799 | ||||||
| 6,657,680 | ||||||||
| ELECTRIC UTILITIES — 1.8% | ||||||||
| American Electric Power Co., Inc. | 9,682 | 373,532 | ||||||
| Duke Energy Corp. | 27,077 | 568,888 | ||||||
| Edison International | 6,596 | 280,396 | ||||||
| Entergy Corp. | 3,649 | 245,213 | ||||||
| Exelon Corp. | 17,493 | 685,900 | ||||||
| FirstEnergy Corp. | 8,410 | 383,412 | ||||||
| NextEra Energy, Inc. | 8,418 | 514,171 | ||||||
| Northeast Utilities | 3,565 | 132,333 | ||||||
| Pepco Holdings, Inc. | 4,768 | 90,067 | ||||||
| Pinnacle West Capital Corp. | 2,159 | 103,416 | ||||||
| PPL Corp. | 11,496 | 324,877 | ||||||
| Progress Energy, Inc. | 5,994 | 318,341 | ||||||
| Southern Co. | 17,461 | 784,523 | ||||||
| 4,805,069 | ||||||||
| ELECTRICAL EQUIPMENT — 0.5% | ||||||||
| Cooper Industries plc | 3,165 | 202,402 | ||||||
| Emerson Electric Co. | 14,963 | 780,769 | ||||||
| Rockwell Automation, Inc. | 2,823 | 224,993 | ||||||
| Roper Industries, Inc. | 1,949 | 193,263 | ||||||
| 1,401,427 | ||||||||
| ELECTRONIC EQUIPMENT, INSTRUMENTS AND COMPONENTS — 0.5% | ||||||||
| Amphenol Corp. Class A | 3,258 | 194,731 | ||||||
| Corning, Inc. | 30,822 | 433,974 | ||||||
| FLIR Systems, Inc. | 2,981 | 75,449 | ||||||
| Jabil Circuit, Inc. | 3,946 | 99,123 | ||||||
| Molex, Inc. | 3,017 | 84,838 | ||||||
| TE Connectivity Ltd. | 8,748 | 321,489 | ||||||
| 1,209,604 | ||||||||
| ENERGY EQUIPMENT AND SERVICES — 1.8% | ||||||||
| Baker Hughes, Inc. | 8,903 | 373,392 | ||||||
Cameron International Corp.(1) | 4,927 | 260,294 | ||||||
| Diamond Offshore Drilling, Inc. | 1,561 | 104,197 | ||||||
FMC Technologies, Inc.(1) | 4,769 | 240,453 | ||||||
| Halliburton Co. | 18,654 | 619,126 | ||||||
| Helmerich & Payne, Inc. | 2,152 | 116,100 | ||||||
Nabors Industries Ltd.(1) | 5,924 | 103,611 | ||||||
| National Oilwell Varco, Inc. | 8,686 | 690,277 | ||||||
Noble Corp.(1) | 4,994 | 187,125 | ||||||
Rowan Cos., Inc.(1) | 2,337 | 76,957 | ||||||
| Schlumberger Ltd. | 27,053 | 1,891,816 | ||||||
| 4,663,348 | ||||||||
| FOOD AND STAPLES RETAILING — 2.2% | ||||||||
| Costco Wholesale Corp. | 8,813 | 800,220 | ||||||
| CVS Caremark Corp. | 26,442 | 1,184,602 | ||||||
| Kroger Co. (The) | 11,997 | 290,687 | ||||||
| Safeway, Inc. | 5,434 | 109,821 | ||||||
| SUPERVALU, Inc. | 4,372 | 24,964 | ||||||
| SYSCO Corp. | 11,811 | 352,677 | ||||||
| Wal-Mart Stores, Inc. | 35,447 | 2,169,356 | ||||||
| Walgreen Co. | 17,594 | 589,223 | ||||||
| Whole Foods Market, Inc. | 3,345 | 278,304 | ||||||
| 5,799,854 | ||||||||
| FOOD PRODUCTS — 1.8% | ||||||||
| Archer-Daniels-Midland Co. | 13,603 | 430,671 | ||||||
| Campbell Soup Co. | 3,426 | 115,970 | ||||||
| ConAgra Foods, Inc. | 8,505 | 223,341 | ||||||
Dean Foods Co.(1) | 3,575 | 43,293 | ||||||
| General Mills, Inc. | 12,860 | 507,327 | ||||||
| H.J. Heinz Co. | 6,492 | 347,647 | ||||||
| Hershey Co. (The) | 3,225 | 197,789 | ||||||
| Hormel Foods Corp. | 2,563 | 75,660 | ||||||
| J.M. Smucker Co. (The) | 2,292 | 186,477 | ||||||
| Kellogg Co. | 4,882 | 261,822 | ||||||
| Kraft Foods, Inc., Class A | 35,940 | 1,366,079 | ||||||
| McCormick & Co., Inc. | 2,672 | 145,437 | ||||||
| Mead Johnson Nutrition Co. | 4,174 | 344,271 | ||||||
| Sara Lee Corp. | 11,728 | 252,504 | ||||||
| Tyson Foods, Inc., Class A | 5,925 | 113,464 | ||||||
| 4,611,752 | ||||||||
| GAS UTILITIES — 0.1% | ||||||||
| AGL Resources, Inc. | 2,408 | 94,442 | ||||||
| ONEOK, Inc. | 2,239 | 182,836 | ||||||
| 277,278 | ||||||||
| HEALTH CARE EQUIPMENT AND SUPPLIES — 1.7% | ||||||||
| Baxter International, Inc. | 11,254 | 672,764 | ||||||
| Becton, Dickinson and Co. | 4,299 | 333,817 | ||||||
Boston Scientific Corp.(1) | 29,560 | 176,769 | ||||||
| C.R. Bard, Inc. | 1,686 | 166,442 | ||||||
CareFusion Corp.(1) | 4,441 | 115,155 | ||||||
| Covidien plc | 9,677 | 529,138 | ||||||
| DENTSPLY International, Inc. | 3,044 | 122,156 | ||||||
Edwards Lifesciences Corp.(1) | 2,355 | 171,279 | ||||||
Intuitive Surgical, Inc.(1) | 810 | 438,817 | ||||||
| Medtronic, Inc. | 21,074 | 825,890 | ||||||
| St. Jude Medical, Inc. | 6,528 | 289,256 | ||||||
| Stryker Corp. | 6,583 | 365,225 | ||||||
13
| Shares | Value | |||||||
Varian Medical Systems, Inc.(1) | 2,234 | $154,057 | ||||||
| Zimmer Holdings, Inc. | 3,652 | 234,751 | ||||||
| 4,595,516 | ||||||||
| HEALTH CARE PROVIDERS AND SERVICES — 2.1% | ||||||||
| Aetna, Inc. | 7,026 | 352,424 | ||||||
| AmerisourceBergen Corp. | 5,100 | 202,368 | ||||||
| Cardinal Health, Inc. | 7,206 | 310,651 | ||||||
| CIGNA Corp. | 5,963 | 293,678 | ||||||
| Coventry Health Care, Inc. | 2,861 | 101,766 | ||||||
DaVita, Inc.(1) | 1,839 | 165,823 | ||||||
Express Scripts, Inc.(1) | 9,885 | 535,569 | ||||||
| Humana, Inc. | 3,420 | 316,282 | ||||||
Laboratory Corp. of America Holdings(1) | 1,962 | 179,601 | ||||||
| McKesson Corp. | 4,960 | 435,339 | ||||||
Medco Health Solutions, Inc.(1) | 7,800 | 548,340 | ||||||
| Patterson Cos., Inc. | 1,626 | 54,308 | ||||||
| Quest Diagnostics, Inc. | 3,309 | 202,345 | ||||||
Tenet Healthcare Corp.(1) | 7,844 | 41,652 | ||||||
| UnitedHealth Group, Inc. | 21,161 | 1,247,229 | ||||||
| WellPoint, Inc. | 6,787 | 500,881 | ||||||
| 5,488,256 | ||||||||
| HOTELS, RESTAURANTS AND LEISURE — 1.9% | ||||||||
| Carnival Corp. | 9,361 | 300,301 | ||||||
Chipotle Mexican Grill, Inc.(1) | 645 | 269,610 | ||||||
| Darden Restaurants, Inc. | 2,541 | 129,998 | ||||||
| International Game Technology | 5,919 | 99,380 | ||||||
| Marriott International, Inc. Class A | 5,407 | 204,655 | ||||||
| McDonald’s Corp. | 20,685 | 2,029,199 | ||||||
| Starbucks Corp. | 15,306 | 855,452 | ||||||
| Starwood Hotels & Resorts Worldwide, Inc. | 4,040 | 227,896 | ||||||
| Wyndham Worldwide Corp. | 2,882 | 134,042 | ||||||
| Wynn Resorts Ltd. | 1,575 | 196,686 | ||||||
| Yum! Brands, Inc. | 9,240 | 657,703 | ||||||
| 5,104,922 | ||||||||
| HOUSEHOLD DURABLES — 0.2% | ||||||||
| D.R. Horton, Inc. | 6,137 | 93,098 | ||||||
| Harman International Industries, Inc. | 1,279 | 59,870 | ||||||
| Leggett & Platt, Inc. | 2,851 | 65,601 | ||||||
| Lennar Corp., Class A | 3,076 | 83,606 | ||||||
| Newell Rubbermaid, Inc. | 5,581 | 99,398 | ||||||
PulteGroup, Inc.(1) | 7,031 | 62,224 | ||||||
| Whirlpool Corp. | 1,502 | 115,444 | ||||||
| 579,241 | ||||||||
| HOUSEHOLD PRODUCTS — 2.1% | ||||||||
| Clorox Co. | 2,722 | 187,137 | ||||||
| Colgate-Palmolive Co. | 9,650 | 943,577 | ||||||
| Kimberly-Clark Corp. | 7,995 | 590,751 | ||||||
| Procter & Gamble Co. (The) | 55,736 | 3,746,017 | ||||||
| 5,467,482 | ||||||||
| INDEPENDENT POWER PRODUCERS AND ENERGY TRADERS — 0.1% | ||||||||
AES Corp. (The)(1) | 12,636 | 165,153 | ||||||
NRG Energy, Inc.(1) | 4,854 | 76,062 | ||||||
| 241,215 | ||||||||
| INDUSTRIAL CONGLOMERATES — 2.6% | ||||||||
| 3M Co. | 14,079 | 1,255,987 | ||||||
| Danaher Corp. | 11,611 | 650,216 | ||||||
| General Electric Co. | 214,886 | 4,312,762 | ||||||
| Tyco International Ltd. | 9,387 | 527,362 | ||||||
| 6,746,327 | ||||||||
| INSURANCE — 3.5% | ||||||||
| ACE Ltd. | 6,870 | 502,884 | ||||||
| Aflac, Inc. | 9,319 | 428,581 | ||||||
| Allstate Corp. (The) | 10,094 | 332,294 | ||||||
American International Group, Inc.(1) | 10,912 | 336,417 | ||||||
| Aon Corp. | 6,517 | 319,724 | ||||||
| Assurant, Inc. | 1,827 | 73,994 | ||||||
Berkshire Hathaway, Inc., Class B(1) | 35,703 | 2,897,298 | ||||||
| Chubb Corp. (The) | 5,552 | 383,699 | ||||||
| Cincinnati Financial Corp. | 3,199 | 110,397 | ||||||
Genworth Financial, Inc., Class A(1) | 9,420 | 78,374 | ||||||
| Hartford Financial Services Group, Inc. | 8,804 | 185,588 | ||||||
| Lincoln National Corp. | 5,988 | 157,844 | ||||||
| Loews Corp. | 6,057 | 241,493 | ||||||
| Marsh & McLennan Cos., Inc. | 11,250 | 368,888 | ||||||
| MetLife, Inc. | 21,410 | 799,664 | ||||||
| Principal Financial Group, Inc. | 6,099 | 179,981 | ||||||
| Progressive Corp. (The) | 12,593 | 291,906 | ||||||
| Prudential Financial, Inc. | 9,430 | 597,768 | ||||||
| Torchmark Corp. | 1,918 | 95,612 | ||||||
| Travelers Cos., Inc. (The) | 8,056 | 476,915 | ||||||
| Unum Group | 5,872 | 143,747 | ||||||
| XL Group plc | 6,421 | 139,271 | ||||||
| 9,142,339 | ||||||||
| INTERNET AND CATALOG RETAIL — 0.9% | ||||||||
Amazon.com, Inc.(1) | 7,373 | 1,493,106 | ||||||
| Expedia, Inc. | 2,038 | 68,151 | ||||||
14
| Shares | Value | |||||||
Netflix, Inc.(1) | 1,129 | $129,880 | ||||||
priceline.com, Inc.(1) | 1,007 | 722,523 | ||||||
TripAdvisor, Inc.(1) | 2,038 | 72,695 | ||||||
| 2,486,355 | ||||||||
| INTERNET SOFTWARE AND SERVICES — 1.8% | ||||||||
Akamai Technologies, Inc.(1) | 3,619 | 132,817 | ||||||
eBay, Inc.(1) | 23,236 | 857,176 | ||||||
Google, Inc., Class A(1) | 5,148 | 3,301,104 | ||||||
| VeriSign, Inc. | 3,429 | 131,468 | ||||||
Yahoo!, Inc.(1) | 24,350 | 370,607 | ||||||
| 4,793,172 | ||||||||
| IT SERVICES — 3.8% | ||||||||
| Accenture plc, Class A | 13,178 | 849,981 | ||||||
| Automatic Data Processing, Inc. | 9,958 | 549,582 | ||||||
Cognizant Technology Solutions Corp., Class A(1) | 6,113 | 470,395 | ||||||
| Computer Sciences Corp. | 3,386 | 101,377 | ||||||
| Fidelity National Information Services, Inc. | 4,894 | 162,089 | ||||||
Fiserv, Inc.(1) | 2,835 | 196,721 | ||||||
| International Business Machines Corp. | 23,487 | 4,900,562 | ||||||
| MasterCard, Inc., Class A | 2,161 | 908,787 | ||||||
| Paychex, Inc. | 6,360 | 197,096 | ||||||
SAIC, Inc.(1) | 5,778 | 76,270 | ||||||
Teradata Corp.(1) | 3,299 | 224,827 | ||||||
| Total System Services, Inc. | 2,954 | 68,149 | ||||||
| Visa, Inc., Class A | 10,111 | 1,193,098 | ||||||
| Western Union Co. (The) | 12,958 | 228,061 | ||||||
| 10,126,995 | ||||||||
| LEISURE EQUIPMENT AND PRODUCTS — 0.1% | ||||||||
| Hasbro, Inc. | 2,534 | 93,049 | ||||||
| Mattel, Inc. | 6,744 | 227,003 | ||||||
| 320,052 | ||||||||
| LIFE SCIENCES TOOLS AND SERVICES — 0.4% | ||||||||
| Agilent Technologies, Inc. | 7,112 | 316,555 | ||||||
Life Technologies Corp.(1) | 3,523 | 171,993 | ||||||
| PerkinElmer, Inc. | 2,106 | 58,252 | ||||||
| Thermo Fisher Scientific, Inc. | 7,404 | 417,437 | ||||||
Waters Corp.(1) | 1,883 | 174,479 | ||||||
| 1,138,716 | ||||||||
| MACHINERY — 2.0% | ||||||||
| Caterpillar, Inc. | 13,154 | 1,401,164 | ||||||
| Cummins, Inc. | 3,928 | 471,517 | ||||||
| Deere & Co. | 8,234 | 666,131 | ||||||
| Dover Corp. | 3,695 | 232,563 | ||||||
| Eaton Corp. | 6,759 | 336,801 | ||||||
| Flowserve Corp. | 1,074 | 124,058 | ||||||
| Illinois Tool Works, Inc. | 9,779 | 558,576 | ||||||
| Ingersoll-Rand plc | 5,865 | 242,518 | ||||||
| Joy Global, Inc. | 2,090 | 153,615 | ||||||
| PACCAR, Inc. | 7,185 | 336,474 | ||||||
| Pall Corp. | 2,302 | 137,268 | ||||||
| Parker-Hannifin Corp. | 3,034 | 256,525 | ||||||
| Snap-On, Inc. | 1,070 | 65,238 | ||||||
| Stanley Black & Decker, Inc. | 3,360 | 258,586 | ||||||
| Xylem, Inc. | 3,922 | 108,835 | ||||||
| 5,349,869 | ||||||||
| MEDIA — 3.0% | ||||||||
| Cablevision Systems Corp., Class A | 4,851 | 71,213 | ||||||
| CBS Corp., Class B | 13,376 | 453,580 | ||||||
| Comcast Corp., Class A | 54,655 | 1,640,197 | ||||||
DirecTV, Class A(1) | 13,704 | 676,155 | ||||||
Discovery Communications, Inc. Class A(1) | 5,342 | 270,305 | ||||||
| Gannett Co., Inc. | 4,408 | 67,575 | ||||||
| Interpublic Group of Cos., Inc. (The) | 8,680 | 99,039 | ||||||
| News Corp. Class A | 43,734 | 861,122 | ||||||
| Omnicom Group, Inc. | 5,677 | 287,540 | ||||||
| Scripps Networks Interactive, Inc. Class A | 1,994 | 97,088 | ||||||
| Time Warner Cable, Inc. | 6,293 | 512,880 | ||||||
| Time Warner, Inc. | 19,675 | 742,731 | ||||||
| Viacom, Inc., Class B | 10,826 | 513,802 | ||||||
| Walt Disney Co. (The) | 36,431 | 1,594,949 | ||||||
| Washington Post Co. (The), Class B | 98 | 36,610 | ||||||
| 7,924,786 | ||||||||
| METALS AND MINING — 0.8% | ||||||||
| Alcoa, Inc. | 21,339 | 213,817 | ||||||
| Allegheny Technologies, Inc. | 2,232 | 91,891 | ||||||
| Cliffs Natural Resources, Inc. | 2,860 | 198,084 | ||||||
| Freeport-McMoRan Copper & Gold, Inc. | 19,229 | 731,471 | ||||||
| Newmont Mining Corp. | 9,915 | 508,342 | ||||||
| Nucor Corp. | 6,571 | 282,225 | ||||||
| Titanium Metals Corp. | 1,223 | 16,584 | ||||||
| United States Steel Corp. | 2,755 | 80,914 | ||||||
| 2,123,328 | ||||||||
| MULTI-UTILITIES — 1.3% | ||||||||
| Ameren Corp. | 4,940 | 160,945 | ||||||
| CenterPoint Energy, Inc. | 8,884 | 175,192 | ||||||
| CMS Energy Corp. | 4,955 | 109,010 | ||||||
| Consolidated Edison, Inc. | 5,970 | 348,767 | ||||||
| Dominion Resources, Inc. | 11,594 | 593,729 | ||||||
15
| Shares | Value | |||||||
| DTE Energy Co. | 3,362 | $185,011 | ||||||
| Integrys Energy Group, Inc. | 1,591 | 84,307 | ||||||
| NiSource, Inc. | 5,457 | 132,878 | ||||||
| PG&E Corp. | 8,257 | 358,436 | ||||||
| Public Service Enterprise Group, Inc. | 10,038 | 307,263 | ||||||
| SCANA Corp. | 2,212 | 100,889 | ||||||
| Sempra Energy | 4,860 | 291,406 | ||||||
| TECO Energy, Inc. | 4,470 | 78,449 | ||||||
| Wisconsin Energy Corp. | 4,775 | 167,985 | ||||||
| Xcel Energy, Inc. | 9,783 | 258,956 | ||||||
| 3,353,223 | ||||||||
| MULTILINE RETAIL — 0.8% | ||||||||
Big Lots, Inc.(1) | 1,470 | 63,239 | ||||||
Dollar Tree, Inc.(1) | 2,472 | 233,579 | ||||||
| Family Dollar Stores, Inc. | 2,299 | 145,481 | ||||||
| JC Penney Co., Inc. | 3,043 | 107,813 | ||||||
| Kohl’s Corp. | 5,250 | 262,657 | ||||||
| Macy’s, Inc. | 8,560 | 340,089 | ||||||
| Nordstrom, Inc. | 3,201 | 178,360 | ||||||
Sears Holdings Corp.(1) | 742 | 49,158 | ||||||
| Target Corp. | 13,522 | 787,927 | ||||||
| 2,168,303 | ||||||||
| OFFICE ELECTRONICS — 0.1% | ||||||||
| Xerox Corp. | 26,302 | 212,520 | ||||||
| OIL, GAS AND CONSUMABLE FUELS — 9.2% | ||||||||
Alpha Natural Resources, Inc.(1) | 4,436 | 67,472 | ||||||
| Anadarko Petroleum Corp. | 10,071 | 788,962 | ||||||
| Apache Corp. | 7,774 | 780,821 | ||||||
| Cabot Oil & Gas Corp. | 4,354 | 135,714 | ||||||
| Chesapeake Energy Corp. | 13,179 | 305,357 | ||||||
| Chevron Corp. | 40,183 | 4,309,225 | ||||||
| ConocoPhillips | 26,095 | 1,983,481 | ||||||
| CONSOL Energy, Inc. | 4,793 | 163,441 | ||||||
Denbury Resources, Inc.(1) | 8,271 | 150,780 | ||||||
| Devon Energy Corp. | 8,110 | 576,783 | ||||||
| El Paso Corp. | 15,657 | 462,664 | ||||||
| EOG Resources, Inc. | 5,400 | 599,940 | ||||||
| EQT Corp. | 3,122 | 150,512 | ||||||
| Exxon Mobil Corp. | 95,639 | 8,294,771 | ||||||
| Hess Corp. | 6,079 | 358,357 | ||||||
| Marathon Oil Corp. | 14,306 | 453,500 | ||||||
| Marathon Petroleum Corp. | 7,053 | 305,818 | ||||||
| Murphy Oil Corp. | 3,872 | 217,877 | ||||||
Newfield Exploration Co.(1) | 2,806 | 97,312 | ||||||
| Noble Energy, Inc. | 3,540 | 346,141 | ||||||
| Occidental Petroleum Corp. | 16,491 | 1,570,438 | ||||||
| Peabody Energy Corp. | 5,449 | 157,803 | ||||||
| Pioneer Natural Resources Co. | 2,468 | 275,404 | ||||||
| QEP Resources, Inc. | 3,539 | 107,940 | ||||||
| Range Resources Corp. | 3,152 | 183,257 | ||||||
Southwestern Energy Co.(1) | 7,096 | 217,138 | ||||||
| Spectra Energy Corp. | 13,106 | 413,494 | ||||||
| Sunoco, Inc. | 2,106 | 80,344 | ||||||
Tesoro Corp.(1) | 2,578 | 69,194 | ||||||
| Valero Energy Corp. | 11,005 | 283,599 | ||||||
| Williams Cos., Inc. (The) | 11,865 | 365,561 | ||||||
WPX Energy, Inc.(1) | 4,126 | 74,309 | ||||||
| 24,347,409 | ||||||||
| PAPER AND FOREST PRODUCTS — 0.2% | ||||||||
| International Paper Co. | 9,047 | 317,550 | ||||||
| MeadWestvaco Corp. | 3,241 | 102,383 | ||||||
| 419,933 | ||||||||
| PERSONAL PRODUCTS — 0.2% | ||||||||
| Avon Products, Inc. | 8,346 | 161,578 | ||||||
| Estee Lauder Cos., Inc. (The), Class A | 4,638 | 287,278 | ||||||
| 448,856 | ||||||||
| PHARMACEUTICALS — 5.7% | ||||||||
| Abbott Laboratories | 31,849 | 1,952,025 | ||||||
| Allergan, Inc. | 6,190 | 590,711 | ||||||
| Bristol-Myers Squibb Co. | 34,324 | 1,158,435 | ||||||
| Eli Lilly & Co. | 20,666 | 832,220 | ||||||
Forest Laboratories, Inc.(1) | 5,626 | 195,166 | ||||||
Hospira, Inc.(1) | 3,507 | 131,127 | ||||||
| Johnson & Johnson | 55,607 | 3,667,838 | ||||||
| Merck & Co., Inc. | 61,822 | 2,373,965 | ||||||
Mylan, Inc.(1) | 8,451 | 198,176 | ||||||
| Perrigo Co. | 1,919 | 198,252 | ||||||
| Pfizer, Inc. | 152,409 | 3,453,588 | ||||||
Watson Pharmaceuticals, Inc.(1) | 2,611 | 175,093 | ||||||
| 14,926,596 | ||||||||
| PROFESSIONAL SERVICES — 0.1% | ||||||||
| Dun & Bradstreet Corp. | 887 | 75,156 | ||||||
| Equifax, Inc. | 2,324 | 102,860 | ||||||
| Robert Half International, Inc. | 3,134 | 94,960 | ||||||
| 272,976 | ||||||||
| REAL ESTATE INVESTMENT TRUSTS (REITs) — 2.0% | ||||||||
| American Tower Corp. | 8,098 | 510,336 | ||||||
| Apartment Investment & Management Co., Class A | 2,496 | 65,919 | ||||||
| AvalonBay Communities, Inc. | 1,983 | 280,297 | ||||||
| Boston Properties, Inc. | 2,968 | 311,610 | ||||||
| Equity Residential | 5,987 | 374,906 | ||||||
| HCP, Inc. | 8,482 | 334,700 | ||||||
16
| Shares | Value | |||||||
| Health Care REIT, Inc. | 4,242 | $233,140 | ||||||
| Host Hotels & Resorts, Inc. | 13,983 | 229,601 | ||||||
| Kimco Realty Corp. | 8,428 | 162,323 | ||||||
| Plum Creek Timber Co., Inc. | 3,256 | 135,319 | ||||||
| ProLogis, Inc. | 9,179 | 330,628 | ||||||
| Public Storage | 2,868 | 396,271 | ||||||
| Simon Property Group, Inc. | 6,185 | 901,031 | ||||||
| Ventas, Inc. | 5,887 | 336,148 | ||||||
| Vornado Realty Trust | 3,848 | 324,002 | ||||||
| Weyerhaeuser Co. | 10,675 | 233,996 | ||||||
| 5,160,227 | ||||||||
| REAL ESTATE MANAGEMENT AND DEVELOPMENT — 0.1% | ||||||||
CBRE Group, Inc.(1) | 6,981 | 139,341 | ||||||
| ROAD AND RAIL — 0.8% | ||||||||
| CSX Corp. | 21,546 | 463,670 | ||||||
| Norfolk Southern Corp. | 6,692 | 440,534 | ||||||
| Ryder System, Inc. | 922 | 48,682 | ||||||
| Union Pacific Corp. | 9,781 | 1,051,262 | ||||||
| 2,004,148 | ||||||||
| SEMICONDUCTORS AND SEMICONDUCTOR EQUIPMENT — 2.4% | ||||||||
Advanced Micro Devices, Inc.(1) | 12,296 | 98,614 | ||||||
| Altera Corp. | 6,506 | 259,069 | ||||||
| Analog Devices, Inc. | 6,209 | 250,844 | ||||||
| Applied Materials, Inc. | 26,437 | 328,876 | ||||||
Broadcom Corp., Class A(1) | 9,755 | 383,371 | ||||||
First Solar, Inc.(1) | 1,222 | 30,611 | ||||||
| Intel Corp. | 101,411 | 2,850,663 | ||||||
| KLA-Tencor Corp. | 3,411 | 185,627 | ||||||
| Linear Technology Corp. | 4,577 | 154,245 | ||||||
LSI Corp.(1) | 11,285 | 97,954 | ||||||
| Microchip Technology, Inc. | 3,793 | 141,100 | ||||||
Micron Technology, Inc.(1) | 19,709 | 159,643 | ||||||
Novellus Systems, Inc.(1) | 1,586 | 79,157 | ||||||
NVIDIA Corp.(1) | 12,450 | 191,605 | ||||||
Teradyne, Inc.(1) | 3,699 | 62,476 | ||||||
| Texas Instruments, Inc. | 23,177 | 778,979 | ||||||
| Xilinx, Inc. | 5,372 | 195,702 | ||||||
| 6,248,536 | ||||||||
| SOFTWARE — 3.8% | ||||||||
Adobe Systems, Inc.(1) | 10,005 | 343,272 | ||||||
Autodesk, Inc.(1) | 4,618 | 195,434 | ||||||
BMC Software, Inc.(1) | 3,280 | 131,725 | ||||||
| CA, Inc. | 7,418 | 204,440 | ||||||
Cerner Corp.(1) | 3,014 | 229,546 | ||||||
Citrix Systems, Inc.(1) | 3,746 | 295,597 | ||||||
Electronic Arts, Inc.(1) | 6,864 | 113,119 | ||||||
| Intuit, Inc. | 5,832 | 350,678 | ||||||
| Microsoft Corp. | 151,416 | 4,883,166 | ||||||
| Oracle Corp. | 79,320 | 2,312,971 | ||||||
Red Hat, Inc.(1) | 3,932 | 235,488 | ||||||
Salesforce.com, Inc.(1) | 2,738 | 423,048 | ||||||
Symantec Corp.(1) | 14,909 | 278,798 | ||||||
| 9,997,282 | ||||||||
| SPECIALTY RETAIL — 2.0% | ||||||||
| Abercrombie & Fitch Co., Class A | 1,626 | 80,666 | ||||||
AutoNation, Inc.(1) | 922 | 31,634 | ||||||
AutoZone, Inc.(1) | 532 | 197,798 | ||||||
Bed Bath & Beyond, Inc.(1) | 4,870 | 320,300 | ||||||
| Best Buy Co., Inc. | 5,684 | 134,597 | ||||||
CarMax, Inc.(1) | 4,533 | 157,068 | ||||||
| GameStop Corp., Class A | 2,974 | 64,952 | ||||||
| Gap, Inc. (The) | 6,607 | 172,707 | ||||||
| Home Depot, Inc. (The) | 31,198 | 1,569,571 | ||||||
| Limited Brands, Inc. | 5,126 | 246,048 | ||||||
| Lowe’s Cos., Inc. | 25,223 | 791,498 | ||||||
O’Reilly Automotive, Inc.(1) | 2,578 | 235,500 | ||||||
| Ross Stores, Inc. | 4,656 | 270,513 | ||||||
| Staples, Inc. | 13,721 | 222,006 | ||||||
| Tiffany & Co. | 2,645 | 182,849 | ||||||
| TJX Cos., Inc. (The) | �� | 15,184 | 602,957 | |||||
Urban Outfitters, Inc.(1) | 2,310 | 67,244 | ||||||
| 5,347,908 | ||||||||
| TEXTILES, APPAREL AND LUXURY GOODS — 0.7% | ||||||||
| Coach, Inc. | 5,761 | 445,210 | ||||||
| NIKE, Inc., Class B | 7,456 | 808,529 | ||||||
| Ralph Lauren Corp. | 1,354 | 236,043 | ||||||
| VF Corp. | 1,728 | 252,253 | ||||||
| 1,742,035 | ||||||||
| THRIFTS AND MORTGAGE FINANCE — 0.1% | ||||||||
| Hudson City Bancorp., Inc. | 11,508 | 84,124 | ||||||
| People’s United Financial, Inc. | 6,888 | 91,197 | ||||||
| 175,321 | ||||||||
| TOBACCO — 1.9% | ||||||||
| Altria Group, Inc. | 41,108 | 1,269,004 | ||||||
| Lorillard, Inc. | 2,737 | 354,387 | ||||||
| Philip Morris International, Inc. | 34,888 | 3,091,426 | ||||||
| Reynolds American, Inc. | 6,837 | 283,325 | ||||||
| 4,998,142 | ||||||||
| TRADING COMPANIES AND DISTRIBUTORS — 0.2% | ||||||||
| Fastenal Co. | 5,898 | 319,082 | ||||||
| W.W. Grainger, Inc. | 1,217 | 261,424 | ||||||
| 580,506 | ||||||||
17
| Shares | Value | |||||||
| WIRELESS TELECOMMUNICATION SERVICES — 0.2% | ||||||||
Crown Castle International Corp.(1) | 5,077 | 270,807 | ||||||
MetroPCS Communications, Inc.(1) | 6,234 | 56,231 | ||||||
Sprint Nextel Corp.(1) | 58,919 | 167,919 | ||||||
| 494,957 | ||||||||
TOTAL COMMON STOCKS (Cost $178,314,652) | 258,085,642 | |||||||
| Temporary Cash Investments — 1.9% | ||||||||
Repurchase Agreement, Bank America Merrill Lynch, (collateralized by various U.S. Treasury obligations, 6.125%, 11/15/27, valued at $1,546,018), in a joint trading account at 0.01%, dated 3/30/12, due 4/2/12 (Delivery value $1,514,207) | 1,514,206 | |||||||
Repurchase Agreement, Credit Suisse First Boston, Inc., (collateralized by various U.S. Treasury obligations, 4.375%, 5/15/41, valued at $964,084), in a joint trading account at 0.03%, dated 3/30/12, due 4/2/12 (Delivery value $946,381) | 946,379 | |||||||
Shares/ Principal Amount | Value | |||||||
Repurchase Agreement, Goldman Sachs & Co., (collateralized by various U.S. Treasury obligations, 4.50%, 5/15/38, valued at $1,160,639), in a joint trading account at 0.03%, dated 3/30/12, due 4/2/12 (Delivery value $1,135,657) | $1,135,654 | |||||||
| SSgA U.S. Government Money Market Fund | 643,232 | 643,232 | ||||||
U.S. Treasury Bills 0.02%, 5/3/12(2)(3) | $730,000 | 729,977 | ||||||
TOTAL TEMPORARY CASH INVESTMENTS (Cost $4,969,457) | 4,969,448 | |||||||
TOTAL INVESTMENT SECURITIES — 99.9% (Cost $183,284,109) | 263,055,090 | |||||||
| OTHER ASSETS AND LIABILITIES — 0.1% | 390,033 | |||||||
| TOTAL NET ASSETS — 100.0% | $263,445,123 | |||||||
| Futures Contracts | ||||
| Contracts Purchased | Expiration Date | Underlying Face Amount at Value | Unrealized Gain (Loss) | |
| 75 | S&P 500 E-Mini | June 2012 | $5,262,000 | $135,996 |
Notes to Schedule of Investments
† Category is less than 0.05% of total net assets.
| (1) | Non-income producing. |
| (2) | Security has been pledged at the custodian bank or with a broker for margin requirements on futures contracts. |
| (3) | The rate indicated is the yield to maturity at purchase. |
See Notes to Financial Statements.
18
| MARCH 31, 2012 | ||||
| Assets | ||||
| Investment securities, at value (cost of $183,284,109) | $263,055,090 | |||
| Receivable for capital shares sold | 359,179 | |||
| Receivable for variation margin on futures contracts | 18,408 | |||
| Dividends and interest receivable | 337,515 | |||
| 263,770,192 | ||||
| Liabilities | ||||
| Payable for capital shares redeemed | 223,177 | |||
| Accrued management fees | 101,892 | |||
| 325,069 | ||||
| Net Assets | $263,445,123 | |||
| Net Assets Consist of: | ||||
| Capital (par value and paid-in surplus) | $190,307,774 | |||
| Accumulated net realized loss | (6,769,628 | ) | ||
| Net unrealized appreciation | 79,906,977 | |||
| $263,445,123 | ||||
| Net assets | Shares outstanding | Net asset value per share | |
| Investor Class, $0.01 Par Value | $229,481,997 | 42,326,055 | $5.42 |
| Institutional Class, $0.01 Par Value | $33,963,126 | 6,261,222 | $5.42 |
See Notes to Financial Statements.
19
| YEAR ENDED MARCH 31, 2012 | ||||
| Investment Income (Loss) | ||||
| Income: | ||||
| Dividends | $5,348,501 | |||
| Interest | 1,855 | |||
| 5,350,356 | ||||
| Expenses: | ||||
| Management fees | 1,163,571 | |||
| Directors’ fees and expenses | 9,558 | |||
| Other expenses | 62 | |||
| 1,173,191 | ||||
| Net investment income (loss) | 4,177,165 | |||
| Realized and Unrealized Gain (Loss) | ||||
| Net realized gain (loss) on: | ||||
| Investment transactions | 10,527,315 | |||
| Futures contract transactions | 270,641 | |||
| 10,797,956 | ||||
| Change in net unrealized appreciation (depreciation) on: | ||||
| Investments | 3,783,962 | |||
| Futures contracts | 95,448 | |||
| 3,879,410 | ||||
| Net realized and unrealized gain (loss) | 14,677,366 | |||
| Net Increase (Decrease) in Net Assets Resulting from Operations | $18,854,531 | |||
See Notes to Financial Statements.
20
| YEARS ENDED MARCH 31, 2012 AND MARCH 31, 2011 | |||||||
| Increase (Decrease) in Net Assets | March 31, 2012 | March 31, 2011 | |||||
| Operations | |||||||
| Net investment income (loss) | $4,177,165 | $5,972,214 | |||||
| Net realized gain (loss) | 10,797,956 | 70,207,172 | |||||
| Change in net unrealized appreciation (depreciation) | 3,879,410 | (30,566,414 | ) | ||||
| Net increase (decrease) in net assets resulting from operations | 18,854,531 | 45,612,972 | |||||
| Distributions to Shareholders | |||||||
| From net investment income: | |||||||
| Investor Class | (8,367,038 | ) | (3,291,548 | ) | |||
| Institutional Class | (1,477,364 | ) | (2,459,234 | ) | |||
| From net realized gains: | |||||||
| Investor Class | (1,812,614 | ) | — | ||||
| Institutional Class | (301,965 | ) | — | ||||
| Decrease in net assets from distributions | (11,958,981 | ) | (5,750,782 | ) | |||
| Capital Share Transactions | |||||||
| Net increase (decrease) in net assets from capital share transactions | (17,750,028 | ) | (206,054,304 | ) | |||
| Net increase (decrease) in net assets | (10,854,478 | ) | (166,192,114 | ) | |||
| Net Assets | |||||||
| Beginning of period | 274,299,601 | 440,491,715 | |||||
| End of period | $263,445,123 | $274,299,601 | |||||
| Undistributed net investment income | — | $131,093 | |||||
See Notes to Financial Statements.
21
MARCH 31, 2012
1. Organization
American Century Capital Portfolios, Inc. (the corporation) is registered under the Investment Company Act of 1940, as amended (the 1940 Act), as an open-end management investment company and is organized as a Maryland corporation. Equity Index Fund (the fund) is one fund in a series issued by the corporation. The fund is nondiversified as defined under the 1940 Act. The fund’s investment objective is to seek long-term capital growth. The fund pursues its objectives by matching, as closely as possible, the investment characteristics and results of the S&P 500 Index.
The fund is authorized to issue the Investor Class and the Institutional Class. The share classes differ principally in their respective distribution and shareholder servicing expenses and arrangements. The Institutional Class is made available to institutional shareholders or through financial intermediaries whose clients do not require the same level of shareholder and administrative services as shareholders of other classes. As a result, the Institutional Class is charged a lower unified management fee.
2. Significant Accounting Policies
The following is a summary of significant accounting policies consistently followed by the fund in preparation of its financial statements. The financial statements are prepared in conformity with accounting principles generally accepted in the United States of America, which may require management to make certain estimates and assumptions at the date of the financial statements. Actual results could differ from these estimates.
Investment Valuations — The fund determines the fair value of its investments and computes its net asset value per share as of the close of regular trading (usually 4 p.m. Eastern time) on the New York Stock Exchange (NYSE) on each day the NYSE is open.
Equity securities that are listed or traded on a domestic securities exchange are valued at the last reported sales price or at the official closing price as provided by the exchange. Equity securities traded on foreign securities exchanges are typically valued at the closing price on the exchange where primarily traded or as of the close of the NYSE, if that is earlier. If no last sales price is reported, or if local convention or regulation so provides, the mean of the latest bid and asked prices is used. Depending on local convention or regulation, securities traded over-the-counter are valued at the mean of the latest bid and asked prices, the last sales price, or the official closing price. In its determination of fair value, the fund may review several factors including: market information specific to a security; news developments in U.S. and foreign markets; the performance of particular U.S. and foreign securities, indices, comparable securities, American Depositary Receipts, Exchange-Traded Funds, and other relevant market indicators.
Debt securities maturing within 60 days at the time of purchase may be valued at cost, plus or minus any amortized discount or premium or at the evaluated mean as provided by an independent pricing service. Evaluated mean prices are commonly derived through utilization of market models, which may consider, among other factors, trade data, quotations from dealers and active market makers, relevant yield curve and spread data, related sector levels, creditworthiness, and other relevant market information on the same or comparable securities.
Investments in open-end management investment companies are valued at the reported net asset value per share. Repurchase agreements are valued at cost. Exchange-traded futures contracts are valued at the settlement price as provided by the appropriate clearing corporation.
22
If the fund determines that the market price for a portfolio security is not readily available or the valuation methods mentioned above do not reflect a security’s fair value, such security is valued as determined in good faith by the Board of Directors or its designee, in accordance with procedures adopted by the Board of Directors. Circumstances that may cause the fund to use these procedures to value a security include, but are not limited to: a security has been declared in default; trading in a security has been halted during the trading day; there is a foreign market holiday and no trading occurred; or an event occurred between the close of a foreign exchange and the NYSE that may affect the value of a security.
Security Transactions — Security transactions are accounted for as of the trade date. Net realized gains and losses are determined on the identified cost basis, which is also used for federal income tax purposes.
Investment Income — Dividend income less foreign taxes withheld, if any, is recorded as of the ex-dividend date. Interest income is recorded on the accrual basis and includes accretion of discounts and amortization of premiums.
Repurchase Agreements — The fund may enter into repurchase agreements with institutions that American Century Investment Management, Inc. (ACIM) (the investment advisor) has determined are creditworthy pursuant to criteria adopted by the Board of Directors. The fund requires that the collateral, represented by securities, received in a repurchase transaction be transferred to the custodian in a manner sufficient to enable the fund to obtain those securities in the event of a default under the repurchase agreement. ACIM monitors, on a daily basis, the securities transferred to ensure the value, including accrued interest, of the securities under each repurchase agreement is equal to or greater than amounts owed to the fund under each repurchase agreement.
Joint Trading Account — Pursuant to an Exemptive Order issued by the Securities and Exchange Commission, the fund, along with certain other funds in the American Century Investments family of funds, may transfer uninvested cash balances into a joint trading account. These balances are invested in one or more repurchase agreements that are collateralized by U.S. Treasury or Agency obligations.
Segregated Assets — In accordance with the 1940 Act, the fund segregates assets on its books and records to cover certain types of investments, including, but not limited to, futures contracts, forward commitments, when-issued securities, short sales, swap agreements and certain forward foreign currency exchange contracts. ACIM monitors, on a daily basis, the securities segregated to ensure the fund designates a sufficient amount of liquid assets, marked-to-market daily. The fund may also receive assets or be required to pledge assets at the custodian bank or with a broker for margin requirements on futures contracts and swap agreements.
Income Tax Status — It is the fund’s policy to distribute substantially all net investment income and net realized gains to shareholders and to otherwise qualify as a regulated investment company under provisions of the Internal Revenue Code. The fund is no longer subject to examination by tax authorities for years prior to 2009. At this time, management believes there are no uncertain tax positions which, based on their technical merit, would not be sustained upon examination and for which it is reasonably possible that the total amounts of unrecognized tax benefits will significantly change in the next twelve months. Accordingly, no provision has been made for federal or state income taxes.
Multiple Class — All shares of the fund represent an equal pro rata interest in the net assets of the class to which such shares belong, and have identical voting, dividend, liquidation and other rights and the same terms and conditions, except for class specific expenses and exclusive rights to vote on matters affecting only individual classes. Income, non-class specific expenses, and realized and unrealized capital gains and losses of the fund are allocated to each class of shares based on their relative net assets.
Distributions to Shareholders — Distributions from net investment income, if any, are generally declared and paid quarterly. Distributions from net realized gains, if any, are generally declared and paid annually.
23
Indemnifications — Under the corporation’s organizational documents, its officers and directors are indemnified against certain liabilities arising out of the performance of their duties to the fund. In addition, in the normal course of business, the fund enters into contracts that provide general indemnifications. The maximum exposure under these arrangements is unknown as this would involve future claims that may be made against a fund. The risk of material loss from such claims is considered by management to be remote.
3. Fees and Transactions with Related Parties
Management Fees — The corporation has entered into a management agreement with ACIM, under which ACIM provides the fund with investment advisory and management services in exchange for a single, unified management fee (the fee) per class. The agreement provides that all expenses of managing and operating the fund, except distribution and service fees, brokerage expenses, taxes, interest, fees and expenses of the independent directors (including legal counsel fees), and extraordinary expenses, will be paid by ACIM. The fee is computed and accrued daily based on each class’s daily net assets and paid monthly in arrears. The rate of the fee is determined by applying a fee rate calculation formula. This formula takes into account the fund’s assets as well as certain assets, if any, of other clients of the investment advisor outside the American Century Investments family of funds (such as subadvised funds and separate accounts) that have very similar investment teams and investment strategies (strategy assets). The annual management fee schedule ranges from 0.350% to 0.490% for the Investor Class. The Institutional Class is 0.20% less at each point within the range. The effective annual management fee for each class for the year ended March 31, 2012 was 0.49% and 0.29% for the Investor Class and Institutional Class, respectively.
ACIM has entered into a subadvisory agreement with Northern Trust Investments, N.A. (NTI) (the subadvisor) on behalf of the fund. The subadvisor makes investment decisions for the fund in accordance with the fund’s investment objectives, policies and restrictions under the supervision of ACIM and the Board of Directors. ACIM pays all costs associated with retaining NTI as the subadvisor of the fund.
Related Parties — Certain officers and directors of the corporation are also officers and/or directors of American Century Companies, Inc. (ACC), the parent of the corporation’s investment advisor, ACIM, the distributor of the corporation, American Century Investment Services, Inc., and the corporation’s transfer agent, American Century Services, LLC.
The fund was eligible to invest in a money market fund for temporary purposes, which is managed by J.P. Morgan Investment Management, Inc. (JPMIM). The fund had a securities lending agreement with JPMorgan Chase Bank (JPMCB) and a mutual funds services agreement with J.P. Morgan Investor Services Co. (JPMIS). JPMCB was a custodian of the fund. JPMIM, JPMIS and JPMCB are wholly owned subsidiaries of JPMorgan Chase & Co. (JPM). Prior to August 31, 2011, JPM was an equity investor in ACC. The services provided to the fund by JPMIM, JPMIS and JPMCB terminated on July 31, 2011.
4. Investment Transactions
Purchases and sales of investment securities, excluding short-term investments, for the year ended March 31, 2012 were $7,079,874 and $31,301,985, respectively.
24
5. Capital Share Transactions
Transactions in shares of the fund were as follows:
| Year ended March 31, 2012 | Year ended March 31, 2011 | ||||||||||||||
| Shares | Amount | Shares | Amount | ||||||||||||
| Investor Class/Shares Authorized | 200,000,000 | 200,000,000 | |||||||||||||
| Sold | 5,611,974 | $28,447,842 | 7,592,817 | $36,013,103 | |||||||||||
| Issued in reinvestment of distributions | 2,035,675 | 9,942,939 | 675,260 | 3,212,242 | |||||||||||
| Redeemed | (9,178,417 | ) | (46,060,069 | ) | (9,367,020 | ) | (43,371,841 | ) | |||||||
| (1,530,768 | ) | (7,669,288 | ) | (1,098,943 | ) | (4,146,496 | ) | ||||||||
| Institutional Class/Shares Authorized | 200,000,000 | 200,000,000 | |||||||||||||
| Sold | 1,760,166 | 8,824,066 | 3,607,728 | 16,847,390 | |||||||||||
| Issued in reinvestment of distributions | 364,111 | 1,779,329 | 533,303 | 2,459,234 | |||||||||||
| Redeemed | (4,044,247 | ) | (20,684,135 | ) | (45,862,531 | ) | (221,214,432 | ) | |||||||
| (1,919,970 | ) | (10,080,740 | ) | (41,721,500 | ) | (201,907,808 | ) | ||||||||
| Net increase (decrease) | (3,450,738 | ) | $(17,750,028 | ) | (42,820,443 | ) | $(206,054,304 | ) | |||||||
6. Fair Value Measurements
The fund’s securities valuation process is based on several considerations and may use multiple inputs to determine the fair value of the positions held by the fund. In conformity with accounting principles generally accepted in the United States of America, the inputs used to determine a valuation are classified into three broad levels as follows:
| • | Level 1 valuation inputs consist of unadjusted quoted prices in an active market for identical securities; |
| • | Level 2 valuation inputs consist of direct or indirect observable market data (including quoted prices for similar securities, evaluations of subsequent market events, interest rates, prepayment speeds, credit risk, etc.); or |
| • | Level 3 valuation inputs consist of unobservable data (including a fund’s own assumptions). |
The level classification is based on the lowest level input that is significant to the fair valuation measurement. The valuation inputs are not necessarily an indication of the risks associated with investing in these securities or other financial instruments.
The following is a summary of the level classifications as of period end. The Schedule of Investments provides additional information on the fund’s portfolio holdings.
| Level 1 | Level 2 | Level 3 | |
| Investment Securities | |||
| Common Stocks | $258,085,642 | — | — |
| Temporary Cash Investments | 643,232 | $4,326,216 | — |
| Total Value of Investment Securities | $258,728,874 | $4,326,216 | — |
| Other Financial Instruments | |||
| Total Unrealized Gain (Loss) on Futures Contracts | $135,996 | — | — |
25
7. Derivative Instruments
Equity Price Risk — The fund is subject to equity price risk in the normal course of pursuing its investment objectives. A fund may enter into futures contracts based on an equity index in order to manage its exposure to changes in market conditions. A fund may purchase futures contracts to gain exposure to increases in market value or sell futures contracts to protect against a decline in market value. Upon entering into a futures contract, a fund is required to deposit either cash or securities in an amount equal to a certain percentage of the contract value (initial margin). Subsequent payments (variation margin) are made or received daily, in cash, by a fund. The variation margin is equal to the daily change in the contract value and is recorded as unrealized gains and losses. A fund recognizes a realized gain or loss when the contract is closed or expires. Net realized and unrealized gains or losses occurring during the holding period of futures contracts are a component of net realized gain (loss) on futures contract transactions and change in net unrealized appreciation (depreciation) on futures contracts, respectively. One of the risks of entering into futures contracts is the possibility that the change in value of the contract may not correlate with the changes in value of the underlying securities. The equity price risk derivative instruments held at period end as disclosed on the Schedule of Investments are indicative of the fund’s typical volume during the period.
The value of equity price risk derivative instruments as of March 31, 2012, is disclosed on the Statement of Assets and Liabilities as an asset of $18,408 in receivable for variation margin on futures contracts.* For the year ended March 31, 2012, the effect of equity price risk derivative instruments on the Statement of Operations was $270,641 in net realized gain (loss) on futures contract transactions and $95,448 in change in net unrealized appreciation (depreciation) on futures contracts.
| * | Included in the unrealized gain (loss) on futures contracts as reported in the Schedule of Investments. |
8. Federal Tax Information
The tax character of distributions paid during the years ended March 31, 2012 and March 31, 2011 were as follows:
| 2012 | 2011 | |
| Distributions Paid From | ||
| Ordinary income | $5,539,993 | $5,750,782 |
| Long-term capital gains | $6,418,988 | — |
The book-basis character of distributions made during the year from net investment income or net realized gains may differ from their ultimate characterization for federal income tax purposes. These differences reflect the differing character of certain income items and net realized gains and losses for financial statement and tax purposes, and may result in reclassification among certain capital accounts on the financial statements.
The reclassifications, which are primarily due to the recharacterization of distributions for federal income tax purposes, were made to capital $1,183,600, accumulated net investment loss $5,536,144, and accumulated net realized loss $(6,719,744).
26
As of March 31, 2012, the components of investments for federal income tax purposes were as follows:
| Federal tax cost of investments | $189,917,741 | |||
| Gross tax appreciation of investments | $99,969,851 | |||
| Gross tax depreciation of investments | (26,832,502 | ) | ||
| Net tax appreciation (depreciation) of investments | $73,137,349 |
The difference between book-basis and tax-basis cost and unrealized appreciation (depreciation) is attributable primarily to the tax deferral of losses on wash sales and the realization for tax purposes of unrealized gains (losses) on futures contracts.
The fund had no distributable capital gains or losses for federal income tax purposes for the year ended March 31, 2012.
27
| For a Share Outstanding Throughout the Years Ended March 31 (except as noted) | ||||||||||||||
| Per-Share Data | Ratios and Supplemental Data | |||||||||||||
| Income From Investment Operations: | Distributions From: | Ratio to Average Net Assets of: | ||||||||||||
Net Asset Value, Beginning of Period | Net Investment Income (Loss)(1) | Net Realized and Unrealized Gain (Loss) | Total From Investment Operations | Net Investment Income | Net Realized Gains | Tax Return of Capital | Total Distributions | Net Asset Value, End of Period | Total Return(2) | Operating Expenses | Net Investment Income (Loss) | Portfolio Turnover Rate | Net Assets, End of Period (in thousands) | |
| Investor Class | ||||||||||||||
| 2012 | $5.27 | 0.08 | 0.31 | 0.39 | (0.20) | (0.04) | — | (0.24) | $5.42 | 8.07% | 0.49% | 1.63% | 3% | $229,482 |
| 2011 | $4.64 | 0.07 | 0.64 | 0.71 | (0.08) | — | — | (0.08) | $5.27 | 15.39% | 0.50% | 1.54% | 4% | $231,171 |
| 2010 | $3.17 | 0.07 | 1.47 | 1.54 | (0.07) | — | — | (0.07) | $4.64 | 48.96% | 0.49% | 1.81% | 12% | $208,726 |
| 2009 | $5.26 | 0.09 | (2.09) | (2.00) | (0.09) | — | — | (0.09) | $3.17 | (38.36)% | 0.49% | 1.93% | 5% | $129,026 |
| 2008 | $5.66 | 0.09 | (0.39) | (0.30) | (0.10) | — | —(3) | (0.10) | $5.26 | (5.46)% | 0.49% | 1.51% | 9% | $207,571 |
| Institutional Class | ||||||||||||||
| 2012 | $5.27 | 0.09 | 0.31 | 0.40 | (0.21) | (0.04) | — | (0.25) | $5.42 | 8.24% | 0.29% | 1.83% | 3% | $33,963 |
| 2011 | $4.64 | 0.08 | 0.64 | 0.72 | (0.09) | — | — | (0.09) | $5.27 | 15.62% | 0.30% | 1.74% | 4% | $43,129 |
| 2010 | $3.17 | 0.08 | 1.47 | 1.55 | (0.08) | — | — | (0.08) | $4.64 | 49.27% | 0.29% | 2.01% | 12% | $231,766 |
| 2009 | $5.26 | 0.10 | (2.09) | (1.99) | (0.10) | — | — | (0.10) | $3.17 | (38.24)% | 0.29% | 2.13% | 5% | $191,053 |
| 2008 | $5.67 | 0.10 | (0.40) | (0.30) | (0.11) | — | —(3) | (0.11) | $5.26 | (5.27)% | 0.29% | 1.71% | 9% | $599,914 |
28
Notes to Financial Highlights
| (1) | Computed using average shares outstanding throughout the period. |
| (2) | Total returns are calculated based on the net asset value of the last business day. Total returns for periods less than one year are not annualized. |
| (3) | Per-share amount was less than $0.005. |
See Notes to Financial Statements.
29
To the Board of Directors and Shareholders of
American Century Capital Portfolios, Inc.:
We have audited the accompanying statement of assets and liabilities, including the schedule of investments, of Equity Index Fund, one of the funds constituting American Century Capital Portfolios, Inc. (the “Corporation”) as of March 31, 2012, and the related statement of operations for the year then ended, the statements of changes in net assets for each of the two years in the period then ended, and the financial highlights for each of the five years in the period then ended. These financial statements and financial highlights are the responsibility of the Corporation’s management. Our responsibility is to express an opinion on these financial statements and financial highlights based on our audits.
We conducted our audits in accordance with the standards of the Public Company Accounting Oversight Board (United States). Those standards require that we plan and perform the audit to obtain reasonable assurance about whether the financial statements and financial highlights are free of material misstatement. The Corporation is not required to have, nor were we engaged to perform, an audit of its internal control over financial reporting. Our audits included consideration of internal control over financial reporting as a basis for designing audit procedures that are appropriate in the circumstances, but not for the purpose of expressing an opinion on the effectiveness of the Corporation’s internal control over financial reporting. Accordingly, we express no such opinion. An audit also includes examining, on a test basis, evidence supporting the amounts and disclosures in the financial statements, assessing the accounting principles used and significant estimates made by management, as well as evaluating the overall financial statement presentation. Our procedures included confirmation of securities owned as of March 31, 2012, by correspondence with the custodian and brokers; where replies were not received from brokers, we performed other auditing procedures. We believe that our audits provide a reasonable basis for our opinion.
In our opinion, such financial statements and financial highlights referred to above present fairly, in all material respects, the financial position of Equity Index Fund of American Century Capital Portfolios, Inc., as of March 31, 2012, the results of its operations for the year then ended, the changes in its net assets for each of the two years in the period then ended, and the financial highlights for each of the five years in the period then ended, in conformity with accounting principles generally accepted in the United States of America.
Deloitte & Touche LLP
Kansas City, Missouri
May 16, 2012
30
The Board of Directors
The individuals listed below serve as directors of the funds. Each director will continue to serve in this capacity until death, retirement, resignation or removal from office. The mandatory retirement age for directors who are not “interested persons,” as that term is defined in the Investment Company Act (independent directors), is 72. However, the mandatory retirement age for an individual director may be extended with the approval of the remaining independent directors.
Mr. Thomas is an “interested person” because he currently serves as President and Chief Executive Officer of American Century Companies, Inc. (ACC), the parent company of American Century Investment Management, Inc. (ACIM or the advisor). Mr. Fink is an “interested person” because he currently serves as Executive Vice President and Chief Operating Officer of ACC.
The other directors (more than three-fourths of the total number) are independent; that is, they have never been employees, directors or officers of, and have no financial interest in, ACC or any of its wholly owned, direct or indirect, subsidiaries, including ACIM, American Century Investment Services, Inc. (ACIS) and American Century Services, LLC (ACS). The directors serve in this capacity for seven (in the case of Mr. Thomas, 15) registered investment companies in the American Century Investments family of funds.
The following table presents additional information about the directors. The mailing address for each director is 4500 Main Street, Kansas City, Missouri 64111.
Name (Year of Birth) | Position(s) Held with Funds | Length of Time Served | Principal Occupation(s) During Past 5 Years | Number of American Century Portfolios Overseen by Director | Other Directorships Held During Past 5 Years | |
| Independent Directors | ||||||
Thomas A. Brown (1940) | Director | Since 1980 | Managing Member, Associated Investments, LLC (real estate investment company); Brown Cascade Properties, LLC (real estate investment company) (2001 to 2009) | 66 | None | |
Andrea C. Hall (1945) | Director | Since 1997 | Retired | 66 | None | |
Jan M. Lewis (1957) | Director | Since 2011 | President and Chief Executive Officer, Catholic Charities of Northeast Kansas (human services organization) (2006 to present) | 66 | None | |
James A. Olson (1942) | Director | Since 2007 | Member, Plaza Belmont LLC (private equity fund manager) | 66 | Saia, Inc. (2002 to 2012) and Entertainment Properties Trust | |
Donald H. Pratt (1937) | Director and Chairman of the Board | Since 1995 (Chairman since 2005) | Chairman and Chief Executive Officer, Western Investments, Inc. (real estate company) | 66 | None | |
31
Name (Year of Birth) | Position(s) Held with Funds | Length of Time Served | Principal Occupation(s) During Past 5 Years | Number of American Century Portfolios Overseen by Director | Other Directorships Held During Past 5 Years | |
| Independent Directors | ||||||
M. Jeannine Strandjord (1945) | Director | Since 1994 | Retired | 66 | DST Systems Inc., Euronet Worldwide Inc., and Charming Shoppes, Inc. (2006 to 2010) | |
John R. Whitten (1946) | Director | Since 2008 | Project Consultant, Celanese Corp. (industrial chemical company) | 66 | Rudolph Technologies, Inc. | |
Stephen E. Yates (1948) | Director | Since 2012 | Retired; Executive Vice President, Technology & Operations, KeyCorp. (computer services) (2004 to 2010) | 66 | Applied Industrial Technology (2001 to 2010) | |
| Interested Directors | ||||||
Barry Fink (1955) | Director and Executive Vice President | Since 2012 (Executive Vice President since 2007) | Chief Operating Officer and Executive Vice President, ACC (September 2007 to present); President, ACS (October 2007 to present); Managing Director, Morgan Stanley (2000 to 2007). Also serves as Manager, ACS and Director, ACC and certain ACC subsidiaries | 66 | None | |
Jonathan S. Thomas (1963) | Director and President | Since 2007 | President and Chief Executive Officer, ACC (March 2007 to present); Chief Administrative Officer, ACC (February 2006 to February 2007); Executive Vice President, ACC (November 2005 to February 2007). Also serves as Chief Executive Officer and Manager, ACS; Executive Vice President, ACIM; Director, ACC, ACIM and other ACC subsidiaries | 108 | None | |
32
Officers
The following table presents certain information about the executive officers of the funds. Each officer serves as an officer for each of the 15 investment companies in the American Century family of funds, unless otherwise noted. No officer is compensated for his or her service as an officer of the funds. The listed officers are interested persons of the funds and are appointed or re-appointed on an annual basis. The mailing address for each officer listed below is 4500 Main Street, Kansas City, Missouri 64111.
Name (Year of Birth) | Offices with the Funds | Principal Occupation(s) During the Past Five Years | |
Jonathan S. Thomas (1963) | Director and President since 2007 | President and Chief Executive Officer, ACC (March 2007 to present); Chief Administrative Officer, ACC (February 2006 to February 2007); Executive Vice President, ACC (November 2005 to February 2007). Also serves as Chief Executive Officer and Manager, ACS; Executive Vice President, ACIM; Director, ACC, ACIM and other ACC subsidiaries | |
Barry Fink (1955) | Director since 2012 and Executive Vice President since 2007 | Chief Operating Officer and Executive Vice President, ACC (September 2007 to present); President, ACS (October 2007 to present); Managing Director, Morgan Stanley (2000 to 2007). Also serves as Manager, ACS and Director, ACC and certain ACC subsidiaries | |
Maryanne L. Roepke (1956) | Chief Compliance Officer since 2006 and Senior Vice President since 2000 | Chief Compliance Officer, American Century funds, ACIM and ACS (August 2006 to present). Also serves as Senior Vice President, ACS | |
Charles A. Etherington (1957) | General Counsel since 2007 and Senior Vice President since 2006 | Attorney, ACC (February 1994 to present); Vice President, ACC (November 2005 to present), General Counsel, ACC (March 2007 to present); Also serves as General Counsel, ACIM, ACS, ACIS and other ACC subsidiaries; and Senior Vice President, ACIM and ACS | |
C. Jean Wade (1964) | Vice President, Treasurer and Chief Financial Officer since 2012 | Vice President, ACS (February 2000 to present) | |
Robert J. Leach (1966) | Vice President since 2006 and Assistant Treasurer since 2012 | Vice President, ACS (February 2000 to present) | |
David H. Reinmiller (1963) | Vice President since 2000 | Attorney, ACC (January 1994 to present); Associate General Counsel, ACC (January 2001 to present). Also serves as Vice President, ACIM and ACS | |
Ward D. Stauffer (1960) | Secretary since 2005 | Attorney, ACC (June 2003 to present) |
The Statement of Additional Information has additional information about the fund’s directors and is available without charge, upon request, by calling 1-800-345-2021.
33
Retirement Account Information
As required by law, distributions you receive from certain IRAs, or 403(b), 457 and qualified plans are subject to federal income tax withholding, unless you elect not to have withholding apply. Tax will be withheld on the total amount withdrawn even though you may be receiving amounts that are not subject to withholding, such as nondeductible contributions. In such case, excess amounts of withholding could occur. You may adjust your withholding election so that a greater or lesser amount will be withheld.
If you don’t want us to withhold on this amount, you must notify us to not withhold the federal income tax. You may notify us in writing or in certain situations by telephone or through other electronic means. You have the right to revoke your withholding election at any time and any election you make may remain in effect until revoked by filing a new election.
Remember, even if you elect not to have income tax withheld, you are liable for paying income tax on the taxable portion of your withdrawal. If you elect not to have income tax withheld or you don’t have enough income tax withheld, you may be responsible for payment of estimated tax. You may incur penalties under the estimated tax rules if your withholding and estimated tax payments are not sufficient. You can reduce or defer the income tax on a distribution by directly or indirectly rolling such distribution over to another IRA or eligible plan. You should consult your tax advisor for additional information.
State tax will be withheld if, at the time of your distribution, your address is within one of the mandatory withholding states and you have federal income tax withheld. State taxes will be withheld from your distribution in accordance with the respective state rules.
Proxy Voting Guidelines
American Century Investment Management, Inc., the fund’s investment advisor, is responsible for exercising the voting rights associated with the securities purchased and/or held by the fund. A description of the policies and procedures the advisor uses in fulfilling this responsibility is available without charge, upon request, by calling 1-800-345-2021. It is also available on American Century Investments’ website at americancentury.com and on the Securities and Exchange Commission’s website at sec.gov. Information regarding how the investment advisor voted proxies relating to portfolio securities during the most recent 12-month period ended June 30 is available on the “About Us” page at americancentury.com. It is also available at sec.gov.
Quarterly Portfolio Disclosure
The fund files its complete schedule of portfolio holdings with the Securities and Exchange Commission (SEC) for the first and third quarters of each fiscal year on Form N-Q. The fund’s Forms N-Q are available on the SEC’s website at sec.gov, and may be reviewed and copied at the SEC’s Public Reference Room in Washington, DC. Information on the operation of the Public Reference Room may be obtained by calling 1-800-SEC-0330. The fund also makes its complete schedule of portfolio holdings for the most recent quarter of its fiscal year available on its website at americancentury.com and, upon request, by calling 1-800-345-2021.
34
Other Tax Information
The following information is provided pursuant to provisions of the Internal Revenue Code.
The fund hereby designates up to the maximum amount allowable as qualified dividend income for the fiscal year ended March 31, 2012.
For corporate taxpayers, the fund hereby designates $5,118,007, or up to the maximum amount allowable, of ordinary income distributions paid during the fiscal year ended March 31, 2012 as qualified for the corporate dividends received deduction.
The fund hereby designates $6,418,988, or up to the maximum amount allowable, as long-term capital gain distributions for the fiscal year ended March 31, 2012.
35
36
| Contact Us | americancentury.com |
| Automated Information Line | 1-800-345-8765 |
| Investor Services Representative | 1-800-345-2021 or 816-531-5575 |
| Investors Using Advisors | 1-800-378-9878 |
Business, Not-For-Profit, Employer-Sponsored Retirement Plans | 1-800-345-3533 |
Banks and Trust Companies, Broker-Dealers, Financial Professionals, Insurance Companies | 1-800-345-6488 |
| Telecommunications Device for the Deaf | 1-800-634-4113 |
American Century Capital Portfolios, Inc.
Investment Advisor:
American Century Investment Management, Inc.
Kansas City, Missouri
This report and the statements it contains are submitted for the general information of our shareholders. The report is not authorized for distribution to prospective investors unless preceded or accompanied by an effective prospectus.
©2012 American Century Proprietary Holdings, Inc. All rights reserved.
CL-ANN-75028 1205
ANNUAL REPORT MARCH 31, 2012
| Market Neutral Value Fund |
| President’s Letter | 2 |
| Independent Chairman’s Letter | 3 |
| Market Perspective | 4 |
| Performance | 5 |
| Portfolio Commentary | 6 |
| Fund Characteristics | 7 |
| Shareholder Fee Example | 8 |
| Schedule of Investments | 10 |
| Statement of Assets and Liabilities | 14 |
| Statement of Operations | 15 |
| Statement of Changes in Net Assets | 16 |
| Notes to Financial Statements | 17 |
| Financial Highlights | 23 |
| Report of Independent Registered Public Accounting Firm | 24 |
| Management | 25 |
| Approval of Management Agreement | 28 |
| Additional Information | 30 |
Any opinions expressed in this report reflect those of the author as of the date of the report, and do not necessarily represent the opinions of American Century Investments® or any other person in the American Century Investments organization. Any such opinions are subject to change at any time based upon market or other conditions and American Century Investments disclaims any responsibility to update such opinions. These opinions may not be relied upon as investment advice and, because investment decisions made by American Century Investments funds are based on numerous factors, may not be relied upon as an indication of trading intent on behalf of any American Century Investments fund. Security examples are used for representational purposes only and are not intended as recommendations to purchase or sell securities. Performance information for comparative indices and securities is provided to American Century Investments by third party vendors. To the best of American Century Investments’ knowledge, such information is accurate at the time of printing.
Dear Investor:
Thank you for reviewing this annual report for the five-month period from the fund’s inception date to March 31, 2012. Our report offers investment performance and portfolio information, presented with the expert perspective of our portfolio management team.
This report remains one of our most important vehicles for conveying information about fund returns, as well as market factors and strategies that affected fund performance. For additional, updated information, we encourage you to visit our website, americancentury.com. Click on the “Fund Performance” and “Insights & News” headings at the top of our Individual Investors site.
“Risk On” Attitude Bolstered U.S. Equity Returns
“Risk off,” which was a major investment theme during the third quarter of 2011, switched to “risk on” during the fourth quarter of 2011 and the first quarter of 2012. These two consecutive quarters of increased tolerance for investment risk formed the backdrop for this report.
Five-month investment returns, as of March 31, 2012, reflected rekindled confidence in the U.S. economic recovery and European debt crisis solutions. Fears of another U.S. recession and a deepening European financial crisis—which caused dramatic dips in U.S. Treasury yields and U.S. stock index levels in the third quarter of 2011—eased. Improvements in employment and the housing market triggered optimism. Meanwhile, central banks around the world continued to bolster and maintain global financial market liquidity, especially in Europe.
As a result, U.S. stocks outpaced U.S. bonds by a wide margin for the reporting period. The S&P 500 Index surged ahead 13.49%, while its broad taxable bond market counterpart, the Barclays U.S. Aggregate Bond Index, inched up just 1.32%. U.S. Treasury returns (particularly for shorter-maturity Treasuries) were even lower than the broad bond market’s, as investors switched from Treasuries to higher-yielding bonds or other asset categories with more appreciation potential in stronger anticipated growth scenarios.
But the economic road ahead still has many possible bumps and potholes in it. Europe, the Middle East, government budget deficits, and the U.S. presidential election could trigger more market instability. We believe strongly in adhering to a disciplined, diversified, long-term investment approach during volatile periods, and we appreciate your continued trust in us during these unsettled times.
Sincerely,
Jonathan Thomas
President and Chief Executive Officer
American Century Investments
2
Dear Fellow Shareholders,
The assets under management in American Century Investments’ funds grow through investors placing new assets in the funds and through market appreciation. Asset growth has been at near record levels over the past two calendar years as market movements were upward, the funds’ relative returns were generally favorable, and the distribution strategies implemented by fund management have been successful.
The board reviews fund performance and distribution strategies on a regular basis. Several years ago, the fund’s management team discussed with the board its plans to grow fund assets in the intermediary, institutional and international distribution channels. These distribution strategies have produced strong positive growth. The growth in the intermediary channel recognizes the funds’ strong relative investment performance and the desire of many shareholders to seek financial guidance. Investors in both the institutional and international channels appear to find the funds’ risk-based investment strategies attractive. The board continues to support fund management’s strategies to increase fund assets and will continue to work to provide the benefits of these gains to fund shareholders.
We continue to receive a steady flow of very thoughtful questions from shareholders. If there are issues that you would like the board to address please email me at dhpratt@fundboardchair.com. Thank you for your continued investment in American Century Investments funds.
Best regards,
Don Pratt
3
By Phil Davidson,
Chief Investment Officer,
U.S. Value Equity
U.S. Stocks Produced Strong Returns
For the period from October 31, 2011, through March 31, 2012, U.S. stocks posted double-digit gains. The market’s advance was driven by improving economic conditions and positive developments in the European sovereign debt crisis.
Economic data released during the reporting period provided evidence of a gradual but promising economic recovery. Most notably, employment growth showed signs of life, helping push the unemployment rate down to a three-year low of 8.3% by the end of the period. Consumer spending and manufacturing activity also picked up, and mild winter weather provided a lift to the construction industry. As a result, the U.S. economy grew at a 3% annual rate in the fourth quarter of 2011, compared with an average of 1.2% for the first three quarters of 2011.
Better news out of Europe also provided a boost to investor confidence. The European Central Bank provided liquidity injections to the debt markets and additional funding support for the Continent’s beleaguered banking sector. In addition, a debt restructuring agreement in Greece helped ease the country’s near-term debt problems. These developments provided some optimism that Europe was making progress toward solving the fiscal challenges facing a number of countries.
Growth and Value Stocks Mixed
For the reporting period, the broad equity indices returned approximately 13%. As the table below illustrates, returns were comparable across all capitalization segments of the equity market. Growth and value stocks generated mixed results—growth issues outpaced value among large-cap stocks, growth and value were virtually even in the mid-cap segment of the market, and value outperformed growth among small-cap shares.
The mixed performance of growth and value shares was a reflection of sector returns during the period. Growth-oriented sectors such as information technology and consumer discretionary, which were major beneficiaries of the improving economic environment, posted the best returns. However, the financials sector, which is the largest sector weighting in most value indices, was also among the better-performing sectors for the reporting period.
| U.S. Stock Index Returns | ||||
| From October 31, 2011 through March 31, 2012* | ||||
| Russell 1000 Index (Large-Cap) | 13.55% | Russell 2000 Index (Small-Cap) | 12.77% | |
| Russell 1000 Growth Index | 14.31% | Russell 2000 Growth Index | 12.43% | |
| Russell 1000 Value Index | 12.77% | Russell 2000 Value Index | 13.11% | |
| Russell Midcap Index | 12.24% | |||
| Russell Midcap Growth Index | 12.26% | |||
| Russell Midcap Value Index | 12.22% | |||
*Total returns for periods less than one year are not annualized.
4
| Total Returns as of March 31, 2012 | |||
| Ticker Symbol | Since Inception(1) | Inception Date | |
| Investor Class | ACVVX | 3.20%(2) | 10/31/11 |
Barclays U.S. 1-3 Month Treasury Bill Index | — | 0.01% | — |
| Institutional Class | ACVKX | 3.30%(2) | 10/31/11 |
A Class No sales charge* With sales charge* | ACVQX | 3.10%(2) -2.83%(2) | 10/31/11 |
C Class No sales charge* With sales charge* | ACVHX | 2.80%(2) 1.80%(2) | 10/31/11 |
| R Class | ACVWX | 3.00%(2) | 10/31/11 |
| * | Sales charges include initial sales charges and contingent deferred sales charges (CDSCs), as applicable. A Class shares have a 5.75% maximum initial sales charge and may be subject to a maximum CDSC of 1.00%. C Class shares redeemed within 12 months of purchase are subject to a maximum CDSC of 1.00%. The SEC requires that mutual funds provide performance information net of maximum sales charges in all cases where charges could be applied. |
| (1) | Total returns for periods less than one year are not annualized. |
| (2) | Returns would have been lower if a portion of the management fee had not been waived. |
| Total Annual Fund Operating Expenses | ||||
| Investor Class | Institutional Class | A Class | C Class | R Class |
| 4.44% | 4.24% | 4.69% | 5.44% | 4.94% |
The total annual fund operating expenses shown is as stated in the fund’s prospectus current as of the date of this report. The prospectus may vary from the expense ratio shown elsewhere in this report because it is based on a different time period, includes acquired fund fees and expenses, and, if applicable, does not include fee waivers or expense reimbursements.
Data presented reflect past performance. Past performance is no guarantee of future results. Current performance may be higher or lower than the performance shown. Investment return and principal value will fluctuate, and redemption value may be more or less than original cost. To obtain performance data current to the most recent month end, please call 1-800-345-2021 or visit americancentury.com. The fund’s investment process may result in high portfolio turnover, which could mean high transaction costs, affecting both performance and capital gains tax liabilities to investors. In addition, its investment approach may involve higher volatility, short sales risk and overweighting risk. International investing involves special risks, such as political instability and currency fluctuations.
Unless otherwise indicated, performance reflects Investor Class shares; performance for other share classes will vary due to differences in fee structure. For information about other share classes available, please consult the prospectus. Data assumes reinvestment of dividends and capital gains, and none of the charts reflect the deduction of taxes that a shareholder would pay on fund distributions or the redemption of fund shares. Returns for the index are provided for comparison. The fund’s total returns include operating expenses (such as transaction costs and management fees) that reduce returns, while the total returns of the index do not.
5
Portfolio Managers: Phil Davidson, Michael Liss, and Kevin Toney
Performance Summary
Market Neutral Value returned 3.20%* (including operating expenses) between its inception on October 31, 2011 and March 31, 2012. This compares to the 0.01% return of its benchmark, the Barclays U.S. 1–3 Month Treasury Bill Index.
During the abbreviated reporting period, the U.S. stock market posted a gain, largely as a result of its strong performance during the first quarter of 2012. Earlier, investors were preoccupied with Europe’s financial woes, which threatened to spread from Greece to other nations and seemed likely to cause problems for European banks. Lackluster U.S. economic growth also dampened market sentiment. Investor risk appetite improved near the end of 2011 when the U.S. economy, proving surprisingly resilient, returned to its slow-growth path. Employers added new jobs, and corporate earnings remained solid. Investors also grew more optimistic as the European Central Bank provided inexpensive loans to European banks and the financial crisis eased.
In this environment, and in keeping with our investment approach, we took long positions in securities we identified as undervalued and short positions in securities that we identified as overvalued. In a long position, Market Neutral Value purchases the security outright. In a short position, we sell at the current market price a security the portfolio did not own but had borrowed in anticipation that the security’s price would decline.
Positions in the Industrials Sector Contributed
Market Neutral Value benefited from its positions in the industrials sector. The portfolio was long shares of Proto Labs, an online and technology-enabled quick-turn manufacturer of custom parts for prototyping and short-run production. The stock, which was purchased during the initial public offering (IPO), appreciated significantly and boosted relative performance. A short position in HEICO Corp., an aerospace, defense and electronics company, also enhanced relative results.
Positions in the Utilities Sector Detracted
In the utilities sector, a long position in natural gas distributor AGL Resources detracted as gas utilities generally underperformed. A short position in Southern, an electric utility primarily serving the southeastern U.S., also dampened relative performance.
Outlook
We will continue to adhere to our disciplined, bottom-up investment process, seeking long-term capital growth, independent of equity market conditions.
| * | All fund returns referenced in this commentary are for Investor Class shares. Total returns for periods less than one year are not annualized. Returns would have been lower if a portion of the management fee had not been waived. |
6
| MARCH 31, 2012 | |
| Top Ten Long Holdings | % of net assets |
| Molex, Inc., Class A | 4.85% |
| National Retail Properties, Inc. (Convertible) | 4.66% |
| Enbridge Energy Partners LP, Class A | 4.52% |
| HEICO Corp., Class A | 3.43% |
| BHP Billiton plc ADR | 3.34% |
| Rush Enterprises, Inc., Class B | 3.10% |
| iShares Russell 1000 Value Index Fund | 2.70% |
| Republic Services, Inc. | 2.66% |
| American Tower Corp. | 2.54% |
| Lowe's Cos., Inc. | 2.51% |
| Top Ten Short Holdings | % of net assets |
| Molex, Inc. | (4.87)% |
| National Retail Properties, Inc. | (4.64)% |
| Enbridge Energy Management LLC | (4.47)% |
| HEICO Corp. | (3.42)% |
| BHP Billiton Ltd. ADR | (3.33)% |
| Verizon Communications, Inc. | (3.15)% |
| Rush Enterprises, Inc., Class A | (3.02)% |
| iShares Russell 1000 Growth Index Fund | (2.70)% |
| Waste Management, Inc. | (2.64)% |
| Southern Co. (The) | (2.39)% |
| Types of Investments in Portfolio | % of net assets |
| Common Stocks | 70.6% |
| Convertible Bonds | 8.5% |
| Exchange-Traded Funds | 4.2% |
| Common Stocks Sold Short | (68.3)% |
| Exchange-Traded Funds Sold Short | (15.0)% |
| Temporary Cash Investments | 14.8% |
| Other Assets and Liabilities* | 85.2% |
*Amount relates primarily to deposits with broker for securities sold short at period end.
7
Fund shareholders may incur two types of costs: (1) transaction costs, including sales charges (loads) on purchase payments and redemption/exchange fees; and (2) ongoing costs, including management fees; distribution and service (12b-1) fees; and other fund expenses. This example is intended to help you understand your ongoing costs (in dollars) of investing in your fund and to compare these costs with the ongoing cost of investing in other mutual funds.
The example is based on an investment of $1,000 made at the beginning of the period and held for the entire period from October 1, 2011 to March 31, 2012 (except as noted).
Actual Expenses
The table provides information about actual account values and actual expenses for each class. You may use the information, together with the amount you invested, to estimate the expenses that you paid over the period. First, identify the share class you own. Then simply divide your account value by $1,000 (for example, an $8,600 account value divided by $1,000 = 8.6), then multiply the result by the number under the heading “Expenses Paid During Period” to estimate the expenses you paid on your account during this period.
If you hold Investor Class shares of any American Century Investments fund, or Institutional Class shares of the American Century Diversified Bond Fund, in an American Century Investments account (i.e., not a financial intermediary or retirement plan account), American Century Investments may charge you a $12.50 semiannual account maintenance fee if the value of those shares is less than $10,000. We will redeem shares automatically in one of your accounts to pay the $12.50 fee. In determining your total eligible investment amount, we will include your investments in all personal accounts (including American Century Investments Brokerage accounts) registered under your Social Security number. Personal accounts include individual accounts, joint accounts, UGMA/UTMA accounts, personal trusts, Coverdell Education Savings Accounts and IRAs (including traditional, Roth, Rollover, SEP-, SARSEP- and SIMPLE-IRAs), and certain other retirement accounts. If you have only business, business retirement, employer-sponsored or American Century Investments Brokerage accounts, you are currently not subject to this fee. If you are subject to the Account Maintenance Fee, your account value could be reduced by the fee amount.
Hypothetical Example for Comparison Purposes
The table also provides information about hypothetical account values and hypothetical expenses based on the actual expense ratio of each class of your fund and an assumed rate of return of 5% per year before expenses, which is not the actual return of a fund’s share class. The hypothetical account values and expenses may not be used to estimate the actual ending account balance or expenses you paid for the period. You may use this information to compare the ongoing costs of investing in your fund and other funds. To do so, compare this 5% hypothetical example with the 5% hypothetical examples that appear in the shareholder reports of the other funds.
8
Please note that the expenses shown in the table are meant to highlight your ongoing costs only and do not reflect any transactional costs, such as sales charges (loads) or redemption/exchange fees. Therefore, the table is useful in comparing ongoing costs only, and will not help you determine the relative total costs of owning different funds. In addition, if these transactional costs were included, your costs would have been higher.
Beginning Account Value 10/1/11 | Ending Account Value 3/31/12 | Expenses Paid During Period(1) 10/1/11 - 3/31/12 | Annualized Expense Ratio(1) | |
| Actual | ||||
| Investor Class (after waiver) | $1,000 | $1,032.00(2) | $20.90(3) | 4.92% |
| Investor Class (before waiver) | $1,000 | $1,032.00(2)(5) | $22.17(3) | 5.22% |
Institutional Class (after waiver) | $1,000 | $1,033.00(2) | $20.06(3) | 4.72% |
Institutional Class (before waiver) | $1,000 | $1,033.00(2)(5) | $21.33(3) | 5.02% |
| A Class (after waiver) | $1,000 | $1,031.00(2) | $21.95(3) | 5.17% |
| A Class (before waiver) | $1,000 | $1,031.00(2)(5) | $23.22(3) | 5.47% |
| C Class (after waiver) | $1,000 | $1,028.00(2) | $25.09(3) | 5.92% |
| C Class (before waiver) | $1,000 | $1,028.00(2)(5) | $26.37(3) | 6.22% |
| R Class (after waiver) | $1,000 | $1,030.00(2) | $23.00(3) | 5.42% |
| R Class (before waiver) | $1,000 | $1,030.00(2)(5) | $24.27(3) | 5.72% |
| Hypothetical | ||||
| Investor Class (after waiver) | $1,000 | $1,000.40(4) | $24.60(4) | 4.92% |
| Investor Class (before waiver) | $1,000 | $998.90(4) | $26.09(4) | 5.22% |
Institutional Class (after waiver) | $1,000 | $1,001.40(4) | $23.62(4) | 4.72% |
Institutional Class (before waiver) | $1,000 | $999.90(4) | $25.10(4) | 5.02% |
| A Class (after waiver) | $1,000 | $999.15(4) | $25.84(4) | 5.17% |
| A Class (before waiver) | $1,000 | $997.65(4) | $27.32(4) | 5.47% |
| C Class (after waiver) | $1,000 | $995.40(4) | $29.53(4) | 5.92% |
| C Class (before waiver) | $1,000 | $993.90(4) | $31.01(4) | 6.22% |
| R Class (after waiver) | $1,000 | $997.90(4) | $27.07(4) | 5.42% |
| R Class (before waiver) | $1,000 | $996.40(4) | $28.55(4) | 5.72% |
| (1) | Expenses are equal to the class’s annualized expense ratio listed in the table above, multiplied by the average account value over the period, multiplied by 183, the number of days in the most recent fiscal half-year, divided by 366, to reflect the one-half year period. |
| (2) | Ending account value based on actual return from October 31, 2011 (fund inception) through March 31, 2011. |
| (3) | Expenses are equal to the class’s annualized expense ratio listed in the table above, multiplied by the average account value over the period, multiplied by 153, the number of days in the period from October 31, 2011 (fund inception) through March 31, 2012, divided by 366 to reflect the period. Had the class been available for the full period, the expenses paid during the period would have been higher. |
| (4) | Ending account value and expenses paid during period assumes the class had been available throughout the entire period and are calculated using the class’s annualized expense ratio listed in the table above. |
| (5) | Ending account value assumes the return earned after waiver and would have been lower if a portion of the management fee had not been waived. |
9
MARCH 31, 2012
| Shares | Value | |||||||
Common Stocks(1) — 70.6% | ||||||||
| AEROSPACE AND DEFENSE — 6.3% | ||||||||
| General Dynamics Corp. | 1,057 | $77,563 | ||||||
| HEICO Corp., Class A | 4,091 | 164,254 | ||||||
| Raytheon Co. | 1,139 | 60,116 | ||||||
| 301,933 | ||||||||
| BEVERAGES — 1.4% | ||||||||
| Dr Pepper Snapple Group, Inc. | 1,689 | 67,915 | ||||||
| CAPITAL MARKETS — 2.9% | ||||||||
| Charles Schwab Corp. (The) | 5,987 | 86,033 | ||||||
| Northern Trust Corp. | 1,075 | 51,009 | ||||||
| 137,042 | ||||||||
| CHEMICALS — 0.6% | ||||||||
| E.I. du Pont de Nemours & Co. | 534 | 28,249 | ||||||
| COMMERCIAL BANKS — 2.0% | ||||||||
| Cullen/Frost Bankers, Inc. | 710 | 41,315 | ||||||
| PNC Financial Services Group, Inc. | 830 | 53,527 | ||||||
| 94,842 | ||||||||
| COMMERCIAL SERVICES AND SUPPLIES — 2.7% | ||||||||
| Republic Services, Inc. | 4,172 | 127,496 | ||||||
| DIVERSIFIED TELECOMMUNICATION SERVICES — 1.7% | ||||||||
| AT&T, Inc. | 2,536 | 79,199 | ||||||
| ELECTRIC UTILITIES — 1.8% | ||||||||
| Great Plains Energy, Inc. | 1,807 | 36,628 | ||||||
| NV Energy, Inc. | 3,011 | 48,537 | ||||||
| 85,165 | ||||||||
| ELECTRICAL EQUIPMENT — 1.7% | ||||||||
| Hubbell, Inc., Class A | 876 | 66,243 | ||||||
| Rockwell Automation, Inc. | 203 | 16,179 | ||||||
| 82,422 | ||||||||
| ELECTRONIC EQUIPMENT, INSTRUMENTS AND COMPONENTS — 5.0% | ||||||||
M/A-COM Technology Solutions Holdings, Inc.(2) | 334 | 6,927 | ||||||
| Molex, Inc., Class A | 9,899 | 232,132 | ||||||
| 239,059 | ||||||||
| ENERGY EQUIPMENT AND SERVICES — 0.5% | ||||||||
| Schlumberger Ltd. | 317 | 22,168 | ||||||
| FOOD PRODUCTS — 2.2% | ||||||||
| Kraft Foods, Inc., Class A | 847 | 32,195 | ||||||
Ralcorp Holdings, Inc.(2) | 1,015 | 75,201 | ||||||
| 107,396 | ||||||||
| GAS UTILITIES — 1.4% | ||||||||
| AGL Resources, Inc. | 1,749 | 68,596 | ||||||
| HEALTH CARE EQUIPMENT AND SUPPLIES — 2.5% | ||||||||
CareFusion Corp.(2) | 1,395 | 36,172 | ||||||
| Medtronic, Inc. | 929 | 36,408 | ||||||
| Stryker Corp. | 393 | 21,804 | ||||||
| Zimmer Holdings, Inc. | 380 | 24,426 | ||||||
| 118,810 | ||||||||
| HOTELS, RESTAURANTS AND LEISURE — 0.7% | ||||||||
| Carnival Corp. | 1,044 | 33,492 | ||||||
| HOUSEHOLD DURABLES — 0.4% | ||||||||
| Whirlpool Corp. | 259 | 19,907 | ||||||
| HOUSEHOLD PRODUCTS — 0.7% | ||||||||
| Procter & Gamble Co. (The) | 489 | 32,866 | ||||||
| INDUSTRIAL CONGLOMERATES — 3.0% | ||||||||
| Koninklijke Philips Electronics NV | 3,499 | 71,205 | ||||||
| Tyco International Ltd. | 1,325 | 74,438 | ||||||
| 145,643 | ||||||||
| INSURANCE — 1.2% | ||||||||
| Chubb Corp. (The) | 351 | 24,257 | ||||||
| MetLife, Inc. | 845 | 31,561 | ||||||
| 55,818 | ||||||||
| MACHINERY — 0.7% | ||||||||
Oshkosh Corp.(2) | 1,549 | 35,890 | ||||||
| MEDIA — 1.1% | ||||||||
| Time Warner Cable, Inc. | 657 | 53,545 | ||||||
| METALS AND MINING — 3.3% | ||||||||
| BHP Billiton plc ADR | 2,603 | 159,772 | ||||||
| MULTI-UTILITIES — 1.0% | ||||||||
| PG&E Corp. | 1,072 | 46,535 | ||||||
| MULTILINE RETAIL — 0.3% | ||||||||
| Target Corp. | 222 | 12,936 | ||||||
| OIL, GAS AND CONSUMABLE FUELS — 8.9% | ||||||||
| DCP Midstream Partners LP | 459 | 21,041 | ||||||
| Enbridge Energy Partners LP, Class A | 6,982 | 216,232 | ||||||
| Imperial Oil Ltd. | 971 | 44,074 | ||||||
| Spectra Energy Partners LP | 686 | 21,918 | ||||||
| Total S.A. ADR | 1,701 | 86,955 | ||||||
Ultra Petroleum Corp.(2) | 722 | 16,339 | ||||||
| Williams Partners LP | 348 | 19,693 | ||||||
| 426,252 | ||||||||
10
| Shares | Value | |||||||
| PHARMACEUTICALS — 2.2% | ||||||||
Mylan, Inc.(2) | 1,775 | $41,624 | ||||||
| Pfizer, Inc. | 1,049 | 23,770 | ||||||
| Teva Pharmaceutical Industries Ltd. ADR | 936 | 42,176 | ||||||
| 107,570 | ||||||||
| REAL ESTATE INVESTMENT TRUSTS (REITs) — 2.5% | ||||||||
| American Tower Corp. | 1,926 | 121,376 | ||||||
| ROAD AND RAIL — 0.5% | ||||||||
| Norfolk Southern Corp. | 336 | 22,119 | ||||||
| SEMICONDUCTORS AND SEMICONDUCTOR EQUIPMENT — 0.9% | ||||||||
| Applied Materials, Inc. | 3,407 | 42,383 | ||||||
| SPECIALTY RETAIL — 3.0% | ||||||||
| Lowe’s Cos., Inc. | 3,826 | 120,060 | ||||||
| Staples, Inc. | 1,582 | 25,597 | ||||||
| 145,657 | ||||||||
| THRIFTS AND MORTGAGE FINANCE — 1.3% | ||||||||
| Capitol Federal Financial, Inc. | 5,130 | 60,842 | ||||||
| TRADING COMPANIES AND DISTRIBUTORS — 3.1% | ||||||||
Rush Enterprises, Inc., Class B(2) | 8,529 | 148,319 | ||||||
| WIRELESS TELECOMMUNICATION SERVICES — 3.1% | ||||||||
| Rogers Communications, Inc., B Shares | 923 | 36,643 | ||||||
| Telephone & Data Systems, Inc. | 1,804 | 41,763 | ||||||
| Vodafone Group plc ADR | 2,574 | 71,222 | ||||||
| 149,628 | ||||||||
TOTAL COMMON STOCKS (Cost $3,082,001) | 3,380,842 | |||||||
Principal Amount | ||||||||
Convertible Bonds(1) — 8.5% | ||||||||
| PAPER AND FOREST PRODUCTS — 2.1% | ||||||||
| Rayonier TRS Holdings, Inc., 4.50%, 8/15/15 | $73,000 | 101,835 | ||||||
| REAL ESTATE INVESTMENT TRUSTS (REITs) — 6.4% | ||||||||
| Annaly Capital Management, Inc., 4.00%, 2/15/15 | 69,000 | 80,558 | ||||||
| National Retail Properties, Inc., 3.95%, 9/15/26 | 194,000 | 222,857 | ||||||
| 303,415 | ||||||||
TOTAL CONVERTIBLE BONDS (Cost $396,283) | 405,250 | |||||||
| Shares | Value | |||||||
Exchange-Traded Funds(1) — 4.2% | ||||||||
| iShares Russell 1000 Value Index Fund | 1,846 | $129,349 | ||||||
| Market Vectors Gold Miners | 999 | 49,521 | ||||||
Market Vectors Pharmaceutical ETF(2) | 616 | 23,691 | ||||||
TOTAL EXCHANGE-TRADED FUNDS (Cost $198,840) | 202,561 | |||||||
Temporary Cash Investments(1) — 14.8% | ||||||||
| SSgA U.S. Government Money Market Fund (Cost $705,831) | 705,831 | 705,831 | ||||||
TOTAL INVESTMENT SECURITIES BEFORE SECURITIES SOLD SHORT — 98.1% (Cost $4,382,955) | 4,694,484 | |||||||
| Securities Sold Short — (83.3)% | ||||||||
| Common Stocks Sold Short — (68.3)% | ||||||||
| AEROSPACE AND DEFENSE — (6.3)% | ||||||||
| Boeing Co. (The) | (1,048 | ) | (77,940 | ) | ||||
| HEICO Corp. | (3,170 | ) | (163,540 | ) | ||||
| Lockheed Martin Corp. | (673 | ) | (60,476 | ) | ||||
| (301,956 | ) | |||||||
| BEVERAGES — (1.4)% | ||||||||
| PepsiCo, Inc. | (1,024 | ) | (67,942 | ) | ||||
| BIOTECHNOLOGY — (1.0)% | ||||||||
| Amgen, Inc. | (690 | ) | (46,913 | ) | ||||
| CAPITAL MARKETS — (2.9)% | ||||||||
| Ameriprise Financial, Inc. | (763 | ) | (43,590 | ) | ||||
| Bank of New York Mellon Corp. (The) | (2,137 | ) | (51,566 | ) | ||||
| BlackRock, Inc. | (217 | ) | (44,463 | ) | ||||
| (139,619 | ) | |||||||
| CHEMICALS — (0.6)% | ||||||||
| Monsanto Co. | (361 | ) | (28,793 | ) | ||||
| COMMERCIAL BANKS — (1.1)% | ||||||||
| Fifth Third Bancorp. | (3,812 | ) | (53,559 | ) | ||||
| COMMERCIAL SERVICES AND SUPPLIES — (2.6)% | ||||||||
| Waste Management, Inc. | (3,609 | ) | (126,171 | ) | ||||
| COMPUTERS AND PERIPHERALS — (0.2)% | ||||||||
| Hewlett-Packard Co. | (307 | ) | (7,316 | ) | ||||
| DIVERSIFIED TELECOMMUNICATION SERVICES — (3.9)% | ||||||||
| BCE, Inc. | (909 | ) | (36,414 | ) | ||||
| Verizon Communications, Inc. | (3,946 | ) | (150,856 | ) | ||||
| (187,270 | ) | |||||||
| ELECTRIC UTILITIES — (2.4)% | ||||||||
| Southern Co. (The) | (2,546 | ) | (114,392 | ) | ||||
11
| Shares | Value | |||||||
| ELECTRICAL EQUIPMENT — (1.4)% | ||||||||
| Hubbell, Inc., Class B | (856 | ) | $(67,265 | ) | ||||
| ELECTRONIC EQUIPMENT, INSTRUMENTS AND COMPONENTS — (4.9)% | ||||||||
| Molex, Inc. | (8,285 | ) | (232,974 | ) | ||||
| ENERGY EQUIPMENT AND SERVICES — (0.5)% | ||||||||
| Halliburton Co. | (663 | ) | (22,005 | ) | ||||
| FOOD PRODUCTS — (2.3)% | ||||||||
| ConAgra Foods, Inc. | (2,840 | ) | (74,579 | ) | ||||
| Unilever NV | (971 | ) | (33,043 | ) | ||||
| (107,622 | ) | |||||||
| HEALTH CARE PROVIDERS AND SERVICES — (0.8)% | ||||||||
| AmerisourceBergen Corp. | (592 | ) | (23,490 | ) | ||||
| McKesson Corp. | (144 | ) | (12,639 | ) | ||||
| (36,129 | ) | |||||||
| HOTELS, RESTAURANTS AND LEISURE — (0.7)% | ||||||||
| Royal Caribbean Cruises Ltd. | (1,136 | ) | (33,433 | ) | ||||
| INSURANCE — (1.6)% | ||||||||
| Berkshire Hathaway, Inc., Class B | (569 | ) | (46,174 | ) | ||||
| Prudential Financial, Inc. | (505 | ) | (32,012 | ) | ||||
| (78,186 | ) | |||||||
| MACHINERY — (2.2)% | ||||||||
| Deere & Co. | (629 | ) | (50,886 | ) | ||||
| Parker Hannifin Corp. | (620 | ) | (52,421 | ) | ||||
| (103,307 | ) | |||||||
| MEDIA — (1.1)% | ||||||||
| Comcast Corp., Class A | (1,787 | ) | (53,628 | ) | ||||
| METALS AND MINING — (3.3)% | ||||||||
| BHP Billiton Ltd. ADR | (2,200 | ) | (159,280 | ) | ||||
| MULTILINE RETAIL — (0.9)% | ||||||||
| Sears Holdings Corp. | (637 | ) | (42,201 | ) | ||||
| OIL, GAS AND CONSUMABLE FUELS — (7.5)% | ||||||||
| ConocoPhillips | (1,094 | ) | (83,155 | ) | ||||
| Copano Energy LLC | (1,796 | ) | (64,117 | ) | ||||
| Enbridge Energy Management LLC | (6,719 | ) | (213,933 | ) | ||||
| (361,205 | ) | |||||||
| PHARMACEUTICALS — (1.8)% | ||||||||
| Watson Pharmaceuticals, Inc. | (1,256 | ) | (84,227 | ) | ||||
| REAL ESTATE INVESTMENT TRUSTS (REITs) — (9.8)% | ||||||||
| Annaly Capital Management, Inc. | (4,890 | ) | (77,360 | ) | ||||
| Equity Residential | (1,133 | ) | (70,948 | ) | ||||
| National Retail Properties, Inc. | (8,174 | ) | (222,251 | ) | ||||
| Rayonier, Inc. | (2,277 | ) | (100,393 | ) | ||||
| (470,952 | ) | |||||||
| SEMICONDUCTORS AND SEMICONDUCTOR EQUIPMENT — (0.9)% | ||||||||
| Intel Corp. | (1,074 | ) | (30,190 | ) | ||||
| KLA-Tencor Corp. | (229 | ) | (12,462 | ) | ||||
| (42,652 | ) | |||||||
| SPECIALTY RETAIL — (2.3)% | ||||||||
| Home Depot, Inc. (The) | (2,213 | ) | (111,336 | ) | ||||
| TRADING COMPANIES AND DISTRIBUTORS — (3.0)% | ||||||||
| Rush Enterprises, Inc., Class A | (6,803 | ) | (144,360 | ) | ||||
| WIRELESS TELECOMMUNICATION SERVICES — (0.9)% | ||||||||
| United States Cellular Corp. | (1,044 | ) | (42,731 | ) | ||||
TOTAL COMMON STOCKS SOLD SHORT (Proceeds $3,093,659) | (3,267,424 | ) | ||||||
| Exchange-Traded Funds Sold Short — (15.0)% | ||||||||
| Consumer Discretionary Select Sector SPDR Fund | (593 | ) | (26,744 | ) | ||||
| Consumer Staples Select Sector SPDR Fund | (975 | ) | (33,228 | ) | ||||
| Industrial Select Sector SPDR Fund | (2,592 | ) | (96,993 | ) | ||||
| iShares Cohen & Steers Realty Majors Index Fund | (655 | ) | (50,199 | ) | ||||
| iShares Dow Jones US Medical Devices Index Fund | (1,222 | ) | (82,901 | ) | ||||
| iShares Russell 1000 Growth Index Fund | (1,955 | ) | (129,186 | ) | ||||
| iShares S&P Global Energy Sector Index Fund | (1,160 | ) | (46,133 | ) | ||||
| SPDR Gold Trust | (307 | ) | (49,777 | ) | ||||
| SPDR S&P Regional Banking ETF | (3,587 | ) | (102,122 | ) | ||||
| United States Natural Gas Fund LP | (973 | ) | (15,490 | ) | ||||
| Utilities Select Sector SPDR Fund | (2,418 | ) | (84,751 | ) | ||||
TOTAL EXCHANGE-TRADED FUNDS SOLD SHORT (Proceeds $678,459) | (717,524 | ) | ||||||
TOTAL SECURITIES SOLD SHORT — (83.3)% (Proceeds $3,772,118) | (3,984,948 | ) | ||||||
| OTHER ASSETS AND LIABILITIES — 85.2% | 4,076,765 | |||||||
| TOTAL NET ASSETS — 100.0% | $4,786,301 | |||||||
12
| Forward Foreign Currency Exchange Contracts | |||||
| Contracts to Sell | Counterparty | Settlement Date | Value | Unrealized Gain (Loss) | |
| 40,251 | CAD for USD | UBS AG | 4/30/12 | $40,331 | $34 |
| 85,700 | EUR for USD | UBS AG | 4/30/12 | 114,311 | (278) |
| 41,144 | GBP for USD | Credit Suisse AG | 4/30/12 | 65,800 | (439) |
| $220,442 | $(683) | ||||
(Value on Settlement Date $219,759)
| Contracts to Buy | Counterparty | Settlement Date | Value | Unrealized Gain (Loss) | |
| 1,460 | CAD for USD | UBS AG | 4/30/12 | $1,463 | $4 |
| 2,116 | EUR for USD | UBS AG | 4/30/12 | 2,822 | 1 |
| 1,093 | GBP for USD | Credit Suisse AG | 4/30/12 | 1,747 | 8 |
| $6,032 | $13 | ||||
(Value on Settlement Date $6,019)
Notes to Schedule of Investments
| ADR = American Depositary Receipt |
| CAD = Canadian Dollar |
| ETF = Exchange-Traded Fund |
| EUR = Euro |
| GBP = British Pound |
| SPDR = Standard & Poor’s Depositary Receipts |
| USD = United States Dollar |
| (1) | Security, or a portion thereof, has been segregated at the custodian bank or on the fund’s records for collateral requirements on securities sold short. At period end, the aggregate value of securities pledged at the custodian bank was $2,845,576. |
| (2) | Non-income producing. |
See Notes to Financial Statements.
13
| MARCH 31, 2012 | ||||
| Assets | ||||
| Investment securities, at value (cost of $4,382,955) | $4,694,484 | |||
| Foreign currency holdings, at value (cost of $482) | 482 | |||
| Deposits with broker for securities sold short | 4,037,976 | |||
| Receivable for investments sold | 35,505 | |||
| Receivable for capital shares sold | 40,000 | |||
| Unrealized gain on forward foreign currency exchange contracts | 47 | |||
| Dividends and interest receivable | 7,493 | |||
| 8,815,987 | ||||
| Liabilities | ||||
| Securities sold short, at value (proceeds of $3,772,118) | 3,984,948 | |||
| Payable for investments purchased | 31,011 | |||
| Unrealized loss on forward foreign currency exchange contracts | 717 | |||
| Accrued management fees | 5,984 | |||
| Distribution and service fees payable | 611 | |||
| Dividend expense payable on securities sold short | 6,333 | |||
| Broker fees and charges payable on securities sold short | 82 | |||
| 4,029,686 | ||||
| Net Assets | $4,786,301 | |||
| Net Assets Consist of: | ||||
| Capital (par value and paid-in surplus) | $4,659,536 | |||
| Undistributed net realized gain | 28,734 | |||
| Net unrealized appreciation | 98,031 | |||
| $4,786,301 | ||||
| Net assets | Shares outstanding | Net asset value per share | |
| Investor Class, $0.01 Par Value | $3,118,060 | 302,183 | $10.32 |
| Institutional Class, $0.01 Par Value | $413,130 | 40,000 | $10.33 |
| A Class, $0.01 Par Value | $432,108 | 41,916 | $10.31* |
| C Class, $0.01 Par Value | $411,074 | 40,000 | $10.28 |
| R Class, $0.01 Par Value | $411,929 | 40,000 | $10.30 |
*Maximum offering price $10.94 (net asset value divided by 0.9425).
See Notes to Financial Statements.
14
FOR THE PERIOD ENDED MARCH 31, 2012(1) | ||||
| Investment Income (Loss) | ||||
| Income: | ||||
| Dividends (net of foreign taxes withheld of $306) | $43,122 | |||
| Interest | 1,264 | |||
| 44,386 | ||||
| Expenses: | ||||
| Dividend expense on securities sold short | 46,417 | |||
| Broker fees and charges on securities sold short | 13,775 | |||
| Management fees | 34,266 | |||
| Distribution and service fees: | ||||
| A Class | 428 | |||
| C Class | 1,683 | |||
| R Class | 843 | |||
| Directors’ fees and expenses | 66 | |||
| Other expenses | 94 | |||
| 97,572 | ||||
| Fees waived | (5,464 | ) | ||
| 92,108 | ||||
| Net investment income (loss) | (47,722 | ) | ||
| Realized and Unrealized Gain (Loss) | ||||
| Net realized gain (loss) on: | ||||
| Investment transactions | 254,002 | |||
| Securities sold short transactions | (180,322 | ) | ||
| Foreign currency transactions | 996 | |||
| 74,676 | ||||
| Change in net unrealized appreciation (depreciation) on: | ||||
| Investments | 311,529 | |||
| Securities sold short | (212,830 | ) | ||
| Translation of assets and liabilities in foreign currencies | (668 | ) | ||
| 98,031 | ||||
| Net realized and unrealized gain (loss) | 172,707 | |||
| Net Increase (Decrease) in Net Assets Resulting from Operations | $124,985 | |||
| (1) | October 31, 2011 (fund inception) through March 31, 2012. |
See Notes to Financial Statements.
15
PERIOD ENDED MARCH 31, 2012(1) | ||||
| Increase (Decrease) in Net Assets | ||||
| Operations | ||||
| Net investment income (loss) | $(47,722 | ) | ||
| Net realized gain (loss) | 74,676 | |||
| Change in net unrealized appreciation (depreciation) | 98,031 | |||
| Net increase (decrease) in net assets resulting from operations | 124,985 | |||
| Capital Share Transactions | ||||
| Net increase (decrease) in net assets from capital share transactions | 4,661,316 | |||
| Net increase (decrease) in net assets | 4,786,301 | |||
| Net Assets | ||||
| End of period | $4,786,301 | |||
| (1) | October 31, 2011 (fund inception) through March 31, 2012. |
See Notes to Financial Statements.
16
MARCH 31, 2012
1. Organization
American Century Capital Portfolios, Inc. (the corporation) is registered under the Investment Company Act of 1940, as amended (the 1940 Act), as an open-end management investment company and is organized as a Maryland corporation. Market Neutral Value Fund (the fund) is one fund in a series issued by the corporation. The fund is diversified as defined under the 1940 Act. The fund’s investment objective is to seek long-term capital growth, independent of equity market conditions. The fund buys, or takes long positions in, equity securities that have been identified as undervalued. The fund takes short positions in equity securities that have been identified as overvalued. The fund’s investment process is designed to maintain approximately equal dollar amounts invested in long and short positions at all times.
The fund is authorized to issue the Investor Class, the Institutional Class, the A Class, the C Class and the R Class. The A Class may incur an initial sales charge. The A Class and C Class may be subject to a contingent deferred sales charge. The share classes differ principally in their respective sales charges and distribution and shareholder servicing expenses and arrangements. The Institutional Class is made available to institutional shareholders or through financial intermediaries whose clients do not require the same level of shareholder and administrative services as shareholders of other classes. As a result, the Institutional Class is charged a lower unified management fee. All classes of the fund commenced sale on October 31, 2011, the fund’s inception date.
2. Significant Accounting Policies
The following is a summary of significant accounting policies consistently followed by the fund in preparation of its financial statements. The financial statements are prepared in conformity with accounting principles generally accepted in the United States of America, which may require management to make certain estimates and assumptions at the date of the financial statements. Actual results could differ from these estimates.
Investment Valuations — The fund determines the fair value of its investments and computes its net asset value per share as of the close of regular trading (usually 4 p.m. Eastern time) on the New York Stock Exchange (NYSE) on each day the NYSE is open.
Equity securities that are listed or traded on a domestic securities exchange are valued at the last reported sales price or at the official closing price as provided by the exchange. Equity securities traded on foreign securities exchanges are typically valued at the closing price on the exchange where primarily traded or as of the close of the NYSE, if that is earlier. If no last sales price is reported, or if local convention or regulation so provides, the mean of the latest bid and asked prices is used. Depending on local convention or regulation, securities traded over-the-counter are valued at the mean of the latest bid and asked prices, the last sales price, or the official closing price. In its determination of fair value, the fund may review several factors including: market information specific to a security; news developments in U.S. and foreign markets; the performance of particular U.S. and foreign securities, indices, comparable securities, American Depositary Receipts, Exchange-Traded Funds, and other relevant market indicators.
Debt securities maturing in greater than 60 days at the time of purchase are valued at the evaluated mean as provided by independent pricing services or at the mean of the most recent bid and asked prices as provided by investment dealers. Debt securities maturing within 60 days at the time of purchase may be valued at cost, plus or minus any amortized discount or premium or at the evaluated mean as provided by an independent pricing service. Evaluated mean prices are commonly derived through utilization of market models, which may consider, among other factors, trade data, quotations from dealers and active market makers, relevant yield curve and spread data, related sector levels, creditworthiness, and other relevant market information on the same or comparable securities.
17
Investments in open-end management investment companies are valued at the reported net asset value per share. Forward foreign currency exchange contracts are valued at the mean of the latest bid and asked prices of the forward currency rates as provided by an independent pricing service.
The value of investments initially expressed in foreign currencies is translated into U.S. dollars at prevailing exchange rates.
If the fund determines that the market price for a portfolio security is not readily available or the valuation methods mentioned above do not reflect a security’s fair value, such security is valued as determined in good faith by the Board of Directors or its designee, in accordance with procedures adopted by the Board of Directors. Circumstances that may cause the fund to use these procedures to value a security include, but are not limited to: a security has been declared in default; trading in a security has been halted during the trading day; there is a foreign market holiday and no trading occurred; or an event occurred between the close of a foreign exchange and the NYSE that may affect the value of a security.
Security Transactions — Security transactions are accounted for as of the trade date. Net realized gains and losses are determined on the identified cost basis, which is also used for federal income tax purposes.
Investment Income — Dividend income less foreign taxes withheld, if any, is recorded as of the ex-dividend date. Interest income is recorded on the accrual basis and includes accretion of discounts and amortization of premiums.
Securities Sold Short —The fund enters into short sales, which is selling securities it does not own, as part of its normal investment activities. Upon selling a security short, the fund will segregate cash, cash equivalents or other appropriate liquid securities in at least an amount equal to the current market value of the securities sold short until the fund replaces the borrowed security. Interest earned on segregated cash for securities sold short is reflected as interest income. The fund is required to pay any dividends or interest due on securities sold short. Such dividends and interest are recorded as an expense. The fund may pay fees or charges on the assets borrowed for securities sold short. Liabilities for securities sold short are valued daily and changes in value are recorded as unrealized appreciation (depreciation) on securities sold short. The fund records realized gain (loss) on a security sold short when it is terminated by the fund and includes as a component of realized gain (loss) on securities sold short transactions.
Foreign Currency Translations — All assets and liabilities initially expressed in foreign currencies are translated into U.S. dollars at prevailing exchange rates at period end. The fund may enter into spot foreign currency exchange contracts to facilitate transactions denominated in a foreign currency. Purchases and sales of investment securities, dividend and interest income, spot foreign currency exchange contracts, and expenses are translated at the rates of exchange prevailing on the respective dates of such transactions. Net realized and unrealized foreign currency exchange gains or losses related to investment securities are a component of net realized gain (loss) on investment transactions and change in net unrealized appreciation (depreciation) on investments, respectively.
Segregated Assets — In accordance with the 1940 Act, the fund segregates assets on its books and records to cover certain types of investments, including, but not limited to, futures contracts, forward commitments, when-issued securities, short sales, swap agreements and certain forward foreign currency exchange contracts. American Century Investment Management, Inc. (ACIM) (the investment advisor) monitors, on a daily basis, the securities segregated to ensure the fund designates a sufficient amount of liquid assets, marked-to-market daily. The fund may also receive assets or be required to pledge assets at the custodian bank or with a broker for margin requirements on futures contracts, short sales and swap agreements.
Income Tax Status — It is the fund’s policy to distribute substantially all net investment income and net realized gains to shareholders and to otherwise qualify as a regulated investment company under provisions of the Internal Revenue Code. All tax years for the fund remain subject to examination by tax authorities. At this time, management
18
believes there are no uncertain tax positions which, based on their technical merit, would not be sustained upon examination and for which it is reasonably possible that the total amounts of unrecognized tax benefits will significantly change in the next twelve months. Accordingly, no provision has been made for federal or state income taxes.
Multiple Class — All shares of the fund represent an equal pro rata interest in the net assets of the class to which such shares belong, and have identical voting, dividend, liquidation and other rights and the same terms and conditions, except for class specific expenses and exclusive rights to vote on matters affecting only individual classes. Income, non-class specific expenses, and realized and unrealized capital gains and losses of the fund are allocated to each class of shares based on their relative net assets.
Distributions to Shareholders — Distributions from net investment income, if any, are generally declared and paid quarterly. Distributions from net realized gains, if any, are generally declared and paid annually.
Indemnifications — Under the corporation’s organizational documents, its officers and directors are indemnified against certain liabilities arising out of the performance of their duties to the fund. In addition, in the normal course of business, the fund enters into contracts that provide general indemnifications. The maximum exposure under these arrangements is unknown as this would involve future claims that may be made against a fund. The risk of material loss from such claims is considered by management to be remote.
3. Fees and Transactions with Related Parties
Management Fees — The corporation has entered into a management agreement with ACIM, under which ACIM provides the fund with investment advisory and management services in exchange for a single, unified management fee (the fee) per class. The agreement provides that all expenses of managing and operating the fund, except distribution and service fees, expenses on securities sold short, brokerage expenses, taxes, interest, fees and expenses of the independent directors (including legal counsel fees), and extraordinary expenses, will be paid by ACIM. The fee is computed and accrued daily based on each class’s daily net assets and paid monthly in arrears. The annual management fee is 1.90% for the Investor Class, A Class, C Class and R Class and 1.70% for the Institutional Class. During the period ended March 31, 2012, the investment advisor voluntarily agreed to waive 0.30% of its management fee. The investment advisor expects the fee waiver to continue through July 31, 2013, and cannot terminate it without the approval of the Board of Directors. The total amount of the waiver for each class for the period October 31, 2011 (fund inception) through March 31, 2012 was $3,433, $506, $514, $505 and $506 for the Investor Class, Institutional Class, A Class, C Class and R Class, respectively. The effective annual management fee after waiver for each class for the period October 31, 2011 (fund inception) through March 31, 2012 was 1.60% for the Investor Class, A Class, C Class and R Class and 1.40% for the Institutional Class.
Distribution and Service Fees — The Board of Directors has adopted a separate Master Distribution and Individual Shareholder Services Plan for each of the A Class, C Class and R Class (collectively the plans), pursuant to Rule 12b-1 of the 1940 Act. The plans provide that the A Class will pay American Century Investment Services, Inc. (ACIS) an annual distribution and service fee of 0.25%. The plans provide that the C Class will pay ACIS an annual distribution and service fee of 1.00%, of which 0.25% is paid for individual shareholder services and 0.75% is paid for distribution services. The plans provide that the R Class will pay ACIS an annual distribution and service fee of 0.50%. The fees are computed and accrued daily based on each class’s daily net assets and paid monthly in arrears. The fees are used to pay financial intermediaries for distribution and individual shareholder services. Fees incurred under the plans during the period October 31, 2011 (fund inception) through March 31, 2012 are detailed in the Statement of Operations.
Acquired Fund Fees and Expenses — The fund may invest in mutual funds, exchange-traded funds, and business development companies (the acquired funds). The fund will indirectly realize its pro rata share of the fees and expenses of the acquired funds in which it invests. These indirect fees and expenses are not paid out of the fund’s assets but are reflected in the return realized by the fund on its investment in the acquired funds.
19
Related Parties — Certain officers and directors of the corporation are also officers and/or directors of American Century Companies, Inc., the parent of the corporation’s investment advisor, ACIM, the distributor of the corporation, ACIS, and the corporation’s transfer agent, American Century Services, LLC. ACIM and the fund’s portfolio managers own 34% and 44%, respectively, of the outstanding shares of the fund.
4. Investment Transactions
Purchases and sales of investment securities and securities sold short, excluding short-term investments, for the period October 31, 2011 (fund inception) through March 31, 2012 were $10,090,825 and $10,266,600, respectively.
5. Capital Share Transactions
Transactions in shares of the fund were as follows:
Period ended March 31, 2012(1) | |||||||
| Shares | Amount | ||||||
| Investor Class/Shares Authorized | 100,000,000 | ||||||
| Sold | 363,789 | $3,667,749 | |||||
| Redeemed | (61,606 | ) | (625,965 | ) | |||
| 302,183 | 3,041,784 | ||||||
| Institutional Class/Shares Authorized | 50,000,000 | ||||||
| Sold | 40,000 | 400,000 | |||||
| A Class/Shares Authorized | 50,000,000 | ||||||
| Sold | 41,916 | 419,532 | |||||
| C Class/Shares Authorized | 50,000,000 | ||||||
| Sold | 40,000 | 400,000 | |||||
| R Class/Shares Authorized | 50,000,000 | ||||||
| Sold | 40,000 | 400,000 | |||||
| Net increase (decrease) | 464,099 | $4,661,316 | |||||
| (1) | October 31, 2011 (fund inception) through March 31, 2012. |
6. Fair Value Measurements
The fund’s securities valuation process is based on several considerations and may use multiple inputs to determine the fair value of the positions held by the fund. In conformity with accounting principles generally accepted in the United States of America, the inputs used to determine a valuation are classified into three broad levels as follows:
| • | Level 1 valuation inputs consist of unadjusted quoted prices in an active market for identical securities; |
| • | Level 2 valuation inputs consist of direct or indirect observable market data (including quoted prices for similar securities, evaluations of subsequent market events, interest rates, prepayment speeds, credit risk, etc.); or |
| • | Level 3 valuation inputs consist of unobservable data (including a fund’s own assumptions). |
The level classification is based on the lowest level input that is significant to the fair valuation measurement. The valuation inputs are not necessarily an indication of the risks associated with investing in these securities or other financial instruments.
20
The following is a summary of the level classifications as of period end. The Schedule of Investments provides additional information on the fund’s portfolio holdings.
| Level 1 | Level 2 | Level 3 | |
| Investment Securities | |||
| Domestic Common Stocks | $2,794,357 | — | — |
| Foreign Common Stocks | 586,485 | — | — |
| Convertible Bonds | — | $405,250 | — |
| Exchange-Traded Funds | 202,561 | — | — |
| Temporary Cash Investments | 705,831 | — | — |
| Total Value of Investment Securities | $4,289,234 | $405,250 | — |
| Securities Sold Short | |||
| Domestic Common Stocks | $(3,038,687) | — | — |
| Foreign Common Stocks | (228,737) | — | — |
| Exchange-Traded Funds | (717,524) | — | — |
| Total Value of Securities Sold Short | $(3,984,948) | — | — |
| Other Financial Instruments | |||
Total Unrealized Gain (Loss) on Forward Foreign Currency Exchange Contracts | — | $(670) | — |
7. Derivative Instruments
Foreign Currency Risk — The fund is subject to foreign currency exchange rate risk in the normal course of pursuing its investment objectives. The value of foreign investments held by a fund may be significantly affected by changes in foreign currency exchange rates. The dollar value of a foreign security generally decreases when the value of the dollar rises against the foreign currency in which the security is denominated and tends to increase when the value of the dollar declines against such foreign currency. A fund may enter into forward foreign currency exchange contracts to reduce a fund’s exposure to foreign currency exchange rate fluctuations. The net U.S. dollar value of foreign currency underlying all contractual commitments held by a fund and the resulting unrealized appreciation or depreciation are determined daily. Realized gain or loss is recorded upon the termination of the contract. Net realized and unrealized gains or losses occurring during the holding period of forward foreign currency exchange contracts are a component of net realized gain (loss) on foreign currency transactions and change in net unrealized appreciation (depreciation) on translation of assets and liabilities in foreign currencies, respectively. A fund bears the risk of an unfavorable change in the foreign currency exchange rate underlying the forward contract. Additionally, losses, up to the fair value, may arise if the counterparties do not perform under the contract terms. The foreign currency risk derivative instruments held at period end as disclosed on the Schedule of Investments are indicative of the fund’s typical volume during the period.
The value of foreign currency risk derivative instruments as of March 31, 2012, is disclosed on the Statement of Assets and Liabilities as an asset of $47 in unrealized gain on forward foreign currency exchange contracts and as a liability of $717 in unrealized loss on forward foreign currency exchange contracts. For the period ended March 31, 2012, the effect of foreign currency risk derivative instruments on the Statement of Operations was $1,003 in net realized gain (loss) on foreign currency transactions and $(670) in change in net unrealized appreciation (depreciation) on translation of assets and liabilities in foreign currencies.
21
8. Risk Factors
The fund’s investment process may result in high portfolio turnover, which could mean high transaction costs, affecting both performance and capital gains tax liabilities to investors.
The fund is subject to short sales risk. If the market price of a security increases after the fund borrows the security, the fund may suffer a loss when it replaces the borrowed security at the higher price. Any loss will be increased by the amount of compensation, interest or dividends, and transaction costs the fund must pay to the lender of the borrowed security.
If the fund is overweighted in a stock or sector, any negative development related to that stock or sector will have a greater impact on the fund than other funds that are not overweighted in that stock or sector.
There are certain risks involved in investing in foreign securities. These risks include those resulting from future adverse political, social and economic developments, fluctuations in currency exchange rates, the possible imposition of exchange controls, and other foreign laws or restrictions.
9. Federal Tax Information
The book-basis character of distributions made during the year from net investment income or net realized gains may differ from their ultimate characterization for federal income tax purposes. These differences reflect the differing character of certain income items and net realized gains and losses for financial statement and tax purposes, and may result in reclassification among certain capital accounts on the financial statements. There were no distributions paid by the fund during the period October 31, 2011 (fund inception) through March 31, 2012.
As of March 31, 2012, the federal tax cost of investments and the components of distributable earnings on a tax-basis were as follows:
| Federal tax cost of investments | $4,398,140 | |||
| Gross tax appreciation of investments | $316,911 | |||
| Gross tax depreciation of investments | (20,567 | ) | ||
| Net tax appreciation (depreciation) of investments | $296,344 | |||
| Net tax appreciation (depreciation) on securities sold short | $(232,323 | ) | ||
Net tax appreciation (depreciation) on derivatives and translation of assets and liabilities in foreign currencies | — | |||
| Net tax appreciation (depreciation) | $64,021 | |||
| Undistributed ordinary income | $62,744 |
The difference between book-basis and tax-basis cost and unrealized appreciation (depreciation) is attributable primarily to the tax deferral of losses on wash sales and the realization for tax purposes of unrealized gains (losses) on certain foreign currency exchange contracts.
22
| For a Share Outstanding Throughout the Period Indicated | |||||||||||||
| Per-Share Data | Ratios and Supplemental Data | ||||||||||||
| Income From Investment Operations: | Net Asset Value, End of Period | Ratio to Average Net Assets of: | |||||||||||
Net Asset Value, Beginning of Period | Net Investment Income (Loss)(1) | Net Realized and Unrealized Gain (Loss) | Total From Investment Operations | Total Return(2) | Operating Expenses(5) | Operating Expenses (before expense waiver)(5) | Operating Expenses (excluding expenses on securities sold short(5) | Net Investment Income (Loss) | Net Investment Income (Loss) (before expense waiver) | Portfolio Turnover Rate | Net Assets, End of Period (in thousands) | ||
| Investor Class | |||||||||||||
2012(3) | $10.00 | (0.11) | 0.43 | 0.32 | $10.32 | 3.20% | 4.92%(4) | 5.22%(4) | 1.61%(4) | (2.49)%(4) | (2.79)%(4) | 292% | $3,118 |
| Institutional Class | |||||||||||||
2012(3) | $10.00 | (0.09) | 0.42 | 0.33 | $10.33 | 3.30% | 4.72%(4) | 5.02%(4) | 1.41%(4) | (2.29)%(4) | (2.59)%(4) | 292% | $413 |
| A Class | |||||||||||||
2012(3) | $10.00 | (0.11) | 0.42 | 0.31 | $10.31 | 3.10% | 5.17%(4) | 5.47%(4) | 1.86%(4) | (2.74)%(4) | (3.04)%(4) | 292% | $432 |
| C Class | |||||||||||||
2012(3) | $10.00 | (0.14) | 0.42 | 0.28 | $10.28 | 2.80% | 5.92%(4) | 6.22%(4) | 2.61%(4) | (3.49)%(4) | (3.79)%(4) | 292% | $411 |
| R Class | |||||||||||||
2012(3) | $10.00 | (0.12) | 0.42 | 0.30 | $10.30 | 3.00% | 5.42%(4) | 5.72%(4) | 2.11%(4) | (2.99)%(4) | (3.29)%(4) | 292% | $412 |
Notes to Financial Highlights
| (1) | Computed using average shares outstanding throughout the period. |
| (2) | Total returns are calculated based on the net asset value of the last business day and do not reflect applicable sales charges, if any. Total returns for periods less than one year are not annualized. |
| (3) | October 31, 2011 (fund inception) through March 31, 2012. |
| (4) | Annualized. |
| (5) | Ratio of operating expenses to average net assets does not include any fees and expenses of the acquired funds. |
See Notes to Financial Statements.
23
To the Board of Directors and Shareholders of
American Century Capital Portfolios, Inc.:
We have audited the accompanying statement of assets and liabilities, including the schedule of investments, of Market Neutral Value Fund, one of the funds constituting American Century Capital Portfolios, Inc. (the “Corporation”) as of March 31, 2012, and the related statement of operations, the statement of changes in net assets, and the financial highlights for the period October 31, 2011 (fund inception) through March 31, 2012. These financial statements and financial highlights are the responsibility of the Corporation’s management. Our responsibility is to express an opinion on these financial statements and financial highlights based on our audit.
We conducted our audit in accordance with the standards of the Public Company Accounting Oversight Board (United States). Those standards require that we plan and perform the audit to obtain reasonable assurance about whether the financial statements and financial highlights are free of material misstatement. The Corporation is not required to have, nor were we engaged to perform, an audit of its internal control over financial reporting. Our audit included consideration of internal control over financial reporting as a basis for designing audit procedures that are appropriate in the circumstances, but not for the purpose of expressing an opinion on the effectiveness of the Corporation’s internal control over financial reporting. Accordingly, we express no such opinion. An audit also includes examining, on a test basis, evidence supporting the amounts and disclosures in the financial statements, assessing the accounting principles used and significant estimates made by management, as well as evaluating the overall financial statement presentation. Our procedures included confirmation of securities owned as of March 31, 2012, by correspondence with the custodian and brokers; where replies were not received from brokers, we performed other auditing procedures. We believe that our audit provides a reasonable basis for our opinion.
In our opinion, such financial statements and financial highlights referred to above present fairly, in all material respects, the financial position of Market Neutral Value Fund of American Century Capital Portfolios, Inc., as of March 31, 2012, the results of its operations, the changes in its net assets, and the financial highlights for the period October 31, 2011 (fund inception) through March 31, 2012, in conformity with accounting principles generally accepted in the United States of America.
Deloitte & Touche LLP
Kansas City, Missouri
May 16, 2012
24
The Board of Directors
The individuals listed below serve as directors of the funds. Each director will continue to serve in this capacity until death, retirement, resignation or removal from office. The mandatory retirement age for directors who are not “interested persons,” as that term is defined in the Investment Company Act (independent directors), is 72. However, the mandatory retirement age for an individual director may be extended with the approval of the remaining independent directors.
Mr. Thomas is an “interested person” because he currently serves as President and Chief Executive Officer of American Century Companies, Inc. (ACC), the parent company of American Century Investment Management, Inc. (ACIM or the advisor). Mr. Fink is an “interested person” because he currently serves as Executive Vice President and Chief Operating Officer of ACC.
The other directors (more than three-fourths of the total number) are independent; that is, they have never been employees, directors or officers of, and have no financial interest in, ACC or any of its wholly owned, direct or indirect, subsidiaries, including ACIM, American Century Investment Services, Inc. (ACIS) and American Century Services, LLC (ACS). The directors serve in this capacity for seven (in the case of Mr. Thomas, 15) registered investment companies in the American Century Investments family of funds.
The following table presents additional information about the directors. The mailing address for each director is 4500 Main Street, Kansas City, Missouri 64111.
Name (Year of Birth) | Position(s) Held with Funds | Length of Time Served | Principal Occupation(s) During Past 5 Years | Number of American Century Portfolios Overseen by Director | Other Directorships Held During Past 5 Years | |
| Independent Directors | ||||||
Thomas A. Brown (1940) | Director | Since 1980 | Managing Member, Associated Investments, LLC (real estate investment company); Brown Cascade Properties, LLC (real estate investment company) (2001 to 2009) | 66 | None | |
Andrea C. Hall (1945) | Director | Since 1997 | Retired | 66 | None | |
Jan M. Lewis (1957) | Director | Since 2011 | President and Chief Executive Officer, Catholic Charities of Northeast Kansas (human services organization) (2006 to present) | 66 | None | |
James A. Olson (1942) | Director | Since 2007 | Member, Plaza Belmont LLC (private equity fund manager) | 66 | Saia, Inc. (2002 to 2012) and Entertainment Properties Trust | |
Donald H. Pratt (1937) | Director and Chairman of the Board | Since 1995 (Chairman since 2005) | Chairman and Chief Executive Officer, Western Investments, Inc. (real estate company) | 66 | None | |
25
Name (Year of Birth) | Position(s) Held with Funds | Length of Time Served | Principal Occupation(s) During Past 5 Years | Number of American Century Portfolios Overseen by Director | Other Directorships Held During Past 5 Years | |
| Independent Directors | ||||||
M. Jeannine Strandjord (1945) | Director | Since 1994 | Retired | 66 | DST Systems Inc., Euronet Worldwide Inc., and Charming Shoppes, Inc. (2006 to 2010) | |
John R. Whitten (1946) | Director | Since 2008 | Project Consultant, Celanese Corp. (industrial chemical company) | 66 | Rudolph Technologies, Inc. | |
Stephen E. Yates (1948) | Director | Since 2012 | Retired; Executive Vice President, Technology & Operations, KeyCorp. (computer services) (2004 to 2010) | 66 | Applied Industrial Technology (2001 to 2010) | |
| Interested Directors | ||||||
Barry Fink (1955) | Director and Executive Vice President | Since 2012 (Executive Vice President since 2007) | Chief Operating Officer and Executive Vice President, ACC (September 2007 to present); President, ACS (October 2007 to present); Managing Director, Morgan Stanley (2000 to 2007). Also serves as Manager, ACS and Director, ACC and certain ACC subsidiaries | 66 | None | |
Jonathan S. Thomas (1963) | Director and President | Since 2007 | President and Chief Executive Officer, ACC (March 2007 to present); Chief Administrative Officer, ACC (February 2006 to February 2007); Executive Vice President, ACC (November 2005 to February 2007). Also serves as Chief Executive Officer and Manager, ACS; Executive Vice President, ACIM; Director, ACC, ACIM and other ACC subsidiaries | 108 | None | |
26
Officers
The following table presents certain information about the executive officers of the funds. Each officer serves as an officer for each of the 15 investment companies in the American Century family of funds, unless otherwise noted. No officer is compensated for his or her service as an officer of the funds. The listed officers are interested persons of the funds and are appointed or re-appointed on an annual basis. The mailing address for each officer listed below is 4500 Main Street, Kansas City, Missouri 64111.
Name (Year of Birth) | Offices with the Funds | Principal Occupation(s) During the Past Five Years |
Jonathan S. Thomas (1963) | Director and President since 2007 | President and Chief Executive Officer, ACC (March 2007 to present); Chief Administrative Officer, ACC (February 2006 to February 2007); Executive Vice President, ACC (November 2005 to February 2007). Also serves as Chief Executive Officer and Manager, ACS; Executive Vice President, ACIM; Director, ACC, ACIM and other ACC subsidiaries |
Barry Fink (1955) | Director since 2012 and Executive Vice President since 2007 | Chief Operating Officer and Executive Vice President, ACC (September 2007 to present); President, ACS (October 2007 to present); Managing Director, Morgan Stanley (2000 to 2007). Also serves as Manager, ACS and Director, ACC and certain ACC subsidiaries |
Maryanne L. Roepke (1956) | Chief Compliance Officer since 2006 and Senior Vice President since 2000 | Chief Compliance Officer, American Century funds, ACIM and ACS (August 2006 to present). Also serves as Senior Vice President, ACS |
Charles A. Etherington (1957) | General Counsel since 2007 and Senior Vice President since 2006 | Attorney, ACC (February 1994 to present); Vice President, ACC (November 2005 to present), General Counsel, ACC (March 2007 to present); Also serves as General Counsel, ACIM, ACS, ACIS and other ACC subsidiaries; and Senior Vice President, ACIM and ACS |
C. Jean Wade (1964) | Vice President, Treasurer and Chief Financial Officer since 2012 | Vice President, ACS (February 2000 to present) |
Robert J. Leach (1966) | Vice President since 2006 and Assistant Treasurer since 2012 | Vice President, ACS (February 2000 to present) |
David H. Reinmiller (1963) | Vice President since 2000 | Attorney, ACC (January 1994 to present); Associate General Counsel, ACC (January 2001 to present). Also serves as Vice President, ACIM and ACS |
Ward D. Stauffer (1960) | Secretary since 2005 | Attorney, ACC (June 2003 to present) |
The Statement of Additional Information has additional information about the fund’s directors and is available without charge, upon request, by calling 1-800-345-2021.
27
At a meeting held on June 9, 2011, the Fund’s Board of Directors unanimously approved the initial management agreement pursuant to which American Century Investment Management, Inc. (the “Advisor”) acts as the investment advisor for the Fund. Under Section 15(c) of the Investment Company Act, new contracts for investment advisory services are required to be approved by a majority of a fund’s independent directors (the “Directors”) each year and to be evaluated on an annual basis thereafter.
In advance of the Board’s consideration, the Advisor provided information concerning the fund. The materials circulated in advance of the meeting and the discussions held at the meeting detailed the investment objective and strategy proposed to be utilized by the Advisor, the Fund’s characteristics and key attributes, the rationale for launching the Fund, the experience of the staff designated to manage the Fund, the proposed pricing, and the markets in which the Fund would be sold. The information considered and the discussions held included, but were not limited to:
| • | the nature, extent, and quality of investment management, shareholder services, and other services to be provided by the Advisor to the Fund; |
| • | the wide range of other programs and services the Advisor would provide to the Fund and its shareholders on a routine and non-routine basis; |
| • | the Fund’s proposed investment objective and strategy, including a discussion of the Fund’s anticipated investment performance and proposed benchmark; |
| • | data comparing the cost of owning the Fund to the cost of owning similar funds; |
| • | the Advisor’s compliance policies, procedures, and regulatory experience; |
| • | data comparing services provided and charges to other investment management clients of the Advisor; and |
| • | consideration of collateral benefits derived by the Advisor from the management of the Fund and any potential economies of scale relating thereto. |
American Century Investments’ funds utilize a unified management fee structure. Under the unified fee structure, the Advisor is responsible for providing all investment advisory, custody, audit, administrative, compliance, recordkeeping, marketing and shareholder services, or arranging and supervising third parties to provide such services. By contrast, most other funds are charged a variety of fees, including an investment advisory fee, a transfer agency fee, an administrative fee, distribution charges and other expenses. Other than their investment advisory fees and Rule 12b-1 distribution fees, all other components of the total fees charged by these other funds may be increased without shareholder approval. The Advisor and Board believe the unified fee structure is a benefit to fund shareholders because it clearly discloses to shareholders the cost of owning fund shares, and, because the unified fee cannot be increased without a vote of Fund shareholders, it shifts to the Advisor the risk of increased costs of operating the Fund and provides a direct incentive to minimize administrative inefficiencies.
28
When considering the approval of the management agreement for the Fund, the Board considered the entrepreneurial risk that the Advisor assumes in launching a new fund. In particular, they considered the effect of the unified management fee structure and the fact that the Advisor will assume a substantial part of the start-up costs of the Fund and the risk that the Fund will grow to a level that will become profitable to the Advisor. The Board considered the position that the Fund would take in the lineup of the American Century Investments’ family of funds and the benefits to shareholders of existing funds of the broadened product offering. Finally, while not specifically discussed, but important in the decision to approve the management agreement, is the Directors’ familiarity with the Advisor. The Board oversees and evaluates on a continuous basis the nature and quality of all services the Advisor performs for other funds within the American Century Investments’ complex. As such, the Directors have confidence in the Advisor’s integrity and competence in providing services to the Fund.
In their deliberations, the Board did not identify any particular information that was all-important or controlling, and each Director attributed different weights to various factors. However, based on their evaluation of all material factors and assisted by the advice of independent legal counsel, the Directors, concluded that the overall arrangements between the Fund and the Advisor, as provided in the management agreement, were fair and reasonable in light of the services to be performed and should be approved.
29
Retirement Account Information
As required by law, distributions you receive from certain IRAs, or 403(b), 457 and qualified plans are subject to federal income tax withholding, unless you elect not to have withholding apply. Tax will be withheld on the total amount withdrawn even though you may be receiving amounts that are not subject to withholding, such as nondeductible contributions. In such case, excess amounts of withholding could occur. You may adjust your withholding election so that a greater or lesser amount will be withheld.
If you don’t want us to withhold on this amount, you must notify us to not withhold the federal income tax. You may notify us in writing or in certain situations by telephone or through other electronic means. You have the right to revoke your withholding election at any time and any election you make may remain in effect until revoked by filing a new election.
Remember, even if you elect not to have income tax withheld, you are liable for paying income tax on the taxable portion of your withdrawal. If you elect not to have income tax withheld or you don’t have enough income tax withheld, you may be responsible for payment of estimated tax. You may incur penalties under the estimated tax rules if your withholding and estimated tax payments are not sufficient. You can reduce or defer the income tax on a distribution by directly or indirectly rolling such distribution over to another IRA or eligible plan. You should consult your tax advisor for additional information.
State tax will be withheld if, at the time of your distribution, your address is within one of the mandatory withholding states and you have federal income tax withheld. State taxes will be withheld from your distribution in accordance with the respective state rules.
Proxy Voting Guidelines
American Century Investment Management, Inc., the fund’s investment advisor, is responsible for exercising the voting rights associated with the securities purchased and/or held by the fund. A description of the policies and procedures the advisor uses in fulfilling this responsibility is available without charge, upon request, by calling 1-800-345-2021. It is also available on American Century Investments’ website at americancentury.com and on the Securities and Exchange Commission’s website at sec.gov. Information regarding how the investment advisor voted proxies relating to portfolio securities during the most recent 12-month period ended June 30 is available on the “About Us” page at americancentury.com. It is also available at sec.gov.
Quarterly Portfolio Disclosure
The fund files its complete schedule of portfolio holdings with the Securities and Exchange Commission (SEC) for the first and third quarters of each fiscal year on Form N-Q. The fund’s Forms N-Q are available on the SEC’s website at sec.gov, and may be reviewed and copied at the SEC’s Public Reference Room in Washington, DC. Information on the operation of the Public Reference Room may be obtained by calling 1-800-SEC-0330. The fund also makes its complete schedule of portfolio holdings for the most recent quarter of its fiscal year available on its website at americancentury.com and, upon request, by calling 1-800-345-2021.
30
31
32
| Contact Us | americancentury.com |
| Automated Information Line | 1-800-345-8765 |
| Investor Services Representative | 1-800-345-2021 or 816-531-5575 |
| Investors Using Advisors | 1-800-378-9878 |
Business, Not-For-Profit, Employer-Sponsored Retirement Plans | 1-800-345-3533 |
Banks and Trust Companies, Broker-Dealers, Financial Professionals, Insurance Companies | 1-800-345-6488 |
| Telecommunications Device for the Deaf | 1-800-634-4113 |
American Century Capital Portfolios, Inc.
Investment Advisor:
American Century Investment Management, Inc.
Kansas City, Missouri
This report and the statements it contains are submitted for the general information of our shareholders. The report is not authorized for distribution to prospective investors unless preceded or accompanied by an effective prospectus.
©2012 American Century Proprietary Holdings, Inc. All rights reserved.
CL-ANN-75031 1205
ANNUAL REPORT MARCH 31, 2012
| Mid Cap Value Fund |
| President’s Letter | 2 |
| Independent Chairman’s Letter | 3 |
| Market Perspective | 4 |
| Performance | 5 |
| Portfolio Commentary | 7 |
| Fund Characteristics | 9 |
| Shareholder Fee Example | 10 |
| Schedule of Investments | 12 |
| Statement of Assets and Liabilities | 15 |
| Statement of Operations | 16 |
| Statement of Changes in Net Assets | 17 |
| Notes to Financial Statements | 18 |
| Financial Highlights | 24 |
| Report of Independent Registered Public Accounting Firm | 26 |
| Management | 27 |
| Additional Information | 30 |
Any opinions expressed in this report reflect those of the author as of the date of the report, and do not necessarily represent the opinions of American Century Investments® or any other person in the American Century Investments organization. Any such opinions are subject to change at any time based upon market or other conditions and American Century Investments disclaims any responsibility to update such opinions. These opinions may not be relied upon as investment advice and, because investment decisions made by American Century Investments funds are based on numerous factors, may not be relied upon as an indication of trading intent on behalf of any American Century Investments fund. Security examples are used for representational purposes only and are not intended as recommendations to purchase or sell securities. Performance information for comparative indices and securities is provided to American Century Investments by third party vendors. To the best of American Century Investments’ knowledge, such information is accurate at the time of printing.
Dear Investor:
Thank you for reviewing this annual report for the period ended March 31, 2012. Our report offers investment performance and portfolio information, presented with the expert perspective of our portfolio management team.
This report remains one of our most important vehicles for conveying information about fund returns, as well as market factors and strategies that affected fund performance. For additional, updated information, we encourage you to visit our website, americancentury.com. Click on the “Fund Performance” and “Insights & News” headings at the top of our Individual Investors site.
Mostly Positive U.S. Returns Belie the Period’s Volatility
U.S. market performance for the 12 months ended March 31, 2012 appeared more benign than it really was. Broadly speaking, U.S. stocks and bonds returned roughly 7-9% for the period, as indicated by the S&P 500 Index and the Barclays U.S. Aggregate Bond Index. But those solid returns masked the roller-coaster ride required to achieve them.
The reporting period began, in April 2011, with stock indices and U.S. Treasury yields at some of their highest levels since 2008, prior to the Financial Crisis plunge. These elevated levels reflected increased risk-taking as the markets priced in improving global economic growth, strong corporate earnings, and higher inflation.
This “risk-on” investing attitude switched to “risk-off” during the summer of 2011, transformed by high fuel prices, federal budget management concerns in the U.S., and the worsening sovereign debt crisis in Europe. Recessionary expectations pulled Treasury yields to record lows by September, and stock indices suffered double-digit declines from their peaks.
Sentiment switched again in the fourth quarter of 2011, as concerns about the European sovereign debt crisis and the U.S. economy eased. Renewed “risk-on” investing carried into the first quarter of 2012, boosting growth stocks and high-yield bonds in particular. But the financial markets remain subject to potentially high volatility as they continue to wrestle with uncertainties regarding Europe, the Middle East, economic strength, government budget deficits, and the U.S. presidential election. We believe strongly in adhering to a disciplined, diversified, long-term investment approach during volatile periods, and we appreciate your continued trust in us during these unsettled times.
Sincerely,
Jonathan Thomas
President and Chief Executive Officer
American Century Investments
2
Dear Fellow Shareholders,
The assets under management in American Century Investments’ funds grow through investors placing new assets in the funds and through market appreciation. Asset growth has been at near record levels over the past two calendar years as market movements were upward, the funds’ relative returns were generally favorable, and the distribution strategies implemented by fund management have been successful.
The board reviews fund performance and distribution strategies on a regular basis. Several years ago, the fund’s management team discussed with the board its plans to grow fund assets in the intermediary, institutional and international distribution channels. These distribution strategies have produced strong positive growth. The growth in the intermediary channel recognizes the funds’ strong relative investment performance and the desire of many shareholders to seek financial guidance. Investors in both the institutional and international channels appear to find the funds’ risk-based investment strategies attractive. The board continues to support fund management’s strategies to increase fund assets and will continue to work to provide the benefits of these gains to fund shareholders.
We continue to receive a steady flow of very thoughtful questions from shareholders. If there are issues that you would like the board to address please email me at dhpratt@fundboardchair.com. Thank you for your continued investment in American Century Investments funds.
Best regards,
Don Pratt
3
By Phil Davidson,
Chief Investment Officer,
U.S. Value Equity
U.S. Stocks Advanced
Despite some meaningful market volatility, U.S. stocks generated positive performance for the one-year period ended March 31, 2012. The overall advance was driven by a robust equity market rally over the last six months of the period as economic conditions improved.
After rallying throughout much of April 2011, the stock market declined sharply from May through September amid weaker economic conditions in the U.S. and an increasingly challenging sovereign debt crisis in Europe. Public debt issues in the U.S. also weighed on the market as the government wrestled with the federal debt ceiling and a major credit rating agency downgraded the credit rating of U.S. debt from AAA to AA+ in August—the first such downgrade in the country’s history.
Market sentiment shifted markedly over the last six months of the period as evidence of improving economic growth helped ease concerns about a possible recession. Most notably, employment growth showed signs of life, helping push the unemployment rate down to a three-year low. Consumer spending and manufacturing activity also picked up, and mild winter weather provided a lift to the construction industry. The situation in Europe also improved as liquidity injections from the European Central Bank and a debt restructuring agreement in Greece helped provide some stability to the Continent’s debt markets and banking sector. The end result was a steady and substantial market rally over the last six months.
Value Stocks Lagged
As the table below illustrates, large-cap stocks and growth issues led the market’s overall advance. Growth stocks benefited the most from the improving economic environment over the last half of the period, along with investors’ greater appetite for risk. Sector performance also favored growth shares over value during the period. The top-performing sectors in the S&P 500 Index included information technology and consumer discretionary, two growth-oriented sectors of the market. In contrast, the financials sector, which is the largest sector weighting in most value indices, declined for the reporting period.
| U.S. Stock Index Returns | ||||
| For the 12 months ended March 31, 2012 | ||||
| Russell 1000 Index (Large-Cap) | 7.86% | Russell 2000 Index (Small-Cap) | -0.18% | |
| Russell 1000 Growth Index | 11.02% | Russell 2000 Growth Index | 0.68% | |
| Russell 1000 Value Index | 4.79% | Russell 2000 Value Index | -1.07% | |
| Russell Midcap Index | 3.31% | |||
| Russell Midcap Growth Index | 4.43% | |||
| Russell Midcap Value Index | 2.28% | |||
4
| Total Returns as of March 31, 2012 | |||||
| Average Annual Returns | |||||
Ticker Symbol | 1 year | 5 years | Since Inception | Inception Date | |
| Investor Class | ACMVX | 4.48% | 3.92% | 8.68% | 3/31/04 |
| Russell Midcap Value Index | — | 2.28% | 1.26% | 7.44% | — |
| Institutional Class | AVUAX | 4.60% | 4.13% | 9.17% | 8/2/04 |
A Class(1) No sales charge* With sales charge* | ACLAX | 4.19% -1.80% | 3.65% 2.44% | 7.55% 6.67% | 1/13/05 |
| C Class | ACCLX | 3.41% | — | 11.35% | 3/1/10 |
| R Class | AMVRX | 3.91% | 3.42% | 6.09% | 7/29/05 |
* | Sales charges include initial sales charges and contingent deferred sales charges (CDSCs), as applicable. A Class shares have a 5.75% maximum initial sales charge and may be subject to a maximum CDSC of 1.00%. C Class shares redeemed within 12 months of purchase are subject to a maximum CDSC of 1.00%. The SEC requires that mutual funds provide performance information net of maximum sales charges in all cases where charges could be applied. |
| (1) | Prior to March 1, 2010, the A Class was referred to as the Advisor Class and did not have a front-end sales charge. Performance prior to that date has been adjusted to reflect this charge. |
Data presented reflect past performance. Past performance is no guarantee of future results. Current performance may be higher or lower than the performance shown. Investment return and principal value will fluctuate, and redemption value may be more or less than original cost. To obtain performance data current to the most recent month end, please call 1-800-345-2021 or visit americancentury.com. International investing involves special risks, such as political instability and currency fluctuations.
Unless otherwise indicated, performance reflects Investor Class shares; performance for other share classes will vary due to differences in fee structure. For information about other share classes available, please consult the prospectus. Data assumes reinvestment of dividends and capital gains, and none of the charts reflect the deduction of taxes that a shareholder would pay on fund distributions or the redemption of fund shares. Returns for the index are provided for comparison. The fund’s total returns include operating expenses (such as transaction costs and management fees) that reduce returns, while the total returns of the index does not.
5
| Growth of $10,000 Over Life of Class |
| $10,000 investment made March 31, 2004 |
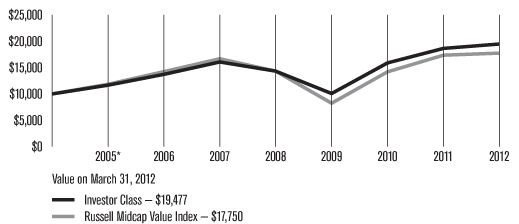
*From 3/31/04, the Investor Class’s inception date. Not annualized.
| Total Annual Fund Operating Expenses | ||||
| Investor Class | Institutional Class | A Class | C Class | R Class |
| 1.01% | 0.81% | 1.26% | 2.01% | 1.51% |
The total annual fund operating expenses shown is as stated in the fund’s prospectus current as of the date of this report. The prospectus may vary from the expense ratio shown elsewhere in this report because it is based on a different time period, includes acquired fund fees and expenses, and, if applicable, does not include fee waivers or expense reimbursements.
Data presented reflect past performance. Past performance is no guarantee of future results. Current performance may be higher or lower than the performance shown. Investment return and principal value will fluctuate, and redemption value may be more or less than original cost. To obtain performance data current to the most recent month end, please call 1-800-345-2021 or visit americancentury.com. International investing involves special risks, such as political instability and currency fluctuations.
Unless otherwise indicated, performance reflects Investor Class shares; performance for other share classes will vary due to differences in fee structure. For information about other share classes available, please consult the prospectus. Data assumes reinvestment of dividends and capital gains, and none of the charts reflect the deduction of taxes that a shareholder would pay on fund distributions or the redemption of fund shares. Returns for the index are provided for comparison. The fund’s total returns include operating expenses (such as transaction costs and management fees) that reduce returns, while the total returns of the index does not.
6
Portfolio Managers: Kevin Toney, Michael Liss, Phil Davidson, and Brian Woglom
Portfolio Manager Brian Woglom has joined the Mid Cap Value management team. Mr. Woglom previously served as an investment analyst for Mid Cap Value and has been a member of the Mid Cap Value team since 2005.
Performance Summary
Mid Cap Value returned 4.48%* for the 12 months ended March 31, 2012. By comparison, the average return for Morningstar’s Mid Cap Value category (its performance, like Mid Cap Value’s, reflects operating expenses) was 0.74%.** The fund’s benchmark, the Russell Midcap Value Index, returned 2.28%. Its returns do not include operating expenses.
The U.S. stock market posted a gain during the one-year reporting period, largely as a result of its strong performance during the first quarter of 2012. For most of the 12-month period, investors were preoccupied with Europe’s financial woes, which threatened to spread from Greece to other nations and seemed likely to cause problems for European banks. Lackluster U.S. economic growth and the downgrade of U.S. debt by Standard & Poor’s Ratings also dampened market sentiment. Investor risk appetite improved near the end of 2011 when the U.S. economy, proving surprisingly resilient, returned to its slow-growth path. Employers added new jobs, and corporate earnings remained solid. Investors also grew more optimistic as the European Central Bank provided inexpensive loans to European banks and the financial crisis eased. In this environment, growth stocks outperformed value stocks across the capitalization spectrum. For the reporting period, Mid Cap Value’s investment approach, which emphasizes higher-quality businesses with sound balance sheets, provided positive absolute results in eight of the 10 sectors in which it was invested. It also outperformed in relative terms. Positions in the financials, consumer staples, and telecommunication services sectors contributed to performance. Allocations to the consumer discretionary and utilities sectors detracted. Foreign holdings also accounted for a portion of the portfolio’s underperformance during the reporting period.
We carefully manage this portfolio for long-term results. Since its inception on March 31, 2004, Mid Cap Value has produced an average annual return of 8.68%, topping the returns for that period for Morningstar’s Mid Cap Value category average and the Russell Midcap Value Index (see the performance information on pages 5 and 6 or in footnotes below).
Financials Boosted Performance
In financials, strong security selection enhanced relative results. Within the insurance industry, Mid Cap Value owned Transatlantic Holdings, a global reinsurance company. Shares of Transatlantic surged on news that it had entered a merger agreement with Allied World Assurance Co. Holdings. The stock continued to perform well as several other suitors made additional offers. Ultimately, Transatlantic agreed to be acquired by Alleghany Corp.
The portfolio also benefited from an investment in American Tower Corp., which is not represented in the benchmark. American Tower announced it was planning to convert itself into a real estate investment trust (REIT) at the end of 2011, attracting more investors to the stock. (The conversion led to American Tower’s reclassification
| * | All fund returns referenced in this commentary are for Investor Class shares. |
| ** | The average returns for the periods ended March 31, 2012, for Morningstar’s Mid Cap Value category were 1.41% for the five-year period and 6.08% since the fund’s inception on March 31, 2004. ©2012 Morningstar, Inc. All Rights Reserved. The information contained herein: (1) is proprietary to Morningstar and/or its content providers; (2) may not be copied or distributed; and (3) is not warranted to be accurate, complete or timely. Neither Morningstar nor its content providers are responsible for any damages or losses arising from any use of this information. |
7
from a telecommunications stock to a REIT.)
The financials sector also provided a notable detractor — Hudson City Bancorp., a regional bank operating primarily in New Jersey and New York. The low interest rate environment has raised concern about its future earnings power.
Consumer Staples Contributed
Mid Cap Value’s overweight in consumer staples added to relative performance as investors gravitated to more defensive stocks. The portfolio benefited from our focus on high-quality names, particularly among food and household products stocks. Many of these stocks offer attractive dividend yields. A notable contributor was Kimberly-Clark Corp., which demonstrated strong pricing power even as commodities prices, specifically the price of pulp, increased.
Energy Supplied Contributor and Detractor
In the energy sector, the portfolio benefited from a position in oil and gas drilling company, EQT Corp. The stock appreciated in the early part of the reporting period, we believe, because of unspecified rumors about its potential acquisition. Drilling companies with a presence in the Marcellus shale, which has significant untapped natural gas reserves, were attractive acquisition candidates during the reporting period.
A detractor was Ultra Petroleum, a high-quality natural gas exploration and production company, with solid assets and the ability to extract natural gas more cheaply than many of its peers. Its shares declined, largely because of supply and demand. New extraction techniques have produced a significant amount of natural gas supply. Meanwhile, prices fell to 10-year lows on weak demand during the mild winter.
Consumer Discretionary and Utilities Hampered Results
Mid Cap Value’s underweight in the consumer discretionary sector, which outperformed in the benchmark, slowed relative performance. Security selection in the household durables industry was also a drag on results.
In utilities, an underweight slowed performance. Utilities stocks, which are generally viewed as defensive instruments in difficult economic times, performed strongly during the reporting period. We believed utilities stocks offer a less attractive risk/reward profile than stocks in other sectors.
Industrials Provided Top Detractor
In the industrials sector, an investment in Koninklijke Philips Electronics detracted. The Dutch company, which does a significant amount of business in Europe, has been hampered by the slowdown in the European economy. In addition, the new management team’s turnaround plan is progressing more slowly than expected.
Outlook
We continue to follow our disciplined, bottom-up process, selecting companies one at a time for the portfolio. As of March 31, 2012, we see opportunities in health care, industrials, and consumer staples reflected by overweight positions in these sectors relative to the benchmark. Fundamental analysis and valuation work have led to smaller relative weightings in financials, information technology, and consumer discretionary stocks.
8
| MARCH 31, 2012 | |
| Top Ten Holdings | % of net assets |
| Republic Services, Inc. | 3.3% |
| iShares Russell Midcap Value Index Fund | 2.8% |
| Northern Trust Corp. | 2.7% |
| Imperial Oil Ltd. | 2.0% |
| CareFusion Corp. | 1.7% |
| Kimberly-Clark Corp. | 1.7% |
| Tyco International Ltd. | 1.7% |
| PG&E Corp. | 1.7% |
| Ralcorp Holdings, Inc. | 1.6% |
| Zimmer Holdings, Inc. | 1.6% |
| Top Five Industries | % of net assets |
| Insurance | 8.4% |
| Oil, Gas and Consumable Fuels | 6.9% |
| Electric Utilities | 6.7% |
| Health Care Equipment and Supplies | 6.5% |
| Commercial Banks | 5.6% |
| Types of Investments in Portfolio | % of net assets |
| Domestic Common Stocks | 87.4% |
| Foreign Common Stocks* | 7.7% |
| Exchange-Traded Funds | 2.8% |
| Total Equity Exposure | 97.9% |
| Temporary Cash Investments | 1.9% |
| Other Assets and Liabilities | 0.2% |
*Includes depositary shares, dual listed securities and foreign ordinary shares.
9
Fund shareholders may incur two types of costs: (1) transaction costs, including sales charges (loads) on purchase payments and redemption/exchange fees; and (2) ongoing costs, including management fees; distribution and service (12b-1) fees; and other fund expenses. This example is intended to help you understand your ongoing costs (in dollars) of investing in your fund and to compare these costs with the ongoing cost of investing in other mutual funds.
The example is based on an investment of $1,000 made at the beginning of the period and held for the entire period from October 1, 2011 to March 31, 2012.
Actual Expenses
The table provides information about actual account values and actual expenses for each class. You may use the information, together with the amount you invested, to estimate the expenses that you paid over the period. First, identify the share class you own. Then simply divide your account value by $1,000 (for example, an $8,600 account value divided by $1,000 = 8.6), then multiply the result by the number under the heading “Expenses Paid During Period” to estimate the expenses you paid on your account during this period.
If you hold Investor Class shares of any American Century Investments fund, or Institutional Class shares of the American Century Diversified Bond Fund, in an American Century Investments account (i.e., not a financial intermediary or retirement plan account), American Century Investments may charge you a $12.50 semiannual account maintenance fee if the value of those shares is less than $10,000. We will redeem shares automatically in one of your accounts to pay the $12.50 fee. In determining your total eligible investment amount, we will include your investments in all personal accounts (including American Century Investments Brokerage accounts) registered under your Social Security number. Personal accounts include individual accounts, joint accounts, UGMA/UTMA accounts, personal trusts, Coverdell Education Savings Accounts and IRAs (including traditional, Roth, Rollover, SEP-, SARSEP- and SIMPLE-IRAs), and certain other retirement accounts. If you have only business, business retirement, employer-sponsored or American Century Investments Brokerage accounts, you are currently not subject to this fee. If you are subject to the Account Maintenance Fee, your account value could be reduced by the fee amount.
Hypothetical Example for Comparison Purposes
The table also provides information about hypothetical account values and hypothetical expenses based on the actual expense ratio of each class of your fund and an assumed rate of return of 5% per year before expenses, which is not the actual return of a fund’s share class. The hypothetical account values and expenses may not be used to estimate the actual ending account balance or expenses you paid for the period. You may use this information to compare the ongoing costs of investing in your fund and other funds. To do so, compare this 5% hypothetical example with the 5% hypothetical examples that appear in the shareholder reports of the other funds.
10
Please note that the expenses shown in the table are meant to highlight your ongoing costs only and do not reflect any transactional costs, such as sales charges (loads) or redemption/exchange fees. Therefore, the table is useful in comparing ongoing costs only, and will not help you determine the relative total costs of owning different funds. In addition, if these transactional costs were included, your costs would have been higher.
Beginning Account Value 10/1/11 | Ending Account Value 3/31/12 | Expenses Paid During Period(1) 10/1/11 – 3/31/12 | Annualized Expense Ratio(1) | |
| Actual | ||||
| Investor Class | $1,000 | $1,231.00 | $5.63 | 1.01% |
| Institutional Class | $1,000 | $1,232.10 | $4.52 | 0.81% |
| A Class | $1,000 | $1,229.10 | $7.02 | 1.26% |
| C Class | $1,000 | $1,224.50 | $11.18 | 2.01% |
| R Class | $1,000 | $1,227.20 | $8.41 | 1.51% |
| Hypothetical | ||||
| Investor Class | $1,000 | $1,019.95 | $5.10 | 1.01% |
| Institutional Class | $1,000 | $1,020.95 | $4.09 | 0.81% |
| A Class | $1,000 | $1,018.70 | $6.36 | 1.26% |
| C Class | $1,000 | $1,014.95 | $10.13 | 2.01% |
| R Class | $1,000 | $1,017.45 | $7.62 | 1.51% |
| (1) | Expenses are equal to the class’s annualized expense ratio listed in the table above, multiplied by the average account value over the period, multiplied by 183, the number of days in the most recent fiscal half-year, divided by 366, to reflect the one-half year period. |
11
MARCH 31, 2012
| Shares | Value | |||||||
| Common Stocks — 95.1% | ||||||||
| AEROSPACE AND DEFENSE — 2.6% | ||||||||
| Exelis, Inc. | 1,022,149 | $12,797,306 | ||||||
| General Dynamics Corp. | 163,746 | 12,015,681 | ||||||
Huntington Ingalls Industries, Inc.(1) | 134,174 | 5,399,162 | ||||||
| L-3 Communications Holdings, Inc. | 238,810 | 16,900,584 | ||||||
| Northrop Grumman Corp. | 204,880 | 12,514,070 | ||||||
| 59,626,803 | ||||||||
| AIRLINES — 1.0% | ||||||||
| Southwest Airlines Co. | 2,889,917 | 23,812,916 | ||||||
| BEVERAGES — 1.4% | ||||||||
| Dr Pepper Snapple Group, Inc. | 790,604 | 31,790,187 | ||||||
| CAPITAL MARKETS — 4.1% | ||||||||
| Charles Schwab Corp. (The) | 1,610,564 | 23,143,805 | ||||||
| Northern Trust Corp. | 1,271,686 | 60,341,501 | ||||||
| State Street Corp. | 200,865 | 9,139,357 | ||||||
| 92,624,663 | ||||||||
| CHEMICALS — 1.0% | ||||||||
| Minerals Technologies, Inc. | 202,878 | 13,270,250 | ||||||
| Olin Corp. | 385,531 | 8,385,299 | ||||||
| 21,655,549 | ||||||||
| COMMERCIAL BANKS — 5.6% | ||||||||
| City National Corp. | 228,124 | 11,969,666 | ||||||
| Comerica, Inc. | 873,867 | 28,278,336 | ||||||
| Commerce Bancshares, Inc. | 706,666 | 28,634,106 | ||||||
| Cullen/Frost Bankers, Inc. | 188,521 | 10,970,037 | ||||||
| PNC Financial Services Group, Inc. | 245,608 | 15,839,260 | ||||||
| SunTrust Banks, Inc. | 507,755 | 12,272,439 | ||||||
| Westamerica Bancorp. | 365,432 | 17,540,736 | ||||||
| 125,504,580 | ||||||||
| COMMERCIAL SERVICES AND SUPPLIES — 3.8% | ||||||||
| Republic Services, Inc. | 2,445,714 | 74,741,020 | ||||||
| Waste Management, Inc. | 329,535 | 11,520,543 | ||||||
| 86,261,563 | ||||||||
| COMMUNICATIONS EQUIPMENT — 0.3% | ||||||||
| Harris Corp. | 150,045 | 6,764,029 | ||||||
| COMPUTERS AND PERIPHERALS — 0.1% | ||||||||
Western Digital Corp.(1) | 81,396 | 3,368,980 | ||||||
| CONTAINERS AND PACKAGING — 1.3% | ||||||||
| Bemis Co., Inc. | 888,016 | 28,674,037 | ||||||
| DIVERSIFIED TELECOMMUNICATION SERVICES — 1.8% | ||||||||
| CenturyLink, Inc. | 635,370 | 24,557,051 | ||||||
tw telecom, inc.(1) | 697,881 | 15,465,043 | ||||||
| 40,022,094 | ||||||||
| ELECTRIC UTILITIES — 6.7% | ||||||||
| Empire District Electric Co. (The) | 1,085,100 | 22,081,785 | ||||||
| Great Plains Energy, Inc. | 1,683,116 | 34,116,761 | ||||||
| IDACORP, Inc. | 207,677 | 8,539,678 | ||||||
| Northeast Utilities | 420,268 | 15,600,348 | ||||||
| NV Energy, Inc. | 1,806,456 | 29,120,071 | ||||||
| Portland General Electric Co. | 562,351 | 14,047,528 | ||||||
| Westar Energy, Inc. | 1,024,322 | 28,609,314 | ||||||
| 152,115,485 | ||||||||
| ELECTRICAL EQUIPMENT — 1.3% | ||||||||
| Brady Corp., Class A | 233,422 | 7,551,202 | ||||||
| Emerson Electric Co. | 260,759 | 13,606,404 | ||||||
| Hubbell, Inc., Class B | 98,660 | 7,752,703 | ||||||
| 28,910,309 | ||||||||
| ELECTRONIC EQUIPMENT, INSTRUMENTS AND COMPONENTS — 1.1% | ||||||||
| Molex, Inc., Class A | 473,347 | 11,099,987 | ||||||
| TE Connectivity Ltd. | 361,826 | 13,297,106 | ||||||
| 24,397,093 | ||||||||
| FOOD AND STAPLES RETAILING — 1.4% | ||||||||
| SYSCO Corp. | 1,043,842 | 31,169,122 | ||||||
| FOOD PRODUCTS — 4.4% | ||||||||
| Campbell Soup Co. | 375,995 | 12,727,431 | ||||||
| General Mills, Inc. | 473,606 | 18,683,757 | ||||||
| H.J. Heinz Co. | 225,666 | 12,084,414 | ||||||
| Kellogg Co. | 330,828 | 17,742,305 | ||||||
Ralcorp Holdings, Inc.(1) | 502,941 | 37,262,899 | ||||||
| 98,500,806 | ||||||||
| GAS UTILITIES — 0.8% | ||||||||
| AGL Resources, Inc. | 468,040 | 18,356,529 | ||||||
| HEALTH CARE EQUIPMENT AND SUPPLIES — 6.5% | ||||||||
| Becton, Dickinson and Co. | 308,086 | 23,922,878 | ||||||
Boston Scientific Corp.(1) | 2,636,092 | 15,763,830 | ||||||
CareFusion Corp.(1) | 1,519,577 | 39,402,632 | ||||||
Hologic, Inc.(1) | 311,851 | 6,720,389 | ||||||
| STERIS Corp. | 401,278 | 12,688,410 | ||||||
| Stryker Corp. | 224,002 | 12,427,631 | ||||||
| Zimmer Holdings, Inc. | 573,244 | 36,848,124 | ||||||
| 147,773,894 | ||||||||
| HEALTH CARE PROVIDERS AND SERVICES — 3.4% | ||||||||
| CIGNA Corp. | 305,663 | 15,053,903 | ||||||
| Humana, Inc. | 98,866 | 9,143,127 | ||||||
LifePoint Hospitals, Inc.(1) | 679,661 | 26,805,830 | ||||||
| Patterson Cos., Inc. | 763,497 | 25,500,800 | ||||||
| 76,503,660 | ||||||||
12
| Shares | Value | |||||||
| HOTELS, RESTAURANTS AND LEISURE — 2.5% | ||||||||
| Carnival Corp. | 430,157 | $13,799,437 | ||||||
| CEC Entertainment, Inc. | 531,923 | 20,165,201 | ||||||
| International Game Technology | 630,703 | 10,589,503 | ||||||
| International Speedway Corp., Class A | 264,014 | 7,326,388 | ||||||
| Speedway Motorsports, Inc. | 264,647 | 4,943,606 | ||||||
| 56,824,135 | ||||||||
| HOUSEHOLD DURABLES — 0.7% | ||||||||
| Whirlpool Corp. | 219,379 | 16,861,470 | ||||||
| HOUSEHOLD PRODUCTS — 2.4% | ||||||||
| Clorox Co. | 216,087 | 14,855,981 | ||||||
| Kimberly-Clark Corp. | 528,166 | 39,026,186 | ||||||
| 53,882,167 | ||||||||
| INDUSTRIAL CONGLOMERATES — 3.0% | ||||||||
| Koninklijke Philips Electronics NV | 1,413,984 | 28,664,616 | ||||||
| Tyco International Ltd. | 682,340 | 38,333,861 | ||||||
| 66,998,477 | ||||||||
| INSURANCE — 8.4% | ||||||||
| ACE Ltd. | 206,011 | 15,080,005 | ||||||
| Allstate Corp. (The) | 869,408 | 28,620,911 | ||||||
| Aon Corp. | 552,341 | 27,097,850 | ||||||
| HCC Insurance Holdings, Inc. | 1,054,528 | 32,869,638 | ||||||
| Marsh & McLennan Cos., Inc. | 905,705 | 29,698,067 | ||||||
| Symetra Financial Corp. | 652,475 | 7,523,037 | ||||||
| Torchmark Corp. | 121,027 | 6,033,196 | ||||||
| Travelers Cos., Inc. (The) | 420,687 | 24,904,670 | ||||||
| Unum Group | 731,571 | 17,908,858 | ||||||
| 189,736,232 | ||||||||
| IT SERVICES — 0.4% | ||||||||
| Booz Allen Hamilton Holding Corp. | 531,233 | 9,046,898 | ||||||
| LIFE SCIENCES TOOLS AND SERVICES — 0.2% | ||||||||
Life Technologies Corp.(1) | 102,618 | 5,009,811 | ||||||
| MACHINERY — 2.7% | ||||||||
| Ingersoll-Rand plc | 182,256 | 7,536,286 | ||||||
| ITT Corp. | 603,270 | 13,839,014 | ||||||
| Kaydon Corp. | 679,858 | 17,343,177 | ||||||
Oshkosh Corp.(1) | 459,545 | 10,647,658 | ||||||
| Snap-On, Inc. | 147,467 | 8,991,063 | ||||||
| Stanley Black & Decker, Inc. | 49,814 | 3,833,685 | ||||||
| 62,190,883 | ||||||||
| MEDIA — 0.9% | ||||||||
| Omnicom Group, Inc. | 124,092 | 6,285,260 | ||||||
| Time Warner Cable, Inc. | 171,636 | 13,988,334 | ||||||
| 20,273,594 | ||||||||
| METALS AND MINING — 1.1% | ||||||||
| Newmont Mining Corp. | 481,788 | 24,701,271 | ||||||
| MULTI-UTILITIES — 3.3% | ||||||||
| Consolidated Edison, Inc. | 170,125 | 9,938,703 | ||||||
| PG&E Corp. | 862,449 | 37,438,911 | ||||||
| Wisconsin Energy Corp. | 221,041 | 7,776,222 | ||||||
| Xcel Energy, Inc. | 728,784 | 19,290,912 | ||||||
| 74,444,748 | ||||||||
| MULTILINE RETAIL — 0.9% | ||||||||
| Target Corp. | 339,294 | 19,770,661 | ||||||
| OIL, GAS AND CONSUMABLE FUELS — 6.9% | ||||||||
| Apache Corp. | 103,800 | 10,425,672 | ||||||
| Devon Energy Corp. | 88,299 | 6,279,825 | ||||||
| EQT Corp. | 272,520 | 13,138,189 | ||||||
| Imperial Oil Ltd. | 1,013,111 | 46,031,571 | ||||||
| Murphy Oil Corp. | 505,790 | 28,460,803 | ||||||
| Peabody Energy Corp. | 319,426 | 9,250,577 | ||||||
Southwestern Energy Co.(1) | 412,620 | 12,626,172 | ||||||
Ultra Petroleum Corp.(1) | 1,316,722 | 29,797,419 | ||||||
| 156,010,228 | ||||||||
| PHARMACEUTICALS — 0.6% | ||||||||
| Eli Lilly & Co. | 144,627 | 5,824,129 | ||||||
Hospira, Inc.(1) | 215,828 | 8,069,809 | ||||||
| 13,893,938 | ||||||||
| REAL ESTATE INVESTMENT TRUSTS (REITs) — 2.8% | ||||||||
| American Tower Corp. | 289,254 | 18,228,787 | ||||||
| Government Properties Income Trust | 291,633 | 7,031,272 | ||||||
| Piedmont Office Realty Trust, Inc., Class A | 1,447,519 | 25,693,462 | ||||||
| Weyerhaeuser Co. | 535,358 | 11,735,047 | ||||||
| 62,688,568 | ||||||||
| ROAD AND RAIL — 0.5% | ||||||||
| Heartland Express, Inc. | 803,037 | 11,611,915 | ||||||
| SEMICONDUCTORS AND SEMICONDUCTOR EQUIPMENT — 2.5% | ||||||||
| Applied Materials, Inc. | 2,663,753 | 33,137,087 | ||||||
Teradyne, Inc.(1) | 1,324,032 | 22,362,901 | ||||||
| 55,499,988 | ||||||||
| SPECIALTY RETAIL — 2.7% | ||||||||
| Lowe’s Cos., Inc. | 1,126,265 | 35,342,196 | ||||||
| Staples, Inc. | 1,652,360 | 26,735,185 | ||||||
| 62,077,381 | ||||||||
| THRIFTS AND MORTGAGE FINANCE — 2.9% | ||||||||
| Capitol Federal Financial, Inc. | 1,600,385 | 18,980,566 | ||||||
| Hudson City Bancorp., Inc. | 2,879,480 | 21,048,999 | ||||||
| People’s United Financial, Inc. | 1,860,451 | 24,632,371 | ||||||
| 64,661,936 | ||||||||
13
| Shares | Value | |||||||
| WIRELESS TELECOMMUNICATION SERVICES — 1.1% | ||||||||
| Rogers Communications, Inc., Class B | 611,309 | $24,269,724 | ||||||
TOTAL COMMON STOCKS (Cost $1,994,296,597) | 2,148,286,324 | |||||||
| Exchange-Traded Funds — 2.8% | ||||||||
| iShares Russell Midcap Value Index Fund (Cost $55,954,251) | 1,332,626 | 64,139,289 | ||||||
| Temporary Cash Investments — 1.9% | ||||||||
Repurchase Agreement, Bank America Merrill Lynch, (collateralized by various U.S. Treasury obligations, 6.125%, 11/15/27, valued at $15,402,338), in a joint trading account at 0.01%, dated 3/30/12, due 4/2/12 (Delivery value $15,085,417) | 15,085,404 | |||||||
Repurchase Agreement, Credit Suisse First Boston, Inc., (collateralized by various U.S. Treasury obligations, 4.375%, 5/15/41, valued at $9,604,764), in a joint trading account at 0.03%, dated 3/30/12, due 4/2/12 (Delivery value $9,428,402) | 9,428,378 | |||||||
Repurchase Agreement, Goldman Sachs & Co., (collateralized by various U.S. Treasury obligations, 4.50%, 5/15/38, valued at $11,562,962), in a joint trading account at 0.03%, dated 3/30/12, due 4/2/12 (Delivery value $11,314,081) | 11,314,053 | |||||||
| SSgA U.S. Government Money Market Fund | 6,395,819 | 6,395,819 | ||||||
TOTAL TEMPORARY CASH INVESTMENTS (Cost $42,223,654) | 42,223,654 | |||||||
TOTAL INVESTMENT SECURITIES — 99.8% (Cost $2,092,474,502) | 2,254,649,267 | |||||||
| OTHER ASSETS AND LIABILITIES — 0.2% | 4,931,499 | |||||||
| TOTAL NET ASSETS — 100.0% | $2,259,580,766 | |||||||
| Forward Foreign Currency Exchange Contracts | |||||
| Contracts to Sell | Counterparty | Settlement Date | Value | Unrealized Gain (Loss) | |
| 58,094,014 | CAD for USD | UBS AG | 4/30/12 | $58,210,396 | $ 49,659 |
| 18,491,022 | EUR for USD | UBS AG | 4/30/12 | 24,664,299 | (59,960) |
| $82,874,695 | $(10,301) | ||||
Notes to Schedule of Investments
CAD = Canadian Dollar
EUR = Euro
USD = United States Dollar
(1) Non-income producing.
See Notes to Financial Statements.
14
| MARCH 31, 2012 | ||||
| Assets | ||||
| Investment securities, at value (cost of $2,092,474,502) | $2,254,649,267 | |||
| Receivable for investments sold | 21,494,492 | |||
| Receivable for capital shares sold | 3,637,912 | |||
| Unrealized gain on forward foreign currency exchange contracts | 49,659 | |||
| Dividends and interest receivable | 4,750,553 | |||
| 2,284,581,883 | ||||
| Liabilities | ||||
| Payable for investments purchased | 19,013,946 | |||
| Payable for capital shares redeemed | 3,992,739 | |||
| Unrealized loss on forward foreign currency exchange contracts | 59,960 | |||
| Accrued management fees | 1,835,077 | |||
| Distribution and service fees payable | 99,395 | |||
| 25,001,117 | ||||
| Net Assets | $2,259,580,766 | |||
| Net Assets Consist of: | ||||
| Capital (par value and paid-in surplus) | $2,084,162,582 | |||
| Undistributed net investment income | 12,663,244 | |||
| Undistributed net realized gain | 590,407 | |||
| Net unrealized appreciation | 162,164,533 | |||
| $2,259,580,766 | ||||
| Net assets | Shares outstanding | Net asset value per share | |
| Investor Class, $0.01 Par Value | $1,615,365,258 | 125,610,018 | $12.86 |
| Institutional Class, $0.01 Par Value | $262,032,282 | 20,370,904 | $12.86 |
| A Class, $0.01 Par Value | $316,497,406 | 24,620,396 | $12.86* |
| C Class, $0.01 Par Value | $15,241,629 | 1,186,991 | $12.84 |
| R Class, $0.01 Par Value | $50,444,191 | 3,925,850 | $12.85 |
*Maximum offering price $13.64 (net asset value divided by 0.9425).
See Notes to Financial Statements.
15
| YEAR ENDED MARCH 31, 2012 | ||||
| Investment Income (Loss) | ||||
| Income: | ||||
| Dividends (net of foreign taxes withheld of $315,150) | $53,026,151 | |||
| Interest | 13,309 | |||
| 53,039,460 | ||||
| Expenses: | ||||
| Management fees | 18,515,207 | |||
| Distribution and service fees: | ||||
| A Class | 630,692 | |||
| C Class | 103,575 | |||
| R Class | 221,402 | |||
| Directors’ fees and expenses | 80,769 | |||
| Other expenses | 2,430 | |||
| 19,554,075 | ||||
| Net investment income (loss) | 33,485,385 | |||
| Realized and Unrealized Gain (Loss) | ||||
| Net realized gain (loss) on: | ||||
| Investment transactions | 71,186,768 | |||
| Foreign currency transactions | 1,835,569 | |||
| 73,022,337 | ||||
| Change in net unrealized appreciation (depreciation) on: | ||||
| Investments | (9,565,173 | ) | ||
| Translation of assets and liabilities in foreign currencies | 391,878 | |||
| (9,173,295 | ) | |||
| Net realized and unrealized gain (loss) | 63,849,042 | |||
| Net Increase (Decrease) in Net Assets Resulting from Operations | $97,334,427 | |||
See Notes to Financial Statements.
16
| YEARS ENDED MARCH 31, 2012 AND MARCH 31, 2011 | |||||||
| Increase (Decrease) in Net Assets | March 31, 2012 | March 31, 2011 | |||||
| Operations | |||||||
| Net investment income (loss) | $33,485,385 | $20,789,702 | |||||
| Net realized gain (loss) | 73,022,337 | 89,778,862 | |||||
| Change in net unrealized appreciation (depreciation) | (9,173,295 | ) | 87,435,934 | ||||
| Net increase (decrease) in net assets resulting from operations | 97,334,427 | 198,004,498 | |||||
| Distributions to Shareholders | |||||||
| From net investment income: | |||||||
| Investor Class | (18,266,763 | ) | (13,839,031 | ) | |||
| Institutional Class | (3,268,918 | ) | (2,589,110 | ) | |||
| A Class | (2,822,647 | ) | (2,017,571 | ) | |||
| C Class | (57,447 | ) | (11,585 | ) | |||
| R Class | (415,298 | ) | (327,247 | ) | |||
| From net realized gains: | |||||||
| Investor Class | (66,393,627 | ) | — | ||||
| Institutional Class | (10,468,601 | ) | — | ||||
| A Class | (12,975,228 | ) | — | ||||
| C Class | (579,630 | ) | — | ||||
| R Class | (2,228,639 | ) | — | ||||
| Decrease in net assets from distributions | (117,476,798 | ) | (18,784,544 | ) | |||
| Capital Share Transactions | |||||||
| Net increase (decrease) in net assets from capital share transactions | 512,576,449 | 948,545,915 | |||||
| Net increase (decrease) in net assets | 492,434,078 | 1,127,765,869 | |||||
| Net Assets | |||||||
| Beginning of period | 1,767,146,688 | 639,380,819 | |||||
| End of period | $2,259,580,766 | $1,767,146,688 | |||||
| Undistributed net investment income | $12,663,244 | $2,804,020 | |||||
See Notes to Financial Statements.
17
MARCH 31, 2012
1. Organization
American Century Capital Portfolios, Inc. (the corporation) is registered under the Investment Company Act of 1940, as amended (the 1940 Act), as an open-end management investment company and is organized as a Maryland corporation. Mid Cap Value Fund (the fund) is one fund in a series issued by the corporation. The fund is diversified as defined under the 1940 Act. The fund’s investment objective is to seek long-term capital growth. Income is a secondary objective. The fund pursues its objectives by investing in equity securities of medium size companies that management believes to be undervalued at the time of purchase.
The fund is authorized to issue the Investor Class, the Institutional Class, the A Class, the C Class and the R Class. The A Class may incur an initial sales charge. The A Class and C Class may be subject to a contingent deferred sales charge. The share classes differ principally in their respective sales charges and distribution and shareholder servicing expenses and arrangements. The Institutional Class is made available to institutional shareholders or through financial intermediaries whose clients do not require the same level of shareholder and administrative services as shareholders of other classes. As a result, the Institutional Class is charged a lower unified management fee.
2. Significant Accounting Policies
The following is a summary of significant accounting policies consistently followed by the fund in preparation of its financial statements. The financial statements are prepared in conformity with accounting principles generally accepted in the United States of America, which may require management to make certain estimates and assumptions at the date of the financial statements. Actual results could differ from these estimates.
Investment Valuations — The fund determines the fair value of its investments and computes its net asset value per share as of the close of regular trading (usually 4 p.m. Eastern time) on the New York Stock Exchange (NYSE) on each day the NYSE is open.
Equity securities that are listed or traded on a domestic securities exchange are valued at the last reported sales price or at the official closing price as provided by the exchange. Equity securities traded on foreign securities exchanges are typically valued at the closing price on the exchange where primarily traded or as of the close of the NYSE, if that is earlier. If no last sales price is reported, or if local convention or regulation so provides, the mean of the latest bid and asked prices is used. Depending on local convention or regulation, securities traded over-the-counter are valued at the mean of the latest bid and asked prices, the last sales price, or the official closing price. In its determination of fair value, the fund may review several factors including: market information specific to a security; news developments in U.S. and foreign markets; the performance of particular U.S. and foreign securities, indices, comparable securities, American Depositary Receipts, Exchange-Traded Funds, and other relevant market indicators.
Debt securities maturing within 60 days at the time of purchase may be valued at cost, plus or minus any amortized discount or premium or at the evaluated mean as provided by an independent pricing service. Evaluated mean prices are commonly derived through utilization of market models, which may consider, among other factors, trade data, quotations from dealers and active market makers, relevant yield curve and spread data, related sector levels, creditworthiness, and other relevant market information on the same or comparable securities.
Investments in open-end management investment companies are valued at the reported net asset value per share. Repurchase agreements are valued at cost. Forward foreign currency exchange contracts are valued at the mean of the latest bid and asked prices of the forward currency rates as provided by an independent pricing service.
The value of investments initially expressed in foreign currencies is translated into U.S. dollars at prevailing exchange rates.
18
If the fund determines that the market price for a portfolio security is not readily available or the valuation methods mentioned above do not reflect a security’s fair value, such security is valued as determined in good faith by the Board of Directors or its designee, in accordance with procedures adopted by the Board of Directors. Circumstances that may cause the fund to use these procedures to value a security include, but are not limited to: a security has been declared in default; trading in a security has been halted during the trading day; there is a foreign market holiday and no trading occurred; or an event occurred between the close of a foreign exchange and the NYSE that may affect the value of a security.
Security Transactions — Security transactions are accounted for as of the trade date. Net realized gains and losses are determined on the identified cost basis, which is also used for federal income tax purposes.
Investment Income — Dividend income less foreign taxes withheld, if any, is recorded as of the ex-dividend date. Distributions received on securities that represent a return of capital or capital gain are recorded as a reduction of cost of investments and/or as a realized gain. The fund estimates the components of distributions received that may be considered nontaxable distributions or capital gain distributions for income tax purposes. Interest income is recorded on the accrual basis and includes accretion of discounts and amortization of premiums.
Foreign Currency Translations — All assets and liabilities initially expressed in foreign currencies are translated into U.S. dollars at prevailing exchange rates at period end. The fund may enter into spot foreign currency exchange contracts to facilitate transactions denominated in a foreign currency. Purchases and sales of investment securities, dividend and interest income, spot foreign currency exchange contracts, and expenses are translated at the rates of exchange prevailing on the respective dates of such transactions. Net realized and unrealized foreign currency exchange gains or losses related to investment securities are a component of net realized gain (loss) on investment transactions and change in net unrealized appreciation (depreciation) on investments, respectively.
Repurchase Agreements — The fund may enter into repurchase agreements with institutions that American Century Investment Management, Inc. (ACIM) (the investment advisor) has determined are creditworthy pursuant to criteria adopted by the Board of Directors. The fund requires that the collateral, represented by securities, received in a repurchase transaction be transferred to the custodian in a manner sufficient to enable the fund to obtain those securities in the event of a default under the repurchase agreement. ACIM monitors, on a daily basis, the securities transferred to ensure the value, including accrued interest, of the securities under each repurchase agreement is equal to or greater than amounts owed to the fund under each repurchase agreement.
Joint Trading Account — Pursuant to an Exemptive Order issued by the Securities and Exchange Commission, the fund, along with certain other funds in the American Century Investments family of funds, may transfer uninvested cash balances into a joint trading account. These balances are invested in one or more repurchase agreements that are collateralized by U.S. Treasury or Agency obligations.
Income Tax Status — It is the fund’s policy to distribute substantially all net investment income and net realized gains to shareholders and to otherwise qualify as a regulated investment company under provisions of the Internal Revenue Code. The fund is no longer subject to examination by tax authorities for years prior to 2009. At this time, management believes there are no uncertain tax positions which, based on their technical merit, would not be sustained upon examination and for which it is reasonably possible that the total amounts of unrecognized tax benefits will significantly change in the next twelve months. Accordingly, no provision has been made for federal or state income taxes.
Multiple Class — All shares of the fund represent an equal pro rata interest in the net assets of the class to which such shares belong, and have identical voting, dividend, liquidation and other rights and the same terms and conditions, except for class specific expenses and exclusive rights to vote on matters affecting only individual classes. Income, non-class specific expenses, and realized and unrealized capital gains and losses of the fund are allocated to each class of shares based on their relative net assets.
19
Distributions to Shareholders — Distributions from net investment income, if any, are generally declared and paid quarterly. Distributions from net realized gains, if any, are generally declared and paid annually.
Indemnifications — Under the corporation’s organizational documents, its officers and directors are indemnified against certain liabilities arising out of the performance of their duties to the fund. In addition, in the normal course of business, the fund enters into contracts that provide general indemnifications. The maximum exposure under these arrangements is unknown as this would involve future claims that may be made against a fund. The risk of material loss from such claims is considered by management to be remote.
3. Fees and Transactions with Related Parties
Management Fees — The corporation has entered into a management agreement with ACIM, under which ACIM provides the fund with investment advisory and management services in exchange for a single, unified management fee (the fee) per class. The agreement provides that all expenses of managing and operating the fund, except distribution and service fees, brokerage expenses, taxes, interest, fees and expenses of the independent directors (including legal counsel fees), and extraordinary expenses, will be paid by ACIM. The fee is computed and accrued daily based on each class’s daily net assets and paid monthly in arrears. The annual management fee is 1.00% for the Investor Class, A Class, C Class and R Class and 0.80% for the Institutional Class.
Distribution and Service Fees — The Board of Directors has adopted a separate Master Distribution and Individual Shareholder Services Plan for each of the A Class, C Class and R Class (collectively the plans), pursuant to Rule 12b-1 of the 1940 Act. The plans provide that the A Class will pay American Century Investment Services, Inc. (ACIS) an annual distribution and service fee of 0.25%. The plans provide that the C Class will pay ACIS an annual distribution and service fee of 1.00%, of which 0.25% is paid for individual shareholder services and 0.75% is paid for distribution services. The plans provide that the R Class will pay ACIS an annual distribution and service fee of 0.50%. The fees are computed and accrued daily based on each class’s daily net assets and paid monthly in arrears. The fees are used to pay financial intermediaries for distribution and individual shareholder services. Fees incurred under the plans during the year ended March 31, 2012 are detailed in the Statement of Operations.
Related Parties — Certain officers and directors of the corporation are also officers and/or directors of American Century Companies, Inc. (ACC), the parent of the corporation’s investment advisor, ACIM, the distributor of the corporation, ACIS, and the corporation’s transfer agent, American Century Services, LLC. Various funds in a series issued by American Century Asset Allocation Portfolios, Inc. (ACAAP) own, in aggregate, 6% of the shares of the fund. ACAAP does not invest in the fund for the purpose of exercising management or control.
The fund was eligible to invest in a money market fund for temporary purposes, which is managed by J.P. Morgan Investment Management, Inc. (JPMIM). The fund had a securities lending agreement with JPMorgan Chase Bank (JPMCB) and a mutual funds services agreement with J.P. Morgan Investor Services Co. (JPMIS). JPMCB was a custodian of the fund. JPMIM, JPMIS and JPMCB are wholly owned subsidiaries of JPMorgan Chase & Co. (JPM). Prior to August 31, 2011, JPM was an equity investor in ACC. The services provided to the fund by JPMIM, JPMIS and JPMCB terminated on July 31, 2011.
4. Investment Transactions
Purchases and sales of investment securities, excluding short-term investments, for the year ended March 31, 2012 were $1,981,234,100 and $1,546,758,511, respectively.
For the year ended March 31, 2012, the fund incurred net realized losses of $(219,323) from redemptions in kind. A redemption in kind occurs when a fund delivers securities from its portfolio in lieu of cash as payment to a redeeming shareholder.
20
5. Capital Share Transactions
Transactions in shares of the fund were as follows:
| Year ended March 31, 2012 | Year ended March 31, 2011 | ||||||||||||||
| Shares | Amount | Shares | Amount | ||||||||||||
| Investor Class/Shares Authorized | 500,000,000 | 250,000,000 | |||||||||||||
| Sold | 50,925,119 | $629,158,557 | 72,679,735 | $882,067,136 | |||||||||||
| Issued in reinvestment of distributions | 7,045,890 | 82,262,991 | 1,048,319 | 12,365,504 | |||||||||||
| Redeemed | (33,946,718 | ) | (413,311,343 | ) | (14,116,783 | ) | (168,457,048 | ) | |||||||
| 24,024,291 | 298,110,205 | 59,611,271 | 725,975,592 | ||||||||||||
| Institutional Class/Shares Authorized | 100,000,000 | 40,000,000 | |||||||||||||
| Sold | 10,959,261 | 137,129,146 | 8,642,241 | 99,291,094 | |||||||||||
| Issued in reinvestment of distributions | 875,263 | 10,238,214 | 151,992 | 1,786,456 | |||||||||||
| Redeemed | (4,418,001 | ) | (53,874,878 | ) | (1,842,986 | ) | (22,136,228 | ) | |||||||
| 7,416,523 | 93,492,482 | 6,951,247 | 78,941,322 | ||||||||||||
| A Class/Shares Authorized | 100,000,000 | 50,000,000 | |||||||||||||
| Sold | 14,668,229 | 181,220,194 | 12,326,960 | 147,472,567 | |||||||||||
| Issued in reinvestment of distributions | 1,310,915 | 15,282,287 | 170,784 | 2,000,933 | |||||||||||
| Redeemed | (7,789,361 | ) | (94,494,556 | ) | (2,680,188 | ) | (31,630,079 | ) | |||||||
| 8,189,783 | 102,007,925 | 9,817,556 | 117,843,421 | ||||||||||||
| C Class/Shares Authorized | 10,000,000 | 10,000,000 | |||||||||||||
| Sold | 833,571 | 10,307,713 | 457,926 | 5,640,665 | |||||||||||
| Issued in reinvestment of distributions | 48,026 | 557,883 | 948 | 10,937 | |||||||||||
| Redeemed | (150,453 | ) | (1,822,502 | ) | (7,495 | ) | (95,061 | ) | |||||||
| 731,144 | 9,043,094 | 451,379 | 5,556,541 | ||||||||||||
| R Class/Shares Authorized | 15,000,000 | 10,000,000 | |||||||||||||
| Sold | 1,963,335 | 24,313,727 | 2,347,333 | 28,450,865 | |||||||||||
| Issued in reinvestment of distributions | 226,428 | 2,636,322 | 28,213 | 327,105 | |||||||||||
| Redeemed | (1,379,934 | ) | (17,027,306 | ) | (715,651 | ) | (8,548,931 | ) | |||||||
| 809,829 | 9,922,743 | 1,659,895 | 20,229,039 | ||||||||||||
| Net increase (decrease) | 41,171,570 | $512,576,449 | 78,491,348 | $948,545,915 | |||||||||||
6. Fair Value Measurements
The fund’s securities valuation process is based on several considerations and may use multiple inputs to determine the fair value of the positions held by the fund. In conformity with accounting principles generally accepted in the United States of America, the inputs used to determine a valuation are classified into three broad levels as follows:
| • | Level 1 valuation inputs consist of unadjusted quoted prices in an active market for identical securities; |
| • | Level 2 valuation inputs consist of direct or indirect observable market data (including quoted prices for similar securities, evaluations of subsequent market events, interest rates, prepayment speeds, credit risk, etc.); or |
| • | Level 3 valuation inputs consist of unobservable data (including a fund’s own assumptions). |
The level classification is based on the lowest level input that is significant to the fair valuation measurement. The valuation inputs are not necessarily an indication of the risks associated with investing in these securities or other financial instruments.
21
The following is a summary of the level classifications as of period end. The Schedule of Investments provides additional information on the fund’s portfolio holdings.
| Level 1 | Level 2 | Level 3 | |
| Investment Securities | |||
| Domestic Common Stocks | $1,975,073,155 | — | — |
| Foreign Common Stocks | 74,247,258 | $ 98,965,911 | — |
| Exchange-Traded Funds | 64,139,289 | — | — |
| Temporary Cash Investments | 6,395,819 | 35,827,835 | — |
| Total Value of Investment Securities | $2,119,855,521 | $134,793,746 | — |
| Other Financial Instruments | |||
Total Unrealized Gain (Loss) on Forward Foreign Currency Exchange Contracts | — | $(10,301) | — |
7. Derivative Instruments
Foreign Currency Risk — The fund is subject to foreign currency exchange rate risk in the normal course of pursuing its investment objectives. The value of foreign investments held by a fund may be significantly affected by changes in foreign currency exchange rates. The dollar value of a foreign security generally decreases when the value of the dollar rises against the foreign currency in which the security is denominated and tends to increase when the value of the dollar declines against such foreign currency. A fund may enter into forward foreign currency exchange contracts to reduce a fund’s exposure to foreign currency exchange rate fluctuations. The net U.S. dollar value of foreign currency underlying all contractual commitments held by a fund and the resulting unrealized appreciation or depreciation are determined daily. Realized gain or loss is recorded upon the termination of the contract. Net realized and unrealized gains or losses occurring during the holding period of forward foreign currency exchange contracts are a component of net realized gain (loss) on foreign currency transactions and change in net unrealized appreciation (depreciation) on translation of assets and liabilities in foreign currencies, respectively. A fund bears the risk of an unfavorable change in the foreign currency exchange rate underlying the forward contract. Additionally, losses, up to the fair value, may arise if the counterparties do not perform under the contract terms. The foreign currency risk derivative instruments held at period end as disclosed on the Schedule of Investments are indicative of the fund’s typical volume during the period.
The value of foreign currency risk derivative instruments as of March 31, 2012, is disclosed on the Statement of Assets and Liabilities as an asset of $49,659 in unrealized gain on forward foreign currency exchange contracts and as a liability of $59,960 in unrealized loss on forward foreign currency exchange contracts. For the year ended March 31, 2012, the effect of foreign currency risk derivative instruments on the Statement of Operations was $1,791,012 in net realized gain (loss) on foreign currency transactions and $395,183 in change in net unrealized appreciation (depreciation) on translation of assets and liabilities in foreign currencies.
8. Risk Factors
There are certain risks involved in investing in foreign securities. These risks include those resulting from future adverse political, social and economic developments, fluctuations in currency exchange rates, the possible imposition of exchange controls, and other foreign laws or restrictions.
22
9. Federal Tax Information
The tax character of distributions paid during the years ended March 31, 2012 and
March 31, 2011 were as follows:
| 2012 | 2011 | |
| Distributions Paid From | ||
| Ordinary income | $50,289,780 | $18,784,544 |
| Long-term capital gains | $67,187,018 | — |
The book-basis character of distributions made during the year from net investment income or net realized gains may differ from their ultimate characterization for federal income tax purposes. These differences reflect the differing character of certain income items and net realized gains and losses for financial statement and tax purposes, and may result in reclassification among certain capital accounts on the financial statements.
As of March 31, 2012, the federal tax cost of investments and the components of distributable earnings on a tax-basis were as follows:
| Federal tax cost of investments | $2,133,667,035 | |||
| Gross tax appreciation of investments | $191,919,504 | |||
| Gross tax depreciation of investments | (70,937,272 | ) | ||
| Net tax appreciation (depreciation) of investments | $120,982,232 | |||
Net tax appreciation (depreciation) on derivatives and translation of assets and liabilities in foreign currencies | $69 | |||
| Net tax appreciation (depreciation) | $120,982,301 | |||
| Undistributed ordinary income | $28,437,009 | |||
| Accumulated long-term gains | $25,998,874 |
The difference between book-basis and tax-basis cost and unrealized appreciation (depreciation) is attributable primarily to the tax deferral of losses on wash sales and the realization for tax purposes of unrealized gains (losses) on certain foreign currency exchange contracts.
23
| For a Share Outstanding Throughout the Years Ended March 31 (except as noted) | |||||||||||||
| Per-Share Data | Ratios and Supplemental Data | ||||||||||||
| Income From Investment Operations: | Distributions From: | Ratio to Average Net Assets of: | |||||||||||
Net Asset Value, Beginning of Period | Net Investment Income (Loss)(1) | Net Realized and Unrealized Gain (Loss) | Total From Investment Operations | Net Investment Income | Net Realized Gains | Total Distributions | Net Asset Value, End of Period | Total Return(2) | Operating Expenses | Net Investment Income (Loss) | Portfolio Turnover Rate | Net Assets, End of Period (in thousands) | |
| Investor Class | |||||||||||||
| 2012 | $13.13 | 0.22 | 0.28 | 0.50 | (0.16) | (0.61) | (0.77) | $12.86 | 4.48% | 1.01% | 1.80% | 82% | $1,615,365 |
| 2011 | $11.41 | 0.25 | 1.70 | 1.95 | (0.23) | — | (0.23) | $13.13 | 17.34% | 1.01% | 2.07% | 71% | $1,334,230 |
| 2010 | $7.34 | 0.18 | 4.03 | 4.21 | (0.14) | — | (0.14) | $11.41 | 57.68% | 1.00% | 1.79% | 126% | $478,796 |
| 2009 | $10.66 | 0.19 | (3.32) | (3.13) | (0.19) | — | (0.19) | $7.34 | (29.66)% | 1.00% | 2.10% | 173% | $210,960 |
| 2008 | $13.33 | 0.16 | (1.51) | (1.35) | (0.16) | (1.16) | (1.32) | $10.66 | (10.84)% | 1.00% | 1.25% | 206% | $274,918 |
| Institutional Class | |||||||||||||
| 2012 | $13.14 | 0.25 | 0.27 | 0.52 | (0.19) | (0.61) | (0.80) | $12.86 | 4.60% | 0.81% | 2.00% | 82% | $262,032 |
| 2011 | $11.41 | 0.28 | 1.70 | 1.98 | (0.25) | — | (0.25) | $13.14 | 17.66% | 0.81% | 2.27% | 71% | $170,182 |
| 2010 | $7.34 | 0.20 | 4.03 | 4.23 | (0.16) | — | (0.16) | $11.41 | 58.00% | 0.80% | 1.99% | 126% | $68,487 |
| 2009 | $10.66 | 0.21 | (3.32) | (3.11) | (0.21) | — | (0.21) | $7.34 | (29.52)% | 0.80% | 2.30% | 173% | $17,859 |
| 2008 | $13.33 | 0.18 | (1.51) | (1.33) | (0.18) | (1.16) | (1.34) | $10.66 | (10.67)% | 0.80% | 1.45% | 206% | $17,378 |
A Class(3) | |||||||||||||
| 2012 | $13.13 | 0.19 | 0.29 | 0.48 | (0.14) | (0.61) | (0.75) | $12.86 | 4.19% | 1.26% | 1.55% | 82% | $316,497 |
| 2011 | $11.41 | 0.21 | 1.71 | 1.92 | (0.20) | — | (0.20) | $13.13 | 17.05% | 1.26% | 1.82% | 71% | $215,813 |
| 2010 | $7.34 | 0.15 | 4.04 | 4.19 | (0.12) | — | (0.12) | $11.41 | 57.28% | 1.25% | 1.54% | 126% | $75,435 |
| 2009 | $10.66 | 0.17 | (3.32) | (3.15) | (0.17) | — | (0.17) | $7.34 | (29.84)% | 1.25% | 1.85% | 173% | $26,039 |
| 2008 | $13.33 | 0.13 | (1.51) | (1.38) | (0.13) | (1.16) | (1.29) | $10.66 | (11.07)% | 1.25% | 1.00% | 206% | $25,932 |
24
| For a Share Outstanding Throughout the Years Ended March 31 (except as noted) | |||||||||||||
| Per-Share Data | Ratios and Supplemental Data | ||||||||||||
| Income From Investment Operations: | Distributions From: | Ratio to Average Net Assets of: | |||||||||||
Net Asset Value, Beginning of Period | Net Investment Income (Loss)(1) | Net Realized and Unrealized Gain (Loss) | Total From Investment Operations | Net Investment Income | Net Realized Gains | Total Distributions | Net Asset Value, End of Period | Total Return(2) | Operating Expenses | Net Investment Income (Loss) | Portfolio Turnover Rate | Net Assets, End of Period (in thousands) | |
| C Class | |||||||||||||
| 2012 | $13.14 | 0.11 | 0.27 | 0.38 | (0.07) | (0.61) | (0.68) | $12.84 | 3.41% | 2.01% | 0.80% | 82% | $15,242 |
| 2011 | $11.42 | 0.13 | 1.71 | 1.84 | (0.12) | — | (0.12) | $13.14 | 16.24% | 2.01% | 1.07% | 71% | $5,989 |
2010(4) | $10.97 | 0.02 | 0.43 | 0.45 | — | — | — | $11.42 | 4.10% | 2.00%(5) | 2.07%(5) | 126%(6) | $51 |
| R Class | |||||||||||||
| 2012 | $13.14 | 0.16 | 0.28 | 0.44 | (0.12) | (0.61) | (0.73) | $12.85 | 3.91% | 1.51% | 1.30% | 82% | $50,444 |
| 2011 | $11.41 | 0.19 | 1.71 | 1.90 | (0.17) | — | (0.17) | $13.14 | 16.85% | 1.51% | 1.57% | 71% | $40,933 |
| 2010 | $7.34 | 0.13 | 4.03 | 4.16 | (0.09) | — | (0.09) | $11.41 | 56.88% | 1.50% | 1.29% | 126% | $16,611 |
| 2009 | $10.65 | 0.15 | (3.32) | (3.17) | (0.14) | — | (0.14) | $7.34 | (29.95)% | 1.50% | 1.60% | 173% | $3,926 |
| 2008 | $13.32 | 0.10 | (1.51) | (1.41) | (0.10) | (1.16) | (1.26) | $10.65 | (11.30)% | 1.50% | 0.75% | 206% | $3,172 |
Notes to Financial Highlights
| (1) | Computed using average shares outstanding throughout the period. |
| (2) | Total returns are calculated based on the net asset value of the last business day and do not reflect applicable sales charges, if any. Total returns for periods less than one year are not annualized. |
| (3) | Prior to March 1, 2010, the A Class was referred to as the Advisor Class. |
| (4) | March 1, 2010 (commencement of sale) through March 31, 2010. |
| (5) | Annualized. |
| (6) | Portfolio turnover is calculated at the fund level. Percentage indicated was calculated for the year ended March 31, 2010. |
See Notes to Financial Statements.
25
To the Board of Directors and Shareholders of
American Century Capital Portfolios, Inc.:
We have audited the accompanying statement of assets and liabilities, including the schedule of investments, of Mid Cap Value Fund, one of the funds constituting American Century Capital Portfolios, Inc. (the “Corporation”) as of March 31, 2012, and the related statement of operations for the year then ended, the statements of changes in net assets for each of the two years in the period then ended, and the financial highlights for each of the five years in the period then ended. These financial statements and financial highlights are the responsibility of the Corporation’s management. Our responsibility is to express an opinion on these financial statements and financial highlights based on our audits.
We conducted our audits in accordance with the standards of the Public Company Accounting Oversight Board (United States). Those standards require that we plan and perform the audit to obtain reasonable assurance about whether the financial statements and financial highlights are free of material misstatement. The Corporation is not required to have, nor were we engaged to perform, an audit of its internal control over financial reporting. Our audits included consideration of internal control over financial reporting as a basis for designing audit procedures that are appropriate in the circumstances, but not for the purpose of expressing an opinion on the effectiveness of the Corporation’s internal control over financial reporting. Accordingly, we express no such opinion. An audit also includes examining, on a test basis, evidence supporting the amounts and disclosures in the financial statements, assessing the accounting principles used and significant estimates made by management, as well as evaluating the overall financial statement presentation. Our procedures included confirmation of securities owned as of March 31, 2012, by correspondence with the custodian and brokers; where replies were not received from brokers, we performed other auditing procedures. We believe that our audits provide a reasonable basis for our opinion.
In our opinion, such financial statements and financial highlights referred to above present fairly, in all material respects, the financial position of Mid Cap Value Fund of American Century Capital Portfolios, Inc., as of March 31, 2012, the results of its operations for the year then ended, the changes in its net assets for each of the two years in the period then ended, and the financial highlights for each of the five years in the period then ended, in conformity with accounting principles generally accepted in the United States of America.
Deloitte & Touche LLP
Kansas City, Missouri
May 16, 2012
26
The Board of Directors
The individuals listed below serve as directors of the funds. Each director will continue to serve in this capacity until death, retirement, resignation or removal from office. The mandatory retirement age for directors who are not “interested persons,” as that term is defined in the Investment Company Act (independent directors), is 72. However, the mandatory retirement age for an individual director may be extended with the approval of the remaining independent directors.
Mr. Thomas is an “interested person” because he currently serves as President and Chief Executive Officer of American Century Companies, Inc. (ACC), the parent company of American Century Investment Management, Inc. (ACIM or the advisor). Mr. Fink is an “interested person” because he currently serves as Executive Vice President and Chief Operating Officer of ACC.
The other directors (more than three-fourths of the total number) are independent; that is, they have never been employees, directors or officers of, and have no financial interest in, ACC or any of its wholly owned, direct or indirect, subsidiaries, including ACIM, American Century Investment Services, Inc. (ACIS) and American Century Services, LLC (ACS). The directors serve in this capacity for seven (in the case of Mr. Thomas, 15) registered investment companies in the American Century Investments family of funds.
The following table presents additional information about the directors. The mailing address for each director is 4500 Main Street, Kansas City, Missouri 64111.
Name (Year of Birth) | Position(s) Held with Funds | Length of Time Served | Principal Occupation(s) During Past 5 Years | Number of American Century Portfolios Overseen by Director | Other Directorships Held During Past 5 Years | |
| Independent Directors | ||||||
Thomas A. Brown (1940) | Director | Since 1980 | Managing Member, Associated Investments, LLC (real estate investment company); Brown Cascade Properties, LLC (real estate investment company) (2001 to 2009) | 66 | None | |
Andrea C. Hall (1945) | Director | Since 1997 | Retired | 66 | None | |
Jan M. Lewis (1957) | Director | Since 2011 | President and Chief Executive Officer, Catholic Charities of Northeast Kansas (human services organization) (2006 to present) | 66 | None | |
James A. Olson (1942) | Director | Since 2007 | Member, Plaza Belmont LLC (private equity fund manager) | 66 | Saia, Inc. (2002 to 2012) and Entertainment Properties Trust | |
Donald H. Pratt (1937) | Director and Chairman of the Board | Since 1995 (Chairman since 2005) | Chairman and Chief Executive Officer, Western Investments, Inc. (real estate company) | 66 | None | |
27
Name (Year of Birth) | Position(s) Held with Funds | Length of Time Served | Principal Occupation(s) During Past 5 Years | Number of American Century Portfolios Overseen by Director | Other Directorships Held During Past 5 Years | |
| Independent Directors | ||||||
M. Jeannine Strandjord (1945) | Director | Since 1994 | Retired | 66 | DST Systems Inc., Euronet Worldwide Inc., and Charming Shoppes, Inc. (2006 to 2010) | |
John R. Whitten (1946) | Director | Since 2008 | Project Consultant, Celanese Corp. (industrial chemical company) | 66 | Rudolph Technologies, Inc. | |
Stephen E. Yates (1948) | Director | Since 2012 | Retired; Executive Vice President, Technology & Operations, KeyCorp. (computer services) (2004 to 2010) | 66 | Applied Industrial Technology (2001 to 2010) | |
| Interested Directors | ||||||
Barry Fink (1955) | Director and Executive Vice President | Since 2012 (Executive Vice President since 2007) | Chief Operating Officer and Executive Vice President, ACC (September 2007 to present); President, ACS (October 2007 to present); Managing Director, Morgan Stanley (2000 to 2007). Also serves as Manager, ACS and Director, ACC and certain ACC subsidiaries | 66 | None | |
Jonathan S. Thomas (1963) | Director and President | Since 2007 | President and Chief Executive Officer, ACC (March 2007 to present); Chief Administrative Officer, ACC (February 2006 to February 2007); Executive Vice President, ACC (November 2005 to February 2007). Also serves as Chief Executive Officer and Manager, ACS; Executive Vice President, ACIM; Director, ACC, ACIM and other ACC subsidiaries | 108 | None | |
28
Officers
The following table presents certain information about the executive officers of the funds. Each officer serves as an officer for each of the 15 investment companies in the American Century family of funds, unless otherwise noted. No officer is compensated for his or her service as an officer of the funds. The listed officers are interested persons of the funds and are appointed or re-appointed on an annual basis. The mailing address for each officer listed below is 4500 Main Street, Kansas City, Missouri 64111.
Name (Year of Birth) | Offices with the Funds | Principal Occupation(s) During the Past Five Years | |
Jonathan S. Thomas (1963) | Director and President since 2007 | President and Chief Executive Officer, ACC (March 2007 to present); Chief Administrative Officer, ACC (February 2006 to February 2007); Executive Vice President, ACC (November 2005 to February 2007). Also serves as Chief Executive Officer and Manager, ACS; Executive Vice President, ACIM; Director, ACC, ACIM and other ACC subsidiaries | |
Barry Fink (1955) | Director since 2012 and Executive Vice President since 2007 | Chief Operating Officer and Executive Vice President, ACC (September 2007 to present); President, ACS (October 2007 to present); Managing Director, Morgan Stanley (2000 to 2007). Also serves as Manager, ACS and Director, ACC and certain ACC subsidiaries | |
Maryanne L. Roepke (1956) | Chief Compliance Officer since 2006 and Senior Vice President since 2000 | Chief Compliance Officer, American Century funds, ACIM and ACS (August 2006 to present). Also serves as Senior Vice President, ACS | |
Charles A. Etherington (1957) | General Counsel since 2007 and Senior Vice President since 2006 | Attorney, ACC (February 1994 to present); Vice President, ACC (November 2005 to present), General Counsel, ACC (March 2007 to present); Also serves as General Counsel, ACIM, ACS, ACIS and other ACC subsidiaries; and Senior Vice President, ACIM and ACS | |
C. Jean Wade (1964) | Vice President, Treasurer and Chief Financial Officer since 2012 | Vice President, ACS (February 2000 to present) | |
Robert J. Leach (1966) | Vice President since 2006 and Assistant Treasurer since 2012 | Vice President, ACS (February 2000 to present) | |
David H. Reinmiller (1963) | Vice President since 2000 | Attorney, ACC (January 1994 to present); Associate General Counsel, ACC (January 2001 to present). Also serves as Vice President, ACIM and ACS | |
Ward D. Stauffer (1960) | Secretary since 2005 | Attorney, ACC (June 2003 to present) |
The Statement of Additional Information has additional information about the fund’s directors and is available without charge, upon request, by calling 1-800-345-2021.
29
Retirement Account Information
As required by law, distributions you receive from certain IRAs, or 403(b), 457 and qualified plans are subject to federal income tax withholding, unless you elect not to have withholding apply. Tax will be withheld on the total amount withdrawn even though you may be receiving amounts that are not subject to withholding, such as nondeductible contributions. In such case, excess amounts of withholding could occur. You may adjust your withholding election so that a greater or lesser amount will be withheld.
If you don’t want us to withhold on this amount, you must notify us to not withhold the federal income tax. You may notify us in writing or in certain situations by telephone or through other electronic means. You have the right to revoke your withholding election at any time and any election you make may remain in effect until revoked by filing a new election.
Remember, even if you elect not to have income tax withheld, you are liable for paying income tax on the taxable portion of your withdrawal. If you elect not to have income tax withheld or you don’t have enough income tax withheld, you may be responsible for payment of estimated tax. You may incur penalties under the estimated tax rules if your withholding and estimated tax payments are not sufficient. You can reduce or defer the income tax on a distribution by directly or indirectly rolling such distribution over to another IRA or eligible plan. You should consult your tax advisor for additional information.
State tax will be withheld if, at the time of your distribution, your address is within one of the mandatory withholding states and you have federal income tax withheld. State taxes will be withheld from your distribution in accordance with the respective state rules.
Proxy Voting Guidelines
American Century Investment Management, Inc., the fund’s investment advisor, is responsible for exercising the voting rights associated with the securities purchased and/or held by the fund. A description of the policies and procedures the advisor uses in fulfilling this responsibility is available without charge, upon request, by calling 1-800-345-2021. It is also available on American Century Investments’ website at americancentury.com and on the Securities and Exchange Commission’s website at sec.gov. Information regarding how the investment advisor voted proxies relating to portfolio securities during the most recent 12-month period ended June 30 is available on the “About Us” page at americancentury.com. It is also available at sec.gov.
Quarterly Portfolio Disclosure
The fund files its complete schedule of portfolio holdings with the Securities and Exchange Commission (SEC) for the first and third quarters of each fiscal year on Form N-Q. The fund’s Forms N-Q are available on the SEC’s website at sec.gov, and may be reviewed and copied at the SEC’s Public Reference Room in Washington, DC. Information on the operation of the Public Reference Room may be obtained by calling 1-800-SEC-0330. The fund also makes its complete schedule of portfolio holdings for the most recent quarter of its fiscal year available on its website at americancentury.com and, upon request, by calling 1-800-345-2021.
30
Other Tax Information
The following information is provided pursuant to provisions of the Internal Revenue Code.
The fund hereby designates up to the maximum amount allowable as qualified dividend income for the fiscal year ended March 31, 2012.
For corporate taxpayers, the fund hereby designates $50,289,780, or up to the maximum amount allowable, of ordinary income distributions paid during the fiscal year ended March 31, 2012 as qualified for the corporate dividends received deduction.
The fund hereby designates $67,187,018, or up to the maximum amount allowable, as long-term capital gain distributions for the fiscal year ended March 31, 2012.
31
| Contact Us | americancentury.com |
| Automated Information Line | 1-800-345-8765 |
| Investor Services Representative | 1-800-345-2021 or 816-531-5575 |
| Investors Using Advisors | 1-800-378-9878 |
Business, Not-For-Profit, Employer-Sponsored Retirement Plans | 1-800-345-3533 |
Banks and Trust Companies, Broker-Dealers, Financial Professionals, Insurance Companies | 1-800-345-6488 |
| Telecommunications Device for the Deaf | 1-800-634-4113 |
American Century Capital Portfolios, Inc.
Investment Advisor:
American Century Investment Management, Inc.
Kansas City, Missouri
This report and the statements it contains are submitted for the general information of our shareholders. The report is not authorized for distribution to prospective investors unless preceded or accompanied by an effective prospectus.
©2012 American Century Proprietary Holdings, Inc. All rights reserved.
CL-ANN-75032 1205
ANNUAL REPORT MARCH 31, 2012
| Large Company Value Fund |
| President’s Letter | 2 |
| Independent Chairman’s Letter | 3 |
| Market Perspective | 4 |
| Performance | 5 |
| Portfolio Commentary | 7 |
| Fund Characteristics | 9 |
| Shareholder Fee Example | 10 |
| Schedule of Investments | 12 |
| Statement of Assets and Liabilities | 15 |
| Statement of Operations | 16 |
| Statement of Changes in Net Assets | 17 |
| Notes to Financial Statements | 18 |
| Financial Highlights | 25 |
| Report of Independent Registered Public Accounting Firm | 27 |
| Management | 28 |
| Additional Information | 31 |
Any opinions expressed in this report reflect those of the author as of the date of the report, and do not necessarily represent the opinions of American Century Investments® or any other person in the American Century Investments organization. Any such opinions are subject to change at any time based upon market or other conditions and American Century Investments disclaims any responsibility to update such opinions. These opinions may not be relied upon as investment advice and, because investment decisions made by American Century Investments funds are based on numerous factors, may not be relied upon as an indication of trading intent on behalf of any American Century Investments fund. Security examples are used for representational purposes only and are not intended as recommendations to purchase or sell securities. Performance information for comparative indices and securities is provided to American Century Investments by third party vendors. To the best of American Century Investments’ knowledge, such information is accurate at the time of printing.
Dear Investor:
Thank you for reviewing this annual report for the period ended March 31, 2012. Our report offers investment performance and portfolio information, presented with the expert perspective of our portfolio management team.
This report remains one of our most important vehicles for conveying information about fund returns, as well as market factors and strategies that affected fund performance. For additional, updated information, we encourage you to visit our website, americancentury.com. Click on the “Fund Performance” and “Insights & News” headings at the top of our Individual Investors site.
Mostly Positive U.S. Returns Belie the Period’s Volatility
U.S. market performance for the 12 months ended March 31, 2012 appeared more benign than it really was. Broadly speaking, U.S. stocks and bonds returned roughly 7-9% for the period, as indicated by the S&P 500 Index and the Barclays U.S. Aggregate Bond Index. But those solid returns masked the roller-coaster ride required to achieve them.
The reporting period began, in April 2011, with stock indices and U.S. Treasury yields at some of their highest levels since 2008, prior to the Financial Crisis plunge. These elevated levels reflected increased risk-taking as the markets priced in improving global economic growth, strong corporate earnings, and higher inflation.
This “risk-on” investing attitude switched to “risk-off” during the summer of 2011, transformed by high fuel prices, federal budget management concerns in the U.S., and the worsening sovereign debt crisis in Europe. Recessionary expectations pulled Treasury yields to record lows by September, and stock indices suffered double-digit declines from their peaks.
Sentiment switched again in the fourth quarter of 2011, as concerns about the European sovereign debt crisis and the U.S. economy eased. Renewed “risk-on” investing carried into the first quarter of 2012, boosting growth stocks and high-yield bonds in particular. But the financial markets remain subject to potentially high volatility as they continue to wrestle with uncertainties regarding Europe, the Middle East, economic strength, government budget deficits, and the U.S. presidential election. We believe strongly in adhering to a disciplined, diversified, long-term investment approach during volatile periods, and we appreciate your continued trust in us during these unsettled times.
Sincerely,
Jonathan Thomas
President and Chief Executive Officer
American Century Investments
2
Dear Fellow Shareholders,
The assets under management in American Century Investments’ funds grow through investors placing new assets in the funds and through market appreciation. Asset growth has been at near record levels over the past two years as market movements have been generally upward, the funds’ relative returns have been favorable, and the distribution strategies implemented by fund management have been successful.
The board reviews fund performance and distribution strategies on a regular basis. Several years ago, the fund’s management team discussed with the board its plans to grow fund assets in the intermediary, institutional and international distribution channels. These distribution strategies have produced strong positive growth. The growth in the intermediary channel recognizes the funds’ strong relative investment performance and the desire of many shareholders to seek financial guidance. Investors in both the institutional and international channels appear to find the funds’ risk-based investment strategies attractive. The board continues to support fund management’s strategies to increase fund assets and will continue to work to provide the benefits of these gains to fund shareholders.
We continue to receive a steady flow of very thoughtful questions from shareholders. If there are issues that you would like the board to address please email me at dhpratt@fundboardchair.com. Thank you for your continued investment in American Century Investments funds.
Best regards,
Don Pratt
3
By Phil Davidson,
Chief Investment Officer,
U.S. Value Equity
U.S. Stocks Advanced
Despite some meaningful market volatility, U.S. stocks generated positive performance for the one-year period ended March 31, 2012. The overall advance was driven by a robust equity market rally over the last six months of the period as economic conditions improved.
After rallying throughout much of April 2011, the stock market declined sharply from May through September amid weaker economic conditions in the U.S. and an increasingly challenging sovereign debt crisis in Europe. Public debt issues in the U.S. also weighed on the market as the government wrestled with the federal debt ceiling and a major credit rating agency downgraded the credit rating of U.S. debt from AAA to AA+ in August—the first such downgrade in the country’s history.
Market sentiment shifted markedly over the last six months of the period as evidence of improving economic growth helped ease concerns about a possible recession. Most notably, employment growth showed signs of life, helping push the unemployment rate down to a three-year low. Consumer spending and manufacturing activity also picked up, and mild winter weather provided a lift to the construction industry. The situation in Europe also improved as liquidity injections from the European Central Bank and a debt restructuring agreement in Greece helped provide some stability to the Continent’s debt markets and banking sector. The end result was a steady and substantial market rally over the last six months.
Value Stocks Lagged
As the table below illustrates, large-cap stocks and growth issues led the market’s overall advance. Growth stocks benefited the most from the improving economic environment over the last half of the period, along with investors’ greater appetite for risk. Sector performance also favored growth shares over value during the period. The top-performing sectors in the S&P 500 Index included information technology and consumer discretionary, two growth-oriented sectors of the market. In contrast, the financials sector, which is the largest sector weighting in most value indices, declined for the reporting period.
| U.S. Stock Index Returns | ||||
| For the 12 months ended March 31, 2012 | ||||
| Russell 1000 Index (Large-Cap) | 7.86% | Russell 2000 Index (Small-Cap) | -0.18% | |
| Russell 1000 Growth Index | 11.02% | Russell 2000 Growth Index | 0.68% | |
| Russell 1000 Value Index | 4.79% | Russell 2000 Value Index | -1.07% | |
| Russell Midcap Index | 3.31% | |||
| Russell Midcap Growth Index | 4.43% | |||
| Russell Midcap Value Index | 2.28% | |||
4
| Total Returns as of March 31, 2012 | ||||||
| Average Annual Returns | ||||||
Ticker Symbol | 1 year | 5 years | 10 years | Since Inception | Inception Date | |
| Investor Class | ALVIX | 6.91% | -1.31% | 3.69% | 4.03% | 7/30/99 |
| Russell 1000 Value Index | — | 4.79% | -0.81% | 4.58% | 3.84% | — |
| S&P 500 Index | — | 8.54% | 2.01% | 4.12% | 2.32% | — |
| Institutional Class | ALVSX | 7.29% | -1.08% | 3.91% | 3.93% | 8/10/01 |
A Class(1) No sales charge* With sales charge* | ALPAX | 6.83% 0.74% | -1.56% -2.71% | 3.43% 2.82% | 4.63% 4.09% | 10/26/00 |
B Class No sales charge* With sales charge* | ALBVX | 6.01% 2.01% | -2.29% -2.51% | — — | 5.34% 5.34% | 1/31/03 |
| C Class | ALPCX | 5.85% | -2.29% | 2.66% | 3.30% | 11/7/01 |
| R Class | ALVRX | 6.55% | -1.80% | — | 4.36% | 8/29/03 |
| * | Sales charges include initial sales charges and contingent deferred sales charges (CDSCs), as applicable. A Class shares have a 5.75% maximum initial sales charge and may be subject to a maximum CDSC of 1.00%. B Class shares redeemed within six years of purchase are subject to a CDSC that declines from 5.00% during the first year after purchase to 0.00% the sixth year after purchase. C Class shares redeemed within 12 months of purchase are subject to a maximum CDSC of 1.00%. The SEC requires that mutual funds provide performance information net of maximum sales charges in all cases where charges could be applied. |
| (1) | Prior to December 3, 2007, the A Class was referred to as the Advisor Class and did not have a front-end sales charge. Performance prior to that date has been adjusted to reflect this charge. |
Data presented reflect past performance. Past performance is no guarantee of future results. Current performance may be higher or lower than the performance shown. Investment return and principal value will fluctuate, and redemption value may be more or less than original cost. To obtain performance data current to the most recent month end, please call 1-800-345-2021 or visit americancentury.com.
Unless otherwise indicated, performance reflects Investor Class shares; performance for other share classes will vary due to differences in fee structure. For information about other share classes available, please consult the prospectus. Data assumes reinvestment of dividends and capital gains, and none of the charts reflect the deduction of taxes that a shareholder would pay on fund distributions or the redemption of fund shares. Returns for the indices are provided for comparison. The fund’s total returns include operating expenses (such as transaction costs and management fees) that reduce returns, while the total returns of the indices do not.
5
| Growth of $10,000 Over 10 Years |
| $10,000 investment made March 31, 2002 |
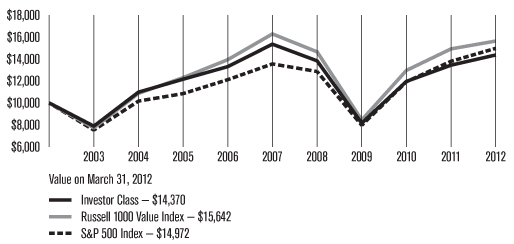
| Total Annual Fund Operating Expenses | |||||
| Investor Class | Institutional Class | A Class | B Class | C Class | R Class |
| 0.87% | 0.67% | 1.12% | 1.87% | 1.87% | 1.37% |
The total annual fund operating expenses shown is as stated in the fund’s prospectus current as of the date of this report. The prospectus may vary from the expense ratio shown elsewhere in this report because it is based on a different time period, includes acquired fund fees and expenses, and, if applicable, does not include fee waivers or expense reimbursements.
Data presented reflect past performance. Past performance is no guarantee of future results. Current performance may be higher or lower than the performance shown. Investment return and principal value will fluctuate, and redemption value may be more or less than original cost. To obtain performance data current to the most recent month end, please call 1-800-345-2021 or visit americancentury.com.
Unless otherwise indicated, performance reflects Investor Class shares; performance for other share classes will vary due to differences in fee structure. For information about other share classes available, please consult the prospectus. Data assumes reinvestment of dividends and capital gains, and none of the charts reflect the deduction of taxes that a shareholder would pay on fund distributions or the redemption of fund shares. Returns for the indices are provided for comparison. The fund’s total returns include operating expenses (such as transaction costs and management fees) that reduce returns, while the total returns of the indices do not.
6
Portfolio Managers: Brendan Healy and Matt Titus
Performance Summary
Large Company Value returned 6.91%* for the 12 months ended March 31, 2012. By comparison, its benchmark, the Russell 1000 Value Index, returned 4.79%. The broader market, as measured by the S&P 500 Index, returned 8.54%. The portfolio’s return reflects operating expenses, while the indices’ returns do not. The average return for Morningstar’s Large Cap Value category (its performance, like Large Company Value’s, reflects operating expenses) was 3.93%.**
The U.S. stock market posted a gain during the one-year reporting period, largely as a result of its strong performance during the first quarter of 2012. For most of the 12-month period, investors were preoccupied with Europe’s financial woes, which threatened to spread from Greece to other nations and seemed likely to cause problems for European banks. Lackluster U.S. economic growth and the downgrade of U.S. debt by Standard & Poor’s Ratings also dampened market sentiment. Investor risk appetite improved near the end of 2011 when the U.S. economy, proving surprisingly resilient, returned to its slow-growth path. Employers added new jobs, and corporate earnings remained solid. Investors also grew more optimistic as the European Central Bank provided inexpensive loans to European banks and the financial crisis eased. In this environment, growth stocks outperformed value stocks across the capitalization spectrum. For the reporting period, Large Company Value received positive results in absolute terms from eight of the 10 sectors in which it was invested. On a relative basis, it outperformed, aided by investments in the energy, consumer discretionary, and health care sectors. An underweight in utilities stocks detracted.
We carefully manage this portfolio for long-term results. Since Large Company Value’s inception on July 30, 1999, the portfolio has produced an average annual return of 4.03%, topping the returns for Morningstar’s Large Cap Value category average, the Russell 1000 Value Index, and the S&P 500 Index for the same period (see performance information on pages 5 and 6 or in footnotes below).
Energy Boosted Results
Large Company Value benefited from investments in large, integrated oil companies and its underweight in exploration and production stocks, which we consider expensive. Near the beginning of the reporting period, we had shifted the portfolio to a significant underweight in the energy equipment and services industry. This proved advantageous after oil prices peaked during the spring of 2011 and shares of energy equipment and services companies underperformed. The portfolio also benefited from the sale of strong performer National Oilwell Varco.
Consumer Discretionary Contributed
Strong stock selection across the consumer discretionary sector enhanced relative performance. In the media industry, the portfolio held Comcast Corp. The cable and television network operator has experienced growth in its broadband
| * | All fund returns referenced in this commentary are for Investor Class shares. |
| ** | The average returns for Morningstar’s Large Cap Value category were -0.24% and 4.09% for the five- and ten-year periods ended March 31, 2012, respectively, and 3.84% since July 30, 1999, the Investor Class’s inception. © 2012 Morningstar, Inc. All Rights Reserved. The information contained herein: (1) is proprietary to Morningstar and/or its content providers; (2) may not be copied or distributed; and (3) is not warranted to be accurate, complete or timely. Neither Morningstar nor its content providers are responsible for any damages or losses arising from any use of this information. |
7
and business services divisions and has reduced turnover among its pay-TV subscribers. Comcast has also returned value to shareholders by increasing its dividend and implementing a stock repurchase program. Among multiline retailers, Macy’s outperformed on better-than-expected sales at its stores and through its website. In specialty retailing, shares of home improvement retailer Lowe’s Companies appreciated on improvement in the U.S. housing market.
Health Care Aided Results
An overweight in health care, the strongest sector in the benchmark, added to relative performance. Large Company Value benefited from its mix of biotechnology and pharmaceutical stocks, including Amgen, Johnson & Johnson (J&J), and Abbott Laboratories. Amgen outperformed on the expectation of accelerated 2012 revenue growth, boosted by sales of the biotechnology firm’s new bone-building drugs. In addition, Amgen initiated a dividend, increased it, and conducted a modified Dutch auction in which it repurchased approximately $5 billion in outstanding shares. J&J performed well as it continued to work on resolving manufacturing issues that have resulted in costly recalls. The company appeared likely to benefit from a change in management during the reporting period. Abbott Laboratories’ shares advanced after the company announced it was splitting itself into two publicly traded companies. In addition, Abbott has some promising drug candidates in its pipeline, which could offset a sales decline when its blockbuster drug Humira loses patent protection.
An Underweight in Utilities Detracted
The portfolio was hampered by its underweight in utilities. Utilities stocks, which generally pay high dividends, were in strong demand during the reporting period. In our opinion, many of these stocks are overvalued.
Information Technology Provided Top Detractor
A top detractor was Hewlett-Packard (HP). As the computer industry evolves, HP has experienced weakness in its personal computer and printer segments. The services business also struggled. The company made an expensive acquisition during the reporting period and unexpectedly changed its chief executive officer.
Outlook
We continue to be bottom-up investment managers, evaluating each company individually and building the portfolio one stock at a time. As of March 31, 2012, Large Company Value is broadly diversified, with ongoing overweight positions in health care, telecommunication services, and information technology stocks. Our valuation work is also directing us toward smaller relative weightings in utilities, financials, and industrials stocks. We are still finding greater value opportunities among mega-cap stocks and have maintained our bias toward these firms.
8
| MARCH 31, 2012 | |
| Top Ten Holdings | % of net assets |
| Chevron Corp. | 4.3% |
| General Electric Co. | 3.7% |
| Pfizer, Inc. | 3.7% |
| JPMorgan Chase & Co. | 3.7% |
| Wells Fargo & Co. | 3.4% |
| Exxon Mobil Corp. | 3.3% |
| Procter & Gamble Co. (The) | 3.1% |
| AT&T, Inc. | 3.0% |
| Johnson & Johnson | 2.7% |
| Cisco Systems, Inc. | 2.6% |
| Top Five Industries | % of net assets |
| Oil, Gas and Consumable Fuels | 11.2% |
| Pharmaceuticals | 9.9% |
| Insurance | 8.4% |
| Commercial Banks | 6.5% |
| Diversified Financial Services | 6.1% |
| Types of Investments in Portfolio | % of net assets |
| Common Stocks | 98.4% |
| Temporary Cash Investments | 1.7% |
| Other Assets and Liabilities | (0.1)% |
9
Fund shareholders may incur two types of costs: (1) transaction costs, including sales charges (loads) on purchase payments and redemption/exchange fees; and (2) ongoing costs, including management fees; distribution and service (12b-1) fees; and other fund expenses. This example is intended to help you understand your ongoing costs (in dollars) of investing in your fund and to compare these costs with the ongoing cost of investing in other mutual funds.
The example is based on an investment of $1,000 made at the beginning of the period and held for the entire period from October 1, 2011 to March 31, 2012.
Actual Expenses
The table provides information about actual account values and actual expenses for each class. You may use the information, together with the amount you invested, to estimate the expenses that you paid over the period. First, identify the share class you own. Then simply divide your account value by $1,000 (for example, an $8,600 account value divided by $1,000 = 8.6), then multiply the result by the number under the heading “Expenses Paid During Period” to estimate the expenses you paid on your account during this period.
If you hold Investor Class shares of any American Century Investments fund, or Institutional Class shares of the American Century Diversified Bond Fund, in an American Century Investments account (i.e., not a financial intermediary or retirement plan account), American Century Investments may charge you a $12.50 semiannual account maintenance fee if the value of those shares is less than $10,000. We will redeem shares automatically in one of your accounts to pay the $12.50 fee. In determining your total eligible investment amount, we will include your investments in all personal accounts (including American Century Investments Brokerage accounts) registered under your Social Security number. Personal accounts include individual accounts, joint accounts, UGMA/UTMA accounts, personal trusts, Coverdell Education Savings Accounts and IRAs (including traditional, Roth, Rollover, SEP-, SARSEP- and SIMPLE-IRAs), and certain other retirement accounts. If you have only business, business retirement, employer-sponsored or American Century Investments Brokerage accounts, you are currently not subject to this fee. If you are subject to the Account Maintenance Fee, your account value could be reduced by the fee amount.
Hypothetical Example for Comparison Purposes
The table also provides information about hypothetical account values and hypothetical expenses based on the actual expense ratio of each class of your fund and an assumed rate of return of 5% per year before expenses, which is not the actual return of a fund’s share class. The hypothetical account values and expenses may not be used to estimate the actual ending account balance or expenses you paid for the period. You may use this information to compare the ongoing costs of investing in your fund and other funds. To do so, compare this 5% hypothetical example with the 5% hypothetical examples that appear in the shareholder reports of the other funds.
10
Please note that the expenses shown in the table are meant to highlight your ongoing costs only and do not reflect any transactional costs, such as sales charges (loads) or redemption/exchange fees. Therefore, the table is useful in comparing ongoing costs only, and will not help you determine the relative total costs of owning different funds. In addition, if these transactional costs were included, your costs would have been higher.
Beginning Account Value 10/1/11 | Ending Account Value 3/31/12 | Expenses Paid During Period(1) 10/1/11 – 3/31/12 | Annualized Expense Ratio(1) | |
| Actual | ||||
| Investor Class | $1,000 | $1,259.00 | $4.97 | 0.88% |
| Institutional Class | $1,000 | $1,262.20 | $3.85 | 0.68% |
| A Class | $1,000 | $1,257.50 | $6.38 | 1.13% |
| B Class | $1,000 | $1,254.50 | $10.60 | 1.88% |
| C Class | $1,000 | $1,253.00 | $10.59 | 1.88% |
| R Class | $1,000 | $1,258.00 | $7.79 | 1.38% |
| Hypothetical | ||||
| Investor Class | $1,000 | $1,020.60 | $4.45 | 0.88% |
| Institutional Class | $1,000 | $1,021.60 | $3.44 | 0.68% |
| A Class | $1,000 | $1,019.35 | $5.70 | 1.13% |
| B Class | $1,000 | $1,015.60 | $9.47 | 1.88% |
| C Class | $1,000 | $1,015.60 | $9.47 | 1.88% |
| R Class | $1,000 | $1,018.10 | $6.96 | 1.38% |
| (1) | Expenses are equal to the class’s annualized expense ratio listed in the table above, multiplied by the average account value over the period, multiplied by 183, the number of days in the most recent fiscal half-year, divided by 366, to reflect the one-half year period. |
11
| Shares | Value | |||||||
| Common Stocks — 98.4% | ||||||||
| AEROSPACE AND DEFENSE — 1.5% | ||||||||
| Honeywell International, Inc. | 49,500 | $3,021,975 | ||||||
| Northrop Grumman Corp. | 37,700 | 2,302,716 | ||||||
| Raytheon Co. | 105,500 | 5,568,290 | ||||||
| 10,892,981 | ||||||||
| AIRLINES — 0.5% | ||||||||
| Southwest Airlines Co. | 461,300 | 3,801,112 | ||||||
| AUTOMOBILES — 1.0% | ||||||||
| Ford Motor Co. | 595,400 | 7,436,546 | ||||||
| BEVERAGES — 0.9% | ||||||||
| PepsiCo, Inc. | 96,400 | 6,396,140 | ||||||
| BIOTECHNOLOGY — 1.5% | ||||||||
| Amgen, Inc. | 131,400 | 8,933,886 | ||||||
Gilead Sciences, Inc.(1) | 30,900 | 1,509,465 | ||||||
| 10,443,351 | ||||||||
| CAPITAL MARKETS — 3.8% | ||||||||
| Ameriprise Financial, Inc. | 123,800 | 7,072,694 | ||||||
| Bank of New York Mellon Corp. (The) | 262,500 | 6,334,125 | ||||||
| BlackRock, Inc. | 25,000 | 5,122,500 | ||||||
| Goldman Sachs Group, Inc. (The) | 62,600 | 7,785,562 | ||||||
| Morgan Stanley | 76,600 | 1,504,424 | ||||||
| 27,819,305 | ||||||||
| CHEMICALS — 0.5% | ||||||||
| E.I. du Pont de Nemours & Co. | 71,100 | 3,761,190 | ||||||
| COMMERCIAL BANKS — 6.5% | ||||||||
| PNC Financial Services Group, Inc. | 161,000 | 10,382,890 | ||||||
| U.S. Bancorp | 382,600 | 12,120,768 | ||||||
| Wells Fargo & Co. | 721,500 | 24,632,010 | ||||||
| 47,135,668 | ||||||||
| COMMERCIAL SERVICES AND SUPPLIES — 0.3% | ||||||||
| Avery Dennison Corp. | 67,700 | 2,039,801 | ||||||
| COMMUNICATIONS EQUIPMENT — 2.6% | ||||||||
| Cisco Systems, Inc. | 899,300 | 19,020,195 | ||||||
| COMPUTERS AND PERIPHERALS — 1.3% | ||||||||
| Hewlett-Packard Co. | 358,000 | 8,531,140 | ||||||
Western Digital Corp.(1) | 15,200 | 629,128 | ||||||
| 9,160,268 | ||||||||
| DIVERSIFIED FINANCIAL SERVICES — 6.1% | ||||||||
| Bank of America Corp. | 454,400 | 4,348,608 | ||||||
| Citigroup, Inc. | 360,800 | 13,187,240 | ||||||
| JPMorgan Chase & Co. | 579,100 | 26,627,018 | ||||||
| 44,162,866 | ||||||||
| DIVERSIFIED TELECOMMUNICATION SERVICES — 5.6% | ||||||||
| AT&T, Inc. | 708,000 | 22,110,840 | ||||||
| CenturyLink, Inc. | 204,900 | 7,919,385 | ||||||
| Verizon Communications, Inc. | 280,000 | 10,704,400 | ||||||
| 40,734,625 | ||||||||
| ELECTRIC UTILITIES — 2.9% | ||||||||
| American Electric Power Co., Inc. | 140,400 | 5,416,632 | ||||||
| Exelon Corp. | 94,400 | 3,701,424 | ||||||
| NV Energy, Inc. | 179,600 | 2,895,152 | ||||||
| Pinnacle West Capital Corp. | 95,200 | 4,560,080 | ||||||
| PPL Corp. | 164,600 | 4,651,596 | ||||||
| 21,224,884 | ||||||||
| ENERGY EQUIPMENT AND SERVICES — 1.2% | ||||||||
| Baker Hughes, Inc. | 99,400 | 4,168,836 | ||||||
| Schlumberger Ltd. | 60,200 | 4,209,786 | ||||||
| 8,378,622 | ||||||||
| FOOD AND STAPLES RETAILING — 2.9% | ||||||||
| CVS Caremark Corp. | 200,800 | 8,995,840 | ||||||
| Kroger Co. (The) | 215,700 | 5,226,411 | ||||||
| Wal-Mart Stores, Inc. | 113,900 | 6,970,680 | ||||||
| 21,192,931 | ||||||||
| FOOD PRODUCTS — 0.6% | ||||||||
| Kraft Foods, Inc., Class A | 114,600 | 4,355,946 | ||||||
| HEALTH CARE EQUIPMENT AND SUPPLIES — 0.9% | ||||||||
| Medtronic, Inc. | 173,300 | 6,791,627 | ||||||
| HEALTH CARE PROVIDERS AND SERVICES — 1.7% | ||||||||
| Aetna, Inc. | 92,000 | 4,614,720 | ||||||
| Quest Diagnostics, Inc. | 24,400 | 1,492,060 | ||||||
| WellPoint, Inc. | 79,500 | 5,867,100 | ||||||
| 11,973,880 | ||||||||
| HOTELS, RESTAURANTS AND LEISURE — 0.2% | ||||||||
| Carnival Corp. | 52,700 | 1,690,616 | ||||||
| HOUSEHOLD PRODUCTS — 3.1% | ||||||||
| Procter & Gamble Co. (The) | 337,600 | 22,690,096 | ||||||
| INDUSTRIAL CONGLOMERATES — 4.4% | ||||||||
| General Electric Co. | 1,355,000 | 27,194,850 | ||||||
| Tyco International Ltd. | 87,000 | 4,887,660 | ||||||
| 32,082,510 | ||||||||
| INSURANCE — 8.4% | ||||||||
| Allstate Corp. (The) | 193,400 | 6,366,728 | ||||||
American International Group, Inc.(1) | 70,400 | 2,170,432 | ||||||
Berkshire Hathaway, Inc., Class B(1) | 94,100 | 7,636,215 | ||||||
| Chubb Corp. (The) | 67,900 | 4,692,569 | ||||||
| Loews Corp. | 174,900 | 6,973,263 | ||||||
12
| Shares | Value | |||||||
| MetLife, Inc. | 250,000 | $9,337,500 | ||||||
| Principal Financial Group, Inc. | 160,500 | 4,736,355 | ||||||
| Prudential Financial, Inc. | 125,900 | 7,980,801 | ||||||
| Torchmark Corp. | 41,500 | 2,068,775 | ||||||
| Travelers Cos., Inc. (The) | 154,200 | 9,128,640 | ||||||
| 61,091,278 | ||||||||
| IT SERVICES — 0.5% | ||||||||
Fiserv, Inc.(1) | 54,900 | 3,809,511 | ||||||
| MACHINERY — 1.0% | ||||||||
| Dover Corp. | 57,700 | 3,631,638 | ||||||
| Ingersoll-Rand plc | 89,000 | 3,680,150 | ||||||
| 7,311,788 | ||||||||
| MEDIA — 4.0% | ||||||||
| CBS Corp., Class B | 112,400 | 3,811,484 | ||||||
| Comcast Corp., Class A | 410,300 | 12,313,103 | ||||||
| Time Warner, Inc. | 284,400 | 10,736,100 | ||||||
| Viacom, Inc., Class B | 37,800 | 1,793,988 | ||||||
| 28,654,675 | ||||||||
| METALS AND MINING — 0.8% | ||||||||
| Freeport-McMoRan Copper & Gold, Inc. | 17,100 | 650,484 | ||||||
| Nucor Corp. | 119,700 | 5,141,115 | ||||||
| 5,791,599 | ||||||||
| MULTI-UTILITIES — 0.9% | ||||||||
| PG&E Corp. | 155,000 | 6,728,550 | ||||||
| MULTILINE RETAIL — 2.8% | ||||||||
| Kohl’s Corp. | 94,100 | 4,707,823 | ||||||
| Macy’s, Inc. | 107,500 | 4,270,975 | ||||||
| Target Corp. | 190,200 | 11,082,954 | ||||||
| 20,061,752 | ||||||||
| OIL, GAS AND CONSUMABLE FUELS — 11.2% | ||||||||
| Apache Corp. | 66,500 | 6,679,260 | ||||||
| Chevron Corp. | 290,600 | 31,163,944 | ||||||
| ConocoPhillips | 69,700 | 5,297,897 | ||||||
| Exxon Mobil Corp. | 274,700 | 23,824,731 | ||||||
| Occidental Petroleum Corp. | 26,000 | 2,475,980 | ||||||
| Total SA ADR | 142,000 | 7,259,040 | ||||||
Ultra Petroleum Corp.(1) | 91,900 | 2,079,697 | ||||||
| Valero Energy Corp. | 93,397 | 2,406,841 | ||||||
| 81,187,390 | ||||||||
| PAPER AND FOREST PRODUCTS — 0.6% | ||||||||
| International Paper Co. | 126,300 | 4,433,130 | ||||||
| PHARMACEUTICALS — 9.9% | ||||||||
| Abbott Laboratories | 104,300 | 6,392,547 | ||||||
| Johnson & Johnson | 295,500 | 19,491,180 | ||||||
| Merck & Co., Inc. | 492,200 | 18,900,480 | ||||||
| Pfizer, Inc. | 1,180,700 | 26,754,662 | ||||||
| 71,538,869 | ||||||||
| SEMICONDUCTORS AND SEMICONDUCTOR EQUIPMENT — 3.4% | ||||||||
| Applied Materials, Inc. | 381,400 | 4,744,616 | ||||||
| Intel Corp. | 668,300 | 18,785,913 | ||||||
Marvell Technology Group Ltd.(1) | 45,600 | 717,288 | ||||||
| 24,247,817 | ||||||||
| SOFTWARE — 2.3% | ||||||||
Adobe Systems, Inc.(1) | 93,900 | 3,221,709 | ||||||
| Microsoft Corp. | 208,500 | 6,724,125 | ||||||
| Oracle Corp. | 238,500 | 6,954,660 | ||||||
| 16,900,494 | ||||||||
| SPECIALTY RETAIL — 1.8% | ||||||||
| Lowe’s Cos., Inc. | 225,600 | 7,079,328 | ||||||
| Staples, Inc. | 369,100 | 5,972,038 | ||||||
| 13,051,366 | ||||||||
| TOBACCO — 0.8% | ||||||||
| Altria Group, Inc. | 185,700 | 5,732,559 | ||||||
TOTAL COMMON STOCKS (Cost $529,953,949) | 713,725,938 | |||||||
| Temporary Cash Investments — 1.7% | ||||||||
Repurchase Agreement, Bank America Merrill Lynch, (collateralized by various U.S. Treasury obligations, 6.125%, 11/15/27, valued at $4,522,076), in a joint trading account at 0.01%, dated 3/30/12, due 4/2/12 (Delivery value $4,429,029) | 4,429,025 | |||||||
Repurchase Agreement, Credit Suisse First Boston, Inc., (collateralized by various U.S. Treasury obligations, 4.375%, 5/15/41, valued at $2,819,927), in a joint trading account at 0.03%, dated 3/30/12, due 4/2/12 (Delivery value $2,768,147) | 2,768,140 | |||||||
Repurchase Agreement, Goldman Sachs & Co., (collateralized by various U.S. Treasury obligations, 4.50%, 5/15/38, valued at $3,394,847), in a joint trading account at 0.03%, dated 3/30/12, due 4/2/12 (Delivery value $3,321,777) | 3,321,769 | |||||||
| SSgA U.S. Government Money Market Fund | 1,868,691 | 1,868,691 | ||||||
TOTAL TEMPORARY CASH INVESTMENTS (Cost $12,387,625) | 12,387,625 | |||||||
TOTAL INVESTMENT SECURITIES — 100.1% (Cost $542,341,574) | 726,113,563 | |||||||
| OTHER ASSETS AND LIABILITIES — (0.1)% | (531,063 | ) | ||||||
| TOTAL NET ASSETS — 100.0% | $725,582,500 | |||||||
13
| Forward Foreign Currency Exchange Contracts | |||||
| Contracts to Sell | Counterparty | Settlement Date | Value | Unrealized Gain (Loss) | |
| 4,546,267 | EUR for USD | UBS AG | 4/30/12 | $6,064,050 | $(14,742) |
| 200,599 | EUR for USD | UBS AG | 4/30/12 | 267,570 | (81) |
| $6,331,620 | $(14,823) | ||||
(Value on Settlement Date $6,316,797)
Notes to Schedule of Investments
ADR = American Depositary Receipt
EUR = Euro
USD = United States Dollar
(1) Non-income producing.
See Notes to Financial Statements.
14
| MARCH 31, 2012 | ||||
| Assets | ||||
| Investment securities, at value (cost of $542,341,574) | $726,113,563 | |||
| Receivable for investments sold | 1,764,740 | |||
| Receivable for capital shares sold | 1,295,489 | |||
| Dividends and interest receivable | 1,174,614 | |||
| 730,348,406 | ||||
| Liabilities | ||||
| Payable for investments purchased | 3,658,453 | |||
| Payable for capital shares redeemed | 555,429 | |||
| Unrealized loss on forward foreign currency exchange contracts | 14,823 | |||
| Accrued management fees | 508,456 | |||
| Distribution and service fees payable | 28,745 | |||
| 4,765,906 | ||||
| Net Assets | $725,582,500 | |||
| Net Assets Consist of: | ||||
| Capital (par value and paid-in surplus) | $993,584,932 | |||
| Undistributed net investment income | 814,938 | |||
| Accumulated net realized loss | (452,574,536 | ) | ||
| Net unrealized appreciation | 183,757,166 | |||
| $725,582,500 | ||||
| Net assets | Shares outstanding | Net asset value per share | |
| Investor Class, $0.01 Par Value | $553,916,212 | 90,887,154 | $6.09 |
| Institutional Class, $0.01 Par Value | $77,705,957 | 12,744,502 | $6.10 |
| A Class, $0.01 Par Value | $75,521,201 | 12,398,226 | $6.09* |
| B Class, $0.01 Par Value | $2,753,123 | 450,425 | $6.11 |
| C Class, $0.01 Par Value | $9,231,606 | 1,514,942 | $6.09 |
| R Class, $0.01 Par Value | $6,454,401 | 1,058,835 | $6.10 |
*Maximum offering price $6.46 (net asset value divided by 0.9425).
See Notes to Financial Statements.
15
| YEAR ENDED MARCH 31, 2012 | ||||
| Investment Income (Loss) | ||||
| Income: | ||||
| Dividends (net of foreign taxes withheld of $40,245) | $21,517,678 | |||
| Interest | 5,955 | |||
| 21,523,633 | ||||
| Expenses: | ||||
| Management fees | 6,592,069 | |||
| Distribution and service fees: | ||||
| A Class | 192,061 | |||
| B Class | 33,975 | |||
| C Class | 92,378 | |||
| R Class | 31,533 | |||
| Directors’ fees and expenses | 35,460 | |||
| Other expenses | 3,639 | |||
| 6,981,115 | ||||
| Net investment income (loss) | 14,542,518 | |||
| Realized and Unrealized Gain (Loss) | ||||
| Net realized gain (loss) on: | ||||
| Investment transactions | 44,746,160 | |||
| Futures contract transactions | (3,104,807 | ) | ||
| Foreign currency transactions | 238,049 | |||
| 41,879,402 | ||||
| Change in net unrealized appreciation (depreciation) on: | ||||
| Investments | (25,190,272 | ) | ||
| Futures contracts | (10,395 | ) | ||
| Translation of assets and liabilities in foreign currencies | 13,976 | |||
| (25,186,691 | ) | |||
| Net realized and unrealized gain (loss) | 16,692,711 | |||
| Net Increase (Decrease) in Net Assets Resulting from Operations | $31,235,229 | |||
See Notes to Financial Statements.
16
| YEARS ENDED MARCH 31, 2012 AND MARCH 31, 2011 | ||||||||
| Increase (Decrease) in Net Assets | March 31, 2012 | March 31, 2011 | ||||||
| Operations | ||||||||
| Net investment income (loss) | $14,542,518 | $16,838,086 | ||||||
| Net realized gain (loss) | 41,879,402 | 10,567,602 | ||||||
| Change in net unrealized appreciation (depreciation) | (25,186,691 | ) | 67,053,564 | |||||
| Net increase (decrease) in net assets resulting from operations | 31,235,229 | 94,459,252 | ||||||
| Distributions to Shareholders | ||||||||
| From net investment income: | ||||||||
| Investor Class | (9,628,204 | ) | (10,094,453 | ) | ||||
| Institutional Class | (3,156,878 | ) | (4,486,401 | ) | ||||
| A Class | (1,150,666 | ) | (1,545,719 | ) | ||||
| B Class | (25,601 | ) | (25,699 | ) | ||||
| C Class | (72,119 | ) | (66,454 | ) | ||||
| R Class | (80,329 | ) | (133,483 | ) | ||||
| Decrease in net assets from distributions | (14,113,797 | ) | (16,352,209 | ) | ||||
| Capital Share Transactions | ||||||||
| Net increase (decrease) in net assets from capital share transactions | (268,943,132 | ) | (368,865,579 | ) | ||||
| Net increase (decrease) in net assets | (251,821,700 | ) | (290,758,536 | ) | ||||
| Net Assets | ||||||||
| Beginning of period | 977,404,200 | 1,268,162,736 | ||||||
| End of period | $725,582,500 | $977,404,200 | ||||||
| Undistributed net investment income | $814,938 | $402,206 | ||||||
See Notes to Financial Statements.
17
MARCH 31, 2012
1. Organization
American Century Capital Portfolios, Inc. (the corporation) is registered under the Investment Company Act of 1940, as amended (the 1940 Act), as an open-end management investment company and is organized as a Maryland corporation. Large Company Value Fund (the fund) is one fund in a series issued by the corporation. The fund is diversified as defined under the 1940 Act. The fund’s investment objective is to seek long-term capital growth. Income is a secondary objective. The fund pursues its objectives by investing primarily in companies with larger market capitalization that management believes to be undervalued at the time of purchase.
The fund is authorized to issue the Investor Class, the Institutional Class, the A Class, the B Class, the C Class and the R Class. The A Class may incur an initial sales charge. The A Class, B Class and C Class may be subject to a contingent deferred sales charge. The share classes differ principally in their respective sales charges and distribution and shareholder servicing expenses and arrangements. The Institutional Class is made available to institutional shareholders or through financial intermediaries whose clients do not require the same level of shareholder and administrative services as shareholders of other classes. As a result, the Institutional Class is charged a lower unified management fee.
2. Significant Accounting Policies
The following is a summary of significant accounting policies consistently followed by the fund in preparation of its financial statements. The financial statements are prepared in conformity with accounting principles generally accepted in the United States of America, which may require management to make certain estimates and assumptions at the date of the financial statements. Actual results could differ from these estimates.
Investment Valuations — The fund determines the fair value of its investments and computes its net asset value per share as of the close of regular trading (usually 4 p.m. Eastern time) on the New York Stock Exchange (NYSE) on each day the NYSE is open.
Equity securities that are listed or traded on a domestic securities exchange are valued at the last reported sales price or at the official closing price as provided by the exchange. Equity securities traded on foreign securities exchanges are typically valued at the closing price on the exchange where primarily traded or as of the close of the NYSE, if that is earlier. If no last sales price is reported, or if local convention or regulation so provides, the mean of the latest bid and asked prices is used. Depending on local convention or regulation, securities traded over-the-counter are valued at the mean of the latest bid and asked prices, the last sales price, or the official closing price. In its determination of fair value, the fund may review several factors including: market information specific to a security; news developments in U.S. and foreign markets; the performance of particular U.S. and foreign securities, indices, comparable securities, American Depositary Receipts, Exchange-Traded Funds, and other relevant market indicators.
Debt securities maturing within 60 days at the time of purchase may be valued at cost, plus or minus any amortized discount or premium or at the evaluated mean as provided by an independent pricing service. Evaluated mean prices are commonly derived through utilization of market models, which may consider, among other factors, trade data, quotations from dealers and active market makers, relevant yield curve and spread data, related sector levels, creditworthiness, and other relevant market information on the same or comparable securities.
Investments in open-end management investment companies are valued at the reported net asset value per share. Repurchase agreements are valued at cost. Exchange-traded futures contracts are valued at the settlement price as provided by the appropriate clearing corporation. Forward foreign currency exchange contracts are valued at the mean of the latest bid and asked prices of the forward currency rates as provided by an independent pricing service.
18
The value of investments initially expressed in foreign currencies is translated into U.S. dollars at prevailing exchange rates.
If the fund determines that the market price for a portfolio security is not readily available or the valuation methods mentioned above do not reflect a security’s fair value, such security is valued as determined in good faith by the Board of Directors or its designee, in accordance with procedures adopted by the Board of Directors. Circumstances that may cause the fund to use these procedures to value a security include, but are not limited to: a security has been declared in default; trading in a security has been halted during the trading day; there is a foreign market holiday and no trading occurred; or an event occurred between the close of a foreign exchange and the NYSE that may affect the value of a security.
Security Transactions — Security transactions are accounted for as of the trade date. Net realized gains and losses are determined on the identified cost basis, which is also used for federal income tax purposes.
Investment Income — Dividend income less foreign taxes withheld, if any, is recorded as of the ex-dividend date. Interest income is recorded on the accrual basis and includes accretion of discounts and amortization of premiums.
Foreign Currency Translations — All assets and liabilities initially expressed in foreign currencies are translated into U.S. dollars at prevailing exchange rates at period end. The fund may enter into spot foreign currency exchange contracts to facilitate transactions denominated in a foreign currency. Purchases and sales of investment securities, dividend and interest income, spot foreign currency exchange contracts, and expenses are translated at the rates of exchange prevailing on the respective dates of such transactions. Net realized and unrealized foreign currency exchange gains or losses related to investment securities are a component of net realized gain (loss) on investment transactions and change in net unrealized appreciation (depreciation) on investments, respectively.
Repurchase Agreements — The fund may enter into repurchase agreements with institutions that American Century Investment Management, Inc. (ACIM) (the investment advisor) has determined are creditworthy pursuant to criteria adopted by the Board of Directors. The fund requires that the collateral, represented by securities, received in a repurchase transaction be transferred to the custodian in a manner sufficient to enable the fund to obtain those securities in the event of a default under the repurchase agreement. ACIM monitors, on a daily basis, the securities transferred to ensure the value, including accrued interest, of the securities under each repurchase agreement is equal to or greater than amounts owed to the fund under each repurchase agreement.
Joint Trading Account — Pursuant to an Exemptive Order issued by the Securities and Exchange Commission, the fund, along with certain other funds in the American Century Investments family of funds, may transfer uninvested cash balances into a joint trading account. These balances are invested in one or more repurchase agreements that are collateralized by U.S. Treasury or Agency obligations.
Segregated Assets — In accordance with the 1940 Act, the fund segregates assets on its books and records to cover certain types of investments, including, but not limited to, futures contracts, forward commitments, when-issued securities, short sales, swap agreements and certain forward foreign currency exchange contracts. ACIM monitors, on a daily basis, the securities segregated to ensure the fund designates a sufficient amount of liquid assets, marked-to-market daily. The fund may also receive assets or be required to pledge assets at the custodian bank or with a broker for margin requirements on futures contracts and swap agreements.
Income Tax Status — It is the fund’s policy to distribute substantially all net investment income and net realized gains to shareholders and to otherwise qualify as a regulated investment company under provisions of the Internal Revenue Code. The fund is no longer subject to examination by tax authorities for years prior to 2009. At this time, management believes there are no uncertain tax positions which, based on their technical merit, would not be sustained upon examination and for which it is reasonably possible that the total amounts of unrecognized tax benefits will significantly change in the next twelve months. Accordingly, no provision has been made for federal or state income taxes.
19
Multiple Class — All shares of the fund represent an equal pro rata interest in the net assets of the class to which such shares belong, and have identical voting, dividend, liquidation and other rights and the same terms and conditions, except for class specific expenses and exclusive rights to vote on matters affecting only individual classes. Income, non-class specific expenses, and realized and unrealized capital gains and losses of the fund are allocated to each class of shares based on their relative net assets.
Distributions to Shareholders — Distributions from net investment income, if any, are generally declared and paid quarterly. Distributions from net realized gains, if any, are generally declared and paid annually.
Indemnifications — Under the corporation’s organizational documents, its officers and directors are indemnified against certain liabilities arising out of the performance of their duties to the fund. In addition, in the normal course of business, the fund enters into contracts that provide general indemnifications. The maximum exposure under these arrangements is unknown as this would involve future claims that may be made against a fund. The risk of material loss from such claims is considered by management to be remote.
3. Fees and Transactions with Related Parties
Management Fees — The corporation has entered into a management agreement with ACIM, under which ACIM provides the fund with investment advisory and management services in exchange for a single, unified management fee (the fee) per class. The agreement provides that all expenses of managing and operating the fund, except distribution and service fees, brokerage expenses, taxes, interest, fees and expenses of the independent directors (including legal counsel fees), and extraordinary expenses, will be paid by ACIM. The fee is computed and accrued daily based on each class’s daily net assets and paid monthly in arrears. The rate of the fee is determined by applying a fee rate calculation formula. This formula takes into account the fund’s assets as well as certain assets, if any, of other clients of the investment advisor outside the American Century Investments family of funds (such as subadvised funds and separate accounts) that have very similar investment teams and investment strategies (strategy assets). The strategy assets of the fund include the assets of NT Large Company Value Fund, one fund in a series issued by the corporation. The annual management fee schedule ranges from 0.70% to 0.90% for the Investor Class, A Class, B Class, C Class and R Class. The Institutional Class is 0.20% less at each point within the range. The effective annual management fee for each class for the year ended March 31, 2012 was 0.87% for the Investor Class, A Class, B Class, C Class and R Class and 0.67% for the Institutional Class.
Distribution and Service Fees — The Board of Directors has adopted a separate Master Distribution and Individual Shareholder Services Plan for each of the A Class, B Class, C Class and R Class (collectively the plans), pursuant to Rule 12b-1 of the 1940 Act. The plans provide that the A Class will pay American Century Investment Services, Inc. (ACIS) an annual distribution and service fee of 0.25%. The plans provide that the B Class and C Class will each pay ACIS an annual distribution and service fee of 1.00%, of which 0.25% is paid for individual shareholder services and 0.75% is paid for distribution services. The plans provide that the R Class will pay ACIS an annual distribution and service fee of 0.50%. The fees are computed and accrued daily based on each class’s daily net assets and paid monthly in arrears. The fees are used to pay financial intermediaries for distribution and individual shareholder services. Fees incurred under the plans during the year ended March 31, 2012 are detailed in the Statement of Operations.
Related Parties — Certain officers and directors of the corporation are also officers and/or directors of American Century Companies, Inc. (ACC), the parent of the corporation’s investment advisor, ACIM, the distributor of the corporation, ACIS, and the corporation’s transfer agent, American Century Services, LLC. Various funds in a series issued by American Century Asset Allocation Portfolios, Inc. (ACAAP) own, in aggregate, 32% of the shares of the fund. ACAAP does not invest in the fund for the purpose of exercising management or control.
20
The fund was eligible to invest in a money market fund for temporary purposes, which is managed by J.P. Morgan Investment Management, Inc. (JPMIM). The fund had a securities lending agreement with JPMorgan Chase Bank (JPMCB) and a mutual funds services agreement with J.P. Morgan Investor Services Co. (JPMIS). JPMCB was a custodian of the fund. JPMIM, JPMIS and JPMCB are wholly owned subsidiaries of JPMorgan Chase & Co. (JPM). Prior to August 31, 2011, JPM was an equity investor in ACC. The services provided to the fund by JPMIM, JPMIS and JPMCB terminated on July 31, 2011.
4. Investment Transactions
Purchases and sales of investment securities, excluding short-term investments, for the year ended March 31, 2012 were $443,614,033 and $706,812,358, respectively.
5. Capital Share Transactions
Transactions in shares of the fund were as follows:
| Year ended March 31, 2012 | Year ended March 31, 2011 | ||||||||||||||
| Shares | Amount | Shares | Amount | ||||||||||||
| Investor Class/Shares Authorized | 600,000,000 | 600,000,000 | |||||||||||||
| Sold | 24,910,328 | $138,308,453 | 20,916,343 | $109,100,382 | |||||||||||
| Issued in reinvestment of distributions | 1,712,887 | 9,435,563 | 1,779,568 | 9,380,186 | |||||||||||
| Redeemed | (44,366,377 | ) | (240,775,115 | ) | (64,195,407 | ) | (323,475,000 | ) | |||||||
| (17,743,162 | ) | (93,031,099 | ) | (41,499,496 | ) | (204,994,432 | ) | ||||||||
| Institutional Class/Shares Authorized | 200,000,000 | 200,000,000 | |||||||||||||
| Sold | 9,854,571 | 54,636,024 | 29,525,804 | 147,147,279 | |||||||||||
| Issued in reinvestment of distributions | 320,302 | 1,769,719 | 520,671 | 2,722,184 | |||||||||||
| Redeemed | (37,240,039 | ) | (206,177,197 | ) | (36,615,092 | ) | (191,057,880 | ) | |||||||
| (27,065,166 | ) | (149,771,454 | ) | (6,568,617 | ) | (41,188,417 | ) | ||||||||
| A Class/Shares Authorized | 100,000,000 | 100,000,000 | |||||||||||||
| Sold | 1,984,083 | 11,123,879 | 3,212,940 | 16,652,036 | |||||||||||
| Issued in reinvestment of distributions | 196,172 | 1,080,491 | 229,789 | 1,207,718 | |||||||||||
| Redeemed | (6,032,898 | ) | (33,420,309 | ) | (25,429,363 | ) | (122,762,880 | ) | |||||||
| (3,852,643 | ) | (21,215,939 | ) | (21,986,634 | ) | (104,903,126 | ) | ||||||||
| B Class/Shares Authorized | 5,000,000 | 5,000,000 | |||||||||||||
| Sold | 5,596 | 32,710 | 643 | 3,334 | |||||||||||
| Issued in reinvestment of distributions | 4,247 | 23,313 | 4,307 | 22,547 | |||||||||||
| Redeemed | (375,194 | ) | (2,089,149 | ) | (265,915 | ) | (1,412,132 | ) | |||||||
| (365,351 | ) | (2,033,126 | ) | (260,965 | ) | (1,386,251 | ) | ||||||||
| C Class/Shares Authorized | 20,000,000 | 20,000,000 | |||||||||||||
| Sold | 120,966 | 685,511 | 120,132 | 617,790 | |||||||||||
| Issued in reinvestment of distributions | 6,232 | 34,173 | 5,425 | 28,283 | |||||||||||
| Redeemed | (490,027 | ) | (2,761,000 | ) | (1,530,898 | ) | (8,001,009 | ) | |||||||
| (362,829 | ) | (2,041,316 | ) | (1,405,341 | ) | (7,354,936 | ) | ||||||||
| R Class/Shares Authorized | 10,000,000 | 10,000,000 | |||||||||||||
| Sold | 263,694 | 1,497,402 | 455,818 | 2,340,631 | |||||||||||
| Issued in reinvestment of distributions | 13,355 | 73,526 | 24,699 | 128,656 | |||||||||||
| Redeemed | (435,456 | ) | (2,421,126 | ) | (2,066,106 | ) | (11,507,704 | ) | |||||||
| (158,407 | ) | (850,198 | ) | (1,585,589 | ) | (9,038,417 | ) | ||||||||
| Net increase (decrease) | (49,547,558 | ) | $(268,943,132 | ) | (73,306,642 | ) | $(368,865,579 | ) | |||||||
21
6. Fair Value Measurements
The fund’s securities valuation process is based on several considerations and may use multiple inputs to determine the fair value of the positions held by the fund. In conformity with accounting principles generally accepted in the United States of America, the inputs used to determine a valuation are classified into three broad levels as follows:
| • | Level 1 valuation inputs consist of unadjusted quoted prices in an active market for identical securities; |
| • | Level 2 valuation inputs consist of direct or indirect observable market data (including quoted prices for similar securities, evaluations of subsequent market events, interest rates, prepayment speeds, credit risk, etc.); or |
| • | Level 3 valuation inputs consist of unobservable data (including a fund’s own assumptions). |
The level classification is based on the lowest level input that is significant to the fair valuation measurement. The valuation inputs are not necessarily an indication of the risks associated with investing in these securities or other financial instruments.
The following is a summary of the level classifications as of period end. The Schedule of Investments provides additional information on the fund’s portfolio holdings.
| Level 1 | Level 2 | Level 3 | |
| Investment Securities | |||
| Common Stocks | $713,725,938 | — | — |
| Temporary Cash Investments | 1,868,691 | $10,518,934 | — |
| Total Value of Investment Securities | $715,594,629 | $10,518,934 | — |
| Other Financial Instruments | |||
| Total Unrealized Gain (Loss) on Forward Foreign Currency Exchange Contracts | — | $(14,823) | — |
7. Derivative Instruments
Equity Price Risk — The fund is subject to equity price risk in the normal course of pursuing its investment objectives. A fund may enter into futures contracts based on an equity index in order to manage its exposure to changes in market conditions. A fund may purchase futures contracts to gain exposure to increases in market value or sell futures contracts to protect against a decline in market value. Upon entering into a futures contract, a fund is required to deposit either cash or securities in an amount equal to a certain percentage of the contract value (initial margin). Subsequent payments (variation margin) are made or received daily, in cash, by a fund. The variation margin is equal to the daily change in the contract value and is recorded as unrealized gains and losses. A fund recognizes a realized gain or loss when the contract is closed or expires. Net realized and unrealized gains or losses occurring during the holding period of futures contracts are a component of net realized gain (loss) on futures contract transactions and change in net unrealized appreciation (depreciation) on futures contracts, respectively. One of the risks of entering into futures contracts is the possibility that the change in value of the contract may not correlate with the changes in value of the underlying securities. The fund regularly purchased equity price risk derivative instruments during the first five months of the period and infrequently for temporary investment purposes, thereafter.
Foreign Currency Risk — The fund is subject to foreign currency exchange rate risk in the normal course of pursuing its investment objectives. The value of foreign investments held by a fund may be significantly affected by changes in foreign currency exchange rates. The dollar value of a foreign security generally decreases when the value of the dollar rises against the foreign currency in which the security is denominated and tends to increase when the value of the dollar declines against such foreign currency. A fund may enter into forward foreign currency exchange contracts to reduce a fund’s exposure
22
to foreign currency exchange rate fluctuations. The net U.S. dollar value of foreign currency underlying all contractual commitments held by a fund and the resulting unrealized appreciation or depreciation are determined daily. Realized gain or loss is recorded upon the termination of the contract. Net realized and unrealized gains or losses occurring during the holding period of forward foreign currency exchange contracts are a component of net realized gain (loss) on foreign currency transactions and change in net unrealized appreciation (depreciation) on translation of assets and liabilities in foreign currencies, respectively. A fund bears the risk of an unfavorable change in the foreign currency exchange rate underlying the forward contract. Additionally, losses, up to the fair value, may arise if the counterparties do not perform under the contract terms. The foreign currency risk derivative instruments held at period end as disclosed on the Schedule of Investments are indicative of the fund’s typical volume during the period.
Value of Derivative Instruments as of March 31, 2012
| Asset Derivatives | Liability Derivatives | ||||
| Type of Risk Exposure | Location on Statement of Assets and Liabilities | Value | Location on Statement of Assets and Liabilities | Value | |
| Foreign Currency Risk | Unrealized gain on forward foreign currency exchange contracts | — | Unrealized loss on forward foreign currency exchange contracts | $14,823 | |
Effect of Derivative Instruments on the Statement of Operations for the Year Ended March 31, 2012 | |||||
| Net Realized Gain (Loss) | Change in Net Unrealized Appreciation (Depreciation) | ||||
| Type of Risk Exposure | Location on Statement of Operations | Value | Location on Statement of Operations | Value | |
| Equity Price Risk | Net realized gain (loss) on futures contract transactions | $(3,104,807) | Change in net unrealized appreciation (depreciation) on futures contracts | $(10,395) | |
| Foreign Currency Risk | Net realized gain (loss) on foreign currency transactions | 238,049 | Change in net unrealized appreciation (depreciation) on translation of assets and liabilities in foreign currencies | 13,976 | |
| $(2,866,758) | $ 3,581 | ||||
8. Federal Tax Information
The tax character of distributions paid during the years ended March 31, 2012 and March 31, 2011 were as follows:
| 2012 | 2011 | |
| Distributions Paid From | ||
| Ordinary income | $14,113,797 | $16,352,209 |
| Long-term capital gains | — | — |
The book-basis character of distributions made during the year from net investment income or net realized gains may differ from their ultimate characterization for federal income tax purposes. These differences reflect the differing character of certain income items and net realized gains and losses for financial statement and tax purposes, and may result in reclassification among certain capital accounts on the financial statements.
23
As of March 31, 2012, the federal tax cost of investments and the components of distributable earnings on a tax-basis were as follows:
| Federal tax cost of investments | $576,531,439 | |||
| Gross tax appreciation of investments | $156,646,508 | |||
| Gross tax depreciation of investments | (7,064,384 | ) | ||
| Net tax appreciation (depreciation) of investments | $149,582,124 | |||
Net tax appreciation (depreciation) on derivatives and translation of assets and liabilities in foreign currencies | — | |||
| Net tax appreciation (depreciation) | $149,582,124 | |||
| Undistributed ordinary income | $814,938 | |||
| Accumulated capital losses | $(418,399,494 | ) | ||
The difference between book-basis and tax-basis cost and unrealized appreciation (depreciation) is attributable primarily to the tax deferral of losses on wash sales and the realization for tax purposes of unrealized gains (losses) on certain foreign currency exchange contracts.
The accumulated capital losses represent net capital loss carryovers that may be used to offset future realized capital gains for federal income tax purposes. Future capital loss carryover utilization in any given year may be subject to Internal Revenue Code limitations. Capital loss carryovers of $(116,322,394) and $(302,077,100) expire in 2017 and 2018, respectively. The Regulated Investment Company Modernization Act of 2010 allows the fund to carry forward capital losses incurred in future taxable years for an unlimited period. Any losses incurred during future taxable years will be required to be utilized prior to the losses which carry an expiration date. As a result, capital loss carryforwards may be more likely to expire unused.
24
| For a Share Outstanding Throughout the Years Ended March 31 (except as noted) | |||||||||||||
| Per-Share Data | Ratios and Supplemental Data | ||||||||||||
| Income From Investment Operations: | Distributions From: | Ratio to Average Net Assets of: | |||||||||||
Net Asset Value, Beginning of Period | Net Investment Income (Loss)(1) | Net Realized and Unrealized Gain (Loss) | Total From Investment Operations | Net Investment Income | Net Realized Gains | Total Distributions | Net Asset Value, End of Period | Total Return(2) | Operating Expenses | Net Investment Income (Loss) | Portfolio Turnover Rate | Net Assets, End of Period (in thousands) | |
| Investor Class | |||||||||||||
| 2012 | $5.80 | 0.10 | 0.29 | 0.39 | (0.10) | — | (0.10) | $6.09 | 6.91% | 0.87% | 1.84% | 56% | $553,916 |
| 2011 | $5.24 | 0.08 | 0.56 | 0.64 | (0.08) | — | (0.08) | $5.80 | 12.39% | 0.87% | 1.58% | 38% | $629,706 |
| 2010 | $3.64 | 0.09 | 1.60 | 1.69 | (0.09) | — | (0.09) | $5.24 | 46.68% | 0.85% | 1.87% | 25% | $786,992 |
| 2009 | $6.48 | 0.14 | (2.76) | (2.62) | (0.14) | (0.08) | (0.22) | $3.64 | (41.07)% | 0.83% | 2.57% | 22% | $569,483 |
| 2008 | $7.55 | 0.14 | (0.85) | (0.71) | (0.15) | (0.21) | (0.36) | $6.48 | (9.88)% | 0.83% | 1.93% | 18% | $1,251,631 |
| Institutional Class | |||||||||||||
| 2012 | $5.80 | 0.11 | 0.30 | 0.41 | (0.11) | — | (0.11) | $6.10 | 7.29% | 0.67% | 2.04% | 56% | $77,706 |
| 2011 | $5.24 | 0.09 | 0.56 | 0.65 | (0.09) | — | (0.09) | $5.80 | 12.61% | 0.67% | 1.78% | 38% | $230,853 |
| 2010 | $3.64 | 0.10 | 1.60 | 1.70 | (0.10) | — | (0.10) | $5.24 | 46.97% | 0.65% | 2.07% | 25% | $243,190 |
| 2009 | $6.48 | 0.15 | (2.76) | (2.61) | (0.15) | (0.08) | (0.23) | $3.64 | (40.95)% | 0.63% | 2.77% | 22% | $275,245 |
| 2008 | $7.55 | 0.16 | (0.86) | (0.70) | (0.16) | (0.21) | (0.37) | $6.48 | (9.70)% | 0.63% | 2.13% | 18% | $540,297 |
A Class(3) | |||||||||||||
| 2012 | $5.79 | 0.09 | 0.30 | 0.39 | (0.09) | — | (0.09) | $6.09 | 6.83% | 1.12% | 1.59% | 56% | $75,521 |
| 2011 | $5.24 | 0.07 | 0.55 | 0.62 | (0.07) | — | (0.07) | $5.79 | 11.92% | 1.12% | 1.33% | 38% | $94,159 |
| 2010 | $3.64 | 0.08 | 1.60 | 1.68 | (0.08) | — | (0.08) | $5.24 | 46.31% | 1.10% | 1.62% | 25% | $200,408 |
| 2009 | $6.47 | 0.12 | (2.74) | (2.62) | (0.13) | (0.08) | (0.21) | $3.64 | (41.12)% | 1.08% | 2.32% | 22% | $162,957 |
| 2008 | $7.55 | 0.12 | (0.86) | (0.74) | (0.13) | (0.21) | (0.34) | $6.47 | (10.24)% | 1.08% | 1.68% | 18% | $373,078 |
25
| For a Share Outstanding Throughout the Years Ended March 31 (except as noted) | |||||||||||||
| Per-Share Data | Ratios and Supplemental Data | ||||||||||||
| Income From Investment Operations: | Distributions From: | Ratio to Average Net Assets of: | |||||||||||
Net Asset Value, Beginning of Period | Net Investment Income (Loss)(1) | Net Realized and Unrealized Gain (Loss) | Total From Investment Operations | Net Investment Income | Net Realized Gains | Total Distributions | Net Asset Value, End of Period | Total Return(2) | Operating Expenses | Net Investment Income (Loss) | Portfolio Turnover Rate | Net Assets, End of Period (in thousands) | |
| B Class | |||||||||||||
| 2012 | $5.81 | 0.05 | 0.29 | 0.34 | (0.04) | — | (0.04) | $6.11 | 6.01% | 1.87% | 0.84% | 56% | $2,753 |
| 2011 | $5.26 | 0.03 | 0.55 | 0.58 | (0.03) | — | (0.03) | $5.81 | 11.04% | 1.87% | 0.58% | 38% | $4,743 |
| 2010 | $3.65 | 0.04 | 1.61 | 1.65 | (0.04) | — | (0.04) | $5.26 | 45.34% | 1.85% | 0.87% | 25% | $5,662 |
| 2009 | $6.49 | 0.08 | (2.75) | (2.67) | (0.09) | (0.08) | (0.17) | $3.65 | (41.58)% | 1.83% | 1.57% | 22% | $5,285 |
| 2008 | $7.57 | 0.07 | (0.87) | (0.80) | (0.07) | (0.21) | (0.28) | $6.49 | (10.88)% | 1.83% | 0.93% | 18% | $12,965 |
| C Class | |||||||||||||
| 2012 | $5.80 | 0.05 | 0.28 | 0.33 | (0.04) | — | (0.04) | $6.09 | 5.85% | 1.87% | 0.84% | 56% | $9,232 |
| 2011 | $5.24 | 0.03 | 0.56 | 0.59 | (0.03) | — | (0.03) | $5.80 | 11.27% | 1.87% | 0.58% | 38% | $10,885 |
| 2010 | $3.64 | 0.04 | 1.60 | 1.64 | (0.04) | — | (0.04) | $5.24 | 45.19% | 1.85% | 0.87% | 25% | $17,211 |
| 2009 | $6.47 | 0.08 | (2.74) | (2.66) | (0.09) | (0.08) | (0.17) | $3.64 | (41.56)% | 1.83% | 1.57% | 22% | $17,246 |
| 2008 | $7.55 | 0.07 | (0.87) | (0.80) | (0.07) | (0.21) | (0.28) | $6.47 | (10.91)% | 1.83% | 0.93% | 18% | $51,775 |
| R Class | |||||||||||||
| 2012 | $5.80 | 0.07 | 0.30 | 0.37 | (0.07) | — | (0.07) | $6.10 | 6.55% | 1.37% | 1.34% | 56% | $6,454 |
| 2011 | $5.24 | 0.05 | 0.56 | 0.61 | (0.05) | — | (0.05) | $5.80 | 11.83% | 1.37% | 1.08% | 38% | $7,058 |
| 2010 | $3.64 | 0.06 | 1.61 | 1.67 | (0.07) | — | (0.07) | $5.24 | 45.93% | 1.35% | 1.37% | 25% | $14,699 |
| 2009 | $6.48 | 0.11 | (2.76) | (2.65) | (0.11) | (0.08) | (0.19) | $3.64 | (41.36)% | 1.33% | 2.07% | 22% | $9,587 |
| 2008 | $7.56 | 0.11 | (0.87) | (0.76) | (0.11) | (0.21) | (0.32) | $6.48 | (10.45)% | 1.33% | 1.43% | 18% | $16,675 |
Notes to Financial Highlights
| (1) | Computed using average shares outstanding throughout the period. |
| (2) | Total returns are calculated based on the net asset value of the last business day and do not reflect applicable sales charges, if any. Total returns for periods less than one year are not annualized. |
| (3) | Prior to September 4, 2007, the A Class was referred to as the Advisor Class. |
See Notes to Financial Statements.
26
To the Board of Directors and Shareholders of
American Century Capital Portfolios, Inc.:
We have audited the accompanying statement of assets and liabilities, including the schedule of investments, of Large Company Value Fund, one of the funds constituting American Century Capital Portfolios, Inc. (the “Corporation”) as of March 31, 2012, and the related statement of operations for the year then ended, the statements of changes in net assets for each of the two years in the period then ended, and the financial highlights for each of the five years in the period then ended. These financial statements and financial highlights are the responsibility of the Corporation’s management. Our responsibility is to express an opinion on these financial statements and financial highlights based on our audits.
We conducted our audits in accordance with the standards of the Public Company Accounting Oversight Board (United States). Those standards require that we plan and perform the audit to obtain reasonable assurance about whether the financial statements and financial highlights are free of material misstatement. The Corporation is not required to have, nor were we engaged to perform, an audit of its internal control over financial reporting. Our audits included consideration of internal control over financial reporting as a basis for designing audit procedures that are appropriate in the circumstances, but not for the purpose of expressing an opinion on the effectiveness of the Corporation’s internal control over financial reporting. Accordingly, we express no such opinion. An audit also includes examining, on a test basis, evidence supporting the amounts and disclosures in the financial statements, assessing the accounting principles used and significant estimates made by management, as well as evaluating the overall financial statement presentation. Our procedures included confirmation of securities owned as of March 31, 2012, by correspondence with the custodian and brokers; where replies were not received from brokers, we performed other auditing procedures. We believe that our audits provide a reasonable basis for our opinion.
In our opinion, such financial statements and financial highlights referred to above present fairly, in all material respects, the financial position of Large Company Value Fund of American Century Capital Portfolios, Inc., as of March 31, 2012, the results of its operations for the year then ended, the changes in its net assets for each of the two years in the period then ended, and the financial highlights for each of the five years in the period then ended, in conformity with accounting principles generally accepted in the United States of America.
Deloitte & Touche LLP
Kansas City, Missouri
May 16, 2012
27
The Board of Directors
The individuals listed below serve as directors of the funds. Each director will continue to serve in this capacity until death, retirement, resignation or removal from office. The mandatory retirement age for directors who are not “interested persons,” as that term is defined in the Investment Company Act (independent directors), is 72. However, the mandatory retirement age for an individual director may be extended with the approval of the remaining independent directors.
Mr. Thomas is an “interested person” because he currently serves as President and Chief Executive Officer of American Century Companies, Inc. (ACC), the parent company of American Century Investment Management, Inc. (ACIM or the advisor). Mr. Fink is an “interested person” because he currently serves as Executive Vice President and Chief Operating Officer of ACC.
The other directors (more than three-fourths of the total number) are independent; that is, they have never been employees, directors or officers of, and have no financial interest in, ACC or any of its wholly owned, direct or indirect, subsidiaries, including ACIM, American Century Investment Services, Inc. (ACIS) and American Century Services, LLC (ACS). The directors serve in this capacity for seven (in the case of Mr. Thomas, 15) registered investment companies in the American Century Investments family of funds.
The following table presents additional information about the directors. The mailing address for each director is 4500 Main Street, Kansas City, Missouri 64111.
Name (Year of Birth) | Position(s) Held with Funds | Length of Time Served | Principal Occupation(s) During Past 5 Years | Number of American Century Portfolios Overseen by Director | Other Directorships Held During Past 5 Years | |
| Independent Directors | ||||||
Thomas A. Brown (1940) | Director | Since 1980 | Managing Member, Associated Investments, LLC (real estate investment company); Brown Cascade Properties, LLC (real estate investment company) (2001 to 2009) | 66 | None | |
Andrea C. Hall (1945) | Director | Since 1997 | Retired | 66 | None | |
Jan M. Lewis (1957) | Director | Since 2011 | President and Chief Executive Officer, Catholic Charities of Northeast Kansas (human services organization) (2006 to present) | 66 | None | |
James A. Olson (1942) | Director | Since 2007 | Member, Plaza Belmont LLC (private equity fund manager) | 66 | Saia, Inc. (2002 to 2012) and Entertainment Properties Trust | |
Donald H. Pratt (1937) | Director and Chairman of the Board | Since 1995 (Chairman since 2005) | Chairman and Chief Executive Officer, Western Investments, Inc. (real estate company) | 66 | None | |
28
Name (Year of Birth) | Position(s) Held with Funds | Length of Time Served | Principal Occupation(s) During Past 5 Years | Number of American Century Portfolios Overseen by Director | Other Directorships Held During Past 5 Years | |
| Independent Directors | ||||||
M. Jeannine Strandjord (1945) | Director | Since 1994 | Retired | 66 | DST Systems Inc., Euronet Worldwide Inc., and Charming Shoppes, Inc. (2006 to 2010) | |
John R. Whitten (1946) | Director | Since 2008 | Project Consultant, Celanese Corp. (industrial chemical company) | 66 | Rudolph Technologies, Inc. | |
Stephen E. Yates (1948) | Director | Since 2012 | Retired; Executive Vice President, Technology & Operations, KeyCorp. (computer services)(2004 to 2010) | 66 | Applied Industrial Technology (2001 to 2010) | |
| Interested Directors | ||||||
Barry Fink (1955) | Director and Executive Vice President | Since 2012 (Executive Vice President since 2007) | Chief Operating Officer and Executive Vice President, ACC (September 2007 to present); President, ACS (October 2007 to present); Managing Director, Morgan Stanley (2000 to 2007). Also serves as Manager, ACS and Director, ACC and certain ACC subsidiaries | 66 | None | |
Jonathan S. Thomas (1963) | Director and President | Since 2007 | President and Chief Executive Officer, ACC (March 2007 to present); Chief Administrative Officer, ACC (February 2006 to February 2007); Executive Vice President, ACC (November 2005 to February 2007). Also serves as Chief Executive Officer and Manager, ACS; Executive Vice President, ACIM; Director, ACC, ACIM and other ACC subsidiaries | 108 | None | |
29
Officers
The following table presents certain information about the executive officers of the funds. Each officer serves as an officer for each of the 15 investment companies in the American Century family of funds, unless otherwise noted. No officer is compensated for his or her service as an officer of the funds. The listed officers are interested persons of the funds and are appointed or re-appointed on an annual basis. The mailing address for each officer listed below is 4500 Main Street, Kansas City, Missouri 64111.
Name (Year of Birth) | Offices with the Funds | Principal Occupation(s) During the Past Five Years | |
Jonathan S. Thomas (1963) | Director and President since 2007 | President and Chief Executive Officer, ACC (March 2007 to present); Chief Administrative Officer, ACC (February 2006 to February 2007); Executive Vice President, ACC (November 2005 to February 2007). Also serves as Chief Executive Officer and Manager, ACS; Executive Vice President, ACIM; Director, ACC, ACIM and other ACC subsidiaries | |
Barry Fink (1955) | Director since 2012 and Executive Vice President since 2007 | Chief Operating Officer and Executive Vice President, ACC (September 2007 to present); President, ACS (October 2007 to present); Managing Director, Morgan Stanley (2000 to 2007). Also serves as Manager, ACS and Director, ACC and certain ACC subsidiaries | |
Maryanne L. Roepke (1956) | Chief Compliance Officer since 2006 and Senior Vice President since 2000 | Chief Compliance Officer, American Century funds, ACIM and ACS (August 2006 to present). Also serves as Senior Vice President, ACS | |
Charles A. Etherington (1957) | General Counsel since 2007 and Senior Vice President since 2006 | Attorney, ACC (February 1994 to present); Vice President, ACC (November 2005 to present), General Counsel, ACC (March 2007 to present); Also serves as General Counsel, ACIM, ACS, ACIS and other ACC subsidiaries; and Senior Vice President, ACIM and ACS | |
C. Jean Wade (1964) | Vice President, Treasurer and Chief Financial Officer since 2012 | Vice President, ACS (February 2000 to present) | |
Robert J. Leach (1966) | Vice President since 2006 and Assistant Treasurer since 2012 | Vice President, ACS (February 2000 to present) | |
David H. Reinmiller (1963) | Vice President since 2000 | Attorney, ACC (January 1994 to present); Associate General Counsel, ACC (January 2001 to present). Also serves as Vice President, ACIM and ACS | |
Ward D. Stauffer (1960) | Secretary since 2005 | Attorney, ACC (June 2003 to present) |
The Statement of Additional Information has additional information about the fund’s directors and is available without charge, upon request, by calling 1-800-345-2021.
30
Retirement Account Information
As required by law, distributions you receive from certain IRAs, or 403(b), 457 and qualified plans are subject to federal income tax withholding, unless you elect not to have withholding apply. Tax will be withheld on the total amount withdrawn even though you may be receiving amounts that are not subject to withholding, such as nondeductible contributions. In such case, excess amounts of withholding could occur. You may adjust your withholding election so that a greater or lesser amount will be withheld.
If you don’t want us to withhold on this amount, you must notify us to not withhold the federal income tax. You may notify us in writing or in certain situations by telephone or through other electronic means. You have the right to revoke your withholding election at any time and any election you make may remain in effect until revoked by filing a new election.
Remember, even if you elect not to have income tax withheld, you are liable for paying income tax on the taxable portion of your withdrawal. If you elect not to have income tax withheld or you don’t have enough income tax withheld, you may be responsible for payment of estimated tax. You may incur penalties under the estimated tax rules if your withholding and estimated tax payments are not sufficient. You can reduce or defer the income tax on a distribution by directly or indirectly rolling such distribution over to another IRA or eligible plan. You should consult your tax advisor for additional information.
State tax will be withheld if, at the time of your distribution, your address is within one of the mandatory withholding states and you have federal income tax withheld. State taxes will be withheld from your distribution in accordance with the respective state rules.
Proxy Voting Guidelines
American Century Investment Management, Inc., the fund’s investment advisor, is responsible for exercising the voting rights associated with the securities purchased and/or held by the fund. A description of the policies and procedures the advisor uses in fulfilling this responsibility is available without charge, upon request, by calling 1-800-345-2021. It is also available on American Century Investments’ website at americancentury.com and on the Securities and Exchange Commission’s website at sec.gov. Information regarding how the investment advisor voted proxies relating to portfolio securities during the most recent 12-month period ended June 30 is available on the “About Us” page at americancentury.com. It is also available at sec.gov.
Quarterly Portfolio Disclosure
The fund files its complete schedule of portfolio holdings with the Securities and Exchange Commission (SEC) for the first and third quarters of each fiscal year on Form N-Q. The fund’s Forms N-Q are available on the SEC’s website at sec.gov, and may be reviewed and copied at the SEC’s Public Reference Room in Washington, DC. Information on the operation of the Public Reference Room may be obtained by calling 1-800-SEC-0330. The fund also makes its complete schedule of portfolio holdings for the most recent quarter of its fiscal year available on its website at americancentury.com and, upon request, by calling 1-800-345-2021.
31
Other Tax Information
The following information is provided pursuant to provisions of the Internal Revenue Code.
The fund hereby designates up to the maximum amount allowable as qualified dividend income for the fiscal year ended March 31, 2012.
For corporate taxpayers, the fund hereby designates $14,113,797, or up to the maximum amount allowable, of ordinary income distributions paid during the fiscal year ended March 31, 2012 as qualified for the corporate dividends received deduction.
32
| Contact Us | americancentury.com |
| Automated Information Line | 1-800-345-8765 |
| Investor Services Representative | 1-800-345-2021 or 816-531-5575 |
| Investors Using Advisors | 1-800-378-9878 |
Business, Not-For-Profit, Employer-Sponsored Retirement Plans | 1-800-345-3533 |
Banks and Trust Companies, Broker-Dealers, Financial Professionals, Insurance Companies | 1-800-345-6488 |
| Telecommunications Device for the Deaf | 1-800-634-4113 |
American Century Capital Portfolios, Inc.
Investment Advisor:
American Century Investment Management, Inc.
Kansas City, Missouri
This report and the statements it contains are submitted for the general information of our shareholders. The report is not authorized for distribution to prospective investors unless preceded or accompanied by an effective prospectus.
©2012 American Century Proprietary Holdings, Inc. All rights reserved.
CL-ANN-75030 1205
ANNUAL REPORT MARCH 31, 2012
| NT Large Company Value Fund |
| President’s Letter | 2 |
| Independent Chairman’s Letter | 3 |
| Market Perspective | 4 |
| Performance | 5 |
| Portfolio Commentary | 6 |
| Fund Characteristics | 8 |
| Shareholder Fee Example | 9 |
| Schedule of Investments | 11 |
| Statement of Assets and Liabilities | 14 |
| Statement of Operations | 15 |
| Statement of Changes in Net Assets | 16 |
| Notes to Financial Statements | 17 |
| Financial Highlights | 23 |
| Report of Independent Registered Public Accounting Firm | 24 |
| Management | 25 |
| Additional Information | 28 |
Any opinions expressed in this report reflect those of the author as of the date of the report, and do not necessarily represent the opinions of American Century Investments® or any other person in the American Century Investments organization. Any such opinions are subject to change at any time based upon market or other conditions and American Century Investments disclaims any responsibility to update such opinions. These opinions may not be relied upon as investment advice and, because investment decisions made by American Century Investments funds are based on numerous factors, may not be relied upon as an indication of trading intent on behalf of any American Century Investments fund. Security examples are used for representational purposes only and are not intended as recommendations to purchase or sell securities. Performance information for comparative indices and securities is provided to American Century Investments by third party vendors. To the best of American Century Investments’ knowledge, such information is accurate at the time of printing.
Dear Investor:
Thank you for reviewing this annual report for the period ended March 31, 2012. Our report offers investment performance and portfolio information, presented with the expert perspective of our portfolio management team.
This report remains one of our most important vehicles for conveying information about fund returns, as well as market factors and strategies that affected fund performance. For additional, updated information, we encourage you to visit our website, americancentury.com. Click on the “Fund Performance” and “Insights & News” headings at the top of our Individual Investors site.
Mostly Positive U.S. Returns Belie the Period’s Volatility
U.S. market performance for the 12 months ended March 31, 2012 appeared more benign than it really was. Broadly speaking, U.S. stocks and bonds returned roughly 7-9% for the period, as indicated by the S&P 500 Index and the Barclays U.S. Aggregate Bond Index. But those solid returns masked the roller-coaster ride required to achieve them.
The reporting period began, in April 2011, with stock indices and U.S. Treasury yields at some of their highest levels since 2008, prior to the Financial Crisis plunge. These elevated levels reflected increased risk-taking as the markets priced in improving global economic growth, strong corporate earnings, and higher inflation.
This “risk-on” investing attitude switched to “risk-off” during the summer of 2011, transformed by high fuel prices, federal budget management concerns in the U.S., and the worsening sovereign debt crisis in Europe. Recessionary expectations pulled Treasury yields to record lows by September, and stock indices suffered double-digit declines from their peaks.
Sentiment switched again in the fourth quarter of 2011, as concerns about the European sovereign debt crisis and the U.S. economy eased. Renewed “risk-on” investing carried into the first quarter of 2012, boosting growth stocks and high-yield bonds in particular. But the financial markets remain subject to potentially high volatility as they continue to wrestle with uncertainties regarding Europe, the Middle East, economic strength, government budget deficits, and the U.S. presidential election. We believe strongly in adhering to a disciplined, diversified, long-term investment approach during volatile periods, and we appreciate your continued trust in us during these unsettled times.
Sincerely,
Jonathan Thomas
President and Chief Executive Officer
American Century Investments
2
Dear Fellow Shareholders,
The assets under management in American Century Investments’ funds grow through investors placing new assets in the funds and through market appreciation. Asset growth has been at near record levels over the past two calendar years as market movements were upward, the funds’ relative returns were generally favorable, and the distribution strategies implemented by fund management have been successful.
The board reviews fund performance and distribution strategies on a regular basis. Several years ago, the fund’s management team discussed with the board its plans to grow fund assets in the intermediary, institutional and international distribution channels. These distribution strategies have produced strong positive growth. The growth in the intermediary channel recognizes the funds’ strong relative investment performance and the desire of many shareholders to seek financial guidance. Investors in both the institutional and international channels appear to find the funds’ risk-based investment strategies attractive. The board continues to support fund management’s strategies to increase fund assets and will continue to work to provide the benefits of these gains to fund shareholders.
We continue to receive a steady flow of very thoughtful questions from shareholders. If there are issues that you would like the board to address please email me at dhpratt@fundboardchair.com. Thank you for your continued investment in American Century Investments funds.
Best regards,
Don Pratt
3
By Phil Davidson,
Chief Investment Officer,
U.S. Value Equity
U.S. Stocks Advanced
Despite some meaningful market volatility, U.S. stocks generated positive performance for the one-year period ended March 31, 2012. The overall advance was driven by a robust equity market rally over the last six months of the period as economic conditions improved.
After rallying throughout much of April 2011, the stock market declined sharply from May through September amid weaker economic conditions in the U.S. and an increasingly challenging sovereign debt crisis in Europe. Public debt issues in the U.S. also weighed on the market as the government wrestled with the federal debt ceiling and a major credit rating agency downgraded the credit rating of U.S. debt from AAA to AA+ in August—the first such downgrade in the country’s history.
Market sentiment shifted markedly over the last six months of the period as evidence of improving economic growth helped ease concerns about a possible recession. Most notably, employment growth showed signs of life, helping push the unemployment rate down to a three-year low. Consumer spending and manufacturing activity also picked up, and mild winter weather provided a lift to the construction industry. The situation in Europe also improved as liquidity injections from the European Central Bank and a debt restructuring agreement in Greece helped provide some stability to the Continent’s debt markets and banking sector. The end result was a steady and substantial market rally over the last six months.
Value Stocks Lagged
As the table below illustrates, large-cap stocks and growth issues led the market’s overall advance. Growth stocks benefited the most from the improving economic environment over the last half of the period, along with investors’ greater appetite for risk. Sector performance also favored growth shares over value during the period. The top-performing sectors in the S&P 500 Index included information technology and consumer discretionary, two growth-oriented sectors of the market. In contrast, the financials sector, which is the largest sector weighting in most value indices, declined for the reporting period.
| U.S. Stock Index Returns | ||||
| For the 12 months ended March 31, 2012 | ||||
| Russell 1000 Index (Large-Cap) | 7.86% | Russell 2000 Index (Small-Cap) | -0.18% | |
| Russell 1000 Growth Index | 11.02% | Russell 2000 Growth Index | 0.68% | |
| Russell 1000 Value Index | 4.79% | Russell 2000 Value Index | -1.07% | |
| Russell Midcap Index | 3.31% | |||
| Russell Midcap Growth Index | 4.43% | |||
| Russell Midcap Value Index | 2.28% | |||
4
| Total Returns as of March 31, 2012 | |||||
| Average Annual Returns | |||||
Ticker Symbol | 1 year | 5 years | Since Inception | Inception Date | |
| Institutional Class | ACLLX | 7.07% | -1.29% | 1.02% | 5/12/06 |
| Russell 1000 Value Index | — | 4.79% | -0.81% | 1.53%(1) | — |
| S&P 500 Index | — | 8.54% | 2.01% | 3.41%(1) | — |
| (1) | Since 4/30/06, the date nearest the Institutional Class’s inception for which data are available. |
| Growth of $10,000 Over Life of Class |
| $10,000 investment made May 12, 2006 |
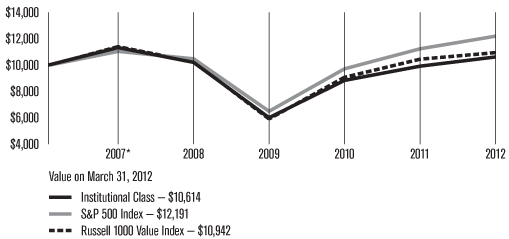
| * | From 5/12/06, the Institutional Class’s inception date. Index data from 4/30/06, the date nearest the Institutional Class’s inception for which data are available. Not annualized. |
| Total Annual Fund Operating Expenses |
Institutional Class 0.67% |
The total annual fund operating expenses shown is as stated in the fund’s prospectus current as of the date of this report. The prospectus may vary from the expense ratio shown elsewhere in this report because it is based on a different time period, includes acquired fund fees and expenses, and, if applicable, does not include fee waivers or expense reimbursements.
Data presented reflect past performance. Past performance is no guarantee of future results. Current performance may be higher or lower than the performance shown. Investment return and principal value will fluctuate, and redemption value may be more or less than original cost. To obtain performance data current to the most recent month end, please call 1-800-345-2021 or visit americancentury.com.
Data assumes reinvestment of dividends and capital gains, and none of the charts reflect the deduction of taxes that a shareholder would pay on fund distributions or the redemption of fund shares. Returns for the indices are provided for comparison. The fund’s total returns include operating expenses (such as transaction costs and management fees) that reduce returns, while the total returns of the indices do not.
5
Portfolio Managers: Brendan Healy and Matt Titus
Performance Summary
NT Large Company Value returned 7.07% for the 12 months ended March 31, 2012. By comparison, its benchmark, the Russell 1000 Value Index, returned 4.79%. The broader market, as measured by the S&P 500 Index, returned 8.54%. The portfolio’s return reflects operating expenses, while the indices’ returns do not. The average return for Morningstar’s Large Cap Value category (its performance, like NT Large Company Value’s, reflects operating expenses) was 3.93%.*
The U.S. stock market posted a gain during the one-year reporting period, largely as a result of its strong performance during the first quarter of 2012. For most of the 12-month period, investors were preoccupied with Europe’s financial woes, which threatened to spread from Greece to other nations and seemed likely to cause problems for European banks. Lackluster U.S. economic growth and the downgrade of U.S. debt by Standard & Poor’s Ratings also dampened market sentiment. Investor risk appetite improved near the end of 2011 when the U.S. economy, proving surprisingly resilient, returned to its slow-growth path. Employers added new jobs, and corporate earnings remained solid. Investors also grew more optimistic as the European Central Bank provided inexpensive loans to European banks and the financial crisis eased. In this environment, growth stocks outperformed value stocks across the capitalization spectrum. For the reporting period, NT Large Company Value received positive results in absolute terms from eight of the 10 sectors in which it was invested. On a relative basis, it outperformed, aided by investments in the energy, consumer discretionary, and health care sectors. An underweight in utilities stocks detracted.
Energy Boosted Results
NT Large Company Value benefited from investments in large, integrated oil companies and its underweight in exploration and production stocks, which we consider expensive. Near the beginning of the reporting period, we had shifted the portfolio to a significant underweight in the energy equipment and services industry. This proved advantageous after oil prices peaked during the spring of 2011 and shares of energy equipment and services companies underperformed. The portfolio also benefited from the sale of strong performer National Oilwell Varco.
Consumer Discretionary Contributed
Strong stock selection across the consumer discretionary sector enhanced relative performance. In the media industry, the portfolio held Comcast Corp. The cable and television network operator has experienced growth in its broadband and business services divisions and has reduced turnover among its pay-TV subscribers. Comcast has also returned value to shareholders by increasing its dividend and implementing a stock repurchase program. Among multiline retailers, Macy’s outperformed on better-than-expected sales at its stores and through its website. In specialty retailing, shares of home improvement retailer Lowe’s Companies appreciated on improvement in the U.S. housing market.
| * | The average returns for Morningstar’s Large Cap Value category were -0.24% for the five-year period ended March 31, 2012 and 2.15% since May 31, 2006, the date nearest the Institutional Class’s inception for which data are available. © 2012 Morningstar, Inc. All Rights Reserved. The information contained herein: (1) is proprietary to Morningstar and/or its content providers; (2) may not be copied or distributed; and (3) is not warranted to be accurate, complete or timely. Neither Morningstar nor its content providers are responsible for any damages or losses arising from any use of this information. |
6
Health Care Aided Results
An overweight in health care, the strongest sector in the benchmark, added to relative performance. NT Large Company Value benefited from its mix of biotechnology and pharmaceutical stocks, including Amgen, Johnson & Johnson (J&J), and Abbott Laboratories. Amgen outperformed on the expectation of accelerated 2012 revenue growth, boosted by sales of the biotechnology firm’s new bone-building drugs. In addition, Amgen initiated a dividend, increased it, and conducted a modified Dutch auction in which it repurchased approximately $5 billion in outstanding shares. J&J performed well as it continued to work on resolving manufacturing issues that have resulted in costly recalls. The company appeared likely to benefit from a change in management during the reporting period. Abbott Laboratories’ shares advanced after the company announced it was splitting itself into two publicly traded companies. In addition, Abbott has some promising drug candidates in its pipeline, which could offset a sales decline when its blockbuster drug Humira loses patent protection.
An Underweight in Utilities Detracted
The portfolio was hampered by its underweight in utilities. Utilities stocks, which generally pay high dividends, were in strong demand during the reporting period. In our opinion, many of these stocks are overvalued.
Information Technology Provided Top Detractor
A top detractor was Hewlett-Packard (HP). As the computer industry evolves, HP has experienced weakness in its personal computer and printer segments. The services business also struggled. The company made an expensive acquisition during the reporting period and unexpectedly changed its chief executive officer.
Outlook
We continue to be bottom-up investment managers, evaluating each company individually and building the portfolio one stock at a time. As of March 31, 2012, NT Large Company Value is broadly diversified, with ongoing overweight positions in health care, telecommunication services, and information technology stocks. Our valuation work is also directing us toward smaller relative weightings in utilities, financials, and industrials stocks. We are still finding greater value opportunities among mega-cap stocks and have maintained our bias toward these firms.
7
| MARCH 31, 2012 | |
| Top Ten Holdings | % of net assets |
| Chevron Corp. | 4.3% |
| General Electric Co. | 3.8% |
| Pfizer, Inc. | 3.7% |
| JPMorgan Chase & Co. | 3.7% |
| Wells Fargo & Co. | 3.4% |
| Exxon Mobil Corp. | 3.3% |
| Procter & Gamble Co. (The) | 3.1% |
| AT&T, Inc. | 3.0% |
| Johnson & Johnson | 2.7% |
| Cisco Systems, Inc. | 2.6% |
| Top Five Industries | % of net assets |
| Oil, Gas and Consumable Fuels | 11.2% |
| Pharmaceuticals | 9.8% |
| Insurance | 8.5% |
| Commercial Banks | 6.6% |
| Diversified Financial Services | 6.1% |
| Types of Investments in Portfolio | % of net assets |
| Common Stocks | 98.0% |
| Exchange-Traded Funds | 0.8% |
| Total Equity Exposure | 98.8% |
| Temporary Cash Investments | 2.3% |
| Other Assets and Liabilities | (1.1)% |
8
Fund shareholders may incur two types of costs: (1) transaction costs, including sales charges (loads) on purchase payments and redemption/exchange fees; and (2) ongoing costs, including management fees; distribution and service (12b-1) fees; and other fund expenses. This example is intended to help you understand your ongoing costs (in dollars) of investing in your fund and to compare these costs with the ongoing cost of investing in other mutual funds.
The example is based on an investment of $1,000 made at the beginning of the period and held for the entire period from October 1, 2011 to March 31, 2012.
Actual Expenses
The table provides information about actual account values and actual expenses for each class. You may use the information, together with the amount you invested, to estimate the expenses that you paid over the period. First, identify the share class you own. Then simply divide your account value by $1,000 (for example, an $8,600 account value divided by $1,000 = 8.6), then multiply the result by the number under the heading “Expenses Paid During Period” to estimate the expenses you paid on your account during this period.
If you hold Investor Class shares of any American Century Investments fund, or Institutional Class shares of the American Century Diversified Bond Fund, in an American Century Investments account (i.e., not a financial intermediary or retirement plan account), American Century Investments may charge you a $12.50 semiannual account maintenance fee if the value of those shares is less than $10,000. We will redeem shares automatically in one of your accounts to pay the $12.50 fee. In determining your total eligible investment amount, we will include your investments in all personal accounts (including American Century Investments Brokerage accounts) registered under your Social Security number. Personal accounts include individual accounts, joint accounts, UGMA/UTMA accounts, personal trusts, Coverdell Education Savings Accounts and IRAs (including traditional, Roth, Rollover, SEP-, SARSEP- and SIMPLE-IRAs), and certain other retirement accounts. If you have only business, business retirement, employer-sponsored or American Century Investments Brokerage accounts, you are currently not subject to this fee. If you are subject to the Account Maintenance Fee, your account value could be reduced by the fee amount.
Hypothetical Example for Comparison Purposes
The table also provides information about hypothetical account values and hypothetical expenses based on the actual expense ratio of each class of your fund and an assumed rate of return of 5% per year before expenses, which is not the actual return of a fund’s share class. The hypothetical account values and expenses may not be used to estimate the actual ending account balance or expenses you paid for the period. You may use this information to compare the ongoing costs of investing in your fund and other funds. To do so, compare this 5% hypothetical example with the 5% hypothetical examples that appear in the shareholder reports of the other funds.
9
Please note that the expenses shown in the table are meant to highlight your ongoing costs only and do not reflect any transactional costs, such as sales charges (loads) or redemption/exchange fees. Therefore, the table is useful in comparing ongoing costs only, and will not help you determine the relative total costs of owning different funds. In addition, if these transactional costs were included, your costs would have been higher.
Beginning Account Value 10/1/11 | Ending Account Value 3/31/12 | Expenses Paid During Period(1) 10/1/11 – 3/31/12 | Annualized Expense Ratio(1) | |
| Actual | ||||
| Institutional Class | $1,000 | $1,261.60 | $3.79 | 0.67% |
| Hypothetical | ||||
| Institutional Class | $1,000 | $1,021.65 | $3.39 | 0.67% |
| (1) | Expenses are equal to the class’s annualized expense ratio listed in the table above, multiplied by the average account value over the period, multiplied by 183, the number of days in the most recent fiscal half-year, divided by 366, to reflect the one-half year period. |
10
| Shares | Value | |||||||
| Common Stocks — 98.0% | ||||||||
| AEROSPACE AND DEFENSE — 1.5% | ||||||||
| Honeywell International, Inc. | 46,300 | $2,826,615 | ||||||
| Northrop Grumman Corp. | 35,700 | 2,180,556 | ||||||
| Raytheon Co. | 96,900 | 5,114,382 | ||||||
| 10,121,553 | ||||||||
| AIRLINES — 0.5% | ||||||||
| Southwest Airlines Co. | 430,700 | 3,548,968 | ||||||
| AUTOMOBILES — 1.0% | ||||||||
| Ford Motor Co. | 547,700 | 6,840,773 | ||||||
| BEVERAGES — 0.9% | ||||||||
| PepsiCo, Inc. | 90,100 | 5,978,135 | ||||||
| BIOTECHNOLOGY — 1.4% | ||||||||
| Amgen, Inc. | 120,500 | 8,192,795 | ||||||
Gilead Sciences, Inc.(1) | 28,900 | 1,411,765 | ||||||
| 9,604,560 | ||||||||
| CAPITAL MARKETS — 3.9% | ||||||||
| Ameriprise Financial, Inc. | 116,700 | 6,667,071 | ||||||
| Bank of New York Mellon Corp. (The) | 245,800 | 5,931,154 | ||||||
| BlackRock, Inc. | 23,300 | 4,774,170 | ||||||
| Goldman Sachs Group, Inc. (The) | 58,200 | 7,238,334 | ||||||
| Morgan Stanley | 70,600 | 1,386,584 | ||||||
| 25,997,313 | ||||||||
| CHEMICALS — 0.5% | ||||||||
| E.I. du Pont de Nemours & Co. | 66,100 | 3,496,690 | ||||||
| COMMERCIAL BANKS — 6.6% | ||||||||
| PNC Financial Services Group, Inc. | 148,200 | 9,557,418 | ||||||
| U.S. Bancorp | 360,500 | 11,420,640 | ||||||
| Wells Fargo & Co. | 670,100 | 22,877,214 | ||||||
| 43,855,272 | ||||||||
| COMMERCIAL SERVICES AND SUPPLIES — 0.3% | ||||||||
| Avery Dennison Corp. | 62,100 | 1,871,073 | ||||||
| COMMUNICATIONS EQUIPMENT — 2.6% | ||||||||
| Cisco Systems, Inc. | 835,400 | 17,668,710 | ||||||
| COMPUTERS AND PERIPHERALS — 1.3% | ||||||||
| Hewlett-Packard Co. | 332,800 | 7,930,624 | ||||||
Western Digital Corp.(1) | 13,900 | 575,321 | ||||||
| 8,505,945 | ||||||||
| DIVERSIFIED FINANCIAL SERVICES — 6.1% | ||||||||
| Bank of America Corp. | 416,300 | 3,983,991 | ||||||
| Citigroup, Inc. | 335,000 | 12,244,250 | ||||||
| JPMorgan Chase & Co. | 536,500 | 24,668,270 | ||||||
| 40,896,511 | ||||||||
| DIVERSIFIED TELECOMMUNICATION SERVICES — 5.7% | ||||||||
| AT&T, Inc. | 652,700 | 20,383,821 | ||||||
| CenturyLink, Inc. | 191,400 | 7,397,610 | ||||||
| Verizon Communications, Inc. | 262,200 | 10,023,906 | ||||||
| 37,805,337 | ||||||||
| ELECTRIC UTILITIES — 2.9% | ||||||||
| American Electric Power Co., Inc. | 128,500 | 4,957,530 | ||||||
| Exelon Corp. | 86,500 | 3,391,665 | ||||||
| NV Energy, Inc. | 166,600 | 2,685,592 | ||||||
| Pinnacle West Capital Corp. | 88,400 | 4,234,360 | ||||||
| PPL Corp. | 150,800 | 4,261,608 | ||||||
| 19,530,755 | ||||||||
| ENERGY EQUIPMENT AND SERVICES — 1.2% | ||||||||
| Baker Hughes, Inc. | 93,000 | 3,900,420 | ||||||
| Schlumberger Ltd. | 56,900 | 3,979,017 | ||||||
| 7,879,437 | ||||||||
| FOOD AND STAPLES RETAILING — 3.0% | ||||||||
| CVS Caremark Corp. | 186,700 | 8,364,160 | ||||||
| Kroger Co. (The) | 200,900 | 4,867,807 | ||||||
| Wal-Mart Stores, Inc. | 105,700 | 6,468,840 | ||||||
| 19,700,807 | ||||||||
| FOOD PRODUCTS — 0.6% | ||||||||
| Kraft Foods, Inc., Class A | 106,000 | 4,029,060 | ||||||
| HEALTH CARE EQUIPMENT AND SUPPLIES — 1.0% | ||||||||
| Medtronic, Inc. | 163,100 | 6,391,889 | ||||||
| HEALTH CARE PROVIDERS AND SERVICES — 1.6% | ||||||||
| Aetna, Inc. | 84,000 | 4,213,440 | ||||||
| Quest Diagnostics, Inc. | 22,300 | 1,363,645 | ||||||
| WellPoint, Inc. | 73,100 | 5,394,780 | ||||||
| 10,971,865 | ||||||||
| HOTELS, RESTAURANTS AND LEISURE — 0.2% | ||||||||
| Carnival Corp. | 50,700 | 1,626,456 | ||||||
| HOUSEHOLD PRODUCTS — 3.1% | ||||||||
| Procter & Gamble Co. (The) | 310,600 | 20,875,426 | ||||||
| INDUSTRIAL CONGLOMERATES — 4.5% | ||||||||
| General Electric Co. | 1,262,200 | 25,332,354 | ||||||
| Tyco International Ltd. | 81,300 | 4,567,434 | ||||||
| 29,899,788 | ||||||||
| INSURANCE — 8.5% | ||||||||
| Allstate Corp. (The) | 178,800 | 5,886,096 | ||||||
American International Group, Inc.(1) | 65,400 | 2,016,282 | ||||||
Berkshire Hathaway, Inc., Class B(1) | 86,500 | 7,019,475 | ||||||
| Chubb Corp. (The) | 63,200 | 4,367,752 | ||||||
| Loews Corp. | 162,700 | 6,486,849 | ||||||
11
| Shares | Value | |||||||
| MetLife, Inc. | 234,000 | $8,739,900 | ||||||
| Principal Financial Group, Inc. | 147,000 | 4,337,970 | ||||||
| Prudential Financial, Inc. | 115,300 | 7,308,867 | ||||||
| Torchmark Corp. | 38,200 | 1,904,270 | ||||||
| Travelers Cos., Inc. (The) | 142,400 | 8,430,080 | ||||||
| 56,497,541 | ||||||||
| IT SERVICES — 0.6% | ||||||||
Fiserv, Inc.(1) | 52,500 | 3,642,975 | ||||||
| MACHINERY — 1.0% | ||||||||
| Dover Corp. | 54,600 | 3,436,524 | ||||||
| Ingersoll-Rand plc | 82,000 | 3,390,700 | ||||||
| 6,827,224 | ||||||||
| MEDIA — 4.0% | ||||||||
| CBS Corp., Class B | 103,600 | 3,513,076 | ||||||
| Comcast Corp., Class A | 377,800 | 11,337,778 | ||||||
| Time Warner, Inc. | 263,700 | 9,954,675 | ||||||
| Viacom, Inc., Class B | 34,900 | 1,656,354 | ||||||
| 26,461,883 | ||||||||
| METALS AND MINING — 0.8% | ||||||||
| Freeport-McMoRan Copper & Gold, Inc. | 15,700 | 597,228 | ||||||
| Nucor Corp. | 110,800 | 4,758,860 | ||||||
| 5,356,088 | ||||||||
| MULTI-UTILITIES — 0.9% | ||||||||
| PG&E Corp. | 144,000 | 6,251,040 | ||||||
| MULTILINE RETAIL — 2.8% | ||||||||
| Kohl’s Corp. | 87,200 | 4,362,616 | ||||||
| Macy’s, Inc. | 99,100 | 3,937,243 | ||||||
| Target Corp. | 174,200 | 10,150,634 | ||||||
| 18,450,493 | ||||||||
| OIL, GAS AND CONSUMABLE FUELS — 11.2% | ||||||||
| Apache Corp. | 61,700 | 6,197,148 | ||||||
| Chevron Corp. | 267,500 | 28,686,700 | ||||||
| ConocoPhillips | 64,700 | 4,917,847 | ||||||
| Exxon Mobil Corp. | 253,700 | 22,003,401 | ||||||
| Occidental Petroleum Corp. | 25,400 | 2,418,842 | ||||||
| Total SA ADR | 130,900 | 6,691,608 | ||||||
Ultra Petroleum Corp.(1) | 88,400 | 2,000,492 | ||||||
| Valero Energy Corp. | 83,302 | 2,146,692 | ||||||
| 75,062,730 | ||||||||
| PAPER AND FOREST PRODUCTS — 0.6% | ||||||||
| International Paper Co. | 115,600 | 4,057,560 | ||||||
| PHARMACEUTICALS — 9.8% | ||||||||
| Abbott Laboratories | 97,200 | 5,957,388 | ||||||
| Johnson & Johnson | 271,600 | 17,914,736 | ||||||
| Merck & Co., Inc. | 446,700 | 17,153,280 | ||||||
| Pfizer, Inc. | 1,090,300 | 24,706,198 | ||||||
| 65,731,602 | ||||||||
| SEMICONDUCTORS AND SEMICONDUCTOR EQUIPMENT — 3.3% | ||||||||
| Applied Materials, Inc. | 353,500 | 4,397,540 | ||||||
| Intel Corp. | 617,600 | 17,360,736 | ||||||
Marvell Technology Group Ltd.(1) | 37,700 | 593,021 | ||||||
| 22,351,297 | ||||||||
| SOFTWARE — 2.3% | ||||||||
Adobe Systems, Inc.(1) | 87,100 | 2,988,401 | ||||||
| Microsoft Corp. | 192,700 | 6,214,575 | ||||||
| Oracle Corp. | 219,400 | 6,397,704 | ||||||
| 15,600,680 | ||||||||
| SPECIALTY RETAIL — 1.8% | ||||||||
| Lowe’s Cos., Inc. | 206,600 | 6,483,108 | ||||||
| Staples, Inc. | 337,100 | 5,454,278 | ||||||
| 11,937,386 | ||||||||
TOTAL COMMON STOCKS (Cost $545,106,373) | 655,324,822 | |||||||
| Exchange-Traded Funds — 0.8% | ||||||||
| SPDR S&P 500 ETF Trust (Cost $4,132,669) | 37,400 | 5,262,928 | ||||||
| Temporary Cash Investments — 2.3% | ||||||||
Repurchase Agreement, Bank America Merrill Lynch, (collateralized by various U.S. Treasury obligations, 6.125%, 11/15/27, valued at $5,718,304), in a joint trading account at 0.01%, dated 3/30/12, due 4/2/12 (Delivery value $5,600,643) | 5,600,638 | |||||||
Repurchase Agreement, Credit Suisse First Boston, Inc., (collateralized by various U.S. Treasury obligations, 4.375%, 5/15/41, valued at $3,565,885), in a joint trading account at 0.03%, dated 3/30/12, due 4/2/12 (Delivery value $3,500,408) | 3,500,399 | |||||||
Repurchase Agreement, Goldman Sachs & Co., (collateralized by various U.S. Treasury obligations, 4.50%, 5/15/38, valued at $4,292,889), in a joint trading account at 0.03%, dated 3/30/12, due 4/2/12 (Delivery value $4,200,490) | 4,200,479 | |||||||
| SSgA U.S. Government Money Market Fund | 2,379,141 | 2,379,141 | ||||||
| TOTAL TEMPORARY CASH INVESTMENTS (Cost $15,680,657) | 15,680,657 | |||||||
| TOTAL INVESTMENT SECURITIES — 101.1% (Cost $564,919,699) | 676,268,407 | |||||||
| OTHER ASSETS AND LIABILITIES — (1.1)% | (7,624,510 | ) | ||||||
| TOTAL NET ASSETS — 100.0% | $668,643,897 | |||||||
12
| Forward Foreign Currency Exchange Contracts | |||||
| Contracts to Sell | Counterparty | Settlement Date | Value | Unrealized Gain (Loss) | |
| 4,119,839 | EUR for USD | UBS AG | 4/30/12 | $5,495,259 | $(13,359) |
| 140,676 | EUR for USD | UBS AG | 4/30/12 | 187,640 | (963) |
| 144,358 | EUR for USD | UBS AG | 4/30/12 | 192,552 | (58) |
| $5,875,451 | $(14,380) | ||||
(Value on Settlement Date $5,861,071)
Notes to Schedule of Investments
ADR = American Depositary Receipt
ETF = Exchange-Traded Fund
EUR = Euro
SPDR = Standard & Poor’s Depositary Receipts
USD = United States Dollar
| (1) | Non-income producing. |
See Notes to Financial Statements.
13
| MARCH 31, 2012 | ||||
| Assets | ||||
| Investment securities, at value (cost of $564,919,699) | $676,268,407 | |||
| Receivable for investments sold | 1,879,534 | |||
| Receivable for capital shares sold | 612,424 | |||
| Dividends and interest receivable | 1,025,469 | |||
| 679,785,834 | ||||
| Liabilities | ||||
| Payable for investments purchased | 10,759,051 | |||
| Unrealized loss on forward foreign currency exchange contracts | 14,380 | |||
| Accrued management fees | 368,506 | |||
| 11,141,937 | ||||
| Net Assets | $668,643,897 | |||
| Institutional Class Capital Shares, $0.01 Par Value | ||||
| Shares authorized | 205,000,000 | |||
| Shares outstanding | 71,839,647 | |||
| Net Asset Value Per Share | $9.31 | |||
| Net Assets Consist of: | ||||
| Capital (par value and paid-in surplus) | $579,334,163 | |||
| Undistributed net investment income | 802,822 | |||
| Accumulated net realized loss | (22,827,416 | ) | ||
| Net unrealized appreciation | 111,334,328 | |||
| $668,643,897 | ||||
See Notes to Financial Statements.
14
| YEAR ENDED MARCH 31, 2012 | ||||
| Investment Income (Loss) | ||||
| Income: | ||||
| Dividends (net of foreign taxes withheld of $31,034) | $14,458,435 | |||
| Interest | 3,959 | |||
| 14,462,394 | ||||
| Expenses: | ||||
| Management fees | 3,592,732 | |||
| Directors’ fees and expenses | 19,606 | |||
| Other expenses | 409 | |||
| 3,612,747 | ||||
| Net investment income (loss) | 10,849,647 | |||
| Realized and Unrealized Gain (Loss) | ||||
| Net realized gain (loss) on: | ||||
| Investment transactions | 5,118,917 | |||
| Futures contract transactions | (1,808,304 | ) | ||
| Foreign currency transactions | 170,133 | |||
| 3,480,746 | ||||
| Change in net unrealized appreciation (depreciation) on: | ||||
| Investments | 33,801,882 | |||
| Futures contracts | (44,325 | ) | ||
| Translation of assets and liabilities in foreign currencies | (225 | ) | ||
| 33,757,332 | ||||
| Net realized and unrealized gain (loss) | 37,238,078 | |||
| Net Increase (Decrease) in Net Assets Resulting from Operations | $48,087,725 | |||
See Notes to Financial Statements.
15
| YEARS ENDED MARCH 31, 2012 AND MARCH 31, 2011 | |||||||
| Increase (Decrease) in Net Assets | March 31, 2012 | March 31, 2011 | |||||
| Operations | |||||||
| Net investment income (loss) | $10,849,647 | $6,430,900 | |||||
| Net realized gain (loss) | 3,480,746 | 7,008,253 | |||||
| Change in net unrealized appreciation (depreciation) | 33,757,332 | 40,763,481 | |||||
| Net increase (decrease) in net assets resulting from operations | 48,087,725 | 54,202,634 | |||||
| Distributions to Shareholders | |||||||
| From net investment income | (10,239,967 | ) | (6,198,514 | ) | |||
| Capital Share Transactions | |||||||
| Proceeds from shares sold | 163,120,619 | 133,067,297 | |||||
| Proceeds from reinvestment of distributions | 10,239,967 | 6,198,514 | |||||
| Payments for shares redeemed | (24,451,077 | ) | (13,417,836 | ) | |||
| Net increase (decrease) in net assets from capital share transactions | 148,909,509 | 125,847,975 | |||||
| Net increase (decrease) in net assets | 186,757,267 | 173,852,095 | |||||
| Net Assets | |||||||
| Beginning of period | 481,886,630 | 308,034,535 | |||||
| End of period | $668,643,897 | $481,886,630 | |||||
| Undistributed net investment income | $802,822 | $217,847 | |||||
| Transactions in Shares of the Fund | |||||||
| Sold | 19,287,286 | 16,968,918 | |||||
| Issued in reinvestment of distributions | 1,212,421 | 764,337 | |||||
| Redeemed | (3,069,792 | ) | (1,718,087 | ) | |||
| Net increase (decrease) in shares of the fund | 17,429,915 | 16,015,168 | |||||
See Notes to Financial Statements.
16
MARCH 31, 2012
1. Organization
American Century Capital Portfolios, Inc. (the corporation) is registered under the Investment Company Act of 1940, as amended (the 1940 Act), as an open-end management investment company and is organized as a Maryland corporation. NT Large Company Value Fund (the fund) is one fund in a series issued by the corporation. The fund is diversified as defined under the 1940 Act. The fund’s investment objective is to seek long-term capital growth. Income is a secondary objective. The fund pursues its objectives by investing primarily in companies with larger market capitalization that management believes to be undervalued at the time of purchase. The fund is not permitted to invest in any securities issued by companies assigned the Global Industry Classification Standard for the tobacco industry.
2. Significant Accounting Policies
The following is a summary of significant accounting policies consistently followed by the fund in preparation of its financial statements. The financial statements are prepared in conformity with accounting principles generally accepted in the United States of America, which may require management to make certain estimates and assumptions at the date of the financial statements. Actual results could differ from these estimates.
Investment Valuations — The fund determines the fair value of its investments and computes its net asset value per share as of the close of regular trading (usually 4 p.m. Eastern time) on the New York Stock Exchange (NYSE) on each day the NYSE is open.
Equity securities that are listed or traded on a domestic securities exchange are valued at the last reported sales price or at the official closing price as provided by the exchange. Equity securities traded on foreign securities exchanges are typically valued at the closing price on the exchange where primarily traded or as of the close of the NYSE, if that is earlier. If no last sales price is reported, or if local convention or regulation so provides, the mean of the latest bid and asked prices is used. Depending on local convention or regulation, securities traded over-the-counter are valued at the mean of the latest bid and asked prices, the last sales price, or the official closing price. In its determination of fair value, the fund may review several factors including: market information specific to a security; news developments in U.S. and foreign markets; the performance of particular U.S. and foreign securities, indices, comparable securities, American Depositary Receipts, Exchange-Traded Funds, and other relevant market indicators.
Debt securities maturing within 60 days at the time of purchase may be valued at cost, plus or minus any amortized discount or premium or at the evaluated mean as provided by an independent pricing service. Evaluated mean prices are commonly derived through utilization of market models, which may consider, among other factors, trade data, quotations from dealers and active market makers, relevant yield curve and spread data, related sector levels, creditworthiness, and other relevant market information on the same or comparable securities.
Investments in open-end management investment companies are valued at the reported net asset value per share. Repurchase agreements are valued at cost. Exchange-traded futures contracts are valued at the settlement price as provided by the appropriate clearing corporation. Forward foreign currency exchange contracts are valued at the mean of the latest bid and asked prices of the forward currency rates as provided by an independent pricing service.
The value of investments initially expressed in foreign currencies is translated into U.S. dollars at prevailing exchange rates.
17
If the fund determines that the market price for a portfolio security is not readily available or the valuation methods mentioned above do not reflect a security’s fair value, such security is valued as determined in good faith by the Board of Directors or its designee, in accordance with procedures adopted by the Board of Directors. Circumstances that may cause the fund to use these procedures to value a security include, but are not limited to: a security has been declared in default; trading in a security has been halted during the trading day; there is a foreign market holiday and no trading occurred; or an event occurred between the close of a foreign exchange and the NYSE that may affect the value of a security.
Security Transactions — Security transactions are accounted for as of the trade date. Net realized gains and losses are determined on the identified cost basis, which is also used for federal income tax purposes.
Investment Income — Dividend income less foreign taxes withheld, if any, is recorded as of the ex-dividend date. Interest income is recorded on the accrual basis and includes accretion of discounts and amortization of premiums.
Foreign Currency Translations — All assets and liabilities initially expressed in foreign currencies are translated into U.S. dollars at prevailing exchange rates at period end. The fund may enter into spot foreign currency exchange contracts to facilitate transactions denominated in a foreign currency. Purchases and sales of investment securities, dividend and interest income, spot foreign currency exchange contracts, and expenses are translated at the rates of exchange prevailing on the respective dates of such transactions. Net realized and unrealized foreign currency exchange gains or losses related to investment securities are a component of net realized gain (loss) on investment transactions and change in net unrealized appreciation (depreciation) on investments, respectively.
Repurchase Agreements — The fund may enter into repurchase agreements with institutions that American Century Investment Management, Inc. (ACIM) (the investment advisor) has determined are creditworthy pursuant to criteria adopted by the Board of Directors. The fund requires that the collateral, represented by securities, received in a repurchase transaction be transferred to the custodian in a manner sufficient to enable the fund to obtain those securities in the event of a default under the repurchase agreement. ACIM monitors, on a daily basis, the securities transferred to ensure the value, including accrued interest, of the securities under each repurchase agreement is equal to or greater than amounts owed to the fund under each repurchase agreement.
Joint Trading Account — Pursuant to an Exemptive Order issued by the Securities and Exchange Commission, the fund, along with certain other funds in the American Century Investments family of funds, may transfer uninvested cash balances into a joint trading account. These balances are invested in one or more repurchase agreements that are collateralized by U.S. Treasury or Agency obligations.
Segregated Assets — In accordance with the 1940 Act, the fund segregates assets on its books and records to cover certain types of investments, including, but not limited to, futures contracts, forward commitments, when-issued securities, short sales, swap agreements and certain forward foreign currency exchange contracts. ACIM monitors, on a daily basis, the securities segregated to ensure the fund designates a sufficient amount of liquid assets, marked-to-market daily. The fund may also receive assets or be required to pledge assets at the custodian bank or with a broker for margin requirements on futures contracts and swap agreements.
Income Tax Status — It is the fund’s policy to distribute substantially all net investment income and net realized gains to shareholders and to otherwise qualify as a regulated investment company under provisions of the Internal Revenue Code. The fund is no longer subject to examination by tax authorities for years prior to 2009. At this time, management believes there are no uncertain tax positions which, based on their technical merit, would not be sustained upon examination and for which it is reasonably possible that the total amounts of unrecognized tax benefits will significantly change in the next twelve months. Accordingly, no provision has been made for federal or state income taxes.
18
Distributions to Shareholders — Distributions from net investment income, if any, are generally declared and paid quarterly. Distributions from net realized gains, if any, are generally declared and paid annually.
Indemnifications — Under the corporation’s organizational documents, its officers and directors are indemnified against certain liabilities arising out of the performance of their duties to the fund. In addition, in the normal course of business, the fund enters into contracts that provide general indemnifications. The maximum exposure under these arrangements is unknown as this would involve future claims that may be made against a fund. The risk of material loss from such claims is considered by management to be remote.
3. Fees and Transactions with Related Parties
Management Fees — The corporation has entered into a management agreement with ACIM, under which ACIM provides the fund with investment advisory and management services in exchange for a single, unified management fee (the fee). The agreement provides that all expenses of managing and operating the fund, except brokerage expenses, taxes, interest, fees and expenses of the independent directors (including legal counsel fees), and extraordinary expenses, will be paid by ACIM. The fee is computed and accrued daily based on the daily net assets of the fund and paid monthly in arrears. The rate of the fee is determined by applying a fee rate calculation formula. This formula takes into account the fund’s assets as well as certain assets, if any, of other clients of the investment advisor outside the American Century Investments family of funds (such as subadvised funds and separate accounts) that have very similar investment teams and investment strategies (strategy assets). The strategy assets of the fund include the assets of Large Company Value Fund, one fund in a series issued by the corporation. The annual management fee schedule for the fund ranges from 0.50% to 0.70%. The effective annual management fee for the year March 31, 2012 was 0.67%.
Related Parties — Certain officers and directors of the corporation are also officers and/or directors of American Century Companies, Inc. (ACC), the parent of the corporation’s investment advisor, ACIM, the distributor of the corporation, American Century Investment Services, Inc., and the corporation’s transfer agent, American Century Services, LLC. The fund is wholly owned, in aggregate, by various funds in a series issued by American Century Asset Allocation Portfolios, Inc. (ACAAP). ACAAP does not invest in the fund for the purpose of exercising management or control.
The fund was eligible to invest in a money market fund for temporary purposes, which is managed by J.P. Morgan Investment Management, Inc. (JPMIM). The fund had a securities lending agreement with JPMorgan Chase Bank (JPMCB) and a mutual funds services agreement with J.P. Morgan Investor Services Co. (JPMIS). JPMCB was a custodian of the fund. JPMIM, JPMIS and JPMCB are wholly owned subsidiaries of JPMorgan Chase & Co. (JPM). Prior to August 31, 2011, JPM was an equity investor in ACC. The services provided to the fund by JPMIM, JPMIS and JPMCB terminated on July 31, 2011.
4. Investment Transactions
Purchases and sales of investment securities, excluding short-term investments, for the year ended March 31, 2012 were $398,906,734 and $248,746,028, respectively.
5. Fair Value Measurements
The fund’s securities valuation process is based on several considerations and may use multiple inputs to determine the fair value of the positions held by the fund. In conformity with accounting principles generally accepted in the United States of America, the inputs used to determine a valuation are classified into three broad levels as follows:
| • | Level 1 valuation inputs consist of unadjusted quoted prices in an active market for identical securities; |
| • | Level 2 valuation inputs consist of direct or indirect observable market data (including quoted prices for similar securities, evaluations of subsequent market events, interest rates, prepayment speeds, credit risk, etc.); or |
19
| • | Level 3 valuation inputs consist of unobservable data (including a fund’s own assumptions). |
The level classification is based on the lowest level input that is significant to the fair valuation measurement. The valuation inputs are not necessarily an indication of the risks associated with investing in these securities or other financial instruments.
The following is a summary of the level classifications as of period end. The Schedule of Investments provides additional information on the fund’s portfolio holdings.
| Level 1 | Level 2 | Level 3 | |
| Investment Securities | |||
| Common Stocks | $655,324,822 | — | — |
| Exchange-Traded Funds | 5,262,928 | — | — |
| Temporary Cash Investments | 2,379,141 | $13,301,516 | — |
| Total Value of Investment Securities | $662,966,891 | $13,301,516 | — |
| Other Financial Instruments | |||
| Total Unrealized Gain (Loss) on Forward Foreign Currency Exchange Contracts | — | $(14,380) | — |
6. Derivative Instruments
Equity Price Risk — The fund is subject to equity price risk in the normal course of pursuing its investment objectives. A fund may enter into futures contracts based on an equity index in order to manage its exposure to changes in market conditions. A fund may purchase futures contracts to gain exposure to increases in market value or sell futures contracts to protect against a decline in market value. Upon entering into a futures contract, a fund is required to deposit either cash or securities in an amount equal to a certain percentage of the contract value (initial margin). Subsequent payments (variation margin) are made or received daily, in cash, by a fund. The variation margin is equal to the daily change in the contract value and is recorded as unrealized gains and losses. A fund recognizes a realized gain or loss when the contract is closed or expires. Net realized and unrealized gains or losses occurring during the holding period of futures contracts are a component of net realized gain (loss) on futures contract transactions and change in net unrealized appreciation (depreciation) on futures contracts, respectively. One of the risks of entering into futures contracts is the possibility that the change in value of the contract may not correlate with the changes in value of the underlying securities. The fund regularly purchased equity price risk derivative instruments during the first eight months of the period.
Foreign Currency Risk — The fund is subject to foreign currency exchange rate risk in the normal course of pursuing its investment objectives. The value of foreign investments held by a fund may be significantly affected by changes in foreign currency exchange rates. The dollar value of a foreign security generally decreases when the value of the dollar rises against the foreign currency in which the security is denominated and tends to increase when the value of the dollar declines against such foreign currency. A fund may enter into forward foreign currency exchange contracts to reduce a fund’s exposure to foreign currency exchange rate fluctuations. The net U.S. dollar value of foreign currency underlying all contractual commitments held by a fund and the resulting unrealized appreciation or depreciation are determined daily. Realized gain or loss is recorded upon the termination of the contract. Net realized and unrealized gains or losses occurring during the holding period of forward foreign currency exchange contracts are a component of net realized gain (loss) on foreign currency transactions and change in net unrealized appreciation (depreciation) on translation of assets and liabilities in foreign currencies, respectively. A fund bears the risk of an unfavorable change in the foreign currency exchange rate underlying the forward contract. Additionally, losses, up to the fair value, may arise if the counterparties do not perform under the contract terms. The foreign currency risk derivative instruments held at period end as disclosed on the Schedule of Investments are indicative of the fund’s typical volume during the period.
20
Value of Derivative Instruments as of March 31, 2012
| Asset Derivatives | Liability Derivatives | ||||
Type of Risk Exposure | Location on Statement of Assets and Liabilities | Value | Location on Statement of Assets and Liabilities | Value | |
| Foreign Currency Risk | Unrealized gain on forward foreign currency exchange contracts | — | Unrealized loss on forward foreign currency exchange contracts | $14,380 | |
Effect of Derivative Instruments on the Statement of Operations for the Year Ended March 31, 2012
| Net Realized Gain (Loss) | Change in Net Unrealized Appreciation (Depreciation) | ||||
Type of Risk Exposure | Location on Statement of Operations | Value | Location on Statement of Operations | Value | |
| Equity Price Risk | Net realized gain (loss) on futures contract transactions | $(1,808,304) | Change in net unrealized appreciation (depreciation) on futures contracts | $(44,325) | |
| Foreign Currency Risk | Net realized gain (loss) on foreign currency transactions | 170,133 | Change in net unrealized appreciation (depreciation) on translation of assets and liabilities in foreign currencies | (225) | |
| $(1,638,171) | $(44,550) | ||||
7. Federal Tax Information
The tax character of distributions paid during the years ended March 31, 2012 and March 31, 2011 were as follows:
| 2012 | 2011 | |
| Distributions Paid From | ||
| Ordinary income | $10,239,967 | $6,198,514 |
| Long-term capital gains | — | — |
The book-basis character of distributions made during the year from net investment income or net realized gains may differ from their ultimate characterization for federal income tax purposes. These differences reflect the differing character of certain income items and net realized gains and losses for financial statement and tax purposes, and may result in reclassification among certain capital accounts on the financial statements.
21
As of March 31, 2012, the federal tax cost of investments and the components of distributable earnings on a tax-basis were as follows:
| Federal tax cost of investments | $583,143,238 | |
| Gross tax appreciation of investments | $99,460,001 | |
| Gross tax depreciation of investments | (6,334,832 | ) |
| Net tax appreciation (depreciation) of investments | $93,125,169 | |
Net tax appreciation (depreciation) on derivatives and translation of assets and liabilities in foreign currencies | — | |
| Net tax appreciation (depreciation) | $93,125,169 | |
| Undistributed ordinary income | $802,822 | |
| Accumulated capital losses | $(4,618,257 | ) |
The difference between book-basis and tax-basis cost and unrealized appreciation (depreciation) is attributable primarily to the tax deferral of losses on wash sales and the realization for tax purposes of unrealized gains (losses) on certain foreign currency exchange contracts.
The accumulated capital losses represent net capital loss carryovers that may be used to offset future realized capital gains for federal income tax purposes. Future capital loss carryover utilization in any given year may be subject to Internal Revenue Code limitations. Capital loss carryovers expire in 2018. The Regulated Investment Company Modernization Act of 2010 allows the fund to carry forward capital losses incurred in future taxable years for an unlimited period. Any losses incurred during future taxable years will be required to be utilized prior to the losses which carry an expiration date. As a result, capital loss carryforwards may be more likely to expire unused.
22
| For a Share Outstanding Throughout the Years Ended March 31 (except as noted) | |||||||||||||
| Per-Share Data | Ratios and Supplemental Data | ||||||||||||
| Income From Investment Operations: | Distributions From: | Ratio to Average Net Assets of: | |||||||||||
Net Asset Value, Beginning of Period | Net Investment Income (Loss) | Net Realized and Unrealized Gain (Loss) | Total From Investment Operations | Net Investment Income | Net Realized Gains | Total Distributions | Net Asset Value, End of Period | Total Return(1) | Operating Expenses | Net Investment Income (Loss) | Portfolio Turnover Rate | Net Assets, End of Period (in thousands) | |
| Institutional Class | |||||||||||||
| 2012 | $8.86 | 0.17(2) | 0.44 | 0.61 | (0.16) | — | (0.16) | $9.31 | 7.07% | 0.67% | 2.02% | 47% | $668,644 |
| 2011 | $8.02 | 0.14(2) | 0.83 | 0.97 | (0.13) | — | (0.13) | $8.86 | 12.24% | 0.66% | 1.70% | 38% | $481,887 |
| 2010 | $5.55 | 0.14(2) | 2.47 | 2.61 | (0.14) | — | (0.14) | $8.02 | 47.28% | 0.64% | 1.99% | 23% | $308,035 |
| 2009 | $9.71 | 0.20(2) | (4.16) | (3.96) | (0.20) | — | (0.20) | $5.55 | (41.22)% | 0.63% | 2.82% | 26% | $152,678 |
| 2008 | $11.13 | 0.22 | (1.29) | (1.07) | (0.22) | (0.13) | (0.35) | $9.71 | (9.93)% | 0.62% | 2.10% | 20% | $98,618 |
Notes to Financial Highlights
| (1) | Total returns are calculated based on the net asset value of the last business day. Total returns for periods less than one year are not annualized. |
| (2) | Computed using average shares outstanding throughout the period. |
See Notes to Financial Statements.
23
To the Board of Directors and Shareholders of
American Century Capital Portfolios, Inc.:
We have audited the accompanying statement of assets and liabilities, including the schedule of investments, of NT Large Cap Value Fund, one of the funds constituting American Century Capital Portfolios, Inc. (the “Corporation”) as of March 31, 2012, and the related statement of operations for the year then ended, the statements of changes in net assets for each of the two years in the period then ended, and the financial highlights for each of the five years in the period then ended. These financial statements and financial highlights are the responsibility of the Corporation’s management. Our responsibility is to express an opinion on these financial statements and financial highlights based on our audits.
We conducted our audits in accordance with the standards of the Public Company Accounting Oversight Board (United States). Those standards require that we plan and perform the audit to obtain reasonable assurance about whether the financial statements and financial highlights are free of material misstatement. The Corporation is not required to have, nor were we engaged to perform, an audit of its internal control over financial reporting. Our audits included consideration of internal control over financial reporting as a basis for designing audit procedures that are appropriate in the circumstances, but not for the purpose of expressing an opinion on the effectiveness of the Corporation’s internal control over financial reporting. Accordingly, we express no such opinion. An audit also includes examining, on a test basis, evidence supporting the amounts and disclosures in the financial statements, assessing the accounting principles used and significant estimates made by management, as well as evaluating the overall financial statement presentation. Our procedures included confirmation of securities owned as of March 31, 2012, by correspondence with the custodian and brokers; where replies were not received from brokers, we performed other auditing procedures. We believe that our audits provide a reasonable basis for our opinion.
In our opinion, such financial statements and financial highlights referred to above present fairly, in all material respects, the financial position of NT Large Cap Value Fund of American Century Capital Portfolios, Inc., as of March 31, 2012, the results of its operations for the year then ended, the changes in its net assets for each of the two years in the period then ended, and the financial highlights for each of the five years in the period then ended, in conformity with accounting principles generally accepted in the United States of America.
Deloitte & Touche LLP
Kansas City, Missouri
May 16, 2012
24
The Board of Directors
The individuals listed below serve as directors of the funds. Each director will continue to serve in this capacity until death, retirement, resignation or removal from office. The mandatory retirement age for directors who are not “interested persons,” as that term is defined in the Investment Company Act (independent directors), is 72. However, the mandatory retirement age for an individual director may be extended with the approval of the remaining independent directors.
Mr. Thomas is an “interested person” because he currently serves as President and Chief Executive Officer of American Century Companies, Inc. (ACC), the parent company of American Century Investment Management, Inc. (ACIM or the advisor). Mr. Fink is an “interested person” because he currently serves as Executive Vice President and Chief Operating Officer of ACC.
The other directors (more than three-fourths of the total number) are independent; that is, they have never been employees, directors or officers of, and have no financial interest in, ACC or any of its wholly owned, direct or indirect, subsidiaries, including ACIM, American Century Investment Services, Inc. (ACIS) and American Century Services, LLC (ACS). The directors serve in this capacity for seven (in the case of Mr. Thomas, 15) registered investment companies in the American Century Investments family of funds.
The following table presents additional information about the directors. The mailing address for each director is 4500 Main Street, Kansas City, Missouri 64111.
Name (Year of Birth) | Position(s) Held with Funds | Length of Time Served | Principal Occupation(s) During Past 5 Years | Number of American Century Portfolios Overseen by Director | Other Directorships Held During Past 5 Years | |
| Independent Directors | ||||||
Thomas A. Brown (1940) | Director | Since 1980 | Managing Member, Associated Investments, LLC (real estate investment company); Brown Cascade Properties, LLC (real estate investment company) (2001 to 2009) | 66 | None | |
Andrea C. Hall (1945) | Director | Since 1997 | Retired | 66 | None | |
Jan M. Lewis (1957) | Director | Since 2011 | President and Chief Executive Officer, Catholic Charities of Northeast Kansas (human services organization) (2006 to present) | 66 | None | |
James A. Olson (1942) | Director | Since 2007 | Member, Plaza Belmont LLC (private equity fund manager) | 66 | Saia, Inc. (2002 to 2012) and Entertainment Properties Trust | |
Donald H. Pratt (1937) | Director and Chairman of the Board | Since 1995 (Chairman since 2005) | Chairman and Chief Executive Officer, Western Investments, Inc. (real estate company) | 66 | None | |
25
Name (Year of Birth) | Position(s) Held with Funds | Length of Time Served | Principal Occupation(s) During Past 5 Years | Number of American Century Portfolios Overseen by Director | Other Directorships Held During Past 5 Years | |
| Independent Directors | ||||||
M. Jeannine Strandjord (1945) | Director | Since 1994 | Retired | 66 | DST Systems Inc., Euronet Worldwide Inc., and Charming Shoppes, Inc. (2006 to 2010) | |
John R. Whitten (1946) | Director | Since 2008 | Project Consultant, Celanese Corp. (industrial chemical company) | 66 | Rudolph Technologies, Inc. | |
Stephen E. Yates (1948) | Director | Since 2012 | Retired; Executive Vice President, Technology & Operations, KeyCorp. (computer services) (2004 to 2010) | 66 | Applied Industrial Technology (2001 to 2010) | |
| Interested Directors | ||||||
Barry Fink (1955) | Director and Executive Vice President | Since 2012 (Executive Vice President since 2007) | Chief Operating Officer and Executive Vice President, ACC (September 2007 to present); President, ACS (October 2007 to present); Managing Director, Morgan Stanley (2000 to 2007). Also serves as Manager, ACS and Director, ACC and certain ACC subsidiaries | 66 | None | |
Jonathan S. Thomas (1963) | Director and President | Since 2007 | President and Chief Executive Officer, ACC (March 2007 to present); Chief Administrative Officer, ACC (February 2006 to February 2007); Executive Vice President, ACC (November 2005 to February 2007). Also serves as Chief Executive Officer and Manager, ACS; Executive Vice President, ACIM; Director, ACC, ACIM and other ACC subsidiaries | 108 | None | |
26
Officers
The following table presents certain information about the executive officers of the funds. Each officer serves as an officer for each of the 15 investment companies in the American Century family of funds, unless otherwise noted. No officer is compensated for his or her service as an officer of the funds. The listed officers are interested persons of the funds and are appointed or re-appointed on an annual basis. The mailing address for each officer listed below is 4500 Main Street, Kansas City, Missouri 64111.
Name (Year of Birth) | Offices with the Funds | Principal Occupation(s) During the Past Five Years | |
Jonathan S. Thomas (1963) | Director and President since 2007 | President and Chief Executive Officer, ACC (March 2007 to present); Chief Administrative Officer, ACC (February 2006 to February 2007); Executive Vice President, ACC (November 2005 to February 2007). Also serves as Chief Executive Officer and Manager, ACS; Executive Vice President, ACIM; Director, ACC, ACIM and other ACC subsidiaries | |
Barry Fink (1955) | Director since 2012 and Executive Vice President since 2007 | Chief Operating Officer and Executive Vice President, ACC (September 2007 to present); President, ACS (October 2007 to present); Managing Director, Morgan Stanley (2000 to 2007). Also serves as Manager, ACS and Director, ACC and certain ACC subsidiaries | |
Maryanne L. Roepke (1956) | Chief Compliance Officer since 2006 and Senior Vice President since 2000 | Chief Compliance Officer, American Century funds, ACIM and ACS (August 2006 to present). Also serves as Senior Vice President, ACS | |
Charles A. Etherington (1957) | General Counsel since 2007 and Senior Vice President since 2006 | Attorney, ACC (February 1994 to present); Vice President, ACC (November 2005 to present), General Counsel, ACC (March 2007 to present); Also serves as General Counsel, ACIM, ACS, ACIS and other ACC subsidiaries; and Senior Vice President, ACIM and ACS | |
C. Jean Wade (1964) | Vice President, Treasurer and Chief Financial Officer since 2012 | Vice President, ACS (February 2000 to present) | |
Robert J. Leach (1966) | Vice President since 2006 and Assistant Treasurer since 2012 | Vice President, ACS (February 2000 to present) | |
David H. Reinmiller (1963) | Vice President since 2000 | Attorney, ACC (January 1994 to present); Associate General Counsel, ACC (January 2001 to present). Also serves as Vice President, ACIM and ACS | |
Ward D. Stauffer (1960) | Secretary since 2005 | Attorney, ACC (June 2003 to present) |
The Statement of Additional Information has additional information about the fund’s directors and is available without charge, upon request, by calling 1-800-345-2021.
27
Retirement Account Information
As required by law, distributions you receive from certain IRAs, or 403(b), 457 and qualified plans are subject to federal income tax withholding, unless you elect not to have withholding apply. Tax will be withheld on the total amount withdrawn even though you may be receiving amounts that are not subject to withholding, such as nondeductible contributions. In such case, excess amounts of withholding could occur. You may adjust your withholding election so that a greater or lesser amount will be withheld.
If you don’t want us to withhold on this amount, you must notify us to not withhold the federal income tax. You may notify us in writing or in certain situations by telephone or through other electronic means. You have the right to revoke your withholding election at any time and any election you make may remain in effect until revoked by filing a new election.
Remember, even if you elect not to have income tax withheld, you are liable for paying income tax on the taxable portion of your withdrawal. If you elect not to have income tax withheld or you don’t have enough income tax withheld, you may be responsible for payment of estimated tax. You may incur penalties under the estimated tax rules if your withholding and estimated tax payments are not sufficient. You can reduce or defer the income tax on a distribution by directly or indirectly rolling such distribution over to another IRA or eligible plan. You should consult your tax advisor for additional information.
State tax will be withheld if, at the time of your distribution, your address is within one of the mandatory withholding states and you have federal income tax withheld. State taxes will be withheld from your distribution in accordance with the respective state rules.
Proxy Voting Guidelines
American Century Investment Management, Inc., the fund’s investment advisor, is responsible for exercising the voting rights associated with the securities purchased and/or held by the fund. A description of the policies and procedures the advisor uses in fulfilling this responsibility is available without charge, upon request, by calling 1-800-345-2021. It is also available on American Century Investments’ website at americancentury.com and on the Securities and Exchange Commission’s website at sec.gov. Information regarding how the investment advisor voted proxies relating to portfolio securities during the most recent 12-month period ended June 30 is available on the “About Us” page at americancentury.com. It is also available at sec.gov.
Quarterly Portfolio Disclosure
The fund files its complete schedule of portfolio holdings with the Securities and Exchange Commission (SEC) for the first and third quarters of each fiscal year on Form N-Q. The fund’s Forms N-Q are available on the SEC’s website at sec.gov, and may be reviewed and copied at the SEC’s Public Reference Room in Washington, DC. Information on the operation of the Public Reference Room may be obtained by calling 1-800-SEC-0330. The fund also makes its complete schedule of portfolio holdings for the most recent quarter of its fiscal year available on its website at americancentury.com and, upon request, by calling 1-800-345-2021.
28
Other Tax Information
The following information is provided pursuant to provisions of the Internal Revenue Code.
The fund hereby designates up to the maximum amount allowable as qualified dividend income for the fiscal year ended March 31, 2012.
For corporate taxpayers, the fund hereby designates $10,239,967, or up to the maximum amount allowable, of ordinary income distributions paid during the fiscal year ended March 31, 2012 as qualified for the corporate dividends received deduction.
29
30
31
32
| Contact Us | americancentury.com |
| Automated Information Line | 1-800-345-8765 |
| Investor Services Representative | 1-800-345-2021 or 816-531-5575 |
| Investors Using Advisors | 1-800-378-9878 |
Business, Not-For-Profit, Employer-Sponsored Retirement Plans | 1-800-345-3533 |
Banks and Trust Companies, Broker-Dealers, Financial Professionals, Insurance Companies | 1-800-345-6488 |
| Telecommunications Device for the Deaf | 1-800-634-4113 |
American Century Capital Portfolios, Inc.
Investment Advisor:
American Century Investment Management, Inc.
Kansas City, Missouri
This report and the statements it contains are submitted for the general information of our shareholders. The report is not authorized for distribution to prospective investors unless preceded or accompanied by an effective prospectus.
©2012 American Century Proprietary Holdings, Inc. All rights reserved.
CL-ANN-75051 1205
ANNUAL REPORT MARCH 31, 2012
| NT Mid Cap Value Fund |
| President’s Letter | 2 |
| Independent Chairman’s Letter | 3 |
| Market Perspective | 4 |
| Performance | 5 |
| Portfolio Commentary | 6 |
| Fund Characteristics | 8 |
| Shareholder Fee Example | 9 |
| Schedule of Investments | 11 |
| Statement of Assets and Liabilities | 14 |
| Statement of Operations | 15 |
| Statement of Changes in Net Assets | 16 |
| Notes to Financial Statements | 17 |
| Financial Highlights | 22 |
| Report of Independent Registered Public Accounting Firm | 23 |
| Management | 24 |
| Additional Information | 27 |
Any opinions expressed in this report reflect those of the author as of the date of the report, and do not necessarily represent the opinions of American Century Investments® or any other person in the American Century Investments organization. Any such opinions are subject to change at any time based upon market or other conditions and American Century Investments disclaims any responsibility to update such opinions. These opinions may not be relied upon as investment advice and, because investment decisions made by American Century Investments funds are based on numerous factors, may not be relied upon as an indication of trading intent on behalf of any American Century Investments fund. Security examples are used for representational purposes only and are not intended as recommendations to purchase or sell securities. Performance information for comparative indices and securities is provided to American Century Investments by third party vendors. To the best of American Century Investments’ knowledge, such information is accurate at the time of printing.
Dear Investor:
Thank you for reviewing this annual report for the period ended March 31, 2012. Our report offers investment performance and portfolio information, presented with the expert perspective of our portfolio management team.
This report remains one of our most important vehicles for conveying information about fund returns, as well as market factors and strategies that affected fund performance. For additional, updated information, we encourage you to visit our website, americancentury.com. Click on the “Fund Performance” and “Insights & News” headings at the top of our Individual Investors site.
Mostly Positive U.S. Returns Belie the Period’s Volatility
U.S. market performance for the 12 months ended March 31, 2012 appeared more benign than it really was. Broadly speaking, U.S. stocks and bonds returned roughly 7-9% for the period, as indicated by the S&P 500 Index and the Barclays U.S. Aggregate Bond Index. But those solid returns masked the roller-coaster ride required to achieve them.
The reporting period began, in April 2011, with stock indices and U.S. Treasury yields at some of their highest levels since 2008, prior to the Financial Crisis plunge. These elevated levels reflected increased risk-taking as the markets priced in improving global economic growth, strong corporate earnings, and higher inflation.
This “risk-on” investing attitude switched to “risk-off” during the summer of 2011, transformed by high fuel prices, federal budget management concerns in the U.S., and the worsening sovereign debt crisis in Europe. Recessionary expectations pulled Treasury yields to record lows by September, and stock indices suffered double-digit declines from their peaks.
Sentiment switched again in the fourth quarter of 2011, as concerns about the European sovereign debt crisis and the U.S. economy eased. Renewed “risk-on” investing carried into the first quarter of 2012, boosting growth stocks and high-yield bonds in particular. But the financial markets remain subject to potentially high volatility as they continue to wrestle with uncertainties regarding Europe, the Middle East, economic strength, government budget deficits, and the U.S. presidential election. We believe strongly in adhering to a disciplined, diversified, long-term investment approach during volatile periods, and we appreciate your continued trust in us during these unsettled times.
Sincerely,
Jonathan Thomas
President and Chief Executive Officer
American Century Investments
2
Dear Fellow Shareholders,
The assets under management in American Century Investments’ funds grow through investors placing new assets in the funds and through market appreciation. Asset growth has been at near record levels over the past two calendar years as market movements were upward, the funds’ relative returns were generally favorable, and the distribution strategies implemented by fund management have been successful.
The board reviews fund performance and distribution strategies on a regular basis. Several years ago, the fund’s management team discussed with the board its plans to grow fund assets in the intermediary, institutional and international distribution channels. These distribution strategies have produced strong positive growth. The growth in the intermediary channel recognizes the funds’ strong relative investment performance and the desire of many shareholders to seek financial guidance. Investors in both the institutional and international channels appear to find the funds’ risk-based investment strategies attractive. The board continues to support fund management’s strategies to increase fund assets and will continue to work to provide the benefits of these gains to fund shareholders.
We continue to receive a steady flow of very thoughtful questions from shareholders. If there are issues that you would like the board to address please email me at dhpratt@fundboardchair.com. Thank you for your continued investment in American Century Investments funds.
Best regards,
Don Pratt
3
By Phil Davidson,
Chief Investment Officer,
U.S. Value Equity
U.S. Stocks Advanced
Despite some meaningful market volatility, U.S. stocks generated positive performance for the one-year period ended March 31, 2012. The overall advance was driven by a robust equity market rally over the last six months of the period as economic conditions improved.
After rallying throughout much of April 2011, the stock market declined sharply from May through September amid weaker economic conditions in the U.S. and an increasingly challenging sovereign debt crisis in Europe. Public debt issues in the U.S. also weighed on the market as the government wrestled with the federal debt ceiling and a major credit rating agency downgraded the credit rating of U.S. debt from AAA to AA+ in August—the first such downgrade in the country’s history.
Market sentiment shifted markedly over the last six months of the period as evidence of improving economic growth helped ease concerns about a possible recession. Most notably, employment growth showed signs of life, helping push the unemployment rate down to a three-year low. Consumer spending and manufacturing activity also picked up, and mild winter weather provided a lift to the construction industry. The situation in Europe also improved as liquidity injections from the European Central Bank and a debt restructuring agreement in Greece helped provide some stability to the Continent’s debt markets and banking sector. The end result was a steady and substantial market rally over the last six months.
Value Stocks Lagged
As the table below illustrates, large-cap stocks and growth issues led the market’s overall advance. Growth stocks benefited the most from the improving economic environment over the last half of the period, along with investors’ greater appetite for risk. Sector performance also favored growth shares over value during the period. The top-performing sectors in the S&P 500 Index included information technology and consumer discretionary, two growth-oriented sectors of the market. In contrast, the financials sector, which is the largest sector weighting in most value indices, declined for the reporting period.
| U.S. Stock Index Returns | ||||
| For the 12 months ended March 31, 2012 | ||||
| Russell 1000 Index (Large-Cap) | 7.86% | Russell 2000 Index (Small-Cap) | -0.18% | |
| Russell 1000 Growth Index | 11.02% | Russell 2000 Growth Index | 0.68% | |
| Russell 1000 Value Index | 4.79% | Russell 2000 Value Index | -1.07% | |
| Russell Midcap Index | 3.31% | |||
| Russell Midcap Growth Index | 4.43% | |||
| Russell Midcap Value Index | 2.28% | |||
4
Performance |
| Total Returns as of March 31, 2012 | |||||
| Average Annual Returns | |||||
| Ticker Symbol | 1 year | 5 years | Since Inception | Inception Date | |
| Institutional Class | ACLMX | 4.93% | 4.33% | 6.32% | 5/12/06 |
| Russell Midcap Value Index | — | 2.28% | 1.26% | 3.63%(1) | — |
| (1) | Since 4/30/06, the date nearest the Institutional Class’s inception for which data are available. |
| Growth of $10,000 Over Life of Class |
| $10,000 investment made May 12, 2006 |
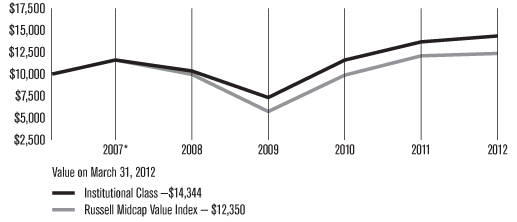
| * | From 5/12/06, the Institutional Class’s inception date. Index data from 4/30/06, the date nearest the Institutional Class’s inception for which data are available. Not annualized. |
| Total Annual Fund Operating Expenses |
Institutional Class 0.81% |
The total annual fund operating expenses shown is as stated in the fund’s prospectus current as of the date of this report. The prospectus may vary from the expense ratio shown elsewhere in this report because it is based on a different time period, includes acquired fund fees and expenses, and, if applicable, does not include fee waivers or expense reimbursements.
Data presented reflect past performance. Past performance is no guarantee of future results. Current performance may be higher or lower than the performance shown. Investment return and principal value will fluctuate, and redemption value may be more or less than original cost. To obtain performance data current to the most recent month end, please call 1-800-345-2021 or visit americancentury.com. International investing involves special risks, such as political instability and currency fluctuations.
Data assumes reinvestment of dividends and capital gains, and none of the charts reflect the deduction of taxes that a shareholder would pay on fund distributions or the redemption of fund shares. Returns for the index are provided for comparison. The fund’s total returns include operating expenses (such as transaction costs and management fees) that reduce returns, while the total returns of the index does not.
5
Portfolio Managers: Kevin Toney, Michael Liss, Phil Davidson, and Brian Woglom
Portfolio Manager Brian Woglom has joined the NT Mid Cap Value management team. Mr. Woglom previously served as an investment analyst for NT Mid Cap Value and has been a member of the NT Mid Cap Value team since 2006.
Performance Summary
NT Mid Cap Value returned 4.93% for the 12 months ended March 31, 2012. By comparison, the average return for Morningstar’s Mid Cap Value category (its performance, like NT Mid Cap Value’s, reflects operating expenses) was 0.74%.* The fund’s benchmark, the Russell Midcap Value Index, returned 2.28%. Its returns do not include operating expenses.
The U.S. stock market posted a gain during the one-year reporting period, largely as a result of its strong performance during the first quarter of 2012. For most of the 12-month period, investors were preoccupied with Europe’s financial woes, which threatened to spread from Greece to other nations and seemed likely to cause problems for European banks. Lackluster U.S. economic growth and the downgrade of U.S. debt by Standard & Poor’s Ratings also dampened market sentiment. Investor risk appetite improved near the end of 2011 when the U.S. economy, proving surprisingly resilient, returned to its slow-growth path. Employers added new jobs, and corporate earnings remained solid. Investors also grew more optimistic as the European Central Bank provided inexpensive loans to European banks and the financial crisis eased. In this environment, growth stocks outperformed value stocks across the capitalization spectrum. For the reporting period, NT Mid Cap Value’s investment approach, which emphasizes higher-quality businesses with sound balance sheets, provided positive absolute results in eight of the 10 sectors in which it was invested. It also outperformed in relative terms. Positions in the financials, consumer staples, and telecommunication services sectors contributed to performance. Allocations to the consumer discretionary and utilities sectors detracted. Foreign holdings also accounted for a portion of the portfolio’s underperformance during the reporting period.
We carefully manage this portfolio for long-term results. Since its inception on May 12, 2006, NT Mid Cap Value has produced an average annual return of 6.32%, topping the returns for that period for Morningstar’s Mid Cap Value category average and the Russell Midcap Value Index (see the performance information on page 5 or in footnotes below).
Financials Boosted Performance
In financials, strong security selection enhanced relative results. Within the insurance industry, NT Mid Cap Value owned Transatlantic Holdings, a global reinsurance company. Shares of Transatlantic surged on news that it had entered a merger agreement with Allied World Assurance Co. Holdings. The stock continued to perform well as several other suitors made additional offers. Ultimately, Transatlantic agreed to be acquired by Alleghany Corp.
The portfolio also benefited from an investment in American Tower Corp., which is not represented in the benchmark. American Tower announced it was planning
| * | The average returns for the periods ended March 31, 2012, for Morningstar’s Mid Cap Value category were 1.41% for the five-year period and 3.74% from May 31, 2006, the date nearest the Institutional Class’s inception for which data are available. ©2012 Morningstar, Inc. All Rights Reserved. The information contained herein: (1) is proprietary to Morningstar and/or its content providers; (2) may not be copied or distributed; and (3) is not warranted to be accurate, complete or timely. Neither Morningstar nor its content providers are responsible for any damages or losses arising from any use of this information. |
6
to convert itself into a real estate investment trust (REIT) at the end of 2011, attracting more investors to the stock. (The conversion led to American Tower’s reclassification from a telecommunications stock to a REIT.)
The financials sector also provided a notable detractor — Hudson City Bancorp., a regional bank operating primarily in New Jersey and New York. The low interest rate environment has raised concern about its future earnings power.
Consumer Staples Contributed
NT Mid Cap Value’s overweight in consumer staples added to relative performance as investors gravitated to more defensive stocks. The portfolio benefited from our focus on high-quality names, particularly among food and household products stocks. Many of these stocks offer attractive dividend yields. A notable contributor was Kimberly-Clark Corp., which demonstrated strong pricing power even as commodities prices, specifically the price of pulp, increased.
Energy Supplied Contributor and Detractor
In the energy sector, the portfolio benefited from a position in oil and gas drilling company, EQT Corp. The stock appreciated in the early part of the reporting period, we believe, because of unspecified rumors about its potential acquisition. Drilling companies with a presence in the Marcellus shale, which has significant untapped natural gas reserves, were attractive acquisition candidates during the reporting period.
A detractor was Ultra Petroleum, a high-quality natural gas exploration and production company, with solid assets and the ability to extract natural gas more cheaply than many of its peers. Its shares declined, largely because of supply and demand. New extraction techniques have produced a significant amount of natural gas supply. Meanwhile, prices fell to 10-year lows on weak demand during the mild winter.
Consumer Discretionary and Utilities Hampered Results
NT Mid Cap Value’s underweight in the consumer discretionary sector, which outperformed in the benchmark, slowed relative performance. Security selection in the household durables industry was also a drag on results.
In utilities, an underweight slowed performance. Utilities stocks, which are generally viewed as defensive instruments in difficult economic times, performed strongly during the reporting period. We believed utilities stocks offer a less attractive risk/reward profile than stocks in other sectors.
Industrials Provided Top Detractor
In the industrials sector, an investment in Koninklijke Philips Electronics detracted. The Dutch company, which does a significant amount of business in Europe, has been hampered by the slowdown in the European economy. In addition, the new management team’s turnaround plan is progressing more slowly than expected.
Outlook
We continue to follow our disciplined, bottom-up process, selecting companies one at a time for the portfolio. As of March 31, 2012, we see opportunities in health care, industrials, and consumer staples reflected by overweight positions in these sectors relative to the benchmark. Fundamental analysis and valuation work have led to smaller relative weightings in financials, information technology, and consumer discretionary stocks.
7
| MARCH 31, 2012 | |
| Top Ten Holdings | % of net assets |
| Republic Services, Inc. | 3.3% |
| iShares Russell Midcap Value Index Fund | 2.8% |
| Northern Trust Corp. | 2.7% |
| Imperial Oil Ltd. | 2.0% |
| CareFusion Corp. | 1.7% |
| Kimberly-Clark Corp. | 1.7% |
| Tyco International Ltd. | 1.7% |
| PG&E Corp. | 1.6% |
| Ralcorp Holdings, Inc. | 1.6% |
| Zimmer Holdings, Inc. | 1.6% |
| Top Five Industries | % of net assets |
| Insurance | 8.3% |
| Oil, Gas and Consumable Fuels | 6.8% |
| Electric Utilities | 6.7% |
| Health Care Equipment and Supplies | 6.4% |
| Commercial Banks | 5.5% |
| Types of Investments in Portfolio | % of net assets |
| Domestic Common Stocks | 86.6% |
| Foreign Common Stocks* | 7.6% |
| Exchange-Traded Funds | 2.8% |
| Total Equity Exposure | 97.0% |
| Temporary Cash Investments | 2.9% |
| Other Assets and Liabilities | 0.1% |
| * | Includes depositary shares, dual listed securities and foreign ordinary shares. |
8
Fund shareholders may incur two types of costs: (1) transaction costs, including sales charges (loads) on purchase payments and redemption/exchange fees; and (2) ongoing costs, including management fees; distribution and service (12b-1) fees; and other fund expenses. This example is intended to help you understand your ongoing costs (in dollars) of investing in your fund and to compare these costs with the ongoing cost of investing in other mutual funds.
The example is based on an investment of $1,000 made at the beginning of the period and held for the entire period from October 1, 2011 to March 31, 2012.
Actual Expenses
The table provides information about actual account values and actual expenses for each class. You may use the information, together with the amount you invested, to estimate the expenses that you paid over the period. First, identify the share class you own. Then simply divide your account value by $1,000 (for example, an $8,600 account value divided by $1,000 = 8.6), then multiply the result by the number under the heading “Expenses Paid During Period” to estimate the expenses you paid on your account during this period.
If you hold Investor Class shares of any American Century Investments fund, or Institutional Class shares of the American Century Diversified Bond Fund, in an American Century Investments account (i.e., not a financial intermediary or retirement plan account), American Century Investments may charge you a $12.50 semiannual account maintenance fee if the value of those shares is less than $10,000. We will redeem shares automatically in one of your accounts to pay the $12.50 fee. In determining your total eligible investment amount, we will include your investments in all personal accounts (including American Century Investments Brokerage accounts) registered under your Social Security number. Personal accounts include individual accounts, joint accounts, UGMA/UTMA accounts, personal trusts, Coverdell Education Savings Accounts and IRAs (including traditional, Roth, Rollover, SEP-, SARSEP- and SIMPLE-IRAs), and certain other retirement accounts. If you have only business, business retirement, employer-sponsored or American Century Investments Brokerage accounts, you are currently not subject to this fee. If you are subject to the Account Maintenance Fee, your account value could be reduced by the fee amount.
Hypothetical Example for Comparison Purposes
The table also provides information about hypothetical account values and hypothetical expenses based on the actual expense ratio of each class of your fund and an assumed rate of return of 5% per year before expenses, which is not the actual return of a fund’s share class. The hypothetical account values and expenses may not be used to estimate the actual ending account balance or expenses you paid for the period. You may use this information to compare the ongoing costs of investing in your fund and other funds. To do so, compare this 5% hypothetical example with the 5% hypothetical examples that appear in the shareholder reports of the other funds.
9
Please note that the expenses shown in the table are meant to highlight your ongoing costs only and do not reflect any transactional costs, such as sales charges (loads) or redemption/exchange fees. Therefore, the table is useful in comparing ongoing costs only, and will not help you determine the relative total costs of owning different funds. In addition, if these transactional costs were included, your costs would have been higher.
Beginning Account Value 10/1/11 | Ending Account Value 3/31/12 | Expenses Paid During Period(1) 10/1/11 - 3/31/12 | Annualized Expense Ratio(1) | |
| Actual | ||||
| Institutional Class | $1,000 | $1,232.50 | $4.47 | 0.80% |
| Hypothetical | ||||
| Institutional Class | $1,000 | $1,021.00 | $4.04 | 0.80% |
| (1) | Expenses are equal to the class’s annualized expense ratio listed in the table above, multiplied by the average account value over the period, multiplied by 183, the number of days in the most recent fiscal half-year, divided by 366, to reflect the one-half year period. |
10
MARCH 31, 2012
| Shares | Value | |||||||
| Common Stocks — 94.2% | ||||||||
| AEROSPACE AND DEFENSE — 2.6% | ||||||||
| Exelis, Inc. | 135,533 | $1,696,873 | ||||||
| General Dynamics Corp. | 21,719 | 1,593,740 | ||||||
Huntington Ingalls Industries, Inc.(1) | 17,903 | 720,417 | ||||||
| L-3 Communications Holdings, Inc. | 31,864 | 2,255,016 | ||||||
| Northrop Grumman Corp. | 27,166 | 1,659,299 | ||||||
| 7,925,345 | ||||||||
| AIRLINES — 1.1% | ||||||||
| Southwest Airlines Co. | 385,595 | 3,177,303 | ||||||
| BEVERAGES — 1.4% | ||||||||
| Dr Pepper Snapple Group, Inc. | 104,831 | 4,215,254 | ||||||
| CAPITAL MARKETS — 4.1% | ||||||||
| Charles Schwab Corp. (The) | 212,671 | 3,056,082 | ||||||
| Northern Trust Corp. | 168,793 | 8,009,228 | ||||||
| State Street Corp. | 26,629 | 1,211,620 | ||||||
| 12,276,930 | ||||||||
| CHEMICALS — 0.9% | ||||||||
| Minerals Technologies, Inc. | 26,470 | 1,731,403 | ||||||
| Olin Corp. | 51,106 | 1,111,555 | ||||||
| 2,842,958 | ||||||||
| COMMERCIAL BANKS — 5.5% | ||||||||
| City National Corp. | 30,253 | 1,587,375 | ||||||
| Comerica, Inc. | 115,392 | 3,734,085 | ||||||
| Commerce Bancshares, Inc. | 93,797 | 3,800,654 | ||||||
| Cullen/Frost Bankers, Inc. | 24,858 | 1,446,487 | ||||||
| PNC Financial Services Group, Inc. | 32,771 | 2,113,402 | ||||||
| SunTrust Banks, Inc. | 67,040 | 1,620,357 | ||||||
| Westamerica Bancorp. | 48,093 | 2,308,464 | ||||||
| 16,610,824 | ||||||||
| COMMERCIAL SERVICES AND SUPPLIES — 3.8% | ||||||||
| Republic Services, Inc. | 324,292 | 9,910,364 | ||||||
| Waste Management, Inc. | 43,368 | 1,516,145 | ||||||
| 11,426,509 | ||||||||
| COMMUNICATIONS EQUIPMENT — 0.3% | ||||||||
| Harris Corp. | 20,020 | 902,502 | ||||||
| COMPUTERS AND PERIPHERALS — 0.1% | ||||||||
Western Digital Corp.(1) | 10,860 | 449,495 | ||||||
| CONTAINERS AND PACKAGING — 1.2% | ||||||||
| Bemis Co., Inc. | 116,917 | 3,775,250 | ||||||
| DIVERSIFIED TELECOMMUNICATION SERVICES — 1.8% | ||||||||
| CenturyLink, Inc. | 83,840 | $3,240,416 | ||||||
tw telecom, inc.(1) | 92,500 | 2,049,800 | ||||||
| 5,290,216 | ||||||||
| ELECTRIC UTILITIES — 6.7% | ||||||||
| Empire District Electric Co. (The) | 143,145 | 2,913,001 | ||||||
| Great Plains Energy, Inc. | 223,250 | 4,525,277 | ||||||
| IDACORP, Inc. | 27,300 | 1,122,576 | ||||||
| Northeast Utilities | 55,726 | 2,068,549 | ||||||
| NV Energy, Inc. | 239,529 | 3,861,207 | ||||||
| Portland General Electric Co. | 74,566 | 1,862,659 | ||||||
| Westar Energy, Inc. | 134,806 | 3,765,132 | ||||||
| 20,118,401 | ||||||||
| ELECTRICAL EQUIPMENT — 1.3% | ||||||||
| Brady Corp., Class A | 30,961 | 1,001,588 | ||||||
| Emerson Electric Co. | 34,444 | 1,797,288 | ||||||
| Hubbell, Inc., Class B | 13,164 | 1,034,427 | ||||||
| 3,833,303 | ||||||||
| ELECTRONIC EQUIPMENT, INSTRUMENTS AND COMPONENTS — 1.1% | ||||||||
| Molex, Inc., Class A | 62,700 | 1,470,315 | ||||||
| TE Connectivity Ltd. | 47,864 | 1,759,002 | ||||||
| 3,229,317 | ||||||||
| FOOD AND STAPLES RETAILING — 1.4% | ||||||||
| SYSCO Corp. | 138,456 | 4,134,296 | ||||||
| FOOD PRODUCTS — 4.3% | ||||||||
| Campbell Soup Co. | 49,872 | 1,688,167 | ||||||
| General Mills, Inc. | 62,355 | 2,459,905 | ||||||
| H.J. Heinz Co. | 29,922 | 1,602,323 | ||||||
| Kellogg Co. | 43,881 | 2,353,338 | ||||||
Ralcorp Holdings, Inc.(1) | 66,217 | 4,906,018 | ||||||
| 13,009,751 | ||||||||
| GAS UTILITIES — 0.8% | ||||||||
| AGL Resources, Inc. | 62,450 | 2,449,289 | ||||||
| HEALTH CARE EQUIPMENT AND SUPPLIES — 6.4% | ||||||||
| Becton, Dickinson and Co. | 40,851 | 3,172,080 | ||||||
Boston Scientific Corp.(1) | 343,295 | 2,052,904 | ||||||
CareFusion Corp.(1) | 201,490 | 5,224,636 | ||||||
Hologic, Inc.(1) | 41,610 | 896,696 | ||||||
| STERIS Corp. | 52,810 | 1,669,852 | ||||||
| Stryker Corp. | 29,888 | 1,658,186 | ||||||
| Zimmer Holdings, Inc. | 74,639 | 4,797,795 | ||||||
| 19,472,149 | ||||||||
11
| Shares | Value | |||||||
| HEALTH CARE PROVIDERS AND SERVICES — 3.4% | 40,227 | $1,981,180 | ||||||
| CIGNA Corp. | ||||||||
| Humana, Inc. | 13,000 | 1,202,240 | ||||||
LifePoint Hospitals, Inc.(1) | 89,485 | 3,529,288 | ||||||
| Patterson Cos., Inc. | 101,872 | 3,402,525 | ||||||
| 10,115,233 | ||||||||
| HOTELS, RESTAURANTS AND LEISURE — 2.5% | ||||||||
| Carnival Corp. | 57,021 | 1,829,234 | ||||||
| CEC Entertainment, Inc. | 70,000 | 2,653,700 | ||||||
| International Game Technology | 83,003 | 1,393,620 | ||||||
| International Speedway Corp., Class A | 34,715 | 963,341 | ||||||
| Speedway Motorsports, Inc. | 34,839 | 650,793 | ||||||
| 7,490,688 | ||||||||
| HOUSEHOLD DURABLES — 0.7% | ||||||||
| Whirlpool Corp. | 29,083 | 2,235,319 | ||||||
| HOUSEHOLD PRODUCTS — 2.4% | ||||||||
| Clorox Co. | 28,500 | 1,959,375 | ||||||
| Kimberly-Clark Corp. | 69,868 | 5,162,546 | ||||||
| 7,121,921 | ||||||||
| INDUSTRIAL CONGLOMERATES — 2.9% | ||||||||
| Koninklijke Philips Electronics NV | 187,681 | 3,804,713 | ||||||
| Tyco International Ltd. | 90,506 | 5,084,627 | ||||||
| 8,889,340 | ||||||||
| INSURANCE — 8.3% | ||||||||
| ACE Ltd. | 27,112 | 1,984,598 | ||||||
| Allstate Corp. (The) | 114,300 | 3,762,756 | ||||||
| Aon Corp. | 73,250 | 3,593,645 | ||||||
| HCC Insurance Holdings, Inc. | 140,679 | 4,384,964 | ||||||
| Marsh & McLennan Cos., Inc. | 120,093 | 3,937,850 | ||||||
| Symetra Financial Corp. | 85,937 | 990,854 | ||||||
| Torchmark Corp. | 15,900 | 792,615 | ||||||
| Travelers Cos., Inc. (The) | 55,781 | 3,302,235 | ||||||
| Unum Group | 96,695 | 2,367,094 | ||||||
| 25,116,611 | ||||||||
| IT SERVICES — 0.4% | ||||||||
| Booz Allen Hamilton Holding Corp. | 70,512 | 1,200,819 | ||||||
| LIFE SCIENCES TOOLS AND SERVICES — 0.2% | ||||||||
Life Technologies Corp.(1) | 13,607 | 664,294 | ||||||
| MACHINERY — 2.7% | 24,166 | $999,264 |
| Ingersoll-Rand plc | ||||||||
| ITT Corp. | 79,688 | 1,828,043 | ||||||
| Kaydon Corp. | 88,521 | 2,258,171 | ||||||
Oshkosh Corp.(1) | 60,934 | 1,411,841 | ||||||
| Snap-On, Inc. | 19,550 | 1,191,963 | ||||||
| Stanley Black & Decker, Inc. | 6,590 | 507,166 | ||||||
| 8,196,448 | ||||||||
| MEDIA — 0.9% | ||||||||
| Omnicom Group, Inc. | 16,457 | 833,547 | ||||||
| Time Warner Cable, Inc. | 22,672 | 1,847,768 | ||||||
| 2,681,315 | ||||||||
| METALS AND MINING — 1.1% | ||||||||
| Newmont Mining Corp. | 64,284 | 3,295,841 | ||||||
| MULTI-UTILITIES — 3.3% | ||||||||
| Consolidated Edison, Inc. | 22,400 | 1,308,608 | ||||||
| PG&E Corp. | 113,924 | 4,945,441 | ||||||
| Wisconsin Energy Corp. | 29,120 | 1,024,441 | ||||||
| Xcel Energy, Inc. | 96,634 | 2,557,902 | ||||||
| 9,836,392 | ||||||||
| MULTILINE RETAIL — 0.9% | ||||||||
| Target Corp. | 45,004 | 2,622,383 | ||||||
| OIL, GAS AND CONSUMABLE FUELS — 6.8% | ||||||||
| Apache Corp. | 13,700 | 1,376,028 | ||||||
| Devon Energy Corp. | 11,710 | 832,815 | ||||||
| EQT Corp. | 36,135 | 1,742,068 | ||||||
| Imperial Oil Ltd. | 134,335 | 6,103,627 | ||||||
| Murphy Oil Corp. | 66,594 | 3,747,245 | ||||||
| Peabody Energy Corp. | 42,620 | 1,234,275 | ||||||
Southwestern Energy Co.(1) | 54,712 | 1,674,187 | ||||||
Ultra Petroleum Corp.(1) | 174,592 | 3,951,017 | ||||||
| 20,661,262 | ||||||||
| PHARMACEUTICALS — 0.6% | ||||||||
| Eli Lilly & Co. | 18,853 | 759,211 | ||||||
Hospira, Inc.(1) | 28,357 | 1,060,268 | ||||||
| 1,819,479 | ||||||||
| REAL ESTATE INVESTMENT TRUSTS (REITs) — 2.8% | ||||||||
| American Tower Corp. | 38,393 | 2,419,527 | ||||||
| Government Properties Income Trust | 38,579 | 930,140 | ||||||
| Piedmont Office Realty Trust, Inc., Class A | 192,001 | 3,408,018 | ||||||
| Weyerhaeuser Co. | 71,432 | 1,565,789 | ||||||
| 8,323,474 | ||||||||
12
| Shares | Value | |||||||
| ROAD AND RAIL — 0.5% | ||||||||
| Heartland Express, Inc. | 107,147 | $1,549,346 | ||||||
| SEMICONDUCTORS AND SEMICONDUCTOR EQUIPMENT — 2.4% | ||||||||
| Applied Materials, Inc. | 353,323 | 4,395,338 | ||||||
Teradyne, Inc.(1) | 175,589 | 2,965,698 | ||||||
| 7,361,036 | ||||||||
| SPECIALTY RETAIL — 2.7% | ||||||||
| Lowe’s Cos., Inc. | 149,309 | 4,685,317 | ||||||
| Staples, Inc. | 218,190 | 3,530,314 | ||||||
| 8,215,631 | ||||||||
| THRIFTS AND MORTGAGE FINANCE — 2.8% | ||||||||
| Capitol Federal Financial, Inc. | 210,906 | 2,501,345 | ||||||
| Hudson City Bancorp., Inc. | 380,593 | 2,782,135 | ||||||
| People’s United Financial, Inc. | 246,689 | 3,266,162 | ||||||
| 8,549,642 | ||||||||
| WIRELESS TELECOMMUNICATION SERVICES — 1.1% | ||||||||
| Rogers Communications, Inc., Class B | 80,451 | 3,194,004 | ||||||
TOTAL COMMON STOCKS (Cost $258,495,313) | 284,279,570 | |||||||
| Exchange-Traded Funds — 2.8% | ||||||||
| iShares Russell Midcap Value Index Fund (Cost $7,436,034) | 176,775 | 8,508,181 | ||||||
| Temporary Cash Investments — 2.9% | ||||||||
Repurchase Agreement, Bank America Merrill Lynch, (collateralized by various U.S. Treasury obligations, 6.125%, 11/15/27, valued at $3,155,905), in a joint trading account at 0.01%, dated 3/30/12, due 4/2/12 (Delivery value $3,090,969) | 3,090,966 | |||||||
Repurchase Agreement, Credit Suisse First Boston, Inc., (collateralized by various U.S. Treasury obligations, 4.375%, 5/15/41, valued at $1,967,995), in a joint trading account at 0.03%, dated 3/30/12, due 4/2/12 (Delivery value $1,931,859) | 1,931,854 | |||||||
Repurchase Agreement, Goldman Sachs & Co., (collateralized by various U.S. Treasury obligations, 4.50%, 5/15/38, valued at $2,369,225), in a joint trading account at 0.03%, dated 3/30/12, due 4/2/12 (Delivery value $2,318,230) | 2,318,224 | |||||||
| SSgA U.S. Government Money Market Fund | 1,313,037 | 1,313,037 | ||||||
TOTAL TEMPORARY CASH INVESTMENTS (Cost $8,654,081) | 8,654,081 | |||||||
TOTAL INVESTMENT SECURITIES — 99.9% (Cost $274,585,428) | 301,441,832 | |||||||
| OTHER ASSETS AND LIABILITIES — 0.1% | 426,535 | |||||||
| TOTAL NET ASSETS — 100.0% | $301,868,367 | |||||||
| Forward Foreign Currency Exchange Contracts | |||||
| Contracts to Sell | Counterparty | Settlement Date | Value | Unrealized Gain (Loss) | |
| 7,647,707 | CAD for USD | UBS AG | 4/30/12 | $7,663,028 | $6,537 |
| 2,454,351 | EUR for USD | UBS AG | 4/30/12 | 3,273,743 | (7,958) |
| $10,936,771 | $(1,421) | ||||
(Value on Settlement Date $10,935,350)
Notes to Schedule of Investments
CAD = Canadian Dollar
EUR = Euro
USD = United States Dollar
| (1) | Non-income producing. |
See Notes to Financial Statements.
13
| MARCH 31, 2012 | ||||
| Assets | ||||
| Investment securities, at value (cost of $274,585,428) | $301,441,832 | |||
| Receivable for investments sold | 2,614,037 | |||
| Receivable for capital shares sold | 221,825 | |||
| Unrealized gain on forward foreign currency exchange contracts | 6,537 | |||
| Dividends and interest receivable | 626,972 | |||
| 304,911,203 | ||||
| Liabilities | ||||
| Payable for investments purchased | 2,836,043 | |||
| Unrealized loss on forward foreign currency exchange contracts | 7,958 | |||
| Accrued management fees | 198,835 | |||
| 3,042,836 | ||||
| Net Assets | $301,868,367 | |||
| Institutional Class Capital Shares, $0.01 Par Value | ||||
| Shares authorized | 150,000,000 | |||
| Shares outstanding | 29,717,948 | |||
| Net Asset Value Per Share | $10.16 | |||
| Net Assets Consist of: | ||||
| Capital (par value and paid-in surplus) | $273,253,886 | |||
| Undistributed net investment income | 1,787,747 | |||
| Accumulated net realized loss | (28,394 | ) | ||
| Net unrealized appreciation | 26,855,128 | |||
| $301,868,367 | ||||
See Notes to Financial Statements.
14
| YEAR ENDED MARCH 31, 2012 | ||||
| Investment Income (Loss) | ||||
| Income: | ||||
| Dividends (net of foreign taxes withheld of $39,998) | $6,807,490 | |||
| Interest | 1,697 | |||
| 6,809,187 | ||||
| Expenses: | ||||
| Management fees | 1,937,394 | |||
| Directors’ fees and expenses | 8,808 | |||
| Other expenses | 477 | |||
| 1,946,679 | ||||
| Net investment income (loss) | 4,862,508 | |||
| Realized and Unrealized Gain (Loss) | ||||
| Net realized gain (loss) on: | ||||
| Investment transactions | 12,291,479 | |||
| Foreign currency transactions | 242,698 | |||
| 12,534,177 | ||||
| Change in net unrealized appreciation (depreciation) on: | ||||
| Investments | (1,322,034 | ) | ||
| Translation of assets and liabilities in foreign currencies | 50,082 | |||
| (1,271,952 | ) | |||
| Net realized and unrealized gain (loss) | 11,262,225 | |||
| Net Increase (Decrease) in Net Assets Resulting from Operations | $16,124,733 | |||
See Notes to Financial Statements.
15
| YEARS ENDED MARCH 31, 2012 AND MARCH 31, 2011 | |||||||
| Increase (Decrease) in Net Assets | March 31, 2012 | March 31, 2011 | |||||
| Operations | |||||||
| Net investment income (loss) | $4,862,508 | $3,974,165 | |||||
| Net realized gain (loss) | 12,534,177 | 20,268,900 | |||||
| Change in net unrealized appreciation (depreciation) | (1,271,952 | ) | 7,346,078 | ||||
| Net increase (decrease) in net assets resulting from operations | 16,124,733 | 31,589,143 | |||||
| Distributions to Shareholders | |||||||
| From net investment income | (3,419,237 | ) | (3,847,606 | ) | |||
| From net realized gains | (19,965,565 | ) | (8,513,579 | ) | |||
| Decrease in net assets from distributions | (23,384,802 | ) | (12,361,185 | ) | |||
| Capital Share Transactions | |||||||
| Proceeds from shares sold | 73,448,264 | 53,326,426 | |||||
| Proceeds from reinvestment of distributions | 23,384,802 | 12,361,185 | |||||
| Payments for shares redeemed | (4,085,736 | ) | (6,263,686 | ) | |||
| Net increase (decrease) in net assets from capital share transactions | 92,747,330 | 59,423,925 | |||||
| Net increase (decrease) in net assets | 85,487,261 | 78,651,883 | |||||
| Net Assets | |||||||
| Beginning of period | 216,381,106 | 137,729,223 | |||||
| End of period | $301,868,367 | $216,381,106 | |||||
| Undistributed net investment income | $1,787,747 | $200,529 | |||||
| Transactions in Shares of the Fund | |||||||
| Sold | 7,397,963 | 5,451,225 | |||||
| Issued in reinvestment of distributions | 2,536,364 | 1,235,583 | |||||
| Redeemed | (437,840 | ) | (620,123 | ) | |||
| Net increase (decrease) in shares of the fund | 9,496,487 | 6,066,685 | |||||
See Notes to Financial Statements.
16
MARCH 31, 2012
1. Organization
American Century Capital Portfolios, Inc. (the corporation) is registered under the Investment Company Act of 1940, as amended (the 1940 Act), as an open-end management investment company and is organized as a Maryland corporation. NT Mid Cap Value Fund (the fund) is one fund in a series issued by the corporation. The fund is diversified as defined under the 1940 Act. The fund’s investment objective is to seek long-term capital growth. Income is a secondary objective. The fund pursues its objectives by investing in equity securities of medium size companies that management believes to be undervalued at the time of purchase. The fund is not permitted to invest in any securities issued by companies assigned the Global Industry Classification Standard for the tobacco industry.
2. Significant Accounting Policies
The following is a summary of significant accounting policies consistently followed by the fund in preparation of its financial statements. The financial statements are prepared in conformity with accounting principles generally accepted in the United States of America, which may require management to make certain estimates and assumptions at the date of the financial statements. Actual results could differ from these estimates.
Investment Valuations — The fund determines the fair value of its investments and computes its net asset value per share as of the close of regular trading (usually 4 p.m. Eastern time) on the New York Stock Exchange (NYSE) on each day the NYSE is open.
Equity securities that are listed or traded on a domestic securities exchange are valued at the last reported sales price or at the official closing price as provided by the exchange. Equity securities traded on foreign securities exchanges are typically valued at the closing price on the exchange where primarily traded or as of the close of the NYSE, if that is earlier. If no last sales price is reported, or if local convention or regulation so provides, the mean of the latest bid and asked prices is used. Depending on local convention or regulation, securities traded over-the-counter are valued at the mean of the latest bid and asked prices, the last sales price, or the official closing price. In its determination of fair value, the fund may review several factors including: market information specific to a security; news developments in U.S. and foreign markets; the performance of particular U.S. and foreign securities, indices, comparable securities, American Depositary Receipts, Exchange-Traded Funds, and other relevant market indicators.
Debt securities maturing within 60 days at the time of purchase may be valued at cost, plus or minus any amortized discount or premium or at the evaluated mean as provided by an independent pricing service. Evaluated mean prices are commonly derived through utilization of market models, which may consider, among other factors, trade data, quotations from dealers and active market makers, relevant yield curve and spread data, related sector levels, creditworthiness, and other relevant market information on the same or comparable securities.
Investments in open-end management investment companies are valued at the reported net asset value per share. Repurchase agreements are valued at cost. Forward foreign currency exchange contracts are valued at the mean of the latest bid and asked prices of the forward currency rates as provided by an independent pricing service.
The value of investments initially expressed in foreign currencies is translated into U.S. dollars at prevailing exchange rates.
If the fund determines that the market price for a portfolio security is not readily available or the valuation methods mentioned above do not reflect a security’s fair value, such security is valued as determined in good faith by the Board of Directors or its designee, in accordance with procedures adopted by the Board of Directors. Circumstances that may cause the fund to use these procedures to value a security include, but are not limited to: a security has been declared in default; trading in a security has been halted during
17
the trading day; there is a foreign market holiday and no trading occurred; or an event occurred between the close of a foreign exchange and the NYSE that may affect the value of a security.
Security Transactions — Security transactions are accounted for as of the trade date. Net realized gains and losses are determined on the identified cost basis, which is also used for federal income tax purposes.
Investment Income — Dividend income less foreign taxes withheld, if any, is recorded as of the ex-dividend date. Distributions received on securities that represent a return of capital or capital gain are recorded as a reduction of cost of invesments and/or as a realized gain. The fund estimates the components of distributions received that may be considered nontaxable distributions or capital gain distributions for income tax purposes. Interest income is recorded on the accrual basis and includes accretion of discounts and amortization of premiums.
Foreign Currency Translations — All assets and liabilities initially expressed in foreign currencies are translated into U.S. dollars at prevailing exchange rates at period end. The fund may enter into spot foreign currency exchange contracts to facilitate transactions denominated in a foreign currency. Purchases and sales of investment securities, dividend and interest income, spot foreign currency exchange contracts, and expenses are translated at the rates of exchange prevailing on the respective dates of such transactions. Net realized and unrealized foreign currency exchange gains or losses related to investment securities are a component of net realized gain (loss) on investment transactions and change in net unrealized appreciation (depreciation) on investments, respectively.
Repurchase Agreements — The fund may enter into repurchase agreements with institutions that American Century Investment Management, Inc. (ACIM) (the investment advisor) has determined are creditworthy pursuant to criteria adopted by the Board of Directors. The fund requires that the collateral, represented by securities, received in a repurchase transaction be transferred to the custodian in a manner sufficient to enable the fund to obtain those securities in the event of a default under the repurchase agreement. ACIM monitors, on a daily basis, the securities transferred to ensure the value, including accrued interest, of the securities under each repurchase agreement is equal to or greater than amounts owed to the fund under each repurchase agreement.
Joint Trading Account — Pursuant to an Exemptive Order issued by the Securities and Exchange Commission, the fund, along with certain other funds in the American Century Investments family of funds, may transfer uninvested cash balances into a joint trading account. These balances are invested in one or more repurchase agreements that are collateralized by U.S. Treasury or Agency obligations.
Income Tax Status — It is the fund’s policy to distribute substantially all net investment income and net realized gains to shareholders and to otherwise qualify as a regulated investment company under provisions of the Internal Revenue Code. The fund is no longer subject to examination by tax authorities for years prior to 2009. At this time, management believes there are no uncertain tax positions which, based on their technical merit, would not be sustained upon examination and for which it is reasonably possible that the total amounts of unrecognized tax benefits will significantly change in the next twelve months. Accordingly, no provision has been made for federal or state income taxes.
Distributions to Shareholders — Distributions from net investment income, if any, are generally declared and paid quarterly. Distributions from net realized gains, if any, are generally declared and paid annually.
Indemnifications — Under the corporation’s organizational documents, its officers and directors are indemnified against certain liabilities arising out of the performance of their duties to the fund. In addition, in the normal course of business, the fund enters into contracts that provide general indemnifications. The maximum exposure under these arrangements is unknown as this would involve future claims that may be made against a fund. The risk of material loss from such claims is considered by management to be remote.
18
3. Fees and Transactions with Related Parties
Management Fees — The corporation has entered into a management agreement with ACIM, under which ACIM provides the fund with investment advisory and management services in exchange for a single, unified management fee (the fee). The agreement provides that all expenses of managing and operating the fund, except distribution and service fees, brokerage expenses, taxes, interest, fees and expenses of the independent directors (including legal counsel fees), and extraordinary expenses, will be paid by ACIM. The fee is computed and accrued daily based on the daily net assets of the fund and paid monthly in arrears. The annual management fee is 0.80%.
Related Parties — Certain officers and directors of the corporation are also officers and/or directors of American Century Companies, Inc. (ACC), the parent of the corporation’s investment advisor, ACIM, the distributor of the corporation, American Century Investment Services, Inc., and the corporation’s transfer agent, American Century Services, LLC. The fund is wholly owned, in aggregate, by various funds in a series issued by American Century Asset Allocation Portfolios, Inc. (ACAAP). ACAAP does not invest in the fund for the purpose of exercising management or control.
The fund was eligible to invest in a money market fund for temporary purposes, which is managed by J.P. Morgan Investment Management, Inc. (JPMIM). The fund had a securities lending agreement with JPMorgan Chase Bank (JPMCB) and a mutual funds services agreement with J.P. Morgan Investor Services Co. (JPMIS). JPMCB was a custodian of the fund. JPMIM, JPMIS and JPMCB are wholly owned subsidiaries of JPMorgan Chase & Co. (JPM). Prior to August 31, 2011, JPM was an equity investor in ACC. The services provided to the fund by JPMIM, JPMIS and JPMCB terminated on July 31, 2011.
4. Investment Transactions
Purchases and sales of investment securities, excluding short-term investments, for the year ended March 31, 2012 were $267,004,808 and $197,986,347, respectively.
5. Fair Value Measurements
The fund’s securities valuation process is based on several considerations and may use multiple inputs to determine the fair value of the positions held by the fund. In conformity with accounting principles generally accepted in the United States of America, the inputs used to determine a valuation are classified into three broad levels as follows:
| • | Level 1 valuation inputs consist of unadjusted quoted prices in an active market for identical securities; |
| • | Level 2 valuation inputs consist of direct or indirect observable market data (including quoted prices for similar securities, evaluations of subsequent market events, interest rates, prepayment speeds, credit risk, etc.); or |
| • | Level 3 valuation inputs consist of unobservable data (including a fund’s own assumptions). |
The level classification is based on the lowest level input that is significant to the fair valuation measurement. The valuation inputs are not necessarily an indication of the risks associated with investing in these securities or other financial instruments.
19
The following is a summary of the level classifications as of period end. The Schedule of Investments provides additional information on the fund’s portfolio holdings.
| Level 1 | Level 2 | Level 3 | |
| Investment Securities | |||
| Domestic Common Stocks | $261,349,735 | — | — |
| Foreign Common Stocks | 9,827,491 | $13,102,344 | — |
| Exchange-Traded Funds | 8,508,181 | — | — |
| Temporary Cash Investments | 1,313,037 | 7,341,044 | — |
| Total Value of Investment Securities | $280,998,444 | $20,443,388 | — |
| Other Financial Instruments | |||
Total Unrealized Gain (Loss) on Forward Foreign Currency Exchange Contracts | — | $(1,421) | — |
6. Derivative Instruments
Foreign Currency Risk — The fund is subject to foreign currency exchange rate risk in the normal course of pursuing its investment objectives. The value of foreign investments held by a fund may be significantly affected by changes in foreign currency exchange rates. The dollar value of a foreign security generally decreases when the value of the dollar rises against the foreign currency in which the security is denominated and tends to increase when the value of the dollar declines against such foreign currency. A fund may enter into forward foreign currency exchange contracts to reduce a fund’s exposure to foreign currency exchange rate fluctuations. The net U.S. dollar value of foreign currency underlying all contractual commitments held by a fund and the resulting unrealized appreciation or depreciation are determined daily. Realized gain or loss is recorded upon the termination of the contract. Net realized and unrealized gains or losses occurring during the holding period of forward foreign currency exchange contracts are a component of net realized gain (loss) on foreign currency transactions and change in net unrealized appreciation (depreciation) on translation of assets and liabilities in foreign currencies, respectively. A fund bears the risk of an unfavorable change in the foreign currency exchange rate underlying the forward contract. Additionally, losses, up to the fair value, may arise if the counterparties do not perform under the contract terms. The foreign currency risk derivative instruments held at period end as disclosed on the Schedule of Investments are indicative of the fund’s typical volume during the period.
The value of foreign currency risk derivative instruments as of March 31, 2012, is disclosed on the Statement of Assets and Liabilities as an asset of $6,537 in unrealized gain on forward foreign currency exchange contracts and as a liability of $7,958 in unrealized loss on forward foreign currency exchange contracts. For the year ended March 31, 2012, the effect of foreign currency risk derivative instruments on the Statement of Operations was $232,376 in net realized gain (loss) on foreign currency transactions and $50,540 in change in net unrealized appreciation (depreciation) on translation of assets and liabilities in foreign currencies.
7. Risk Factors
There are certain risks involved in investing in foreign securities. These risks include those resulting from future adverse political, social and economic developments, fluctuations in currency exchange rates, the possible imposition of exchange controls, and other foreign laws or restrictions.
20
8. Federal Tax Information
The tax character of distributions paid during the years ended March 31, 2012 and March 31, 2011 were as follows:
| 2012 | 2011 | |
| Distributions Paid From | ||
| Ordinary income | $11,958,431 | $8,739,435 |
| Long-term capital gains | $11,426,371 | $3,621,750 |
The book-basis character of distributions made during the year from net investment income or net realized gains may differ from their ultimate characterization for federal income tax purposes. These differences reflect the differing character of certain income items and net realized gains and losses for financial statement and tax purposes, and may result in reclassification among certain capital accounts on the financial statements.
As of March 31, 2012, the federal tax cost of investments and the components of distributable earnings on a tax-basis were as follows:
| Federal tax cost of investments | $280,932,746 |
| Gross tax appreciation of investments | $28,147,438 |
| Gross tax depreciation of investments | (7,638,352) |
| Net tax appreciation (depreciation) of investments | $20,509,086 |
Net tax appreciation (depreciation) on derivatives and translation of assets and liabilities in foreign currencies | $148 |
| Net tax appreciation (depreciation) | $20,509,234 |
| Undistributed ordinary income | $4,555,190 |
| Accumulated long-term gains | $3,550,057 |
The difference between book-basis and tax-basis cost and unrealized appreciation (depreciation) is attributable primarily to the tax deferral of losses on wash sales and the realization for tax purposes of unrealized gains (losses) on certain foreign currency exchange contracts.
21
| For a Share Outstanding Throughout the Years Ended March 31 (except as noted) | |||||||||||||
| Per-Share Data | Ratios and Supplemental Data | ||||||||||||
Net Asset Value, Beginning of Period | Income From Investment Operations: | Distributions From: | Net Asset Value, End of Period | Total Return(2) | Ratio to Average Net Assets of: | Portfolio Turnover Rate | Net Assets, End of Period (in thousands) | ||||||
Net Investment Income (Loss)(1) | Net Realized and Unrealized Gain (Loss) | Total From Investment Operations | Net Investment Income | Net Realized Gains | Total Distributions | Operating Expenses | Net Investment Income (Loss) | ||||||
| Institutional Class | |||||||||||||
| 2012 | $10.70 | 0.20 | 0.22 | 0.42 | (0.14) | (0.82) | (0.96) | $10.16 | 4.93% | 0.81% | 2.01% | 82% | $301,868 |
| 2011 | $9.73 | 0.23 | 1.45 | 1.68 | (0.23) | (0.48) | (0.71) | $10.70 | 17.91% | 0.80% | 2.35% | 102% | $216,381 |
| 2010 | $6.25 | 0.17 | 3.45 | 3.62 | (0.14) | — | (0.14) | $9.73 | 58.29% | 0.80% | 1.98% | 143% | $137,729 |
| 2009 | $9.04 | 0.18 | (2.79) | (2.61) | (0.18) | — | (0.18) | $6.25 | (29.25)% | 0.80% | 2.36% | 181% | $67,933 |
| 2008 | $11.28 | 0.16 | (1.29) | (1.13) | (0.15) | (0.96) | (1.11) | $9.04 | (10.79)% | 0.80% | 1.48% | 208% | $45,832 |
Notes to Financial Highlights
| (1) | Computed using average shares outstanding throughout the period. |
| (2) | Total returns are calculated based on the net asset value of the last business day. Total returns for periods less than one year are not annualized. |
See Notes to Financial Statements.
22
To the Board of Directors and Shareholders of
American Century Capital Portfolios, Inc.:
We have audited the accompanying statement of assets and liabilities, including the schedule of investments, of NT Mid Cap Value Fund, one of the funds constituting American Century Capital Portfolios, Inc. (the “Corporation”) as of March 31, 2012, and the related statement of operations for the year then ended, the statements of changes in net assets for each of the two years in the period then ended, and the financial highlights for each of the five years in the period then ended. These financial statements and financial highlights are the responsibility of the Corporation’s management. Our responsibility is to express an opinion on these financial statements and financial highlights based on our audits.
We conducted our audits in accordance with the standards of the Public Company Accounting Oversight Board (United States). Those standards require that we plan and perform the audit to obtain reasonable assurance about whether the financial statements and financial highlights are free of material misstatement. The Corporation is not required to have, nor were we engaged to perform, an audit of its internal control over financial reporting. Our audits included consideration of internal control over financial reporting as a basis for designing audit procedures that are appropriate in the circumstances, but not for the purpose of expressing an opinion on the effectiveness of the Corporation’s internal control over financial reporting. Accordingly, we express no such opinion. An audit also includes examining, on a test basis, evidence supporting the amounts and disclosures in the financial statements, assessing the accounting principles used and significant estimates made by management, as well as evaluating the overall financial statement presentation. Our procedures included confirmation of securities owned as of March 31, 2012, by correspondence with the custodian and brokers; where replies were not received from brokers, we performed other auditing procedures. We believe that our audits provide a reasonable basis for our opinion.
In our opinion, such financial statements and financial highlights referred to above present fairly, in all material respects, the financial position of NT Mid Cap Value Fund of American Century Capital Portfolios, Inc., as of March 31, 2012, the results of its operations for the year then ended, the changes in its net assets for each of the two years in the period then ended, and the financial highlights for each of the five years in the period then ended, in conformity with accounting principles generally accepted in the United States of America.
Deloitte & Touche LLP
Kansas City, Missouri
May 16, 2012
23
The individuals listed below serve as directors of the funds. Each director will continue to serve in this capacity until death, retirement, resignation or removal from office. The mandatory retirement age for directors who are not “interested persons,” as that term is defined in the Investment Company Act (independent directors), is 72. However, the mandatory retirement age for an individual director may be extended with the approval of the remaining independent directors.
Mr. Thomas is an “interested person” because he currently serves as President and Chief Executive Officer of American Century Companies, Inc. (ACC), the parent company of American Century Investment Management, Inc. (ACIM or the advisor). Mr. Fink is an “interested person” because he currently serves as Executive Vice President and Chief Operating Officer of ACC.
The other directors (more than three-fourths of the total number) are independent; that is, they have never been employees, directors or officers of, and have no financial interest in, ACC or any of its wholly owned, direct or indirect, subsidiaries, including ACIM, American Century Investment Services, Inc. (ACIS) and American Century Services, LLC (ACS). The directors serve in this capacity for seven (in the case of Mr. Thomas, 15) registered investment companies in the American Century Investments family of funds.
The following table presents additional information about the directors. The mailing address for each director is 4500 Main Street, Kansas City, Missouri 64111.
Name (Year of Birth) | Position(s) Held with Funds | Length of Time Served | Principal Occupation(s) During Past 5 Years | Number of American Century Portfolios Overseen by Director | Other Directorships Held During Past 5 Years | |
| Independent Directors | ||||||
Thomas A. Brown (1940) | Director | Since 1980 | Managing Member, Associated Investments, LLC (real estate investment company); Brown Cascade Properties, LLC (real estate investment company) (2001 to 2009) | 66 | None | |
Andrea C. Hall (1945) | Director | Since 1997 | Retired | 66 | None | |
Jan M. Lewis (1957) | Director | Since 2011 | President and Chief Executive Officer, Catholic Charities of Northeast Kansas (human services organization) (2006 to present) | 66 | None | |
James A. Olson (1942) | Director | Since 2007 | Member, Plaza Belmont LLC (private equity fund manager) | 66 | Saia, Inc. (2002 to 2012) and Entertainment Properties Trust | |
Donald H. Pratt (1937) | Director and Chairman of the Board | Since 1995 (Chairman since 2005) | Chairman and Chief Executive Officer, Western Investments, Inc. (real estate company) | 66 | None | |
24
Name (Year of Birth) | Position(s) Held with Funds | Length of Time Served | Principal Occupation(s) During Past 5 Years | Number of American Century Portfolios Overseen by Director | Other Directorships Held During Past 5 Years | |
| Independent Directors | ||||||
M. Jeannine Strandjord (1945) | Director | Since 1994 | Retired | 66 | DST Systems Inc., Euronet Worldwide Inc., and Charming Shoppes, Inc. (2006 to 2010) | |
John R. Whitten (1946) | Director | Since 2008 | Project Consultant, Celanese Corp. (industrial chemical company) | 66 | Rudolph Technologies, Inc. | |
Stephen E. Yates (1948) | Director | Since 2012 | Retired; Executive Vice President, Technology & Operations, KeyCorp. (computer services) (2004 to 2010) | 66 | Applied Industrial Technology (2001 to 2010) | |
| Interested Directors | ||||||
Barry Fink (1955) | Director and Executive Vice President | Since 2012 (Executive Vice President since 2007) | Chief Operating Officer and Executive Vice President, ACC (September 2007 to present); President, ACS (October 2007 to present); Managing Director, Morgan Stanley (2000 to 2007). Also serves as Manager, ACS and Director, ACC and certain ACC subsidiaries | 66 | None | |
Jonathan S. Thomas (1963) | Director and President | Since 2007 | President and Chief Executive Officer, ACC (March 2007 to present); Chief Administrative Officer, ACC (February 2006 to February 2007); Executive Vice President, ACC (November 2005 to February 2007). Also serves as Chief Executive Officer and Manager, ACS; Executive Vice President, ACIM; Director, ACC, ACIM and other ACC subsidiaries | 108 | None | |
25
Officers
The following table presents certain information about the executive officers of the funds. Each officer serves as an officer for each of the 15 investment companies in the American Century family of funds, unless otherwise noted. No officer is compensated for his or her service as an officer of the funds. The listed officers are interested persons of the funds and are appointed or re-appointed on an annual basis. The mailing address for each officer listed below is 4500 Main Street, Kansas City, Missouri 64111.
Name (Year of Birth) | Offices with the Funds | Principal Occupation(s) During the Past Five Years |
Jonathan S. Thomas (1963) | Director and President since 2007 | President and Chief Executive Officer, ACC (March 2007 to present); Chief Administrative Officer, ACC (February 2006 to February 2007); Executive Vice President, ACC (November 2005 to February 2007). Also serves as Chief Executive Officer and Manager, ACS; Executive Vice President, ACIM; Director, ACC, ACIM and other ACC subsidiaries |
Barry Fink (1955) | Director since 2012 and Executive Vice President since 2007 | Chief Operating Officer and Executive Vice President, ACC (September 2007 to present); President, ACS (October 2007 to present); Managing Director, Morgan Stanley (2000 to 2007). Also serves as Manager, ACS and Director, ACC and certain ACC subsidiaries |
Maryanne L. Roepke (1956) | Chief Compliance Officer since 2006 and Senior Vice President since 2000 | Chief Compliance Officer, American Century funds, ACIM and ACS (August 2006 to present). Also serves as Senior Vice President, ACS |
Charles A. Etherington (1957) | General Counsel since 2007 and Senior Vice President since 2006 | Attorney, ACC (February 1994 to present); Vice President, ACC (November 2005 to present), General Counsel, ACC (March 2007 to present); Also serves as General Counsel, ACIM, ACS, ACIS and other ACC subsidiaries; and Senior Vice President, ACIM and ACS |
C. Jean Wade (1964) | Vice President, Treasurer and Chief Financial Officer since 2012 | Vice President, ACS (February 2000 to present) |
Robert J. Leach (1966) | Vice President since 2006 and Assistant Treasurer since 2012 | Vice President, ACS (February 2000 to present) |
David H. Reinmiller (1963) | Vice President since 2000 | Attorney, ACC (January 1994 to present); Associate General Counsel, ACC (January 2001 to present). Also serves as Vice President, ACIM and ACS |
Ward D. Stauffer (1960) | Secretary since 2005 | Attorney, ACC (June 2003 to present) |
The Statement of Additional Information has additional information about the fund’s directors and is available without charge, upon request, by calling 1-800-345-2021.
26
Retirement Account Information
As required by law, distributions you receive from certain IRAs, or 403(b), 457 and qualified plans are subject to federal income tax withholding, unless you elect not to have withholding apply. Tax will be withheld on the total amount withdrawn even though you may be receiving amounts that are not subject to withholding, such as nondeductible contributions. In such case, excess amounts of withholding could occur. You may adjust your withholding election so that a greater or lesser amount will be withheld.
If you don’t want us to withhold on this amount, you must notify us to not withhold the federal income tax. You may notify us in writing or in certain situations by telephone or through other electronic means. You have the right to revoke your withholding election at any time and any election you make may remain in effect until revoked by filing a new election.
Remember, even if you elect not to have income tax withheld, you are liable for paying income tax on the taxable portion of your withdrawal. If you elect not to have income tax withheld or you don’t have enough income tax withheld, you may be responsible for payment of estimated tax. You may incur penalties under the estimated tax rules if your withholding and estimated tax payments are not sufficient. You can reduce or defer the income tax on a distribution by directly or indirectly rolling such distribution over to another IRA or eligible plan. You should consult your tax advisor for additional information.
State tax will be withheld if, at the time of your distribution, your address is within one of the mandatory withholding states and you have federal income tax withheld. State taxes will be withheld from your distribution in accordance with the respective state rules.
Proxy Voting Guidelines
American Century Investment Management, Inc., the fund’s investment advisor, is responsible for exercising the voting rights associated with the securities purchased and/or held by the fund. A description of the policies and procedures the advisor uses in fulfilling this responsibility is available without charge, upon request, by calling 1-800-345-2021. It is also available on American Century Investments’ website at americancentury.com and on the Securities and Exchange Commission’s website at sec.gov. Information regarding how the investment advisor voted proxies relating to portfolio securities during the most recent 12-month period ended June 30 is available on the “About Us” page at americancentury.com. It is also available at sec.gov.
Quarterly Portfolio Disclosure
The fund files its complete schedule of portfolio holdings with the Securities and Exchange Commission (SEC) for the first and third quarters of each fiscal year on Form N-Q. The fund’s Forms N-Q are available on the SEC’s website at sec.gov, and may be reviewed and copied at the SEC’s Public Reference Room in Washington, DC. Information on the operation of the Public Reference Room may be obtained by calling 1-800-SEC-0330. The fund also makes its complete schedule of portfolio holdings for the most recent quarter of its fiscal year available on its website at americancentury.com and, upon request, by calling 1-800-345-2021.
27
Other Tax Information
The following information is provided pursuant to provisions of the Internal Revenue Code.
The fund hereby designates up to the maximum amount allowable as qualified dividend income for the fiscal year ended March 31, 2012.
For corporate taxpayers, the fund hereby designates $6,408,520, or up to the maximum amount allowable, of ordinary income distributions paid during the fiscal year ended March 31, 2012 as qualified for the corporate dividends received deduction.
The fund hereby designates $11,426,371, or up to the maximum amount allowable, as long-term capital gain distributions for the fiscal year ended March 31, 2012.
28
| Contact Us | americancentury.com |
| Automated Information Line | 1-800-345-8765 |
| Investor Services Representative | 1-800-345-2021 or 816-531-5575 |
| Investors Using Advisors | 1-800-378-9878 |
Business, Not-For-Profit, Employer-Sponsored Retirement Plans | 1-800-345-3533 |
Banks and Trust Companies, Broker-Dealers, Financial Professionals, Insurance Companies | 1-800-345-6488 |
| Telecommunications Device for the Deaf | 1-800-634-4113 |
American Century Capital Portfolios, Inc.
Investment Advisor:
American Century Investment Management, Inc.
Kansas City, Missouri
This report and the statements it contains are submitted for the general information of our shareholders. The report is not authorized for distribution to prospective investors unless preceded or accompanied by an effective prospectus.
©2012 American Century Proprietary Holdings, Inc. All rights reserved.
CL-ANN-75052 1205
ANNUAL REPORT MARCH 31, 2012
| Small Cap Value Fund |
| President’s Letter | 2 |
| Independent Chairman’s Letter | 3 |
| Market Perspective | 4 |
| Performance | 5 |
| Portfolio Commentary | 7 |
| Fund Characteristics | 9 |
| Shareholder Fee Example | 10 |
| Schedule of Investments | 12 |
| Statement of Assets and Liabilities | 19 |
| Statement of Operations | 20 |
| Statement of Changes in Net Assets | 21 |
| Notes to Financial Statements | 22 |
| Financial Highlights | 28 |
| Report of Independent Registered Public Accounting Firm | 30 |
| Management | 31 |
| Additional Information | 34 |
Any opinions expressed in this report reflect those of the author as of the date of the report, and do not necessarily represent the opinions of American Century Investments® or any other person in the American Century Investments organization. Any such opinions are subject to change at any time based upon market or other conditions and American Century Investments disclaims any responsibility to update such opinions. These opinions may not be relied upon as investment advice and, because investment decisions made by American Century Investments funds are based on numerous factors, may not be relied upon as an indication of trading intent on behalf of any American Century Investments fund. Security examples are used for representational purposes only and are not intended as recommendations to purchase or sell securities. Performance information for comparative indices and securities is provided to American Century Investments by third party vendors. To the best of American Century Investments’ knowledge, such information is accurate at the time of printing.
Jonathan Thomas
Dear Investor:
Thank you for reviewing this annual report for the period ended March 31, 2012. Our report offers investment performance and portfolio information, presented with the expert perspective of our portfolio management team.
This report remains one of our most important vehicles for conveying information about fund returns, as well as market factors and strategies that affected fund performance. For additional, updated information, we encourage you to visit our website, americancentury.com. Click on the “Fund Performance” and “Insights & News” headings at the top of our Individual Investors site.
Mostly Positive U.S. Returns Belie the Period’s Volatility
U.S. market performance for the 12 months ended March 31, 2012 appeared more benign than it really was. Broadly speaking, U.S. stocks and bonds returned roughly 7-9% for the period, as indicated by the S&P 500 Index and the Barclays U.S. Aggregate Bond Index. But those solid returns masked the roller-coaster ride required to achieve them.
The reporting period began, in April 2011, with stock indices and U.S. Treasury yields at some of their highest levels since 2008, prior to the Financial Crisis plunge. These elevated levels reflected increased risk-taking as the markets priced in improving global economic growth, strong corporate earnings, and higher inflation.
This “risk-on” investing attitude switched to “risk-off” during the summer of 2011, transformed by high fuel prices, federal budget management concerns in the U.S., and the worsening sovereign debt crisis in Europe. Recessionary expectations pulled Treasury yields to record lows by September, and stock indices suffered double-digit declines from their peaks.
Sentiment switched again in the fourth quarter of 2011, as concerns about the European sovereign debt crisis and the U.S. economy eased. Renewed “risk-on” investing carried into the first quarter of 2012, boosting growth stocks and high-yield bonds in particular. But the financial markets remain subject to potentially high volatility as they continue to wrestle with uncertainties regarding Europe, the Middle East, economic strength, government budget deficits, and the U.S. presidential election. We believe strongly in adhering to a disciplined, diversified, long-term investment approach during volatile periods, and we appreciate your continued trust in us during these unsettled times.
Sincerely,
Jonathan Thomas
President and Chief Executive Officer
American Century Investments
2
Don Pratt
Dear Fellow Shareholders,
The assets under management in American Century Investments’ funds grow through investors placing new assets in the funds and through market appreciation. Asset growth has been at near record levels over the past two calendar years as market movements were upward, the funds’ relative returns were generally favorable, and the distribution strategies implemented by fund management have been successful.
The board reviews fund performance and distribution strategies on a regular basis. Several years ago, the fund’s management team discussed with the board its plans to grow fund assets in the intermediary, institutional and international distribution channels. These distribution strategies have produced strong positive growth. The growth in the intermediary channel recognizes the funds’ strong relative investment performance and the desire of many shareholders to seek financial guidance. Investors in both the institutional and international channels appear to find the funds’ risk-based investment strategies attractive. The board continues to support fund management’s strategies to increase fund assets and will continue to work to provide the benefits of these gains to fund shareholders.
We continue to receive a steady flow of very thoughtful questions from shareholders. If there are issues that you would like the board to address please email me at dhpratt@fundboardchair.com. Thank you for your continued investment in American Century Investments funds.
Best regards,
Don Pratt
3
By Phil Davidson,
Chief Investment Officer,
U.S. Value Equity
U.S. Stocks Advanced
Despite some meaningful market volatility, U.S. stocks generated positive performance for the one-year period ended March 31, 2012. The overall advance was driven by a robust equity market rally over the last six months of the period as economic conditions improved.
After rallying throughout much of April 2011, the stock market declined sharply from May through September amid weaker economic conditions in the U.S. and an increasingly challenging sovereign debt crisis in Europe. Public debt issues in the U.S. also weighed on the market as the government wrestled with the federal debt ceiling and a major credit rating agency downgraded the credit rating of U.S. debt from AAA to AA+ in August—the first such downgrade in the country’s history.
Market sentiment shifted markedly over the last six months of the period as evidence of improving economic growth helped ease concerns about a possible recession. Most notably, employment growth showed signs of life, helping push the unemployment rate down to a three-year low. Consumer spending and manufacturing activity also picked up, and mild winter weather provided a lift to the construction industry. The situation in Europe also improved as liquidity injections from the European Central Bank and a debt restructuring agreement in Greece helped provide some stability to the Continent’s debt markets and banking sector. The end result was a steady and substantial market rally over the last six months.
Value Stocks Lagged
As the table below illustrates, large-cap stocks and growth issues led the market’s overall advance. Growth stocks benefited the most from the improving economic environment over the last half of the period, along with investors’ greater appetite for risk. Sector performance also favored growth shares over value during the period. The top-performing sectors in the S&P 500 Index included information technology and consumer discretionary, two growth-oriented sectors of the market. In contrast, the financials sector, which is the largest sector weighting in most value indices, declined for the reporting period.
| U.S. Stock Index Returns | ||||
| For the 12 months ended March 31, 2012 | ||||
| Russell 1000 Index (Large-Cap) | 7.86% | Russell 2000 Index (Small-Cap) | -0.18% | |
| Russell 1000 Growth Index | 11.02% | Russell 2000 Growth Index | 0.68% | |
| Russell 1000 Value Index | 4.79% | Russell 2000 Value Index | -1.07% | |
| Russell Midcap Index | 3.31% | |||
| Russell Midcap Growth Index | 4.43% | |||
| Russell Midcap Value Index | 2.28% | |||
4
| Total Returns as of March 31, 2012 | ||||||
| Average Annual Returns | ||||||
Ticker Symbol | 1 year | 5 years | 10 years | Since Inception | Inception Date | |
| Investor Class | ASVIX | -1.39% | 4.13% | 7.97% | 11.28% | 7/31/98 |
| Russell 2000 Value Index | — | -1.07% | 0.01% | 6.59% | 7.78% | — |
| Institutional Class | ACVIX | -1.20% | 4.34% | 8.18% | 12.00% | 10/26/98 |
A Class(1) No sales charge* With sales charge* | ACSCX | -1.56% -7.26% | 3.86% 2.64% | 7.71% 7.07% | 12.18% 11.64% | 12/31/99 |
| C Class | ASVNX | -2.30% | — | — | 9.73% | 3/1/10 |
| R Class | ASVRX | -1.80% | — | — | 10.29% | 3/1/10 |
* | Sales charges include initial sales charges and contingent deferred sales charges (CDSCs), as applicable. A Class shares have a 5.75% maximum initial sales charge and may be subject to a maximum CDSC of 1.00%. C Class shares redeemed within 12 months of purchase are subject to a maximum CDSC of 1.00%. The SEC requires that mutual funds provide performance information net of maximum sales charges in all cases where charges could be applied. |
| (1) | Prior to March 1, 2010, the A Class was referred to as the Advisor Class and did not have a front-end sales charge. Performance prior to that date has been adjusted to reflect this charge. |
Data presented reflect past performance. Past performance is no guarantee of future results. Current performance may be higher or lower than the performance shown. Investment return and principal value will fluctuate, and redemption value may be more or less than original cost. To obtain performance data current to the most recent month end, please call 1-800-345-2021 or visit americancentury.com. Historically, small company stocks have been more volatile than the stocks of larger, more established companies. The fund’s investment process may result in high portfolio turnover, which could mean high transaction costs, affecting both performance and capital gains tax liabilities to investors.
Unless otherwise indicated, performance reflects Investor Class shares; performance for other share classes will vary due to differences in fee structure. For information about other share classes available, please consult the prospectus. Data assumes reinvestment of dividends and capital gains, and none of the charts reflect the deduction of taxes that a shareholder would pay on fund distributions or the redemption of fund shares. Returns for the index are provided for comparison. The fund’s total returns include operating expenses (such as transaction costs and management fees) that reduce returns, while the total returns of the index do not.
5
| Growth of $10,000 Over 10 Years |
| $10,000 investment made March 31, 2002 |
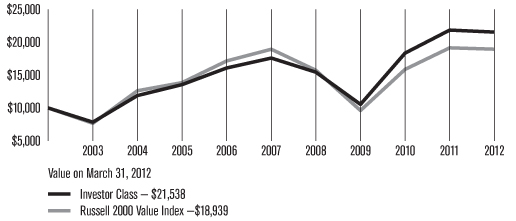
| Total Annual Fund Operating Expenses | ||||
| Investor Class | Institutional Class | A Class | C Class | R Class |
| 1.41% | 1.21% | 1.66% | 2.41% | 1.91% |
The total annual fund operating expenses shown is as stated in the fund’s prospectus current as of the date of this report. The prospectus may vary from the expense ratio shown elsewhere in this report because it is based on a different time period, includes acquired fund fees and expenses, and, if applicable, does not include fee waivers or expense reimbursements.
Data presented reflect past performance. Past performance is no guarantee of future results. Current performance may be higher or lower than the performance shown. Investment return and principal value will fluctuate, and redemption value may be more or less than original cost. To obtain performance data current to the most recent month end, please call 1-800-345-2021 or visit americancentury.com. Historically, small company stocks have been more volatile than the stocks of larger, more established companies. The fund’s investment process may result in high portfolio turnover, which could mean high transaction costs, affecting both performance and capital gains tax liabilities to investors.
Unless otherwise indicated, performance reflects Investor Class shares; performance for other share classes will vary due to differences in fee structure. For information about other share classes available, please consult the prospectus. Data assumes reinvestment of dividends and capital gains, and none of the charts reflect the deduction of taxes that a shareholder would pay on fund distributions or the redemption of fund shares. Returns for the index are provided for comparison. The fund’s total returns include operating expenses (such as transaction costs and management fees) that reduce returns, while the total returns of the index do not.
6
Portfolio Managers: Ben Giele and James Pitman
Performance Summary
Small Cap Value declined 1.39%* for the 12 months ended March 31, 2012. By comparison, its benchmark, the Russell 2000 Value Index, fell 1.07%. The portfolio’s returns reflect operating expenses while the index’s returns do not.
The U.S. stock market posted a gain during the one-year reporting period, largely as a result of its strong performance during the first quarter of 2012. For most of the 12-month period, investors were preoccupied with Europe’s financial woes, which threatened to spread from Greece to other nations and seemed likely to cause problems for European banks. Lackluster U.S. economic growth and the downgrade of U.S. debt by Standard & Poor’s Ratings also dampened market sentiment. Investor risk appetite improved near the end of 2011 when the U.S. economy, proving surprisingly resilient, returned to its slow-growth path. Employers added new jobs, and corporate earnings remained solid. Investors also grew more optimistic as the European Central Bank provided inexpensive loans to European banks and the financial crisis eased. In this environment, growth stocks outperformed value stocks across the capitalization spectrum. Small cap stocks generally underperformed their mid cap and large cap counterparts. For the reporting period, Small Cap Value provided positive absolute results in seven of the 10 sectors in which it was invested. It underperformed on a relative basis. The portfolio was hindered by positions in the financials and energy sectors, while investments in the information technology and industrials sectors contributed. Foreign holdings also accounted for a portion of the portfolio’s underperformance during the reporting period.
We carefully manage this portfolio for long-term results. Since Small Cap Value’s inception on July 31, 1998, the portfolio has produced an average annual return of 11.28%, outpacing the return of the Russell 2000 Value Index for the same period (see performance information on pages 5-6).
Financials Detracted
Small Cap Value was hampered by an underweight position in the financials sector, which recorded positive results for the benchmark, the Russell 2000 Value Index. More specifically, an underweight in the commercial banking industry detracted. Security selection also dampened relative performance. Within the capital markets segment, a key detractor was Artio Global Investors. The investment manager was hurt by the poor performance of its developed markets portfolios and has experienced investment outflows as a result.
Energy Hampered Results
Stock selection in the energy sector, which was down 23% in the benchmark, was a drag on results. Small Cap Value was overweight Penn Virginia Corp., Overseas Shipholding Group, and Patriot Coal Corp. Penn Virginia, an independent oil and gas exploration company, declined on a drop in production. Oil tanker company Overseas Shipholding Group was hurt by a slump in demand. Patriot Coal Corp. reduced earnings guidance on weakness in coal prices.
| * | All fund returns referenced in this commentary are for Investor Class shares. |
7
Information Technology Contributed
Strong stock selection across the information technology sector, the second-weakest performer in the benchmark, boosted relative performance. Small Cap Value benefited from investments in semiconductor maker National Semiconductor, communications clearinghouse NeuStar, and Total Systems Services, an electronic payment processor. Shares of National Semiconductor rose on news of its takeover by Texas Instruments. NeuStar reported solid revenue growth, while Total Systems Services has been steadily winning new contracts.
Industrials Added Value
In the poorly performing industrials sector, effective stock picking contributed to relative results. A notable contributor was On Assignment, a professional staffing company providing temporary scientific professionals. The company reported better-than-expected earnings and raised guidance for 2012 as the U.S. job market improved. Its shares also rose on news it would acquire rival Apex Systems in a deal that could boost 2012 earnings.
Outlook
We continue to be bottom-up investment managers, building the portfolio one stock at a time, a process that results in exposure to market segments based on the attractiveness of individual companies in terms of their valuation and fundamentals. As of March 31, 2012, the portfolio is broadly diversified, with larger positions than the benchmark in the information technology, health care, and industrials sectors. Our fundamental analysis and valuation work is also directing us toward a smaller relative weighting in financials and utilities stocks.
8
| MARCH 31, 2012 | |
| Top Ten Holdings | % of net assets |
| Quest Software, Inc. | 2.1% |
| iShares Russell 2000 Index Fund | 1.7% |
| iShares S&P SmallCap 600 Index Fund | 1.5% |
| Aspen Insurance Holdings Ltd., Series AHL, 5.625% (Convertible) | 1.2% |
| First Horizon National Corp. | 1.2% |
| HCC Insurance Holdings, Inc. | 1.2% |
| Granite Construction, Inc. | 1.0% |
| Young Innovations, Inc. | 1.0% |
| DST Systems, Inc. | 0.9% |
| American Science & Engineering, Inc. | 0.9% |
| Top Five Industries | % of net assets |
| Commercial Banks | 9.9% |
| Real Estate Investment Trusts (REITs) | 8.2% |
| Insurance | 6.3% |
| Machinery | 4.1% |
| Health Care Providers and Services | 3.5% |
| Types of Investments in Portfolio | % of net assets |
| Common Stocks | 91.9% |
| Exchange-Traded Funds | 3.2% |
| Convertible Preferred Stocks | 2.0% |
| Preferred Stocks | 0.3% |
| Total Equity Exposure | 97.4% |
| Temporary Cash Investments | 1.7% |
| Other Assets and Liabilities | 0.9% |
9
Fund shareholders may incur two types of costs: (1) transaction costs, including sales charges (loads) on purchase payments and redemption/exchange fees; and (2) ongoing costs, including management fees; distribution and service (12b-1) fees; and other fund expenses. This example is intended to help you understand your ongoing costs (in dollars) of investing in your fund and to compare these costs with the ongoing cost of investing in other mutual funds.
The example is based on an investment of $1,000 made at the beginning of the period and held for the entire period from October 1, 2011 to March 31, 2012.
Actual Expenses
The table provides information about actual account values and actual expenses for each class. You may use the information, together with the amount you invested, to estimate the expenses that you paid over the period. First, identify the share class you own. Then simply divide your account value by $1,000 (for example, an $8,600 account value divided by $1,000 = 8.6), then multiply the result by the number under the heading “Expenses Paid During Period” to estimate the expenses you paid on your account during this period.
If you hold Investor Class shares of any American Century Investments fund, or Institutional Class shares of the American Century Diversified Bond Fund, in an American Century Investments account (i.e., not a financial intermediary or retirement plan account), American Century Investments may charge you a $12.50 semiannual account maintenance fee if the value of those shares is less than $10,000. We will redeem shares automatically in one of your accounts to pay the $12.50 fee. In determining your total eligible investment amount, we will include your investments in all personal accounts (including American Century Investments Brokerage accounts) registered under your Social Security number. Personal accounts include individual accounts, joint accounts, UGMA/UTMA accounts, personal trusts, Coverdell Education Savings Accounts and IRAs (including traditional, Roth, Rollover, SEP-, SARSEP- and SIMPLE-IRAs), and certain other retirement accounts. If you have only business, business retirement, employer-sponsored or American Century Investments Brokerage accounts, you are currently not subject to this fee. If you are subject to the Account Maintenance Fee, your account value could be reduced by the fee amount.
Hypothetical Example for Comparison Purposes
The table also provides information about hypothetical account values and hypothetical expenses based on the actual expense ratio of each class of your fund and an assumed rate of return of 5% per year before expenses, which is not the actual return of a fund’s share class. The hypothetical account values and expenses may not be used to estimate the actual ending account balance or expenses you paid for the period. You may use this information to compare the ongoing costs of investing in your fund and other funds. To do so, compare this 5% hypothetical example with the 5% hypothetical examples that appear in the shareholder reports of the other funds.
10
Please note that the expenses shown in the table are meant to highlight your ongoing costs only and do not reflect any transactional costs, such as sales charges (loads) or redemption/exchange fees. Therefore, the table is useful in comparing ongoing costs only, and will not help you determine the relative total costs of owning different funds. In addition, if these transactional costs were included, your costs would have been higher.
Beginning Account Value 10/1/11 | Ending Account Value 3/31/12 | Expenses Paid During Period(1) 10/1/11 - 3/31/12 | Annualized Expense Ratio(1) | |
| Actual | ||||
| Investor Class | $1,000 | $1,273.80 | $7.11 | 1.25% |
| Institutional Class | $1,000 | $1,274.70 | $5.97 | 1.05% |
| A Class | $1,000 | $1,272.70 | $8.52 | 1.50% |
| C Class | $1,000 | $1,267.90 | $12.76 | 2.25% |
| R Class | $1,000 | $1,271.40 | $9.94 | 1.75% |
| Hypothetical | ||||
| Investor Class | $1,000 | $1,018.75 | $6.31 | 1.25% |
| Institutional Class | $1,000 | $1,019.75 | $5.30 | 1.05% |
| A Class | $1,000 | $1,017.50 | $7.57 | 1.50% |
| C Class | $1,000 | $1,013.75 | $11.33 | 2.25% |
| R Class | $1,000 | $1,016.25 | $8.82 | 1.75% |
| (1) | Expenses are equal to the class’s annualized expense ratio listed in the table above, multiplied by the average account value over the period, multiplied by 183, the number of days in the most recent fiscal half-year, divided by 366, to reflect the one-half year period. |
11
MARCH 31, 2012
| Shares | Value | |||||||
| Common Stocks — 91.9% | ||||||||
| AEROSPACE AND DEFENSE — 2.9% | ||||||||
| AAR Corp. | 195,440 | $3,566,780 | ||||||
| Alliant Techsystems, Inc. | 165,000 | 8,269,800 | ||||||
| American Science & Engineering, Inc. | 265,000 | 17,768,250 | ||||||
| Ceradyne, Inc. | 70,000 | 2,279,200 | ||||||
| Curtiss-Wright Corp. | 275,000 | 10,177,750 | ||||||
Moog, Inc., Class A(1) | 105,000 | 4,503,450 | ||||||
| National Presto Industries, Inc. | 45,000 | 3,413,700 | ||||||
Orbital Sciences Corp.(1) | 195,000 | 2,564,250 | ||||||
Teledyne Technologies, Inc.(1) | 65,000 | 4,098,250 | ||||||
| Triumph Group, Inc. | 40,000 | 2,506,400 | ||||||
| 59,147,830 | ||||||||
| AIR FREIGHT AND LOGISTICS — 0.2% | ||||||||
| UTi Worldwide, Inc. | 245,000 | 4,221,350 | ||||||
| AIRLINES — 0.6% | ||||||||
Alaska Air Group, Inc.(1) | 200,000 | 7,164,000 | ||||||
Allegiant Travel Co.(1) | 45,000 | 2,452,500 | ||||||
JetBlue Airways Corp.(1) | 575,000 | 2,811,750 | ||||||
| 12,428,250 | ||||||||
| AUTO COMPONENTS — 1.2% | ||||||||
American Axle & Manufacturing Holdings, Inc.(1) | 650,000 | 7,611,500 | ||||||
| Cooper Tire & Rubber Co. | 260,000 | 3,957,200 | ||||||
| Dana Holding Corp. | 600,000 | 9,300,000 | ||||||
| Lear Corp. | 85,000 | 3,951,650 | ||||||
| 24,820,350 | ||||||||
| BEVERAGES — 0.1% | ||||||||
Primo Water Corp.(1)(2) | 1,200,000 | 2,340,000 | ||||||
| BUILDING PRODUCTS — 0.2% | ||||||||
| Apogee Enterprises, Inc. | 165,000 | 2,136,750 | ||||||
| Simpson Manufacturing Co., Inc. | 70,000 | 2,257,500 | ||||||
| 4,394,250 | ||||||||
| CAPITAL MARKETS — 2.6% | ||||||||
| Apollo Investment Corp. | 900,000 | 6,453,000 | ||||||
| Ares Capital Corp. | 230,000 | 3,760,500 | ||||||
| Artio Global Investors, Inc. | 345,000 | 1,645,650 | ||||||
| BlackRock Kelso Capital Corp. | 240,000 | 2,356,800 | ||||||
| Fifth Street Finance Corp. | 300,000 | 2,928,000 | ||||||
| Hercules Technology Growth Capital, Inc. | 550,000 | 6,094,000 | ||||||
| Janus Capital Group, Inc. | 945,000 | 8,419,950 | ||||||
Knight Capital Group, Inc., Class A(1) | 225,000 | $2,895,750 | ||||||
| MCG Capital Corp. | 300,000 | 1,275,000 | ||||||
| PennantPark Investment Corp. | 750,000 | 7,800,000 | ||||||
| Prospect Capital Corp. | 265,000 | 2,909,700 | ||||||
| Waddell & Reed Financial, Inc. | 245,000 | 7,940,450 | ||||||
| 54,478,800 | ||||||||
| CHEMICALS — 2.6% | ||||||||
Ferro Corp.(1) | 425,000 | 2,524,500 | ||||||
Georgia Gulf Corp.(1) | 115,000 | 4,011,200 | ||||||
| H.B. Fuller Co. | 150,000 | 4,924,500 | ||||||
| Hawkins, Inc. | 115,000 | 4,278,000 | ||||||
| Innophos Holdings, Inc. | 130,000 | 6,515,600 | ||||||
Intrepid Potash, Inc.(1) | 255,000 | 6,204,150 | ||||||
Kraton Performance Polymers, Inc.(1) | 55,000 | 1,461,350 | ||||||
| Minerals Technologies, Inc. | 125,000 | 8,176,250 | ||||||
| Olin Corp. | 115,000 | 2,501,250 | ||||||
OM Group, Inc.(1) | 150,000 | 4,126,500 | ||||||
| Sensient Technologies Corp. | 45,000 | 1,710,000 | ||||||
| Tredegar Corp. | 240,000 | 4,701,600 | ||||||
W.R. Grace & Co.(1) | 45,000 | 2,601,000 | ||||||
| 53,735,900 | ||||||||
| COMMERCIAL BANKS — 9.9% | ||||||||
| American National Bankshares, Inc. | 261,193 | 5,563,411 | ||||||
| BancorpSouth, Inc. | 400,000 | 5,388,000 | ||||||
| BOK Financial Corp. | 95,000 | 5,346,600 | ||||||
| Boston Private Financial Holdings, Inc. | 760,000 | 7,531,600 | ||||||
| City National Corp. | 60,000 | 3,148,200 | ||||||
| Community Bank System, Inc. | 240,000 | 6,907,200 | ||||||
| Cullen/Frost Bankers, Inc. | 150,000 | 8,728,500 | ||||||
| CVB Financial Corp. | 285,000 | 3,345,900 | ||||||
| F.N.B. Corp. | 500,000 | 6,040,000 | ||||||
| First Financial Bancorp. | 240,000 | 4,152,000 | ||||||
| First Horizon National Corp. | 2,400,000 | 24,912,000 | ||||||
| First Interstate Bancsystem, Inc. | 260,000 | 3,801,200 | ||||||
| First Midwest Bancorp., Inc. | 250,000 | 2,995,000 | ||||||
First Republic Bank(1) | 125,000 | 4,117,500 | ||||||
| FirstMerit Corp. | 385,000 | 6,491,100 | ||||||
| Fulton Financial Corp. | 1,365,000 | 14,332,500 | ||||||
| Heritage Financial Corp. | 480,000 | 6,528,000 | ||||||
| Lakeland Financial Corp. | 240,000 | 6,247,200 | ||||||
| MB Financial, Inc. | 145,000 | 3,043,550 | ||||||
12
| Shares | Value | |||||||
| National Bankshares, Inc. | 170,000 | $5,117,000 | ||||||
| Old National Bancorp. | 305,000 | 4,007,700 | ||||||
| Pacific Continental Corp. | 410,000 | 3,862,200 | ||||||
Park Sterling Corp.(1) | 1,025,000 | 4,920,000 | ||||||
| Susquehanna Bancshares, Inc. | 565,000 | 5,582,200 | ||||||
| TCF Financial Corp. | 1,225,000 | 14,565,250 | ||||||
| Trico Bancshares | 330,000 | 5,748,600 | ||||||
| Trustmark Corp. | 300,000 | 7,494,000 | ||||||
| Umpqua Holdings Corp. | 325,000 | 4,407,000 | ||||||
| United Bankshares, Inc. | 100,000 | 2,886,000 | ||||||
| Washington Banking Co. | 240,000 | 3,314,400 | ||||||
| Webster Financial Corp. | 90,000 | 2,040,300 | ||||||
| Wintrust Financial Corp. | 105,000 | 3,757,950 | ||||||
| Zions BanCorp. | 370,000 | 7,940,200 | ||||||
| 204,262,261 | ||||||||
| COMMERCIAL SERVICES AND SUPPLIES — 1.3% | ||||||||
| ABM Industries, Inc. | 135,000 | 3,280,500 | ||||||
| Brink’s Co. (The) | 165,000 | 3,938,550 | ||||||
Metalico, Inc.(1) | 1,155,000 | 4,931,850 | ||||||
SYKES Enterprises, Inc.(1) | 490,000 | 7,742,000 | ||||||
| US Ecology, Inc. | 340,000 | 7,391,600 | ||||||
| 27,284,500 | ||||||||
| COMMUNICATIONS EQUIPMENT — 1.2% | ||||||||
| Bel Fuse, Inc., Class B | 350,000 | 6,184,500 | ||||||
Emulex Corp.(1) | 275,000 | 2,854,500 | ||||||
Oplink Communications, Inc.(1) | 245,000 | 4,189,500 | ||||||
| Plantronics, Inc. | 95,000 | 3,824,700 | ||||||
Polycom, Inc.(1) | 195,000 | 3,718,650 | ||||||
| Tellabs, Inc. | 875,000 | 3,543,750 | ||||||
| 24,315,600 | ||||||||
| COMPUTERS AND PERIPHERALS — 0.6% | ||||||||
| Lexmark International, Inc., Class A | 80,000 | 2,659,200 | ||||||
QLogic Corp.(1) | 525,000 | 9,324,000 | ||||||
| 11,983,200 | ||||||||
| CONSTRUCTION AND ENGINEERING — 1.6% | ||||||||
| Comfort Systems USA, Inc. | 150,000 | 1,636,500 | ||||||
| EMCOR Group, Inc. | 210,000 | 5,821,200 | ||||||
| Granite Construction, Inc. | 705,000 | 20,261,700 | ||||||
Pike Electric Corp.(1) | 685,000 | 5,637,550 | ||||||
| 33,356,950 | ||||||||
| CONTAINERS AND PACKAGING — 0.6% | ||||||||
| Bemis Co., Inc. | 290,000 | 9,364,100 | ||||||
| Sonoco Products Co. | 70,000 | 2,324,000 | ||||||
| 11,688,100 | ||||||||
| DISTRIBUTORS — 0.2% | ||||||||
| Core-Mark Holding Co., Inc. | 79,390 | 3,250,227 | ||||||
| DIVERSIFIED FINANCIAL SERVICES — 0.5% | ||||||||
| CBOE Holdings, Inc. | 180,000 | 5,115,600 | ||||||
| Compass Diversified Holdings | 340,000 | 5,028,600 | ||||||
| 10,144,200 | ||||||||
| DIVERSIFIED TELECOMMUNICATION SERVICES — 0.1% | ||||||||
| Atlantic Tele-Network, Inc. | 55,000 | 1,999,800 | ||||||
| ELECTRIC UTILITIES — 2.6% | ||||||||
| Cleco Corp. | 80,000 | 3,172,000 | ||||||
| El Paso Electric Co. | 155,000 | 5,035,950 | ||||||
| Great Plains Energy, Inc. | 775,000 | 15,709,250 | ||||||
| IDACORP, Inc. | 70,000 | 2,878,400 | ||||||
| NV Energy, Inc. | 445,000 | 7,173,400 | ||||||
| PNM Resources, Inc. | 225,000 | 4,117,500 | ||||||
| Portland General Electric Co. | 220,000 | 5,495,600 | ||||||
| Unitil Corp. | 140,000 | 3,756,200 | ||||||
| Westar Energy, Inc. | 190,000 | 5,306,700 | ||||||
| 52,645,000 | ||||||||
| ELECTRICAL EQUIPMENT — 1.7% | ||||||||
| Brady Corp., Class A | 300,000 | 9,705,000 | ||||||
| Encore Wire Corp. | 480,000 | 14,270,400 | ||||||
| Hubbell, Inc., Class B | 40,000 | 3,143,200 | ||||||
II-VI, Inc.(1) | 170,000 | 4,020,500 | ||||||
| LSI Industries, Inc. | 375,000 | 2,748,750 | ||||||
Thomas & Betts Corp.(1) | 25,000 | 1,797,750 | ||||||
| 35,685,600 | ||||||||
| ELECTRONIC EQUIPMENT, INSTRUMENTS AND COMPONENTS — 2.4% | ||||||||
Benchmark Electronics, Inc.(1) | 335,000 | 5,524,150 | ||||||
Coherent, Inc.(1) | 50,000 | 2,916,500 | ||||||
| Electro Scientific Industries, Inc. | 215,000 | 3,227,150 | ||||||
IPG Photonics Corp.(1) | 30,000 | 1,561,500 | ||||||
| Littelfuse, Inc. | 200,000 | 12,540,000 | ||||||
M/A-COM Technology Solutions Holdings, Inc.(1) | 100,000 | 2,074,000 | ||||||
| Methode Electronics, Inc. | 460,000 | 4,268,800 | ||||||
| Park Electrochemical Corp. | 340,000 | 10,278,200 | ||||||
Plexus Corp.(1) | 165,000 | 5,773,350 | ||||||
Tech Data Corp.(1) | 40,000 | 2,170,400 | ||||||
| �� | 50,334,050 | |||||||
| ENERGY EQUIPMENT AND SERVICES — 1.8% | ||||||||
| Bristow Group, Inc. | 110,000 | 5,250,300 | ||||||
Cal Dive International, Inc.(1) | 850,000 | 2,805,000 | ||||||
Helix Energy Solutions Group, Inc.(1) | 445,000 | 7,921,000 | ||||||
Key Energy Services, Inc.(1) | 40,000 | 618,000 | ||||||
| SandRidge Permian Trust | 130,000 | 3,030,300 | ||||||
13
| Shares | Value | |||||||
Superior Energy Services, Inc.(1) | 190,000 | $5,008,400 | ||||||
Tetra Technologies, Inc.(1) | 1,100,000 | 10,362,000 | ||||||
Unit Corp.(1) | 65,000 | 2,779,400 | ||||||
| 37,774,400 | ||||||||
| FOOD AND STAPLES RETAILING — 0.8% | ||||||||
| Harris Teeter Supermarkets Inc. | 45,000 | 1,804,500 | ||||||
| Village Super Market, Inc., Class A | 165,000 | 5,212,350 | ||||||
| Weis Markets, Inc. | 235,000 | 10,246,000 | ||||||
| 17,262,850 | ||||||||
| FOOD PRODUCTS — 0.9% | ||||||||
Dole Food Co., Inc.(1) | 415,000 | 4,141,700 | ||||||
| J&J Snack Foods Corp. | 140,000 | 7,344,400 | ||||||
| Snyders-Lance, Inc. | 240,000 | 6,204,000 | ||||||
| 17,690,100 | ||||||||
| GAS UTILITIES — 0.9% | ||||||||
| Atmos Energy Corp. | 255,000 | 8,022,300 | ||||||
| Chesapeake Utilities Corp. | 45,000 | 1,850,400 | ||||||
| Laclede Group, Inc. (The) | 77,570 | 3,026,781 | ||||||
| WGL Holdings, Inc. | 125,000 | 5,087,500 | ||||||
| 17,986,981 | ||||||||
| HEALTH CARE EQUIPMENT AND SUPPLIES — 2.1% | ||||||||
Cutera, Inc.(1) | 385,000 | 3,291,750 | ||||||
ICU Medical, Inc.(1) | 130,000 | 6,390,800 | ||||||
Integra LifeSciences Holdings Corp.(1) | 150,000 | 5,203,500 | ||||||
Orthofix International NV(1) | 116,152 | 4,364,992 | ||||||
| Utah Medical Products, Inc. | 155,000 | 4,820,500 | ||||||
Young Innovations, Inc.(2) | 655,000 | 20,252,600 | ||||||
| 44,324,142 | ||||||||
| HEALTH CARE PROVIDERS AND SERVICES — 3.5% | ||||||||
Amsurg Corp.(1) | 145,000 | 4,057,100 | ||||||
| Assisted Living Concepts, Inc., Class A | 120,000 | 1,993,200 | ||||||
Centene Corp.(1) | 90,000 | 4,407,300 | ||||||
HealthSouth Corp.(1) | 370,000 | 7,577,600 | ||||||
LifePoint Hospitals, Inc.(1) | 135,000 | 5,324,400 | ||||||
| Lincare Holdings, Inc. | 340,000 | 8,799,200 | ||||||
Magellan Health Services, Inc.(1) | 145,000 | 7,077,450 | ||||||
| National Healthcare Corp. | 115,000 | 5,239,400 | ||||||
| Owens & Minor, Inc. | 295,000 | 8,970,950 | ||||||
PSS World Medical, Inc.(1) | 245,000 | 6,208,300 | ||||||
| U.S. Physical Therapy, Inc. | 145,000 | 3,342,250 | ||||||
VCA Antech, Inc.(1) | 375,000 | 8,703,750 | ||||||
| 71,700,900 | ||||||||
| HOTELS, RESTAURANTS AND LEISURE — 1.8% | ||||||||
Bally Technologies, Inc.(1) | 155,000 | 7,246,250 | ||||||
| Bob Evans Farms, Inc. | 130,000 | 4,903,600 | ||||||
| Brinker International, Inc. | 160,000 | 4,408,000 | ||||||
| CEC Entertainment, Inc. | 110,000 | 4,170,100 | ||||||
Jack in the Box, Inc.(1) | 170,000 | 4,074,900 | ||||||
Orient-Express Hotels Ltd. Class A(1) | 280,000 | 2,856,000 | ||||||
| Vail Resorts, Inc. | 155,000 | 6,703,750 | ||||||
WMS Industries, Inc.(1) | 125,000 | 2,966,250 | ||||||
| 37,328,850 | ||||||||
| HOUSEHOLD DURABLES — 1.0% | ||||||||
| CSS Industries, Inc. | 280,000 | 5,448,800 | ||||||
Helen of Troy Ltd.(1) | 55,000 | 1,870,550 | ||||||
La-Z-Boy, Inc.(1) | 300,000 | 4,488,000 | ||||||
| Tupperware Brands Corp. | 135,000 | 8,572,500 | ||||||
| 20,379,850 | ||||||||
| INSURANCE — 5.1% | ||||||||
| Alterra Capital Holdings Ltd. | 360,000 | 8,272,800 | ||||||
| American Equity Investment Life Holding Co. | 525,000 | 6,704,250 | ||||||
| Arthur J. Gallagher & Co. | 80,000 | 2,859,200 | ||||||
| Aspen Insurance Holdings Ltd. | 365,000 | 10,198,100 | ||||||
| Baldwin & Lyons, Inc., Class B | 290,000 | 6,490,200 | ||||||
| Hanover Insurance Group, Inc. (The) | 135,000 | 5,551,200 | ||||||
| HCC Insurance Holdings, Inc. | 795,000 | 24,780,150 | ||||||
| Infinity Property & Casualty Corp. | 95,000 | 4,971,350 | ||||||
National Financial Partners Corp.(1) | 315,000 | 4,769,100 | ||||||
| Platinum Underwriters Holdings Ltd. | 245,000 | 8,942,500 | ||||||
| Primerica, Inc. | 210,000 | 5,294,100 | ||||||
| ProAssurance Corp. | 65,000 | 5,727,150 | ||||||
| Symetra Financial Corp. | 420,000 | 4,842,600 | ||||||
| United Fire Group, Inc. | 345,000 | 6,172,050 | ||||||
| 105,574,750 | ||||||||
| IT SERVICES — 2.6% | ||||||||
Convergys Corp.(1) | 685,000 | 9,144,750 | ||||||
| DST Systems, Inc. | 355,000 | 19,251,650 | ||||||
Euronet Worldwide, Inc.(1) | 220,000 | 4,595,800 | ||||||
NeuStar, Inc., Class A(1) | 140,000 | 5,215,000 | ||||||
| Total System Services, Inc. | 545,000 | 12,573,150 | ||||||
Vantiv, Inc. Class A(1) | 96,803 | 1,900,243 | ||||||
| 52,680,593 | ||||||||
14
| Shares | Value | |||||||
| LEISURE EQUIPMENT AND PRODUCTS — 0.2% | ||||||||
| Brunswick Corp. | 190,000 | 4,892,500 | ||||||
| LIFE SCIENCES TOOLS AND SERVICES — 0.4% | ||||||||
Covance, Inc.(1) | 160,000 | 7,620,800 | ||||||
| MACHINERY — 4.1% | ||||||||
| Actuant Corp., Class A | 185,000 | 5,363,150 | ||||||
Altra Holdings, Inc.(1) | 400,000 | 7,680,000 | ||||||
| Barnes Group, Inc. | 210,000 | 5,525,100 | ||||||
| Briggs & Stratton Corp. | 465,000 | 8,337,450 | ||||||
| Douglas Dynamics, Inc. | 140,000 | 1,925,000 | ||||||
| Dynamic Materials Corp. | 200,000 | 4,222,000 | ||||||
| FreightCar America, Inc. | 155,000 | 3,485,950 | ||||||
| Harsco Corp. | 135,000 | 3,167,100 | ||||||
| IDEX Corp. | 125,000 | 5,266,250 | ||||||
| Kaydon Corp. | 405,000 | 10,331,550 | ||||||
| Kennametal, Inc. | 325,000 | 14,472,250 | ||||||
| Lincoln Electric Holdings, Inc. | 110,000 | 4,985,200 | ||||||
| Mueller Industries, Inc., Class A | 100,000 | 4,545,000 | ||||||
Oshkosh Corp.(1) | 115,000 | 2,664,550 | ||||||
| Robbins & Myers, Inc. | 50,000 | 2,602,500 | ||||||
| 84,573,050 | ||||||||
| MARINE — 0.5% | ||||||||
| Alexander & Baldwin, Inc. | 65,000 | 3,149,250 | ||||||
Diana Shipping, Inc.(1) | 700,000 | 6,265,000 | ||||||
| 9,414,250 | ||||||||
| MEDIA — 1.5% | ||||||||
| Belo Corp. Class A | 1,360,000 | 9,751,200 | ||||||
E.W. Scripps Co. (The), Class A(1) | 215,000 | 2,122,050 | ||||||
Entercom Communications Corp., Class A(1) | 630,000 | 4,088,700 | ||||||
| Entravision Communications Corp., Class A | 2,815,000 | 4,813,650 | ||||||
| Gannett Co., Inc. | 190,000 | 2,912,700 | ||||||
| Harte-Hanks, Inc. | 52,679 | 476,745 | ||||||
LIN TV Corp., Class A(1) | 1,510,000 | 6,115,500 | ||||||
| 30,280,545 | ||||||||
| METALS AND MINING — 1.5% | ||||||||
Century Aluminum Co.(1) | 250,000 | 2,220,000 | ||||||
| Hecla Mining Co. | 1,150,000 | 5,313,000 | ||||||
Materion Corp.(1) | 210,000 | 6,033,300 | ||||||
RTI International Metals, Inc.(1) | 235,000 | 5,419,100 | ||||||
| Schnitzer Steel Industries, Inc. Class A | 135,000 | 5,385,825 | ||||||
Thompson Creek Metals Co., Inc.(1) | 950,000 | 6,422,000 | ||||||
| 30,793,225 | ||||||||
| MULTI-UTILITIES — 0.8% | ||||||||
| Avista Corp. | 185,000 | 4,732,300 | ||||||
| Black Hills Corp. | 130,000 | 4,358,900 | ||||||
| MDU Resources Group, Inc. | 125,000 | 2,798,750 | ||||||
| NorthWestern Corp. | 125,000 | 4,432,500 | ||||||
| 16,322,450 | ||||||||
| MULTILINE RETAIL — 0.7% | ||||||||
Big Lots, Inc.(1) | 120,000 | 5,162,400 | ||||||
| Dillard’s, Inc., Class A | 85,000 | 5,356,700 | ||||||
| Fred’s, Inc., Class A | 245,000 | 3,579,450 | ||||||
| 14,098,550 | ||||||||
| OFFICE ELECTRONICS — 0.2% | ||||||||
Zebra Technologies Corp., Class A(1) | 95,000 | 3,912,100 | ||||||
| OIL, GAS AND CONSUMABLE FUELS — 2.4% | ||||||||
| Berry Petroleum Co., Class A | 90,000 | 4,241,700 | ||||||
Bill Barrett Corp.(1) | 255,000 | 6,632,550 | ||||||
| BP Prudhoe Bay Royalty Trust | 40,000 | 5,008,400 | ||||||
Comstock Resources, Inc.(1) | 250,000 | 3,957,500 | ||||||
Forest Oil Corp.(1) | 235,000 | 2,848,200 | ||||||
| Hugoton Royalty Trust | 260,000 | 3,816,800 | ||||||
Lone Pine Resources, Inc.(1) | 110,000 | 715,000 | ||||||
| Overseas Shipholding Group, Inc. | 55,000 | 694,650 | ||||||
| Penn Virginia Corp. | 125,000 | 568,750 | ||||||
Swift Energy Co.(1) | 225,000 | 6,531,750 | ||||||
Vaalco Energy, Inc.(1) | 775,000 | 7,323,750 | ||||||
| Western Refining, Inc. | 215,000 | 4,046,300 | ||||||
Whiting USA Trust II(1) | 154,886 | 3,562,378 | ||||||
| 49,947,728 | ||||||||
| PAPER AND FOREST PRODUCTS — 1.0% | ||||||||
| Buckeye Technologies, Inc. | 140,000 | 4,755,800 | ||||||
Clearwater Paper Corp.(1) | 250,000 | 8,302,500 | ||||||
KapStone Paper and Packaging Corp.(1) | 375,000 | 7,387,500 | ||||||
| 20,445,800 | ||||||||
| PERSONAL PRODUCTS — 0.3% | ||||||||
| Inter Parfums, Inc. | 280,000 | 4,393,200 | ||||||
Prestige Brands Holdings, Inc.(1) | 130,000 | 2,272,400 | ||||||
| 6,665,600 | ||||||||
| PHARMACEUTICALS — 1.0% | ||||||||
Impax Laboratories, Inc.(1) | 170,000 | 4,178,600 | ||||||
| Medicis Pharmaceutical Corp., Class A | 75,000 | 2,819,250 | ||||||
Par Pharmaceutical Cos., Inc.(1) | 240,000 | 9,295,200 | ||||||
ViroPharma, Inc.(1) | 140,000 | 4,209,800 | ||||||
| 20,502,850 | ||||||||
15
| Shares | Value | |||||||
| PROFESSIONAL SERVICES — 1.3% | ||||||||
| CDI Corp. | 465,000 | $8,337,450 | ||||||
| Heidrick & Struggles International, Inc. | 225,000 | 4,956,750 | ||||||
Kforce, Inc.(1) | 295,000 | 4,395,500 | ||||||
On Assignment, Inc.(1) | 480,000 | 8,385,600 | ||||||
| 26,075,300 | ||||||||
| REAL ESTATE INVESTMENT TRUSTS (REITs) — 7.8% | ||||||||
| American Campus Communities, Inc. | 115,000 | 5,142,800 | ||||||
| Associated Estates Realty Corp. | 195,000 | 3,186,300 | ||||||
| BioMed Realty Trust, Inc. | 435,000 | 8,256,300 | ||||||
| Campus Crest Communities, Inc. | 665,000 | 7,753,900 | ||||||
| CBL & Associates Properties, Inc. | 450,000 | 8,514,000 | ||||||
| Chimera Investment Corp. | 2,375,000 | 6,721,250 | ||||||
| CommonWealth REIT | 275,000 | 5,120,500 | ||||||
| CreXus Investment Corp. | 280,000 | 2,895,200 | ||||||
| DCT Industrial Trust, Inc. | 315,000 | 1,858,500 | ||||||
| DiamondRock Hospitality Co. | 400,000 | 4,116,000 | ||||||
| Equity Lifestyle Properties, Inc. | 50,000 | 3,487,000 | ||||||
First Industrial Realty Trust, Inc.(1) | 260,000 | 3,211,000 | ||||||
| First Potomac Realty Trust | 265,000 | 3,203,850 | ||||||
| Government Properties Income Trust | 170,000 | 4,098,700 | ||||||
| Hatteras Financial Corp. | 220,000 | 6,138,000 | ||||||
| Healthcare Realty Trust, Inc. | 250,000 | 5,500,000 | ||||||
| Hersha Hospitality Trust | 615,000 | 3,357,900 | ||||||
| Highwoods Properties, Inc. | 90,000 | 2,998,800 | ||||||
| Kilroy Realty Corp. | 100,000 | 4,661,000 | ||||||
| LaSalle Hotel Properties | 165,000 | 4,643,100 | ||||||
| Lexington Realty Trust | 1,025,000 | 9,214,750 | ||||||
| Mack-Cali Realty Corp. | 250,000 | 7,205,000 | ||||||
| Medical Properties Trust, Inc. | 200,000 | 1,856,000 | ||||||
| MFA Financial, Inc. | 825,000 | 6,162,750 | ||||||
| National Retail Properties, Inc. | 170,000 | 4,622,300 | ||||||
| PS Business Parks, Inc. | 130,000 | 8,520,200 | ||||||
| RLJ Lodging Trust | 430,000 | 8,010,900 | ||||||
| Sabra Health Care REIT, Inc. | 465,000 | 7,644,600 | ||||||
| Sun Communities, Inc. | 73,383 | 3,179,685 | ||||||
| Urstadt Biddle Properties, Inc., Class A | 240,000 | 4,737,600 | ||||||
| Washington Real Estate Investment Trust | 140,000 | 4,158,000 | ||||||
| 160,175,885 | ||||||||
| ROAD AND RAIL — 0.8% | ||||||||
| Arkansas Best Corp. | 230,000 | 4,326,300 | ||||||
| Celadon Group, Inc. | 205,000 | 3,187,750 | ||||||
| Heartland Express, Inc. | 285,000 | 4,121,100 | ||||||
| Marten Transport Ltd. | 145,000 | 3,200,150 | ||||||
| Werner Enterprises, Inc. | 110,000 | 2,734,600 | ||||||
| 17,569,900 | ||||||||
| SEMICONDUCTORS AND SEMICONDUCTOR EQUIPMENT — 2.3% | ||||||||
Cymer, Inc.(1) | 90,000 | 4,500,000 | ||||||
Formfactor, Inc.(1) | 675,000 | 3,766,500 | ||||||
| Intersil Corp., Class A | 340,000 | 3,808,000 | ||||||
| MKS Instruments, Inc. | 70,000 | 2,067,100 | ||||||
Nanometrics, Inc.(1) | 350,000 | 6,478,500 | ||||||
Photronics, Inc.(1) | 460,000 | 3,059,000 | ||||||
Semtech Corp.(1) | 110,000 | 3,130,600 | ||||||
Spansion, Inc., Class A(1) | 1,100,000 | 13,398,000 | ||||||
Standard Microsystems Corp.(1) | 300,000 | 7,761,000 | ||||||
| 47,968,700 | ||||||||
| SOFTWARE — 3.4% | ||||||||
Compuware Corp.(1) | 650,000 | 5,973,500 | ||||||
JDA Software Group, Inc.(1) | 120,000 | 3,297,600 | ||||||
Quest Software, Inc.(1) | 1,900,000 | 44,213,000 | ||||||
Synopsys, Inc.(1) | 75,000 | 2,299,500 | ||||||
Websense, Inc.(1) | 630,000 | 13,286,700 | ||||||
| 69,070,300 | ||||||||
| SPECIALTY RETAIL — 3.1% | ||||||||
| American Eagle Outfitters, Inc. | 180,000 | 3,094,200 | ||||||
Cabela’s, Inc.(1) | 75,000 | 2,861,250 | ||||||
| Cato Corp. (The), Class A | 125,000 | 3,455,000 | ||||||
Collective Brands, Inc.(1) | 235,000 | 4,620,100 | ||||||
| Destination Maternity Corp. | 280,000 | 5,199,600 | ||||||
| Finish Line, Inc. (The), Class A | 195,000 | 4,137,900 | ||||||
Genesco, Inc.(1) | 45,389 | 3,252,122 | ||||||
| Guess?, Inc. | 130,000 | 4,062,500 | ||||||
| Lithia Motors, Inc., Class A | 279,176 | 7,314,411 | ||||||
| Men’s Wearhouse, Inc. (The) | 80,000 | 3,101,600 | ||||||
| Penske Automotive Group, Inc. | 250,000 | 6,157,500 | ||||||
| RadioShack Corp. | 900,000 | 5,598,000 | ||||||
| Rent-A-Center, Inc. | 110,000 | 4,152,500 | ||||||
| Williams-Sonoma, Inc. | 160,000 | 5,996,800 | ||||||
| 63,003,483 | ||||||||
16
| Shares | Value | |||||||
| TEXTILES, APPAREL AND LUXURY GOODS — 1.2% | ||||||||
| Columbia Sportswear Co. | 205,000 | $9,727,250 | ||||||
Culp, Inc.(1) | 480,000 | 5,270,400 | ||||||
| Movado Group, Inc. | 300,000 | 7,365,000 | ||||||
| Wolverine World Wide, Inc. | 65,000 | 2,416,700 | ||||||
| 24,779,350 | ||||||||
| THRIFTS AND MORTGAGE FINANCE — 2.6% | ||||||||
| BankUnited, Inc. | 660,000 | 16,500,000 | ||||||
| Brookline Bancorp., Inc. | 460,000 | 4,310,200 | ||||||
| Capitol Federal Financial, Inc. | 625,000 | 7,412,500 | ||||||
| Flushing Financial Corp. | 240,000 | 3,230,400 | ||||||
| Kaiser Federal Financial Group, Inc. | 215,000 | 3,007,850 | ||||||
Nationstar Mortgage Holdings, Inc.(1) | 295,000 | 4,236,200 | ||||||
| Oritani Financial Corp. | 215,000 | 3,156,200 | ||||||
| Provident Financial Services, Inc. | 380,000 | 5,521,400 | ||||||
| Washington Federal, Inc. | 310,000 | 5,214,200 | ||||||
| 52,588,950 | ||||||||
| TRADING COMPANIES AND DISTRIBUTORS — 1.0% | ||||||||
| Applied Industrial Technologies, Inc. | 125,000 | 5,141,250 | ||||||
| Kaman Corp. | 175,000 | 5,941,250 | ||||||
| Lawson Products, Inc. | 310,000 | 4,684,100 | ||||||
WESCO International, Inc.(1) | 75,000 | 4,898,250 | ||||||
| 20,664,850 | ||||||||
| WATER UTILITIES — 0.2% | ||||||||
| Artesian Resources Corp., Class A | 260,000 | 4,885,400 | ||||||
TOTAL COMMON STOCKS(Cost $1,625,908,235) | 1,891,471,200 | |||||||
| Exchange-Traded Funds — 3.2% | ||||||||
| iShares Russell 2000 Index Fund | 425,000 | 35,211,250 | ||||||
| iShares S&P SmallCap 600 Index Fund | 405,000 | 30,905,550 | ||||||
TOTAL EXCHANGE-TRADED FUNDS(Cost $61,905,372) | 66,116,800 | |||||||
| Convertible Preferred Stocks — 2.0% | ||||||||
| INSURANCE — 1.2% | ||||||||
| Aspen Insurance Holdings Ltd., Series AHL, 5.625% | 455,000 | 25,252,500 | ||||||
| LEISURE EQUIPMENT AND PRODUCTS — 0.2% | ||||||||
| Callaway Golf Co., Series B, 7.50% | 45,000 | 4,635,000 | ||||||
| MEDIA — 0.2% | ||||||||
LodgeNet Interactive Corp., 10.00%(3) | 3,321 | 4,030,864 | ||||||
| REAL ESTATE INVESTMENT TRUSTS (REITs) — 0.1% | ||||||||
| Lexington Realty Trust, Series C, 6.50% | 42,306 | 1,848,243 | ||||||
| TOBACCO — 0.3% | ||||||||
| Universal Corp., 6.75% | 5,604 | 6,053,721 | ||||||
TOTAL CONVERTIBLE PREFERRED STOCKS(Cost $37,688,611) | 41,820,328 | |||||||
| Preferred Stocks — 0.3% | ||||||||
| REAL ESTATE INVESTMENT TRUSTS (REITs) — 0.3% | ||||||||
| DuPont Fabros Technology, Inc., Series A, 7.875% | 135,000 | 3,493,800 | ||||||
| Inland Real Estate Corp., Series A, 8.125% | 106,133 | 2,715,944 | ||||||
TOTAL PREFERRED STOCKS (Cost $6,027,059) | 6,209,744 | |||||||
| Temporary Cash Investments — 1.7% | ||||||||
Repurchase Agreement, Bank America Merrill Lynch, (collateralized by various U.S. Treasury obligations, 6.125%, 11/15/27, valued at $12,674,204), in a joint trading account at 0.01%, dated 3/30/12, due 4/2/12 (Delivery value $12,413,417) | 12,413,407 | |||||||
Repurchase Agreement, Credit Suisse First Boston, Inc., (collateralized by various U.S. Treasury obligations, 4.375%, 5/15/41, valued at $7,903,524), in a joint trading account at 0.03%, dated 3/30/12, due 4/2/12 (Delivery value $7,758,399) | 7,758,380 | |||||||
Repurchase Agreement, Goldman Sachs & Co., (collateralized by various U.S. Treasury obligations, 4.50%, 5/15/38, valued at $9,514,876), in a joint trading account at 0.03%, dated 3/30/12, due 4/2/12 (Delivery value $9,310,078) | 9,310,055 | |||||||
| SSgA U.S. Government Money Market Fund | 5,273,192 | 5,273,192 | ||||||
TOTAL TEMPORARY CASH INVESTMENTS (Cost $34,755,034) | 34,755,034 | |||||||
TOTAL INVESTMENT SECURITIES — 99.1% (Cost $1,766,284,311) | 2,040,373,106 | |||||||
| OTHER ASSETS AND LIABILITIES — 0.9% | 18,721,196 | |||||||
| TOTAL NET ASSETS — 100.0% | $2,059,094,302 | |||||||
17
Notes to Schedule of Investments
CBOE = Chicago Board Options Exchange
| (1) | Non-income producing. |
| (2) | Affiliated Company: the fund’s holding represents ownership of 5% or more of the voting securities of the company; therefore, the company is affiliated as defined in the Investment Company Act of 1940. |
| (3) | Security was purchased under Rule 144A of the Securities Act of 1933 or is a private placement and, unless registered under the Act or exempted from registration, may only be sold to qualified institutional investors. The aggregate value of these securities at the period end was $4,030,864, which represented 0.2% of total net assets. |
See Notes to Financial Statements.
18
| MARCH 31, 2012 | ||||
| Assets | ||||
| Investment securities — unaffiliated, at value (cost of $1,746,483,612) | $2,017,780,506 | |||
| Investment securities — affiliated, at value (cost of $19,800,699) | 22,592,600 | |||
| Total investment securities, at value (cost of $1,766,284,311) | 2,040,373,106 | |||
| Receivable for investments sold | 38,460,725 | |||
| Receivable for capital shares sold | 1,351,308 | |||
| Dividends and interest receivable | 3,718,929 | |||
| 2,083,904,068 | ||||
| Liabilities | ||||
| Payable for investments purchased | 20,108,006 | |||
| Payable for capital shares redeemed | 2,589,230 | |||
| Accrued management fees | 2,019,893 | |||
| Distribution and service fees payable | 92,637 | |||
| 24,809,766 | ||||
| Net Assets | $2,059,094,302 | |||
| Net Assets Consist of: | ||||
| Capital (par value and paid-in surplus) | $1,834,573,104 | |||
| Undistributed net investment income | 6,845,576 | |||
| Accumulated net realized loss | (56,413,173 | ) | ||
| Net unrealized appreciation | 274,088,795 | |||
| $2,059,094,302 | ||||
| Net assets | Shares outstanding | Net asset value per share | |
| Investor Class, $0.01 Par Value | $880,194,027 | 102,212,112 | $8.61 |
| Institutional Class, $0.01 Par Value | $742,867,007 | 85,857,465 | $8.65 |
| A Class, $0.01 Par Value | $432,711,499 | 50,506,463 | $8.57* |
| C Class, $0.01 Par Value | $77,080 | 9,040 | $8.53 |
| R Class, $0.01 Par Value | $3,244,689 | 378,282 | $8.58 |
*Maximum offering price $9.09 (net asset value divided by 0.9425).
See Notes to Financial Statements.
19
| YEAR ENDED MARCH 31, 2012 | ||||
| Investment Income (Loss) | ||||
| Income: | ||||
| Dividends (including $910,275 from affiliates) | $49,529,092 | |||
| Interest | 14,636 | |||
| 49,543,728 | ||||
| Expenses: | ||||
| Management fees | 24,260,357 | |||
| Distribution and service fees: | ||||
| A Class | 1,097,964 | |||
| C Class | 646 | |||
| R Class | 17,781 | |||
| Directors’ fees and expenses | 97,501 | |||
| 25,474,249 | ||||
| Net investment income (loss) | 24,069,479 | |||
| Realized and Unrealized Gain (Loss) | ||||
| Net realized gain (loss) on investment transactions (including $(1,422,631) from affiliates) | 51,466,803 | |||
| Change in net unrealized appreciation (depreciation) on investments | (149,779,985 | ) | ||
| Net realized and unrealized gain (loss) | (98,313,182 | ) | ||
| Net Increase (Decrease) in Net Assets Resulting from Operations | $(74,243,703 | ) | ||
See Notes to Financial Statements.
20
| YEARS ENDED MARCH 31, 2012 AND MARCH 31, 2011 | |||||||
| Increase (Decrease) in Net Assets | March 31, 2012 | March 31, 2011 | |||||
| Operations | |||||||
| Net investment income (loss) | $24,069,479 | $22,244,660 | |||||
| Net realized gain (loss) | 51,466,803 | 286,958,789 | |||||
| Change in net unrealized appreciation (depreciation) | (149,779,985 | ) | 79,895,526 | ||||
| Net increase (decrease) in net assets resulting from operations | (74,243,703 | ) | 389,098,975 | ||||
| Distributions to Shareholders | |||||||
| From net investment income: | |||||||
| Investor Class | (7,140,243 | ) | (6,926,961 | ) | |||
| Institutional Class | (6,493,376 | ) | (6,428,297 | ) | |||
| A Class | (2,675,508 | ) | (2,495,132 | ) | |||
| C Class | (170 | ) | (42 | ) | |||
| R Class | (15,558 | ) | (9,025 | ) | |||
| From net realized gains: | |||||||
| Investor Class | (61,738,483 | ) | — | ||||
| Institutional Class | (46,265,286 | ) | — | ||||
| A Class | (29,223,314 | ) | — | ||||
| C Class | (4,992 | ) | — | ||||
| R Class | (215,299 | ) | — | ||||
| Decrease in net assets from distributions | (153,772,229 | ) | (15,859,457 | ) | |||
| Capital Share Transactions | |||||||
| Net increase (decrease) in net assets from capital share transactions | (193,359,264 | ) | 132,084,281 | ||||
| Net increase (decrease) in net assets | (421,375,196 | ) | 505,323,799 | ||||
| Net Assets | |||||||
| Beginning of period | 2,480,469,498 | 1,975,145,699 | |||||
| End of period | $2,059,094,302 | $2,480,469,498 | |||||
| Undistributed net investment income | $6,845,576 | $181,767 | |||||
See Notes to Financial Statements.
21
MARCH 31, 2012
1. Organization
American Century Capital Portfolios, Inc. (the corporation) is registered under the Investment Company Act of 1940, as amended (the 1940 Act), as an open-end management investment company and is organized as a Maryland corporation. Small Cap Value Fund (the fund) is one fund in a series issued by the corporation. The fund is diversified as defined under the 1940 Act. The fund’s investment objective is to seek long-term capital growth. Income is a secondary objective. The fund pursues its objectives by investing in stocks of smaller market capitalization companies that management believes to be undervalued at the time of purchase.
The fund is authorized to issue the Investor Class, the Institutional Class, the A Class, the C Class and the R Class. The A Class may incur an initial sales charge. The A Class and C Class may be subject to a contingent deferred sales charge. The share classes differ principally in their respective sales charges and distribution and shareholder servicing expenses and arrangements. The Institutional Class is made available to institutional shareholders or through financial intermediaries whose clients do not require the same level of shareholder and administrative services as shareholders of other classes. As a result, the Institutional Class is charged a lower unified management fee.
2. Significant Accounting Policies
The following is a summary of significant accounting policies consistently followed by the fund in preparation of its financial statements. The financial statements are prepared in conformity with accounting principles generally accepted in the United States of America, which may require management to make certain estimates and assumptions at the date of the financial statements. Actual results could differ from these estimates.
Investment Valuations — The fund determines the fair value of its investments and computes its net asset value per share as of the close of regular trading (usually 4 p.m. Eastern time) on the New York Stock Exchange (NYSE) on each day the NYSE is open.
Equity securities that are listed or traded on a domestic securities exchange are valued at the last reported sales price or at the official closing price as provided by the exchange. Equity securities traded on foreign securities exchanges are typically valued at the closing price on the exchange where primarily traded or as of the close of the NYSE, if that is earlier. If no last sales price is reported, or if local convention or regulation so provides, the mean of the latest bid and asked prices is used. Depending on local convention or regulation, securities traded over-the-counter are valued at the mean of the latest bid and asked prices, the last sales price, or the official closing price. In its determination of fair value, the fund may review several factors including: market information specific to a security; news developments in U.S. and foreign markets; the performance of particular U.S. and foreign securities, indices, comparable securities, American Depositary Receipts, Exchange-Traded Funds, and other relevant market indicators.
Debt securities maturing within 60 days at the time of purchase may be valued at cost, plus or minus any amortized discount or premium or at the evaluated mean as provided by an independent pricing service. Evaluated mean prices are commonly derived through utilization of market models, which may consider, among other factors, trade data, quotations from dealers and active market makers, relevant yield curve and spread data, related sector levels, creditworthiness, and other relevant market information on the same or comparable securities.
Investments in open-end management investment companies are valued at the reported net asset value per share. Repurchase agreements are valued at cost.
If the fund determines that the market price for a portfolio security is not readily available or the valuation methods mentioned above do not reflect a security’s fair value, such security is valued as determined in good faith by the Board of Directors or its designee, in accordance with procedures adopted by the Board of Directors. Circumstances that may cause the fund to use these procedures to value a security include, but are not limited
22
to: a security has been declared in default; trading in a security has been halted during the trading day; there is a foreign market holiday and no trading occurred; or an event occurred between the close of a foreign exchange and the NYSE that may affect the value of a security.
Security Transactions — Security transactions are accounted for as of the trade date. Net realized gains and losses are determined on the identified cost basis, which is also used for federal income tax purposes.
Investment Income — Dividend income less foreign taxes withheld, if any, is recorded as of the ex-dividend date. Distributions received on securities that represent a return of capital or capital gain are recorded as a reduction of cost of investments and/or as a realized gain. The fund estimates the components of distributions received that may be considered nontaxable distributions or capital gain distributions for income tax purposes. Interest income is recorded on the accrual basis and includes accretion of discounts and amortization of premiums.
Business Development Companies — The fund may invest in securities of closed-end investment companies that have elected to be treated as a business development company under the 1940 Act. A business development company operates similar to an exchange-traded fund and represents a portfolio of securities. The fund may purchase a business development company to gain exposure to the securities in the underlying portfolio. The risks of owning a business development company generally reflect the risks of owning the underlying securities. Business development companies have expenses that reduce their value.
Repurchase Agreements — The fund may enter into repurchase agreements with institutions that American Century Investment Management, Inc. (ACIM) (the investment advisor) has determined are creditworthy pursuant to criteria adopted by the Board of Directors. The fund requires that the collateral, represented by securities, received in a repurchase transaction be transferred to the custodian in a manner sufficient to enable the fund to obtain those securities in the event of a default under the repurchase agreement. ACIM monitors, on a daily basis, the securities transferred to ensure the value, including accrued interest, of the securities under each repurchase agreement is equal to or greater than amounts owed to the fund under each repurchase agreement.
Joint Trading Account — Pursuant to an Exemptive Order issued by the Securities and Exchange Commission, the fund, along with certain other funds in the American Century Investments family of funds, may transfer uninvested cash balances into a joint trading account. These balances are invested in one or more repurchase agreements that are collateralized by U.S. Treasury or Agency obligations.
Income Tax Status — It is the fund’s policy to distribute substantially all net investment income and net realized gains to shareholders and to otherwise qualify as a regulated investment company under provisions of the Internal Revenue Code. The fund is no longer subject to examination by tax authorities for years prior to 2009. At this time, management believes there are no uncertain tax positions which, based on their technical merit, would not be sustained upon examination and for which it is reasonably possible that the total amounts of unrecognized tax benefits will significantly change in the next twelve months. Accordingly, no provision has been made for federal or state income taxes.
Multiple Class — All shares of the fund represent an equal pro rata interest in the net assets of the class to which such shares belong, and have identical voting, dividend, liquidation and other rights and the same terms and conditions, except for class specific expenses and exclusive rights to vote on matters affecting only individual classes. Income, non-class specific expenses, and realized and unrealized capital gains and losses of the fund are allocated to each class of shares based on their relative net assets.
Distributions to Shareholders — Distributions from net investment income, if any, are generally declared and paid quarterly. Distributions from net realized gains, if any, are generally declared and paid annually.
Indemnifications — Under the corporation’s organizational documents, its officers and directors are indemnified against certain liabilities arising out of the performance of their duties to the fund. In addition, in the normal course of business, the fund enters into
23
contracts that provide general indemnifications. The maximum exposure under these arrangements is unknown as this would involve future claims that may be made against a fund. The risk of material loss from such claims is considered by management to be remote.
3. Fees and Transactions with Related Parties
Management Fees — The corporation has entered into a management agreement with ACIM, under which ACIM provides the fund with investment advisory and management services in exchange for a single, unified management fee (the fee) per class. The agreement provides that all expenses of managing and operating the fund, except distribution and service fees, brokerage expenses, taxes, interest, fees and expenses of the independent directors (including legal counsel fees), and extraordinary expenses, will be paid by ACIM. The fee is computed and accrued daily based on each class’s daily net assets and paid monthly in arrears. The rate of the fee is determined by applying a fee rate calculation formula. This formula takes into account the fund’s assets as well as certain assets, if any, of other clients of the investment advisor outside the American Century Investments family of funds (such as subadvised funds and separate accounts) that have very similar investment teams and investment strategies (strategy assets). The annual management fee schedule ranges from 1.00% to 1.25% for the Investor Class, A Class, C Class and R Class. The Institutional Class is 0.20% less at each point within the range. The effective annual management fee for each class for the year ended March 31, 2012 was 1.24% for the Investor Class, A Class, C Class, and R Class and 1.04% for the Institutional Class.
Distribution and Service Fees — The Board of Directors has adopted a separate Master Distribution and Individual Shareholder Services Plan for each of the A Class, C Class and R Class (collectively the plans), pursuant to Rule 12b-1 of the 1940 Act. The plans provide that the A Class will pay American Century Investment Services, Inc. (ACIS) an annual distribution and service fee of 0.25%. The plans provide that the C Class will pay ACIS an annual distribution and service fee of 1.00%, of which 0.25% is paid for individual shareholder services and 0.75% is paid for distribution services. The plans provide that the R Class will pay ACIS an annual distribution and service fee of 0.50%. The fees are computed and accrued daily based on each class’s daily net assets and paid monthly in arrears. The fees are used to pay financial intermediaries for distribution and individual shareholder services. Fees incurred under the plans during the year ended March 31, 2012 are detailed in the Statement of Operations.
Acquired Fund Fees and Expenses — The fund may invest in mutual funds, exchange-traded funds, and business development companies (the acquired funds). The fund will indirectly realize its pro rata share of the fees and expenses of the acquired funds in which it invests. These indirect fees and expenses are not paid out of the fund’s assets but are reflected in the return realized by the fund on its investment in the acquired funds.
Related Parties — Certain officers and directors of the corporation are also officers and/or directors of American Century Companies, Inc. (ACC), the parent of the corporation’s investment advisor, ACIM, the distributor of the corporation, ACIS, and the corporation’s transfer agent, American Century Services, LLC.
The fund was eligible to invest in a money market fund for temporary purposes, which is managed by J.P. Morgan Investment Management, Inc. (JPMIM). The fund had a securities lending agreement with JPMorgan Chase Bank (JPMCB) and a mutual funds services agreement with J.P. Morgan Investor Services Co. (JPMIS). JPMCB was a custodian of the fund. JPMIM, JPMIS and JPMCB are wholly owned subsidiaries of JPMorgan Chase & Co. (JPM). Prior to August 31, 2011, JPM was an equity investor in ACC. The services provided to the fund by JPMIM, JPMIS and JPMCB terminated on July 31, 2011.
4. Investment Transactions
Purchases and sales of investment securities, excluding short-term investments, for the year ended March 31, 2012 were $2,474,611,879 and $2,772,545,957, respectively.
For the year ended March 31, 2012, the fund incurred net realized losses of $(462,516) from redemptions in kind. A redemption in kind occurs when a fund delivers securities from its portfolio in lieu of cash as payment to a redeeming shareholder.
24
5. Capital Share Transactions
Transactions in shares of the fund were as follows:
| Year ended March 31, 2012 | Year ended March 31, 2011 | ||||||||||||||
| Shares | Amount | Shares | Amount | ||||||||||||
| Investor Class/Shares Authorized | 500,000,000 | 500,000,000 | |||||||||||||
| Sold | 16,151,704 | $136,283,125 | 34,957,443 | $291,161,149 | |||||||||||
| Issued in reinvestment of distributions | 8,341,097 | 64,839,925 | 775,767 | 6,541,679 | |||||||||||
| Redeemed | (37,992,301 | ) | (314,448,272 | ) | (30,451,138 | ) | (252,735,029 | ) | |||||||
| (13,499,500 | ) | (113,325,222 | ) | 5,282,072 | 44,967,799 | ||||||||||
| Institutional Class/Shares Authorized | 300,000,000 | 270,000,000 | |||||||||||||
| Sold | 32,654,579 | 270,354,770 | 28,024,318 | 234,934,340 | |||||||||||
| Issued in reinvestment of distributions | 6,140,554 | 48,062,845 | 661,970 | 5,582,538 | |||||||||||
| Redeemed | (43,486,648 | ) | (358,948,533 | ) | (19,435,931 | ) | (161,546,370 | ) | |||||||
| (4,691,515 | ) | (40,530,918 | ) | 9,250,357 | 78,970,508 | ||||||||||
| A Class/Shares Authorized | 200,000,000 | 190,000,000 | |||||||||||||
| Sold | 7,394,433 | 62,030,098 | 11,642,949 | 96,129,611 | |||||||||||
| Issued in reinvestment of distributions | 4,089,636 | 31,614,716 | 235,973 | 2,000,259 | |||||||||||
| Redeemed | (15,737,514 | ) | (131,775,673 | ) | (11,441,531 | ) | (94,285,463 | ) | |||||||
| (4,253,445 | ) | (38,130,859 | ) | 437,391 | 3,844,407 | ||||||||||
| C Class/Shares Authorized | 5,000,000 | 5,000,000 | |||||||||||||
| Sold | 3,478 | 29,223 | 2,965 | 26,617 | |||||||||||
| Issued in reinvestment of distributions | 670 | 5,162 | 5 | 42 | |||||||||||
| Redeemed | (1,330 | ) | (10,688 | ) | (37 | ) | (330 | ) | |||||||
| 2,818 | 23,697 | 2,933 | 26,329 | ||||||||||||
| R Class/Shares Authorized | 5,000,000 | 5,000,000 | |||||||||||||
| Sold | 119,636 | 993,995 | 545,619 | 4,514,218 | |||||||||||
| Issued in reinvestment of distributions | 29,823 | 230,857 | 1,005 | 9,025 | |||||||||||
| Redeemed | (293,206 | ) | (2,620,814 | ) | (27,884 | ) | (248,005 | ) | |||||||
| (143,747 | ) | (1,395,962 | ) | 518,740 | 4,275,238 | ||||||||||
| Net increase (decrease) | (22,585,389 | ) | $(193,359,264 | ) | 15,491,493 | $132,084,281 | |||||||||
6. Affiliated Company Transactions
If a fund’s holding represents ownership of 5% or more of the voting securities of a company, the company is affiliated as defined in the 1940 Act. A summary of transactions for each company which is or was an affiliate at or during the year ended March 31, 2012 follows:
| March 31, 2011 | March 31, 2012 | ||||||
| Company | Share Balance | Purchase Cost | Sales Cost | Realized Gain (Loss) | Dividend Income | Share Balance | Market Value |
Primo Water Corp.(1) | 420,000 | $6,826,967 | $6,653,119 | $(1,774,586) | — | 1,200,000 | $2,340,000 |
Utah Medical Products, Inc.(2) | 170,000 | 152,159 | 583,429 | (24,087) | $146,050 | 155,000 | (2) |
| Young Innovations, Inc. | 625,000 | 3,808,143 | 2,639,197 | 376,042 | 764,225 | 655,000 | 20,252,600 |
| $10,787,269 | $9,875,745 | $(1,422,631) | $910,275 | $22,592,600 | |||
| (1) | Non-income producing. |
| (2) | Company was not an affiliate at March 31, 2012. |
25
7. Fair Value Measurements
The fund’s securities valuation process is based on several considerations and may use multiple inputs to determine the fair value of the positions held by the fund. In conformity with accounting principles generally accepted in the United States of America, the inputs used to determine a valuation are classified into three broad levels as follows:
| • | Level 1 valuation inputs consist of unadjusted quoted prices in an active market for identical securities; |
| • | Level 2 valuation inputs consist of direct or indirect observable market data (including quoted prices for similar securities, evaluations of subsequent market events, interest rates, prepayment speeds, credit risk, etc.); or |
| • | Level 3 valuation inputs consist of unobservable data (including a fund’s own assumptions). |
The level classification is based on the lowest level input that is significant to the fair valuation measurement. The valuation inputs are not necessarily an indication of the risks associated with investing in these securities or other financial instruments.
The following is a summary of the level classifications as of period end. The Schedule of Investments provides additional information on the fund’s portfolio holdings.
| Level 1 | Level 2 | Level 3 | |
| Investment Securities | |||
| Common Stocks | $1,891,471,200 | — | — |
| Exchange-Traded Funds | 66,116,800 | — | — |
| Convertible Preferred Stocks | — | $41,820,328 | — |
| Preferred Stocks | — | 6,209,744 | — |
| Temporary Cash Investments | 5,273,192 | 29,481,842 | — |
| Total Value of Investment Securities | $1,962,861,192 | $77,511,914 | — |
8. Risk Factors
The fund generally invests in smaller companies which may be more volatile, and subject to greater short-term risk than those of larger companies.
The fund’s investment process may result in high portfolio turnover, which could mean high transaction costs, affecting both performance and capital gains tax liabilities to investors.
9. Federal Tax Information
The tax character of distributions paid during the years ended March 31, 2012 and March 31, 2011 were as follows:
| 2012 | 2011 | |
| Distributions Paid From | ||
| Ordinary income | $16,324,855 | $15,859,457 |
| Long-term capital gains | $137,447,374 | — |
The book-basis character of distributions made during the year from net investment income or net realized gains may differ from their ultimate characterization for federal income tax purposes. These differences reflect the differing character of certain income items and net realized gains and losses for financial statement and tax purposes, and may result in reclassification among certain capital accounts on the financial statements.
26
As of March 31, 2012, the federal tax cost of investments and the components of distributable earnings on a tax-basis were as follows:
| Federal tax cost of investments | $1,844,894,626 | |
| Gross tax appreciation of investments | $252,247,637 | |
| Gross tax depreciation of investments | (56,769,157 | ) |
| Net tax appreciation (depreciation) of investments | $195,478,480 | |
| Undistributed ordinary income | $6,845,576 | |
| Accumulated long-term gains | $22,197,142 |
The difference between book-basis and tax-basis cost and unrealized appreciation (depreciation) is attributable primarily to the tax deferral of losses on wash sales.
27
| For a Share Outstanding Throughout the Years Ended March 31 (except as noted) | |||||||||||||
| Per-Share Data | Ratios and Supplemental Data | ||||||||||||
| Income From Investment Operations: | Distributions From: | Ratio to Average Net Assets of: | |||||||||||
Net Asset Value, Beginning of Period | Net Investment Income (Loss)(1) | Net Realized and Unrealized Gain (Loss) | Total From Investment Operations | Net Investment Income | Net Realized Gains | Total Distributions | Net Asset Value, End of Period | Total Return(2) | Operating Expenses(3) | Net Investment Income (Loss) | Portfolio Turnover Rate | Net Assets, End of Period (in thousands) | |
| Investor Class | |||||||||||||
| 2012 | $9.48 | 0.10 | (0.30) | (0.20) | (0.07) | (0.60) | (0.67) | $8.61 | (1.39)% | 1.24% | 1.14% | 120% | $880,194 |
| 2011 | $8.02 | 0.09 | 1.43 | 1.52 | (0.06) | — | (0.06) | $9.48 | 19.06% | 1.24% | 1.03% | 99% | $1,096,617 |
| 2010 | $4.70 | 0.11 | 3.33 | 3.44 | (0.12) | — | (0.12) | $8.02 | 73.93% | 1.25% | 1.60% | 104% | $885,942 |
| 2009 | $7.02 | 0.12 | (2.31) | (2.19) | (0.11) | (0.02) | (0.13) | $4.70 | (31.69)% | 1.25% | 1.93% | 192% | $419,206 |
| 2008 | $10.01 | 0.09 | (1.16) | (1.07) | (0.09) | (1.83) | (1.92) | $7.02 | (12.22)% | 1.26% | 1.01% | 123% | $732,968 |
| Institutional Class | |||||||||||||
| 2012 | $9.52 | 0.11 | (0.30) | (0.19) | (0.08) | (0.60) | (0.68) | $8.65 | (1.20)% | 1.04% | 1.34% | 120% | $742,867 |
| 2011 | $8.05 | 0.10 | 1.44 | 1.54 | (0.07) | — | (0.07) | $9.52 | 19.30% | 1.04% | 1.23% | 99% | $861,881 |
| 2010 | $4.71 | 0.12 | 3.35 | 3.47 | (0.13) | — | (0.13) | $8.05 | 74.47% | 1.05% | 1.80% | 104% | $654,738 |
| 2009 | $7.04 | 0.13 | (2.32) | (2.19) | (0.12) | (0.02) | (0.14) | $4.71 | (31.61)% | 1.05% | 2.13% | 192% | $258,902 |
| 2008 | $10.03 | 0.11 | (1.17) | (1.06) | (0.10) | (1.83) | (1.93) | $7.04 | (12.05)% | 1.06% | 1.21% | 123% | $370,422 |
A Class(4) | |||||||||||||
| 2012 | $9.44 | 0.08 | (0.30) | (0.22) | (0.05) | (0.60) | (0.65) | $8.57 | (1.56)% | 1.49% | 0.89% | 120% | $432,711 |
| 2011 | $8.00 | 0.06 | 1.43 | 1.49 | (0.05) | — | (0.05) | $9.44 | 18.63% | 1.49% | 0.78% | 99% | $516,974 |
| 2010 | $4.69 | 0.09 | 3.32 | 3.41 | (0.10) | — | (0.10) | $8.00 | 73.53% | 1.50% | 1.35% | 104% | $434,413 |
| 2009 | $7.00 | 0.10 | (2.30) | (2.20) | (0.09) | (0.02) | (0.11) | $4.69 | (31.82)% | 1.50% | 1.68% | 192% | $215,068 |
| 2008 | $10.00 | 0.07 | (1.17) | (1.10) | (0.07) | (1.83) | (1.90) | $7.00 | (12.51)% | 1.51% | 0.76% | 123% | $286,227 |
28
| For a Share Outstanding Throughout the Years Ended March 31 (except as noted) | |||||||||||||
| Per-Share Data | Ratios and Supplemental Data | ||||||||||||
| Income From Investment Operations: | Distributions From: | Ratio to Average Net Assets of: | |||||||||||
Net Asset Value, Beginning of Period | Net Investment Income (Loss)(1) | Net Realized and Unrealized Gain (Loss) | Total From Investment Operations | Net Investment Income | Net Realized Gains | Total Distributions | Net Asset Value, End of Period | Total Return(2) | Operating Expenses(3) | Net Investment Income (Loss) | Portfolio Turnover Rate | Net Assets, End of Period (in thousands) | |
| C Class | |||||||||||||
| 2012 | $9.43 | 0.02 | (0.30) | (0.28) | (0.02) | (0.60) | (0.62) | $8.53 | (2.30)% | 2.24% | 0.14% | 120% | $77 |
| 2011 | $8.01 | 0.01 | 1.42 | 1.43 | (0.01) | — | (0.01) | $9.43 | 17.85% | 2.24% | 0.03% | 99% | $59 |
2010(5) | $7.60 | —(6) | 0.41 | 0.41 | — | — | — | $8.01 | 5.39% | 2.25%(7) | 0.72%(7) | 104%(8) | $26 |
| R Class | |||||||||||||
| 2012 | $9.46 | 0.05 | (0.29) | (0.24) | (0.04) | (0.60) | (0.64) | $8.58 | (1.80)% | 1.74% | 0.64% | 120% | $3,245 |
| 2011 | $8.02 | 0.06 | 1.41 | 1.47 | (0.03) | — | (0.03) | $9.46 | 18.36% | 1.73% | 0.54% | 99% | $4,939 |
2010(5) | $7.60 | 0.01 | 0.41 | 0.42 | — | — | — | $8.02 | 5.53% | 1.75%(7) | 1.22%(7) | 104%(8) | $26 |
Notes to Financial Highlights
| (1) | Computed using average shares outstanding throughout the period. |
| (2) | Total returns are calculated based on the net asset value of the last business day and do not reflect applicable sales charges, if any. Total returns for periods less than one year are not annualized. |
| (3) | Ratio of operating expenses to average net assets does not include any fees and expenses of the acquired funds. |
| (4) | Prior to March 1, 2010, the A Class was referred to as the Advisor Class. |
| (5) | March 1, 2010 (commencement of sale) through March 31, 2010. |
| (6) | Per-share amount was less than $0.005. |
| (7) | Annualized. |
| (8) | Portfolio turnover is calculated at the fund level. Percentage indicated was calculated for the year ended March 31, 2010. |
See Notes to Financial Statements.
29
To the Board of Directors and Shareholders of
American Century Capital Portfolios, Inc.:
We have audited the accompanying statement of assets and liabilities, including the schedule of investments, of Small Cap Value Fund, one of the funds constituting American Century Capital Portfolios, Inc. (the “Corporation”) as of March 31, 2012, and the related statement of operations for the year then ended, the statements of changes in net assets for each of the two years in the period then ended, and the financial highlights for each of the five years in the period then ended. These financial statements and financial highlights are the responsibility of the Corporation’s management. Our responsibility is to express an opinion on these financial statements and financial highlights based on our audits.
We conducted our audits in accordance with the standards of the Public Company Accounting Oversight Board (United States). Those standards require that we plan and perform the audit to obtain reasonable assurance about whether the financial statements and financial highlights are free of material misstatement. The Corporation is not required to have, nor were we engaged to perform, an audit of its internal control over financial reporting. Our audits included consideration of internal control over financial reporting as a basis for designing audit procedures that are appropriate in the circumstances, but not for the purpose of expressing an opinion on the effectiveness of the Corporation’s internal control over financial reporting. Accordingly, we express no such opinion. An audit also includes examining, on a test basis, evidence supporting the amounts and disclosures in the financial statements, assessing the accounting principles used and significant estimates made by management, as well as evaluating the overall financial statement presentation. Our procedures included confirmation of securities owned as of March 31, 2012, by correspondence with the custodian and brokers; where replies were not received from brokers, we performed other auditing procedures. We believe that our audits provide a reasonable basis for our opinion.
In our opinion, such financial statements and financial highlights referred to above present fairly, in all material respects, the financial position of Small Cap Value Fund of American Century Capital Portfolios, Inc., as of March 31, 2012, the results of its operations for the year then ended, the changes in its net assets for each of the two years in the period then ended, and the financial highlights for each of the five years in the period then ended, in conformity with accounting principles generally accepted in the United States of America.
Deloitte & Touche LLP
Kansas City, Missouri
May 16, 2012
30
The Board of Directors
The individuals listed below serve as directors of the funds. Each director will continue to serve in this capacity until death, retirement, resignation or removal from office. The mandatory retirement age for directors who are not “interested persons,” as that term is defined in the Investment Company Act (independent directors), is 72. However, the mandatory retirement age for an individual director may be extended with the approval of the remaining independent directors.
Mr. Thomas is an “interested person” because he currently serves as President and Chief Executive Officer of American Century Companies, Inc. (ACC), the parent company of American Century Investment Management, Inc. (ACIM or the advisor). Mr. Fink is an “interested person” because he currently serves as Executive Vice President and Chief Operating Officer of ACC.
The other directors (more than three-fourths of the total number) are independent; that is, they have never been employees, directors or officers of, and have no financial interest in, ACC or any of its wholly owned, direct or indirect, subsidiaries, including ACIM, American Century Investment Services, Inc. (ACIS) and American Century Services, LLC (ACS). The directors serve in this capacity for seven (in the case of Mr. Thomas, 15) registered investment companies in the American Century Investments family of funds.
The following table presents additional information about the directors. The mailing address for each director is 4500 Main Street, Kansas City, Missouri 64111.
Name (Year of Birth) | Position(s) Held with Funds | Length of Time Served | Principal Occupation(s) During Past 5 Years | Number of American Century Portfolios Overseen by Director | Other Directorships Held During Past 5 Years | |
| Independent Directors | ||||||
Thomas A. Brown (1940) | Director | Since 1980 | Managing Member, Associated Investments, LLC (real estate investment company); Brown Cascade Properties, LLC (real estate investment company) (2001 to 2009) | 66 | None | |
Andrea C. Hall (1945) | Director | Since 1997 | Retired | 66 | None | |
Jan M. Lewis (1957) | Director | Since 2011 | President and Chief Executive Officer, Catholic Charities of Northeast Kansas (human services organization) (2006 to present) | 66 | None | |
James A. Olson (1942) | Director | Since 2007 | Member, Plaza Belmont LLC (private equity fund manager) | 66 | Saia, Inc. (2002 to 2012) and Entertainment Properties Trust | |
Donald H. Pratt (1937) | Director and Chairman of the Board | Since 1995 (Chairman since 2005) | Chairman and Chief Executive Officer, Western Investments, Inc. (real estate company) | 66 | None | |
31
Name (Year of Birth) | Position(s) Held with Funds | Length of Time Served | Principal Occupation(s) During Past 5 Years | Number of American Century Portfolios Overseen by Director | Other Directorships Held During Past 5 Years | |
| Independent Directors | ||||||
M. Jeannine Strandjord (1945) | Director | Since 1994 | Retired | 66 | DST Systems Inc., Euronet Worldwide Inc., and Charming Shoppes, Inc. (2006 to 2010) | |
John R. Whitten (1946) | Director | Since 2008 | Project Consultant, Celanese Corp. (industrial chemical company) | 66 | Rudolph Technologies, Inc. | |
Stephen E. Yates (1948) | Director | Since 2012 | Retired; Executive Vice President, Technology & Operations, KeyCorp. (computer services) (2004 to 2010) | 66 | Applied Industrial Technology (2001 to 2010) | |
| Interested Directors | ||||||
Barry Fink (1955) | Director and Executive Vice President | Since 2012 (Executive Vice President since 2007) | Chief Operating Officer and Executive Vice President, ACC (September 2007 to present); President, ACS (October 2007 to present); Managing Director, Morgan Stanley (2000 to 2007). Also serves as Manager, ACS and Director, ACC and certain ACC subsidiaries | 66 | None | |
Jonathan S. Thomas (1963) | Director and President | Since 2007 | President and Chief Executive Officer, ACC (March 2007 to present); Chief Administrative Officer, ACC (February 2006 to February 2007); Executive Vice President, ACC (November 2005 to February 2007). Also serves as Chief Executive Officer and Manager, ACS; Executive Vice President, ACIM; Director, ACC, ACIM and other ACC subsidiaries | 108 | None | |
32
Officers
The following table presents certain information about the executive officers of the funds. Each officer serves as an officer for each of the 15 investment companies in the American Century family of funds, unless otherwise noted. No officer is compensated for his or her service as an officer of the funds. The listed officers are interested persons of the funds and are appointed or re-appointed on an annual basis. The mailing address for each officer listed below is 4500 Main Street, Kansas City, Missouri 64111.
Name (Year of Birth) | Offices with the Funds | Principal Occupation(s) During the Past Five Years |
Jonathan S. Thomas (1963) | Director and President since 2007 | President and Chief Executive Officer, ACC (March 2007 to present); Chief Administrative Officer, ACC (February 2006 to February 2007); Executive Vice President, ACC (November 2005 to February 2007). Also serves as Chief Executive Officer and Manager, ACS; Executive Vice President, ACIM; Director, ACC, ACIM and other ACC subsidiaries |
Barry Fink (1955) | Director since 2012 and Executive Vice President since 2007 | Chief Operating Officer and Executive Vice President, ACC (September 2007 to present); President, ACS (October 2007 to present); Managing Director, Morgan Stanley (2000 to 2007). Also serves as Manager, ACS and Director, ACC and certain ACC subsidiaries |
Maryanne L. Roepke (1956) | Chief Compliance Officer since 2006 and Senior Vice President since 2000 | Chief Compliance Officer, American Century funds, ACIM and ACS (August 2006 to present). Also serves as Senior Vice President, ACS |
Charles A. Etherington (1957) | General Counsel since 2007 and Senior Vice President since 2006 | Attorney, ACC (February 1994 to present); Vice President, ACC (November 2005 to present), General Counsel, ACC (March 2007 to present); Also serves as General Counsel, ACIM, ACS, ACIS and other ACC subsidiaries; and Senior Vice President, ACIM and ACS |
C. Jean Wade (1964) | Vice President, Treasurer and Chief Financial Officer since 2012 | Vice President, ACS (February 2000 to present) |
Robert J. Leach (1966) | Vice President since 2006 and Assistant Treasurer since 2012 | Vice President, ACS (February 2000 to present) |
David H. Reinmiller (1963) | Vice President since 2000 | Attorney, ACC (January 1994 to present); Associate General Counsel, ACC (January 2001 to present). Also serves as Vice President, ACIM and ACS |
Ward D. Stauffer (1960) | Secretary since 2005 | Attorney, ACC (June 2003 to present) |
The Statement of Additional Information has additional information about the fund’s directors and is available without charge, upon request, by calling 1-800-345-2021.
33
As required by law, distributions you receive from certain IRAs, or 403(b), 457 and qualified plans are subject to federal income tax withholding, unless you elect not to have withholding apply. Tax will be withheld on the total amount withdrawn even though you may be receiving amounts that are not subject to withholding, such as nondeductible contributions. In such case, excess amounts of withholding could occur. You may adjust your withholding election so that a greater or lesser amount will be withheld.
If you don’t want us to withhold on this amount, you must notify us to not withhold the federal income tax. You may notify us in writing or in certain situations by telephone or through other electronic means. You have the right to revoke your withholding election at any time and any election you make may remain in effect until revoked by filing a new election.
Remember, even if you elect not to have income tax withheld, you are liable for paying income tax on the taxable portion of your withdrawal. If you elect not to have income tax withheld or you don’t have enough income tax withheld, you may be responsible for payment of estimated tax. You may incur penalties under the estimated tax rules if your withholding and estimated tax payments are not sufficient. You can reduce or defer the income tax on a distribution by directly or indirectly rolling such distribution over to another IRA or eligible plan. You should consult your tax advisor for additional information.
State tax will be withheld if, at the time of your distribution, your address is within one of the mandatory withholding states and you have federal income tax withheld. State taxes will be withheld from your distribution in accordance with the respective state rules.
Proxy Voting Guidelines
American Century Investment Management, Inc., the fund’s investment advisor, is responsible for exercising the voting rights associated with the securities purchased and/or held by the fund. A description of the policies and procedures the advisor uses in fulfilling this responsibility is available without charge, upon request, by calling 1-800-345-2021. It is also available on American Century Investments’ website at americancentury.com and on the Securities and Exchange Commission’s website at sec.gov. Information regarding how the investment advisor voted proxies relating to portfolio securities during the most recent 12-month period ended June 30 is available on the “About Us” page at americancentury.com. It is also available at sec.gov.
Quarterly Portfolio Disclosure
The fund files its complete schedule of portfolio holdings with the Securities and Exchange Commission (SEC) for the first and third quarters of each fiscal year on Form N-Q. The fund’s Forms N-Q are available on the SEC’s website at sec.gov, and may be reviewed and copied at the SEC’s Public Reference Room in Washington, DC. Information on the operation of the Public Reference Room may be obtained by calling 1-800-SEC-0330. The fund also makes its complete schedule of portfolio holdings for the most recent quarter of its fiscal year available on its website at americancentury.com and, upon request, by calling 1-800-345-2021.
34
Other Tax Information
The following information is provided pursuant to provisions of the Internal Revenue Code.
The fund hereby designates up to the maximum amount allowable as qualified dividend income for the fiscal year ended March 31, 2012.
For corporate taxpayers, the fund hereby designates $16,324,855, or up to the maximum amount allowable, of ordinary income distributions paid during the fiscal year ended March 31, 2012 as qualified for the corporate dividends received deduction.
The fund hereby designates $137,447,374, or up to the maximum amount allowable, as long-term capital gain distributions for the fiscal year ended March 31, 2012.
35
36
| Contact Us | americancentury.com |
| Automated Information Line | 1-800-345-8765 |
| Investor Services Representative | 1-800-345-2021 or 816-531-5575 |
| Investors Using Advisors | 1-800-378-9878 |
Business, Not-For-Profit, Employer-Sponsored Retirement Plans | 1-800-345-3533 |
Banks and Trust Companies, Broker-Dealers, Financial Professionals, Insurance Companies | 1-800-345-6488 |
| Telecommunications Device for the Deaf | 1-800-634-4113 |
American Century Capital Portfolios, Inc.
Investment Advisor:
American Century Investment Management, Inc.
Kansas City, Missouri
This report and the statements it contains are submitted for the general information of our shareholders. The report is not authorized for distribution to prospective investors unless preceded or accompanied by an effective prospectus.
©2012 American Century Proprietary Holdings, Inc. All rights reserved.
CL-ANN-75034 1205
ANNUAL REPORT MARCH 31, 2012
| Value Fund |
| President’s Letter | 2 |
| Independent Chairman’s Letter | 3 |
| Market Perspective | 4 |
| Performance | 5 |
| Portfolio Commentary | 7 |
| Fund Characteristics | 9 |
| Shareholder Fee Example | 10 |
| Schedule of Investments | 12 |
| Statement of Assets and Liabilities | 16 |
| Statement of Operations | 17 |
| Statement of Changes in Net Assets | 18 |
| Notes to Financial Statements | 19 |
| Financial Highlights | 26 |
| Report of Independent Registered Public Accounting Firm | 29 |
| Management | 30 |
| Additional Information | 33 |
Any opinions expressed in this report reflect those of the author as of the date of the report, and do not necessarily represent the opinions of American Century Investments® or any other person in the American Century Investments organization. Any such opinions are subject to change at any time based upon market or other conditions and American Century Investments disclaims any responsibility to update such opinions. These opinions may not be relied upon as investment advice and, because investment decisions made by American Century Investments funds are based on numerous factors, may not be relied upon as an indication of trading intent on behalf of any American Century Investments fund. Security examples are used for representational purposes only and are not intended as recommendations to purchase or sell securities. Performance information for comparative indices and securities is provided to American Century Investments by third party vendors. To the best of American Century Investments’ knowledge, such information is accurate at the time of printing.
Dear Investor:
Thank you for reviewing this annual report for the period ended March 31, 2012. Our report offers investment performance and portfolio information, presented with the expert perspective of our portfolio management team.
This report remains one of our most important vehicles for conveying information about fund returns, as well as market factors and strategies that affected fund performance. For additional, updated information, we encourage you to visit our website, americancentury.com. Click on the “Fund Performance” and “Insights & News” headings at the top of our Individual Investors site.
Mostly Positive U.S. Returns Belie the Period’s Volatility
U.S. market performance for the 12 months ended March 31, 2012 appeared more benign than it really was. Broadly speaking, U.S. stocks and bonds returned roughly 7-9% for the period, as indicated by the S&P 500 Index and the Barclays U.S. Aggregate Bond Index. But those solid returns masked the roller-coaster ride required to achieve them.
The reporting period began, in April 2011, with stock indices and U.S. Treasury yields at some of their highest levels since 2008, prior to the Financial Crisis plunge. These elevated levels reflected increased risk-taking as the markets priced in improving global economic growth, strong corporate earnings, and higher inflation.
This “risk-on” investing attitude switched to “risk-off” during the summer of 2011, transformed by high fuel prices, federal budget management concerns in the U.S., and the worsening sovereign debt crisis in Europe. Recessionary expectations pulled Treasury yields to record lows by September, and stock indices suffered double-digit declines from their peaks.
Sentiment switched again in the fourth quarter of 2011, as concerns about the European sovereign debt crisis and the U.S. economy eased. Renewed “risk-on” investing carried into the first quarter of 2012, boosting growth stocks and high-yield bonds in particular. But the financial markets remain subject to potentially high volatility as they continue to wrestle with uncertainties regarding Europe, the Middle East, economic strength, government budget deficits, and the U.S. presidential election. We believe strongly in adhering to a disciplined, diversified, long-term investment approach during volatile periods, and we appreciate your continued trust in us during these unsettled times.
Sincerely,
Jonathan Thomas
President and Chief Executive Officer
American Century Investments
2
Dear Fellow Shareholders,
The assets under management in American Century Investments’ funds grow through investors placing new assets in the funds and through market appreciation. Asset growth has been at near record levels over the past two calendar years as market movements were upward, the funds’ relative returns were generally favorable, and the distribution strategies implemented by fund management have been successful.
The board reviews fund performance and distribution strategies on a regular basis. Several years ago, the fund’s management team discussed with the board its plans to grow fund assets in the intermediary, institutional and international distribution channels. These distribution strategies have produced strong positive growth. The growth in the intermediary channel recognizes the funds’ strong relative investment performance and the desire of many shareholders to seek financial guidance. Investors in both the institutional and international channels appear to find the funds’ risk-based investment strategies attractive. The board continues to support fund management’s strategies to increase fund assets and will continue to work to provide the benefits of these gains to fund shareholders.
We continue to receive a steady flow of very thoughtful questions from shareholders. If there are issues that you would like the board to address please email me at dhpratt@fundboardchair.com. Thank you for your continued investment in American Century Investments funds.
Best regards,
Don Pratt
3
By Phil Davidson,
Chief Investment Officer,
U.S. Value Equity
U.S. Stocks Advanced
Despite some meaningful market volatility, U.S. stocks generated positive performance for the one-year period ended March 31, 2012. The overall advance was driven by a robust equity market rally over the last six months of the period as economic conditions improved.
After rallying throughout much of April 2011, the stock market declined sharply from May through September amid weaker economic conditions in the U.S. and an increasingly challenging sovereign debt crisis in Europe. Public debt issues in the U.S. also weighed on the market as the government wrestled with the federal debt ceiling and a major credit rating agency downgraded the credit rating of U.S. debt from AAA to AA+ in August—the first such downgrade in the country’s history.
Market sentiment shifted markedly over the last six months of the period as evidence of improving economic growth helped ease concerns about a possible recession. Most notably, employment growth showed signs of life, helping push the unemployment rate down to a three-year low. Consumer spending and manufacturing activity also picked up, and mild winter weather provided a lift to the construction industry. The situation in Europe also improved as liquidity injections from the European Central Bank and a debt restructuring agreement in Greece helped provide some stability to the Continent’s debt markets and banking sector. The end result was a steady and substantial market rally over the last six months.
Value Stocks Lagged
As the table below illustrates, large-cap stocks and growth issues led the market’s overall advance. Growth stocks benefited the most from the improving economic environment over the last half of the period, along with investors’ greater appetite for risk. Sector performance also favored growth shares over value during the period. The top-performing sectors in the S&P 500 Index included information technology and consumer discretionary, two growth-oriented sectors of the market. In contrast, the financials sector, which is the largest sector weighting in most value indices, declined for the reporting period.
| U.S. Stock Index Returns | ||||
| For the 12 months ended March 31, 2012 | ||||
| Russell 1000 Index (Large-Cap) | 7.86% | Russell 2000 Index (Small-Cap) | -0.18% | |
| Russell 1000 Growth Index | 11.02% | Russell 2000 Growth Index | 0.68% | |
| Russell 1000 Value Index | 4.79% | Russell 2000 Value Index | -1.07% | |
| Russell Midcap Index | 3.31% | |||
| Russell Midcap Growth Index | 4.43% | |||
| Russell Midcap Value Index | 2.28% | |||
4
| Total Returns as of March 31, 2012 | ||||||
| Average Annual Returns | ||||||
Ticker Symbol | 1 year | 5 years | 10 years | Since Inception | Inception Date | |
| Investor Class | TWVLX | 6.22% | 0.77% | 4.98% | 9.26% | 9/1/93 |
| Russell 3000 Value Index | — | 4.30% | -0.75% | 4.73% | 8.54%(1) | — |
| S&P 500 Index | — | 8.54% | 2.01% | 4.12% | 8.22%(1) | — |
| Institutional Class | AVLIX | 6.42% | 0.97% | 5.20% | 6.50% | 7/31/97 |
A Class(2) No sales charge* With sales charge* | TWADX | 5.95% -0.07% | 0.52% -0.65% | 4.73% 4.11% | 7.45% 7.04% | 10/2/96 |
B Class No sales charge* With sales charge* | ACBVX | 5.14% 1.14% | -0.23% -0.43% | — — | 6.70% 6.70% | 1/31/03 |
| C Class | ACLCX | 5.01% | -0.24% | 3.94% | 4.22% | 6/4/01 |
| R Class | AVURX | 5.72% | 0.27% | — | 2.99% | 7/29/05 |
| * | Sales charges include initial sales charges and contingent deferred sales charges (CDSCs), as applicable. A Class shares have a 5.75% maximum initial sales charge and may be subject to a maximum CDSC of 1.00%. B Class shares redeemed within six years of purchase are subject to a CDSC that declines from 5.00% during the first year after purchase to 0.00% the sixth year after purchase. C Class shares redeemed within 12 months of purchase are subject to a maximum CDSC of 1.00%. The SEC requires that mutual funds provide performance information net of maximum sales charges in all cases where charges could be applied. |
| (1) | Since 8/31/93, the date nearest the Investor Class’s inception for which data are available. |
| (2) | Prior to September 4, 2007, the A Class was referred to as the Advisor Class and did not have a front-end sales charge. Performance prior to that date has been adjusted to reflect this charge. |
Data presented reflect past performance. Past performance is no guarantee of future results. Current performance may be higher or lower than the performance shown. Investment return and principal value will fluctuate, and redemption value may be more or less than original cost. To obtain performance data current to the most recent month end, please call 1-800-345-2021 or visit americancentury.com. International investing involves special risks, such as political instability and currency fluctuations.
Unless otherwise indicated, performance reflects Investor Class shares; performance for other share classes will vary due to differences in fee structure. For information about other share classes available, please consult the prospectus. Data assumes reinvestment of dividends and capital gains, and none of the charts reflect the deduction of taxes that a shareholder would pay on fund distributions or the redemption of fund shares. Returns for the indices are provided for comparison. The fund’s total returns include operating expenses (such as transaction costs and management fees) that reduce returns, while the total returns of the indices do not.
5
| Growth of $10,000 Over 10 Years |
| $10,000 investment made March 31, 2002 |
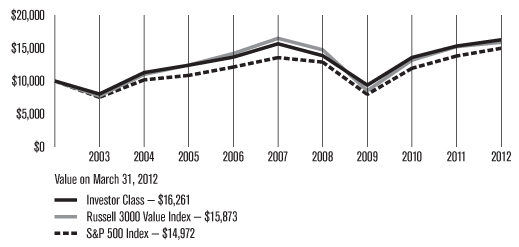
| Total Annual Fund Operating Expenses | |||||
| Investor Class | Institutional Class | A Class | B Class | C Class | R Class |
| 1.01% | 0.81% | 1.26% | 2.01% | 2.01% | 1.51% |
The total annual fund operating expenses shown is as stated in the fund’s prospectus current as of the date of this report. The prospectus may vary from the expense ratio shown elsewhere in this report because it is based on a different time period, includes acquired fund fees and expenses, and, if applicable, does not include fee waivers or expense reimbursements.
Data presented reflect past performance. Past performance is no guarantee of future results. Current performance may be higher or lower than the performance shown. Investment return and principal value will fluctuate, and redemption value may be more or less than original cost. To obtain performance data current to the most recent month end, please call 1-800-345-2021 or visit americancentury.com. International investing involves special risks, such as political instability and currency fluctuations.
Unless otherwise indicated, performance reflects Investor Class shares; performance for other share classes will vary due to differences in fee structure. For information about other share classes available, please consult the prospectus. Data assumes reinvestment of dividends and capital gains, and none of the charts reflect the deduction of taxes that a shareholder would pay on fund distributions or the redemption of fund shares. Returns for the indices are provided for comparison. The fund’s total returns include operating expenses (such as transaction costs and management fees) that reduce returns, while the total returns of the indices do not.
6
Portfolio Managers: Michael Liss, Kevin Toney, and Phil Davidson
Performance Summary
Value returned 6.22%* for the 12 months ended March 31, 2012. By comparison, its benchmark, the Russell 3000 Value Index returned 4.30%. The broader market, as measured by the S&P 500 Index, returned 8.54%. The portfolio’s return reflects operating expenses, while the indices’ returns do not. The average return for Morningstar’s Large Cap Value category (its performance, like Value’s, reflects operating expenses) was 3.93%.**
The U.S. stock market posted a gain during the one-year reporting period, largely as a result of its strong performance during the first quarter of 2012. For most of the 12-month period, investors were preoccupied with Europe’s financial woes, which threatened to spread from Greece to other nations and seemed likely to cause problems for European banks. Lackluster U.S. economic growth and the downgrade of U.S. debt by Standard & Poor’s Ratings also dampened market sentiment. Investor risk appetite improved near the end of 2011 when the U.S. economy, proving surprisingly resilient, returned to its slow-growth path. Employers added new jobs, and corporate earnings remained solid. Investors also grew more optimistic as the European Central Bank provided inexpensive loans to European banks and the financial crisis eased. In this environment, growth stocks outperformed value stocks across the capitalization spectrum. For the reporting period, Value’s investment approach, which emphasizes higher-quality businesses with sound balance sheets, provided positive absolute results in eight of the 10 sectors in which it was invested. It also outperformed on a relative basis. Positions in the consumer staples, financials, and telecommunication services sectors added to performance. Industrials and consumer discretionary detracted.
We carefully manage this portfolio for long-term results. Since Value’s inception on September 1, 1993, the portfolio has produced an average annual return of 9.26%, topping the returns for that period for Morningstar’s Large Cap Value category average, the Russell 3000 Value Index, and the S&P 500 Index (see the performance information on pages 5 and 6 or in footnotes below).
Consumer Staples Contributed
Value’s overweight in consumer staples added to relative performance as investors gravitated to more defensive stocks. The portfolio benefited from our focus on high-quality names, particularly among food and household products stocks. Many of these stocks offer attractive dividend yields. A notable contributor was Kraft Foods. Kraft, which reported better-than-expected profits, has been able to raise consumer prices, offsetting higher commodities costs. Kraft is also planning to split itself into two companies — a global snack company to capitalize on growth opportunities for products such as cookies and chewing gum, and a North American grocery business that will focus selling staples such as cheese and coffee.
| * | All fund returns referenced in this commentary are for Investor Class shares. |
| ** | The average returns for Morningstar’s Large Cap Value category were -0.24% and 4.09% for the five- and ten-year periods ended March 31, 2012, respectively, and 7.64% from October 1, 1993, the date nearest the Investor Class’s inception for which data are available, through March 31, 2012. © 2012 Morningstar, Inc. All Rights Reserved. The information contained herein: (1) is proprietary to Morningstar and/or its content providers; (2) may not be copied or distributed; and (3) is not warranted to be accurate, complete or timely. Neither Morningstar nor its content providers are responsible for any damages or losses arising from any use of this information. |
7
Financials Enhanced Performance
Strong stock selection in financials, one of three sectors to post negative performance in the benchmark, contributed to Value’s relative results. Within diversified financial services, the portfolio did not own some of the more volatile names, such as Citigroup. In the insurance industry, the portfolio held Transatlantic Holdings, a global reinsurance company. Shares of Transatlantic surged on news that it had entered a merger agreement with Allied World Assurance Co. Holdings. The
stock continued to perform well as several other suitors made additional offers. Ultimately, Transatlantic agreed to be acquired by Alleghany Corp.
Telecommunication Services and Health Care Added Value
In telecommunication services, security selection boosted results. The portfolio’s results were largely a question of what it didn’t own. For example, Value had no exposure to mobile phone company, Sprint-Nextel. Sprint-Nextel’s earnings have been hindered by discounting and the low margins it earns on smart phone sales.
In health care, the strongest performing sector in the benchmark, an overweight position contributed to performance. The portfolio benefited from a position in Johnson & Johnson (J&J), which advanced along with other pharmaceutical names during the reporting period. J&J continues to work on resolving manufacturing issues that have resulted in costly recalls, and the company seems likely to benefit from a change in management.
Industrials Hampered Results
Although an overweight in industrials was advantageous, security selection hindered relative performance. A key detractor was Koninklijke Philips Electronics. The Dutch company, which does a significant amount of business in Europe, has been hampered by the slowdown in the European economy. In addition, the new management team’s turnaround plan is progressing more slowly than expected.
An overweight in the airlines industry, which underperformed in the benchmark, also slowed relative progress. Airline companies have experienced a decline in earnings, largely because they cannot raise airfares enough to offset higher fuel costs. More specifically, the portfolio’s overweight in Southwest Airlines detracted from performance.
Consumer Discretionary Detracted
The portfolio’s mix of consumer discretionary stocks dampened relative results. Value was underweight media companies based on our belief that long-term secular pressures, such as changing technology and consumer preferences, would continue to weigh on their performance. However, the media industry posted strong gains on improving advertising revenues, driven by the economic recovery and the turnaround in the U.S. auto market.
Outlook
We will continue to follow our disciplined, bottom-up process, selecting securities one at a time for the portfolio. As of March 31, 2012, we see opportunities in health care, industrials, energy, and consumer staples, reflected by our overweight positions in these sectors relative to the benchmark. Our fundamental analysis and valuation work is also directing us toward smaller weightings in financials, utilities, and information technology stocks.
8
| MARCH 31, 2012 | |
| Top Ten Holdings | % of net assets |
| JPMorgan Chase & Co. | 3.1% |
| General Electric Co. | 3.0% |
| Total S.A. | 2.8% |
| Pfizer, Inc. | 2.7% |
| Procter & Gamble Co. (The) | 2.6% |
| AT&T, Inc. | 2.5% |
| Northern Trust Corp. | 2.5% |
| Chevron Corp. | 2.4% |
| Johnson & Johnson | 2.2% |
| Wells Fargo & Co. | 2.1% |
| Top Five Industries | % of net assets |
| Oil, Gas and Consumable Fuels | 11.8% |
| Pharmaceuticals | 8.0% |
| Insurance | 6.5% |
| Commercial Banks | 6.3% |
| Capital Markets | 5.6% |
| Types of Investments in Portfolio | % of net assets |
| Domestic Common Stocks | 85.8% |
| Foreign Common Stocks** | 8.9% |
| Total Common Stocks | 94.7% |
| Temporary Cash Investments | 5.3% |
| Other Assets and Liabilities | —* |
| * | Category is less than 0.05% of total net assets. |
| ** | Includes depositary shares, dual listed securities and foreign ordinary shares. |
9
Fund shareholders may incur two types of costs: (1) transaction costs, including sales charges (loads) on purchase payments and redemption/exchange fees; and (2) ongoing costs, including management fees; distribution and service (12b-1) fees; and other fund expenses. This example is intended to help you understand your ongoing costs (in dollars) of investing in your fund and to compare these costs with the ongoing cost of investing in other mutual funds.
The example is based on an investment of $1,000 made at the beginning of the period and held for the entire period from October 1, 2011 to March 31, 2012.
Actual Expenses
The table provides information about actual account values and actual expenses for each class. You may use the information, together with the amount you invested, to estimate the expenses that you paid over the period. First, identify the share class you own. Then simply divide your account value by $1,000 (for example, an $8,600 account value divided by $1,000 = 8.6), then multiply the result by the number under the heading “Expenses Paid During Period” to estimate the expenses you paid on your account during this period.
If you hold Investor Class shares of any American Century Investments fund, or Institutional Class shares of the American Century Diversified Bond Fund, in an American Century Investments account (i.e., not a financial intermediary or retirement plan account), American Century Investments may charge you a $12.50 semiannual account maintenance fee if the value of those shares is less than $10,000. We will redeem shares automatically in one of your accounts to pay the $12.50 fee. In determining your total eligible investment amount, we will include your investments in all personal accounts (including American Century Investments Brokerage accounts) registered under your Social Security number. Personal accounts include individual accounts, joint accounts, UGMA/UTMA accounts, personal trusts, Coverdell Education Savings Accounts and IRAs (including traditional, Roth, Rollover, SEP-, SARSEP- and SIMPLE-IRAs), and certain other retirement accounts. If you have only business, business retirement, employer-sponsored or American Century Investments Brokerage accounts, you are currently not subject to this fee. If you are subject to the Account Maintenance Fee, your account value could be reduced by the fee amount.
Hypothetical Example for Comparison Purposes
The table also provides information about hypothetical account values and hypothetical expenses based on the actual expense ratio of each class of your fund and an assumed rate of return of 5% per year before expenses, which is not the actual return of a fund’s share class. The hypothetical account values and expenses may not be used to estimate the actual ending account balance or expenses you paid for the period. You may use this information to compare the ongoing costs of investing in your fund and other funds. To do so, compare this 5% hypothetical example with the 5% hypothetical examples that appear in the shareholder reports of the other funds.
10
Please note that the expenses shown in the table are meant to highlight your ongoing costs only and do not reflect any transactional costs, such as sales charges (loads) or redemption/exchange fees. Therefore, the table is useful in comparing ongoing costs only, and will not help you determine the relative total costs of owning different funds. In addition, if these transactional costs were included, your costs would have been higher.
Beginning Account Value 10/1/11 | Ending Account Value 3/31/12 | Expenses Paid During Period(1) 10/1/11 – 3/31/12 | Annualized Expense Ratio(1) | |
| Actual | ||||
| Investor Class | $1,000 | $1,240.10 | $5.60 | 1.00% |
| Institutional Class | $1,000 | $1,243.30 | $4.49 | 0.80% |
| A Class | $1,000 | $1,241.10 | $7.00 | 1.25% |
| B Class | $1,000 | $1,234.30 | $11.17 | 2.00% |
| C Class | $1,000 | $1,234.10 | $11.17 | 2.00% |
| R Class | $1,000 | $1,237.50 | $8.39 | 1.50% |
| Hypothetical | ||||
| Investor Class | $1,000 | $1,020.00 | $5.05 | 1.00% |
| Institutional Class | $1,000 | $1,021.00 | $4.04 | 0.80% |
| A Class | $1,000 | $1,018.75 | $6.31 | 1.25% |
| B Class | $1,000 | $1,015.00 | $10.07 | 2.00% |
| C Class | $1,000 | $1,015.00 | $10.07 | 2.00% |
| R Class | $1,000 | $1,017.50 | $7.57 | 1.50% |
| (1) | Expenses are equal to the class’s annualized expense ratio listed in the table above, multiplied by the average account value over the period, multiplied by 183, the number of days in the most recent fiscal half-year, divided by 366, to reflect the one-half year period. |
11
| Shares | Value | |||||||
| Common Stocks — 94.7% | ||||||||
| AEROSPACE AND DEFENSE — 1.4% | ||||||||
| General Dynamics Corp. | 91,612 | $6,722,488 | ||||||
| L-3 Communications Holdings, Inc. | 103,132 | 7,298,652 | ||||||
| Northrop Grumman Corp. | 142,390 | 8,697,181 | ||||||
| Raytheon Co. | 174,274 | 9,198,182 | ||||||
| 31,916,503 | ||||||||
| AIR FREIGHT AND LOGISTICS — 0.3% | ||||||||
| United Parcel Service, Inc., Class B | 69,311 | 5,594,784 | ||||||
| AIRLINES — 0.8% | ||||||||
| Southwest Airlines Co. | 2,234,897 | 18,415,551 | ||||||
| AUTOMOBILES — 1.7% | ||||||||
General Motors Co.(1) | 373,337 | 9,576,094 | ||||||
| Honda Motor Co., Ltd. | 214,000 | 8,131,328 | ||||||
| Toyota Motor Corp. | 449,300 | 19,379,014 | ||||||
| 37,086,436 | ||||||||
| BEVERAGES — 1.3% | ||||||||
| Dr Pepper Snapple Group, Inc. | 610,015 | 24,528,703 | ||||||
| PepsiCo, Inc. | 50,846 | 3,373,632 | ||||||
| 27,902,335 | ||||||||
| CAPITAL MARKETS — 5.6% | ||||||||
| Charles Schwab Corp. (The) | 1,446,408 | 20,784,883 | ||||||
| Franklin Resources, Inc. | 62,268 | 7,723,100 | ||||||
| Goldman Sachs Group, Inc. (The) | 174,027 | 21,643,738 | ||||||
| Northern Trust Corp. | 1,171,079 | 55,567,699 | ||||||
| State Street Corp. | 405,451 | 18,448,020 | ||||||
| 124,167,440 | ||||||||
| COMMERCIAL BANKS — 6.3% | ||||||||
| BB&T Corp. | 71,011 | 2,229,035 | ||||||
| Comerica, Inc. | 551,532 | 17,847,576 | ||||||
| Commerce Bancshares, Inc. | 279,990 | 11,345,195 | ||||||
| PNC Financial Services Group, Inc. | 580,549 | 37,439,605 | ||||||
| U.S. Bancorp | 837,989 | 26,547,491 | ||||||
| Wells Fargo & Co. | 1,339,904 | 45,744,323 | ||||||
| 141,153,225 | ||||||||
| COMMERCIAL SERVICES AND SUPPLIES — 3.1% | ||||||||
| Avery Dennison Corp. | 274,490 | 8,270,384 | ||||||
| Republic Services, Inc. | 1,439,126 | 43,979,690 | ||||||
| Waste Management, Inc. | 478,552 | 16,730,178 | ||||||
| 68,980,252 | ||||||||
| COMMUNICATIONS EQUIPMENT — 1.7% | ||||||||
| Cisco Systems, Inc. | 1,840,078 | 38,917,650 | ||||||
| COMPUTERS AND PERIPHERALS — 1.5% | ||||||||
| Diebold, Inc. | 166,029 | 6,395,437 | ||||||
| Hewlett-Packard Co. | 980,896 | 23,374,752 | ||||||
QLogic Corp.(1) | 166,389 | 2,955,068 | ||||||
| 32,725,257 | ||||||||
| CONSTRUCTION MATERIALS — 0.1% | ||||||||
| Martin Marietta Materials, Inc. | 36,910 | 3,160,603 | ||||||
| CONTAINERS AND PACKAGING — 0.7% | ||||||||
| Bemis Co., Inc. | 434,510 | 14,030,328 | ||||||
| Sonoco Products Co. | 78,865 | 2,618,318 | ||||||
| 16,648,646 | ||||||||
| DIVERSIFIED FINANCIAL SERVICES — 3.1% | ||||||||
| JPMorgan Chase & Co. | 1,485,867 | 68,320,165 | ||||||
| DIVERSIFIED TELECOMMUNICATION SERVICES — 3.3% | ||||||||
| AT&T, Inc. | 1,788,309 | 55,848,890 | ||||||
| CenturyLink, Inc. | 260,880 | 10,083,012 | ||||||
| Verizon Communications, Inc. | 187,352 | 7,162,467 | ||||||
| 73,094,369 | ||||||||
| ELECTRIC UTILITIES — 2.1% | ||||||||
| Great Plains Energy, Inc. | 273,808 | 5,550,088 | ||||||
| NV Energy, Inc. | 581,191 | 9,368,799 | ||||||
| Westar Energy, Inc. | 1,168,175 | 32,627,128 | ||||||
| 47,546,015 | ||||||||
| ELECTRICAL EQUIPMENT — 0.9% | ||||||||
ABB Ltd. ADR(1) | 244,306 | 4,986,286 | ||||||
| Emerson Electric Co. | 160,260 | 8,362,367 | ||||||
| Hubbell, Inc., Class B | 70,680 | 5,554,034 | ||||||
| 18,902,687 | ||||||||
| ELECTRONIC EQUIPMENT, INSTRUMENTS AND COMPONENTS — 0.5% | ||||||||
| Molex, Inc. | 317,450 | 8,926,694 | ||||||
| TE Connectivity Ltd. | 59,428 | 2,183,979 | ||||||
| 11,110,673 | ||||||||
| ENERGY EQUIPMENT AND SERVICES — 0.3% | ||||||||
| Halliburton Co. | 172,968 | 5,740,808 | ||||||
| FOOD AND STAPLES RETAILING — 1.7% | ||||||||
| CVS Caremark Corp. | 314,292 | 14,080,281 | ||||||
| SYSCO Corp. | 412,529 | 12,318,116 | ||||||
| Wal-Mart Stores, Inc. | 202,219 | 12,375,803 | ||||||
| 38,774,200 | ||||||||
12
| Shares | Value | |||||||
| FOOD PRODUCTS — 2.1% | ||||||||
| Campbell Soup Co. | 134,728 | $4,560,543 | ||||||
| General Mills, Inc. | 152,233 | 6,005,592 | ||||||
| Kellogg Co. | 82,235 | 4,410,263 | ||||||
| Kraft Foods, Inc., Class A | 615,755 | 23,404,847 | ||||||
Ralcorp Holdings, Inc.(1) | 66,701 | 4,941,877 | ||||||
| Unilever NV CVA | 91,241 | 3,104,872 | ||||||
| 46,427,994 | ||||||||
| HEALTH CARE EQUIPMENT AND SUPPLIES — 5.2% | ||||||||
| Becton, Dickinson and Co. | 228,940 | 17,777,191 | ||||||
Boston Scientific Corp.(1) | 3,230,149 | 19,316,291 | ||||||
CareFusion Corp.(1) | 1,397,707 | 36,242,542 | ||||||
| Medtronic, Inc. | 426,758 | 16,724,646 | ||||||
| Stryker Corp. | 123,124 | 6,830,920 | ||||||
| Zimmer Holdings, Inc. | 285,901 | 18,377,716 | ||||||
| 115,269,306 | ||||||||
| HEALTH CARE PROVIDERS AND SERVICES — 2.1% | ||||||||
| Aetna, Inc. | 180,368 | 9,047,259 | ||||||
| CIGNA Corp. | 147,752 | 7,276,786 | ||||||
LifePoint Hospitals, Inc.(1) | 290,369 | 11,452,153 | ||||||
| UnitedHealth Group, Inc. | 333,730 | 19,670,046 | ||||||
| 47,446,244 | ||||||||
| HOTELS, RESTAURANTS AND LEISURE — 1.7% | ||||||||
| Carnival Corp. | 196,967 | 6,318,702 | ||||||
| International Game Technology | 453,889 | 7,620,796 | ||||||
| International Speedway Corp., Class A | 494,847 | 13,732,004 | ||||||
| Speedway Motorsports, Inc. | 597,169 | 11,155,117 | ||||||
| 38,826,619 | ||||||||
| HOUSEHOLD DURABLES — 0.6% | ||||||||
Toll Brothers, Inc.(1) | 88,786 | 2,129,976 | ||||||
| Whirlpool Corp. | 154,831 | 11,900,311 | ||||||
| 14,030,287 | ||||||||
| HOUSEHOLD PRODUCTS — 3.3% | ||||||||
| Clorox Co. | 67,630 | 4,649,562 | ||||||
| Kimberly-Clark Corp. | 159,755 | 11,804,297 | ||||||
| Procter & Gamble Co. (The) | 845,860 | 56,850,251 | ||||||
| 73,304,110 | ||||||||
| INDUSTRIAL CONGLOMERATES — 4.5% | ||||||||
| 3M Co. | 49,167 | 4,386,188 | ||||||
| General Electric Co. | 3,348,867 | 67,211,761 | ||||||
| Koninklijke Philips Electronics NV | 1,044,615 | 21,176,680 | ||||||
| Tyco International Ltd. | 123,410 | 6,933,174 | ||||||
| 99,707,803 | ||||||||
| INSURANCE — 6.5% | ||||||||
| ACE Ltd. | 50,616 | 3,705,091 | ||||||
| Allstate Corp. (The) | 771,954 | 25,412,726 | ||||||
| Aon Corp. | 108,177 | 5,307,164 | ||||||
Berkshire Hathaway, Inc., Class A(1) | 189 | 23,039,100 | ||||||
| HCC Insurance Holdings, Inc. | 400,140 | 12,472,364 | ||||||
| Marsh & McLennan Cos., Inc. | 671,700 | 22,025,043 | ||||||
| MetLife, Inc. | 387,593 | 14,476,599 | ||||||
| Prudential Financial, Inc. | 144,885 | 9,184,260 | ||||||
| Torchmark Corp. | 106,632 | 5,315,605 | ||||||
| Travelers Cos., Inc. (The) | 271,830 | 16,092,336 | ||||||
| Unum Group | 273,934 | 6,705,904 | ||||||
| 143,736,192 | ||||||||
| IT SERVICES — 0.1% | ||||||||
| Visa, Inc., Class A | 25,543 | 3,014,074 | ||||||
| METALS AND MINING — 0.9% | ||||||||
| Barrick Gold Corp. | 205,517 | 8,935,879 | ||||||
| Freeport-McMoRan Copper & Gold, Inc. | 209,223 | 7,958,843 | ||||||
| Newmont Mining Corp. | 81,229 | 4,164,611 | ||||||
| 21,059,333 | ||||||||
| MULTI-UTILITIES — 2.3% | ||||||||
| PG&E Corp. | 627,997 | 27,261,350 | ||||||
| Xcel Energy, Inc. | 909,465 | 24,073,538 | ||||||
| 51,334,888 | ||||||||
| MULTILINE RETAIL — 1.1% | ||||||||
| Target Corp. | 400,535 | 23,339,174 | ||||||
| OIL, GAS AND CONSUMABLE FUELS — 11.8% | ||||||||
| Apache Corp. | 21,052 | 2,114,463 | ||||||
| BP plc | 730,928 | 5,407,765 | ||||||
| BP plc ADR | 45,965 | 2,068,425 | ||||||
| Chevron Corp. | 494,022 | 52,978,919 | ||||||
| EQT Corp. | 117,599 | 5,669,448 | ||||||
| Exxon Mobil Corp. | 387,771 | 33,631,379 | ||||||
| Imperial Oil Ltd. | 728,506 | 33,100,298 | ||||||
| Murphy Oil Corp. | 150,513 | 8,469,366 | ||||||
| Peabody Energy Corp. | 260,666 | 7,548,887 | ||||||
Southwestern Energy Co.(1) | 450,921 | 13,798,183 | ||||||
| Total S.A. | 1,227,426 | 62,599,554 | ||||||
Ultra Petroleum Corp.(1) | 1,582,641 | 35,815,166 | ||||||
| 263,201,853 | ||||||||
| PHARMACEUTICALS — 8.0% | ||||||||
| Bristol-Myers Squibb Co. | 371,010 | 12,521,587 | ||||||
| Eli Lilly & Co. | 305,910 | 12,318,996 | ||||||
Hospira, Inc.(1) | 142,160 | 5,315,362 | ||||||
| Johnson & Johnson | 757,184 | 49,943,857 | ||||||
| Merck & Co., Inc. | 985,580 | 37,846,272 | ||||||
| Pfizer, Inc. | 2,660,283 | 60,282,013 | ||||||
| 178,228,087 | ||||||||
13
| Shares | Value | |||||||
| REAL ESTATE INVESTMENT TRUSTS (REITs) — 0.1% | ||||||||
| Weyerhaeuser Co. | 131,330 | $2,878,754 | ||||||
| SEMICONDUCTORS AND SEMICONDUCTOR EQUIPMENT — 3.0% | ||||||||
| Applied Materials, Inc. | 2,145,388 | 26,688,627 | ||||||
| Intel Corp. | 1,172,668 | 32,963,697 | ||||||
Marvell Technology Group Ltd.(1) | 357,401 | 5,621,918 | ||||||
| Texas Instruments, Inc. | 63,882 | 2,147,074 | ||||||
| 67,421,316 | ||||||||
| SOFTWARE — 0.3% | ||||||||
| Oracle Corp. | 263,972 | 7,697,424 | ||||||
| SPECIALTY RETAIL — 3.3% | ||||||||
| Lowe’s Cos., Inc. | 1,426,191 | 44,753,873 | ||||||
| Staples, Inc. | 1,763,494 | 28,533,333 | ||||||
| 73,287,206 | ||||||||
| THRIFTS AND MORTGAGE FINANCE — 0.9% | ||||||||
| Hudson City Bancorp., Inc. | 2,654,318 | 19,403,065 | ||||||
| WIRELESS TELECOMMUNICATION SERVICES — 0.5% | ||||||||
| Rogers Communications, Inc., Class B | 278,899 | 11,072,636 | ||||||
TOTAL COMMON STOCKS (Cost $1,855,712,764) | 2,110,843,964 | |||||||
| Temporary Cash Investments — 5.3% | ||||||||
Repurchase Agreement, Bank America Merrill Lynch, (collateralized by various U.S. Treasury obligations, 6.125%, 11/15/27, valued at $42,798,330), in a joint trading account at 0.01%, dated 3/30/12, due 4/2/12 (Delivery value $41,917,705) | $41,917,670 | |||||||
Repurchase Agreement, Credit Suisse First Boston, Inc., (collateralized by various U.S. Treasury obligations, 4.375%, 5/15/41, valued at $26,688,669), in a joint trading account at 0.03%, dated 3/30/12, due 4/2/12 (Delivery value $26,198,609) | 26,198,544 | |||||||
Repurchase Agreement, Goldman Sachs & Co., (collateralized by various U.S. Treasury obligations, 4.50%, 5/15/38, valued at $32,129,892), in a joint trading account at 0.03%, dated 3/30/12, due 4/2/12 (Delivery value $31,438,331) | 31,438,252 | |||||||
| SSgA U.S. Government Money Market Fund | 17,795,810 | 17,795,810 | ||||||
TOTAL TEMPORARY CASH INVESTMENTS (Cost $117,350,276) | 117,350,276 | |||||||
TOTAL INVESTMENT SECURITIES — 100.0% (Cost $1,973,063,040) | 2,228,194,240 | |||||||
OTHER ASSETS AND LIABILITIES† | 97,523 | |||||||
| TOTAL NET ASSETS — 100.0% | $2,228,291,763 | |||||||
| Forward Foreign Currency Exchange Contracts | |||||||||||||
| Contracts to Buy | Counterparty | Settlement Date | Value | Unrealized Gain (Loss) | |||||||||
| 103,879 | GBP for USD | Credit Suisse AG | 4/30/12 | $166,125 | $729 | ||||||||
(Value on Settlement Date $165,396)
| Contracts to Sell | Counterparty | Settlement Date | Value | Unrealized Gain (Loss) | |||||||||
| 39,782,530 | CAD for USD | UBS AG | 4/30/12 | $39,862,228 | $34,006 | ||||||||
| 3,409,675 | CHF for USD | Credit Suisse AG | 4/30/12 | 3,778,326 | (17,088 | ) | |||||||
| 48,224,374 | EUR for USD | UBS AG | 4/30/12 | 64,324,209 | (156,375 | ) | |||||||
| 3,639,579 | GBP for USD | Credit Suisse AG | 4/30/12 | 5,820,494 | (38,841 | ) | |||||||
| 1,737,945,000 | JPY for USD | Credit Suisse AG | 4/27/12 | 21,001,428 | (68,637 | ) | |||||||
| $134,786,685 | $(246,935 | ) | |||||||||||
(Value on Settlement Date $134,539,750)
| Futures Contracts | |||||||||||||
| Contracts Purchased | Expiration Date | Underlying Face Amount at Value | Unrealized Gain (Loss) | ||||||||||
| 996 | S&P 500 E-Mini | June 2012 | $69,879,360 | $2,694,891 | |||||||||
14
Notes to Schedule of Investments
ADR = American Depositary Receipt
CAD = Canadian Dollar
CHF = Swiss Franc
CVA = Certificaten Van Aandelen
EUR = Euro
GBP = British Pound
JPY = Japanese Yen
USD = United States Dollar
† Category is less than 0.05% of total net assets.
(1) Non-income producing.
See Notes to Financial Statements.
15
| MARCH 31, 2012 | ||||
| Assets | ||||
| Investment securities, at value (cost of $1,973,063,040) | $2,228,194,240 | |||
| Cash | 144,563 | |||
| Foreign currency holdings, at value (cost of $59,576) | 59,576 | |||
| Deposits with broker for futures contracts | 3,486,000 | |||
| Receivable for investments sold | 4,502,779 | |||
| Receivable for capital shares sold | 1,614,783 | |||
| Receivable for variation margin on futures contracts | 259,533 | |||
| Unrealized gain on forward foreign currency exchange contracts | 34,735 | |||
| Dividends and interest receivable | 4,712,129 | |||
| Other assets | 128,038 | |||
| 2,243,136,376 | ||||
| Liabilities | ||||
| Payable for investments purchased | 10,492,184 | |||
| Payable for capital shares redeemed | 2,172,868 | |||
| Unrealized loss on forward foreign currency exchange contracts | 280,941 | |||
| Accrued management fees | 1,825,982 | |||
| Distribution and service fees payable | 72,638 | |||
| 14,844,613 | ||||
| Net Assets | $2,228,291,763 | |||
| Net Assets Consist of: | ||||
| Capital (par value and paid-in surplus) | $2,343,370,177 | |||
| Undistributed net investment income | 4,732,951 | |||
| Accumulated net realized loss | (377,392,667 | ) | ||
| Net unrealized appreciation | 257,581,302 | |||
| $2,228,291,763 | ||||
| Net assets | Shares outstanding | Net asset value per share | |
| Investor Class, $0.01 Par Value | $1,811,710,113 | 290,852,209 | $6.23 |
| Institutional Class, $0.01 Par Value | $126,086,499 | 20,218,354 | $6.24 |
| A Class, $0.01 Par Value | $255,777,063 | 41,082,886 | $6.23* |
| B Class, $0.01 Par Value | $2,282,905 | 367,737 | $6.21 |
| C Class, $0.01 Par Value | $11,194,125 | 1,817,506 | $6.16 |
| R Class, $0.01 Par Value | $21,241,058 | 3,411,378 | $6.23 |
*Maximum offering price $6.61 (net asset value divided by 0.9425).
See Notes to Financial Statements.
16
| YEAR ENDED MARCH 31, 2012 | ||||
| Investment Income (Loss) | ||||
| Income: | ||||
| Dividends (net of foreign taxes withheld of $986,155) | $56,482,678 | |||
| Interest | 23,642 | |||
| 56,506,320 | ||||
| Expenses: | ||||
| Management fees | 20,482,327 | |||
| Distribution and service fees: | ||||
| A Class | 532,712 | |||
| B Class | 24,292 | |||
| C Class | 78,651 | |||
| R Class | 91,142 | |||
| Directors’ fees and expenses | 88,142 | |||
| Other expenses | 5,158 | |||
| 21,302,424 | ||||
| Net investment income (loss) | 35,203,896 | |||
| Realized and Unrealized Gain (Loss) | ||||
| Net realized gain (loss) on: | ||||
| Investment transactions | 63,499,717 | |||
| Futures contract transactions | 6,708,956 | |||
| Foreign currency transactions | 4,323,312 | |||
| 74,531,985 | ||||
| Change in net unrealized appreciation (depreciation) on: | ||||
| Investments | 26,288,519 | |||
| Futures contracts | 2,694,891 | |||
| Translation of assets and liabilities in foreign currencies | (127,882 | ) | ||
| 28,855,528 | ||||
| Net realized and unrealized gain (loss) | 103,387,513 | |||
| Net Increase (Decrease) in Net Assets Resulting from Operations | $138,591,409 | |||
See Notes to Financial Statements.
17
| YEARS ENDED MARCH 31, 2012 AND MARCH 31, 2011 | |||||||
| Increase (Decrease) in Net Assets | March 31, 2012 | March 31, 2011 | |||||
| Operations | |||||||
| Net investment income (loss) | $35,203,896 | $38,209,245 | |||||
| Net realized gain (loss) | 74,531,985 | 130,675,664 | |||||
| Change in net unrealized appreciation (depreciation) | 28,855,528 | 108,354,740 | |||||
| Net increase (decrease) in net assets resulting from operations | 138,591,409 | 277,239,649 | |||||
| Distributions to Shareholders | |||||||
| From net investment income: | |||||||
| Investor Class | (28,942,467 | ) | (30,338,911 | ) | |||
| Institutional Class | (4,266,772 | ) | (4,591,088 | ) | |||
| A Class | (3,188,642 | ) | (2,911,109 | ) | |||
| B Class | (22,177 | ) | (34,586 | ) | |||
| C Class | (68,873 | ) | (81,713 | ) | |||
| R Class | (233,735 | ) | (190,034 | ) | |||
| Decrease in net assets from distributions | (36,722,666 | ) | (38,147,441 | ) | |||
| Capital Share Transactions | |||||||
| Net increase (decrease) in net assets from capital share transactions | (10,870,097 | ) | 275,659,606 | ||||
| Net increase (decrease) in net assets | 90,998,646 | 514,751,814 | |||||
| Net Assets | |||||||
| Beginning of period | 2,137,293,117 | 1,622,541,303 | |||||
| End of period | $2,228,291,763 | $2,137,293,117 | |||||
| Undistributed net investment income | $4,732,951 | $5,276,817 | |||||
See Notes to Financial Statements.
18
MARCH 31, 2012
1. Organization
American Century Capital Portfolios, Inc. (the corporation) is registered under the Investment Company Act of 1940, as amended (the 1940 Act), as an open-end management investment company and is organized as a Maryland corporation. Value Fund (the fund) is one fund in a series issued by the corporation. The fund is diversified as defined under the 1940 Act. The fund’s investment objective is to seek long-term capital growth. Income is a secondary objective. The fund pursues its objectives by investing in stocks of companies of all sizes that management believes to be undervalued at the time
of purchase.
The fund is authorized to issue the Investor Class, the Institutional Class, the A Class, the B Class, the C Class and the R Class. The A Class may incur an initial sales charge. The A Class, B Class and C Class may be subject to a contingent deferred sales charge. The share classes differ principally in their respective sales charges and distribution and shareholder servicing expenses and arrangements. The Institutional Class is made available to institutional shareholders or through financial intermediaries whose clients do not require the same level of shareholder and administrative services as shareholders of other classes. As a result, the Institutional Class is charged a lower unified management fee.
2. Significant Accounting Policies
The following is a summary of significant accounting policies consistently followed by the fund in preparation of its financial statements. The financial statements are prepared in conformity with accounting principles generally accepted in the United States of America, which may require management to make certain estimates and assumptions at the date of the financial statements. Actual results could differ from these estimates.
Investment Valuations — The fund determines the fair value of its investments and computes its net asset value per share as of the close of regular trading (usually 4 p.m. Eastern time) on the New York Stock Exchange (NYSE) on each day the NYSE is open.
Equity securities that are listed or traded on a domestic securities exchange are valued at the last reported sales price or at the official closing price as provided by the exchange. Equity securities traded on foreign securities exchanges are typically valued at the closing price on the exchange where primarily traded or as of the close of the NYSE, if that is earlier. If no last sales price is reported, or if local convention or regulation so provides, the mean of the latest bid and asked prices is used. Depending on local convention or regulation, securities traded over-the-counter are valued at the mean of the latest bid and asked prices, the last sales price, or the official closing price. In its determination of fair value, the fund may review several factors including: market information specific to a security; news developments in U.S. and foreign markets; the performance of particular U.S. and foreign securities, indices, comparable securities, American Depositary Receipts, Exchange-Traded Funds, and other relevant market indicators.
Debt securities maturing within 60 days at the time of purchase may be valued at cost, plus or minus any amortized discount or premium or at the evaluated mean as provided by an independent pricing service. Evaluated mean prices are commonly derived through utilization of market models, which may consider, among other factors, trade data, quotations from dealers and active market makers, relevant yield curve and spread data, related sector levels, creditworthiness, and other relevant market information on the same or comparable securities.
Investments in open-end management investment companies are valued at the reported net asset value per share. Repurchase agreements are valued at cost. Exchange-traded futures contracts are valued at the settlement price as provided by the appropriate clearing corporation. Forward foreign currency exchange contracts are valued at the mean of the latest bid and asked prices of the forward currency rates as provided by an independent pricing service.
19
The value of investments initially expressed in foreign currencies is translated into U.S. dollars at prevailing exchange rates.
If the fund determines that the market price for a portfolio security is not readily available or the valuation methods mentioned above do not reflect a security’s fair value, such security is valued as determined in good faith by the Board of Directors or its designee, in accordance with procedures adopted by the Board of Directors. Circumstances that may cause the fund to use these procedures to value a security include, but are not limited to: a security has been declared in default; trading in a security has been halted during the trading day; there is a foreign market holiday and no trading occurred; or an event occurred between the close of a foreign exchange and the NYSE that may affect the value of a security.
Security Transactions — Security transactions are accounted for as of the trade date. Net realized gains and losses are determined on the identified cost basis, which is also used for federal income tax purposes.
Investment Income — Dividend income less foreign taxes withheld, if any, is recorded as of the ex-dividend date. Interest income is recorded on the accrual basis and includes accretion of discounts and amortization of premiums.
Foreign Currency Translations — All assets and liabilities initially expressed in foreign currencies are translated into U.S. dollars at prevailing exchange rates at period end. The fund may enter into spot foreign currency exchange contracts to facilitate transactions denominated in a foreign currency. Purchases and sales of investment securities, dividend and interest income, spot foreign currency exchange contracts, and expenses are translated at the rates of exchange prevailing on the respective dates of such transactions. Net realized and unrealized foreign currency exchange gains or losses related to investment securities are a component of net realized gain (loss) on investment transactions and change in net unrealized appreciation (depreciation) on investments, respectively.
Repurchase Agreements — The fund may enter into repurchase agreements with institutions that American Century Investment Management, Inc. (ACIM) (the investment advisor) has determined are creditworthy pursuant to criteria adopted by the Board of Directors. The fund requires that the collateral, represented by securities, received in a repurchase transaction be transferred to the custodian in a manner sufficient to enable the fund to obtain those securities in the event of a default under the repurchase agreement. ACIM monitors, on a daily basis, the securities transferred to ensure the value, including accrued interest, of the securities under each repurchase agreement is equal to or greater than amounts owed to the fund under each repurchase agreement.
Joint Trading Account — Pursuant to an Exemptive Order issued by the Securities and Exchange Commission, the fund, along with certain other funds in the American Century Investments family of funds, may transfer uninvested cash balances into a joint trading account. These balances are invested in one or more repurchase agreements that are collateralized by U.S. Treasury or Agency obligations.
Segregated Assets — In accordance with the 1940 Act, the fund segregates assets on its books and records to cover certain types of investments, including, but not limited to, futures contracts, forward commitments, when-issued securities, short sales, swap agreements and certain forward foreign currency exchange contracts. ACIM monitors, on a daily basis, the securities segregated to ensure the fund designates a sufficient amount of liquid assets, marked-to-market daily. The fund may also receive assets or be required to pledge assets at the custodian bank or with a broker for margin requirements on futures contracts and swap agreements.
Income Tax Status — It is the fund’s policy to distribute substantially all net investment income and net realized gains to shareholders and to otherwise qualify as a regulated investment company under provisions of the Internal Revenue Code. The fund is no longer subject to examination by tax authorities for years prior to 2009. At this time, management believes there are no uncertain tax positions which, based on their technical merit, would not be sustained upon examination and for which it is reasonably possible that the total amounts of unrecognized tax benefits will significantly change in the next twelve months. Accordingly, no provision has been made for federal or state income taxes.
20
Multiple Class — All shares of the fund represent an equal pro rata interest in the net assets of the class to which such shares belong, and have identical voting, dividend, liquidation and other rights and the same terms and conditions, except for class specific expenses and exclusive rights to vote on matters affecting only individual classes. Income, non-class specific expenses, and realized and unrealized capital gains and losses of the fund are allocated to each class of shares based on their relative net assets.
Distributions to Shareholders — Distributions from net investment income, if any, are generally declared and paid quarterly. Distributions from net realized gains, if any, are generally declared and paid annually.
Indemnifications — Under the corporation’s organizational documents, its officers and directors are indemnified against certain liabilities arising out of the performance of their duties to the fund. In addition, in the normal course of business, the fund enters into contracts that provide general indemnifications. The maximum exposure under these arrangements is unknown as this would involve future claims that may be made against a fund. The risk of material loss from such claims is considered by management to be remote.
3. Fees and Transactions with Related Parties
Management Fees — The corporation has entered into a management agreement with ACIM, under which ACIM provides the fund with investment advisory and management services in exchange for a single, unified management fee (the fee) per class. The agreement provides that all expenses of managing and operating the fund, except distribution and service fees, brokerage expenses, taxes, interest, fees and expenses of the independent directors (including legal counsel fees), and extraordinary expenses, will be paid by ACIM. The fee is computed and accrued daily based on each class’s daily net assets and paid monthly in arrears. The rate of the fee is determined by applying a fee rate calculation formula. This formula takes into account the fund’s assets as well as certain assets, if any, of other clients of the investment advisor outside the American Century Investments family of funds (such as subadvised funds and separate accounts) that have very similar investment teams and investment strategies (strategy assets). The annual management fee schedule ranges from 0.85% to 1.00% for the Investor Class, A Class, B Class, C Class and R Class. The Institutional Class is 0.20% less at each point within the range. The effective annual management fee for each class for the year ended March 31, 2012 was 1.00% for the Investor Class, A Class, B Class, C Class and R Class and 0.80% for the Institutional Class.
Distribution and Service Fees — The Board of Directors has adopted a separate Master Distribution and Individual Shareholder Services Plan for each of the A Class, B Class, C Class and R Class (collectively the plans), pursuant to Rule 12b-1 of the 1940 Act. The plans provide that the A Class will pay American Century Investment Services, Inc. (ACIS) an annual distribution and service fee of 0.25%. The plans provide that the B Class and C Class will each pay ACIS an annual distribution and service fee of 1.00%, of which 0.25% is paid for individual shareholder services and 0.75% is paid for distribution services. The plans provide that the R Class will pay ACIS an annual distribution and service fee of 0.50%. The fees are computed and accrued daily based on each class’s daily net assets and paid monthly in arrears. The fees are used to pay financial intermediaries for distribution and individual shareholder services. Fees incurred under the plans during the year ended March 31, 2012 are detailed in the Statement of Operations.
Related Parties — Certain officers and directors of the corporation are also officers and/or directors of American Century Companies, Inc. (ACC), the parent of the corporation’s investment advisor, ACIM, the distributor of the corporation, ACIS, and the corporation’s transfer agent, American Century Services, LLC.
The fund was eligible to invest in a money market fund for temporary purposes, which is managed by J.P. Morgan Investment Management, Inc. (JPMIM). The fund had a securities lending agreement with JPMorgan Chase Bank (JPMCB) and a mutual funds services agreement with J.P. Morgan Investor Services Co. (JPMIS). JPMCB was a custodian of the fund. JPMIM, JPMIS and JPMCB are wholly owned subsidiaries of JPMorgan Chase & Co. (JPM). Prior to August 31, 2011, JPM was an equity investor in ACC. The services provided to the fund by JPMIM, JPMIS and JPMCB terminated on July 31, 2011.
21
4. Investment Transactions
Purchases and sales of investment securities, excluding short-term investments, for the year ended March 31, 2012 were $1,254,600,784 and $1,318,442,962, respectively.
For the year ended March 31, 2012, the fund incurred net realized gains of $7,698,728 from redemptions in kind. A redemption in kind occurs when a fund delivers securities from its portfolio in lieu of cash as payment to a redeeming shareholder.
5. Capital Share Transactions
Transactions in shares of the fund were as follows:
| Year ended March 31, 2012 | Year ended March 31, 2011 | ||||||||||||||
| Shares | Amount | Shares | Amount | ||||||||||||
| Investor Class/Shares Authorized | 1,100,000,000 | 1,000,000,000 | |||||||||||||
| Sold | 65,488,649 | $364,198,389 | 99,542,833 | $515,144,572 | |||||||||||
| Issued in reinvestment of distributions | 4,816,694 | 27,128,597 | 5,240,675 | 28,242,944 | |||||||||||
| Redeemed | (58,694,110 | ) | (333,509,846 | ) | (61,480,581 | ) | (334,981,493 | ) | |||||||
| 11,611,233 | 57,817,140 | 43,302,927 | 208,406,023 | ||||||||||||
| Institutional Class/Shares Authorized | 200,000,000 | 125,000,000 | |||||||||||||
| Sold | 10,529,303 | 59,274,684 | 6,984,266 | 38,504,311 | |||||||||||
| Issued in reinvestment of distributions | 757,394 | 4,264,834 | 850,569 | 4,591,088 | |||||||||||
| Redeemed | (28,844,013 | ) | (166,796,081 | ) | (9,672,208 | ) | (51,914,026 | ) | |||||||
| (17,557,316 | ) | (103,256,563 | ) | (1,837,373 | ) | (8,818,627 | ) | ||||||||
| A Class/Shares Authorized | 200,000,000 | 150,000,000 | |||||||||||||
| Sold | 11,958,515 | 69,054,781 | 24,506,681 | 124,332,768 | |||||||||||
| Issued in reinvestment of distributions | 560,414 | 3,151,163 | 318,542 | 1,710,118 | |||||||||||
| Redeemed | (7,417,731 | ) | (42,744,039 | ) | (10,958,614 | ) | (59,753,401 | ) | |||||||
| 5,101,198 | 29,461,905 | 13,866,609 | 66,289,485 | ||||||||||||
| B Class/Shares Authorized | 5,000,000 | 5,000,000 | |||||||||||||
| Sold | 3,515 | 21,092 | 4,323 | 23,808 | |||||||||||
| Issued in reinvestment of distributions | 3,526 | 19,924 | 5,849 | 31,168 | |||||||||||
| Redeemed | (128,271 | ) | (723,843 | ) | (111,022 | ) | (614,783 | ) | |||||||
| (121,230 | ) | (682,827 | ) | (100,850 | ) | (559,807 | ) | ||||||||
| C Class/Shares Authorized | 15,000,000 | 5,000,000 | |||||||||||||
| Sold | 719,040 | 4,152,842 | 246,108 | 1,331,424 | |||||||||||
| Issued in reinvestment of distributions | 9,630 | 53,891 | 12,200 | 64,537 | |||||||||||
| Redeemed | (205,655 | ) | (1,155,221 | ) | (326,335 | ) | (1,750,623 | ) | |||||||
| 523,015 | 3,051,512 | (68,027 | ) | (354,662 | ) | ||||||||||
| R Class/Shares Authorized | 15,000,000 | 15,000,000 | |||||||||||||
| Sold | 1,001,334 | 5,660,184 | 4,465,606 | 23,210,734 | |||||||||||
| Issued in reinvestment of distributions | 41,545 | 233,735 | 35,129 | 190,034 | |||||||||||
| Redeemed | (555,501 | ) | (3,155,183 | ) | (2,414,937 | ) | (12,703,574 | ) | |||||||
| 487,378 | 2,738,736 | 2,085,798 | 10,697,194 | ||||||||||||
| Net increase (decrease) | 44,278 | $(10,870,097 | ) | 57,249,084 | $275,659,606 | ||||||||||
22
6. Fair Value Measurements
The fund’s securities valuation process is based on several considerations and may use multiple inputs to determine the fair value of the positions held by the fund. In conformity with accounting principles generally accepted in the United States of America, the inputs used to determine a valuation are classified into three broad levels as follows:
| • | Level 1 valuation inputs consist of unadjusted quoted prices in an active market for identical securities; |
| • | Level 2 valuation inputs consist of direct or indirect observable market data (including quoted prices for similar securities, evaluations of subsequent market events, interest rates, prepayment speeds, credit risk, etc.); or |
| • | Level 3 valuation inputs consist of unobservable data (including a fund’s own assumptions). |
The level classification is based on the lowest level input that is significant to the fair valuation measurement. The valuation inputs are not necessarily an indication of the risks associated with investing in these securities or other financial instruments.
The following is a summary of the level classifications as of period end. The Schedule of Investments provides additional information on the fund’s portfolio holdings.
| Level 1 | Level 2 | Level 3 | |||||||||
| Investment Securities | |||||||||||
| Domestic Common Stocks | $1,912,437,065 | — | — | ||||||||
| Foreign Common Stocks | 34,434,752 | $163,972,147 | — | ||||||||
| Temporary Cash Investments | 17,795,810 | 99,554,466 | — | ||||||||
| Total Value of Investment Securities | $1,964,667,627 | $263,526,613 | — | ||||||||
| Other Financial Instruments | |||||||||||
| Futures Contracts | $2,694,891 | — | — | ||||||||
| Forward Foreign Currency Exchange Contracts | — | $(246,206 | ) | — | |||||||
| Total Unrealized Gain (Loss) on Other Financial Instruments | $2,694,891 | $(246,206 | ) | — | |||||||
7. Derivative Instruments
Equity Price Risk — The fund is subject to equity price risk in the normal course of pursuing its investment objectives. A fund may enter into futures contracts based on an equity index in order to manage its exposure to changes in market conditions. A fund may purchase futures contracts to gain exposure to increases in market value or sell futures contracts to protect against a decline in market value. Upon entering into a futures contract, a fund is required to deposit either cash or securities in an amount equal to a certain percentage of the contract value (initial margin). Subsequent payments (variation margin) are made or received daily, in cash, by a fund. The variation margin is equal to the daily change in the contract value and is recorded as unrealized gains and losses. A fund recognizes a realized gain or loss when the contract is closed or expires. Net realized and unrealized gains or losses occurring during the holding period of futures contracts are a component of net realized gain (loss) on futures contract transactions and change in net unrealized appreciation (depreciation) on futures contracts, respectively. One of the risks of entering into futures contracts is the possibility that the change in value of the contract may not correlate with the changes in value of the underlying securities. The fund began investing in equity price risk derivatives in September 2011. The equity price risk derivative instruments at period end as disclosed on the fund’s Schedule of Investments are indicative of the fund’s typical volume since September 2011.
23
Foreign Currency Risk — The fund is subject to foreign currency exchange rate risk in the normal course of pursuing its investment objectives. The value of foreign investments held by a fund may be significantly affected by changes in foreign currency exchange rates. The dollar value of a foreign security generally decreases when the value of the dollar rises against the foreign currency in which the security is denominated and tends to increase when the value of the dollar declines against such foreign currency. A fund may enter into forward foreign currency exchange contracts to reduce a fund’s exposure to foreign currency exchange rate fluctuations. The net U.S. dollar value of foreign currency underlying all contractual commitments held by a fund and the resulting unrealized appreciation or depreciation are determined daily. Realized gain or loss is recorded upon the termination of the contract. Net realized and unrealized gains or losses occurring during the holding period of forward foreign currency exchange contracts are a component of net realized gain (loss) on foreign currency transactions and change in net unrealized appreciation (depreciation) on translation of assets and liabilities in foreign currencies, respectively. A fund bears the risk of an unfavorable change in the foreign currency exchange rate underlying the forward contract. Additionally, losses, up to the fair value, may arise if the counterparties do not perform under the contract terms. The foreign currency risk derivative instruments held at period end as disclosed on the Schedule of Investments are indicative of the fund’s typical volume during the period.
Value of Derivative Instruments as of March 31, 2012 | |||||
| Asset Derivatives | Liability Derivatives | ||||
Type of Risk Exposure | Location on Statement of Assets and Liabilities | Value | Location on Statement of Assets and Liabilities | Value | |
| Equity Price Risk | Receivable for variation margin on futures contracts* | $259,533 | Payable for variation margin on futures contracts* | — | |
| Foreign Currency Risk | Unrealized gain on forward foreign currency exchange contracts | 34,735 | Unrealized loss on forward foreign currency exchange contracts | $280,941 | |
| $294,268 | $280,941 | ||||
*Included in the unrealized gain (loss) on future contracts as reported in the Schedule of Investments.
Effect of Derivative Instruments on the Statement of Operations for the Year Ended March 31, 2012 | |||||
| Net Realized Gain (Loss) | Change in Net Unrealized Appreciation (Depreciation) | ||||
Type of Risk Exposure | Location on Statement of Operations | Value | Location on Statement of Operations | Value | |
| Equity Price Risk | Net realized gain (loss) on futures contract transactions | $ 6,708,956 | Change in net unrealized appreciation (depreciation) on futures contracts | $2,694,891 | |
| Foreign Currency Risk | Net realized gain (loss) on foreign currency transactions | 4,306,530 | Change in net unrealized appreciation (depreciation) on translation of assets and liabilities in foreign currencies | (129,194) | |
| $11,015,486 | $2,565,697 | ||||
8. Risk Factors
There are certain risks involved in investing in foreign securities. These risks include those resulting from future adverse political, social and economic developments, fluctuations in currency exchange rates, the possible imposition of exchange controls, and other foreign laws or restrictions.
24
9. Federal Tax Information
The tax character of distributions paid during the years ended March 31, 2012 and
March 31, 2011 were as follows:
| 2012 | 2011 | |
| Distributions Paid From | ||
| Ordinary income | $36,722,666 | $38,147,441 |
| Long-term capital gains | — | — |
The book-basis character of distributions made during the year from net investment income or net realized gains may differ from their ultimate characterization for federal income tax purposes. These differences reflect the differing character of certain income items and net realized gains and losses for financial statement and tax purposes, and may result in reclassification among certain capital accounts on the financial statements.
As of March 31, 2012, the federal tax cost of investments and the components of distributable earnings on a tax-basis were as follows:
| Federal tax cost of investments | $2,062,060,948 | |
| Gross tax appreciation of investments | $236,029,997 | |
| Gross tax depreciation of investments | (69,896,705 | ) |
| Net tax appreciation (depreciation) of investments | $166,133,292 | |
Net tax appreciation (depreciation) on derivatives and translation of assets and liabilities in foreign currencies | $(7,403 | ) |
| Net tax appreciation (depreciation) | $166,125,889 | |
| Undistributed ordinary income | $4,741,772 | |
| Accumulated capital losses | $(285,946,075 | ) |
The difference between book-basis and tax-basis cost and unrealized appreciation (depreciation) is attributable primarily to the tax deferral of losses on wash sales and the realization for tax purposes of unrealized gains (losses) on certain foreign currency exchange contracts.
The accumulated capital losses represent net capital loss carryovers that may be used to offset future realized capital gains for federal income tax purposes. Future capital loss carryover utilization in any given year may be subject to Internal Revenue Code limitations. Capital loss carryovers of $(80,172,282) and $(205,773,793) expire in 2017 and 2018, respectively. The Regulated Investment Company Modernization Act of 2010 allows the fund to carry forward capital losses incurred in future taxable years for an unlimited period. Any losses incurred during future taxable years will be required to be utilized prior to the losses which carry an expiration date. As a result, capital loss carryforwards may be more likely to expire unused.
25
| For a Share Outstanding Throughout the Years Ended March 31 (except as noted) | |||||||||||||
| Per-Share Data | Ratios and Supplemental Data | ||||||||||||
| Income From Investment Operations: | Distributions From: | Ratio to Average Net Assets of: | |||||||||||
Net Asset Value, Beginning of Period | Net Investment Income (Loss)(1) | Net Realized and Unrealized Gain (Loss) | Total From Investment Operations | Net Investment Income | Net Realized Gains | Total Distributions | Net Asset Value, End of Period | Total Return(2) | Operating Expenses | Net Investment Income (Loss) | Portfolio Turnover Rate | Net Assets, End of Period (in thousands) | |
| Investor Class | |||||||||||||
| 2012 | $5.97 | 0.10 | 0.26 | 0.36 | (0.10) | — | (0.10) | $6.23 | 6.22% | 1.01% | 1.70% | 62% | $1,811,710 |
| 2011 | $5.40 | 0.11 | 0.57 | 0.68 | (0.11) | — | (0.11) | $5.97 | 12.84% | 1.01% | 2.05% | 76% | $1,668,403 |
| 2010 | $3.80 | 0.09 | 1.60 | 1.69 | (0.09) | — | (0.09) | $5.40 | 44.84% | 1.00% | 1.97% | 62% | $1,274,063 |
| 2009 | $5.78 | 0.13 | (1.98) | (1.85) | (0.13) | — | (0.13) | $3.80 | (32.34)% | 1.00% | 2.63% | 91% | $975,772 |
| 2008 | $7.61 | 0.12 | (0.92) | (0.80) | (0.12) | (0.91) | (1.03) | $5.78 | (11.56)% | 1.00% | 1.65% | 152% | $1,707,366 |
| Institutional Class | |||||||||||||
| 2012 | $5.98 | 0.11 | 0.26 | 0.37 | (0.11) | — | (0.11) | $6.24 | 6.42% | 0.81% | 1.90% | 62% | $126,086 |
| 2011 | $5.41 | 0.12 | 0.57 | 0.69 | (0.12) | — | (0.12) | $5.98 | 13.05% | 0.81% | 2.25% | 76% | $225,950 |
| 2010 | $3.81 | 0.10 | 1.60 | 1.70 | (0.10) | — | (0.10) | $5.41 | 45.01% | 0.80% | 2.17% | 62% | $214,112 |
| 2009 | $5.79 | 0.14 | (1.98) | (1.84) | (0.14) | — | (0.14) | $3.81 | (32.14)% | 0.80% | 2.83% | 91% | $123,484 |
| 2008 | $7.62 | 0.13 | (0.91) | (0.78) | (0.14) | (0.91) | (1.05) | $5.79 | (11.36)% | 0.80% | 1.85% | 152% | $307,769 |
A Class(3) | |||||||||||||
| 2012 | $5.97 | 0.08 | 0.27 | 0.35 | (0.09) | — | (0.09) | $6.23 | 5.95% | 1.26% | 1.45% | 62% | $255,777 |
| 2011 | $5.40 | 0.10 | 0.57 | 0.67 | (0.10) | — | (0.10) | $5.97 | 12.57% | 1.26% | 1.80% | 76% | $214,896 |
| 2010 | $3.80 | 0.08 | 1.60 | 1.68 | (0.08) | — | (0.08) | $5.40 | 44.47% | 1.25% | 1.72% | 62% | $119,363 |
| 2009 | $5.78 | 0.12 | (1.98) | (1.86) | (0.12) | — | (0.12) | $3.80 | (32.51)% | 1.25% | 2.38% | 91% | $83,254 |
| 2008 | $7.61 | 0.10 | (0.92) | (0.82) | (0.10) | (0.91) | (1.01) | $5.78 | (11.76)% | 1.25% | 1.40% | 152% | $191,739 |
26
| For a Share Outstanding Throughout the Years Ended March 31 (except as noted) | |||||||||||||
| Per-Share Data | Ratios and Supplemental Data | ||||||||||||
| Income From Investment Operations: | Distributions From: | Ratio to Average Net Assets of: | |||||||||||
Net Asset Value, Beginning of Period | Net Investment Income (Loss)(1) | Net Realized and Unrealized Gain (Loss) | Total From Investment Operations | Net Investment Income | Net Realized Gains | Total Distributions | Net Asset Value, End of Period | Total Return(2) | Operating Expenses | Net Investment Income (Loss) | Portfolio Turnover Rate | Net Assets, End of Period (in thousands) | |
| B Class | |||||||||||||
| 2012 | $5.96 | 0.04 | 0.26 | 0.30 | (0.05) | — | (0.05) | $6.21 | 5.14% | 2.01% | 0.70% | 62% | $2,283 |
| 2011 | $5.39 | 0.06 | 0.57 | 0.63 | (0.06) | — | (0.06) | $5.96 | 11.87% | 2.01% | 1.05% | 76% | $2,916 |
| 2010 | $3.80 | 0.05 | 1.59 | 1.64 | (0.05) | — | (0.05) | $5.39 | 43.21% | 2.00% | 0.97% | 62% | $3,182 |
| 2009 | $5.78 | 0.08 | (1.97) | (1.89) | (0.09) | — | (0.09) | $3.80 | (33.01)% | 2.00% | 1.63% | 91% | $2,651 |
| 2008 | $7.61 | 0.05 | (0.92) | (0.87) | (0.05) | (0.91) | (0.96) | $5.78 | (12.41)% | 2.00% | 0.65% | 152% | $5,601 |
| C Class | |||||||||||||
| 2012 | $5.92 | 0.04 | 0.25 | 0.29 | (0.05) | — | (0.05) | $6.16 | 5.01% | 2.01% | 0.70% | 62% | $11,194 |
| 2011 | $5.35 | 0.06 | 0.57 | 0.63 | (0.06) | — | (0.06) | $5.92 | 11.96% | 2.01% | 1.05% | 76% | $7,659 |
| 2010 | $3.77 | 0.05 | 1.58 | 1.63 | (0.05) | — | (0.05) | $5.35 | 43.29% | 2.00% | 0.97% | 62% | $7,294 |
| 2009 | $5.74 | 0.08 | (1.96) | (1.88) | (0.09) | — | (0.09) | $3.77 | (33.06)% | 2.00% | 1.63% | 91% | $5,414 |
| 2008 | $7.56 | 0.05 | (0.91) | (0.86) | (0.05) | (0.91) | (0.96) | $5.74 | (12.36)% | 2.00% | 0.65% | 152% | $11,532 |
| R Class | |||||||||||||
| 2012 | $5.97 | 0.07 | 0.26 | 0.33 | (0.07) | — | (0.07) | $6.23 | 5.72% | 1.51% | 1.20% | 62% | $21,241 |
| 2011 | $5.40 | 0.07 | 0.58 | 0.65 | (0.08) | — | (0.08) | $5.97 | 12.29% | 1.51% | 1.55% | 76% | $17,470 |
| 2010 | $3.80 | 0.07 | 1.60 | 1.67 | (0.07) | — | (0.07) | $5.40 | 44.10% | 1.50% | 1.47% | 62% | $4,527 |
| 2009 | $5.78 | 0.11 | (1.98) | (1.87) | (0.11) | — | (0.11) | $3.80 | (32.67)% | 1.50% | 2.13% | 91% | $2,255 |
| 2008 | $7.61 | 0.09 | (0.92) | (0.83) | (0.09) | (0.91) | (1.00) | $5.78 | (11.98)% | 1.50% | 1.15% | 152% | $1,625 |
27
Notes to Financial Highlights
| (1) | Computed using average shares outstanding throughout the period. |
| (2) | Total returns are calculated based on the net asset value of the last business day and do not reflect applicable sales charges, if any. Total returns for periods less than one year are not annualized. |
| (3) | Prior to September 4, 2007, the A Class was referred to as the Advisor Class. |
See Notes to Financial Statements.
28
To the Board of Directors and Shareholders of
American Century Capital Portfolios, Inc.:
We have audited the accompanying statement of assets and liabilities, including the schedule of investments, of Value Fund, one of the funds constituting American Century Capital Portfolios, Inc. (the “Corporation”) as of March 31, 2012, and the related statement of operations for the year then ended, the statements of changes in net assets for each of the two years in the period then ended, and the financial highlights for each of the five years in the period then ended. These financial statements and financial highlights are the responsibility of the Corporation’s management. Our responsibility is to express an opinion on these financial statements and financial highlights based on our audits.
We conducted our audits in accordance with the standards of the Public Company Accounting Oversight Board (United States). Those standards require that we plan and perform the audit to obtain reasonable assurance about whether the financial statements and financial highlights are free of material misstatement. The Corporation is not required to have, nor were we engaged to perform, an audit of its internal control over financial reporting. Our audits included consideration of internal control over financial reporting as a basis for designing audit procedures that are appropriate in the circumstances, but not for the purpose of expressing an opinion on the effectiveness of the Corporation’s internal control over financial reporting. Accordingly, we express no such opinion. An audit also includes examining, on a test basis, evidence supporting the amounts and disclosures in the financial statements, assessing the accounting principles used and significant estimates made by management, as well as evaluating the overall financial statement presentation. Our procedures included confirmation of securities owned as of March 31, 2012, by correspondence with the custodian and brokers; where replies were not received from brokers, we performed other auditing procedures. We believe that our audits provide a reasonable basis for our opinion.
In our opinion, such financial statements and financial highlights referred to above present fairly, in all material respects, the financial position of Value Fund of American Century Capital Portfolios, Inc., as of March 31, 2012, the results of its operations for the year then ended, the changes in its net assets for each of the two years in the period then ended, and the financial highlights for each of the five years in the period then ended, in conformity with accounting principles generally accepted in the United States of America.
Deloitte & Touche LLP
Kansas City, Missouri
May 16, 2012
29
The Board of Directors
The individuals listed below serve as directors of the funds. Each director will continue to serve in this capacity until death, retirement, resignation or removal from office. The mandatory retirement age for directors who are not “interested persons,” as that term is defined in the Investment Company Act (independent directors), is 72. However, the mandatory retirement age for an individual director may be extended with the approval of the remaining independent directors.
Mr. Thomas is an “interested person” because he currently serves as President and Chief Executive Officer of American Century Companies, Inc. (ACC), the parent company of American Century Investment Management, Inc. (ACIM or the advisor). Mr. Fink is an “interested person” because he currently serves as Executive Vice President and Chief Operating Officer of ACC.
The other directors (more than three-fourths of the total number) are independent; that is, they have never been employees, directors or officers of, and have no financial interest in, ACC or any of its wholly owned, direct or indirect, subsidiaries, including ACIM, American Century Investment Services, Inc. (ACIS) and American Century Services, LLC (ACS). The directors serve in this capacity for seven (in the case of Mr. Thomas, 15) registered investment companies in the American Century Investments family of funds.
The following table presents additional information about the directors. The mailing address for each director is 4500 Main Street, Kansas City, Missouri 64111.
Name (Year of Birth) | Position(s) Held with Funds | Length of Time Served | Principal Occupation(s) During Past 5 Years | Number of American Century Portfolios Overseen by Director | Other Directorships Held During Past 5 Years | |
| Independent Directors | ||||||
Thomas A. Brown (1940) | Director | Since 1980 | Managing Member, Associated Investments, LLC (real estate investment company); Brown Cascade Properties, LLC (real estate investment company) (2001 to 2009) | 66 | None | |
Andrea C. Hall (1945) | Director | Since 1997 | Retired | 66 | None | |
Jan M. Lewis (1957) | Director | Since 2011 | President and Chief Executive Officer, Catholic Charities of Northeast Kansas (human services organization) (2006 to present) | 66 | None | |
James A. Olson (1942) | Director | Since 2007 | Member, Plaza Belmont LLC (private equity fund manager) | 66 | Saia, Inc. (2002 to 2012) and Entertainment Properties Trust | |
Donald H. Pratt (1937) | Director and Chairman of the Board | Since 1995 (Chairman since 2005) | Chairman and Chief Executive Officer, Western Investments, Inc. (real estate company) | 66 | None | |
30
Name (Year of Birth) | Position(s) Held with Funds | Length of Time Served | Principal Occupation(s) During Past 5 Years | Number of American Century Portfolios Overseen by Director | Other Directorships Held During Past 5 Years | |
| Independent Directors | ||||||
M. Jeannine Strandjord (1945) | Director | Since 1994 | Retired | 66 | DST Systems Inc., Euronet Worldwide Inc., and Charming Shoppes, Inc. (2006 to 2010) | |
John R. Whitten (1946) | Director | Since 2008 | Project Consultant, Celanese Corp. (industrial chemical company) | 66 | Rudolph Technologies, Inc. | |
Stephen E. Yates (1948) | Director | Since 2012 | Retired; Executive Vice President, Technology & Operations, KeyCorp. (computer services) (2004 to 2010) | 66 | Applied Industrial Technology (2001 to 2010) | |
| Interested Directors | ||||||
Barry Fink (1955) | Director and Executive Vice President | Since 2012 (Executive Vice President since 2007) | Chief Operating Officer and Executive Vice President, ACC (September 2007 to present); President, ACS (October 2007 to present); Managing Director, Morgan Stanley (2000 to 2007). Also serves as Manager, ACS and Director, ACC and certain ACC subsidiaries | 66 | None | |
Jonathan S. Thomas (1963) | Director and President | Since 2007 | President and Chief Executive Officer, ACC (March 2007 to present); Chief Administrative Officer, ACC (February 2006 to February 2007); Executive Vice President, ACC (November 2005 to February 2007). Also serves as Chief Executive Officer and Manager, ACS; Executive Vice President, ACIM; Director, ACC, ACIM and other ACC subsidiaries | 108 | None | |
31
Officers
The following table presents certain information about the executive officers of the funds. Each officer serves as an officer for each of the 15 investment companies in the American Century family of funds, unless otherwise noted. No officer is compensated for his or her service as an officer of the funds. The listed officers are interested persons of the funds and are appointed or re-appointed on an annual basis. The mailing address for each officer listed below is 4500 Main Street, Kansas City, Missouri 64111.
Name (Year of Birth) | Offices with the Funds | Principal Occupation(s) During the Past Five Years | |
Jonathan S. Thomas (1963) | Director and President since 2007 | President and Chief Executive Officer, ACC (March 2007 to present); Chief Administrative Officer, ACC (February 2006 to February 2007); Executive Vice President, ACC (November 2005 to February 2007). Also serves as Chief Executive Officer and Manager, ACS; Executive Vice President, ACIM; Director, ACC, ACIM and other ACC subsidiaries | |
Barry Fink (1955) | Director since 2012 and Executive Vice President since 2007 | Chief Operating Officer and Executive Vice President, ACC (September 2007 to present); President, ACS (October 2007 to present); Managing Director, Morgan Stanley (2000 to 2007). Also serves as Manager, ACS and Director, ACC and certain ACC subsidiaries | |
Maryanne L. Roepke (1956) | Chief Compliance Officer since 2006 and Senior Vice President since 2000 | Chief Compliance Officer, American Century funds, ACIM and ACS (August 2006 to present). Also serves as Senior Vice President, ACS | |
Charles A. Etherington (1957) | General Counsel since 2007 and Senior Vice President since 2006 | Attorney, ACC (February 1994 to present); Vice President, ACC (November 2005 to present), General Counsel, ACC (March 2007 to present); Also serves as General Counsel, ACIM, ACS, ACIS and other ACC subsidiaries; and Senior Vice President, ACIM and ACS | |
C. Jean Wade (1964) | Vice President, Treasurer and Chief Financial Officer since 2012 | Vice President, ACS (February 2000 to present) | |
Robert J. Leach (1966) | Vice President since 2006 and Assistant Treasurer since 2012 | Vice President, ACS (February 2000 to present) | |
David H. Reinmiller (1963) | Vice President since 2000 | Attorney, ACC (January 1994 to present); Associate General Counsel, ACC (January 2001 to present). Also serves as Vice President, ACIM and ACS | |
Ward D. Stauffer (1960) | Secretary since 2005 | Attorney, ACC (June 2003 to present) |
The Statement of Additional Information has additional information about the fund’s directors and is available without charge, upon request, by calling 1-800-345-2021.
32
Retirement Account Information
As required by law, distributions you receive from certain IRAs, or 403(b), 457 and qualified plans are subject to federal income tax withholding, unless you elect not to have withholding apply. Tax will be withheld on the total amount withdrawn even though you may be receiving amounts that are not subject to withholding, such as nondeductible contributions. In such case, excess amounts of withholding could occur. You may adjust your withholding election so that a greater or lesser amount will be withheld.
If you don’t want us to withhold on this amount, you must notify us to not withhold the federal income tax. You may notify us in writing or in certain situations by telephone or through other electronic means. You have the right to revoke your withholding election at any time and any election you make may remain in effect until revoked by filing a new election.
Remember, even if you elect not to have income tax withheld, you are liable for paying income tax on the taxable portion of your withdrawal. If you elect not to have income tax withheld or you don’t have enough income tax withheld, you may be responsible for payment of estimated tax. You may incur penalties under the estimated tax rules if your withholding and estimated tax payments are not sufficient. You can reduce or defer the income tax on a distribution by directly or indirectly rolling such distribution over to another IRA or eligible plan. You should consult your tax advisor for additional information.
State tax will be withheld if, at the time of your distribution, your address is within one of the mandatory withholding states and you have federal income tax withheld. State taxes will be withheld from your distribution in accordance with the respective state rules.
Proxy Voting Guidelines
American Century Investment Management, Inc., the fund’s investment advisor, is responsible for exercising the voting rights associated with the securities purchased and/or held by the fund. A description of the policies and procedures the advisor uses in fulfilling this responsibility is available without charge, upon request, by calling 1-800-345-2021. It is also available on American Century Investments’ website at americancentury.com and on the Securities and Exchange Commission’s website at sec.gov. Information regarding how the investment advisor voted proxies relating to portfolio securities during the most recent 12-month period ended June 30 is available on the “About Us” page at americancentury.com. It is also available at sec.gov.
Quarterly Portfolio Disclosure
The fund files its complete schedule of portfolio holdings with the Securities and Exchange Commission (SEC) for the first and third quarters of each fiscal year on Form N-Q. The fund’s Forms N-Q are available on the SEC’s website at sec.gov, and may be reviewed and copied at the SEC’s Public Reference Room in Washington, DC. Information on the operation of the Public Reference Room may be obtained by calling 1-800-SEC-0330. The fund also makes its complete schedule of portfolio holdings for the most recent quarter of its fiscal year available on its website at americancentury.com and, upon request, by calling 1-800-345-2021.
33
Other Tax Information
The following information is provided pursuant to provisions of the Internal Revenue Code.
The fund hereby designates up to the maximum amount allowable as qualified dividend income for the fiscal year ended March 31, 2012.
For corporate taxpayers, the fund hereby designates $36,722,666, or up to the maximum amount allowable, of ordinary income distributions paid during the fiscal year ended March 31, 2012 as qualified for the corporate dividends received deduction.
34
35
36
| Contact Us | americancentury.com |
| Automated Information Line | 1-800-345-8765 |
| Investor Services Representative | 1-800-345-2021 or 816-531-5575 |
| Investors Using Advisors | 1-800-378-9878 |
Business, Not-For-Profit, Employer-Sponsored Retirement Plans | 1-800-345-3533 |
Banks and Trust Companies, Broker-Dealers, Financial Professionals, Insurance Companies | 1-800-345-6488 |
| Telecommunications Device for the Deaf | 1-800-634-4113 |
American Century Capital Portfolios, Inc.
Investment Advisor:
American Century Investment Management, Inc.
Kansas City, Missouri
This report and the statements it contains are submitted for the general information of our shareholders. The report is not authorized for distribution to prospective investors unless preceded or accompanied by an effective prospectus.
©2012 American Century Proprietary Holdings, Inc. All rights reserved.
CL-ANN-75035 1205
ANNUAL REPORT MARCH 31, 2012
| Real Estate Fund |
| President’s Letter | 2 |
| Independent Chairman’s Letter | 3 |
| Market Perspective | 4 |
| Performance | 5 |
| Portfolio Commentary | 7 |
| Fund Characteristics | 9 |
| Shareholder Fee Example | 10 |
| Schedule of Investments | 12 |
| Statement of Assets and Liabilities | 14 |
| Statement of Operations | 15 |
| Statement of Changes in Net Assets | 16 |
| Notes to Financial Statements | 17 |
| Financial Highlights | 23 |
| Report of Independent Registered Public Accounting Firm | 25 |
| Management | 26 |
| Additional Information | 29 |
Any opinions expressed in this report reflect those of the author as of the date of the report, and do not necessarily represent the opinions of American Century Investments® or any other person in the American Century Investments organization. Any such opinions are subject to change at any time based upon market or other conditions and American Century Investments disclaims any responsibility to update such opinions. These opinions may not be relied upon as investment advice and, because investment decisions made by American Century Investments funds are based on numerous factors, may not be relied upon as an indication of trading intent on behalf of any American Century Investments fund. Security examples are used for representational purposes only and are not intended as recommendations to purchase or sell securities. Performance information for comparative indices and securities is provided to American Century Investments by third party vendors. To the best of American Century Investments’ knowledge, such information is accurate at the time of printing.
Dear Investor:
Thank you for reviewing this annual report for the period ended March 31, 2012. Our report offers investment performance and portfolio information, presented with the expert perspective of our portfolio management team.
This report remains one of our most important vehicles for conveying information about fund returns, as well as market factors and strategies that affected fund performance. For additional, updated information, we encourage you to visit our website, americancentury.com. Click on the “Fund Performance” and “Insights & News” headings at the top of our Individual Investors site.
Mostly Positive U.S. Returns Belie the Period’s Volatility
U.S. market performance for the 12 months ended March 31, 2012 appeared more benign than it really was. Broadly speaking, U.S. stocks and bonds returned roughly 7-9% for the period, as indicated by the S&P 500 Index and the Barclays U.S. Aggregate Bond Index. But those solid returns masked the roller-coaster ride required to achieve them.
The reporting period began, in April 2011, with stock indices and U.S. Treasury yields at some of their highest levels since 2008, prior to the Financial Crisis plunge. These elevated levels reflected increased risk-taking as the markets priced in improving global economic growth, strong corporate earnings, and higher inflation.
This “risk-on” investing attitude switched to “risk-off” during the summer of 2011, transformed by high fuel prices, federal budget management concerns in the U.S., and the worsening sovereign debt crisis in Europe. Recessionary expectations pulled Treasury yields to record lows by September, and stock indices suffered double-digit declines from their peaks.
Sentiment switched again in the fourth quarter of 2011, as concerns about the European sovereign debt crisis and the U.S. economy eased. Renewed “risk-on” investing carried into the first quarter of 2012, boosting growth stocks and high-yield bonds in particular. But the financial markets remain subject to potentially high volatility as they continue to wrestle with uncertainties regarding Europe, the Middle East, economic strength, government budget deficits, and the U.S. presidential election. We believe strongly in adhering to a disciplined, diversified, long-term investment approach during volatile periods, and we appreciate your continued trust in us during these unsettled times.
Sincerely,
Jonathan Thomas
President and Chief Executive Officer
American Century Investments
2
Dear Fellow Shareholders,
The assets under management in American Century Investments’ funds grow through investors placing new assets in the funds and through market appreciation. Asset growth has been at near record levels over the past two calendar years as market movements were upward, the funds’ relative returns were generally favorable, and the distribution strategies implemented by fund management have been successful.
The board reviews fund performance and distribution strategies on a regular basis. Several years ago, the fund’s management team discussed with the board its plans to grow fund assets in the intermediary, institutional and international distribution channels. These distribution strategies have produced strong positive growth. The growth in the intermediary channel recognizes the funds’ strong relative investment performance and the desire of many shareholders to seek financial guidance. Investors in both the institutional and international channels appear to find the funds’ risk-based investment strategies attractive. The board continues to support fund management’s strategies to increase fund assets and will continue to work to provide the benefits of these gains to fund shareholders.
We continue to receive a steady flow of very thoughtful questions from shareholders. If there are issues that you would like the board to address please email me at dhpratt@fundboardchair.com. Thank you for your continued investment in American Century Investments funds.
Best regards,
Don Pratt
3
By Enrique Chang,
Chief Investment Officer,
American Century Investments
U.S. Stocks Mixed but Generally Higher
The U.S. stock market faced significant volatility during the 12 months ended March 31, 2012, but ultimately posted positive overall returns. As the reporting period began, stocks were in the midst of an eight-month rally driven by improving economic data and better-than-expected corporate profits. After peaking in late April, however, stocks reversed course as evidence of a slowdown in U.S. economic activity and a worsening sovereign debt crisis in Europe put downward pressure on the equity market. In addition, government wrangling over the federal debt ceiling and an unprecedented credit rating downgrade of U.S. debt from AAA to AA+ during the summer weighed on investor confidence.
Recession fears and fiscal uncertainty led to an accelerating market decline in the third quarter of the year as stocks suffered their largest quarterly decline since the height of the credit crisis in late 2008. However, the equity market bottomed in early October and experienced another reversal, enjoying a substantial rebound over the last six months of the period. Investors grew more optimistic as signs of improving economic activity quashed recession fears; in particular, job growth consistently exceeded expectations, driving the unemployment rate down to its lowest level in three years. Another positive factor was better news out of Europe—the European Central Bank provided long-term financing to the debt markets and support for the Continent’s troubled banking sector, while Greece reached an agreement on a sovereign debt restructuring.
Large-Cap and Growth Stocks Fared Best
For the full reporting period, the broad equity indices (as represented by the S&P 500 Index and Russell 3000 Index) rose by 7–8%. As the table below illustrates, large-cap stocks posted the best returns, while small-cap issues declined modestly. Growth stocks outperformed value shares across all market capitalizations.
From a sector perspective, the best-performing sectors included information technology and consumer discretionary, both of which benefited from improving economic conditions in the latter half of the period. Two defensive sectors of the market, health care and consumer staples, also generated double-digit gains for the reporting period. On the downside, the commodity-driven energy and materials sectors fell the most, reflecting a broad decline in commodity prices.
| U.S. Stock Index Returns | ||||
| For the 12 months ended March 31, 2012 | ||||
| Russell 1000 Index (Large-Cap) | 7.86% | Russell 2000 Index (Small-Cap) | -0.18% | |
| Russell 1000 Growth Index | 11.02% | Russell 2000 Growth Index | 0.68% | |
| Russell 1000 Value Index | 4.79% | Russell 2000 Value Index | -1.07% | |
| Russell Midcap Index | 3.31% | |||
| Russell Midcap Growth Index | 4.43% | |||
| Russell Midcap Value Index | 2.28% | |||
4
| Total Returns as of March 31, 2012 | ||||||
| Average Annual Returns | ||||||
Ticker Symbol | 1 year | 5 years | 10 years | Since Inception | Inception Date | |
| Investor Class | REACX | 15.62% | -1.42% | 10.30% | 11.40% | 9/21/95(1) |
| MSCI U.S. REIT Index | — | 13.02% | -0.16% | 10.41% | 10.96%(2) | — |
| S&P 500 Index | — | 8.54% | 2.01% | 4.12% | 7.41%(2) | — |
| Institutional Class | REAIX | 15.86% | -1.22% | 10.52% | 9.67% | 6/16/97 |
A Class(3) No sales charge* With sales charge* | AREEX | 15.33% 8.68% | -1.66% -2.82% | 10.04% 9.39% | 10.97% 10.48% | 10/6/98 |
| C Class | ARYCX | 14.44% | — | — | -1.14% | 9/28/07 |
| R Class | AREWX | 15.01% | — | — | -0.66% | 9/28/07 |
| * | Sales charges include initial sales charges and contingent deferred sales charges (CDSCs), as applicable. A Class shares have a 5.75% maximum initial sales charge and may be subject to a maximum CDSC of 1.00%. C Class shares redeemed within 12 months of purchase are subject to a maximum CDSC of 1.00%. The SEC requires that mutual funds provide performance information net of maximum sales charges in all cases where charges could be applied. |
| (1) | The inception date for RREEF Real Estate Securities Fund, Real Estate’s predecessor. That fund merged with Real Estate on 6/13/97 and Real Estate was first offered to the public on 6/16/97. |
| (2) | Since 9/30/95, the date nearest the Investor Class’s inception for which data are available. |
| (3) | Prior to September 4, 2007, the A Class was referred to as the Advisor Class and did not have a front-end sales charge. Performance prior to that date has been adjusted to reflect this charge. |
Data presented reflect past performance. Past performance is no guarantee of future results. Current performance may be higher or lower than the performance shown. Investment return and principal value will fluctuate, and redemption value may be more or less than original cost. To obtain performance data current to the most recent month end, please call 1-800-345-2021 or visit americancentury.com. The fund may be subject to certain risks similar to those associated with direct investment in real estate including but not limited to: local or regional economic conditions, changes in zoning laws, changes in property values, property tax increases, overbuilding, increased competition, environmental contamination, natural disasters and interest rate risk. The fund’s investment process may result in high portfolio turnover, which could mean high transaction costs, affecting both performance and capital gains tax liabilities to investors.
Unless otherwise indicated, performance reflects Investor Class shares; performance for other share classes will vary due to differences in fee structure. For information about other share classes available, please consult the prospectus. Data assumes reinvestment of dividends and capital gains, and none of the charts reflect the deduction of taxes that a shareholder would pay on fund distributions or the redemption of fund shares. Returns for the indices are provided for comparison. The fund’s total returns include operating expenses (such as transaction costs and management fees) that reduce returns, while the total returns of the indices do not.
5
| Growth of $10,000 Over 10 Years |
| $10,000 investment made March 31, 2002 |
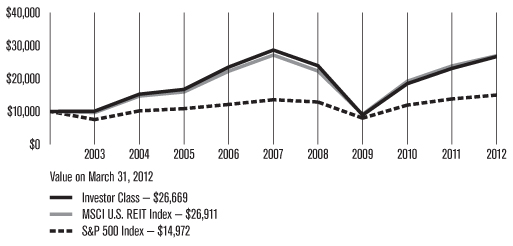
| Total Annual Fund Operating Expenses | ||||
| Investor Class | Institutional Class | A Class | C Class | R Class |
| 1.16% | 0.96% | 1.41% | 2.16% | 1.66% |
The total annual fund operating expenses shown is as stated in the fund’s prospectus current as of the date of this report. The prospectus may vary from the expense ratio shown elsewhere in this report because it is based on a different time period, includes acquired fund fees and expenses, and, if applicable, does not include fee waivers or expense reimbursements.
Data presented reflect past performance. Past performance is no guarantee of future results. Current performance may be higher or lower than the performance shown. Investment return and principal value will fluctuate, and redemption value may be more or less than original cost. To obtain performance data current to the most recent month end, please call 1-800-345-2021 or visit americancentury.com. The fund may be subject to certain risks similar to those associated with direct investment in real estate including but not limited to: local or regional economic conditions, changes in zoning laws, changes in property values, property tax increases, overbuilding, increased competition, environmental contamination, natural disasters and interest rate risk. The fund’s investment process may result in high portfolio turnover, which could mean high transaction costs, affecting both performance and capital gains tax liabilities to investors.
Unless otherwise indicated, performance reflects Investor Class shares; performance for other share classes will vary due to differences in fee structure. For information about other share classes available, please consult the prospectus. Data assumes reinvestment of dividends and capital gains, and none of the charts reflect the deduction of taxes that a shareholder would pay on fund distributions or the redemption of fund shares. Returns for the indices are provided for comparison. The fund’s total returns include operating expenses (such as transaction costs and management fees) that reduce returns, while the total returns of the indices do not.
6
Portfolio Manager: Steven Brown
Performance Summary
Real Estate posted a total return of 15.62%* for the fiscal year ended March 31, 2012. By comparison, the MSCI U.S. REIT Index (the fund’s benchmark) returned 13.02%, while the S&P 500 Index (a broad stock market measure) returned 8.54%.
REIT Market Overview
Real estate investment trusts (REITs) weathered some interim volatility but posted double-digit gains overall for the 12-month period, outperforming the broad equity market. REITs continued to benefit from low interest rates and the Federal Reserve’s efforts to stimulate economic growth, which led to better fundamentals in the commercial real estate market as supply remained muted while demand began to pick up. REITs also attracted demand for their relatively high dividend yields; with the Federal Reserve maintaining a near-zero interest rate policy and Treasury rates falling to historically low levels during the period, investors were drawn to higher-yielding investments such as REITs.
From a regional perspective, certain areas of the country experienced above-average economic growth during the 12 months. For example, California benefited from a resurgence in the technology sector, while strength in the energy industry boosted growth in Texas. Commercial property markets in these areas fared well during the period.
The top-performing sectors in the REIT market for the fiscal year included regional malls, self-storage, and apartments. Regional mall REITs rallied sharply thanks to improving consumer spending patterns among more affluent customers and a lack of new supply—no new malls opened across the country in 2011. Both self-storage and apartment REITs continued to benefit from the shift toward renting over home ownership. Apartment REITs enjoyed stronger demand and rising rental rates, while self-storage REITs saw occupancy levels increase as downsizing from homes to apartments led to a need for storage space.
Underperforming sectors in the REIT market included hotels, industrials, and health care. Hotel REITs were one of the only segments of the REIT market to decline for the 12-month period as they were disproportionally affected by the global economic slowdown during the first half of the period. Industrial REITs comprised another economically sensitive sector that lagged as economic activity weakened early in the period, while health care REITs faced uncertainty regarding reimbursement rates from the federal government.
Sector Allocation Added Value
The fund’s outperformance of its benchmark index during the reporting period was driven in part by favorable sector allocation. In particular, overweight positions compared with the index in regional mall, self-storage, and apartment REITs contributed positively to performance versus the index as these sectors outperformed. Furthermore, underweight positions in the lagging hotel and health care segments also boosted relative results.
*All fund returns referenced in this commentary are for Investor Class shares.
7
On the downside, exposure to real estate services and development companies detracted from performance versus the benchmark, though these segments made up just 1% of the portfolio on average during the period.
Stock Selection Also Contributed to Outperformance
Individual stock selection also contributed to the fund’s outperformance of its benchmark index. One of the best contributors was Taubman Centers, which owns a high-quality portfolio of regional mall properties throughout the United States. Taubman, which was the fund’s largest overweight position relative to the benchmark during the period, averaged sales of $600 per square foot on its properties in 2011, giving it the most productive portfolio in the mall industry. As a result, Taubman returned more than 40% for the reporting period.
Other top individual contributors included self-storage REIT Extra Space Storage and residential REIT American Campus Communities. Extra Space, based on the West Coast, benefited from strong demand in this region of the country, helping boost both occupancy and rental rates. The company also increased its dividend by 40% during the period. American Campus Communities, which owns and operates student housing facilities, was a direct beneficiary of the trend toward the outsourcing of student housing needs to private developers, particularly among state universities.
Real Estate Developers Detracted
Among individual holdings, real estate development company Forest City Enterprises had the biggest negative impact on performance versus the benchmark index. Forest City faced concerns about the company’s above-average debt levels and slow leasing progress in its property portfolio. After the end of the reporting period, the company made a management change.
Another notable detractor was office REIT SL Green, which owns office properties primarily in New York City. The company was adversely affected by the downturn in the financial services industry, which led to declining demand for office space on Wall Street.
Outlook
We remain constructive on the REIT market as we move through the remainder of 2012. Economic conditions should continue to improve thanks to stimulative policies by the Federal Reserve and other central banks around the world. In addition, occupancy rates in the commercial property sector are rising, and REITs are taking advantage of low interest rates to refinance their debt, resulting in considerable cost savings. These factors should provide a favorable backdrop for the REIT market over the balance of the year.
8
| MARCH 31, 2012 | |
| Top Ten Holdings | % of net assets |
| Simon Property Group, Inc. | 11.8% |
| Equity Residential | 5.3% |
| ProLogis, Inc. | 4.8% |
| Public Storage | 4.2% |
| Vornado Realty Trust | 4.2% |
| Host Hotels & Resorts, Inc. | 3.7% |
| AvalonBay Communities, Inc. | 3.7% |
| Ventas, Inc. | 3.3% |
| Boston Properties, Inc. | 3.3% |
| HCP, Inc. | 2.9% |
| Sub-Industry Allocation | % of net assets |
| Retail REITs | 25.8% |
| Specialized REITs | 20.6% |
| Residential REITs | 19.9% |
| Office REITs | 15.2% |
| Industrial REITs | 6.2% |
| Diversified REITs | 4.2% |
| Hotels, Resorts and Cruise Lines | 1.5% |
| Real Estate Operating Companies | 1.0% |
| Diversified Real Estate Activities | 1.0% |
| Real Estate Services | 0.6% |
| Cash and Equivalents* | 4.0% |
| *Includes temporary cash investments and other assets and liabilities. | |
| Types of Investments in Portfolio | % of net assets |
| Common Stocks | 96.0% |
| Temporary Cash Investments | 2.4% |
| Other Assets and Liabilities | 1.6% |
9
Fund shareholders may incur two types of costs: (1) transaction costs, including sales charges (loads) on purchase payments and redemption/exchange fees; and (2) ongoing costs, including management fees; distribution and service (12b-1) fees; and other fund expenses. This example is intended to help you understand your ongoing costs (in dollars) of investing in your fund and to compare these costs with the ongoing cost of investing in other mutual funds.
The example is based on an investment of $1,000 made at the beginning of the period and held for the entire period from October 1, 2011 to March 31, 2012.
Actual Expenses
The table provides information about actual account values and actual expenses for each class. You may use the information, together with the amount you invested, to estimate the expenses that you paid over the period. First, identify the share class you own. Then simply divide your account value by $1,000 (for example, an $8,600 account value divided by $1,000 = 8.6), then multiply the result by the number under the heading “Expenses Paid During Period” to estimate the expenses you paid on your account during this period.
If you hold Investor Class shares of any American Century Investments fund, or Institutional Class shares of the American Century Diversified Bond Fund, in an American Century Investments account (i.e., not a financial intermediary or retirement plan account), American Century Investments may charge you a $12.50 semiannual account maintenance fee if the value of those shares is less than $10,000. We will redeem shares automatically in one of your accounts to pay the $12.50 fee. In determining your total eligible investment amount, we will include your investments in all personal accounts (including American Century Investments Brokerage accounts) registered under your Social Security number. Personal accounts include individual accounts, joint accounts, UGMA/UTMA accounts, personal trusts, Coverdell Education Savings Accounts and IRAs (including traditional, Roth, Rollover, SEP-, SARSEP- and SIMPLE-IRAs), and certain other retirement accounts. If you have only business, business retirement, employer-sponsored or American Century Investments Brokerage accounts, you are currently not subject to this fee. If you are subject to the Account Maintenance Fee, your account value could be reduced by the fee amount.
Hypothetical Example for Comparison Purposes
The table also provides information about hypothetical account values and hypothetical expenses based on the actual expense ratio of each class of your fund and an assumed rate of return of 5% per year before expenses, which is not the actual return of a fund’s share class. The hypothetical account values and expenses may not be used to estimate the actual ending account balance or expenses you paid for the period. You may use this information to compare the ongoing costs of investing in your fund and other funds. To do so, compare this 5% hypothetical example with the 5% hypothetical examples that appear in the shareholder reports of the other funds.
10
Please note that the expenses shown in the table are meant to highlight your ongoing costs only and do not reflect any transactional costs, such as sales charges (loads) or redemption/exchange fees. Therefore, the table is useful in comparing ongoing costs only, and will not help you determine the relative total costs of owning different funds. In addition, if these transactional costs were included, your costs would have been higher.
Beginning Account Value 10/1/11 | Ending Account Value 3/31/12 | Expenses Paid During Period(1) 10/1/11 – 3/31/12 | Annualized Expense Ratio(1) | |
| Actual | ||||
| Investor Class | $1,000 | $1,282.60 | $6.62 | 1.16% |
| Institutional Class | $1,000 | $1,283.80 | $5.48 | 0.96% |
| A Class | $1,000 | $1,280.80 | $8.04 | 1.41% |
| C Class | $1,000 | $1,276.00 | $12.29 | 2.16% |
| R Class | $1,000 | $1,279.00 | $9.46 | 1.66% |
| Hypothetical | ||||
| Investor Class | $1,000 | $1,019.20 | $5.86 | 1.16% |
| Institutional Class | $1,000 | $1,020.20 | $4.85 | 0.96% |
| A Class | $1,000 | $1,017.95 | $7.11 | 1.41% |
| C Class | $1,000 | $1,014.20 | $10.88 | 2.16% |
| R Class | $1,000 | $1,016.70 | $8.37 | 1.66% |
| (1) | Expenses are equal to the class’s annualized expense ratio listed in the table above, multiplied by the average account value over the period, multiplied by 183, the number of days in the most recent fiscal half-year, divided by 366, to reflect the one-half year period. |
11
| Shares | Value | |||||||
| Common Stocks — 96.0% | ||||||||
| DIVERSIFIED REAL ESTATE ACTIVITIES — 1.0% | ||||||||
| Brookfield Asset Management, Inc. Class A | 344,200 | $10,866,394 | ||||||
| DIVERSIFIED REITs — 4.2% | ||||||||
| Vornado Realty Trust | 566,100 | 47,665,620 | ||||||
| HOTELS, RESORTS AND CRUISE LINES — 1.5% | ||||||||
| Starwood Hotels & Resorts Worldwide, Inc. | 142,900 | 8,060,989 | ||||||
| Wyndham Worldwide Corp. | 204,600 | 9,515,946 | ||||||
| 17,576,935 | ||||||||
| INDUSTRIAL REITs — 6.2% | ||||||||
| DCT Industrial Trust, Inc. | 1,668,500 | 9,844,150 | ||||||
First Industrial Realty Trust, Inc.(1) | 554,900 | 6,853,015 | ||||||
| ProLogis, Inc. | 1,518,900 | 54,710,778 | ||||||
| 71,407,943 | ||||||||
| OFFICE REITs — 15.2% | ||||||||
| Boston Properties, Inc. | 356,700 | 37,449,933 | ||||||
| Brandywine Realty Trust | 691,600 | 7,939,568 | ||||||
| Digital Realty Trust, Inc. | 342,000 | 25,297,740 | ||||||
| Douglas Emmett, Inc. | 815,300 | 18,596,993 | ||||||
| Duke Realty Corp. | 1,592,100 | 22,830,714 | ||||||
| Highwoods Properties, Inc. | 302,500 | 10,079,300 | ||||||
| Kilroy Realty Corp. | 490,700 | 22,871,527 | ||||||
| SL Green Realty Corp. | 362,800 | 28,135,140 | ||||||
| 173,200,915 | ||||||||
| REAL ESTATE OPERATING COMPANIES — 1.0% | ||||||||
Forest City Enterprises, Inc. Class A(1) | 728,200 | 11,403,612 | ||||||
| REAL ESTATE SERVICES — 0.6% | ||||||||
CBRE Group, Inc.(1) | 184,300 | 3,678,628 | ||||||
| Jones Lang LaSalle, Inc. | 32,600 | 2,715,906 | ||||||
| 6,394,534 | ||||||||
| RESIDENTIAL REITs — 19.9% | ||||||||
| Apartment Investment & Management Co., Class A | 902,800 | 23,842,948 | ||||||
| AvalonBay Communities, Inc. | 296,700 | 41,938,545 | ||||||
| BRE Properties, Inc. | 296,400 | 14,983,020 | ||||||
| Camden Property Trust | 306,900 | 20,178,675 | ||||||
| Education Realty Trust, Inc. | 716,100 | 7,762,524 | ||||||
| Equity Residential | 968,600 | 60,653,732 | ||||||
| Essex Property Trust, Inc. | 158,400 | 23,999,184 | ||||||
| Post Properties, Inc. | 301,500 | 14,128,290 | ||||||
| UDR, Inc. | 764,300 | 20,414,453 | ||||||
| 227,901,371 | ||||||||
| RETAIL REITs — 25.8% | ||||||||
| CBL & Associates Properties, Inc. | 540,500 | 10,226,260 | ||||||
| DDR Corp. | 1,485,500 | 21,688,300 | ||||||
| Equity One, Inc. | 393,500 | 7,956,570 | ||||||
| Federal Realty Investment Trust | 90,300 | 8,740,137 | ||||||
| General Growth Properties, Inc. | 1,515,100 | 25,741,549 | ||||||
| Glimcher Realty Trust | 913,700 | 9,338,014 | ||||||
| Kimco Realty Corp. | 973,500 | 18,749,610 | ||||||
| Macerich Co. (The) | 558,000 | 32,224,500 | ||||||
| Simon Property Group, Inc. | 924,300 | 134,652,024 | ||||||
| Taubman Centers, Inc. | 343,800 | 25,080,210 | ||||||
| 294,397,174 | ||||||||
| SPECIALIZED REITs — 20.6% | ||||||||
| CubeSmart | 46,400 | 552,160 | ||||||
| Extra Space Storage, Inc. | 375,400 | 10,807,766 | ||||||
| HCP, Inc. | 840,500 | 33,166,130 | ||||||
| Health Care REIT, Inc. | 522,600 | 28,722,096 | ||||||
| Host Hotels & Resorts, Inc. | 2,556,800 | 41,982,656 | ||||||
| LaSalle Hotel Properties | 617,600 | 17,379,264 | ||||||
| Public Storage | 345,900 | 47,793,003 | ||||||
Strategic Hotels & Resorts, Inc.(1) | 1,229,900 | 8,092,742 | ||||||
Sunstone Hotel Investors, Inc.(1) | 988,400 | 9,627,016 | ||||||
| Ventas, Inc. | 660,500 | 37,714,550 | ||||||
| 235,837,383 | ||||||||
TOTAL COMMON STOCKS (Cost $725,890,968) | 1,096,651,881 | |||||||
| Temporary Cash Investments — 2.4% | ||||||||
Repurchase Agreement, Bank America Merrill Lynch, (collateralized by various U.S. Treasury obligations, 6.125%, 11/15/27, valued at $9,985,339), in a joint trading account at 0.01%, dated 3/30/12, due 4/2/12 (Delivery value $9,779,879) | 9,779,871 | |||||||
Repurchase Agreement, Credit Suisse First Boston, Inc., (collateralized by various U.S. Treasury obligations, 4.375%, 5/15/41, valued at $6,226,771), in a joint trading account at 0.03%, dated 3/30/12, due 4/2/12 (Delivery value $6,112,434) | 6,112,419 | |||||||
Repurchase Agreement, Goldman Sachs & Co., (collateralized by various U.S. Treasury obligations, 4.50%, 5/15/38, valued at $7,496,271), in a joint trading account at 0.03%, dated 3/30/12, due 4/2/12 (Delivery value $7,334,921) | 7,334,903 | |||||||
12
| Shares | Value | |||||||
| SSgA U.S. Government Money Market Fund | 4,154,473 | $4,154,473 | ||||||
TOTAL TEMPORARY CASH INVESTMENTS (Cost $27,381,666) | 27,381,666 | |||
TOTAL INVESTMENT SECURITIES — 98.4% (Cost $753,272,634) | 1,124,033,547 | |||
| OTHER ASSETS AND LIABILITIES — 1.6% | 18,765,116 | |||
| TOTAL NET ASSETS — 100.0% | $1,142,798,663 |
Notes to Schedule of Investments
REIT = Real Estate Investment Trust
| (1) | Non-income producing. |
See Notes to Financial Statements.
13
| MARCH 31, 2012 | ||||
| Assets | ||||
| Investment securities, at value (cost of $753,272,634) | $1,124,033,547 | |||
| Receivable for investments sold | 12,965,425 | |||
| Receivable for capital shares sold | 23,683,253 | |||
| Dividends and interest receivable | 2,259,018 | |||
| 1,162,941,243 | ||||
| Liabilities | ||||
| Payable for investments purchased | 18,183,290 | |||
| Payable for capital shares redeemed | 923,277 | |||
| Accrued management fees | 1,004,635 | |||
| Distribution and service fees payable | 31,378 | |||
| 20,142,580 | ||||
| Net Assets | $1,142,798,663 | |||
| Net Assets Consist of: | ||||
| Capital (par value and paid-in surplus) | $1,305,453,275 | |||
| Accumulated net realized loss | (533,415,525 | ) | ||
| Net unrealized appreciation | 370,760,913 | |||
| $1,142,798,663 | ||||
| Net assets | Shares outstanding | Net asset value per share | |
| Investor Class, $0.01 Par Value | $696,245,283 | 31,158,409 | $22.35 |
| Institutional Class, $0.01 Par Value | $290,557,157 | 12,972,209 | $22.40 |
| A Class, $0.01 Par Value | $151,198,345 | 6,764,343 | $22.35* |
| C Class, $0.01 Par Value | $2,573,815 | 116,384 | $22.11 |
| R Class, $0.01 Par Value | $2,224,063 | 99,857 | $22.27 |
*Maximum offering price $23.71 (net asset value divided by 0.9425).
See Notes to Financial Statements.
14
| YEAR ENDED MARCH 31, 2012 | ||||
| Investment Income (Loss) | ||||
| Income: | ||||
| Dividends | $20,357,649 | |||
| Interest | 6,416 | |||
| 20,364,065 | ||||
| Expenses: | ||||
| Management fees | 11,249,558 | |||
| Distribution and service fees: | ||||
| A Class | 336,281 | |||
| B Class | 467 | |||
| C Class | 18,680 | |||
| R Class | 8,818 | |||
| Directors’ fees and expenses | 43,760 | |||
| Other expenses | 1,319 | |||
| 11,658,883 | ||||
| Net investment income (loss) | 8,705,182 | |||
| Realized and Unrealized Gain (Loss) | ||||
| Net realized gain (loss) on investment transactions | 66,741,271 | |||
| Change in net unrealized appreciation (depreciation) on investments | 66,043,274 | |||
| Net realized and unrealized gain (loss) | 132,784,545 | |||
| Net Increase (Decrease) in Net Assets Resulting from Operations | $141,489,727 | |||
See Notes to Financial Statements.
15
| YEARS ENDED MARCH 31, 2012 AND MARCH 31, 2011 | |||||||
| Increase (Decrease) in Net Assets | March 31, 2012 | March 31, 2011 | |||||
| Operations | |||||||
| Net investment income (loss) | $8,705,182 | $7,560,401 | |||||
| Net realized gain (loss) | 66,741,271 | 200,334,854 | |||||
| Change in net unrealized appreciation (depreciation) | 66,043,274 | 10,715,797 | |||||
| Net increase (decrease) in net assets resulting from operations | 141,489,727 | 218,611,052 | |||||
| Distributions to Shareholders | |||||||
| From net investment income: | |||||||
| Investor Class | (7,773,868 | ) | (5,541,757 | ) | |||
| Institutional Class | (3,905,445 | ) | (2,952,541 | ) | |||
| A Class | (1,436,579 | ) | (1,046,525 | ) | |||
| B Class | — | (229 | ) | ||||
| C Class | (15,776 | ) | (3,154 | ) | |||
| R Class | (18,401 | ) | (3,917 | ) | |||
| Decrease in net assets from distributions | (13,150,069 | ) | (9,548,123 | ) | |||
| Capital Share Transactions | |||||||
| Net increase (decrease) in net assets from capital share transactions | (33,113,657 | ) | (96,616,583 | ) | |||
| Net increase (decrease) in net assets | 95,226,001 | 112,446,346 | |||||
| Net Assets | |||||||
| Beginning of period | 1,047,572,662 | 935,126,316 | |||||
| End of period | $1,142,798,663 | $1,047,572,662 | |||||
| Accumulated net investment loss | — | $(1,919 | ) | ||||
See Notes to Financial Statements.
16
MARCH 31, 2012
1. Organization
American Century Capital Portfolios, Inc. (the corporation) is registered under the Investment Company Act of 1940, as amended (the 1940 Act), as an open-end management investment company and is organized as a Maryland corporation. Real Estate Fund (the fund) is one fund in a series issued by the corporation. The fund is nondiversified as defined under the 1940 Act. The fund’s investment objective is to seek high total investment return through a combination of capital appreciation and current income. The fund pursues its objective by investing primarily in equity securities issued by real estate investment trusts and companies engaged in the real estate industry.
The fund is authorized to issue the Investor Class, the Institutional Class, the A Class, the B Class, the C Class and the R Class. The A Class may incur an initial sales charge. The A Class, B Class and C Class may be subject to a contingent deferred sales charge. The share classes differ principally in their respective sales charges and distribution and shareholder servicing expenses and arrangements. The Institutional Class is made available to institutional shareholders or through financial intermediaries whose clients do not require the same level of shareholder and administrative services as shareholders of other classes. As a result, the Institutional Class is charged a lower unified management fee. On October 21, 2011, all outstanding B class shares were converted to A Class shares and the fund discontinued issuance of the B Class.
2. Significant Accounting Policies
The following is a summary of significant accounting policies consistently followed by the fund in preparation of its financial statements. The financial statements are prepared in conformity with accounting principles generally accepted in the United States of America, which may require management to make certain estimates and assumptions at the date of the financial statements. Actual results could differ from these estimates.
Investment Valuations — The fund determines the fair value of its investments and computes its net asset value per share as of the close of regular trading (usually 4 p.m. Eastern time) on the New York Stock Exchange (NYSE) on each day the NYSE is open.
Equity securities that are listed or traded on a domestic securities exchange are valued at the last reported sales price or at the official closing price as provided by the exchange. Equity securities traded on foreign securities exchanges are typically valued at the closing price on the exchange where primarily traded or as of the close of the NYSE, if that is earlier. If no last sales price is reported, or if local convention or regulation so provides, the mean of the latest bid and asked prices is used. Depending on local convention or regulation, securities traded over-the-counter are valued at the mean of the latest bid and asked prices, the last sales price, or the official closing price. In its determination of fair value, the fund may review several factors including: market information specific to a security; news developments in U.S. and foreign markets; the performance of particular U.S. and foreign securities, indices, comparable securities, American Depositary Receipts, Exchange-Traded Funds, and other relevant market indicators.
Debt securities maturing within 60 days at the time of purchase may be valued at cost, plus or minus any amortized discount or premium or at the evaluated mean as provided by an independent pricing service. Evaluated mean prices are commonly derived through utilization of market models, which may consider, among other factors, trade data, quotations from dealers and active market makers, relevant yield curve and spread data, related sector levels, creditworthiness, and other relevant market information on the same or comparable securities.
Investments in open-end management investment companies are valued at the reported net asset value per share. Repurchase agreements are valued at cost.
If the fund determines that the market price for a portfolio security is not readily available or the valuation methods mentioned above do not reflect a security’s fair value, such security is valued as determined in good faith by the Board of Directors or its designee, in
17
accordance with procedures adopted by the Board of Directors. Circumstances that may cause the fund to use these procedures to value a security include, but are not limited to: a security has been declared in default; trading in a security has been halted during the trading day; there is a foreign market holiday and no trading occurred; or an event occurred between the close of a foreign exchange and the NYSE that may affect the value of a security.
Security Transactions — Security transactions are accounted for as of the trade date. Net realized gains and losses are determined on the identified cost basis, which is also used for federal income tax purposes.
Investment Income — Dividend income less foreign taxes withheld, if any, is recorded as of the ex-dividend date. Distributions received on securities that represent a return of capital or capital gain are recorded as a reduction of cost of investments and/or as a realized gain. The fund estimates the components of distributions received that may be considered nontaxable distributions or capital gain distributions for income tax purposes. Interest income is recorded on the accrual basis and includes accretion of discounts and amortization of premiums.
Repurchase Agreements — The fund may enter into repurchase agreements with institutions that American Century Investment Management, Inc. (ACIM) (the investment advisor) has determined are creditworthy pursuant to criteria adopted by the Board of Directors. The fund requires that the collateral, represented by securities, received in a repurchase transaction be transferred to the custodian in a manner sufficient to enable the fund to obtain those securities in the event of a default under the repurchase agreement. ACIM monitors, on a daily basis, the securities transferred to ensure the value, including accrued interest, of the securities under each repurchase agreement is equal to or greater than amounts owed to the fund under each repurchase agreement.
Joint Trading Account — Pursuant to an Exemptive Order issued by the Securities and Exchange Commission, the fund, along with certain other funds in the American Century Investments family of funds, may transfer uninvested cash balances into a joint trading account. These balances are invested in one or more repurchase agreements that are collateralized by U.S. Treasury or Agency obligations.
Income Tax Status — It is the fund’s policy to distribute substantially all net investment income and net realized gains to shareholders and to otherwise qualify as a regulated investment company under provisions of the Internal Revenue Code. The fund is no longer subject to examination by tax authorities for years prior to 2009. At this time, management believes there are no uncertain tax positions which, based on their technical merit, would not be sustained upon examination and for which it is reasonably possible that the total amounts of unrecognized tax benefits will significantly change in the next twelve months. Accordingly, no provision has been made for federal or state income taxes.
Multiple Class — All shares of the fund represent an equal pro rata interest in the net assets of the class to which such shares belong, and have identical voting, dividend, liquidation and other rights and the same terms and conditions, except for class specific expenses and exclusive rights to vote on matters affecting only individual classes. Income, non-class specific expenses, and realized and unrealized capital gains and losses of the fund are allocated to each class of shares based on their relative net assets.
Distributions to Shareholders — Distributions from net investment income, if any, are generally declared and paid quarterly. Distributions from net realized gains, if any, are generally declared and paid annually.
Indemnifications — Under the corporation’s organizational documents, its officers and directors are indemnified against certain liabilities arising out of the performance of their duties to the fund. In addition, in the normal course of business, the fund enters into contracts that provide general indemnifications. The maximum exposure under these arrangements is unknown as this would involve future claims that may be made against a fund. The risk of material loss from such claims is considered by management to be remote.
18
3. Fees and Transactions with Related Parties
Management Fees — The corporation has entered into a management agreement with ACIM, under which ACIM provides the fund with investment advisory and management services in exchange for a single, unified management fee (the fee) per class. The agreement provides that all expenses of managing and operating the fund, except distribution and service fees, brokerage expenses, taxes, interest, fees and expenses of the independent directors (including legal counsel fees), and extraordinary expenses, will be paid by ACIM. The fee is computed and accrued daily based on each class’s daily net assets and paid monthly in arrears. The rate of the fee is determined by applying a fee rate calculation formula. This formula takes into account the fund’s assets as well as certain assets, if any, of other clients of the investment advisor outside the American Century Investments family of funds (such as subadvised funds and separate accounts) that have very similar investment teams and investment strategies (strategy assets). The annual management fee schedule ranges from 1.05% to 1.20% for the Investor Class, A Class, B Class, C Class and R Class. The Institutional Class is 0.20% less at each point within the range. The effective annual management fee for each class for the year ended March 31, 2012 was 1.16% for the Investor Class, A Class, C Class and R Class and 0.96% for the Institutional Class.
Distribution and Service Fees — The Board of Directors has adopted a separate Master Distribution and Individual Shareholder Services Plan for each of the A Class, B Class, C Class and R Class (collectively the plans), pursuant to Rule 12b-1 of the 1940 Act. The plans provide that the A Class will pay American Century Investment Services, Inc. (ACIS) an annual distribution and service fee of 0.25%. The plans provide that the B Class and C Class will each pay ACIS an annual distribution and service fee of 1.00%, of which 0.25% is paid for individual shareholder services and 0.75% is paid for distribution services. The plans provide that the R Class will pay ACIS an annual distribution and service fee of 0.50%. The fees are computed and accrued daily based on each class’s daily net assets and paid monthly in arrears. The fees are used to pay financial intermediaries for distribution and individual shareholder services. Fees incurred under the plans during the year ended March 31, 2012 are detailed in the Statement of Operations.
Related Parties — Certain officers and directors of the corporation are also officers and/or directors of American Century Companies, Inc. (ACC), the parent of the corporation’s investment advisor, ACIM, the distributor of the corporation, ACIS, and the corporation’s transfer agent, American Century Services, LLC. Various funds in a series issued by American Century Asset Allocation Portfolios, Inc. (ACAAP) own, in aggregate, 13% of the shares of the fund. ACAAP does not invest in the fund for the purpose of exercising management or control.
The fund was eligible to invest in a money market fund for temporary purposes, which is managed by J.P. Morgan Investment Management, Inc. (JPMIM). The fund had a securities lending agreement with JPMorgan Chase Bank (JPMCB) and a mutual funds services agreement with J.P. Morgan Investor Services Co. (JPMIS). JPMCB was a custodian of the fund. JPMIM, JPMIS and JPMCB are wholly owned subsidiaries of JPMorgan Chase & Co. (JPM). Prior to August 31, 2011, JPM was an equity investor in ACC. The services provided to the fund by JPMIM, JPMIS and JPMCB terminated on July 31, 2011.
4. Investment Transactions
Purchases and sales of investment securities, excluding short-term investments, for the year ended March 31, 2012 were $1,720,094,213 and $1,790,855,445, respectively.
19
5. Capital Share Transactions
Transactions in shares of the fund were as follows:
| Year ended March 31, 2012 | Year ended March 31, 2011 | ||||||||||||||
| Shares | Amount | Shares | Amount | ||||||||||||
| Investor Class/Shares Authorized | 150,000,000 | 150,000,000 | |||||||||||||
| Sold | 10,880,030 | $221,561,441 | 9,936,153 | $171,304,273 | |||||||||||
| Issued in reinvestment of distributions | 376,842 | 7,595,460 | 293,260 | 5,155,307 | |||||||||||
| Redeemed | (11,017,255 | ) | (217,677,225 | ) | (15,118,463 | ) | (258,085,198 | ) | |||||||
| 239,617 | 11,479,676 | (4,889,050 | ) | (81,625,618 | ) | ||||||||||
| Institutional Class/Shares Authorized | 75,000,000 | 75,000,000 | |||||||||||||
| Sold | 3,184,340 | 64,220,181 | 5,250,292 | 90,751,885 | |||||||||||
| Issued in reinvestment of distributions | 191,040 | 3,846,085 | 165,593 | 2,916,541 | |||||||||||
| Redeemed | (5,577,862 | ) | (107,633,958 | ) | (4,792,589 | ) | (84,080,224 | ) | |||||||
| (2,202,482 | ) | (39,567,692 | ) | 623,296 | 9,588,202 | ||||||||||
| A Class/Shares Authorized | 40,000,000 | 40,000,000 | |||||||||||||
| Sold | 2,997,190 | 61,932,215 | 2,827,581 | 49,364,023 | |||||||||||
| Issued in reinvestment of distributions | 69,670 | 1,411,296 | 58,754 | 1,035,857 | |||||||||||
| Redeemed | (3,508,480 | ) | (69,618,846 | ) | (4,408,803 | ) | (76,067,947 | ) | |||||||
| (441,620 | ) | (6,275,335 | ) | (1,522,468 | ) | (25,668,067 | ) | ||||||||
| B Class/Shares Authorized | 5,000,000 | 5,000,000 | |||||||||||||
| Sold | — | — | 290 | 4,972 | |||||||||||
| Issued in reinvestment of distributions | — | — | 13 | 229 | |||||||||||
| Redeemed | (4,495 | ) | (85,823 | ) | (1,598 | ) | (28,164 | ) | |||||||
| (4,495 | ) | (85,823 | ) | (1,295 | ) | (22,963 | ) | ||||||||
| C Class/Shares Authorized | 5,000,000 | 5,000,000 | |||||||||||||
| Sold | 59,962 | 1,222,030 | 30,885 | 544,430 | |||||||||||
| Issued in reinvestment of distributions | 657 | 13,257 | 165 | 2,914 | |||||||||||
| Redeemed | (26,132 | ) | (503,556 | ) | (11,531 | ) | (196,244 | ) | |||||||
| 34,487 | 731,731 | 19,519 | 351,100 | ||||||||||||
| R Class/Shares Authorized | 5,000,000 | 5,000,000 | |||||||||||||
| Sold | 62,654 | 1,256,865 | 46,748 | 851,148 | |||||||||||
| Issued in reinvestment of distributions | 901 | 18,313 | 218 | 3,871 | |||||||||||
| Redeemed | (33,454 | ) | (671,392 | ) | (5,337 | ) | (94,256 | ) | |||||||
| 30,101 | 603,786 | 41,629 | 760,763 | ||||||||||||
| Net increase (decrease) | (2,344,392 | ) | $(33,113,657 | ) | (5,728,369 | ) | $(96,616,583 | ) | |||||||
20
6. Fair Value Measurements
The fund’s securities valuation process is based on several considerations and may use multiple inputs to determine the fair value of the positions held by the fund. In conformity with accounting principles generally accepted in the United States of America, the inputs used to determine a valuation are classified into three broad levels as follows:
| • | Level 1 valuation inputs consist of unadjusted quoted prices in an active market for identical securities; |
| • | Level 2 valuation inputs consist of direct or indirect observable market data (including quoted prices for similar securities, evaluations of subsequent market events, interest rates, prepayment speeds, credit risk, etc.); or |
| • | Level 3 valuation inputs consist of unobservable data (including a fund’s own assumptions). |
The level classification is based on the lowest level input that is significant to the fair valuation measurement. The valuation inputs are not necessarily an indication of the risks associated with investing in these securities or other financial instruments.
The following is a summary of the level classifications as of period end. The Schedule of Investments provides additional information on the fund’s portfolio holdings.
| Level 1 | Level 2 | Level 3 | |
| Investment Securities | |||
| Common Stocks | $1,096,651,881 | — | — |
| Temporary Cash Investments | 4,154,473 | $23,227,193 | — |
| Total Value of Investment Securities | $1,100,806,354 | $23,227,193 | — |
7. Risk Factors
The fund concentrates its investments in a narrow segment of the total market. Because of this, the fund is subject to certain additional risks as compared to investing in a more diversified portfolio of investments. The fund may be subject to certain risks similar to those associated with direct investment in real estate including but not limited to: local or regional economic conditions, changes in zoning laws, changes in property values, property tax increases, overbuilding, increased competition, environmental contamination, natural disasters, and interest rate risk.
The fund’s investment process may result in high portfolio turnover, which could mean high transaction costs, affecting both performance and capital gains tax liabilities to investors.
21
8. Federal Tax Information
The tax character of distributions paid during the years ended March 31, 2012 and March 31, 2011 were as follows:
| 2012 | 2011 | |
| Distributions Paid From | ||
| Ordinary income | $13,150,069 | $9,548,123 |
| Long-term capital gains | — | — |
The book-basis character of distributions made during the year from net investment income or net realized gains may differ from their ultimate characterization for federal income tax purposes. These differences reflect the differing character of certain income items and net realized gains and losses for financial statement and tax purposes, and may result in reclassification among certain capital accounts on the financial statements.
As of March 31, 2012, the federal tax cost of investments and the components of distributable earnings on a tax-basis were as follows:
| Federal tax cost of investments | $825,109,072 | |
| Gross tax appreciation of investments | $299,139,450 | |
| Gross tax depreciation of investments | (214,975 | ) |
| Net tax appreciation (depreciation) of investments | $298,924,475 | |
| Undistributed ordinary income | — | |
| Accumulated capital losses | $(461,579,087 | ) |
The difference between book-basis and tax-basis cost and unrealized appreciation (depreciation) is attributable primarily to the tax deferral of losses on wash sales.
The accumulated capital losses represent net capital loss carryovers that may be used to offset future realized capital gains for federal income tax purposes. Future capital loss carryover utilization in any given year may be subject to Internal Revenue Code limitations. Capital loss carryovers expire in 2018. The Regulated Investment Company Modernization Act of 2010 allows the fund to carry forward capital losses incurred in future taxable years for an unlimited period. Any losses incurred during future taxable years will be required to be utilized prior to the losses which carry an expiration date. As a result, capital loss carryforwards may be more likely to expire unused.
22
| For a Share Outstanding Throughout the Years Ended March 31 (except as noted) | |||||||||||||
| Per-Share Data | Ratios and Supplemental Data | ||||||||||||
| Income From Investment Operations: | Distributions From: | Ratio to Average Net Assets of: | |||||||||||
Net Asset Value, Beginning of Period | Net Investment Income (Loss)(1) | Net Realized and Unrealized Gain (Loss) | Total From Investment Operations | Net Investment Income | Net Realized Gains | Total Distributions | Net Asset Value, End of Period | Total Return(2) | Operating Expenses | Net Investment Income (Loss) | Portfolio Turnover Rate | Net Assets, End of Period (in thousands) | |
| Investor Class | |||||||||||||
| 2012 | $19.58 | 0.17 | 2.87 | 3.04 | (0.27) | — | (0.27) | $22.35 | 15.62% | 1.16% | 0.83% | 168% | $696,245 |
| 2011 | $15.79 | 0.13 | 3.83 | 3.96 | (0.17) | — | (0.17) | $19.58 | 25.19% | 1.16% | 0.76% | 238% | $605,529 |
| 2010 | $7.80 | 0.28 | 8.01 | 8.29 | (0.30) | — | (0.30) | $15.79 | 107.30% | 1.16% | 2.24% | 236% | $565,463 |
| 2009 | $21.67 | 0.46 | (13.91) | (13.45) | (0.42) | — | (0.42) | $7.80 | (62.80)% | 1.15% | 2.87% | 109% | $361,510 |
| 2008 | $31.37 | 0.43 | (5.53) | (5.10) | (0.51) | (4.09) | (4.60) | $21.67 | (16.60)% | 1.14% | 1.60% | 153% | $864,011 |
| Institutional Class | |||||||||||||
| 2012 | $19.62 | 0.21 | 2.87 | 3.08 | (0.30) | — | (0.30) | $22.40 | 15.86% | 0.96% | 1.03% | 168% | $290,557 |
| 2011 | $15.81 | 0.17 | 3.84 | 4.01 | (0.20) | — | (0.20) | $19.62 | 25.48% | 0.96% | 0.96% | 238% | $297,740 |
| 2010 | $7.81 | 0.30 | 8.03 | 8.33 | (0.33) | — | (0.33) | $15.81 | 107.71% | 0.96% | 2.44% | 236% | $230,109 |
| 2009 | $21.71 | 0.50 | (13.94) | (13.44) | (0.46) | — | (0.46) | $7.81 | (62.73)% | 0.95% | 3.07% | 109% | $104,565 |
| 2008 | $31.41 | 0.48 | (5.54) | (5.06) | (0.55) | (4.09) | (4.64) | $21.71 | (16.44)% | 0.94% | 1.80% | 153% | $200,982 |
A Class(3) | |||||||||||||
| 2012 | $19.60 | 0.11 | 2.87 | 2.98 | (0.23) | — | (0.23) | $22.35 | 15.33% | 1.41% | 0.58% | 168% | $151,198 |
| 2011 | $15.81 | 0.09 | 3.83 | 3.92 | (0.13) | — | (0.13) | $19.60 | 24.92% | 1.41% | 0.51% | 238% | $141,257 |
| 2010 | $7.81 | 0.24 | 8.02 | 8.26 | (0.26) | — | (0.26) | $15.81 | 106.76% | 1.41% | 1.99% | 236% | $138,037 |
| 2009 | $21.69 | 0.42 | (13.94) | (13.52) | (0.36) | — | (0.36) | $7.81 | (62.88)% | 1.40% | 2.62% | 109% | $84,568 |
| 2008 | $31.41 | 0.36 | (5.53) | (5.17) | (0.46) | (4.09) | (4.55) | $21.69 | (16.84)% | 1.39% | 1.35% | 153% | $253,419 |
23
| For a Share Outstanding Throughout the Years Ended March 31 (except as noted) | |||||||||||||
| Per-Share Data | Ratios and Supplemental Data | ||||||||||||
| Income From Investment Operations: | Distributions From: | Ratio to Average Net Assets of: | |||||||||||
Net Asset Value, Beginning of Period | Net Investment Income (Loss)(1) | Net Realized and Unrealized Gain (Loss) | Total From Investment Operations | Net Investment Income | Net Realized Gains | Total Distributions | Net Asset Value, End of Period | Total Return(2) | Operating Expenses | Net Investment Income (Loss) | Portfolio Turnover Rate | Net Assets, End of Period (in thousands) | |
| C Class | |||||||||||||
| 2012 | $19.48 | (0.02) | 2.82 | 2.80 | (0.17) | — | (0.17) | $22.11 | 14.44% | 2.16% | (0.17)% | 168% | $2,574 |
| 2011 | $15.75 | (0.04) | 3.82 | 3.78 | (0.05) | — | (0.05) | $19.48 | 24.00% | 2.16% | (0.24)% | 238% | $1,595 |
| 2010 | $7.78 | 0.14 | 7.99 | 8.13 | (0.16) | — | (0.16) | $15.75 | 105.21% | 2.16% | 1.24% | 236% | $983 |
| 2009 | $21.62 | 0.35 | (13.90) | (13.55) | (0.29) | — | (0.29) | $7.78 | (63.12)% | 2.15% | 1.87% | 109% | $334 |
2008(4) | $29.12 | 0.13 | (3.41) | (3.28) | (0.13) | (4.09) | (4.22) | $21.62 | (11.57)% | 2.14%(5) | 1.15%(5) | 153%(6) | $62 |
| R Class | |||||||||||||
| 2012 | $19.55 | 0.08 | 2.84 | 2.92 | (0.20) | — | (0.20) | $22.27 | 15.01% | 1.66% | 0.33% | 168% | $2,224 |
| 2011 | $15.78 | 0.06 | 3.81 | 3.87 | (0.10) | — | (0.10) | $19.55 | 24.60% | 1.66% | 0.26% | 238% | $1,364 |
| 2010 | $7.79 | 0.21 | 8.01 | 8.22 | (0.23) | — | (0.23) | $15.78 | 106.38% | 1.66% | 1.74% | 236% | $444 |
| 2009 | $21.65 | 0.44 | (13.96) | (13.52) | (0.34) | — | (0.34) | $7.79 | (62.98)% | 1.65% | 2.37% | 109% | $127 |
2008(4) | $29.12 | 0.19 | (3.41) | (3.22) | (0.16) | (4.09) | (4.25) | $21.65 | (11.37)% | 1.64%(5) | 1.65%(5) | 153%(6) | $26 |
Notes to Financial Highlights
| (1) | Computed using average shares outstanding throughout the period. |
| (2) | Total returns are calculated based on the net asset value of the last business day and do not reflect applicable sales charges, if any. Total returns for periods less than one year are not annualized. |
| (3) | Prior to September 4, 2007, the A Class was referred to as the Advisor Class. |
| (4) | September 28, 2007 (commencement of sale) through March 31, 2008. |
| (5) | Annualized. |
| (6) | Portfolio turnover is calculated at the fund level. Percentage indicated was calculated for the year ended March 31, 2008. |
See Notes to Financial Statements.
24
To the Board of Directors and Shareholders of
American Century Capital Portfolios, Inc.:
We have audited the accompanying statement of assets and liabilities, including the schedule of investments, of Real Estate Fund, one of the funds constituting American Century Capital Portfolios, Inc. (the “Corporation”) as of March 31, 2012, and the related statement of operations for the year then ended, the statements of changes in net assets for each of the two years in the period then ended, and the financial highlights for each of the five years in the period then ended. These financial statements and financial highlights are the responsibility of the Corporation’s management. Our responsibility is to express an opinion on these financial statements and financial highlights based on our audits.
We conducted our audits in accordance with the standards of the Public Company Accounting Oversight Board (United States). Those standards require that we plan and perform the audit to obtain reasonable assurance about whether the financial statements and financial highlights are free of material misstatement. The Corporation is not required to have, nor were we engaged to perform, an audit of its internal control over financial reporting. Our audits included consideration of internal control over financial reporting as a basis for designing audit procedures that are appropriate in the circumstances, but not for the purpose of expressing an opinion on the effectiveness of the Corporation’s internal control over financial reporting. Accordingly, we express no such opinion. An audit also includes examining, on a test basis, evidence supporting the amounts and disclosures in the financial statements, assessing the accounting principles used and significant estimates made by management, as well as evaluating the overall financial statement presentation. Our procedures included confirmation of securities owned as of March 31, 2012, by correspondence with the custodian and brokers; where replies were not received from brokers, we performed other auditing procedures. We believe that our audits provide a reasonable basis for our opinion.
In our opinion, such financial statements and financial highlights referred to above present fairly, in all material respects, the financial position of Real Estate Fund of American Century Capital Portfolios, Inc., as of March 31, 2012, the results of its operations for the year then ended, the changes in its net assets for each of the two years in the period then ended, and the financial highlights for each of the five years in the period then ended, in conformity with accounting principles generally accepted in the United States of America.
Deloitte & Touche LLP
Kansas City, Missouri
May 16, 2012
25
The individuals listed below serve as directors of the funds. Each director will continue to serve in this capacity until death, retirement, resignation or removal from office. The mandatory retirement age for directors who are not “interested persons,” as that term is defined in the Investment Company Act (independent directors), is 72. However, the mandatory retirement age for an individual director may be extended with the approval of the remaining independent directors.
Mr. Thomas is an “interested person” because he currently serves as President and Chief Executive Officer of American Century Companies, Inc. (ACC), the parent company of American Century Investment Management, Inc. (ACIM or the advisor). Mr. Fink is an “interested person” because he currently serves as Executive Vice President and Chief Operating Officer of ACC.
The other directors (more than three-fourths of the total number) are independent; that is, they have never been employees, directors or officers of, and have no financial interest in, ACC or any of its wholly owned, direct or indirect, subsidiaries, including ACIM, American Century Investment Services, Inc. (ACIS) and American Century Services, LLC (ACS). The directors serve in this capacity for seven (in the case of Mr. Thomas, 15) registered investment companies in the American Century Investments family of funds.
The following table presents additional information about the directors. The mailing address for each director is 4500 Main Street, Kansas City, Missouri 64111.
Name (Year of Birth) | Position(s) Held with Funds | Length of Time Served | Principal Occupation(s) During Past 5 Years | Number of American Century Portfolios Overseen by Director | Other Directorships Held During Past 5 Years | |
| Independent Directors | ||||||
Thomas A. Brown (1940) | Director | Since 1980 | Managing Member, Associated Investments, LLC (real estate investment company); Brown Cascade Properties, LLC (real estate investment company) (2001 to 2009) | 66 | None | |
Andrea C. Hall (1945) | Director | Since 1997 | Retired | 66 | None | |
Jan M. Lewis (1957) | Director | Since 2011 | President and Chief Executive Officer, Catholic Charities of Northeast Kansas(human services organization) (2006 to present) | 66 | None | |
James A. Olson (1942) | Director | Since 2007 | Member, Plaza Belmont LLC (private equity fund manager) | 66 | Saia, Inc. (2002 to 2012) and Entertainment Properties Trust | |
Donald H. Pratt (1937) | Director and Chairman of the Board | Since 1995 (Chairman since 2005) | Chairman and Chief Executive Officer, Western Investments, Inc. (real estate company) | 66 | None | |
26
Name (Year of Birth) | Position(s) Held with Funds | Length of Time Served | Principal Occupation(s) During Past 5 Years | Number of American Century Portfolios Overseen by Director | Other Directorships Held During Past 5 Years | |
| Independent Directors | ||||||
M. Jeannine Strandjord (1945) | Director | Since 1994 | Retired | 66 | DST Systems Inc., Euronet Worldwide Inc., and Charming Shoppes, Inc. (2006 to 2010) | |
John R. Whitten (1946) | Director | Since 2008 | Project Consultant, Celanese Corp. (industrial chemical company) | 66 | Rudolph Technologies, Inc. | |
Stephen E. Yates (1948) | Director | Since 2012 | Retired; Executive Vice President, Technology & Operations, KeyCorp. (computer services) (2004 to 2010) | 66 | Applied Industrial Technology (2001 to 2010) | |
| Interested Directors | ||||||
Barry Fink (1955) | Director and Executive Vice President | Since 2012 (Executive Vice President since 2007) | Chief Operating Officer and Executive Vice President, ACC (September 2007 to present); President, ACS (October 2007 to present); Managing Director, Morgan Stanley (2000 to 2007). Also serves as Manager, ACS and Director, ACC and certain ACC subsidiaries | 66 | None | |
Jonathan S. Thomas (1963) | Director and President | Since 2007 | President and Chief Executive Officer, ACC (March 2007 to present); Chief Administrative Officer, ACC (February 2006 to February 2007); Executive Vice President, ACC (November 2005 to February 2007). Also serves as Chief Executive Officer and Manager, ACS; Executive Vice President, ACIM; Director, ACC, ACIM and other ACC subsidiaries | 108 | None | |
27
Officers
The following table presents certain information about the executive officers of the funds. Each officer serves as an officer for each of the 15 investment companies in the American Century family of funds, unless otherwise noted. No officer is compensated for his or her service as an officer of the funds. The listed officers are interested persons of the funds and are appointed or re-appointed on an annual basis. The mailing address for each officer listed below is 4500 Main Street, Kansas City, Missouri 64111.
Name (Year of Birth) | Offices with the Funds | Principal Occupation(s) During the Past Five Years |
Jonathan S. Thomas (1963) | Director and President since 2007 | President and Chief Executive Officer, ACC (March 2007 to present); Chief Administrative Officer, ACC (February 2006 to February 2007); Executive Vice President, ACC (November 2005 to February 2007). Also serves as Chief Executive Officer and Manager, ACS; Executive Vice President, ACIM; Director, ACC, ACIM and other ACC subsidiaries |
Barry Fink (1955) | Director since 2012 and Executive Vice President since 2007 | Chief Operating Officer and Executive Vice President, ACC (September 2007 to present); President, ACS (October 2007 to present); Managing Director, Morgan Stanley (2000 to 2007). Also serves as Manager, ACS and Director, ACC and certain ACC subsidiaries |
Maryanne L. Roepke (1956) | Chief Compliance Officer since 2006 and Senior Vice President since 2000 | Chief Compliance Officer, American Century funds, ACIM and ACS (August 2006 to present). Also serves as Senior Vice President, ACS |
Charles A. Etherington (1957) | General Counsel since 2007 and Senior Vice President since 2006 | Attorney, ACC (February 1994 to present); Vice President, ACC (November 2005 to present), General Counsel, ACC (March 2007 to present); Also serves as General Counsel, ACIM, ACS, ACIS and other ACC subsidiaries; and Senior Vice President, ACIM and ACS |
C. Jean Wade (1964) | Vice President, Treasurer and Chief Financial Officer since 2012 | Vice President, ACS (February 2000 to present) |
Robert J. Leach (1966) | Vice President since 2006 and Assistant Treasurer since 2012 | Vice President, ACS (February 2000 to present) |
David H. Reinmiller (1963) | Vice President since 2000 | Attorney, ACC (January 1994 to present); Associate General Counsel, ACC (January 2001 to present). Also serves as Vice President, ACIM and ACS |
Ward D. Stauffer (1960) | Secretary since 2005 | Attorney, ACC (June 2003 to present) |
The Statement of Additional Information has additional information about the fund’s directors and is available without charge, upon request, by calling 1-800-345-2021.
28
Retirement Account Information
As required by law, distributions you receive from certain IRAs, or 403(b), 457 and qualified plans are subject to federal income tax withholding, unless you elect not to have withholding apply. Tax will be withheld on the total amount withdrawn even though you may be receiving amounts that are not subject to withholding, such as nondeductible contributions. In such case, excess amounts of withholding could occur. You may adjust your withholding election so that a greater or lesser amount will be withheld.
If you don’t want us to withhold on this amount, you must notify us to not withhold the federal income tax. You may notify us in writing or in certain situations by telephone or through other electronic means. You have the right to revoke your withholding election at any time and any election you make may remain in effect until revoked by filing a new election.
Remember, even if you elect not to have income tax withheld, you are liable for paying income tax on the taxable portion of your withdrawal. If you elect not to have income tax withheld or you don’t have enough income tax withheld, you may be responsible for payment of estimated tax. You may incur penalties under the estimated tax rules if your withholding and estimated tax payments are not sufficient. You can reduce or defer the income tax on a distribution by directly or indirectly rolling such distribution over to another IRA or eligible plan. You should consult your tax advisor for additional information.
State tax will be withheld if, at the time of your distribution, your address is within one of the mandatory withholding states and you have federal income tax withheld. State taxes will be withheld from your distribution in accordance with the respective state rules.
Proxy Voting Guidelines
American Century Investment Management, Inc., the fund’s investment advisor, is responsible for exercising the voting rights associated with the securities purchased and/or held by the fund. A description of the policies and procedures the advisor uses in fulfilling this responsibility is available without charge, upon request, by calling 1-800-345-2021. It is also available on American Century Investments’ website at americancentury.com and on the Securities and Exchange Commission’s website at sec.gov. Information regarding how the investment advisor voted proxies relating to portfolio securities during the most recent 12-month period ended June 30 is available on the “About Us” page at americancentury.com. It is also available at sec.gov.
Quarterly Portfolio Disclosure
The fund files its complete schedule of portfolio holdings with the Securities and Exchange Commission (SEC) for the first and third quarters of each fiscal year on Form N-Q. The fund’s Forms N-Q are available on the SEC’s website at sec.gov, and may be reviewed and copied at the SEC’s Public Reference Room in Washington, DC. Information on the operation of the Public Reference Room may be obtained by calling 1-800-SEC-0330. The fund also makes its complete schedule of portfolio holdings for the most recent quarter of its fiscal year available on its website at americancentury.com and, upon request, by calling 1-800-345-2021.
29
Other Tax Information
The following information is provided pursuant to provisions of the Internal Revenue Code.
The fund hereby designates up to the maximum amount allowable as qualified dividend income for the fiscal year ended March 31, 2012.
For corporate taxpayers, the fund hereby designates $219,639, or up to the maximum amount allowable, of ordinary income distributions paid during the fiscal year ended March 31, 2012 as qualified for the corporate dividends received deduction.
30
31
32
| Contact Us | americancentury.com |
| Automated Information Line | 1-800-345-8765 |
| Investor Services Representative | 1-800-345-2021 or 816-531-5575 |
| Investors Using Advisors | 1-800-378-9878 |
Business, Not-For-Profit, Employer-Sponsored Retirement Plans | 1-800-345-3533 |
Banks and Trust Companies, Broker-Dealers, Financial Professionals, Insurance Companies | 1-800-345-6488 |
| Telecommunications Device for the Deaf | 1-800-634-4113 |
American Century Capital Portfolios, Inc.
Investment Advisor:
American Century Investment Management, Inc.
Kansas City, Missouri
This report and the statements it contains are submitted for the general information of our shareholders. The report is not authorized for distribution to prospective investors unless preceded or accompanied by an effective prospectus.
©2012 American Century Proprietary Holdings, Inc. All rights reserved.
CL-ANN-75033 1205
ITEM 2. CODE OF ETHICS.
| (a) | The registrant has adopted a Code of Ethics for Senior Financial Officers that applies to the registrant’s principal executive officer, principal financial officer, principal accounting officer, and persons performing similar functions. |
| (b) | No response required. |
| (c) | None. |
| (d) | None. |
| (e) | Not applicable. |
| (f) | The registrant’s Code of Ethics for Senior Financial Officers was filed as Exhibit 12 (a)(1) to American Century Asset Allocation Portfolios, Inc.’s Annual Certified Shareholder Report on Form N-CSR, File No. 811-21591, on September 29, 2005, and is incorporated herein by reference. |
ITEM 3. AUDIT COMMITTEE FINANCIAL EXPERT.
| (a)(1) | The registrant’s board has determined that the registrant has at least one audit committee financial expert serving on its audit committee. |
| (a)(2) | M. Jeannine Strandjord, James A. Olson and Andrea C. Hall are the registrant’s designated audit committee financial experts. They are “independent” as defined in Item 3 of Form N-CSR. |
| (a)(3) | Not applicable. |
| (b) | No response required. |
| (c) | No response required. |
| (d) | No response required. |
ITEM 4. PRINCIPAL ACCOUNTANT FEES AND SERVICES.
| (a) | Audit Fees. |
The aggregate fees billed for each of the last two fiscal years for professional services rendered by the principal accountant for the audit of the registrant’s annual financial statements or services that are normally provided by the accountant in connection with statutory and regulatory filings or engagements for those fiscal years were as follows:
FY 2011: $179,813
FY 2012: $176,272
| (b) | Audit-Related Fees. |
The aggregate fees billed in each of the last two fiscal years for assurance and related services by the principal accountant that are reasonably related to the performance of the audit of the registrant’s financial statements and are not reported under paragraph (a) of this Item were as follows:
| For services rendered to the registrant: |
FY 2011: $0 FY 2012: $0 |
Fees required to be approved pursuant to paragraph (c)(7)(ii) of Rule 2-01 of Regulation S-X (relating to certain engagements for non-audit services with the registrant’s investment adviser and its affiliates):
FY 2011: $0 FY 2012: $0 |
| (c) | Tax Fees. |
The aggregate fees billed in each of the last two fiscal years for professional services rendered by the principal accountant for tax compliance, tax advice, and tax planning were as follows:
| For services rendered to the registrant: |
FY 2011: $0
FY 2012: $0
Fees required to be approved pursuant to paragraph (c)(7)(ii) of Rule 2-01 of Regulation S-X (relating to certain engagements for non-audit services with the registrant’s investment adviser and its affiliates):
FY 2011: $0
FY 2012: $0
| (d) | All Other Fees. |
The aggregate fees billed in each of the last two fiscal years for products and services provided by the principal accountant, other than the services reported in paragraphs (a) through (c) of this Item were as follows:
| For services rendered to the registrant: |
FY 2011: $0 FY 2012: $0 |
Fees required to be approved pursuant to paragraph (c)(7)(ii) of Rule 2-01 of Regulation S-X (relating to certain engagements for non-audit services with the registrant’s investment adviser and its affiliates):
FY 2011: $0 FY 2012: $0 |
| (e)(1) | In accordance with paragraph (c)(7)(i)(A) of Rule 2-01 of Regulation S-X, before the accountant is engaged by the registrant to render audit or non-audit services, the engagement is approved by the registrant’s audit committee. Pursuant to paragraph (c)(7)(ii) of Rule 2-01 of Regulation S-X, the registrant’s audit committee also pre-approves its accountant’s engagements for non-audit services with the registrant’s investment adviser, its parent company, and any entity controlled by, or under common control with the investment adviser that provides ongoing services to the registrant, if the engagement relates directly to the operations and financial reporting of the registrant. |
| (e)(2) | All services described in each of paragraphs (b) through (d) of this Item were pre-approved before the engagement by the registrant’s audit committee pursuant to paragraph (c)(7)(i)(A) of Rule 2-01 of Regulation S-X. Consequently, none of such services were required to be approved by the audit committee pursuant to paragraph (c)(7)(i)(C). |
| (f) | The percentage of hours expended on the principal accountant’s engagement to audit the registrant’s financial statements for the most recent fiscal year that were attributed to work performed by persons other than the principal accountant’s full-time, permanent employees was less than 50%. |
| (g) | The aggregate non-audit fees billed by the registrant’s accountant for services rendered to the registrant, and rendered to the registrant’s investment adviser (not including any sub-adviser whose role is primarily portfolio management and is subcontracted with or overseen by another investment adviser), and any entity controlling, controlled by, or under common control with the adviser that provides ongoing services to the registrant for each of the last two fiscal years of the registrant were as follows: |
FY 2011: $61,807
FY 2012: $44,957
| (h) | The registrant’s investment adviser and accountant have notified the registrant’s audit committee of all non-audit services that were rendered by the registrant’s accountant to the registrant’s investment adviser, its parent company, and any entity controlled by, or under common control with the investment adviser that provides services to the registrant, which services were not required to be pre-approved pursuant to paragraph (c)(7)(ii) of Rule 2-01 of Regulation S-X. The notification provided to the registrant’s audit committee included sufficient details regarding such services to allow the registrant’s audit committee to consider the continuing independence of its principal accountant. |
ITEM 5. AUDIT COMMITTEE OF LISTED REGISTRANTS.
Not applicable.
ITEM 6. INVESTMENTS.
| (a) | The schedule of investments is included as part of the report to stockholders filed under Item 1 of this Form. |
| (b) | Not applicable. |
ITEM 7. DISCLOSURE OF PROXY VOTING POLICIES AND PROCEDURES FOR CLOSED-END MANAGEMENT INVESTMENT COMPANIES.
Not applicable.
ITEM 8. PORTFOLIO MANAGERS OF CLOSED-END MANAGEMENT INVESTMENT COMPANIES.
Not applicable.
ITEM 9. PURCHASES OF EQUITY SECURITIES BY CLOSED-END MANAGEMENT INVESTMENT COMPANY AND AFFILIATED PURCHASERS.
Not applicable.
ITEM 10. SUBMISSION OF MATTERS TO A VOTE OF SECURITY HOLDERS.
During the reporting period, there were no material changes to the procedures by which shareholders may recommend nominees to the registrant’s board.
ITEM 11. CONTROLS AND PROCEDURES.
| (a) | The registrant's principal executive officer and principal financial officer have concluded that the registrant's disclosure controls and procedures (as defined in Rule 30a-3(c) under the Investment Company Act of 1940) are effective based on their evaluation of these controls and procedures as of a date within 90 days of the filing date of this report. |
| (b) | There were no changes in the registrant's internal control over financial reporting (as defined in Rule 30a-3(d) under the Investment Company Act of 1940) that occurred during the registrant's second fiscal quarter of the period covered by this report that have materially affected, or are reasonably likely to materially affect, the registrant's internal control over financial reporting. |
ITEM 12. EXHIBITS.
| (a)(1) | Registrant’s Code of Ethics for Senior Financial Officers, which is the subject of the disclosure required by Item 2 of Form N-CSR, was filed as Exhibit 12(a)(1) to American Century Asset Allocation Portfolios, Inc.’s Certified Shareholder Report on Form N-CSR, File No. 811-21591, on September 29, 2005. |
| (a)(2) | Separate certifications by the registrant’s principal executive officer and principal financial officer, pursuant to Section 302 of the Sarbanes-Oxley Act of 2002 and Rule 30a-2(a) under the Investment Company Act of 1940, are filed and attached hereto as EX-99.CERT. |
| (a)(3) | Not applicable. |
| (b) | A certification by the registrant’s chief executive officer and chief financial officer, pursuant to Section 906 of the Sarbanes-Oxley Act of 2002, is furnished and attached hereto as EX-99.906CERT. |
SIGNATURES
Pursuant to the requirements of the Securities Exchange Act of 1934 and the Investment Company Act of 1940, the registrant has duly caused this report to be signed on its behalf by the undersigned, thereunto duly authorized.
| Registrant: | American Century Capital Portfolios, Inc. | |||
| By: | /s/ Jonathan S. Thomas | |||
| Name: | Jonathan S. Thomas | |||
| Title: | President | |||
| Date: | May 30, 2012 | |||
Pursuant to the requirements of the Securities Exchange Act of 1934 and the Investment Company Act of 1940, this report has been signed below by the following persons on behalf of the registrant and in the capacities and on the dates indicated.
| By: | /s/ Jonathan S. Thomas | ||
| Name: | Jonathan S. Thomas | ||
| Title: | President | ||
| (principal executive officer) | |||
| Date: | May 30, 2012 | ||
| By: | /s/ C. Jean Wade | ||
| Name: | C. Jean Wade | ||
| Title: | Vice President, Treasurer, and | ||
| Chief Financial Officer | |||
| (principal financial officer) | |||
| Date: | May 30, 2012 | ||