| | |
| UNITED STATES |
| SECURITIES AND EXCHANGE COMMISSION |
| Washington, D.C. 20549 |
|
| FORM N-CSR |
|
| CERTIFIED SHAREHOLDER REPORT OF REGISTERED |
| MANAGEMENT INVESTMENT COMPANIES |
|
| Investment Company Act file number | 811-07820 |
| |
| AMERICAN CENTURY CAPITAL PORTFOLIOS, INC. |
| (Exact name of registrant as specified in charter) |
| |
| 4500 MAIN STREET, KANSAS CITY, MISSOURI | 64111 |
| (Address of principal executive offices) | (Zip Code) |
| |
| CHARLES A. ETHERINGTON |
| 4500 MAIN STREET, KANSAS CITY, MISSOURI 64111 |
| (Name and address of agent for service) |
| |
| Registrant’s telephone number, including area code: | 816-531-5575 |
| |
| Date of fiscal year end: | 03-31 |
| |
| Date of reporting period: | 03-31-2010 |
| |
| ITEM 1. REPORTS TO STOCKHOLDERS |
|
| Annual Report | |
| March 31, 2010 | |

|
| American Century Investments® |
Equity Income Fund
Value Fund
Large Company Value Fund
| |
| President’s Letter | 2 |
| Independent Chairman’s Letter | 3 |
| Market Perspective | 4 |
| U.S. Stock Index Returns | 4 |
| |
| Equity Income | |
| |
| Performance | 5 |
| Portfolio Commentary | 7 |
| Top Ten Holdings, Top Five Industries and | |
| Types of Investments in Portfolio | 9 |
| |
| Value | |
| |
| Performance | 10 |
| Portfolio Commentary | 12 |
| Top Ten Holdings, Top Five Industries and | |
| Types of Investments in Portfolio | 14 |
| |
| Large Company Value | |
| |
| Performance | 15 |
| Portfolio Commentary | 17 |
| Top Ten Holdings, Top Five Industries and | |
| Types of Investments in Portfolio | 19 |
| |
| Shareholder Fee Examples | 20 |
| |
| Financial Statements | |
| |
| Schedule of Investments | 23 |
| Statement of Assets and Liabilities | 33 |
| Statement of Operations | 35 |
| Statement of Changes in Net Assets | 36 |
| Notes to Financial Statements | 38 |
| Financial Highlights | 51 |
| Report of Independent Registered Public Accounting Firm | 69 |
| |
| Other Information | |
| |
| Management | 70 |
| Board Approval of Management Agreements | 74 |
| Additional Information | 80 |
| Index Definitions | 81 |
Any opinions expressed in this report reflect those of the author as of the date of the report, and do not necessarily represent the opinions of American Century Investments or any other person in the American Century Investments organization. Any such opinions are subject to change at any time based upon market or other conditions and American Century Investments disclaims any responsibility to update such opinions. These opinions may not be relied upon as investment advice and, because investment decisions made by American Century Investments funds are based on numerous factors, may not be relied upon as an indication of trading intent on behalf of any American Century Investments fund. Security examples are used for representational purposes only and are not intended as recommendations to purchase or sell securities. Performance information for comparative indices and securities is provided to American Century Investments by third party vendors. To the best of American Century Investments’ knowledge, such information is accurate at the time of printing.

Dear Investor:
To learn more about the capital markets, your investment, and the portfolio management strategies American Century Investments provides, we encourage you to review this shareholder report for the financial reporting period ended March 31, 2010.
On the following pages, you will find investment performance and portfolio information, presented with the expert perspective and commentary of our portfolio management team. This report remains one of our most important vehicles for conveying the information you need about your investment performance, and about the market factors and strategies that affect fund returns. For additional information on the markets, we encourage you to visit the “Insights & News” tab at our Web site, americancentury.com, for updates and further expert commentary.
The top of our Web site’s home page also provides a link to “Our Story,” which, first and foremost, outlines our commitment—since 1958—to helping clients reach their financial goals. We believe strongly that we will only be successful when our clients are successful. That’s who we are.
Another important, unique facet of our story and who we are is “Profits with a Purpose,” which describes our bond with the Stowers Institute for Medical Research (SIMR). SIMR is a world-class biomedical organization—founded by our company founder James E. Stowers, Jr. and his wife Virginia—that is dedicated to researching the causes, treatment, and prevention of gene-based diseases, including cancer. Through American Century Investments’ private ownership structure, more than 40% of our profits support SIMR.
Mr. Stowers’ example of achieving financial success and using that platform to help humanity motivates our entire American Century Investments team. His story inspires us to help each of our clients achieve success. Thank you for sharing your financial journey with us.
Sincerely,

Jonathan Thomas
President and Chief Executive Officer
American Century Investments
2
|
| Independent Chairman’s Letter |

Fellow Shareholders,
The principal event at a recent board meeting was the retirement of Jim Stowers, Jr. from the American Century Mutual Funds Kansas City board. This was one of those times when you felt like you were living a historical moment. Jim founded what was known as Twentieth Century Mutual Funds over 50 years ago. Through the years, his number one priority has been to “Put Investors First!” The board presented Jim with a resolution acknowledging that, by building a successful investment company, he has impacted the lives of many by helping them on the path to financial success.
We respect Jim’s decision to focus his energy on the Stowers Institute for Medical Research and American Century Companies, Inc. (ACC), the parent company of the funds’ investment advisors. The pioneering medical research that Jim and his wife Virginia have made possible through the Institute should enrich the lives of millions in the future.
Shortly after his retirement from the board, we received word that Jim—who celebrated his 86th birthday in January—was hospitalized after experiencing a fall during his regular exercise regimen. While Jim has made steady progress toward recovery, this potentially serious incident resulted in the activation of his long-standing estate and business succession plan. Under the terms of the plan, ACC’s co-chairman Richard W. Brown succeeded Jim as trustee of a trust that holds a significant interest in ACC stock. While less than a majority interest, the trust is presumed to control the funds’ investment advisors under the Investment Company Act of 1940. This change triggered the need for a shareholder proxy to approve new management and subadvisory agreements for the funds. If you have not already responded, I encourage you to take the time to read the proxy materials and send your vote as soon as p ossible.
On behalf of the board, I want to once again thank Jim for his mutual fund board service and wish him a speedy recovery. More than three years ago, Jim and Richard Brown installed a strong and effective leadership team at American Century Investments and I look forward to continuing to work with them on behalf of fund shareholders. And while Jim no longer sits on the fund board, the inherent optimism captured by his favorite catch phrase—“The best is yet to be”—still resonates with all of us who have the privilege of serving you. I invite you to send your comments, questions or concerns to me at dhpratt@fundboardchair.com.

3

By Phil Davidson, Chief Investment Officer, U.S. Value Equity
Stocks Enjoyed Bountiful Recovery
The U.S. stock market gained approximately 50% for the year ended March 31, 2010—one of its best 12-month returns in the last three decades. The key factor behind the remarkable rally in stocks was increasing confidence in a potential economic recovery.
The period began as the U.S. economy was beginning to emerge from its worst downturn since the Great Depression. Signs of economic improvement—including a pickup in industrial production, rising retail sales, and signals that the housing sector was starting to stabilize—gained momentum throughout the 12-month period, helping the U.S. economy post positive growth in the third and fourth quarters of 2009. The exception was job growth—the unemployment rate rose to its highest level since 1983 before falling back slightly toward the end of the reporting period.
Better-than-expected corporate profits also provided a boost to stocks despite sluggish revenue growth. Aggressive cost-cutting strategies across much of corporate America helped profits remain on an upward trajectory.
Value Stocks Led the Rally
Value stocks led the market’s advance, outperforming growth shares across all market capitalizations (see the table below). Many of the best-performing stocks were financially stressed companies that were able to stabilize their businesses and strengthen their balance sheets—characteristics that apply to value-oriented issues. In addition, the financial sector—a sizable component of the value universe—was one of the top-performing sectors in the equity market as many troubled financial firms were able to issue equity and deleverage.
Another recent development that has been favorable for value stocks is a resurgence of dividends. 2009 was the worst year on record for dividends in the U.S., where more than 800 companies reduced their dividend payouts by a total of $58 billion. However, in the first three months of 2010, income-oriented investors were rewarded with growing dividend payouts. In February alone, 47 companies in the S&P 500 increased their dividends or began paying them. Dividends play a central role in our efforts to reduce risk and increase total returns, and they also confirm the strength of a company’s earnings and cash flow.
| | | | |
| U.S. Stock Index Returns | | | | |
| For the 12 months ended March 31, 2010 | | | | |
| Russell 1000 Index (Large-Cap) | 51.60% | | Russell 2000 Index (Small-Cap) | 62.76% |
| Russell 1000 Growth Index | 49.75% | | Russell 2000 Growth Index | 60.32% |
| Russell 1000 Value Index | 53.56% | | Russell 2000 Value Index | 65.07% |
| Russell Midcap Index | 67.71% | | | |
| Russell Midcap Growth Index | 63.00% | | | |
| Russell Midcap Value Index | 72.41% | | | |
4
| | | | | | | |
| Equity Income | | | | | | |
| |
| Total Returns as of March 31, 2010 | | | | | |
| | | | | Average Annual Returns | |
| | | Ticker | | | | Since | Inception |
| | | Symbol | 1 year | 5 years | 10 years | Inception | Date |
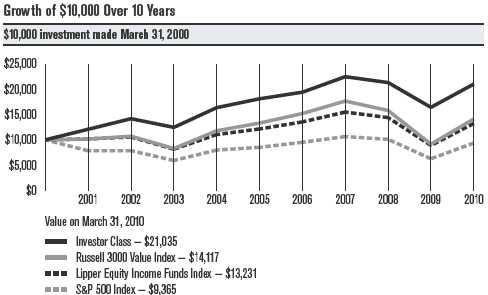
| Investor Class | TWEIX | 28.04% | 3.03% | 7.72% | 10.59% | 8/1/94 |
| Russell 3000 Value Index(1) | — | 54.46% | 1.18% | 3.51% | 8.88%(2) | — |
| S&P 500 Index(1) | — | 49.77% | 1.92% | -0.65% | 8.16%(2) | — |
| Lipper Equity Income | | | | | | |
| Funds Index(1) | — | 48.54% | 1.72% | 2.84% | 7.13%(2) | — |
| Institutional Class | ACIIX | 28.30% | 3.21% | 7.93% | 7.23% | 7/8/98 |
| A Class(3) | TWEAX | | | | | 3/7/97 |
| No sales charge* | | 27.71% | 2.77% | 7.45% | 8.26% | |
| With sales charge* | | 20.38% | 1.56% | 6.81% | 7.77% | |
| B Class | AEKBX | | | | | 9/28/07 |
| No sales charge* | | 26.92% | — | — | -5.48% | |
| With sales charge* | | 22.92% | — | — | -6.79% | |
| C Class | AEYIX | 26.74% | 1.98% | — | 4.65% | 7/13/01 |
| R Class | AEURX | 27.44% | 2.52% | — | 5.22% | 8/29/03 |
| * Sales charges include initial sales charges and contingent deferred sales charges (CDSCs), as applicable. A Class shares have a 5.75% |
| maximum initial sales charge for equity funds and may be subject to a maximum CDSC of 1.00%. B Class shares redeemed within six |
| years of purchase are subject to a CDSC that declines from 5.00% during the first year after purchase to 0.00% the sixth year after |
| purchase. C Class shares redeemed within 12 months of purchase are subject to a maximum CDSC of 1.00%. The SEC requires that |
| mutual funds provide performance information net of maximum sales charges in all cases where charges could be applied. |
| |
| (1) | Data provided by Lipper Inc. — A Reuters Company. © 2010 Reuters. All rights reserved. Any copying, republication or redistribution of Lipper |
| | content, including by caching, framing or similar means, is expressly prohibited without the prior written consent of Lipper. Lipper shall not be |
| | liable for any errors or delays in the content, or for any actions taken in reliance thereon. | | | |
| | Lipper Fund Performance — Performance data is total return, and is preliminary and subject to revision. | | |
| | The data contained herein has been obtained from company reports, financial reporting services, periodicals and other resources believed to be |
| | reliable. Although carefully verified, data on compilations is not guaranteed by Lipper and may be incomplete. No offer or solicitations to buy or |
| | sell any of the securities herein is being made by Lipper. | | | | | |
| (2) | Since 7/31/94, the date nearest the Investor Class’s inception for which data are available. | | | |
| (3) | Prior to September 4, 2007, the A Class was referred to as the Advisor Class and did not have a front-end sales charge. Performance prior to that |
| | date has been adjusted to reflect this charge. | | | | | |
Data presented reflect past performance. Past performance is no guarantee of future results. Current performance may be higher or lower than the performance shown. Investment return and principal value will fluctuate, and redemption value may be more or less than original cost. To obtain performance data current to the most recent month end, please call 1-800-345-2021 or visit americancentury.com. International investing involves special risks, such as political instability and currency fluctuations.
Unless otherwise indicated, performance reflects Investor Class shares; performance for other share classes will vary due to differences in fee structure. For information about other share classes available, please consult the prospectus. Data assumes reinvestment of dividends and capital gains, and none of the charts reflect the deduction of taxes that a shareholder would pay on fund distributions or the redemption of fund shares. Returns for the indices are provided for comparison. The fund’s total returns include operating expenses (such as transaction costs and management fees) that reduce returns, while the total returns of the indices do not.
5
Equity Income
| | | | | |
| Total Annual Fund Operating Expenses | | | |
| | Institutional | | | | |
| Investor Class | Class | A Class | B Class | C Class | R Class |
| 0.99% | 0.79% | 1.24% | 1.99% | 1.99% | 1.49% |
The total annual fund operating expenses shown is as stated in the fund’s prospectus current as of the date of this report. The prospectus may vary from the expense ratio shown elsewhere in this report because it is based on a different time period, includes acquired fund fees and expenses, and, if applicable, does not include fee waivers or expense reimbursements.
Data presented reflect past performance. Past performance is no guarantee of future results. Current performance may be higher or lower than the performance shown. Investment return and principal value will fluctuate, and redemption value may be more or less than original cost. To obtain performance data current to the most recent month end, please call 1-800-345-2021 or visit americancentury.com. International investing involves special risks, such as political instability and currency fluctuations.
Unless otherwise indicated, performance reflects Investor Class shares; performance for other share classes will vary due to differences in fee structure. For information about other share classes available, please consult the prospectus. Data assumes reinvestment of dividends and capital gains, and none of the charts reflect the deduction of taxes that a shareholder would pay on fund distributions or the redemption of fund shares. Returns for the indices are provided for comparison. The fund’s total returns include operating expenses (such as transaction costs and management fees) that reduce returns, while the total returns of the indices do not.
6
Equity Income
Portfolio Managers: Phil Davidson, Kevin Toney, and Michael Liss
Performance Summary
Equity Income returned 28.04%* for the 12 months ended March 31, 2010. By comparison, the Lipper Equity Income Funds Index returned 48.54%, and the average return for Morningstar’s Large Cap Value category** (its performance, like Equity Income’s, reflects operating expenses) was 50.25%. Two market indices—the Russell 3000 Value Index and the S&P 500 Index—returned 54.46% and 49.77%, respectively. The portfolio’s return reflects operating expenses, while the indices’ returns do not.
As the performance figures above indicate, the stock market staged a remarkable comeback during the reporting period. Economic conditions improved (partly in response to government stimulus programs), corporate earnings were better than expected, and improving conditions in the capital markets helped the more highly leveraged and financially strapped companies. These factors led many investors to shift into riskier assets, and many of the period’s largest gains were made by securities of lower-quality businesses that had fared the worst during the financial crisis. That situation was at odds with Equity Income’s conservative investment approach, which emphasizes higher-quality, income-producing securities. Many of the companies held by the portfolio have contained costs and gained market share, allowing them to raise their dividends, but a large number were left behind in the low-quality rally. Against t his backdrop, Equity Income’s relative performance for the annual period was more a result of what it didn’t own rather than what it did.
Equity Income is carefully managed to provide solid long-term performance. Since its inception on August 1, 1994, Equity Income has produced an average annual return of 10.59%, topping the returns for the Lipper Equity Income Funds Index, Morningstar’s Large Cap Value category average, the Russell 3000 Value Index, and the S&P 500 Index for the same period (see performance information on page 5 and in footnotes below).
Financials Slowed Progress
Although financials contributed significantly to the portfolio’s return, the sector was the largest source of underperformance against the benchmark. Equity Income’s mix of higher-quality companies and its underweight position restrained performance during the market rally when companies with stressed balance sheets outperformed stronger, higher-quality businesses. For example, in commercial banks, the portfolio held Commerce Bancshares, a high-quality regional bank serving customers in Midwestern states. Commerce did not take federal bailout money and raised its dividend, but its shares did not keep pace with the sector during the low-quality rally.
| |
| * | All fund returns referenced in this commentary are for Investor Class shares. |
| **The average returns for Morningstar’s Large Cap Value category were 1.21% and 3.12% for the five- and ten-year periods ended March 31, 2010, |
| | respectively, and 7.46% since the fund’s inception. © Morningstar, Inc. All Rights Reserved. The information contained herein: (1) is proprietary to |
| | Morningstar and/or its content providers; (2) may not be copied or distributed; and (3) is not warranted to be accurate, complete or timely. Neither |
| | Morningstar nor its content providers are responsible for any damages or losses arising from any use of this information. |
7
Equity Income
For some time, we have approached financials with caution and conservatism as evidenced by an investment in a convertible security issued by U.S. Bancorp. Although the position provided the portfolio with a positive return, it underperformed many other financials names.
Elsewhere in the sector, our investments were concentrated in the less-volatile names in insurance, thrifts, and capital markets companies. In the insurance industry, Equity Income was overweight shares of Marsh & McLennan. A global insurance broker, Marsh does not have a credit-sensitive business model and we believe it is well-positioned to benefit from new management and improving operating conditions.
The capital markets segment provided top contributor T. Rowe Price Group. As the environment improves for asset managers, the company stands to benefit from consolidation within the segment and appears positioned to gain market share.
Industrials Detracted
In industrials, Equity Income was hindered by the combination of an underweight position and stock selection. Many industrials stocks, which suffered steep declines as the recession took hold, posted strong results during the annual period. The sector was up more than 80% in the benchmark. The portfolio’s investments were concentrated in commercial services and supplies, specifically among waste management companies. In keeping with our conservative stance, Equity Income held a less risky convertible security issued by Waste Connections, which did not keep up with other securities in the sector.
Consumer Discretionary Hampered Results
An underweight in the consumer discretionary sector dampened relative progress. Equity Income did not own any media companies, which outperformed as the economy strengthened and advertising revenues improved. Similarly, the portfolio was slowed by an underweight in automakers, which turned in strong results during the period.
Outlook
We will continue to follow our disciplined, bottom-up investment process, selecting companies one at a time for the portfolio. As of March 31, 2010, we see attractive opportunities in consumer staples, utilities, and information technology, reflected by our overweight positions in these sectors. We continue to be selective in holdings of consumer discretionary, industrials, materials, and financials companies, relying on fundamental analysis to identify strong, financially sound businesses whose securities provide attractive yields.
8
| |
| Equity Income | |
| |
| Top Ten Holdings | |
| | % of net assets |
| | as of 3/31/10 |
| Exxon Mobil Corp. | 6.4% |
| Bank of America Corp. | 3.9% |
| AT&T, Inc. | 3.7% |
| Johnson & Johnson | 3.2% |
| Kimberly-Clark Corp. | 3.1% |
| United Parcel Service, Inc., Class B | 3.1% |
| Wal-Mart Stores, Inc. | 3.0% |
| U.S. Bancorp. (Convertible Bonds) | 3.0% |
| Total SA | 2.9% |
| Chevron Corp. | 2.9% |
| |
| Top Five Industries | |
| | % of net assets |
| | as of 3/31/10 |
| Oil, Gas & Consumable Fuels | 14.4% |
| Insurance | 7.5% |
| Real Estate Investment Trusts (REITs) | 6.5% |
| Pharmaceuticals | 6.0% |
| Household Products | 5.8% |
| |
| Types of Investments in Portfolio | |
| | % of net assets |
| | as of 3/31/10 |
| Common Stocks | 72.5% |
| Convertible Bonds | 21.3% |
| Convertible Preferred Stocks | 3.9% |
| Preferred Stocks | 0.1% |
| Total Equity Exposure | 97.8% |
| Temporary Cash Investments | 0.4% |
| Other Assets and Liabilities | 1.8% |
9
| | | | | | | |
| Value | | | | | | |
| |
| Total Returns as of March 31, 2010 | | | | | |
| | | | | Average Annual Returns | |
| | | Ticker | | | | Since | Inception |
| | | Symbol | 1 year | 5 years | 10 years | Inception | Date |
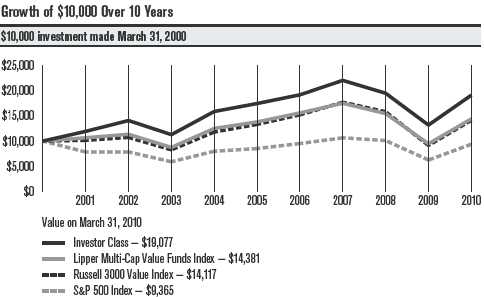
| Investor Class | TWVLX | 44.84% | 1.82% | 6.67% | 9.24% | 9/1/93 |
| Russell 3000 Value Index(1) | — | 54.46% | 1.18% | 3.51% | 8.39%(2) | — |
| S&P 500 Index(1) | — | 49.77% | 1.92% | -0.65% | 7.77%(2) | — |
| Lipper Multi-Cap Value | | | | | | |
| Funds Index(1) | — | 51.98% | 0.85% | 3.70% | 7.55%(2) | — |
| Institutional Class | AVLIX | 45.01% | 2.02% | 6.87% | 6.01% | 7/31/97 |
| A Class(3) | TWADX | | | | | 10/2/96 |
| No sales charge* | | 44.47% | 1.57% | 6.39% | 7.19% | |
| With sales charge* | | 36.23% | 0.36% | 5.76% | 6.72% | |
| B Class | ACBVX | | | | | 1/31/03 |
| No sales charge* | | 43.21% | 0.80% | — | 6.21% | |
| With sales charge* | | 39.21% | 0.60% | — | 6.21% | |
| C Class | ACLCX | 43.29% | 0.80% | — | 3.29% | 6/4/01 |
| R Class | AVURX | 44.10% | — | — | 0.53% | 7/29/05 |
| * Sales charges include initial sales charges and contingent deferred sales charges (CDSCs), as applicable. A Class shares have a 5.75% |
| maximum initial sales charge for equity funds and may be subject to a maximum CDSC of 1.00%. B Class shares redeemed within six |
| years of purchase are subject to a CDSC that declines from 5.00% during the first year after purchase to 0.00% the sixth year after |
| purchase. C Class shares redeemed within 12 months of purchase are subject to a maximum CDSC of 1.00%. The SEC requires that |
| mutual funds provide performance information net of maximum sales charges in all cases where charges could be applied. |
| |
| (1) | Data provided by Lipper Inc. — A Reuters Company. © 2010 Reuters. All rights reserved. Any copying, republication or redistribution of Lipper |
| | content, including by caching, framing or similar means, is expressly prohibited without the prior written consent of Lipper. Lipper shall not be |
| | liable for any errors or delays in the content, or for any actions taken in reliance thereon. | | | |
| | Lipper Fund Performance — Performance data is total return, and is preliminary and subject to revision. | | |
| | The data contained herein has been obtained from company reports, financial reporting services, periodicals and other resources believed to be |
| | reliable. Although carefully verified, data on compilations is not guaranteed by Lipper and may be incomplete. No offer or solicitations to buy or |
| | sell any of the securities herein is being made by Lipper. | | | | | |
| (2) | Since 8/31/93, the date nearest the Investor Class’s inception for which data are available. | | | |
| (3) | Prior to September 4, 2007, the A Class was referred to as the Advisor Class and did not have a front-end sales charge. Performance prior to that |
| | date has been adjusted to reflect this charge. | | | | | |
Data presented reflect past performance. Past performance is no guarantee of future results. Current performance may be higher or lower than the performance shown. Investment return and principal value will fluctuate, and redemption value may be more or less than original cost. To obtain performance data current to the most recent month end, please call 1-800-345-2021 or visit americancentury.com. International investing involves special risks, such as political instability and currency fluctuations.
Unless otherwise indicated, performance reflects Investor Class shares; performance for other share classes will vary due to differences in fee structure. For information about other share classes available, please consult the prospectus. Data assumes reinvestment of dividends and capital gains, and none of the charts reflect the deduction of taxes that a shareholder would pay on fund distributions or the redemption of fund shares. Returns for the indices are provided for comparison. The fund’s total returns include operating expenses (such as transaction costs and management fees) that reduce returns, while the total returns of the indices do not.
10
Value
| | | | | |
| Total Annual Fund Operating Expenses | | | |
| | Institutional | | | | |
| Investor Class | Class | A Class | B Class | C Class | R Class |
| 1.01% | 0.81% | 1.26% | 2.01% | 2.01% | 1.51% |
The total annual fund operating expenses shown is as stated in the fund’s prospectus current as of the date of this report. The prospectus may vary from the expense ratio shown elsewhere in this report because it is based on a different time period, includes acquired fund fees and expenses, and, if applicable, does not include fee waivers or expense reimbursements.
Data presented reflect past performance. Past performance is no guarantee of future results. Current performance may be higher or lower than the performance shown. Investment return and principal value will fluctuate, and redemption value may be more or less than original cost. To obtain performance data current to the most recent month end, please call 1-800-345-2021 or visit americancentury.com. International investing involves special risks, such as political instability and currency fluctuations.
Unless otherwise indicated, performance reflects Investor Class shares; performance for other share classes will vary due to differences in fee structure. For information about other share classes available, please consult the prospectus. Data assumes reinvestment of dividends and capital gains, and none of the charts reflect the deduction of taxes that a shareholder would pay on fund distributions or the redemption of fund shares. Returns for the indices are provided for comparison. The fund’s total returns include operating expenses (such as transaction costs and management fees) that reduce returns, while the total returns of the indices do not.
11
Value
Portfolio Managers: Michael Liss, Kevin Toney, and Phil Davidson
Performance Summary
Value returned 44.84%* for the 12 months ended March 31, 2010. By comparison, the Lipper Multi-Cap Value Funds Index returned 51.98%, while the average return for Morningstar’s Large Cap Value category** (its performance, like Value’s, reflects operating expenses) was 50.25%. Two market indices—the Russell 3000 Value Index and the S&P 500 Index—returned 54.46% and 49.77%, respectively. The portfolio’s return reflects operating expenses, while the indices’ returns do not.
As the performance figures above indicate, the stock market staged a remarkable comeback during the reporting period. Economic conditions improved (partly in response to government stimulus programs), corporate earnings were better than expected, and improving conditions in the capital markets helped the more highly leveraged or financially strapped companies. These factors led many investors to shift into riskier assets, and many of the period’s largest gains were made by the lower-quality businesses that fared the worst during the financial crisis. That situation was at odds with Value’s investment approach, which emphasizes higher-quality businesses with sound balance sheets. Nonetheless, the portfolio received positive contributions in absolute terms from all 10 of the sectors in which it was invested. On a relative basis, Value’s underperformance was more a result of what it didn’t own rat her than what it did.
Value is carefully managed for long-term results. Since its inception on September 1, 1993, Value has produced an average annual return of 9.24%, topping the returns for the Lipper Multi-Cap Value Funds Index, Morning-star’s Large Cap Value category average, the Russell 3000 Value Index, and the S&P 500 Index for the same period (see performance information on page 10 and in footnotes below).
Financials Slowed Results
Value’s position in the financials sector was its largest source of underperfor-mance versus the benchmark. Although financials contributed the most to the portfolio’s return, an underweight restrained relative progress as companies with stressed balance sheets, some of which had appeared to be on the brink of bankruptcy only months earlier, outperformed stronger, higher-quality businesses. The portfolio was underweight commercial banks, a segment that returned more than 82% to the Russell 3000 Value Index.
During the reporting period, the portfolio’s investments were concentrated in the less-volatile insurance names. Many of these companies, however, underperformed during the low-quality rally. Value benefited from holdings among asset management firms, including notable contributor
| |
| * | All fund returns referenced in this commentary are for Investor Class shares. |
| **The average returns for Morningstar’s Large Cap Value category were 1.21% and 3.12% for the five- and ten-year periods ended March 31, 2010, |
| | respectively, and 7.47% since the fund’s inception. © Morningstar, Inc. All Rights Reserved. The information contained herein: (1) is proprietary to |
| | Morningstar and/or its content providers; (2) may not be copied or distributed; and (3) is not warranted to be accurate, complete or timely. Neither |
| | Morningstar nor its content providers are responsible for any damages or losses arising from any use of this information. |
12
Value
AllianceBernstein Holding LP which performed well as the environment for asset managers improved.
Value’s underweight in real estate investment trusts (REITs) detracted from relative performance. For some time, the management team has been concerned about this segment’s operating trends, financial leverage, access to funding, and valuation. However, in spite of deterioration in the commercial real estate market, REIT stocks posted gains of more than 214% in the benchmark, as investors moved into riskier assets during the period.
Consumer Discretionary Detracted
Relative performance was slowed by the combination of an underweight position and security selection in the consumer discretionary sector. Many of these stocks, which suffered steep declines as the recession took hold, rallied on optimism about a possible economic recovery and improving consumer sentiment. Value was hindered by its lack of exposure to media stocks, which outperformed as advertising revenues improved. It also did not own Ford Motor, which rose nearly 378% during the period.
Utilities Contributed
Security selection in utilities—the second-weakest sector in the benchmark—benefited relative performance. Because of valuations and higher-risk business models, Value did not hold any independent power producers; the segment declined more than 23% in the Russell 3000 Value Index. The portfolio’s mix of electric utilities was particularly advantageous.
Information Technology Added Value
The portfolio’s position in the information technology sector enhanced relative performance. The portfolio held Tyco Electronics, a global provider of engineered electronic components, network solutions, wireless systems, and undersea telecommunication systems. Tyco, which derives a significant percentage of its revenue from the manufacturing of automotive products, performed well as conditions improved in the automobiles segment and the global economy strengthened.
Outlook
We will continue to follow our disciplined, bottom-up process, selecting securities one at a time for the portfolio. As of March 31, 2010, we see opportunities in consumer staples, health care, information technology, and energy, reflected by overweight positions in these sectors relative to the benchmark. Our fundamental analysis and valuation work are also directing us toward relative underweights in financials, consumer discretionary, and materials energy stocks.
13
| |
| Value | |
| |
| Top Ten Holdings | |
| | % of net assets |
| | as of 3/31/10 |
| Exxon Mobil Corp. | 5.2% |
| AT&T, Inc. | 3.4% |
| JPMorgan Chase & Co. | 3.2% |
| Chevron Corp. | 3.2% |
| General Electric Co. | 3.1% |
| Total SA | 2.7% |
| Marsh & McLennan Cos., Inc. | 2.7% |
| Pfizer, Inc. | 2.7% |
| Lowe’s Cos., Inc. | 2.1% |
| Berkshire Hathaway, Inc., Class A | 2.0% |
| |
| Top Five Industries | |
| | % of net assets |
| | as of 3/31/10 |
| Oil, Gas & Consumable Fuels | 16.4% |
| Insurance | 8.2% |
| Pharmaceuticals | 6.7% |
| Capital Markets | 5.5% |
| Food Products | 4.6% |
| |
| Types of Investments in Portfolio | |
| | % of net assets |
| | as of 3/31/10 |
| Domestic Common Stocks | 92.2% |
| Foreign Common Stocks* | 6.8% |
| Total Common Stocks | 99.0% |
| Temporary Cash Investments | 1.2% |
| Other Assets and Liabilities | (0.2)% |
| * Includes depositary shares, dual listed securities and foreign ordinary shares. | |
14
| | | | | | | |
| Large Company Value | | | | | |
| |
| Total Returns as of March 31, 2010 | | | | | |
| | | | | Average Annual Returns | |
| | | Ticker | | | | Since | Inception |
| | | Symbol | 1 year | 5 years | 10 years | Inception | Date |
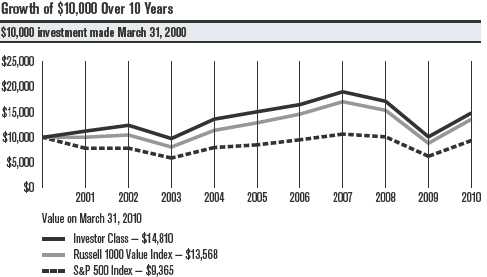
| Investor Class | ALVIX | 46.68% | -0.33% | 4.00% | 3.02% | 7/30/99 |
| Russell 1000 Value Index(1) | — | 53.56% | 1.05% | 3.10% | 2.75% | — |
| S&P 500 Index(1) | — | 49.77% | 1.92% | -0.65% | 0.59% | — |
| Institutional Class | ALVSX | 46.97% | -0.13% | — | 2.59% | 8/10/01 |
| A Class(2) | ALPAX | | | | | 10/26/00 |
| No sales charge* | | 46.31% | -0.58% | — | 3.66% | |
| With sales charge* | | 37.97% | -1.75% | — | 3.01% | |
| B Class | ALBVX | | | | | 1/31/03 |
| No sales charge* | | 45.34% | -1.32% | — | 4.48% | |
| With sales charge* | | 41.34% | -1.53% | — | 4.48% | |
| C Class | ALPCX | 45.19% | -1.32% | — | 2.09% | 11/7/01 |
| R Class | ALVRX | 45.93% | -0.83% | — | 2.95% | 8/29/03 |
| * Sales charges include initial sales charges and contingent deferred sales charges (CDSCs), as applicable. A Class shares have a 5.75% |
| maximum initial sales charge for equity funds and may be subject to a maximum CDSC of 1.00%. B Class shares redeemed within six |
| years of purchase are subject to a CDSC that declines from 5.00% during the first year after purchase to 0.00% the sixth year after |
| purchase. C Class shares redeemed within 12 months of purchase are subject to a maximum CDSC of 1.00%. The SEC requires that |
| mutual funds provide performance information net of maximum sales charges in all cases where charges could be applied. |
| |
| (1) | Data provided by Lipper Inc. — A Reuters Company. © 2010 Reuters. All rights reserved. Any copying, republication or redistribution of Lipper |
| | content, including by caching, framing or similar means, is expressly prohibited without the prior written consent of Lipper. Lipper shall not be |
| | liable for any errors or delays in the content, or for any actions taken in reliance thereon. | | | |
| | The data contained herein has been obtained from company reports, financial reporting services, periodicals and other resources believed to be |
| | reliable. Although carefully verified, data on compilations is not guaranteed by Lipper and may be incomplete. No offer or solicitations to buy or |
| | sell any of the securities herein is being made by Lipper. | | | | | |
| (2) | Prior to December 3, 2007, the A Class was referred to as the Advisor Class and did not have a front-end sales charge. Performance prior to that |
| | date has been adjusted to reflect this charge. | | | | | |
Data presented reflect past performance. Past performance is no guarantee of future results. Current performance may be higher or lower than the performance shown. Investment return and principal value will fluctuate, and redemption value may be more or less than original cost. To obtain performance data current to the most recent month end, please call 1-800-345-2021 or visit americancentury.com.
Unless otherwise indicated, performance reflects Investor Class shares; performance for other share classes will vary due to differences in fee structure. For information about other share classes available, please consult the prospectus. Data assumes reinvestment of dividends and capital gains, and none of the charts reflect the deduction of taxes that a shareholder would pay on fund distributions or the redemption of fund shares. Returns for the indices are provided for comparison. The fund’s total returns include operating expenses (such as transaction costs and management fees) that reduce returns, while the total returns of the indices do not.
15
Large Company Value
| | | | | |
| Total Annual Fund Operating Expenses | | | |
| | Institutional | | | | |
| Investor Class | Class | A Class | B Class | C Class | R Class |
| 0.83% | 0.63% | 1.08% | 1.83% | 1.83% | 1.33% |
The total annual fund operating expenses shown is as stated in the fund’s prospectus current as of the date of this report. The prospectus may vary from the expense ratio shown elsewhere in this report because it is based on a different time period, includes acquired fund fees and expenses, and, if applicable, does not include fee waivers or expense reimbursements.
Data presented reflect past performance. Past performance is no guarantee of future results. Current performance may be higher or lower than the performance shown. Investment return and principal value will fluctuate, and redemption value may be more or less than original cost. To obtain performance data current to the most recent month end, please call 1-800-345-2021 or visit americancentury.com.
Unless otherwise indicated, performance reflects Investor Class shares; performance for other share classes will vary due to differences in fee structure. For information about other share classes available, please consult the prospectus. Data assumes reinvestment of dividends and capital gains, and none of the charts reflect the deduction of taxes that a shareholder would pay on fund distributions or the redemption of fund shares. Returns for the indices are provided for comparison. The fund’s total returns include operating expenses (such as transaction costs and management fees) that reduce returns, while the total returns of the indices do not.
16
Large Company Value
Portfolio Managers: Chuck Ritter and Brendan Healy
Performance Summary
Large Company Value returned 46.68%* for the 12 months ended March 31, 2010. By comparison, its benchmark, the Russell 1000 Value Index, returned 53.56%. The broader market, as measured by the S&P 500 Index, returned 49.77%. The portfolio’s return reflects operating expenses, while the indices’ returns do not. The average return for Morningstar’s Large Cap Value category** (its performance, like Large Company Value’s, reflects operating expenses) was 50.25%.
As the performance figures above indicate, the stock market staged a remarkable comeback during the reporting period. Economic conditions improved in response to government stimulus, corporate earnings were better than expected, and improving conditions in the capital markets helped the more highly leveraged or financially strapped companies. These factors led many investors to shift into riskier assets, and many of the period’s largest gains were made by the lower-quality businesses that fared the worst during the financial crisis. Furthermore, the names that lagged the rally tended to be the stable, less risky businesses favored by Large Company Value. In this environment, the portfolio received positive results in absolute terms from all 10 of the sectors in which it was invested. On a relative basis, holdings in the consumer discretionary and health care sectors detracted. The portfolio’s position in utilities contributed positively.
Large Company Value is carefully managed for long-term results. Since its inception on July 30, 1999, Large Company Value has produced an average annual return of 3.02%, topping the returns for Morningstar’s Large Cap Value category average, the Russell 1000 Value Index, and the S&P 500 Index for the same period (see performance information on page 15 and in footnotes below).
Consumer Discretionary Detracted
Within the consumer discretionary sector, security selection was a drag on relative performance. Although the portfolio benefited from its investments in the media industry, these results were offset by a lack of exposure to car maker Ford Motor and auto component companies. Ford, which was up significantly in the benchmark, has restructured its business and steadily gained market share. Among diversified consumer services stocks, a notable detractor was H&R Block, which experienced a decline in its tax-preparation business.
Health Care Hampered Results
The portfolio’s overweight in health care dampened relative progress. Health care stocks gained, but their progress was constrained as investors
| |
| * | All fund returns referenced in this commentary are for Investor Class shares. |
| **The average returns for Morningstar’s Large Cap Value category were 1.21% and 3.12% for the five- and ten-year periods ended March 31, 2010, |
| | respectively, and 2.69% since the fund’s inception. © Morningstar, Inc. All Rights Reserved. The information contained herein: (1) is proprietary to |
| | Morningstar and/or its content providers; (2) may not be copied or distributed; and (3) is not warranted to be accurate, complete or timely. Neither |
| | Morningstar nor its content providers are responsible for any damages or losses arising from any use of this information. |
17
Large Company Value
priced in worst-case scenarios for health care reform. As fears abated, the sector’s performance strengthened.
Security selection also slowed relative results. A notable detractor was Abbott Laboratories, which develops and manufactures laboratory diagnostics, medical devices, and pharmaceutical therapies. Earlier in the reporting period, Abbott reported a deceleration in prescription growth for Humira, its blockbuster drug for the treatment of rheumatoid arthritis. Eventually, sales of Humira rebounded strongly, but the drugmaker’s shares underper-formed other pharmaceutical names.
A Defensive Bias Also Slowed Progress
A factor influencing Large Company Value’s relative underperformance was the annual reconstitution of the portfolio’s benchmark index, the Russell 1000 Value Index. The reconstitution, which occurred during June 2009, gave greater weighting to cyclical sectors and stocks—in other words, those that tend to rise during good economic times. Because of our investment approach, we did not respond to this shift in weightings by increasing the portfolio’s cyclical sensitivity, which hampered relative performance.
Utilities Provided a Boost
Large Company Value continued to benefit from a significant underweight in the utilities sector, reflecting our belief that many of these stocks have been overvalued for some time. The stance added value during the market rally when utilities underperformed all but one other benchmark sector.
Consumer Staples Provided Notable Contributor
The consumer staples sector was the source of key contributor Pepsi Bottling Group. Its share price surged on news that PepsiCo, which already owned one third of the bottling company, had launched a takeover bid. We sold the position after the announcement.
Outlook
We continue to be bottom-up investment managers, evaluating each company individually and building the portfolio one stock at a time. As of March 31, 2010, Large Company Value is broadly diversified, with ongoing overweight positions in the health care, information technology, and consumer staples sectors. Our valuation work is also directing us toward smaller relative weightings in financials, utilities, and materials stocks.
18
| |
| Large Company Value | |
| |
| Top Ten Holdings | |
| | % of net assets |
| | as of 3/31/10 |
| Exxon Mobil Corp. | 4.9% |
| General Electric Co. | 3.9% |
| JPMorgan Chase & Co. | 3.8% |
| Bank of America Corp. | 3.5% |
| Pfizer, Inc. | 3.5% |
| Chevron Corp. | 3.5% |
| AT&T, Inc. | 3.5% |
| ConocoPhillips | 2.7% |
| Verizon Communications, Inc. | 2.2% |
| Wells Fargo & Co. | 2.2% |
| |
| Top Five Industries | |
| | % of net assets |
| | as of 3/31/10 |
| Oil, Gas & Consumable Fuels | 15.8% |
| Pharmaceuticals | 8.8% |
| Diversified Financial Services | 7.8% |
| Diversified Telecommunication Services | 6.0% |
| Insurance | 4.8% |
| |
| Types of Investments in Portfolio | |
| | % of net assets |
| | as of 3/31/10 |
| Common Stocks & Futures | 99.0% |
| Temporary Cash Investments | 0.7% |
| Other Assets and Liabilities | 0.3% |
19
|
| Shareholder Fee Examples (Unaudited) |
Fund shareholders may incur two types of costs: (1) transaction costs, including sales charges (loads) on purchase payments and redemption/ exchange fees; and (2) ongoing costs, including management fees; distribution and service (12b-1) fees; and other fund expenses. This example is intended to help you understand your ongoing costs (in dollars) of investing in your fund and to compare these costs with the ongoing cost of investing in other mutual funds.
The example is based on an investment of $1,000 made at the beginning of the period and held for the entire period from October 1, 2009 to March 31, 2010.
Actual Expenses
The table provides information about actual account values and actual expenses for each class. You may use the information, together with the amount you invested, to estimate the expenses that you paid over the period. First, identify the share class you own. Then simply divide your account value by $1,000 (for example, an $8,600 account value divided by $1,000 = 8.6), then multiply the result by the number under the heading “Expenses Paid During Period” to estimate the expenses you paid on your account during this period.
If you hold Investor Class shares of any American Century Investments fund, or Institutional Class shares of the American Century Diversified Bond Fund, in an American Century Investments account (i.e., not a financial intermediary or retirement plan account), American Century Investments may charge you a $12.50 semiannual account maintenance fee if the value of those shares is less than $10,000. We will redeem shares automatically in one of your accounts to pay the $12.50 fee. In determining your total eligible investment amount, we will include your investments in all personal accounts (including American Century Investments Brokerage accounts) registered under your Social Security number. Personal accounts include individual accounts, joint accounts, UGMA/UTMA accounts, personal trusts, Coverdell Education Savings Accounts and IRAs (including traditional, Roth, Rollover, SEP-, SARSEP- and SIMPLE-IRAs), and certain other retirement accounts. If you have only business, business retirement, employer-sponsored or American Century Investments Brokerage accounts, you are currently not subject to this fee. We will not charge the fee as long as you choose to manage your accounts exclusively online. If you are subject to the Account Maintenance Fee, your account value could be reduced by the fee amount.
Hypothetical Example for Comparison Purposes
The table also provides information about hypothetical account values and hypothetical expenses based on the actual expense ratio of each class of your fund and an assumed rate of return of 5% per year before expenses, which is not the actual return of a fund’s share class. The hypothetical account values and expenses may not be used to estimate the actual ending account balance or expenses you paid for the period. You may use this information to compare the ongoing costs of investing in your fund and other funds. To do so, compare this 5% hypothetical example with the 5% hypothetical examples that appear in the shareholder reports of the other funds.
20
Please note that the expenses shown in the table are meant to highlight your ongoing costs only and do not reflect any transactional costs, such as sales charges (loads) or redemption/exchange fees. Therefore, the table is useful in comparing ongoing costs only, and will not help you determine the relative total costs of owning different funds. In addition, if these transactional costs were included, your costs would have been higher.
| | | | |
| | Beginning | Ending | Expenses Paid | |
| | Account Value | Account Value | During Period* | Annualized |
| | 10/1/09 | 3/31/10 | 10/1/09 – 3/31/10 | Expense Ratio* |
| Equity Income | | | | |
| Actual | | | | |
| Investor Class | $1,000 | $1,091.50 | $5.06 | 0.97% |
| Institutional Class | $1,000 | $1,091.00 | $4.01 | 0.77% |
| A Class | $1,000 | $1,090.10 | $6.36 | 1.22% |
| B Class | $1,000 | $1,085.80 | $10.24 | 1.97% |
| C Class | $1,000 | $1,085.90 | $10.24 | 1.97% |
| R Class | $1,000 | $1,088.90 | $7.66 | 1.47% |
| Hypothetical | | | | |
| Investor Class | $1,000 | $1,020.09 | $4.89 | 0.97% |
| Institutional Class | $1,000 | $1,021.09 | $3.88 | 0.77% |
| A Class | $1,000 | $1,018.85 | $6.14 | 1.22% |
| B Class | $1,000 | $1,015.11 | $9.90 | 1.97% |
| C Class | $1,000 | $1,015.11 | $9.90 | 1.97% |
| R Class | $1,000 | $1,017.60 | $7.39 | 1.47% |
| Value | | | | |
| Actual | | | | |
| Investor Class | $1,000 | $1,110.90 | $5.26 | 1.00% |
| Institutional Class | $1,000 | $1,114.10 | $4.22 | 0.80% |
| A Class | $1,000 | $1,111.80 | $6.58 | 1.25% |
| B Class | $1,000 | $1,104.00 | $10.49 | 2.00% |
| C Class | $1,000 | $1,104.80 | $10.50 | 2.00% |
| R Class | $1,000 | $1,108.10 | $7.88 | 1.50% |
| Hypothetical | | | | |
| Investor Class | $1,000 | $1,019.95 | $5.04 | 1.00% |
| Institutional Class | $1,000 | $1,020.94 | $4.03 | 0.80% |
| A Class | $1,000 | $1,018.70 | $6.29 | 1.25% |
| B Class | $1,000 | $1,014.96 | $10.05 | 2.00% |
| C Class | $1,000 | $1,014.96 | $10.05 | 2.00% |
| R Class | $1,000 | $1,017.45 | $7.54 | 1.50% |
|
| * Expenses are equal to the class’s annualized expense ratio listed in the table above, multiplied by the average account value over the period, |
| multiplied by 182, the number of days in the most recent fiscal half-year, divided by 365, to reflect the one-half year period. |
21
| | | | |
| | Beginning | Ending | Expenses Paid | |
| | Account Value | Account Value | During Period* | Annualized |
| | 10/1/09 | 3/31/10 | 10/1/09 – 3/31/10 | Expense Ratio* |
| Large Company Value | | | | |
| Actual | | | | |
| Investor Class | $1,000 | $1,087.90 | $4.37 | 0.84% |
| Institutional Class | $1,000 | $1,089.00 | $3.33 | 0.64% |
| A Class | $1,000 | $1,086.50 | $5.67 | 1.09% |
| B Class | $1,000 | $1,082.00 | $9.55 | 1.84% |
| C Class | $1,000 | $1,082.30 | $9.55 | 1.84% |
| R Class | $1,000 | $1,085.10 | $6.97 | 1.34% |
| Hypothetical | | | | |
| Investor Class | $1,000 | $1,020.74 | $4.23 | 0.84% |
| Institutional Class | $1,000 | $1,021.74 | $3.23 | 0.64% |
| A Class | $1,000 | $1,019.50 | $5.49 | 1.09% |
| B Class | $1,000 | $1,015.76 | $9.25 | 1.84% |
| C Class | $1,000 | $1,015.76 | $9.25 | 1.84% |
| R Class | $1,000 | $1,018.25 | $6.74 | 1.34% |
| * Expenses are equal to the class’s annualized expense ratio listed in the table above, multiplied by the average account value over the period, |
| multiplied by 182, the number of days in the most recent fiscal half-year, divided by 365, to reflect the one-half year period. |
22
| | | | | | |
| Equity Income | | | | | | |
| |
| MARCH 31, 2010 | | | | | | |
| |
| | Shares/ | | | | Shares/ | |
| | Principal | | | | Principal | |
| | Amount | Value | | | Amount | Value |
| Common Stocks — 72.5% | | | ELECTRONIC EQUIPMENT, | | |
| | | | | INSTRUMENTS & COMPONENTS — 0.5% | |
| AEROSPACE & DEFENSE — 1.3% | | | Molex, Inc., Class A | 1,800,000 | $ 31,770,000 |
| Honeywell International, Inc. | 353,800 | $ 16,016,526 | | FOOD & STAPLES RETAILING — 3.0% | |
| Northrop Grumman Corp. | 407,127 | 26,695,317 | | Wal-Mart Stores, Inc. | 3,450,016 | 191,820,890 |
| Raytheon Co. | 740,500 | 42,297,360 | | FOOD PRODUCTS — 2.6% | | |
| | | 85,009,203 | | Campbell Soup Co. | 1,400,821 | 49,519,023 |
| AIR FREIGHT & LOGISTICS — 3.1% | | | H.J. Heinz Co. | 1,325,400 | 60,451,494 |
| United Parcel Service, Inc., | | | | Hershey Co. (The) | 700,030 | 29,968,284 |
| Class B | 3,020,921 | 194,577,522 | | | | |
| AUTOMOBILES — 0.3% | | | | Unilever NV CVA | 765,000 | 23,139,572 |
| Honda Motor Co. Ltd. | 448,800 | 15,841,694 | | | | 163,078,373 |
| CAPITAL MARKETS — 2.8% | | | | GAS UTILITIES — 4.8% | | |
| AllianceBernstein Holding LP | 890,173 | 27,292,704 | | AGL Resources, Inc. | 2,463,700 | 95,222,005 |
| Northern Trust Corp. | 2,244,500 | 124,031,070 | | Nicor, Inc. | 1,000,000 | 41,920,000 |
| | | | | Piedmont Natural | | |
| T. Rowe Price Group, Inc. | 500,000 | 27,465,000 | | Gas Co., Inc. | 1,900,030 | 52,402,827 |
| | | 178,788,774 | | Spectra Energy Partners LP | 850,062 | 25,841,885 |
| CHEMICALS — 0.7% | | | | WGL Holdings, Inc.(1) | 2,505,688 | 86,822,089 |
| E.I. du Pont | | | | | | |
| de Nemours & Co. | 1,144,800 | 42,632,352 | | | | 302,208,806 |
| COMMERCIAL BANKS — 0.7% | | | HOTELS, RESTAURANTS & LEISURE — 0.6% | |
| Commerce Bancshares, Inc. | 1,110,049 | 45,667,416 | | McDonald’s Corp. | 608,500 | 40,599,120 |
| COMMERCIAL SERVICES & SUPPLIES — 1.7% | | HOUSEHOLD PRODUCTS — 5.8% | |
| Pitney Bowes, Inc. | 800,000 | 19,560,000 | | Clorox Co. | 582,000 | 37,329,480 |
| Waste Management, Inc. | 2,449,945 | 84,351,606 | | Kimberly-Clark Corp. | 3,130,300 | 196,833,264 |
| | | 103,911,606 | | Procter & Gamble Co. (The) | 2,081,930 | 131,723,711 |
| CONSTRUCTION MATERIALS — 0.5% | | | | | 365,886,455 |
| Martin Marietta | | | | INSURANCE — 6.8% | | |
| Materials, Inc. | 377,500 | 31,540,125 | | ACE Ltd. | 534,700 | 27,964,810 |
| DISTRIBUTORS — 0.8% | | | | Allstate Corp. (The) | 3,480,000 | 112,438,800 |
| Genuine Parts Co. | 1,180,400 | 49,860,096 | | Chubb Corp. (The) | 1,590,200 | 82,451,870 |
| DIVERSIFIED TELECOMMUNICATION | | | Marsh & McLennan | | |
| SERVICES — 4.1% | | | | Cos., Inc. | 7,000,089 | 170,942,173 |
| AT&T, Inc. | 9,000,000 | 232,560,000 | | MetLife, Inc. | 145,000 | 6,284,300 |
| BCE, Inc. | 236,200 | 6,941,929 | | Transatlantic Holdings, Inc. | 533,204 | 28,153,171 |
| CenturyTel, Inc. | 478,100 | 16,953,426 | | | | 428,235,124 |
| | | 256,455,355 | | IT SERVICES — 1.1% | | |
| ELECTRIC UTILITIES — 1.6% | | | | Automatic Data | | |
| Northeast Utilities | 1,500,000 | 41,460,000 | | Processing, Inc. | 1,535,500 | 68,283,685 |
| Portland General Electric Co. | 1,107,133 | 21,378,738 | | MACHINERY — 0.5% | | |
| Southern Co. | 1,065,200 | 35,322,032 | | Caterpillar, Inc. | 513,600 | 32,279,760 |
| | | 98,160,770 | | METALS & MINING — 0.3% | | |
| ELECTRICAL EQUIPMENT — 1.3% | | | Nucor Corp. | 470,800 | 21,364,904 |
| Emerson Electric Co. | 1,131,400 | 56,954,676 | | | | |
| Rockwell Automation, Inc. | 470,019 | 26,490,271 | | | | |
| | | 83,444,947 | | | | |
23
| | | | | | |
| Equity Income | | | | | | |
| |
| | Shares/ | | | | Shares/ | |
| | Principal | | | | Principal | |
| | Amount | Value | | | Amount | Value |
| MULTI-UTILITIES — 3.7% | | | | Convertible Bonds — 21.3% | |
| Consolidated Edison, Inc. | 2,615,168 | $ 116,479,583 | | AUTO COMPONENTS — 1.1% | |
| PG&E Corp. | 2,300,000 | 97,566,000 | | BorgWarner, Inc., | | |
| Wisconsin Energy Corp. | 390,000 | 19,269,900 | | 3.50%, 4/15/12 | $ 52,000,000 | $ 68,250,000 |
| | | 233,315,483 | | CAPITAL MARKETS — 0.6% | | |
| OIL, GAS & CONSUMABLE FUELS — 13.3% | | Janus Capital Group, Inc., | | |
| BP plc | 4,549,300 | 43,036,810 | | 3.25%, 7/15/14 | 17,500,000 | 22,181,250 |
| Chevron Corp. | 2,381,500 | 180,589,145 | | Morgan Stanley, (convertible | | |
| Enterprise Products | | | | into Charles Schwab Corp. | | |
| Partners LP | 537,500 | 18,586,750 | | (The)), 6.10%, 8/10/10(2)(3) | 888,200 | 16,640,427 |
| Exxon Mobil Corp. | 6,000,029 | 401,881,943 | | | | 38,821,677 |
| Total SA | 3,146,400 | 182,651,468 | | COMMERCIAL BANKS — 3.0% | |
| XTO Energy, Inc. | 196,400 | 9,266,152 | | U.S. Bancorp., VRN, | | |
| | | 836,012,268 | | 0.00%, 6/11/10 | 190,130,000 | 188,466,362 |
| PHARMACEUTICALS — 6.0% | | | | COMMUNICATIONS EQUIPMENT — 0.1% | |
| | | | | Ciena Corp., | | |
| Bristol-Myers Squibb Co. | 3,825,740 | 102,147,258 | | 4.00%, 3/15/15(2) | 6,500,000 | 6,760,000 |
| Eli Lilly & Co. | 1,273,000 | 46,108,060 | | ENERGY EQUIPMENT & SERVICES — 1.0% | |
| Johnson & Johnson | 3,040,835 | 198,262,442 | | Cameron International Corp., | | |
| Pfizer, Inc. | 1,974,524 | 33,863,087 | | 2.50%, 6/15/26 | 47,511,000 | 63,070,853 |
| | | 380,380,847 | | HEALTH CARE EQUIPMENT & SUPPLIES — 0.3% |
| REAL ESTATE INVESTMENT TRUSTS (REITs) — 0.9% | | Beckman Coulter, Inc., | | |
| Annaly Capital | | | | 2.50%, 12/15/36 | 16,697,000 | 18,784,125 |
| Management, Inc. | 3,150,200 | 54,120,436 | | HEALTH CARE PROVIDERS & SERVICES — 1.1% |
| SEMICONDUCTORS & SEMICONDUCTOR | | | Lincare Holdings, Inc., | | |
| EQUIPMENT — 1.1% | | | | 2.75%, 11/1/37 | 59,000,000 | 68,292,500 |
| Applied Materials, Inc. | 3,045,246 | 41,049,916 | | HOUSEHOLD DURABLES — 0.4% | |
| Microchip Technology, Inc. | 1,000,000 | 28,160,000 | | Deutsche Bank AG, | | |
| | | 69,209,916 | | (convertible into Toll | | |
| SPECIALTY RETAIL — 1.8% | | | | Brothers, Inc.), | | |
| | | | | 15.67%, 6/11/10(2)(3) | 655,000 | 12,825,883 |
| Lowe’s Cos., Inc. | 3,322,300 | 80,532,552 | | Deutsche Bank AG, | | |
| Sherwin-Williams Co. (The) | 469,400 | 31,768,992 | | (convertible into Toll | | |
| | | 112,301,544 | | Brothers, Inc.), | | |
| THRIFTS & MORTGAGE FINANCE — 0.8% | | | 12.05%, 7/29/10(2)(3) | 600,000 | 11,968,500 |
| Hudson City Bancorp., Inc. | 1,800,000 | 25,488,000 | | | | 24,794,383 |
| People’s United | | | | INSURANCE — 0.7% | | |
| Financial, Inc. | 1,610,000 | 25,180,400 | | BNP Paribas, | | |
| | | 50,668,400 | | (convertible into Aon Corp.), | | |
| | | | | 4.55%, 5/4/10(2)(3) | 640,000 | 26,928,000 |
| TOTAL COMMON STOCKS | | | | | | |
| (Cost $3,963,429,430) | | 4,567,425,871 | | Morgan Stanley, | | |
| | | | | (convertible into Marsh | | |
| | | | | & McLennan Cos., Inc.), | | |
| | | | | 8.20%, 6/10/10(2)(3) | 725,000 | 17,200,625 |
| | | | | | | 44,128,625 |
24
| | | | | | |
| Equity Income | | | | | |
| |
| | Shares/ | | | | Shares/ | |
| | Principal | | | | Principal | |
| | Amount | Value | | | Amount | Value |
| IT SERVICES — 1.3% | | | | SPECIALTY RETAIL — 0.6% | | |
| DST Systems, Inc., VRN, | | | | Best Buy Co., Inc., | | |
| 3.625%, 8/15/23 | $ 77,000,000 | $ 79,887,500 | | 2.25%, 1/15/22 | $ 22,497,000 | $ 25,196,640 |
| METALS & MINING — 1.0% | | | | BNP Paribas, (convertible | | |
| Newmont Mining Corp., | | | | into Gap, Inc. (The)), 6.79%, | | |
| 3.00%, 2/15/12 | 50,000,000 | 63,562,500 | | 8/10/10(2)(3) | 530,000 | 11,389,700 |
| OIL, GAS & CONSUMABLE FUELS — 1.1% | | | | | 36,586,340 |
| Peabody Energy Corp., | | | | TOTAL CONVERTIBLE BONDS | |
| 4.75%, 12/15/41 | 67,000,000 | 72,862,500 | | (Cost $1,214,656,240) | | 1,342,621,712 |
| REAL ESTATE INVESTMENT TRUSTS (REITs) — 5.6% | | Convertible Preferred Stocks — 3.9% |
| Annaly Capital Management, | | | | DIVERSIFIED FINANCIAL SERVICES — 3.9% |
| Inc., 4.00%, 2/15/15 | 55,012,000 | 56,043,475 | | Bank of America Corp., | | |
| Host Hotels & Resorts LP, | | | | 7.25%, 12/31/49(4) | | |
| 3.25%, 4/15/24(2) | 105,600,000 | 108,504,000 | | (Cost $185,303,843) | 252,200 | 245,895,000 |
| Host Hotels & Resorts LP, | | | | | | |
| 2.50%, 10/15/29(2) | 47,000,000 | 57,222,500 | | Preferred Stocks — 0.1% | |
| Rayonier TRS Holdings, Inc., | | | | REAL ESTATE INVESTMENT TRUSTS (REITs) — 0.1% |
| 3.75%, 10/15/12 | 55,028,000 | 60,324,445 | | Public Storage, | | |
| Rayonier TRS Holdings, Inc., | | | | 7.50%, 5/7/10(4) | | |
| 4.50%, 8/15/15(2) | 38,975,000 | 46,282,812 | | (Cost $7,223,942) | 330,522 | 8,329,155 |
| Reckson Operating | | | | Temporary Cash Investments — 0.4% |
| Partnership LP, 4.00%, | | | | | | |
| 6/15/25 | 24,000,000 | 23,940,000 | | FHLB Discount Notes, | | |
| | | | | 0.001%, 4/1/10(5) | $ 24,500,000 | 24,500,000 |
| | | 352,317,232 | | JPMorgan U.S. Treasury | | |
| SEMICONDUCTORS & SEMICONDUCTOR | | | Plus Money Market Fund | | |
| EQUIPMENT — 3.0% | | | | Agency Shares | 31,029 | 31,029 |
| Intel Corp., 2.95%, 12/15/35 | 138,004,000 | 136,106,445 | | TOTAL TEMPORARY | | |
| Linear Technology Corp., | | | | CASH INVESTMENTS | | |
| 3.125%, 5/1/27 | 34,970,000 | 35,232,275 | | (Cost $24,531,029) | | 24,531,029 |
| Verigy Ltd., | | | | TOTAL INVESTMENT | | |
| 5.25%, 7/15/14(2) | 18,000,000 | 20,070,000 | | SECURITIES — 98.2% | | |
| | | 191,408,720 | | (Cost $5,395,144,484) | | 6,188,802,767 |
| SOFTWARE — 0.4% | | | | OTHER ASSETS | | |
| Sybase, Inc., | | | | AND LIABILITIES — 1.8% | | 111,547,780 |
| 3.50%, 8/15/29(2) | 20,588,000 | 24,628,395 | | TOTAL NET ASSETS — 100.0% | $6,300,350,547 |
25
| | | | | |
| Equity Income | | | |
| |
| Forward Foreign Currency Exchange Contracts | | |
| | Contracts to Sell | Settlement Date | Value | Unrealized Gain (Loss) |
| | 6,726,600 | CAD for USD | 4/30/10 | $ 6,622,951 | $ (15,591) |
| | 112,957,802 | EUR for USD | 4/30/10 | 152,566,455 | (490,237) |
| | 21,666,041 | GBP for USD | 4/30/10 | 32,874,606 | (433,176) |
| | 1,102,365,000 | JPY for USD | 4/30/10 | 11,792,890 | 110,928 |
| | | | | $203,856,902 | $(828,076) |
| (Value on Settlement Date $203,028,826) | | | |
| |
| Notes to Schedule of Investments | | |
| CAD = Canadian Dollar | | | |
| CVA = Certificaten Van Aandelen | | | |
| EUR = Euro | | | | |
| FHLB = Federal Home Loan Bank | | | |
| GBP = British Pound | | | |
| JPY = Japanese Yen | | | |
| USD = United States Dollar | | | |
| VRN = Variable Rate Note. Interest reset date is indicated. Rate shown is effective at the period end. | |
| |
| (1) | Affiliated Company: the fund’s holding represents ownership of 5% or more of the voting securities of the company; therefore, the company is |
| | affiliated as defined in the Investment Company Act of 1940. | | |
| (2) | Security was purchased under Rule 144A of the Securities Act of 1933 or is a private placement and, unless registered under the Act or |
| | exempted from registration, may only be sold to qualified institutional investors. The aggregate value of these securities at the period end was |
| | $360,420,842, which represented 5.7% of total net assets. | | |
| (3) | Equity-linked debt security. The aggregated value of these securities at the period end, was $96,953,135, which represented 1.5% of total |
| | net assets. | | | | |
| (4) | Perpetual security. These securities do not have a predetermined maturity date. The coupon rates are fixed for a period of time and may be |
| | structured to adjust thereafter. Interest reset or next call date is indicated, as applicable. | |
| (5) | The rate indicated is the yield to maturity at purchase. | | |
Industry classifications are unaudited.
See Notes to Financial Statements.
26
| | | | | | |
| Value | | | | | | |
| |
| MARCH 31, 2010 | | | | | | |
| |
| | Shares | Value | | | Shares | Value |
| Common Stocks — 99.0% | | | COMPUTERS & PERIPHERALS — 1.6% | |
| AEROSPACE & DEFENSE — 0.6% | | | Diebold, Inc. | 359,120 | $ 11,405,651 |
| Boeing Co. (The) | 34,190 | $ 2,482,536 | | Hewlett-Packard Co. | 287,460 | 15,278,499 |
| Northrop Grumman Corp. | 118,840 | 7,792,339 | | | | 26,684,150 |
| | | 10,274,875 | | CONSTRUCTION MATERIALS — 0.3% | |
| AIR FREIGHT & LOGISTICS — 1.4% | | | Vulcan Materials Co. | 110,720 | 5,230,413 |
| United Parcel Service, Inc., | | | | CONTAINERS & PACKAGING — 0.5% | |
| Class B | 360,900 | 23,245,569 | | Bemis Co., Inc. | 265,010 | 7,611,087 |
| AIRLINES — 0.1% | | | | DISTRIBUTORS — 1.3% | | |
| Southwest Airlines Co. | 125,210 | 1,655,276 | | Genuine Parts Co. | 489,340 | 20,669,722 |
| AUTOMOBILES — 1.4% | | | | DIVERSIFIED — 0.6% | | |
| Honda Motor Co. Ltd. | 175,900 | 6,208,899 | | iShares Russell 3000 | | |
| Toyota Motor Corp. | 408,300 | 16,355,584 | | Value Index Fund | 127,110 | 10,177,698 |
| | | 22,564,483 | | DIVERSIFIED FINANCIAL SERVICES — 4.4% | |
| BEVERAGES — 0.8% | | | | Bank of America Corp. | 870,360 | 15,535,926 |
| PepsiCo, Inc. | 195,470 | 12,932,295 | | JPMorgan Chase & Co. | 1,157,280 | 51,788,280 |
| CAPITAL MARKETS — 5.5% | | | | McGraw-Hill Cos., Inc. (The) | 133,150 | 4,746,797 |
| AllianceBernstein Holding LP | 419,130 | 12,850,526 | | | | 72,071,003 |
| | | | | DIVERSIFIED TELECOMMUNICATION | |
| Ameriprise Financial, Inc. | 137,350 | 6,230,196 | | SERVICES — 4.5% | | |
| Bank of New York | | | | AT&T, Inc. | 2,127,990 | 54,987,262 |
| Mellon Corp. (The) | 307,040 | 9,481,395 | | | | |
| Goldman Sachs | | | | BCE, Inc. | 162,180 | 4,766,478 |
| Group, Inc. (The) | 85,230 | 14,542,795 | | Verizon | | |
| Invesco Ltd. | 224,080 | 4,909,593 | | Communications, Inc. | 435,880 | 13,520,997 |
| Morgan Stanley | 326,020 | 9,549,126 | | | | 73,274,737 |
| Northern Trust Corp. | 342,610 | 18,932,629 | | ELECTRIC UTILITIES — 3.7% | | |
| | | | | American Electric | | |
| State Street Corp. | 265,490 | 11,984,218 | | Power Co., Inc. | 244,080 | 8,342,654 |
| | | 88,480,478 | | IDACORP, Inc. | 467,540 | 16,186,235 |
| CHEMICALS — 1.0% | | | | Southern Co. | 250,270 | 8,298,953 |
| E.I. du Pont | | | | Westar Energy, Inc. | 1,197,600 | 26,706,480 |
| de Nemours & Co. | 426,590 | 15,886,212 | | | | |
| COMMERCIAL BANKS — 2.2% | | | | | | 59,534,322 |
| Commerce Bancshares, Inc. | 134,870 | 5,548,552 | | ELECTRICAL EQUIPMENT — 1.8% | |
| PNC Financial Services | | | | Emerson Electric Co. | 91,140 | 4,587,988 |
| Group, Inc. | 80,610 | 4,812,417 | | Hubbell, Inc., Class B | 474,250 | 23,916,427 |
| U.S. Bancorp. | 956,820 | 24,762,501 | | | | 28,504,415 |
| | | 35,123,470 | | ELECTRONIC EQUIPMENT, | | |
| COMMERCIAL SERVICES & SUPPLIES — 2.5% | | INSTRUMENTS & COMPONENTS — 1.5% | |
| Avery Dennison Corp. | 163,270 | 5,944,661 | | Molex, Inc. | 734,050 | 15,312,283 |
| Pitney Bowes, Inc. | 165,170 | 4,038,406 | | Tyco Electronics Ltd. | 318,470 | 8,751,556 |
| Republic Services, Inc. | 645,190 | 18,723,414 | | | | 24,063,839 |
| Waste Management, Inc. | 335,740 | 11,559,528 | | ENERGY EQUIPMENT & SERVICES — 1.0% | |
| | | 40,266,009 | | Baker Hughes, Inc. | 85,900 | 4,023,556 |
| COMMUNICATIONS EQUIPMENT — 0.3% | | | BJ Services Co. | 168,690 | 3,609,966 |
| Nokia Oyj ADR | 106,250 | 1,651,125 | | Schlumberger Ltd. | 136,410 | 8,656,579 |
| QUALCOMM, Inc. | 97,150 | 4,079,328 | | | | 16,290,101 |
| | | 5,730,453 | | | | |
27
| | | | | | |
| Value | | | | | | |
| |
| | Shares | Value | | | Shares | Value |
| FOOD & STAPLES RETAILING — 1.7% | | | INSURANCE — 8.2% | | |
| Casey’s General Stores, Inc. | 89,150 | $ 2,799,310 | | Allstate Corp. (The) | 367,430 | $ 11,871,663 |
| CVS Caremark Corp. | 272,980 | 9,980,149 | | Aon Corp. | 240,050 | 10,252,535 |
| Wal-Mart Stores, Inc. | 280,750 | 15,609,700 | | Berkshire Hathaway, Inc., | | |
| | | 28,389,159 | | Class A(1) | 260 | 31,668,000 |
| FOOD PRODUCTS — 4.6% | | | | Chubb Corp. (The) | 245,870 | 12,748,360 |
| Campbell Soup Co. | 404,890 | 14,312,862 | | Marsh & McLennan | | |
| ConAgra Foods, Inc. | 393,020 | 9,853,011 | | Cos., Inc. | 1,767,290 | 43,157,222 |
| H.J. Heinz Co. | 278,360 | 12,696,000 | | Transatlantic Holdings, Inc. | 133,310 | 7,038,768 |
| Kraft Foods, Inc., Class A | 852,350 | 25,775,064 | | Travelers Cos., Inc. (The) | 295,070 | 15,916,076 |
| Unilever NV CVA | 392,570 | 11,874,381 | | | | 132,652,624 |
| | | 74,511,318 | | IT SERVICES — 0.6% | | |
| | | | | Automatic Data | | |
| HEALTH CARE EQUIPMENT & SUPPLIES — 2.4% | | Processing, Inc. | 220,380 | 9,800,299 |
| Beckman Coulter, Inc. | 271,270 | 17,035,756 | | MEDIA — 0.4% | | |
| Boston Scientific Corp.(1) | 1,436,220 | 10,369,508 | | Walt Disney Co. (The) | 191,020 | 6,668,508 |
| CareFusion Corp.(1) | 43,650 | 1,153,670 | | METALS & MINING — 0.7% | | |
| Zimmer Holdings, Inc.(1) | 182,060 | 10,777,952 | | Barrick Gold Corp. | 131,610 | 5,045,927 |
| | | 39,336,886 | | Newmont Mining Corp. | 124,860 | 6,359,120 |
| HEALTH CARE PROVIDERS & SERVICES — 1.6% | | | | 11,405,047 |
| Aetna, Inc. | 178,340 | 6,261,517 | | MULTILINE RETAIL — 0.7% | | |
| Cardinal Health, Inc. | 67,330 | 2,425,900 | | Target Corp. | 201,750 | 10,612,050 |
| CIGNA Corp. | 74,110 | 2,710,944 | | MULTI-UTILITIES — 2.3% | | |
| LifePoint Hospitals, Inc.(1) | 230,860 | 8,491,031 | | PG&E Corp. | 215,160 | 9,127,087 |
| UnitedHealth Group, Inc. | 183,210 | 5,985,471 | | Wisconsin Energy Corp. | 377,190 | 18,636,958 |
| | | 25,874,863 | | Xcel Energy, Inc. | 465,040 | 9,858,848 |
| HOTELS, RESTAURANTS & LEISURE — 1.7% | | | | | 37,622,893 |
| Hyatt Hotels Corp., | | | | OIL, GAS & CONSUMABLE FUELS — 16.4% | |
| Class A(1) | 73,950 | 2,881,092 | | | | |
| | | | | Apache Corp. | 47,790 | 4,850,685 |
| International Speedway | | | | Chevron Corp. | 679,870 | 51,554,542 |
| Corp., Class A | 549,040 | 14,148,761 | | | | |
| Speedway Motorsports, Inc. | 644,162 | 10,055,369 | | ConocoPhillips | 270,510 | 13,841,997 |
| | | 27,085,222 | | Devon Energy Corp. | 296,720 | 19,117,670 |
| HOUSEHOLD DURABLES — 0.7% | | | EQT Corp. | 424,700 | 17,412,700 |
| | | | | Exxon Mobil Corp. | 1,257,880 | 84,252,802 |
| Toll Brothers, Inc.(1) | 259,880 | 5,405,504 | | | | |
| | | | | Imperial Oil Ltd. | 321,070 | 12,401,493 |
| Whirlpool Corp. | 62,570 | 5,459,232 | | | | |
| | | | | Total SA | 754,360 | 43,791,305 |
| | | 10,864,736 | | | | |
| | | | | Valero Energy Corp. | 141,680 | 2,791,096 |
| HOUSEHOLD PRODUCTS — 2.2% | | | | | |
| | | | | XTO Energy, Inc. | 333,090 | 15,715,186 |
| Kimberly-Clark Corp. | 435,470 | 27,382,354 | | | | |
| | | | | | | 265,729,476 |
| Procter & Gamble Co. (The) | 139,530 | 8,828,063 | | | | |
| | | | | PAPER & FOREST PRODUCTS — 0.3% | |
| | | 36,210,417 | | | | |
| | | | | Weyerhaeuser Co. | 96,020 | 4,346,825 |
| INDUSTRIAL CONGLOMERATES — 3.4% | | | | | |
| | | | | PHARMACEUTICALS — 6.7% | | |
| 3M Co. | 59,220 | 4,949,015 | | | | |
| | | | | Bristol-Myers Squibb Co. | 292,610 | 7,812,687 |
| General Electric Co. | 2,756,910 | 50,175,762 | | | | |
| | | | | Eli Lilly & Co. | 383,230 | 13,880,591 |
| | | 55,124,777 | | | | |
| | | | | Johnson & Johnson | 419,350 | 27,341,620 |
| | | | | Merck & Co., Inc. | 443,160 | 16,552,026 |
| | | | | Pfizer, Inc. | 2,513,550 | 43,107,382 |
| | | | | | | 108,694,306 |
28
| | | | | | |
| Value | | | | | | |
| |
| | Shares | Value | | | Shares | Value |
| REAL ESTATE INVESTMENT TRUSTS (REITs) — 0.9% | | Temporary Cash Investments — 1.2% |
| Boston Properties, Inc. | 51,970 | $ 3,920,617 | | JPMorgan U.S. Treasury | | |
| Host Hotels & Resorts, Inc. | 530,000 | 7,764,500 | | Plus Money Market Fund | | |
| Public Storage | 40,600 | 3,734,794 | | Agency Shares | 58,100 | $ 58,100 |
| | | 15,419,911 | | Repurchase Agreement, Bank of America | |
| ROAD & RAIL — 0.9% | | | | Securities, LLC, (collateralized by various | |
| | | | | U.S. Treasury obligations, 3.125%, 1/31/17, | |
| Heartland Express, Inc. | 400,090 | 6,601,485 | | valued at $19,757,579), in a joint trading | |
| Union Pacific Corp. | 110,940 | 8,131,902 | | account at 0.01%, dated 3/31/10, due | |
| | | 14,733,387 | | 4/1/10 (Delivery value $19,300,005) | 19,300,000 |
| SEMICONDUCTORS & SEMICONDUCTOR | | | TOTAL TEMPORARY | | |
| EQUIPMENT — 2.5% | | | | CASH INVESTMENTS | | |
| Applied Materials, Inc. | 1,206,040 | 16,257,419 | | (Cost $19,358,100) | | 19,358,100 |
| Intel Corp. | 758,150 | 16,876,419 | | TOTAL INVESTMENT | | |
| | | | | SECURITIES — 100.2% | | |
| KLA-Tencor Corp. | 126,980 | 3,926,222 | | (Cost $1,505,602,382) | | 1,626,000,563 |
| Texas Instruments, Inc. | 167,080 | 4,088,447 | | OTHER ASSETS | | |
| | | 41,148,507 | | AND LIABILITIES — (0.2)% | | (3,459,260) |
| SPECIALTY RETAIL — 2.5% | | | | TOTAL NET ASSETS — 100.0% | | $1,622,541,303 |
| Lowe’s Cos., Inc. | 1,384,490 | 33,560,037 | | | | |
| PetSmart, Inc. | 222,580 | 7,113,657 | | | | |
| | | 40,673,694 | | | | |
| THRIFTS & MORTGAGE FINANCE — 0.6% | | | | | |
| Hudson City Bancorp., Inc. | 668,570 | 9,466,951 | | | | |
| TOTAL COMMON STOCKS | | | | | | |
| (Cost $1,486,244,282) | | 1,606,642,463 | | | | |
| | | | |
| Forward Foreign Currency Exchange Contracts | | |
| Contracts to Sell | Settlement Date | Value | Unrealized Gain (Loss) |
| 14,716,515 | CAD for USD | 4/30/10 | $14,489,751 | $ (35,295) |
| 34,710,643 | EUR for USD | 4/30/10 | 46,881,930 | (150,644) |
| 1,582,141,125 | JPY for USD | 4/30/10 | 16,925,443 | 159,207 |
| | | | $78,297,124 | $ (26,732) |
| (Value on Settlement Date $78,270,392) | | | |
| |
| Notes to Schedule of Investments | | |
| ADR = American Depositary Receipt | | | |
| CAD = Canadian Dollar | | | |
| CVA = Certificaten Van Aandelen | | | |
| EUR = Euro | | | | |
| JPY = Japanese Yen | | | |
| USD = United States Dollar | | | |
| (1) Non-income producing. | | | |
| |
| Industry classifications are unaudited. | | | |
| |
| |
| See Notes to Financial Statements. | | | |
29
| | | | | | |
| Large Company Value | | | | | |
| |
| MARCH 31, 2010 | | | | | | |
| |
| | Shares | Value | | | Shares | Value |
| Common Stocks — 97.5% | | | DIVERSIFIED FINANCIAL SERVICES — 7.8% | |
| AEROSPACE & DEFENSE — 2.6% | | | Bank of America Corp. | 2,481,600 | $ 44,296,560 |
| | | | | Citigroup, Inc.(1) | 1,685,800 | 6,827,490 |
| Honeywell International, Inc. | 255,000 | $ 11,543,850 | | | | |
| Lockheed Martin Corp. | 82,400 | 6,857,328 | | JPMorgan Chase & Co. | 1,077,700 | 48,227,075 |
| Northrop Grumman Corp. | 217,800 | 14,281,146 | | | | 99,351,125 |
| | | 32,682,324 | | DIVERSIFIED TELECOMMUNICATION | |
| | | | | SERVICES — 6.0% | | |
| BEVERAGES — 1.3% | | | | AT&T, Inc. | 1,700,400 | 43,938,336 |
| Coca-Cola Co. (The) | 306,000 | 16,830,000 | | CenturyTel, Inc. | 137,800 | 4,886,388 |
| BIOTECHNOLOGY — 0.8% | | | | Verizon | | |
| Amgen, Inc.(1) | 117,400 | 7,015,824 | | Communications, Inc. | 895,000 | 27,762,900 |
| Gilead Sciences, Inc.(1) | 66,800 | 3,038,064 | | | | 76,587,624 |
| | | 10,053,888 | | ELECTRIC UTILITIES — 2.2% | | |
| CAPITAL MARKETS — 4.0% | | | | Exelon Corp. | 352,400 | 15,438,644 |
| Ameriprise Financial, Inc. | 185,600 | 8,418,816 | | PPL Corp. | 436,700 | 12,100,957 |
| Bank of New York | | | | | | 27,539,601 |
| Mellon Corp. (The) | 368,100 | 11,366,928 | | ENERGY EQUIPMENT & SERVICES — 1.9% | |
| Goldman Sachs | | | | Baker Hughes, Inc. | 122,900 | 5,756,636 |
| Group, Inc. (The) | 123,100 | 21,004,553 | | | | |
| | | | | Diamond Offshore | | |
| Morgan Stanley | 339,500 | 9,943,955 | | Drilling, Inc. | 35,100 | 3,117,231 |
| | | 50,734,252 | | National Oilwell Varco, Inc. | 233,900 | 9,491,662 |
| CHEMICALS — 2.1% | | | | Transocean Ltd.(1) | 63,200 | 5,459,216 |
| E.I. du Pont | | | | | | 23,824,745 |
| de Nemours & Co. | 417,800 | 15,558,872 | | | | |
| PPG Industries, Inc. | 167,700 | 10,967,580 | | FOOD & STAPLES RETAILING — 3.2% | |
| | | 26,526,452 | | Kroger Co. (The) | 364,000 | 7,884,240 |
| COMMERCIAL BANKS — 4.3% | | | | SYSCO Corp. | 246,500 | 7,271,750 |
| PNC Financial Services | | | | Walgreen Co. | 318,000 | 11,794,620 |
| Group, Inc. | 162,900 | 9,725,130 | | Wal-Mart Stores, Inc. | 252,200 | 14,022,320 |
| U.S. Bancorp. | 662,900 | 17,155,852 | | | | 40,972,930 |
| Wells Fargo & Co. | 875,300 | 27,239,336 | | FOOD PRODUCTS — 1.2% | | |
| | | 54,120,318 | | Kraft Foods, Inc., Class A | 314,300 | 9,504,432 |
| COMMERCIAL SERVICES & SUPPLIES — 1.7% | | Unilever NV | | |
| Avery Dennison Corp. | 125,900 | 4,584,019 | | New York Shares | 200,800 | 6,056,128 |
| Pitney Bowes, Inc. | 194,500 | 4,755,525 | | | | 15,560,560 |
| R.R. Donnelley & Sons Co. | 259,200 | 5,533,920 | | HEALTH CARE EQUIPMENT & SUPPLIES — 0.4% |
| Waste Management, Inc. | 179,700 | 6,187,071 | | Medtronic, Inc. | 114,500 | 5,155,935 |
| | | 21,060,535 | | HEALTH CARE PROVIDERS & SERVICES — 1.5% |
| COMMUNICATIONS EQUIPMENT — 0.7% | | | Aetna, Inc. | 188,500 | 6,618,235 |
| Cisco Systems, Inc.(1) | 359,000 | 9,344,770 | | Quest Diagnostics, Inc. | 65,400 | 3,812,166 |
| | | | | WellPoint, Inc.(1) | 124,900 | 8,041,062 |
| COMPUTERS & PERIPHERALS — 1.2% | | | | | |
| Hewlett-Packard Co. | 278,000 | 14,775,700 | | | | 18,471,463 |
| CONSTRUCTION & ENGINEERING — 0.3% | | | HOTELS, RESTAURANTS & LEISURE — 0.5% | |
| Shaw Group, Inc. (The)(1) | 104,300 | 3,590,006 | | Darden Restaurants, Inc. | 72,300 | 3,220,242 |
| | | | | Starbucks Corp.(1) | 131,600 | 3,193,932 |
| DIVERSIFIED CONSUMER SERVICES — 0.4% | | | | | |
| H&R Block, Inc. | 266,400 | 4,741,920 | | | | 6,414,174 |
30
| | | | | | |
| Large Company Value | | | | | |
| |
| | Shares | Value | | | Shares | Value |
| HOUSEHOLD DURABLES — 0.6% | | | OFFICE ELECTRONICS — 0.4% | | |
| Newell Rubbermaid, Inc. | 470,500 | $ 7,151,600 | | Xerox Corp. | 469,200 | $ 4,574,700 |
| HOUSEHOLD PRODUCTS — 0.5% | | | OIL, GAS & CONSUMABLE FUELS — 15.8% |
| Clorox Co. | 104,400 | 6,696,216 | | Apache Corp. | 139,600 | 14,169,400 |
| INDEPENDENT POWER PRODUCERS | | | Chevron Corp. | 579,700 | 43,958,651 |
| & ENERGY TRADERS — 0.2% | | | | ConocoPhillips | 657,000 | 33,618,690 |
| NRG Energy, Inc.(1) | 145,500 | 3,040,950 | | Devon Energy Corp. | 112,000 | 7,216,160 |
| INDUSTRIAL CONGLOMERATES — 4.4% | | | Exxon Mobil Corp. | 919,000 | 61,554,620 |
| General Electric Co. | 2,719,200 | 49,489,440 | | Occidental Petroleum Corp. | 177,600 | 15,014,304 |
| Tyco International Ltd. | 177,300 | 6,781,725 | | Royal Dutch Shell plc, Class | | |
| | | 56,271,165 | | A ADR | 358,100 | 20,719,666 |
| INSURANCE — 4.8% | | | | Valero Energy Corp. | 193,900 | 3,819,830 |
| Allstate Corp. (The) | 325,800 | 10,526,598 | | | | 200,071,321 |
| Chubb Corp. (The) | 208,700 | 10,821,095 | | PAPER & FOREST PRODUCTS — 0.4% | |
| Loews Corp. | 176,900 | 6,594,832 | | International Paper Co. | 222,400 | 5,473,264 |
| Principal Financial | | | | PHARMACEUTICALS — 8.8% | | |
| Group, Inc. | 238,400 | 6,963,664 | | Abbott Laboratories | 211,600 | 11,147,088 |
| Torchmark Corp. | 143,800 | 7,694,738 | | Eli Lilly & Co. | 210,500 | 7,624,310 |
| Travelers Cos., Inc. (The) | 251,600 | 13,571,304 | | Johnson & Johnson | 362,000 | 23,602,400 |
| XL Capital Ltd., Class A | 210,400 | 3,976,560 | | Merck & Co., Inc. | 680,800 | 25,427,880 |
| | | 60,148,791 | | Pfizer, Inc. | 2,581,100 | 44,265,865 |
| IT SERVICES — 1.5% | | | | | | 112,067,543 |
| Fiserv, Inc.(1) | 97,900 | 4,969,404 | | REAL ESTATE INVESTMENT TRUSTS (REITs) — 0.6% |
| International Business | | | | Simon Property Group, Inc. | 86,900 | 7,290,910 |
| Machines Corp. | 110,900 | 14,222,925 | | SEMICONDUCTORS & SEMICONDUCTOR | |
| | | 19,192,329 | | EQUIPMENT — 1.1% | | |
| MACHINERY — 1.3% | | | | Applied Materials, Inc. | 304,700 | 4,107,356 |
| Dover Corp. | 148,200 | 6,928,350 | | Intel Corp. | 460,200 | 10,244,052 |
| Ingersoll-Rand plc | 284,300 | 9,913,541 | | | | 14,351,408 |
| | | 16,841,891 | | SOFTWARE — 2.3% | | |
| MEDIA — 4.5% | | | | Activision Blizzard, Inc. | 354,100 | 4,270,446 |
| CBS Corp., Class B | 553,300 | 7,713,002 | | Microsoft Corp. | 488,200 | 14,289,614 |
| Comcast Corp., Class A | 759,100 | 14,286,262 | | Oracle Corp. | 431,300 | 11,080,097 |
| Time Warner Cable, Inc. | 153,100 | 8,161,761 | | | | 29,640,157 |
| Time Warner, Inc. | 479,800 | 15,003,346 | | SPECIALTY RETAIL — 2.3% | | |
| Viacom, Inc., Class B(1) | 329,100 | 11,314,458 | | Best Buy Co., Inc. | 121,800 | 5,181,372 |
| | | 56,478,829 | | Gap, Inc. (The) | 190,000 | 4,390,900 |
| METALS & MINING — 0.8% | | | | Home Depot, Inc. (The) | 457,100 | 14,787,185 |
| Freeport-McMoRan | | | | Staples, Inc. | 225,600 | 5,276,784 |
| Copper & Gold, Inc. | 11,200 | 935,648 | | | | 29,636,241 |
| Nucor Corp. | 209,800 | 9,520,724 | | TEXTILES, APPAREL & LUXURY GOODS — 0.5% |
| | | 10,456,372 | | VF Corp. | 83,200 | 6,668,480 |
| MULTILINE RETAIL — 0.9% | | | | TOBACCO — 1.0% | | |
| Kohl’s Corp.(1) | 120,100 | 6,579,078 | | Altria Group, Inc. | 413,600 | 8,487,072 |
| Macy’s, Inc. | 221,000 | 4,811,170 | | Lorillard, Inc. | 48,200 | 3,626,568 |
| | | 11,390,248 | | | | 12,113,640 |
| MULTI-UTILITIES — 0.7% | | | | TOTAL COMMON STOCKS | | |
| PG&E Corp. | 209,000 | 8,865,780 | | (Cost $1,095,102,905) | | 1,236,760,157 |
31
| | |
| Large Company Value |
| |
| | Shares | Value |
| Temporary Cash Investments — | |
| Segregated For Futures | |
| Contracts — 1.5% | | |
| Repurchase Agreement, Bank of America | |
| Securities, LLC, (collateralized by various | |
| U.S. Treasury obligations, 3.125%, 1/31/17, | |
| valued at $19,383,925), in a joint trading | |
| account at 0.01%, dated 3/31/10, due | |
| 4/1/10 (Delivery value $18,935,005) | |
| (Cost $18,935,000) | | $ 18,935,000 |
| |
| Temporary Cash Investments — 0.7% |
| JPMorgan U.S. Treasury | | |
| Plus Money Market Fund | | |
| Agency Shares | 97,196 | 97,196 |
| Repurchase Agreement, Bank of America | |
| Securities, LLC, (collateralized by various | |
| U.S. Treasury obligations, 3.125%, 1/31/17, | |
| valued at $8,665,694), in a joint trading | |
| account at 0.01%, dated 3/31/10, due | |
| 4/1/10 (Delivery value $8,465,002) | 8,465,000 |
| TOTAL TEMPORARY | | |
| CASH INVESTMENTS | | |
| (Cost $8,562,196) | | 8,562,196 |
| TOTAL INVESTMENT | | |
| SECURITIES — 99.7% | | |
| (Cost $1,122,600,101) | | 1,264,257,353 |
| OTHER ASSETS AND | | |
| LIABILITIES — 0.3% | | 3,905,383 |
| TOTAL NET ASSETS — 100.0% | | $1,268,162,736 |
| | | |
| Futures Contracts | | | |
| | | Underlying Face | |
| Contracts Purchased | Expiration Date | Amount at Value | Unrealized Gain (Loss) |
| 325 S&P 500 E-Mini Futures | June 2010 | $18,934,500 | $233,041 |
| |
| Notes to Schedule of Investments | | |
| ADR = American Depositary Receipt | | | |
| (1) Non-income producing. | | | |
| |
| Industry classifications are unaudited. | | | |
| |
| |
| See Notes to Financial Statements. | | | |
32
|
| Statement of Assets and Liabilities |
| | | |
| MARCH 31, 2010 | | | |
| | | | Large |
| | Equity Income | Value | Company Value |
| Assets | | | |
| Investment securities — unaffiliated, at value (cost of | | | |
| $5,326,316,281, $1,505,602,382 and $1,122,600,101, respectively) | $6,101,980,678 | $1,626,000,563 | $1,264,257,353 |
| Investment securities — affiliated, at value (cost of $68,828,203, | | | |
| $–and $–, respectively) | 86,822,089 | — | — |
| Total investment securities, at value (cost of $5,395,144,484, | | | |
| $1,505,602,382 and $1,122,600,101, respectively) | 6,188,802,767 | 1,626,000,563 | 1,264,257,353 |
| Cash | 16,741 | — | — |
| Foreign currency holdings, at value (cost of $853,079, $– and $–, | | | |
| respectively) | 855,421 | — | — |
| Deposits at broker for futures contracts | — | — | 1,462,500 |
| Receivable for investments sold | 145,584,145 | 2,437,351 | — |
| Receivable for capital shares sold | 10,847,872 | 1,104,126 | 2,786,814 |
| Receivable for forward foreign currency exchange contracts | 110,928 | 159,207 | — |
| Dividends and interest receivable | 28,200,588 | 3,449,743 | 1,843,768 |
| | 6,374,418,462 | 1,633,150,990 | 1,270,350,435 |
| |
| Liabilities | | | |
| Payable for investments purchased | 62,375,622 | 6,022,312 | — |
| Payable for capital shares redeemed | 5,374,777 | 3,034,748 | 1,193,124 |
| Payable for forward foreign currency exchange contracts | 939,004 | 185,939 | — |
| Payable for variation margin on futures contracts | — | — | 68,250 |
| Accrued management fees | 4,888,662 | 1,330,572 | 858,618 |
| Distribution fees payable | 123,330 | 6,577 | 14,626 |
| Service fees (and distribution fees — A Class and R Class) payable | 366,520 | 29,539 | 53,081 |
| | 74,067,915 | 10,609,687 | 2,187,699 |
| Net Assets | $6,300,350,547 | $1,622,541,303 | $1,268,162,736 |
| |
| |
| See Notes to Financial Statements. | | | |
33
| | | |
| MARCH 31, 2010 | | | |
| | | | Large |
| | Equity Income | Value | Company Value |
| Net Assets Consist of: | | | |
| Capital (par value and paid-in surplus) | $ 6,704,677,053 | $2,077,827,233 | $1,631,393,642 |
| Undistributed net investment income | 10,254,950 | 2,725,069 | — |
| Accumulated net realized loss on investment | | | |
| and foreign currency transactions | (1,207,419,323) | (578,382,033) | (505,121,199) |
| Net unrealized appreciation on investments and translation | | | |
| of assets and liabilities in foreign currencies | 792,837,867 | 120,371,034 | 141,890,293 |
| | $ 6,300,350,547 | $1,622,541,303 | $1,268,162,736 |
| | | | |
| Investor Class, $0.01 Par Value | | | |
| Net assets | $3,829,492,495 | $1,274,063,068 | $786,992,390 |
| Shares outstanding | 566,112,182 | 235,938,049 | 150,129,812 |
| Net asset value per share | $6.76 | $5.40 | $5.24 |
| | | | |
| Institutional Class, $0.01 Par Value | | | |
| Net assets | $792,024,259 | $214,112,484 | $243,190,345 |
| Shares outstanding | 117,037,959 | 39,613,043 | 46,378,285 |
| Net asset value per share | $6.77 | $5.41 | $5.24 |
| | | | |
| A Class, $0.01 Par Value | | | |
| Net assets | $1,385,436,017 | $119,362,692 | $200,408,396 |
| Shares outstanding | 204,799,090 | 22,115,079 | 38,237,503 |
| Net asset value per share | $6.76 | $5.40 | $5.24 |
| Maximum offering price (net asset value divided by 0.9425) | $7.17 | $5.73 | $5.56 |
| | | | |
| B Class, $0.01 Par Value | | | |
| Net assets | $7,383,061 | $3,182,022 | $5,661,660 |
| Shares outstanding | 1,089,951 | 589,817 | 1,076,741 |
| Net asset value per share | $6.77 | $5.39 | $5.26 |
| | | | |
| C Class, $0.01 Par Value | | | |
| Net assets | $193,776,074 | $7,293,723 | $17,210,807 |
| Shares outstanding | 28,634,847 | 1,362,518 | 3,283,112 |
| Net asset value per share | $6.77 | $5.35 | $5.24 |
| | | | |
| R Class, $0.01 Par Value | | | |
| Net assets | $92,238,641 | $4,527,314 | $14,699,138 |
| Shares outstanding | 13,661,562 | 838,202 | 2,802,831 |
| Net asset value per share | $6.75 | $5.40 | $5.24 |
| |
| |
| See Notes to Financial Statements. | | | |
34
| | | |
| YEAR ENDED MARCH 31, 2010 | | | |
| | | | Large |
| | Equity Income | Value | Company Value |
| Investment Income (Loss) | | | |
| Income: | | | |
| Dividends (including $8,738,439 from affiliates | | | |
| in Equity Income and net of foreign taxes withheld | | | |
| of $2,410,714, $458,053 and $76, respectively) | $ 174,012,165 | $ 42,291,026 | $ 33,685,095 |
| Interest | 37,062,424 | 24,633 | 44,568 |
| | 211,074,589 | 42,315,659 | 33,729,663 |
| Expenses: | | | |
| Management fees | 51,069,548 | 13,959,185 | 9,846,147 |
| Distribution fees: | | | |
| B Class | 41,481 | 22,989 | 43,260 |
| C Class | 1,121,730 | 49,692 | 135,998 |
| Service fees: | | | |
| B Class | 13,827 | 7,663 | 14,420 |
| C Class | 373,910 | 16,564 | 45,333 |
| Distribution and service fees: | | | |
| A Class | 2,798,712 | 255,524 | 485,436 |
| R Class | 336,212 | 18,418 | 65,783 |
| Directors’ fees and expenses | 250,304 | 56,489 | 54,770 |
| Other expenses | 286 | 17 | 40 |
| | 56,006,010 | 14,386,541 | 10,691,187 |
| Net investment income (loss) | 155,068,579 | 27,929,118 | 23,038,476 |
| | | | |
| Realized and Unrealized Gain (Loss) | | | |
| Net realized gain (loss) on: | | | |
| Investment transactions (including $(1,076,539) | | | |
| from affiliates in Equity Income) | 235,322,854 | 2,653,853 | (90,386,312) |
| Foreign currency transactions | (5,894,139) | (2,459,892) | — |
| Futures contract transactions | — | 2,017,808 | 21,290,711 |
| | 229,428,715 | 2,211,769 | (69,095,601) |
| | | | |
| Change in net unrealized appreciation (depreciation) on: | | | |
| Investments | 918,795,741 | 479,207,684 | 504,422,717 |
| Translation of assets and liabilities in foreign currencies | (1,364,242) | (147,332) | — |
| Futures contracts | — | — | (4,158,514) |
| | 917,431,499 | 479,060,352 | 500,264,203 |
| | | | |
| Net realized and unrealized gain (loss) | 1,146,860,214 | 481,272,121 | 431,168,602 |
| | | | |
| Net Increase (Decrease) in Net Assets | | | |
| Resulting from Operations | $1,301,928,793 | $509,201,239 | $454,207,078 |
See Notes to Financial Statements.
35
|
| Statement of Changes in Net Assets |
| | | | |
| YEARS ENDED MARCH 31, 2010 AND MARCH 31, 2009 | | | |
| | Equity Income | Value | |
| Increase (Decrease) in Net Assets | 2010 | 2009 | 2010 | 2009 |
| Operations | | | | |
| Net investment income (loss) | $ 155,068,579 | $ 155,553,464 | $ 27,929,118 | $ 44,173,650 |
| Net realized gain (loss) | 229,428,715 | (1,038,472,929) | 2,211,769 | (307,533,855) |
| Change in net unrealized | | | | |
| appreciation (depreciation) | 917,431,499 | (304,301,554) | 479,060,352 | (350,470,048) |
| Net increase (decrease) in net assets | | | | |
| resulting from operations | 1,301,928,793 | (1,187,221,019) | 509,201,239 | (613,830,253) |
| | | | | |
| Distributions to Shareholders | | | | |
| From net investment income: | | | | |
| Investor Class | (91,538,788) | (116,479,871) | (22,506,189) | (35,722,719) |
| Institutional Class | (18,672,015) | (18,736,225) | (2,883,160) | (5,401,338) |
| A Class | (27,339,571) | (27,423,419) | (1,666,471) | (3,179,752) |
| B Class | (92,764) | (28,307) | (29,104) | (67,375) |
| C Class | (2,474,684) | (2,668,345) | (63,174) | (136,824) |
| R Class | (1,479,300) | (1,185,911) | (49,343) | (44,354) |
| Decrease in net assets from distributions | (141,597,122) | (166,522,078) | (27,197,441) | (44,552,362) |
| | | | | |
| Capital Share Transactions | | | | |
| Net increase (decrease) in net assets from | | | | |
| capital share transactions | 794,999,912 | 389,430,888 | (52,291,998) | (374,420,582) |
| | | | | |
| Net increase (decrease) in net assets | 1,955,331,583 | (964,312,209) | 429,711,800 | (1,032,803,197) |
| | | | | |
| Net Assets | | | | |
| Beginning of period | 4,345,018,964 | 5,309,331,173 | 1,192,829,503 | 2,225,632,700 |
| End of period | $6,300,350,547 | $ 4,345,018,964 | $1,622,541,303 | $ 1,192,829,503 |
| | | | | |
| Undistributed net investment income | $10,254,950 | $2,025,950 | $2,725,069 | $1,593,245 |
| |
| |
| See Notes to Financial Statements. | | | | |
36
| | |
| YEARS ENDED MARCH 31, 2010 AND MARCH 31, 2009 | | |
| | Large Company Value |
| Increase (Decrease) in Net Assets | 2010 | 2009 |
| Operations | | |
| Net investment income (loss) | $ 23,038,476 | $ 43,729,282 |
| Net realized gain (loss) | (69,095,601) | (434,126,077) |
| Change in net unrealized appreciation (depreciation) | 500,264,203 | (467,530,642) |
| Net increase (decrease) in net assets resulting from operations | 454,207,078 | (857,927,437) |
| | | |
| Distributions to Shareholders | | |
| From net investment income: | | |
| Investor Class | (13,895,896) | (24,087,668) |
| Institutional Class | (5,761,662) | (12,985,767) |
| A Class | (3,184,128) | (6,318,876) |
| B Class | (49,293) | (146,748) |
| C Class | (153,902) | (528,933) |
| R Class | (183,617) | (299,117) |
| From net realized gains: | | |
| Investor Class | — | (12,476,507) |
| Institutional Class | — | (6,638,027) |
| A Class | — | (3,841,488) |
| B Class | — | (121,562) |
| C Class | — | (435,919) |
| R Class | — | (202,323) |
| Decrease in net assets from distributions | (23,228,498) | (68,082,935) |
| | | |
| Capital Share Transactions | | |
| Net increase (decrease) in net assets from capital share transactions | (202,619,467) | (280,606,732) |
| | | |
| Net increase (decrease) in net assets | 228,359,113 | (1,206,617,104) |
| | | |
| Net Assets | | |
| Beginning of period | 1,039,803,623 | 2,246,420,727 |
| End of period | $1,268,162,736 | $1,039,803,623 |
| |
| |
| See Notes to Financial Statements. | | |
37
|
| Notes to Financial Statements |
MARCH 31, 2010
1. Organization and Summary of Significant Accounting Policies
Organization — American Century Capital Portfolios, Inc. (the corporation) is registered under the Investment Company Act of 1940 (the 1940 Act) as an open-end management investment company. Equity Income Fund (Equity Income), Value Fund (Value) and Large Company Value Fund (Large Company Value) (collectively, the funds) are three funds in a series issued by the corporation. The funds are diversified under the 1940 Act. Equity Income’s investment objective is to seek current income; capital appreciation is a secondary objective. Equity Income pursues its investment objective by investing in securities of companies with a favorable income-paying history that have prospects for income payments to continue or increase. Value and Large Company Value’s investment objective is to seek long-term capital growth; income is a secondary objective. Value and Large Company Value pursue their investment objective by investing in stocks of companies that management believes to be undervalued at the time of purchase. Value invests in companies with small, medium, and large market capitalization and Large Company Value invests in companies with larger market capitalization. The following is a summary of the funds’ significant accounting policies.
Multiple Class — The funds are authorized to issue the Investor Class, the Institutional Class, the A Class, the B Class, the C Class and the R Class. The A Class may incur an initial sales charge. The A Class, B Class and C Class may be subject to a contingent deferred sales charge. The share classes differ principally in their respective sales charges and distribution and shareholder servicing expenses and arrangements. All shares of each fund represent an equal pro rata interest in the net assets of the class to which such shares belong, and have identical voting, dividend, liquidation and other rights and the same terms and conditions, except for class specific expenses and exclusive rights to vote on matters affecting only individual classes. Income, non-class specific expenses, and realized and unrealized capital gains and losses of the funds are allocated to each class of shares based on their relative net assets.
Security Valuations — Securities traded primarily on a principal securities exchange are valued at the last reported sales price, or at the mean of the latest bid and asked prices where no last sales price is available. Depending on local convention or regulation, securities traded over-the-counter are valued at the mean of the latest bid and asked prices, the last sales price, or the official close price. Investments in open-end management investment companies are valued at the reported net asset value. Debt securities not traded on a principal securities exchange are valued through a commercial pricing service or at the mean of the most recent bid and asked prices. Discount notes may be valued through a commercial pricing service or at amortized cost, which approximates fair value. Securities traded on foreign securities ex changes and over-the-counter markets are normally completed before the close of business on days that the New York Stock Exchange (the Exchange) is open and may also take place on days when the Exchange is not open. If an event occurs after the value of a security was established but before the net asset value per share was determined that was likely to materially change the net asset value, that security would be valued as determined in accordance with procedures adopted by the Board of Directors. If the funds determine that the market price of a portfolio security is not readily available, or that the valuation methods mentioned above do not reflect the security’s fair value, such security is valued as determined by the Board of Directors or its designee, in accordance with procedures adopted by the Board of Directors, if such determination would materially impact a fund’s net asset value. Certain other circumstances may cause the funds to use alternative procedures to value a security such as: a security has been declared in default; trading in a security has been halted during the trading day; or there is a foreign market holiday and no trading will commence.
38
Security Transactions — For financial reporting purposes, security transactions are accounted for as of the trade date. Net realized gains and losses are determined on the identified cost basis, which is also used for federal income tax purposes.
Investment Income — Dividend income less foreign taxes withheld, if any, is recorded as of the ex-dividend date. Interest income is recorded on the accrual basis and includes accretion of discounts and amortization of premiums.
Equity-Linked Debt and Linked-Equity Securities — The funds may invest in hybrid equity securities, which usually convert into common stock at a date predetermined by the issuer. These securities generally offer a higher dividend yield than that of the common stock to which the security is linked. These instruments are issued by a company other than the one to which the security is linked and carry the credit of the issuer, not that of the underlying common stock. The securities’ appreciation is limited based on a predetermined final cap price at the date of the conversion. Risks of investing in these securities include, but are not limited to, a set time to capture the yield advantage, limited appreciation potential, decline in value of the underlying stock, and failure of the issuer to pay dividends or to deliver c ommon stock at maturity.
Foreign Currency Translations —All assets and liabilities initially expressed in foreign currencies are translated into U.S. dollars at prevailing exchange rates at period end. The funds may enter into spot foreign currency exchange contracts to facilitate transactions denominated in a foreign currency. Purchases and sales of investment securities, dividend and interest income, spot foreign currency exchange contracts, and certain expenses are translated at the rates of exchange prevailing on the respective dates of such transactions. For assets and liabilities, other than investments in securities, net realized and unrealized gains and losses from foreign currency translations arise from changes in currency exchange rates.
Net realized and unrealized foreign currency exchange gains or losses occurring during the holding period of investment securities are a component of net realized gain (loss) on investment transactions and unrealized appreciation (depreciation) on investments, respectively. Certain countries may impose taxes on the contract amount of purchases and sales of foreign currency contracts in their currency. The funds record the foreign tax expense, if any, as a reduction to the net realized gain (loss) on foreign currency transactions.
Repurchase Agreements — The funds may enter into repurchase agreements with institutions that American Century Investment Management, Inc. (ACIM) (the investment advisor) has determined are creditworthy pursuant to criteria adopted by the Board of Directors. Each repurchase agreement is recorded at cost. Each fund requires that the collateral, represented by securities, received in a repurchase transaction be transferred to the custodian in a manner sufficient to enable each fund to obtain those securities in the event of a default under the repurchase agreement. ACIM monitors, on a daily basis, the securities transferred to ensure the value, including accrued interest, of the securities under each repurchase agreement is equal to or greater than amounts owed to each fund under each repurchase agreement.
Joint Trading Account — Pursuant to an Exemptive Order issued by the Securities and Exchange Commission, each fund, along with certain other funds in the American Century Investments family of funds, may transfer uninvested cash balances into a joint trading account. These balances are invested in one or more repurchase agreements that are collateralized by U.S. Treasury or Agency obligations.
Income Tax Status — It is each fund’s policy to distribute substantially all net investment income and net realized gains to shareholders and to otherwise qualify as a regulated investment company under provisions of the Internal Revenue Code. The funds are no longer subject to examination by tax authorities for years prior to 2007. At this time, management believes there are no uncertain tax positions which, based on their technical merit, would not be sustained upon examination and for which it is reasonably possible that the total amounts of unrecognized tax benefits will significantly change in the next twelve months. Accordingly, no provision has been made for federal or state income taxes.
39
Distributions to Shareholders — Distributions to shareholders are recorded on the ex-dividend date. Distributions from net investment income are declared and paid quarterly. Distributions from net realized gains, if any, are generally declared and paid annually.
Indemnifications — Under the corporation’s organizational documents, its officers and directors are indemnified against certain liabilities arising out of the performance of their duties to the funds. In addition, in the normal course of business, the funds enter into contracts that provide general indemnifications. The maximum exposure under these arrangements is unknown as this would involve future claims that may be made against a fund. The risk of material loss from such claims is considered by management to be remote.
Use of Estimates — The financial statements are prepared in conformity with accounting principles generally accepted in the United States of America, which may require management to make certain estimates and assumptions at the date of the financial statements. Actual results could differ from these estimates.
Subsequent Events — In preparing the financial statements, management evaluated the impact of events or transactions occurring through the date the financial statements were issued that would merit recognition or disclosure.
2. Fees and Transactions with Related Parties
Management Fees — The corporation has entered into a Management Agreement with ACIM, under which ACIM provides the funds with investment advisory and management services in exchange for a single, unified management fee (the fee) per class. The Agreement provides that all expenses of managing and operating the funds, except brokerage expenses, taxes, interest, fees and expenses of the independent directors (including legal counsel fees) and extraordinary expenses, will be paid by ACIM. The fee is computed and accrued daily based on the daily net assets of each specific class of shares of each fund and paid monthly in arrears. For funds with a stepped fee schedule, the rate of the fee is determined by applying a fee rate calculation formula. This formula takes into account each fund’s assets as well as certain assets, if a ny, of other clients of the investment advisor outside the American Century Investments family of funds (such as subadvised funds and separate accounts) that have very similar investment teams and investment strategies (strategy assets). The annual management fee schedule for Equity Income ranges from 0.80% to 1.00% for the Investor Class, A Class, B Class, C Class and R Class. The annual management fee schedule for Value ranges from 0.85% to 1.00% for the Investor Class, A Class, B Class, C Class and R Class. The annual management fee schedule for Large Company Value ranges from 0.70% to 0.90% for the Investor Class, A Class, B Class, C Class and R Class. The Institutional Class of each fund is 0.20% less at each point within the range.
The effective annual management fee for each class of each fund for the year ended March 31, 2010, was as follows:
| | |
| | Investor, A, B, C & R | Institutional |
| Equity Income | 0.97% | 0.77% |
| Value | 1.00% | 0.80% |
| Large Company Value | 0.84% | 0.64% |
40
Distribution and Service Fees — The Board of Directors has adopted a separate Master Distribution and Individual Shareholder Services Plan for each of the A Class, B Class, C Class and R Class (collectively the plans), pursuant to Rule 12b-1 of the 1940 Act. The plans provide that the A Class will pay American Century Investment Services, Inc. (ACIS) an annual distribution and service fee of 0.25%. The plans provide that the B Class and the C Class will each pay ACIS an annual distribution fee of 0.75% and service fee of 0.25%. The plans provide that the R Class will pay ACIS an annual distribution and service fee of 0.50%. The fees are computed and accrued daily based on each class’s daily net assets and paid monthly in arrears. The fees are used to pay financial intermediaries for distribution and individual shareholde r services. Fees incurred under the plans during the year ended March 31, 2010, are detailed in the Statement of Operations.
Related Parties — Certain officers and directors of the corporation are also officers and/or directors of American Century Companies, Inc. (ACC), the parent of the corporation’s investment advisor, ACIM, the distributor of the corporation, ACIS, and the corporation’s transfer agent, American Century Services, LLC.
The funds are eligible to invest in a money market fund for temporary purposes, which is managed by J.P. Morgan Investment Management, Inc. (JPMIM). The funds have a Mutual Funds Services Agreement with J.P. Morgan Investor Services Co. (JPMIS) and a securities lending agreement with JPMorgan Chase Bank (JPMCB). JPMCB is a custodian of the funds. JPMIM, JPMIS and JPMCB are wholly owned subsidiaries of JPMorgan Chase & Co. (JPM). JPM is an equity investor in ACC.
3. Investment Transactions
Investment transactions, excluding short-term investments, for the year ended March 31, 2010, were as follows:
| | | |
| | Equity Income | Value | Large Company Value |
| Purchases | $ 5,920,696,270 | $ 851,540,330 | $ 292,686,697 |
| Sales | $ 5,391,040,053 | $ 900,644,745 | $ 427,426,100 |
41
| | | | |
| 4. Capital Share Transactions | | | | |
| |
| Transactions in shares of the funds were as follows: | | |
| |
| | Year ended March 31, 2010 | Year ended March 31, 2009 |
| | Shares | Amount | Shares | Amount |
| Equity Income | | | | |
| Investor Class/Shares Authorized | 1,800,000,000 | | 1,500,000,000 | |
| Sold | 169,677,002 | $1,047,154,389 | 144,479,407 | $ 866,731,526 |
| Issued in reinvestment of distributions | 13,016,992 | 82,056,572 | 17,100,135 | 107,601,292 |
| Redeemed | (154,423,129) | (955,914,532) | (133,115,506) | (842,860,297) |
| | 28,270,865 | 173,296,429 | 28,464,036 | 131,472,521 |
| Institutional Class/Shares Authorized | 350,000,000 | | 240,000,000 | |
| Sold | 47,822,155 | 296,483,471 | 40,221,176 | 248,521,793 |
| Issued in reinvestment of distributions | 2,654,543 | 16,791,045 | 2,911,495 | 18,133,861 |
| Redeemed | (26,155,585) | (159,873,283) | (18,314,225) | (117,878,477) |
| | 24,321,113 | 153,401,233 | 24,818,446 | 148,777,177 |
| A Class/Shares Authorized | 600,000,000 | | 475,000,000 | |
| Sold | 107,205,616 | 663,509,713 | 62,666,044 | 374,765,261 |
| Issued in reinvestment of distributions | 4,162,263 | 26,333,580 | 4,243,751 | 26,565,849 |
| Redeemed | (53,208,153) | (333,546,851) | (48,118,311) | (307,954,781) |
| | 58,159,726 | 356,296,442 | 18,791,484 | 93,376,329 |
| B Class/Shares Authorized | 10,000,000 | | 20,000,000 | |
| Sold | 724,358 | 4,355,007 | 445,508 | 2,606,785 |
| Issued in reinvestment of distributions | 11,269 | 71,783 | 3,746 | 21,871 |
| Redeemed | (86,971) | (547,248) | (40,178) | (245,850) |
| | 648,656 | 3,879,542 | 409,076 | 2,382,806 |
| C Class/Shares Authorized | 100,000,000 | | 50,000,000 | |
| Sold | 14,315,632 | 88,023,700 | 5,847,450 | 34,543,379 |
| Issued in reinvestment of distributions | 325,677 | 2,055,686 | 382,672 | 2,394,695 |
| Redeemed | (3,896,987) | (24,563,635) | (4,359,143) | (27,550,459) |
| | 10,744,322 | 65,515,751 | 1,870,979 | 9,387,615 |
| R Class/Shares Authorized | 50,000,000 | | 20,000,000 | |
| Sold | 11,210,088 | 68,808,648 | 2,434,300 | 14,833,099 |
| Issued in reinvestment of distributions | 226,679 | 1,442,220 | 184,849 | 1,157,676 |
| Redeemed | (4,358,485) | (27,640,353) | (1,898,160) | (11,956,335) |
| | 7,078,282 | 42,610,515 | 720,989 | 4,034,440 |
| Net increase (decrease) | 129,222,964 | $ 794,999,912 | 75,075,010 | $ 389,430,888 |
42
| | | | |
| | Year ended March 31, 2010 | Year ended March 31, 2009 |
| | Shares | Amount | Shares | Amount |
| Value | | | | |
| Investor Class/Shares Authorized | 880,000,000 | | 1,250,000,000 | |
| Sold | 29,425,799 | $ 136,358,039 | 30,987,365 | $ 146,011,346 |
| Issued in reinvestment of distributions | 4,332,822 | 20,695,344 | 7,104,843 | 33,183,474 |
| Redeemed | (54,362,072) | (252,065,378) | (76,759,099) | (385,699,104) |
| | (20,603,451) | (95,011,995) | (38,666,891) | (206,504,284) |
| Institutional Class/Shares Authorized | 125,000,000 | | 125,000,000 | |
| Sold | 18,656,545 | 92,085,593 | 9,345,154 | 45,000,807 |
| Issued in reinvestment of distributions | 592,396 | 2,868,474 | 1,138,948 | 5,401,338 |
| Redeemed | (12,054,560) | (53,856,923) | (31,202,939) | (159,526,056) |
| | 7,194,381 | 41,097,144 | (20,718,837) | (109,123,911) |
| A Class/Shares Authorized | 100,000,000 | | 150,000,000 | |
| Sold | 7,643,029 | 37,535,454 | 6,714,489 | 33,425,372 |
| Issued in reinvestment of distributions | 342,437 | 1,632,715 | 661,446 | 3,123,129 |
| Redeemed | (7,768,233) | (37,737,001) | (18,645,461) | (92,499,588) |
| | 217,233 | 1,431,168 | (11,269,526) | (55,951,087) |
| B Class/Shares Authorized | 20,000,000 | | 20,000,000 | |
| Sold | 20,262 | 95,773 | 27,172 | 123,211 |
| Issued in reinvestment of distributions | 5,236 | 24,541 | 12,613 | 58,313 |
| Redeemed | (132,822) | (634,172) | (311,458) | (1,540,863) |
| | (107,324) | (513,858) | (271,673) | (1,359,339) |
| C Class/Shares Authorized | 10,000,000 | | 20,000,000 | |
| Sold | 225,800 | 1,046,952 | 283,303 | 1,313,799 |
| Issued in reinvestment of distributions | 10,522 | 49,054 | 23,299 | 106,981 |
| Redeemed | (308,499) | (1,463,920) | (881,793) | (4,338,814) |
| | (72,177) | (367,914) | (575,191) | (2,918,034) |
| R Class/Shares Authorized | 10,000,000 | | 20,000,000 | |
| Sold | 580,506 | 2,693,868 | 432,648 | 2,018,584 |
| Issued in reinvestment of distributions | 10,279 | 49,343 | 9,964 | 44,354 |
| Redeemed | (345,574) | (1,669,754) | (130,728) | (626,865) |
| | 245,211 | 1,073,457 | 311,884 | 1,436,073 |
| Net increase (decrease) | (13,126,127) | $ (52,291,998) | (71,190,234) | $(374,420,582) |
43
| | | | |
| | Year ended March 31, 2010 | Year ended March 31, 2009 |
| | Shares | Amount | Shares | Amount |
| Large Company Value | | | | |
| Investor Class/Shares Authorized | 550,000,000 | | 550,000,000 | |
| Sold | 31,999,754 | $ 146,769,217 | 59,296,017 | $ 310,739,279 |
| Issued in reinvestment of distributions | 1,803,551 | 8,667,136 | 5,065,704 | 23,264,926 |
| Redeemed | (40,133,547) | (188,017,635) | (101,187,145) | (517,924,401) |
| | (6,330,242) | (32,581,282) | (36,825,424) | (183,920,196) |
| Institutional Class/Shares Authorized | 200,000,000 | | 200,000,000 | |
| Sold | 12,953,075 | 59,584,815 | 41,223,991 | 215,645,715 |
| Issued in reinvestment of distributions | 992,901 | 4,745,792 | 3,585,809 | 16,456,627 |
| Redeemed | (43,176,588) | (195,513,472) | (52,640,123) | (242,779,188) |
| | (29,230,612) | (131,182,865) | (7,830,323) | (10,676,846) |
| A Class/Shares Authorized | 150,000,000 | | 300,000,000 | |
| Sold | 8,288,328 | 38,063,429 | 11,140,257 | 57,167,088 |
| Issued in reinvestment of distributions | 403,887 | 1,922,104 | 1,541,631 | 7,055,998 |
| Redeemed | (15,234,522) | (71,180,263) | (25,533,095) | (130,775,138) |
| | (6,542,307) | (31,194,730) | (12,851,207) | (66,552,052) |
| B Class/Shares Authorized | 10,000,000 | | 20,000,000 | |
| Sold | 12,513 | 54,852 | 42,187 | 194,556 |
| Issued in reinvestment of distributions | 8,644 | 41,137 | 49,239 | 219,947 |
| Redeemed | (392,323) | (1,813,191) | (640,231) | (3,262,484) |
| | (371,166) | (1,717,202) | (548,805) | (2,847,981) |
| C Class/Shares Authorized | 20,000,000 | | 50,000,000 | |
| Sold | 289,450 | 1,380,883 | 599,720 | 2,971,675 |
| Issued in reinvestment of distributions | 11,872 | 56,197 | 74,819 | 335,855 |
| Redeemed | (1,757,154) | (8,012,506) | (3,932,850) | (20,238,583) |
| | (1,455,832) | (6,575,426) | (3,258,311) | (16,931,053) |
| R Class/Shares Authorized | 10,000,000 | | 20,000,000 | |
| Sold | 835,084 | 3,697,955 | 862,495 | 4,327,553 |
| Issued in reinvestment of distributions | 37,073 | 178,037 | 108,516 | 485,125 |
| Redeemed | (702,319) | (3,243,954) | (912,549) | (4,491,282) |
| | 169,838 | 632,038 | 58,462 | 321,396 |
| Net increase (decrease) | (43,760,321) | $(202,619,467) | (61,255,608) | $(280,606,732) |
44
5. Affiliated Company Transactions
If a fund’s holding represents ownership of 5% or more of the voting securities of a company, the company is affiliated as defined in the 1940 Act. A summary of transactions for each company which is or was an affiliate at or during the year ended March 31, 2010 follows:
| | | | | | | |
| | March 31, 2009 | | | | | March 31, 2010 |
| | Share | Purchase | | Realized | Dividend | Share | |
| Fund/Company | Balance | Cost | Sales Cost | Gain (Loss) | Income | Balance | Market Value |
| |
| Equity Income | | | | | | | |
| AGL Resources, Inc.(1) | 3,573,500 | $ 2,686,006 | $41,799,522 | $(1,075,023) | $5,121,526 | 2,463,700 | (1) |
| WGL Holdings, Inc. | 2,371,288 | 10,892,526 | 6,777,361 | (1,516) | 3,616,913 | 2,505,688 | $86,822,089 |
| | | $13,578,532 | $48,576,883 | $(1,076,539) | $8,738,439 | | $86,822,089 |
| (1) Company was not an affiliate at March 31, 2010. | | | | | |
6. Fair Value Measurements
The funds’ securities valuation process is based on several considerations and may use multiple inputs to determine the fair value of the positions held by the funds. In conformity with accounting principles generally accepted in the United States of America, the inputs used to determine a valuation are classified into three broad levels as follows:
• Level 1 valuation inputs consist of unadjusted quoted prices in an active market for identical securities;
• Level 2 valuation inputs consist of significant direct or indirect observable market data (including quoted prices for similar securities, evaluations of subsequent market events, interest rates, prepayment speeds, credit risk, etc.); or
• Level 3 valuation inputs consist of significant unobservable inputs (including a fund’s own assumptions).
The level classification is based on the lowest level input that is significant to the fair valuation measurement. The valuation inputs are not an indication of the risks associated with investing in these securities or other financial instruments.
The following is a summary of the valuation inputs used to determine the fair value of the funds’ securities and other financial instruments as of March 31, 2010. The Schedule of Investments provides additional details of the funds’ portfolio holdings.
| | | | |
| | Level 1 | Level 2 | Level 3 | |
| |
| Equity Income | | | | |
| Investment Securities | | | | |
| Common Stocks | $4,295,814,398 | $ 271,611,473 | — | |
| Convertible Bonds | — | 1,342,621,712 | — | |
| Convertible Preferred Stocks | — | 245,895,000 | — | |
| Preferred Stocks | — | 8,329,155 | — | |
| Temporary Cash Investments | 31,029 | 24,500,000 | — | |
| Total Value of Investment Securities | $4,295,845,427 | $1,892,957,340 | — | |
| | | | | |
| Other Financial Instruments | | | | |
| Total Unrealized Gain (Loss) on Forward | | | | |
| Foreign Currency Exchange Contracts | — | $(828,076) | — | |
45
| | | | |
| | Level 1 | Level 2 | Level 3 | |
| |
| Value | | | | |
| Investment Securities | | | | |
| Domestic Common Stocks | $1,495,795,715 | — | | — |
| Foreign Common Stocks | 15,448,608 | $ 95,398,140 | | — |
| Temporary Cash Investments | 58,100 | 19,300,000 | | — |
| Total Value of Investment Securities | $1,511,302,423 | $114,698,140 | | — |
| |
| Other Financial Instruments | | | | |
| Total Unrealized Gain (Loss) on Forward | | | | |
| Foreign Currency Exchange Contracts | — | $(26,732) | | — |
| |
| Large Company Value | | | | |
| Investment Securities | | | | |
| Common Stocks | $1,236,760,157 | — | | — |
| Temporary Cash Investments | 97,196 | $27,400,000 | | — |
| Total Value of Investment Securities | $1,236,857,353 | $27,400,000 | | — |
| |
| Other Financial Instruments | | | | |
| Total Unrealized Gain (Loss) on Futures Contracts | $233,041 | — | | — |
7. Derivative Instruments
Equity Price Risk — Value and Large Company Value are subject to equity price risk in the normal course of pursuing their investment objectives. A fund may enter into futures contracts based on an equity index in order to manage its exposure to changes in market conditions. A fund may purchase futures contracts to gain exposure to increases in market value or sell futures contracts to protect against a decline in market value. Upon entering into a futures contract, a fund is required to deposit either cash or securities in an amount equal to a certain percentage of the contract value (initial margin). Subsequent payments (variation margin) are made or received daily, in cash, by a fund. The variation margin is equal to the daily change in the contract value and is recorded as unrealized gains and losses. A fund recognizes a r ealized gain or loss when the contract is closed or expires. Net realized and unrealized gains or losses occurring during the holding period of futures contracts are a component of net realized gain (loss) on futures contract transactions and change in net unrealized appreciation (depreciation) on futures contracts, respectively. One of the risks of entering into futures contracts is the possibility that the change in value of the contract may not correlate with the changes in value of the underlying securities. For Large Company Value, the equity price risk derivative instruments held at period end as disclosed on the Schedule of Investments are indicative of the fund’s typical volume during the period. During the period, Value infrequently purchased equity price risk derivative instruments for temporary investment purposes.
Foreign Currency Risk — Equity Income and Value are subject to foreign currency exchange rate risk in the normal course of pursuing their investment objectives. The value of foreign investments held by a fund may be significantly affected by changes in foreign currency exchange rates. The dollar value of a foreign security generally decreases when the value of the dollar rises against the foreign currency in which the security is denominated and tends to increase when the value of the dollar declines against such foreign currency. A fund may enter into forward foreign currency exchange contracts to reduce a fund’s exposure to foreign currency exchange rate fluctuations. The net U.S. dollar value of foreign currency underlying all contractual commitments held by a fund and the resulting unrealized appreciation or deprecia tion are determined daily using prevailing exchange rates. Realized gain or loss is recorded upon the termination of the contract. Net realized and unrealized gains or losses occurring during the holding period
46
of forward foreign currency exchange contracts are a component of net realized gain (loss) on foreign currency transactions and change in net unrealized appreciation (depreciation) on translation of assets and liabilities in foreign currencies, respectively. A fund bears the risk of an unfavorable change in the foreign currency exchange rate underlying the forward contract. Additionally, losses, up to the fair value, may arise if the counterparties do not perform under the contract terms. The risk of loss from non-performance by the counterparty may be reduced by the use of master netting agreements. The foreign currency risk derivative instruments held at period end as disclosed on the Schedule of Investments are indicative of Equity Income’s and Value’s average volume during the period.
Value of Derivative Instruments as of March 31, 2010
| | | | | |
| | Asset Derivatives | | Liability Derivatives |
| Fund/Type | Location on Statement | | | Location on Statement | |
| of Derivative | of Assets and Liabilities | Value | | of Assets and Liabilities | Value |
| |
| Equity Income | | | | | |
| Foreign Currency Risk | Receivable for forward foreign | | | Payable for forward foreign | |
| | currency exchange contracts | $110,928 | | currency exchange contracts | $939,004 |
| |
| Value | | | | | |
| Foreign Currency Risk | Receivable for forward foreign | | | Payable for forward foreign | |
| | currency exchange contracts | $159,207 | | currency exchange contracts | $185,939 |
| |
| Large Company Value | | | | |
| Equity Price Risk | Receivable for variation | | | Payable for variation | |
| | margin on futures contracts | — | | margin on futures contracts | $68,250 |
| |
| Effect of Derivative Instruments on the Statement of Operations for the Year Ended |
| March 31, 2010 | | | | | |
| |
| | | | | Change in Net Unrealized |
| | Net Realized Gain (Loss) | | Appreciation (Depreciation) |
| Fund/Type | Location on Statement | | | Location on Statement | |
| of Derivative | of Operations | Value | | of Operations | Value |
| |
| Equity Income | | | | | |
| Foreign Currency Risk | Net realized gain (loss) on | $(5,884,649) | | Change in net unrealized | $(1,372,326) |
| | foreign currency transactions | | | appreciation (depreciation) | |
| | | | | on translation of assets and | |
| | | | | liabilities in foreign currencies | |
| |
| Value | | | | | |
| Equity Price Risk | Net realized gain (loss) on | $ 2,017,808 | | Change in net unrealized | — |
| | futures contract transactions | | | appreciation (depreciation) | |
| | | | | on futures contracts | |
| Foreign Currency Risk | Net realized gain (loss) on | (2,505,834) | | Change in net unrealized | $(146,726) |
| | foreign currency transactions | | | appreciation (depreciation) | |
| | | | | on translation of assets and | |
| | | | | liabilities in foreign currencies | |
| | | $ (488,026) | | | $(146,726) |
47
| | | | |
| | | | Change in Net Unrealized |
| | Net Realized Gain (Loss) | Appreciation (Depreciation) |
| Fund/Type | Location on Statement | | Location on Statement | |
| of Derivative | of Operations | Value | of Operations | Value |
| |
| Large Company Value | | | |
| Equity Price Risk | Net realized gain (loss) on | $21,290,711 | Change in net unrealized | $(4,158,514) |
| | futures contract transactions | | appreciation (depreciation) | |
| | | | on futures contracts | |
8. Risk Factors
There are certain risks involved in investing in foreign securities. These risks include those resulting from future adverse political, social, and economic development, fluctuations in currency exchange rates, the possible imposition of exchange controls, and other foreign laws and restrictions.
9. Interfund Lending
The funds, along with certain other funds in the American Century Investments family of funds, may participate in an interfund lending program, pursuant to an Exemptive Order issued by the Securities and Exchange Commission (SEC). This program provides an alternative credit facility allowing the funds to borrow from or lend to other funds in the American Century Investments family of funds that permit such transactions. Interfund lending transactions are subject to each fund’s investment policies and borrowing and lending limits. The interfund loan rate earned/paid on interfund lending transactions is determined daily based on the average of certain current market rates. Interfund lending transactions normally extend only overnight, but can have a maximum duration of seven days. The program is subject to annual approval by the Board of Directors. During the year ended March 31, 2010, the funds did not utilize the program.
10. Federal Tax Information
The tax character of distributions paid during the years ended March 31, 2010 and March 31, 2009 were as follows
| | | | | | |
| | Equity Income | Value | Large Company Value |
| | 2010 | 2009 | 2010 | 2009 | 2010 | 2009 |
| Distributions Paid From | | | | | | |
| Ordinary income | $141,597,122 | $166,129,626 | $27,197,441 | $44,552,362 | $23,228,498 | $45,450,573 |
| Long-term capital gains | — | $392,452 | — | — | — | $22,632,362 |
The book-basis character of distributions made during the year from net investment income or net realized gains may differ from their ultimate characterization for federal income tax purposes. These differences reflect the differing character of certain income items and net realized gains and losses for financial statement and tax purposes, and may result in reclassification among certain capital accounts on the financial statements.
48
As of March 31, 2010, the federal tax cost of investments and the components of distributable earnings on a tax-basis were as follows:
| | | |
| | Equity Income | Value | Large Company Value |
| Federal tax cost of investments | $5,605,899,801 | $1,586,214,964 | $1,138,947,038 |
| Gross tax appreciation of investments | $590,093,201 | $ 144,511,303 | $212,149,374 |
| Gross tax depreciation of investments | (7,190,235) | (104,725,704) | (86,839,059) |
| Net tax appreciation (depreciation) of investments | $582,902,966 | $ 39,785,599 | $125,310,315 |
| Net tax appreciation (depreciation) on derivatives and | | | |
| translation of assets and liabilities in foreign currencies | $ 7,660 | $ (415) | — |
| Net tax appreciation (depreciation) | $582,910,626 | $39,785,184 | $125,310,315 |
| Undistributed ordinary income | $10,254,950 | $2,725,069 | — |
| Accumulated capital losses | $(997,492,082) | $(497,796,183) | $(478,206,635) |
| Capital loss deferrals | — | — | $(10,334,586) |
The difference between book-basis and tax-basis cost and unrealized appreciation (depreciation) is attributable primarily to the tax deferral of losses on wash sales and the realization for tax purposes of unrealized gains (losses) on certain forward foreign currency exchange contracts and on certain futures contracts.
The accumulated capital losses listed above represent net capital loss carryovers that may be used to offset future realized capital gains for federal income tax purposes. Future capital loss carryover utilization in any given year may be subject to Internal Revenue Code limitations. The capital loss carryovers expire as follows:
| | |
| | 2017 | 2018 |
| Equity Income | $(417,263,106) | $(580,228,976) |
| Value | $(292,022,390) | $(205,773,793) |
| Large Company Value | $(176,129,535) | $(302,077,100) |
The capital loss deferrals listed above represent net capital losses incurred in the five-month period ended March 31, 2010. The funds have elected to treat such losses as having been incurred in the following fiscal year for federal income tax purposes.
11. Recently Issued Accounting Standards
In March 2008, the Financial Accounting Standards Board (FASB) issued Accounting Standards Codification (ASC) Section 815-10 (formerly Statement of Financial Accounting Standards No. 161, “Disclosures about Derivative Instruments and Hedging Activities —an amendment of FASB Statement No. 133”). ASC Section 815-10 is effective for interim periods beginning after November 15, 2008 and has been adopted by the funds. ASC Section 815-10 amends and expands disclosures about derivative instruments and hedging activities. ASC Section 815-10 requires qualitative disclosures about the objectives and strategies of derivative instruments, quantitative disclosures about the fair value amounts of and gains and losses on derivative instruments, and disclosures of credit-risk-related contingent features in hedging activities.
49
12. Corporate Event
As part of a long-standing estate and business succession plan established by ACC Co-Chairman James E. Stowers, Jr., the founder of American Century Investments, ACC Co-Chairman Richard W. Brown succeeded Mr. Stowers as trustee of a trust that holds a greater-than-25% voting interest in ACC, the parent corporation of each fund’s advisor. Under the 1940 Act, this is presumed to represent control of ACC even though it is less than a majority interest. The change of trustee may technically be considered a “change of control” of ACC and therefore also a change of control of each fund’s advisor even though there has been no change to their management and none is anticipated. The “change of control” resulted in the assignment of each fund’s investment advisory agreement. Under the 1940 Act, an assignment automatically terminated such agreement, making the approval of a new agreement ne cessary.
On February 18, 2010, the Board of Directors approved interim investment advisory agreements under which each fund will be managed until new agreements are approved by fund shareholders. On March 29, 2010, the Board of Directors approved new investment advisory agreements. The interim agreements and the new agreements are substantially identical to the terminated agreements (with the exception of different effective and termination dates) and will not result in changes in the management of American Century Investments, the funds, their investment objectives, fees or services provided. The new agreements have been submitted to shareholders for approval at a Special Meeting of Shareholders to be held on June 16, 2010.
13. Other Tax Information (Unaudited)
The following information is provided pursuant to provisions of the Internal Revenue Code.
The funds hereby designate up to the maximum amount allowable as qualified dividend income for the fiscal year ended March 31, 2010.
For corporate taxpayers, the funds hereby designate the following ordinary income distributions, or up to the maximum amount allowable, as qualified for the corporate dividends received deduction for the fiscal year ended March 31, 2010.
| | |
| Equity Income | Value | Large Company Value |
| $137,135,808 | $27,197,440 | $23,228,498 |
50
| | | | | | |
| Equity Income | | | | | |
| |
| Investor Class | | | | | |
| For a Share Outstanding Throughout the Years Ended March 31 | | | |
| | | 2010 | 2009 | 2008 | 2007 | 2006 |
| Per-Share Data | | | | | |
| Net Asset Value, Beginning of Period | $5.42 | $7.30 | $8.65 | $8.11 | $8.05 |
| Income From Investment Operations | | | | | |
| Net Investment Income (Loss)(1) | 0.18 | 0.22 | 0.23 | 0.21 | 0.20 |
| Net Realized and Unrealized Gain (Loss) | 1.33 | (1.87) | (0.62) | 1.05 | 0.36 |
| Total From Investment Operations | 1.51 | (1.65) | (0.39) | 1.26 | 0.56 |
| Distributions | | | | | |
| From Net Investment Income | (0.17) | (0.23) | (0.23) | (0.17) | (0.18) |
| From Net Realized Gains | — | — | (0.73) | (0.55) | (0.32) |
| Total Distributions | (0.17) | (0.23) | (0.96) | (0.72) | (0.50) |
| Net Asset Value, End of Period | $6.76 | $5.42 | $7.30 | $8.65 | $8.11 |
| |
| Total Return(2) | 28.04% | (22.98)% | (5.17)% | 15.79% | 7.21% |
| | | | | | |
| Ratios/Supplemental Data | | | | | |
| Ratio of Operating Expenses | | | | | |
| to Average Net Assets | 0.97% | 0.98% | 0.97% | 0.97% | 0.98% |
| Ratio of Net Investment Income (Loss) | | | | | |
| to Average Net Assets | 2.93% | 3.36% | 2.68% | 2.43% | 2.53% |
| Portfolio Turnover Rate | 105% | 296% | 165% | 160% | 150% |
| Net Assets, End of Period (in thousands) | $3,829,492 | $2,913,351 | $3,719,757 | $4,790,510 | $3,715,366 |
| (1) | Computed using average shares outstanding throughout the period. | | | | |
| (2) | Total return assumes reinvestment of net investment income and capital gains distributions, if any. Total returns for periods less than one year |
| | are not annualized. Total returns are calculated based on the net asset value of the last business day. The total return of the classes may not |
| | precisely reflect the class expense differences because of the impact of calculating the net asset values to two decimal places. If net asset |
| | values were calculated to three decimal places, the total return differences would more closely reflect the class expense differences. The |
| | calculation of net asset values to two decimal places is made in accordance with SEC guidelines and does not result in any gain or loss of value |
| | between one class and another. | | | | | |
See Notes to Financial Statements.
51
| | | | | | |
| Equity Income | | | | | |
| |
| Institutional Class | | | | | |
| For a Share Outstanding Throughout the Years Ended March 31 | | | |
| | | 2010 | 2009 | 2008 | 2007 | 2006 |
| Per-Share Data | | | | | |
| Net Asset Value, Beginning of Period | $5.42 | $7.31 | $8.65 | $8.11 | $8.06 |
| Income From Investment Operations | | | | | |
| Net Investment Income (Loss)(1) | 0.19 | 0.23 | 0.25 | 0.23 | 0.22 |
| Net Realized and Unrealized Gain (Loss) | 1.34 | (1.88) | (0.61) | 1.05 | 0.35 |
| Total From Investment Operations | 1.53 | (1.65) | (0.36) | 1.28 | 0.57 |
| Distributions | | | | | |
| From Net Investment Income | (0.18) | (0.24) | (0.25) | (0.19) | (0.20) |
| From Net Realized Gains | — | — | (0.73) | (0.55) | (0.32) |
| Total Distributions | (0.18) | (0.24) | (0.98) | (0.74) | (0.52) |
| Net Asset Value, End of Period | $6.77 | $5.42 | $7.31 | $8.65 | $8.11 |
| |
| Total Return(2) | 28.30% | (22.94)% | (4.85)% | 16.01% | 7.29% |
| | | | | |
| Ratios/Supplemental Data | | | | | |
| Ratio of Operating Expenses | | | | | |
| to Average Net Assets | 0.77% | 0.78% | 0.77% | 0.77% | 0.78% |
| Ratio of Net Investment Income (Loss) | | | | | |
| to Average Net Assets | 3.13% | 3.56% | 2.88% | 2.63% | 2.73% |
| Portfolio Turnover Rate | 105% | 296% | 165% | 160% | 150% |
| Net Assets, End of Period (in thousands) | $792,024 | $502,435 | $496,033 | $551,202 | $382,909 |
| (1) | Computed using average shares outstanding throughout the period. | | | | |
| (2) | Total return assumes reinvestment of net investment income and capital gains distributions, if any. Total returns for periods less than one year |
| | are not annualized. Total returns are calculated based on the net asset value of the last business day. The total return of the classes may not |
| | precisely reflect the class expense differences because of the impact of calculating the net asset values to two decimal places. If net asset |
| | values were calculated to three decimal places, the total return differences would more closely reflect the class expense differences. The |
| | calculation of net asset values to two decimal places is made in accordance with SEC guidelines and does not result in any gain or loss of value |
| | between one class and another. | | | | | |
See Notes to Financial Statements.
52
| | | | | | |
| Equity Income | | | | | |
| |
| A Class(1) | | | | | |
| For a Share Outstanding Throughout the Years Ended March 31 | | | |
| | | 2010 | 2009 | 2008 | 2007 | 2006 |
| Per-Share Data | | | | | |
| Net Asset Value, Beginning of Period | $5.42 | $7.30 | $8.65 | $8.11 | $8.05 |
| Income From Investment Operations | | | | | |
| Net Investment Income (Loss)(2) | 0.17 | 0.20 | 0.20 | 0.19 | 0.18 |
| Net Realized and Unrealized Gain (Loss) | 1.32 | (1.86) | (0.61) | 1.05 | 0.36 |
| Total From Investment Operations | 1.49 | (1.66) | (0.41) | 1.24 | 0.54 |
| Distributions | | | | | |
| From Net Investment Income | (0.15) | (0.22) | (0.21) | (0.15) | (0.16) |
| From Net Realized Gains | — | — | (0.73) | (0.55) | (0.32) |
| Total Distributions | (0.15) | (0.22) | (0.94) | (0.70) | (0.48) |
| Net Asset Value, End of Period | $6.76 | $5.42 | $7.30 | $8.65 | $8.11 |
| |
| Total Return(3) | 27.71% | (23.18)% | (5.40)% | 15.51% | 6.94% |
| | | | | | |
| Ratios/Supplemental Data | | | | | |
| Ratio of Operating Expenses | | | | | |
| to Average Net Assets | 1.22% | 1.23% | 1.22% | 1.22% | 1.23% |
| Ratio of Net Investment Income (Loss) | | | | | |
| to Average Net Assets | 2.68% | 3.11% | 2.43% | 2.18% | 2.28% |
| Portfolio Turnover Rate | 105% | 296% | 165% | 160% | 150% |
| Net Assets, End of Period (in thousands) | $1,385,436 | $794,323 | $933,600 | $1,280,888 | $902,749 |
| (1) | Prior to September 4, 2007, the A Class was referred to as the Advisor Class. | | | |
| (2) | Computed using average shares outstanding throughout the period. | | | | |
| (3) | Total return assumes reinvestment of net investment income and capital gains distributions, if any, and does not reflect applicable sales charges. |
| | Total returns for periods less than one year are not annualized. Total returns are calculated based on the net asset value of the last business day. |
| | The total return of the classes may not precisely reflect the class expense differences because of the impact of calculating the net asset values |
| | to two decimal places. If net asset values were calculated to three decimal places, the total return differences would more closely reflect the |
| | class expense differences. The calculation of net asset values to two decimal places is made in accordance with SEC guidelines and does not |
| | result in any gain or loss of value between one class and another. | | | | |
See Notes to Financial Statements.
53
| | | | |
| Equity Income | | | |
| |
| B Class | | | |
| For a Share Outstanding Throughout the Years Ended March 31 (except as noted) | | |
| | | 2010 | 2009 | 2008(1) |
| Per-Share Data | | | |
| Net Asset Value, Beginning of Period | $5.42 | $7.30 | $8.99 |
| Income From Investment Operations | | | |
| Net Investment Income (Loss)(2) | 0.12 | 0.15 | 0.08 |
| Net Realized and Unrealized Gain (Loss) | 1.33 | (1.86) | (0.95) |
| Total From Investment Operations | 1.45 | (1.71) | (0.87) |
| Distributions | | | |
| From Net Investment Income | (0.10) | (0.17) | (0.09) |
| From Net Realized Gains | — | — | (0.73) |
| Total Distributions | (0.10) | (0.17) | (0.82) |
| Net Asset Value, End of Period | $6.77 | $5.42 | $7.30 |
| |
| Total Return(3) | 26.92% | (23.75)% | (10.28)% |
| | | | |
| Ratios/Supplemental Data | | | |
| Ratio of Operating Expenses to Average Net Assets | 1.97% | 1.98% | 1.97%(4) |
| Ratio of Net Investment Income (Loss) to Average Net Assets | 1.93% | 2.36 | 2.11%(4) |
| Portfolio Turnover Rate | 105% | 296% | 165%(5) |
| Net Assets, End of Period (in thousands) | $7,383 | $2,392 | $235 |
| (1) | September 28, 2007 (commencement of sale) through March 31, 2008. | | | |
| (2) | Computed using average shares outstanding throughout the period. | | | |
| (3) | Total return assumes reinvestment of net investment income and capital gains distributions, if any, and does not reflect applicable sales charges. |
| | Total returns for periods less than one year are not annualized. Total returns are calculated based on the net asset value of the last business day. |
| | The total return of the classes may not precisely reflect the class expense differences because of the impact of calculating the net asset values |
| | to two decimal places. If net asset values were calculated to three decimal places, the total return differences would more closely reflect the |
| | class expense differences. The calculation of net asset values to two decimal places is made in accordance with SEC guidelines and does not |
| | result in any gain or loss of value between one class and another. | | | |
| (4) | Annualized. | | | |
| (5) | Portfolio turnover is calculated at the fund level. Percentage indicated was calculated for the year ended March 31, 2008. | |
See Notes to Financial Statements.
54
| | | | | | |
| Equity Income | | | | | |
| |
| C Class | | | | | |
| For a Share Outstanding Throughout the Years Ended March 31 | | | |
| | | 2010 | 2009 | 2008 | 2007 | 2006 |
| Per-Share Data | | | | | |
| Net Asset Value, Beginning of Period | $5.42 | $7.30 | $8.65 | $8.11 | $8.06 |
| Income From Investment Operations | | | | | |
| Net Investment Income (Loss)(1) | 0.12 | 0.15 | 0.14 | 0.12 | 0.13 |
| Net Realized and Unrealized Gain (Loss) | 1.33 | (1.86) | (0.61) | 1.06 | 0.34 |
| Total From Investment Operations | 1.45 | (1.71) | (0.47) | 1.18 | 0.47 |
| Distributions | | | | | |
| From Net Investment Income | (0.10) | (0.17) | (0.15) | (0.09) | (0.10) |
| From Net Realized Gains | — | — | (0.73) | (0.55) | (0.32) |
| Total Distributions | (0.10) | (0.17) | (0.88) | (0.64) | (0.42) |
| Net Asset Value, End of Period | $6.77 | $5.42 | $7.30 | $8.65 | $8.11 |
| |
| Total Return(2) | 26.74% | (23.75)% | (6.10)% | 14.65% | 6.02% |
| | | | | | |
| Ratios/Supplemental Data | | | | | |
| Ratio of Operating Expenses | | | | | |
| to Average Net Assets | 1.97% | 1.98% | 1.97% | 1.97% | 1.98% |
| Ratio of Net Investment Income (Loss) | | | | | |
| to Average Net Assets | 1.93% | 2.36% | 1.68% | 1.43% | 1.53% |
| Portfolio Turnover Rate | 105% | 296% | 165% | 160% | 150% |
| Net Assets, End of Period (in thousands) | $193,776 | $96,930 | $116,985 | $127,266 | $98,481 |
| (1) | Computed using average shares outstanding throughout the period. | | | | |
| (2) | Total return assumes reinvestment of net investment income and capital gains distributions, if any, and does not reflect applicable sales charges. |
| | Total returns for periods less than one year are not annualized. Total returns are calculated based on the net asset value of the last business day. |
| | The total return of the classes may not precisely reflect the class expense differences because of the impact of calculating the net asset values |
| | to two decimal places. If net asset values were calculated to three decimal places, the total return differences would more closely reflect the |
| | class expense differences. The calculation of net asset values to two decimal places is made in accordance with SEC guidelines and does not |
| | result in any gain or loss of value between one class and another. | | | | |
See Notes to Financial Statements.
55
| | | | | | |
| Equity Income | | | | | |
| |
| R Class | | | | | |
| For a Share Outstanding Throughout the Years Ended March 31 | | | |
| | | 2010 | 2009 | 2008 | 2007 | 2006 |
| Per-Share Data | | | | | |
| Net Asset Value, Beginning of Period | $5.41 | $7.29 | $8.63 | $8.09 | $8.04 |
| Income From Investment Operations | | | | | |
| Net Investment Income (Loss)(1) | 0.15 | 0.18 | 0.18 | 0.17 | 0.17 |
| Net Realized and Unrealized Gain (Loss) | 1.32 | (1.86) | (0.60) | 1.05 | 0.34 |
| Total From Investment Operations | 1.47 | (1.68) | (0.42) | 1.22 | 0.51 |
| Distributions | | | | | |
| From Net Investment Income | (0.13) | (0.20) | (0.19) | (0.13) | (0.14) |
| From Net Realized Gains | — | — | (0.73) | (0.55) | (0.32) |
| Total Distributions | (0.13) | (0.20) | (0.92) | (0.68) | (0.46) |
| Net Asset Value, End of Period | $6.75 | $5.41 | $7.29 | $8.63 | $8.09 |
| |
| Total Return(2) | 27.44% | (23.40)% | (5.53)% | 15.25% | 6.56% |
| | | | | | |
| Ratios/Supplemental Data | | | | | |
| Ratio of Operating Expenses | | | | | |
| to Average Net Assets | 1.47% | 1.48% | 1.47% | 1.47% | 1.48% |
| Ratio of Net Investment Income (Loss) | | | | | |
| to Average Net Assets | 2.43% | 2.86% | 2.18% | 1.93% | 2.03% |
| Portfolio Turnover Rate | 105% | 296% | 165% | 160% | 150% |
| Net Assets, End of Period (in thousands) | $92,239 | $35,588 | $42,720 | $44,767 | $24,283 |
| (1) | Computed using average shares outstanding throughout the period. | | | | |
| (2) | Total return assumes reinvestment of net investment income and capital gains distributions, if any. Total returns for periods less than one year |
| | are not annualized. Total returns are calculated based on the net asset value of the last business day. The total return of the classes may not |
| | precisely reflect the class expense differences because of the impact of calculating the net asset values to two decimal places. If net asset |
| | values were calculated to three decimal places, the total return differences would more closely reflect the class expense differences. The |
| | calculation of net asset values to two decimal places is made in accordance with SEC guidelines and does not result in any gain or loss of value |
| | between one class and another. | | | | | |
See Notes to Financial Statements.
56
| | | | | | |
| Value | | | | | |
| |
| Investor Class | | | | | |
| For a Share Outstanding Throughout the Years Ended March 31 | | | |
| | | 2010 | 2009 | 2008 | 2007 | 2006 |
| Per-Share Data | | | | | |
| Net Asset Value, Beginning of Period | $3.80 | $5.78 | $7.61 | $7.18 | $7.31 |
| Income From Investment Operations | | | | | |
| Net Investment Income (Loss)(1) | 0.09 | 0.13 | 0.12 | 0.12 | 0.12 |
| Net Realized and Unrealized Gain (Loss) | 1.60 | (1.98) | (0.92) | 0.93 | 0.57 |
| Total From Investment Operations | 1.69 | (1.85) | (0.80) | 1.05 | 0.69 |
| Distributions | | | | | |
| From Net Investment Income | (0.09) | (0.13) | (0.12) | (0.11) | (0.10) |
| From Net Realized Gains | — | — | (0.91) | (0.51) | (0.72) |
| Total Distributions | (0.09) | (0.13) | (1.03) | (0.62) | (0.82) |
| Net Asset Value, End of Period | $5.40 | $3.80 | $5.78 | $7.61 | $7.18 |
| |
| Total Return(2) | 44.84% | (32.34)% | (11.56)% | 14.90% | 9.89% |
| | | | | | |
| Ratios/Supplemental Data | | | | | |
| Ratio of Operating Expenses | | | | | |
| to Average Net Assets | 1.00% | 1.00% | 1.00% | 0.99% | 0.99% |
| Ratio of Net Investment Income (Loss) | | | | | |
| to Average Net Assets | 1.97% | 2.63% | 1.65% | 1.58% | 1.71% |
| Portfolio Turnover Rate | 62% | 91% | 152% | 140% | 134% |
| Net Assets, End of Period (in thousands) | $1,274,063 | $975,772 | $1,707,366 | $2,495,067 | $2,296,153 |
| (1) | Computed using average shares outstanding throughout the period. | | | | |
| (2) | Total return assumes reinvestment of net investment income and capital gains distributions, if any. Total returns for periods less than one year |
| | are not annualized. Total returns are calculated based on the net asset value of the last business day. The total return of the classes may not |
| | precisely reflect the class expense differences because of the impact of calculating the net asset values to two decimal places. If net asset |
| | values were calculated to three decimal places, the total return differences would more closely reflect the class expense differences. The |
| | calculation of net asset values to two decimal places is made in accordance with SEC guidelines and does not result in any gain or loss of value |
| | between one class and another. | | | | | |
See Notes to Financial Statements.
57
| | | | | | |
| Value | | | | | |
| |
| Institutional Class | | | | | |
| For a Share Outstanding Throughout the Years Ended March 31 | | | |
| | | 2010 | 2009 | 2008 | 2007 | 2006 |
| Per-Share Data | | | | | |
| Net Asset Value, Beginning of Period | $3.81 | $5.79 | $7.62 | $7.19 | $7.32 |
| Income From Investment Operations | | | | | |
| Net Investment Income (Loss)(1) | 0.10 | 0.14 | 0.13 | 0.13 | 0.14 |
| Net Realized and Unrealized Gain (Loss) | 1.60 | (1.98) | (0.91) | 0.94 | 0.57 |
| Total From Investment Operations | 1.70 | (1.84) | (0.78) | 1.07 | 0.71 |
| Distributions | | | | | |
| From Net Investment Income | (0.10) | (0.14) | (0.14) | (0.13) | (0.12) |
| From Net Realized Gains | — | — | (0.91) | (0.51) | (0.72) |
| Total Distributions | (0.10) | (0.14) | (1.05) | (0.64) | (0.84) |
| Net Asset Value, End of Period | $5.41 | $3.81 | $5.79 | $7.62 | $7.19 |
| |
| Total Return(2) | 45.01% | (32.14)% | (11.36)% | 15.11% | 10.10% |
| | | | | | |
| Ratios/Supplemental Data | | | | | |
| Ratio of Operating Expenses | | | | | |
| to Average Net Assets | 0.80% | 0.80% | 0.80% | 0.79% | 0.79% |
| Ratio of Net Investment Income (Loss) | | | | | |
| to Average Net Assets | 2.17% | 2.83% | 1.85% | 1.78% | 1.91% |
| Portfolio Turnover Rate | 62% | 91% | 152% | 140% | 134% |
| Net Assets, End of Period (in thousands) | $214,112 | $123,484 | $307,769 | $289,536 | $254,778 |
| (1) | Computed using average shares outstanding throughout the period. | | | | |
| (2) | Total return assumes reinvestment of net investment income and capital gains distributions, if any. Total returns for periods less than one year |
| | are not annualized. Total returns are calculated based on the net asset value of the last business day. The total return of the classes may not |
| | precisely reflect the class expense differences because of the impact of calculating the net asset values to two decimal places. If net asset |
| | values were calculated to three decimal places, the total return differences would more closely reflect the class expense differences. The |
| | calculation of net asset values to two decimal places is made in accordance with SEC guidelines and does not result in any gain or loss of value |
| | between one class and another. | | | | | |
See Notes to Financial Statements.
58
| | | | | | |
| Value | | | | | |
| |
| A Class(1) | | | | | |
| For a Share Outstanding Throughout the Years Ended March 31 | | | |
| | | 2010 | 2009 | 2008 | 2007 | 2006 |
| Per-Share Data | | | | | |
| Net Asset Value, Beginning of Period | $3.80 | $5.78 | $7.61 | $7.18 | $7.31 |
| Income From Investment Operations | | | | | |
| Net Investment Income (Loss)(2) | 0.08 | 0.12 | 0.10 | 0.10 | 0.10 |
| Net Realized and Unrealized Gain (Loss) | 1.60 | (1.98) | (0.92) | 0.93 | 0.57 |
| Total From Investment Operations | 1.68 | (1.86) | (0.82) | 1.03 | 0.67 |
| Distributions | | | | | |
| From Net Investment Income | (0.08) | (0.12) | (0.10) | (0.09) | (0.08) |
| From Net Realized Gains | — | — | (0.91) | (0.51) | (0.72) |
| Total Distributions | (0.08) | (0.12) | (1.01) | (0.60) | (0.80) |
| Net Asset Value, End of Period | $5.40 | $3.80 | $5.78 | $7.61 | $7.18 |
| |
| Total Return(3) | 44.47% | (32.51)% | (11.76)% | 14.62% | 9.61% |
| | | | | | |
| Ratios/Supplemental Data | | | | | |
| Ratio of Operating Expenses | | | | | |
| to Average Net Assets | 1.25% | 1.25% | 1.25% | 1.24% | 1.24% |
| Ratio of Net Investment Income (Loss) | | | | | |
| to Average Net Assets | 1.72% | 2.38% | 1.40% | 1.33% | 1.46% |
| Portfolio Turnover Rate | 62% | 91% | 152% | 140% | 134% |
| Net Assets, End of Period (in thousands) | $119,363 | $83,254 | $191,739 | $249,265 | $214,835 |
| (1) | Prior to September 4, 2007, the A Class was referred to as the Advisor Class. | | | |
| (2) | Computed using average shares outstanding throughout the period. | | | | |
| (3) | Total return assumes reinvestment of net investment income and capital gains distributions, if any, and does not reflect applicable sales charges. |
| | Total returns for periods less than one year are not annualized. Total returns are calculated based on the net asset value of the last business day. |
| | The total return of the classes may not precisely reflect the class expense differences because of the impact of calculating the net asset values |
| | to two decimal places. If net asset values were calculated to three decimal places, the total return differences would more closely reflect the |
| | class expense differences. The calculation of net asset values to two decimal places is made in accordance with SEC guidelines and does not |
| | result in any gain or loss of value between one class and another. | | | | |
See Notes to Financial Statements.
59
| | | | | | |
| Value | | | | | |
| |
| B Class | | | | | |
| For a Share Outstanding Throughout the Years Ended March 31 | | | |
| | | 2010 | 2009 | 2008 | 2007 | 2006 |
| Per-Share Data | | | | | |
| Net Asset Value, Beginning of Period | $3.80 | $5.78 | $7.61 | $7.18 | $7.31 |
| Income From Investment Operations | | | | | |
| Net Investment Income (Loss)(1) | 0.05 | 0.08 | 0.05 | 0.04 | 0.05 |
| Net Realized and Unrealized Gain (Loss) | 1.59 | (1.97) | (0.92) | 0.94 | 0.57 |
| Total From Investment Operations | 1.64 | (1.89) | (0.87) | 0.98 | 0.62 |
| Distributions | | | | | |
| From Net Investment Income | (0.05) | (0.09) | (0.05) | (0.04) | (0.03) |
| From Net Realized Gains | — | — | (0.91) | (0.51) | (0.72) |
| Total Distributions | (0.05) | (0.09) | (0.96) | (0.55) | (0.75) |
| Net Asset Value, End of Period | $5.39 | $3.80 | $5.78 | $7.61 | $7.18 |
| |
| Total Return(2) | 43.21% | (33.01)% | (12.41)% | 13.78% | 8.81% |
| | | | | | |
| Ratios/Supplemental Data | | | | | |
| Ratio of Operating Expenses | | | | | |
| to Average Net Assets | 2.00% | 2.00% | 2.00% | 1.99% | 1.99% |
| Ratio of Net Investment Income (Loss) | | | | | |
| to Average Net Assets | 0.97% | 1.63% | 0.65% | 0.58% | 0.71% |
| Portfolio Turnover Rate | 62% | 91% | 152% | 140% | 134% |
| Net Assets, End of Period (in thousands) | $3,182 | $2,651 | $5,601 | $7,740 | $7,129 |
| (1) | Computed using average shares outstanding throughout the period. | | | | |
| (2) | Total return assumes reinvestment of net investment income and capital gains distributions, if any, and does not reflect applicable sales charges. |
| | Total returns for periods less than one year are not annualized. Total returns are calculated based on the net asset value of the last business day. |
| | The total return of the classes may not precisely reflect the class expense differences because of the impact of calculating the net asset values |
| | to two decimal places. If net asset values were calculated to three decimal places, the total return differences would more closely reflect the |
| | class expense differences. The calculation of net asset values to two decimal places is made in accordance with SEC guidelines and does not |
| | result in any gain or loss of value between one class and another. | | | | |
See Notes to Financial Statements.
60
| | | | | | |
| Value | | | | | |
| |
| C Class | | | | | |
| For a Share Outstanding Throughout the Years Ended March 31 | | | |
| | | 2010 | 2009 | 2008 | 2007 | 2006 |
| Per-Share Data | | | | | |
| Net Asset Value, Beginning of Period | $3.77 | $5.74 | $7.56 | $7.14 | $7.27 |
| Income From Investment Operations | | | | | |
| Net Investment Income (Loss)(1) | 0.05 | 0.08 | 0.05 | 0.04 | 0.05 |
| Net Realized and Unrealized Gain (Loss) | 1.58 | (1.96) | (0.91) | 0.93 | 0.57 |
| Total From Investment Operations | 1.63 | (1.88) | (0.86) | 0.97 | 0.62 |
| Distributions | | | | | |
| From Net Investment Income | (0.05) | (0.09) | (0.05) | (0.04) | (0.03) |
| From Net Realized Gains | — | — | (0.91) | (0.51) | (0.72) |
| Total Distributions | (0.05) | (0.09) | (0.96) | (0.55) | (0.75) |
| Net Asset Value, End of Period | $5.35 | $3.77 | $5.74 | $7.56 | $7.14 |
| |
| Total Return(2) | 43.29% | (33.06)% | (12.36)% | 13.71% | 8.87% |
| | | | | | |
| Ratios/Supplemental Data | | | | | |
| Ratio of Operating Expenses | | | | | |
| to Average Net Assets | 2.00% | 2.00% | 2.00% | 1.99% | 1.99% |
| Ratio of Net Investment Income (Loss) | | | | | |
| to Average Net Assets | 0.97% | 1.63% | 0.65% | 0.58% | 0.71% |
| Portfolio Turnover Rate | 62% | 91% | 152% | 140% | 134% |
| Net Assets, End of Period (in thousands) | $7,294 | $5,414 | $11,532 | $22,274 | $19,259 |
| (1) | Computed using average shares outstanding throughout the period. | | | | |
| (2) | Total return assumes reinvestment of net investment income and capital gains distributions, if any, and does not reflect applicable sales charges. |
| | Total returns for periods less than one year are not annualized. Total returns are calculated based on the net asset value of the last business day. |
| | The total return of the classes may not precisely reflect the class expense differences because of the impact of calculating the net asset values |
| | to two decimal places. If net asset values were calculated to three decimal places, the total return differences would more closely reflect the |
| | class expense differences. The calculation of net asset values to two decimal places is made in accordance with SEC guidelines and does not |
| | result in any gain or loss of value between one class and another. | | | | |
See Notes to Financial Statements.
61
| | | | | | |
| Value | | | | | |
| |
| R Class | | | | | |
| For a Share Outstanding Throughout the Years Ended March 31 (except as noted) | | |
| | | 2010 | 2009 | 2008 | 2007 | 2006(1) |
| Per-Share Data | | | | | |
| Net Asset Value, Beginning of Period | $3.80 | $5.78 | $7.61 | $7.18 | $7.60 |
| Income From Investment Operations | | | | | |
| Net Investment Income (Loss)(2) | 0.07 | 0.11 | 0.09 | 0.08 | 0.06 |
| Net Realized and Unrealized Gain (Loss) | 1.60 | (1.98) | (0.92) | 0.94 | 0.29 |
| Total From Investment Operations | 1.67 | (1.87) | (0.83) | 1.02 | 0.35 |
| Distributions | | | | | |
| From Net Investment Income | (0.07) | (0.11) | (0.09) | (0.08) | (0.05) |
| From Net Realized Gains | — | — | (0.91) | (0.51) | (0.72) |
| Total Distributions | (0.07) | (0.11) | (1.00) | (0.59) | (0.77) |
| Net Asset Value, End of Period | $5.40 | $3.80 | $5.78 | $7.61 | $7.18 |
| |
| Total Return(3) | 44.10% | (32.67)% | (11.98)% | 14.34% | 4.99% |
| | | | | | |
| Ratios/Supplemental Data | | | | | |
| Ratio of Operating Expenses | | | | | |
| to Average Net Assets | 1.50% | 1.50% | 1.50% | 1.49% | 1.49%(4) |
| Ratio of Net Investment Income (Loss) | | | | | |
| to Average Net Assets | 1.47% | 2.13% | 1.15% | 1.08% | 1.17%(4) |
| Portfolio Turnover Rate | 62% | 91% | 152% | 140% | 134%(5) |
| Net Assets, End of Period (in thousands) | $4,527 | $2,255 | $1,625 | $331 | $43 |
| (1) | July 29, 2005 (commencement of sale) through March 31, 2006. | | | | |
| (2) | Computed using average shares outstanding throughout the period. | | | | |
| (3) | Total return assumes reinvestment of net investment income and capital gains distributions, if any. Total returns for periods less than one year |
| | are not annualized. Total returns are calculated based on the net asset value of the last business day. The total return of the classes may not |
| | precisely reflect the class expense differences because of the impact of calculating the net asset values to two decimal places. If net asset |
| | values were calculated to three decimal places, the total return differences would more closely reflect the class expense differences. The |
| | calculation of net asset values to two decimal places is made in accordance with SEC guidelines and does not result in any gain or loss of value |
| | between one class and another. | | | | | |
| (4) | Annualized. | | | | | |
| (5) | Portfolio turnover is calculated at the fund level. Percentage indicated was calculated for the year ended March 31, 2006. | |
See Notes to Financial Statements.
62
| | | | | | |
| Large Company Value | | | | | |
| |
| Investor Class | | | | | |
| For a Share Outstanding Throughout the Years Ended March 31 | | | |
| | | 2010 | 2009 | 2008 | 2007 | 2006 |
| Per-Share Data | | | | | |
| Net Asset Value, Beginning of Period | $3.64 | $6.48 | $7.55 | $6.72 | $6.39 |
| Income From Investment Operations | | | | | |
| Net Investment Income (Loss)(1) | 0.09 | 0.14 | 0.14 | 0.13 | 0.12 |
| Net Realized and Unrealized Gain (Loss) | 1.60 | (2.76) | (0.85) | 0.89 | 0.47 |
| Total From Investment Operations | 1.69 | (2.62) | (0.71) | 1.02 | 0.59 |
| Distributions | | | | | |
| From Net Investment Income | (0.09) | (0.14) | (0.15) | (0.13) | (0.11) |
| From Net Realized Gains | — | (0.08) | (0.21) | (0.06) | (0.15) |
| Total Distributions | (0.09) | (0.22) | (0.36) | (0.19) | (0.26) |
| Net Asset Value, End of Period | $5.24 | $3.64 | $6.48 | $7.55 | $6.72 |
| |
| Total Return(2) | 46.68% | (41.07)% | (9.88)% | 15.37% | 9.44% |
| | | | | | |
| Ratios/Supplemental Data | | | | | |
| Ratio of Operating Expenses | | | | | |
| to Average Net Assets | 0.85% | 0.83% | 0.83% | 0.83% | 0.84% |
| Ratio of Net Investment Income (Loss) | | | | | |
| to Average Net Assets | 1.87% | 2.57% | 1.93% | 1.86% | 1.75% |
| Portfolio Turnover Rate | 25% | 22% | 18% | 12% | 16% |
| Net Assets, End of Period (in thousands) | $786,992 | $569,483 | $1,251,631 | $1,498,119 | $1,112,858 |
| (1) | Computed using average shares outstanding throughout the period. | | | | |
| (2) | Total return assumes reinvestment of net investment income and capital gains distributions, if any. Total returns for periods less than one year |
| | are not annualized. Total returns are calculated based on the net asset value of the last business day. The total return of the classes may not |
| | precisely reflect the class expense differences because of the impact of calculating the net asset values to two decimal places. If net asset |
| | values were calculated to three decimal places, the total return differences would more closely reflect the class expense differences. The |
| | calculation of net asset values to two decimal places is made in accordance with SEC guidelines and does not result in any gain or loss of value |
| | between one class and another. | | | | | |
See Notes to Financial Statements.
63
| | | | | | |
| Large Company Value | | | | | |
| |
| Institutional Class | | | | | |
| For a Share Outstanding Throughout the Years Ended March 31 | | | |
| | | 2010 | 2009 | 2008 | 2007 | 2006 |
| Per-Share Data | | | | | |
| Net Asset Value, Beginning of Period | $3.64 | $6.48 | $7.55 | $6.72 | $6.39 |
| Income From Investment Operations | | | | | |
| Net Investment Income (Loss)(1) | 0.10 | 0.15 | 0.16 | 0.15 | 0.13 |
| Net Realized and Unrealized Gain (Loss) | 1.60 | (2.76) | (0.86) | 0.88 | 0.47 |
| Total From Investment Operations | 1.70 | (2.61) | (0.70) | 1.03 | 0.60 |
| Distributions | | | | | |
| From Net Investment Income | (0.10) | (0.15) | (0.16) | (0.14) | (0.12) |
| From Net Realized Gains | — | (0.08) | (0.21) | (0.06) | (0.15) |
| Total Distributions | (0.10) | (0.23) | (0.37) | (0.20) | (0.27) |
| Net Asset Value, End of Period | $5.24 | $3.64 | $6.48 | $7.55 | $6.72 |
| |
| Total Return(2) | 46.97% | (40.95)% | (9.70)% | 15.60% | 9.65% |
| | | | | | |
| Ratios/Supplemental Data | | | | | |
| Ratio of Operating Expenses | | | | | |
| to Average Net Assets | 0.65% | 0.63% | 0.63% | 0.63% | 0.64% |
| Ratio of Net Investment Income (Loss) | | | | | |
| to Average Net Assets | 2.07% | 2.77% | 2.13% | 2.06% | 1.95% |
| Portfolio Turnover Rate | 25% | 22% | 18% | 12% | 16% |
| Net Assets, End of Period (in thousands) | $243,190 | $275,245 | $540,297 | $587,012 | $527,109 |
| (1) | Computed using average shares outstanding throughout the period. | | | | |
| (2) | Total return assumes reinvestment of net investment income and capital gains distributions, if any. Total returns for periods less than one year |
| | are not annualized. Total returns are calculated based on the net asset value of the last business day. The total return of the classes may not |
| | precisely reflect the class expense differences because of the impact of calculating the net asset values to two decimal places. If net asset |
| | values were calculated to three decimal places, the total return differences would more closely reflect the class expense differences. The |
| | calculation of net asset values to two decimal places is made in accordance with SEC guidelines and does not result in any gain or loss of value |
| | between one class and another. | | | | | |
See Notes to Financial Statements.
64
| | | | | | |
| Large Company Value | | | | | |
| |
| A Class(1) | | | | | |
| For a Share Outstanding Throughout the Years Ended March 31 | | | |
| | | 2010 | 2009 | 2008 | 2007 | 2006 |
| Per-Share Data | | | | | |
| Net Asset Value, Beginning of Period | $3.64 | $6.47 | $7.55 | $6.72 | $6.39 |
| Income From Investment Operations | | | | | |
| Net Investment Income (Loss)(2) | 0.08 | 0.12 | 0.12 | 0.12 | 0.10 |
| Net Realized and Unrealized Gain (Loss) | 1.60 | (2.74) | (0.86) | 0.88 | 0.47 |
| Total From Investment Operations | 1.68 | (2.62) | (0.74) | 1.00 | 0.57 |
| Distributions | | | | | |
| From Net Investment Income | (0.08) | (0.13) | (0.13) | (0.11) | (0.09) |
| From Net Realized Gains | — | (0.08) | (0.21) | (0.06) | (0.15) |
| Total Distributions | (0.08) | (0.21) | (0.34) | (0.17) | (0.24) |
| Net Asset Value, End of Period | $5.24 | $3.64 | $6.47 | $7.55 | $6.72 |
| |
| Total Return(3) | 46.31% | (41.12)% | (10.24)% | 15.08% | 9.17% |
| | | | | | |
| Ratios/Supplemental Data | | | | | |
| Ratio of Operating Expenses | | | | | |
| to Average Net Assets | 1.10% | 1.08% | 1.08% | 1.08% | 1.09% |
| Ratio of Net Investment Income (Loss) | | | | | |
| to Average Net Assets | 1.62% | 2.32% | 1.68% | 1.61% | 1.50% |
| Portfolio Turnover Rate | 25% | 22% | 18% | 12% | 16% |
| Net Assets, End of Period (in thousands) | $200,408 | $162,957 | $373,078 | $282,930 | $184,601 |
| (1) | Prior to December 3, 2007, the A Class was referred to as the Advisor Class. | | | |
| (2) | Computed using average shares outstanding throughout the period. | | | | |
| (3) | Total return assumes reinvestment of net investment income and capital gains distributions, if any, and does not reflect applicable sales charges. |
| | Total returns for periods less than one year are not annualized. Total returns are calculated based on the net asset value of the last business day. |
| | The total return of the classes may not precisely reflect the class expense differences because of the impact of calculating the net asset values |
| | to two decimal places. If net asset values were calculated to three decimal places, the total return differences would more closely reflect the |
| | class expense differences. The calculation of net asset values to two decimal places is made in accordance with SEC guidelines and does not |
| | result in any gain or loss of value between one class and another. | | | | |
See Notes to Financial Statements.
65
| | | | | | |
| Large Company Value | | | | | |
| |
| B Class | | | | | |
| For a Share Outstanding Throughout the Years Ended March 31 | | | |
| | | 2010 | 2009 | 2008 | 2007 | 2006 |
| Per-Share Data | | | | | |
| Net Asset Value, Beginning of Period | $3.65 | $6.49 | $7.57 | $6.74 | $6.41 |
| Income From Investment Operations | | | | | |
| Net Investment Income (Loss)(1) | 0.04 | 0.08 | 0.07 | 0.06 | 0.05 |
| Net Realized and Unrealized Gain (Loss) | 1.61 | (2.75) | (0.87) | 0.89 | 0.47 |
| Total From Investment Operations | 1.65 | (2.67) | (0.80) | 0.95 | 0.52 |
| Distributions | | | | | |
| From Net Investment Income | (0.04) | (0.09) | (0.07) | (0.06) | (0.04) |
| From Net Realized Gains | — | (0.08) | (0.21) | (0.06) | (0.15) |
| Total Distributions | (0.04) | (0.17) | (0.28) | (0.12) | (0.19) |
| Net Asset Value, End of Period | $5.26 | $3.65 | $6.49 | $7.57 | $6.74 |
| |
| Total Return(2) | 45.34% | (41.58)% | (10.88)% | 14.18% | 8.33% |
| | | | | | |
| Ratios/Supplemental Data | | | | | |
| Ratio of Operating Expenses | | | | | |
| to Average Net Assets | 1.85% | 1.83% | 1.83% | 1.83% | 1.84% |
| Ratio of Net Investment Income (Loss) | | | | | |
| to Average Net Assets | 0.87% | 1.57% | 0.93% | 0.86% | 0.75% |
| Portfolio Turnover Rate | 25% | 22% | 18% | 12% | 16% |
| Net Assets, End of Period (in thousands) | $5,662 | $5,285 | $12,965 | $17,374 | $15,954 |
| (1) | Computed using average shares outstanding throughout the period. | | | | |
| (2) | Total return assumes reinvestment of net investment income and capital gains distributions, if any, and does not reflect applicable sales charges. |
| | Total returns for periods less than one year are not annualized. Total returns are calculated based on the net asset value of the last business day. |
| | The total return of the classes may not precisely reflect the class expense differences because of the impact of calculating the net asset values |
| | to two decimal places. If net asset values were calculated to three decimal places, the total return differences would more closely reflect the |
| | class expense differences. The calculation of net asset values to two decimal places is made in accordance with SEC guidelines and does not |
| | result in any gain or loss of value between one class and another. | | | | |
See Notes to Financial Statements.
66
| | | | | | |
| Large Company Value | | | | | |
| |
| C Class | | | | | |
| For a Share Outstanding Throughout the Years Ended March 31 | | | |
| | | 2010 | 2009 | 2008 | 2007 | 2006 |
| Per-Share Data | | | | | |
| Net Asset Value, Beginning of Period | $3.64 | $6.47 | $7.55 | $6.72 | $6.39 |
| Income From Investment Operations | | | | | |
| Net Investment Income (Loss)(1) | 0.04 | 0.08 | 0.07 | 0.06 | 0.05 |
| Net Realized and Unrealized Gain (Loss) | 1.60 | (2.74) | (0.87) | 0.89 | 0.47 |
| Total From Investment Operations | 1.64 | (2.66) | (0.80) | 0.95 | 0.52 |
| Distributions | | | | | |
| From Net Investment Income | (0.04) | (0.09) | (0.07) | (0.06) | (0.04) |
| From Net Realized Gains | — | (0.08) | (0.21) | (0.06) | (0.15) |
| Total Distributions | (0.04) | (0.17) | (0.28) | (0.12) | (0.19) |
| Net Asset Value, End of Period | $5.24 | $3.64 | $6.47 | $7.55 | $6.72 |
| |
| Total Return(2) | 45.19% | (41.56)% | (10.91)% | 14.22% | 8.35% |
| | | | | | |
| Ratios/Supplemental Data | | | | | |
| Ratio of Operating Expenses | | | | | |
| to Average Net Assets | 1.85% | 1.83% | 1.83% | 1.83% | 1.84% |
| Ratio of Net Investment Income (Loss) | | | | | |
| to Average Net Assets | 0.87% | 1.57% | 0.93% | 0.86% | 0.75% |
| Portfolio Turnover Rate | 25% | 22% | 18% | 12% | 16% |
| Net Assets, End of Period (in thousands) | $17,211 | $17,246 | $51,775 | $71,792 | $61,682 |
| (1) | Computed using average shares outstanding throughout the period. | | | | |
| (2) | Total return assumes reinvestment of net investment income and capital gains distributions, if any, and does not reflect applicable sales charges |
| | Total returns for periods less than one year are not annualized. Total returns are calculated based on the net asset value of the last business day. |
| | The total return of the classes may not precisely reflect the class expense differences because of the impact of calculating the net asset values |
| | to two decimal places. If net asset values were calculated to three decimal places, the total return differences would more closely reflect the |
| | class expense differences. The calculation of net asset values to two decimal places is made in accordance with SEC guidelines and does not |
| | result in any gain or loss of value between one class and another. | | | | |
See Notes to Financial Statements.
67
| | | | | | |
| Large Company Value | | | | | |
| |
| R Class | | | | | |
| For a Share Outstanding Throughout the Years Ended March 31 | | | |
| | | 2010 | 2009 | 2008 | 2007 | 2006 |
| Per-Share Data | | | | | |
| Net Asset Value, Beginning of Period | $3.64 | $6.48 | $7.56 | $6.72 | $6.39 |
| Income From Investment Operations | | | | | |
| Net Investment Income (Loss)(1) | 0.06 | 0.11 | 0.11 | 0.10 | 0.09 |
| Net Realized and Unrealized Gain (Loss) | 1.61 | (2.76) | (0.87) | 0.89 | 0.47 |
| Total From Investment Operations | 1.67 | (2.65) | (0.76) | 0.99 | 0.56 |
| Distributions | | | | | |
| From Net Investment Income | (0.07) | (0.11) | (0.11) | (0.09) | (0.08) |
| From Net Realized Gains | — | (0.08) | (0.21) | (0.06) | (0.15) |
| Total Distributions | (0.07) | (0.19) | (0.32) | (0.15) | (0.23) |
| Net Asset Value, End of Period | $5.24 | $3.64 | $6.48 | $7.56 | $6.72 |
| |
| Total Return(2) | 45.93% | (41.36)% | (10.45)% | 14.95% | 8.90% |
| | | | | | |
| Ratios/Supplemental Data | | | | | |
| Ratio of Operating Expenses | | | | | |
| to Average Net Assets | 1.35% | 1.33% | 1.33% | 1.33% | 1.34% |
| Ratio of Net Investment Income (Loss) | | | | | |
| to Average Net Assets | 1.37% | 2.07% | 1.43% | 1.36% | 1.25% |
| Portfolio Turnover Rate | 25% | 22% | 18% | 12% | 16% |
| Net Assets, End of Period (in thousands) | $14,699 | $9,587 | $16,675 | $17,765 | $10,984 |
| (1) | Computed using average shares outstanding throughout the period. | | | | |
| (2) | Total return assumes reinvestment of net investment income and capital gains distributions, if any. Total returns for periods less than one year |
| | are not annualized. Total returns are calculated based on the net asset value of the last business day. The total return of the classes may not |
| | precisely reflect the class expense differences because of the impact of calculating the net asset values to two decimal places. If net asset |
| | values were calculated to three decimal places, the total return differences would more closely reflect the class expense differences. The |
| | calculation of net asset values to two decimal places is made in accordance with SEC guidelines and does not result in any gain or loss of value |
| | between one class and another. | | | | | |
See Notes to Financial Statements.
68
|
| Report of Independent Registered Public Accounting Firm |
The Board of Directors and Shareholders,
American Century Capital Portfolios, Inc.:
We have audited the accompanying statements of assets and liabilities, including the schedules of investments, of Equity Income Fund, Value Fund and Large Company Value Fund, three of the mutual funds constituting American Century Capital Portfolios, Inc. (the “Corporation”), as of March 31, 2010, and the related statements of operations for the year then ended, the statements of changes in net assets for each of the two years in the period then ended, and the financial highlights for each of the five years in the period then ended. These financial statements and financial highlights are the responsibility of the Corporation’s management. Our responsibility is to express an opinion on these financial statements and financial highlights based on our audits.
We conducted our audits in accordance with the standards of the Public Company Accounting Oversight Board (United States). Those standards require that we plan and perform the audit to obtain reasonable assurance about whether the financial statements and financial highlights are free of material misstatement. The Corporation is not required to have, nor were we engaged to perform, an audit of its internal control over financial reporting. Our audits included consideration of internal control over financial reporting as a basis for designing audit procedures that are appropriate in the circumstances, but not for the purpose of expressing an opinion on the effectiveness of the Corporation’s internal control over financial reporting. Accordingly, we express no such opinion. An audit also includes examining, on a test basis, evidence supporting the amounts and disclosures in the financial statements, assessing t he accounting principles used and significant estimates made by management, as well as evaluating the overall financial statement presentation. Our procedures included confirmation of securities owned as of March 31, 2010, by correspondence with the custodian and brokers; where replies were not received from brokers, we performed other auditing procedures. We believe that our audits provide a reasonable basis for our opinion.
In our opinion, the financial statements and financial highlights referred to above present fairly, in all material respects, the respective financial positions of Equity Income Fund, Value Fund and Large Company Value Fund, three of the mutual funds of American Century Capital Portfolios, Inc., as of March 31, 2010, the results of their operations for the year then ended, the changes in their net assets for each of the two years in the period then ended, and the financial highlights for each of the five years in the period then ended, in conformity with accounting principles generally accepted in the United States of America.
Deloitte & Touche LLP
Kansas City, Missouri
May 17, 2010
69
The Board of Directors
The individuals listed below serve as directors of the funds. Each director will continue to serve in this capacity until death, retirement, resignation or removal from office. The mandatory retirement age for directors who are not “interested persons,” as that term is defined in the Investment Company Act (independent directors), is 72. However, the mandatory retirement age may be extended or changed with the approval of the remaining independent directors.
Mr. Thomas is the only director who is an “interested person” because he currently serves as President and Chief Executive Officer of American Century Companies, Inc. (ACC), the parent company of American Century Investment Management, Inc. (ACIM) and American Century Global Investment Management, Inc. (ACGIM). ACIM and ACGIM are referred to collectively as the “advisors.”
The other directors (more than three-fourths of the total number) are independent; that is, they have never been employees, directors or officers of, and have no financial interest in, ACC or any of its wholly owned, direct or indirect, subsidiaries, including ACIM, ACGIM, American Century Investment Services, Inc. (ACIS) and American Century Services, LLC (ACS). The directors serve in this capacity for seven (in the case of Mr. Thomas, 15) registered investment companies in the American Century Investments family of funds.
The following presents additional information about the directors. The mailing address for each director is 4500 Main Street, Kansas City, Missouri 64111.
Independent Directors
Thomas A. Brown
Year of Birth: 1940
Position(s) with the Funds: Director
Length of Time Served: Since 1980
Principal Occupation(s) During the Past Five Years: Managing Member, Associated Investments,
LLC (real estate investment company); Brown Cascade Properties, LLC (real estate
investment company) (2001 to 2009)
Number of Funds in Fund Complex Overseen by Director: 63
Other Directorships Held by Director: None
Education/Other Professional Experience: BS in Mechanical Engineering, University of
Kansas; formerly, Chief Executive Officer, Associated Bearings Company; formerly,
Area Vice President, Applied Industrial Technologies (bearings and power
transmission company)
70
Andrea C. Hall
Year of Birth: 1945
Position(s) with the Funds: Director
Length of Time Served: Since 1997
Principal Occupation(s) During the Past Five Years: Retired as advisor to the President, Midwest
Research Institute (not-for-profit research organization) (June 2006)
Number of Funds in Fund Complex Overseen by Director: 63
Other Directorships Held by Director: None
Education/Other Professional Experience: BS in Biology, Florida State University; PhD in
Biology, Georgetown University; formerly, Senior Vice President and director of
Research Operations, Midwest Research Institute
James A. Olson
Year of Birth: 1942
Position(s) with the Funds: Director
Length of Time Served: Since 2007
Principal Occupation(s) During the Past Five Years: Member, Plaza Belmont LLC (private equity
fund manager); Chief Financial Officer, Plaza Belmont LLC (September 1999 to
September 2006)
Number of Funds in Fund Complex Overseen by Director: 63
Other Directorships Held by Director: Saia, Inc. and Entertainment Properties Trust
Education/Other Professional Experience: BS in Business Administration and MBA, St. Louis
University; CPA; 21 years of experience as a partner in the accounting firm of Ernst
& Young LLP
Donald H. Pratt
Year of Birth: 1937
Position(s) with the Funds: Director, Chairman of the Board
Length of Time Served: Since 1995
Principal Occupation(s) During the Past Five Years: Chairman and Chief Executive Officer,
Western Investments, Inc. (real estate company)
Number of Funds in Fund Complex Overseen by Director: 63
Other Directorships Held by Director: None
Education/Other Professional Experience: BS in Industrial Engineering, Wichita State
University; MBA, Harvard Business School; serves on the Board of Governors of
the Independent Directors Council and Investment Company Institute; formerly,
Chairman of the Board, Butler Manufacturing Company (metal buildings producer)
Gale E. Sayers
Year of Birth: 1943
Position(s) with the Funds: Director
Length of Time Served: Since 2000
Principal Occupation(s) During the Past Five Years: President, Chief Executive Officer and
Founder, Sayers40, Inc., (technology products and services provider)
Number of Funds in Fund Complex Overseen by Director: 63
Other Directorships Held by Director: None
Education/Other Professional Experience: BS in Physical Education and M.Ed. in Educational
Administration, University of Kansas; Recipient of the Ernst & Young Entrepreneur
of the Year Award; inducted into the Chicago Entrepreneurship Hall of Fame and
the National Football League Hall of Fame
71
M. Jeannine Strandjord
Year of Birth: 1945
Position(s) with the Funds: Director
Length of Time Served: Since 1994
Principal Occupation(s) During the Past Five Years: Retired, formerly, Senior Vice President,
Process Excellence, Sprint Corporation (telecommunications company) (January
2005-September 2005)
Number of Funds in Fund Complex Overseen by Director: 63
Other Directorships Held by Director: DST Systems Inc., Euronet Worldwide Inc., Charming
Shoppes, Inc.
Education/Other Professional Experience: BS in Business Administration and Accounting,
University of Kansas; CPA; formerly, Senior Vice President of Financial Services and
Treasurer and Chief Financial Officer, Global Markets Group; Sprint Corporation;
formerly, with the accounting firm of Ernst and Whinney
John R. Whitten
Year of Birth: 1946
Position(s) with the Funds: Director
Length of Time Served: Since 2008
Principal Occupation(s) During the Past Five Years: Project Consultant, Celanese Corp.
(industrial chemical company)
Number of Funds in Fund Complex Overseen by Director: 63
Other Directorships Held by Director: Rudolph Technologies, Inc.
Professional Education/Experience: BS in Business Administration, Cleveland State
University; CPA; formerly, Chief Financial Officer and Treasurer, Applied Industrial
Technologies, Inc.; thirteen years of experience with accounting firm Deloitte &
Touche LLP
Interested Director
Jonathan S. Thomas
Year of Birth: 1963
Position(s) with the Funds: Director and President
Length of Time Served: Since 2007
Principal Occupation(s) During the Past Five Years: President and Chief Executive Officer,
ACC (March 2007 to present); Chief Administrative Officer, ACC (February 2006 to
February 2007); Executive Vice President, ACC (November 2005 to February 2007).
Also serves as: Chief Executive Officer and Manager, American Century Services,
LLC (ACS); Executive Vice President, American Century Investment Management
(ACIM) and American Century Global Investment Management (ACGIM); Director,
ACIM, ACGIM and other ACC subsidiaries; Global Chief Operating Officer and
Managing Director, Morgan Stanley (investment management) (March 2000 to
November 2005)
Number of Funds in Fund Complex Overseen by Director: 104
Other Directorships Held by Director: None
Education/Other Professional Experience: BA in Economics, University of Massachusetts;
MBA, Boston College; formerly held senior leadership roles with Fidelity
Investments, Boston Financial Services and Bank of America; serves on the Board of
Governors of the Investment Company Institute
72
Officers
The following table presents certain information about the executive officers of the funds. Each officer serves as an officer for each of the 15 investment companies in the American Century family of funds, unless otherwise noted. No officer is compensated for his or her service as an officer of the funds. The listed officers are interested persons of the funds and are appointed or re-appointed on an annual basis. The mailing address for each of the officers listed below is 4500 Main Street, Kansas City, Missouri 64111.
| | |
| Name | Offices with | |
| (Year of Birth) | the Funds | Principal Occupation During the Past Five Years |
| Jonathan Thomas | Director and | President and Chief Executive Officer, ACC (March 2007 to present); Chief |
| (1963) | President | Administrative Officer, ACC (February 2006 to March 2007); Executive |
| | since 2007 | Vice President, ACC (November 2005 to February 2007). Also serves as: |
| | | Chief Executive Officer and Manager, ACS; Executive Vice President, ACIM, |
| | | ACGIM; Director, ACIM, ACGIM and other ACC subsidiaries; Global Chief |
| | | Operating Officer and Managing Director, Morgan Stanley (March 2000 to |
| | | November 2005) |
| Barry Fink | Executive | Chief Operating Officer and Executive Vice President, ACC (September 2007 |
| (1955) | Vice President | to present); President, ACS (October 2007 to present); Managing Director, |
| | since 2007 | Morgan Stanley (2000 to 2007); Global General Counsel, Morgan Stanley |
| | | (2000 to 2006). Also serves as: Manager, ACS and Director, ACC and |
| | | certain ACC subsidiaries |
| Maryanne Roepke | Chief Compliance | Chief Compliance Officer, American Century funds, ACIM, ACGIM and |
| (1956) | Officer since 2006 | ACS (August 2006 to present); Assistant Treasurer, ACC (January 1995 to |
| | and Senior | August 2006); and Treasurer and Chief Financial Officer, various American |
| | Vice President | Century funds (July 2000 to August 2006). Also serves as: Senior Vice |
| | since 2000 | President, ACS |
| Charles | General Counsel | Attorney, ACC (February 1994 to present); Vice President, ACC (November |
| Etherington | since 2007 and | 2005 to present), General Counsel, ACC (March 2007 to present); Also |
| (1957) | Senior Vice | serves as General Counsel, ACIM, ACGIM, ACS, ACIS and other ACC |
| | President | subsidiaries; and Senior Vice President, ACIM, ACGIM and ACS |
| | since 2006 | |
| Robert Leach | Vice President, | Vice President, ACS (February 2000 to present); and Controller, various |
| (1966) | Treasurer and | American Century funds (1997 to September 2006) |
| | Chief Financial | |
| | Officer since 2006 | |
| David Reinmiller | Vice President | Attorney, ACC (January 1994 to present); Associate General Counsel, ACC |
| (1963) | since 2000 | (January 2001 to present); Chief Compliance Officer, American Century |
| | | funds, ACIM and ACGIM (January 2001 to February 2005). Also serves as |
| | | Vice President, ACIM, ACGIM and ACS |
| Ward Stauffer | Secretary | Attorney, ACC (June 2003 – Present) |
| (1960) | since 2005 | |
The SAI has additional information about the funds’ directors and is available without charge, upon request, by calling 1-800-345-2021.
73
|
| Board Approval of Management Agreements |
American Century Investment Management, Inc. (“ACIM” or the “Advisor”) currently serves as investment advisor to the Funds under an interim management agreement (the “Interim Management Agreement”) between the Advisor and the Funds approved by the Funds’ Board of Directors (the “Board”). The Advisor previously served as investment advisor to the Funds pursuant to a management agreement (the “Prior Management Agreement”) that terminated in accordance with its terms on February 16, 2010, as a result of a change of control of the Advisor’s parent company, American Century Companies, Inc. (“ACC”). The change in control occurred as the result of a change in the trustee of a trust created by James E. Stowers, Jr., the founder of American Century Investments, which holds shares representing a significant interest in ACC stock. Mr. Stowers previously se rved as the trustee of the trust. On February 16, 2010, Richard W. Brown, Co-Chairman of ACC with Mr. Stowers, became the trustee in accordance with the terms of the trust and Mr. Stowers’ long-standing estate and succession plan.
On February 18, 2010, the Board approved the Interim Management Agreement in accordance with Rule 15a-4 under the Investment Company Act to ensure continued management of the Funds by the Advisor after the termination of the Prior Management Agreement and until shareholder approval of a new management agreement (the “Proposed Management Agreement”) as required under the Act. The Board has approved the Proposed Management Agreement and has recommended its approval to shareholders. Fund shareholders are scheduled to consider approval of the Proposed Management Agreement at a meeting to be held on June 16, 2010.
The Interim Management Agreement and the Proposed Management Agreement are substantially identical to the Prior Management Agreement except for their effective dates and the termination provisions of the Interim Management Agreement. Under the Interim and Proposed Management Agreements, the Advisor will provide the same services to the Funds and receive the same compensation rate as under the Prior Management Agreement.
Basis for Board Approval of Interim Management Agreement
In considering the approval of the Interim Management Agreement, Rule 15a-4 requires the Board to approve the contract within ten business days of the termination of the prior agreement and to determine that the compensation to be received under the interim agreement is no greater than would have been received under the prior agreement. In connection with the approval, the Board noted that it oversees on a continuous basis and evaluates at its quarterly meetings, directly and through the committees of the Board, the nature and quality of significant services provided by the Advisor, the investment performance of the Funds, shareholder services, audit and compliance functions and a variety of other matters relating to the Funds’ operations.
In evaluating the Interim Management Agreement, the Board, assisted by the advice of its independent legal counsel, considered a number of factors in addition to those required by the rule with no one factor being determinative to its analysis. Among the factors considered by the Board were the
74
circumstances and effect of the change of control, the fact that the Advisor will provide the same services and receive the same compensation rate as under the Prior Management Agreements, and that the change of control did not result in a change of the personnel managing the Funds. Upon completion of its analysis, the Board approved the Interim Management Agreement, determining that the continued management of the Funds by the Advisor was in the best interests of the Funds and Fund shareholders.
Basis for Board Approval of Proposed Management Agreement
At a meeting held on March 29, 2010, after considering all information presented, the Board approved, and determined to recommend that shareholders approve, the Proposed Management Agreement. In connection with that approval, the Board requested and reviewed extensive data and information compiled by the Advisor and certain independent providers of evaluation data concerning the Funds and services provided to the Funds by the Advisor. The Board oversees on a continuous basis and evaluates at its quarterly meetings, directly and through the committees of the Board, the nature and quality of significant services provided by the Advisor, the investment performance of the Funds, shareholder services, audit and compliance functions and a variety of other matters relating to the Funds’ operations. The information considered and the discussions held at the meetings included, but were not limited to:
• the nature, extent and quality of investment management, shareholder services and other services provided to the Funds;
• the wide range of programs and services the Advisor provides to the Funds and their shareholders on a routine and non-routine basis;
• the compliance policies, procedures, and regulatory experience of the Advisor;
• data comparing the cost of owning the Funds to the cost of owning similar funds;
• the fact that there will be no changes to the fees, services, or personnel who provide such services as compared to the Prior Management Agreement;
• data comparing the Funds’ performance to appropriate benchmarks and/ or a peer group of other mutual funds with similar investment objectives and strategies;
• financial data showing the profitability of the Funds to the Advisor and the overall profitability of the Advisor;
• data comparing services provided and charges to the Funds with those for other non-fund investment management clients of the Advisor; and
• consideration of collateral or “fall-out” benefits derived by the Advisor from the management of the Funds and potential sharing of economies of scale in connection with the management of the Funds.
75
The Board also considered whether there was any reason for not continuing the existing arrangement with the Advisor. In particular, the Board recognized that shareholders may have invested in the Funds on the strength of the Advisor’s industry standing and reputation and in the expectation that the Advisor will have a continuing role in providing advisory services to the Funds.
The Board considered all of the information provided by the Advisor, the independent data providers, and the Board’s independent legal counsel, and evaluated such information for each Fund. The Board did not identify any single factor as being all-important or controlling, and each Board member may have attributed different levels of importance to different factors. In deciding to approve the Proposed Management Agreement under the terms ultimately determined by the Board to be appropriate, the Board based its decision on a number of factors, including the following:
Nature, Extent and Quality of Services—Generally. Under the Proposed Management Agreement, the Advisor is responsible for providing or arranging for all services necessary for the operation of the Funds. The Board noted that under the Proposed Management Agreement, the Advisor provides or arranges at its own expense a wide variety of services including:
• constructing and designing the Funds
• portfolio research and security selection
• initial capitalization/funding
• securities trading
• Fund administration
• custody of Fund assets
• daily valuation of each Fund’s portfolio
• shareholder servicing and transfer agency, including shareholder
confirmations, recordkeeping and communications
• legal services
• regulatory and portfolio compliance
• financial reporting
• marketing and distribution
The Board noted that many of these services have expanded over time both in terms of quantity and complexity in response to shareholder demands, competition in the industry, changing distribution channels and the changing regulatory environment.
76
Investment Management Services. The investment management services provided to the Funds are complex and provide Fund shareholders access to professional money management, instant diversification of their investments within an asset class, the opportunity to easily diversify among asset classes, and liquidity. As a part of its general oversight and in evaluating investment performance, the Board expects the Advisor to manage each Fund in accordance with its investment objectives and approved strategies. In providing these services, the Advisor utilizes teams of investment professionals who require extensive information technology, research, training, compliance and other systems to conduct their business. The Board, directly and through its Fund Performance Review Committee, regularly reviews investment performance information for each Fund, together with comparative information for appropriate benchmarks and/or peer groups of similarly-managed funds, over different time horizons. If performance concerns are identified, the underperforming Fund receives special reviews until performance improves, during which time the Board discusses with the Advisor the reasons for such underperformance and any efforts being undertaken to improve performance.
Shareholder and Other Services. Under the Proposed Management Agreement, the Advisor will also provide the Funds with a comprehensive package of transfer agency, shareholder, and other services. The Board, directly and through the various committees of the Board, regularly reviews reports and evaluations of such services. These reports include, but are not limited to, information regarding the operational efficiency and accuracy of the shareholder and transfer agency services provided, staffing levels, shareholder satisfaction (as measured by external as well as internal sources), technology support, new products and services offered to Fund shareholders, securities trading activities, portfolio valuation services, auditing services, and legal and operational compliance activities. Certain aspects of shareholder and transfer a gency service level efficiency and the quality of securities trading activities are measured by independent third party providers and are presented in comparison to other fund groups not managed by the Advisor.
Costs of Services Provided and Profitability. The Advisor provided detailed information concerning its cost of providing various services to the Funds, its profitability in managing the Funds, its overall profitability, and its financial condition. The Board reviewed with the Advisor the methodology used to prepare this financial information. The Board has also reviewed with the Advisor its methodology for compensating the investment professionals that provide services to the Funds as well as compensation to the five highest paid personnel of the Advisor. This financial information regarding the Advisor is considered in order to evaluate the Advisor’s financial condition, its ability to continue to provide services under the Proposed Management Agreement, and the reasonableness of the proposed management fees. The Board c oncluded that the Advisor’s profits were reasonable in light of the services provided to the Funds.
77
Ethics. The Board generally considers the Advisor’s commitment to providing quality services to shareholders and to conducting its business ethically. It noted that the Advisor’s practices generally meet or exceed industry best practices.
Economies of Scale. The Board also reviewed information provided by the Advisor regarding the possible existence of economies of scale in connection with the management of the Funds. The Board concluded that economies of scale are difficult to measure and predict with precision, especially on a fund-by-fund basis. The analysis of economies of scale is further complicated by the additional services and content provided by the Advisor and its reinvestment in its ability to provide and expand those services. Accordingly, the Board seeks to evaluate economies of scale by reviewing information, such as year-over-year profitability of the Advisor generally, the profitability of its management of each Fund specifically, and the expenses incurred by the Advisor in providing various functions to the Funds. The Board believes the Adviso r is appropriately sharing economies of scale through its competitive fee structure, offering competitive fees from fund inception, fee breakpoints as each Fund increases in size, and through reinvestment in its business to provide shareholders additional services and enhancements to existing services.
Comparison to Fees of Funds not Managed by the Advisor. Both the Prior and Proposed Management Agreements provide that the Funds pay the Advisor a single, all-inclusive (or unified) management fee for providing all services necessary for the management and operation of the Funds, other than brokerage expenses, taxes, interest, extraordinary expenses, and the fees and expenses of the Funds’ Independent Trustees (including their independent legal counsel) and expenses incurred in connection with the provision of shareholder services and distribution services under a plan adopted pursuant to Rule 12b-1 under the 1940 Act. Under the unified fee structure, the Advisor is responsible for providing all investment advisory, custody, audit, administrative, compliance, recordkeeping, marketing and shareholder services, or arranging and supervising third parties that provide such services. By contrast, most other funds are charged a variety of fees, including an investment advisory fee, a transfer agency fee, an administrative fee, distribution charges and other expenses. Other than their investment advisory fees and any applicable Rule 12b-1 distribution fees, the components of the total fees charged by these other funds may be increased without shareholder approval. The Board believes the unified fee structure is a benefit to Fund shareholders because it clearly discloses to shareholders the cost of owning Fund shares, and, since the unified fee cannot be increased without a vote of Fund shareholders, it shifts to the Advisor the risk of increased costs of operating the Funds and provides a direct incentive to minimize administrative inefficiencies. Part of the Board’s analysis of fee levels involves reviewing certain evaluative data compiled by an independent provider comparing each Fund’s unified fee to the total expense ratios of similar funds not managed by the Advisor. The Board concluded that the management fee to be paid by each Fund to the Advisor under the Proposed Management Agreement is reasonable in light of the services to be provided to the Fund.
78
Comparison to Fees and Services Provided to Other Clients of the Advisor. The Board also requested and received information from the Advisor concerning the nature and extent of the services, fees, and profitability of its advisory services to advisory clients other than the Funds. They observed that these varying types of client accounts require different services and involve different regulatory and entrepreneurial risks than the management of the Funds. The Board analyzed this information and concluded that the fees charged and services provided to the Funds were reasonable by comparison.
Collateral or “Fall-Out” Benefits Derived by the Advisor. The Board considered the existence of collateral benefits the Advisor may receive as a result of its relationship with the Funds. The Board concluded that the Advisor’s primary business is managing mutual funds and it generally does not use Fund or shareholder information to generate profits in other lines of business, and therefore does not derive any significant collateral benefits from them. The Board noted that the Advisor receives proprietary research from broker-dealers that execute Fund portfolio transactions and concluded that this research is likely to benefit Fund shareholders. The Board also determined that the Advisor is able to provide investment management services to certain clients other than the Funds, at least in part, due to its existin g infrastructure built to serve the fund complex. The Board concluded, however, that the assets of those other clients are not material to the analysis and, in any event, are included with the assets of the Funds to determine breakpoints in each Fund’s fee schedule, provided they are managed using the same investment team and strategy.
Conclusion of the Board. As a result of this process, the Board, in the absence of particular circumstances and assisted by the advice of its independent legal counsel, taking into account all of the factors discussed above and the information provided by the Advisor and others, concluded that the Proposed Management Agreement be approved and recommended its approval to Fund shareholders.
79
Retirement Account Information
As required by law, distributions you receive from certain IRAs, or 403(b), 457 and qualified plans are subject to federal income tax withholding, unless you elect not to have withholding apply. Tax will be withheld on the total amount withdrawn even though you may be receiving amounts that are not subject to withholding, such as nondeductible contributions. In such case, excess amounts of withholding could occur. You may adjust your withholding election so that a greater or lesser amount will be withheld.
If you don’t want us to withhold on this amount, you must notify us to not withhold the federal income tax. You may notify us in writing or in certain situations by telephone or through other electronic means. You have the right to revoke your withholding election at any time and any election you make may remain in effect until revoked by filing a new election.
Remember, even if you elect not to have income tax withheld, you are liable for paying income tax on the taxable portion of your withdrawal. If you elect not to have income tax withheld or you don’t have enough income tax withheld, you may be responsible for payment of estimated tax. You may incur penalties under the estimated tax rules if your withholding and estimated tax payments are not sufficient. You can reduce or defer the income tax on a distribution by directly or indirectly rolling such distribution over to another IRA or eligible plan. You should consult your tax advisor for additional information.
State tax will be withheld if, at the time of your distribution, your address is within one of the mandatory withholding states and you have federal income tax withheld. State taxes will be withheld from your distribution in accordance with the respective state rules.
Proxy Voting Guidelines
American Century Investment Management, Inc., the funds’ investment advisor, is responsible for exercising the voting rights associated with the securities purchased and/or held by the funds. A description of the policies and procedures the advisor uses in fulfilling this responsibility is available without charge, upon request, by calling 1-800-345-2021. It is also available on American Century Investments’ website at americancentury.com and on the Securities and Exchange Commission’s website at sec.gov. Information regarding how the investment advisor voted proxies relating to portfolio securities during the most recent 12-month period ended June 30 is available on the “About Us” page at americancentury.com. It is also available at sec.gov.
Quarterly Portfolio Disclosure
The funds file their complete schedule of portfolio holdings with the Securities and Exchange Commission (SEC) for the first and third quarters of each fiscal year on Form N-Q. The funds’ Forms N-Q are available on the SEC’s website at sec.gov, and may be reviewed and copied at the SEC’s Public Reference Room in Washington, DC. Information on the operation of the Public Reference Room may be obtained by calling 1-800-SEC-0330. The funds also make their complete schedule of portfolio holdings for the most recent quarter of their fiscal year available on their website at americancentury.com and, upon request, by calling 1-800-345-2021.
80
The following indices are used to illustrate investment market, sector, or style performance or to serve as fund performance comparisons. They are not investment products available for purchase.
The Lipper Equity Income Funds Index is an equally-weighted index of, typically, the 30 largest equity income mutual funds that purchase securities of companies of all market capitalizations.
The Lipper Multi-Cap Value Funds Index is an equally-weighted index of, typically, the 30 largest mutual funds that use a value investment strategy to purchase securities of companies of all market capitalizations.
The Russell 1000® Index is a market-capitalization weighted, large-cap index created by Frank Russell Company to measure the performance of the 1,000 largest publicly traded U.S. companies, based on total market capitalization.
The Russell 1000® Growth Index measures the performance of those Russell 1000 Index companies (the 1,000 largest publicly traded U.S. companies, based on total market capitalization) with higher price-to-book ratios and higher forecasted growth values.
The Russell 1000® Value Index measures the performance of those Russell 1000 Index companies (the 1,000 largest publicly traded U.S. companies, based on total market capitalization) with lower price-to-book ratios and lower forecasted growth values.
The Russell 2000® Index is a market-capitalization weighted index created by Frank Russell Company to measure the performance of the 2,000 smallest of the 3,000 largest publicly traded U.S. companies, based on total market capitalization.
The Russell 2000® Growth Index measures the performance of those Russell 2000 Index companies (the 2,000 smallest of the 3,000 largest publicly traded U.S. companies, based on total market capitalization) with higher price-to-book ratios and higher forecasted growth values.
The Russell 2000® Value Index measures the performance of those Russell 2000 Index companies (the 2,000 smallest of the 3,000 largest publicly traded U.S. companies, based on total market capitalization) with lower price-to-book ratios and lower forecasted growth values.
The Russell 3000® Value Index measures the performance of those Russell 3000 Index companies (the 3,000 largest U.S. companies based on total market capitalization) with lower price-to-book ratios and lower forecasted growth values.
The Russell Midcap® Index measures the performance of the 800 smallest of the 1,000 largest publicly traded U.S. companies, based on total market capitalization.
81
The Russell Midcap® Growth Index measures the performance of those Russell Midcap Index companies (the 800 smallest of the 1,000 largest publicly traded U.S. companies, based on total market capitalization) with higher price-to-book ratios and higher forecasted growth values.
The Russell Midcap® Value Index measures the performance of those Russell Midcap Index companies (the 800 smallest of the 1,000 largest publicly traded U.S. companies, based on total market capitalization) with lower price-to-book ratios and lower forecasted growth values.
The S&P 500 Index is a market value-weighted index of the stocks of 500 publicly traded U.S. companies chosen for market size, liquidity, and industry group representation that are considered to be leading firms in dominant industries. Each stock’s weight in the index is proportionate to its market value. Created by Standard & Poor’s, it is considered to be a broad measure of U.S. stock market performance.
82
83
84

| |
| |
| Contact Us | |
| americancentury.com | |
| Automated Information Line | 1-800-345-8765 |
| Investor Services Representative | 1-800-345-2021 or |
| | 816-531-5575 |
| Investors Using Advisors | 1-800-378-9878 |
| Business, Not-For-Profit, Employer-Sponsored | |
| Retirement Plans | 1-800-345-3533 |
| Banks and Trust Companies, Broker-Dealers, | |
| Financial Professionals, Insurance Companies | 1-800-345-6488 |
| Telecommunications Device for the Deaf | 1-800-634-4113 |
| American Century Capital Portfolios, Inc. | |
| Investment Advisor: | |
| American Century Investment Management, Inc. | |
| Kansas City, Missouri | |
This report and the statements it contains are submitted for the general
information of our shareholders. The report is not authorized for distribution to
prospective investors unless preceded or accompanied by an effective prospectus.
American Century Investment Services, Inc., Distributor
©2010 American Century Proprietary Holdings, Inc. All rights reserved.
1005
CL-ANN-68270N
|
| Annual Report |
| March 31, 2010 |

|
| American Century Investments® |
Real Estate Fund
| |
| President’s Letter | 2 |
| Independent Chairman’s Letter | 3 |
| Market Perspective | 4 |
| U.S. Stock Index Returns | 4 |
| |
| Real Estate | |
| |
| Performance | 5 |
| Portfolio Commentary | 7 |
| Top Ten Holdings | 9 |
| Industry Allocation | 9 |
| Types of Investments in Portfolio | 9 |
| |
| Shareholder Fee Example | 10 |
| |
| Financial Statements | |
| |
| Schedule of Investments | 12 |
| Statement of Assets and Liabilities | 14 |
| Statement of Operations | 16 |
| Statement of Changes in Net Assets | 17 |
| Notes to Financial Statements | 18 |
| Financial Highlights | 25 |
| Report of Independent Registered Public Accounting Firm | 31 |
| |
| Other Information | |
| |
| Management | 32 |
| Board Approval of Management Agreements | 36 |
| Additional Information | 42 |
| Index Definitions | 43 |
Any opinions expressed in this report reflect those of the author as of the date of the report, and do not necessarily represent the opinions of American Century Investments or any other person in the American Century Investments organization. Any such opinions are subject to change at any time based upon market or other conditions and American Century Investments disclaims any responsibility to update such opinions. These opinions may not be relied upon as investment advice and, because investment decisions made by American Century Investments funds are based on numerous factors, may not be relied upon as an indication of trading intent on behalf of any American Century Investments fund. Security examples are used for representational purposes only and are not intended as recommendations to purchase or sell securities. Performance information for comparative indices and securities is provided to American Century Investments by third party vendors. To the best of American Century Investments’ knowledge, such information is accurate at the time of printing.

Dear Investor:
To learn more about the capital markets, your investment, and the portfolio management strategies American Century Investments provides, we encourage you to review this shareholder report for the financial reporting period ended March 31, 2010.
On the following pages, you will find investment performance and portfolio information, presented with the expert perspective and commentary of our portfolio management team. This report remains one of our most important vehicles for conveying the information you need about your investment performance, and about the market factors and strategies that affect fund returns. For additional information on the markets, we encourage you to visit the “Insights & News” tab at our Web site, americancentury.com, for updates and further expert commentary.
The top of our Web site’s home page also provides a link to “Our Story,” which, first and foremost, outlines our commitment—since 1958—to helping clients reach their financial goals. We believe strongly that we will only be successful when our clients are successful. That’s who we are.
Another important, unique facet of our story and who we are is “Profits with a Purpose,” which describes our bond with the Stowers Institute for Medical Research (SIMR). SIMR is a world-class biomedical organization—founded by our company founder James E. Stowers, Jr. and his wife Virginia—that is dedicated to researching the causes, treatment, and prevention of gene-based diseases, including cancer. Through American Century Investments’ private ownership structure, more than 40% of our profits support SIMR.
Mr. Stowers’ example of achieving financial success and using that platform to help humanity motivates our entire American Century Investments team. His story inspires us to help each of our clients achieve success. Thank you for sharing your financial journey with us.
Sincerely,

Jonathan Thomas
President and Chief Executive Officer
American Century Investments
2
|
| Independent Chairman’s Letter |

Fellow Shareholders,
The principal event at a recent board meeting was the retirement of Jim Stowers, Jr. from the American Century Mutual Funds Kansas City board. This was one of those times when you felt like you were living a historical moment. Jim founded what was known as Twentieth Century Mutual Funds over 50 years ago. Through the years, his number one priority has been to “Put Investors First!” The board presented Jim with a resolution acknowledging that, by building a successful investment company, he has impacted the lives of many by helping them on the path to financial success.
We respect Jim’s decision to focus his energy on the Stowers Institute for Medical Research and American Century Companies, Inc. (ACC), the parent company of the funds’ investment advisors. The pioneering medical research that Jim and his wife Virginia have made possible through the Institute should enrich the lives of millions in the future.
Shortly after his retirement from the board, we received word that Jim—who celebrated his 86th birthday in January—was hospitalized after experiencing a fall during his regular exercise regimen. While Jim has made steady progress toward recovery, this potentially serious incident resulted in the activation of his long-standing estate and business succession plan. Under the terms of the plan, ACC’s co-chairman Richard W. Brown succeeded Jim as trustee of a trust that holds a significant interest in ACC stock. While less than a majority interest, the trust is presumed to control the funds’ investment advisors under the Investment Company Act of 1940. This change triggered the need for a shareholder proxy to approve new management and subadvisory agreements for the funds. If you have not already responded, I encourage you to take the time to read the proxy materials and send your vote as soon as p ossible.
On behalf of the board, I want to once again thank Jim for his mutual fund board service and wish him a speedy recovery. More than three years ago, Jim and Richard Brown installed a strong and effective leadership team at American Century Investments and I look forward to continuing to work with them on behalf of fund shareholders. And while Jim no longer sits on the fund board, the inherent optimism captured by his favorite catch phrase—“The best is yet to be”—still resonates with all of us who have the privilege of serving you. I invite you to send your comments, questions or concerns to me at dhpratt@fundboardchair.com.

3

By Enrique Chang, Chief Investment Officer, American Century Investments
A Remarkable Recovery for Stocks
The U.S. stock market generated a very strong return for the year ended March 31, 2010, enjoying one of its best 12-month performances since 1983 (see the table below). The market’s extraordinary advance was driven by growing signs of economic recovery following a severe recession in late 2008 and early 2009.
The reporting period began shortly after the stock market hit its lowest point in 13 years, weighed down by the Great Recession—the worst economic downturn since the 1930s. Since then, however, the economic environment has improved markedly, providing support to the equity market. An increase in manufacturing activity, improving consumer spending, and signs of stabilization in the housing sector helped the U.S. economy post positive economic growth in the second half of 2009 after a year of declining output. The major exception to the favorable economic data was employment—job losses continued to mount and the unemployment rate remained persistently elevated throughout the 12-month period.
Stocks also got a lift from corporate earnings, which consistently exceeded expectations during the reporting period. The improvement in corporate profits occurred despite flat-to-declining revenues as businesses managed their cost structure more effectively, successfully lowering expenses.
Better economic data and rising corporate profits helped the stock market bounce back sharply throughout the reporting period, producing tremendous gains—the broad stock indexes delivered returns of more than 50% for the 12 months. Mid-cap stocks posted the best results, followed by small-and large-cap shares, while value-oriented issues outpaced growth across all market capitalizations.
Bumps in the Road
Although we appear to be on a path to economic recovery, there are still likely to be bumps in the road before we can put the Great Recession firmly behind us. We are still facing an unemployment rate near 10%, a fragile financial sector, and enormous fiscal deficits. In addition, consumers and businesses are continuing to deleverage, which is likely to limit any improvements in retail and corporate spending. As a result, we expect a slower and longer road to prosperity than in past recoveries.
| | | | |
| U.S. Stock Index Returns | | | | |
| For the 12 months ended March 31, 2010 | | | | |
| Russell 1000 Index (Large-Cap) | 51.60% | | Russell 2000 Index (Small-Cap) | 62.76% |
| Russell 1000 Growth Index | 49.75% | | Russell 2000 Growth Index | 60.32% |
| Russell 1000 Value Index | 53.56% | | Russell 2000 Value Index | 65.07% |
| Russell Midcap Index | 67.71% | | | |
| Russell Midcap Growth Index | 63.00% | | | |
| Russell Midcap Value Index | 72.41% | | | |
4
| | | | | | |
| Real Estate | | | | | | |
| |
| Total Returns as of March 31, 2010 | | | | |
| | | | Average Annual Returns | |
| | Ticker | | | | Since | Inception |
| | Symbol | 1 year(1) | 5 years | 10 years | Inception | Date |
| Investor Class | REACX | 107.30% | 2.00% | 10.68% | 10.23% | 9/21/95(2) |
| MSCI US REIT Index | — | 110.46% | 3.77% | 11.20% | 9.96%(3) | — |
| Institutional Class | REAIX | 107.71% | 2.20% | 10.89% | 8.05% | 6/16/97 |
| A Class(4) | AREEX | | | | | 10/6/98 |
| No sales charge* | | 106.76% | 1.74% | 10.41% | 9.47% | |
| With sales charge* | | 94.79% | 0.54% | 9.76% | 8.90% | |
| B Class | ARYBX | | | | | 9/28/07 |
| No sales charge* | | 105.35% | — | — | -14.83% | |
| With sales charge* | | 101.35% | — | — | -16.37% | |
| C Class | ARYCX | 105.21% | — | — | -14.81% | 9/28/07 |
| R Class | AREWX | 106.38% | — | — | -14.40% | 9/28/07 |
| *Sales charges include initial sales charges and contingent deferred sales charges (CDSCs), as applicable. A Class shares have a 5.75% |
| maximum initial sales charge for equity funds and may be subject to a maximum CDSC of 1.00%. B Class shares redeemed within six |
| years of purchase are subject to a CDSC that declines from 5.00% during the first year after purchase to 0.00% the sixth year after |
| purchase. C Class shares redeemed within 12 months of purchase are subject to a maximum CDSC of 1.00%. The SEC requires that |
| mutual funds provide performance information net of maximum sales charges in all cases where charges could be applied. |
| |
| (1) | The performance is attributable in part to unusually favorable market conditions and may not be repeated or consistently achieved in the future. |
| (2) | The inception date for RREEF Real Estate Securities Fund, Real Estate’s predecessor. That fund merged with Real Estate on 6/13/97 and Real |
| | Estate was first offered to the public on 6/16/97. |
| (3) | Since 9/30/95, the date nearest the Investor Class’s inception for which data are available. |
| (4) | Prior to September 4, 2007, the A Class was referred to as the Advisor Class and did not have a front-end sales charge. Performance prior to that |
| | date has been adjusted to reflect this charge. |
Data presented reflect past performance. Past performance is no guarantee of future results. Current performance may be higher or lower than the performance shown. Investment return and principal value will fluctuate, and redemption value may be more or less than original cost. To obtain performance data current to the most recent month end, please call 1-800-345-2021 or visit americancentury.com. The fund may be subject to certain risks similar to those associated with direct investment in real estate including but not limited to: local or regional economic conditions, changes in zoning laws, changes in property values, property tax increases, overbuilding, increased competition, environmental contamination, natural disasters and interest rate risk.
Unless otherwise indicated, performance reflects Investor Class shares; performance for other share classes will vary due to differences in fee structure. For information about other share classes available, please consult the prospectus. Data assumes reinvestment of dividends and capital gains, and none of the charts reflect the deduction of taxes that a shareholder would pay on fund distributions or the redemption of fund shares. Returns for the index are provided for comparison. The fund’s total returns include operating expenses (such as transaction costs and management fees) that reduce returns, while the total returns of the index do not.
5
Real Estate
| | | | | |
| Total Annual Fund Operating Expenses | | | |
| | Institutional | | | | |
| Investor Class | Class | A Class | B Class | C Class | R Class |
| 1.15% | 0.95% | 1.40% | 2.15% | 2.15% | 1.65% |
The total annual fund operating expenses shown is as stated in the fund’s prospectus current as of the date of this report. The prospectus may vary from the expense ratio shown elsewhere in this report because it is based on a different time period, includes acquired fund fees and expenses, and, if applicable, does not include fee waivers or expense reimbursements.
Data presented reflect past performance. Past performance is no guarantee of future results. Current performance may be higher or lower than the performance shown. Investment return and principal value will fluctuate, and redemption value may be more or less than original cost. To obtain performance data current to the most recent month end, please call 1-800-345-2021 or visit americancentury.com. The fund may be subject to certain risks similar to those associated with direct investment in real estate including but not limited to: local or regional economic conditions, changes in zoning laws, changes in property values, property tax increases, overbuilding, increased competition, environmental contamination, natural disasters and interest rate risk.
Unless otherwise indicated, performance reflects Investor Class shares; performance for other share classes will vary due to differences in fee structure. For information about other share classes available, please consult the prospectus. Data assumes reinvestment of dividends and capital gains, and none of the charts reflect the deduction of taxes that a shareholder would pay on fund distributions or the redemption of fund shares. Returns for the index are provided for comparison. The fund’s total returns include operating expenses (such as transaction costs and management fees) that reduce returns, while the total returns of the index do not.
6
Real Estate
Portfolio Manager: Steven Brown
Performance Summary
The Real Estate fund posted a total return of 107.30%* for the 12 months ended March 31, 2010. It was the fund’s best fiscal-year return ever. By comparison, the Morgan Stanley Capital International US REIT Index (the fund’s benchmark) returned 110.46%, while the S&P 500 Index** (a broad stock market measure) returned 49.77%.
REIT Market Overview
As the triple-digit returns of the fund and its benchmark index indicate, real estate investment trusts (REITs) enjoyed one of the strongest 12-month performances in the history of the asset class. In late 2008 and early 2009, a severe economic downturn and a liquidity crisis in the credit markets sent REITs down sharply. By the beginning of the reporting period, many were trading at 40–50% discounts to their underlying property values. Since then, however, REITs staged a tremendous rebound as evidence of a burgeoning economic recovery gained momentum.
REITs also benefited from their ability to raise capital. In the spring of 2009, many REITs issued equity to help pay off near-term debt maturities. As the credit markets began to thaw in the second half of 2009, REITs were able to refinance existing debt and raise additional capital. As a result, the most highly leveraged REITs—which were hit hardest in the downturn—generated the best returns during the recovery. This dynamic provided a strong boost to smaller-cap REITs, which outperformed mid- and large-cap REITs for the 12-month period.
All segments of the REIT market posted robust returns during the period, but the top performers were those with the greatest economic sensitivity, such as hotels and regional shopping malls. In contrast, the more-defensive health care segment lagged the overall REIT market.
Portfolio Positioning
Despite a return of more than 107% for the reporting period, the Real Estate fund trailed the performance of its benchmark index. The primary factor behind this underperformance was our emphasis on the larger-cap segment of the REIT market, which meant the fund had limited exposure to the smaller-cap REITs that were the performance leaders for the 12-month period.
|
| * All fund returns referenced in this commentary are for Investor Class shares. |
| **The S&P 500 returned 1.92% and -0.65% for the five- and ten-year periods ended March 31, 2010, respectively. Data provided by Lipper Inc. — |
| A Reuters Company. © 2010 Reuters. All rights reserved. Any copying, republication or redistribution of Lipper content, including caching, framing |
| or similar means, is expressly prohibited without the prior written consent of Lipper. Lipper shall not be liable for any errors or delays in the content, |
| or for any actions taken in reliance thereon. |
| The data contained herein has been obtained from company reports, financial reporting services, periodicals and other resources believed to be |
| reliable. Although carefully verified, data on compilations is not guaranteed by Lipper and may be incomplete. No offer or solicitations to buy or sell |
| any of the securities herein is being made by Lipper. |
7
Real Estate
On the positive side, we participated in many recovery stories during the period. As it became clear that the worst of the economic downturn was behind us, we shifted into more cyclical REITs that were poised to benefit from an economic recovery. In particular, we added a number of hotel REITs and regional mall REITs, which tend to have the most economic sensitivity. We also gradually increased our exposure to smaller-cap REITs, with a focus on those trading at discounts to their underlying property values.
Winners and Losers
Stock selection among office and apartment REITs had a negative impact on performance versus the benchmark. The biggest individual detractors were defensive REITs that held up well during the downturn but lagged during the rebound. Examples included Digital Realty Trust, which runs computer-data centers for corporations, and American Campus Communities, which owns and operates student housing properties.
Stock selection was most successful among retail REITs, led by Kimco Realty and Macerich. Kimco, which owns primarily strip malls, benefited from efforts to strengthen its balance sheet as the company issued equity and used the proceeds to reduce debt. Macerich also raised capital to pay down debt, and its ownership of regional shopping malls contributed to its strong return.
A Look Ahead
The investment opportunity set for 2010 continues to improve. We believe that the U.S. economy will grow by 3–4% this year. As a result, we are focusing our investments on real estate with short-duration leases, such as hotels, self-storage facilities, and apartments.
Improvement in the debt markets has also been a positive factor for REITs. Many financial institutions have returned to lending for commercial real estate, and the growth in lending activity has increased the value of many types of commercial real estate. REITs with sizable levels of debt—which had been a negative factor—are now in better negotiating positions with their lenders.
In addition, commercial real estate continues to trade at a discount to replacement value, and REITs are particularly well suited to take advantage of acquisition opportunities because of their access to the capital markets and relatively intact management teams. We are emphasizing publicly traded real estate companies that have been active in acquiring properties.
Many studies indicate that net commercial construction activity will average less than 1% a year between 2010 and 2012, while demand growth over this period is expected to average more than 2% annually. This bodes well for rising occupancy levels, which would likely be followed by higher rental rates. We are investing in REITs that have the strong potential for upward movement in leasing rates.
Finally, the promising outlook for the REIT market gives us confidence that we will see a resumption of dividend growth, which in the past has averaged approximately 4% annually.
8
| |
| Real Estate | |
| |
| Top Ten Holdings | |
| | % of net assets as of 3/31/10 |
| Simon Property Group, Inc. | 9.4% |
| Public Storage | 6.2% |
| Vornado Realty Trust | 5.7% |
| Boston Properties, Inc. | 5.4% |
| Equity Residential | 4.7% |
| Host Hotels & Resorts, Inc. | 4.7% |
| Kimco Realty Corp. | 3.9% |
| Ventas, Inc. | 3.8% |
| AvalonBay Communities, Inc. | 3.4% |
| HCP, Inc. | 3.2% |
| |
| Industry Allocation | |
| | % of net assets as of 3/31/10 |
| Specialized REITs | 26.0% |
| Retail REITs | 23.9% |
| Office REITs | 16.5% |
| Residential REITs | 14.4% |
| Industrial REITs | 5.7% |
| Diversified REITs | 5.7% |
| Hotels, Resorts & Cruise Lines | 2.2% |
| Health Care Facilities | 1.2% |
| Real Estate Operating Companies | 1.0% |
| Diversified Real Estate Activities | 1.0% |
| Real Estate Services | 0.8% |
| Casinos & Gaming | 0.7% |
| Homebuilding | 0.5% |
| Other Assets and Liabilities | 0.4% |
| |
| Types of Investments in Portfolio | |
| | % of net assets as of 3/31/10 |
| Common Stocks | 99.6% |
| Other Assets and Liabilities | 0.4% |
9
|
| Shareholder Fee Example (Unaudited) |
Fund shareholders may incur two types of costs: (1) transaction costs, including sales charges (loads) on purchase payments and redemption/ exchange fees; and (2) ongoing costs, including management fees; distribution and service (12b-1) fees; and other fund expenses. This example is intended to help you understand your ongoing costs (in dollars) of investing in your fund and to compare these costs with the ongoing cost of investing in other mutual funds.
The example is based on an investment of $1,000 made at the beginning of the period and held for the entire period from October 1, 2009 to March 31, 2010.
Actual Expenses
The table provides information about actual account values and actual expenses for each class. You may use the information, together with the amount you invested, to estimate the expenses that you paid over the period. First, identify the share class you own. Then simply divide your account value by $1,000 (for example, an $8,600 account value divided by $1,000 = 8.6), then multiply the result by the number under the heading “Expenses Paid During Period” to estimate the expenses you paid on your account during this period.
If you hold Investor Class shares of any American Century Investments fund, or Institutional Class shares of the American Century Diversified Bond Fund, in an American Century Investments account (i.e., not a financial intermediary or retirement plan account), American Century Investments may charge you a $12.50 semiannual account maintenance fee if the value of those shares is less than $10,000. We will redeem shares automatically in one of your accounts to pay the $12.50 fee. In determining your total eligible investment amount, we will include your investments in all personal accounts (including American Century Investments Brokerage accounts) registered under your Social Security number. Personal accounts include individual accounts, joint accounts, UGMA/UTMA accounts, personal trusts, Coverdell Education Savings Accounts and IRAs (including traditional, Roth, Rollover, SEP-, SARSEP- and SIMPLE-IRAs), and certain other retirement accounts. If you have only business, business retirement, employer-sponsored or American Century Investments Brokerage accounts, you are currently not subject to this fee. We will not charge the fee as long as you choose to manage your accounts exclusively online. If you are subject to the Account Maintenance Fee, your account value could be reduced by the fee amount.
10
Hypothetical Example for Comparison Purposes
The table also provides information about hypothetical account values and hypothetical expenses based on the actual expense ratio of each class of your fund and an assumed rate of return of 5% per year before expenses, which is not the actual return of a fund’s share class. The hypothetical account values and expenses may not be used to estimate the actual ending account balance or expenses you paid for the period. You may use this information to compare the ongoing costs of investing in your fund and other funds. To do so, compare this 5% hypothetical example with the 5% hypothetical examples that appear in the shareholder reports of the other funds.
Please note that the expenses shown in the table are meant to highlight your ongoing costs only and do not reflect any transactional costs, such as sales charges (loads) or redemption/exchange fees. Therefore, the table is useful in comparing ongoing costs only, and will not help you determine the relative total costs of owning different funds. In addition, if these transactional costs were included, your costs would have been higher.
| | | | |
| | Beginning | Ending | Expenses Paid | |
| | Account Value | Account Value | During Period* | Annualized |
| | 10/1/09 | 3/31/10 | 10/1/09 – 3/31/10 | Expense Ratio* |
| Actual | | | | |
| Investor Class | $1,000 | $1,194.40 | $6.35 | 1.16% |
| Institutional Class | $1,000 | $1,195.40 | $5.25 | 0.96% |
| A Class | $1,000 | $1,192.60 | $7.71 | 1.41% |
| B Class | $1,000 | $1,188.90 | $11.79 | 2.16% |
| C Class | $1,000 | $1,188.80 | $11.79 | 2.16% |
| R Class | $1,000 | $1,191.40 | $9.07 | 1.66% |
| Hypothetical | | | | |
| Investor Class | $1,000 | $1,019.15 | $5.84 | 1.16% |
| Institutional Class | $1,000 | $1,020.14 | $4.84 | 0.96% |
| A Class | $1,000 | $1,017.90 | $7.09 | 1.41% |
| B Class | $1,000 | $1,014.16 | $10.85 | 2.16% |
| C Class | $1,000 | $1,014.16 | $10.85 | 2.16% |
| R Class | $1,000 | $1,016.65 | $8.35 | 1.66% |
| *Expenses are equal to the class’s annualized expense ratio listed in the table above, multiplied by the average account value over the period, |
| multiplied by 182, the number of days in the most recent fiscal half-year, divided by 365, to reflect the one-half year period. |
11
| | | | | | |
| Real Estate | | | | | | |
| |
| MARCH 31, 2010 | | | | | | |
| |
| | Shares | Value | | | Shares | Value |
| Common Stocks — 99.6% | | | RESIDENTIAL REITs — 14.4% | | |
| | | | | American Campus | | |
| CASINOS & GAMING — 0.7% | | | | Communities, Inc. | 332,409 | $ 9,194,433 |
| MGM Mirage(1) | 532,535 | $ 6,390,420 | | | | |
| | | | | Apartment Investment & | | |
| DIVERSIFIED REAL ESTATE ACTIVITIES — 1.0% | | Management Co., Class A | 431,500 | 7,943,915 |
| Brookfield Asset | | | | AvalonBay Communities, Inc. | 365,963 | 31,600,905 |
| Management, Inc., Class A | 366,700 | 9,321,514 | | Equity LifeStyle | | |
| DIVERSIFIED REITs — 5.7% | | | | Properties, Inc. | 129,800 | 6,993,624 |
| Vornado Realty Trust | 700,986 | 53,064,640 | | Equity Residential | 1,132,900 | 44,353,035 |
| HEALTH CARE FACILITIES — 1.2% | | | Essex Property Trust, Inc. | 142,800 | 12,844,860 |
| Emeritus Corp.(1) | 556,405 | 11,322,842 | | Mid-America Apartment | | |
| HOMEBUILDING — 0.5% | | | | Communities, Inc. | 159,768 | 8,274,385 |
| Lennar Corp., Class A | 271,939 | 4,680,070 | | Post Properties, Inc. | 363,769 | 8,010,193 |
| HOTELS, RESORTS & CRUISE LINES — 2.2% | | | UDR, Inc. | 276,679 | 4,880,618 |
| Choice Hotels | | | | | | 134,095,968 |
| International, Inc. | 206,300 | 7,181,303 | | RETAIL REITs — 23.9% | | |
| Intercontinental Hotels | | | | Developers Diversified | | |
| Group plc | 185,700 | 2,908,173 | | Realty Corp. | 1,539,355 | 18,733,950 |
| Marriott International, Inc., | | | | Equity One, Inc. | 481,134 | 9,088,621 |
| Class A | 313,504 | 9,881,646 | | Federal Realty | | |
| Starwood Hotels & Resorts | | | | Investment Trust | 155,702 | 11,336,663 |
| Worldwide, Inc. | 20,000 | 932,800 | | General Growth | | |
| | | 20,903,922 | | Properties, Inc. | 153,845 | 2,475,366 |
| INDUSTRIAL REITs — 5.7% | | | | Kimco Realty Corp. | 2,315,103 | 36,208,211 |
| AMB Property Corp. | 926,800 | 25,246,032 | | Macerich Co. (The) | 428,089 | 16,400,090 |
| DCT Industrial Trust, Inc. | 2,475,777 | 12,948,314 | | Pennsylvania Real Estate | | |
| ProLogis | 1,162,447 | 15,344,300 | | Investment Trust | 37,100 | 462,637 |
| | | 53,538,646 | | Regency Centers Corp. | 617,600 | 23,141,472 |
| OFFICE REITs — 16.5% | | | | Simon Property Group, Inc. | 1,042,974 | 87,505,519 |
| Alexandria Real Estate | | | | Tanger Factory | | |
| Equities, Inc. | 270,600 | 18,292,560 | | Outlet Centers | 85,428 | 3,687,072 |
| BioMed Realty Trust, Inc. | 623,785 | 10,317,404 | | Taubman Centers, Inc. | 45,700 | 1,824,344 |
| Boston Properties, Inc. | 672,269 | 50,715,974 | | Weingarten Realty Investors | 590,263 | 12,726,070 |
| Corporate Office | | | | | | 223,590,015 |
| Properties Trust | 313,579 | 12,583,925 | | SPECIALIZED REITs — 26.0% | | |
| Digital Realty Trust, Inc. | 448,550 | 24,311,410 | | Chesapeake Lodging Trust(1) | 220,060 | 4,284,568 |
| HRPT Properties Trust | 1,445,203 | 11,243,679 | | HCP, Inc. | 913,498 | 30,145,434 |
| Mack-Cali Realty Corp. | 67,000 | 2,361,750 | | Health Care REIT, Inc. | 531,034 | 24,018,668 |
| SL Green Realty Corp. | 428,818 | 24,558,407 | | Hersha Hospitality Trust | 2,194,186 | 11,365,884 |
| | | 154,385,109 | | Host Hotels & Resorts, Inc. | 2,968,662 | 43,490,898 |
| REAL ESTATE OPERATING COMPANIES — 1.0% | | LaSalle Hotel Properties | 357,420 | 8,327,886 |
| Forest City Enterprises, Inc., | | | | Nationwide Health | | |
| Class A(1) | 669,378 | 9,645,737 | | Properties, Inc. | 195,900 | 6,885,885 |
| REAL ESTATE SERVICES — 0.8% | | | Omega Healthcare | | |
| CB Richard Ellis Group, Inc., | | | | Investors, Inc. | 593,100 | 11,559,519 |
| Class A(1) | 458,500 | 7,267,225 | | Pebblebrook Hotel Trust(1) | 215,899 | 4,540,356 |
| | | | | Public Storage | 634,489 | 58,366,643 |
12
| | | | |
| Real Estate | | | | |
| |
| | Shares | Value | | Notes to Schedule of Investments |
| Sovran Self Storage, Inc. | 54,200 | $ 1,889,412 | | REIT = Real Estate Investment Trust |
| U-Store-It Trust | 390,853 | 2,814,142 | | (1) Non-income producing. |
| Ventas, Inc. | 750,861 | 35,650,880 | | |
| | | 243,340,175 | | Industry classifications are unaudited. |
| TOTAL INVESTMENT | | | | |
| SECURITIES — 99.6% | | | | |
| (Cost $637,545,288) | | 931,546,283 | | |
| | | | | See Notes to Financial Statements. |
| OTHER ASSETS | | | | |
| AND LIABILITIES — 0.4% | | 3,580,033 | | |
| TOTAL NET ASSETS — 100.0% | | $935,126,316 | | |
13
|
| Statement of Assets and Liabilities |
| |
| MARCH 31, 2010 | |
| Assets | |
| Investment securities, at value (cost of $637,545,288) | $931,546,283 |
| Receivable for investments sold | 13,977,908 |
| Receivable for capital shares sold | 1,242,868 |
| Dividends and interest receivable | 2,701,145 |
| | 949,468,204 |
| | |
| Liabilities | |
| Disbursements in excess of demand deposit cash | 1,592,184 |
| Payable for investments purchased | 9,771,224 |
| Payable for capital shares redeemed | 2,082,199 |
| Accrued management fees | 866,376 |
| Distribution fees payable | 642 |
| Service fees (and distribution fees — A Class and R Class) payable | 29,263 |
| | 14,341,888 |
| | |
| Net Assets | $935,126,316 |
| |
| |
| See Notes to Financial Statements. | |
14
| |
| MARCH 31, 2010 | |
| Net Assets Consist of: | |
| Capital (par value and paid-in surplus) | $1,442,066,445 |
| Undistributed net investment income | 959,281 |
| Accumulated net realized loss on investment and foreign currency transactions | (801,901,252) |
| Net unrealized appreciation on investments and translation of assets and liabilities in foreign currencies | 294,001,842 |
| | $ 935,126,316 |
| | |
| Investor Class, $0.01 Par Value | |
| Net assets | $565,462,804 |
| Shares outstanding | 35,807,842 |
| Net asset value per share | $15.79 |
| | |
| Institutional Class, $0.01 Par Value | |
| Net assets | $230,108,737 |
| Shares outstanding | 14,551,395 |
| Net asset value per share | $15.81 |
| | |
| A Class, $0.01 Par Value | |
| Net assets | $138,037,082 |
| Shares outstanding | 8,728,431 |
| Net asset value per share | $15.81 |
| Maximum offering price (net asset value divided by 0.9425) | $16.77 |
| | |
| B Class, $0.01 Par Value | |
| Net assets | $91,138 |
| Shares outstanding | 5,790 |
| Net asset value per share | $15.74 |
| | |
| C Class, $0.01 Par Value | |
| Net assets | $982,741 |
| Shares outstanding | 62,378 |
| Net asset value per share | $15.75 |
| |
| R Class, $0.01 Par Value | |
| Net assets | $443,814 |
| Shares outstanding | 28,127 |
| Net asset value per share | $15.78 |
| |
| |
| See Notes to Financial Statements. | |
15
| |
| YEAR ENDED MARCH 31, 2010 | |
| Investment Income (Loss) | |
| Income: | |
| Dividends (including $173,680 from affiliates and net of foreign taxes withheld of $77,012) | $ 27,226,603 |
| Interest | 156,529 |
| | 27,383,132 |
| | |
| Expenses: | |
| Management fees | 8,942,602 |
| Distribution fees: | |
| B Class | 452 |
| C Class | 5,109 |
| Service fees: | |
| B Class | 151 |
| C Class | 1,703 |
| Distribution and service fees: | |
| A Class | 306,708 |
| R Class | 1,391 |
| Directors’ fees and expenses | 33,310 |
| Other expenses | 85 |
| | 9,291,511 |
| | |
| Net investment income (loss) | 18,091,621 |
| | |
| Realized and Unrealized Gain (Loss) | |
| Net realized gain (loss) on investment and foreign currency transactions | |
| (including $(715,497) from affiliates) | 47,877,830 |
| | |
| Change in net unrealized appreciation (depreciation) on investments | |
| and translation of assets and liabilities in foreign currencies | 476,236,140 |
| | |
| Net realized and unrealized gain (loss) | 524,113,970 |
| | |
| Net Increase (Decrease) in Net Assets Resulting from Operations | $542,205,591 |
| |
| |
| See Notes to Financial Statements. | |
16
|
| Statement of Changes in Net Assets |
| | |
| YEARS ENDED MARCH 31, 2010 AND MARCH 31, 2009 | | |
| Increase (Decrease) in Net Assets | 2010 | 2009 |
| Operations | | |
| Net investment income (loss) | $ 18,091,621 | $ 29,937,040 |
| Net realized gain (loss) | 47,877,830 | (709,628,436) |
| Change in net unrealized appreciation (depreciation) | 476,236,140 | (201,518,566) |
| Net increase (decrease) in net assets resulting from operations | 542,205,591 | (881,209,962) |
| | | |
| Distributions to Shareholders | | |
| From net investment income: | | |
| Investor Class | (12,367,077) | (18,036,728) |
| Institutional Class | (4,550,792) | (5,022,497) |
| A Class | (2,618,436) | (4,021,393) |
| B Class | (820) | (935) |
| C Class | (8,551) | (8,260) |
| R Class | (5,149) | (3,361) |
| Decrease in net assets from distributions | (19,550,825) | (27,093,174) |
| | | |
| Capital Share Transactions | | |
| Net increase (decrease) in net assets from capital share transactions | (138,672,672) | 140,914,237 |
| | | |
| Net increase (decrease) in net assets | 383,982,094 | (767,388,899) |
| | | |
| Net Assets | | |
| Beginning of period | 551,144,222 | 1,318,533,121 |
| End of period | $ 935,126,316 | $ 551,144,222 |
| | | |
| Undistributed net investment income | $959,281 | $2,631,492 |
| |
| |
| See Notes to Financial Statements. | | |
17
|
| Notes to Financial Statements |
MARCH 31, 2010
1. Organization and Summary of Significant Accounting Policies
Organization — American Century Capital Portfolios, Inc. (the corporation) is registered under the Investment Company Act of 1940 (the 1940 Act) as an open-end management investment company. Real Estate Fund (the fund) is one fund in a series issued by the corporation. The fund is nondiversified under the 1940 Act. The fund’s investment objective is to seek high total investment return through a combination of capital appreciation and current income. The fund pursues its objective by investing primarily in securities issued by real estate investment trusts and in the securities of companies which are principally engaged in the real estate industry. The following is a summary of the fund’s significant accounting policies.
Multiple Class — The fund is authorized to issue the Investor Class, the Institutional Class, the A Class, the B Class, the C Class and the R Class. The A Class may incur an initial sales charge. The A Class, B Class and C Class may be subject to a contingent deferred sales charge. The share classes differ principally in their respective distribution and shareholder servicing expenses and arrangements. All shares of the fund represent an equal pro rata interest in the net assets of the class to which such shares belong, and have identical voting, dividend, liquidation and other rights and the same terms and conditions, except for class specific expenses and exclusive rights to vote on matters affecting only individual classes. Income, non-class specific expenses, and realized and unrealized capital gains and losses of the fun d are allocated to each class of shares based on their relative net assets.
Security Valuations — Securities traded primarily on a principal securities exchange are valued at the last reported sales price, or at the mean of the latest bid and asked prices where no last sales price is available. Depending on local convention or regulation, securities traded over-the-counter are valued at the mean of the latest bid and asked prices, the last sales price, or the official close price. Investments in open-end management investment companies are valued at the reported net asset value. Debt securities not traded on a principal securities exchange are valued through a commercial pricing service or at the mean of the most recent bid and asked prices. Discount notes may be valued through a commercial pricing service or at amortized cost, which approximates fair value. Securities traded on foreign securities ex changes and over-the-counter markets are normally completed before the close of business on days that the New York Stock Exchange (the Exchange) is open and may also take place on days when the Exchange is not open. If an event occurs after the value of a security was established but before the net asset value per share was determined that was likely to materially change the net asset value, that security would be valued as determined in accordance with procedures adopted by the Board of Directors. If the fund determines that the market price of a portfolio security is not readily available, or that the valuation methods mentioned above do not reflect the security’s fair value, such security is valued as determined by the Board of Directors or its designee, in accordance with procedures adopted by the Board of Directors, if such determination would materially impact a fund’s net asset value. Certain other circumstances may cause the fund to use alternative procedures to value a security such as a s ecurity has been declared in default; trading in a security has been halted during the trading day; or there is a foreign market holiday and no trading will commence.
Security Transactions — For financial reporting purposes, security transactions are accounted for as of the trade date. Net realized gains and losses are determined on the identified cost basis, which is also used for federal income tax purposes.
Investment Income — Dividend income less foreign taxes withheld, if any, is recorded as of the ex-dividend date. Distributions received on securities that represent a return of capital or capital gain are recorded as a reduction of cost of investments and/or as a realized gain. The fund estimates the components of distributions received that may be considered nontaxable distributions or capital gain distributions for income tax purposes. Interest income is recorded on the accrual basis and includes accretion of discounts and amortization of premiums.
18
Foreign Currency Translations — All assets and liabilities initially expressed in foreign currencies are translated into U.S. dollars at prevailing exchange rates at period end. The fund may enter into spot foreign currency exchange contracts to facilitate transactions denominated in a foreign currency. Purchases and sales of investment securities, dividend and interest income, spot foreign currency exchange contracts, and certain expenses are translated at the rates of exchange prevailing on the respective dates of such transactions. For assets and liabilities, other than investments in securities, net realized and unrealized gains and losses from foreign currency translations arise from changes in currency exchange rates.
Net realized and unrealized foreign currency exchange gains or losses occurring during the holding period of investment securities are a component of net realized gain (loss) on investment transactions and net unrealized appreciation (depreciation) on investments, respectively. Certain countries may impose taxes on the contract amount of purchases and sales of foreign currency contracts in their currency. The fund records the foreign tax expense, if any, as a reduction to the net realized gain (loss) on foreign currency transactions.
When-Issued — The fund may engage in securities transactions on a when-issued basis. Under these arrangements, the securities’ prices and yields are fixed on the date of the commitment, but payment and delivery are scheduled for a future date. During this period, securities are subject to market fluctuations. The fund will segregate cash, cash equivalents or other appropriate liquid securities on its records in amounts sufficient to meet the purchase price.
Repurchase Agreements — The fund may enter into repurchase agreements with institutions that American Century Investment Management, Inc. (ACIM) (the investment advisor) has determined are creditworthy pursuant to criteria adopted by the Board of Directors. Each repurchase agreement is recorded at cost. The fund requires that the collateral, represented by securities, received in a repurchase transaction be transferred to the custodian in a manner sufficient to enable the fund to obtain those securities in the event of a default under the repurchase agreement. ACIM monitors, on a daily basis, the securities transferred to ensure the value, including accrued interest, of the securities under each repurchase agreement is equal to or greater than amounts owed to the fund under each repurchase agreement.
Joint Trading Account — Pursuant to an Exemptive Order issued by the Securities and Exchange Commission, the fund, along with certain other funds in the American Century Investments family of funds, may transfer uninvested cash balances into a joint trading account. These balances are invested in one or more repurchase agreements that are collateralized by U.S. Treasury or Agency obligations.
Income Tax Status — It is the fund’s policy to distribute substantially all net investment income and net realized gains to shareholders and to otherwise qualify as a regulated investment company under provisions of the Internal Revenue Code. The fund is no longer subject to examination by tax authorities for years prior to 2007. At this time, management believes there are no uncertain tax positions which, based on their technical merit, would not be sustained upon examination and for which it is reasonably possible that the total amounts of unrecognized tax benefits will significantly change in the next twelve months. Accordingly, no provision has been made for federal or state income taxes.
Distributions to Shareholders — Distributions to shareholders are recorded on the ex-dividend date. Distributions from net investment income are declared and paid quarterly. Distributions from net realized gains, if any, are generally declared and paid annually.
Indemnifications — Under the corporation’s organizational documents, its officers and directors are indemnified against certain liabilities arising out of the performance of their duties to the fund. In addition, in the normal course of business, the fund enters into contracts that provide general indemnifications. The maximum exposure under these arrangements is unknown as this would involve future claims that may be made against a fund. The risk of material loss from such claims is considered by management to be remote.
19
Use of Estimates — The financial statements are prepared in conformity with accounting principles generally accepted in the United States of America, which may require management to make certain estimates and assumptions at the date of the financial statements. Actual results could differ from these estimates.
Subsequent Events — In preparing the financial statements, management evaluated the impact of events or transactions occurring through the date the financial statements were issued that would merit recognition or disclosure.
2. Fees and Transactions with Related Parties
Management Fees — The corporation has entered into a Management Agreement with ACIM, under which ACIM provides the fund with investment advisory and management services in exchange for a single, unified management fee (the fee) per class. The Agreement provides that all expenses of managing and operating the fund, except brokerage expenses, taxes, interest, fees and expenses of the independent directors (including legal counsel fees), and extraordinary expenses, will be paid by ACIM. The fee is computed and accrued daily based on the daily net assets of the specific class of shares of the fund and paid monthly in arrears. For funds with a stepped fee schedule, the rate of the fee is determined by applying a fee rate calculation formula. This formula takes into account the fund’s assets as well as certain assets, if a ny, of other clients of the investment advisor outside the American Century Investments family of funds (such as subadvised funds and separate accounts) that have very similar investment teams and investment strategies (strategy assets). The annual management fee schedule for the fund ranges from 1.05% to 1.20% for the Investor Class, A Class, B Class, C Class and R Class. The Institutional Class is 0.20% less at each point within the range. The effective annual management fee for each class of the fund for the year ended March 31, 2010 was 0.96% for the Institutional Class and 1.16% for the Investor Class, A Class, B Class, C Class and R Class.
Distribution and Service Fees — The Board of Directors has adopted a separate Master Distribution and Individual Shareholder Services Plan for each of the A Class, B Class, C Class and R Class (collectively the plans), pursuant to Rule 12b-1 of the 1940 Act. The plans provide that the A Class will pay American Century Investment Services, Inc. (ACIS) an annual distribution and service fee of 0.25%. The plans provide that the B Class and the C Class will each pay ACIS an annual distribution fee of 0.75% and service fee of 0.25%. The plans provide that the R Class will pay ACIS an annual distribution and service fee of 0.50%. The fees are computed and accrued daily based on each class’s daily net assets and paid monthly in arrears. The fees are used to pay financial intermediaries for distribution and individual shareh older services. Fees incurred under the plan during the year ended March 31, 2010, are detailed in the Statement of Operations.
Related Parties — Certain officers and directors of the corporation are also officers and/or directors of American Century Companies, Inc. (ACC), the parent of the corporation’s investment advisor, ACIM, the distributor of the corporation, ACIS, and the corporation’s transfer agent, American Century Services, LLC.
The fund is eligible to invest in a money market fund for temporary purposes, which is managed by J.P. Morgan Investment Management, Inc. (JPMIM). The fund has a Mutual Funds Services Agreement with J.P. Morgan Investor Services Co. (JPMIS) and a securities lending agreement with JPMorgan Chase Bank (JPMCB). JPMCB is a custodian of the fund. JPMIM, JPMIS and JPMCB are wholly owned subsidiaries of JPMorgan Chase & Co. (JPM). JPM is an equity investor in ACC.
20
3. Investment Transactions
Purchases and sales of investment securities, excluding short-term investments, for the year ended March 31, 2010, were $1,862,408,322 and $1,988,700,392, respectively.
| | | | |
| 4. Capital Share Transactions | | | | |
| |
| Transactions in shares of the fund were as follows: | | |
| | Year ended March 31, 2010 | Year ended March 31, 2009 |
| | Shares | Amount | Shares | Amount |
| Investor Class/Shares Authorized | 125,000,000 | | 125,000,000 | |
| Sold | 13,756,354 | $ 163,922,813 | 23,041,568 | $ 344,222,905 |
| Issued in reinvestment of distributions | 882,720 | 10,795,798 | 1,295,267 | 16,120,892 |
| Redeemed | (25,186,666) | (300,987,364) | (17,852,701) | (265,309,245) |
| | (10,547,592) | (126,268,753) | 6,484,134 | 95,034,552 |
| Institutional Class/Shares Authorized | 50,000,000 | | 50,000,000 | |
| Sold | 4,434,279 | 53,898,381 | 6,476,609 | 89,803,524 |
| Issued in reinvestment of distributions | 290,226 | 3,669,953 | 348,202 | 4,415,072 |
| Redeemed | (3,562,186) | (42,977,266) | (2,694,016) | (38,510,197) |
| | 1,162,319 | 14,591,068 | 4,130,795 | 55,708,399 |
| A Class/Shares Authorized | 50,000,000 | | 50,000,000 | |
| Sold | 3,722,369 | 45,104,605 | 5,175,979 | 80,644,085 |
| Issued in reinvestment of distributions | 208,901 | 2,564,343 | 323,244 | 3,929,378 |
| Redeemed | (6,031,790) | (75,038,635) | (6,356,365) | (95,269,021) |
| | (2,100,520) | (27,369,687) | (857,142) | (10,695,558) |
| B Class/Shares Authorized | 10,000,000 | | 20,000,000 | |
| Sold | 2,736 | 34,074 | 4,472 | 58,511 |
| Issued in reinvestment of distributions | 70 | 811 | 83 | 935 |
| Redeemed | (2,216) | (24,955) | (868) | (10,981) |
| | 590 | 9,930 | 3,687 | 48,465 |
| C Class/Shares Authorized | 10,000,000 | | 20,000,000 | |
| Sold | 51,478 | 594,273 | 44,305 | 659,246 |
| Issued in reinvestment of distributions | 621 | 7,537 | 624 | 6,903 |
| Redeemed | (32,603) | (385,093) | (4,927) | (68,209) |
| | 19,496 | 216,717 | 40,002 | 597,940 |
| R Class/Shares Authorized | 10,000,000 | | 20,000,000 | |
| Sold | 21,462 | 271,578 | 16,579 | 232,799 |
| Issued in reinvestment of distributions | 401 | 5,031 | 287 | 3,164 |
| Redeemed | (10,050) | (128,556) | (1,735) | (15,524) |
| | 11,813 | 148,053 | 15,131 | 220,439 |
| Net increase (decrease) | (11,453,894) | $(138,672,672) | 9,816,607 | $ 140,914,237 |
21
5. Affiliated Company Transactions
If a fund’s holding represents ownership of 5% or more of the voting securities of a company, the company is affiliated as defined in the 1940 Act. A summary of transactions for each company which is or was an affiliate at or during the year ended March 31, 2010, follows:
| | | | | | | |
| March 31, 2009 | | | | | March 31, 2010 |
| | Share | Purchases | Sales | Realized | Dividend | Share | Market |
| Company | Balance | Cost | Cost | Gain (Loss) | Income | Balance | Value |
| Parkway Properties, Inc.(1) | — | $13,367,936 | $13,367,936 | ($715,497) | $173,680 | — | —(1) |
| (1) Company not an affiliate at March 31, 2010. | | | | | |
6. Fair Value Measurements
The fund’s securities valuation process is based on several considerations and may use multiple inputs to determine the fair value of the positions held by the fund. In conformity with accounting principles generally accepted in the United States of America, the inputs used to determine a valuation are classified into three broad levels as follows:
• Level 1 valuation inputs consist of unadjusted quoted prices in an active market for identical securities;
• Level 2 valuation inputs consist of significant direct or indirect observable market data (including quoted prices for similar securities, evaluations of subsequent market events, interest rates, prepayment speeds, credit risk, etc.); or
• Level 3 valuation inputs consist of significant unobservable inputs (including a fund’s own assumptions).
The level classification is based on the lowest level input that is significant to the fair valuation measurement. The valuation inputs are not an indication of the risks associated with investing in these securities or other financial instruments.
The following is a summary of the valuation inputs used to determine the fair value of the fund’s securities as of March 31, 2010. The Schedule of Investments provides additional details on the fund’s portfolio holdings.
| | | |
| | Level 1 | Level 2 | Level 3 |
| Investment Securities | | | |
| Total Value of Investment Securities | $928,638,110 | $2,908,173 | — |
7. Risk Factors
The fund concentrates its investments in a narrow segment of the total market. Because of this, the fund is subject to certain additional risks as compared to investing in a more diversified portfolio of investments. The fund may be subject to certain risks similar to those associated with direct investment in real estate including but not limited to: local or regional economic conditions, changes in zoning laws, changes in property values, property tax increases, overbuilding, increased competition, environmental contamination, natural disasters, and interest rate risk.
22
8. Interfund Lending
The fund, along with certain other funds in the American Century Investments family of funds, may participate in an interfund lending program, pursuant to an Exemptive Order issued by the Securities and Exchange Commission (SEC). This program provides an alternative credit facility allowing the fund to borrow from or lend to other funds in the American Century Investments family of funds that permit such transactions. Interfund lending transactions are subject to each fund’s investment policies and borrowing and lending limits. The interfund loan rate earned/paid on interfund lending transactions is determined daily based on the average of certain current market rates. Interfund lending transactions normally extend only overnight, but can have a maximum duration of seven days. The program is subject to annual approval by the Board of Directors. During the year ended March 31, 2010, the fund did not utilize th e program.
9. Federal Tax Information
The tax character of distributions paid during the years ended March 31, 2010 and March 31, 2009 were as follows:
| | |
| | 2010 | 2009 |
| Distributions Paid From | | |
| Ordinary income | $19,550,825 | $27,025,737 |
| Long-term capital gains | — | $67,437 |
The book-basis character of distributions made during the year from net investment income or net realized gains may differ from their ultimate characterization for federal income tax purposes. These differences reflect the differing character of certain income items and net realized gains and losses for financial statement and tax purposes, and may result in reclassification among certain capital accounts on the financial statements.
As of March 31, 2010, the federal tax cost of investments and the components of distributable earnings on a tax-basis were as follows:
| | |
| Federal tax cost of investments | $762,350,099 |
| Gross tax appreciation of investments | $173,323,057 |
| Gross tax depreciation of investments | (4,126,873) |
| Net tax appreciation (depreciation) of investments | $169,196,184 |
| Net tax appreciation (depreciation) on derivatives and translation of assets | |
| and liabilities in foreign currencies | $ 847 |
| Net tax appreciation (depreciation) | $169,197,031 |
| Undistributed ordinary income | $959,281 |
| Accumulated capital losses | $(676,594,036) |
| Capital loss deferral | $(502,405) |
The difference between book-basis and tax-basis cost and unrealized appreciation (depreciation) is attributable primarily to the tax deferral of losses on wash sales.
The accumulated capital losses listed above represent net capital loss carryovers that may be used to offset future realized capital gains for federal income tax purposes. Future capital loss carryover utilization in any given year may be subject to Internal Revenue Code limitations. The capital loss carryovers of $(206,620,499) and $(469,973,537) expire in 2017 and 2018, respectively.
The capital loss deferrals listed above represent net capital losses incurred in the five-month period ended March 31, 2010. The fund has elected to treat such losses as having been incurred in the following fiscal year for federal income tax purposes.
23
10. Recently Issued Accounting Standards
In March 2008, the Financial Accounting Standards Board (FASB) issued Accounting Standards Codification (ASC) Section 815-10 (formerly Statement of Financial Accounting Standards No. 161, “Disclosures about Derivative Instruments and Hedging Activities —an amendment of FASB Statement No. 133”). ASC Section 815-10 is effective for interim periods beginning after November 15, 2008 and has been adopted by the fund. ASC Section 815-10 amends and expands disclosures about derivative instruments and hedging activities. ASC Section 815-10 requires qualitative disclosures about the objectives and strategies of derivative instruments, quantitative disclosures about the fair value amounts of and gains and losses on derivative instruments, and disclosures of credit-risk-related contingent features in hedging activities.
11. Corporate Event
As part of a long-standing estate and business succession plan established by ACC Co-Chairman James E. Stowers, Jr., the founder of American Century Investments, ACC Co-Chairman Richard W. Brown succeeded Mr. Stowers as trustee of a trust that holds a greater-than-25% voting interest in ACC, the parent corporation of the fund’s advisor. Under the 1940 Act, this is presumed to represent control of ACC even though it is less than a majority interest. The change of trustee may technically be considered a “change of control” of ACC and therefore also a change of control of the fund’s advisor even though there has been no change to their management and none is anticipated. The “change of control” resulted in the assignment of the fund’s investment advisory agreement. Under the 1940 Act, an assignment automatically terminated such agreement, making the approval of a new agreement nec essary.
On February 18, 2010, the Board of Directors approved interim investment advisory agreements under which each fund will be managed until new agreements are approved by fund shareholders. On March 29, 2010, the Board of Directors approved new investment advisory agreements. The interim agreements and the new agreements are substantially identical to the terminated agreements (with the exception of different effective and termination dates) and will not result in changes in the management of American Century Investments, the funds, their investment objectives, fees or services provided. The new agreements have been submitted to shareholders for approval at a Special Meeting of Shareholders to be held on June 16, 2010.
12. Other Tax Information (Unaudited)
The following information is provided pursuant to provisions of the Internal Revenue Code.
The fund hereby designates up to the maximum amount allowable as qualified dividend income for the fiscal year ended March 31, 2010.
For corporate taxpayers, the fund hereby designates $38,667, or up to the maximum amount allowable, of ordinary income distributions paid during the fiscal year ended March 31, 2010 as qualified for the corporate dividends received deduction.
24
| | | | | | |
| Real Estate | | | | | |
| |
| Investor Class | | | | | |
| For a Share Outstanding Throughout the Years Ended March 31 | | | |
| | | 2010 | 2009 | 2008 | 2007 | 2006 |
| Per-Share Data | | | | | |
| Net Asset Value, Beginning of Period | $7.80 | $21.67 | $31.37 | $29.00 | $23.24 |
| Income From Investment Operations | | | | | |
| Net Investment Income (Loss)(1) | 0.28 | 0.46 | 0.43 | 0.53 | 0.53 |
| Net Realized and Unrealized Gain (Loss) | 8.01 | (13.91) | (5.53) | 5.70 | 8.44 |
| Total From Investment Operations | 8.29 | (13.45) | (5.10) | 6.23 | 8.97 |
| Distributions | | | | | |
| From Net Investment Income | (0.30) | (0.42) | (0.51) | (0.49) | (0.49) |
| From Net Realized Gains | — | — | (4.09) | (3.37) | (2.72) |
| Total Distributions | (0.30) | (0.42) | (4.60) | (3.86) | (3.21) |
| Net Asset Value, End of Period | $15.79 | $7.80 | $21.67 | $31.37 | $29.00 |
| |
| Total Return(2) | 107.30% | (62.80)% | (16.60)% | 22.02% | 40.65% |
| | | | | | |
| Ratios/Supplemental Data | | | | | |
| Ratio of Operating Expenses | | | | | |
| to Average Net Assets | 1.16% | 1.15% | 1.14% | 1.13% | 1.15% |
| Ratio of Net Investment Income (Loss) | | | | | |
| to Average Net Assets | 2.24% | 2.87% | 1.60% | 1.72% | 2.00% |
| Portfolio Turnover Rate | 236% | 109% | 153% | 197% | 177% |
| Net Assets, End of Period (in thousands) | $565,463 | $361,510 | $864,011 | $1,590,428 | $986,526 |
| (1) | Computed using average shares outstanding throughout the period. | | | | |
| (2) | Total return assumes reinvestment of net investment income and capital gains distributions, if any. Total returns for periods less than one year |
| | are not annualized. Total returns are calculated based on the net asset value of the last business day. The total return of the classes may not |
| | precisely reflect the class expense differences because of the impact of calculating the net asset values to two decimal places. If net asset |
| | values were calculated to three decimal places, the total return differences would more closely reflect the class expense differences. The |
| | calculation of net asset values to two decimal places is made in accordance with SEC guidelines and does not result in any gain or loss of value |
| | between one class and another. | | | | | |
See Notes to Financial Statements.
25
| | | | | | |
| Real Estate | | | | | |
| |
| Institutional Class | | | | | |
| For a Share Outstanding Throughout the Years Ended March 31 | | | |
| | | 2010 | 2009 | 2008 | 2007 | 2006 |
| Per-Share Data | | | | | |
| Net Asset Value, Beginning of Period | $7.81 | $21.71 | $31.41 | $29.03 | $23.25 |
| Income From Investment Operations | | | | | |
| Net Investment Income (Loss)(1) | 0.30 | 0.50 | 0.48 | 0.59 | 0.59 |
| Net Realized and Unrealized Gain (Loss) | 8.03 | (13.94) | (5.54) | 5.71 | 8.45 |
| Total From Investment Operations | 8.33 | (13.44) | (5.06) | 6.30 | 9.04 |
| Distributions | | | | | |
| From Net Investment Income | (0.33) | (0.46) | (0.55) | (0.55) | (0.54) |
| From Net Realized Gains | — | — | (4.09) | (3.37) | (2.72) |
| Total Distributions | (0.33) | (0.46) | (4.64) | (3.92) | (3.26) |
| Net Asset Value, End of Period | $15.81 | $7.81 | $21.71 | $31.41 | $29.03 |
| |
| Total Return(2) | 107.71% | (62.73)% | (16.44)% | 22.27% | 40.99% |
| | | | | | |
| Ratios/Supplemental Data | | | | | |
| Ratio of Operating Expenses | | | | | |
| to Average Net Assets | 0.96% | 0.95% | 0.94% | 0.93% | 0.95% |
| Ratio of Net Investment Income (Loss) | | | | | |
| to Average Net Assets | 2.44% | 3.07% | 1.80% | 1.92% | 2.20% |
| Portfolio Turnover Rate | 236% | 109% | 153% | 197% | 177% |
| Net Assets, End of Period (in thousands) | $230,109 | $104,565 | $200,982 | $379,044 | $242,745 |
| (1) | Computed using average shares outstanding throughout the period. | | | | |
| (2) | Total return assumes reinvestment of net investment income and capital gains distributions, if any. Total returns for periods less than one year |
| | are not annualized. Total returns are calculated based on the net asset value of the last business day. The total return of the classes may not |
| | precisely reflect the class expense differences because of the impact of calculating the net asset values to two decimal places. If net asset |
| | values were calculated to three decimal places, the total return differences would more closely reflect the class expense differences. The |
| | calculation of net asset values to two decimal places is made in accordance with SEC guidelines and does not result in any gain or loss of value |
| | between one class and another. | | | | | |
See Notes to Financial Statements.
26
| | | | | | |
| Real Estate | | | | | |
| |
| A Class(1) | | | | | |
| For a Share Outstanding Throughout the Years Ended March 31 | | | |
| | | 2010 | 2009 | 2008 | 2007 | 2006 |
| Per-Share Data | | | | | |
| Net Asset Value, Beginning of Period | $7.81 | $21.69 | $31.41 | $29.04 | $23.26 |
| Income From Investment Operations | | | | | |
| Net Investment Income (Loss)(2) | 0.24 | 0.42 | 0.36 | 0.45 | 0.46 |
| Net Realized and Unrealized Gain (Loss) | 8.02 | (13.94) | (5.53) | 5.71 | 8.46 |
| Total From Investment Operations | 8.26 | (13.52) | (5.17) | 6.16 | 8.92 |
| Distributions | | | | | |
| From Net Investment Income | (0.26) | (0.36) | (0.46) | (0.42) | (0.42) |
| From Net Realized Gains | — | — | (4.09) | (3.37) | (2.72) |
| Total Distributions | (0.26) | (0.36) | (4.55) | (3.79) | (3.14) |
| Net Asset Value, End of Period | $15.81 | $7.81 | $21.69 | $31.41 | $29.04 |
| |
| Total Return(3) | 106.76% | (62.88)% | (16.84)% | 21.70% | 40.37% |
| | | | | | |
| Ratios/Supplemental Data | | | | | |
| Ratio of Operating Expenses | | | | | |
| to Average Net Assets | 1.41% | 1.40% | 1.39% | 1.38% | 1.40% |
| Ratio of Net Investment Income (Loss) | | | | | |
| to Average Net Assets | 1.99% | 2.62% | 1.35% | 1.47% | 1.75% |
| Portfolio Turnover Rate | 236% | 109% | 153% | 197% | 177% |
| Net Assets, End of Period (in thousands) | $138,037 | $84,568 | $253,419 | $488,277 | $331,329 |
| (1) | Prior to September 4, 2007, the A Class was referred to as the Advisor Class. | | | |
| (2) | Computed using average shares outstanding throughout the period. | | | | |
| (3) | Total return assumes reinvestment of net investment income and capital gains distributions, if any, and does not reflect applicable sales charges. |
| | Total returns for periods less than one year are not annualized. Total returns are calculated based on the net asset value of the last business day. |
| | The total return of the classes may not precisely reflect the class expense differences because of the impact of calculating the net asset values |
| | to two decimal places. If net asset values were calculated to three decimal places, the total return differences would more closely reflect the |
| | class expense differences. The calculation of net asset values to two decimal places is made in accordance with SEC guidelines and does not |
| | result in any gain or loss of value between one class and another. | | | | |
See Notes to Financial Statements.
27
| | | | |
| Real Estate | | | |
| |
| B Class | | | |
| For a Share Outstanding Throughout the Years Ended March 31 (except as noted) | | |
| | | 2010 | 2009 | 2008(1) |
| Per-Share Data | | | |
| Net Asset Value, Beginning of Period | $7.77 | $21.62 | $29.12 |
| Income From Investment Operations | | | |
| Net Investment Income (Loss)(2) | 0.16 | 0.37 | 0.14 |
| Net Realized and Unrealized Gain (Loss) | 7.97 | (13.93) | (3.42) |
| Total From Investment Operations | 8.13 | (13.56) | (3.28) |
| Distributions | | | |
| From Net Investment Income | (0.16) | (0.29) | (0.13) |
| From Net Realized Gains | — | — | (4.09) |
| Total Distributions | (0.16) | (0.29) | (4.22) |
| Net Asset Value, End of Period | $15.74 | $7.77 | $21.62 |
| |
| Total Return(3) | 105.35% | (63.17)% | (11.57)% |
| | | | |
| Ratios/Supplemental Data | | | |
| Ratio of Operating Expenses to Average Net Assets | 2.16% | 2.15% | 2.14%(4) |
| Ratio of Net Investment Income (Loss) to Average Net Assets | 1.24% | 1.87% | 1.17%(4) |
| Portfolio Turnover Rate | 236% | 109% | 153%(5) |
| Net Assets, End of Period (in thousands) | $91 | $40 | $33 |
| (1) | September 28, 2007 (commencement of sale) through March 31, 2008. | | | |
| (2) | Computed using average shares outstanding throughout the period. | | | |
| (3) | Total return assumes reinvestment of net investment income and capital gains distributions, if any, and does not reflect applicable sales charges. |
| | Total returns for periods less than one year are not annualized. Total returns are calculated based on the net asset value of the last business day. |
| | The total return of the classes may not precisely reflect the class expense differences because of the impact of calculating the net asset values |
| | to two decimal places. If net asset values were calculated to three decimal places, the total return differences would more closely reflect the |
| | class expense differences. The calculation of net asset values to two decimal places is made in accordance with SEC guidelines and does not |
| | result in any gain or loss of value between one class and another. | | | |
| (4) | Annualized. | | | |
| (5) | Portfolio turnover is calculated at the fund level. Percentage indicated was calculated for the year ended March 31, 2008. | |
See Notes to Financial Statements.
28
| | | | |
| Real Estate | | | |
| |
| C Class | | | |
| For a Share Outstanding Throughout the Years Ended March 31 (except as noted) | | |
| | | 2010 | 2009 | 2008(1) |
| Per-Share Data | | | |
| Net Asset Value, Beginning of Period | $7.78 | $21.62 | $29.12 |
| Income From Investment Operations | | | |
| Net Investment Income (Loss)(2) | 0.14 | 0.35 | 0.13 |
| Net Realized and Unrealized Gain (Loss) | 7.99 | (13.90) | (3.41) |
| Total From Investment Operations | 8.13 | (13.55) | (3.28) |
| Distributions | | | |
| From Net Investment Income | (0.16) | (0.29) | (0.13) |
| From Net Realized Gains | — | — | (4.09) |
| Total Distributions | (0.16) | (0.29) | (4.22) |
| Net Asset Value, End of Period | $15.75 | $7.78 | $21.62 |
| |
| Total Return(3) | 105.21% | (63.12)% | (11.57)% |
| | | | |
| Ratios/Supplemental Data | | | |
| Ratio of Operating Expenses to Average Net Assets | 2.16% | 2.15% | 2.14%(4) |
| Ratio of Net Investment Income (Loss) to Average Net Assets | 1.24% | 1.87% | 1.15%(4) |
| Portfolio Turnover Rate | 236% | 109% | 153%(5) |
| Net Assets, End of Period (in thousands) | $983 | $334 | $62 |
| (1) | September 28, 2007 (commencement of sale) through March 31, 2008. | | | |
| (2) | Computed using average shares outstanding throughout the period. | | | |
| (3) | Total return assumes reinvestment of net investment income and capital gains distributions, if any, and does not reflect applicable sales charges. |
| | Total returns for periods less than one year are not annualized. Total returns are calculated based on the net asset value of the last business day. |
| | The total return of the classes may not precisely reflect the class expense differences because of the impact of calculating the net asset values |
| | to two decimal places. If net asset values were calculated to three decimal places, the total return differences would more closely reflect the |
| | class expense differences. The calculation of net asset values to two decimal places is made in accordance with SEC guidelines and does not |
| | result in any gain or loss of value between one class and another. | | | |
| (4) | Annualized. | | | |
| (5) | Portfolio turnover is calculated at the fund level. Percentage indicated was calculated for the year ended March 31, 2008. | |
See Notes to Financial Statements.
29
| | | | |
| Real Estate | | | |
| |
| R Class | | | |
| For a Share Outstanding Throughout the Years Ended March 31 (except as noted) | | |
| | | 2010 | 2009 | 2008(1) |
| Per-Share Data | | | |
| Net Asset Value, Beginning of Period | $7.79 | $21.65 | $29.12 |
| Income From Investment Operations | | | |
| Net Investment Income (Loss)(2) | 0.21 | 0.44 | 0.19 |
| Net Realized and Unrealized Gain (Loss) | 8.01 | (13.96) | (3.41) |
| Total From Investment Operations | 8.22 | (13.52) | (3.22) |
| Distributions | | | |
| From Net Investment Income | (0.23) | (0.34) | (0.16) |
| From Net Realized Gains | — | — | (4.09) |
| Total Distributions | (0.23) | (0.34) | (4.25) |
| Net Asset Value, End of Period | $15.78 | $7.79 | $21.65 |
| |
| Total Return(3) | 106.38% | (62.98)% | (11.37)% |
| | | | |
| Ratios/Supplemental Data | | | |
| Ratio of Operating Expenses to Average Net Assets | 1.66% | 1.65% | 1.64%(4) |
| Ratio of Net Investment Income (Loss) to Average Net Assets | 1.74% | 2.37% | 1.65%(4) |
| Portfolio Turnover Rate | 236% | 109% | 153%(5) |
| Net Assets, End of Period (in thousands) | $444 | $127 | $26 |
| (1) | September 28, 2007 (commencement of sale) through March 31, 2008. | | | |
| (2) | Computed using average shares outstanding throughout the period. | | | |
| (3) | Total return assumes reinvestment of net investment income and capital gains distributions, if any. Total returns for periods less than one year |
| | are not annualized. Total returns are calculated based on the net asset value of the last business day. The total return of the classes may not |
| | precisely reflect the class expense differences because of the impact of calculating the net asset values to two decimal places. If net asset |
| | values were calculated to three decimal places, the total return differences would more closely reflect the class expense differences. The |
| | calculation of net asset values to two decimal places is made in accordance with SEC guidelines and does not result in any gain or loss of value |
| | between one class and another. | | | |
| (4) | Annualized. | | | |
| (5) | Portfolio turnover is calculated at the fund level. Percentage indicated was calculated for the year ended March 31, 2008. | |
See Notes to Financial Statements.
30
|
| Report of Independent Registered Public Accounting Firm |
The Board of Directors and Shareholders,
American Century Capital Portfolios, Inc.:
We have audited the accompanying statement of assets and liabilities, including the schedule of investments, of Real Estate Fund, one of the mutual funds constituting American Century Capital Portfolios, Inc. (the “Corporation”), as of March 31, 2010, and the related statement of operations for the year then ended, the statement of changes in net assets for each of the two years in the period then ended, and the financial highlights for each of the five years in the period then ended. These financial statements and financial highlights are the responsibility of the Corporation’s management. Our responsibility is to express an opinion on these financial statements and financial highlights based on our audits.
We conducted our audits in accordance with the standards of the Public Company Accounting Oversight Board (United States). Those standards require that we plan and perform the audit to obtain reasonable assurance about whether the financial statements and financial highlights are free of material misstatement. The Corporation is not required to have, nor were we engaged to perform, an audit of its internal control over financial reporting. Our audits included consideration of internal control over financial reporting as a basis for designing audit procedures that are appropriate in the circumstances, but not for the purpose of expressing an opinion on the effectiveness of the Corporation’s internal control over financial reporting. Accordingly, we express no such opinion. An audit also includes examining, on a test basis, evidence supporting the amounts and disclosures in the financial statements, assessing t he accounting principles used and significant estimates made by management, as well as evaluating the overall financial statement presentation. Our procedures included confirmation of securities owned as of March 31, 2010, by correspondence with the custodian and brokers; where replies were not received from brokers, we performed other auditing procedures. We believe that our audits provide a reasonable basis for our opinion.
In our opinion, the financial statements and financial highlights referred to above present fairly, in all material respects, the financial position of Real Estate Fund of American Century Capital Portfolios, Inc. as of March 31, 2010, the results of its operations for the year then ended, the changes in its net assets for each of the two years in the period then ended, and the financial highlights for each of the five years in the period then ended, in conformity with accounting principles generally accepted in the United States of America.
Deloitte & Touche LLP
Kansas City, Missouri
May 17, 2010
31
The Board of Directors
The individuals listed below serve as directors of the fund. Each director will continue to serve in this capacity until death, retirement, resignation or removal from office. The mandatory retirement age for directors who are not “interested persons,” as that term is defined in the Investment Company Act (independent directors), is 72. However, the mandatory retirement age may be extended or changed with the approval of the remaining independent directors.
Mr. Thomas is the only director who is an “interested person” because he currently serves as President and Chief Executive Officer of American Century Companies, Inc. (ACC), the parent company of American Century Investment Management, Inc. (ACIM) and American Century Global Investment Management, Inc. (ACGIM). ACIM and ACGIM are referred to collectively as the “advisors.”
The other directors (more than three-fourths of the total number) are independent; that is, they have never been employees, directors or officers of, and have no financial interest in, ACC or any of its wholly owned, direct or indirect, subsidiaries, including ACIM, ACGIM, American Century Investment Services, Inc. (ACIS) and American Century Services, LLC (ACS). The directors serve in this capacity for seven (in the case of Mr. Thomas, 15) registered investment companies in the American Century Investments family of funds.
The following presents additional information about the directors. The mailing address for each director is 4500 Main Street, Kansas City, Missouri 64111.
Independent Directors
Thomas A. Brown
Year of Birth: 1940
Position(s) with the Fund: Director
Length of Time Served: Since 1980
Principal Occupation(s) During the Past Five Years: Managing Member, Associated Investments,
LLC (real estate investment company); Brown Cascade Properties, LLC (real estate
investment company) (2001 to 2009)
Number of Funds in Fund Complex Overseen by Director: 63
Other Directorships Held by Director: None
Education/Other Professional Experience: BS in Mechanical Engineering, University of
Kansas; formerly, Chief Executive Officer, Associated Bearings Company; formerly,
Area Vice President, Applied Industrial Technologies (bearings and power
transmission company)
32
Andrea C. Hall
Year of Birth: 1945
Position(s) with the Fund: Director
Length of Time Served: Since 1997
Principal Occupation(s) During the Past Five Years: Retired as advisor to the President, Midwest
Research Institute (not-for-profit research organization) (June 2006)
Number of Funds in Fund Complex Overseen by Director: 63
Other Directorships Held by Director: None
Education/Other Professional Experience: BS in Biology, Florida State University; PhD in
Biology, Georgetown University; formerly, Senior Vice President and director of
Research Operations, Midwest Research Institute
James A. Olson
Year of Birth: 1942
Position(s) with the Fund: Director
Length of Time Served: Since 2007
Principal Occupation(s) During the Past Five Years: Member, Plaza Belmont LLC (private equity
fund manager); Chief Financial Officer, Plaza Belmont LLC (September 1999 to
September 2006)
Number of Funds in Fund Complex Overseen by Director: 63
Other Directorships Held by Director: Saia, Inc. and Entertainment Properties Trust
Education/Other Professional Experience: BS in Business Administration and MBA, St. Louis
University; CPA; 21 years of experience as a partner in the accounting firm of Ernst
& Young LLP
Donald H. Pratt
Year of Birth: 1937
Position(s) with the Fund: Director, Chairman of the Board
Length of Time Served: Since 1995
Principal Occupation(s) During the Past Five Years: Chairman and Chief Executive Officer,
Western Investments, Inc. (real estate company)
Number of Funds in Fund Complex Overseen by Director: 63
Other Directorships Held by Director: None
Education/Other Professional Experience: BS in Industrial Engineering, Wichita State
University; MBA, Harvard Business School; serves on the Board of Governors of
the Independent Directors Council and Investment Company Institute; formerly,
Chairman of the Board, Butler Manufacturing Company (metal buildings producer)
Gale E. Sayers
Year of Birth: 1943
Position(s) with the Fund: Director
Length of Time Served: Since 2000
Principal Occupation(s) During the Past Five Years: President, Chief Executive Officer and
Founder, Sayers40, Inc., (technology products and services provider)
Number of Funds in Fund Complex Overseen by Director: 63
Other Directorships Held by Director: None
Education/Other Professional Experience: BS in Physical Education and M.Ed. in Educational
Administration, University of Kansas; Recipient of the Ernst & Young Entrepreneur
of the Year Award; inducted into the Chicago Entrepreneurship Hall of Fame and
the National Football League Hall of Fame
33
M. Jeannine Strandjord
Year of Birth: 1945
Position(s) with the Fund: Director
Length of Time Served: Since 1994
Principal Occupation(s) During the Past Five Years: Retired, formerly, Senior Vice President,
Process Excellence, Sprint Corporation (telecommunications company)
(January 2005-September 2005)
Number of Funds in Fund Complex Overseen by Director: 63
Other Directorships Held by Director: DST Systems Inc., Euronet Worldwide Inc., Charming
Shoppes, Inc.
Education/Other Professional Experience: BS in Business Administration and Accounting,
University of Kansas; CPA; formerly, Senior Vice President of Financial Services and
Treasurer and Chief Financial Officer, Global Markets Group; Sprint Corporation;
formerly, with the accounting firm of Ernst and Whinney
John R. Whitten
Year of Birth: 1946
Position(s) with the Fund: Director
Length of Time Served: Since 2008
Principal Occupation(s) During the Past Five Years: Project Consultant, Celanese Corp.
(industrial chemical company)
Number of Funds in Fund Complex Overseen by Director: 63
Other Directorships Held by Director: Rudolph Technologies, Inc.
Professional Education/Experience: BS in Business Administration, Cleveland State
University; CPA; formerly, Chief Financial Officer and Treasurer, Applied Industrial
Technologies, Inc.; thirteen years of experience with accounting firm Deloitte &
Touche LLP
Interested Director
Jonathan S. Thomas
Year of Birth: 1963
Position(s) with the Fund: Director and President
Length of Time Served: Since 2007
Principal Occupation(s) During the Past Five Years: President and Chief Executive Officer,
ACC (March 2007 to present); Chief Administrative Officer, ACC (February 2006 to
February 2007); Executive Vice President, ACC (November 2005 to February 2007).
Also serves as: Chief Executive Officer and Manager, American Century Services,
LLC (ACS); Executive Vice President, American Century Investment Management
(ACIM) and American Century Global Investment Management (ACGIM); Director,
ACIM, ACGIM and other ACC subsidiaries; Global Chief Operating Officer and
Managing Director, Morgan Stanley (investment management) (March 2000 to
November 2005)
Number of Funds in Fund Complex Overseen by Director: 104
Other Directorships Held by Director: None
Education/Other Professional Experience: BA in Economics, University of Massachusetts;
MBA, Boston College; formerly held senior leadership roles with Fidelity
Investments, Boston Financial Services and Bank of America; serves on the Board of
Governors of the Investment Company Institute
34
Officers
The following table presents certain information about the executive officers of the fund. Each officer serves as an officer for each of the 15 investment companies in the American Century family of funds, unless otherwise noted. No officer is compensated for his or her service as an officer of the fund. The listed officers are interested persons of the fund and are appointed or re-appointed on an annual basis. The mailing address for each of the officers listed below is 4500 Main Street, Kansas City, Missouri 64111.
| | |
| Name | Offices with | |
| (Year of Birth) | the Fund | Principal Occupation During the Past Five Years |
| Jonathan Thomas | Director and | President and Chief Executive Officer, ACC (March 2007 to present); Chief |
| (1963) | President | Administrative Officer, ACC (February 2006 to March 2007); Executive |
| | since 2007 | Vice President, ACC (November 2005 to February 2007). Also serves as: |
| | | Chief Executive Officer and Manager, ACS; Executive Vice President, ACIM, |
| | | ACGIM; Director, ACIM, ACGIM and other ACC subsidiaries; Global Chief |
| | | Operating Officer and Managing Director, Morgan Stanley (March 2000 to |
| | | November 2005) |
| Barry Fink | Executive | Chief Operating Officer and Executive Vice President, ACC (September 2007 |
| (1955) | Vice President | to present); President, ACS (October 2007 to present); Managing Director, |
| | since 2007 | Morgan Stanley (2000 to 2007); Global General Counsel, Morgan Stanley |
| | | (2000 to 2006). Also serves as: Manager, ACS and Director, ACC and |
| | | certain ACC subsidiaries |
| Maryanne Roepke | Chief Compliance | Chief Compliance Officer, American Century funds, ACIM, ACGIM and |
| (1956) | Officer since 2006 | ACS (August 2006 to present); Assistant Treasurer, ACC (January 1995 to |
| | and Senior Vice | August 2006); and Treasurer and Chief Financial Officer, various American |
| | President | Century funds (July 2000 to August 2006). Also serves as: Senior Vice |
| | since 2000 | President, ACS |
| Charles | General Counsel | Attorney, ACC (February 1994 to present); Vice President, ACC (November |
| Etherington | since 2007 and | 2005 to present), General Counsel, ACC (March 2007 to present); Also |
| (1957) | Senior Vice | serves as General Counsel, ACIM, ACGIM, ACS, ACIS and other ACC |
| | President | subsidiaries; and Senior Vice President, ACIM, ACGIM and ACS |
| | since 2006 | |
| Robert Leach | Vice President, | Vice President, ACS (February 2000 to present); and Controller, various |
| (1966) | Treasurer and | American Century funds (1997 to September 2006) |
| | Chief Financial | |
| | Officer since 2006 | |
| David Reinmiller | Vice President | Attorney, ACC (January 1994 to present); Associate General Counsel, ACC |
| (1963) | since 2000 | (January 2001 to present); Chief Compliance Officer, American Century |
| | | funds, ACIM and ACGIM (January 2001 to February 2005). Also serves as |
| | | Vice President, ACIM, ACGIM and ACS |
| Ward Stauffer | Secretary | Attorney, ACC (June 2003 – Present) |
| (1960) | since 2005 | |
The SAI has additional information about the fund’s directors and is available without charge, upon request, by calling 1-800-345-2021.
35
|
| Board Approval of Management Agreements |
American Century Investment Management, Inc. (“ACIM” or the “Advisor”) currently serves as investment advisor to the Fund under an interim management agreement (the “Interim Management Agreement”) between the Advisor and the Fund approved by the Fund’s Board of Directors (the “Board”). The Advisor previously served as investment advisor to the Fund pursuant to a management agreement (the “Prior Management Agreement”) that terminated in accordance with its terms on February 16, 2010, as a result of a change of control of the Advisor’s parent company, American Century Companies, Inc. (“ACC”). The change in control occurred as the result of a change in the trustee of a trust created by James E. Stowers, Jr., the founder of American Century Investments, which holds shares representing a significant interest in ACC stock. Mr. Stowers previously serve d as the trustee of the trust. On February 16, 2010, Richard W. Brown, Co-Chairman of ACC with Mr. Stowers, became the trustee in accordance with the terms of the trust and Mr. Stowers’ long-standing estate and succession plan.
On February 18, 2010, the Board approved the Interim Management Agreement in accordance with Rule 15a-4 under the Investment Company Act to ensure continued management of the Fund by the Advisor after the termination of the Prior Management Agreement and until shareholder approval of a new management agreement (the “Proposed Management Agreement”) as required under the Act. The Board has approved the Proposed Management Agreement and has recommended its approval to shareholders. Fund shareholders are scheduled to consider approval of the Proposed Management Agreement at a meeting to be held on June 16, 2010.
The Interim Management Agreement and the Proposed Management Agreement are substantially identical to the Prior Management Agreement except for their effective dates and the termination provisions of the Interim Management Agreement. Under the Interim and Proposed Management Agreements, the Advisor will provide the same services to the Fund and receive the same compensation rate as under the Prior Management Agreement.
Basis for Board Approval of Interim Management Agreement
In considering the approval of the Interim Management Agreement, Rule 15a-4 requires the Board to approve the contract within ten business days of the termination of the prior agreement and to determine that the compensation to be received under the interim agreement is no greater than would have been received under the prior agreement. In connection with the approval, the Board noted that it oversees on a continuous basis and evaluates at its quarterly meetings, directly and through the committees of the Board, the nature and quality of significant services provided by the Advisor, the investment performance of the Fund, shareholder services, audit and compliance functions and a variety of other matters relating to the Fund’s operations.
In evaluating the Interim Management Agreement, the Board, assisted by the advice of its independent legal counsel, considered a number of factors in addition to those required by the rule with no one factor being determinative to its analysis. Among the factors considered by the Board were the circumstances and effect of the change of control, the fact that the Advisor will provide the same services and receive the same compensation rate as
36
under the Prior Management Agreements, and that the change of control did not result in a change of the personnel managing the Fund. Upon completion of its analysis, the Board approved the Interim Management Agreement, determining that the continued management of the Fund by the Advisor was in the best interests of the Fund and Fund shareholders.
Basis for Board Approval of Proposed Management Agreement
At a meeting held on March 29, 2010, after considering all information presented, the Board approved, and determined to recommend that shareholders approve, the Proposed Management Agreement. In connection with that approval, the Board requested and reviewed extensive data and information compiled by the Advisor and certain independent providers of evaluation data concerning the Fund and services provided to the Fund by the Advisor. The Board oversees on a continuous basis and evaluates at its quarterly meetings, directly and through the committees of the Board, the nature and quality of significant services provided by the Advisor, the investment performance of the Fund, shareholder services, audit and compliance functions and a variety of other matters relating to the Fund’s operations. The information considered and the discussions held at the meetings included, but were not limited to:
• the nature, extent and quality of investment management, shareholder services and other services provided to the Fund;
• the wide range of programs and services the Advisor provides to the Fund and its shareholders on a routine and non-routine basis;
• the compliance policies, procedures, and regulatory experience of the Advisor;
• data comparing the cost of owning the Fund to the cost of owning similar funds;
• the fact that there will be no changes to the fees, services, or personnel who provide such services as compared to the Prior Management Agreement;
• data comparing the Fund’s performance to appropriate benchmarks and/ or a peer group of other mutual funds with similar investment objectives and strategies;
• financial data showing the profitability of the Fund to the Advisor and the overall profitability of the Advisor;
• data comparing services provided and charges to the Fund with those for other non-fund investment management clients of the Advisor; and
• consideration of collateral or “fall-out” benefits derived by the Advisor from the management of the Fund and potential sharing of economies of scale in connection with the management of the Fund.
37
The Board also considered whether there was any reason for not continuing the existing arrangement with the Advisor. In particular, the Board recognized that shareholders may have invested in the Fund on the strength of the Advisor’s industry standing and reputation and in the expectation that the Advisor will have a continuing role in providing advisory services to the Fund.
The Board considered all of the information provided by the Advisor, the independent data providers, and the Board’s independent legal counsel, and evaluated such information for the Fund. The Board did not identify any single factor as being all-important or controlling, and each Board member may have attributed different levels of importance to different factors. In deciding to approve the Proposed Management Agreement under the terms ultimately determined by the Board to be appropriate, the Board based its decision on a number of factors, including the following:
Nature, Extent and Quality of Services — Generally. Under the Proposed Management Agreement, the Advisor is responsible for providing or arranging for all services necessary for the operation of the Fund. The Board noted that under the Proposed Management Agreement, the Advisor provides or arranges at its own expense a wide variety of services including:
• constructing and designing the Fund
• portfolio research and security selection
• initial capitalization/funding
• securities trading
• Fund administration
• custody of Fund assets
• daily valuation of the Fund’s portfolio
• shareholder servicing and transfer agency, including shareholder
confirmations, recordkeeping and communications
• legal services
• regulatory and portfolio compliance
• financial reporting
• marketing and distribution
The Board noted that many of these services have expanded over time both in terms of quantity and complexity in response to shareholder demands, competition in the industry, changing distribution channels and the changing regulatory environment.
38
Investment Management Services. The investment management services provided to the Fund are complex and provide Fund shareholders access to professional money management, instant diversification of their investments within an asset class, the opportunity to easily diversify among asset classes, and liquidity. As a part of its general oversight and in evaluating investment performance, the Board expects the Advisor to manage the Fund in accordance with its investment objectives and approved strategies. In providing these services, the Advisor utilizes teams of investment professionals who require extensive information technology, research, training, compliance and other systems to conduct their business. The Board, directly and through its Fund Performance Review Committee, regularly reviews investment performance information f or the Fund, together with comparative information for appropriate benchmarks and/or peer groups of similarly-managed funds, over different time horizons. If performance concerns are identified, the underperforming Fund receives special reviews until performance improves, during which time the Board discusses with the Advisor the reasons for such underperformance and any efforts being undertaken to improve performance.
Shareholder and Other Services. Under the Proposed Management Agreement, the Advisor will also provide the Fund with a comprehensive package of transfer agency, shareholder, and other services. The Board, directly and through the various committees of the Board, regularly reviews reports and evaluations of such services. These reports include, but are not limited to, information regarding the operational efficiency and accuracy of the shareholder and transfer agency services provided, staffing levels, shareholder satisfaction (as measured by external as well as internal sources), technology support, new products and services offered to Fund shareholders, securities trading activities, portfolio valuation services, auditing services, and legal and operational compliance activities. Certain aspects of shareholder and transfer ag ency service level efficiency and the quality of securities trading activities are measured by independent third party providers and are presented in comparison to other fund groups not managed by the Advisor.
Costs of Services Provided and Profitability. The Advisor provided detailed information concerning its cost of providing various services to the Fund, its profitability in managing the Fund, its overall profitability, and its financial condition. The Board reviewed with the Advisor the methodology used to prepare this financial information. The Board has also reviewed with the Advisor its methodology for compensating the investment professionals that provide services to the Fund as well as compensation to the five highest paid personnel of the Advisor. This financial information regarding the Advisor is considered in order to evaluate the Advisor’s financial condition, its ability to continue to provide services under the Proposed Management Agreement, and the reasonableness of the proposed management fees. The Board conc luded that the Advisor’s profits were reasonable in light of the services provided to the Fund.
39
Ethics. The Board generally considers the Advisor’s commitment to providing quality services to shareholders and to conducting its business ethically. It noted that the Advisor’s practices generally meet or exceed industry best practices.
Economies of Scale. The Board also reviewed information provided by the Advisor regarding the possible existence of economies of scale in connection with the management of the Fund. The Board concluded that economies of scale are difficult to measure and predict with precision, especially on a fund-by-fund basis. The analysis of economies of scale is further complicated by the additional services and content provided by the Advisor and its reinvestment in its ability to provide and expand those services. Accordingly, the Board seeks to evaluate economies of scale by reviewing information, such as year-over-year profitability of the Advisor generally, the profitability of its management of the Fund specifically, and the expenses incurred by the Advisor in providing various functions to the Fund. The Board believes the Advisor i s appropriately sharing economies of scale through its competitive fee structure, offering competitive fees from fund inception, fee breakpoints as the Fund increases in size, and through reinvestment in its business to provide shareholders additional services and enhancements to existing services.
Comparison to Fees of Funds not Managed by the Advisor. Both the Prior and Proposed Management Agreements provide that the Fund pays the Advisor a single, all-inclusive (or unified) management fee for providing all services necessary for the management and operation of the Fund, other than brokerage expenses, taxes, interest, extraordinary expenses, and the fees and expenses of the Fund’s Independent Trustees (including their independent legal counsel) and expenses incurred in connection with the provision of shareholder services and distribution services under a plan adopted pursuant to Rule 12b-1 under the 1940 Act. Under the unified fee structure, the Advisor is responsible for providing all investment advisory, custody, audit, administrative, compliance, recordkeeping, marketing and shareholder services, or arranging and supervising third parties that provide such services. By contrast, most other funds are charged a variety of fees, including an investment advisory fee, a transfer agency fee, an administrative fee, distribution charges and other expenses. Other than their investment advisory fees and any applicable Rule 12b-1 distribution fees, the components of the total fees charged by these other funds may be increased without shareholder approval. The Board believes the unified fee structure is a benefit to Fund shareholders because it clearly discloses to shareholders the cost of owning Fund shares, and, since the unified fee cannot be increased without a vote of Fund shareholders, it shifts to the Advisor the risk of increased costs of operating the Fund and provides a direct incentive to minimize administrative inefficiencies. Part of the Board’s analysis of fee levels involves reviewing certain evaluative data compiled by an independent provider comparing the Fund’s unified fee to the total expense rat ios of similar funds not managed by the Advisor. The Board concluded that the management fee to be paid by the Fund to the Advisor under the Proposed Management Agreement is reasonable in light of the services to be provided to the Fund.
40
Comparison to Fees and Services Provided to Other Clients of the Advisor. The Board also requested and received information from the Advisor concerning the nature and extent of the services, fees, and profitability of its advisory services to advisory clients other than the Fund. They observed that these varying types of client accounts require different services and involve different regulatory and entrepreneurial risks than the management of the Fund. The Board analyzed this information and concluded that the fees charged and services provided to the Fund were reasonable by comparison.
Collateral or “Fall-Out” Benefits Derived by the Advisor. The Board considered the existence of collateral benefits the Advisor may receive as a result of its relationship with the Fund. The Board concluded that the Advisor’s primary business is managing mutual funds and it generally does not use Fund or shareholder information to generate profits in other lines of business, and therefore does not derive any significant collateral benefits from them. The Board noted that the Advisor receives proprietary research from broker-dealers that execute Fund portfolio transactions and concluded that this research is likely to benefit Fund shareholders. The Board also determined that the Advisor is able to provide investment management services to certain clients other than the Fund, at least in part, due to its existing infrastructure built to serve the fund complex. The Board concluded, however, that the assets of those other clients are not material to the analysis and, in any event, are included with the assets of the Fund to determine breakpoints in the Fund’s fee schedule, provided they are managed using the same investment team and strategy.
Conclusion of the Board. As a result of this process, the Board, in the absence of particular circumstances and assisted by the advice of its independent legal counsel, taking into account all of the factors discussed above and the information provided by the Advisor and others, concluded that the Proposed Management Agreement be approved and recommended its approval to Fund shareholders.
41
Retirement Account Information
As required by law, distributions you receive from certain IRAs or 403(b), 457 and qualified plans are subject to federal income tax withholding, unless you elect not to have withholding apply. Tax will be withheld on the total amount withdrawn even though you may be receiving amounts that are not subject to withholding, such as nondeductible contributions. In such case, excess amounts of withholding could occur. You may adjust your withholding election so that a greater or lesser amount will be withheld.
If you don’t want us to withhold on this amount, you must notify us to not withhold the federal income tax. You may notify us in writing or in certain situations by telephone or through other electronic means. You have the right to revoke your withholding election at any time and any election you make may remain in effect until revoked by filing a new election.
Remember, even if you elect not to have income tax withheld, you are liable for paying income tax on the taxable portion of your withdrawal. If you elect not to have income tax withheld or you don’t have enough income tax withheld, you may be responsible for payment of estimated tax. You may incur penalties under the estimated tax rules if your withholding and estimated tax payments are not sufficient. You can reduce or defer the income tax on a distribution by directly or indirectly rolling such distribution over to another IRA or eligible plan. You should consult your tax advisor for additional information.
State tax will be withheld if, at the time of your distribution, your address is within one of the mandatory withholding states and you have federal income tax withheld. State taxes will be withheld from your distribution in accordance with the respective state rules.
Proxy Voting Guidelines
American Century Investment Management, Inc., the fund’s investment advisor, is responsible for exercising the voting rights associated with the securities purchased and/or held by the fund. A description of the policies and procedures the advisor uses in fulfilling this responsibility is available without charge, upon request, by calling 1-800-345-2021. It is also available on American Century Investments’ website at americancentury.com and on the Securities and Exchange Commission’s website at sec.gov. Information regarding how the investment advisor voted proxies relating to portfolio securities during the most recent 12-month period ended June 30 is available on the “About Us” page at americancentury.com. It is also available at sec.gov.
Quarterly Portfolio Disclosure
The fund files its complete schedule of portfolio holdings with the Securities and Exchange Commission (SEC) for the first and third quarters of each fiscal year on Form N-Q. The fund’s Form N-Q is available on the SEC’s website at sec.gov, and may be reviewed and copied at the SEC’s Public Reference Room in Washington, DC. Information on the operation of the Public Reference Room may be obtained by calling 1-800-SEC-0330. The fund also makes its complete schedule of portfolio holdings for the most recent quarter of its fiscal year available on its website at americancentury.com and, upon request, by calling 1-800-345-2021.
42
The following indices are used to illustrate investment market, sector, or style performance or to serve as fund performance comparisons. They are not investment products available for purchase.
The Morgan Stanley Capital International US Real Estate Investment Trust (MSCI US REIT) Index is a market value-weighted index that tracks the daily stock price performance of equity securities of the most actively traded REITs.
The Russell 1000® Index is a market-capitalization weighted, large-cap index created by Frank Russell Company to measure the performance of the 1,000 largest publicly traded U.S. companies, based on total market capitalization.
The Russell 1000® Growth Index measures the performance of those Russell 1000 Index companies (the 1,000 largest publicly traded U.S. companies, based on total market capitalization) with higher price-to-book ratios and higher forecasted growth values.
The Russell 1000® Value Index measures the performance of those Russell 1000 Index companies (the 1,000 largest publicly traded U.S. companies, based on total market capitalization) with lower price-to-book ratios and lower forecasted growth values.
The Russell 2000® Index is a market-capitalization weighted index created by Frank Russell Company to measure the performance of the 2,000 smallest of the 3,000 largest publicly traded U.S. companies, based on total market capitalization.
The Russell 2000® Growth Index measures the performance of those Russell 2000 Index companies (the 2,000 smallest of the 3,000 largest publicly traded U.S. companies, based on total market capitalization) with higher price-to-book ratios and higher forecasted growth values.
The Russell 2000® Value Index measures the performance of those Russell 2000 Index companies (the 2,000 smallest of the 3,000 largest publicly traded U.S. companies, based on total market capitalization) with lower price-to-book ratios and lower forecasted growth values.
The Russell Midcap® Index measures the performance of the 800 smallest of the 1,000 largest publicly traded U.S. companies, based on total market capitalization.
The Russell Midcap® Growth Index measures the performance of those Russell Midcap Index companies (the 800 smallest of the 1,000 largest publicly traded U.S. companies, based on total market capitalization) with higher price-to-book ratios and higher forecasted growth values.
43
The Russell Midcap® Value Index measures the performance of those Russell Midcap Index companies (the 800 smallest of the 1,000 largest publicly traded U.S. companies, based on total market capitalization) with lower price-to-book ratios and lower forecasted growth values.
The S&P 500 Index is a market value-weighted index of the stocks of 500 publicly traded U.S. companies chosen for market size, liquidity, and industry group representation that are considered to be leading firms in dominant industries. Each stock’s weight in the index is proportionate to its market value. Created by Standard & Poor’s, it is considered to be a broad measure of U.S. stock market performance.
44

| |
| |
| Contact Us | |
| americancentury.com | |
| Automated Information Line | 1-800-345-8765 |
| Investor Services Representative | 1-800-345-2021 or |
| | 816-531-5575 |
| Investors Using Advisors | 1-800-378-9878 |
| Business, Not-For-Profit, Employer-Sponsored | |
| Retirement Plans | 1-800-345-3533 |
| Banks and Trust Companies, Broker-Dealers, | |
| Financial Professionals, Insurance Companies | 1-800-345-6488 |
| Telecommunications Device for the Deaf | 1-800-634-4113 |
| American Century Capital Portfolios, Inc. | |
| Investment Advisor: | |
| American Century Investment Management, Inc. | |
| Kansas City, Missouri | |
This report and the statements it contains are submitted for the general
information of our shareholders. The report is not authorized for distribution to
prospective investors unless preceded or accompanied by an effective prospectus.
American Century Investment Services, Inc., Distributor
©2010 American Century Proprietary Holdings, Inc. All rights reserved.
1005
CL-ANN-68269N
|
| Annual Report |
| March 31, 2010 |

|
| American Century Investments® |
Mid Cap Value Fund
Small Cap Value Fund
| |
| President’s Letter | 2 |
| Independent Chairman’s Letter | 3 |
| Market Perspective | 4 |
| U.S. Stock Index Returns | 4 |
| |
| Mid Cap Value | |
| |
| Performance | 5 |
| Portfolio Commentary | 7 |
| Top Ten Holdings | 9 |
| Top Five Industries | 9 |
| Types of Investments in Portfolio | 9 |
| |
| Small Cap Value | |
| |
| Performance | 10 |
| Portfolio Commentary | 12 |
| Top Ten Holdings | 14 |
| Top Five Industries | 14 |
| Types of Investments in Portfolio | 14 |
| |
| Shareholder Fee Examples | 15 |
| |
| Financial Statements | |
| |
| Schedule of Investments | 17 |
| Statement of Assets and Liabilities | 27 |
| Statement of Operations | 29 |
| Statement of Changes in Net Assets | 30 |
| Notes to Financial Statements | 31 |
| Financial Highlights | 41 |
| Report of Independent Registered Public Accounting Firm | 51 |
| |
| Other Information | |
| |
| Management | 52 |
| Board Approval of Management Agreements | 56 |
| Additional Information | 62 |
| Index Definitions | 63 |
Any opinions expressed in this report reflect those of the author as of the date of the report, and do not necessarily represent the opinions of American Century Investments or any other person in the American Century Investments organization. Any such opinions are subject to change at any time based upon market or other conditions and American Century Investments disclaims any responsibility to update such opinions. These opinions may not be relied upon as investment advice and, because investment decisions made by American Century Investments funds are based on numerous factors, may not be relied upon as an indication of trading intent on behalf of any American Century Investments fund. Security examples are used for representational purposes only and are not intended as recommendations to purchase or sell securities. Performance information for comparative indices and securities is provided to American Century Investments by third party vendors. To the best of American Century Investments’ knowledge, such information is accurate at the time of printing.

Dear Investor:
To learn more about the capital markets, your investment, and the portfolio management strategies American Century Investments provides, we encourage you to review this shareholder report for the financial reporting period ended March 31, 2010.
On the following pages, you will find investment performance and portfolio information, presented with the expert perspective and commentary of our portfolio management team. This report remains one of our most important vehicles for conveying the information you need about your investment performance, and about the market factors and strategies that affect fund returns. For additional information on the markets, we encourage you to visit the “Insights & News” tab at our Web site, americancentury.com, for updates and further expert commentary.
The top of our Web site’s home page also provides a link to “Our Story,” which, first and foremost, outlines our commitment—since 1958—to helping clients reach their financial goals. We believe strongly that we will only be successful when our clients are successful. That’s who we are.
Another important, unique facet of our story and who we are is “Profits with a Purpose,” which describes our bond with the Stowers Institute for Medical Research (SIMR). SIMR is a world-class biomedical organization—founded by our company founder James E. Stowers, Jr. and his wife Virginia—that is dedicated to researching the causes, treatment, and prevention of gene-based diseases, including cancer. Through American Century Investments’ private ownership structure, more than 40% of our profits support SIMR.
Mr. Stowers’ example of achieving financial success and using that platform to help humanity motivates our entire American Century Investments team. His story inspires us to help each of our clients achieve success. Thank you for sharing your financial journey with us.
Sincerely,

Jonathan Thomas
President and Chief Executive Officer
American Century Investments
2
|
| Independent Chairman’s Letter |

Fellow Shareholders,
The principal event at a recent board meeting was the retirement of Jim Stowers, Jr. from the American Century Mutual Funds Kansas City board. This was one of those times when you felt like you were living a historical moment. Jim founded what was known as Twentieth Century Mutual Funds over 50 years ago. Through the years, his number one priority has been to “Put Investors First!” The board presented Jim with a resolution acknowledging that, by building a successful investment company, he has impacted the lives of many by helping them on the path to financial success.
We respect Jim’s decision to focus his energy on the Stowers Institute for Medical Research and American Century Companies, Inc. (ACC), the parent company of the funds’ investment advisors. The pioneering medical research that Jim and his wife Virginia have made possible through the Institute should enrich the lives of millions in the future.
Shortly after his retirement from the board, we received word that Jim—who celebrated his 86th birthday in January—was hospitalized after experiencing a fall during his regular exercise regimen. While Jim has made steady progress toward recovery, this potentially serious incident resulted in the activation of his long-standing estate and business succession plan. Under the terms of the plan, ACC’s co-chairman Richard W. Brown succeeded Jim as trustee of a trust that holds a significant interest in ACC stock. While less than a majority interest, the trust is presumed to control the funds’ investment advisors under the Investment Company Act of 1940. This change triggered the need for a shareholder proxy to approve new management and subadvisory agreements for the funds. If you have not already responded, I encourage you to take the time to read the proxy materials and send your vote as soon as p ossible.
On behalf of the board, I want to once again thank Jim for his mutual fund board service and wish him a speedy recovery. More than three years ago, Jim and Richard Brown installed a strong and effective leadership team at American Century Investments and I look forward to continuing to work with them on behalf of fund shareholders. And while Jim no longer sits on the fund board, the inherent optimism captured by his favorite catch phrase—“The best is yet to be”—still resonates with all of us who have the privilege of serving you. I invite you to send your comments, questions or concerns to me at dhpratt@fundboardchair.com.

3

By Phil Davidson, Chief Investment Officer, U.S. Value Equity
Stocks Enjoyed Bountiful Recovery
The U.S. stock market gained approximately 50% for the year ended March 31, 2010—one of its best 12-month returns in the last three decades. The key factor behind the remarkable rally in stocks was increasing confidence in a potential economic recovery.
The period began as the U.S. economy was beginning to emerge from its worst downturn since the Great Depression. Signs of economic improvement—including a pickup in industrial production, rising retail sales, and signals that the housing sector was starting to stabilize—gained momentum throughout the 12-month period, helping the U.S. economy post positive growth in the third and fourth quarters of 2009. The exception was job growth—the unemployment rate rose to its highest level since 1983 before falling back slightly toward the end of the reporting period.
Better-than-expected corporate profits also provided a boost to stocks despite sluggish revenue growth. Aggressive cost-cutting strategies across much of corporate America helped profits remain on an upward trajectory.
Value Stocks Led the Rally
Value stocks led the market’s advance, outperforming growth shares across all market capitalizations (see the table below). Many of the best-performing stocks were financially stressed companies that were able to stabilize their businesses and strengthen their balance sheets—characteristics that apply to value-oriented issues. In addition, the financial sector—a sizable component of the value universe—was one of the top-performing sectors in the equity market as many troubled financial firms were able to issue equity and deleverage.
Another recent development that has been favorable for value stocks is a resurgence of dividends. 2009 was the worst year on record for dividends in the U.S., where more than 800 companies reduced their dividend payouts by a total of $58 billion. However, in the first three months of 2010, income-oriented investors were rewarded with growing dividend payouts. In February alone, 47 companies in the S&P 500 increased their dividends or began paying them. Dividends play a central role in our efforts to reduce risk and increase total returns, and they also confirm the strength of a company’s earnings and cash flow.
| | | | |
| U.S. Stock Index Returns | | | | |
| For the 12 months ended March 31, 2010 | | | | |
| Russell 1000 Index (Large-Cap) | 51.60% | | Russell 2000 Index (Small-Cap) | 62.76% |
| Russell 1000 Growth Index | 49.75% | | Russell 2000 Growth Index | 60.32% |
| Russell 1000 Value Index | 53.56% | | Russell 2000 Value Index | 65.07% |
| Russell Midcap Index | 67.71% | | | |
| Russell Midcap Growth Index | 63.00% | | | |
| Russell Midcap Value Index | 72.41% | | | |
4
| | | | | | |
| Mid Cap Value | | | | | |
| |
| Total Returns as of March 31, 2010 | | | | |
| | | | | Average Annual Returns | |
| | | Ticker | | | Since | Inception |
| | | Symbol | 1 year(1) | 5 years | Inception | Date |
| Investor Class | ACMVX | 57.68% | 6.37% | 8.02% | 3/31/04 |
| Russell Midcap Value Index(2) | — | 72.41% | 3.71% | 6.01% | — |
| Institutional Class | AVUAX | 58.00% | 6.57% | 8.56% | 8/2/04 |
| A Class(3) | ACLAX | | | | 1/13/05 |
| No sales charge* | | 57.28% | 6.11% | 6.46% | |
| With sales charge* | | 48.20% | 4.86% | 5.26% | |
| C Class | ACCLX | | | | 3/1/10 |
| No sales charge* | | — | — | 4.10%(4) | |
| With sales charge* | | — | — | 3.10%(4) | |
| R Class | AMVRX | 56.88% | — | 4.38% | 7/29/05 |
| *Sales charges include initial sales charges and contingent deferred sales charges (CDSCs), as applicable. A Class shares have a 5.75% |
| maximum initial sales charge for equity funds and may be subject to a maximum CDSC of 1.00%. C Class shares redeemed within 12 |
| months of purchase are subject to a maximum CDSC of 1.00%. The SEC requires that mutual funds provide performance information |
| net of maximum sales charges in all cases where charges could be applied. | | | |
| |
| (1) | The performance is attributable in part to unusually favorable market conditions and may not be repeated or consistently achieved in the future. |
| (2) | Data provided by Lipper Inc. – A Reuters Company. © 2010 Reuters. All rights reserved. Any copying, republication or redistribution of Lipper |
| | content, including by caching, framing or similar means, is expressly prohibited without the prior written consent of Lipper. Lipper shall not be |
| | liable for any errors or delays in the content, or for any actions taken in reliance thereon. | | | |
| | The data contained herein has been obtained from company reports, financial reporting services, periodicals and other resources believed to be |
| | reliable. Although carefully verified, data on compilations is not guaranteed by Lipper and may be incomplete. No offer or solicitations to buy or |
| | sell any of the securities herein is being made by Lipper. | | | | |
| (3) | Prior to March 1, 2010, the A Class was referred to as the Advisor Class and did not have a front-end sales charge. Performance prior to that |
| | date has been adjusted to reflect this charge. | | | | | |
| (4) | Total returns for periods less than one year are not annualized. | | | | |
Data presented reflect past performance. Past performance is no guarantee of future results. Current performance may be higher or lower than the performance shown. Investment return and principal value will fluctuate, and redemption value may be more or less than original cost. To obtain performance data current to the most recent month end, please call 1-800-345-2021 or visit americancentury.com.
Unless otherwise indicated, performance reflects Investor Class shares; performance for other share classes will vary due to differences in fee structure. For information about other share classes available, please consult the prospectus. Data assumes reinvestment of dividends and capital gains, and none of the charts reflect the deduction of taxes that a shareholder would pay on fund distributions or the redemption of fund shares. Returns for the index are provided for comparison. The fund’s total returns include operating expenses (such as transaction costs and management fees) that reduce returns, while the total returns of the index do not.
5
Mid Cap Value
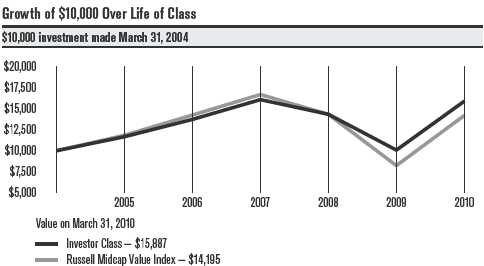
| | | | |
| Total Annual Fund Operating Expenses | | | |
| Investor Class | Institutional Class | A Class | C Class | R Class |
| 1.01% | 0.81% | 1.26% | 2.01% | 1.51% |
The total annual fund operating expenses shown is as stated in the fund’s prospectus current as of the date of this report. The prospectus may vary from the expense ratio shown elsewhere in this report because it is based on a different time period, includes acquired fund fees and expenses, and, if applicable, does not include fee waivers or expense reimbursements.
Data presented reflect past performance. Past performance is no guarantee of future results. Current performance may be higher or lower than the performance shown. Investment return and principal value will fluctuate, and redemption value may be more or less than original cost. To obtain performance data current to the most recent month end, please call 1-800-345-2021 or 17500 visit americancentury.com.
Unless otherwise indicated, performance reflects Investor Class shares; performance for other share classes will vary due to differences in fee structure. For information about other share classes available, please consult the prospectus. Data assumes reinvestment of dividends and capital gains, and none of the charts reflect the deduction of taxes that a shareholder would pay on fund distributions or the redemption of fund shares. Returns for the index are provided for comparison. The fund’s total returns include operating expenses (such as transaction costs and management fees) that reduce returns, while the total returns of the index do not.
6
Mid Cap Value
Portfolio Managers: Kevin Toney, Michael Liss, and Phil Davidson
Performance Summary
Mid Cap Value returned 57.68%* for the 12 months ended March 31, 2010. By comparison, the average return for Morningstar’s Mid Cap Value category** (its performance, like Mid Cap Value’s, reflects operating expenses) was 65.78%. The fund’s benchmark, the Russell Midcap Value Index (which does not include operating expenses), was up 72.41%.
As the performance figures above indicate, the stock market staged a remarkable comeback during the reporting period. Economic conditions improved (partly in response to government stimulus programs), corporate earnings were better than expected, and improving conditions in the capital markets helped the more highly leveraged or financially strapped companies. These factors led many investors to shift into riskier assets, and many of the period’s largest gains were made by the lower-quality businesses that fared the worst during the financial crisis. That situation was at odds with Mid Cap Value’s investment approach, which emphasizes higher-quality businesses with sound balance sheets. Nonetheless, the portfolio received positive contributions in absolute terms from all 10 of the sectors in which it was invested. On a relative basis, Mid Cap Value’s underperformance was more a result of what it did n’t own rather than what it did.
Mid Cap Value is carefully managed for long-term results. Since its inception on March 31, 2004, Mid Cap Value has produced an average annual return of 8.02%, topping the returns for that period for Morningstar’s Mid Cap Value category average and the Russell Midcap Value Index (see the performance information on pages 5 and 6 or in footnotes below).
Financials Slowed Results
The portfolio’s position in the financials sector was the largest source of underperformance versus the benchmark. Although financials contributed the most to Mid Cap Value’s return, conservative security selection restrained relative progress as companies with stressed balance sheets, many of which had appeared to be on the brink of bankruptcy only months earlier, outperformed stronger, higher-quality businesses. The portfolio was significantly underweight commercial banks, a segment that returned more than 67% to the benchmark.
The portfolio’s investments were concentrated in the less-volatile insurance and thrift names, many of which did not keep pace with other financial stocks during the low-quality rally. A top detractor was global insurance broker Marsh & McLennan Companies. Marsh does not have a credit-sensitive business model and we believe it is well-positioned to benefit
|
| * All fund returns referenced in this commentary are for Investor Class shares. |
| ** The five-year and since inception average returns as of March 31, 2010, for Morningstar’s Mid Cap Value category were 3.34% and 4.80%, |
| respectively. © 2010 Morningstar, Inc. All Rights Reserved. The information contained herein: (1) is proprietary to Morningstar and/or its content |
| providers; (2) may not be copied or distributed; and (3) is not warranted to be accurate, complete or timely. Neither Morningstar nor its content |
| providers are responsible for any damages or losses arising from any use of this information. |
7
Mid Cap Value
from regulatory changes and improving operating conditions. Another notable detractor was People’s United Financial, a conservatively run and well-capitalized thrift.
Consumer Discretionary Detracted
Relative performance was hampered by the combination of an underweight position and security selection in the consumer discretionary sector. Many of these stocks, which suffered steep declines as the recession took hold, rallied on optimism about a possible economic recovery and improving consumer sentiment. The portfolio did not own any media stocks, which outperformed as advertising revenues improved. It was also slowed by an underweight position in automakers. Mid Cap Value did not hold shares of Ford Motor, which rose nearly 378% during the period.
In addition, the portfolio was hindered by its investments in leisure stocks. A key detractor was International Speedway Corp. During the recession, the race track operator struggled with lower attendance at NASCAR events and a decline in corporate sponsorship.
Information Technology Contributed
The portfolio’s holdings in the information technology sector added to relative results. Many of these companies are tied more closely to their own product cycles and market opportunities than to broad economic or capital markets conditions. A key contributor was Emulex Corp., a maker of storage-networking equipment. Its share price rose dramatically on news of an unsolicited takeover bid from chipmaker Broadcom Corp. The stock remained elevated as Emulex resisted the takeover, urging shareholders to reject Broadcom’s offer on the grounds that it materially undervalued the company. Ultimately, Broadcom withdrew the offer.
Utilities Enhanced Performance
Security selection in utilities—the weakest sector in the benchmark—benefited the portfolio. Because of valuations and higher-risk business models, Mid Cap Value did not hold any independent power producers, one of the weakest performing segments within the sector. The portfolio’s underweight in multi-utilities was also advantageous.
Outlook
We continue to follow our disciplined, bottom-up process, selecting companies one at a time for the portfolio. As of March 31, 2010, we see opportunities in consumer staples, industrials, energy, and health care stocks, reflected by overweight positions in these sectors, relative to the benchmark. Our fundamental analysis and valuation work are also directing us toward smaller relative weightings in consumer discretionary, materials, and financials stocks.
8
| |
| Mid Cap Value | |
| |
| Top Ten Holdings | |
| | % of net assets |
| | as of 3/31/10 |
| Imperial Oil Ltd. | 2.9% |
| Northern Trust Corp. | 2.9% |
| Aon Corp. | 2.7% |
| Kimberly-Clark Corp. | 2.5% |
| Marsh & McLennan Cos., Inc. | 2.4% |
| Republic Services, Inc. | 2.2% |
| Lowe's Cos., Inc. | 2.0% |
| Chubb Corp. (The) | 1.9% |
| ConAgra Foods, Inc. | 1.8% |
| Wisconsin Energy Corp. | 1.7% |
| |
| Top Five Industries | |
| | % of net assets |
| | as of 3/31/10 |
| Insurance | 13.3% |
| Oil, Gas & Consumable Fuels | 8.8% |
| Food Products | 6.2% |
| Commercial Services & Supplies | 5.6% |
| Electric Utilities | 5.1% |
| |
| Types of Investments in Portfolio | |
| | % of net assets |
| | as of 3/31/10 |
| Domestic Common Stocks | 91.8% |
| Foreign Common Stocks(1) | 5.9% |
| Total Common Stocks | 97.7% |
| Temporary Cash Investments | 2.6% |
| Other Assets and Liabilities | (0.3)% |
| (1) Includes depositary shares, dual listed securities and foreign ordinary shares. | |
9
| | | | | | | |
| Small Cap Value | | | | | | |
| |
| Total Returns as of March 31, 2010 | | | | | |
| | | | | Average Annual Returns | |
| | | Ticker | | | | Since | Inception |
| | | Symbol | 1 year(1) | 5 years | 10 years | Inception | Date |
| Investor Class | ASVIX | 73.93% | 6.24% | 12.86% | 11.79% | 7/31/98 |
| Russell 2000 Value Index(2) | — | 65.07% | 2.75% | 8.90% | 7.53% | — |
| Institutional Class | ACVIX | 74.47% | 6.46% | 13.09% | 12.62% | 10/26/98 |
| A Class(3) | ACSCX | | | | | 12/31/99 |
| No sales charge* | | 73.53% | 6.00% | 12.60% | 13.01% | |
| With sales charge* | | 63.43% | 4.76% | 11.93% | 12.35% | |
| C Class | ASVNX | | | | | 3/1/10 |
| No sales charge* | | — | — | — | 5.39%(4) | |
| With sales charge* | | — | — | — | 4.39%(4) | |
| R Class | ASVRX | — | — | — | 5.53%(4) | 3/1/10 |
| *Sales charges include initial sales charges and contingent deferred sales charges (CDSCs), as applicable. A Class shares have a 5.75% |
| maximum initial sales charge for equity funds and may be subject to a maximum CDSC of 1.00%. C Class shares redeemed within 12 |
| months of purchase are subject to a maximum CDSC of 1.00%. The SEC requires that mutual funds provide performance information |
| net of maximum sales charges in all cases where charges could be applied. | | | |
| |
| (1) | The performance is attributable in part to unusually favorable market conditions and may not be repeated or consistently achieved in the future. |
| (2) | Data provided by Lipper Inc. – A Reuters Company. © 2010 Reuters. All rights reserved. Any copying, republication or redistribution of Lipper |
| | content, including by caching, framing or similar means, is expressly prohibited without the prior written consent of Lipper. Lipper shall not be |
| | liable for any errors or delays in the content, or for any actions taken in reliance thereon. | | | |
| | The data contained herein has been obtained from company reports, financial reporting services, periodicals and other resources believed to be |
| | reliable. Although carefully verified, data on compilations is not guaranteed by Lipper and may be incomplete. No offer or solicitations to buy or |
| | sell any of the securities herein is being made by Lipper. | | | | | |
| (3) | Prior to March 1, 2010, the A Class was referred to as the Advisor Class and did not have a front-end sales charge. Performance prior to that |
| | date has been adjusted to reflect this charge. | | | | | |
| (4) | Total returns for periods less than one year are not annualized. | | | | |
Data presented reflect past performance. Past performance is no guarantee of future results. Current performance may be higher or lower than the performance shown. Investment return and principal value will fluctuate, and redemption value may be more or less than original cost. To obtain performance data current to the most recent month end, please call 1-800-345-2021 or visit americancentury.com. Historically, small company stocks have been more volatile than the stocks of larger, more established companies.
Unless otherwise indicated, performance reflects Investor Class shares; performance for other share classes will vary due to differences in fee structure. For information about other share classes available, please consult the prospectus. Data assumes reinvestment of dividends and capital gains, and none of the charts reflect the deduction of taxes that a shareholder would pay on fund distributions or the redemption of fund shares. Returns for the index are provided for comparison. The fund’s total returns include operating expenses (such as transaction costs and management fees) that reduce returns, while the total returns of the index do not.
10
Small Cap Value

| | | | |
| Total Annual Fund Operating Expenses | | | |
| Investor Class | Institutional Class | A Class | C Class | R Class |
| 1.49% | 1.29% | 1.74% | 2.49% | 1.99% |
The total annual fund operating expenses shown is as stated in the fund’s prospectus current as of the date of this report. The prospectus may vary from the expense ratio shown elsewhere in this report because it is based on a different time period, includes acquired fund fees and expenses, and, if applicable, does not include fee waivers or expense reimbursements.
Data presented reflect past performance. Past performance is no guarantee of future results. Current performance may be higher or lower than the performance shown. Investment return and principal value will fluctuate, and redemption value may be more or less than original cost. To obtain performance data current to the most recent month end, please call 1-800-345-2021 or visit americancentury.com. Historically, small company stocks have been more volatile than the stocks of larger, more establishe d companies.
Unless otherwise indicated, performance reflects Investor Class shares; performance for other share classes will vary due to differences in fee structure. For information about other share classes available, please consult the prospectus. Data assumes reinvestment of dividends and capital gains, and none of the charts reflect the deduction of taxes that a shareholder would pay on fund distributions or the redemption of fund shares. Returns for the index are provided for comparison. The fund’s total returns include operating expenses (such as transaction costs and management fees) that reduce returns, while the total returns of the index do not.
11
Small Cap Value
Portfolio Managers: Ben Giele and James Pitman
Performance Summary
Small Cap Value returned 73.93%* for the 12 months ended March 31, 2010. By comparison, its benchmark, the Russell 2000 Value Index, returned 65.07%. The portfolio’s returns reflect operating expenses while the index’s returns do not. The Lipper Small-Cap Value Funds Index, which includes operating expenses, returned 69.02%.**
As the performance figures above indicate, the stock market staged a remarkable comeback during the reporting period. Economic conditions improved (partly in response to government stimulus programs), corporate earnings were better than expected, and improving conditions in the capital markets helped the more highly leveraged or financially strapped companies. These factors led many investors to shift into riskier assets, and many of the period’s largest gains were made by the lower-quality businesses that fared the worst during the financial crisis. Small company stocks posted significant gains during the period, while value stocks outperformed their growth counterparts. In this environment, Small Cap Value received positive results in absolute terms from all 10 of the sectors in which it was invested. On a relative basis, the portfolio’s outperformance was largely the result of effective security selec tion and our continued emphasis on less-risky businesses with sound balance sheets. Contributing most against the benchmark were investments in the financials, utilities, and consumer discretionary sectors. The portfolio’s position in the health care sector detracted.
Small Cap Value is carefully managed for long-term results. Since its inception on July 31, 1998, Small Cap Value has produced an average annual return of 11.79%, outpacing the returns of the Russell 2000 Value Index and the Lipper Small-Cap Value Funds Index for the same period (see performance information on pages 10 and 11 or in footnotes below).
Financials Enhanced Results
Security selection within the financials sector contributed significantly to relative performance. The rally in financials was centered in large banks and financial institutions, some of which had appeared to be on the brink of bankruptcy just months earlier. Although small-cap financials advanced as well, their shares lagged their large-cap counterparts.
The portfolio benefited from its investments in well-capitalized regional commercial banks. A notable contributor was Webster Financial Corp., a regional bank serving customers in southern New England and eastern New York state. Webster Financial has successfully raised capital to cover credit concerns and support its expansion plans.
|
| * All fund returns referenced in this commentary are for Investor Class shares. |
| ** The Lipper Small-Cap Value Funds Index returned 3.65%, 9.33% and 8.07% for the five-, ten-year and since inception periods ended |
| March 31, 2010, respectively. |
12
Small Cap Value
Small Cap Value’s mix of capital markets firms was also advantageous. A top performer was Calamos Asset Management. During the market turmoil, Calamos’ share price had suffered in sympathy with other asset managers. As the environment improved, the company earned a profit, helped by investment gains.
Within the insurance segment, select holdings detracted. HCC Insurance Holdings, one of the portfolio’s largest positions, reported strong 2009 earnings, benefiting from its conservative underwriting, capital structure, and investment portfolio. Although the property casualty insurer provided positive returns, its shares did not keep pace with riskier names in the segment.
Utilities Contributed
The portfolio’s underweight in the utilities sector was another source of positive relative results. During difficult economic times, utilities stocks tend to be viewed as defensive investments. However, when the market rallied during the period, utilities turned in the weakest sector performance of the benchmark index.
Consumer Discretionary Added Value
An overweight in the consumer discretionary sector contributed to progress versus the benchmark. The portfolio benefited from security selection among media companies, which outperformed as the economy strengthened and advertising revenues improved.
Health Care Detracted
The portfolio’s position in health care detracted slightly. The health care sector provided an overall total return of more than 60% within the portfolio and the benchmark, but security selection ultimately dampened Small Cap Value’s performance. Among the detractors was Pharmaceutical Product Development, a contract research organization that provides drug discovery and development services. The company’s share price rose during the one-year reporting period, but did not keep pace with the broad health care sector.
Outlook
We continue to be bottom-up investment managers, building the portfolio one stock at a time, a process that results in exposure to market segments based on the attractiveness of individual companies in terms of their valuation and fundamentals. As of March 31, 2010, the portfolio is broadly diversified, with larger positions than the benchmark in the consumer discretionary, industrials, health care, and information technology sectors. Our fundamental analysis and valuation work is also directing us toward a smaller relative weighting in financials and utilities stocks.
13
| |
| Small Cap Value | |
| |
| Top Ten Holdings | |
| | % of net assets |
| | as of 3/31/10 |
| Aspen Insurance Holdings Ltd., Series AHL, 5.625%, 12/31/49 (Conv. Pref.) | 2.2% |
| iShares Russell 2000 Value Index Fund | 2.0% |
| Granite Construction, Inc. | 1.0% |
| Mueller Industries, Inc. | 1.0% |
| W&T Offshore, Inc. | 1.0% |
| Curtiss-Wright Corp. | 1.0% |
| Young Innovations, Inc. | 1.0% |
| HCC Insurance Holdings, Inc. | 0.8% |
| Portland General Electric Co. | 0.7% |
| Parametric Technology Corp. | 0.7% |
| |
| Top Five Industries | |
| | % of net assets |
| | as of 3/31/10 |
| Commercial Banks | 8.0% |
| Insurance | 7.3% |
| Real Estate Investment Trusts (REITs) | 6.6% |
| Machinery | 4.3% |
| Oil, Gas & Consumable Fuels | 4.2% |
| |
| Types of Investments in Portfolio | |
| | % of net assets |
| | as of 3/31/10 |
| Common Stocks | 94.4% |
| Convertible Preferred Stocks | 3.4% |
| Preferred Stocks | 0.6% |
| Total Equity Exposure | 98.4% |
| Temporary Cash Investments | 1.9% |
| Other Assets and Liabilities | (0.3)% |
14
|
| Shareholder Fee Examples (Unaudited) |
Fund shareholders may incur two types of costs: (1) transaction costs, including sales charges (loads) on purchase payments and redemption/ exchange fees; and (2) ongoing costs, including management fees; distribution and service (12b-1) fees; and other fund expenses. This example is intended to help you understand your ongoing costs (in dollars) of investing in your fund and to compare these costs with the ongoing cost of investing in other mutual funds.
The example is based on an investment of $1,000 made at the beginning of the period and held for the entire period from October 1, 2009 to March 31, 2010.
Actual Expenses
The table provides information about actual account values and actual expenses for each class. You may use the information, together with the amount you invested, to estimate the expenses that you paid over the period. First, identify the share class you own. Then simply divide your account value by $1,000 (for example, an $8,600 account value divided by $1,000 = 8.6), then multiply the result by the number under the heading “Expenses Paid During Period” to estimate the expenses you paid on your account during this period.
If you hold Investor Class shares of any American Century Investments fund, or Institutional Class shares of the American Century Diversified Bond Fund, in an American Century Investments account (i.e., not a financial intermediary or retirement plan account), American Century Investments may charge you a $12.50 semiannual account maintenance fee if the value of those shares is less than $10,000. We will redeem shares automatically in one of your accounts to pay the $12.50 fee. In determining your total eligible investment amount, we will include your investments in all personal accounts (including American Century Investments Brokerage accounts) registered under your Social Security number. Personal accounts include individual accounts, joint accounts, UGMA/UTMA accounts, personal trusts, Coverdell Education Savings Accounts and IRAs (including traditional, Roth, Rollover, SEP-, SARSEP- and SIMPLE-IRAs), and certain other retirement accounts. If you have only business, business retirement, employer-sponsored or American Century Investments Brokerage accounts, you are currently not subject to this fee. We will not charge the fee as long as you choose to manage your accounts exclusively online. If you are subject to the Account Maintenance Fee, your account value could be reduced by the fee amount.
Hypothetical Example for Comparison Purposes
The table also provides information about hypothetical account values and hypothetical expenses based on the actual expense ratio of each class of your fund and an assumed rate of return of 5% per year before expenses, which is not the actual return of a fund’s share class. The hypothetical account values and expenses may not be used to estimate the actual ending account balance or expenses you paid for the period. You may use this information to compare the ongoing costs of investing in your fund and other funds. To do so, compare this 5% hypothetical example with the 5% hypothetical examples that appear in the shareholder reports of the other funds.
15
Please note that the expenses shown in the table are meant to highlight your ongoing costs only and do not reflect any transactional costs, such as sales charges (loads) or redemption/exchange fees. Therefore, the table is useful in comparing ongoing costs only, and will not help you determine the relative total costs of owning different funds. In addition, if these transactional costs were included, your costs would have been higher.
| | | | | |
| | | Beginning | Ending | Expenses Paid | |
| | | Account Value | Account Value | During Period(1) | Annualized |
| | | 10/1/09 | 3/31/10 | 10/1/09 - 3/31/10 | Expense Ratio(1) |
| Mid Cap Value | | | | |
| Actual | | | | |
| Investor Class | $1,000 | $1,144.40 | $5.35 | 1.00% |
| Institutional Class | $1,000 | $1,145.60 | $4.28 | 0.80% |
| A Class | $1,000 | $1,142.90 | $6.68 | 1.25% |
| C Class | $1,000 | $1,041.00(2) | $1.68(3) | 2.00% |
| R Class | $1,000 | $1,141.40 | $8.01 | 1.50% |
| Hypothetical | | | | |
| Investor Class | $1,000 | $1,019.95 | $5.04 | 1.00% |
| Institutional Class | $1,000 | $1,020.94 | $4.03 | 0.80% |
| A Class | $1,000 | $1,018.70 | $6.29 | 1.25% |
| C Class | $1,000 | $1,014.96(4) | $10.05(4) | 2.00% |
| R Class | $1,000 | $1,017.45 | $7.54 | 1.50% |
| Small Cap Value | | | | |
| Actual | | | | |
| Investor Class | $1,000 | $1,156.00 | $6.72 | 1.25% |
| Institutional Class | $1,000 | $1,157.60 | $5.65 | 1.05% |
| A Class | $1,000 | $1,155.60 | $8.06 | 1.50% |
| C Class | $1,000 | $1,053.90(2) | $1.90(3) | 2.25% |
| R Class | $1,000 | $1,055.30(2) | $1.48(3) | 1.75% |
| Hypothetical | | | | |
| Investor Class | $1,000 | $1,018.70 | $6.29 | 1.25% |
| Institutional Class | $1,000 | $1,019.70 | $5.29 | 1.05% |
| A Class | $1,000 | $1,017.45 | $7.54 | 1.50% |
| C Class | $1,000 | $1,013.71(4) | $11.30(4) | 2.25% |
| R Class | $1,000 | $1,016.21(4) | $8.80(4) | 1.75% |
| |
| (1) | Expenses are equal to the class’s annualized expense ratio listed in the table above, multiplied by the average account value over the period, |
| | multiplied by 182, the number of days in the most recent fiscal half-year, divided by 365, to reflect the one-half year period. |
| (2) | Ending account value based on actual return from March 1, 2010 (commencement of sale) through March 31, 2010. | |
| (3) | Expenses are equal to the class’s annualized expense ratio listed in the table above, multiplied by the average account value over the period, |
| | multiplied by 30, the number of days in the period from March 1, 2010 (commencement of sale) through March 31, 2010, divided by 365, to |
| | reflect the period. Had the class been available for the full period, the expenses paid during the period would have been higher. |
| (4) | Ending account value and expenses paid during period assumes the class had been available throughout the entire period and are calculated |
| | using the class’s annualized expense ratio listed in the table above. | | |
16
| | | | | | |
| Mid Cap Value | | | | | | |
| |
| MARCH 31, 2010 | | | | | | |
| |
| | Shares | Value | | | Shares | Value |
| Common Stocks — 97.7% | | | DIVERSIFIED TELECOMMUNICATION | |
| | | | | SERVICES — 2.5% | | |
| AEROSPACE & DEFENSE — 0.6% | | | BCE, Inc. | 80,527 | $ 2,366,692 |
| Northrop Grumman Corp. | 63,100 | $ 4,137,467 | | CenturyTel, Inc. | 266,053 | 9,434,240 |
| BEVERAGES — 0.6% | | | | Consolidated | | |
| Coca-Cola Enterprises, Inc. | 128,400 | 3,551,544 | | Communications | | |
| CAPITAL MARKETS — 4.5% | | | | Holdings, Inc. | 97,300 | 1,844,808 |
| AllianceBernstein Holding LP | 36,800 | 1,128,288 | | Iowa Telecommunications | | |
| Ameriprise Financial, Inc. | 47,501 | 2,154,645 | | Services, Inc. | 137,989 | 2,304,416 |
| Invesco Ltd. | 148,100 | 3,244,871 | | | | 15,950,156 |
| Northern Trust Corp. | 333,600 | 18,434,736 | | ELECTRIC UTILITIES — 5.1% | | |
| State Street Corp. | 91,600 | 4,134,824 | | American Electric Power | | |
| | | | | Co., Inc. | 92,855 | 3,173,784 |
| | | 29,097,364 | | | | |
| | | | | Great Plains Energy, Inc. | 136,359 | 2,532,187 |
| CHEMICALS — 0.7% | | | | | | |
| | | | | IDACORP, Inc. | 162,668 | 5,631,566 |
| Minerals Technologies, Inc. | 92,201 | 4,779,700 | | | | |
| | | | | Northeast Utilities | 229,183 | 6,334,618 |
| COMMERCIAL BANKS — 2.2% | | | | | | |
| | | | | Portland General Electric Co. | 295,736 | 5,710,662 |
| City National Corp. | 31,800 | 1,716,246 | | | | |
| | | | | Westar Energy, Inc. | 421,641 | 9,402,594 |
| Comerica, Inc. | 201,728 | 7,673,733 | | | | |
| | | | | | | 32,785,411 |
| Commerce Bancshares, Inc. | 108,249 | 4,453,364 | | | | |
| | | | | ELECTRICAL EQUIPMENT — 1.9% | |
| | | 13,843,343 | | | | |
| | | | | Emerson Electric Co. | 68,600 | 3,453,324 |
| COMMERCIAL SERVICES & SUPPLIES — 5.6% | | | | |
| | | | | Hubbell, Inc., Class B | 115,835 | 5,841,559 |
| Cintas Corp. | 132,800 | 3,730,352 | | | | |
| | | | | Rockwell Automation, Inc. | 31,700 | 1,786,612 |
| IESI-BFC Ltd. | 10,051 | 172,374 | | | | |
| | | | | Woodward Governor Co. | 31,515 | 1,007,850 |
| Pitney Bowes, Inc. | 332,100 | 8,119,845 | | | | |
| | | | | | | 12,089,345 |
| Republic Services, Inc. | 494,498 | 14,350,332 | | | | |
| | | | | ELECTRONIC EQUIPMENT, INSTRUMENTS | |
| Waste Management, Inc. | 280,444 | 9,655,687 | | & COMPONENTS — 1.0% | | |
| | | 36,028,590 | | Molex, Inc. | 309,984 | 6,466,266 |
| COMMUNICATIONS EQUIPMENT — 0.6% | | | ENERGY EQUIPMENT & SERVICES — 0.9% | |
| Emulex Corp.(1) | 308,500 | 4,096,880 | | Baker Hughes, Inc. | 84,500 | 3,957,980 |
| COMPUTERS & PERIPHERALS — 0.7% | | | Smith International, Inc. | 38,000 | 1,627,160 |
| Diebold, Inc. | 133,351 | 4,235,228 | | | | 5,585,140 |
| CONSTRUCTION MATERIALS — 0.8% | | | FOOD PRODUCTS — 6.2% | | |
| Vulcan Materials Co. | 104,400 | 4,931,856 | | Campbell Soup Co. | 223,800 | 7,911,330 |
| CONTAINERS & PACKAGING — 1.9% | | | ConAgra Foods, Inc. | 456,690 | 11,449,218 |
| Bemis Co., Inc. | 277,968 | 7,983,241 | | H.J. Heinz Co. | 233,600 | 10,654,496 |
| Sonoco Products Co. | 130,100 | 4,005,779 | | Hershey Co. (The) | 66,600 | 2,851,146 |
| | | 11,989,020 | | Kraft Foods, Inc., Class A | 216,800 | 6,556,032 |
| DISTRIBUTORS — 1.1% | | | | | | 39,422,222 |
| Genuine Parts Co. | 172,594 | 7,290,371 | | GAS UTILITIES — 0.9% | | |
| DIVERSIFIED — 1.5% | | | | Southwest Gas Corp. | 182,203 | 5,451,514 |
| iShares Russell Midcap | | | | | | |
| Value Index Fund | 234,300 | 9,449,319 | | | | |
17
| | | | | | | |
| Mid Cap Value | | | | | | | |
| |
| | Shares | | Value | | | Shares | Value |
| HEALTH CARE EQUIPMENT & SUPPLIES — 3.1% | | IT SERVICES — 0.6% | | |
| Beckman Coulter, Inc. | 103,456 | $ 6,497,037 | | Automatic Data | | |
| Boston Scientific Corp.(1) | 450,400 | | 3,251,888 | | Processing, Inc. | 88,200 | $ 3,922,254 |
| CareFusion Corp.(1) | 46,400 | | 1,226,352 | | LEISURE EQUIPMENT & PRODUCTS — 0.3% | |
| Symmetry Medical, Inc.(1) | 374,471 | | 3,759,689 | | Mattel, Inc. | 95,700 | 2,176,218 |
| Zimmer Holdings, Inc.(1) | 81,200 | | 4,807,040 | | MACHINERY — 3.2% | | |
| | | | | | Altra Holdings, Inc.(1) | 462,161 | 6,345,470 |
| | | | 19,542,006 | | | | |
| HEALTH CARE PROVIDERS & SERVICES — 1.9% | | Dover Corp. | 41,100 | 1,921,425 |
| Cardinal Health, Inc. | 26,400 | | 951,192 | | Kaydon Corp. | 272,956 | 10,263,146 |
| LifePoint Hospitals, Inc.(1) | 160,900 | | 5,917,902 | | Robbins & Myers, Inc. | 68,000 | 1,619,760 |
| Patterson Cos., Inc. | 58,700 | | 1,822,635 | | | | 20,149,801 |
| Select Medical | | | | | METALS & MINING — 0.9% | | |
| Holdings Corp.(1) | 418,178 | | 3,529,422 | | Newmont Mining Corp. | 111,138 | 5,660,258 |
| | | | 12,221,151 | | MULTILINE RETAIL — 0.7% | | |
| HOTELS, RESTAURANTS & LEISURE — 3.0% | | | Target Corp. | 90,700 | 4,770,820 |
| CEC Entertainment, Inc.(1) | 163,600 | | 6,231,524 | | MULTI-UTILITIES — 3.8% | | |
| Hyatt Hotels Corp., | | | | | PG&E Corp. | 203,500 | 8,632,470 |
| Class A(1) | 65,301 | | 2,544,127 | | Wisconsin Energy Corp. | 225,500 | 11,141,955 |
| International Speedway | | | | | Xcel Energy, Inc. | 222,859 | 4,724,611 |
| Corp., Class A | 231,607 | | 5,968,513 | | | | 24,499,036 |
| Speedway Motorsports, Inc. | 284,143 | | 4,435,472 | | OIL, GAS & CONSUMABLE FUELS — 8.8% | |
| | | | 19,179,636 | | Apache Corp. | 15,151 | 1,537,826 |
| HOUSEHOLD DURABLES — 1.4% | | | | Devon Energy Corp. | 74,100 | 4,774,263 |
| Fortune Brands, Inc. | 143,800 | | 6,975,738 | | EQT Corp. | 247,357 | 10,141,637 |
| Toll Brothers, Inc.(1) | 91,400 | | 1,901,120 | | Imperial Oil Ltd. | 486,600 | 18,795,174 |
| | | | 8,876,858 | | Inergy LP | 34,053 | 1,287,203 |
| HOUSEHOLD PRODUCTS — 2.8% | | | | Murphy Oil Corp. | 130,600 | 7,338,414 |
| Clorox Co. | 24,900 | | 1,597,086 | | Noble Energy, Inc. | 63,500 | 4,635,500 |
| Kimberly-Clark Corp. | 258,723 | | 16,268,502 | | Ultra Petroleum Corp.(1) | 61,600 | 2,872,408 |
| | | | 17,865,588 | | Williams Pipeline | | |
| INDUSTRIAL CONGLOMERATES — 0.6% | | | | Partners LP | 57,800 | 1,748,450 |
| Tyco International Ltd. | 108,400 | | 4,146,300 | | XTO Energy, Inc. | 68,900 | 3,250,702 |
| INSURANCE — 13.3% | | | | | | | 56,381,577 |
| ACE Ltd. | 175,800 | | 9,194,340 | | PAPER & FOREST PRODUCTS — 0.8% | |
| Allstate Corp. (The) | 191,600 | | 6,190,596 | | MeadWestvaco Corp. | 64,500 | 1,647,975 |
| Aon Corp. | 404,500 | | 17,276,195 | | Weyerhaeuser Co. | 72,936 | 3,301,813 |
| Chubb Corp. (The) | 236,900 | | 12,283,265 | | | | 4,949,788 |
| Hartford Financial Services | | | | | REAL ESTATE INVESTMENT TRUSTS (REITs) — 3.9% |
| Group, Inc. (The) | 79,136 | | 2,249,045 | | Annaly Capital | | |
| HCC Insurance | | | | | Management, Inc. | 247,700 | 4,255,486 |
| Holdings, Inc. | 228,932 | | 6,318,523 | | Boston Properties, Inc. | 45,299 | 3,417,356 |
| Marsh & McLennan | | | | | Government Properties | | |
| Cos., Inc. | 621,727 | | 15,182,573 | | Income Trust | 182,289 | 4,741,337 |
| Primerica, Inc.(1) | 27,731 | | 415,965 | | HCP, Inc. | 46,100 | 1,521,300 |
| Symetra Financial Corp.(1) | 226,978 | | 2,991,570 | | Host Hotels & Resorts, Inc. | 412,869 | 6,048,531 |
| Transatlantic Holdings, Inc. | 120,558 | | 6,365,463 | | Piedmont Office Realty | | |
| Travelers Cos., Inc. (The) | 123,400 | | 6,656,196 | | Trust, Inc., Class A | 245,962 | 4,882,346 |
| | | | 85,123,731 | | | | 24,866,356 |
18
| | | | | | |
| Mid Cap Value | | | | | | |
| |
| | Shares | Value | | | Shares | Value |
| ROAD & RAIL — 0.2% | | | | Temporary Cash Investments — 2.6% |
| Heartland Express, Inc. | 96,700 | $ 1,595,550 | | | | |
| | | | | JPMorgan U.S. Treasury | | |
| SEMICONDUCTORS & SEMICONDUCTOR | | | Plus Money Market Fund | | |
| EQUIPMENT — 2.8% | | | | Agency Shares | 31,830 | $ 31,830 |
| Applied Materials, Inc. | 695,700 | 9,378,036 | | Repurchase Agreement, Bank of America | |
| KLA-Tencor Corp. | 163,000 | 5,039,960 | | Securities, LLC, (collateralized by various | |
| Verigy Ltd.(1) | 295,300 | 3,301,454 | | U.S. Treasury obligations, 3.125%, 1/31/17, | |
| | | 17,719,450 | | valued at $17,300,678), in a joint trading | |
| | | | | account at 0.01%, dated 3/31/10, due | |
| SOFTWARE — 1.2% | | | | 4/1/10 (Delivery value $16,900,005) | 16,900,000 |
| Cadence Design | | | | TOTAL TEMPORARY | | |
| Systems, Inc.(1) | 634,300 | 4,224,438 | | CASH INVESTMENTS | | |
| SS&C Technologies | | | | (Cost $16,931,830) | | 16,931,830 |
| Holdings, Inc.(1) | 23,313 | 351,560 | | TOTAL INVESTMENT | | |
| Synopsys, Inc.(1) | 136,600 | 3,055,742 | | SECURITIES — 100.3% | | |
| | | 7,631,740 | | (Cost $557,613,324) | | 641,556,321 |
| SPECIALTY RETAIL — 3.0% | | | | OTHER ASSETS | | |
| | | | | AND LIABILITIES — (0.3)% | | (2,175,502) |
| Lowe’s Cos., Inc. | 533,600 | 12,934,464 | | | | |
| | | | | TOTAL NET ASSETS — 100.0% | | $639,380,819 |
| PetSmart, Inc. | 186,200 | 5,950,952 | | | | |
| | | 18,885,416 | | | | |
| THRIFTS & MORTGAGE FINANCE — 2.1% | | | | | |
| Hudson City Bancorp., Inc. | 340,000 | 4,814,400 | | | | |
| Northwest Bancshares, Inc. | 249,659 | 2,930,997 | | | | |
| People’s United | | | | | | |
| Financial, Inc. | 353,889 | 5,534,824 | | | | |
| | | 13,280,221 | | | | |
| TOTAL COMMON STOCKS | | | | | | |
| (Cost $540,681,494) | | 624,624,491 | | | | |
| | | |
| Forward Foreign Currency Exchange Contracts | | |
| Contracts to Sell | Settlement Date | Value | Unrealized Gain (Loss) |
| 17,981,246 CAD for USD | 4/30/10 | $17,704,176 | $(43,125) |
| (Value on Settlement Date $17,661,051) | | | |
| |
| Notes to Schedule of Investments | | |
| CAD = Canadian Dollar | | | |
| USD = United States Dollar | | | |
| (1) Non-income producing. | | | |
| |
| Industry classifications are unaudited. | | | |
| |
| See Notes to Financial Statements. | | | |
19
| | | | | | |
| Small Cap Value | | | | | |
| |
| MARCH 31, 2010 | | | | | | |
| | Shares | Value | | | Shares | Value |
| Common Stocks — 94.4% | | | Investment Technology | | |
| | | | | Group, Inc.(1) | 275,000 | $ 4,589,750 |
| AEROSPACE & DEFENSE — 2.4% | | | Knight Capital Group, Inc., | | |
| AAR Corp.(1) | 150,000 | $ 3,723,000 | | Class A(1) | 190,000 | 2,897,500 |
| AeroVironment, Inc.(1) | 86,097 | 2,247,993 | | MCG Capital Corp.(1) | 750,000 | 3,907,500 |
| Ceradyne, Inc.(1) | 160,000 | 3,630,400 | | PennantPark | | |
| Curtiss-Wright Corp. | 555,000 | 19,314,000 | | Investment Corp. | 410,000 | 4,247,600 |
| Esterline | | | | Piper Jaffray Cos.(1) | 120,000 | 4,836,000 |
| Technologies Corp.(1) | 80,000 | 3,954,400 | | Prospect Capital Corp. | 445,000 | 5,406,750 |
| Moog, Inc., Class A(1) | 265,000 | 9,386,300 | | Pzena Investment | | |
| Triumph Group, Inc. | 80,000 | 5,607,200 | | Management, Inc., Class A(1) | 420,000 | 3,204,600 |
| | | 47,863,293 | | TradeStation Group, Inc.(1) | 765,000 | 5,362,650 |
| AIR FREIGHT & LOGISTICS — 0.2% | | | | | 77,050,100 |
| UTi Worldwide, Inc. | 265,000 | 4,059,800 | | CHEMICALS — 2.8% | | |
| AIRLINES — 0.4% | | | | A. Schulman, Inc. | 115,000 | 2,814,050 |
| Allegiant Travel Co.(1) | 50,000 | 2,893,000 | | Arch Chemicals, Inc. | 170,000 | 5,846,300 |
| JetBlue Airways Corp.(1) | 545,000 | 3,041,100 | | Cytec Industries, Inc. | 95,000 | 4,440,300 |
| SkyWest, Inc. | 190,000 | 2,713,200 | | Ferro Corp.(1) | 340,000 | 2,988,600 |
| | | 8,647,300 | | Georgia Gulf Corp.(1) | 175,000 | 3,235,750 |
| AUTO COMPONENTS — 0.7% | | | | H.B. Fuller Co. | 195,000 | 4,525,950 |
| ArvinMeritor, Inc.(1) | 230,000 | 3,070,500 | | Intrepid Potash, Inc.(1) | 165,000 | 5,004,450 |
| Cooper Tire & Rubber Co. | 150,000 | 2,853,000 | | Kraton Performance | | |
| | | | | Polymers, Inc.(1) | 220,000 | 3,929,200 |
| Dana Holding Corp.(1) | 240,000 | 2,851,200 | | | | |
| Lear Corp.(1) | 35,000 | 2,777,250 | | Minerals Technologies, Inc. | 40,000 | 2,073,600 |
| Standard Motor | | | | Olin Corp. | 305,000 | 5,984,100 |
| Products, Inc. | 325,000 | 3,224,000 | | OM Group, Inc.(1) | 110,000 | 3,726,800 |
| | | 14,775,950 | | Sensient Technologies Corp. | 165,000 | 4,794,900 |
| BIOTECHNOLOGY — 0.4% | | | | Solutia, Inc.(1) | 370,000 | 5,960,700 |
| Martek Biosciences Corp.(1) | 85,000 | 1,913,350 | | | | 55,324,700 |
| Talecris Biotherapeutics | | | | COMMERCIAL BANKS — 8.0% | | |
| Holdings Corp.(1) | 260,000 | 5,179,200 | | American National | | |
| | | 7,092,550 | | Bankshares, Inc. | 170,000 | 3,425,500 |
| BUILDING PRODUCTS — 0.6% | | | | Associated Banc-Corp. | 350,000 | 4,830,000 |
| Apogee Enterprises, Inc. | 145,000 | 2,292,450 | | Boston Private Financial | | |
| Griffon Corp.(1) | 285,000 | 3,551,100 | | Holdings, Inc. | 825,000 | 6,080,250 |
| | | | | Citizens Republic | | |
| Simpson Manufacturing | | | | Bancorp., Inc.(1) | 4,075,000 | 4,808,500 |
| Co., Inc. | 215,000 | 5,968,400 | | | | |
| | | | | Community Bank | | |
| | | 11,811,950 | | System, Inc. | 125,000 | 2,847,500 |
| CAPITAL MARKETS — 3.9% | | | | CVB Financial Corp. | 310,000 | 3,078,300 |
| Apollo Investment Corp. | 600,000 | 7,638,000 | | East West Bancorp., Inc. | 215,000 | 3,745,300 |
| Ares Capital Corp. | 690,000 | 10,239,600 | | First Citizens BancShares, | | |
| Artio Global Investors, Inc. | 270,000 | 6,679,800 | | Inc., Class A | 15,000 | 2,981,400 |
| Calamos Asset Management, | | | | First Horizon | | |
| Inc., Class A | 405,000 | 5,807,700 | | National Corp.(1) | 350,001 | 4,917,508 |
| E*TRADE Financial Corp.(1) | 2,525,000 | 4,166,250 | | First Interstate | | |
| Fifth Street Finance Corp. | 330,000 | 3,831,300 | | Bancsystem, Inc. | 190,000 | 3,087,500 |
| HFF, Inc., Class A(1) | 570,000 | 4,235,100 | | First Midwest Bancorp., Inc. | 290,000 | 3,929,500 |
20
| | | | | | |
| Small Cap Value | | | | | | |
| |
| | Shares | Value | | | Shares | Value |
| FirstMerit Corp. | 270,000 | $ 5,823,900 | | NCR Corp.(1) | 200,000 | $ 2,760,000 |
| FNB Corp. | 420,000 | 3,406,200 | | Novatel Wireless, Inc.(1) | 610,000 | 4,105,300 |
| Fulton Financial Corp. | 950,000 | 9,680,500 | | | | 15,392,250 |
| Hampton Roads | | | | CONSTRUCTION & ENGINEERING — 2.0% | |
| Bankshares, Inc. | 355,000 | 553,800 | | Comfort Systems USA, Inc. | 290,000 | 3,622,100 |
| Heritage Financial Corp.(1) | 345,000 | 5,206,050 | | | | |
| | | | | EMCOR Group, Inc.(1) | 240,000 | 5,911,200 |
| Huntington Bancshares, Inc. | 890,000 | 4,779,300 | | Granite Construction, Inc. | 675,000 | 20,398,500 |
| IBERIABANK Corp. | 50,000 | 3,000,500 | | KBR, Inc. | 140,000 | 3,102,400 |
| KeyCorp | 375,000 | 2,906,250 | | Pike Electric Corp.(1) | 620,000 | 5,778,400 |
| Lakeland Financial Corp. | 240,000 | 4,572,000 | | | | 38,812,600 |
| Marshall & Ilsley Corp. | 1,100,000 | 8,855,000 | | CONSTRUCTION MATERIALS — 0.5% | |
| MB Financial, Inc. | 130,000 | 2,928,900 | | Martin Marietta | | |
| National Bankshares, Inc. | 110,000 | 2,997,500 | | Materials, Inc. | 45,000 | 3,759,750 |
| Old National Bancorp. | 345,000 | 4,122,750 | | Texas Industries, Inc. | 155,000 | 5,296,350 |
| Pacific Continental Corp. | 280,000 | 2,940,000 | | | | 9,056,100 |
| Sterling Bancorp, Class N | 20,000 | 201,000 | | CONTAINERS & PACKAGING — 0.6% | |
| Sterling Bancshares, Inc. | 1,775,000 | 9,904,500 | | Silgan Holdings, Inc. | 65,000 | 3,914,950 |
| Trico Bancshares | 150,000 | 2,985,000 | | Sonoco Products Co. | 235,000 | 7,235,650 |
| Trustmark Corp. | 120,000 | 2,931,600 | | | | 11,150,600 |
| United Bankshares, Inc. | 150,000 | 3,933,000 | | DISTRIBUTORS — 0.2% | | |
| Washington Banking Co. | 435,000 | 5,476,650 | | Core-Mark Holding | | |
| Webster Financial Corp. | 270,000 | 4,722,300 | | Co., Inc.(1) | 105,000 | 3,214,050 |
| Whitney Holding Corp. | 790,000 | 10,894,100 | | DIVERSIFIED — 2.3% | | |
| Wilmington Trust Corp. | 430,000 | 7,125,100 | | iShares Russell 2000 | | |
| Wintrust Financial Corp. | 95,000 | 3,534,950 | | Index Fund | 90,000 | 6,102,900 |
| | | 157,212,108 | | iShares Russell 2000 Value | | |
| COMMERCIAL SERVICES & SUPPLIES — 1.8% | | Index Fund | 615,000 | 39,261,600 |
| ABM Industries, Inc. | 190,000 | 4,028,000 | | | | 45,364,500 |
| | | | | DIVERSIFIED CONSUMER SERVICES — 1.0% | |
| ATC Technology Corp.(1) | 170,000 | 2,917,200 | | | | |
| | | | | Corinthian Colleges, Inc.(1) | 470,000 | 8,267,300 |
| Brink’s Co. (The) | 235,000 | 6,634,050 | | | | |
| | | | | Lincoln Educational | | |
| IESI-BFC Ltd. | 640,000 | 10,976,000 | | Services Corp.(1) | 255,000 | 6,451,500 |
| SYKES Enterprises, Inc.(1) | 170,000 | 3,882,800 | | Regis Corp. | 240,000 | 4,483,200 |
| US Ecology, Inc. | 450,000 | 7,245,000 | | | | 19,202,000 |
| | | 35,683,050 | | DIVERSIFIED TELECOMMUNICATION | |
| COMMUNICATIONS EQUIPMENT — 0.8% | | | SERVICES — 0.2% | | |
| Bel Fuse, Inc., Class B | 235,000 | 4,735,250 | | Atlantic Tele-Network, Inc. | 90,000 | 4,043,700 |
| Calix, Inc.(1) | 59,775 | 803,974 | | ELECTRIC UTILITIES — 1.8% | | |
| Emulex Corp.(1) | 215,000 | 2,855,200 | | Central Vermont Public | | |
| Opnext, Inc.(1) | 700,000 | 1,652,000 | | Service Corp. | 190,000 | 3,832,300 |
| Polycom, Inc.(1) | 195,000 | 5,963,100 | | Great Plains Energy, Inc. | 570,000 | 10,584,900 |
| | | 16,009,524 | | IDACORP, Inc. | 75,000 | 2,596,500 |
| COMPUTERS & PERIPHERALS — 0.8% | | | Portland General Electric Co. | 680,000 | 13,130,800 |
| Electronics for | | | | Unitil Corp. | 120,000 | 2,790,000 |
| Imaging, Inc.(1) | 485,000 | 5,640,550 | | Westar Energy, Inc. | 125,000 | 2,787,500 |
| Lexmark International, Inc., | | | | | | 35,722,000 |
| Class A(1) | 80,000 | 2,886,400 | | | | |
21
| | | | | | |
| Small Cap Value | | | | | | |
| |
| | Shares | Value | | | Shares | Value |
| ELECTRICAL EQUIPMENT — 2.7% | | | FOOD PRODUCTS — 0.8% | | |
| Acuity Brands, Inc. | 115,000 | $ 4,854,150 | | American Italian Pasta Co., | | |
| Belden, Inc. | 220,000 | 6,041,200 | | Class A(1) | 70,000 | $ 2,720,900 |
| Brady Corp., Class A | 190,000 | 5,912,800 | | B&G Foods, Inc., Class A | 270,000 | 2,829,600 |
| Encore Wire Corp. | 380,000 | 7,904,000 | | Farmer Bros. Co. | 160,000 | 2,998,400 |
| General Cable Corp.(1) | 105,000 | 2,835,000 | | Seneca Foods Corp., | | |
| | | | | Class A(1) | 155,835 | 4,537,915 |
| GrafTech International Ltd.(1) | 310,000 | 4,237,700 | | | | |
| | | | | TreeHouse Foods, Inc.(1) | 65,000 | 2,851,550 |
| Hubbell, Inc., Class B | 60,000 | 3,025,800 | | | | |
| | | | | | | 15,938,365 |
| II-VI, Inc.(1) | 160,000 | 5,414,400 | | | | |
| | | | | GAS UTILITIES — 0.6% | | |
| LSI Industries, Inc. | 740,000 | 5,046,800 | | Chesapeake Utilities Corp. | 105,000 | 3,129,000 |
| Regal-Beloit Corp. | 85,000 | 5,049,850 | | Nicor, Inc. | 70,000 | 2,934,400 |
| Thomas & Betts Corp.(1) | 100,000 | 3,924,000 | | | | |
| | | | | WGL Holdings, Inc. | 140,000 | 4,851,000 |
| | | 54,245,700 | | | | 10,914,400 |
| ELECTRONIC EQUIPMENT, INSTRUMENTS & | | | | | |
| COMPONENTS — 2.3% | | | | HEALTH CARE EQUIPMENT & SUPPLIES — 1.8% |
| Anixter International, Inc.(1) | 65,000 | 3,045,250 | | Analogic Corp. | 70,000 | 2,991,100 |
| | | | | CONMED Corp.(1) | 85,000 | 2,023,850 |
| Benchmark | | | | | | |
| Electronics, Inc.(1) | 260,000 | 5,392,400 | | Cutera, Inc.(1)(2) | 690,000 | 7,155,300 |
| Coherent, Inc.(1) | 90,000 | 2,876,400 | | Utah Medical Products, Inc. | 155,000 | 4,360,150 |
| Electro Scientific | | | | Young Innovations, Inc.(2) | 679,235 | 19,127,258 |
| Industries, Inc.(1) | 455,000 | 5,828,550 | | | | 35,657,658 |
| Littelfuse, Inc.(1) | 17,072 | 648,907 | | HEALTH CARE PROVIDERS & SERVICES — 3.0% |
| Methode Electronics, Inc. | 300,000 | 2,970,000 | | Alliance HealthCare | | |
| Molex, Inc. | 200,000 | 4,172,000 | | Services, Inc.(1) | 1,000,000 | 5,620,000 |
| Park Electrochemical Corp. | 160,000 | 4,598,400 | | Almost Family, Inc.(1) | 80,000 | 3,015,200 |
| PC Connection, Inc.(1) | 485,000 | 3,007,000 | | AMERIGROUP Corp.(1) | 115,000 | 3,822,600 |
| Rogers Corp.(1) | 270,000 | 7,832,700 | | Amsurg Corp.(1) | 300,000 | 6,477,000 |
| TTM Technologies, Inc.(1) | 330,000 | 2,930,400 | | Assisted Living Concepts, | | |
| | | | | Inc., Class A(1) | 140,000 | 4,597,600 |
| Vishay | | | | | | |
| Intertechnology, Inc.(1) | 170,000 | 1,739,100 | | Health Management | | |
| | | | | Associates, Inc., Class A(1) | 800,000 | 6,880,000 |
| | | 45,041,107 | | | | |
| | | | | Kindred Healthcare, Inc.(1) | 155,000 | 2,797,750 |
| ENERGY EQUIPMENT & SERVICES — 1.8% | | | | | |
| | | | | LifePoint Hospitals, Inc.(1) | 120,000 | 4,413,600 |
| Bristow Group, Inc.(1) | 125,000 | 4,716,250 | | | | |
| Global Industries Ltd.(1) | 460,000 | 2,953,200 | | Magellan Health | | |
| | | | | Services, Inc.(1) | 180,000 | 7,826,400 |
| Helix Energy Solutions | | | | National Healthcare Corp. | 245,000 | 8,668,100 |
| Group, Inc.(1) | 380,000 | 4,951,400 | | | | |
| | | | | U.S. Physical Therapy, Inc.(1) | 300,000 | 5,220,000 |
| Key Energy Services, Inc.(1) | 525,000 | 5,013,750 | | | | |
| North American Energy | | | | | | 59,338,250 |
| Partners, Inc.(1) | 260,000 | 2,493,400 | | HOTELS, RESTAURANTS & LEISURE — 1.7% | |
| Rowan Cos., Inc.(1) | 190,000 | 5,530,900 | | Bally Technologies, Inc.(1) | 180,000 | 7,297,200 |
| Superior Energy | | | | Bob Evans Farms, Inc. | 155,000 | 4,791,050 |
| Services, Inc.(1) | 250,000 | 5,255,000 | | Gaylord Entertainment Co.(1) | 150,000 | 4,393,500 |
| Unit Corp.(1) | 115,000 | 4,862,200 | | Jack in the Box, Inc.(1) | 190,000 | 4,474,500 |
| | | 35,776,100 | | Life Time Fitness, Inc.(1) | 150,000 | 4,215,000 |
| FOOD & STAPLES RETAILING — 0.6% | | | Red Robin Gourmet | | |
| Ruddick Corp. | 95,000 | 3,005,800 | | Burgers, Inc.(1) | 190,000 | 4,643,600 |
| Weis Markets, Inc. | 240,000 | 8,726,400 | | Ruby Tuesday, Inc.(1) | 375,000 | 3,963,750 |
| | | 11,732,200 | | | | 33,778,600 |
22
| | | | | | |
| Small Cap Value | | | | | | |
| |
| | Shares | Value | | | Shares | Value |
| HOUSEHOLD DURABLES — 1.3% | | | IT SERVICES — 1.2% | | |
| CSS Industries, Inc | 140,000 | $ 2,814,000 | | CACI International, Inc., | | |
| Ethan Allen Interiors, Inc. | 280,000 | 5,776,400 | | Class A(1) | 95,000 | $ 4,640,750 |
| Furniture Brands | | | | Cass Information | | |
| International, Inc.(1) | 775,000 | 4,983,250 | | Systems, Inc. | 125,000 | 3,893,750 |
| Helen of Troy Ltd.(1) | 115,000 | 2,996,900 | | DST Systems, Inc. | 285,000 | 11,813,250 |
| M.D.C. Holdings, Inc. | 80,000 | 2,768,800 | | Total System Services, Inc. | 230,000 | 3,601,800 |
| M/I Homes, Inc.(1) | 225,000 | 3,296,250 | | | | 23,949,550 |
| Standard Pacific Corp.(1) | 650,000 | 2,938,000 | | LEISURE EQUIPMENT & PRODUCTS — 0.5% | |
| | | | | JAKKS Pacific, Inc.(1) | 215,000 | 2,805,750 |
| | | 25,573,600 | | | | |
| HOUSEHOLD PRODUCTS — 0.5% | | | RC2 Corp.(1) | 185,000 | 2,769,450 |
| Cellu Tissue Holdings, Inc.(1) | 500,000 | 4,990,000 | | Sport Supply Group, Inc. | 265,000 | 3,561,600 |
| WD-40 Co. | 140,000 | 4,596,200 | | | | 9,136,800 |
| | | 9,586,200 | | LIFE SCIENCES TOOLS & SERVICES — 0.5% | |
| INDUSTRIAL CONGLOMERATES — 0.1% | | | Pharmaceutical Product | | |
| | | | | Development, Inc. | 435,000 | 10,331,250 |
| Tredegar Corp. | 160,000 | 2,732,800 | | MACHINERY — 4.3% | | |
| INSURANCE — 5.1% | | | | Actuant Corp., Class A | 295,000 | 5,767,250 |
| American Equity Investment | | | | | | |
| Life Holding Co. | 310,000 | 3,301,500 | | Barnes Group, Inc. | 310,000 | 6,029,500 |
| Aspen Insurance | | | | CLARCOR, Inc. | 110,000 | 3,793,900 |
| Holdings Ltd. | 140,000 | 4,037,600 | | Dynamic Materials Corp. | 300,000 | 4,686,000 |
| Assured Guaranty Ltd. | 275,000 | 6,041,750 | | FreightCar America, Inc. | 170,000 | 4,107,200 |
| Baldwin & Lyons, Inc., | | | | IDEX Corp. | 90,000 | 2,979,000 |
| Class B | 235,000 | 5,661,150 | | Kadant, Inc.(1) | 180,000 | 2,593,800 |
| Delphi Financial Group, Inc., | | | | Kaydon Corp. | 80,000 | 3,008,000 |
| Class A | 125,000 | 3,145,000 | | Kennametal, Inc. | 195,000 | 5,483,400 |
| Erie Indemnity Co., Class A | 290,000 | 12,507,700 | | Lincoln Electric | | |
| Hanover Insurance | | | | Holdings, Inc. | 145,000 | 7,877,850 |
| Group, Inc. (The) | 145,000 | 6,323,450 | | Mueller Industries, Inc. | 740,000 | 19,824,600 |
| HCC Insurance | | | | Mueller Water Products, | | |
| Holdings, Inc. | 550,000 | 15,180,000 | | Inc., Class A | 1,360,000 | 6,500,800 |
| Max Capital Group Ltd. | 185,000 | 4,253,150 | | Pentair, Inc. | 110,000 | 3,918,200 |
| Mercer Insurance | | | | RBC Bearings, Inc.(1) | 120,000 | 3,824,400 |
| Group, Inc.(2) | 361,253 | 6,502,554 | | | | |
| Platinum Underwriters | | | | Robbins & Myers, Inc. | 195,000 | 4,644,900 |
| Holdings Ltd. | 195,000 | 7,230,600 | | | | 85,038,800 |
| Primerica, Inc.(1) | 86,608 | 1,299,120 | | MARINE — 0.4% | | |
| ProAssurance Corp.(1) | 105,000 | 6,146,700 | | Diana Shipping, Inc.(1) | 400,000 | 6,048,000 |
| Symetra Financial Corp.(1) | 75,000 | 988,500 | | Genco Shipping | | |
| | | | | & Trading Ltd.(1) | 135,000 | 2,849,850 |
| United Fire & Casualty Co. | 255,000 | 4,587,450 | | | | |
| Unitrin, Inc. | 175,000 | 4,908,750 | | | | 8,897,850 |
| Validus Holdings Ltd. | 150,000 | 4,129,500 | | MEDIA — 2.9% | | |
| Zenith National | | | | Arbitron, Inc. | 185,000 | 4,932,100 |
| Insurance Corp. | 105,000 | 4,023,600 | | Belo Corp., Class A | 585,000 | 3,989,700 |
| | | 100,268,074 | | E.W. Scripps Co. (The), | | |
| | | | | Class A(1) | 1,075,000 | 9,083,750 |
| INTERNET SOFTWARE & SERVICES — 0.2% | | | | | |
| | | | | Entercom Communications | | |
| IAC/InterActiveCorp(1) | 170,000 | 3,865,800 | | Corp., Class A(1) | 90,000 | 1,070,100 |
23
| | | | | | |
| Small Cap Value | | | | | |
| |
| | Shares | Value | | | Shares | Value |
| Entravision Communications | | | | Penn Virginia Corp. | 135,000 | $ 3,307,500 |
| Corp., Class A(1) | 2,680,000 | $ 7,396,800 | | Rosetta Resources, Inc.(1) | 165,000 | 3,885,750 |
| Harte-Hanks, Inc. | 305,000 | 3,922,300 | | W&T Offshore, Inc. | 2,360,000 | 19,824,000 |
| Journal Communications, | | | | | | 83,060,750 |
| Inc., Class A(1) | 1,350,000 | 5,670,000 | | | | |
| | | | | PAPER & FOREST PRODUCTS — 0.8% | |
| Knology, Inc.(1) | 210,000 | 2,822,400 | | | | |
| | | | | Domtar Corp.(1) | 85,000 | 5,474,850 |
| LIN TV Corp., Class A(1) | 1,725,190 | 9,919,842 | | | | |
| | | | | Louisiana-Pacific Corp.(1) | 375,000 | 3,393,750 |
| McClatchy Co. (The), | | | | | | |
| Class A(1) | 1,275,000 | 6,260,250 | | P.H. Glatfelter Co. | 235,000 | 3,405,150 |
| Sinclair Broadcast Group, | | | | Schweitzer-Mauduit | | |
| Inc., Class A(1) | 75,000 | 381,000 | | International, Inc. | 70,000 | 3,329,200 |
| Value Line, Inc. | 92,498 | 2,135,779 | | | | 15,602,950 |
| | | 57,584,021 | | PERSONAL PRODUCTS — 0.5% | |
| METALS & MINING — 2.2% | | | | Inter Parfums, Inc. | 255,000 | 3,779,100 |
| Brush Engineered | | | | Prestige Brands | | |
| Materials, Inc.(1) | 175,000 | 3,949,750 | | Holdings, Inc.(1) | 465,000 | 4,185,000 |
| Carpenter Technology Corp. | 90,000 | 3,294,000 | | Schiff Nutrition | | |
| | | | | International, Inc. | 290,000 | 2,372,200 |
| Coeur d’Alene Mines Corp.(1) | 230,000 | 3,445,400 | | | | |
| | | | | | | 10,336,300 |
| Commercial Metals Co. | 240,000 | 3,614,400 | | PHARMACEUTICALS — 0.5% | | |
| Haynes International, Inc. | 225,000 | 7,994,250 | | Biovail Corp. | 175,000 | 2,934,750 |
| Kaiser Aluminum Corp. | 75,000 | 2,892,750 | | Endo Pharmaceuticals | | |
| Mesabi Trust | 130,000 | 3,179,800 | | Holdings, Inc.(1) | 165,000 | 3,908,850 |
| Royal Gold, Inc. | 100,000 | 4,621,000 | | Par Pharmaceutical | | |
| RTI International | | | | Cos., Inc.(1) | 95,000 | 2,356,000 |
| Metals, Inc.(1) | 135,000 | 4,094,550 | | | | 9,199,600 |
| Schnitzer Steel Industries, | | | | PROFESSIONAL SERVICES — 1.0% | |
| Inc., Class A | 75,000 | 3,939,750 | | CDI Corp. | 255,579 | 3,746,788 |
| Worthington Industries, Inc. | 195,000 | 3,371,550 | | Heidrick & Struggles | | |
| | | 44,397,200 | | International, Inc. | 120,000 | 3,363,600 |
| MULTILINE RETAIL — 0.4% | | | | Korn/Ferry International(1) | 155,000 | 2,735,750 |
| Big Lots, Inc.(1) | 160,000 | 5,827,200 | | Mistras Group, Inc.(1) | 595,000 | 5,944,050 |
| Fred’s, Inc., Class A | 150,000 | 1,797,000 | | Towers Watson & Co., | | |
| | | 7,624,200 | | Class A | 85,000 | 4,037,500 |
| MULTI-UTILITIES — 0.8% | | | | | | 19,827,688 |
| Avista Corp. | 200,000 | 4,142,000 | | REAL ESTATE INVESTMENT TRUSTS (REITs) — 5.7% |
| Black Hills Corp. | 100,000 | 3,035,000 | | American Campus | | |
| MDU Resources Group, Inc. | 210,000 | 4,531,800 | | Communities, Inc. | 105,000 | 2,904,300 |
| NorthWestern Corp. | 140,000 | 3,753,400 | | Capstead Mortgage Corp. | 260,000 | 3,109,600 |
| | | 15,462,200 | | Chimera Investment Corp. | 2,650,000 | 10,308,500 |
| OIL, GAS & CONSUMABLE FUELS — 4.2% | | | DCT Industrial Trust, Inc. | 945,000 | 4,942,350 |
| Berry Petroleum Co., Class A | 170,000 | 4,787,200 | | First Industrial Realty | | |
| | | | | Trust, Inc.(1) | 485,000 | 3,763,600 |
| Bill Barrett Corp.(1) | 190,000 | 5,834,900 | | | | |
| DHT Holdings, Inc. | 1,200,000 | 4,704,000 | | First Potomac Realty Trust | 290,958 | 4,373,099 |
| Forest Oil Corp.(1) | 425,000 | 10,973,500 | | Getty Realty Corp. | 145,000 | 3,393,000 |
| | | | | Government Properties | | |
| Frontier Oil Corp. | 585,000 | 7,897,500 | | Income Trust | 250,000 | 6,502,500 |
| Goodrich Petroleum Corp.(1) | 190,000 | 2,971,600 | | Hatteras Financial Corp. | 105,000 | 2,705,850 |
| Mariner Energy, Inc.(1) | 725,000 | 10,853,250 | | Healthcare Realty Trust, Inc. | 125,000 | 2,911,250 |
| Nordic American Tanker | | | | Hersha Hospitality Trust | 645,000 | 3,341,100 |
| Shipping | 265,000 | 8,021,550 | | | | |
24
| | | | | | |
| Small Cap Value | | | | | |
| |
| | Shares | Value | | | Shares | Value |
| Highwoods Properties, Inc. | 250,000 | $ 7,932,500 | | Compuware Corp.(1) | 450,000 | $ 3,780,000 |
| Inland Real Estate Corp. | 310,000 | 2,836,500 | | Lawson Software, Inc.(1) | 485,000 | 3,205,850 |
| Kilroy Realty Corp. | 140,000 | 4,317,600 | | Parametric | | |
| LaSalle Hotel Properties | 235,000 | 5,475,500 | | Technology Corp.(1) | 725,000 | 13,086,250 |
| Lexington Realty Trust | 850,000 | 5,533,500 | | Quest Software, Inc.(1) | 270,000 | 4,803,300 |
| Medical Properties | | | | Radiant Systems, Inc.(1) | 420,000 | 5,993,400 |
| Trust, Inc. | 255,000 | 2,672,400 | | S1 Corp.(1) | 820,000 | 4,838,000 |
| MFA Financial, Inc. | 1,200,000 | 8,832,000 | | SS&C Technologies | | |
| National Health | | | | Holdings, Inc.(1) | 72,973 | 1,100,433 |
| Investors, Inc. | 105,000 | 4,069,800 | | Sybase, Inc.(1) | 165,000 | 7,692,300 |
| National Retail | | | | THQ, Inc.(1) | 330,000 | 2,313,300 |
| Properties, Inc. | 130,000 | 2,967,900 | | | | |
| | | | | TIBCO Software, Inc.(1) | 350,000 | 3,776,500 |
| Omega Healthcare | | | | | | |
| Investors, Inc. | 195,000 | 3,800,550 | | Ulticom, Inc.(2) | 577,353 | 5,585,890 |
| Piedmont Office Realty | | | | | | 63,297,473 |
| Trust, Inc., Class A | 255,000 | 5,061,750 | | SPECIALTY RETAIL — 4.1% | | |
| Saul Centers, Inc. | 80,000 | 3,312,000 | | Aaron’s, Inc. | 115,000 | 3,834,100 |
| Urstadt Biddle Properties, | | | | Cabela’s, Inc.(1) | 245,000 | 4,285,050 |
| Inc., Class A | 290,000 | 4,584,900 | | Cato Corp. (The), Class A | 140,000 | 3,001,600 |
| Washington Real Estate | | | | | | |
| Investment Trust | 100,000 | 3,055,000 | | Children’s Place Retail | | |
| | | | | Stores, Inc. (The)(1) | 110,000 | 4,900,500 |
| | | 112,707,049 | | Christopher & Banks Corp. | 730,000 | 5,840,000 |
| ROAD & RAIL — 0.3% | | | | | | |
| | | | | Coldwater Creek, Inc.(1) | 615,000 | 4,268,100 |
| Arkansas Best Corp. | 105,000 | 3,137,400 | | | | |
| | | | | Collective Brands, Inc.(1) | 200,000 | 4,548,000 |
| Old Dominion Freight | | | | | | |
| Line, Inc.(1) | 95,000 | 3,172,050 | | Dress Barn, Inc. (The)(1) | 105,000 | 2,746,800 |
| | | 6,309,450 | | Finish Line, Inc. (The), | | |
| SEMICONDUCTORS & SEMICONDUCTOR | | | Class A | 315,000 | 5,140,800 |
| EQUIPMENT — 2.7% | | | | Genesco, Inc.(1) | 235,000 | 7,287,350 |
| Cohu, Inc. | 170,000 | 2,340,900 | | Group 1 Automotive, Inc.(1) | 110,000 | 3,504,600 |
| Cymer, Inc.(1) | 110,000 | 4,103,000 | | Hot Topic, Inc.(1) | 630,000 | 4,095,000 |
| Integrated Device | | | | Men’s Wearhouse, Inc. (The) | 115,000 | 2,753,100 |
| Technology, Inc.(1) | 820,000 | 5,026,600 | | New York & Co., Inc.(1) | 635,000 | 3,041,650 |
| Intersil Corp., Class A | 320,000 | 4,723,200 | | PEP Boys-Manny Moe | | |
| Mattson Technology, Inc.(1) | 825,000 | 3,811,500 | | & Jack | 270,000 | 2,713,500 |
| MEMC Electronic | | | | Rent-A-Center, Inc.(1) | 125,000 | 2,956,250 |
| Materials, Inc.(1) | 345,000 | 5,288,850 | | Stage Stores, Inc. | 190,000 | 2,924,100 |
| MKS Instruments, Inc.(1) | 145,000 | 2,840,550 | | Systemax, Inc. | 89,221 | 1,939,664 |
| Sigma Designs, Inc.(1) | 465,000 | 5,454,450 | | Vitamin Shoppe, Inc.(1) | 240,000 | 5,388,000 |
| Standard | | | | Wet Seal, Inc. (The), | | |
| Microsystems Corp.(1) | 190,000 | 4,423,200 | | Class A(1) | 1,425,000 | 6,783,000 |
| Varian Semiconductor | | | | | | 81,951,164 |
| Equipment Associates, Inc.(1) | 110,000 | 3,643,200 | | | | |
| | | | | TEXTILES, APPAREL & LUXURY GOODS — 1.0% |
| Verigy Ltd.(1) | 700,000 | 7,826,000 | | | | |
| | | | | Crocs, Inc.(1) | 475,000 | 4,165,750 |
| Zoran Corp.(1) | 270,000 | 2,905,200 | | | | |
| | | | | True Religion Apparel, Inc.(1) | 125,000 | 3,795,000 |
| | | 52,386,650 | | Warnaco Group, Inc. (The)(1) | 110,000 | 5,248,100 |
| SOFTWARE — 3.2% | | | | Weyco Group, Inc. | 75,000 | 1,764,000 |
| Aspen Technology, Inc.(1) | 305,000 | 3,126,250 | | | | |
| | | | | Wolverine World Wide, Inc. | 170,000 | 4,957,200 |
| Cadence Design | | | | | | 19,930,050 |
| Systems, Inc.(1) | 600,000 | 3,996,000 | | | | |
25
| | | | | | | |
| Small Cap Value | | | | | | | |
| |
| | Shares | Value | | | | Shares | Value |
| THRIFTS & MORTGAGE FINANCE — 2.3% | | | Preferred Stocks — 0.6% | |
| Brookline Bancorp., Inc. | 380,000 | $ 4,043,200 | | | | | |
| First Financial Holdings, Inc. | 215,000 | 3,237,900 | | REAL ESTATE INVESTMENT TRUSTS (REITs) — 0.6% |
| | | | | National Retail Properties, | | |
| First Financial | | | | Inc., Series C, 7.375%, | | |
| Northwest, Inc. | 580,000 | 3,961,400 | | 10/12/11(3) | 280,192 | $ 6,640,550 |
| First Niagara Financial | | | | PS Business Parks, Inc., | | |
| Group, Inc. | 620,000 | 8,816,400 | | Series K, 7.95%, 4/9/10(3) | 203,231 | 5,052,323 |
| Flushing Financial Corp. | 250,000 | 3,165,000 | | | | | 11,692,873 |
| K-Fed Bancorp. | 380,000 | 3,389,600 | | TOTAL PREFERRED STOCKS | | |
| PMI Group, Inc. (The)(1) | 725,000 | 3,929,500 | | (Cost $11,109,714) | | 11,692,873 |
| Provident Financial | | | | | | | |
| Services, Inc. | 495,000 | 5,890,500 | | Temporary Cash Investments — 1.9% |
| Radian Group, Inc. | 315,000 | 4,926,600 | | JPMorgan U.S. Treasury | | |
| Washington Federal, Inc. | 215,000 | 4,368,800 | | Plus Money Market Fund | | |
| | | | | Agency Shares | 132,423 | 132,423 |
| | | 45,728,900 | | Repurchase Agreement, Bank of America | |
| TRADING COMPANIES & DISTRIBUTORS — 0.8% | | Securities, LLC, (collateralized by various | |
| GATX Corp. | 115,000 | 3,294,750 | | U.S. Treasury obligations, 3.125%, 1/31/17, | |
| Kaman Corp. | 190,000 | 4,751,900 | | valued at $37,774,852), in a joint trading | |
| | | | | account at 0.01%, dated 3/31/10, due | |
| Lawson Products, Inc. | 240,000 | 3,712,800 | | 4/1/10 (Delivery value $36,900,010) | | 36,900,000 |
| WESCO International, Inc.(1) | 115,000 | 3,991,650 | | TOTAL TEMPORARY | | |
| | | 15,751,100 | | CASH INVESTMENTS | | |
| WATER UTILITIES — 0.2% | | | | (Cost $37,032,423) | | 37,032,423 |
| Artesian Resources Corp., | | | | TOTAL INVESTMENT | | |
| Class A | 230,000 | 4,061,800 | | SECURITIES — 100.3% | | |
| | | | | (Cost $1,636,163,932) | | 1,980,137,186 |
| TOTAL COMMON STOCKS | | | | | | | |
| (Cost $1,532,206,680) | | 1,864,509,774 | | OTHER ASSETS | | |
| | | | | AND LIABILITIES — (0.3)% | | (4,991,487) |
| Convertible Preferred Stocks — 3.4% | | TOTAL NET ASSETS — 100.0% | | $1,975,145,699 |
| INSURANCE — 2.2% | | | | | | | |
| Aspen Insurance Holdings | | | | Notes to Schedule of Investments |
| Ltd., Series AHL, | | | | (1) | Non-income producing. | | |
| 5.625%, 12/31/49(3) | 780,000 | 43,680,000 | | (2) | Affiliated Company: the fund’s holding represents ownership of 5% or |
| LEISURE EQUIPMENT & PRODUCTS — 0.3% | | | more of the voting securities of the company; therefore, the company |
| Callaway Golf Co., Series B, | | | | | is affiliated as defined in the Investment Company Act of 1940. |
| 7.50%, 6/15/12(3)(4) | 40,000 | 5,560,000 | | (3) | Perpetual security. These securities do not have a predetermined |
| MEDIA — 0.3% | | | | | maturity date. The coupon rates are fixed for a period of time and |
| | | | | | may be structured to adjust thereafter. Interest reset or next call |
| LodgeNet Interactive Corp., | | | | | date is indicated, as applicable. | | |
| 10.00%, 12/31/49(3)(4) | 2,516 | 4,997,405 | | | | | |
| REAL ESTATE INVESTMENT TRUSTS (REITs) — 0.3% | | (4) | Security was purchased under Rule 144A of the Securities Act of |
| | | | | | 1933 or is a private placement and, unless registered under the |
| Entertainment Properties | | | | | Act or exempted from registration, may only be sold to qualified |
| Trust, Series E, | | | | | institutional investors. The aggregate value of these securities at |
| 9.00%, 4/20/13(3) | 150,000 | 3,918,000 | | | the period end was $10,557,405, which represented 0.5% of total |
| Lexington Realty Trust, | | | | | net assets. | | |
| Series C, 6.50%, 12/31/49(3) | 70,000 | 2,641,800 | | | | | |
| |
| | | 6,559,800 | | Industry classifications are unaudited. | | |
| TOBACCO — 0.3% | | | | | | | |
| Universal Corp., | | | | | | | |
| 6.75%, 3/15/13(3) | 5,003 | 6,104,911 | | | | | |
| | | | | See Notes to Financial Statements. | | |
| TOTAL CONVERTIBLE | | | | | | | |
| PREFERRED STOCKS | | | | | | | |
| (Cost $55,815,115) | | 66,902,116 | | | | | |
26
|
| Statement of Assets and Liabilities |
| | |
| MARCH 31, 2010 | | |
| | Mid Cap Value | Small Cap Value |
| Assets | | |
| Investment securities — unaffiliated, at value (cost of $557,613,324 | | |
| and $1,592,417,126, respectively) | $641,556,321 | $1,941,766,184 |
| Investment securities — affiliated, at value (cost of $— and | | |
| $43,746,806, respectively) | — | 38,371,002 |
| Total investment securities, at value (cost of $557,613,324 | | |
| and $1,636,163,932, respectively) | 641,556,321 | 1,980,137,186 |
| Receivable for investments sold | 18,443,268 | 12,050,330 |
| Receivable for capital shares sold | 4,502,491 | 1,920,054 |
| Dividends and interest receivable | 1,668,595 | 3,788,164 |
| | 666,170,675 | 1,997,895,734 |
| |
| Liabilities | | |
| Disbursements in excess of demand deposit cash | — | 135 |
| Payable for investments purchased | 25,448,731 | 18,391,428 |
| Payable for capital shares redeemed | 774,579 | 2,314,198 |
| Payable for forward foreign currency exchange contracts | 43,125 | — |
| Accrued management fees | 501,564 | 1,952,900 |
| Distribution fees payable | 16 | 16 |
| Service fees (and distribution fees — A Class and R Class) payable | 21,841 | 91,358 |
| | 26,789,856 | 22,750,035 |
| |
| Net Assets | $639,380,819 | $1,975,145,699 |
| |
| |
| See Notes to Financial Statements. | | |
27
| | |
| MARCH 31, 2010 | | |
| | Mid Cap Value | Small Cap Value |
| Net Assets Consist of: | | |
| Capital (par value and paid-in surplus) | $623,385,185 | $1,902,033,615 |
| Undistributed net investment income | 900,994 | — |
| Accumulated net realized loss on investment | | |
| and foreign currency transactions | (68,807,254) | (270,861,170) |
| Net unrealized appreciation on investments and | | |
| translation of assets and liabilities in foreign currencies | 83,901,894 | 343,973,254 |
| | $639,380,819 | $1,975,145,699 |
| | | |
| Investor Class, $0.01 Par Value | | |
| Net assets | $478,796,118 | $885,942,364 |
| Shares outstanding | 41,974,456 | 110,429,540 |
| Net asset value per share | $11.41 | $8.02 |
| | | |
| Institutional Class, $0.01 Par Value | | |
| Net assets | $68,487,233 | $654,737,974 |
| Shares outstanding | 6,003,134 | 81,298,623 |
| Net asset value per share | $11.41 | $8.05 |
| | | |
| A Class, $0.01 Par Value | | |
| Net assets | $75,435,295 | $434,412,630 |
| Shares outstanding | 6,613,057 | 54,322,517 |
| Net asset value per share | $11.41 | $8.00 |
| Maximum offering price (net asset value divided by 0.9425) | $12.11 | $8.49 |
| | | |
| C Class, $0.01 Par Value | | |
| Net assets | $51,028 | $26,360 |
| Shares outstanding | 4,468 | 3,289 |
| Net asset value per share | $11.42 | $8.01 |
| | | |
| R Class, $0.01 Par Value | | |
| Net assets | $16,611,145 | $26,371 |
| Shares outstanding | 1,456,126 | 3,289 |
| Net asset value per share | $11.41 | $8.02 |
| |
| |
| See Notes to Financial Statements. | | |
28
| | |
| YEAR ENDED MARCH 31, 2010 | | |
| | Mid Cap Value | Small Cap Value |
| Investment Income (Loss) | | |
| Income: | | |
| Dividends (including $— and $9,372,805 respectively, from affiliates | | |
| and net of foreign taxes withheld of $78,196 and $100,476, respectively) | $ 11,820,637 | $ 41,168,761 |
| Interest | 6,556 | 32,024 |
| | 11,827,193 | 41,200,785 |
| | | |
| Expenses: | | |
| Management fees | 4,161,692 | 17,191,070 |
| Distribution fees — C Class | 16 | 16 |
| Service fees — C Class | 5 | 5 |
| Distribution and service fees: | | |
| A Class | 121,573 | 820,306 |
| R Class | 47,327 | 11 |
| Directors’ fees and expenses | 16,751 | 62,170 |
| Other expenses | 5 | 12 |
| | 4,347,369 | 18,073,590 |
| | | |
| Net investment income (loss) | 7,479,824 | 23,127,195 |
| | | |
| Realized and Unrealized Gain (Loss) | | |
| Net realized gain (loss) on: | | |
| Investment transactions (including $— and $(5,377,125) | | |
| from affiliates, respectively) | 47,430,848 | 139,774,597 |
| Foreign currency transactions | (1,180,690) | — |
| | 46,250,158 | 139,774,597 |
| | | |
| Change in net unrealized appreciation (depreciation) on: | | |
| Investments | 121,436,546 | 563,558,090 |
| Translation of assets and liabilities in foreign currencies | (69,913) | — |
| | 121,366,633 | 563,558,090 |
| | | |
| Net realized and unrealized gain (loss) | 167,616,791 | 703,332,687 |
| | | |
| Net Increase (Decrease) in Net Assets Resulting from Operations | $175,096,615 | $726,459,882 |
| |
| |
| See Notes to Financial Statements. | | |
29
|
| Statement of Changes in Net Assets |
| | | | |
| YEARS ENDED MARCH 31, 2010 AND MARCH 31, 2009 | | | |
| | Mid Cap Value | Small Cap Value |
| Increase (Decrease) in Net Assets | 2010 | 2009 | 2010 | 2009 |
| Operations | | | | |
| Net investment income (loss) | $ 7,479,824 | $ 5,984,436 | $ 23,127,195 | $ 22,796,973 |
| Net realized gain (loss) | 46,250,158 | (75,849,439) | 139,774,597 | (282,679,366) |
| Change in net unrealized | | | | |
| appreciation (depreciation) | 121,366,633 | (27,581,130) | 563,558,090 | (165,421,152) |
| Net increase (decrease) in net assets | | | | |
| resulting from operations | 175,096,615 | (97,446,133) | 726,459,882 | (425,303,545) |
| | | | | |
| Distributions to Shareholders | | | | |
| From net investment income: | | | | |
| Investor Class | (4,964,361) | (5,060,283) | (11,478,460) | (10,241,684) |
| Institutional Class | (603,466) | (410,293) | (7,667,831) | (6,416,710) |
| A Class | (619,938) | (457,530) | (4,934,355) | (4,047,581) |
| R Class | (93,212) | (52,176) | — | — |
| From net realized gains: | | | | |
| Investor Class | — | — | — | (1,417,907) |
| Institutional Class | — | — | — | (811,201) |
| A Class | — | — | — | (711,770) |
| Decrease in net assets from distributions | (6,280,977) | (5,980,282) | (24,080,646) | (23,646,853) |
| | | | | |
| Capital Share Transactions | | | | |
| Net increase (decrease) in net assets | | | | |
| from capital share transactions | 211,781,652 | 40,809,631 | 379,590,623 | (47,489,658) |
| | | | | |
| | | | | |
| Net increase (decrease) in net assets | 380,597,290 | (62,616,784) | 1,081,969,859 | (496,440,056) |
| | | | | |
| Net Assets | | | | |
| Beginning of period | 258,783,529 | 321,400,313 | 893,175,840 | 1,389,615,896 |
| End of period | $639,380,819 | $258,783,529 | $1,975,145,699 | $ 893,175,840 |
| | | | | |
| Undistributed net investment income | $900,994 | $84,203 | — | $4,547,075 |
| |
| |
| See Notes to Financial Statements. | | | | |
30
|
| Notes to Financial Statements |
MARCH 31, 2010
1. Organization and Summary of Significant Accounting Policies
Organization — American Century Capital Portfolios, Inc. (the corporation) is registered under the Investment Company Act of 1940 (the 1940 Act) as an open-end management investment company. Mid Cap Value Fund (Mid Cap Value) and Small Cap Value Fund (Small Cap Value) (collectively, the funds) are two funds in a series issued by the corporation. The funds are diversified under the 1940 Act. The funds’ investment objective is to seek long-term capital growth. The production of income is a secondary objective. Mid Cap Value pursues its investment objective by investing in stocks of mid-sized market capitalization companies that management believes to be undervalued at the time of purchase. Small Cap Value pursues its investment objective by investing in stocks of smaller market capitalization companies that management beli eves to be undervalued at the time of purchase. The following is a summary of the funds’ significant accounting policies.
Multiple Class — The funds are authorized to issue the Investor Class, the Institutional Class, the A Class (formerly Advisor Class), the C Class and the R Class. The A Class may incur an initial sales charge. The A Class and C Class may be subject to a contingent deferred sales charge. The share classes differ principally in their respective distribution and shareholder servicing expenses and arrangements. All shares of each fund represent an equal pro rata interest in the net assets of the class to which such shares belong, and have identical voting, dividend, liquidation and other rights and the same terms and conditions, except for class specific expenses and exclusive rights to vote on matters affecting only individual classes. Income, non-class specific expenses, and realized and unrealized capital gains and losses of t he funds are allocated to each class of shares based on their relative net assets. Sale of Mid Cap Value’s C Class commenced on March 1, 2010. Sale of Small Cap Value’s C Class and R Class commenced on March 1, 2010.
Security Valuations — Securities traded primarily on a principal securities exchange are valued at the last reported sales price, or at the mean of the latest bid and asked prices where no last sales price is available. Depending on local convention or regulation, securities traded over-the-counter are valued at the mean of the latest bid and asked prices, the last sales price, or the official close price. Investments in open-end management investment companies are valued at the reported net asset value. Debt securities not traded on a principal securities exchange are valued through a commercial pricing service or at the mean of the most recent bid and asked prices. Discount notes may be valued through a commercial pricing service or at amortized cost, which approximates fair value. Securities traded on foreign securities ex changes and over-the-counter markets are normally completed before the close of business on days that the New York Stock Exchange (the Exchange) is open and may also take place on days when the Exchange is not open. If an event occurs after the value of a security was established but before the net asset value per share was determined that was likely to materially change the net asset value, that security would be valued as determined in accordance with procedures adopted by the Board of Directors. If the funds determine that the market price of a portfolio security is not readily available, or that the valuation methods mentioned above do not reflect the security’s fair value, such security is valued as determined by the Board of Directors or its designee, in accordance with procedures adopted by the Board of Directors, if such determination would materially impact a fund’s net asset value. Certain other circumstances may cause the funds to use alternative procedures to value a security such as: a security has been declared in default; trading in a security has been halted during the trading day; or there is a foreign market holiday and no trading will commence.
Security Transactions — For financial reporting purposes, security transactions are accounted for as of the trade date. Net realized gains and losses are determined on the identified cost basis, which is also used for federal income tax purposes.
31
Investment Income — Dividend income less foreign taxes withheld, if any, is recorded as of the ex-dividend date. Distributions received on securities that represent a return of capital or capital gain are recorded as a reduction of cost of investments and/or as a realized gain. The funds estimate the components of distributions received that may be considered nontaxable distributions or capital gain distributions for income tax purposes. Interest income is recorded on the accrual basis and includes accretion of discounts and amortization of premiums.
Exchange Traded Funds — The funds may invest in exchange traded funds (ETFs). ETFs are a type of index fund bought and sold on a securities exchange. An ETF trades like common stock and represents a fixed portfolio of securities designed to track the performance and dividend yield of a particular domestic or foreign market index. A fund may purchase an ETF to temporarily gain exposure to a portion of the U.S. or a foreign market while awaiting purchase of underlying securities. The risks of owning an ETF generally reflect the risks of owning the underlying securities they are designed to track, although the lack of liquidity on an ETF could result in it being more volatile. Additionally, ETFs have fees and expenses that reduce their value.
Business Development Companies — Small Cap Value may invest in securities of closed-end investment companies that have elected to be treated as a business development company under the 1940 Act. A business development company operates similar to an exchange traded fund and represents a portfolio of securities. Small Cap Value may purchase a business development company to gain exposure to the securities in the underlying portfolio. The risks of owning a business development company generally reflect the risks of owning the underlying securities. Business development companies have expenses that reduce their value.
Foreign Currency Translations — All assets and liabilities initially expressed in foreign currencies are translated into U.S. dollars at prevailing exchange rates at period end. The funds may enter into spot foreign currency exchange contracts to facilitate transactions denominated in a foreign currency. Purchases and sales of investment securities, dividend and interest income, spot foreign currency exchange contracts, and certain expenses are translated at the rates of exchange prevailing on the respective dates of such transactions. For assets and liabilities, other than investments in securities, net realized and unrealized gains and losses from foreign currency translations arise from changes in currency exchange rates.
Net realized and unrealized foreign currency exchange gains or losses occurring during the holding period of investment securities are a component of net realized gain (loss) on investment transactions and net unrealized appreciation (depreciation) on investments, respectively. Certain countries may impose taxes on the contract amount of purchases and sales of foreign currency contracts in their currency. The funds record the foreign tax expense, if any, as a reduction to the net realized gain (loss) on foreign currency transactions.
Repurchase Agreements — The funds may enter into repurchase agreements with institutions that American Century Investment Management, Inc. (ACIM) (the investment advisor) has determined are creditworthy pursuant to criteria adopted by the Board of Directors. Each repurchase agreement is recorded at cost. Each fund requires that the collateral, represented by securities, received in a repurchase transaction be transferred to the custodian in a manner sufficient to enable each fund to obtain those securities in the event of a default under the repurchase agreement. ACIM monitors, on a daily basis, the securities transferred to ensure the value, including accrued interest, of the securities under each repurchase agreement is equal to or greater than amounts owed to each fund under each repurchase agreement.
32
Joint Trading Account — Pursuant to an Exemptive Order issued by the Securities and Exchange Commission, each fund, along with certain other funds in the American Century Investments family of funds, may transfer uninvested cash balances into a joint trading account. These balances are invested in one or more repurchase agreements that are collateralized by U.S. Treasury or Agency obligations.
Income Tax Status — It is each fund’s policy to distribute substantially all net investment income and net realized gains to shareholders and to otherwise qualify as a regulated investment company under provisions of the Internal Revenue Code. The funds are no longer subject to examination by tax authorities for years prior to 2007. At this time, management believes there are no uncertain tax positions which, based on their technical merit, would not be sustained upon examination and for which it is reasonably possible that the total amounts of unrecognized tax benefits will significantly change in the next twelve months. Accordingly, no provision has been made for federal or state income taxes.
Distributions to Shareholders — Distributions to shareholders are recorded on the ex-dividend date. Distributions from net investment income are declared and paid quarterly. Distributions from net realized gains, if any, are generally declared and paid annually.
Indemnifications — Under the corporation’s organizational documents, its officers and directors are indemnified against certain liabilities arising out of the performance of their duties to the funds. In addition, in the normal course of business, the funds enter into contracts that provide general indemnifications. The maximum exposure under these arrangements is unknown as this would involve future claims that may be made against a fund. The risk of material loss from such claims is considered by management to be remote.
Use of Estimates — The financial statements are prepared in conformity with accounting principles generally accepted in the United States of America, which may require management to make certain estimates and assumptions at the date of the financial statements. Actual results could differ from these estimates.
Subsequent Events — In preparing the financial statements, management evaluated the impact of events or transactions occurring through the date the financial statements were issued that would merit recognition or disclosure.
2. Fees and Transactions with Related Parties
Management Fees — The corporation has entered into a Management Agreement with ACIM, under which ACIM provides the funds with investment advisory and management services in exchange for a single, unified management fee (the fee) per class. The Agreement provides that all expenses of managing and operating the funds, except brokerage expenses, taxes, interest, fees and expenses of the independent directors (including legal counsel fees), and extraordinary expenses, will be paid by ACIM. The fee is computed and accrued daily based on the daily net assets of each specific class of shares of each fund and paid monthly in arrears. For funds with a stepped fee schedule, the rate of the fee is determined by applying a fee rate calculation formula. This formula takes into account each fund’s assets as well as certain assets, if any, of other clients of the investment advisor outside the American Century Investments family of funds (such as subadvised funds and separate accounts) that have very similar investment teams and investment strategies (strategy assets). The annual management fee schedule for Mid Cap Value is 1.00%, 0.80%, 1.00%, 1.00% and 1.00% for the Investor Class, Institutional Class, A Class, C Class and R Class, respectively. The annual management fee schedule for Small Cap Value ranges from 1.00% to 1.25% for the Investor Class, A Class, C Class and R Class. The Institutional Class is 0.20% less at each point within the range for Small Cap Value.
33
The effective annual management fee for each class of each fund for the year ended March 31, 2010, was as follows:
| | |
| | Investor, A, C & R | Institutional |
| Mid Cap Value | 1.00% | 0.80% |
| Small Cap Value | 1.25% | 1.05% |
Distribution and Service Fees — The Board of Directors has adopted a separate Master Distribution and Individual Shareholder Services Plan for each of the A Class, C Class and R Class (collectively the plans), pursuant to Rule 12b-1 of the 1940 Act. The plans provide that the A Class will pay American Century Investment Services, Inc. (ACIS) an annual distribution and service fee of 0.25%. The plans provide that the C Class will pay ACIS an annual distribution fee of 0.75% and service fee of 0.25%. The plans provide that the R Class will pay ACIS an annual distribution and service fee of 0.50%. The fees are computed and accrued daily based on each class’s daily net assets and paid monthly in arrears. The fees are used to pay financial intermediaries for distribution and individual shareholder services. Fees incurred unde r the plans during the year ended March 31, 2010, are detailed in the Statement of Operations.
Acquired Fund Fees and Expenses — The funds may invest in mutual funds, exchange traded funds, and business development companies (the acquired funds). Each fund will indirectly realize its pro rata share of the fees and expenses of the acquired funds in which it invests. These indirect fees and expenses are not paid out of the fund’s assets but are reflected in the return realized by the fund on its investment in the acquired funds.
Related Parties — Certain officers and directors of the corporation are also officers and/ or directors of American Century Companies, Inc. (ACC), the parent of the corporation’s investment advisor, ACIM, the distributor of the corporation, ACIS, and the corporation’s transfer agent, American Century Services, LLC.
The funds are eligible to invest in a money market fund for temporary purposes, which is managed by J.P. Morgan Investment Management, Inc. (JPMIM). The funds have a Mutual Funds Services Agreement with J.P. Morgan Investor Services Co. (JPMIS) and a securities lending agreement with JPMorgan Chase Bank (JPMCB). JPMCB is a custodian of the funds. JPMIM, JPMIS and JPMCB are wholly owned subsidiaries of JPMorgan Chase & Co. (JPM). JPM is an equity investor in ACC.
3. Investment Transactions
Investment transactions, excluding short-term investments, for the year ended March 31, 2010, were as follows:
| | |
| | Mid Cap Value | Small Cap Value |
| Purchases | $721,967,400 | $1,811,983,962 |
| Sales | $522,864,250 | $1,449,438,986 |
34
| | | | |
| 4. Capital Share Transactions | | | | |
| |
| Transactions in shares of the funds were as follows: | | |
| | Year ended March 31, 2010 (1) | Year ended March 31, 2009 |
| | Shares | Amount | Shares | Amount |
| Mid Cap Value | | | | |
| Investor Class/Shares Authorized | 120,000,000 | | 75,000,000 | |
| Sold | 21,306,808 | $213,695,479 | 11,583,385 | $100,805,312 |
| Issued in reinvestment of distributions | 417,792 | 4,255,315 | 470,378 | 4,166,891 |
| Redeemed | (8,496,534) | (82,980,087) | (9,108,024) | (81,605,589) |
| | 13,228,066 | 134,970,707 | 2,945,739 | 23,366,614 |
| Institutional Class/Shares Authorized | 20,000,000 | | 20,000,000 | |
| Sold | 4,462,654 | 46,178,288 | 1,336,091 | 11,458,786 |
| Issued in reinvestment of distributions | 46,510 | 483,302 | 44,956 | 396,391 |
| Redeemed | (939,061) | (9,386,542) | (578,563) | (4,718,425) |
| | 3,570,103 | 37,275,048 | 802,484 | 7,136,752 |
| A Class/Shares Authorized | 20,000,000 | | 20,000,000 | |
| Sold | 4,642,922 | 46,461,341 | 2,092,852 | 17,133,819 |
| Issued in reinvestment of distributions | 60,409 | 617,612 | 52,237 | 453,144 |
| Redeemed | (1,638,412) | (16,714,115) | (1,030,530) | (9,152,116) |
| | 3,064,919 | 30,364,838 | 1,114,559 | 8,434,847 |
| C Class/Shares Authorized | 20,000,000 | | N/A | |
| Sold | 4,468 | 50,000 | | |
| R Class/Shares Authorized | 10,000,000 | | 20,000,000 | |
| Sold | 1,132,811 | 11,223,557 | 379,003 | 3,043,519 |
| Issued in reinvestment of distributions | 9,042 | 93,171 | 6,073 | 52,176 |
| Redeemed | (220,730) | (2,195,669) | (147,769) | (1,224,277) |
| | 921,123 | 9,121,059 | 237,307 | 1,871,418 |
| Net increase (decrease) | 20,788,679 | $211,781,652 | 5,100,089 | $ 40,809,631 |
| | |
| (1) March 1, 2010 (commencement of sale) through March 31, 2010 for the C Class. | | |
35
| | | | |
| | Year ended March 31, 2010(1) | Year ended March 31, 2009 |
| | Shares | Amount | Shares | Amount |
| Small Cap Value | | | | |
| Investor Class/Shares Authorized | 500,000,000 | | 500,000,000 | |
| Sold | 46,301,934 | $308,457,745 | 18,359,040 | $107,055,962 |
| Issued in reinvestment of distributions | 1,843,406 | 11,250,741 | 1,864,672 | 11,463,956 |
| Redeemed | (26,949,571) | (180,987,009) | (35,426,119) | (216,690,910) |
| | 21,195,769 | 138,721,477 | (15,202,407) | (98,170,992) |
| Institutional Class/Shares Authorized | 210,000,000 | | 200,000,000 | |
| Sold | 37,975,594 | 265,921,659 | 14,335,511 | 86,227,985 |
| Issued in reinvestment of distributions | 1,126,179 | 6,962,827 | 1,042,135 | 6,425,536 |
| Redeemed | (12,731,092) | (89,566,167) | (13,056,836) | (79,974,617) |
| | 26,370,681 | 183,318,319 | 2,320,810 | 12,678,904 |
| A Class/Shares Authorized | 190,000,000 | | 190,000,000 | |
| Sold | 18,114,015 | 123,055,287 | 16,680,664 | 106,892,904 |
| Issued in reinvestment of distributions | 644,442 | 3,882,759 | 664,645 | 4,023,372 |
| Redeemed | (10,338,333) | (69,437,219) | (12,337,993) | (72,913,846) |
| | 8,420,124 | 57,500,827 | 5,007,316 | 38,002,430 |
| C Class/Shares Authorized | 20,000,000 | | N/A | |
| Sold | 3,289 | 25,000 | | |
| R Class/Shares Authorized | 20,000,000 | | N/A | |
| Sold | 3,289 | 25,000 | | |
| Net increase (decrease) | 55,993,152 | $379,590,623 | (7,874,281) | $(47,489,658) |
| | |
| (1) March 1, 2010 (commencement of sale) through March 31, 2010 for the C Class and R Class. | | |
5. Affiliated Company Transactions
If a fund’s holding represents ownership of 5% or more of the voting securities of a company, the company is affiliated as defined in the 1940 Act. A summary of transactions for each company which is or was an affiliate at or during the year ended March 31, 2010, follows:
| | | | | | | | |
| | March 31, 2009 | | | | | March 31, 2010 |
| | | Share | Purchase | Sales | Realized | Dividend | Share | Market |
| Fund/Company | Balance | Cost | Cost | Gain (Loss) | Income | Balance | Value |
| Small Cap Value | | | | | | | |
| Cutera, Inc.(1) | 655,000 | $ 2,196,652 | $3,128,635 | $(947,722) | — | 690,000 | $ 7,155,300 |
| DHT Holdings, Inc. | 2,318,922 | 3,273,643 | 12,527,753 | (3,558,539) | $ 488,160 | 1,200,000 | (2) |
| Mercer Insurance | | | | | | | |
| Group, Inc. | 275,000 | 1,742,694 | 262,536 | 5,357 | 95,625 | 361,253 | 6,502,554 |
| Ulticom, Inc. | 1,908,975 | 1,005,677 | 510,824 | (245,844) | 8,524,598 | 577,353 | 5,585,890 |
| Utah Medical | | | | | | | |
| Products, Inc. | 180,000 | 1,049,025 | 1,941,353 | (116,164) | 156,712 | 155,000 | (2) |
| Young Innovations, Inc. | 725,000 | 2,277,755 | 3,891,668 | (514,213) | 107,710 | 679,235 | 19,127,258 |
| | | | $11,545,446 | $22,262,769 | $(5,377,125) | $9,372,805 | | $38,371,002 |
| (1) | Non-income producing. | | | | | | | |
| (2) | Company was not an affiliate at March 31, 2010. | | | | | |
36
6. Fair Value Measurements
The funds’ securities valuation process is based on several considerations and may use multiple inputs to determine the fair value of the positions held by the funds. In conformity with accounting principles generally accepted in the United States of America, the inputs used to determine a valuation are classified into three broad levels as follows:
• Level 1 valuation inputs consist of unadjusted quoted prices in an active market for identical securities;
• Level 2 valuation inputs consist of significant direct or indirect observable market data (including quoted prices for similar securities, evaluations of subsequent market events, interest rates, prepayment speeds, credit risk, etc.); or
• Level 3 valuation inputs consist of significant unobservable inputs (including a fund’s own assumptions).
The level classification is based on the lowest level input that is significant to the fair valuation measurement. The valuation inputs are not an indication of the risks associated with investing in these securities or other financial instruments.
The following is a summary of the valuation inputs used to determine the fair value of the funds’ securities and other financial instruments as of March 31, 2010. The Schedule of Investments provides additional details on the funds’ portfolio holdings.
| | | | |
| | Level 1 | Level 2 | Level 3 | |
| Mid Cap Value | | | | |
| Investment Securities | | | | |
| Domestic Common Stocks | $586,648,157 | — | | — |
| Foreign Common Stocks | 16,814,468 | $21,161,866 | | — |
| Temporary Cash Investments | 31,830 | 16,900,000 | | — |
| Total Value of Investment Securities | $603,494,455 | $38,061,866 | | — |
| | | | | |
| Other Financial Instruments | | | | |
| Total Unrealized Gain (Loss) on Forward | | | | |
| Foreign Currency Exchange Contracts | — | $(43,125) | | — |
| | | | | |
| Small Cap Value | | | | |
| Investment Securities | | | | |
| Common Stocks | $1,864,509,774 | — | | — |
| Convertible Preferred Stocks | — | $ 66,902,116 | | — |
| Preferred Stocks | — | 11,692,873 | | — |
| Temporary Cash Investments | 132,423 | 36,900,000 | | — |
| Total Value of Investment Securities | $1,864,642,197 | $115,494,989 | | — |
37
7. Derivative Instruments
Foreign Currency Risk — Mid Cap Value is subject to foreign currency exchange rate risk in the normal course of pursuing its investment objectives. The value of foreign investments held by a fund may be significantly affected by changes in foreign currency exchange rates. The dollar value of a foreign security generally decreases when the value of the dollar rises against the foreign currency in which the security is denominated and tends to increase when the value of the dollar declines against such foreign currency. A fund may enter into forward foreign currency exchange contracts to reduce a fund’s exposure to foreign currency exchange rate fluctuations. The net U.S. dollar value of foreign currency underlying all contractual commitments held b y a fund and the resulting unrealized appreciation or depreciation are determined daily using prevailing exchange rates. Realized gain or loss is recorded upon the termination of the contract. Net realized and unrealized gains or losses occurring during the holding period of forward foreign currency exchange contracts are a component of net realized gain (loss) on foreign currency transactions and change in net unrealized appreciation (depreciation) on translation of assets and liabilities in foreign currencies, respectively. A fund bears the risk of an unfavorable change in the foreign currency exchange rate underlying the forward contract. Additionally, losses, up to the fair value, may arise if the counterparties do not perform under the contract terms. The risk of loss from non-performance by the counterparty may be reduced by the use of master netting agreements. The foreign currency risk derivative instruments held at period end as disclosed on the Schedule of Investments are indicative of Mid Cap Valu e’s typical volume during the period
For Mid Cap Value, the value of foreign currency risk derivative instruments as of March 31, 2010, is disclosed on the Statement of Assets and Liabilities as a liability of $43,125 in payable for forward foreign currency exchange contracts. For Mid Cap Value, for the year ended March 31, 2010, the effect of foreign currency risk derivative instruments on the Statement of Operations was $(1,172,710) in net realized gain (loss) on foreign currency transactions and $(73,069) in change in net unrealized appreciation (depreciation) on translation of assets and liabilities in foreign currencies.
8. Risk Factors
There are certain risks involved in investing in foreign securities. These risks include those resulting from future adverse political, social, and economic development, fluctuations in currency exchange rates, the possible imposition of exchange controls, and other foreign laws and restrictions.
Small Cap Value generally invests in smaller companies which may be more volatile, and subject to greater short-term risk than those of larger companies. In addition, Small Cap Value’s performance may be affected by investments in initial public offerings (IPOs). The impact of IPOs on a fund’s performance depends on the strength of the IPO market and the size of the fund. IPOs may have less impact on a fund’s performance as its assets grow.
9. Interfund Lending
The funds, along with certain other funds in the American Century Investments family of funds, may participate in an interfund lending program, pursuant to an Exemptive Order issued by the Securities and Exchange Commission (SEC). This program provides an alternative credit facility allowing the funds to borrow from or lend to other funds in the American Century Investments family of funds that permit such transactions. Interfund lending transactions are subject to each fund’s investment policies and borrowing and lending limits. The interfund loan rate earned/paid on interfund lending transactions is determined daily based on the average of certain current market rates. Interfund lending transactions normally extend only overnight, but can have a maximum duration of seven days. The program is subject to annual approval by the Board of Directors. During the year ended March 31, 2010, the funds did not utilize the program.
38
10. Federal Tax Information
The tax character of distributions paid during the years ended March 31, 2010 and March 31, 2009 were as follows:
| | | | |
| | Mid Cap Value | Small Cap Value |
| | 2010 | 2009 | 2010 | 2009 |
| Distributions Paid From | | | | |
| Ordinary income | $6,280,977 | $5,980,282 | $24,080,646 | $22,252,662 |
| Long-term capital gains | — | — | — | $1,394,191 |
The book-basis character of distributions made during the year from net investment income or net realized gains may differ from their ultimate characterization for federal income tax purposes. These differences reflect the differing character of certain income items and net realized gains and losses for financial statement and tax purposes, and may result in reclassification among certain capital accounts on the financial statements.
As of March 31, 2010, the federal tax cost of investments and the components of distributable earnings on a tax-basis were as follows:
| | |
| | Mid Cap Value | Small Cap Value |
| Federal tax cost of investments | $580,932,625 | $1,742,575,150 |
| Gross tax appreciation of investments | $67,614,080 | $278,856,478 |
| Gross tax depreciation of investments | (6,990,384) | (41,294,442) |
| Net tax appreciation (depreciation) of investments | $60,623,696 | $237,562,036 |
| Net tax appreciation (depreciation) on derivatives and | | |
| translation of assets and liabilities in foreign currencies | $2,022 | — |
| Net tax appreciation (depreciation) | $60,625,718 | $237,562,036 |
| Undistributed ordinary income | $900,994 | — |
| Accumulated capital losses | $(45,531,078) | $(164,449,952) |
The difference between book-basis and tax-basis cost and unrealized appreciation (depreciation) is attributable primarily to the tax deferral of losses on wash sales and the realization for tax purposes of unrealized gains (losses) on certain forward foreign currency exchange contracts.
The accumulated capital losses listed above represent net capital loss carryovers that may be used to offset future realized capital gains for federal income tax purposes. Future capital loss carryover utilization in any given year may be subject to Internal Revenue Code limitations. The capital loss carryovers expire as follows:
| | |
| | 2017 | 2018 |
| Mid Cap Value | $(37,541,838) | $(7,989,240) |
| Small Cap Value | $(77,587,982) | $(86,861,970) |
39
11. Corporate Event
As part of a long-standing estate and business succession plan established by ACC Co-Chairman James E. Stowers, Jr., the founder of American Century Investments, ACC Co-Chairman Richard W. Brown succeeded Mr. Stowers as trustee of a trust that holds a greater-than-25% voting interest in ACC, the parent corporation of each fund’s advisor. Under the 1940 Act, this is presumed to represent control of ACC even though it is less than a majority interest. The change of trustee may technically be considered a “change of control” of ACC and therefore also a change of control of each fund’s advisor even though there has been no change to their management and none is anticipated. The “change of control” resulted in the assignment of each fund’s investment advisory agreement. Under the 1940 Act, an assignment automatically terminated such agreement, making the approval of a new agreement necessary.
On February 18, 2010, the Board of Directors approved interim investment advisory agreements under which each fund will be managed until new agreements are approved by fund shareholders. On March 29, 2010, the Board of Directors approved new investment advisory agreements. The interim agreements and the new agreements are substantially identical to the terminated agreements (with the exception of different effective and termination dates) and will not result in changes in the management of American Century Investments, the funds, their investment objectives, fees or services provided. The new agreements have been submitted to shareholders for approval at a Special Meeting of Shareholders to be held on June 16, 2010. Management agreements for new share classes of the funds that were launched after February 18, 2010 did not terminate, have not been replaced by interim agreements, and do not require approval of new agreements.
12. Recently Issued Accounting Standards
In March 2008, the Financial Accounting Standards Board (FASB) issued Accounting Standards Codification (ASC) Section 815-10 (formerly Statement of Financial Accounting Standards No. 161, “Disclosures about Derivative Instruments and Hedging Activities —an amendment of FASB Statement No. 133”). ASC Section 815-10 is effective for interim periods beginning after November 15, 2008 and has been adopted by the funds. ASC Section 815-10 amends and expands disclosures about derivative instruments and hedging activities. ASC Section 815-10 requires qualitative disclosures about the objectives and strategies of derivative instruments, quantitative disclosures about the fair value amounts of and gains and losses on derivative instruments, and disclosures of credit-risk-related contingent features in hedging activities.
13. Other Tax Information (Unaudited)
The following information is provided pursuant to provisions of the Internal Revenue Code.
The funds hereby designate up to the maximum amount allowable as qualified dividend income for the fiscal year ended March 31, 2010.
For corporate taxpayers, Mid Cap Value and Small Cap Value hereby designate $6,280,977 and $24,080,646, respectively, or up to the maximum amount allowable, of ordinary income distributions paid during the fiscal year ended March 31, 2010 as qualified for the corporate dividends received deduction.
40
| | | | | | |
| Mid Cap Value | | | | | |
| |
| Investor Class | | | | | |
| For a Share Outstanding Throughout the Years Ended March 31 | | | |
| | | 2010 | 2009 | 2008 | 2007 | 2006 |
| Per-Share Data | | | | | |
| Net Asset Value, Beginning of Period | $7.34 | $10.66 | $13.33 | $12.10 | $11.32 |
| Income From Investment Operations | | | | | |
| Net Investment Income (Loss)(1) | 0.18 | 0.19 | 0.16 | 0.16 | 0.21 |
| Net Realized and Unrealized Gain (Loss) | 4.03 | (3.32) | (1.51) | 1.87 | 1.70 |
| Total From Investment Operations | 4.21 | (3.13) | (1.35) | 2.03 | 1.91 |
| Distributions | | | | | |
| From Net Investment Income | (0.14) | (0.19) | (0.16) | (0.14) | (0.21) |
| From Net Realized Gains | — | — | (1.16) | (0.66) | (0.92) |
| Total Distributions | (0.14) | (0.19) | (1.32) | (0.80) | (1.13) |
| Net Asset Value, End of Period | $11.41 | $7.34 | $10.66 | $13.33 | $12.10 |
| |
| Total Return(2) | 57.68% | (29.66)% | (10.84)% | 17.12% | 17.62% |
| | | | | | |
| Ratios/Supplemental Data | | | | | |
| Ratio of Operating Expenses to Average | | | | | |
| Net Assets | 1.00% | 1.00% | 1.00% | 1.00% | 1.00% |
| Ratio of Net Investment Income (Loss) to | | | | | |
| Average Net Assets | 1.79% | 2.10% | 1.25% | 1.30% | 1.77% |
| Portfolio Turnover Rate | 126% | 173% | 206% | 187% | 228% |
| Net Assets, End of Period (in thousands) | $478,796 | $210,960 | $274,918 | $301,642 | $115,262 |
| |
| (1) | Computed using average shares outstanding throughout the period. | | | | |
| (2) | Total return assumes reinvestment of net investment income and capital gains distributions, if any. Total returns for periods less than one year are |
| | not annualized. Total returns are calculated based on the net asset value of the last business day. The total return of the classes may not precisely |
| | reflect the class expense differences because of the impact of calculating the net asset values to two decimal places. If net asset values were |
| | calculated to three decimal places, the total return differences would more closely reflect the class expense differences. The calculation of net |
| | asset values to two decimal places is made in accordance with SEC guidelines and does not result in any gain or loss of value between one |
| | class and another. | | | | | |
See Notes to Financial Statements.
41
| | | | | | |
| Mid Cap Value | | | | | |
| |
| Institutional Class | | | | | |
| For a Share Outstanding Throughout the Years Ended March 31 | | | |
| | | 2010 | 2009 | 2008 | 2007 | 2006 |
| Per-Share Data | | | | | |
| Net Asset Value, Beginning of Period | $7.34 | $10.66 | $13.33 | $12.10 | $11.33 |
| Income From Investment Operations | | | | | |
| Net Investment Income (Loss)(1) | 0.20 | 0.21 | 0.18 | 0.19 | 0.24 |
| Net Realized and Unrealized Gain (Loss) | 4.03 | (3.32) | (1.51) | 1.87 | 1.69 |
| Total From Investment Operations | 4.23 | (3.11) | (1.33) | 2.06 | 1.93 |
| Distributions | | | | | |
| From Net Investment Income | (0.16) | (0.21) | (0.18) | (0.17) | (0.24) |
| From Net Realized Gains | — | — | (1.16) | (0.66) | (0.92) |
| Total Distributions | (0.16) | (0.21) | (1.34) | (0.83) | (1.16) |
| Net Asset Value, End of Period | $11.41 | $7.34 | $10.66 | $13.33 | $12.10 |
| |
| Total Return(2) | 58.00% | (29.52)% | (10.67)% | 17.36% | 17.74% |
| | | | | | |
| Ratios/Supplemental Data | | | | | |
| Ratio of Operating Expenses to Average | | | | | |
| Net Assets | 0.80% | 0.80% | 0.80% | 0.80% | 0.80% |
| Ratio of Net Investment Income (Loss) to | | | | | |
| Average Net Assets | 1.99% | 2.30% | 1.45% | 1.50% | 1.97% |
| Portfolio Turnover Rate | 126% | 173% | 206% | 187% | 228% |
| Net Assets, End of Period (in thousands) | $68,487 | $17,859 | $17,378 | $20,623 | $10,510 |
| (1) | Computed using average shares outstanding throughout the period. | | | | |
| (2) | Total return assumes reinvestment of net investment income and capital gains distributions, if any. Total returns for periods less than one year are |
| | not annualized. Total returns are calculated based on the net asset value of the last business day. The total return of the classes may not precisely |
| | reflect the class expense differences because of the impact of calculating the net asset values to two decimal places. If net asset values were |
| | calculated to three decimal places, the total return differences would more closely reflect the class expense differences. The calculation of net |
| | asset values to two decimal places is made in accordance with SEC guidelines and does not result in any gain or loss of value between one |
| | class and another. | | | | | |
See Notes to Financial Statements.
42
| | | | | | |
| Mid Cap Value | | | | | |
| |
| A Class(1) | | | | | |
| For a Share Outstanding Throughout the Years Ended March 31 (except as noted) | | |
| | | 2010 | 2009 | 2008 | 2007 | 2006 |
| Per-Share Data | | | | | |
| Net Asset Value, Beginning of Period | $7.34 | $10.66 | $13.33 | $12.10 | $11.32 |
| Income From Investment Operations | | | | | |
| Net Investment Income (Loss)(2) | 0.15 | 0.17 | 0.13 | 0.14 | 0.16 |
| Net Realized and Unrealized Gain (Loss) | 4.04 | (3.32) | (1.51) | 1.86 | 1.72 |
| Total From Investment Operations | 4.19 | (3.15) | (1.38) | 2.00 | 1.88 |
| Distributions | | | | | |
| From Net Investment Income | (0.12) | (0.17) | (0.13) | (0.11) | (0.18) |
| From Net Realized Gains | — | — | (1.16) | (0.66) | (0.92) |
| Total Distributions | (0.12) | (0.17) | (1.29) | (0.77) | (1.10) |
| Net Asset Value, End of Period | $11.41 | $7.34 | $10.66 | $13.33 | $12.10 |
| |
| Total Return(3) | 57.28% | (29.84)% | (11.07)% | 16.83% | 17.32% |
| | | | | | |
| Ratios/Supplemental Data | | | | | |
| Ratio of Operating Expenses to Average | | | | | |
| Net Assets | 1.25% | 1.25% | 1.25% | 1.25% | 1.25% |
| Ratio of Net Investment Income (Loss) to | | | | | |
| Average Net Assets | 1.54% | 1.85% | 1.00% | 1.05% | 1.52% |
| Portfolio Turnover Rate | 126% | 173% | 206% | 187% | 228% |
| Net Assets, End of Period (in thousands) | $75,435 | $26,039 | $25,932 | $21,412 | $8,175 |
| (1) | Prior to March 1, 2010, the A Class was referred to as the Advisor Class. | | | |
| (2) | Computed using average shares outstanding throughout the period. | | | | |
| (3) | Total return assumes reinvestment of net investment income and capital gains distributions, if any, and does not reflect applicable sales charges. |
| | Total returns for periods less than one year are not annualized. Total returns are calculated based on the net asset value of the last business day. |
| | The total return of the classes may not precisely reflect the class expense differences because of the impact of calculating the net asset values |
| | to two decimal places. If net asset values were calculated to three decimal places, the total return differences would more closely reflect the |
| | class expense differences. The calculation of net asset values to two decimal places is made in accordance with SEC guidelines and does not |
| | result in any gain or loss of value between one class and another. | | | | |
See Notes to Financial Statements.
43
| | |
| Mid Cap Value | |
| |
| C Class | |
| For a Share Outstanding Throughout the Years Ended March 31 (except as noted) | |
| | | 2010(1) |
| Per-Share Data | |
| Net Asset Value, Beginning of Period | $10.97 |
| Income From Investment Operations | |
| Net Investment Income (Loss)(2) | 0.02 |
| Net Realized and Unrealized Gain (Loss) | 0.43 |
| Total From Investment Operations | 0.45 |
| Net Asset Value, End of Period | $11.42 |
| |
| Total Return(3) | 4.10% |
| | |
| Ratios/Supplemental Data | |
| Ratio of Operating Expenses to Average Net Assets | 2.00%(4) |
| Ratio of Net Investment Income (Loss) to Average Net Assets | 2.07%(4) |
| Portfolio Turnover Rate | 126%(5) |
| Net Assets, End of Period (in thousands) | $51 |
| (1) | March 1, 2010 (commencement of sale) through March 31, 2010. | |
| (2) | Computed using average shares outstanding throughout the period. | |
| (3) | Total return assumes reinvestment of net investment income and capital gains distributions, if any, and does not reflect applicable sales charges. |
| | Total returns for periods less than one year are not annualized. Total returns are calculated based on the net asset value of the last business day. |
| | The total return of the classes may not precisely reflect the class expense differences because of the impact of calculating the net asset values |
| | to two decimal places. If net asset values were calculated to three decimal places, the total return differences would more closely reflect the |
| | class expense differences. The calculation of net asset values to two decimal places is made in accordance with SEC guidelines and does not |
| | result in any gain or loss of value between one class and another. | |
| (4) | Annualized. | |
| (5) | Portfolio turnover is calculated at the fund level. Percentage indicated was calculated for the year ended March 31, 2010. | |
See Notes to Financial Statements.
44
| | | | | | |
| Mid Cap Value | | | | | |
| |
| R Class | | | | | |
| For a Share Outstanding Throughout the Years Ended March 31 (except as noted) | | |
| | | 2010 | 2009 | 2008 | 2007 | 2006(1) |
| Per-Share Data | | | | | |
| Net Asset Value, Beginning of Period | $7.34 | $10.65 | $13.32 | $12.09 | $12.21 |
| Income From Investment Operations | | | | | |
| Net Investment Income (Loss)(2) | 0.13 | 0.15 | 0.10 | 0.13 | 0.07 |
| Net Realized and Unrealized Gain (Loss) | 4.03 | (3.32) | (1.51) | 1.84 | 0.79 |
| Total From Investment Operations | 4.16 | (3.17) | (1.41) | 1.97 | 0.86 |
| Distributions | | | | | |
| From Net Investment Income | (0.09) | (0.14) | (0.10) | (0.08) | (0.06) |
| From Net Realized Gains | — | — | (1.16) | (0.66) | (0.92) |
| Total Distributions | (0.09) | (0.14) | (1.26) | (0.74) | (0.98) |
| Net Asset Value, End of Period | $11.41 | $7.34 | $10.65 | $13.32 | $12.09 |
| |
| Total Return(3) | 56.88% | (29.95)% | (11.30)% | 16.55% | 7.56% |
| | | | | | |
| Ratios/Supplemental Data | | | | | |
| Ratio of Operating Expenses | | | | | |
| to Average Net Assets | 1.50% | 1.50% | 1.50% | 1.50% | 1.50%(4) |
| Ratio of Net Investment Income (Loss) | | | | | |
| to Average Net Assets | 1.29% | 1.60% | 0.75% | 0.80% | 0.97%(4) |
| Portfolio Turnover Rate | 126% | 173% | 206% | 187% | 228%(5) |
| Net Assets, End of Period (in thousands) | $16,611 | $3,926 | $3,172 | $820 | $27 |
| (1) | July 29, 2005 (commencement of sale) through March 31, 2006. | | | | |
| (2) | Computed using average shares outstanding throughout the period. | | | | |
| (3) | Total return assumes reinvestment of net investment income and capital gains distributions, if any. Total returns for periods less than one year are |
| | not annualized. Total returns are calculated based on the net asset value of the last business day. The total return of the classes may not precisely |
| | reflect the class expense differences because of the impact of calculating the net asset values to two decimal places. If net asset values were |
| | calculated to three decimal places, the total return differences would more closely reflect the class expense differences. The calculation of net |
| | asset values to two decimal places is made in accordance with SEC guidelines and does not result in any gain or loss of value between one |
| | class and another. | | | | | |
| (4) | Annualized. | | | | | |
| (5) | Portfolio turnover is calculated at the fund level. Percentage indicated was calculated for the year ended March 31, 2006. | |
See Notes to Financial Statements.
45
| | | | | | |
| Small Cap Value | | | | | |
| |
| Investor Class | | | | | |
| For a Share Outstanding Throughout the Years Ended March 31 | | | |
| | | 2010 | 2009 | 2008 | 2007 | 2006 |
| Per-Share Data | | | | | |
| Net Asset Value, Beginning of Period | $4.70 | $7.02 | $10.01 | $10.45 | $10.07 |
| Income From Investment Operations | | | | | |
| Net Investment Income (Loss)(1) | 0.11 | 0.12 | 0.09 | 0.06 | 0.06 |
| Net Realized and Unrealized Gain (Loss) | 3.33 | (2.31) | (1.16) | 0.87 | 1.72 |
| Total From Investment Operations | 3.44 | (2.19) | (1.07) | 0.93 | 1.78 |
| Distributions | | | | | |
| From Net Investment Income | (0.12) | (0.11) | (0.09) | (0.04) | (0.06) |
| From Net Realized Gains | — | (0.02) | (1.83) | (1.33) | (1.34) |
| Total Distributions | (0.12) | (0.13) | (1.92) | (1.37) | (1.40) |
| Net Asset Value, End of Period | $8.02 | $4.70 | $7.02 | $10.01 | $10.45 |
| |
| Total Return(2) | 73.93% | (31.69)% | (12.22)% | 9.38% | 18.67% |
| | | | | | |
| Ratios/Supplemental Data | | | | | |
| Ratio of Operating Expenses | | | | | |
| to Average Net Assets(3) | 1.25% | 1.25% | 1.26% | 1.25% | 1.25% |
| Ratio of Net Investment Income (Loss) | | | | | |
| to Average Net Assets | 1.60% | 1.93% | 1.01% | 0.57% | 0.58% |
| Portfolio Turnover Rate | 104% | 192% | 123% | 121% | 111% |
| Net Assets, End of Period (in thousands) | $885,942 | $419,206 | $732,968 | $1,261,392 | $1,390,024 |
| (1) | Computed using average shares outstanding throughout the period. | | | | |
| (2) | Total return assumes reinvestment of net investment income and capital gains distributions, if any. Total returns for periods less than one year are |
| | not annualized. Total returns are calculated based on the net asset value of the last business day. The total return of the classes may not precisely |
| | reflect the class expense differences because of the impact of calculating the net asset values to two decimal places. If net asset values were |
| | calculated to three decimal places, the total return differences would more closely reflect the class expense differences. The calculation of net |
| | asset values to two decimal places is made in accordance with SEC guidelines and does not result in any gain or loss of value between one |
| | class and another. | | | | | |
| (3) | Ratio of operating expenses to average net assets does not include any fees and expenses of the acquired funds. | |
See Notes to Financial Statements.
46
| | | | | | |
| Small Cap Value | | | | | |
| |
| Institutional Class | | | | | |
| For a Share Outstanding Throughout the Years Ended March 31 | | | |
| | | 2010 | 2009 | 2008 | 2007 | 2006 |
| Per-Share Data | | | | | |
| Net Asset Value, Beginning of Period | $4.71 | $7.04 | $10.03 | $10.47 | $10.08 |
| Income From Investment Operations | | | | | |
| Net Investment Income (Loss)(1) | 0.12 | 0.13 | 0.11 | 0.08 | 0.08 |
| Net Realized and Unrealized Gain (Loss) | 3.35 | (2.32) | (1.17) | 0.87 | 1.73 |
| Total From Investment Operations | 3.47 | (2.19) | (1.06) | 0.95 | 1.81 |
| Distributions | | | | | |
| From Net Investment Income | (0.13) | (0.12) | (0.10) | (0.06) | (0.08) |
| From Net Realized Gains | — | (0.02) | (1.83) | (1.33) | (1.34) |
| Total Distributions | (0.13) | (0.14) | (1.93) | (1.39) | (1.42) |
| Net Asset Value, End of Period | $8.05 | $4.71 | $7.04 | $10.03 | $10.47 |
| |
| Total Return(2) | 74.47% | (31.61)% | (12.05)% | 9.52% | 18.98% |
| | | | | | |
| Ratios/Supplemental Data | | | | | |
| Ratio of Operating Expenses | | | | | |
| to Average Net Assets(3) | 1.05% | 1.05% | 1.06% | 1.05% | 1.05% |
| Ratio of Net Investment Income (Loss) | | | | | |
| to Average Net Assets | 1.80% | 2.13% | 1.21% | 0.77% | 0.78% |
| Portfolio Turnover Rate | 104% | 192% | 123% | 121% | 111% |
| Net Assets, End of Period (in thousands) | $654,738 | $258,902 | $370,422 | $443,173 | $435,327 |
| (1) | Computed using average shares outstanding throughout the period. | | | | |
| (2) | Total return assumes reinvestment of net investment income and capital gains distributions, if any. Total returns for periods less than one year are |
| | not annualized. Total returns are calculated based on the net asset value of the last business day. The total return of the classes may not precisely |
| | reflect the class expense differences because of the impact of calculating the net asset values to two decimal places. If net asset values were |
| | calculated to three decimal places, the total return differences would more closely reflect the class expense differences. The calculation of net |
| | asset values to two decimal places is made in accordance with SEC guidelines and does not result in any gain or loss of value between one |
| | class and another. | | | | | |
| (3) | Ratio of operating expenses to average net assets does not include any fees and expenses of the acquired funds. | |
See Notes to Financial Statements.
47
| | | | | | |
| Small Cap Value | | | | | |
| |
| A Class(1) | | | | | |
| For a Share Outstanding Throughout the Years Ended March 31 | | | |
| | | 2010 | 2009 | 2008 | 2007 | 2006 |
| Per-Share Data | | | | | |
| Net Asset Value, Beginning of Period | $4.69 | $7.00 | $10.00 | $10.45 | $10.06 |
| Income From Investment Operations | | | | | |
| Net Investment Income (Loss)(2) | 0.09 | 0.10 | 0.07 | 0.03 | 0.03 |
| Net Realized and Unrealized Gain (Loss) | 3.32 | (2.30) | (1.17) | 0.87 | 1.74 |
| Total From Investment Operations | 3.41 | (2.20) | (1.10) | 0.90 | 1.77 |
| Distributions | | | | | |
| From Net Investment Income | (0.10) | (0.09) | (0.07) | (0.02) | (0.04) |
| From Net Realized Gains | — | (0.02) | (1.83) | (1.33) | (1.34) |
| Total Distributions | (0.10) | (0.11) | (1.90) | (1.35) | (1.38) |
| Net Asset Value, End of Period | $8.00 | $4.69 | $7.00 | $10.00 | $10.45 |
| |
| Total Return(3) | 73.53% | (31.82)% | (12.51)% | 9.10% | 18.51% |
| | | | | | |
| Ratios/Supplemental Data | | | | | |
| Ratio of Operating Expenses | | | | | |
| to Average Net Assets(4) | 1.50% | 1.50% | 1.51% | 1.50% | 1.50% |
| Ratio of Net Investment Income (Loss) | | | | | |
| to Average Net Assets | 1.35% | 1.68% | 0.76% | 0.32% | 0.33% |
| Portfolio Turnover Rate | 104% | 192% | 123% | 121% | 111% |
| Net Assets, End of Period (in thousands) | $434,413 | $215,068 | $286,227 | $434,182 | $455,001 |
| (1) | Prior to March 1, 2010, the A Class was referred to as the Advisor Class. | | | |
| (2) | Computed using average shares outstanding throughout the period. | | | | |
| (3) | Total return assumes reinvestment of net investment income and capital gains distributions, if any, and does not reflect applicable sales charges. |
| | Total returns for periods less than one year are not annualized. Total returns are calculated based on the net asset value of the last business day. |
| | The total return of the classes may not precisely reflect the class expense differences because of the impact of calculating the net asset values |
| | to two decimal places. If net asset values were calculated to three decimal places, the total return differences would more closely reflect the |
| | class expense differences. The calculation of net asset values to two decimal places is made in accordance with SEC guidelines and does not |
| | result in any gain or loss of value between one class and another. | | | | |
| (4) | Ratio of operating expenses to average net assets does not include any fees and expenses of the acquired funds. | |
See Notes to Financial Statements.
48
| | |
| Small Cap Value | |
| |
| C Class | |
| For a Share Outstanding Throughout the Years Ended March 31 (except as noted) | |
| | | 2010(1) |
| Per-Share Data | |
| Net Asset Value, Beginning of Period | $7.60 |
| Income From Investment Operations | |
| Net Investment Income (Loss)(2) | —(3) |
| Net Realized and Unrealized Gain (Loss) | 0.41 |
| Total From Investment Operations | 0.41 |
| Net Asset Value, End of Period | $8.01 |
| |
| Total Return(4) | 5.39% |
| | |
| Ratios/Supplemental Data | |
| Ratio of Operating Expenses to Average Net Assets(5) | 2.25%(6) |
| Ratio of Net Investment Income (Loss) to Average Net Assets | 0.72%(6) |
| Portfolio Turnover Rate | 104%(7) |
| Net Assets, End of Period (in thousands) | $26 |
| (1) | March 1, 2010 (commencement of sale) through March 31, 2010. | |
| (2) | Computed using average shares outstanding throughout the period. | |
| (3) | Per-share amount was less than $0.005. | |
| (4) | Total return assumes reinvestment of net investment income and capital gains distributions, if any, and does not reflect applicable sales charges. |
| | Total returns for periods less than one year are not annualized. Total returns are calculated based on the net asset value of the last business day. |
| | The total return of the classes may not precisely reflect the class expense differences because of the impact of calculating the net asset values |
| | to two decimal places. If net asset values were calculated to three decimal places, the total return differences would more closely reflect the |
| | class expense differences. The calculation of net asset values to two decimal places is made in accordance with SEC guidelines and does not |
| | result in any gain or loss of value between one class and another. | |
| (5) | Ratio of operating expenses to average net assets does not include any fees and expenses of the acquired funds. | |
| (6) | Annualized. | |
| (7) | Portfolio turnover is calculated at the fund level. Percentage indicated was calculated for the year ended March 31, 2010. | |
See Notes to Financial Statements.
49
| | |
| Small Cap Value | |
| |
| R Class | |
| For a Share Outstanding Throughout the Years Ended March 31 (except as noted) | |
| | | 2010(1) |
| Per-Share Data | |
| Net Asset Value, Beginning of Period | $7.60 |
| Income From Investment Operations | |
| Net Investment Income (Loss)(2) | 0.01 |
| Net Realized and Unrealized Gain (Loss) | 0.41 |
| Total From Investment Operations | 0.42 |
| Net Asset Value, End of Period | $8.02 |
| |
| Total Return(3) | 5.53% |
| | |
| Ratios/Supplemental Data | |
| Ratio of Operating Expenses to Average Net Assets(4) | 1.75%(5) |
| Ratio of Net Investment Income (Loss) to Average Net Assets | 1.22%(5) |
| Portfolio Turnover Rate | 104%(6) |
| Net Assets, End of Period (in thousands) | $26 |
| (1) | March 1, 2010 (commencement of sale) through March 31, 2010. | |
| (2) | Computed using average shares outstanding throughout the period. | |
| (3) | Total return assumes reinvestment of net investment income and capital gains distributions, if any. Total returns for periods less than one year are |
| | not annualized. Total returns are calculated based on the net asset value of the last business day. The total return of the classes may not precisely |
| | reflect the class expense differences because of the impact of calculating the net asset values to two decimal places. If net asset values were |
| | calculated to three decimal places, the total return differences would more closely reflect the class expense differences. The calculation of net |
| | asset values to two decimal places is made in accordance with SEC guidelines and does not result in any gain or loss of value between one |
| | class and another. | |
| (4) | Ratio of operating expenses to average net assets does not include any fees and expenses of the acquired funds. | |
| (5) | Annualized. | |
| (6) | Portfolio turnover is calculated at the fund level. Percentage indicated was calculated for the year ended March 31, 2010. | |
See Notes to Financial Statements.
50
|
| Report of Independent Registered Public Accounting Firm |
The Board of Directors and Shareholders,
American Century Capital Portfolios, Inc.:
We have audited the accompanying statements of assets and liabilities, including the schedules of investments, of Mid Cap Value Fund and Small Cap Value Fund, two of the mutual funds constituting American Century Capital Portfolios, Inc. (the “Corporation”), as of March 31, 2010, and the related statements of operations for the year then ended, the statements of changes in net assets for each of the two years in the period then ended, and the financial highlights for each of the fiscal periods presented. These financial statements and financial highlights are the responsibility of the Corporation’s management. Our responsibility is to express an opinion on these financial statements and financial highlights based on our audits.
We conducted our audits in accordance with the standards of the Public Company Accounting Oversight Board (United States). Those standards require that we plan and perform the audit to obtain reasonable assurance about whether the financial statements and financial highlights are free of material misstatement. The Corporation is not required to have, nor were we engaged to perform, an audit of its internal control over financial reporting. Our audits included consideration of internal control over financial reporting as a basis for designing audit procedures that are appropriate in the circumstances, but not for the purpose of expressing an opinion on the effectiveness of the Corporation’s internal control over financial reporting. Accordingly, we express no such opinion. An audit also includes examining, on a test basis, evidence supporting the amounts and disclosures in the financial statements, assessing t he accounting principles used and significant estimates made by management, as well as evaluating the overall financial statement presentation. Our procedures included confirmation of securities owned as of March 31, 2010, by correspondence with the custodian and brokers; where replies were not received from brokers, we performed other auditing procedures. We believe that our audits provide a reasonable basis for our opinion.
In our opinion, the financial statements and financial highlights referred to above present fairly, in all material respects, the respective financial positions of Mid Cap Value Fund and Small Cap Value Fund, two of the mutual funds of American Century Capital Portfolios, Inc., as of March 31, 2010, the results of their operations for the year then ended, the changes in their net assets for each of the two years in the period then ended, and the financial highlights for each of the fiscal periods presented, in conformity with accounting principles generally accepted in the United States of America.
Deloitte & Touche LLP
Kansas City, Missouri
May 17, 2010
51
The Board of Directors
The individuals listed below serve as directors of the funds. Each director will continue to serve in this capacity until death, retirement, resignation or removal from office. The mandatory retirement age for directors who are not “interested persons,” as that term is defined in the Investment Company Act (independent directors), is 72. However, the mandatory retirement age may be extended or changed with the approval of the remaining independent directors.
Mr. Thomas is the only director who is an “interested person” because he currently serves as President and Chief Executive Officer of American Century Companies, Inc. (ACC), the parent company of American Century Investment Management, Inc. (ACIM) and American Century Global Investment Management, Inc. (ACGIM). ACIM and ACGIM are referred to collectively as the “advisors.”
The other directors (more than three-fourths of the total number) are independent; that is, they have never been employees, directors or officers of, and have no financial interest in, ACC or any of its wholly owned, direct or indirect, subsidiaries, including ACIM, ACGIM, American Century Investment Services, Inc. (ACIS) and American Century Services, LLC (ACS). The directors serve in this capacity for seven (in the case of Mr. Thomas, 15) registered investment companies in the American Century Investments family of funds.
The following presents additional information about the directors. The mailing address for each director is 4500 Main Street, Kansas City, Missouri 64111.
Independent Directors
Thomas A. Brown
Year of Birth: 1940
Position(s) with the Funds: Director
Length of Time Served: Since 1980
Principal Occupation(s) During the Past Five Years: Managing Member, Associated Investments,
LLC (real estate investment company); Brown Cascade Properties, LLC (real estate
investment company) (2001 to 2009)
Number of Funds in Fund Complex Overseen by Director: 63
Other Directorships Held by Director: None
Education/Other Professional Experience: BS in Mechanical Engineering, University of
Kansas; formerly, Chief Executive Officer, Associated Bearings Company; formerly,
Area Vice President, Applied Industrial Technologies (bearings and power
transmission company)
52
Andrea C. Hall
Year of Birth: 1945
Position(s) with the Funds: Director
Length of Time Served: Since 1997
Principal Occupation(s) During the Past Five Years: Retired as advisor to the President, Midwest
Research Institute (not-for-profit research organization) (June 2006)
Number of Funds in Fund Complex Overseen by Director: 63
Other Directorships Held by Director: None
Education/Other Professional Experience: BS in Biology, Florida State University; PhD in
Biology, Georgetown University; formerly, Senior Vice President and director of
Research Operations, Midwest Research Institute
James A. Olson
Year of Birth: 1942
Position(s) with the Funds: Director
Length of Time Served: Since 2007
Principal Occupation(s) During the Past Five Years: Member, Plaza Belmont LLC (private equity
fund manager); Chief Financial Officer, Plaza Belmont LLC (September 1999 to
September 2006)
Number of Funds in Fund Complex Overseen by Director: 63
Other Directorships Held by Director: Saia, Inc. and Entertainment Properties Trust
Education/Other Professional Experience: BS in Business Administration and MBA, St. Louis
University; CPA; 21 years of experience as a partner in the accounting firm of
Ernst & Young LLP
Donald H. Pratt
Year of Birth: 1937
Position(s) with the Funds: Director, Chairman of the Board
Length of Time Served: Since 1995
Principal Occupation(s) During the Past Five Years: Chairman and Chief Executive Officer,
Western Investments, Inc. (real estate company)
Number of Funds in Fund Complex Overseen by Director: 63
Other Directorships Held by Director: None
Education/Other Professional Experience: BS in Industrial Engineering, Wichita State
University; MBA, Harvard Business School; serves on the Board of Governors of
the Independent Directors Council and Investment Company Institute; formerly,
Chairman of the Board, Butler Manufacturing Company (metal buildings producer)
Gale E. Sayers
Year of Birth: 1943
Position(s) with the Funds: Director
Length of Time Served: Since 2000
Principal Occupation(s) During the Past Five Years: President, Chief Executive Officer and
Founder, Sayers40, Inc., (technology products and services provider)
Number of Funds in Fund Complex Overseen by Director: 63
Other Directorships Held by Director: None
Education/Other Professional Experience: BS in Physical Education and M.Ed. in Educational
Administration, University of Kansas; Recipient of the Ernst & Young Entrepreneur
of the Year Award; inducted into the Chicago Entrepreneurship Hall of Fame and
the National Football League Hall of Fame
53
M. Jeannine Strandjord
Year of Birth: 1945
Position(s) with the Funds: Director
Length of Time Served: Since 1994
Principal Occupation(s) During the Past Five Years: Retired, formerly, Senior Vice President,
Process Excellence, Sprint Corporation (telecommunications company) (January
2005-September 2005)
Number of Funds in Fund Complex Overseen by Director: 63
Other Directorships Held by Director: DST Systems Inc., Euronet Worldwide Inc., Charming
Shoppes, Inc.
Education/Other Professional Experience: BS in Business Administration and Accounting,
University of Kansas; CPA; formerly, Senior Vice President of Financial Services and
Treasurer and Chief Financial Officer, Global Markets Group; Sprint Corporation;
formerly, with the accounting firm of Ernst and Whinney
John R. Whitten
Year of Birth: 1946
Position(s) with the Funds: Director
Length of Time Served: Since 2008
Principal Occupation(s) During the Past Five Years: Project Consultant, Celanese Corp.
(industrial chemical company)
Number of Funds in Fund Complex Overseen by Director: 63
Other Directorships Held by Director: Rudolph Technologies, Inc.
Professional Education/Experience: BS in Business Administration, Cleveland State
University; CPA; formerly, Chief Financial Officer and Treasurer, Applied Industrial
Technologies, Inc.; thirteen years of experience with accounting firm Deloitte &
Touche LLP
Interested Director
Jonathan S. Thomas
Year of Birth: 1963
Position(s) with the Funds: Director and President
Length of Time Served: Since 2007
Principal Occupation(s) During the Past Five Years: President and Chief Executive Officer,
ACC (March 2007 to present); Chief Administrative Officer, ACC (February 2006 to
February 2007); Executive Vice President, ACC (November 2005 to February 2007).
Also serves as: Chief Executive Officer and Manager, American Century Services,
LLC (ACS); Executive Vice President, American Century Investment Management
(ACIM) and American Century Global Investment Management (ACGIM); Director,
ACIM, ACGIM and other ACC subsidiaries; Global Chief Operating Officer and
Managing Director, Morgan Stanley (investment management) (March 2000 to
November 2005)
Number of Funds in Fund Complex Overseen by Director: 104
Other Directorships Held by Director: None
Education/Other Professional Experience: BA in Economics, University of Massachusetts;
MBA, Boston College; formerly held senior leadership roles with Fidelity
Investments, Boston Financial Services and Bank of America; serves on the Board
of Governors of the Investment Company Institute
54
Officers
The following table presents certain information about the executive officers of the funds. Each officer serves as an officer for each of the 15 investment companies in the American Century family of funds, unless otherwise noted. No officer is compensated for his or her service as an officer of the funds. The listed officers are interested persons of the funds and are appointed or re-appointed on an annual basis. The mailing address for each of the officers listed below is 4500 Main Street, Kansas City, Missouri 64111.
| | |
| Name | Offices with | |
| (Year of Birth) | the Funds | Principal Occupation During the Past Five Years |
| Jonathan Thomas | Director and | President and Chief Executive Officer, ACC (March 2007 to present); Chief |
| (1963) | President | Administrative Officer, ACC (February 2006 to March 2007); Executive |
| | since 2007 | Vice President, ACC (November 2005 to February 2007). Also serves as: |
| | | Chief Executive Officer and Manager, ACS; Executive Vice President, ACIM, |
| | | ACGIM; Director, ACIM, ACGIM and other ACC subsidiaries; Global Chief |
| | | Operating Officer and Managing Director, Morgan Stanley (March 2000 to |
| | | November 2005) |
| Barry Fink | Executive Vice | Chief Operating Officer and Executive Vice President, ACC (September 2007 |
| (1955) | President | to present); President, ACS (October 2007 to present); Managing Director, |
| | since 2007 | Morgan Stanley (2000 to 2007); Global General Counsel, Morgan Stanley |
| | | (2000 to 2006). Also serves as: Manager, ACS and Director, ACC and |
| | | certain ACC subsidiaries |
| Maryanne Roepke | Chief Compliance | Chief Compliance Officer, American Century funds, ACIM, ACGIM and |
| (1956) | Officer since 2006 | ACS (August 2006 to present); Assistant Treasurer, ACC (January 1995 to |
| | and Senior | August 2006); and Treasurer and Chief Financial Officer, various American |
| | Vice President | Century funds (July 2000 to August 2006). Also serves as: Senior Vice |
| | since 2000 | President, ACS |
| Charles | General Counsel | Attorney, ACC (February 1994 to present); Vice President, ACC (November |
| Etherington | since 2007 and | 2005 to present), General Counsel, ACC (March 2007 to present); Also |
| (1957) | Senior Vice | serves as General Counsel, ACIM, ACGIM, ACS, ACIS and other ACC |
| | President | subsidiaries; and Senior Vice President, ACIM, ACGIM and ACS |
| | since 2006 | |
| Robert Leach | Vice President, | Vice President, ACS (February 2000 to present); and Controller, various |
| (1966) | Treasurer and | American Century funds (1997 to September 2006) |
| | Chief Financial | |
| | Officer since 2006 | |
| David Reinmiller | Vice President | Attorney, ACC (January 1994 to present); Associate General Counsel, ACC |
| (1963) | since 2000 | (January 2001 to present); Chief Compliance Officer, American Century |
| | | funds, ACIM and ACGIM (January 2001 to February 2005). Also serves as |
| | | Vice President, ACIM, ACGIM and ACS |
| Ward Stauffer | Secretary | Attorney, ACC (June 2003 – Present) |
| (1960) | since 2005 | |
The SAI has additional information about the funds’ directors and is available without charge, upon request, by calling 1-800-345-2021.
55
|
| Board Approval of Management Agreements |
American Century Investment Management, Inc. (“ACIM” or the “Advisor”) currently serves as investment advisor to the Funds under an interim management agreement (the “Interim Management Agreement”) between the Advisor and the Funds approved by the Funds’ Board of Directors (the “Board”). The Advisor previously served as investment advisor to the Funds pursuant to a management agreement (the “Prior Management Agreement”) that terminated in accordance with its terms on February 16, 2010, as a result of a change of control of the Advisor’s parent company, American Century Companies, Inc. (“ACC”). The change in control occurred as the result of a change in the trustee of a trust created by James E. Stowers, Jr., the founder of American Century Investments, which holds shares representing a significant interest in ACC stock. Mr. Stowers previously se rved as the trustee of the trust. On February 16, 2010, Richard W. Brown, Co-Chairman of ACC with Mr. Stowers, became the trustee in accordance with the terms of the trust and Mr. Stowers’ long-standing estate and succession plan.
On February 18, 2010, the Board approved the Interim Management Agreement in accordance with Rule 15a-4 under the Investment Company Act to ensure continued management of the Funds by the Advisor after the termination of the Prior Management Agreement and until shareholder approval of a new management agreement (the “Proposed Management Agreement”) as required under the Act. The Board has approved the Proposed Management Agreement and has recommended its approval to shareholders. Fund shareholders are scheduled to consider approval of the Proposed Management Agreement at a meeting to be held on June 16, 2010.*
The Interim Management Agreement and the Proposed Management Agreement are substantially identical to the Prior Management Agreement except for their effective dates and the termination provisions of the Interim Management Agreement. Under the Interim and Proposed Management Agreements, the Advisor will provide the same services to the Funds and receive the same compensation rate as under the Prior Management Agreement.
Basis for Board Approval of Interim Management Agreement
In considering the approval of the Interim Management Agreement, Rule 15a-4 requires the Board to approve the contract within ten business days of the termination of the prior agreement and to determine that the compensation to be received under the interim agreement is no greater than would have been received under the prior agreement. In connection with the approval, the Board noted that it oversees on a continuous basis and evaluates at its quarterly meetings, directly and through the committees of the Board, the nature and quality of significant services provided by the Advisor, the investment performance of the Funds, shareholder services, audit and compliance functions and a variety of other matters relating to the Funds’ operations.
|
| *Management agreements for new share classes of the Funds launched after February 16, 2010, did not terminate, have not been replaced by Interim |
| Management Agreements, and do not require Board or shareholder approval at this time. |
56
In evaluating the Interim Management Agreement, the Board, assisted by the advice of its independent legal counsel, considered a number of factors in addition to those required by the rule with no one factor being determinative to its analysis. Among the factors considered by the Board were the circumstances and effect of the change of control, the fact that the Advisor will provide the same services and receive the same compensation rate as under the Prior Management Agreements, and that the change of control did not result in a change of the personnel managing the Funds. Upon completion of its analysis, the Board approved the Interim Management Agreement, determining that the continued management of the Funds by the Advisor was in the best interests of the Funds and Fund shareholders.
Basis for Board Approval of Proposed Management Agreement
At a meeting held on March 29, 2010, after considering all information presented, the Board approved, and determined to recommend that shareholders approve, the Proposed Management Agreement. In connection with that approval, the Board requested and reviewed extensive data and information compiled by the Advisor and certain independent providers of evaluation data concerning the Funds and services provided to the Funds by the Advisor. The Board oversees on a continuous basis and evaluates at its quarterly meetings, directly and through the committees of the Board, the nature and quality of significant services provided by the Advisor, the investment performance of the Funds, shareholder services, audit and compliance functions and a variety of other matters relating to the Funds’ operations. The information considered and the discussions held at the meetings included, but were not limited to:
• the nature, extent and quality of investment management, shareholder services and other services provided to the Funds;
• the wide range of programs and services the Advisor provides to the Funds and their shareholders on a routine and non-routine basis;
• the compliance policies, procedures, and regulatory experience of the Advisor;
• data comparing the cost of owning the Funds to the cost of owning similar funds;
• the fact that there will be no changes to the fees, services, or personnel who provide such services as compared to the Prior Management Agreement;
• data comparing the Funds’ performance to appropriate benchmarks and/ or a peer group of other mutual funds with similar investment objectives and strategies;
• financial data showing the profitability of the Funds to the Advisor and the overall profitability of the Advisor;
• data comparing services provided and charges to the Funds with those for other non-fund investment management clients of the Advisor; and
57
• consideration of collateral or “fall-out” benefits derived by the Advisor from the management of the Funds and potential sharing of economies of scale in connection with the management of the Funds.
The Board also considered whether there was any reason for not continuing the existing arrangement with the Advisor. In particular, the Board recognized that shareholders may have invested in the Funds on the strength of the Advisor’s industry standing and reputation and in the expectation that the Advisor will have a continuing role in providing advisory services to the Funds.
The Board considered all of the information provided by the Advisor, the independent data providers, and the Board’s independent legal counsel, and evaluated such information for each Fund. The Board did not identify any single factor as being all-important or controlling, and each Board member may have attributed different levels of importance to different factors. In deciding to approve the Proposed Management Agreement under the terms ultimately determined by the Board to be appropriate, the Board based its decision on a number of factors, including the following:
Nature, Extent and Quality of Services – Generally. Under the Proposed Management Agreement, the Advisor is responsible for providing or arranging for all services necessary for the operation of the Funds. The Board noted that under the Proposed Management Agreement, the Advisor provides or arranges at its own expense a wide variety of services including:
• constructing and designing the Funds
• portfolio research and security selection
• initial capitalization/funding
• securities trading
• Fund administration
• custody of Fund assets
• daily valuation of each Fund’s portfolio
• shareholder servicing and transfer agency, including shareholder confir-
mations, recordkeeping and communications
• legal services
• regulatory and portfolio compliance
• financial reporting
• marketing and distribution
58
The Board noted that many of these services have expanded over time both in terms of quantity and complexity in response to shareholder demands, competition in the industry, changing distribution channels and the changing regulatory environment.
Investment Management Services. The investment management services provided to the Funds are complex and provide Fund shareholders access to professional money management, instant diversification of their investments within an asset class, the opportunity to easily diversify among asset classes, and liquidity. As a part of its general oversight and in evaluating investment performance, the Board expects the Advisor to manage each Fund in accordance with its investment objectives and approved strategies. In providing these services, the Advisor utilizes teams of investment professionals who require extensive information technology, research, training, compliance and other systems to conduct their business. The Board, directly and through its Fund Performance Review Committee, regularly reviews investment performance information for each Fund, together with comparative information for appropriate benchmarks and/or peer groups of similarly-managed funds, over different time horizons. If performance concerns are identified, the underperforming Fund receives special reviews until performance improves, during which time the Board discusses with the Advisor the reasons for such underperformance and any efforts being undertaken to improve performance.
Shareholder and Other Services. Under the Proposed Management Agreement, the Advisor will also provide the Funds with a comprehensive package of transfer agency, shareholder, and other services. The Board, directly and through the various committees of the Board, regularly reviews reports and evaluations of such services. These reports include, but are not limited to, information regarding the operational efficiency and accuracy of the shareholder and transfer agency services provided, staffing levels, shareholder satisfaction (as measured by external as well as internal sources), technology support, new products and services offered to Fund shareholders, securities trading activities, portfolio valuation services, auditing services, and legal and operational compliance activities. Certain aspects of shareholder and transfer a gency service level efficiency and the quality of securities trading activities are measured by independent third party providers and are presented in comparison to other fund groups not managed by the Advisor.
Costs of Services Provided and Profitability. The Advisor provided detailed information concerning its cost of providing various services to the Funds, its profitability in managing the Funds, its overall profitability, and its financial condition. The Board reviewed with the Advisor the methodology used to prepare this financial information. The Board has also reviewed with the Advisor its methodology for compensating the investment professionals that provide services to the Funds as well as compensation to the five highest paid personnel of the Advisor. This financial information regarding the Advisor is considered in order to evaluate the Advisor’s financial condition, its ability to continue to provide services under the Proposed
59
Management Agreement, and the reasonableness of the proposed management fees. The Board concluded that the Advisor’s profits were reasonable in light of the services provided to the Funds.
Ethics. The Board generally considers the Advisor’s commitment to providing quality services to shareholders and to conducting its business ethically. It noted that the Advisor’s practices generally meet or exceed industry best practices.
Economies of Scale. The Board also reviewed information provided by the Advisor regarding the possible existence of economies of scale in connection with the management of the Funds. The Board concluded that economies of scale are difficult to measure and predict with precision, especially on a fund-by-fund basis. The analysis of economies of scale is further complicated by the additional services and content provided by the Advisor and its reinvestment in its ability to provide and expand those services. Accordingly, the Board seeks to evaluate economies of scale by reviewing information, such as year-over-year profitability of the Advisor generally, the profitability of its management of each Fund specifically, and the expenses incurred by the Advisor in providing various functions to the Funds. The Board believes the Adviso r is appropriately sharing economies of scale through its competitive fee structure, offering competitive fees from fund inception, fee breakpoints as each Fund increases in size, and through reinvestment in its business to provide shareholders additional services and enhancements to existing services.
Comparison to Fees of Funds not Managed by the Advisor. Both the Prior and Proposed Management Agreements provide that the Funds pay the Advisor a single, all-inclusive (or unified) management fee for providing all services necessary for the management and operation of the Funds, other than brokerage expenses, taxes, interest, extraordinary expenses, and the fees and expenses of the Funds’ Independent Trustees (including their independent legal counsel) and expenses incurred in connection with the provision of shareholder services and distribution services under a plan adopted pursuant to Rule 12b-1 under the 1940 Act. Under the unified fee structure, the Advisor is responsible for providing all investment advisory, custody, audit, administrative, compliance, recordkeeping, marketing and shareholder services, or arranging and supervising third parties that provide such services. By contrast, most other funds are charged a variety of fees, including an investment advisory fee, a transfer agency fee, an administrative fee, distribution charges and other expenses. Other than their investment advisory fees and any applicable Rule 12b-1 distribution fees, the components of the total fees charged by these other funds may be increased without shareholder approval. The Board believes the unified fee structure is a benefit to Fund shareholders because it clearly discloses to shareholders the cost of owning Fund shares, and, since the unified fee cannot be increased without a vote of Fund shareholders, it shifts to the Advisor the risk of increased costs of operating the Funds and provides a direct incentive to minimize administrative inefficiencies. Part of the Board’s analysis of fee levels involves
60
reviewing certain evaluative data compiled by an independent provider comparing each Fund’s unified fee to the total expense ratios of similar funds not managed by the Advisor. The Board concluded that the management fee to be paid by each Fund to the Advisor under the Proposed Management Agreement is reasonable in light of the services to be provided to the Fund.
Comparison to Fees and Services Provided to Other Clients of the Advisor. The Board also requested and received information from the Advisor concerning the nature and extent of the services, fees, and profitability of its advisory services to advisory clients other than the Funds. They observed that these varying types of client accounts require different services and involve different regulatory and entrepreneurial risks than the management of the Funds. The Board analyzed this information and concluded that the fees charged and services provided to the Funds were reasonable by comparison.
Collateral or “Fall-Out” Benefits Derived by the Advisor. The Board considered the existence of collateral benefits the Advisor may receive as a result of its relationship with the Funds. The Board concluded that the Advisor’s primary business is managing mutual funds and it generally does not use Fund or shareholder information to generate profits in other lines of business, and therefore does not derive any significant collateral benefits from them. The Board noted that the Advisor receives proprietary research from broker-dealers that execute Fund portfolio transactions and concluded that this research is likely to benefit Fund shareholders. The Board also determined that the Advisor is able to provide investment management services to certain clients other than the Funds, at least in part, due to its existin g infrastructure built to serve the fund complex. The Board concluded, however, that the assets of those other clients are not material to the analysis and, in any event, are included with the assets of the Funds to determine breakpoints in each Fund’s fee schedule, provided they are managed using the same investment team and strategy.
Conclusion of the Board. As a result of this process, the Board, in the absence of particular circumstances and assisted by the advice of its independent legal counsel, taking into account all of the factors discussed above and the information provided by the Advisor and others, concluded that the Proposed Management Agreement be approved and recommended its approval to Fund shareholders.
61
Retirement Account Information
As required by law, distributions you receive from certain IRAs, or 403(b), 457 and qualified plans are subject to federal income tax withholding, unless you elect not to have withholding apply. Tax will be withheld on the total amount withdrawn even though you may be receiving amounts that are not subject to withholding, such as nondeductible contributions. In such case, excess amounts of withholding could occur. You may adjust your withholding election so that a greater or lesser amount will be withheld.
If you don’t want us to withhold on this amount, you must notify us to not withhold the federal income tax. You may notify us in writing or in certain situations by telephone or through other electronic means. You have the right to revoke your withholding election at any time and any election you make may remain in effect until revoked by filing a new election.
Remember, even if you elect not to have income tax withheld, you are liable for paying income tax on the taxable portion of your withdrawal. If you elect not to have income tax withheld or you don’t have enough income tax withheld, you may be responsible for payment of estimated tax. You may incur penalties under the estimated tax rules if your withholding and estimated tax payments are not sufficient. You can reduce or defer the income tax on a distribution by directly or indirectly rolling such distribution over to another IRA or eligible plan. You should consult your tax advisor for additional information.
State tax will be withheld if, at the time of your distribution, your address is within one of the mandatory withholding states and you have federal income tax withheld. State taxes will be withheld from your distribution in accordance with the respective state rules.
Proxy Voting Guidelines
American Century Investment Management, Inc., the funds’ investment advisor, is responsible for exercising the voting rights associated with the securities purchased and/or held by the funds. A description of the policies and procedures the advisor uses in fulfilling this responsibility is available without charge, upon request, by calling 1-800-345-2021. It is also available on American Century Investments’ website at americancentury.com and on the Securities and Exchange Commission’s website at sec.gov. Information regarding how the investment advisor voted proxies relating to portfolio securities during the most recent 12-month period ended June 30 is available on the “About Us” page at americancentury.com. It is also available at sec.gov.
Quarterly Portfolio Disclosure
The funds file their complete schedule of portfolio holdings with the Securities and Exchange Commission (SEC) for the first and third quarters of each fiscal year on Form N-Q. The funds’ Forms N-Q are available on the SEC’s website at sec.gov, and may be reviewed and copied at the SEC’s Public Reference Room in Washington, DC. Information on the operation of the Public Reference Room may be obtained by calling 1-800-SEC-0330. The funds also make their complete schedule of portfolio holdings for the most recent quarter of their fiscal year available on their website at americancentury.com and, upon request, by calling 1-800-345-2021.
62
The following indices are used to illustrate investment market, sector, or style performance or to serve as fund performance comparisons. They are not investment products available for purchase.
The Lipper Small-Cap Value Funds Index is an equal dollar-weighted index of, typically, the 30 largest mutual funds within the Small-Cap Value fund classification, as defined by Lipper. The index is adjusted for the reinvestment of capital gains and income dividends.
The Russell 1000® Index is a market-capitalization weighted, large-cap index created by Frank Russell Company to measure the performance of the 1,000 largest publicly traded U.S. companies, based on total market capitalization.
The Russell 1000® Growth Index measures the performance of those Russell 1000 Index companies (the 1,000 largest publicly traded U.S. companies, based on total market capitalization) with higher price-to-book ratios and higher forecasted growth values.
The Russell 1000® Value Index measures the performance of those Russell 1000 Index companies (the 1,000 largest publicly traded U.S. companies, based on total market capitalization) with lower price-to-book ratios and lower forecasted growth values.
The Russell 2000® Index is a market-capitalization weighted index created by Frank Russell Company to measure the performance of the 2,000 smallest of the 3,000 largest publicly traded U.S. companies, based on total market capitalization.
The Russell 2000® Growth Index measures the performance of those Russell 2000 Index companies (the 2,000 smallest of the 3,000 largest publicly traded U.S. companies, based on total market capitalization) with higher price-to-book ratios and higher forecasted growth values.
The Russell 2000® Value Index measures the performance of those Russell 2000 Index companies (the 2,000 smallest of the 3,000 largest publicly traded U.S. companies, based on total market capitalization) with lower price-to-book ratios and lower forecasted growth values.
The Russell Midcap® Index measures the performance of the 800 smallest of the 1,000 largest publicly traded U.S. companies, based on total market capitalization.
The Russell Midcap® Growth Index measures the performance of those Russell Midcap Index companies (the 800 smallest of the 1,000 largest publicly traded U.S. companies, based on total market capitalization) with higher price-to-book ratios and higher forecasted growth values.
The Russell Midcap® Value Index measures the performance of those Russell Midcap Index companies (the 800 smallest of the 1,000 largest publicly traded U.S. companies, based on total market capitalization) with lower price-to-book ratios and lower forecasted growth values.
63
64

| |
| |
| Contact Us | |
| americancentury.com | |
| Automated Information Line | 1-800-345-8765 |
| Investor Services Representative | 1-800-345-2021 or |
| | 816-531-5575 |
| Business, Not-For-Profit, Employer-Sponsored | |
| Retirement Plans | 1-800-345-3533 |
| Banks and Trust Companies, Broker-Dealers, | |
| Financial Professionals, Insurance Companies | 1-800-345-6488 |
| Telecommunications Device for the Deaf | 1-800-634-4113 |
| American Century Capital Portfolios, Inc. | |
| Investment Advisor: | |
| American Century Investment Management, Inc. | |
| Kansas City, Missouri | |
This report and the statements it contains are submitted for the general
information of our shareholders. The report is not authorized for distribution to
prospective investors unless preceded or accompanied by an effective prospectus.
American Century Investment Services, Inc., Distributor
©2010 American Century Proprietary Holdings, Inc. All rights reserved.
1005
CL-ANN-68271S
|
| Annual Report |
| March 31, 2010 |

|
| American Century Investments® |
Equity Index Fund
| |
| President’s Letter | 2 |
| Independent Chairman’s Letter | 3 |
| Market Perspective | 4 |
| U.S. Stock Index Returns | 4 |
| |
| Equity Index | |
| |
| Performance | 5 |
| Portfolio Commentary | 6 |
| Top Ten Holdings | 8 |
| Top Five Industries | 8 |
| Types of Investments in Portfolio | 8 |
| |
| Shareholder Fee Example | 9 |
| |
| Financial Statements | |
| |
| Schedule of Investments | 11 |
| Statement of Assets and Liabilities | 19 |
| Statement of Operations | 20 |
| Statement of Changes in Net Assets | 21 |
| Notes to Financial Statements | 22 |
| Financial Highlights | 28 |
| Report of Independent Registered Public Accounting Firm | 30 |
| |
| Other Information | |
| |
| Management | 31 |
| Board Approval of Management and Subadvisory Agreements | 35 |
| Additional Information | 42 |
| Index Definitions | 43 |
Any opinions expressed in this report reflect those of the author as of the date of the report, and do not necessarily represent the opinions of American Century Investments or any other person in the American Century Investments organization. Any such opinions are subject to change at any time based upon market or other conditions and American Century Investments disclaims any responsibility to update such opinions. These opinions may not be relied upon as investment advice and, because investment decisions made by American Century Investments funds are based on numerous factors, may not be relied upon as an indication of trading intent on behalf of any American Century Investments fund. Security examples are used for representational purposes only and are not intended as recommendations to purchase or sell securities. Performance information for comparative indices and securities is provided to American Century Investments by third party vendors. To the best of American Century Investments’ knowledge, such information is accurate at the time of printing.

Dear Investor:
To learn more about the capital markets, your investment, and the portfolio management strategies American Century Investments provides, we encourage you to review this shareholder report for the financial reporting period ended March 31, 2010.
On the following pages, you will find investment performance and portfolio information, presented with the expert perspective and commentary of our portfolio management team. This report remains one of our most important vehicles for conveying the information you need about your investment performance, and about the market factors and strategies that affect fund returns. For additional information on the markets, we encourage you to visit the “Insights & News” tab at our Web site, americancentury.com, for updates and further expert commentary.
The top of our Web site’s home page also provides a link to “Our Story,” which, first and foremost, outlines our commitment—since 1958—to helping clients reach their financial goals. We believe strongly that we will only be successful when our clients are successful. That’s who we are.
Another important, unique facet of our story and who we are is “Profits with a Purpose,” which describes our bond with the Stowers Institute for Medical Research (SIMR). SIMR is a world-class biomedical organization—founded by our company founder James E. Stowers, Jr. and his wife Virginia—that is dedicated to researching the causes, treatment, and prevention of gene-based diseases, including cancer. Through American Century Investments’ private ownership structure, more than 40% of our profits support SIMR.
Mr. Stowers’ example of achieving financial success and using that platform to help humanity motivates our entire American Century Investments team. His story inspires us to help each of our clients achieve success. Thank you for sharing your financial journey with us.
Sincerely,

Jonathan Thomas
President and Chief Executive Officer
American Century Investments
2
|
| Independent Chairman’s Letter |

Fellow Shareholders,
The principal event at a recent board meeting was the retirement of Jim Stowers, Jr. from the American Century Mutual Funds Kansas City board. This was one of those times when you felt like you were living a historical moment. Jim founded what was known as Twentieth Century Mutual Funds over 50 years ago. Through the years, his number one priority has been to “Put Investors First!” The board presented Jim with a resolution acknowledging that, by building a successful investment company, he has impacted the lives of many by helping them on the path to financial success.
We respect Jim’s decision to focus his energy on the Stowers Institute for Medical Research and American Century Companies, Inc. (ACC), the parent company of the funds’ investment advisors. The pioneering medical research that Jim and his wife Virginia have made possible through the Institute should enrich the lives of millions in the future.
Shortly after his retirement from the board, we received word that Jim—who celebrated his 86th birthday in January—was hospitalized after experiencing a fall during his regular exercise regimen. While Jim has made steady progress toward recovery, this potentially serious incident resulted in the activation of his long-standing estate and business succession plan. Under the terms of the plan, ACC’s co-chairman Richard W. Brown succeeded Jim as trustee of a trust that holds a significant interest in ACC stock. While less than a majority interest, the trust is presumed to control the funds’ investment advisors under the Investment Company Act of 1940. This change triggered the need for a shareholder proxy to approve new management and subadvisory agreements for the funds. If you have not already responded, I encourage you to take the time to read the proxy materials and send your vote as soon as p ossible.
On behalf of the board, I want to once again thank Jim for his mutual fund board service and wish him a speedy recovery. More than three years ago, Jim and Richard Brown installed a strong and effective leadership team at American Century Investments and I look forward to continuing to work with them on behalf of fund shareholders. And while Jim no longer sits on the fund board, the inherent optimism captured by his favorite catch phrase—“The best is yet to be”—still resonates with all of us who have the privilege of serving you. I invite you to send your comments, questions or concerns to me at dhpratt@fundboardchair.com.

3

By Enrique Chang, Chief Investment Officer, American Century Investments
A Remarkable Recovery for Stocks
The U.S. stock market generated a very strong return for the year ended March 31, 2010, enjoying one of its best 12-month performances since 1983 (see the table below). The market’s extraordinary advance was driven by growing signs of economic recovery following a severe recession in late 2008 and early 2009.
The reporting period began shortly after the stock market hit its lowest point in 13 years, weighed down by the Great Recession—the worst economic downturn since the 1930s. Since then, however, the economic environment has improved markedly, providing support to the equity market. An increase in manufacturing activity, improving consumer spending, and signs of stabilization in the housing sector helped the U.S. economy post positive economic growth in the second half of 2009 after a year of declining output. The major exception to the favorable economic data was employment—job losses continued to mount and the unemployment rate remained persistently elevated throughout the 12-month period.
Stocks also got a lift from corporate earnings, which consistently exceeded expectations during the reporting period. The improvement in corporate profits occurred despite flat-to-declining revenues as businesses managed their cost structure more effectively, successfully lowering expenses.
Better economic data and rising corporate profits helped the stock market bounce back sharply throughout the reporting period, producing tremendous gains—the broad stock indices delivered returns of more than 50% for the 12 months. Mid-cap stocks posted the best results, followed by small-and large-cap shares, while value-oriented issues outpaced growth across all market capitalizations.
Bumps in the Road
Although we appear to be on a path to economic recovery, there are still likely to be bumps in the road before we can put the Great Recession firmly behind us. We are still facing an unemployment rate near 10%, a fragile financial sector, and enormous fiscal deficits. In addition, consumers and businesses are continuing to deleverage, which is likely to limit any improvements in retail and corporate spending. As a result, we expect a slower and longer road to prosperity than in past recoveries.
| | | | |
| U.S. Stock Index Returns | | | | |
| For the 12 months ended March 31, 2010 | | | | |
| Russell 1000 Index (Large-Cap) | 51.60% | | Russell 2000 Index (Small-Cap) | 62.76% |
| Russell 1000 Growth Index | 49.75% | | Russell 2000 Growth Index | 60.32% |
| Russell 1000 Value Index | 53.56% | | Russell 2000 Value Index | 65.07% |
| Russell Midcap Index | 67.71% | | | |
| Russell Midcap Growth Index | 63.00% | | | |
| Russell Midcap Value Index | 72.41% | | | |
4
| | | | | | |
| Equity Index | | | | | | |
| |
| Total Returns as of March 31, 2010 | | | | |
| | | | Average Annual Returns | |
| | Ticker | | | | Since | Inception |
| | Symbol | 1 year | 5 years | 10 years | Inception | Date |
| Investor Class | ACIVX | 48.96% | 1.47% | -1.12% | 0.77% | 2/26/99 |
| S&P 500 Index(1) | — | 49.77% | 1.92% | -0.65% | 1.26% | — |
| Institutional Class | ACQIX | 49.27% | 1.63% | -0.92% | 0.97% | 2/26/99 |
| (1) Data provided by Lipper Inc. — A Reuters Company. © 2010 Reuters. All rights reserved. Any copying, republication or redistribution of Lipper |
| content, including by caching, framing or similar means, is expressly prohibited without the prior written consent of Lipper. Lipper shall not be |
| liable for any errors or delays in the content, or for any actions taken in reliance thereon. | | | |
| The data contained herein has been obtained from company reports, financial reporting services, periodicals and other resources believed to be |
| reliable. Although carefully verified, data on compilations is not guaranteed by Lipper and may be incomplete. No offer or solicitations to buy or |
| sell any of the securities herein is being made by Lipper. | | | | |
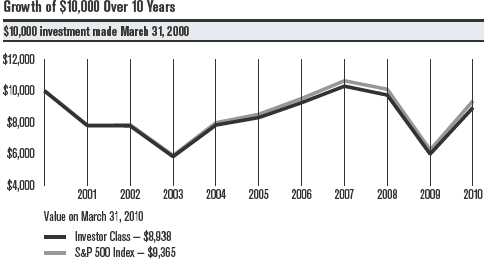
| |
| Total Annual Fund Operating Expenses | |
| Investor Class | Institutional Class |
| 0.50% | 0.30% |
The total annual fund operating expenses shown is as stated in the fund’s prospectus current as of the date of this report. The prospectus may vary from the expense ratio shown elsewhere in this report because it is based on a different time period, includes acquired fund fees and expenses, and, if applicable, does not include fee waivers or expense reimbursements.
Data presented reflect past performance. Past performance is no guarantee of future results. Current performance may be higher or lower than the performance shown. Investment return and principal value will fluctuate, and redemption value may be more or less than original cost. To obtain performance data current to the most recent month end, please call 1-800-345-2021 or visit americancentury.com.
Unless otherwise indicated, performance reflects Investor Class shares; performance for other share classes will vary due to differences in fee structure. For information about other share classes available, please consult the prospectus. Data assumes reinvestment of dividends and capital gains, and none of the charts reflect the deduction of taxes that a shareholder would pay on fund distributions or the redemption of fund shares. Returns for the index are provided for comparison. The fund’s total returns include operating expenses (such as transaction costs and management fees) that reduce returns, while the total returns of the index do not.
5
Equity Index
Subadvisor: Northern Trust Investments, N.A.
Performance Summary
Equity Index returned 48.96%* for the fiscal year ended March 31, 2010, compared with the 49.77% return of its benchmark, the S&P 500 Index. The portfolio’s results reflected operating expenses, whereas the index return did not.
The fund’s return of nearly 50% for the 12-month period reflected the substantial rebound in the stock market after its sharp decline in late 2008 and early 2009. Improving economic conditions provided the main catalyst for the stock market’s recovery. Every sector in the S&P 500 Index posted double-digit gains for the period, led by those with the greatest economic sensitivity—information technology, industrials, and consumer discretionary. Financial stocks, which declined the most during the downturn, also generated strong gains over the past 12 months.
Technology Led the Advance
The fund’s holdings in the information technology sector—the largest sector weighting in the portfolio—had the biggest positive impact on performance during the reporting period. Five of the fund’s top ten performance contributors came from this sector, including the top two—consumer electronics maker Apple and software giant Microsoft. Apple returned more than 120% for the period thanks to strong sales of its iPhone and the introduction of the iPad, a new tablet computer with a touch screen. Microsoft benefited from the release of Windows 7, the latest upgrade to its dominant operating system.
Other top-performing technology holdings included network products maker Cisco Systems, which made some beneficial acquisitions and moved into new market segments; online advertising and search firm Google, which delivered robust earnings despite a difficult advertising environment; and computer hardware maker Hewlett-Packard, which rallied as demand for PCs improved.
Financials Rebounded
The financials sector produced the best overall return in the portfolio, gaining more than 80% for the 12-month period. Crippled by the economic downturn and credit crisis in late 2008, financial stocks staged a substantial rebound over the past 12 months as economic and credit conditions improved, enabling many financial firms to raise capital and rebuild their damaged balance sheets.
The best contributors in this sector included financial services provider Bank of America and commercial bank Wells Fargo, both of which produced triple-digit returns for the reporting period. Bank of America began a return to profitability and made progress on paying back funds provided by the federal government under the Troubled Asset Relief
*All fund returns referenced in this commentary are for Investor Class shares.
6
Equity Index
Program (TARP). Wells Fargo repeatedly exceeded earnings expectations and issued equity during the period to improve its balance sheet. Investment banks JPMorgan Chase and Goldman Sachs were also among the fund’s top performance contributors during the period.
Consumer Discretionary and Industrials Stocks Also Surged
The fund’s consumer discretionary and industrials stocks generated strong returns as the economic environment improved. In the industrials sector, aerospace and defense companies and industrial conglomerates were the best performers, led by industrial giant General Electric. Improving financial conditions boosted GE Capital, the company’s finance arm, and rising orders for industrial goods helped General Electric report consistently better-than-expected earnings. Defense contractor United Technologies and aircraft manufacturer Boeing, which completed a successful test flight of its long-awaited 787 Dreamliner, were also significant performance contributors in this sector.
Media companies and retailers were the top contributors in the consumer discretionary sector. Entertainment company Walt Disney was the leading contributor in this sector, advancing as strong results from the company’s television channels and movie studios—particularly its Pixar and Marvel Entertainment units—more than offset weakness at its theme parks. Auto maker Ford Motor also performed well, surging by more than 350% for the period as auto sales began to recover.
Utilities and Telecom Lagged
The more-defensive utilities and telecommunication services sectors of the portfolio posted the lowest returns. Stiff price competition continued to weigh on the telecom services sector, keeping both wireless and wireline telecom stocks in check. The primary detractor in this sector was discount wireless carrier MetroPCS Communications, which was hit hard by price wars among low-price wireless carriers, leading to lost market share and lower earnings expectations. In the utilities sector, the largest individual detractor was independent power producer NRG Energy, which tumbled as higher operating costs led to disappointing earnings reports during the last two quarters of the period.
Elsewhere, the most significant detractors in the portfolio included agricultural products maker Monsanto, which slumped amid increased competition in its herbicide business and tepid demand for its newest seed product, and biotechnology firm Genzyme, which faced a contamination problem in one of its production facilities that forced a shutdown of the plant.
Outlook
Stocks enjoyed a remarkable rally over the past 12 months, but that is unlikely to be repeated in the coming year. We expect to see further economic improvement as we move through 2010, but there are a number of obstacles—including consumer deleveraging, burgeoning fiscal deficits, and persistently high unemployment—that are likely to result in a slow, gradual pace of recovery.
7
| |
| Equity Index | |
| |
| Top Ten Holdings | |
| | % of net assets as of 3/31/10 |
| Exxon Mobil Corp. | 2.9% |
| Microsoft Corp. | 2.1% |
| Apple, Inc. | 2.0% |
| General Electric Co. | 1.8% |
| Procter & Gamble Co. (The) | 1.7% |
| Johnson & Johnson | 1.7% |
| Bank of America Corp. | 1.7% |
| JPMorgan Chase & Co. | 1.6% |
| International Business Machines Corp. | 1.5% |
| Wells Fargo & Co. | 1.5% |
| |
| Top Five Industries | |
| | % of net assets as of 3/31/10 |
| Oil, Gas & Consumable Fuels | 8.9% |
| Pharmaceuticals | 5.9% |
| Diversified Financial Services | 4.6% |
| Computers & Peripherals | 4.1% |
| Software | 4.0% |
| |
| Types of Investments in Portfolio | |
| | % of net assets as of 3/31/10 |
| Common Stocks and Futures | 99.9% |
| Other Assets and Liabilities | 0.1% |
8
|
| Shareholder Fee Example (Unaudited) |
Fund shareholders may incur two types of costs: (1) transaction costs, including sales charges (loads) on purchase payments and redemption/ exchange fees; and (2) ongoing costs, including management fees; distribution and service (12b-1) fees; and other fund expenses. This example is intended to help you understand your ongoing costs (in dollars) of investing in your fund and to compare these costs with the ongoing cost of investing in other mutual funds.
The example is based on an investment of $1,000 made at the beginning of the period and held for the entire period from October 1, 2009 to March 31, 2010.
Actual Expenses
The table provides information about actual account values and actual expenses for each class. You may use the information, together with the amount you invested, to estimate the expenses that you paid over the period. First, identify the share class you own. Then simply divide your account value by $1,000 (for example, an $8,600 account value divided by $1,000 = 8.6), then multiply the result by the number under the heading “Expenses Paid During Period” to estimate the expenses you paid on your account during this period.
If you hold Investor Class shares of any American Century Investments fund, or Institutional Class shares of the American Century Diversified Bond Fund, in an American Century Investments account (i.e., not a financial intermediary or retirement plan account), American Century Investments may charge you a $12.50 semiannual account maintenance fee if the value of those shares is less than $10,000. We will redeem shares automatically in one of your accounts to pay the $12.50 fee. In determining your total eligible investment amount, we will include your investments in all personal accounts (including American Century Investments Brokerage accounts) registered under your Social Security number. Personal accounts include individual accounts, joint accounts, UGMA/UTMA accounts, personal trusts, Coverdell Education Savings Accounts and IRAs (including traditional, Roth, Rollover, SEP-, SARSEP- and SIMPLE-IRAs), and certain other retirement accounts. If you have only business, business retirement, employer-sponsored or American Century Investments Brokerage accounts, you are currently not subject to this fee. We will not charge the fee as long as you choose to manage your accounts exclusively online. If you are subject to the Account Maintenance Fee, your account value could be reduced by the fee amount.
9
Hypothetical Example for Comparison Purposes
The table also provides information about hypothetical account values and hypothetical expenses based on the actual expense ratio of each class of your fund and an assumed rate of return of 5% per year before expenses, which is not the actual return of a fund’s share class. The hypothetical account values and expenses may not be used to estimate the actual ending account balance or expenses you paid for the period. You may use this information to compare the ongoing costs of investing in your fund and other funds. To do so, compare this 5% hypothetical example with the 5% hypothetical examples that appear in the shareholder reports of the other funds.
Please note that the expenses shown in the table are meant to highlight your ongoing costs only and do not reflect any transactional costs, such as sales charges (loads) or redemption/exchange fees. Therefore, the table is useful in comparing ongoing costs only, and will not help you determine the relative total costs of owning different funds. In addition, if these transactional costs were included, your costs would have been higher.
| | | | |
| | Beginning | Ending | Expenses Paid | |
| | Account Value | Account Value | During Period* | Annualized |
| | 10/1/09 | 3/31/10 | 10/1/09 – 3/31/10 | Expense Ratio* |
| Actual | | | | |
| Investor Class | $1,000 | $1,115.00 | $2.58 | 0.49% |
| Institutional Class | $1,000 | $1,116.20 | $1.53 | 0.29% |
| Hypothetical | | | | |
| Investor Class | $1,000 | $1,022.49 | $2.47 | 0.49% |
| Institutional Class | $1,000 | $1,023.49 | $1.46 | 0.29% |
|
| *Expenses are equal to the class’s annualized expense ratio listed in the table above, multiplied by the average account value over the period, |
| multiplied by 182, the number of days in the most recent fiscal half-year, divided by 365, to reflect the one-half year period. |
10
| | | | | | |
| Equity Index | | | | | | |
| |
| MARCH 31, 2010 | | | | | | |
| | Shares | Value | | | Shares | Value |
| Common Stocks — 97.8% | | | PepsiCo, Inc. | 66,681 | $ 4,411,615 |
| AEROSPACE & DEFENSE — 2.9% | | | | | 10,973,744 |
| Boeing Co. (The) | 30,849 | $ 2,239,946 | | BIOTECHNOLOGY — 1.5% | | |
| | | | | Amgen, Inc.(1) | 39,985 | 2,389,504 |
| General Dynamics Corp. | 15,726 | 1,214,047 | | | | |
| Goodrich Corp. | 5,103 | 359,864 | | Biogen Idec, Inc.(1) | 11,001 | 631,017 |
| Honeywell International, Inc. | 31,061 | 1,406,131 | | Celgene Corp.(1) | 18,699 | 1,158,590 |
| ITT Corp. | 7,559 | 405,238 | | Cephalon, Inc.(1) | 3,061 | 207,475 |
| L-3 Communications | | | | Genzyme Corp.(1) | 10,882 | 564,014 |
| Holdings, Inc. | 4,722 | 432,677 | | Gilead Sciences, Inc.(1) | 36,682 | 1,668,297 |
| Lockheed Martin Corp. | 12,780 | 1,063,552 | | | | 6,618,897 |
| Northrop Grumman Corp. | 12,283 | 805,396 | | BUILDING PRODUCTS — 0.1% | | |
| Precision Castparts Corp. | 5,805 | 735,551 | | Masco Corp. | 14,589 | 226,421 |
| Raytheon Co. | 15,469 | 883,589 | | CAPITAL MARKETS — 2.7% | | |
| Rockwell Collins, Inc. | 6,458 | 404,206 | | Ameriprise Financial, Inc. | 10,476 | 475,191 |
| United Technologies Corp. | 38,096 | 2,804,247 | | Bank of New York | | |
| | | 12,754,444 | | Mellon Corp. (The) | 49,112 | 1,516,578 |
| AIR FREIGHT & LOGISTICS — 1.0% | | | Charles Schwab Corp. (The) | 40,033 | 748,217 |
| C.H. Robinson | | | | E*TRADE Financial Corp.(1) | 67,470 | 111,325 |
| Worldwide, Inc. | 6,803 | 379,948 | | Federated Investors, Inc., | | |
| Expeditors International | | | | Class B | 3,314 | 87,423 |
| of Washington, Inc. | 8,763 | 323,530 | | Franklin Resources, Inc. | 6,091 | 675,492 |
| FedEx Corp. | 12,666 | 1,183,004 | | Goldman Sachs Group, Inc. | | |
| United Parcel Service, Inc., | | | | (The) | 21,460 | 3,661,720 |
| Class B | 40,505 | 2,608,927 | | Invesco Ltd. | 17,403 | 381,300 |
| | | 4,495,409 | | Janus Capital Group, Inc. | 7,316 | 104,546 |
| AIRLINES — 0.1% | | | | Legg Mason, Inc. | 6,776 | 194,268 |
| Southwest Airlines Co. | 30,735 | 406,317 | | Morgan Stanley | 56,934 | 1,667,597 |
| AUTO COMPONENTS — 0.2% | | | | Northern Trust Corp. | 10,274 | 567,741 |
| Goodyear Tire & Rubber Co. | | | | State Street Corp. | 20,077 | 906,276 |
| (The)(1) | 9,620 | 121,597 | | | | |
| | | | | T. Rowe Price Group, Inc. | 10,615 | 583,082 |
| Johnson Controls, Inc. | 27,231 | 898,350 | | | | 11,680,756 |
| | | 1,019,947 | | CHEMICALS — 1.8% | | |
| AUTOMOBILES — 0.5% | | | | Air Products | | |
| Ford Motor Co.(1) | 137,459 | 1,727,860 | | & Chemicals, Inc. | 8,676 | 641,590 |
| Harley-Davidson, Inc. | 9,734 | 273,233 | | Airgas, Inc. | 3,461 | 220,189 |
| | | 2,001,093 | | CF Industries Holdings, Inc. | 2,009 | 183,181 |
| BEVERAGES — 2.5% | | | | Dow Chemical Co. (The) | 46,992 | 1,389,553 |
| Brown-Forman Corp., | | | | E.I. du Pont de Nemours | | |
| Class B | 4,492 | 267,050 | | & Co. | 36,700 | 1,366,708 |
| Coca-Cola Co. (The) | 94,047 | 5,172,585 | | Eastman Chemical Co. | 3,011 | 191,740 |
| Coca-Cola Enterprises, Inc. | 12,835 | 355,016 | | Ecolab, Inc. | 9,438 | 414,800 |
| Constellation Brands, Inc., | | | | FMC Corp. | 2,956 | 178,956 |
| Class A(1) | 8,409 | 138,244 | | | | |
| | | | | International Flavors | | |
| Dr. Pepper Snapple | | | | & Fragrances, Inc. | 3,347 | 159,552 |
| Group, Inc. | 10,131 | 356,307 | | Monsanto Co. | 22,204 | 1,585,810 |
| Molson Coors Brewing Co., | | | | PPG Industries, Inc. | 6,840 | 447,336 |
| Class B | 6,489 | 272,927 | | | | |
| | | | | Praxair, Inc. | 12,500 | 1,037,500 |
11
| | | | | | |
| Equity Index | | | | | | |
| |
| | Shares | Value | | | Shares | Value |
| Sigma-Aldrich Corp. | 4,983 | $ 267,388 | | QLogic Corp.(1) | 4,458 | $ 90,497 |
| | | 8,084,303 | | SanDisk Corp.(1) | 9,402 | 325,591 |
| COMMERCIAL BANKS — 3.1% | | | | Teradata Corp.(1) | 6,594 | 190,501 |
| BB&T Corp. | 28,197 | 913,301 | | Western Digital Corp.(1) | 9,385 | 365,921 |
| Comerica, Inc. | 7,097 | 269,970 | | | | 17,895,009 |
| Fifth Third Bancorp. | 31,879 | 433,236 | | CONSTRUCTION & ENGINEERING — 0.2% | |
| First Horizon | | | | Fluor Corp. | 7,424 | 345,290 |
| National Corp.(1) | 9,448 | 132,738 | | | | |
| | | | | Jacobs Engineering | | |
| Huntington Bancshares, Inc. | 29,311 | 157,400 | | Group, Inc.(1) | 5,115 | 231,147 |
| KeyCorp | 36,390 | 282,022 | | Quanta Services, Inc.(1) | 8,571 | 164,220 |
| M&T Bank Corp. | 3,370 | 267,511 | | | | 740,657 |
| Marshall & Ilsley Corp. | 20,691 | 166,562 | | CONSTRUCTION MATERIALS — 0.1% | |
| PNC Financial Services | | | | Vulcan Materials Co. | 4,977 | 235,113 |
| Group, Inc. | 21,034 | 1,255,730 | | | | |
| | | | | CONSUMER FINANCE — 0.8% | | |
| Regions Financial Corp. | 49,028 | 384,870 | | | | |
| | | | | American Express Co. | 48,872 | 2,016,459 |
| SunTrust Banks, Inc. | 20,150 | 539,818 | | | | |
| | | | | Capital One Financial Corp. | 18,482 | 765,340 |
| U.S. Bancorp. | 77,958 | 2,017,553 | | | | |
| | | | | Discover Financial Services | 22,322 | 332,598 |
| Wells Fargo & Co. | 211,257 | 6,574,318 | | | | |
| | | | | SLM Corp.(1) | 19,249 | 240,997 |
| Zions Bancorp. | 6,252 | 136,419 | | | | |
| | | 13,531,448 | | | | 3,355,394 |
| COMMERCIAL SERVICES & SUPPLIES — 0.5% | | CONTAINERS & PACKAGING — 0.2% | |
| Avery Dennison Corp. | 4,673 | 170,144 | | Ball Corp. | 3,874 | 206,794 |
| Cintas Corp. | 5,236 | 147,079 | | Bemis Co., Inc. | 4,333 | 124,444 |
| | | | | Owens-Illinois, Inc.(1) | 6,952 | 247,074 |
| Iron Mountain, Inc. | 7,285 | 199,609 | | | | |
| | | | | Pactiv Corp.(1) | 5,684 | 143,123 |
| Pitney Bowes, Inc. | 8,717 | 213,131 | | | | |
| R.R. Donnelley & Sons Co. | 7,983 | 170,437 | | Sealed Air Corp. | 6,052 | 127,576 |
| Republic Services, Inc. | 13,245 | 384,370 | | | | 849,011 |
| Stericycle, Inc.(1) | 3,517 | 191,676 | | DISTRIBUTORS — 0.1% | | |
| Waste Management, Inc. | 19,625 | 675,689 | | Genuine Parts Co. | 6,607 | 279,080 |
| | | 2,152,135 | | DIVERSIFIED CONSUMER SERVICES — 0.2% | |
| | | | | Apollo Group, Inc., Class A(1) | 5,344 | 327,534 |
| COMMUNICATIONS EQUIPMENT — 2.4% | | | | | |
| Cisco Systems, Inc.(1) | 233,304 | 6,072,903 | | DeVry, Inc. | 2,600 | 169,520 |
| Harris Corp. | 5,420 | 257,396 | | H&R Block, Inc. | 13,857 | 246,654 |
| JDS Uniphase Corp.(1) | 8,760 | 109,763 | | | | 743,708 |
| Juniper Networks, Inc.(1) | 21,610 | 662,995 | | DIVERSIFIED FINANCIAL SERVICES — 4.6% | |
| | | | | Bank of America Corp. | 409,012 | 7,300,864 |
| Motorola, Inc.(1) | 95,018 | 667,026 | | | | |
| | | | | Citigroup, Inc.(1) | 800,826 | 3,243,346 |
| QUALCOMM, Inc. | 68,517 | 2,877,029 | | | | |
| | | | | CME Group, Inc. | 2,696 | 852,233 |
| Tellabs, Inc. | 14,706 | 111,324 | | | | |
| | | | | IntercontinentalExchange, | | |
| | | 10,758,436 | | Inc.(1) | 3,006 | 337,213 |
| COMPUTERS & PERIPHERALS — 4.1% | | | JPMorgan Chase & Co.(2) | 162,048 | 7,251,648 |
| Apple, Inc.(1) | 36,964 | 8,683,953 | | | | |
| | | | | Leucadia National Corp.(1) | 7,700 | 191,037 |
| Dell, Inc.(1) | 69,963 | 1,050,145 | | McGraw-Hill Cos., Inc. (The) | 13,034 | 464,662 |
| EMC Corp.(1) | 83,731 | 1,510,507 | | Moody’s Corp. | 8,107 | 241,183 |
| Hewlett-Packard Co. | 95,971 | 5,100,859 | | NASDAQ OMX Group, Inc. | | |
| Lexmark International, Inc., | | | | (The)(1) | 5,900 | 124,608 |
| Class A(1) | 3,369 | 121,553 | | NYSE Euronext | 10,725 | 317,567 |
| NetApp, Inc.(1) | 13,989 | 455,482 | | | | 20,324,361 |
12
| | | | | | |
| Equity Index | | | | | | |
| |
| | Shares | Value | | | Shares | Value |
| DIVERSIFIED TELECOMMUNICATION | | | Diamond Offshore | | |
| SERVICES — 2.5% | | | | Drilling, Inc. | 2,845 | $ 252,665 |
| AT&T, Inc. | 240,853 | $ 6,223,641 | | FMC Technologies, Inc.(1) | 5,025 | 324,766 |
| CenturyTel, Inc. | 12,268 | 435,023 | | Halliburton Co. | 36,668 | 1,104,807 |
| Frontier | | | | Helmerich & Payne, Inc. | 4,305 | 163,934 |
| Communications Corp. | 13,529 | 100,656 | | Nabors Industries Ltd.(1) | 11,783 | 231,300 |
| Qwest Communications | | | | National Oilwell Varco, Inc. | 16,933 | 687,141 |
| International, Inc. | 59,635 | 311,295 | | | | |
| | | | | Rowan Cos., Inc.(1) | 4,396 | 127,968 |
| Verizon | | | | | | |
| Communications, Inc. | 115,480 | 3,582,190 | | Schlumberger Ltd. | 48,882 | 3,102,052 |
| Windstream Corp. | 18,223 | 198,448 | | Smith International, Inc. | 10,199 | 436,721 |
| | | 10,851,253 | | | | 7,709,170 |
| ELECTRIC UTILITIES — 1.8% | | | | FOOD & STAPLES RETAILING — 2.6% | |
| Allegheny Energy, Inc. | 6,754 | 155,342 | | Costco Wholesale Corp. | 17,993 | 1,074,362 |
| American Electric | | | | CVS Caremark Corp. | 56,463 | 2,064,287 |
| Power Co., Inc. | 19,300 | 659,674 | | Kroger Co. (The) | 26,332 | 570,351 |
| Duke Energy Corp. | 54,065 | 882,341 | | Safeway, Inc. | 15,763 | 391,868 |
| Edison International | 13,474 | 460,406 | | SUPERVALU, INC. | 9,020 | 150,454 |
| Entergy Corp. | 7,614 | 619,399 | | SYSCO Corp. | 23,961 | 706,850 |
| Exelon Corp. | 27,065 | 1,185,718 | | Walgreen Co. | 40,278 | 1,493,911 |
| FirstEnergy Corp. | 12,296 | 480,650 | | Wal-Mart Stores, Inc. | 86,940 | 4,833,864 |
| FPL Group, Inc. | 16,748 | 809,431 | | Whole Foods Market, Inc.(1) | 6,952 | 251,315 |
| Northeast Utilities | 7,100 | 196,244 | | | | 11,537,262 |
| Pepco Holdings, Inc. | 9,200 | 157,780 | | FOOD PRODUCTS — 1.8% | | |
| Pinnacle West Capital Corp. | 4,163 | 157,070 | | Archer-Daniels-Midland Co. | 25,996 | 751,284 |
| PPL Corp. | 15,084 | 417,978 | | Campbell Soup Co. | 7,633 | 269,826 |
| Progress Energy, Inc. | 11,503 | 452,758 | | ConAgra Foods, Inc. | 18,294 | 458,631 |
| Southern Co. | 33,773 | 1,119,913 | | Dean Foods Co.(1) | 7,642 | 119,903 |
| | | 7,754,704 | | General Mills, Inc. | 13,467 | 953,329 |
| ELECTRICAL EQUIPMENT — 0.5% | | | H.J. Heinz Co. | 13,036 | 594,572 |
| Emerson Electric Co. | 30,600 | 1,540,404 | | Hershey Co. (The) | 6,863 | 293,805 |
| First Solar, Inc.(1) | 1,989 | 243,951 | | Hormel Foods Corp. | 2,861 | 120,191 |
| Rockwell Automation, Inc. | 5,857 | 330,100 | | J.M. Smucker Co. (The) | 4,906 | 295,636 |
| Roper Industries, Inc. | 3,790 | 219,214 | | Kellogg Co. | 10,355 | 553,268 |
| | | 2,333,669 | | Kraft Foods, Inc., Class A | 70,688 | 2,137,605 |
| ELECTRONIC EQUIPMENT, | | | | McCormick & Co., Inc. | 5,398 | 207,067 |
| INSTRUMENTS & COMPONENTS — 0.6% | | | Mead Johnson Nutrition Co. | 8,239 | 428,675 |
| Agilent Technologies, Inc.(1) | 14,352 | 493,565 | | Sara Lee Corp. | 28,789 | 401,031 |
| Amphenol Corp., Class A | 7,021 | 296,216 | | Tyson Foods, Inc., Class A | 12,715 | 243,492 |
| Corning, Inc. | 63,319 | 1,279,677 | | | | 7,828,315 |
| FLIR Systems, Inc.(1) | 6,400 | 180,480 | | GAS UTILITIES — 0.1% | | |
| Jabil Circuit, Inc. | 7,510 | 121,587 | | Nicor, Inc. | 1,951 | 81,786 |
| Molex, Inc. | 5,380 | 112,227 | | ONEOK, Inc. | 4,304 | 196,478 |
| | | 2,483,752 | | Questar Corp. | 7,152 | 308,966 |
| ENERGY EQUIPMENT & SERVICES — 1.8% | | | | | 587,230 |
| Baker Hughes, Inc. | 12,812 | 600,114 | | HEALTH CARE EQUIPMENT & SUPPLIES — 1.9% |
| BJ Services Co. | 12,145 | 259,903 | | Baxter International, Inc. | 24,580 | 1,430,556 |
| Cameron | | | | Becton, Dickinson & Co. | 9,582 | 754,391 |
| International Corp.(1) | 9,748 | 417,799 | | | | |
13
| | | | | | |
| Equity Index | | | | | | |
| |
| | Shares | Value | | | Shares | Value |
| Boston Scientific Corp.(1) | 62,200 | $ 449,084 | | HOUSEHOLD DURABLES — 0.4% | |
| C.R. Bard, Inc. | 3,840 | 332,621 | | D.R. Horton, Inc. | 11,785 | $ 148,491 |
| CareFusion Corp.(1) | 7,142 | 188,763 | | Fortune Brands, Inc. | 6,159 | 298,773 |
| DENTSPLY International, Inc. | 5,980 | 208,403 | | Harman International | | |
| | | | | Industries, Inc.(1) | 2,834 | 132,574 |
| Hospira, Inc.(1) | 6,580 | 372,757 | | | | |
| Intuitive Surgical, Inc.(1) | 1,606 | 559,097 | | Leggett & Platt, Inc. | 5,935 | 128,433 |
| Medtronic, Inc. | 45,092 | 2,030,493 | | Lennar Corp., Class A | 6,114 | 105,222 |
| | | | | Newell Rubbermaid, Inc. | 11,078 | 168,386 |
| St. Jude Medical, Inc.(1) | 13,193 | 541,573 | | | | |
| | | | | Pulte Homes, Inc.(1) | 13,205 | 148,556 |
| Stryker Corp. | 11,666 | 667,528 | | | | |
| Varian Medical | | | | Stanley Black & Decker, Inc. | 6,287 | 360,937 |
| Systems, Inc.(1) | 4,938 | 273,219 | | Whirlpool Corp. | 3,023 | 263,757 |
| Zimmer Holdings, Inc.(1) | 8,594 | 508,765 | | | | 1,755,129 |
| | | 8,317,250 | | HOUSEHOLD PRODUCTS — 2.4% | |
| HEALTH CARE PROVIDERS & SERVICES — 2.1% | | Clorox Co. | 5,771 | 370,152 |
| Aetna, Inc. | 17,723 | 622,255 | | Colgate-Palmolive Co. | 20,154 | 1,718,330 |
| AmerisourceBergen Corp. | 11,770 | 340,388 | | Kimberly-Clark Corp. | 16,941 | 1,065,250 |
| Cardinal Health, Inc. | 14,898 | 536,775 | | Procter & Gamble Co. (The) | 118,537 | 7,499,836 |
| CIGNA Corp. | 11,268 | 412,183 | | | | 10,653,568 |
| Coventry Health Care, Inc.(1) | 6,208 | 153,462 | | INDEPENDENT POWER PRODUCERS | |
| | | | | & ENERGY TRADERS — 0.2% | | |
| DaVita, Inc.(1) | 4,181 | 265,075 | | | | |
| | | | | AES Corp. (The)(1) | 27,416 | 301,576 |
| Express Scripts, Inc.(1) | 11,209 | 1,140,628 | | | | |
| | | | | Constellation Energy | | |
| Humana, Inc.(1) | 6,952 | 325,145 | | Group, Inc. | 8,278 | 290,641 |
| Laboratory Corp. | | | | NRG Energy, Inc.(1) | 10,486 | 219,157 |
| of America Holdings(1) | 4,222 | 319,648 | | | | |
| | | | | | | 811,374 |
| McKesson Corp. | 10,996 | 722,657 | | INDUSTRIAL CONGLOMERATES — 2.4% | |
| Medco Health | | | | 3M Co. | 29,088 | 2,430,884 |
| Solutions, Inc.(1) | 18,944 | 1,223,025 | | | | |
| | | | | General Electric Co.(2) | 434,988 | 7,916,782 |
| Patterson Cos., Inc. | 3,994 | 124,014 | | | | |
| Quest Diagnostics, Inc. | 6,060 | 353,237 | | Textron, Inc. | 11,288 | 239,644 |
| Tenet Healthcare Corp.(1) | 17,728 | 101,404 | | | | 10,587,310 |
| UnitedHealth Group, Inc. | 47,308 | 1,545,552 | | INSURANCE — 3.8% | | |
| WellPoint, Inc.(1) | 18,046 | 1,161,802 | | Aflac, Inc. | 19,040 | 1,033,682 |
| | | 9,347,250 | | Allstate Corp. (The) | 21,999 | 710,788 |
| | | | | American International | | |
| HOTELS, RESTAURANTS & LEISURE — 1.5% | | | Group, Inc.(1) | 5,400 | 184,356 |
| Carnival Corp. | 17,873 | 694,902 | | Aon Corp. | 11,000 | 469,810 |
| Darden Restaurants, Inc. | 5,513 | 245,549 | | Assurant, Inc. | 4,680 | 160,898 |
| International | | | | Berkshire Hathaway, Inc., | | |
| Game Technology | 12,219 | 225,440 | | Class B(1) | 67,501 | 5,485,806 |
| Marriott International, Inc., | | | | Chubb Corp. (The) | 13,307 | 689,968 |
| Class A | 10,393 | 327,587 | | | | |
| McDonald’s Corp. | 43,848 | 2,925,539 | | Cincinnati Financial Corp. | 6,745 | 194,930 |
| | | | | Genworth Financial, Inc., | | |
| Starbucks Corp.(1) | 30,462 | 739,313 | | Class A(1) | 20,120 | 369,001 |
| Starwood Hotels & Resorts | | | | Hartford Financial Services | | |
| Worldwide, Inc. | 7,695 | 358,895 | | Group, Inc. (The) | 18,090 | 514,118 |
| Wyndham Worldwide Corp. | 7,338 | 188,807 | | Lincoln National Corp. | 11,999 | 368,369 |
| Wynn Resorts Ltd. | 2,694 | 204,286 | | Loews Corp. | 14,390 | 536,459 |
| Yum! Brands, Inc. | 19,239 | 737,431 | | Marsh & | | |
| | | 6,647,749 | | McLennan Cos., Inc. | 21,659 | 528,913 |
14
| | | | | | |
| Equity Index | | | | | | |
| |
| | Shares | Value | | | Shares | Value |
| MetLife, Inc. | 33,605 | $ 1,456,441 | | LIFE SCIENCES TOOLS & SERVICES — 0.4% | |
| Principal Financial | | | | Life Technologies Corp.(1) | 7,388 | $ 386,171 |
| Group, Inc. | 13,248 | 386,974 | | Millipore Corp.(1) | 2,268 | 239,501 |
| Progressive Corp. (The) | 27,484 | 524,670 | | PerkinElmer, Inc. | 4,768 | 113,955 |
| Prudential Financial, Inc. | 18,839 | 1,139,759 | | Thermo Fisher | | |
| Torchmark Corp. | 3,311 | 177,172 | | Scientific, Inc.(1) | 16,838 | 866,146 |
| Travelers Cos., Inc. (The) | 20,920 | 1,128,425 | | Waters Corp.(1) | 3,735 | 252,262 |
| Unum Group | 13,727 | 340,018 | | | | 1,858,035 |
| XL Capital Ltd., Class A | 14,108 | 266,641 | | MACHINERY — 1.6% | | |
| | | 16,667,198 | | Caterpillar, Inc. | 25,571 | 1,607,137 |
| INTERNET & CATALOG RETAIL — 0.6% | | | Cummins, Inc. | 8,320 | 515,424 |
| Amazon.com, Inc.(1) | 13,957 | 1,894,383 | | Danaher Corp. | 10,703 | 855,277 |
| Expedia, Inc. | 8,708 | 217,352 | | Deere & Co. | 17,197 | 1,022,534 |
| priceline.com, Inc.(1) | 1,862 | 474,810 | | Dover Corp. | 7,705 | 360,209 |
| | | 2,586,545 | | Eaton Corp. | 6,631 | 502,431 |
| INTERNET SOFTWARE & SERVICES — 1.8% | | | Flowserve Corp. | 2,317 | 255,496 |
| Akamai Technologies, Inc.(1) | 7,137 | 224,173 | | Illinois Tool Works, Inc. | 15,881 | 752,124 |
| eBay, Inc.(1) | 46,347 | 1,249,052 | | PACCAR, Inc. | 14,714 | 637,705 |
| Google, Inc., Class A(1) | 9,845 | 5,582,213 | | Pall Corp. | 4,564 | 184,796 |
| Monster Worldwide, Inc.(1) | 4,621 | 76,755 | | Parker-Hannifin Corp. | 6,607 | 427,737 |
| VeriSign, Inc.(1) | 7,275 | 189,223 | | Snap-on, Inc. | 2,368 | 102,629 |
| Yahoo!, Inc.(1) | 48,364 | 799,457 | | | | 7,223,499 |
| | | 8,120,873 | | MEDIA — 2.9% | | |
| IT SERVICES — 3.0% | | | | CBS Corp., Class B | 27,870 | 388,508 |
| Automatic Data | | | | Comcast Corp., Class A | 115,542 | 2,174,500 |
| Processing, Inc. | 20,422 | 908,166 | | DIRECTV, Class A(1) | 38,165 | 1,290,359 |
| Cognizant Technology | | | | Discovery Communications, | | |
| Solutions Corp., Class A(1) | 12,151 | 619,458 | | Inc., Class A(1) | 11,568 | 390,883 |
| Computer Sciences Corp.(1) | 6,277 | 342,034 | | Gannett Co., Inc. | 9,264 | 153,041 |
| Fidelity National Information | | | | Interpublic Group | | |
| Services, Inc. | 13,634 | 319,581 | | of Cos., Inc. (The)(1) | 20,725 | 172,432 |
| Fiserv, Inc.(1) | 6,099 | 309,585 | | Meredith Corp. | 1,653 | 56,880 |
| International Business | | | | New York Times Co. (The), | | |
| Machines Corp. | 52,999 | 6,797,122 | | Class A(1) | 5,277 | 58,733 |
| MasterCard, Inc., Class A | 3,906 | 992,124 | | News Corp., Class A | 91,695 | 1,321,325 |
| Paychex, Inc. | 13,242 | 406,529 | | Omnicom Group, Inc. | 12,504 | 485,280 |
| SAIC, Inc.(1) | 12,349 | 218,577 | | Scripps Networks | | |
| Total System Services, Inc. | 7,750 | 121,365 | | Interactive, Inc., Class A | 3,637 | 161,301 |
| Visa, Inc., Class A | 18,232 | 1,659,659 | | Time Warner Cable, Inc. | 14,305 | 762,599 |
| Western Union Co. (The) | 27,661 | 469,131 | | Time Warner, Inc. | 46,946 | 1,468,001 |
| | | | | Viacom, Inc., Class B(1) | 24,539 | 843,651 |
| | | 13,163,331 | | | | |
| LEISURE EQUIPMENT & PRODUCTS — 0.1% | | | Walt Disney Co. (The) | 79,116 | 2,761,940 |
| Eastman Kodak Co.(1) | 10,301 | 59,643 | | Washington Post Co. (The), | | |
| | | | | Class B | 243 | 107,936 |
| Hasbro, Inc. | 4,883 | 186,921 | | | | 12,597,369 |
| Mattel, Inc. | 14,843 | 337,530 | | METALS & MINING — 1.1% | | |
| | | 584,094 | | AK Steel Holding Corp. | 4,403 | 100,653 |
| | | | | Alcoa, Inc. | 40,896 | 582,359 |
15
| | | | | | |
| Equity Index | | | | | | |
| |
| | Shares | Value | | | Shares | Value |
| Allegheny Technologies, Inc. | 4,008 | $ 216,392 | | Devon Energy Corp. | 18,306 | $ 1,179,456 |
| Cliffs Natural Resources, Inc. | 5,528 | 392,212 | | El Paso Corp. | 28,919 | 313,482 |
| Freeport-McMoRan Copper | | | | EOG Resources, Inc. | 10,245 | 952,170 |
| & Gold, Inc. | 17,655 | 1,474,899 | | EQT Corp. | 5,422 | 222,302 |
| Newmont Mining Corp. | 19,978 | 1,017,479 | | Exxon Mobil Corp. | 192,442 | 12,889,765 |
| Nucor Corp. | 12,955 | 587,898 | | Hess Corp. | 11,944 | 747,097 |
| Titanium Metals Corp.(1) | 3,900 | 64,701 | | Marathon Oil Corp. | 28,950 | 915,978 |
| United States Steel Corp. | 5,737 | 364,414 | | Massey Energy Co. | 3,695 | 193,212 |
| | | 4,801,007 | | Murphy Oil Corp. | 7,623 | 428,336 |
| MULTILINE RETAIL — 0.9% | | | | Noble Energy, Inc. | 7,178 | 523,994 |
| Big Lots, Inc.(1) | 3,556 | 129,510 | | Occidental Petroleum Corp. | 33,026 | 2,792,018 |
| Family Dollar Stores, Inc. | 5,497 | 201,245 | | Peabody Energy Corp. | 11,051 | 505,031 |
| J.C. Penney Co., Inc. | 9,765 | 314,140 | | Pioneer Natural | | |
| Kohl’s Corp.(1) | 12,357 | 676,916 | | Resources Co. | 4,750 | 267,520 |
| Macy’s, Inc. | 17,128 | 372,877 | | Range Resources Corp. | 6,361 | 298,140 |
| Nordstrom, Inc. | 6,715 | 274,308 | | Southwestern Energy Co.(1) | 14,108 | 574,478 |
| Sears Holdings Corp.(1) | 2,052 | 222,498 | | Spectra Energy Corp. | 25,923 | 584,045 |
| Target Corp. | 30,614 | 1,610,296 | | Sunoco, Inc. | 4,972 | 147,718 |
| | | 3,801,790 | | Tesoro Corp. | 6,100 | 84,790 |
| MULTI-UTILITIES — 1.2% | | | | Valero Energy Corp. | 23,228 | 457,592 |
| Ameren Corp. | 9,671 | 252,220 | | Williams Cos., Inc. (The) | 23,444 | 541,556 |
| CenterPoint Energy, Inc. | 15,948 | 229,013 | | XTO Energy, Inc. | 23,869 | 1,126,139 |
| CMS Energy Corp. | 9,854 | 152,343 | | | | 39,358,609 |
| Consolidated Edison, Inc. | 11,357 | 505,841 | | PAPER & FOREST PRODUCTS — 0.2% | |
| Dominion Resources, Inc. | 24,286 | 998,397 | | International Paper Co. | 17,879 | 440,002 |
| DTE Energy Co. | 6,806 | 303,548 | | MeadWestvaco Corp. | 7,043 | 179,949 |
| Integrys Energy Group, Inc. | 3,239 | 153,464 | | Weyerhaeuser Co. | 8,724 | 394,935 |
| NiSource, Inc. | 11,658 | 184,196 | | | | 1,014,886 |
| PG&E Corp. | 15,037 | 637,869 | | PERSONAL PRODUCTS — 0.2% | |
| Public Service Enterprise | | | | Avon Products, Inc. | 17,209 | 582,869 |
| Group, Inc. | 20,498 | 605,101 | | Estee Lauder Cos., Inc. | | |
| SCANA Corp. | 4,420 | 166,148 | | (The), Class A | 4,708 | 305,408 |
| Sempra Energy | 10,199 | 508,930 | | | | 888,277 |
| TECO Energy, Inc. | 8,746 | 138,974 | | PHARMACEUTICALS — 5.9% | | |
| Wisconsin Energy Corp. | 4,815 | 237,909 | | Abbott Laboratories | 63,203 | 3,329,534 |
| Xcel Energy, Inc. | 18,264 | 387,197 | | Allergan, Inc. | 12,461 | 813,952 |
| | | 5,461,150 | | Bristol-Myers Squibb Co. | 69,777 | 1,863,046 |
| OFFICE ELECTRONICS — 0.1% | | | | Eli Lilly & Co. | 41,271 | 1,494,836 |
| Xerox Corp. | 55,600 | 542,100 | | Forest Laboratories, Inc.(1) | 12,496 | 391,875 |
| OIL, GAS & CONSUMABLE FUELS — 8.9% | | | Johnson & Johnson | 112,344 | 7,324,829 |
| Anadarko Petroleum Corp. | 20,049 | 1,460,169 | | King Pharmaceuticals, Inc.(1) | 9,496 | 111,673 |
| Apache Corp. | 13,751 | 1,395,727 | | Merck & Co., Inc. | 126,992 | 4,743,151 |
| Cabot Oil & Gas Corp. | 4,278 | 157,430 | | Mylan, Inc.(1) | 12,546 | 284,920 |
| Chesapeake Energy Corp. | 26,541 | 627,429 | | Pfizer, Inc. | 329,449 | 5,650,050 |
| Chevron Corp. | 81,883 | 6,209,188 | | Watson | | |
| ConocoPhillips | 60,689 | 3,105,456 | | Pharmaceuticals, Inc.(1) | 4,356 | 181,950 |
| CONSOL Energy, Inc. | 9,054 | 386,244 | | | | 26,189,816 |
| Denbury Resources, Inc.(1) | 16,132 | 272,147 | | | | |
16
| | | | | | |
| Equity Index | | | | | | |
| |
| | Shares | Value | | | Shares | Value |
| PROFESSIONAL SERVICES — 0.1% | | | National | | |
| Dun & Bradstreet Corp. | 2,099 | $ 156,208 | | Semiconductor Corp. | 9,610 | $ 138,864 |
| Equifax, Inc. | 5,327 | 190,707 | | Novellus Systems, Inc.(1) | 3,632 | 90,800 |
| Robert Half | | | | NVIDIA Corp.(1) | 22,903 | 398,054 |
| International, Inc. | 5,843 | 177,802 | | Teradyne, Inc.(1) | 7,674 | 85,719 |
| | | 524,717 | | Texas Instruments, Inc. | 50,404 | 1,233,386 |
| REAL ESTATE INVESTMENT TRUSTS (REITs) — 1.2% | | Xilinx, Inc. | 11,331 | 288,941 |
| Apartment Investment & | | | | | | 10,780,963 |
| Management Co., Class A | 4,291 | 78,997 | | SOFTWARE — 4.0% | | |
| AvalonBay Communities, Inc. | 3,307 | 285,559 | | Adobe Systems, Inc.(1) | 21,188 | 749,420 |
| Boston Properties, Inc. | 5,610 | 423,218 | | | | |
| | | | | Autodesk, Inc.(1) | 9,554 | 281,079 |
| Equity Residential | 11,602 | 454,218 | | | | |
| | | | | BMC Software, Inc.(1) | 7,237 | 275,006 |
| HCP, Inc. | 11,973 | 395,109 | | | | |
| Health Care REIT, Inc. | 5,055 | 228,638 | | CA, Inc. | 15,773 | 370,192 |
| | | | | Citrix Systems, Inc.(1) | 7,588 | 360,202 |
| Host Hotels & Resorts, Inc. | 26,470 | 387,786 | | | | |
| | | | | Compuware Corp.(1) | 8,747 | 73,475 |
| Kimco Realty Corp. | 16,788 | 262,564 | | | | |
| Plum Creek Timber Co., Inc. | 6,729 | 261,825 | | Electronic Arts, Inc.(1) | 13,334 | 248,812 |
| ProLogis | 18,643 | 246,088 | | Intuit, Inc.(1) | 12,931 | 444,051 |
| Public Storage | 5,601 | 515,236 | | McAfee, Inc.(1) | 6,557 | 263,132 |
| Simon Property Group, Inc. | 11,849 | 994,131 | | Microsoft Corp. | 311,216 | 9,109,292 |
| Ventas, Inc. | 6,474 | 307,386 | | Novell, Inc.(1) | 14,691 | 87,999 |
| Vornado Realty Trust | 6,455 | 488,644 | | Oracle Corp. | 159,528 | 4,098,274 |
| | | 5,329,399 | | Red Hat, Inc.(1) | 7,769 | 227,399 |
| REAL ESTATE MANAGEMENT & DEVELOPMENT(3) | | salesforce.com, inc.(1) | 4,475 | 333,164 |
| CB Richard Ellis Group, Inc., | | | | Symantec Corp.(1) | 33,135 | 560,644 |
| Class A(1) | 11,042 | 175,016 | | | | 17,482,141 |
| ROAD & RAIL — 0.7% | | | | SPECIALTY RETAIL — 2.0% | | |
| CSX Corp. | 15,875 | 808,037 | | Abercrombie & Fitch Co., | | |
| Norfolk Southern Corp. | 15,176 | 848,187 | | Class A | 3,747 | 171,013 |
| Ryder System, Inc. | 2,006 | 77,753 | | AutoNation, Inc.(1) | 3,773 | 68,216 |
| Union Pacific Corp. | 20,495 | 1,502,283 | | AutoZone, Inc.(1) | 1,171 | 202,688 |
| | | 3,236,260 | | Bed Bath & Beyond, Inc.(1) | 10,814 | 473,220 |
| SEMICONDUCTORS & | | | | Best Buy Co., Inc. | 14,105 | 600,027 |
| SEMICONDUCTOR EQUIPMENT — 2.4% | | | GameStop Corp., Class A(1) | 6,552 | 143,554 |
| Advanced Micro | | | | | | |
| Devices, Inc.(1) | 23,184 | 214,916 | | Gap, Inc. (The) | 19,398 | 448,288 |
| Altera Corp. | 12,028 | 292,401 | | Home Depot, Inc. (The) | 69,259 | 2,240,529 |
| Analog Devices, Inc. | 12,009 | 346,099 | | Limited Brands, Inc. | 11,011 | 271,091 |
| Applied Materials, Inc. | 54,421 | 733,595 | | Lowe’s Cos., Inc. | 59,828 | 1,450,231 |
| Broadcom Corp., Class A | 17,677 | 586,523 | | Office Depot, Inc.(1) | 11,746 | 93,733 |
| Intel Corp. | 224,951 | 5,007,409 | | O’Reilly Automotive, Inc.(1) | 5,754 | 239,999 |
| KLA-Tencor Corp. | 7,008 | 216,687 | | RadioShack Corp. | 5,417 | 122,587 |
| Linear Technology Corp. | 9,288 | 262,665 | | Ross Stores, Inc. | 4,931 | 263,660 |
| LSI Corp.(1) | 26,531 | 162,370 | | Sherwin-Williams Co. (The) | 3,623 | 245,205 |
| MEMC Electronic | | | | Staples, Inc. | 29,920 | 699,829 |
| Materials, Inc.(1) | 9,556 | 146,493 | | Tiffany & Co. | 5,014 | 238,115 |
| Microchip Technology, Inc. | 7,484 | 210,749 | | TJX Cos., Inc. (The) | 17,194 | 731,089 |
| Micron Technology, Inc.(1) | 35,158 | 365,292 | | Urban Outfitters, Inc.(1) | 5,349 | 203,422 |
| | | | | | | 8,906,496 |
17
| | | | | | |
| Equity Index | | | | | | |
| |
| | Shares | Value | | | Shares/ | |
| TEXTILES, APPAREL & LUXURY GOODS — 0.5% | | | Principal | |
| Coach, Inc. | 12,665 | $ 500,521 | | | Amount | Value |
| NIKE, Inc., Class B | 15,834 | 1,163,799 | | Temporary Cash Investments — | |
| Polo Ralph Lauren Corp. | 2,278 | 193,721 | | Segregated For | | |
| VF Corp. | 3,661 | 293,429 | | Futures Contracts — 2.1% | |
| | | 2,151,470 | | JPMorgan U.S. Treasury | | |
| THRIFTS & MORTGAGE FINANCE — 0.1% | | | Plus Money Market Fund | | |
| Hudson City Bancorp., Inc. | 18,522 | 262,271 | | Agency Shares | 27,759 | $ 27,759 |
| People’s United | | | | Repurchase Agreement, Bank of America | |
| Financial, Inc. | 15,165 | 237,181 | | Securities, LLC, (collateralized by various | |
| | | | | U.S. Treasury obligations, 3.125%, 1/31/17, | |
| | | 499,452 | | valued at $8,496,782), in a joint trading | |
| TOBACCO — 1.5% | | | | account at 0.01%, dated 3/31/10, due | |
| Altria Group, Inc. | 85,174 | 1,747,770 | | 4/1/10 (Delivery value $8,300,002) | 8,300,000 |
| Lorillard, Inc. | 6,224 | 468,294 | | U.S. Treasury Bills, | | |
| | | | | 0.12%, 5/6/10(4) | $1,130,000 | 1,129,861 |
| Philip Morris | | | | | | |
| International, Inc. | 76,618 | 3,996,395 | | TOTAL TEMPORARY CASH | | |
| Reynolds American, Inc. | 6,990 | 377,320 | | INVESTMENTS — SEGREGATED | |
| | | | | FOR FUTURES CONTRACTS | |
| | | 6,589,779 | | (Cost $9,457,625) | | 9,457,620 |
| TRADING COMPANIES & DISTRIBUTORS — 0.1% | | TOTAL INVESTMENT | | |
| Fastenal Co. | 5,292 | 253,963 | | SECURITIES — 99.9% | | |
| W.W. Grainger, Inc. | 2,550 | 275,706 | | (Cost $333,663,240) | | 440,088,012 |
| | | 529,669 | | OTHER ASSETS | | |
| WIRELESS TELECOMMUNICATION SERVICES — 0.3% | | AND LIABILITIES — 0.1% | | 403,703 |
| American Tower Corp., | | | | TOTAL NET ASSETS — 100.0% | $440,491,715 |
| Class A(1) | 16,584 | 706,644 | | | | |
| MetroPCS | | | | | | |
| Communications, Inc.(1) | 10,800 | 76,464 | | | | |
| Sprint Nextel Corp.(1) | 119,125 | 452,675 | | | | |
| | | 1,235,783 | | | | |
| TOTAL COMMON STOCKS | | | | | | |
| (Cost $324,205,615) | | 430,630,392 | | | | |
| | | | |
| Futures Contracts | | | |
| | Contracts Purchased | Expiration Date | Underlying Face Amount at Value | Unrealized Gain (Loss) |
| | 169 S&P 500 E-Mini Futures | June 2010 | $9,845,940 | $169,209 |
| |
| |
| Notes to Schedule of Investments | | |
| (1) | Non-income producing. | | | |
| (2) | Security, or a portion thereof, has been segregated for futures contracts. At the period end, the aggregate value of securities pledged |
| | was $9,846,000. | | | |
| (3) | Industry is less than 0.05% of total net assets. | | |
| (4) | The rate indicated is the yield to maturity at purchase. | | |
| |
| Industry classifications are unaudited. | | | |
| |
| |
| See Notes to Financial Statements. | | | |
18
|
| Statement of Assets and Liabilities |
| |
| MARCH 31, 2010 | |
| Assets | |
| Investment securities, at value (cost of $333,663,240) | $440,088,012 |
| Cash | 3,100 |
| Receivable for capital shares sold | 222,155 |
| Dividends and interest receivable | 550,619 |
| | 440,863,886 |
| | |
| Liabilities | |
| Payable for investments purchased | 63,655 |
| Payable for capital shares redeemed | 142,922 |
| Payable for variation margin on futures contracts | 25,019 |
| Accrued management fees | 140,575 |
| | 372,171 |
| | |
| Net Assets | $440,491,715 |
| | |
| Net Assets Consist of: | |
| Capital (par value and paid-in surplus) | $393,387,849 |
| Undistributed net investment income | 45,551 |
| Accumulated net realized loss on investment transactions | (59,535,666) |
| Net unrealized appreciation on investments | 106,593,981 |
| | $440,491,715 |
| | |
| Investor Class, $0.01 Par Value | |
| Net assets | $208,725,818 |
| Shares outstanding | 44,955,766 |
| Net asset value per share | $4.64 |
| | |
| Institutional Class, $0.01 Par Value | |
| Net assets | $231,765,897 |
| Shares outstanding | 49,902,692 |
| Net asset value per share | $4.64 |
| |
| |
| See Notes to Financial Statements. | |
19
| |
| YEAR ENDED MARCH 31, 2010 | |
| Investment Income (Loss) | |
| Income: | |
| Dividends | $ 8,960,605 |
| Interest | 9,536 |
| | 8,970,141 |
| | |
| Expenses: | |
| Management fees | 1,471,238 |
| Directors’ fees and expenses | 14,191 |
| Other expenses | 19 |
| | 1,485,448 |
| | |
| Net investment income (loss) | 7,484,693 |
| | |
| Realized and Unrealized Gain (Loss) | |
| Net realized gain (loss) on: | |
| Investment transactions | 7,048,214 |
| Futures contract transactions | 4,232,395 |
| | 11,280,609 |
| | |
| Change in net unrealized appreciation (depreciation) on: | |
| Investments | 133,224,165 |
| Futures contracts | (489,897) |
| | 132,734,268 |
| | |
| Net realized and unrealized gain (loss) | 144,014,877 |
| | |
| Net Increase (Decrease) in Net Assets Resulting from Operations | $151,499,570 |
| |
| |
| See Notes to Financial Statements. | |
20
|
| Statement of Changes in Net Assets |
| | |
| YEARS ENDED MARCH 31, 2010 AND MARCH 31, 2009 | | |
| Increase (Decrease) in Net Assets | 2010 | 2009 |
| Operations | | |
| Net investment income (loss) | $ 7,484,693 | $ 11,301,222 |
| Net realized gain (loss) | 11,280,609 | 20,315,221 |
| Change in net unrealized appreciation (depreciation) | 132,734,268 | (245,933,033) |
| Net increase (decrease) in net assets resulting from operations | 151,499,570 | (214,316,590) |
| | | |
| Distributions to Shareholders | | |
| From net investment income: | | |
| Investor Class | (3,159,335) | (3,550,797) |
| Institutional Class | (4,332,216) | (7,578,541) |
| Decrease in net assets from distributions | (7,491,551) | (11,129,338) |
| | | |
| Capital Share Transactions | | |
| Net increase (decrease) in net assets from capital share transactions | (23,595,176) | (261,960,006) |
| | | |
| Net increase (decrease) in net assets | 120,412,843 | (487,405,934) |
| | | |
| Net Assets | | |
| Beginning of period | 320,078,872 | 807,484,806 |
| End of period | $ 440,491,715 | $ 320,078,872 |
| | | |
| Undistributed net investment income | $45,551 | $33,941 |
| |
| |
| See Notes to Financial Statements. | | |
21
|
| Notes to Financial Statements |
MARCH 31, 2010
1. Organization and Summary of Significant Accounting Policies
Organization — American Century Capital Portfolios, Inc. (the corporation) is registered under the Investment Company Act of 1940 (the 1940 Act) as an open-end management investment company. Equity Index Fund (the fund) is one fund in a series issued by the corporation. The fund is nondiversified under the 1940 Act. The fund’s investment objective is to seek long-term capital growth. The fund pursues its objective by matching, as closely as possible, the investment characteristics and results of the S&P 500 Composite Price Index (S&P 500 Index). The following is a summary of the fund’s significant accounting policies.
Multiple Class — The fund is authorized to issue the Investor Class and the Institutional Class. The share classes differ principally in their respective distribution and shareholder servicing expenses and arrangements. All shares of the fund represent an equal pro rata interest in the net assets of the class to which such shares belong, and have identical voting, dividend, liquidation and other rights and the same terms and conditions, except for class specific expenses and exclusive rights to vote on matters affecting only individual classes. Income, non-class specific expenses, and realized and unrealized capital gains and losses of the fund are allocated to each class of shares based on their relative net assets.
Security Valuations — Securities traded primarily on a principal securities exchange are valued at the last reported sales price, or at the mean of the latest bid and asked prices where no last sales price is available. Depending on local convention or regulation, securities traded over-the-counter are valued at the mean of the latest bid and asked prices, the last sales price, or the official close price. Investments in open-end management investment companies are valued at the reported net asset value. Debt securities not traded on a principal securities exchange are valued through a commercial pricing service or at the mean of the most recent bid and asked prices. Discount notes may be valued through a commercial pricing service or at amortized cost, which approximates fair value. Securities traded on foreign securities ex changes and over-the-counter markets are normally completed before the close of business on days that the New York Stock Exchange (the Exchange) is open and may also take place on days when the Exchange is not open. If an event occurs after the value of a security was established but before the net asset value per share was determined that was likely to materially change the net asset value, that security would be valued as determined in accordance with procedures adopted by the Board of Directors. If the fund determines that the market price of a portfolio security is not readily available, or that the valuation methods mentioned above do not reflect the security’s fair value, such security is valued as determined by the Board of Directors or its designee, in accordance with procedures adopted by the Board of Directors, if such determination would materially impact a fund’s net asset value. Certain other circumstances may cause the fund to use alternative procedures to value a security such as: a security has been declared in default; trading in a security has been halted during the trading day; or there is a foreign market holiday and no trading will commence.
Security Transactions — For financial reporting purposes, security transactions are accounted for as of the trade date. Net realized gains and losses are determined on the identified cost basis, which is also used for federal income tax purposes.
Investment Income — Dividend income less foreign taxes withheld, if any, is recorded as of the ex-dividend date. Interest income is recorded on the accrual basis and includes accretion of discounts and amortization of premiums.
Repurchase Agreements — The fund may enter into repurchase agreements with institutions that American Century Investment Management, Inc. (ACIM) (the investment advisor) has determined are creditworthy pursuant to criteria adopted by the Board of Directors. Each repurchase agreement is recorded at cost. The fund requires that the collateral, represented by securities, received in a repurchase transaction be transferred to the custodian in a manner sufficient to enable the fund to obtain those securities in the event of a default under the repurchase agreement. ACIM monitors, on a daily basis, the
22
securities transferred to ensure the value, including accrued interest, of the securities under each repurchase agreement is equal to or greater than amounts owed to the fund under each repurchase agreement.
Joint Trading Account — Pursuant to an Exemptive Order issued by the Securities and Exchange Commission, the fund, along with certain other funds in the American Century Investments family of funds, may transfer uninvested cash balances into a joint trading account. These balances are invested in one or more repurchase agreements that are collateralized by U.S. Treasury or Agency obligations.
Income Tax Status — It is the fund’s policy to distribute substantially all net investment income and net realized gains to shareholders and to otherwise qualify as a regulated investment company under provisions of the Internal Revenue Code. The fund is no longer subject to examination by tax authorities for years prior to 2007. At this time, management believes there are no uncertain tax positions which, based on their technical merit, would not be sustained upon examination and for which it is reasonably possible that the total amounts of unrecognized tax benefits will significantly change in the next twelve months. Accordingly, no provision has been made for federal or state income taxes.
Distributions to Shareholders — Distributions to shareholders are recorded on the ex-dividend date. Distributions from net investment income are declared and paid quarterly. Distributions from net realized gains, if any, are generally declared and paid annually.
Indemnifications — Under the corporation’s organizational documents, its officers and directors are indemnified against certain liabilities arising out of the performance of their duties to the fund. In addition, in the normal course of business, the fund enters into contracts that provide general indemnifications. The maximum exposure under these arrangements is unknown as this would involve future claims that may be made against a fund. The risk of material loss from such claims is considered by management to be remote.
Use of Estimates — The financial statements are prepared in conformity with accounting principles generally accepted in the United States of America, which may require management to make certain estimates and assumptions at the date of the financial statements. Actual results could differ from these estimates.
Subsequent Events — In preparing the financial statements, management evaluated the impact of events or transactions occurring through the date the financial statements were issued that would merit recognition or disclosure.
2. Fees and Transactions with Related Parties
Management Fees — The corporation has entered into a Management Agreement with ACIM, under which ACIM provides the fund with investment advisory and management services in exchange for a single, unified management fee (the fee) per class. The Agreement provides that all expenses of managing and operating the fund, except brokerage expenses, taxes, interest, fees and expenses of the independent directors (including legal counsel fees), and extraordinary expenses, will be paid by ACIM. The fee is computed and accrued daily based on the daily net assets of the specific class of shares of the fund and paid monthly in arrears. For funds with a stepped fee schedule, the rate of the fee is determined by applying a fee rate calculation formula. This formula takes into account the fund’s assets as well as certain assets, if a ny, of other clients of the investment advisor outside the American Century Investments family of funds (such as subadvised funds and separate accounts) that have very similar investment teams and investment strategies (strategy assets). The annual management fee schedule for the fund ranges from 0.350% to 0.490% for the Investor Class. The Institutional Class is 0.200% less at each point within the range. The effective annual management fee for each class of the fund for the year ended March 31, 2010 was 0.49% and 0.29% for the Investor Class and Institutional Class, respectively.
23
ACIM has entered into a Subadvisory Agreement with Northern Trust Investments, N.A. (NTI) (the subadvisor) on behalf of the fund. The subadvisor makes investment decisions for the fund in accordance with the fund’s investment objectives, policies and restrictions under the supervision of ACIM and the Board of Directors. ACIM pays all costs associated with retaining NTI as the subadvisor of the fund.
Related Parties — Certain officers and directors of the corporation are also officers and/or directors of American Century Companies, Inc. (ACC), the parent of the corporation’s investment advisor, ACIM, the distributor of the corporation, American Century Investment Services, Inc., and the corporation’s transfer agent, American Century Services, LLC.
The fund is eligible to invest in a money market fund for temporary purposes, which is managed by J.P. Morgan Investment Management, Inc. (JPMIM). The fund has a Mutual Funds Services Agreement with J.P. Morgan Investor Services Co. (JPMIS) and a securities lending agreement with JPMorgan Chase Bank (JPMCB). JPMCB is a custodian of the fund. JPMIM, JPMIS and JPMCB are wholly owned subsidiaries of JPMorgan Chase & Co. (JPM). JPM is an equity investor in ACC.
3. Investment Transactions
Purchases and sales of investment securities, excluding short-term investments, for the year ended March 31, 2010, were $46,207,018 and $61,550,300, respectively.
| | | | |
| 4. Capital Share Transactions | | | | |
| |
| Transactions in shares of the fund were as follows: | | |
| | Year ended March 31, 2010 | Year ended March 31, 2009 |
| | Shares | Amount | Shares | Amount |
| Investor Class/Shares Authorized | 150,000,000 | | 150,000,000 | |
| Sold | 12,694,955 | $ 52,828,024 | 11,722,718 | $ 47,846,238 |
| Issued in reinvestment of distributions | 725,656 | 3,081,827 | 879,869 | 3,466,687 |
| Redeemed | (9,204,015) | (37,281,187) | (11,312,460) | (45,792,775) |
| | 4,216,596 | 18,628,664 | 1,290,127 | 5,520,150 |
| Institutional Class/Shares Authorized | 310,000,000 | | 310,000,000 | |
| Sold | 10,325,912 | 39,608,523 | 12,856,911 | 56,973,880 |
| Issued in reinvestment of distributions | 1,026,830 | 4,332,216 | 1,805,909 | 7,578,541 |
| Redeemed | (21,735,881) | (86,164,579) | (68,330,902) | (332,032,577) |
| | (10,383,139) | (42,223,840) | (53,668,082) | (267,480,156) |
| Net increase (decrease) | (6,166,543) | $(23,595,176) | (52,377,955) | $(261,960,006) |
24
5. Fair Value Measurements
The fund’s securities valuation process is based on several considerations and may use multiple inputs to determine the fair value of the positions held by the fund. In conformity with accounting principles generally accepted in the United States of America, the inputs used to determine a valuation are classified into three broad levels as follows:
• Level 1 valuation inputs consist of unadjusted quoted prices in an active market for identical securities;
• Level 2 valuation inputs consist of significant direct or indirect observable market data (including quoted prices for similar securities, evaluations of subsequent market events, interest rates, prepayment speeds, credit risk, etc.); or
• Level 3 valuation inputs consist of significant unobservable inputs (including a fund’s own assumptions).
The level classification is based on the lowest level input that is significant to the fair valuation measurement. The valuation inputs are not an indication of the risks associated with investing in these securities or other financial instruments.
The following is a summary of the valuation inputs used to determine the fair value of the fund’s securities and other financial instruments as of March 31, 2010. The Schedule of Investments provides additional details on the fund’s portfolio holdings.
| | | |
| | Level 1 | Level 2 | Level 3 |
| Investment Securities | | | |
| Common Stocks | $430,630,392 | — | — |
| Temporary Cash Investments | 27,759 | $9,429,861 | — |
| Total Value of Investment Securities | $430,658,151 | $9,429,861 | — |
| | | | |
| Other Financial Instruments | | | |
| Total Unrealized Gain (Loss) on Futures Contracts | $169,209 | — | — |
6. Derivative Instruments
Equity Price Risk — The fund is subject to equity price risk in the normal course of pursuing its investment objectives. A fund may enter into futures contracts based on an equity index in order to manage its exposure to changes in market conditions. A fund may purchase futures contracts to gain exposure to increases in market value or sell futures contracts to protect against a decline in market value. Upon entering into a futures contract, a fund is required to deposit either cash or securities in an amount equal to a certain percentage of the contract value (initial margin). Subsequent payments (variation margin) are made or received daily, in cash, by a fund. The variation margin is equal to the daily change in the contract value and is recorded as unrealized gains and losses. A fund recognizes a realized gain or loss whe n the contract is closed or expires. Net realized and unrealized gains or losses occurring during the holding period of futures contracts are a component of net realized gain (loss) on futures contract transactions and change in net unrealized appreciation (depreciation) on futures contracts, respectively. One of the risks of entering into futures contracts is the possibility that the change in value of the contract may not correlate with the changes in value of the underlying securities. The equity price risk derivative instruments held at period end as disclosed on the Schedule of Investments are indicative of the fund’s typical volume during the period.
The value of equity price risk derivatives as of March 31, 2010, is disclosed on the Statement of Assets and Liabilities as a liability of $25,019 in payable for variation margin on futures contracts. For the year ended March 31, 2010, the effect of equity price risk derivatives on the Statement of Operations was $4,232,395 in net realized gain (loss) on futures contract transactions and $(489,897) in change in net unrealized appreciation (depreciation) on futures contracts.
25
7. Interfund Lending
The fund, along with certain other funds in the American Century Investments family of funds, may participate in an interfund lending program, pursuant to an Exemptive Order issued by the Securities and Exchange Commission (SEC). This program provides an alternative credit facility allowing the fund to borrow from or lend to other funds in the American Century Investments family of funds that permit such transactions. Interfund lending transactions are subject to each fund’s investment policies and borrowing and lending limits. The interfund loan rate earned/paid on interfund lending transactions is determined daily based on the average of certain current market rates. Interfund lending transactions normally extend only overnight, but can have a maximum duration of seven days. The program is subject to annual approval by the Board of Directors. During the year ended March 31, 2010, the fund did not utilize th e program.
8. Federal Tax Information
The tax character of distributions paid during the years ended March 31, 2010 and March 31, 2009 were as follows:
| | |
| | 2010 | 2009 |
| Distributions Paid From | | |
| Ordinary income | $7,491,551 | $11,129,338 |
| Long-term capital gains | — | — |
The book-basis character of distributions made during the year from net investment income or net realized gains may differ from their ultimate characterization for federal income tax purposes. These differences reflect the differing character of certain income items and net realized gains and losses for financial statement and tax purposes, and may result in reclassification among certain capital accounts on the financial statements.
As of March 31, 2010, the federal tax cost of investments and the components of distributable earnings on a tax-basis were as follows:
| | |
| Federal tax cost of investments | $353,892,679 |
| Gross tax appreciation of investments | $130,248,135 |
| Gross tax depreciation of investments | (44,052,802) |
| Net tax appreciation (depreciation) of investments | $ 86,195,333 |
| Net tax appreciation (depreciation) on derivatives | — |
| Net tax appreciation (depreciation) | $86,195,333 |
| Undistributed ordinary income | $45,551 |
| Accumulated capital losses | $(39,137,018) |
The difference between book-basis and tax-basis cost and unrealized appreciation (depreciation) is attributable primarily to the tax deferral of losses on wash sales and the realization for tax purposes of unrealized gains on certain futures contracts.
The accumulated capital losses listed above represent net capital loss carryovers that may be used to offset future realized capital gains for federal income tax purposes. Future capital loss carryover utilization in any given year may be subject to Internal Revenue Code limitations. The capital loss carryovers expire as follows:
| | | | |
| 2011 | 2012 | 2013 | 2014 | 2015 |
| $(21,756,247) | $(1,957,751) | $(1,992,016) | $(5,270,954) | $(8,160,050) |
26
9. Corporate Event
As part of a long-standing estate and business succession plan established by ACC Co-Chairman James E. Stowers, Jr., the founder of American Century Investments, ACC Co-Chairman Richard W. Brown succeeded Mr. Stowers as trustee of a trust that holds a greater-than-25% voting interest in ACC, the parent corporation of each fund’s advisor. Under the 1940 Act, this is presumed to represent control of ACC even though it is less than a majority interest. The change of trustee may technically be considered a “change of control” of ACC and therefore also a change of control of each fund’s advisor even though there has been no change to their management and none is anticipated. The “change of control” resulted in the assignment of each fund’s investment advisory agreement. Under the 1940 Act, an assignment automatically terminated such agreement, making the approval of a new agreement necessary.
On February 18, 2010, the Board of Directors approved interim investment advisory agreements under which each fund will be managed until new agreements are approved by fund shareholders. On March 29, 2010, the Board of Directors approved new investment advisory agreements. The interim agreements and the new agreements are substantially identical to the terminated agreements (with the exception of different effective and termination dates) and will not result in changes in the management of American Century Investments, the funds, their investment objectives, fees or services provided. The new agreements have been submitted to shareholders for approval at a Special Meeting of Shareholders to be held on June 16, 2010.
10. Recently Issued Accounting Standards
In March 2008, the Financial Accounting Standards Board (FASB) issued Accounting Standards Codification (ASC) Section 815-10 (formerly Statement of Financial Accounting Standards No. 161, “Disclosures about Derivative Instruments and Hedging Activities —an amendment of FASB Statement No. 133”). ASC Section 815-10 is effective for interim periods beginning after November 15, 2008 and has been adopted by the fund. ASC Section 815-10 amends and expands disclosures about derivative instruments and hedging activities. ASC Section 815-10 requires qualitative disclosures about the objectives and strategies of derivative instruments, quantitative disclosures about the fair value amounts of and gains and losses on derivative instruments, and disclosures of credit-risk-related contingent features in hedging activities.
11. Other Tax Information (Unaudited)
The following information is provided pursuant to provisions of the Internal Revenue Code.
The fund hereby designates up to the maximum amount allowable as qualified dividend income for the fiscal year ended March 31, 2010.
For corporate taxpayers, the fund hereby designates $7,491,551, or up to the maximum amount allowable, of ordinary income distributions paid during the fiscal year ended March 31, 2010 as qualified for the corporate dividends received deduction.
27
| | | | | | |
| Equity Index | | | | | |
| |
| Investor Class | | | | | |
| For a Share Outstanding Throughout the Years Ended March 31 | | | |
| | | 2010 | 2009 | 2008 | 2007 | 2006 |
| Per-Share Data | | | | | |
| Net Asset Value, Beginning of Period | $3.17 | $5.26 | $5.66 | $5.16 | $4.70 |
| Income From Investment Operations | | | | | |
| Net Investment Income (Loss)(1) | 0.07 | 0.09 | 0.09 | 0.08 | 0.07 |
| Net Realized and Unrealized Gain (Loss) | 1.47 | (2.09) | (0.39) | 0.50 | 0.46 |
| Total From Investment Operations | 1.54 | (2.00) | (0.30) | 0.58 | 0.53 |
| Distributions | | | | | |
| From Net Investment Income | (0.07) | (0.09) | (0.10) | (0.08) | (0.07) |
| From Tax Return of Capital | — | — | —(2) | — | — |
| Total Distributions | (0.07) | (0.09) | (0.10) | (0.08) | (0.07) |
| Net Asset Value, End of Period | $4.64 | $3.17 | $5.26 | $5.66 | $5.16 |
| |
| Total Return(3) | 48.96% | (38.36)% | (5.46)% | 11.28% | 11.36% |
| | | | | | |
| Ratios/Supplemental Data | | | | | |
| Ratio of Operating Expenses | | | | | |
| to Average Net Assets | 0.49% | 0.49% | 0.49% | 0.49% | 0.49% |
| Ratio of Net Investment Income (Loss) | | | | | |
| to Average Net Assets | 1.81% | 1.93% | 1.51% | 1.49% | 1.43% |
| Portfolio Turnover Rate | 12% | 5% | 9% | 4% | 17% |
| Net Assets, End of Period (in thousands) | $208,726 | $129,026 | $207,571 | $232,880 | $152,799 |
| (1) | Computed using average shares outstanding throughout the period. | | | | |
| (2) | Per share amount was less than $0.005. | | | | | |
| (3) | Total return assumes reinvestment of net investment income and capital gains distributions, if any. Total returns for periods less than one year |
| | are not annualized. Total returns are calculated based on the net asset value of the last business day. The total return of the classes may not |
| | precisely reflect the class expense differences because of the impact of calculating the net asset values to two decimal places. If net asset |
| | values were calculated to three decimal places, the total return differences would more closely reflect the class expense differences. The |
| | calculation of net asset values to two decimal places is made in accordance with SEC guidelines and does not result in any gain or loss of value |
| | between one class and another. | | | | | |
See Notes to Financial Statements.
28
| | | | | | |
| Equity Index | | | | | |
| |
| Institutional Class | | | | | |
| For a Share Outstanding Throughout the Years Ended March 31 | | | |
| | | 2010 | 2009 | 2008 | 2007 | 2006 |
| Per-Share Data | | | | | |
| Net Asset Value, Beginning of Period | $3.17 | $5.26 | $5.67 | $5.16 | $4.71 |
| Income From Investment Operations | | | | | |
| Net Investment Income (Loss)(1) | 0.08 | 0.10 | 0.10 | 0.09 | 0.08 |
| Net Realized and Unrealized Gain (Loss) | 1.47 | (2.09) | (0.40) | 0.51 | 0.45 |
| Total From Investment Operations | 1.55 | (1.99) | (0.30) | 0.60 | 0.53 |
| Distributions | | | | | |
| From Net Investment Income | (0.08) | (0.10) | (0.11) | (0.09) | (0.08) |
| From Tax Return of Capital | — | — | —(2) | — | — |
| Total Distributions | (0.08) | (0.10) | (0.11) | (0.09) | (0.08) |
| Net Asset Value, End of Period | $4.64 | $3.17 | $5.26 | $5.67 | $5.16 |
| |
| Total Return(3) | 49.27% | (38.24)% | (5.27)% | 11.50% | 11.35% |
| | | | | | |
| Ratios/Supplemental Data | | | | | |
| Ratio of Operating Expenses | | | | | |
| to Average Net Assets | 0.29% | 0.29% | 0.29% | 0.29% | 0.29% |
| Ratio of Net Investment Income (Loss) | | | | | |
| to Average Net Assets | 2.01% | 2.13% | 1.71% | 1.69% | 1.63% |
| Portfolio Turnover Rate | 12% | 5% | 9% | 4% | 17% |
| Net Assets, End of Period (in thousands) | $231,766 | $191,053 | $599,914 | $813,571 | $662,759 |
| (1) | Computed using average shares outstanding throughout the period. | | | | |
| (2) | Per share amount was less than $0.005. | | | | | |
| (3) | Total return assumes reinvestment of net investment income and capital gains distributions, if any. Total returns for periods less than one year |
| | are not annualized. Total returns are calculated based on the net asset value of the last business day. The total return of the classes may not |
| | precisely reflect the class expense differences because of the impact of calculating the net asset values to two decimal places. If net asset |
| | values were calculated to three decimal places, the total return differences would more closely reflect the class expense differences. The |
| | calculation of net asset values to two decimal places is made in accordance with SEC guidelines and does not result in any gain or loss of value |
| | between one class and another. | | | | | |
See Notes to Financial Statements.
29
|
| Report of Independent Registered Public Accounting Firm |
The Board of Directors and Shareholders,
American Century Capital Portfolios, Inc.:
We have audited the accompanying statement of assets and liabilities, including the schedule of investments, of Equity Index Fund, one of the mutual funds constituting American Century Capital Portfolios, Inc. (the “Corporation”), as of March 31, 2010, and the related statement of operations for the year then ended, the statement of changes in net assets for each of the two years in the period then ended, and the financial highlights for each of the five years in the period then ended. These financial statements and financial highlights are the responsibility of the Corporation’s management. Our responsibility is to express an opinion on these financial statements and financial highlights based on our audits.
We conducted our audits in accordance with the standards of the Public Company Accounting Oversight Board (United States). Those standards require that we plan and perform the audit to obtain reasonable assurance about whether the financial statements and financial highlights are free of material misstatement. The Corporation is not required to have, nor were we engaged to perform, an audit of its internal control over financial reporting. Our audits included consideration of internal control over financial reporting as a basis for designing audit procedures that are appropriate in the circumstances, but not for the purpose of expressing an opinion on the effectiveness of the Corporation’s internal control over financial reporting. Accordingly, we express no such opinion. An audit also includes examining, on a test basis, evidence supporting the amounts and disclosures in the financial statements, assessing t he accounting principles used and significant estimates made by management, as well as evaluating the overall financial statement presentation. Our procedures included confirmation of securities owned as of March 31, 2010, by correspondence with the custodian and brokers; where replies were not received from brokers, we performed other auditing procedures. We believe that our audits provide a reasonable basis for our opinion.
In our opinion, the financial statements and financial highlights referred to above present fairly, in all material respects, the financial position of Equity Index Fund of American Century Capital Portfolios, Inc. as of March 31, 2010, the results of its operations for the year then ended, the changes in its net assets for each of the two years in the period then ended, and the financial highlights for each of the five years in the period then ended, in conformity with accounting principles generally accepted in the United States of America.
Deloitte & Touche LLP
Kansas City, Missouri
May 17, 2010
30
The Board of Directors
The individuals listed below serve as directors of the fund. Each director will continue to serve in this capacity until death, retirement, resignation or removal from office. The mandatory retirement age for directors who are not “interested persons,” as that term is defined in the Investment Company Act (independent directors), is 72. However, the mandatory retirement age may be extended or changed with the approval of the remaining independent directors.
Mr. Thomas is the only director who is an “interested person” because he currently serves as President and Chief Executive Officer of American Century Companies, Inc. (ACC), the parent company of American Century Investment Management, Inc. (ACIM) and American Century Global Investment Management, Inc. (ACGIM). ACIM and ACGIM are referred to collectively as the “advisors.”
The other directors (more than three-fourths of the total number) are independent; that is, they have never been employees, directors or officers of, and have no financial interest in, ACC or any of its wholly owned, direct or indirect, subsidiaries, including ACIM, ACGIM, American Century Investment Services, Inc. (ACIS) and American Century Services, LLC (ACS). The directors serve in this capacity for seven (in the case of Mr. Thomas, 15) registered investment companies in the American Century Investments family of funds.
The following presents additional information about the directors. The mailing address for each director is 4500 Main Street, Kansas City, Missouri 64111.
Independent Directors
Thomas A. Brown
Year of Birth: 1940
Position(s) with the Fund: Director
Length of Time Served: Since 1980
Principal Occupation(s) During the Past Five Years: Managing Member, Associated Investments,
LLC (real estate investment company); Brown Cascade Properties, LLC (real estate
investment company) (2001 to 2009)
Number of Funds in Fund Complex Overseen by Director: 63
Other Directorships Held by Director: None
Education/Other Professional Experience: BS in Mechanical Engineering, University of
Kansas; formerly, Chief Executive Officer, Associated Bearings Company; formerly,
Area Vice President, Applied Industrial Technologies (bearings and power
transmission company)
31
Andrea C. Hall
Year of Birth: 1945
Position(s) with the Fund: Director
Length of Time Served: Since 1997
Principal Occupation(s) During the Past Five Years: Retired as advisor to the President, Midwest
Research Institute (not-for-profit research organization) (June 2006)
Number of Funds in Fund Complex Overseen by Director: 63
Other Directorships Held by Director: None
Education/Other Professional Experience: BS in Biology, Florida State University; PhD in
Biology, Georgetown University; formerly, Senior Vice President and director of
Research Operations, Midwest Research Institute
James A. Olson
Year of Birth: 1942
Position(s) with the Fund: Director
Length of Time Served: Since 2007
Principal Occupation(s) During the Past Five Years: Member, Plaza Belmont LLC (private equity
fund manager); Chief Financial Officer, Plaza Belmont LLC (September 1999 to
September 2006)
Number of Funds in Fund Complex Overseen by Director: 63
Other Directorships Held by Director: Saia, Inc. and Entertainment Properties Trust
Education/Other Professional Experience: BS in Business Administration and MBA, St. Louis
University; CPA; 21 years of experience as a partner in the accounting firm of Ernst
& Young LLP
Donald H. Pratt
Year of Birth: 1937
Position(s) with the Fund: Director, Chairman of the Board
Length of Time Served: Since 1995
Principal Occupation(s) During the Past Five Years: Chairman and Chief Executive Officer,
Western Investments, Inc. (real estate company)
Number of Funds in Fund Complex Overseen by Director: 63
Other Directorships Held by Director: None
Education/Other Professional Experience: BS in Industrial Engineering, Wichita State
University; MBA, Harvard Business School; serves on the Board of Governors of
the Independent Directors Council and Investment Company Institute; formerly,
Chairman of the Board, Butler Manufacturing Company (metal buildings producer)
Gale E. Sayers
Year of Birth: 1943
Position(s) with the Fund: Director
Length of Time Served: Since 2000
Principal Occupation(s) During the Past Five Years: President, Chief Executive Officer and
Founder, Sayers40, Inc., (technology products and services provider)
Number of Funds in Fund Complex Overseen by Director: 63
Other Directorships Held by Director: None
Education/Other Professional Experience: BS in Physical Education and M.Ed. in Educational
Administration, University of Kansas; Recipient of the Ernst & Young Entrepreneur
of the Year Award; inducted into the Chicago Entrepreneurship Hall of Fame and
the National Football League Hall of Fame
32
M. Jeannine Strandjord
Year of Birth: 1945
Position(s) with the Fund: Director
Length of Time Served: Since 1994
Principal Occupation(s) During the Past Five Years: Retired, formerly, Senior Vice President,
Process Excellence, Sprint Corporation (telecommunications company)
(January 2005-September 2005)
Number of Funds in Fund Complex Overseen by Director: 63
Other Directorships Held by Director: DST Systems Inc., Euronet Worldwide Inc., Charming
Shoppes, Inc.
Education/Other Professional Experience: BS in Business Administration and Accounting,
University of Kansas; CPA; formerly, Senior Vice President of Financial Services and
Treasurer and Chief Financial Officer, Global Markets Group; Sprint Corporation;
formerly, with the accounting firm of Ernst and Whinney
John R. Whitten
Year of Birth: 1946
Position(s) with the Fund: Director
Length of Time Served: Since 2008
Principal Occupation(s) During the Past Five Years: Project Consultant, Celanese Corp.
(industrial chemical company)
Number of Funds in Fund Complex Overseen by Director: 63
Other Directorships Held by Director: Rudolph Technologies, Inc.
Professional Education/Experience: BS in Business Administration, Cleveland State
University; CPA; formerly, Chief Financial Officer and Treasurer, Applied Industrial
Technologies, Inc.; thirteen years of experience with accounting firm Deloitte &
Touche LLP
Interested Director
Jonathan S. Thomas
Year of Birth: 1963
Position(s) with the Fund: Director and President
Length of Time Served: Since 2007
Principal Occupation(s) During the Past Five Years: President and Chief Executive Officer,
ACC (March 2007 to present); Chief Administrative Officer, ACC (February 2006 to
February 2007); Executive Vice President, ACC (November 2005 to February 2007).
Also serves as: Chief Executive Officer and Manager, American Century Services,
LLC (ACS); Executive Vice President, American Century Investment Management
(ACIM) and American Century Global Investment Management (ACGIM); Director,
ACIM, ACGIM and other ACC subsidiaries; Global Chief Operating Officer and
Managing Director, Morgan Stanley (investment management) (March 2000 to
November 2005)
Number of Funds in Fund Complex Overseen by Director: 104
Other Directorships Held by Director: None
Education/Other Professional Experience: BA in Economics, University of Massachusetts;
MBA, Boston College; formerly held senior leadership roles with Fidelity
Investments, Boston Financial Services and Bank of America; serves on the Board of
Governors of the Investment Company Institute
33
Officers
The following table presents certain information about the executive officers of the fund. Each officer serves as an officer for each of the 15 investment companies in the American Century family of funds, unless otherwise noted. No officer is compensated for his or her service as an officer of the fund. The listed officers are interested persons of the fund and are appointed or re-appointed on an annual basis. The mailing address for each of the officers listed below is 4500 Main Street, Kansas City, Missouri 64111.
| | |
| Name | Offices with | |
| (Year of Birth) | the Fund | Principal Occupation During the Past Five Years |
| Jonathan Thomas | Director and | President and Chief Executive Officer, ACC (March 2007 to present); Chief |
| (1963) | President | Administrative Officer, ACC (February 2006 to March 2007); Executive |
| | since 2007 | Vice President, ACC (November 2005 to February 2007). Also serves as: |
| | | Chief Executive Officer and Manager, ACS; Executive Vice President, ACIM, |
| | | ACGIM; Director, ACIM, ACGIM and other ACC subsidiaries; Global Chief |
| | | Operating Officer and Managing Director, Morgan Stanley (March 2000 to |
| | | November 2005) |
| Barry Fink | Executive | Chief Operating Officer and Executive Vice President, ACC (September 2007 |
| (1955) | Vice President | to present); President, ACS (October 2007 to present); Managing Director, |
| | since 2007 | Morgan Stanley (2000 to 2007); Global General Counsel, Morgan Stanley |
| | | (2000 to 2006). Also serves as: Manager, ACS and Director, ACC and |
| | | certain ACC subsidiaries |
| Maryanne Roepke | Chief Compliance | Chief Compliance Officer, American Century funds, ACIM, ACGIM and |
| (1956) | Officer since 2006 | ACS (August 2006 to present); Assistant Treasurer, ACC (January 1995 to |
| | and Senior Vice | August 2006); and Treasurer and Chief Financial Officer, various American |
| | President | Century funds (July 2000 to August 2006). Also serves as: Senior Vice |
| | since 2000 | President, ACS |
| Charles | General Counsel | Attorney, ACC (February 1994 to present); Vice President, ACC (November |
| Etherington | since 2007 and | 2005 to present), General Counsel, ACC (March 2007 to present); Also |
| (1957) | Senior Vice | serves as General Counsel, ACIM, ACGIM, ACS, ACIS and other ACC |
| | President | subsidiaries; and Senior Vice President, ACIM, ACGIM and ACS |
| | since 2006 | |
| Robert Leach | Vice President, | Vice President, ACS (February 2000 to present); and Controller, various |
| (1966) | Treasurer and | American Century funds (1997 to September 2006) |
| | Chief Financial | |
| | Officer since 2006 | |
| David Reinmiller | Vice President | Attorney, ACC (January 1994 to present); Associate General Counsel, ACC |
| (1963) | since 2000 | (January 2001 to present); Chief Compliance Officer, American Century |
| | | funds, ACIM and ACGIM (January 2001 to February 2005). Also serves as |
| | | Vice President, ACIM, ACGIM and ACS |
| Ward Stauffer | Secretary | Attorney, ACC (June 2003 – Present) |
| (1960) | since 2005 | |
The SAI has additional information about the fund’s directors and is available without charge, upon request, by calling 1-800-345-2021.
34
|
| Board Approval of Management and Subadvisory Agreements |
American Century Investment Management, Inc. (“ACIM” or the “Advisor”) currently serves as investment advisor to the Fund under an interim management agreement (the “Interim Management Agreement”) between the Advisor and the Fund approved by the Fund’s Board of Directors (the “Board”). The Advisor previously served as investment advisor to the Fund pursuant to a management agreement (the “Prior Management Agreement”) that terminated in accordance with its terms on February 16, 2010, as a result of a change of control of the Advisor’s parent company, American Century Companies, Inc. (“ACC”). The change in control occurred as the result of a change in the trustee of a trust created by James E. Stowers, Jr., the founder of American Century Investments, which holds shares representing a significant interest in ACC stock. Mr. Stowers previously serve d as the trustee of the trust. On February 16, 2010, Richard W. Brown, Co-Chairman of ACC with Mr. Stowers, became the trustee in accordance with the terms of the trust and Mr. Stowers’ long-standing estate and succession plan.
Northern Trust Investments, N.A. (the “Subadvisor”) currently serves as subadvisor to the Fund under an interim subadvisory agreement (the “Interim Subadvisory Agreement”) between the Advisor and the Subad-visor. The Subadvisor previously served as subadvisor to the Fund pursuant to a subadvisory agreement (the “Prior Subadvisory Agreement”) that terminated as a result of the termination of the Prior Management Agreement.
On February 18, 2010, the Board approved the Interim Management Agreement and Interim Subadvisory Agreement in accordance with Rule 15a-4 under the Investment Company Act to ensure continued management of the Fund by the Advisor and the Subadvisor after the termination of the Prior Management Agreement and the Prior Subadvisory Agreement and until shareholder approval of a new management agreement (the “Proposed Management Agreement”) and a new subadvisory agreement (the “Proposed Subadvisory Agreement”) as required under the Act. The Board has approved the Proposed Management Agreement and Proposed Subadvisory Agreement and has recommended their approval to shareholders. Fund shareholders are scheduled to consider approval of the Proposed Management Agreement and Proposed Subadvisory Agreement at a meeting to be held on June 16, 2010.
The Interim Management Agreement and the Proposed Management Agreement are substantially identical to the Prior Management Agreement except for their effective dates and the termination provisions of the Interim Management Agreement. Under the Interim and Proposed Management Agreements, the Advisor will provide the same services to the Fund and receive the same compensation rate as under the Prior Management Agreement. The Interim and Proposed Subadvisory Agreements are substantially identical to the Prior Subadvisory Agreement except for their effective dates and the termination provisions of the Interim Subadvisory Agreement. Under the Interim and Proposed Subadvisory Agreements, the Subadvisor will provide the same services to the Fund and receive the same compensation rate from the Advisor as under the Prior Subadvisory Agreement.
35
Basis for Board Approval of Interim Agreements
In considering the approvals of the Interim Management Agreement and the Interim Subadvisory Agreement, Rule 15a-4 requires the Board to approve a contract within ten business days of the termination of the prior agreement and to determine that the compensation to be received under an interim agreement is no greater than would have been received under the prior agreement. In connection with the approvals, the Board noted that it oversees on a continuous basis and evaluates at its quarterly meetings, directly and through the committees of the Board, the nature and quality of significant services provided by the Advisor and the Subadvisor, the investment performance of the Fund, shareholder services, audit and compliance functions and a variety of other matters relating to the Fund’s operations.
In evaluating the Interim Management Agreement and the Interim Subad-visory Agreement, the Board, assisted by the advice of its independent legal counsel, considered a number of factors in addition to those required by the rule with no one factor being determinative to its analysis. Among the factors considered by the Board were the circumstances and effect of the change of control, the fact that the Advisor and Subadvisor will provide the same services and receive the same compensation rate as under the prior agreements, and that the change of control did not result in a change of the personnel managing the Fund. Upon completion of its analysis, the Board approved the Interim Management Agreement and the Interim Subadvi-sory Agreement, determining that the continued management of the Fund by the Advisor and the Subadvisor was in the best interests of the Fund and Fund shareholders.
Basis for Board Approval of Proposed Management Agreement
At a meeting held on March 29, 2010, after considering all information presented, the Board approved, and determined to recommend that shareholders approve, the Proposed Management Agreement. In connection with that approval, the Board requested and reviewed extensive data and information compiled by the Advisor and certain independent providers of evaluation data concerning the Fund and services provided to the Fund by the Advisor. The Board oversees on a continuous basis and evaluates at its quarterly meetings, directly and through the committees of the Board, the nature and quality of significant services provided by the Advisor, the investment performance of the Fund, shareholder services, audit and compliance functions and a variety of other matters relating to the Fund’s operations. The information considered and the discussions held at the meetings included, but were not limited to:
• the nature, extent and quality of the services provided to the Fund;
• the wide range of programs and services the Advisor provides to the Fund and its shareholders on a routine and non-routine basis;
• the compliance policies, procedures, and regulatory experience of the Advisor;
36
• data comparing the cost of owning the Fund to the cost of owning similar funds;
• the fact that there will be no changes to the fees, services, or personnel who provide such services as compared to the Prior Management Agreement;
• data comparing the Fund’s performance to appropriate benchmarks and/ or a peer group of other mutual funds with similar investment objectives and strategies;
• financial data showing the profitability of the Fund to the Advisor and the overall profitability of the Advisor;
• data comparing services provided and charges to the Fund with those for other non-fund investment management clients of the Advisor; and
• consideration of collateral or “fall-out” benefits derived by the Advisor from the management of the Fund and potential sharing of economies of scale in connection with the management of the Fund.
The Board also considered whether there was any reason for not continuing the existing arrangement with the Advisor. In particular, the Board recognized that shareholders may have invested in the Fund on the strength of the Advisor’s industry standing and reputation and in the expectation that the Advisor will have a continuing role in providing services to the Fund.
The Board considered all of the information provided by the Advisor, the independent data providers, and the Board’s independent legal counsel, and evaluated such information for the Fund. The Board did not identify any single factor as being all-important or controlling, and each Board member may have attributed different levels of importance to different factors. In deciding to approve the Proposed Management Agreement under the terms ultimately determined by the Board to be appropriate, the Board based its decision on a number of factors, including the following:
Nature, Extent and Quality of Services — Generally. Under the Proposed Management Agreement, the Advisor is responsible for providing or arranging for all services necessary for the operation of the Fund. The Board noted that under the Proposed Management Agreement, the Advisor provides or arranges at its own expense a wide variety of services including:
• constructing and designing the Fund
• portfolio research and security selection
• initial capitalization/funding
• securities trading
• Fund administration
• custody of Fund assets
37
• daily valuation of the Fund’s portfolio
• shareholder servicing and transfer agency, including shareholder
confirmations, recordkeeping and communications
• legal services
• regulatory and portfolio compliance
• financial reporting
• marketing and distribution
The Board noted that many of these services have expanded over time both in terms of quantity and complexity in response to shareholder demands, competition in the industry, changing distribution channels and the changing regulatory environment.
Investment Management Services. The investment management services provided to the Fund are complex and provide Fund shareholders access to professional money management, instant diversification of their investments within an asset class, the opportunity to easily diversify among asset classes, and liquidity. As a part of its general oversight and in evaluating investment performance, the Board expects the Advisor to manage, or arrange for the management of, the Fund in accordance with its investment objectives and approved strategies. The Board, directly and through its Fund Performance Review Committee, regularly reviews investment performance information for the Fund, together with comparative information for appropriate benchmarks and/or peer groups of similarly-managed funds, over different time horizons. If performance conce rns are identified, the underperforming Fund receives special reviews until performance improves, during which time the Board discusses with the Advisor the reasons for such underperformance and any efforts being undertaken to improve performance.
Shareholder and Other Services. Under the Proposed Management Agreement, the Advisor will also provide the Fund with a comprehensive package of transfer agency, shareholder, and other services. The Board, directly and through the various committees of the Board, regularly reviews reports and evaluations of such services. These reports include, but are not limited to, information regarding the operational efficiency and accuracy of the shareholder and transfer agency services provided, staffing levels, shareholder satisfaction (as measured by external as well as internal sources), technology support, new products and services offered to Fund shareholders, securities trading activities, portfolio valuation services, auditing services, and legal and operational compliance activities. Certain aspects of shareholder and transfer agency service level efficiency and the quality of securities trading activities are measured by independent third party providers and are presented in comparison to other fund groups not managed by the Advisor.
38
Costs of Services Provided and Profitability. The Advisor provided detailed information concerning its cost of providing various services to the Fund, its profitability in managing the Fund, its overall profitability, and its financial condition. The Board reviewed with the Advisor the methodology used to prepare this financial information. The Board has also reviewed with the Advisor the compensation paid to the five highest paid personnel of the Advisor. This financial information regarding the Advisor is considered in order to evaluate the Advisor’s financial condition, its ability to continue to provide services under the Proposed Management Agreement, and the reasonableness of the proposed management fees. The Board concluded that the Advisor’s profits were reasonable in light of the services provided to the Fun d.
Ethics. The Board generally considers the Advisor’s commitment to providing quality services to shareholders and to conducting its business ethically. It noted that the Advisor’s practices generally meet or exceed industry best practices.
Economies of Scale. The Board also reviewed information provided by the Advisor regarding the possible existence of economies of scale in connection with the management of the Fund. The Board concluded that economies of scale are difficult to measure and predict with precision, especially on a fund-by-fund basis. The analysis of economies of scale is further complicated by the additional services and content provided by the Advisor and its reinvestment in its ability to provide and expand those services. Accordingly, the Board seeks to evaluate economies of scale by reviewing information, such as year-over-year profitability of the Advisor generally, the profitability of its management of the Fund specifically, and the expenses incurred by the Advisor in providing various functions to the Fund. The Board believes the Advisor i s appropriately sharing economies of scale through its competitive fee structure, offering competitive fees from fund inception, fee breakpoints as the Fund increases in size, and through reinvestment in its business to provide shareholders additional services and enhancements to existing services.
Comparison to Fees of Fund not Managed by the Advisor. Both the Prior and Proposed Management Agreements provide that the Fund pay the Advisor a single, all-inclusive (or unified) management fee for providing all services necessary for the management and operation of the Fund, other than brokerage expenses, taxes, interest, extraordinary expenses, and the fees and expenses of the Fund’s Independent Trustees (including their independent legal counsel) and expenses incurred in connection with the provision of shareholder services and distribution services under a plan adopted pursuant to Rule 12b-1 under the 1940 Act. Under the unified fee structure, the Advisor is responsible for providing all investment advisory, custody, audit, administrative, compliance, recordkeeping, marketing and shareholder services, or arranging an d supervising third parties that provide such services. By contrast, most other funds are charged a variety of fees, including an investment advisory fee, a transfer agency fee, an administrative fee, distribution charges and other expenses. Other than their investment advisory fees and any applicable Rule 12b-1 distribution fees, the components of the total fees charged by these other funds may be
39
increased without shareholder approval. The Board believes the unified fee structure is a benefit to Fund shareholders because it clearly discloses to shareholders the cost of owning Fund shares, and, since the unified fee cannot be increased without a vote of Fund shareholders, it shifts to the Advisor the risk of increased costs of operating the Fund and provides a direct incentive to minimize administrative inefficiencies. Part of the Board’s analysis of fee levels involves reviewing certain evaluative data compiled by an independent provider comparing the Fund’s unified fee to the total expense ratios of similar funds not managed by the Advisor. The Board concluded that the management fee to be paid by the Fund to the Advisor under the Proposed Management Agreement is reasonable in light of the services to be provided to the Fund.
Comparison to Fees and Services Provided to Other Clients of the Advisor. The Board also requested and received information from the Advisor concerning the nature and extent of the services, fees, and profitability of its advisory services to advisory clients other than the Fund. They observed that these varying types of client accounts require different services and involve different regulatory and entrepreneurial risks than the management of the Fund. The Board analyzed this information and concluded that the fees charged and services provided to the Fund were reasonable by comparison.
Collateral or “Fall-Out” Benefits Derived by the Advisor. The Board considered the existence of collateral benefits the Advisor may receive as a result of its relationship with the Fund. The Board concluded that the Advisor’s primary business is managing mutual funds and it generally does not use Fund or shareholder information to generate profits in other lines of business, and therefore does not derive any significant collateral benefits from them. The Board noted that the Advisor receives proprietary research from broker-dealers that execute Fund portfolio transactions and concluded that this research is likely to benefit Fund shareholders.
Conclusion of the Board. As a result of this process, the Board, in the absence of particular circumstances and assisted by the advice of its independent legal counsel, taking into account all of the factors discussed above and the information provided by the Advisor and others, concluded that the Proposed Management Agreement be approved and recommended its approval to Fund shareholders.
Basis for Board Approval of Proposed Subadvisory Agreement
At its meeting held on March 29, 2010, the Fund’s Board considered and approved the Proposed Subadvisory Agreement between the Advisor and the Subadvisor with respect to the Fund. In approving the Proposed Subad-visory Agreement, the Board considered the following criteria relevant to the Subadvisor:
• The nature of the investment management services provided to the Fund;
• the Subadvisor’s breadth of experience in index fund management;
40
• Data comparing the Fund’s performance to appropriate benchmarks; and
• The compliance policies, procedures, and regulatory experience of the Subadvisor.
The Board also considered the Subadvisor’s positive track record with respect to complying with the Advisor’s stringent requirements for trading practices and soft dollar arrangements.
Under the Proposed Subadvisory Agreement, the Subadvisor is responsible for managing the investment operations and composition of the Fund, including the purchase, retention, and disposition of the investments held by the Fund. In performing its evaluation, the Board considered information received in connection with the approval of the Proposed Subadvisory Agreement, as well as information provided on an ongoing basis at its regularly scheduled Board and committee meetings. The Board did not consider the profitability of the Subadvisor because the Subadvisor is paid from the unified fee of the Advisor as a result of arm’s length negotiations.
After considering all information presented, and while no single factor was determinative, the Board, assisted by the advice of independent legal counsel, concluded that the Proposed Subadvisory Agreement be approved and recommended its approval to Fund shareholders.
41
Retirement Account Information
As required by law, distributions you receive from certain IRAs or 403(b), 457 and qualified plans are subject to federal income tax withholding, unless you elect not to have withholding apply. Tax will be withheld on the total amount withdrawn even though you may be receiving amounts that are not subject to withholding, such as nondeductible contributions. In such case, excess amounts of withholding could occur. You may adjust your withholding election so that a greater or lesser amount will be withheld.
If you don’t want us to withhold on this amount, you must notify us to not withhold the federal income tax. You may notify us in writing or in certain situations by telephone or through other electronic means. You have the right to revoke your withholding election at any time and any election you make may remain in effect until revoked by filing a new election.
Remember, even if you elect not to have income tax withheld, you are liable for paying income tax on the taxable portion of your withdrawal. If you elect not to have income tax withheld or you don’t have enough income tax withheld, you may be responsible for payment of estimated tax. You may incur penalties under the estimated tax rules if your withholding and estimated tax payments are not sufficient. You can reduce or defer the income tax on a distribution by directly or indirectly rolling such distribution over to another IRA or eligible plan. You should consult your tax advisor for additional information.
State tax will be withheld if, at the time of your distribution, your address is within one of the mandatory withholding states and you have federal income tax withheld. State taxes will be withheld from your distribution in accordance with the respective state rules.
Proxy Voting Guidelines
American Century Investment Management, Inc., the fund’s investment advisor, is responsible for exercising the voting rights associated with the securities purchased and/or held by the fund. A description of the policies and procedures the advisor uses in fulfilling this responsibility is available without charge, upon request, by calling 1-800-345-2021. It is also available on American Century Investments’ website at americancentury.com and on the Securities and Exchange Commission’s website at sec.gov. Information regarding how the investment advisor voted proxies relating to portfolio securities during the most recent 12-month period ended June 30 is available on the “About Us” page at americancentury.com. It is also available at sec.gov.
Quarterly Portfolio Disclosure
The fund files its complete schedule of portfolio holdings with the Securities and Exchange Commission (SEC) for the first and third quarters of each fiscal year on Form N-Q. The fund’s Form N-Q is available on the SEC’s website at sec.gov, and may be reviewed and copied at the SEC’s Public Reference Room in Washington, DC. Information on the operation of the Public Reference Room may be obtained by calling 1-800-SEC-0330. The fund also makes its complete schedule of portfolio holdings for the most recent quarter of its fiscal year available on its website at americancentury.com and, upon request, by calling 1-800-345-2021.
42
The following indices are used to illustrate investment market, sector, or style performance or to serve as fund performance comparisons. They are not investment products available for purchase.
The Russell 1000® Index is a market-capitalization weighted, large-cap index created by Frank Russell Company to measure the performance of the 1,000 largest publicly traded U.S. companies, based on total market capitalization.
The Russell 1000® Growth Index measures the performance of those Russell 1000 Index companies (the 1,000 largest publicly traded U.S. companies, based on total market capitalization) with higher price-to-book ratios and higher forecasted growth values.
The Russell 1000® Value Index measures the performance of those Russell 1000 Index companies (the 1,000 largest publicly traded U.S. companies, based on total market capitalization) with lower price-to-book ratios and lower forecasted growth values.
The Russell 2000® Index is a market-capitalization weighted index created by Frank Russell Company to measure the performance of the 2,000 smallest of the 3,000 largest publicly traded U.S. companies, based on total market capitalization.
The Russell 2000® Growth Index measures the performance of those Russell 2000 Index companies (the 2,000 smallest of the 3,000 largest publicly traded U.S. companies, based on total market capitalization) with higher price-to-book ratios and higher forecasted growth values.
The Russell 2000® Value Index measures the performance of those Russell 2000 Index companies (the 2,000 smallest of the 3,000 largest publicly traded U.S. companies, based on total market capitalization) with lower price-to-book ratios and lower forecasted growth values.
The Russell Midcap® Index measures the performance of the 800 smallest of the 1,000 largest publicly traded U.S. companies, based on total market capitalization.
The Russell Midcap® Growth Index measures the performance of those Russell Midcap Index companies (the 800 smallest of the 1,000 largest publicly traded U.S. companies, based on total market capitalization) with higher price-to-book ratios and higher forecasted growth values.
The Russell Midcap® Value Index measures the performance of those Russell Midcap Index companies (the 800 smallest of the 1,000 largest publicly traded U.S. companies, based on total market capitalization) with lower price-to-book ratios and lower forecasted growth values.
The S&P 500 Index is a market value-weighted index of the stocks of 500 publicly traded U.S. companies chosen for market size, liquidity, and industry group representation that are considered to be leading firms in dominant industries. Each stock’s weight in the index is proportionate to its market value. Created by Standard & Poor’s, it is considered to be a broad measure of U.S. stock market performance.
43
44

| |
| |
| Contact Us | |
| americancentury.com | |
| Automated Information Line | 1-800-345-8765 |
| Investor Services Representative | 1-800-345-2021 or |
| | 816-531-5575 |
| Business, Not-For-Profit, Employer-Sponsored | |
| Retirement Plans | 1-800-345-3533 |
| Banks and Trust Companies, Broker-Dealers, | |
| Financial Professionals, Insurance Companies | 1-800-345-6488 |
| Telecommunications Device for the Deaf | 1-800-634-4113 |
| American Century Capital Portfolios, Inc. | |
| Investment Advisor: | |
| American Century Investment Management, Inc. | |
| Kansas City, Missouri | |
This report and the statements it contains are submitted for the general
information of our shareholders. The report is not authorized for distribution to
prospective investors unless preceded or accompanied by an effective prospectus.
American Century Investment Services, Inc., Distributor
©2010 American Century Proprietary Holdings, Inc. All rights reserved.
1005
CL-ANN-68272N
|
| Annual Report |
| March 31, 2010 |

|
| American Century Investments® |
NT Large Company Value Fund
NT Mid Cap Value Fund
| |
| President’s Letter | 2 |
| Independent Chairman’s Letter | 3 |
| Market Perspective | 4 |
| U.S. Stock Index Returns | 4 |
| |
| NT Large Company Value | |
| |
| Performance | 5 |
| Portfolio Commentary | 6 |
| Top Ten Holdings | 8 |
| Top Five Industries | 8 |
| Types of Investments in Portfolio | 8 |
| |
| NT Mid Cap Value | |
| |
| Performance | 9 |
| Portfolio Commentary | 10 |
| Top Ten Holdings | 12 |
| Top Five Industries | 12 |
| Types of Investments in Portfolio | 12 |
| |
| Shareholder Fee Examples | 13 |
| |
| Financial Statements | |
| |
| Schedule of Investments | 15 |
| Statement of Assets and Liabilities | 21 |
| Statement of Operations | 22 |
| Statement of Changes in Net Assets | 23 |
| Notes to Financial Statements | 24 |
| Financial Highlights | 31 |
| Report of Independent Registered Public Accounting Firm | 33 |
| |
| Other Information | |
| |
| Management | 34 |
| Board Approval of Management Agreements | 38 |
| Additional Information | 44 |
| Index Definitions | 45 |
Any opinions expressed in this report reflect those of the author as of the date of the report, and do not necessarily represent the opinions of American Century Investments or any other person in the American Century Investments organization. Any such opinions are subject to change at any time based upon market or other conditions and American Century Investments disclaims any responsibility to update such opinions. These opinions may not be relied upon as investment advice and, because investment decisions made by American Century Investments funds are based on numerous factors, may not be relied upon as an indication of trading intent on behalf of any American Century Investments fund. Security examples are used for representational purposes only and are not intended as recommendations to purchase or sell securities. Performance information for comparative indices and securities is provided to American Century Investments by third party vendors. To the best of American Century Investments’ knowledge, such information is accurate at the time of printing.

Dear Investor:
To learn more about the capital markets, your investment, and the portfolio management strategies American Century Investments provides, we encourage you to review this shareholder report for the financial reporting period ended March 31, 2010.
On the following pages, you will find investment performance and portfolio information, presented with the expert perspective and commentary of our portfolio management team. This report remains one of our most important vehicles for conveying the information you need about your investment performance, and about the market factors and strategies that affect fund returns. For additional information on the markets, we encourage you to visit the “Insights & News” tab at our Web site, americancentury.com, for updates and further expert commentary.
The top of our Web site’s home page also provides a link to “Our Story,” which, first and foremost, outlines our commitment—since 1958—to helping clients reach their financial goals. We believe strongly that we will only be successful when our clients are successful. That’s who we are.
Another important, unique facet of our story and who we are is “Profits with a Purpose,” which describes our bond with the Stowers Institute for Medical Research (SIMR). SIMR is a world-class biomedical organization—founded by our company founder James E. Stowers, Jr. and his wife Virginia—that is dedicated to researching the causes, treatment, and prevention of gene-based diseases, including cancer. Through American Century Investments’ private ownership structure, more than 40% of our profits support SIMR.
Mr. Stowers’ example of achieving financial success and using that platform to help humanity motivates our entire American Century Investments team. His story inspires us to help each of our clients achieve success. Thank you for sharing your financial journey with us.
Sincerely,

Jonathan Thomas
President and Chief Executive Officer
American Century Investments
2
|
| Independent Chairman’s Letter |

Fellow Shareholders,
The principal event at a recent board meeting was the retirement of Jim Stowers, Jr. from the American Century Mutual Funds Kansas City board. This was one of those times when you felt like you were living a historical moment. Jim founded what was known as Twentieth Century Mutual Funds over 50 years ago. Through the years, his number one priority has been to “Put Investors First!” The board presented Jim with a resolution acknowledging that, by building a successful investment company, he has impacted the lives of many by helping them on the path to financial success.
We respect Jim’s decision to focus his energy on the Stowers Institute for Medical Research and American Century Companies, Inc. (ACC), the parent company of the funds’ investment advisors. The pioneering medical research that Jim and his wife Virginia have made possible through the Institute should enrich the lives of millions in the future.
Shortly after his retirement from the board, we received word that Jim—who celebrated his 86th birthday in January—was hospitalized after experiencing a fall during his regular exercise regimen. While Jim has made steady progress toward recovery, this potentially serious incident resulted in the activation of his long-standing estate and business succession plan. Under the terms of the plan, ACC’s co-chairman Richard W. Brown succeeded Jim as trustee of a trust that holds a significant interest in ACC stock. While less than a majority interest, the trust is presumed to control the funds’ investment advisors under the Investment Company Act of 1940. This change triggered the need for a shareholder proxy to approve new management and subadvisory agreements for the funds. If you have not already responded, I encourage you to take the time to read the proxy materials and send your vote as soon as p ossible.
On behalf of the board, I want to once again thank Jim for his mutual fund board service and wish him a speedy recovery. More than three years ago, Jim and Richard Brown installed a strong and effective leadership team at American Century Investments and I look forward to continuing to work with them on behalf of fund shareholders. And while Jim no longer sits on the fund board, the inherent optimism captured by his favorite catch phrase—“The best is yet to be”—still resonates with all of us who have the privilege of serving you. I invite you to send your comments, questions or concerns to me at dhpratt@fundboardchair.com.
3

By Phil Davidson, Chief Investment Officer, U.S. Value Equity
Stocks Enjoyed Bountiful Recovery
The U.S. stock market gained approximately 50% for the year ended March 31, 2010—one of its best 12-month returns in the last three decades. The key factor behind the remarkable rally in stocks was increasing confidence in a potential economic recovery.
The period began as the U.S. economy was beginning to emerge from its worst downturn since the Great Depression. Signs of economic improvement—including a pickup in industrial production, rising retail sales, and signals that the housing sector was starting to stabilize—gained momentum throughout the 12-month period, helping the U.S. economy post positive growth in the third and fourth quarters of 2009. The exception was job growth—the unemployment rate rose to its highest level since 1983 before falling back slightly toward the end of the reporting period.
Better-than-expected corporate profits also provided a boost to stocks despite sluggish revenue growth. Aggressive cost-cutting strategies across much of corporate America helped profits remain on an upward trajectory.
Value Stocks Led the Rally
Value stocks led the market’s advance, outperforming growth shares across all market capitalizations (see the table below). Many of the best-performing stocks were financially stressed companies that were able to stabilize their businesses and strengthen their balance sheets—characteristics that apply to value-oriented issues. In addition, the financial sector—a sizable component of the value universe—was one of the top-performing sectors in the equity market as many troubled financial firms were able to issue equity and deleverage.
Another recent development that has been favorable for value stocks is a resurgence of dividends. 2009 was the worst year on record for dividends in the U.S., where more than 800 companies reduced their dividend payouts by a total of $58 billion. However, in the first three months of 2010, income-oriented investors were rewarded with growing dividend payouts. In February alone, 47 companies in the S&P 500 increased their dividends or began paying them. Dividends play a central role in our efforts to reduce risk and increase total returns, and they also confirm the strength of a company’s earnings and cash flow.
| | | | |
| U.S. Stock Index Returns | | | | |
| For the 12 months ended March 31, 2010 | | | | |
| Russell 1000 Index (Large-Cap) | 51.60% | | Russell 2000 Index (Small-Cap) | 62.76% |
| Russell 1000 Growth Index | 49.75% | | Russell 2000 Growth Index | 60.32% |
| Russell 1000 Value Index | 53.56% | | Russell 2000 Value Index | 65.07% |
| Russell Midcap Index | 67.71% | | | |
| Russell Midcap Growth Index | 63.00% | | | |
| Russell Midcap Value Index | 72.41% | | | |
4
| | | | |
| NT Large Company Value | | | |
| |
| Total Returns as of March 31, 2010 | | | |
| | | | Average Annual | |
| | | | Returns | |
| | Ticker | | Since | Inception |
| | Symbol | 1 year | Inception | Date |
| Institutional Class | ACLLX | 47.28% | -3.15% | 5/12/06 |
| Russell 1000 Value Index | — | 53.56% | -2.21% | — |
| S&P 500 Index | — | 49.77% | -0.39% | — |
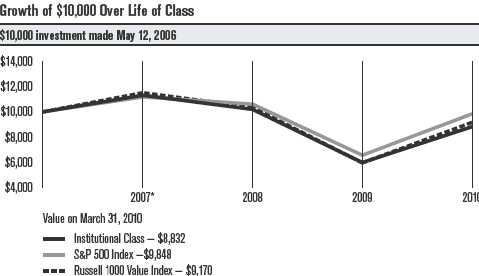
|
| *From 5/12/06, the Institutional Class’s inception date. Not annualized. |
| |
| Total Annual Fund Operating Expenses |
| Institutional Class | 0.64% |
The total annual fund operating expenses shown is as stated in the fund’s prospectus current as of the date of this report. The prospectus may vary from the expense ratio shown elsewhere in this report because it is based on a different time period, includes acquired fund fees and expenses, and, if applicable, does not include fee waivers or expense reimbursements.
Data presented reflect past performance. Past performance is no guarantee of future results. Current performance may be higher or lower than the performance shown. Investment return and principal value will fluctuate, and redemption value may be more or less than original cost. To obtain performance data current to the most recent month end, please call 1-800-345-2021 or visit americancentury.com.
Data assumes reinvestment of dividends and capital gains, and none of the charts reflect the deduction of taxes that a shareholder would pay on fund distributions or the redemption of fund shares. Returns for the indices are provided for comparison. The fund’s total returns include operating expenses (such as transaction costs and management fees) that reduce returns, while the total returns of the indices do not.
5
NT Large Company Value
Portfolio Managers: Chuck Ritter and Brendan Healy
Performance Summary
NT Large Company Value returned 47.28% for the 12 months ended March 31, 2010. By comparison, its benchmark, the Russell 1000 Value Index, returned 53.56%. The broader market, as measured by the S&P 500 Index, returned 49.77%. The portfolio’s return reflects operating expenses, while the indices’ returns do not. The average return for Morningstar’s Large Cap Value category (its performance, like NT Large Company Value’s, reflects operating expenses) was 50.25%.*
As the performance figures above indicate, the stock market staged a remarkable comeback during the reporting period. Economic conditions improved in response to government stimulus, corporate earnings were better than expected, and improving conditions in the capital markets helped the more highly leveraged or financially strapped companies. These factors led many investors to shift into riskier assets, and many of the period’s largest gains were made by the lower-quality businesses that fared the worst during the financial crisis. Furthermore, the names that lagged the rally tended to be the stable, less risky businesses favored by NT Large Company Value. In this environment, the portfolio received positive results in absolute terms from all 10 of the sectors in which it was invested. On a relative basis, holdings in the consumer discretionary and health care sectors detracted. The portfolio’s position in utilities contributed positively.
Consumer Discretionary Detracted
Within the consumer discretionary sector, security selection was a drag on relative performance. Although the portfolio benefited from its investments in the media industry, these results were offset by a lack of exposure to car maker Ford Motor and auto component companies. Ford, which was up significantly in the benchmark, has restructured its business and steadily gained market share. Among diversified consumer services stocks, a notable detractor was H&R Block, which experienced a decline in its tax-preparation business.
Health Care Hampered Results
The portfolio’s overweight in health care dampened relative progress. Health care stocks gained, but their progress was constrained as investors priced in worst-case scenarios for health care reform. As fears abated, the sector’s performance strengthened.
|
| *The average return from June 1, 2006, the date nearest the fund’s inception for which data are available, through March 31, 2010, for Morningstar’s |
| Large Cap Value category was -1.32%. © 2010 Morningstar, Inc. All Rights Reserved. The information contained herein: (1) is proprietary to |
| Morningstar and/or its content providers; (2) may not be copied or distributed; and (3) is not warranted to be accurate, complete or timely. Neither |
| Morningstar nor its content providers are responsible for any damages or losses arising from any use of this information. |
6
NT Large Company Value
Security selection also slowed relative results. A notable detractor was Abbott Laboratories, which develops and manufactures laboratory diagnostics, medical devices, and pharmaceutical therapies. Earlier in the reporting period, Abbott reported a deceleration in prescription growth for Humira, its blockbuster drug for the treatment of rheumatoid arthritis. Eventually, sales of Humira rebounded strongly, but the drugmaker’s shares underperformed other pharmaceutical names.
A Defensive Bias Also Slowed Progress
A factor influencing NT Large Company Value’s relative underperformance was the annual reconstitution of the portfolio’s benchmark index, the Russell 1000 Value Index. The reconstitution, which occurred during June 2009, gave greater weighting to cyclical sectors and stocks—in other words, those that tend to rise during good economic times. Because of our investment approach, we did not respond to this shift in weightings by increasing the portfolio’s cyclical sensitivity, which hampered relative performance.
Utilities Provided a Boost
NT Large Company Value continued to benefit from a significant underweight in the utilities sector, reflecting our belief that many of these stocks have been overvalued for some time. The stance added value during the market rally when utilities underperformed all but one other benchmark sector.
Consumer Staples Provided Notable Contributor
The consumer staples sector was the source of key contributor Pepsi Bottling Group. Its share price surged on news that PepsiCo, which already owned one third of the bottling company, had launched a takeover bid. The deal closed in February 2010.
Outlook
We continue to be bottom-up investment managers, evaluating each company individually and building the portfolio one stock at a time. As of March 31, 2010, NT Large Company Value is broadly diversified, with ongoing overweight positions in the health care, information technology, and consumer staples sectors. Our valuation work is also directing us toward smaller relative weightings in financials, utilities, and materials stocks.
7
| |
| NT Large Company Value | |
| |
| Top Ten Holdings | |
| | % of net assets |
| | as of 3/31/10 |
| Exxon Mobil Corp. | 4.7% |
| General Electric Co. | 3.8% |
| JPMorgan Chase & Co. | 3.7% |
| Bank of America Corp. | 3.4% |
| Pfizer, Inc. | 3.4% |
| Chevron Corp. | 3.4% |
| AT&T, Inc. | 3.4% |
| ConocoPhillips | 2.6% |
| Verizon Communications, Inc. | 2.1% |
| Wells Fargo & Co. | 2.1% |
| |
| Top Five Industries | |
| | % of net assets |
| | as of 3/31/10 |
| Oil, Gas & Consumable Fuels | 15.4% |
| Pharmaceuticals | 8.6% |
| Diversified Financial Services | 7.6% |
| Diversified Telecommunication Services | 5.9% |
| Insurance | 4.6% |
| |
| Types of Investments in Portfolio | |
| | % of net assets |
| | as of 3/31/10 |
| Common Stocks and Futures | 99.4% |
| Temporary Cash Investments | 0.5% |
| Other Assets and Liabilities | 0.1% |
8
| | | | |
| NT Mid Cap Value | | | | |
| |
| Total Returns as of March 31, 2010 | | | |
| | | | Average Annual | |
| | | | Returns | |
| | Ticker | | Since | Inception |
| | Symbol | 1 year* | Inception | Date |
| Institutional Class | ACLMX | 58.29% | 3.88% | 5/12/06 |
| Russell Midcap Value Index | — | 72.41% | -0.09% | — |
| *The performance is attributable in part to unusually favorable market conditions and may not be repeated or consistently achieved in the future. |
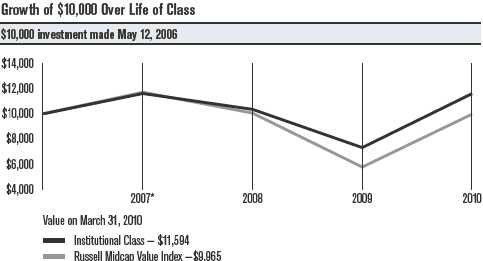
|
| *From 5/12/06, the Institutional Class’s inception date. Not annualized. |
| |
| Total Annual Fund Operating Expenses |
| Institutional Class | 0.81% |
The total annual fund operating expenses shown is as stated in the fund’s prospectus current as of the date of this report. The prospectus may vary from the expense ratio shown elsewhere in this report because it is based on a different time period, includes acquired fund fees and expenses, and, if applicable, does not include fee waivers or expense reimbursements.
Data presented reflect past performance. Past performance is no guarantee of future results. Current performance may be higher or lower than the performance shown. Investment return and principal value will fluctuate, and redemption value may be more or less than original cost. To obtain performance data current to the most recent month end, please call 1-800-345-2021 or visit americancentury.com.
Data assumes reinvestment of dividends and capital gains, and none of the charts reflect the deduction of taxes that a shareholder would pay on fund distributions or the redemption of fund shares. Returns for the index are provided for comparison. The fund’s total returns include operating expenses (such as transaction costs and management fees) that reduce returns, while the total returns of the index do not.
9
NT Mid Cap Value
Portfolio Managers: Kevin Toney, Michael Liss, and Phil Davidson
Performance Summary
NT Mid Cap Value returned 58.29% for the 12 months ended March 31, 2010. By comparison, the average return for Morningstar’s Mid Cap Value category (its performance, like NT Mid Cap Value’s, reflects operating expenses) was 65.78%.* The fund’s benchmark, the Russell Midcap Value Index, was up 72.41%. Its returns do not include operating expenses.
As the performance figures above indicate, the stock market staged a remarkable comeback during the reporting period. Economic conditions improved (partly in response to government stimulus programs), corporate earnings were better than expected, and improving conditions in the capital markets helped the more highly leveraged or financially strapped companies. These factors led many investors to shift into riskier assets, and many of the period’s largest gains were made by the lower-quality businesses that fared the worst during the financial crisis. That situation was at odds with NT Mid Cap Value’s investment approach, which emphasizes higher-quality businesses with sound balance sheets. Nonetheless, the portfolio received positive contributions in absolute terms from all 10 of the sectors in which it was invested. On a relative basis, NT Mid Cap Value’s underperformance was more a result of what it didn’t own, rather than what it did.
Financials Slowed Results
The portfolio’s position in the financials sector was the largest source of underperformance versus the benchmark. Although financials contributed the most to NT Mid Cap Value’s return, conservative security selection restrained relative progress as companies with stressed balance sheets, many of which had appeared to be on the brink of bankruptcy only months earlier, outperformed stronger, higher-quality businesses. The portfolio was significantly underweight commercial banks, a segment that returned more than 67% to the benchmark.
The portfolio’s investments were concentrated in the less-volatile insurance and thrift names, many of which did not keep pace with other financial stocks during the low-quality rally. A top detractor was global insurance broker, Marsh & McLennan Companies. Marsh does not have a credit-sensitive business model and we believe it is well-positioned to benefit from regulatory changes and improving operating conditions. Another notable detractor was People’s United Financial, a conservatively run and well-capitalized thrift.
|
| *The average return from June 1, 2006, the date nearest the fund’s inception for which data are available, through March 31, 2010, for Morningstar’s |
| Mid Cap Value category was 0.61%. © 2010 Morningstar, Inc. All Rights Reserved. The information contained herein: (1) is proprietary to |
| Morningstar and/or its content providers; (2) may not be copied or distributed; and (3) is not warranted to be accurate, complete or timely. Neither |
| Morningstar nor its content providers are responsible for any damages or losses arising from any use of this information. |
10
NT Mid Cap Value
Consumer Discretionary Detracted
Relative performance was hampered by the combination of an underweight position and security selection in the consumer discretionary sector. Many of these stocks, which suffered steep declines as the recession took hold, rallied on optimism about a possible economic recovery and improving consumer sentiment. The portfolio did not own any media stocks, which outperformed as advertising revenues improved. It was also slowed by an underweight position in automakers. NT Mid Cap Value did not hold shares of Ford Motor, which rose nearly 378% during the period.
In addition, the portfolio was hindered by its investments in leisure stocks. A key detractor was International Speedway Corp. During the recession, the race track operator struggled with lower attendance at NASCAR events and a decline in corporate sponsorship.
Information Technology Contributed
The portfolio’s holdings in the information technology sector added to relative results. Many of these companies are tied more closely to their own product cycles and market opportunities than to broad economic or capital markets conditions. A key contributor was Emulex Corp., a maker of storage-networking equipment. Its share price rose dramatically on news of an unsolicited takeover bid from chipmaker Broadcom Corp. The stock remained elevated as Emulex resisted the takeover, urging shareholders to reject Broadcom’s offer on the grounds that it materially undervalued the company. Ultimately, Broadcom withdrew the offer.
Utilities Enhanced Performance
Security selection in utilities—the weakest sector in the benchmark—benefited the portfolio. Because of valuations and higher-risk business models, NT Mid Cap Value did not hold any independent power producers, one of the weakest performing segments within the sector. The portfolio’s underweight in multi-utilities was also advantageous.
Outlook
We continue to follow our disciplined, bottom-up process, selecting companies one at a time for the portfolio. As of March 31, 2010, we see opportunities in consumer staples, industrials, energy, and health care stocks, reflected by overweight positions in these sectors, relative to the benchmark. Our fundamental analysis and valuation work are also directing us toward smaller relative weightings in consumer discretionary, materials, and financials stocks.
11
| |
| NT Mid Cap Value | |
| |
| Top Ten Holdings | |
| | % of net assets |
| | as of 3/31/10 |
| Imperial Oil Ltd. | 3.0% |
| Northern Trust Corp. | 2.9% |
| Aon Corp. | 2.7% |
| Kimberly-Clark Corp. | 2.6% |
| Marsh & McLennan Cos., Inc. | 2.4% |
| Republic Services, Inc. | 2.3% |
| Lowe’s Cos., Inc. | 2.1% |
| Chubb Corp. (The) | 2.0% |
| ConAgra Foods, Inc. | 1.8% |
| Wisconsin Energy Corp. | 1.8% |
| |
| Top Five Industries | |
| | % of net assets |
| | as of 3/31/10 |
| Insurance | 13.5% |
| Oil, Gas & Consumable Fuels | 8.9% |
| Food Products | 6.2% |
| Commercial Services & Supplies | 5.7% |
| Electric Utilities | 5.2% |
| |
| Types of Investments in Portfolio | |
| | % of net assets |
| | as of 3/31/10 |
| Domestic Common Stocks | 93.3% |
| Foreign Common Stocks(1) | 6.0% |
| Total Common Stocks | 99.3% |
| Temporary Cash Investments | 1.1% |
| Other Assets and Liabilities | (0.4)% |
| (1) Includes depositary shares, dual listed securities and foreign ordinary shares. | |
12
|
| Shareholder Fee Examples (Unaudited) |
Fund shareholders may incur two types of costs: (1) transaction costs, including sales charges (loads) on purchase payments and redemption/ exchange fees; and (2) ongoing costs, including management fees; distribution and service (12b-1) fees; and other fund expenses. This example is intended to help you understand your ongoing costs (in dollars) of investing in your fund and to compare these costs with the ongoing cost of investing in other mutual funds.
The example is based on an investment of $1,000 made at the beginning of the period and held for the entire period from October 1, 2009 to March 31, 2010.
Actual Expenses
The table provides information about actual account values and actual expenses for each class. You may use the information, together with the amount you invested, to estimate the expenses that you paid over the period. First, identify the share class you own. Then simply divide your account value by $1,000 (for example, an $8,600 account value divided by $1,000 = 8.6), then multiply the result by the number under the heading “Expenses Paid During Period” to estimate the expenses you paid on your account during this period.
If you hold Investor Class shares of any American Century Investments fund, or Institutional Class shares of the American Century Diversified Bond Fund, in an American Century Investments account (i.e., not a financial intermediary or retirement plan account), American Century Investments may charge you a $12.50 semiannual account maintenance fee if the value of those shares is less than $10,000. We will redeem shares automatically in one of your accounts to pay the $12.50 fee. In determining your total eligible investment amount, we will include your investments in all personal accounts (including American Century Investments Brokerage accounts) registered under your Social Security number. Personal accounts include individual accounts, joint accounts, UGMA/UTMA accounts, personal trusts, Coverdell Education Savings Accounts and IRAs (including traditional, Roth, Rollover, SEP-, SARSEP- and SIMPLE-IRAs), and certain other retirement accounts. If you have only business, business retirement, employer-sponsored or American Century Investments Brokerage accounts, you are currently not subject to this fee. We will not charge the fee as long as you choose to manage your accounts exclusively online. If you are subject to the Account Maintenance Fee, your account value could be reduced by the fee amount.
Hypothetical Example for Comparison Purposes
The table also provides information about hypothetical account values and hypothetical expenses based on the actual expense ratio of each class of your fund and an assumed rate of return of 5% per year before expenses, which is not the actual return of a fund’s share class. The hypothetical account values and expenses may not be used to estimate the actual ending account
13
balance or expenses you paid for the period. You may use this information to compare the ongoing costs of investing in your fund and other funds. To do so, compare this 5% hypothetical example with the 5% hypothetical examples that appear in the shareholder reports of the other funds.
Please note that the expenses shown in the table are meant to highlight your ongoing costs only and do not reflect any transactional costs, such as sales charges (loads) or redemption/exchange fees. Therefore, the table is useful in comparing ongoing costs only, and will not help you determine the relative total costs of owning different funds. In addition, if these transactional costs were included, your costs would have been higher.
| | | | |
| | Beginning | Ending | Expenses Paid | |
| | Account Value | Account Value | During Period* | Annualized |
| | 10/1/09 | 3/31/10 | 10/1/09 - 3/31/10 | Expense Ratio* |
| NT Large Company Value — Institutional Class | | |
| Actual | $1,000 | $1,088.70 | $3.33 | 0.64% |
| Hypothetical | $1,000 | $1,021.74 | $3.23 | 0.64% |
| NT Mid Cap Value — Institutional Class | | | |
| Actual | $1,000 | $1,145.80 | $4.28 | 0.80% |
| Hypothetical | $1,000 | $1,020.94 | $4.03 | 0.80% |
| *Expenses are equal to the class’s annualized expense ratio listed in the table above, multiplied by the average account value over the period, |
| multiplied by 182, the number of days in the most recent fiscal half-year, divided by 365, to reflect the one-half year period. |
14
| | | | | | |
| NT Large Company Value | | | | |
| |
| MARCH 31, 2010 | | | | | | |
| | Shares | Value | | | Shares | Value |
| Common Stocks — 95.4% | | | DIVERSIFIED — 0.9% | | |
| AEROSPACE & DEFENSE — 2.6% | | | SPDR S&P 500 ETF Trust | 23,300 | $ 2,725,867 |
| Honeywell International, Inc. | 60,800 | $ 2,752,416 | | DIVERSIFIED CONSUMER SERVICES — 0.4% | |
| Lockheed Martin Corp. | 19,900 | 1,656,078 | | H&R Block, Inc. | 63,200 | 1,124,960 |
| Northrop Grumman Corp. | 52,500 | 3,442,425 | | DIVERSIFIED FINANCIAL SERVICES — 7.6% | |
| | | 7,850,919 | | Bank of America Corp. | 589,100 | 10,515,435 |
| | | | | Citigroup, Inc.(1) | 400,900 | 1,623,645 |
| BEVERAGES — 1.3% | | | | | | |
| Coca-Cola Co. (The) | 72,600 | 3,993,000 | | JPMorgan Chase & Co. | 254,800 | 11,402,300 |
| BIOTECHNOLOGY — 0.8% | | | | | | 23,541,380 |
| Amgen, Inc.(1) | 28,400 | 1,697,184 | | DIVERSIFIED TELECOMMUNICATION | |
| | | | | SERVICES — 5.9% | | |
| Gilead Sciences, Inc.(1) | 15,700 | 714,036 | | | | |
| | | | | AT&T, Inc. | 403,000 | 10,413,520 |
| | | 2,411,220 | | CenturyTel, Inc. | 32,500 | 1,152,450 |
| CAPITAL MARKETS — 3.9% | | | | Verizon | | |
| Ameriprise Financial, Inc. | 42,700 | 1,936,872 | | Communications, Inc. | 212,600 | 6,594,852 |
| Bank of New York | | | | | | 18,160,822 |
| Mellon Corp. (The) | 88,200 | 2,723,616 | | ELECTRIC UTILITIES — 2.1% | | |
| Goldman Sachs | | | | Exelon Corp. | 82,700 | 3,623,087 |
| Group, Inc. (The) | 29,400 | 5,016,522 | | | | |
| Morgan Stanley | 80,900 | 2,369,561 | | PPL Corp. | 103,900 | 2,879,069 |
| | | 12,046,571 | | | | 6,502,156 |
| CHEMICALS — 2.0% | | | | ENERGY EQUIPMENT & SERVICES — 1.9% | |
| E.I. du Pont de Nemours | | | | Baker Hughes, Inc. | 29,500 | 1,381,780 |
| & Co. | 99,300 | 3,697,932 | | Diamond Offshore | | |
| PPG Industries, Inc. | 39,600 | 2,589,840 | | Drilling, Inc. | 8,700 | 772,647 |
| | | 6,287,772 | | National Oilwell Varco, Inc. | 56,100 | 2,276,538 |
| | | | | Transocean Ltd.(1) | 14,900 | 1,287,062 |
| COMMERCIAL BANKS — 4.2% | | | | | | |
| PNC Financial Services | | | | | | 5,718,027 |
| Group, Inc. | 39,000 | 2,328,300 | | FOOD & STAPLES RETAILING — 3.2% | |
| U.S. Bancorp. | 156,200 | 4,042,456 | | Kroger Co. (The) | 88,300 | 1,912,578 |
| Wells Fargo & Co. | 207,100 | 6,444,952 | | SYSCO Corp. | 59,400 | 1,752,300 |
| | | 12,815,708 | | Walgreen Co. | 75,600 | 2,804,004 |
| COMMERCIAL SERVICES & SUPPLIES — 1.6% | | Wal-Mart Stores, Inc. | 60,400 | 3,358,240 |
| Avery Dennison Corp. | 29,600 | 1,077,736 | | | | 9,827,122 |
| Pitney Bowes, Inc. | 47,700 | 1,166,265 | | FOOD PRODUCTS — 1.2% | | |
| R.R. Donnelley & Sons Co. | 63,000 | 1,345,050 | | Kraft Foods, Inc., Class A | 76,800 | 2,322,432 |
| Waste Management, Inc. | 42,900 | 1,477,047 | | Unilever NV | | |
| | | 5,066,098 | | New York Shares | 48,600 | 1,465,776 |
| COMMUNICATIONS EQUIPMENT — 0.7% | | | | | 3,788,208 |
| Cisco Systems, Inc.(1) | 86,600 | 2,254,198 | | HEALTH CARE EQUIPMENT & SUPPLIES — 0.4% |
| COMPUTERS & PERIPHERALS — 1.1% | | | Medtronic, Inc. | 27,300 | 1,229,319 |
| Hewlett-Packard Co. | 65,500 | 3,481,325 | | HEALTH CARE PROVIDERS & SERVICES — 1.5% |
| CONSTRUCTION & ENGINEERING — 0.3% | | | Aetna, Inc. | 45,300 | 1,590,483 |
| | | | | Quest Diagnostics, Inc. | 15,800 | 920,982 |
| Shaw Group, Inc. (The)(1) | 24,400 | 839,848 | | | | |
| | | | | WellPoint, Inc.(1) | 30,500 | 1,963,590 |
| | | | | | | 4,475,055 |
15
| | | | | | |
| NT Large Company Value | | | | |
| |
| | Shares | Value | | | Shares | Value |
| HOTELS, RESTAURANTS & LEISURE — 0.5% | | | MULTILINE RETAIL — 0.9% | | |
| Darden Restaurants, Inc. | 17,300 | $ 770,542 | | Kohl’s Corp.(1) | 28,600 | $ 1,566,708 |
| Starbucks Corp.(1) | 31,500 | 764,505 | | Macy’s, Inc. | 53,800 | 1,171,226 |
| | | 1,535,047 | | | | 2,737,934 |
| HOUSEHOLD DURABLES — 0.6% | | | MULTI-UTILITIES — 0.7% | | |
| Newell Rubbermaid, Inc. | 112,800 | 1,714,560 | | PG&E Corp. | 50,100 | 2,125,242 |
| HOUSEHOLD PRODUCTS — 0.5% | | | OFFICE ELECTRONICS — 0.4% | | |
| Clorox Co. | 25,400 | 1,629,156 | | Xerox Corp. | 111,500 | 1,087,125 |
| INDEPENDENT POWER PRODUCERS | | | OIL, GAS & CONSUMABLE FUELS — 15.4% | |
| & ENERGY TRADERS — 0.2% | | | | Apache Corp. | 33,100 | 3,359,650 |
| NRG Energy, Inc.(1) | 34,900 | 729,410 | | Chevron Corp. | 137,400 | 10,419,042 |
| INDUSTRIAL CONGLOMERATES — 4.3% | | | ConocoPhillips | 155,900 | 7,977,403 |
| General Electric Co. | 646,300 | 11,762,660 | | Devon Energy Corp. | 26,800 | 1,726,724 |
| Tyco International Ltd. | 42,100 | 1,610,325 | | Exxon Mobil Corp. | 218,400 | 14,628,432 |
| | | 13,372,985 | | Occidental Petroleum Corp. | 42,000 | 3,550,680 |
| INSURANCE — 4.6% | | | | Royal Dutch Shell plc, | | |
| Allstate Corp. (The) | 77,100 | 2,491,101 | | Class A ADR | 83,700 | 4,842,882 |
| Chubb Corp. (The) | 49,800 | 2,582,130 | | Valero Energy Corp. | 46,100 | 908,170 |
| Loews Corp. | 41,900 | 1,562,032 | | | | 47,412,983 |
| Principal Financial | | | | PAPER & FOREST PRODUCTS — 0.4% | |
| Group, Inc. | 56,700 | 1,656,207 | | International Paper Co. | 53,100 | 1,306,791 |
| Torchmark Corp. | 33,400 | 1,787,234 | | PHARMACEUTICALS — 8.6% | | |
| Travelers Cos., Inc. (The) | 60,600 | 3,268,764 | | Abbott Laboratories | 50,500 | 2,660,340 |
| XL Capital Ltd., Class A | 50,400 | 952,560 | | Eli Lilly & Co. | 48,800 | 1,767,536 |
| | | 14,300,028 | | Johnson & Johnson | 85,300 | 5,561,560 |
| IT SERVICES — 1.5% | | | | Merck & Co., Inc. | 161,100 | 6,017,085 |
| Fiserv, Inc.(1) | 22,900 | 1,162,404 | | Pfizer, Inc. | 612,300 | 10,500,945 |
| International Business | | | | | | 26,507,466 |
| Machines Corp. | 26,400 | 3,385,800 | | REAL ESTATE INVESTMENT TRUSTS (REITs) — 0.5% |
| | | 4,548,204 | | Simon Property Group, Inc. | 19,500 | 1,636,050 |
| MACHINERY — 1.3% | | | | SEMICONDUCTORS | | |
| Dover Corp. | 35,300 | 1,650,275 | | & SEMICONDUCTOR EQUIPMENT — 1.1% | |
| Ingersoll-Rand plc | 68,200 | 2,378,134 | | Applied Materials, Inc. | 75,200 | 1,013,696 |
| | | 4,028,409 | | Intel Corp. | 110,200 | 2,453,052 |
| MEDIA — 4.4% | | | | | | 3,466,748 |
| CBS Corp., Class B | 132,300 | 1,844,262 | | SOFTWARE — 2.3% | | |
| Comcast Corp., Class A | 180,500 | 3,397,010 | | Activision Blizzard, Inc. | 82,700 | 997,362 |
| Time Warner Cable, Inc. | 36,700 | 1,956,477 | | Microsoft Corp. | 116,000 | 3,395,320 |
| Time Warner, Inc. | 113,800 | 3,558,526 | | Oracle Corp. | 102,300 | 2,628,087 |
| Viacom, Inc., Class B(1) | 78,200 | 2,688,516 | | | | 7,020,769 |
| | | 13,444,791 | | SPECIALTY RETAIL — 2.3% | | |
| METALS & MINING — 0.8% | | | | Best Buy Co., Inc. | 28,900 | 1,229,406 |
| Freeport-McMoRan Copper | | | | Gap, Inc. (The) | 45,200 | 1,044,572 |
| & Gold, Inc. | 2,700 | 225,558 | | Home Depot, Inc. (The) | 108,500 | 3,509,975 |
| Nucor Corp. | 50,200 | 2,278,076 | | Staples, Inc. | 55,100 | 1,288,789 |
| | | 2,503,634 | | | | 7,072,742 |
16
| | | | | | |
| NT Large Company Value | | | | |
| |
| | Shares | Value | | | Shares | Value |
| TEXTILES, APPAREL & LUXURY GOODS — 0.5% | | Temporary Cash Investments — 0.5% |
| VF Corp. | 18,300 | $ 1,466,745 | | | | |
| | | | | JPMorgan U.S. Treasury | | |
| TOTAL COMMON STOCKS | | | | Plus Money Market Fund | | |
| (Cost $257,265,613) | | 293,786,394 | | Agency Shares | 50,971 | $ 50,971 |
| |
| Temporary Cash Investments — | | | Repurchase Agreement, Bank of America | |
| | | | | Securities, LLC, (collateralized by various | |
| Segregated For Futures Contracts — 4.0% | | U.S. Treasury obligations, 3.125%, 1/31/17, | |
| Repurchase Agreement, Bank of America | | | valued at $1,482,330), in a joint trading | |
| Securities, LLC, (collateralized by various | | | account at 0.01%, dated 3/31/10, due | |
| U.S. Treasury obligations, 3.125%, 1/31/17, | | | 4/1/10 (Delivery value $1,448,000) | 1,448,000 |
| valued at $12,644,851), in a joint trading | | | TOTAL TEMPORARY | | |
| account at 0.01%, dated 3/31/10, due | | | CASH INVESTMENTS | | |
| 4/1/10 (Delivery value $12,352,003) | | | (Cost $1,498,971) | | 1,498,971 |
| (Cost $12,352,000) | | $ 12,352,000 | | TOTAL INVESTMENT | | |
| | | | | SECURITIES — 99.9% | | |
| | | | | (Cost $271,116,584) | | 307,637,365 |
| | | | | OTHER ASSETS | | |
| | | | | AND LIABILITIES — 0.1% | | 397,170 |
| | | | | TOTAL NET ASSETS — 100.0% | | $308,034,535 |
| | | |
| Futures Contracts | | | |
| | | Underlying Face | |
| Contracts Purchased | Expiration Date | Amount at Value | Unrealized Gain (Loss) |
| 212 S&P 500 E-Mini Futures | June 2010 | $12,351,120 | $292,734 |
| |
| Notes to Schedule of Investments | | |
| ADR = American Depositary Receipt | | | |
| ETF = Exchange Traded Fund | | | |
| SPDR = Standard & Poor’s Depositary Receipt | | | |
| (1) Non-income producing. | | | |
| |
| Industry classifications are unaudited. | | | |
| |
| |
| See Notes to Financial Statements. | | | |
17
| | | | | | |
| NT Mid Cap Value | | | | | |
| |
| MARCH 31, 2010 | | | | | | |
| | Shares | Value | | | Shares | Value |
| Common Stocks — 99.3% | | | Consolidated | | |
| | | | | Communications | | |
| AEROSPACE & DEFENSE — 0.7% | | | Holdings, Inc. | 21,100 | $ 400,056 |
| Northrop Grumman Corp. | 13,900 | $ 911,423 | | Iowa Telecommunications | | |
| BEVERAGES — 0.6% | | | | Services, Inc. | 30,237 | 504,958 |
| Coca-Cola Enterprises, Inc. | 28,100 | 777,246 | | | | 3,508,566 |
| CAPITAL MARKETS — 4.6% | | | | ELECTRIC UTILITIES — 5.2% | | |
| AllianceBernstein Holding LP | 8,000 | 245,280 | | American Electric Power | | |
| Ameriprise Financial, Inc. | 10,483 | 475,509 | | Co., Inc. | 20,091 | 686,711 |
| Invesco Ltd. | 32,400 | 709,884 | | Great Plains Energy, Inc. | 29,582 | 549,338 |
| Northern Trust Corp. | 72,589 | 4,011,268 | | IDACORP, Inc. | 35,179 | 1,217,897 |
| State Street Corp. | 19,800 | 893,772 | | Northeast Utilities | 50,230 | 1,388,357 |
| | | 6,335,713 | | Portland General Electric Co. | 64,271 | 1,241,073 |
| CHEMICALS — 0.8% | | | | Westar Energy, Inc. | 92,331 | 2,058,981 |
| Minerals Technologies, Inc. | 19,970 | 1,035,245 | | | | 7,142,357 |
| COMMERCIAL BANKS — 2.2% | | | | ELECTRICAL EQUIPMENT — 2.0% | |
| City National Corp. | 7,000 | 377,790 | | Emerson Electric Co. | 15,300 | 770,202 |
| Comerica, Inc. | 43,807 | 1,666,418 | | Hubbell, Inc., Class B | 26,296 | 1,326,107 |
| Commerce Bancshares, Inc. | 24,306 | 999,949 | | Rockwell Automation, Inc. | 6,900 | 388,884 |
| | | 3,044,157 | | Woodward Governor Co. | 6,850 | 219,063 |
| COMMERCIAL SERVICES & SUPPLIES — 5.7% | | | | 2,704,256 |
| Cintas Corp. | 29,100 | 817,419 | | ELECTRONIC EQUIPMENT, INSTRUMENTS | |
| | | | | & COMPONENTS — 1.0% | | |
| IESI-BFC Ltd. | 2,210 | 37,902 | | | | |
| | | | | Molex, Inc. | 67,958 | 1,417,604 |
| Pitney Bowes, Inc. | 74,800 | 1,828,860 | | | | |
| | | | | ENERGY EQUIPMENT & SERVICES — 0.9% | |
| Republic Services, Inc. | 107,098 | 3,107,984 | | | | |
| | | | | Baker Hughes, Inc. | 18,500 | 866,540 |
| Waste Management, Inc. | 61,396 | 2,113,864 | | | | |
| | | | | Smith International, Inc. | 8,500 | 363,970 |
| | | 7,906,029 | | | | |
| | | | | | | 1,230,510 |
| COMMUNICATIONS EQUIPMENT — 0.6% | | | | | |
| | | | | FOOD PRODUCTS — 6.2% | | |
| Emulex Corp.(1) | 66,800 | 887,104 | | | | |
| | | | | Campbell Soup Co. | 49,200 | 1,739,220 |
| COMPUTERS & PERIPHERALS — 0.7% | | | ConAgra Foods, Inc. | 99,207 | 2,487,119 |
| Diebold, Inc. | 29,914 | 950,069 | | H.J. Heinz Co. | 50,500 | 2,303,305 |
| CONSTRUCTION MATERIALS — 0.8% | | | Hershey Co. (The) | 14,400 | 616,464 |
| Vulcan Materials Co. | 22,900 | 1,081,796 | | Kraft Foods, Inc., Class A | 47,100 | 1,424,304 |
| CONTAINERS & PACKAGING — 1.9% | | | | | 8,570,412 |
| Bemis Co., Inc. | 60,111 | 1,726,388 | | GAS UTILITIES — 0.9% | | |
| Sonoco Products Co. | 28,500 | 877,515 | | Southwest Gas Corp. | 39,520 | 1,182,438 |
| | | 2,603,903 | | HEALTH CARE EQUIPMENT & SUPPLIES — 3.1% |
| DISTRIBUTORS — 1.1% | | | | Beckman Coulter, Inc. | 22,455 | 1,410,174 |
| Genuine Parts Co. | 37,356 | 1,577,917 | | | | |
| | | | | Boston Scientific Corp.(1) | 97,800 | 706,116 |
| DIVERSIFIED — 1.5% | | | | | | |
| | | | | CareFusion Corp.(1) | 10,150 | 268,265 |
| iShares Russell Midcap | | | | | | |
| Value Index Fund | 50,900 | 2,052,797 | | Symmetry Medical, Inc.(1) | 81,007 | 813,310 |
| DIVERSIFIED TELECOMMUNICATION | | | Zimmer Holdings, Inc.(1) | 17,600 | 1,041,920 |
| SERVICES — 2.5% | | | | | | 4,239,785 |
| BCE, Inc. | 17,425 | 512,121 | | | | |
| CenturyTel, Inc. | 58,980 | 2,091,431 | | | | |
18
| | | | | | |
| NT Mid Cap Value | | | | | |
| |
| | Shares | Value | | | Shares | Value |
| HEALTH CARE PROVIDERS & SERVICES — 1.9% | | MACHINERY — 3.2% | | |
| Cardinal Health, Inc. | 5,700 | $ 205,371 | | Altra Holdings, Inc.(1) | 101,462 | $ 1,393,073 |
| LifePoint Hospitals, Inc.(1) | 35,000 | 1,287,300 | | Dover Corp. | 9,000 | 420,750 |
| Patterson Cos., Inc. | 12,800 | 397,440 | | Kaydon Corp. | 60,032 | 2,257,203 |
| Select Medical | | | | Robbins & Myers, Inc. | 14,900 | 354,918 |
| Holdings Corp.(1) | 91,819 | 774,952 | | | | 4,425,944 |
| | | 2,665,063 | | METALS & MINING — 0.9% | | |
| HOTELS, RESTAURANTS & LEISURE — 3.2% | | | Newmont Mining Corp. | 24,078 | 1,226,293 |
| CEC Entertainment, Inc.(1) | 35,800 | 1,363,622 | | MULTILINE RETAIL — 0.8% | | |
| Hyatt Hotels Corp., Class A(1) | 14,111 | 549,765 | | Target Corp. | 19,700 | 1,036,220 |
| International Speedway | | | | MULTI-UTILITIES — 3.9% | | |
| Corp., Class A | 53,315 | 1,373,927 | | PG&E Corp. | 44,100 | 1,870,722 |
| Speedway Motorsports, Inc. | 67,439 | 1,052,723 | | Wisconsin Energy Corp. | 48,860 | 2,414,173 |
| | | 4,340,037 | | Xcel Energy, Inc. | 50,097 | 1,062,056 |
| HOUSEHOLD DURABLES — 1.4% | | | | | 5,346,951 |
| Fortune Brands, Inc. | 31,200 | 1,513,512 | | OIL, GAS & CONSUMABLE FUELS — 8.9% | |
| Toll Brothers, Inc.(1) | 20,100 | 418,080 | | Apache Corp. | 3,248 | 329,672 |
| | | 1,931,592 | | Devon Energy Corp. | 16,100 | 1,037,323 |
| HOUSEHOLD PRODUCTS — 2.8% | | | EQT Corp. | 53,500 | 2,193,500 |
| Clorox Co. | 5,400 | 346,356 | | Imperial Oil Ltd. | 106,100 | 4,098,167 |
| Kimberly-Clark Corp. | 56,295 | 3,539,830 | | Inergy LP | 7,357 | 278,094 |
| | | 3,886,186 | | Murphy Oil Corp. | 28,600 | 1,607,034 |
| INDUSTRIAL CONGLOMERATES — 0.7% | | | Noble Energy, Inc. | 13,800 | 1,007,400 |
| Tyco International Ltd. | 23,500 | 898,875 | | Ultra Petroleum Corp.(1) | 13,400 | 624,842 |
| INSURANCE — 13.5% | | | | Williams Pipeline | | |
| ACE Ltd. | 39,000 | 2,039,700 | | Partners LP | 12,800 | 387,200 |
| Allstate Corp. (The) | 42,100 | 1,360,251 | | XTO Energy, Inc. | 14,900 | 702,982 |
| Aon Corp. | 87,900 | 3,754,209 | | | | 12,266,214 |
| Chubb Corp. (The) | 52,600 | 2,727,310 | | PAPER & FOREST PRODUCTS — 0.8% | |
| Hartford Financial Services | | | | MeadWestvaco Corp. | 14,000 | 357,700 |
| Group, Inc. (The) | 17,155 | 487,545 | | Weyerhaeuser Co. | 16,106 | 729,119 |
| HCC Insurance | | | | | | 1,086,819 |
| Holdings, Inc. | 49,491 | 1,365,952 | | | | |
| Marsh & McLennan | | | | REAL ESTATE INVESTMENT TRUSTS (REITs) — 3.9% |
| Cos., Inc. | 136,054 | 3,322,439 | | Annaly Capital | | |
| | | | | Management, Inc. | 53,800 | 924,284 |
| Primerica, Inc.(1) | 6,038 | 90,570 | | | | |
| | | | | Boston Properties, Inc. | 9,758 | 736,143 |
| Symetra Financial Corp.(1) | 49,279 | 649,497 | | | | |
| | | | | Government Properties | | |
| Transatlantic Holdings, Inc. | 26,175 | 1,382,040 | | Income Trust | 40,483 | 1,052,963 |
| Travelers Cos., Inc. (The) | 27,000 | 1,456,380 | | HCP, Inc. | 10,100 | 333,300 |
| | | 18,635,893 | | Host Hotels & Resorts, Inc. | 89,286 | 1,308,040 |
| IT SERVICES — 0.6% | | | | Piedmont Office Realty | | |
| Automatic Data | | | | Trust, Inc., Class A | 53,975 | 1,071,404 |
| Processing, Inc. | 19,600 | 871,612 | | | | 5,426,134 |
| LEISURE EQUIPMENT & PRODUCTS — 0.3% | | | ROAD & RAIL — 0.3% | | |
| Mattel, Inc. | 21,000 | 477,540 | | Heartland Express, Inc. | 20,900 | 344,850 |
19
| | | | | | |
| NT Mid Cap Value | | | | | |
| |
| | Shares | Value | | | Shares | Value |
| SEMICONDUCTORS | | | | | | |
| & SEMICONDUCTOR EQUIPMENT — 2.8% | | | Temporary Cash Investments — 1.1% |
| Applied Materials, Inc. | 152,600 | $ 2,057,048 | | JPMorgan U.S. Treasury | | |
| | | | | Plus Money Market Fund | | |
| KLA-Tencor Corp. | 35,800 | 1,106,936 | | Agency Shares | 67,126 | $ 67,126 |
| Verigy Ltd.(1) | 64,800 | 724,464 | | Repurchase Agreement, Bank of America | |
| | | 3,888,448 | | Securities, LLC, (collateralized by various | |
| SOFTWARE — 1.2% | | | | U.S. Treasury obligations, 3.125%, 1/31/17, | |
| Cadence Design | | | | valued at $1,535,563), in a joint trading | |
| Systems, Inc.(1) | 137,200 | 913,752 | | account at 0.01%, dated 3/31/10, due | |
| | | | | 4/1/10 (Delivery value $1,500,000) | 1,500,000 |
| SS&C Technologies | | | | | | |
| Holdings, Inc.(1) | 5,075 | 76,531 | | TOTAL TEMPORARY | | |
| | | | | CASH INVESTMENTS | | |
| Synopsys, Inc.(1) | 30,000 | 671,100 | | (Cost $1,567,126) | | 1,567,126 |
| | | 1,661,383 | | TOTAL INVESTMENT | | |
| SPECIALTY RETAIL — 3.1% | | | | SECURITIES — 100.4% | | |
| Lowe’s Cos., Inc. | 119,800 | 2,903,952 | | (Cost $117,486,487) | | 138,276,453 |
| PetSmart, Inc. | 40,900 | 1,307,164 | | OTHER ASSETS | | |
| | | | | AND LIABILITIES — (0.4)% | | (547,230) |
| | | 4,211,116 | | | | |
| | | | | TOTAL NET ASSETS — 100.0% | | $137,729,223 |
| THRIFTS & MORTGAGE FINANCE — 2.1% | | | | | |
| Hudson City Bancorp., Inc. | 75,800 | 1,073,328 | | | | |
| Northwest Bancshares, Inc. | 54,116 | 635,322 | | | | |
| People’s United | | | | | | |
| Financial, Inc. | 77,633 | 1,214,180 | | | | |
| | | 2,922,830 | | | | |
| TOTAL COMMON STOCKS | | | | | | |
| (Cost $115,919,361) | | 136,709,327 | | | | |
| | | |
| Forward Foreign Currency Exchange Contracts | | |
| Contracts to Sell | Settlement Date | Value | Unrealized Gain (Loss) |
| 3,944,063 CAD for USD | 4/30/10 | $3,883,289 | $(9,459) |
| (Value on Settlement Date $3,873,830) | | | |
| |
| Notes to Schedule of Investments | | |
| CAD = Canadian Dollar | | | |
| USD = United States Dollar | | | |
| (1) Non-income producing. | | | |
| |
| Industry classifications are unaudited. | | | |
| |
| |
| See Notes to Financial Statements. | | | |
20
|
| Statement of Assets and Liabilities |
| | |
| MARCH 31, 2010 | | |
| | NT Large | |
| | Company Value | NT Mid Cap Value |
| Assets | | |
| Investment securities, at value (cost of $271,116,584 and $117,486,487, respectively) | $307,637,365 | $138,276,453 |
| Deposits at broker for futures contracts | 954,000 | — |
| Receivable for investments sold | — | 4,275,289 |
| Receivable for capital shares sold | 500,756 | 41,667 |
| Dividends and interest receivable | 399,646 | 370,524 |
| | 309,491,767 | 142,963,933 |
| | | |
| Liabilities | | |
| Payable for investments purchased | 1,215,811 | 5,049,353 |
| Payable for variation margin on futures contracts | 44,520 | — |
| Payable for forward foreign currency exchange contracts | — | 9,459 |
| Payable for capital shares redeemed | 34,072 | 85,172 |
| Accrued management fees | 162,829 | 90,726 |
| | 1,457,232 | 5,234,710 |
| | | |
| Net Assets | $308,034,535 | $137,729,223 |
| | | |
| Institutional Class Capital Shares, $0.01 Par Value | | |
| Authorized | 110,000,000 | 50,000,000 |
| Shares outstanding | 38,394,564 | 14,154,776 |
| | | |
| Net Asset Value Per Share | $8.02 | $9.73 |
| | | |
| Net Assets Consist of: | | |
| Capital (par value and paid-in surplus) | $304,576,679 | $121,084,915 |
| Undistributed net investment income | 1,861 | 227,494 |
| Accumulated net realized loss on investment and foreign currency transactions | (33,357,520) | (4,364,188) |
| Net unrealized appreciation on investments and translation of assets | | |
| and liabilities in foreign currencies | 36,813,515 | 20,781,002 |
| | $308,034,535 | $137,729,223 |
| |
| |
| See Notes to Financial Statements. | | |
21
| | |
| YEAR ENDED MARCH 31, 2010 | | |
| | NT Large | |
| | Company Value | NT Mid Cap Value |
| Investment Income (Loss) | | |
| Income: | | |
| Dividends (net of foreign taxes withheld of $12 and $18,616, respectively) | $ 5,941,545 | $ 2,827,137 |
| Interest | 8,079 | 1,295 |
| | 5,949,624 | 2,828,432 |
| Expenses: | | |
| Management fees | 1,447,723 | 811,493 |
| Directors’ fees and expenses | 7,939 | 3,582 |
| Other expenses | 100 | — |
| | 1,455,762 | 815,075 |
| | | |
| Net investment income (loss) | 4,493,862 | 2,013,357 |
| | | |
| Realized and Unrealized Gain (Loss) | | |
| Net realized gain (loss) on: | | |
| Investment transactions | (9,570,439) | 14,536,500 |
| Futures contract transactions | 3,536,931 | — |
| Foreign currency transactions | — | (276,607) |
| | (6,033,508) | 14,259,893 |
| | | |
| Change in net unrealized appreciation (depreciation) on: | | |
| Investments | 81,406,915 | 27,114,092 |
| Futures contracts | (539,570) | — |
| Translation of assets and liabilities in foreign currencies | — | (16,452) |
| | 80,867,345 | 27,097,640 |
| | | |
| Net realized and unrealized gain (loss) | 74,833,837 | 41,357,533 |
| | | |
| Net Increase (Decrease) in Net Assets Resulting from Operations | $79,327,699 | $43,370,890 |
| |
| |
| See Notes to Financial Statements. | | |
22
|
| Statement of Changes in Net Assets |
| | | | |
| YEARS ENDED MARCH 31, 2010 AND MARCH 31, 2009 | | | |
| | NT Large Company Value | NT Mid Cap Value |
| Increase (Decrease) in Net Assets | 2010 | 2009 | 2010 | 2009 |
| Operations | | | | |
| Net investment income (loss) | $ 4,493,862 | $ 3,106,006 | $ 2,013,357 | $ 1,194,891 |
| Net realized gain (loss) | (6,033,508) | (26,691,514) | 14,259,893 | (14,383,457) |
| Change in net unrealized | | | | |
| appreciation (depreciation) | 80,867,345 | (37,743,680) | 27,097,640 | (5,340,494) |
| Net increase (decrease) in net assets | | | | |
| resulting from operations | 79,327,699 | (61,329,188) | 43,370,890 | (18,529,060) |
| | | | | |
| Distributions to Shareholders | | | | |
| From net investment income | (4,435,883) | (3,130,233) | (1,746,754) | (1,139,180) |
| | | | | |
| Capital Share Transactions | | | | |
| Proceeds from shares sold | 107,194,743 | 136,728,186 | 41,468,311 | 52,591,992 |
| Payments for shares redeemed | (26,729,647) | (18,208,706) | (13,295,819) | (10,823,097) |
| Net increase (decrease) in net assets | | | | |
| from capital share transactions | 80,465,096 | 118,519,480 | 28,172,492 | 41,768,895 |
| | | | | |
| Net increase (decrease) in net assets | 155,356,912 | 54,060,059 | 69,796,628 | 22,100,655 |
| | | | | |
| Net Assets | | | | |
| Beginning of period | 152,677,623 | 98,617,564 | 67,932,595 | 45,831,940 |
| End of period | $308,034,535 | $152,677,623 | $137,729,223 | $ 67,932,595 |
| | | | | |
| Undistributed net investment income | $1,861 | — | $227,494 | $42,289 |
| | | | | |
| Transactions in Shares of the Fund | | | | |
| Sold | 14,774,606 | 20,224,219 | 4,969,831 | 7,235,875 |
| Redeemed | (3,882,445) | (2,883,043) | (1,675,866) | (1,447,737) |
| Net increase (decrease) in shares | | | | |
| of the fund | 10,892,161 | 17,341,176 | 3,293,965 | 5,788,138 |
| |
| |
| See Notes to Financial Statements. | | | | |
23
|
| Notes to Financial Statements |
MARCH 31, 2010
1. Organization and Summary of Significant Accounting Policies
Organization — American Century Capital Portfolios, Inc. (the corporation) is registered under the Investment Company Act of 1940 (the 1940 Act) as an open-end management investment company. NT Large Company Value Fund (NT Large Company Value) and NT Mid Cap Value Fund (NT Mid Cap Value) (collectively, the funds) are two funds in a series issued by the corporation. The funds are diversified under the 1940 Act. The funds’ investment objective is to seek long-term capital growth. Income is a secondary objective. The funds pursue their investment objective by investing in stocks of companies that management believes to be undervalued at the time of purchase. NT Large Company Value invests primarily in companies with larger market capitalization. NT Mid Cap Value invests in mid-sized market capitalization companies. The fund s are not permitted to invest in any securities issued by companies assigned the Global Industry Classification Standard for the tobacco industry. The following is a summary of the funds’ significant accounting policies.
Security Valuations — Securities traded primarily on a principal securities exchange are valued at the last reported sales price, or at the mean of the latest bid and asked prices where no last sales price is available. Depending on local convention or regulation, securities traded over-the-counter are valued at the mean of the latest bid and asked prices, the last sales price, or the official close price. Investments in open-end management investment companies are valued at the reported net asset value. Debt securities not traded on a principal securities exchange are valued through a commercial pricing service or at the mean of the most recent bid and asked prices. Discount notes may be valued through a commercial pricing service or at amortized cost, which approximates fair value. Securities traded on foreign securities ex changes and over-the-counter markets are normally completed before the close of business on days that the New York Stock Exchange (the Exchange) is open and may also take place on days when the Exchange is not open. If an event occurs after the value of a security was established but before the net asset value per share was determined that was likely to materially change the net asset value, that security would be valued as determined in accordance with procedures adopted by the Board of Directors. If the funds determine that the market price of a portfolio security is not readily available, or that the valuation methods mentioned above do not reflect the security’s fair value, such security is valued as determined by the Board of Directors or its designee, in accordance with procedures adopted by the Board of Directors, if such determination would materially impact a fund’s net asset value. Certain other circumstances may cause the funds to use alternative procedures to value a security such as: a security has been declared in default; trading in a security has been halted during the trading day; or there is a foreign market holiday and no trading will commence.
Security Transactions — For financial reporting purposes, security transactions are accounted for as of the trade date. Net realized gains and losses are determined on the identified cost basis, which is also used for federal income tax purposes.
Investment Income — Dividend income less foreign taxes withheld, if any, is recorded as of the ex-dividend date. Interest income is recorded on the accrual basis and includes accretion of discounts and amortization of premiums.
Exchange Traded Funds — The funds may invest in exchange traded funds (ETFs). ETFs are a type of index fund bought and sold on a securities exchange. An ETF trades like common stock and represents a fixed portfolio of securities designed to track the performance and dividend yield of a particular domestic or foreign market index. A fund may purchase an ETF to temporarily gain exposure to a portion of the U.S. or a foreign market while awaiting purchase of underlying securities. The risks of owning an ETF generally reflect the risks of owning the underlying securities they are designed to track, although the lack of liquidity on an ETF could result in it being more volatile. Additionally, ETFs have fees and expenses that reduce their value.
24
Foreign Currency Translations — All assets and liabilities initially expressed in foreign currencies are translated into U.S. dollars at prevailing exchange rates at period end. The funds may enter into spot foreign currency exchange contracts to facilitate transactions denominated in a foreign currency. Purchases and sales of investment securities, dividend and interest income, spot foreign currency exchange contracts, and certain expenses are translated at the rates of exchange prevailing on the respective dates of such transactions. For assets and liabilities, other than investments in securities, net realized and unrealized gains and losses from foreign currency translations arise from changes in currency exchange rates.
Net realized and unrealized foreign currency exchange gains or losses occurring during the holding period of investment securities are a component of net realized gain (loss) on investment transactions and net unrealized appreciation (depreciation) on investments, respectively. Certain countries may impose taxes on the contract amount of purchases and sales of foreign currency contracts in their currency. The funds record the foreign tax expense, if any, as a reduction to the net realized gain (loss) on foreign currency transactions.
Repurchase Agreements — The funds may enter into repurchase agreements with institutions that American Century Investment Management, Inc. (ACIM) (the investment advisor) has determined are creditworthy pursuant to criteria adopted by the Board of Directors. Each repurchase agreement is recorded at cost. Each fund requires that the collateral, represented by securities, received in a repurchase transaction be transferred to the custodian in a manner sufficient to enable each fund to obtain those securities in the event of a default under the repurchase agreement. ACIM monitors, on a daily basis, the securities transferred to ensure the value, including accrued interest, of the securities under each repurchase agreement is equal to or greater than amounts owed to each fund under each repurchase agreement.
Joint Trading Account — Pursuant to an Exemptive Order issued by the Securities and Exchange Commission, each fund, along with certain other funds in the American Century Investments family of funds, may transfer uninvested cash balances into a joint trading account. These balances are invested in one or more repurchase agreements that are collateralized by U.S. Treasury or Agency obligations.
Income Tax Status — It is each fund’s policy to distribute substantially all net investment income and net realized gains to shareholders and to otherwise qualify as a regulated investment company under provisions of the Internal Revenue Code. All tax years for the funds remain subject to examination by tax authorities. At this time, management believes there are no uncertain tax positions which, based on their technical merit, would not be sustained upon examination and for which it is reasonably possible that the total amounts of unrecognized tax benefits will significantly change in the next twelve months. Accordingly, no provision has been made for federal or state income taxes.
Distributions to Shareholders — Distributions to shareholders are recorded on the ex-dividend date. Distributions from net investment income are declared and paid quarterly. Distributions from net realized gains, if any, are generally declared and paid annually.
Indemnifications — Under the corporation’s organizational documents, its officers and directors are indemnified against certain liabilities arising out of the performance of their duties to the funds. In addition, in the normal course of business, the funds enter into contracts that provide general indemnifications. The maximum exposure under these arrangements is unknown as this would involve future claims that may be made against a fund. The risk of material loss from such claims is considered by management to be remote.
Use of Estimates — The financial statements are prepared in conformity with accounting principles generally accepted in the United States of America, which may require management to make certain estimates and assumptions at the date of the financial statements. Actual results could differ from these estimates.
Subsequent Events — In preparing the financial statements, management evaluated the impact of events or transactions occurring through the date the financial statements were issued that would merit recognition or disclosure.
25
2. Fees and Transactions with Related Parties
Management Fees — The corporation has entered into a Management Agreement with ACIM, under which ACIM provides the funds with investment advisory and management services in exchange for a single, unified management fee (the fee). The Agreement provides that all expenses of managing and operating the funds, except brokerage expenses, taxes, interest, fees and expenses of the independent directors (including legal counsel fees), and extraordinary expenses, will be paid by ACIM. The fee is computed and accrued daily based on the daily net assets of each fund and paid monthly in arrears. For funds with a stepped fee schedule, the rate of the fee is determined by applying a fee rate calculation formula. This formula takes into account each fund’s assets as well as certain assets, if any, of other clients of the investment adv isor outside the American Century Investments family of funds (such as subadvised funds and separate accounts) that have very similar investment teams and investment strategies (strategy assets). The annual management fee schedule for NT Large Company Value ranges from 0.50% to 0.70%. The effective annual management fee for NT Large Company Value for the year ended March 31, 2010 was 0.64%. The annual management fee for NT Mid Cap Value is 0.80%.
Related Parties — Certain officers and directors of the corporation are also officers and/ or directors of American Century Companies, Inc. (ACC), the parent of the corporation’s investment advisor, ACIM, the distributor of the corporation, American Century Investment Services, Inc., and the corporation’s transfer agent, American Century Services, LLC. The funds are wholly owned, in aggregate, by various funds in a series issued by American Century Asset Allocation Portfolios, Inc. (ACAAP). ACAAP does not invest in the funds for the purpose of exercising management or control.
The funds are eligible to invest in a money market fund for temporary purposes, which is managed by J.P. Morgan Investment Management, Inc. (JPMIM). The funds have a Mutual Funds Services Agreement with J.P. Morgan Investor Services Co. (JPMIS) and a securities lending agreement with JPMorgan Chase Bank (JPMCB). JPMCB is a custodian of the funds. JPMIM, JPMIS and JPMCB are wholly owned subsidiaries of JPMorgan Chase & Co. (JPM). JPM is an equity investor in ACC.
3. Investment Transactions
Investment transactions, excluding short-term investments, for the year ended March 31, 2010 were as follows:
| | |
| | NT Large Company Value | NT Mid Cap Value |
| Purchases | $126,996,994 | $170,088,818 |
| Sales | $50,366,863 | $142,366,507 |
4. Fair Value Measurements
The funds’ securities valuation process is based on several considerations and may use multiple inputs to determine the fair value of the positions held by the funds. In conformity with accounting principles generally accepted in the United States of America, the inputs used to determine a valuation are classified into three broad levels as follows:
• Level 1 valuation inputs consist of unadjusted quoted prices in an active market for identical securities;
• Level 2 valuation inputs consist of significant direct or indirect observable market data (including quoted prices for similar securities, evaluations of subsequent market events, interest rates, prepayment speeds, credit risk, etc.); or
• Level 3 valuation inputs consist of significant unobservable inputs (including a fund’s own assumptions).
26
The level classification is based on the lowest level input that is significant to the fair valuation measurement. The valuation inputs are not an indication of the risks associated with investing in these securities or other financial instruments.
The following is a summary of the valuation inputs used to determine the fair value of the funds’ securities and other financial instruments as of March 31, 2010. The Schedule of Investments provides additional details on the funds’ portfolio holdings.
| | | | |
| | Level 1 | Level 2 | Level 3 | |
| |
| NT Large Company Value | | | | |
| Investment Securities | | | | |
| Common Stocks | $293,786,394 | — | | — |
| Temporary Cash Investments | 50,971 | $13,800,000 | | — |
| Total Value of Investment Securities | $293,837,365 | $13,800,000 | | — |
| | | | | |
| Other Financial Instruments | | | | |
| Total Unrealized Gain (Loss) on Futures Contracts | $292,734 | — | | — |
| | | | | |
| NT Mid Cap Value | | | | |
| Investment Securities | | | | |
| Domestic Common Stocks | $128,398,098 | — | | — |
| Foreign Common Stocks | 3,700,941 | $4,610,288 | | — |
| Temporary Cash Investments | 67,126 | 1,500,000 | | — |
| Total Value of Investment Securities | $132,166,165 | $6,110,288 | | — |
| | | | | |
| Other Financial Instruments | | | | |
| Total Unrealized Gain (Loss) on Forward | | | | |
| Foreign Currency Exchange Contracts | — | $(9,459) | | — |
| |
| |
| 5. Derivative Instruments | | | | |
Equity Price Risk — NT Large Company Value is subject to equity price risk in the normal course of pursuing its investment objectives. A fund may enter into futures contracts based on an equity index in order to manage its exposure to changes in market conditions. A fund may purchase futures contracts to gain exposure to increases in market value or sell futures contracts to protect against a decline in market value. Upon entering into a futures contract, a fund is required to deposit either cash or securities in an amount equal to a certain percentage of the contract value (initial margin). Subsequent payments (variation margin) are made or received daily, in cash, by a fund. The variation margin is equal to the daily change in the contract value and is recorded as unrealized gains and losses. A fund recognizes a realized ga in or loss when the contract is closed or expires. Net realized and unrealized gains or losses occurring during the holding period of futures contracts are a component of net realized gain (loss) on futures contract transactions and change in net unrealized appreciation (depreciation) on futures contracts, respectively. One of the risks of entering into futures contracts is the possibility that the change in value of the contract may not correlate with the changes in value of the underlying securities. The equity price risk derivative instruments held at period end as disclosed on the Schedule of Investments are indicative of the fund’s typical volume during the period.
27
Foreign Currency Risk — NT Mid Cap Value is subject to foreign currency exchange rate risk in the normal course of pursuing its investment objectives. The value of foreign investments held by a fund may be significantly affected by changes in foreign currency exchange rates. The dollar value of a foreign security generally decreases when the value of the dollar rises against the foreign currency in which the security is denominated and tends to increase when the value of the dollar declines against such foreign currency. A fund may enter into forward foreign currency exchange contracts to reduce a fund’s exposure to foreign currency exchange rate fluctuations. The net U.S. dollar value of foreign currency underlying all contractual commitments hel d by a fund and the resulting unrealized appreciation or depreciation are determined daily using prevailing exchange rates. Realized gain or loss is recorded upon the termination of the contract. Net realized and unrealized gains or losses occurring during the holding period of forward foreign currency exchange contracts are a component of net realized gain (loss) on foreign currency transactions and change in net unrealized appreciation (depreciation) on translation of assets and liabilities in foreign currencies, respectively. A fund bears the risk of an unfavorable change in the foreign currency exchange rate underlying the forward contract. Additionally, losses, up to the fair value, may arise if the counterparties do not perform under the contract terms. The risk of loss from non-performance by the counterparty may be reduced by the use of master netting agreements. The foreign currency risk derivative instruments held at period end as disclosed on the Schedule of Investments are indicative of the fund& #146;s typical volume during the period.
For NT Large Company Value, the value of equity price risk derivative instruments as of March 31, 2010, is disclosed on the Statement of Assets and Liabilities as a liability of $44,520 in payable for variation margin on futures contracts. For NT Large Company Value, for the year ended March 31, 2010, the effect of equity price risk derivative instruments on the Statement of Operations was $3,536,931 in net realized gain (loss) on futures contract transactions and $(539,570) in change in net unrealized appreciation (depreciation) on futures contracts.
For NT Mid Cap Value, the value of foreign currency risk derivative instruments as of March 31, 2010, is disclosed on the Statement of Assets and Liabilities as a liability of $9,459 in payable for forward foreign currency exchange contracts. For NT Mid Cap Value, for the year ended March 31, 2010, the effect of foreign currency risk derivative instruments on the Statement of Operations was $(275,120) in net realized gain (loss) on foreign currency transactions and $(17,382) in change in net unrealized appreciation (depreciation) on translation of assets and liabilities in foreign currencies.
6. Risk Factors
There are certain risks involved in investing in foreign securities. These risks include those resulting from future adverse political, social, and economic development, fluctuations in currency exchange rates, the possible imposition of exchange controls, and other foreign laws and restrictions.
7. Interfund Lending
The funds, along with certain other funds in the American Century Investments family of funds, may participate in an interfund lending program, pursuant to an Exemptive Order issued by the Securities and Exchange Commission (SEC). This program provides an alternative credit facility allowing the funds to borrow from or lend to other funds in the American Century Investments family of funds that permit such transactions. Interfund lending transactions are subject to each fund’s investment policies and borrowing and lending limits. The interfund loan rate earned/paid on interfund lending transactions is determined daily based on the average of certain current market rates. Interfund lending transactions normally extend only overnight, but can have a maximum duration of seven days. The program is subject to annual approval by the Board of Directors. During the year ended March 31, 2010, the funds did not utilize the program.
28
8. Federal Tax Information
The tax character of distributions paid during the years ended March 31, 2010 and March 31, 2009 were as follows:
| | | | |
| | NT Large Company Value | NT Mid Cap Value |
| | 2010 | 2009 | 2010 | 2009 |
| Distributions Paid From | | | | |
| Ordinary income | $4,435,883 | $3,130,012 | $1,746,754 | $1,139,180 |
| Long-term capital gains | — | $221 | — | — |
The book-basis character of distributions made during the year from net investment income or net realized gains may differ from their ultimate characterization for federal income tax purposes. These differences reflect the differing character of certain income items and net realized gains and losses for financial statement and tax purposes, and may result in reclassification among certain capital accounts on the financial statements.
| | | |
| As of March 31, 2010, the federal tax cost of investments and the components of | |
| distributable earnings on a tax-basis were as follows: | | | |
| | | |
| | NT Large | | |
| | Company Value | NT Mid Cap Value |
| Federal tax cost of investments | $277,777,676 | $123,116,780 |
| Gross tax appreciation of investments | $35,373,674 | $15,613,863 |
| Gross tax depreciation of investments | (5,513,985) | (454,190) |
| Net tax appreciation (depreciation) of investments | $29,859,689 | $15,159,673 |
| Net tax appreciation (depreciation) on derivatives and translation of assets and | | |
| liabilities in foreign currencies | — | $ 495 |
| Net tax appreciation (depreciation) | $29,859,689 | $15,160,168 |
| Undistributed ordinary income | $1,861 | $1,484,140 |
| Accumulated capital losses | $(26,105,024) | — |
| Capital loss deferrals | $(298,670) | — |
The difference between book-basis and tax-basis cost and unrealized appreciation (depreciation) is attributable primarily to the tax deferral of losses on wash sales, and the realization for tax purposes of unrealized gains (losses) on certain forward foreign currency exchange contracts and on certain futures contracts.
The accumulated capital losses listed above represent net capital loss carryovers that may be used to offset future realized capital gains for federal income tax purposes. Future capital loss carryover utilization in any given year may be subject to Internal Revenue Code limitations. For NT Large Company Value, capital loss carryovers of $(10,029,955) and $(16,075,069) expire in 2017 and 2018, respectively.
The capital loss deferrals listed above represent net capital losses incurred in the five-month period ended March 31, 2010. The funds have elected to treat such losses as having been incurred in the following fiscal year for federal income tax purposes.
29
9. Corporate Event
As part of a long-standing estate and business succession plan established by ACC Co-Chairman James E. Stowers, Jr., the founder of American Century Investments, ACC Co-Chairman Richard W. Brown succeeded Mr. Stowers as trustee of a trust that holds a greater-than-25% voting interest in ACC, the parent corporation of each fund’s advisor. Under the 1940 Act, this is presumed to represent control of ACC even though it is less than a majority interest. The change of trustee may technically be considered a “change of control” of ACC and therefore also a change of control of each fund’s advisor even though there has been no change to their management and none is anticipated. The “change of control” resulted in the assignment of each fund’s investment advisory agreement. Under the 1940 Act, an assignment automatically terminated such agreement, making the approval of a new agreement necessary.
On February 18, 2010, the Board of Directors approved interim investment advisory agreements under which each fund will be managed until new agreements are approved by fund shareholders. On March 29, 2010, the Board of Directors approved new investment advisory agreements. The interim agreements and the new agreements are substantially identical to the terminated agreements (with the exception of different effective and termination dates) and will not result in changes in the management of American Century Investments, the funds, their investment objectives, fees or services provided. The new agreements have been submitted to shareholders for approval at a Special Meeting of Shareholders to be held on June 16, 2010.
10. Recently Issued Accounting Standards
In March 2008, the Financial Accounting Standards Board (FASB) issued Accounting Standards Codification (ASC) Section 815-10 (formerly Statement of Financial Accounting Standards No. 161, “Disclosures about Derivative Instruments and Hedging Activities —an amendment of FASB Statement No. 133”). ASC Section 815-10 is effective for interim periods beginning after November 15, 2008 and has been adopted by the funds. ASC Section 815-10 amends and expands disclosures about derivative instruments and hedging activities. ASC Section 815-10 requires qualitative disclosures about the objectives and strategies of derivative instruments, quantitative disclosures about the fair value amounts of and gains and losses on derivative instruments, and disclosures of credit-risk-related contingent features in hedging activities.
11. Other Tax Information (Unaudited)
The following information is provided pursuant to provisions of the Internal Revenue Code.
The funds hereby designate up to the maximum amount allowable as qualified dividend income for the fiscal year ended March 31, 2010.
For corporate taxpayers, NT Large Company Value and NT Mid Cap Value hereby designate $4,435,883 and $1,746,754, respectively, or up to the maximum amount allowable, of ordinary income distributions paid during the fiscal year ended March 31, 2010 as qualified for the corporate dividends received deduction.
30
| | | | | |
| NT Large Company Value | | | | |
| |
| For a Share Outstanding Throughout the Years Ended March 31 (except as noted) | | |
| | | 2010 | 2009 | 2008 | 2007(1) |
| Per-Share Data | | | | |
| Net Asset Value, Beginning of Period | $5.55 | $9.71 | $11.13 | $10.00 |
| Income From Investment Operations | | | | |
| Net Investment Income (Loss) | 0.14(2) | 0.20(2) | 0.22 | 0.18 |
| Net Realized and Unrealized Gain (Loss) | 2.47 | (4.16) | (1.29) | 1.14 |
| Total From Investment Operations | 2.61 | (3.96) | (1.07) | 1.32 |
| Distributions | | | | |
| From Net Investment Income | (0.14) | (0.20) | (0.22) | (0.18) |
| From Net Realized Gains | — | — | (0.13) | (0.01) |
| Total Distributions | (0.14) | (0.20) | (0.35) | (0.19) |
| Net Asset Value, End of Period | $8.02 | $5.55 | $9.71 | $11.13 |
| |
| Total Return(3) | 47.28% | (41.22)% | (9.93)% | 13.26% |
| | | | | |
| Ratios/Supplemental Data | | | | |
| Ratio of Operating Expenses to Average Net Assets | 0.64% | 0.63% | 0.62% | 0.63% |
| Ratio of Net Investment Income (Loss) to Average Net Assets | 1.99% | 2.82% | 2.10% | 2.01% |
| Portfolio Turnover Rate | 23% | 26% | 20% | 18% |
| Net Assets, End of Period (in thousands) | $308,035 | $152,678 | $98,618 | $71,970 |
| (1) | May 12, 2006 (fund inception) through March 31, 2007. | | | | |
| (2) | Computed using average shares outstanding throughout the period. | | | | |
| (3) | Total return assumes reinvestment of net investment income and capital gains distributions, if any. Total returns for periods less than one year |
| | are not annualized. Total returns are calculated based on the net asset value of the last business day. | | |
| (4) | Annualized. | | | | |
See Notes to Financial Statements.
31
| | | | | |
| NT Mid Cap Value | | | | |
| |
| For a Share Outstanding Throughout the Years Ended March 31 (except as noted) | | |
| | | 2010 | 2009 | 2008 | 2007(1) |
| Per-Share Data | | | | |
| Net Asset Value, Beginning of Period | $6.25 | $9.04 | $11.28 | $10.00 |
| Income From Investment Operations | | | | |
| Net Investment Income (Loss) | 0.17(2) | 0.18(2) | 0.16(2) | 0.14 |
| Net Realized and Unrealized Gain (Loss) | 3.45 | (2.79) | (1.29) | 1.44 |
| Total From Investment Operations | 3.62 | (2.61) | (1.13) | 1.58 |
| Distributions | | | | |
| From Net Investment Income | (0.14) | (0.18) | (0.15) | (0.12) |
| From Net Realized Gains | — | — | (0.96) | (0.18) |
| Total Distributions | (0.14) | (0.18) | (1.11) | (0.30) |
| Net Asset Value, End of Period | $9.73 | $6.25 | $9.04 | $11.28 |
| |
| Total Return(3) | 58.29% | (29.25)% | (10.79)% | 16.03% |
| | | | | |
| Ratios/Supplemental Data | | | | |
| Ratio of Operating Expenses to Average Net Assets | 0.80% | 0.80% | 0.80% | 0.80%(4) |
| Ratio of Net Investment Income (Loss) to Average Net Assets | 1.98% | 2.36% | 1.48% | 1.55%(4) |
| Portfolio Turnover Rate | 143% | 181% | 208% | 203% |
| Net Assets, End of Period (in thousands) | $137,729 | $67,933 | $45,832 | $33,375 |
| (1) | May 12, 2006 (fund inception) through March 31, 2007. | | | | |
| (2) | Computed using average shares outstanding throughout the period. | | | | |
| (3) | Total return assumes reinvestment of net investment income and capital gains distributions, if any. Total returns for periods less than one year |
| | are not annualized. Total returns are calculated based on the net asset value of the last business day. | | |
| (4) | Annualized. | | | | |
See Notes to Financial Statements.
32
|
| Report of Independent Registered Public Accounting Firm |
The Board of Directors and Shareholders,
American Century Capital Portfolios, Inc.:
We have audited the accompanying statements of assets and liabilities, including the schedules of investments, of NT Large Company Value Fund and NT Mid Cap Value Fund, two of the mutual funds constituting American Century Capital Portfolios, Inc. (the “Corporation”), as of March 31, 2010, and the related statements of operations for the year then ended, the statements of changes in net assets for each of the two years in the period then ended, and the financial highlights each of the three years in the period then ended and for the period May 12, 2006 (inception of the funds) through March 31, 2007. These financial statements and financial highlights are the responsibility of the Corporation’s management. Our responsibility is to express an opinion on these financial statements and financial highlights based on our audits.
We conducted our audits in accordance with the standards of the Public Company Accounting Oversight Board (United States). Those standards require that we plan and perform the audit to obtain reasonable assurance about whether the financial statements and financial highlights are free of material misstatement. The Corporation is not required to have, nor were we engaged to perform, an audit of its internal control over financial reporting. Our audits included consideration of internal control over financial reporting as a basis for designing audit procedures that are appropriate in the circumstances, but not for the purpose of expressing an opinion on the effectiveness of the Corporation’s internal control over financial reporting. Accordingly, we express no such opinion. An audit also includes examining, on a test basis, evidence supporting the amounts and disclosures in the financial statements, assessing t he accounting principles used and significant estimates made by management, as well as evaluating the overall financial statement presentation. Our procedures included confirmation of securities owned as of March 31, 2010, by correspondence with the custodian and brokers; where replies were not received from brokers, we performed other auditing procedures. We believe that our audits provide a reasonable basis for our opinion.
In our opinion, the financial statements and financial highlights referred to above present fairly, in all material respects, the respective financial positions of NT Large Company Value Fund and NT Mid Cap Value Fund, two of the mutual funds of American Century Capital Portfolios, Inc., as of March 31, 2010, the results of their operations for the year then ended, the changes in their net assets for each of the two years in the period then ended, and the financial highlights for each of the three years in the period then ended and for the period May 12, 2006 through March 31, 2007, in conformity with accounting principles generally accepted in the United States of America.
Deloitte & Touche LLP
Kansas City, Missouri
May 17, 2010
33
The Board of Directors
The individuals listed below serve as directors of the funds. Each director will continue to serve in this capacity until death, retirement, resignation or removal from office. The mandatory retirement age for directors who are not “interested persons,” as that term is defined in the Investment Company Act (independent directors), is 72. However, the mandatory retirement age may be extended or changed with the approval of the remaining independent directors.
Mr. Thomas is the only director who is an “interested person” because he currently serves as President and Chief Executive Officer of American Century Companies, Inc. (ACC), the parent company of American Century Investment Management, Inc. (ACIM) and American Century Global Investment Management, Inc. (ACGIM). ACIM and ACGIM are referred to collectively as the “advisors.”
The other directors (more than three-fourths of the total number) are independent; that is, they have never been employees, directors or officers of, and have no financial interest in, ACC or any of its wholly owned, direct or indirect, subsidiaries, including ACIM, ACGIM, American Century Investment Services, Inc. (ACIS) and American Century Services, LLC (ACS). The directors serve in this capacity for seven (in the case of Mr. Thomas, 15) registered investment companies in the American Century Investments family of funds.
The following presents additional information about the directors. The mailing address for each director is 4500 Main Street, Kansas City, Missouri 64111.
Independent Directors
Thomas A. Brown
Year of Birth: 1940
Position(s) with the Funds: Director
Length of Time Served: Since 1980
Principal Occupation(s) During the Past Five Years: Managing Member, Associated Investments,
LLC (real estate investment company); Brown Cascade Properties, LLC (real estate
investment company) (2001 to 2009)
Number of Funds in Fund Complex Overseen by Director: 63
Other Directorships Held by Director: None
Education/Other Professional Experience: BS in Mechanical Engineering, University of
Kansas; formerly, Chief Executive Officer, Associated Bearings Company; formerly,
Area Vice President, Applied Industrial Technologies (bearings and power
transmission company)
34
Andrea C. Hall
Year of Birth: 1945
Position(s) with the Funds: Director
Length of Time Served: Since 1997
Principal Occupation(s) During the Past Five Years: Retired as advisor to the President, Midwest
Research Institute (not-for-profit research organization) (June 2006)
Number of Funds in Fund Complex Overseen by Director: 63
Other Directorships Held by Director: None
Education/Other Professional Experience: BS in Biology, Florida State University; PhD in
Biology, Georgetown University; formerly, Senior Vice President and director of
Research Operations, Midwest Research Institute
James A. Olson
Year of Birth: 1942
Position(s) with the Funds: Director
Length of Time Served: Since 2007
Principal Occupation(s) During the Past Five Years: Member, Plaza Belmont LLC (private equity
fund manager); Chief Financial Officer, Plaza Belmont LLC (September 1999 to
September 2006)
Number of Funds in Fund Complex Overseen by Director: 63
Other Directorships Held by Director: Saia, Inc. and Entertainment Properties Trust
Education/Other Professional Experience: BS in Business Administration and MBA, St. Louis
University; CPA; 21 years of experience as a partner in the accounting firm of
Ernst & Young LLP
Donald H. Pratt
Year of Birth: 1937
Position(s) with the Funds: Director, Chairman of the Board
Length of Time Served: Since 1995
Principal Occupation(s) During the Past Five Years: Chairman and Chief Executive Officer,
Western Investments, Inc. (real estate company)
Number of Funds in Fund Complex Overseen by Director: 63
Other Directorships Held by Director: None
Education/Other Professional Experience: BS in Industrial Engineering, Wichita State
University; MBA, Harvard Business School; serves on the Board of Governors of
the Independent Directors Council and Investment Company Institute; formerly,
Chairman of the Board, Butler Manufacturing Company (metal buildings producer)
Gale E. Sayers
Year of Birth: 1943
Position(s) with the Funds: Director
Length of Time Served: Since 2000
Principal Occupation(s) During the Past Five Years: President, Chief Executive Officer and
Founder, Sayers40, Inc., (technology products and services provider)
Number of Funds in Fund Complex Overseen by Director: 63
Other Directorships Held by Director: None
Education/Other Professional Experience: BS in Physical Education and M.Ed. in Educational
Administration, University of Kansas; Recipient of the Ernst & Young Entrepreneur
of the Year Award; inducted into the Chicago Entrepreneurship Hall of Fame and
the National Football League Hall of Fame
35
M. Jeannine Strandjord
Year of Birth: 1945
Position(s) with the Funds: Director
Length of Time Served: Since 1994
Principal Occupation(s) During the Past Five Years: Retired, formerly, Senior Vice President,
Process Excellence, Sprint Corporation (telecommunications company) (January
2005-September 2005)
Number of Funds in Fund Complex Overseen by Director: 63
Other Directorships Held by Director: DST Systems Inc., Euronet Worldwide Inc., Charming
Shoppes, Inc.
Education/Other Professional Experience: BS in Business Administration and Accounting,
University of Kansas; CPA; formerly, Senior Vice President of Financial Services and
Treasurer and Chief Financial Officer, Global Markets Group; Sprint Corporation;
formerly, with the accounting firm of Ernst and Whinney
John R. Whitten
Year of Birth: 1946
Position(s) with the Funds: Director
Length of Time Served: Since 2008
Principal Occupation(s) During the Past Five Years: Project Consultant, Celanese Corp.
(industrial chemical company)
Number of Funds in Fund Complex Overseen by Director: 63
Other Directorships Held by Director: Rudolph Technologies, Inc.
Professional Education/Experience: BS in Business Administration, Cleveland State
University; CPA; formerly, Chief Financial Officer and Treasurer, Applied Industrial
Technologies, Inc.; thirteen years of experience with accounting firm Deloitte &
Touche LLP
Interested Director
Jonathan S. Thomas
Year of Birth: 1963
Position(s) with the Funds: Director and President
Length of Time Served: Since 2007
Principal Occupation(s) During the Past Five Years: President and Chief Executive Officer,
ACC (March 2007 to present); Chief Administrative Officer, ACC (February 2006 to
February 2007); Executive Vice President, ACC (November 2005 to February 2007).
Also serves as: Chief Executive Officer and Manager, American Century Services,
LLC (ACS); Executive Vice President, American Century Investment Management
(ACIM) and American Century Global Investment Management (ACGIM); Director,
ACIM, ACGIM and other ACC subsidiaries; Global Chief Operating Officer and
Managing Director, Morgan Stanley (investment management) (March 2000 to
November 2005)
Number of Funds in Fund Complex Overseen by Director: 104
Other Directorships Held by Director: None
Education/Other Professional Experience: BA in Economics, University of Massachusetts;
MBA, Boston College; formerly held senior leadership roles with Fidelity
Investments, Boston Financial Services and Bank of America; serves on the Board
of Governors of the Investment Company Institute
36
Officers
The following table presents certain information about the executive officers of the funds. Each officer serves as an officer for each of the 15 investment companies in the American Century family of funds, unless otherwise noted. No officer is compensated for his or her service as an officer of the funds. The listed officers are interested persons of the funds and are appointed or re-appointed on an annual basis. The mailing address for each of the officers listed below is 4500 Main Street, Kansas City, Missouri 64111.
| | |
| Name | Offices with | |
| (Year of Birth) | the Funds | Principal Occupation During the Past Five Years |
| Jonathan Thomas | Director and | President and Chief Executive Officer, ACC (March 2007 to present); Chief |
| (1963) | President | Administrative Officer, ACC (February 2006 to March 2007); Executive |
| | since 2007 | Vice President, ACC (November 2005 to February 2007). Also serves as: |
| | | Chief Executive Officer and Manager, ACS; Executive Vice President, ACIM, |
| | | ACGIM; Director, ACIM, ACGIM and other ACC subsidiaries; Global Chief |
| | | Operating Officer and Managing Director, Morgan Stanley (March 2000 to |
| | | November 2005) |
| Barry Fink | Executive Vice | Chief Operating Officer and Executive Vice President, ACC (September 2007 |
| (1955) | President | to present); President, ACS (October 2007 to present); Managing Director, |
| | since 2007 | Morgan Stanley (2000 to 2007); Global General Counsel, Morgan Stanley |
| | | (2000 to 2006). Also serves as: Manager, ACS and Director, ACC and |
| | | certain ACC subsidiaries |
| Maryanne Roepke | Chief Compliance | Chief Compliance Officer, American Century funds, ACIM, ACGIM and |
| (1956) | Officer since 2006 | ACS (August 2006 to present); Assistant Treasurer, ACC (January 1995 to |
| | and Senior | August 2006); and Treasurer and Chief Financial Officer, various American |
| | Vice President | Century funds (July 2000 to August 2006). Also serves as: Senior Vice |
| | since 2000 | President, ACS |
| Charles | General Counsel | Attorney, ACC (February 1994 to present); Vice President, ACC (November |
| Etherington | since 2007 and | 2005 to present), General Counsel, ACC (March 2007 to present); Also |
| (1957) | Senior Vice | serves as General Counsel, ACIM, ACGIM, ACS, ACIS and other ACC |
| | President | subsidiaries; and Senior Vice President, ACIM, ACGIM and ACS |
| | since 2006 | |
| Robert Leach | Vice President, | Vice President, ACS (February 2000 to present); and Controller, various |
| (1966) | Treasurer and | American Century funds (1997 to September 2006) |
| | Chief Financial | |
| | Officer since 2006 | |
| David Reinmiller | Vice President | Attorney, ACC (January 1994 to present); Associate General Counsel, ACC |
| (1963) | since 2000 | (January 2001 to present); Chief Compliance Officer, American Century |
| | | funds, ACIM and ACGIM (January 2001 to February 2005). Also serves as |
| | | Vice President, ACIM, ACGIM and ACS |
| Ward Stauffer | Secretary | Attorney, ACC (June 2003 – Present) |
| (1960) | since 2005 | |
The SAI has additional information about the funds’ directors and is available without charge, upon request, by calling 1-800-345-2021.
37
|
| Board Approval of Management Agreements |
American Century Investment Management, Inc. (“ACIM” or the “Advisor”) currently serves as investment advisor to the Funds under an interim management agreement (the “Interim Management Agreement”) between the Advisor and the Funds approved by the Funds’ Board of Directors (the “Board”). The Advisor previously served as investment advisor to the Funds pursuant to a management agreement (the “Prior Management Agreement”) that terminated in accordance with its terms on February 16, 2010, as a result of a change of control of the Advisor’s parent company, American Century Companies, Inc. (“ACC”). The change in control occurred as the result of a change in the trustee of a trust created by James E. Stowers, Jr., the founder of American Century Investments, which holds shares representing a significant interest in ACC stock. Mr. Stowers previously se rved as the trustee of the trust. On February 16, 2010, Mr. Richard W. Brown, Co-Chairman of ACC with Mr. Stowers, became the trustee in accordance with the terms of the trust and Mr. Stowers’ long-standing estate and succession plan.
On February 18, 2010, the Board approved the Interim Management Agreement in accordance with Rule 15a-4 under the Investment Company Act to ensure continued management of the Funds by the Advisor after the termination of the Prior Management Agreement and until shareholder approval of a new management agreement (the “Proposed Management Agreement”) as required under the Act. The Board has approved the Proposed Management Agreement and has recommended its approval to shareholders. Fund shareholders are scheduled to consider approval of the Proposed Management Agreement at a meeting to be held on June 16, 2010.
The Interim Management Agreement and the Proposed Management Agreement are substantially identical to the Prior Management Agreement except for their effective dates and the termination provisions of the Interim Management Agreement. Under the Interim and Proposed Management Agreements, the Advisor will provide the same services to the Funds and receive the same compensation rate as under the Prior Management Agreement.
Basis for Board Approval of Interim Management Agreement
In considering the approval of the Interim Management Agreement, Rule 15a-4 requires the Board to approve the contract within ten business days of the termination of the prior agreement and to determine that the compensation to be received under the interim agreement is no greater than would have been received under the prior agreement. In connection with the approval, the Board noted that it oversees on a continuous basis and evaluates at its quarterly meetings, directly and through the committees of the Board, the nature and quality of significant services provided by the Advisor, the investment performance of the Funds, shareholder services, audit and compliance functions and a variety of other matters relating to the Funds’ operations.
38
In evaluating the Interim Management Agreement, the Board, assisted by the advice of its independent legal counsel, considered a number of factors in addition to those required by the rule with no one factor being determinative to its analysis. Among the factors considered by the Board were the circumstances and effect of the change of control, the fact that the Advisor will provide the same services and receive the same compensation rate as under the Prior Management Agreements, and that the change of control did not result in a change of the personnel managing the Funds. Upon completion of its analysis, the Board approved the Interim Management Agreement, determining that the continued management of the Funds by the Advisor was in the best interests of the Funds and Fund shareholders.
Basis for Board Approval of Proposed Management Agreement
At a meeting held on March 29, 2010, after considering all information presented, the Board approved, and determined to recommend that shareholders approve, the Proposed Management Agreement. In connection with that approval, the Board requested and reviewed extensive data and information compiled by the Advisor and certain independent providers of evaluation data concerning the Funds and services provided to the Funds by the Advisor. The Board oversees on a continuous basis and evaluates at its quarterly meetings, directly and through the committees of the Board, the nature and quality of significant services provided by the Advisor, the investment performance of the Funds, shareholder services, audit and compliance functions and a variety of other matters relating to the Funds’ operations. The information considered and the discussions held at the meetings included, but were not limited to:
• the nature, extent and quality of investment management, shareholder services and other services provided to the Funds;
• the wide range of programs and services the Advisor provides to the Funds and their shareholders on a routine and non-routine basis;
• the compliance policies, procedures, and regulatory experience of the Advisor;
• data comparing the cost of owning the Funds to the cost of owning similar funds;
• the fact that there will be no changes to the fees, services, or personnel who provide such services as compared to the Prior Management Agreement;
• data comparing the Funds’ performance to appropriate benchmarks and/ or a peer group of other mutual funds with similar investment objectives and strategies;
• financial data showing the profitability of the Funds to the Advisor and the overall profitability of the Advisor;
39
• data comparing services provided and charges to the Funds with those for other non-fund investment management clients of the Advisor; and
• consideration of collateral or “fall-out” benefits derived by the Advisor from the management of the Funds and potential sharing of economies of scale in connection with the management of the Funds.
The Board also considered whether there was any reason for not continuing the existing arrangement with the Advisor. In particular, the Board recognized that shareholders may have invested in the Funds on the strength of the Advisor’s industry standing and reputation and in the expectation that the Advisor will have a continuing role in providing advisory services to the Funds.
The Board considered all of the information provided by the Advisor, the independent data providers, and the Board’s independent legal counsel, and evaluated such information for each Fund. The Board did not identify any single factor as being all-important or controlling, and each Board member may have attributed different levels of importance to different factors. In deciding to approve the Proposed Management Agreement under the terms ultimately determined by the Board to be appropriate, the Board based its decision on a number of factors, including the following:
Nature, Extent and Quality of Services – Generally. Under the Proposed Management Agreement, the Advisor is responsible for providing or arranging for all services necessary for the operation of the Funds. The Board noted that under the Proposed Management Agreement, the Advisor provides or arranges at its own expense a wide variety of services including:
• constructing and designing the Funds
• portfolio research and security selection
• initial capitalization/funding
• securities trading
• Fund administration
• custody of Fund assets
• daily valuation of each Fund’s portfolio
• shareholder servicing and transfer agency, including shareholder confir-
mations, recordkeeping and communications
• legal services
• regulatory and portfolio compliance
• financial reporting
• marketing and distribution
40
The Board noted that many of these services have expanded over time both in terms of quantity and complexity in response to shareholder demands, competition in the industry, changing distribution channels and the changing regulatory environment.
Investment Management Services. The investment management services provided to the Funds are complex and provide Fund shareholders access to professional money management, instant diversification of their investments within an asset class, the opportunity to easily diversify among asset classes, and liquidity. As a part of its general oversight and in evaluating investment performance, the Board expects the Advisor to manage each Fund in accordance with its investment objectives and approved strategies. In providing these services, the Advisor utilizes teams of investment professionals who require extensive information technology, research, training, compliance and other systems to conduct their business. The Board, directly and through its Fund Performance Review Committee, regularly reviews investment performance information for each Fund, together with comparative information for appropriate benchmarks and/or peer groups of similarly-managed funds, over different time horizons. If performance concerns are identified, the underperforming Fund receives special reviews until performance improves, during which time the Board discusses with the Advisor the reasons for such underperformance and any efforts being undertaken to improve performance.
Shareholder and Other Services. Under the Proposed Management Agreement, the Advisor will also provide the Funds with a comprehensive package of transfer agency, shareholder, and other services. The Board, directly and through the various committees of the Board, regularly reviews reports and evaluations of such services. These reports include, but are not limited to, information regarding the operational efficiency and accuracy of the shareholder and transfer agency services provided, staffing levels, shareholder satisfaction (as measured by external as well as internal sources), technology support, new products and services offered to Fund shareholders, securities trading activities, portfolio valuation services, auditing services, and legal and operational compliance activities. Certain aspects of shareholder and transfer a gency service level efficiency and the quality of securities trading activities are measured by independent third party providers and are presented in comparison to other fund groups not managed by the Advisor.
Costs of Services Provided and Profitability. The Advisor provided detailed information concerning its cost of providing various services to the Funds, its profitability in managing the Funds, its overall profitability, and its financial condition. The Board reviewed with the Advisor the methodology used to prepare this financial information. The Board has also reviewed with the Advisor its methodology for compensating the investment professionals that provide services to the Funds as well as compensation to the five highest paid personnel of the Advisor. This financial information regarding the Advisor is considered in order to evaluate the Advisor’s financial
41
condition, its ability to continue to provide services under the Proposed Management Agreement, and the reasonableness of the proposed management fees. The Board concluded that the Advisor’s profits were reasonable in light of the services provided to the Funds.
Ethics. The Board generally considers the Advisor’s commitment to providing quality services to shareholders and to conducting its business ethically. It noted that the Advisor’s practices generally meet or exceed industry best practices.
Economies of Scale. The Board also reviewed information provided by the Advisor regarding the possible existence of economies of scale in connection with the management of the Funds. The Board concluded that economies of scale are difficult to measure and predict with precision, especially on a fund-by-fund basis. The analysis of economies of scale is further complicated by the additional services and content provided by the Advisor and its reinvestment in its ability to provide and expand those services. Accordingly, the Board seeks to evaluate economies of scale by reviewing information, such as year-over-year profitability of the Advisor generally, the profitability of its management of each Fund specifically, and the expenses incurred by the Advisor in providing various functions to the Funds. The Board believes the Adviso r is appropriately sharing economies of scale through its competitive fee structure, offering competitive fees from fund inception, fee breakpoints as each Fund increases in size, and through reinvestment in its business to provide shareholders additional services and enhancements to existing services.
Comparison to Fees of Funds not Managed by the Advisor. Both the Prior and Proposed Management Agreements provide that the Funds pay the Advisor a single, all-inclusive (or unified) management fee for providing all services necessary for the management and operation of the Funds, other than brokerage expenses, taxes, interest, extraordinary expenses, and the fees and expenses of the Funds’ Independent Trustees (including their independent legal counsel) and expenses incurred in connection with the provision of shareholder services and distribution services under a plan adopted pursuant to Rule 12b-1 under the 1940 Act. Under the unified fee structure, the Advisor is responsible for providing all investment advisory, custody, audit, administrative, compliance, recordkeeping, marketing and shareholder services, or arranging and supervising third parties that provide such services. By contrast, most other funds are charged a variety of fees, including an investment advisory fee, a transfer agency fee, an administrative fee, distribution charges and other expenses. Other than their investment advisory fees and any applicable Rule 12b-1 distribution fees, the components of the total fees charged by these other funds may be increased without shareholder approval. The Board believes the unified fee structure is a benefit to Fund shareholders because it clearly discloses to shareholders the cost of owning Fund shares, and, since the unified fee cannot be increased without a vote of Fund shareholders, it shifts to the Advisor the risk of increased costs of operating the Funds and provides a direct incentive to
42
minimize administrative inefficiencies. Part of the Board’s analysis of fee levels involves reviewing certain evaluative data compiled by an independent provider comparing each Fund’s unified fee to the total expense ratios of similar funds not managed by the Advisor. The Board concluded that the management fee to be paid by each Fund to the Advisor under the Proposed Management Agreement is reasonable in light of the services to be provided to the Fund.
Comparison to Fees and Services Provided to Other Clients of the Advisor. The Board also requested and received information from the Advisor concerning the nature and extent of the services, fees, and profitability of its advisory services to advisory clients other than the Funds. They observed that these varying types of client accounts require different services and involve different regulatory and entrepreneurial risks than the management of the Funds. The Board analyzed this information and concluded that the fees charged and services provided to the Funds were reasonable by comparison.
Collateral or “Fall-Out” Benefits Derived by the Advisor. The Board considered the existence of collateral benefits the Advisor may receive as a result of its relationship with the Funds. The Board concluded that the Advisor’s primary business is managing mutual funds and it generally does not use Fund or shareholder information to generate profits in other lines of business, and therefore does not derive any significant collateral benefits from them. The Board noted that the Advisor receives proprietary research from broker-dealers that execute Fund portfolio transactions and concluded that this research is likely to benefit Fund shareholders. The Board also determined that the Advisor is able to provide investment management services to certain clients other than the Funds, at least in part, due to its existin g infrastructure built to serve the fund complex. The Board concluded, however, that the assets of those other clients are not material to the analysis and, in any event, are included with the assets of the Funds to determine breakpoints in each Fund’s fee schedule, provided they are managed using the same investment team and strategy.
Conclusion of the Board. As a result of this process, the Board, in the absence of particular circumstances and assisted by the advice of its independent legal counsel, taking into account all of the factors discussed above and the information provided by the Advisor and others, concluded that the Proposed Management Agreement be approved and recommended its approval to Fund shareholders.
43
Retirement Account Information
As required by law, distributions you receive from certain IRAs, or 403(b), 457 and qualified plans are subject to federal income tax withholding, unless you elect not to have withholding apply. Tax will be withheld on the total amount withdrawn even though you may be receiving amounts that are not subject to withholding, such as nondeductible contributions. In such case, excess amounts of withholding could occur. You may adjust your withholding election so that a greater or lesser amount will be withheld.
If you don’t want us to withhold on this amount, you must notify us to not withhold the federal income tax. You may notify us in writing or in certain situations by telephone or through other electronic means. You have the right to revoke your withholding election at any time and any election you make may remain in effect until revoked by filing a new election.
Remember, even if you elect not to have income tax withheld, you are liable for paying income tax on the taxable portion of your withdrawal. If you elect not to have income tax withheld or you don’t have enough income tax withheld, you may be responsible for payment of estimated tax. You may incur penalties under the estimated tax rules if your withholding and estimated tax payments are not sufficient. You can reduce or defer the income tax on a distribution by directly or indirectly rolling such distribution over to another IRA or eligible plan. You should consult your tax advisor for additional information.
State tax will be withheld if, at the time of your distribution, your address is within one of the mandatory withholding states and you have federal income tax withheld. State taxes will be withheld from your distribution in accordance with the respective state rules.
Proxy Voting Guidelines
American Century Investment Management, Inc., the funds’ investment advisor, is responsible for exercising the voting rights associated with the securities purchased and/or held by the funds. A description of the policies and procedures the advisor uses in fulfilling this responsibility is available without charge, upon request, by calling 1-800-345-2021. It is also available on American Century Investments’ website at americancentury.com and on the Securities and Exchange Commission’s website at sec.gov. Information regarding how the investment advisor voted proxies relating to portfolio securities during the most recent 12-month period ended June 30 is available on the “About Us” page at americancentury.com. It is also available at sec.gov.
Quarterly Portfolio Disclosure
The funds file their complete schedule of portfolio holdings with the Securities and Exchange Commission (SEC) for the first and third quarters of each fiscal year on Form N-Q. The funds’ Forms N-Q are available on the SEC’s website at sec.gov, and may be reviewed and copied at the SEC’s Public Reference Room in Washington, DC. Information on the operation of the Public Reference Room may be obtained by calling 1-800-SEC-0330. The funds also make their complete schedule of portfolio holdings for the most recent quarter of their fiscal year available on their website at americancentury.com and, upon request, by calling 1-800-345-2021.
44
The following indices are used to illustrate investment market, sector, or style performance or to serve as fund performance comparisons. They are not investment products available for purchase.
The Russell 1000® Index is a market-capitalization weighted, large-cap index created by Frank Russell Company to measure the performance of the 1,000 largest publicly traded U.S. companies, based on total market capitalization.
The Russell 1000® Growth Index measures the performance of those Russell 1000 Index companies (the 1,000 largest publicly traded U.S. companies, based on total market capitalization) with higher price-to-book ratios and higher forecasted growth values.
The Russell 1000® Value Index measures the performance of those Russell 1000 Index companies (the 1,000 largest publicly traded U.S. companies, based on total market capitalization) with lower price-to-book ratios and lower forecasted growth values.
The Russell 2000® Index is a market-capitalization weighted index created by Frank Russell Company to measure the performance of the 2,000 smallest of the 3,000 largest publicly traded U.S. companies, based on total market capitalization.
The Russell 2000® Growth Index measures the performance of those Russell 2000 Index companies (the 2,000 smallest of the 3,000 largest publicly traded U.S. companies, based on total market capitalization) with higher price-to-book ratios and higher forecasted growth values.
The Russell 2000® Value Index measures the performance of those Russell 2000 Index companies (the 2,000 smallest of the 3,000 largest publicly traded U.S. companies, based on total market capitalization) with lower price-to-book ratios and lower forecasted growth values.
The Russell Midcap® Index measures the performance of the 800 smallest of the 1,000 largest publicly traded U.S. companies, base d on total market capitalization.
The Russell Midcap® Growth Index measures the performance of those Russell Midcap Index companies (the 800 smallest of the 1,000 largest publicly traded U.S. companies, based on total market capitalization) with higher price-to-book ratios and higher forecasted growth values.
The Russell Midcap® Value Index measures the performance of those Russell Midcap Index companies (the 800 smallest of the 1,000 largest publicly traded U.S. companies, based on total market capitalization) with lower price-to-book ratios and lower forecasted growth values.
The S&P 500 Index is a market value-weighted index of the stocks of 500 publicly traded U.S. companies chosen for market size, liquidity, and industry group representation that are considered to be leading firms in dominant industries. Each stock’s weight in the index is proportionate to its market value. Created by Standard & Poor’s, it is considered to be a broad measure of U.S. stock market performance.
45
46
47
48

| |
| |
| Contact Us | |
| americancentury.com | |
| Automated Information Line | 1-800-345-8765 |
| Investor Services Representative | 1-800-345-2021 or |
| | 816-531-5575 |
| Business, Not-For-Profit, Employer-Sponsored | |
| Retirement Plans | 1-800-345-3533 |
| Banks and Trust Companies, Broker-Dealers, | |
| Financial Professionals, Insurance Companies | 1-800-345-6488 |
| Telecommunications Device for the Deaf | 1-800-634-4113 |
| American Century Capital Portfolios, Inc. | |
| Investment Advisor: | |
| American Century Investment Management, Inc. | |
| Kansas City, Missouri | |
This report and the statements it contains are submitted for the general
information of our shareholders. The report is not authorized for distribution to
prospective investors unless preceded or accompanied by an effective prospectus.
American Century Investment Services, Inc., Distributor
©2010 American Century Proprietary Holdings, Inc. All rights reserved.
1005
CL-ANN-68261N
| | | |
| ITEM 2. CODE OF ETHICS. |
| (a) | The registrant has adopted a Code of Ethics for Senior Financial Officers that applies to the |
| | registrant’s principal executive officer, principal financial officer, principal accounting officer, |
| | and persons performing similar functions. |
| |
| (b) | No response required. |
| |
| (c) | None. | | |
| | | |
| (d) | None. | | |
| | | |
| (e) | Not applicable. |
| |
| (f) | The registrant’s Code of Ethics for Senior Financial Officers was filed as Exhibit 12 (a)(1) |
| | American Century Asset Allocation Portfolios, Inc.’s Annual Certified Shareholder Report |
| | Form N-CSR, File No. 811-21591, on September 29, 2005, and is incorporated herein by |
| | reference. | | |
| | | |
| ITEM 3. AUDIT COMMITTEE FINANCIAL EXPERT. |
| (a)(1) | The registrant’s board has determined that the registrant has at least one audit committee |
| | financial expert serving on its audit committee. |
| |
| (a)(2) | James A. Olson, Thomas A. Brown and Gale E. Sayers are the registrant’s designated audit |
| | committee financial experts. They are “independent” as defined in Item 3 of Form N-CSR. |
| |
| (a)(3) | Not applicable. |
| |
| (b) | No response required. |
| |
| (c) | No response required. |
| |
| (d) | No response required. |
| |
| ITEM 4. PRINCIPAL ACCOUNTANT FEES AND SERVICES. |
| (a) | Audit Fees. | | |
|
| The aggregate fees billed for each of the last two fiscal years for professional services rendered by the |
| principal accountant for the audit of the registrant’s annual financial statements or services that are |
| normally provided by the accountant in connection with statutory and regulatory filings or engagements |
| for those fiscal years were as follows: |
| | | |
| | FY 2009: | $166,905 |
| | FY 2010: | $163,575 |
| | | |
| (b) | Audit-Related Fees. |
| |
| The aggregate fees billed in each of the last two fiscal years for assurance and related services by the |
| principal accountant that are reasonably related to the performance of the audit of the registrant’s |
| financial statements and are not reported under paragraph (a) of this Item were as follows: |
| |
| | For services rendered to the registrant: |
| |
| | FY 2009: | $0 |
| | FY 2010: | $0 |
| |
| | Fees required to be approved pursuant to paragraph (c)(7)(ii) of Rule 2-01 of Regulation S-X |
| | (relating to certain engagements for non-audit services with the registrant’s investment adviser |
| | and its affiliates): |
| |
| | FY 2009: | $0 |
| | FY 2010: | $0 |
| |
| (c) | Tax Fees. | | |
| |
| The aggregate fees billed in each of the last two fiscal years for professional services rendered by the |
| principal accountant for tax compliance, tax advice, and tax planning were as follows: |
| |
| | For services rendered to the registrant: |
| |
| | FY 2009: | $0 |
| | FY 2010: | $0 |
| |
| | Fees required to be approved pursuant to paragraph (c)(7)(ii) of Rule 2-01 of Regulation S-X |
| | (relating to certain engagements for non-audit services with the registrant’s investment adviser |
| | and its affiliates): |
| |
| | FY 2009: | $0 |
| | FY 2010: | $0 |
| |
| (d) | All Other Fees. |
| |
| The aggregate fees billed in each of the last two fiscal years for products and services provided by the |
| principal accountant, other than the services reported in paragraphs (a) through (c) of this Item were as |
| follows: | | | |
| |
| | For services rendered to the registrant: |
| |
| | FY 2009: | $0 |
| | FY 2010: | $0 |
| |
| | Fees required to be approved pursuant to paragraph (c)(7)(ii) of Rule 2-01 of Regulation S-X |
| | (relating to certain engagements for non-audit services with the registrant’s investment adviser |
| | and its affiliates): |
| |
| | FY 2009: | $0 |
| | FY 2010: | $0 |
| | |
| (e)(1) | In accordance with paragraph (c)(7)(i)(A) of Rule 2-01 of Regulation S-X, before the |
| | accountant is engaged by the registrant to render audit or non-audit services, the engagement is |
| | approved by the registrant’s audit committee. Pursuant to paragraph (c)(7)(ii) of Rule 2-01 of |
| | Regulation S-X, the registrant’s audit committee also pre-approves its accountant’s |
| | engagements for non-audit services with the registrant’s investment adviser, its parent company, |
| | and any entity controlled by, or under common control with the investment adviser that |
| | provides ongoing services to the registrant, if the engagement relates directly to the operations |
| | and financial reporting of the registrant. |
| |
| (e)(2) | All services described in each of paragraphs (b) through (d) of this Item were pre-approved |
| | before the engagement by the registrant’s audit committee pursuant to paragraph (c)(7)(i)(A) of |
| | Rule 2-01 of Regulation S-X. Consequently, none of such services were required to be |
| | approved by the audit committee pursuant to paragraph (c)(7)(i)(C). |
| |
| (f) | The percentage of hours expended on the principal accountant’s engagement to audit the |
| | registrant’s financial statements for the most recent fiscal year that were attributed to work |
| | performed by persons other than the principal accountant’s full-time, permanent employees was |
| | less than 50%. | |
| |
| (g) | The aggregate non-audit fees billed by the registrant’s accountant for services rendered to the |
| | registrant, and rendered to the registrant’s investment adviser (not including any sub-adviser |
| | whose role is primarily portfolio management and is subcontracted with or overseen by another |
| | investment adviser), and any entity controlling, controlled by, or under common control with |
| | the adviser that provides ongoing services to the registrant for each of the last two fiscal years |
| | of the registrant were as follows: |
| |
| | FY 2009: | $131,465 |
| | FY 2010: | $ 55,692 |
| |
| (h) | The registrant’s investment adviser and accountant have notified the registrant’s audit |
| | committee of all non-audit services that were rendered by the registrant’s accountant to the |
| | registrant’s investment adviser, its parent company, and any entity controlled by, or under |
| | common control with the investment adviser that provides services to the registrant, which |
| | services were not required to be pre-approved pursuant to paragraph (c)(7)(ii) of Rule 2-01 of |
| | Regulation S-X. The notification provided to the registrant’s audit committee included |
| | sufficient details regarding such services to allow the registrant’s audit committee to consider |
| | the continuing independence of its principal accountant. |
| |
| ITEM 5. AUDIT COMMITTEE OF LISTED REGISTRANTS. |
| Not applicable. | |
| |
| ITEM 6. INVESTMENTS. |
| (a) | The schedule of investments is included as part of the report to stockholders filed under Item 1 |
| | of this Form. | |
| |
| (b) | Not applicable. |
| |
| ITEM 7. DISCLOSURE OF PROXY VOTING POLICIES AND PROCEDURES FOR |
| CLOSED-END MANAGEMENT INVESTMENT COMPANIES. |
| Not applicable. | |
| |
| ITEM 8. PORTFOLIO MANAGERS OF CLOSED-END MANAGEMENT |
| INVESTMENT COMPANIES. |
| Not applicable. |
| |
| ITEM 9. PURCHASES OF EQUITY SECURITIES BY CLOSED-END MANAGEMENT |
| INVESTMENT COMPANY AND AFFILIATED PURCHASERS. |
| Not applicable. |
| |
| ITEM 10. SUBMISSION OF MATTERS TO A VOTE OF SECURITY HOLDERS. |
| During the reporting period, there were no material changes to the procedures by which shareholders may |
| recommend nominees to the registrant’s board. |
| |
| ITEM 11. CONTROLS AND PROCEDURES. |
| (a) | The registrant's principal executive officer and principal financial officer have concluded that |
| | the registrant's disclosure controls and procedures (as defined in Rule 30a-3(c) under the |
| | Investment Company Act of 1940) are effective based on their evaluation of these controls and |
| | procedures as of a date within 90 days of the filing date of this report. |
| |
| (b) | There were no changes in the registrant's internal control over financial reporting (as defined in |
| | Rule 30a-3(d) under the Investment Company Act of 1940) that occurred during the registrant's |
| | second fiscal quarter of the period covered by this report that have materially affected, or are |
| | reasonably likely to materially affect, the registrant's internal control over financial reporting. |
| |
| ITEM 12. EXHIBITS. |
| (a)(1) | Registrant’s Code of Ethics for Senior Financial Officers, which is the subject of the disclosure |
| | required by Item 2 of Form N-CSR, was filed as Exhibit 12(a)(1) to American Century Asset |
| | Allocation Portfolios, Inc.’s Certified Shareholder Report on Form N-CSR, File No. 811-21591, |
| | on September 29, 2005. |
| |
| (a)(2) | Separate certifications by the registrant’s principal executive officer and principal financial |
| | officer, pursuant to Section 302 of the Sarbanes-Oxley Act of 2002 and Rule 30a-2(a) under the |
| | Investment Company Act of 1940, are filed and attached hereto as EX-99.CERT. |
| |
| (a)(3) | Not applicable. |
| |
| (b) | A certification by the registrant’s chief executive officer and chief financial officer, pursuant to |
| | Section 906 of the Sarbanes-Oxley Act of 2002, is furnished and attached hereto as EX- |
| | 99.906CERT. |
SIGNATURES
Pursuant to the requirements of the Securities Exchange Act of 1934 and the Investment Company Act of 1940, the registrant has duly caused this report to be signed on its behalf by the undersigned, thereunto duly authorized.
| | |
| Registrant: | American Century Capital Portfolios, Inc. |
| |
| By: | /s/ Jonathan S. Thomas |
| | Name: | Jonathan S. Thomas |
| | Title: | President |
| |
| Date: | May 28, 2010 |
Pursuant to the requirements of the Securities Exchange Act of 1934 and the Investment Company Act of 1940, this report has been signed below by the following persons on behalf of the registrant and in the capacities and on the dates indicated.
| | |
| By: | /s/ Jonathan S. Thomas |
| | Name: | Jonathan S. Thomas |
| | Title: | President |
| | | (principal executive officer) |
| |
| Date: | May 28, 2010 |
| | |
| By: | /s/ Robert J. Leach |
| | Name: | Robert J. Leach |
| | Title: | Vice President, Treasurer, and |
| | | Chief Financial Officer |
| | | (principal financial officer) |
| |
| Date: | May 28, 2010 |